Differences in fruit and vegetable intake and their determinants among 11-year-old schoolchildren...
11
RESEARCH Open Access Differences in fruit and vegetable intake and their determinants among 11-year-old schoolchildren between 2003 and 2009 Claudia Fischer 1,2 , Johannes Brug 1 , Nannah I Tak 1 , Agneta Yngve 3,4 and Saskia J te Velde 1* Abstract Background: Fruit and vegetable (FV) intake in children in the Netherlands is much lower than recommended. Recurrent appraisal of intake levels is important for detecting changes in intake over time and to inform future interventions and policies. The aim of the present study was to investigate differences in fruit and vegetable intake, and whether these could be explained by differences in potential determinants of FV intake in 11-year-old Dutch schoolchildren, by comparing two school samples assessed in 2003 and 2009. Methods: For 1105 children of the Pro Children study in 2003 and 577 children of the Pro Greens study in 2009 complete data on intake and behavioural determinants were available. The self-administered questionnaire included questions on children’s ethnicity, usual fruit and vegetable intake, mother’s educational level, and important potential determinants of fruit and vegetable intake. Multiple regression analysis was applied to test for differences in intake and determinants between study samples. Mediation analyses were used to investigate whether the potential mediators explained the differences in intake between the two samples. Results: In 2009, more children complied with the World Health Organization recommendation of 400 g fruit and vegetables per day (17.0%) than in 2003 (11.8%, p = 0.004). Fruit consumption was significantly higher in the sample of 2009 than in the sample of 2003 (difference = 23.8 (95%CI: 8.1; 39.5) grams/day). This difference was mainly explained by a difference in the parental demand regarding their child’s intake (23.6%), followed by the child’s knowledge of the fruit recommendation (14.2%) and parental facilitation of consumption (18.5%). Vegetable intake was lower in the 2009 sample than in the 2003 sample (12.3 (95%CI -21.0; -3.6). This difference could not be explained by the assessed mediators. Conclusions: The findings indicate that fruit intake among 11-year-olds improved somewhat between 2003 and 2009. Vegetable intake, however, appears to have declined somewhat between 2003 and 2009. Since a better knowledge of the recommendation, parental demand and facilitation explained most of the observed fruit consumption difference, future interventions may specifically address these potential mediators. Further, the provision of vegetables in the school setting should be considered in order to increase children’s vegetable intake. Keywords: schoolchildren, fruit and vegetables, trend, the Netherlands * Correspondence: [email protected] 1 The EMGO+ Institute for Health and Care Research and the Department of Epidemiology and Biostatistics, VU University Medical Center, Van der Boechorststraat 7, 1081 BT, Amsterdam, The Netherlands Full list of author information is available at the end of the article Fischer et al. International Journal of Behavioral Nutrition and Physical Activity 2011, 8:141 http://www.ijbnpa.org/content/8/1/141 © 2011 Fischer et al; licensee BioMed Central Ltd. This is an Open Access article distributed under the terms of the Creative Commons Attribution License (http://creativecommons.org/licenses/by/2.0), which permits unrestricted use, distribution, and reproduction in any medium, provided the original work is properly cited.
Transcript of Differences in fruit and vegetable intake and their determinants among 11-year-old schoolchildren...

RESEARCH Open Access
Differences in fruit and vegetable intake andtheir determinants among 11-year-oldschoolchildren between 2003 and 2009Claudia Fischer1,2, Johannes Brug1, Nannah I Tak1, Agneta Yngve3,4 and Saskia J te Velde1*
Abstract
Background: Fruit and vegetable (FV) intake in children in the Netherlands is much lower than recommended.Recurrent appraisal of intake levels is important for detecting changes in intake over time and to inform futureinterventions and policies. The aim of the present study was to investigate differences in fruit and vegetable intake,and whether these could be explained by differences in potential determinants of FV intake in 11-year-old Dutchschoolchildren, by comparing two school samples assessed in 2003 and 2009.
Methods: For 1105 children of the Pro Children study in 2003 and 577 children of the Pro Greens study in 2009complete data on intake and behavioural determinants were available. The self-administered questionnaireincluded questions on children’s ethnicity, usual fruit and vegetable intake, mother’s educational level, andimportant potential determinants of fruit and vegetable intake.Multiple regression analysis was applied to test for differences in intake and determinants between study samples.Mediation analyses were used to investigate whether the potential mediators explained the differences in intakebetween the two samples.
Results: In 2009, more children complied with the World Health Organization recommendation of 400 g fruit andvegetables per day (17.0%) than in 2003 (11.8%, p = 0.004). Fruit consumption was significantly higher in thesample of 2009 than in the sample of 2003 (difference = 23.8 (95%CI: 8.1; 39.5) grams/day). This difference wasmainly explained by a difference in the parental demand regarding their child’s intake (23.6%), followed by thechild’s knowledge of the fruit recommendation (14.2%) and parental facilitation of consumption (18.5%). Vegetableintake was lower in the 2009 sample than in the 2003 sample (12.3 (95%CI -21.0; -3.6). This difference could not beexplained by the assessed mediators.
Conclusions: The findings indicate that fruit intake among 11-year-olds improved somewhat between 2003 and2009. Vegetable intake, however, appears to have declined somewhat between 2003 and 2009. Since a betterknowledge of the recommendation, parental demand and facilitation explained most of the observed fruitconsumption difference, future interventions may specifically address these potential mediators. Further, theprovision of vegetables in the school setting should be considered in order to increase children’s vegetable intake.
Keywords: schoolchildren, fruit and vegetables, trend, the Netherlands
* Correspondence: [email protected] EMGO+ Institute for Health and Care Research and the Department ofEpidemiology and Biostatistics, VU University Medical Center, Van derBoechorststraat 7, 1081 BT, Amsterdam, The NetherlandsFull list of author information is available at the end of the article
Fischer et al. International Journal of Behavioral Nutrition and Physical Activity 2011, 8:141http://www.ijbnpa.org/content/8/1/141
© 2011 Fischer et al; licensee BioMed Central Ltd. This is an Open Access article distributed under the terms of the Creative CommonsAttribution License (http://creativecommons.org/licenses/by/2.0), which permits unrestricted use, distribution, and reproduction inany medium, provided the original work is properly cited.

IntroductionA healthy diet, including an ample intake of fruit andvegetables, is part of recommendations for a healthy dietand may be especially important in youth [1]. Fruit andvegetables supply part of the important nutrients neededfor physical and mental development during childhood[2]. This is the time when food and meal habits arelearned [3], which tend to track to a certain extent intoadulthood [4]. Furthermore, ample intakes of fruit andvegetables are believed to contribute to prevention ofchronic disease [5,6] and possibly weight management [7].The World Health Organization (WHO) and Food and
Agriculture Organization (FAO) recommend a dailyintake of 400 grams of fruit and vegetables [8]. TheDutch recommendation for fruit and vegetable intake for10-12-year-old-children is at least two pieces of fruit and150-200 g of vegetables per day [9] Many schoolchildrenfall short of the recommended amount per day [9], how-ever, and a cross-country comparison indicated thatDutch 11-year-old children have lower intakes than chil-dren in many other European countries [10].Similarly to other countries in Europe [11,12] and else-
where [13,14], government and non-governmental healthpromotion agencies in the Netherlands have includedfruit and vegetable promotion in health promotion effortstargeting the population in general and schoolchildren inparticular. For this reason several initiatives have beenundertaken in the Netherlands in the last few years togain more insight into the intake pattern and to increasethe consumption of fruit and vegetables among children.Campaigns like the ‘Vita+Froet’ project [15], the School-gruiten Project [16] and the Pro Children Project [17,18]focused on interventions in the school setting, becausethe advantage of this setting is that almost all childrencan be reached.A main focus of such projects is increasing the availabil-
ity and accessibility of fruit and vegetables at school byproviding children with free servings of fruit and/or ready-to-eat vegetables during school hours. Some also use spe-cific school lessons to increase knowledge, for example, orpromote taste testing to enhance preferences, and parentalactivities to improve parental support [15,17]. Some muni-cipal health services in the Netherlands have adopted theSchoolgruiten programme; there are initiatives to imple-ment the programme nationwide, and the European Com-mission is encouraging similar promotion of fruit andvegetable consumption across Europe [19].To explore trends in intake, inform decisions about
continuation of the aforementioned interventions ordevelop future programmes and policies, it is importantto gain insight into present intake levels and correlatesof intakes as compared with the period before mostintervention activities were launched [20].
Therefore, the objectives of the present study were toexplore differences in the fruit and vegetable consump-tion and their determinants between two national repre-sentative samples of 11-year-old schoolchildren in theNetherlands in 2003 and 2009. In addition, it wasassessed whether differences in the presumed determi-nants explained the potential differences in intake levelsbetween the two samples. Finally, it was tested whetherdifferences between the samples were modified by gen-der, ethnic background or parental educational level.
MethodsSampleRepresentative samples of 11-year-olds in the Netherlandswere derived from the Dutch cross-sectional survey dataof the Pro Children Study in 2003 [21] and the data of theDutch survey conducted within the Pro Greens study in2009 [22]. Both studies were funded by the EuropeanCommission and used the same sampling and surveymethodology.
ProceduresThe methodological build-up was identical in both studiesand has been described in more detail previously [21]. Thedata collection process of the Pro Children study tookplace between October and November 2003; the ProGreens study collected data between April and June 2009.Supervised by the teachers, children completed a self-administered written questionnaire in one school hour.Another questionnaire was given to the children to takehome for their parents. Parental informed consent wasobtained before the children participated in the surveys[17]. Ethical approval for Dutch participation in the ProChildren study was obtained by the Medical Ethics Com-mittee of the Erasmus University Medical Centre Rotter-dam; Dutch participation in the Pro Greens study protocolwas approved by the Medical Ethics Committee of the VUUniversity Medical Center, Amsterdam.
MeasuresFruit and vegetable intakePrimary outcome measures were the total intake of fruitand vegetables in grams on the day prior to the day ofthe data collection. Fruit and vegetable intakes were ana-lysed separately because previous studies have shown thatthese are distinct behaviours [23] with their own determi-nants and may be affected differently by interventions.Fruit and vegetable intake was measured by a validatedself-administered 24-hour recall questionnaire [24].In summary, the 24 h recall is an instrument that
identifies all vegetables and fruits consumed during theday prior to the completion of the questionnaire. Ques-tions were asked about the fruit and vegetable intake in
Fischer et al. International Journal of Behavioral Nutrition and Physical Activity 2011, 8:141http://www.ijbnpa.org/content/8/1/141
Page 2 of 11
three different time intervals: (1) before school, (2) dur-ing school time and lunch, (3) after school, at supperand after supper. Amounts were indicated in terms ofthe number of slices, portions, or pieces eaten and stan-dards were defined for these units [24]. Dried fruit andfruit juice were not included in the assessment of fruitintake; qualitative research shows that soft drinks, lem-onades or fruit yogurts are often regarded as fruit juiceby children. Potatoes were not included in the vegetableintake assessment [24]. Over-reporters, defined asreporting more than 1000 gram/day of total fruit andvegetable intake (excluding fruit juices) [24], wereexcluded from the analyses (10 children, five in eachsample). Both studies used the same questionnaire, butwith one exception: the questionnaire of the Pro Greensstudy had an extra item on berry consumption, whichwas covered in the ‘other fruit’ section in the ProChildren study.For descriptive purposes only, intake levels were
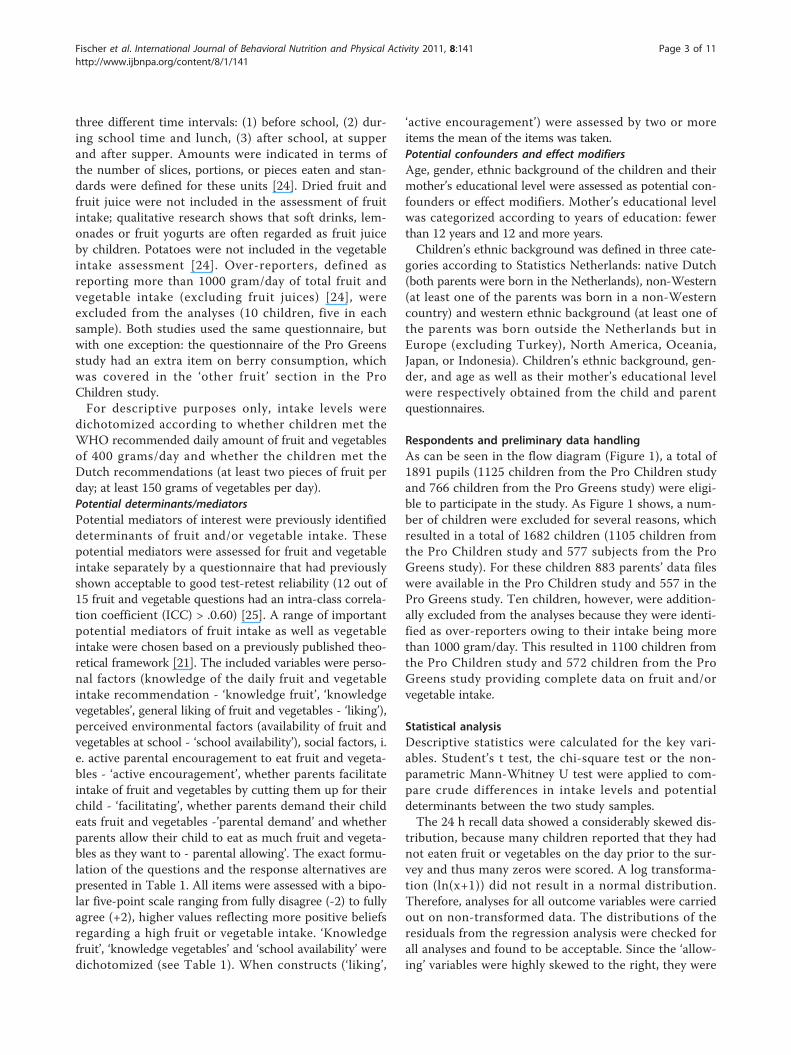
dichotomized according to whether children met theWHO recommended daily amount of fruit and vegetablesof 400 grams/day and whether the children met theDutch recommendations (at least two pieces of fruit perday; at least 150 grams of vegetables per day).Potential determinants/mediatorsPotential mediators of interest were previously identifieddeterminants of fruit and/or vegetable intake. Thesepotential mediators were assessed for fruit and vegetableintake separately by a questionnaire that had previouslyshown acceptable to good test-retest reliability (12 out of15 fruit and vegetable questions had an intra-class correla-tion coefficient (ICC) > .0.60) [25]. A range of importantpotential mediators of fruit intake as well as vegetableintake were chosen based on a previously published theo-retical framework [21]. The included variables were perso-nal factors (knowledge of the daily fruit and vegetableintake recommendation - ‘knowledge fruit’, ‘knowledgevegetables’, general liking of fruit and vegetables - ‘liking’),perceived environmental factors (availability of fruit andvegetables at school - ‘school availability’), social factors, i.e. active parental encouragement to eat fruit and vegeta-bles - ‘active encouragement’, whether parents facilitateintake of fruit and vegetables by cutting them up for theirchild - ‘facilitating’, whether parents demand their childeats fruit and vegetables -’parental demand’ and whetherparents allow their child to eat as much fruit and vegeta-bles as they want to - parental allowing’. The exact formu-lation of the questions and the response alternatives arepresented in Table 1. All items were assessed with a bipo-lar five-point scale ranging from fully disagree (-2) to fullyagree (+2), higher values reflecting more positive beliefsregarding a high fruit or vegetable intake. ‘Knowledgefruit’, ‘knowledge vegetables’ and ‘school availability’ weredichotomized (see Table 1). When constructs (‘liking’,
‘active encouragement’) were assessed by two or moreitems the mean of the items was taken.Potential confounders and effect modifiersAge, gender, ethnic background of the children and theirmother’s educational level were assessed as potential con-founders or effect modifiers. Mother’s educational levelwas categorized according to years of education: fewerthan 12 years and 12 and more years.Children’s ethnic background was defined in three cate-
gories according to Statistics Netherlands: native Dutch(both parents were born in the Netherlands), non-Western(at least one of the parents was born in a non-Westerncountry) and western ethnic background (at least one ofthe parents was born outside the Netherlands but inEurope (excluding Turkey), North America, Oceania,Japan, or Indonesia). Children’s ethnic background, gen-der, and age as well as their mother’s educational levelwere respectively obtained from the child and parentquestionnaires.
Respondents and preliminary data handlingAs can be seen in the flow diagram (Figure 1), a total of1891 pupils (1125 children from the Pro Children studyand 766 children from the Pro Greens study) were eligi-ble to participate in the study. As Figure 1 shows, a num-ber of children were excluded for several reasons, whichresulted in a total of 1682 children (1105 children fromthe Pro Children study and 577 subjects from the ProGreens study). For these children 883 parents’ data fileswere available in the Pro Children study and 557 in thePro Greens study. Ten children, however, were addition-ally excluded from the analyses because they were identi-fied as over-reporters owing to their intake being morethan 1000 gram/day. This resulted in 1100 children fromthe Pro Children study and 572 children from the ProGreens study providing complete data on fruit and/orvegetable intake.
Statistical analysisDescriptive statistics were calculated for the key vari-ables. Student’s t test, the chi-square test or the non-parametric Mann-Whitney U test were applied to com-pare crude differences in intake levels and potentialdeterminants between the two study samples.The 24 h recall data showed a considerably skewed dis-
tribution, because many children reported that they hadnot eaten fruit or vegetables on the day prior to the sur-vey and thus many zeros were scored. A log transforma-tion (ln(x+1)) did not result in a normal distribution.Therefore, analyses for all outcome variables were carriedout on non-transformed data. The distributions of theresiduals from the regression analysis were checked forall analyses and found to be acceptable. Since the ‘allow-ing’ variables were highly skewed to the right, they were
Fischer et al. International Journal of Behavioral Nutrition and Physical Activity 2011, 8:141http://www.ijbnpa.org/content/8/1/141
Page 3 of 11
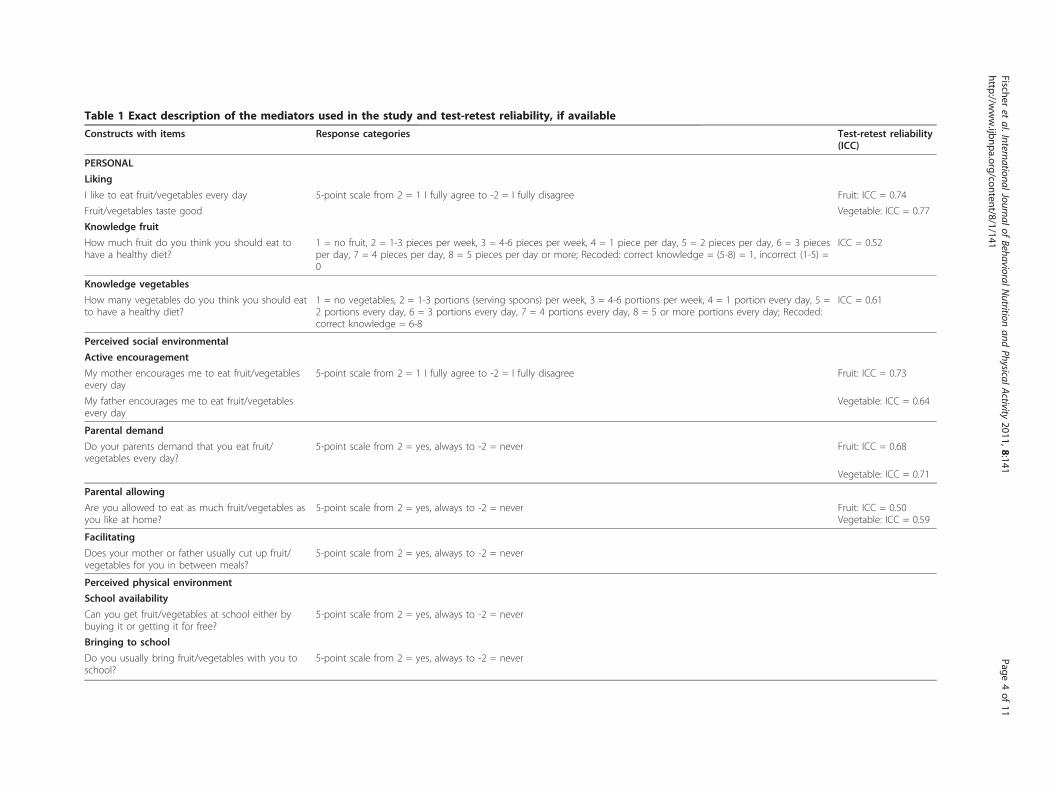
Table 1 Exact description of the mediators used in the study and test-retest reliability, if available
Constructs with items Response categories Test-retest reliability(ICC)
PERSONAL
Liking
I like to eat fruit/vegetables every day 5-point scale from 2 = 1 I fully agree to -2 = I fully disagree Fruit: ICC = 0.74
Fruit/vegetables taste good Vegetable: ICC = 0.77
Knowledge fruit
How much fruit do you think you should eat tohave a healthy diet?
1 = no fruit, 2 = 1-3 pieces per week, 3 = 4-6 pieces per week, 4 = 1 piece per day, 5 = 2 pieces per day, 6 = 3 piecesper day, 7 = 4 pieces per day, 8 = 5 pieces per day or more; Recoded: correct knowledge = (5-8) = 1, incorrect (1-5) =0
ICC = 0.52
Knowledge vegetables
How many vegetables do you think you should eatto have a healthy diet?
1 = no vegetables, 2 = 1-3 portions (serving spoons) per week, 3 = 4-6 portions per week, 4 = 1 portion every day, 5 =2 portions every day, 6 = 3 portions every day, 7 = 4 portions every day, 8 = 5 or more portions every day; Recoded:correct knowledge = 6-8
ICC = 0.61
Perceived social environmental
Active encouragement
My mother encourages me to eat fruit/vegetablesevery day
5-point scale from 2 = 1 I fully agree to -2 = I fully disagree Fruit: ICC = 0.73
My father encourages me to eat fruit/vegetablesevery day
Vegetable: ICC = 0.64
Parental demand
Do your parents demand that you eat fruit/vegetables every day?
5-point scale from 2 = yes, always to -2 = never Fruit: ICC = 0.68
Vegetable: ICC = 0.71
Parental allowing
Are you allowed to eat as much fruit/vegetables asyou like at home?
5-point scale from 2 = yes, always to -2 = never Fruit: ICC = 0.50Vegetable: ICC = 0.59
Facilitating
Does your mother or father usually cut up fruit/vegetables for you in between meals?
5-point scale from 2 = yes, always to -2 = never
Perceived physical environment
School availability
Can you get fruit/vegetables at school either bybuying it or getting it for free?
5-point scale from 2 = yes, always to -2 = never
Bringing to school
Do you usually bring fruit/vegetables with you toschool?
5-point scale from 2 = yes, always to -2 = never
Fischeret
al.InternationalJournalofBehavioralN
utritionand
PhysicalActivity
2011,8:141http://w
ww.ijbnpa.org/content/8/1/141
Page4of
11
categorized as ‘negative’, i.e. taking ‘strongly disagree’ and‘disagree’ together; ‘neutral’, and ‘positive’, i.e. taking‘strongly agree’ and ‘agree’ together. Likewise, the ‘bring-ing vegetables to school’ variable was dichotomized intoa low (including the two negative answer alternatives)and a ‘neutral/high’ category, including the neutral andtwo positive answer categories.All analyses with fruit and vegetable intake and poten-
tial determinants as dependent variables and the twosamples (coded zero and one) as an independent variablewere conducted with linear or binary logistic regressionanalyses. First, effect modification by age, gender, ethnicbackground of the child and/or the mother’s educationallevel was assessed by including the interaction termsbetween the group variable and the potential moderator.Children’s age, gender, mother’s educational level andethnic background of the child were included as covari-ates in the adjusted models to account for potentialconfounding.Second, it was explored whether the differences in pre-
sumed determinants could explain the differences inintake between the samples (the so-called ‘total effect’ orpath c). Mediation analyses were applied in accordancewith MacKinnon et al. [26] and following the SPSS scriptdeveloped by Preacher and Hayes [27]. Briefly, the asso-ciation between sample and presumed determinants(path a) and the association between the presumed deter-minants and the intake variables (path b) were assessed.The product-of-coefficient method [26] was then appliedto calculate the mediated effects (a*b). Bootstrappingwith 5000 re-samples was used to construct the bias-
corrected 95% confidence intervals around the mediatedeffects [27]. The proportion of the ‘total effect’ explainedby the presumed determinants was calculated as a*b/c foreach individual determinant and as Σ(ai*bi)/c for alldeterminants together. For both fruit intake and vegeta-ble intake two mediation models were run; the firstmodel including all presumed mediators and a secondmodel including only the variables that were identified assignificant mediators in the first model.All analyses were conducted with the PASW Statistics
18 program (IBM). A p-value ≤ 0.05 was considered tobe significant. Numbers included in the specific analysesdiffer slightly because of missing values on one or morevariables.
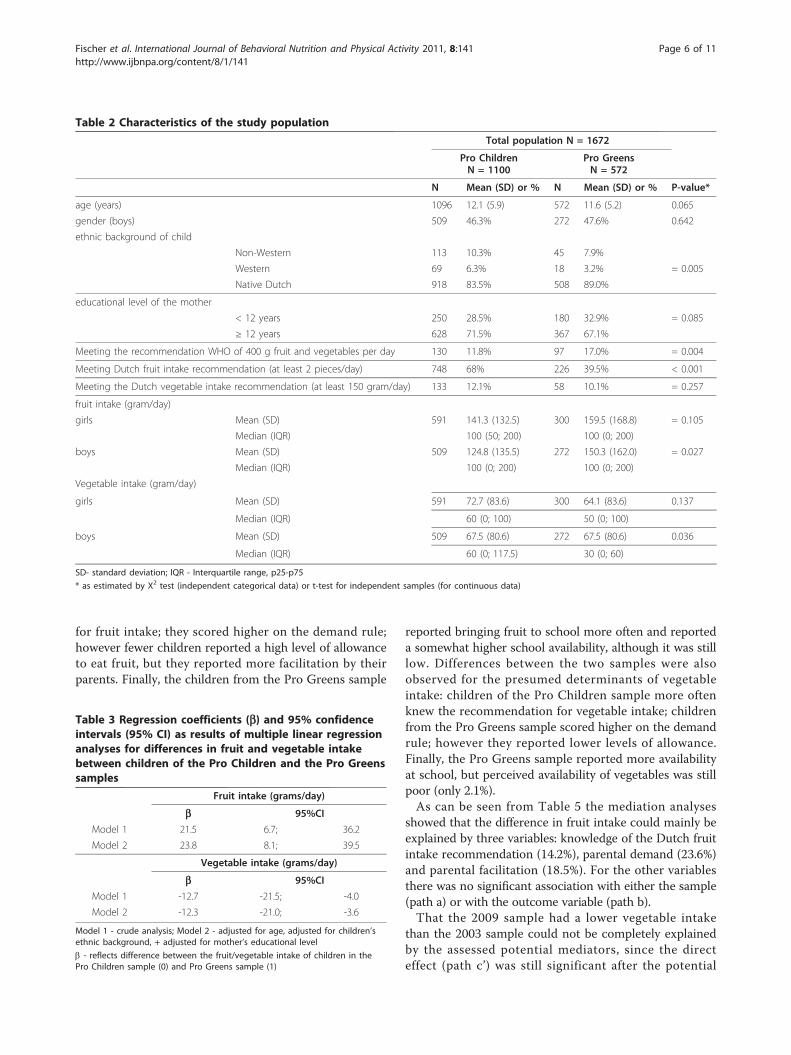
ResultsCharacteristicsAs shown in Table 2 the children in the Pro Childrenstudy were slightly older than the children in the ProGreens study. In both studies, there were slightly moregirls than boys. In both samples the majority of the chil-dren were of native Dutch background, but there weremore children of Western ethnic background in the ProChildren study. Educational level was high in both sam-ples. More children in the Pro Greens sample met theWHO recommendation of at least 400 g of fruit andvegetables than in the Pro Children sample. With regardto the Dutch recommendations, however, the childrenfrom the Pro Children sample performed better, espe-cially on the recommendation for fruit intake.
Fruit and vegetable intakeAs can be seen in Table 3 the difference in fruit intakebetween the two samples was 23.8 gram/day (95%CI 6.7;36.2) in favour of the children from the Pro Greenssample. This effect was not modified by gender, age, ori-gin or maternal educational level.Table 3 shows that the 2009 sample had a significantly
lower vegetable intake than the 2003 sample. The differ-ence in mean vegetable intake between the two sampleswas small: (-12.7 (-21.5; -4.0) gram/day) in the crude and(-12.3 (-21.0; -3.6) gram/day) in the adjusted analyses. Nosignificant effect modification was observed (data notshown).
Potential determinants of fruit and vegetable intakeTable 4 shows the unadjusted differences in the scoresbetween the two samples on the potential determinantsfor fruit and vegetable intake. For fruit intake, the samplesdiffered in almost all presumed determinants, except forliking (but there was a trend towards statistical signifi-cance, p = 0.073) and parental encouragement. More chil-dren of the Pro Greens sample knew the recommendation
n 1113 n 580
5 gender was
missing
n 5771105
2003
2009
2 not reliable
12 Sick, no
t
186 Sick, no
t
3 not reliable
1100 students
included in SPSS file
572 students
included in SPSS file
5 overreporting
(> 1000
5 overreporting
(> 1000
Figure 1 Flow diagram of the inclusion process of the ProChildren study and the Pro Greens study.
Fischer et al. International Journal of Behavioral Nutrition and Physical Activity 2011, 8:141http://www.ijbnpa.org/content/8/1/141
Page 5 of 11
for fruit intake; they scored higher on the demand rule;however fewer children reported a high level of allowanceto eat fruit, but they reported more facilitation by theirparents. Finally, the children from the Pro Greens sample
reported bringing fruit to school more often and reporteda somewhat higher school availability, although it was stilllow. Differences between the two samples were alsoobserved for the presumed determinants of vegetableintake: children of the Pro Children sample more oftenknew the recommendation for vegetable intake; childrenfrom the Pro Greens sample scored higher on the demandrule; however they reported lower levels of allowance.Finally, the Pro Greens sample reported more availabilityat school, but perceived availability of vegetables was stillpoor (only 2.1%).As can be seen from Table 5 the mediation analyses
showed that the difference in fruit intake could mainly beexplained by three variables: knowledge of the Dutch fruitintake recommendation (14.2%), parental demand (23.6%)and parental facilitation (18.5%). For the other variablesthere was no significant association with either the sample(path a) or with the outcome variable (path b).That the 2009 sample had a lower vegetable intake
than the 2003 sample could not be completely explainedby the assessed potential mediators, since the directeffect (path c’) was still significant after the potential
Table 2 Characteristics of the study population
Total population N = 1672
Pro ChildrenN = 1100
Pro GreensN = 572
N Mean (SD) or % N Mean (SD) or % P-value*
age (years) 1096 12.1 (5.9) 572 11.6 (5.2) 0.065
gender (boys) 509 46.3% 272 47.6% 0.642
ethnic background of child
Non-Western 113 10.3% 45 7.9%
Western 69 6.3% 18 3.2% = 0.005
Native Dutch 918 83.5% 508 89.0%
educational level of the mother
< 12 years 250 28.5% 180 32.9% = 0.085
≥ 12 years 628 71.5% 367 67.1%
Meeting the recommendation WHO of 400 g fruit and vegetables per day 130 11.8% 97 17.0% = 0.004
Meeting Dutch fruit intake recommendation (at least 2 pieces/day) 748 68% 226 39.5% < 0.001
Meeting the Dutch vegetable intake recommendation (at least 150 gram/day) 133 12.1% 58 10.1% = 0.257
fruit intake (gram/day)
girls Mean (SD) 591 141.3 (132.5) 300 159.5 (168.8) = 0.105
Median (IQR) 100 (50; 200) 100 (0; 200)
boys Mean (SD) 509 124.8 (135.5) 272 150.3 (162.0) = 0.027
Median (IQR) 100 (0; 200) 100 (0; 200)
Vegetable intake (gram/day)
girls Mean (SD) 591 72.7 (83.6) 300 64.1 (83.6) 0.137
Median (IQR) 60 (0; 100) 50 (0; 100)
boys Mean (SD) 509 67.5 (80.6) 272 67.5 (80.6) 0.036
Median (IQR) 60 (0; 117.5) 30 (0; 60)
SD- standard deviation; IQR - Interquartile range, p25-p75
* as estimated by X2 test (independent categorical data) or t-test for independent samples (for continuous data)
Table 3 Regression coefficients (b) and 95% confidenceintervals (95% CI) as results of multiple linear regressionanalyses for differences in fruit and vegetable intakebetween children of the Pro Children and the Pro Greenssamples
Fruit intake (grams/day)
b 95%CI
Model 1 21.5 6.7; 36.2
Model 2 23.8 8.1; 39.5
Vegetable intake (grams/day)
b 95%CI
Model 1 -12.7 -21.5; -4.0
Model 2 -12.3 -21.0; -3.6
Model 1 - crude analysis; Model 2 - adjusted for age, adjusted for children’sethnic background, + adjusted for mother’s educational level
b - reflects difference between the fruit/vegetable intake of children in thePro Children sample (0) and Pro Greens sample (1)
Fischer et al. International Journal of Behavioral Nutrition and Physical Activity 2011, 8:141http://www.ijbnpa.org/content/8/1/141
Page 6 of 11

mediators were taken into account. Results from themediation analyses indicated that parental demand actedas a suppressor in the relationship between cohort andvegetable intake, meaning that the association betweencohort and vegetable intake became stronger after the‘demand’ variable was taken into account. The variableswith a negative association with the cohort variable(knowledge of the Dutch vegetable intake recommenda-tion, liking, active parental encouragement, parentalallowing) did not show significant mediating effects.
DiscussionThe aim of this study was to assess differences in fruitand vegetable consumption and their potential determi-nants between two samples of 11-year-old schoolchildrenin the Netherlands measured in 2003 and 2009. Overall,the results indicated that the mean fruit intake of thechildren measured in 2009 was higher than that of thechildren measured in 2003, independent of their gender,ethnicity and maternal level of education; however, vege-table intake was somewhat lower in 2009 than in 2003.
Also more children from the 2009 cohort met the WHOrecommendation. However, the observation that morechildren from the 2003 cohort met the Dutch recom-mendation for fruit intake may be a result of the differentdefinitions. The Dutch recommendation states a mini-mum of two portions or pieces of fruit, whereas the WHOrecommendation combines fruit and vegetable intakeand uses total grams per day. Additional analysesrevealed that the 2003 children reported a higher con-sumption of tangerines than did the 2009 cohort.Whereas one tangerine counted as one piece of fruit, inthe calculations for grams per day it was considered tocontribute 50 grams and most other popular fruits suchas apples, pears and bananas were estimated to weigh100 grams per piece. That the 2003 cohort ate more tan-gerines is in line with the season of measurement; inSeptember and October these kinds of fruit are widelyavailable in the Netherlands.Regarding the presumed mediators, significantly more
children in 2009 knew about the recommended fruitintake levels than in 2003, and some positive trends for
Table 4 Median scores and interquartile ranges (IQR) for determinants of fruit and vegetable intake
Pro Children (PC) Pro Greens (PG)
FRUIT INTAKE N Median IQR (p25-p75) N Median IQR (p25-p75) P*
knowledge fruit (% of children who scored correctly) 1101 48% 581 59.7% < 0.001
liking (-2; +2) 1101 1.5 1 - 2 584 1.5 1 - 2 0.073
active encouragement (-2; +2) 1097 0 -1 - 1 580 0.5 -1 - 1 0.691
parental demand(-2;+2) 1090 0 0 - 1 574 1 0 - 2 < 0.001
parental allowing 1084 559 = 0.022
Neutral 110 10.1% 68 12.2
High 920 84.9% 447 80.0%
facilitating(-2; +2)
1090 0 -1 - 1 581 0 0 - 1 < 0.001
bringing fruit to school (-2; +2) 1100 -1 -2 - 0 580 0 -1 - 1 < 0.001
school availability (% of children scoring positive) 1086 1.3% 576 4.0% = 0.001
VEGETABLE INTAKE
Knowledge vegetables (% of children who scored correctly) 1100 22% 583 19% < 0.001
liking (-2; +2) 1100 1 0 - 1.5 582 1 0 - 1.5 0.708
active encouragement(-2; +2)
1096 1 0 - 1.5 578 1 0 - 1.5 0.537
parental demand(-2;+2) 1095 1 0 - 1 580 1 0 - 2 0.003(PC < PG)
parental allowing 1093 570 0.006
Neutral 146 13.4% 97 17.0%
High 888 81.2% 426 74.7
facilitating(-2; +2)
1085 -1 -2 - 0 574 -1 -2 - 0 0.718
bringing vegetables to school 1088 559 0.415
Low 937 86.7% 473 84.6%
Neutral/high 151 13.9% 86 15.4%
school availability (% of children scoring positive) 1086 0.7% 563 2.1% 0.018
* p-value based on Mann-Whitney U test or X2 test between the Pro Children sample and the Pro-Greens sample
* IQR- interquartile range, p25 - p75
Fischer et al. International Journal of Behavioral Nutrition and Physical Activity 2011, 8:141http://www.ijbnpa.org/content/8/1/141
Page 7 of 11

other potential determinants of fruit and vegetableintakes were also found.The finding that the schoolchildren in 2009 on average
reported eating more fruit than in 2003 is encouraging.From the mediation analyses it appears that knowledgeof the recommendation, parental demand and parentalfacilitation explains most of this difference. This mayindicate that school programmes were indeed able toimprove the children’s knowledge of the recommenda-tions for fruit intake and that this influenced their intake.It further suggests that the school programmes or othermedia activities were able to reach the parents, who sub-sequently changed their parenting practices regardingfruit intake. It is, however, surprising that liking or schoolavailability could not explain the differences between thetwo samples. Most school-based programmes not onlyaddressed the knowledge of the recommendations butalso individual level determinants such as liking [18].Results also show that liking was most strongly
associated with fruit intake, but also that the level of lik-ing did not significantly differ between the samples. Thismay indicate that even if the 2009 sample was moreexposed to fruit-promoting school programmes, theseprogrammes were not able to positively influence the lik-ing for fruit. Conversely, the school availability signifi-cantly differed between the two samples but was notrelated to fruit intake. This might be because a very smallproportion of children in the 2009 sample reported thepositive availability of fruit at school.Our results regarding fruit intake are somewhat similar
to the very few earlier studies that are available forapproximately the same period of time. Rasmussen et al.showed that in Denmark fruit intake improved between2002 and 2006 among 11-, 13- and 15-year-olds; in allage groups among girls the proportion which state to eatfruit at least once per day improved from between 52%and 58% in 2002 to between 62.9 and 69.8% in 2006 [20].The proportion of boys which state to eat fruit at least
Table 5 Results from the mediation analyses exploring whether presumed determinants could explain differences infruit and vegetable intake between the two samples (0 = Pro Children; 1 = Pro Greens)
fruit intake (n = 1369) total effect = 25.16(7.36; 43.0)
direct effect model 1 = 13.0(-4.44; 30.5)
Direct effect in model 2 = 10.0 (-5.63;25,7)
path a path b(model 1)
path b(model 2)
mediated effect (a*b) in model1
mediated effect (a*b) in model 2
coeff SE coeff SE coeff SE coeff 95%CI1 proportion coeff 95%CI1 proportion
knowledge 0.13 0.05 25.30 7.82 26.47 7.86 3.28 1.28 6.44 13.0% 3.27 1.24 5.99 14.2%
liking 0.04 0.08 35.24 4.92 – – 1.27 -2.37 5.02 5.0% – – – –
active encouragement 0.07 0.07 -1.82 3.36 – – -0.12 -1.58 0.27 -0.5% – – – –
parental demand 0.17 0.06 16.98 3.98 23.47 3.52 2.89 0.71 6.48 11.5% 5.42 2.64 10.86 23.6%
parental allowing -0.17 0.07 4.16 3.81 – – -0.69 -2.45 0.29 -2.8% – – – –
parental facilitation 0.33 0.08 7.08 3.53 12.16 3.44 2.33 0.09 5.56 9.3% 4.24 1.78 8.28 18.5%
bringing to school 0.39 0.04 5.93 3.26 – – 2.30 -0.08 5.52 9.2% – – – –
school availability 0.20 0.03 4.41 5.50 – – 0.89 -0.97 3.99 3.5% – – – –
Total 12.15 5.12 20.36 48.3% 12.9 8.40 20.1 56.3%
Vegetable intake (n = 1356) total effect = -12.5(-21.4; -3.63)
direct effect model 1 = -12.7(-21.5; -3.86)
Direct effect model 2 = -14.0 (-22.7;-5.26)
path a path b(model 1)
path b(model 2)
mediated effect (a*b) in model1
mediated effect (a*b) in model 2
coeff SE coeff SE coeff SE coeff 95%CI1 proportion coeff 95%CI1 proportion
knowledge -0.03 0.02 9.65 5.39 – – -0.31 -1.47 0.11 2.4% – – – –
liking -0.06 0.06 5.19 2.23 – – -0.31 -1.39 0.19 2.5% – – – –
active encouragement -0.02 0.07 1.25 1.85 – – -0.03 -0.68 0.17 0.2% – – – –
parental demand 0.11 0.06 7.29 2.49 10.2 2.18 0.82 0.04 2.22 -6.6% 1.23 0.15 2.81 -9.7%
parental allowing -0.14 0.06 1.49 2.22 – – -0.21 -1.09 0.35 1.7% – – – –
parental facilitation 0.00 0.06 3.32 2.19 – – 0.00 -0.65 0.53 0.0% – – – –
bringing to school 0.02 0.02 17.75 6.64 – – 0.30 -0.29 1.41 -2.4%
school availability 0.01 0.01 -19.61 21.62 – – -0.11 -0.60 0.09 0.9% – – – –
total 0.16 -1.85 2.39 -1.3% 1.23 0.15 2.81 -9.7%1 bias-corrected 95% confidence intervals retrieved from resampling (n = 5000)
Model 1 - model including all potential mediators
Model 2 - model including only the significant mediators from model 1
All models are adjusted for sex, age, ethnic background and maternal educational level
Bold - significant estimates at the p = 0.05 level
Fischer et al. International Journal of Behavioral Nutrition and Physical Activity 2011, 8:141http://www.ijbnpa.org/content/8/1/141
Page 8 of 11

once per day improved from between 29.2 and 49.6% in2002 to between 41.3 and 55.0% in 2006. Johnson andHackett presented evidence for a positive trend in fruitand vegetable intake in Liverpool between 2000 and 2006for 9-10-year-olds; the proportion of boys and girlsreporting eating fruit on the previous day increased from71.5% in 2000 to 76.8% in 2006 and from 70.7% in 2000to 80.8% in 2006 respectively [28]. However, no otherstudies published on potential underlying factors explain-ing the trends in fruit intake.The results further indicate that 11-year-olds in 2009 did
not eat more vegetables than 11-years-olds in 2003. Onthe contrary, the 2009 sample reported a lower vegetableintake than the 2003 sample. This finding is consistentwith results from previous research, indicating thatincreasing intake levels of vegetables of children is moredifficult than improving fruit intakes. Children have higherpreferences for fruit [29], and in the Netherlands it mightbe even more difficult to improve vegetable intake byschool-based promotion, as vegetable intake during schoolhours is uncommon and does not fit the normal eatingpatterns of most native Dutch families. Vegetables are partof the evening meal, but are rather uncommon at break-fast, lunch or in between meals [16]. The potential media-tors included in the current study could not explain thedifference in vegetable intake between the two samples,but we found that parental demand and bringing vegeta-bles to school had a suppressive effect on the difference invegetable intake between the samples. This indicates thateven though parental demand and bringing vegetables toschool were significantly associated with the outcome vari-ables in the expected direction, the so-called direct effectof the cohort variable on the outcome was stronger whenthese two variables were taken into account. These resultssuggest that there must be unmeasured factors thatexplain why the 2009 sample reported a lower vegetableintake than the 2003 sample. Therefore, future studiesshould include other potential mediators in order toinform future intervention strategies. One possibly impor-tant mediator may be feeding strategies, as a study byZeinstra et al. showed that a feeding strategy in whichchildren could make choice regarding when and whatvegetables to eat, was positively associated with their vege-table intake [30]. In addition, since school availability ofvegetables was very low, an alternative strategy may be toimprove availability and accessibility of vegetables atschools, for example by providing ready-to-eat vegetablesas a snack in the morning breaks.The fact that many factors that have been found to be
significant correlates of fruit and vegetable intakesappeared to be more favourable in 2009 than in 2003 isencouraging. The fact in particular that in 2009 childrenmore often agreed that there are fruits and vegetables
available at their school may indicate that schools havechanged their policies or have participated in pro-grammes that facilitate availability and accessibility, suchas the Schoolgruiten project [16]. Analyses of differencesin school policies between 2009 and 2003 will be con-ducted to gain more insight. Nevertheless, the proportionof children who agreed that fruit and vegetables wereavailable at their school remained low in 2009 also, indi-cating that there is much room for further improvement.There was one potential determinant that showed a
negative trend: fewer children in 2009 than in 2003reported that they were allowed to eat as much fruitand vegetables as they wanted. It may be that parentshave become stricter in controlling their children’s eat-ing behaviours. It could also be a statistical artefactsince in 2003 the scores were high and could only godown (regression to the mean), but this is mere specula-tion and should be further explored in additionalresearch.A strength of this study is that it used representative
samples for the Netherlands, using the same validatedmethodologies [24], that were sensitive enough to detectchanges in intake as well as in determinants [17]. Anotherstrength of the study is that effect modification by gender,maternal educational level and ethnic background wasexplored and that potential confounders were controlledin multiple regression analyses. Moreover, the currentstudy did not solely explore differences in intake; it alsoincluded potential determinants of fruit and vegetableintake and was thus able to conduct mediation analyses.There are also some limitations to this study, however.First, fruit and vegetable intake might have been influ-enced by seasonal effects, because the Pro Children datawere collected in autumn and the Pro Greens data inspring. Since seasons may influence the availability of fruitand vegetables, it is generally assumed that children eatmore fruit and vegetables in summer and autumn com-pared with winter and spring [31]. We explored thisassumption in the available data from the control group ofthe Dutch Pro Children intervention study (n = 188) andindeed found that the children reported significantlyhigher intakes of fruit and vegetables in the Septembermeasurement compared with the May measurement (datanot shown). The observation in the current study that the2009 sample reported higher fruit intakes in May than theschoolchildren in October 2003 is not consistent with thisproposed seasonal effect and may thus represent a realhigher intake level in the 2009 sample compared with the2003 sample. Furthermore, this seasonal influence is unli-kely to apply to for most determinants, except for theavailability of fruit and vegetables.Second, the Pro Greens questionnaire slightly differed
from the one used in Pro Children in the assessment of
Fischer et al. International Journal of Behavioral Nutrition and Physical Activity 2011, 8:141http://www.ijbnpa.org/content/8/1/141
Page 9 of 11
fruit intake, i.e. a separate question for berries was added.Although it was just a minor adaptation, a sensitivity ana-lysis was conducted. There were doubts as to whetherchildren might have thought that they had to state piecesof berries eaten instead of portions of berries eaten,because there were high intake numbers on this item.Therefore, under the assumption that the childrenreported pieces of berries instead of portions, the num-bers were recalculated into portions eaten to check if itwould make a difference in the number of children whoreached the recommended intake. Results from theseanalyses showed that the reported differences betweenthe two samples were not caused by this extra question-naire item (data not shown).A final limitation was the use of self-reported mea-
sures. Self-reported intake levels may be biased, but aprevious study showed acceptable validity of the ques-tionnaire used in the present study. Furthermore, anybias because of self reports is likely to be the same inthe two study samples, and will therefore not be of lim-ited influence on the comparison between the twosamples.Taking the limitations into account, the present study
does provide an indication of the current situation com-pared with a period in which interventions and policiesaimed at improving schoolchildren’s fruit and vegetableintakes were not omnipresent. Although the effect sizemay not be clinically relevant for individuals, there is alikely relevance for public health, because many childrencan be reached by school-based interventions and smallchanges in a large proportion of the population canhave an important impact on health indicators, asrecently shown in an epidemiological modelling study[32]. In the Netherlands 608 out of around 7000 pri-mary schools reported participating in Schoolgruiten orsimilar fruit and vegetable promoting projects. Theresult of the current study might indicate that theincreased attention to fruit and vegetable intakes inDutch schools may have started to have a somewhatpositive effect among 11-year-olds.
ConclusionThe outcome of the present study suggests that therewas a small improvement in fruit consumption in 11-year-olds between 2003 and 2009, whereas the intake ofvegetables was lower in the more recent sample. Chil-dren reported in general more knowledge of recom-mended intake levels and more favourable scores onother potential determinants of fruit and vegetableintakes in 2009 than in 2003. Improved knowledge, par-ental demand and parental facilitation explained the dif-ferences in fruit intake which suggests that these factorsshould be addressed in future intervention programmesor strategies.
AcknowledgementsThe Pro Children study was carried out with financial support from theCommission of the European Communities, specific RTD programme ‘Qualityof Life and Management of Living Resources’, QLK1-2001-00547 ‘Promotingand Sustaining Health through Increased Vegetable and Fruit Consumptionamong European Schoolchildren’ (Pro Children).The Pro Greens Project was made possible by a financial contribution fromthe European Commission’s Programme of Community Action in the Fieldof Public Health 2003-2008.The studies do not necessarily reflect the Commission’s views and in no wayanticipate its future policy in this area.Special thanks go to Marianne Wind for the data collection for the ProChildren study and Linda de Gauw, whose role was crucial in theorganization and data collection procedure of the Pro Greens study, as wellas to all the children, teachers, and headmasters who participated in thissurvey.
Author details1The EMGO+ Institute for Health and Care Research and the Department ofEpidemiology and Biostatistics, VU University Medical Center, Van derBoechorststraat 7, 1081 BT, Amsterdam, The Netherlands. 2Department ofHealth Sciences, VU University, De Boelelaan 1081, 1081 HV, Amsterdam, TheNetherlands. 3Department of Biosciences and Nutrition, Karolinska Institutet,Novum, SE-141 83, Huddinge, Sweden. 4Department of Health, Nutrition andManagement, Oslo and Akershus University College, P.O.Box 4, St Olavsplass,NO0130 Oslo, Norway.
Authors’ contributionsAY, JB, SJtV designed the study. CF, NIT and SJtV conducted the analyses. CFdrafted the manuscript. All authors provided feedback on the manuscriptand approved the submitted version.
Competing interestsThe authors declare that they have no competing interests.
Received: 28 January 2011 Accepted: 22 December 2011Published: 22 December 2011
References1. Vereecken C, Huybrechts I, van HH, Martens V, Wittebroodt I, Maes L:
Results from a dietary intervention study in preschools “Beastly Healthyat School. Int J Public Health 2009, 54:142-149.
2. Huybrechts I, Matthys C, Vereecken C, Maes L, Temme EH, Van OH, De BG,De HS: Food intakes by preschool children in Flanders compared withdietary guidelines. Int J Environ Res Public Health 2008, 5:243-257.
3. Crockett S, Sims L: Environmental influences on children’s eating. Journalof Nutrition Education 1995, 27:235-249.
4. te Velde SJ, Twisk JW, Brug J: Tracking of fruit and vegetableconsumption from adolescence into adulthood and its longitudinalassociation with overweight. Br J Nutr 2007, 98:431-438.
5. Paolini M, Sapone A, Canistro D, Antonelli MA, Chieco P: Diet and risk ofcancer. Lancet 2003, 361:257-258.
6. Hung H-C, Joshipura KJ, Jiang R, Hu FB, Hunter D, Smith-Warner SA,Colditz GA, Rosner B, Spiegelman D, Willett WC: Fruit and VegetableIntake and Risk of Major Chronic Disease. J Natl Cancer Inst 2004,96:1577-1584.
7. Bes-Rastrollo M, Martinez-Gonzalez MA, Sanchez-Villegas A, de la FuenteArrillaga C, Martinez JA: Association of fiber intake and fruit/vegetableconsumption with weight gain in a Mediterranean population. Nutrition2006, 22:504-5011.
8. WHO, FAO: Diet, nutrition and the prevention of chronic diseases Geneva,Switzerland; 2003.
9. Netherlands Bureau for Food and Nutrition Education: Zo eet Nederland[This is how the Dutch eat] Den Haag: VoVo; 1998.
10. Yngve A, Wolf A, Poortvliet E, Elmadfa I, Brug J, Ehrenblad B, Franchini B,Haraldsdóttir J, Krølner R, Maes L, et al: Fruit and Vegetable Intake in aSample of 11-Year-Old Children in 9 European Countries: The ProChildren Cross-Sectional Survey. Annals of Nutrition and Metabolism 2005,49:236-245.
11. Bere E, Veierod MB, Bjelland M, Klepp KI: Outcome and process evaluationof a Norwegian school-randomized fruit and vegetable intervention:
Fischer et al. International Journal of Behavioral Nutrition and Physical Activity 2011, 8:141http://www.ijbnpa.org/content/8/1/141
Page 10 of 11

Fruits and Vegetables Make the Marks (FVMM). Health Educ Res 2006,21:258-67.
12. Eriksen K, Haraldsdottir J, Pederson R, Flyger HV: Effect of a fruit andvegetable subscription in Danish schools. Public Health Nutr 2003, 6:57-63.
13. Baranowski T, Stables G: Process Evaluations of the 5-a-Day Projects.Health Education & Behavior 2000, 27:157-166.
14. Pollard CM, Miller MR, Daly AM, Crouchley KE, O’Donoghue KJ, Lang AJ,Binns CW: Increasing fruit and vegetable consumption: success of theWestern Australian Go for 2&5 campaign. Public Health Nutr 2008,11:314-320.
15. Reinaerts E, De NJ, Candel M, de VN: Increasing children’s fruit andvegetable consumption: distribution or a multicomponent programme?Public Health Nutr 2007, 10:939-947.
16. Tak NI, te Velde SJ, Brug J: Long term effects of the Dutch ProjectSchoolgruiten - promoting fruit and vegetable consumption amongprimary schoolchildren. Public Health Nutr 2008.
17. te Velde SJ, Brug J, Wind M, Hildonen C, Bjelland M, Perez-Rodrigo C,Klepp KI: Effects of a comprehensive fruit- and vegetable-promotingschool-based intervention in three European countries: the Pro ChildrenStudy. Br J Nutr 2008, 99:893-903.
18. Perez-Rodrigo C, Wind M, Hildonen C, Bjelland M, Aranceta J, Klepp KI,Brug J: The Pro Children intervention: applying the interventionmapping protocol to develop a school-based fruit and vegetablepromotion programme. Ann Nutr Metab 2005, 49:267-277.
19. de Sa J, Lock K: Will European agricultural policy for school fruit andvegetables improve public health? A review of school fruit andvegetable programmes. The European Journal of Public Health 2008,ckn061.
20. Rasmussen M, Krolner R, Svastisalee CM, Due P, Holstein BE: Secular trendsin fruit intake among Danish schoolchildren, 1988 to 2006: changinghabits or methodological artefacts? Int J Behav Nutr Phys Act 2008, 5:6.
21. Klepp K-I, Pérez-Rodrigo C, De Bourdeaudhuij I, Due PP, Elmadfa I,Haraldsdóttir J, König J, Sjöström M, Thórsdóttir I, Vaz de Almeida MD, et al:Promoting Fruit and Vegetable Consumption among EuropeanSchoolchildren: Rationale, Conceptualization and Design of the ProChildren Project. Annals of Nutrition and Metabolism 2005, 49:212-220.
22. Yngve A, Lynch C, Thorsdottir I, Roos E, Krawinkel M, Papadaki A, HlastanRibic C, the Pro Greens consortium: Promoting vegetable and fruitconsumption among European schoolchildren: Background,conceptualization and design of the Pro Greens Project. 2011.
23. Reinaerts E, De NJ, Candel M, de VN: Explaining school children’s fruit andvegetable consumption: the contributions of availability, accessibility,exposure, parental consumption and habit in addition to psychosocialfactors. Appetite 2007, 48:248-258.
24. Haraldsdóttir J, Thórsdóttir I, de Almeida MDV, Maes L, Pérez Rodrigo C,Elmadfa I, Frost Andersen L: Validity and Reproducibility of a PrecodedQuestionnaire to Assess Fruit and Vegetable Intake in European 11- to12-Year-Old Schoolchildren. Annals of Nutrition and Metabolism 2005,49:221-227.
25. De Bourdeaudhuij I, Klepp KI, Due P, Rodrigo CP, de Almeida M, Wind M,Krolner R, Sandvik C, Brug J: Reliability and validity of a questionnaire tomeasure personal, social and environmental correlates of fruit andvegetable intake in 10-11-year-old children in five European countries.Public Health Nutr 2005, 8:189-200.
26. MacKinnon DP: Introduction to Statistical Mediation Analysis New York, NY:Lawrence Erlbaum Associates; 2008.
27. Preacher KJ, Hayes AF: Asymptotic and resampling strategies forassessing and comparing indirect effects in multiple mediator models.Behav Res Methods 2008, 40:879-891.
28. Johnson B, Hackett AF: Trends in fruit, vegetable and salad intakes in 9-10-year-old schoolchildren living in Liverpool, 2000-2005. Public HealthNutr 2007, 10:252-255.
29. Burchett H: Increasing fruit and vegetable consumption among Britishprimary schoolchildren: a review. Health Education 2003, 103:99-109.
30. Zeinstra GG, Renes RJ, Koelen MA, Kok FJ, de GC: Offering choice and itseffect on Dutch children’s liking and consumption of vegetables: arandomized controlled trial. Am J Clin Nutr 2010, 91:349-356.
31. Fahey MT, Sasaki S, Kobayashi M, Akabane M, Tsugane S: Seasonalmisclassification error and magnitude of true between-person variationin dietary nutrient intake: a random coefficients analysis and
implications for the Japan Public Health Center (JPHC) Cohort Study.Public Health Nutr 2003, 6:385-391.
32. te Velde SJ, Lennert VJ, Tak NI, Bosmans JE, Klepp KI, Brug J: Modeling thelong term health outcomes and cost-effectiveness of two interventionspromoting fruit and vegetable intake among schoolchildren. Econ HumBiol 2011, 9:14-22.
doi:10.1186/1479-5868-8-141Cite this article as: Fischer et al.: Differences in fruit and vegetableintake and their determinants among 11-year-old schoolchildrenbetween 2003 and 2009. International Journal of Behavioral Nutrition andPhysical Activity 2011 8:141.
Submit your next manuscript to BioMed Centraland take full advantage of:
• Convenient online submission
• Thorough peer review
• No space constraints or color figure charges
• Immediate publication on acceptance
• Inclusion in PubMed, CAS, Scopus and Google Scholar
• Research which is freely available for redistribution
Submit your manuscript at www.biomedcentral.com/submit
Fischer et al. International Journal of Behavioral Nutrition and Physical Activity 2011, 8:141http://www.ijbnpa.org/content/8/1/141
Page 11 of 11