Global Variability in Fruit and Vegetable Consumption
13
Global Variability in Fruit and Vegetable Consumption Justin N. Hall, BScH, BPHE, Spencer Moore, PhD, MPH, Sam B. Harper, PhD, MPH, John W. Lynch, PhD, MEd, MPH Background: Low fruit and vegetable consumption is an important risk factor for chronic diseases, but for many (mainly developing) countries, no prevalence data have ever been published. This study presents data on the prevalence of low fruit and vegetable intake for 52 countries and for various sociodemographic groups and settings across these countries. Methods: Data from 196,373 adult participants from 52 countries taking part in the World Health Survey (2002–2003) were analyzed in the summer of 2008. Low fruit and vegetable consumption was defined according to the WHO guidelines of a minimum of five servings of fruits and/or vegetables daily. Results: Low fruit and vegetable consumption prevalence ranged from 36.6% (Ghana) to 99.2% (Pakistan) for men and from 38.0% (Ghana) to 99.3% (Pakistan) for women. Significant differences in the likelihood of low fruit and vegetable intake between men and women were found in 15 countries. The prevalence of low fruit and vegetable consumption tended to increase with age and decrease with income. Although urbanicity was not associated overall with low fruit and vegetable consumption, urban and rural differences were significant for 11 countries. Conclusions: Overall, 77.6% of men and 78.4% of women from the 52 mainly low- and middle-income countries consumed less than the minimum recommended five daily servings of fruits and vegetables. Baseline global information on low fruit and vegetable consumption obtained in this study can help policymakers worldwide establish interventions for addressing the global chronic disease epidemic. (Am J Prev Med 2009;36(5):402– 409) © 2009 American Journal of Preventive Medicine Introduction L ow fruit and vegetable consumption increases the risk of obesity, coronary heart disease and stroke, type 2 diabetes, diverticulosis, hyperten- sion, and epithelial cancers, such as cancer of the lung, esophagus, mouth, stomach, colon, and pancreas. 1–9 Low fruit and vegetable consumption is an important modifi- able risk factor that is contributing to the rising global burden of chronic diseases. 10,11 Although the disease burden that can be attributed to nutrition has not been quantified in many countries, the importance of fruit and vegetable consumption in the fight against obesity and chronic diseases should not be underestimated. In 2000, it was estimated that 2.7 million deaths (4.9%) and 26.7 million disability adjusted life years (DALYs; 1.8%) were attributable to low fruit and vege- table intake globally. 12 Further, 31% of ischemic heart disease, 20% of esophageal cancer, 19% of ischemic stroke, 19% of gastric cancer, and 12% of lung cancer worldwide could be prevented by increasing dietary intake of fruits and vegetables to the minimum recom- mended daily intakes established by the WHO. 12 The WHO panel on diet, nutrition, and prevention of chronic diseases recommended an individual intake of at least 400g of fruits and vegetables a day—the equiv- alent of five servings of 80g each. 13,14 Many developing countries lack any data on fruit and vegetable consumption patterns in their populations (www.who.int/infobase). 12 Where surveys have been performed and data are available, there are intrinsic differences in survey methodology and food intake assessment, which make direct comparisons impossi- ble. 15 To reduce morbidity and mortality from chronic disease caused by low fruit and vegetable consumption, these gaps in knowledge, including the identification of specific populations and subgroups at risk, need to be From the School of Kinesiology and Health Studies, Queen’s Univer- sity (Hall, Moore), Kingston, Ontario; the Centre de Recherche du Centre Hospitalier de l’Université de Montréal (Moore); the Depart- ment of Epidemiology, Biostatistics, and Occupational Health, Fac- ulty of Medicine, McGill University (Harper, Lynch), Montréal, Québec; the School of Health Sciences, University of South Australia (Lynch), Adelaide, South Australia; and the Department of Social Medicine, University of Bristol (Lynch), Bristol, United Kingdom Address correspondence and reprint requests to: Spencer Moore, PhD, MPH, 69 Union Street PEC, Room 215, Queen’s University, Kingston ON K7L 3N6, Canada. E-mail: [email protected]. 402 Am J Prev Med 2009;36(5) 0749-3797/09/$–see front matter © 2009 American Journal of Preventive Medicine • Published by Elsevier Inc. doi:10.1016/j.amepre.2009.01.029
-
Upload
independent -
Category
Documents
-
view
0 -
download
0
Transcript of Global Variability in Fruit and Vegetable Consumption
GVJJ
B
M
R
C
I
Lsefabbqvc
FsCmuQ(M
PK
4
lobal Variability in Fruit andegetable Consumption
ustin N. Hall, BScH, BPHE, Spencer Moore, PhD, MPH, Sam B. Harper, PhD, MPH,ohn W. Lynch, PhD, MEd, MPH
ackground: Low fruit and vegetable consumption is an important risk factor for chronic diseases, butfor many (mainly developing) countries, no prevalence data have ever been published.This study presents data on the prevalence of low fruit and vegetable intake for 52countries and for various sociodemographic groups and settings across these countries.
ethods: Data from 196,373 adult participants from 52 countries taking part in the World HealthSurvey (2002–2003) were analyzed in the summer of 2008. Low fruit and vegetableconsumption was defined according to the WHO guidelines of a minimum of five servingsof fruits and/or vegetables daily.
esults: Low fruit and vegetable consumption prevalence ranged from 36.6% (Ghana) to 99.2%(Pakistan) for men and from 38.0% (Ghana) to 99.3% (Pakistan) for women. Significantdifferences in the likelihood of low fruit and vegetable intake between men and womenwere found in 15 countries. The prevalence of low fruit and vegetable consumption tendedto increase with age and decrease with income. Although urbanicity was not associatedoverall with low fruit and vegetable consumption, urban and rural differences weresignificant for 11 countries.
onclusions: Overall, 77.6% of men and 78.4% of women from the 52 mainly low- and middle-incomecountries consumed less than the minimum recommended five daily servings of fruits andvegetables. Baseline global information on low fruit and vegetable consumption obtainedin this study can help policymakers worldwide establish interventions for addressing theglobal chronic disease epidemic.(Am J Prev Med 2009;36(5):402–409) © 2009 American Journal of Preventive Medicine
((tdswimWcaa
v(pdabdt
ntroduction
ow fruit and vegetable consumption increasesthe risk of obesity, coronary heart disease andstroke, type 2 diabetes, diverticulosis, hyperten-
ion, and epithelial cancers, such as cancer of the lung,sophagus, mouth, stomach, colon, and pancreas.1–9 Lowruit and vegetable consumption is an important modifi-ble risk factor that is contributing to the rising globalurden of chronic diseases.10,11 Although the diseaseurden that can be attributed to nutrition has not beenuantified in many countries, the importance of fruit andegetable consumption in the fight against obesity andhronic diseases should not be underestimated.
rom the School of Kinesiology and Health Studies, Queen’s Univer-ity (Hall, Moore), Kingston, Ontario; the Centre de Recherche duentre Hospitalier de l’Université de Montréal (Moore); the Depart-ent of Epidemiology, Biostatistics, and Occupational Health, Fac-
lty of Medicine, McGill University (Harper, Lynch), Montréal,uébec; the School of Health Sciences, University of South Australia
Lynch), Adelaide, South Australia; and the Department of Socialedicine, University of Bristol (Lynch), Bristol, United KingdomAddress correspondence and reprint requests to: Spencer Moore,
shD, MPH, 69 Union Street PEC, Room 215, Queen’s University,ingston ON K7L 3N6, Canada. E-mail: [email protected].
02 Am J Prev Med 2009;36(5)© 2009 American Journal of Preventive Medicine • Publish
In 2000, it was estimated that 2.7 million deaths4.9%) and 26.7 million disability adjusted life yearsDALYs; 1.8%) were attributable to low fruit and vege-able intake globally.12 Further, 31% of ischemic heartisease, 20% of esophageal cancer, 19% of ischemictroke, 19% of gastric cancer, and 12% of lung cancerorldwide could be prevented by increasing dietary
ntake of fruits and vegetables to the minimum recom-ended daily intakes established by the WHO.12 TheHO panel on diet, nutrition, and prevention of
hronic diseases recommended an individual intake oft least 400g of fruits and vegetables a day—the equiv-lent of five servings of 80g each.13,14
Many developing countries lack any data on fruit andegetable consumption patterns in their populationswww.who.int/infobase).12 Where surveys have beenerformed and data are available, there are intrinsicifferences in survey methodology and food intakessessment, which make direct comparisons impossi-le.15 To reduce morbidity and mortality from chronicisease caused by low fruit and vegetable consumption,hese gaps in knowledge, including the identification of
pecific populations and subgroups at risk, need to be0749-3797/09/$–see front mattered by Elsevier Inc. doi:10.1016/j.amepre.2009.01.029
ficvlf
M
S
TshfhhpslaftlmwAMa
ewatcwTao
llpsutdui
Q
Qtmttmfc2q
dd
tpfsrbmoc(sbntaocdeia
S
Dwttytsowwaw
pbssvommanmbn
spa(ataa
M
lled. To develop effective policies and implementomprehensive programs aimed at increasing fruit andegetable consumption, governments require country-evel baseline information on the prevalence of lowruit and vegetable consumption.10,16
ethods
tudy Population and Design
he World Health Survey (WHS), a large cross-sectionaltudy, was administered in 70 countries in 2002–2003 to assessealthcare expenditures, adult mortality, birth history, risk
actors, chronic health conditions, and the coverage ofealth interventions (www.who.int/healthinfo/survey/en/index.tml). Countries included in the survey comprise a largeroportion of the world’s population, geographically repre-ent the six WHO regions, and include high-, middle-, andow-income countries. In addition to the standard questionssked of all participants, each country was able to selecturther questionnaire modules, one of which included ques-ions related to dietary habits and nutrition. Fifty-two mainlyow- and middle-income countries administered the nutrition
odule. These countries represent all regions of the world,ith 14 countries from the European region, 18 from thefrican region, six from the Americas, four from the Easternediterranean region, five from the Southeast Asia region,
nd five from the Western Pacific region.The WHS’s sampling frame covered 100% of a country’s
ligible population, meaning that the entire national territoryas included, and particular ethnic groups or geographicreas were not excluded from the sampling frame. Excep-ional circumstances that may have precluded full nationaloverage, such as accessibility and conflict, were discussedith WHO sampling experts and noted in the data record.he target population included any adult, male or female,ged �18 years living in private households, who were not outf the country during the survey period.Face-to-face interviews were conducted by lay people with at
east a high school education. Interviewers attended a week-ong training course using a standard protocol manual andarticipated in field interviews that were reviewed by supervi-ors prior to actual data collection. Random national samples,sing a multistage cluster design, were obtained in all coun-ries except China, Comoros, the Republic of Congo, Côte’Ivoire, India, and the Russian Federation. A Kish table wassed to select respondents within each household (www.who.
nt/healthinfo/survey/en/index.html).17,18
uestionnaire
uestionnaires were translated using a standard WHO pro-ocol with both translation and back-translation of the instru-
ent. Independent bilingual experts reviewed and verifiedhe quality of the translations prior to field implementa-ion.17,18 The WHS was not a comprehensive nutrition survey
easuring whole diets, but rather sought measurement ofruit and vegetable consumption only. Two questions wereoncerned with intake of fruits and vegetables, using the4-hour dietary recall data as the gold standard.19 The survey
uestions were: How many servings of fruit do you eat on a typical gay 2009
ay? and How many servings of vegetables do you eat on a typicalay?Researchers were trained to show all respondents a nutri-
ion risk factor card that indicates both in writing andictorially general categories, amounts, and examples ofruits and vegetables in an attempt to standardize the servingize and number of servings reported. Each nutrition card waseviewed and updated by each survey country to reflect theest examples of fruits and vegetables to be considered theost typical for that country. The nutrition card categorized
ne serving of vegetables into one of three groups: (1) oneup of raw green leafy vegetables such as spinach or salad;2) one-half cup of other vegetables cooked or chopped raw,uch as tomatoes, carrots, pumpkin, corn, Chinese cabbage,eans, or onions; and (3) one-half cup vegetable juice. Theutrition card categorized one serving of fruit into one of
hree groups: (1) one medium size piece of fruit, such as anpple, banana, or orange; (2) one-half cup cooked, chopped,r canned fruit; and (3) one-half cup fruit juice, not artifi-ially flavored. Researchers were also instructed to tell respon-ents to consider a “typical day” to be one when a person isating fruits or vegetables and not the average over the period ofnquiry.19 Informed consent was obtained from all respondents,nd the study received ethics approval at each site.
tudy Sample and Methods
ata analysis was conducted in the summer of 2008. Thereere 229,180 WHS participants within the 52 countries. Of
hese, 199,032 participants provided complete information inhe nutrition module. For these reports, people aged �18ears and those aged �99 years were excluded. Observationshat were missing information on age, gender, urbanicity, orampling weight were also excluded, for a total of 196,373bservations. Observations from Slovenia and Guatemalaere kept, although sampling and urbanicity informationere absent for Slovenia, and sampling information wasbsent for Guatemala. People aged between 70 and 99 yearsere grouped into the “70 plus” age category.Economic status was measured using the asset-based ap-
roach developed by Ferguson and colleagues,20 which haseen used in previous cross-national studies of economictatus and health in developing countries.21,22 Previous re-earch23 has shown that asset-based approaches can providealid and reliable, if imperfect, estimates of household wealthr consumption, and Ferguson and colleagues20 showedoderate-to-high correlations between the asset index andeasured income and consumption data in Greece, Peru,
nd Pakistan. In addition, Wagstaff and Watanabe24 showedo significant difference in estimating inequalities in childalnutrition within 19 low-income countries using an asset-
ased or consumption-based approach for measuring eco-omic status.This approach assumes that economic status is an unob-
erved latent variable and is estimated by a random-effectsrobit model using measures of household ownership ofssets (e.g., a refrigerator, a radio, or a car); access to servicese.g., drinking water); and known predictors of income (e.g.,ge and education). Coefficients on the asset variables fromhe model indicate thresholds on the latent income scalebove which households are more likely to own particularssets (i.e., if a household’s estimated permanent income is
reater than the asset threshold, there is a �0.5 probabilityAm J Prev Med 2009;36(5) 403
tepe
imTtaswtucrrmllicgSw
uw(ffaSri
D
LWdauel
RR
Ts(daw(a(dF
GF
Gvp
Tc
C
BBBBCCCCCCCDEEEGGGHIKKLLMMMMMMMNNPPPRSSSSSSSTTUUUVZZ
4
hat they own the item). This asset scale is then applied toach household to estimate permanent income. Estimates ofermanent income were categorized into quintiles withinach country.Prevalence reports according to income groups were lim-
ted to a smaller sample size of 179,066 observations due toissing income information including all observations fromurkey. Country prevalence estimates were age standardized
o the 1999 WHO standard population (www.who.int/infobase)nd weighted according to the sampling design (based onelection probability, nonresponse, and post-stratification)ith the exception of Guatemala and Slovenia. To examine if
here were significant differences according to gender, age,rbanicity, or income in the risk of low fruit and vegetableonsumption, multivariable Poisson regression analyses with aobust error variance were conducted for each country sepa-ately. This modified Poisson regression approach providesore accurate estimates and CIs for binary outcomes than
ogistic regression when the outcome of interest has a highevel of prevalence in the population.25,26 Therefore, thencidence rate ratios (IRRs) and 95% CIs are reported. Forountries with no missing data, IRRs were adjusted forender, age, urbanicity, and income quintile. Surveys fromlovenia were missing data on urbanicity; those from Turkeyere missing data on income.Countries are reported as indicating significant gender or
rbanicity differences with p�0.05 using clustered robust SEsith the clusters formed of a country’s primary sampling unitsPSUs) used in the WHS. Information on PSUs was missingor Guatemala, Slovenia, and Zambia. Robust SEs were usedor these three countries. Results of separate country analysesre provided as supplementary files. Data were analyzed usingtata, version 10. Sampling weights were not applied ineporting pooled prevalence for age strata, urbanicity, orncome quintiles.
efinition of Low Fruit and Vegetable Consumption
ow fruit and vegetable consumption was defined by theHO panel on diet, nutrition, and prevention of chronic
iseases as consuming fewer than five servings of fruitsnd/or vegetables daily. The panel recommends an individ-al intake of at least 400g of fruits and vegetables a day, thequivalent of five servings, which was used as the cutoff forow fruit and vegetable consumption.13,14
esultsesponse Rates and Demographics
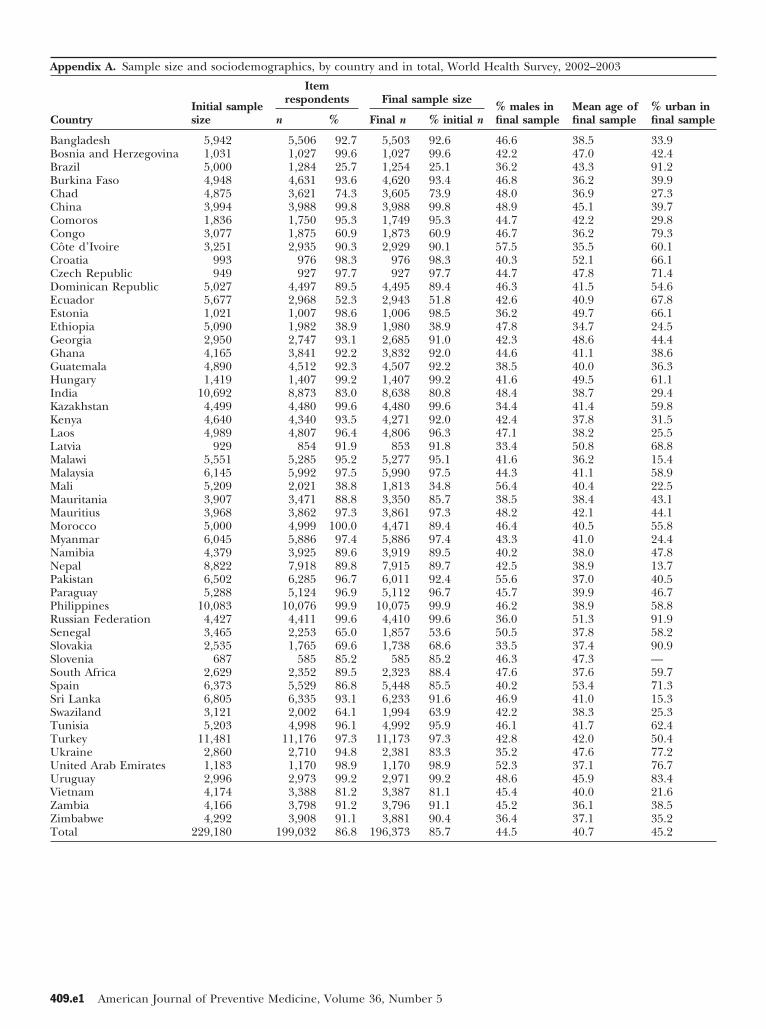
he overall module response was 86.8%. Country re-ponse to the nutrition module ranged from 25.7%Brazil) to 100% (Morocco). Sample characteristics areisplayed in Appendixes A–E (available online at www.jpm-online.net). The percentage of men in the sampleas 44.5%; the percentage was lowest for Latvia33.4%) and highest for Côte d’Ivoire (57.5%). Meange ranged from 34.7 years (Ethiopia) to 52.1 yearsCroatia). The percentage of urban-dwelling respon-ents ranged from 13.7% (Nepal) to 91.9% (Russian
ederation). l04 American Journal of Preventive Medicine, Volume 36, Num
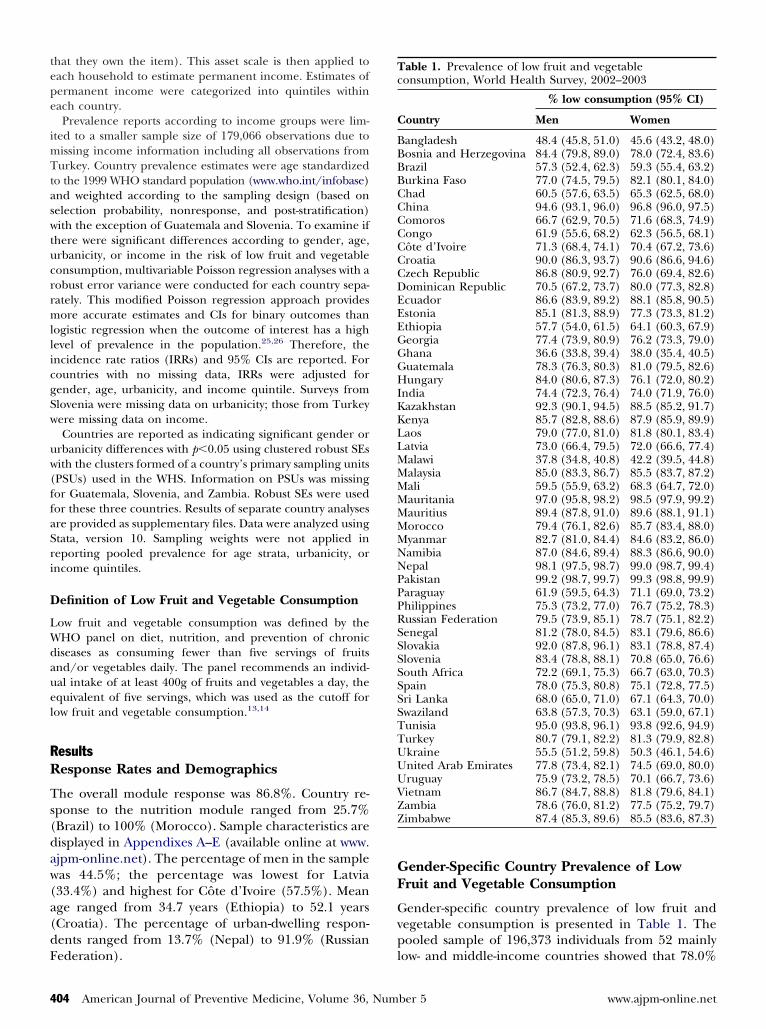
ender-Specific Country Prevalence of Lowruit and Vegetable Consumption
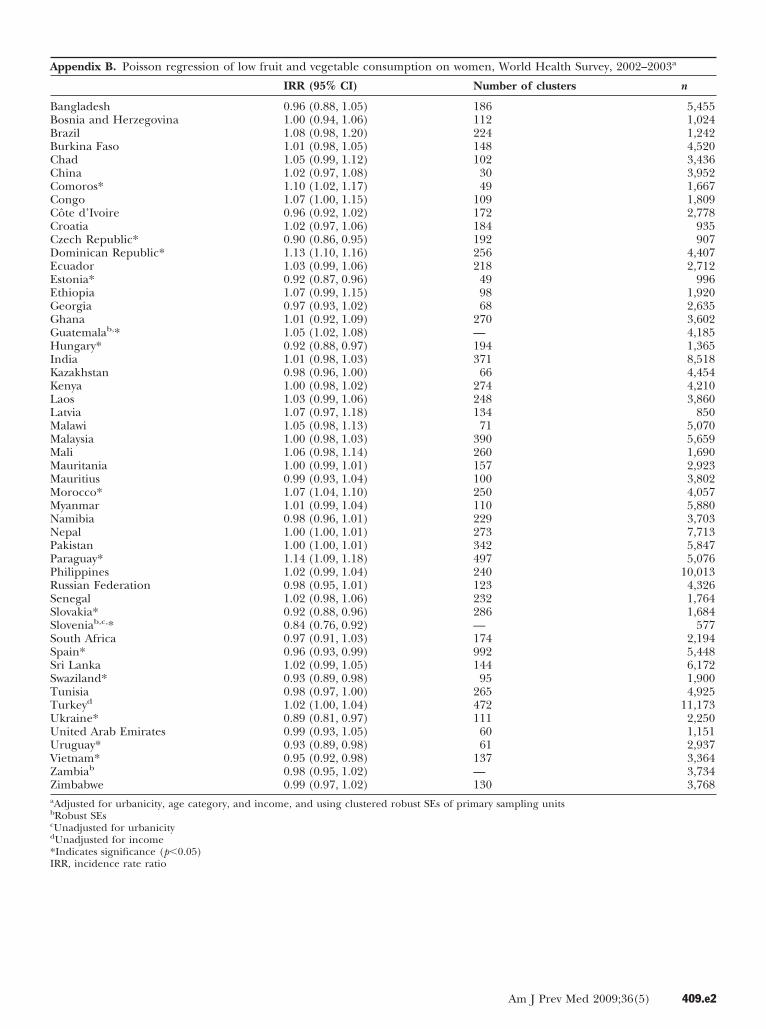
ender-specific country prevalence of low fruit andegetable consumption is presented in Table 1. Theooled sample of 196,373 individuals from 52 mainly
able 1. Prevalence of low fruit and vegetableonsumption, World Health Survey, 2002–2003
% low consumption (95% CI)
ountry Men Women
angladesh 48.4 (45.8, 51.0) 45.6 (43.2, 48.0)osnia and Herzegovina 84.4 (79.8, 89.0) 78.0 (72.4, 83.6)razil 57.3 (52.4, 62.3) 59.3 (55.4, 63.2)urkina Faso 77.0 (74.5, 79.5) 82.1 (80.1, 84.0)had 60.5 (57.6, 63.5) 65.3 (62.5, 68.0)hina 94.6 (93.1, 96.0) 96.8 (96.0, 97.5)omoros 66.7 (62.9, 70.5) 71.6 (68.3, 74.9)ongo 61.9 (55.6, 68.2) 62.3 (56.5, 68.1)ôte d’Ivoire 71.3 (68.4, 74.1) 70.4 (67.2, 73.6)roatia 90.0 (86.3, 93.7) 90.6 (86.6, 94.6)zech Republic 86.8 (80.9, 92.7) 76.0 (69.4, 82.6)ominican Republic 70.5 (67.2, 73.7) 80.0 (77.3, 82.8)cuador 86.6 (83.9, 89.2) 88.1 (85.8, 90.5)stonia 85.1 (81.3, 88.9) 77.3 (73.3, 81.2)thiopia 57.7 (54.0, 61.5) 64.1 (60.3, 67.9)eorgia 77.4 (73.9, 80.9) 76.2 (73.3, 79.0)hana 36.6 (33.8, 39.4) 38.0 (35.4, 40.5)uatemala 78.3 (76.3, 80.3) 81.0 (79.5, 82.6)ungary 84.0 (80.6, 87.3) 76.1 (72.0, 80.2)
ndia 74.4 (72.3, 76.4) 74.0 (71.9, 76.0)azakhstan 92.3 (90.1, 94.5) 88.5 (85.2, 91.7)enya 85.7 (82.8, 88.6) 87.9 (85.9, 89.9)aos 79.0 (77.0, 81.0) 81.8 (80.1, 83.4)atvia 73.0 (66.4, 79.5) 72.0 (66.6, 77.4)alawi 37.8 (34.8, 40.8) 42.2 (39.5, 44.8)alaysia 85.0 (83.3, 86.7) 85.5 (83.7, 87.2)ali 59.5 (55.9, 63.2) 68.3 (64.7, 72.0)auritania 97.0 (95.8, 98.2) 98.5 (97.9, 99.2)auritius 89.4 (87.8, 91.0) 89.6 (88.1, 91.1)orocco 79.4 (76.1, 82.6) 85.7 (83.4, 88.0)yanmar 82.7 (81.0, 84.4) 84.6 (83.2, 86.0)amibia 87.0 (84.6, 89.4) 88.3 (86.6, 90.0)epal 98.1 (97.5, 98.7) 99.0 (98.7, 99.4)akistan 99.2 (98.7, 99.7) 99.3 (98.8, 99.9)araguay 61.9 (59.5, 64.3) 71.1 (69.0, 73.2)hilippines 75.3 (73.2, 77.0) 76.7 (75.2, 78.3)ussian Federation 79.5 (73.9, 85.1) 78.7 (75.1, 82.2)enegal 81.2 (78.0, 84.5) 83.1 (79.6, 86.6)lovakia 92.0 (87.8, 96.1) 83.1 (78.8, 87.4)lovenia 83.4 (78.8, 88.1) 70.8 (65.0, 76.6)outh Africa 72.2 (69.1, 75.3) 66.7 (63.0, 70.3)pain 78.0 (75.3, 80.8) 75.1 (72.8, 77.5)ri Lanka 68.0 (65.0, 71.0) 67.1 (64.3, 70.0)waziland 63.8 (57.3, 70.3) 63.1 (59.0, 67.1)unisia 95.0 (93.8, 96.1) 93.8 (92.6, 94.9)urkey 80.7 (79.1, 82.2) 81.3 (79.9, 82.8)kraine 55.5 (51.2, 59.8) 50.3 (46.1, 54.6)nited Arab Emirates 77.8 (73.4, 82.1) 74.5 (69.0, 80.0)ruguay 75.9 (73.2, 78.5) 70.1 (66.7, 73.6)ietnam 86.7 (84.7, 88.8) 81.8 (79.6, 84.1)ambia 78.6 (76.0, 81.2) 77.5 (75.2, 79.7)imbabwe 87.4 (85.3, 89.6) 85.5 (83.6, 87.3)
ow- and middle-income countries showed that 78.0%
ber 5 www.ajpm-online.net
(tfecIamWEll33u
PTtcttgfh
oBacnHddotds
P
ApOcmtsld
Fs
M
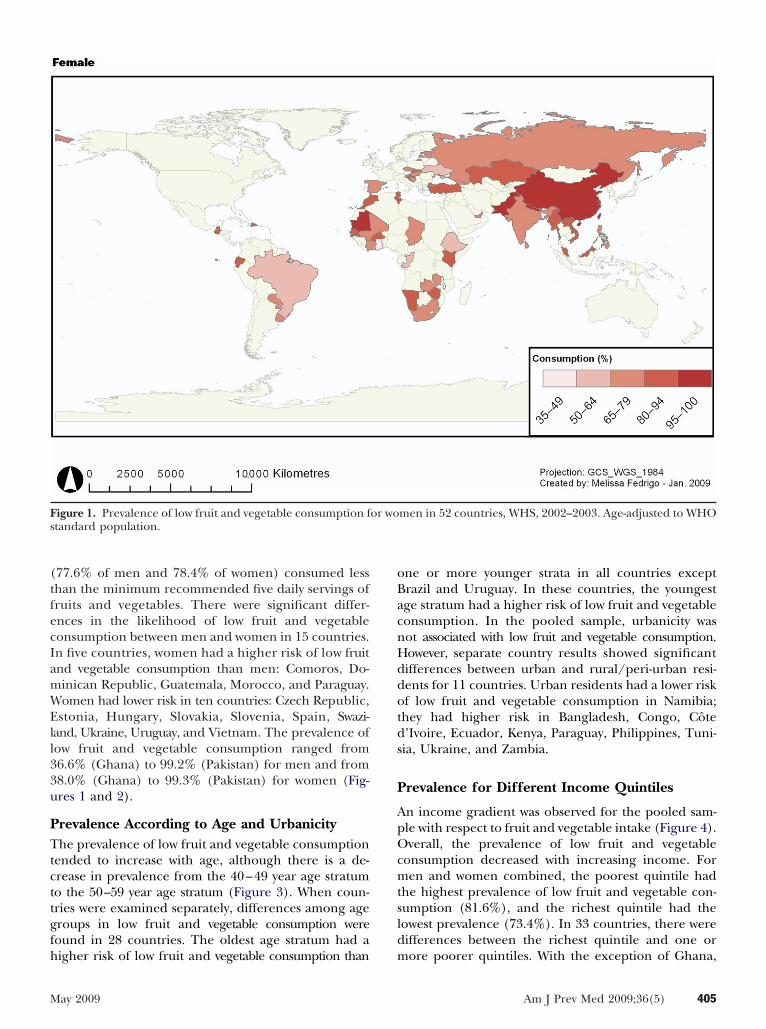
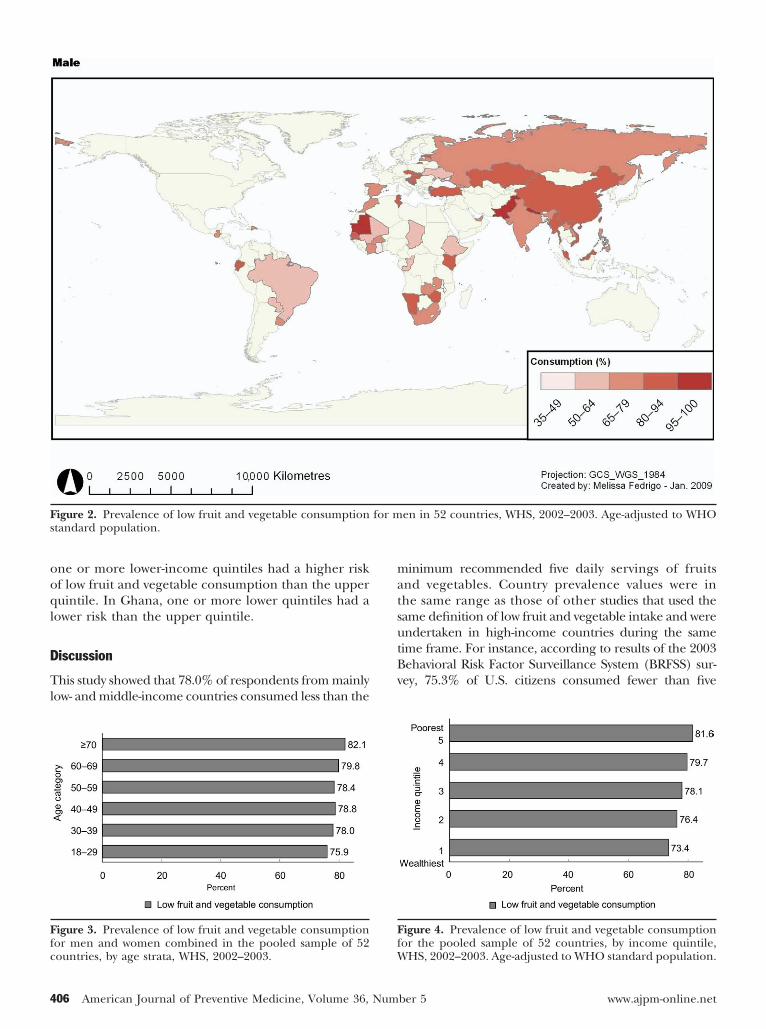
77.6% of men and 78.4% of women) consumed lesshan the minimum recommended five daily servings ofruits and vegetables. There were significant differ-nces in the likelihood of low fruit and vegetableonsumption between men and women in 15 countries.n five countries, women had a higher risk of low fruitnd vegetable consumption than men: Comoros, Do-inican Republic, Guatemala, Morocco, and Paraguay.omen had lower risk in ten countries: Czech Republic,stonia, Hungary, Slovakia, Slovenia, Spain, Swazi-
and, Ukraine, Uruguay, and Vietnam. The prevalence ofow fruit and vegetable consumption ranged from6.6% (Ghana) to 99.2% (Pakistan) for men and from8.0% (Ghana) to 99.3% (Pakistan) for women (Fig-res 1 and 2).
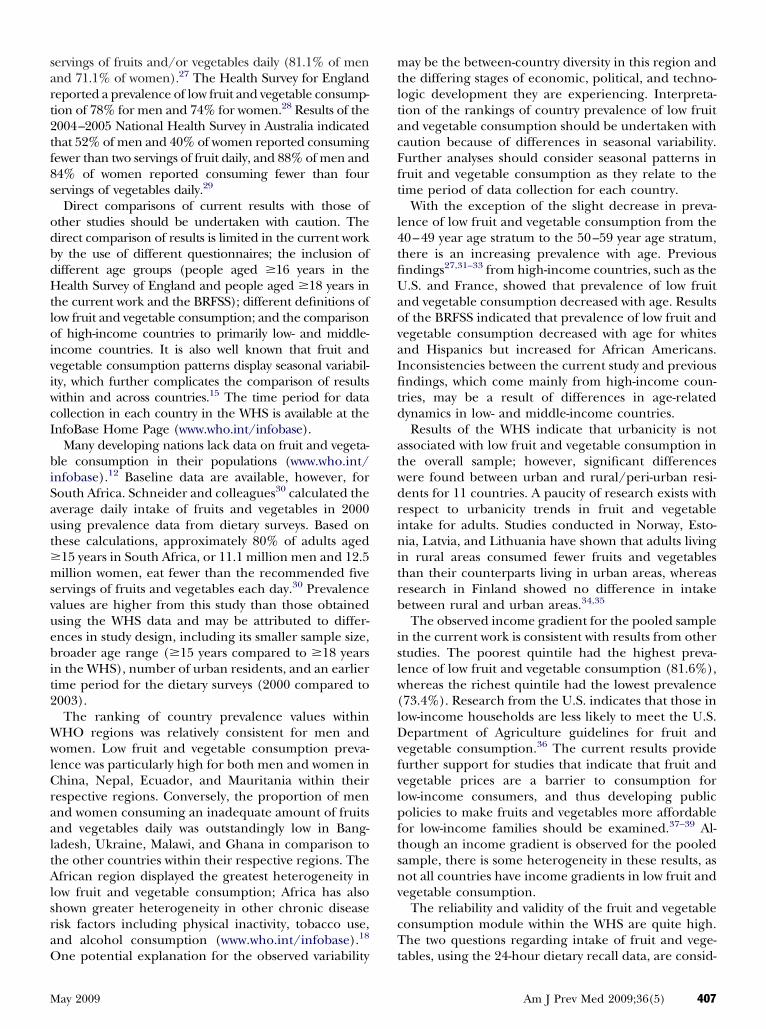
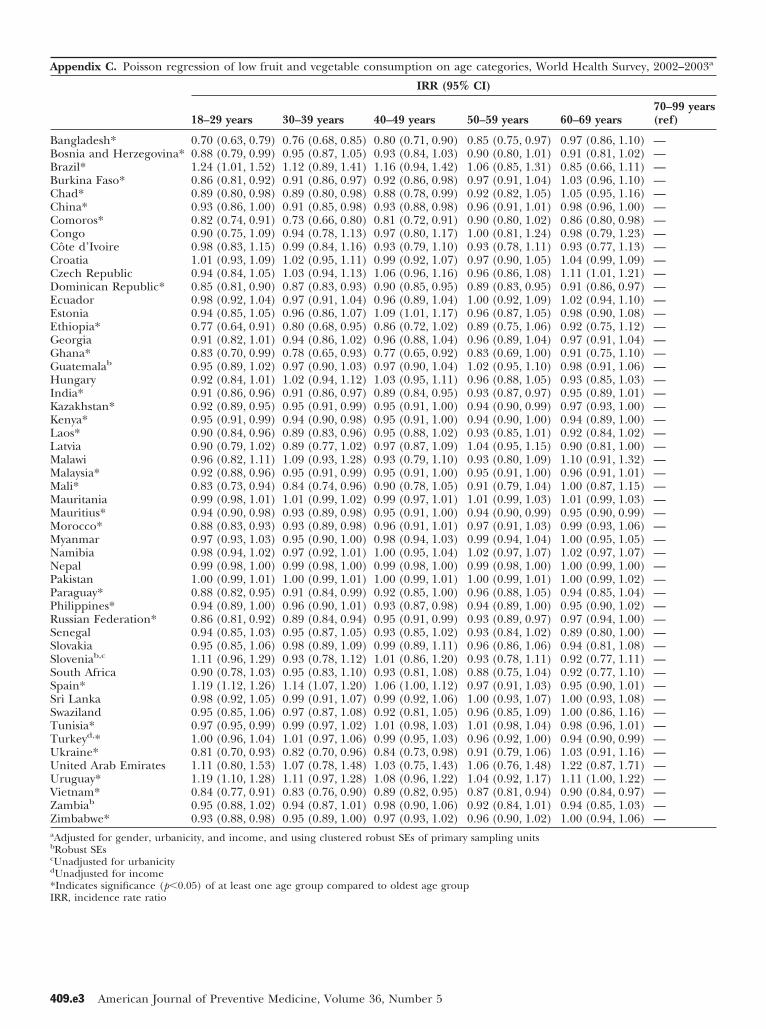
revalence According to Age and Urbanicityhe prevalence of low fruit and vegetable consumption
ended to increase with age, although there is a de-rease in prevalence from the 40–49 year age stratumo the 50–59 year age stratum (Figure 3). When coun-ries were examined separately, differences among ageroups in low fruit and vegetable consumption wereound in 28 countries. The oldest age stratum had a
igure 1. Prevalence of low fruit and vegetable consumption ftandard population.
igher risk of low fruit and vegetable consumption than m
ay 2009
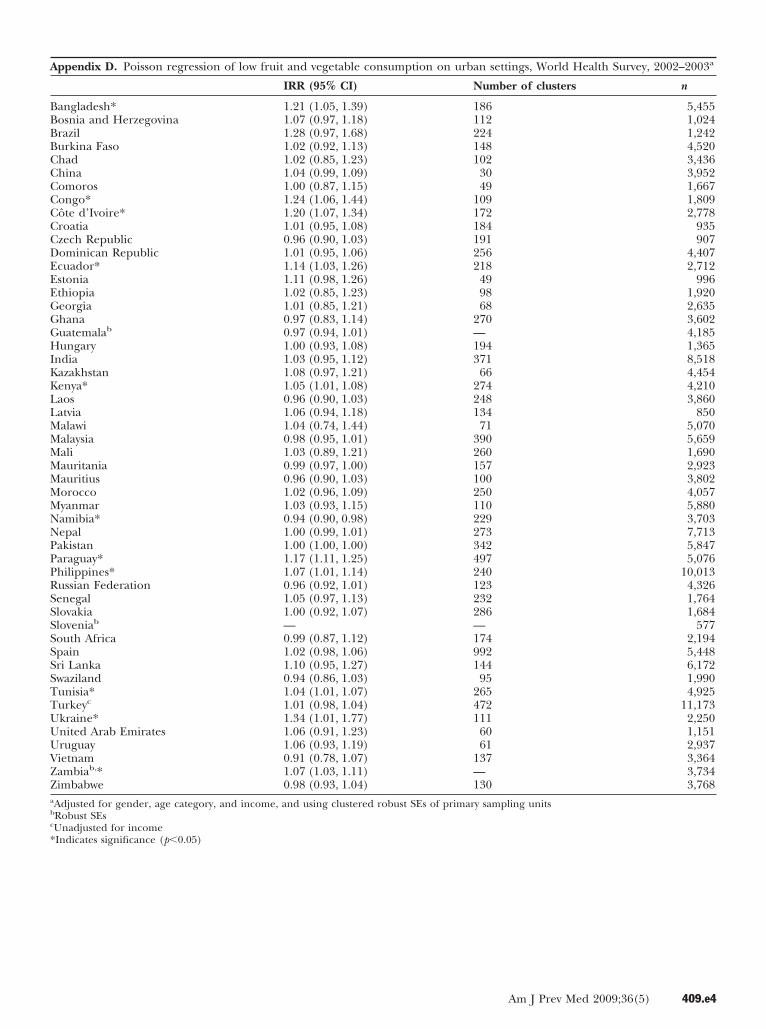
ne or more younger strata in all countries exceptrazil and Uruguay. In these countries, the youngestge stratum had a higher risk of low fruit and vegetableonsumption. In the pooled sample, urbanicity wasot associated with low fruit and vegetable consumption.owever, separate country results showed significantifferences between urban and rural/peri-urban resi-ents for 11 countries. Urban residents had a lower riskf low fruit and vegetable consumption in Namibia;hey had higher risk in Bangladesh, Congo, Côte’Ivoire, Ecuador, Kenya, Paraguay, Philippines, Tuni-ia, Ukraine, and Zambia.
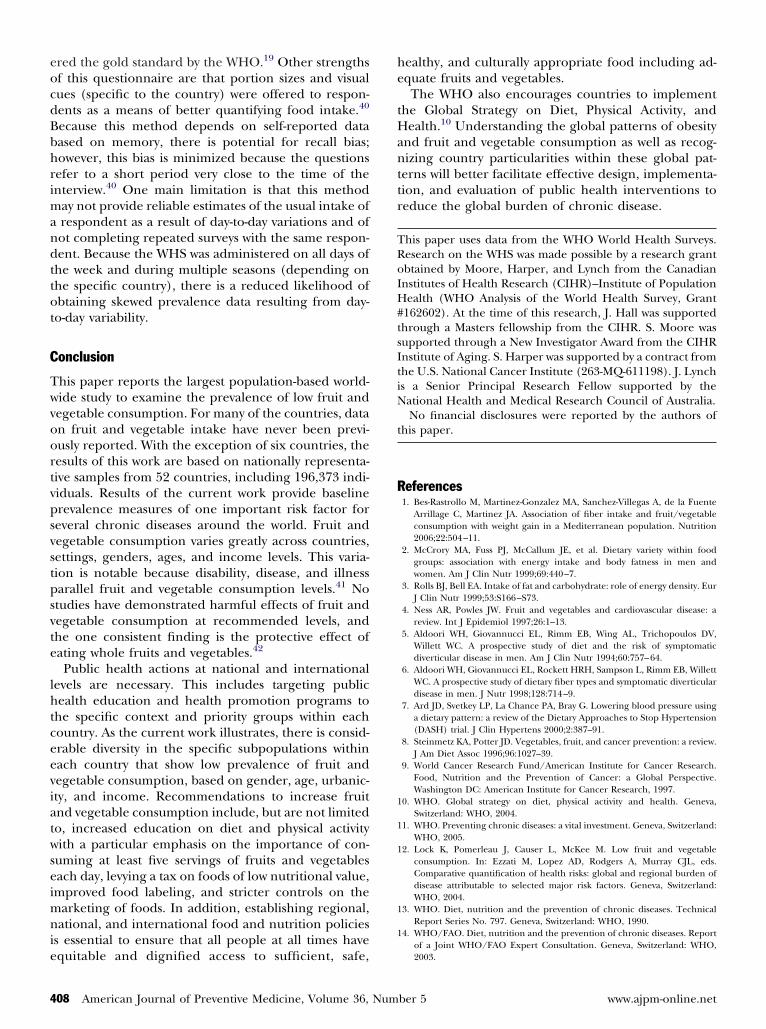
revalence for Different Income Quintiles
n income gradient was observed for the pooled sam-le with respect to fruit and vegetable intake (Figure 4).verall, the prevalence of low fruit and vegetable
onsumption decreased with increasing income. Foren and women combined, the poorest quintile had
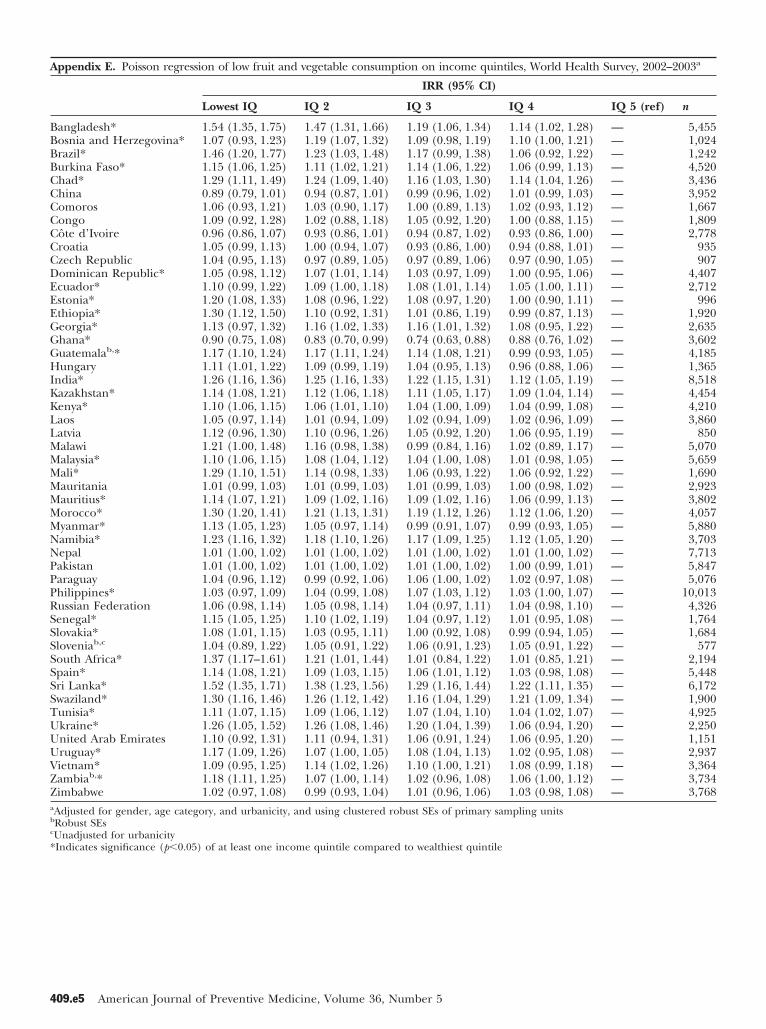
he highest prevalence of low fruit and vegetable con-umption (81.6%), and the richest quintile had theowest prevalence (73.4%). In 33 countries, there wereifferences between the richest quintile and one or
men in 52 countries, WHS, 2002–2003. Age-adjusted to WHO
or woore poorer quintiles. With the exception of Ghana,
Am J Prev Med 2009;36(5) 405
ooql
D
Tl
matsutBv
Ff
Fs
Ffc
4
ne or more lower-income quintiles had a higher riskf low fruit and vegetable consumption than the upperuintile. In Ghana, one or more lower quintiles had a
ower risk than the upper quintile.
iscussion
his study showed that 78.0% of respondents from mainlyow- and middle-income countries consumed less than the
igure 2. Prevalence of low fruit and vegetable consumptiontandard population.
igure 3. Prevalence of low fruit and vegetable consumptionor men and women combined in the pooled sample of 52
Wountries, by age strata, WHS, 2002–2003.
06 American Journal of Preventive Medicine, Volume 36, Num
inimum recommended five daily servings of fruitsnd vegetables. Country prevalence values were inhe same range as those of other studies that used theame definition of low fruit and vegetable intake and werendertaken in high-income countries during the same
ime frame. For instance, according to results of the 2003ehavioral Risk Factor Surveillance System (BRFSS) sur-ey, 75.3% of U.S. citizens consumed fewer than five
igure 4. Prevalence of low fruit and vegetable consumptionor the pooled sample of 52 countries, by income quintile,
en in 52 countries, WHS, 2002–2003. Age-adjusted to WHO
for mHS, 2002–2003. Age-adjusted to WHO standard population.
ber 5 www.ajpm-online.net
sart2tf8s
odbdHtloiviwcI
biSaut�msvuebit2
WwlCraaltAlsraO
mtltacFft
l4tfiUaovaIfitd
atwdrinitrb
islw(lDvfvlpftsnv
cT
M
ervings of fruits and/or vegetables daily (81.1% of mennd 71.1% of women).27 The Health Survey for Englandeported a prevalence of low fruit and vegetable consump-ion of 78% for men and 74% for women.28 Results of the004–2005 National Health Survey in Australia indicatedhat 52% of men and 40% of women reported consumingewer than two servings of fruit daily, and 88% of men and4% of women reported consuming fewer than fourervings of vegetables daily.29
Direct comparisons of current results with those ofther studies should be undertaken with caution. Theirect comparison of results is limited in the current worky the use of different questionnaires; the inclusion ofifferent age groups (people aged �16 years in theealth Survey of England and people aged �18 years in
he current work and the BRFSS); different definitions ofow fruit and vegetable consumption; and the comparisonf high-income countries to primarily low- and middle-
ncome countries. It is also well known that fruit andegetable consumption patterns display seasonal variabil-ty, which further complicates the comparison of resultsithin and across countries.15 The time period for dataollection in each country in the WHS is available at thenfoBase Home Page (www.who.int/infobase).
Many developing nations lack data on fruit and vegeta-le consumption in their populations (www.who.int/
nfobase).12 Baseline data are available, however, forouth Africa. Schneider and colleagues30 calculated theverage daily intake of fruits and vegetables in 2000sing prevalence data from dietary surveys. Based onhese calculations, approximately 80% of adults aged15 years in South Africa, or 11.1 million men and 12.5illion women, eat fewer than the recommended five
ervings of fruits and vegetables each day.30 Prevalencealues are higher from this study than those obtainedsing the WHS data and may be attributed to differ-nces in study design, including its smaller sample size,roader age range (�15 years compared to �18 years
n the WHS), number of urban residents, and an earlierime period for the dietary surveys (2000 compared to003).The ranking of country prevalence values withinHO regions was relatively consistent for men andomen. Low fruit and vegetable consumption preva-
ence was particularly high for both men and women inhina, Nepal, Ecuador, and Mauritania within their
espective regions. Conversely, the proportion of mennd women consuming an inadequate amount of fruitsnd vegetables daily was outstandingly low in Bang-adesh, Ukraine, Malawi, and Ghana in comparison tohe other countries within their respective regions. Thefrican region displayed the greatest heterogeneity in
ow fruit and vegetable consumption; Africa has alsohown greater heterogeneity in other chronic diseaseisk factors including physical inactivity, tobacco use,nd alcohol consumption (www.who.int/infobase).18
ne potential explanation for the observed variability t
ay 2009
ay be the between-country diversity in this region andhe differing stages of economic, political, and techno-ogic development they are experiencing. Interpreta-ion of the rankings of country prevalence of low fruitnd vegetable consumption should be undertaken withaution because of differences in seasonal variability.urther analyses should consider seasonal patterns inruit and vegetable consumption as they relate to theime period of data collection for each country.
With the exception of the slight decrease in preva-ence of low fruit and vegetable consumption from the0–49 year age stratum to the 50–59 year age stratum,here is an increasing prevalence with age. Previousndings27,31–33 from high-income countries, such as the.S. and France, showed that prevalence of low fruit
nd vegetable consumption decreased with age. Resultsf the BRFSS indicated that prevalence of low fruit andegetable consumption decreased with age for whitesnd Hispanics but increased for African Americans.nconsistencies between the current study and previousndings, which come mainly from high-income coun-
ries, may be a result of differences in age-relatedynamics in low- and middle-income countries.Results of the WHS indicate that urbanicity is not
ssociated with low fruit and vegetable consumption inhe overall sample; however, significant differencesere found between urban and rural/peri-urban resi-ents for 11 countries. A paucity of research exists withespect to urbanicity trends in fruit and vegetablentake for adults. Studies conducted in Norway, Esto-ia, Latvia, and Lithuania have shown that adults living
n rural areas consumed fewer fruits and vegetableshan their counterparts living in urban areas, whereasesearch in Finland showed no difference in intakeetween rural and urban areas.34,35
The observed income gradient for the pooled samplen the current work is consistent with results from othertudies. The poorest quintile had the highest preva-ence of low fruit and vegetable consumption (81.6%),hereas the richest quintile had the lowest prevalence73.4%). Research from the U.S. indicates that those inow-income households are less likely to meet the U.S.epartment of Agriculture guidelines for fruit and
egetable consumption.36 The current results provideurther support for studies that indicate that fruit andegetable prices are a barrier to consumption forow-income consumers, and thus developing publicolicies to make fruits and vegetables more affordableor low-income families should be examined.37–39 Al-hough an income gradient is observed for the pooledample, there is some heterogeneity in these results, asot all countries have income gradients in low fruit andegetable consumption.
The reliability and validity of the fruit and vegetableonsumption module within the WHS are quite high.he two questions regarding intake of fruit and vege-
ables, using the 24-hour dietary recall data, are consid-
Am J Prev Med 2009;36(5) 407
eocdBbhrimandttot
C
Twvoortvpsvstpsvte
lhtceeviatwseimnie
he
tHanttr
TRoIH#tsItiN
t
R
1
1
1
1
1
4
red the gold standard by the WHO.19 Other strengthsf this questionnaire are that portion sizes and visualues (specific to the country) were offered to respon-ents as a means of better quantifying food intake.40
ecause this method depends on self-reported dataased on memory, there is potential for recall bias;owever, this bias is minimized because the questionsefer to a short period very close to the time of thenterview.40 One main limitation is that this method
ay not provide reliable estimates of the usual intake ofrespondent as a result of day-to-day variations and ofot completing repeated surveys with the same respon-ent. Because the WHS was administered on all days ofhe week and during multiple seasons (depending onhe specific country), there is a reduced likelihood ofbtaining skewed prevalence data resulting from day-o-day variability.
onclusion
his paper reports the largest population-based world-ide study to examine the prevalence of low fruit andegetable consumption. For many of the countries, datan fruit and vegetable intake have never been previ-usly reported. With the exception of six countries, theesults of this work are based on nationally representa-ive samples from 52 countries, including 196,373 indi-iduals. Results of the current work provide baselinerevalence measures of one important risk factor foreveral chronic diseases around the world. Fruit andegetable consumption varies greatly across countries,ettings, genders, ages, and income levels. This varia-ion is notable because disability, disease, and illnessarallel fruit and vegetable consumption levels.41 Notudies have demonstrated harmful effects of fruit andegetable consumption at recommended levels, andhe one consistent finding is the protective effect ofating whole fruits and vegetables.42
Public health actions at national and internationalevels are necessary. This includes targeting publicealth education and health promotion programs to
he specific context and priority groups within eachountry. As the current work illustrates, there is consid-rable diversity in the specific subpopulations withinach country that show low prevalence of fruit andegetable consumption, based on gender, age, urbanic-ty, and income. Recommendations to increase fruitnd vegetable consumption include, but are not limitedo, increased education on diet and physical activityith a particular emphasis on the importance of con-
uming at least five servings of fruits and vegetablesach day, levying a tax on foods of low nutritional value,mproved food labeling, and stricter controls on the
arketing of foods. In addition, establishing regional,ational, and international food and nutrition policies
s essential to ensure that all people at all times have
quitable and dignified access to sufficient, safe,08 American Journal of Preventive Medicine, Volume 36, Num
ealthy, and culturally appropriate food including ad-quate fruits and vegetables.The WHO also encourages countries to implement
he Global Strategy on Diet, Physical Activity, andealth.10 Understanding the global patterns of obesity
nd fruit and vegetable consumption as well as recog-izing country particularities within these global pat-
erns will better facilitate effective design, implementa-ion, and evaluation of public health interventions toeduce the global burden of chronic disease.
his paper uses data from the WHO World Health Surveys.esearch on the WHS was made possible by a research grantbtained by Moore, Harper, and Lynch from the Canadiannstitutes of Health Research (CIHR)–Institute of Populationealth (WHO Analysis of the World Health Survey, Grant
162602). At the time of this research, J. Hall was supportedhrough a Masters fellowship from the CIHR. S. Moore wasupported through a New Investigator Award from the CIHRnstitute of Aging. S. Harper was supported by a contract fromhe U.S. National Cancer Institute (263-MQ-611198). J. Lynchs a Senior Principal Research Fellow supported by theational Health and Medical Research Council of Australia.No financial disclosures were reported by the authors of
his paper.
eferences1. Bes-Rastrollo M, Martinez-Gonzalez MA, Sanchez-Villegas A, de la Fuente
Arrillage C, Martinez JA. Association of fiber intake and fruit/vegetableconsumption with weight gain in a Mediterranean population. Nutrition2006;22:504–11.
2. McCrory MA, Fuss PJ, McCallum JE, et al. Dietary variety within foodgroups: association with energy intake and body fatness in men andwomen. Am J Clin Nutr 1999;69:440–7.
3. Rolls BJ, Bell EA. Intake of fat and carbohydrate: role of energy density. EurJ Clin Nutr 1999;53:S166–S73.
4. Ness AR, Powles JW. Fruit and vegetables and cardiovascular disease: areview. Int J Epidemiol 1997;26:1–13.
5. Aldoori WH, Giovannucci EL, Rimm EB, Wing AL, Trichopoulos DV,Willett WC. A prospective study of diet and the risk of symptomaticdiverticular disease in men. Am J Clin Nutr 1994;60:757–64.
6. Aldoori WH, Giovannucci EL, Rockett HRH, Sampson L, Rimm EB, WillettWC. A prospective study of dietary fiber types and symptomatic diverticulardisease in men. J Nutr 1998;128:714–9.
7. Ard JD, Svetkey LP, La Chance PA, Bray G. Lowering blood pressure usinga dietary pattern: a review of the Dietary Approaches to Stop Hypertension(DASH) trial. J Clin Hypertens 2000;2:387–91.
8. Steinmetz KA, Potter JD. Vegetables, fruit, and cancer prevention: a review.J Am Diet Assoc 1996;96:1027–39.
9. World Cancer Research Fund/American Institute for Cancer Research.Food, Nutrition and the Prevention of Cancer: a Global Perspective.Washington DC: American Institute for Cancer Research, 1997.
0. WHO. Global strategy on diet, physical activity and health. Geneva,Switzerland: WHO, 2004.
1. WHO. Preventing chronic diseases: a vital investment. Geneva, Switzerland:WHO, 2005.
2. Lock K, Pomerleau J, Causer L, McKee M. Low fruit and vegetableconsumption. In: Ezzati M, Lopez AD, Rodgers A, Murray CJL, eds.Comparative quantification of health risks: global and regional burden ofdisease attributable to selected major risk factors. Geneva, Switzerland:WHO, 2004.
3. WHO. Diet, nutrition and the prevention of chronic diseases. TechnicalReport Series No. 797. Geneva, Switzerland: WHO, 1990.
4. WHO/FAO. Diet, nutrition and the prevention of chronic diseases. Report
of a Joint WHO/FAO Expert Consultation. Geneva, Switzerland: WHO,2003.ber 5 www.ajpm-online.net
1
1
1
1
1
2
2
2
2
2
2
2
2
2
2
3
3
3
3
3
3
3
3
3
3
4
4
4
M
5. Pomerleau J, Lock K, McKee M, Altmann DR. The challenge of measuringglobal fruit and vegetable intake. J Nutr 2004;134:1175–80.
6. Armstrong T, Bonita R. Capacity building for an integrated noncommuni-cable disease risk factor surveillance system in developing countries. EthnDis 2003;13(2S):S13–S18.
7. Moussavi S, Chatterji S, Verdes E, Tanden A, Patel V, Ustün B. Depression,chronic disease, and decrements in health: results from the World HealthSurveys. Lancet 2007;370:851–8.
8. Guthold R, Ono T, Strong KL, Chatterji S, Morabia A. Worldwide variabilityin physical inactivity: a 51-country survey. Am J Prev Med 2008;34:486–94.
9. WHO. World Health Survey: guide to administration and question byquestion specifications. Geneva, Switzerland: WHO, 2002.
0. Ferguson BD, Tandon A, Gakidou E, Murray CJL. Estimating permanentincome using indicator variables. In: Murray CJL, Evans DB, eds. Healthsystems performance assessment: debates, methods and empiricism. Ge-neva, Switzerland: WHO, 2003.
1. Chatterji S, Kowal P, Mathers C, et al. The health of aging populations inChina and India. Health Affairs 2008;27:1052–63.
2. Gakidou E, Oza S, Fuertes CV, et al. Improving child survival throughenvironmental and nutritional interventions: the importance of targetinginterventions toward the poor. JAMA 2007;298:1876–87.
3. Filmer D, Pritchett LH. Estimating wealth effects without expendituredata—or tears: an application to educational enrolments in states of India.Demography 2001;38:115–32.
4. Wagstaff A, Watanabe N. What difference does the choice of ses make inhealth inequality measurement? Health Economics 2003;12:885–90.
5. Zou G. A modified Poisson regression approach to prospective studies withbinary data. Am J Epid 2004;159:702–06.
6. Barros A, Hirakata V. Alternatives for logistic regression in cross-sectionalstudies: an empirical comparison of models that directly estimate theprevalence ratio. BMC Med Res Methodol 2003;3:21.
7. Blanck HM, Gillespie C, Kimmons JE, Seymour JD, Serdula MK. Trends infruit and vegetable consumption among U.S. men and women, 1994–2005.Prev Chronic Dis 2008;5:A35–A44.
8. Blake M, Chaudhury M, Deverill C, et al. Health survey for England 2003,volume 2: risk factors for cardiovascular disease. In: Sproston K, PrimatestaP, eds. Health survey for England 2003. Norwich, United Kingdom: HerMajesty’s Stationery Office, 2004.
9. Australian Bureau of Statistics (ABS). National health survey summary of
results, 2004–05. ABS Catal2006.ay 2009
0. Schneider M, Norman R, Steyn N, Bradshaw D, South African ComparativeRisk Assessment Collaborating Group. Estimating the burden of diseaseattribute to low fruit and vegetable intake in South Africa in 2000. S AfrMed J 2007;97:717–23.
1. Subar AF, Heimendinger J, Patterson BH, Krebs-Smith SM, Pivonka E,Kessler R. Fruit and vegetable intake in the United States: the baselinesurvey of the Five a Day for Better Health Program. Am J Health Promot1995;9:352–60.
2. Slesinger DP, McDivitt M, O’Donnell FM. Food patterns in an urbanpopulation: age and sociodemographic correlates. J Gerontol 1980;35:432–41.
3. Tamers SL, Agurs-Collins T, Dodd KW, Nebeling L. U.S. and France adultfruit and vegetable consumption patterns: an international comparison.Eur J Clin Nutr 2009;63:11–7.
4. Johansson L, Thelle DS, Solvoll K, Bjorneboe GE, Drevon CA. Healthydietary habits in relation to social determinants and lifestyle factors. Br JNutr 1999;81:211–20.
5. Prättälä R, Paalanen L, Grinberga D, Helasoja V, Kasmel A, Petkeviciene J.Gender differences in the consumption of meat, fruit and vegetables aresimilar in Finland and the Baltic countries. Eur J Public Health2007;17:520–5.
6. Guenther PM, Dodd KW, Reedy J, Krebs-Smith SM. Most Americans eatmuch less than recommended amounts of fruits and vegetables. J Am DietAssoc 2006;106:1371–9.
7. Havas S, Treiman K, Langenberg P, et al. Factors associated with fruit andvegetable consumption among women participating in WIC. J Am DietAssoc 1998;98:1141–8.
8. Reicks M, Randall JL, Haynes BJ. Factors affecting consumption of fruitsand vegetables by low-income families. J Am Diet Assoc 1994;94:1309 –11.
9. Pollard J, Kirk SFL, Cade JE. Factors affecting food choice in relation tofruit and vegetable intake: a review. Nutr Rev 2002;15:373–87.
0. Agudo A. Measuring intake of fruit and vegetables. Background Paper forthe Joint FAO/WHO Workshop on Fruit and Vegetables for Health; 2004Sept 1–3; Kobe, Japan. Geneva, Switzerland: WHO, 2005.
1. Popkin BM. Global nutrition dynamics: the world is shifting rapidly toward adiet linked with noncommunicable diseases. Am J Clin Nutr 2006;84:289–98.
2. Van Duyn MA, Pivonka E. Overview of the health benefits of fruit andvegetable consumption for the dietetic professional: selected literature.
ogue No. 4364.0. Canberra, Australia: ABS,J Am Diet Assoc 2000;100:1511–21.Did you know?You can save your online searches and get the results by e-mail.Visit www.ajpm-online.net today to see what else is new online!
Am J Prev Med 2009;36(5) 409
A
C
BBBBCCCCCCCDEEEGGGHIKKLLMMMMMMMNNPPPRSSSSSSSTTUUUVZZTotal .7 45.2
409.e1 American Journa
and sociodemographics, by country and in total, World Health Survey, 200
Initial samplesize
Itemrespondents Final sample size
% males infinal sample
Mfinn % Final n % initial n
5,942 5,506 92.7 5,503 92.6 46.6 381,031 1,027 99.6 1,027 99.6 42.2 475,000 1,284 25.7 1,254 25.1 36.2 434,948 4,631 93.6 4,620 93.4 46.8 364,875 3,621 74.3 3,605 73.9 48.0 363,994 3,988 99.8 3,988 99.8 48.9 451,836 1,750 95.3 1,749 95.3 44.7 423,077 1,875 60.9 1,873 60.9 46.7 363,251 2,935 90.3 2,929 90.1 57.5 35
993 976 98.3 976 98.3 40.3 52949 927 97.7 927 97.7 44.7 47
5,027 4,497 89.5 4,495 89.4 46.3 415,677 2,968 52.3 2,943 51.8 42.6 401,021 1,007 98.6 1,006 98.5 36.2 495,090 1,982 38.9 1,980 38.9 47.8 342,950 2,747 93.1 2,685 91.0 42.3 484,165 3,841 92.2 3,832 92.0 44.6 414,890 4,512 92.3 4,507 92.2 38.5 401,419 1,407 99.2 1,407 99.2 41.6 49
10,692 8,873 83.0 8,638 80.8 48.4 384,499 4,480 99.6 4,480 99.6 34.4 414,640 4,340 93.5 4,271 92.0 42.4 374,989 4,807 96.4 4,806 96.3 47.1 38
929 854 91.9 853 91.8 33.4 505,551 5,285 95.2 5,277 95.1 41.6 366,145 5,992 97.5 5,990 97.5 44.3 415,209 2,021 38.8 1,813 34.8 56.4 403,907 3,471 88.8 3,350 85.7 38.5 383,968 3,862 97.3 3,861 97.3 48.2 425,000 4,999 100.0 4,471 89.4 46.4 406,045 5,886 97.4 5,886 97.4 43.3 414,379 3,925 89.6 3,919 89.5 40.2 388,822 7,918 89.8 7,915 89.7 42.5 386,502 6,285 96.7 6,011 92.4 55.6 375,288 5,124 96.9 5,112 96.7 45.7 39
10,083 10,076 99.9 10,075 99.9 46.2 384,427 4,411 99.6 4,410 99.6 36.0 513,465 2,253 65.0 1,857 53.6 50.5 372,535 1,765 69.6 1,738 68.6 33.5 37
687 585 85.2 585 85.2 46.3 472,629 2,352 89.5 2,323 88.4 47.6 376,373 5,529 86.8 5,448 85.5 40.2 536,805 6,335 93.1 6,233 91.6 46.9 413,121 2,002 64.1 1,994 63.9 42.2 385,203 4,998 96.1 4,992 95.9 46.1 41
11,481 11,176 97.3 11,173 97.3 42.8 422,860 2,710 94.8 2,381 83.3 35.2 471,183 1,170 98.9 1,170 98.9 52.3 372,996 2,973 99.2 2,971 99.2 48.6 454,174 3,388 81.2 3,387 81.1 45.4 404,166 3,798 91.2 3,796 91.1 45.2 364,292 3,908 91.1 3,881 90.4 36.4 37
229,180 199,032 86.8 196,373 85.7 44.5 40
ppendix A. Sample size 2–2003
ountryean age ofal sample
% urban infinal sample
angladesh .5 33.9osnia and Herzegovina .0 42.4razil .3 91.2urkina Faso .2 39.9had .9 27.3hina .1 39.7omoros .2 29.8ongo .2 79.3ôte d’Ivoire .5 60.1roatia .1 66.1zech Republic .8 71.4ominican Republic .5 54.6cuador .9 67.8stonia .7 66.1thiopia .7 24.5eorgia .6 44.4hana .1 38.6uatemala .0 36.3ungary .5 61.1
ndia .7 29.4azakhstan .4 59.8enya .8 31.5aos .2 25.5atvia .8 68.8alawi .2 15.4alaysia .1 58.9ali .4 22.5auritania .4 43.1auritius .1 44.1orocco .5 55.8yanmar .0 24.4amibia .0 47.8epal .9 13.7akistan .0 40.5araguay .9 46.7hilippines .9 58.8ussian Federation .3 91.9enegal .8 58.2lovakia .4 90.9lovenia .3 —outh Africa .6 59.7pain .4 71.3ri Lanka .0 15.3waziland .3 25.3unisia .7 62.4urkey .0 50.4kraine .6 77.2nited Arab Emirates .1 76.7ruguay .9 83.4ietnam .0 21.6ambia .1 38.5imbabwe .1 35.2
l of Preventive Medicine, Volume 36, Number 5
A
BBBBCCCCCCCDEEEGGGHIKKLLMMMMMMMNNPPPRSSSSSSSTTUUUVZZa
b
c
d
*I
ppendix B. Poisson regression of low fruit and vegetable consumption on women, World Health Survey, 2002–2003a
IRR (95% CI) Number of clusters n
angladesh 0.96 (0.88, 1.05) 186 5,455osnia and Herzegovina 1.00 (0.94, 1.06) 112 1,024razil 1.08 (0.98, 1.20) 224 1,242urkina Faso 1.01 (0.98, 1.05) 148 4,520had 1.05 (0.99, 1.12) 102 3,436hina 1.02 (0.97, 1.08) 30 3,952omoros* 1.10 (1.02, 1.17) 49 1,667ongo 1.07 (1.00, 1.15) 109 1,809ôte d’Ivoire 0.96 (0.92, 1.02) 172 2,778roatia 1.02 (0.97, 1.06) 184 935zech Republic* 0.90 (0.86, 0.95) 192 907ominican Republic* 1.13 (1.10, 1.16) 256 4,407cuador 1.03 (0.99, 1.06) 218 2,712stonia* 0.92 (0.87, 0.96) 49 996thiopia 1.07 (0.99, 1.15) 98 1,920eorgia 0.97 (0.93, 1.02) 68 2,635hana 1.01 (0.92, 1.09) 270 3,602uatemalab,* 1.05 (1.02, 1.08) — 4,185ungary* 0.92 (0.88, 0.97) 194 1,365
ndia 1.01 (0.98, 1.03) 371 8,518azakhstan 0.98 (0.96, 1.00) 66 4,454enya 1.00 (0.98, 1.02) 274 4,210aos 1.03 (0.99, 1.06) 248 3,860atvia 1.07 (0.97, 1.18) 134 850alawi 1.05 (0.98, 1.13) 71 5,070alaysia 1.00 (0.98, 1.03) 390 5,659ali 1.06 (0.98, 1.14) 260 1,690auritania 1.00 (0.99, 1.01) 157 2,923auritius 0.99 (0.93, 1.04) 100 3,802orocco* 1.07 (1.04, 1.10) 250 4,057yanmar 1.01 (0.99, 1.04) 110 5,880amibia 0.98 (0.96, 1.01) 229 3,703epal 1.00 (1.00, 1.01) 273 7,713akistan 1.00 (1.00, 1.01) 342 5,847araguay* 1.14 (1.09, 1.18) 497 5,076hilippines 1.02 (0.99, 1.04) 240 10,013ussian Federation 0.98 (0.95, 1.01) 123 4,326enegal 1.02 (0.98, 1.06) 232 1,764lovakia* 0.92 (0.88, 0.96) 286 1,684loveniab,c,* 0.84 (0.76, 0.92) — 577outh Africa 0.97 (0.91, 1.03) 174 2,194pain* 0.96 (0.93, 0.99) 992 5,448ri Lanka 1.02 (0.99, 1.05) 144 6,172waziland* 0.93 (0.89, 0.98) 95 1,900unisia 0.98 (0.97, 1.00) 265 4,925urkeyd 1.02 (1.00, 1.04) 472 11,173kraine* 0.89 (0.81, 0.97) 111 2,250nited Arab Emirates 0.99 (0.93, 1.05) 60 1,151ruguay* 0.93 (0.89, 0.98) 61 2,937ietnam* 0.95 (0.92, 0.98) 137 3,364ambiab 0.98 (0.95, 1.02) — 3,734imbabwe 0.99 (0.97, 1.02) 130 3,768
Adjusted for urbanicity, age category, and income, and using clustered robust SEs of primary sampling unitsRobust SEsUnadjusted for urbanicityUnadjusted for income
Indicates significance (p�0.05)RR, incidence rate ratioAm J Prev Med 2009;36(5) 409.e2
A
BBBBCCCCCCCDEEEGGGHIKKLLMMMMMMMNNPPPRSSSSSSSTTUUUVZZa
b
c
d
*I
4
ppendix C. Poisson regression of low fruit and vegetable consumption on age categories, World Health Survey, 2002–2003a
IRR (95% CI)
18–29 years 30–39 years 40–49 years 50–59 years 60–69 years70–99 years(ref)
angladesh* 0.70 (0.63, 0.79) 0.76 (0.68, 0.85) 0.80 (0.71, 0.90) 0.85 (0.75, 0.97) 0.97 (0.86, 1.10) —osnia and Herzegovina* 0.88 (0.79, 0.99) 0.95 (0.87, 1.05) 0.93 (0.84, 1.03) 0.90 (0.80, 1.01) 0.91 (0.81, 1.02) —razil* 1.24 (1.01, 1.52) 1.12 (0.89, 1.41) 1.16 (0.94, 1.42) 1.06 (0.85, 1.31) 0.85 (0.66, 1.11) —urkina Faso* 0.86 (0.81, 0.92) 0.91 (0.86, 0.97) 0.92 (0.86, 0.98) 0.97 (0.91, 1.04) 1.03 (0.96, 1.10) —had* 0.89 (0.80, 0.98) 0.89 (0.80, 0.98) 0.88 (0.78, 0.99) 0.92 (0.82, 1.05) 1.05 (0.95, 1.16) —hina* 0.93 (0.86, 1.00) 0.91 (0.85, 0.98) 0.93 (0.88, 0.98) 0.96 (0.91, 1.01) 0.98 (0.96, 1.00) —omoros* 0.82 (0.74, 0.91) 0.73 (0.66, 0.80) 0.81 (0.72, 0.91) 0.90 (0.80, 1.02) 0.86 (0.80, 0.98) —ongo 0.90 (0.75, 1.09) 0.94 (0.78, 1.13) 0.97 (0.80, 1.17) 1.00 (0.81, 1.24) 0.98 (0.79, 1.23) —ôte d’Ivoire 0.98 (0.83, 1.15) 0.99 (0.84, 1.16) 0.93 (0.79, 1.10) 0.93 (0.78, 1.11) 0.93 (0.77, 1.13) —roatia 1.01 (0.93, 1.09) 1.02 (0.95, 1.11) 0.99 (0.92, 1.07) 0.97 (0.90, 1.05) 1.04 (0.99, 1.09) —zech Republic 0.94 (0.84, 1.05) 1.03 (0.94, 1.13) 1.06 (0.96, 1.16) 0.96 (0.86, 1.08) 1.11 (1.01, 1.21) —ominican Republic* 0.85 (0.81, 0.90) 0.87 (0.83, 0.93) 0.90 (0.85, 0.95) 0.89 (0.83, 0.95) 0.91 (0.86, 0.97) —cuador 0.98 (0.92, 1.04) 0.97 (0.91, 1.04) 0.96 (0.89, 1.04) 1.00 (0.92, 1.09) 1.02 (0.94, 1.10) —stonia 0.94 (0.85, 1.05) 0.96 (0.86, 1.07) 1.09 (1.01, 1.17) 0.96 (0.87, 1.05) 0.98 (0.90, 1.08) —thiopia* 0.77 (0.64, 0.91) 0.80 (0.68, 0.95) 0.86 (0.72, 1.02) 0.89 (0.75, 1.06) 0.92 (0.75, 1.12) —eorgia 0.91 (0.82, 1.01) 0.94 (0.86, 1.02) 0.96 (0.88, 1.04) 0.96 (0.89, 1.04) 0.97 (0.91, 1.04) —hana* 0.83 (0.70, 0.99) 0.78 (0.65, 0.93) 0.77 (0.65, 0.92) 0.83 (0.69, 1.00) 0.91 (0.75, 1.10) —uatemalab 0.95 (0.89, 1.02) 0.97 (0.90, 1.03) 0.97 (0.90, 1.04) 1.02 (0.95, 1.10) 0.98 (0.91, 1.06) —ungary 0.92 (0.84, 1.01) 1.02 (0.94, 1.12) 1.03 (0.95, 1.11) 0.96 (0.88, 1.05) 0.93 (0.85, 1.03) —
ndia* 0.91 (0.86, 0.96) 0.91 (0.86, 0.97) 0.89 (0.84, 0.95) 0.93 (0.87, 0.97) 0.95 (0.89, 1.01) —azakhstan* 0.92 (0.89, 0.95) 0.95 (0.91, 0.99) 0.95 (0.91, 1.00) 0.94 (0.90, 0.99) 0.97 (0.93, 1.00) —enya* 0.95 (0.91, 0.99) 0.94 (0.90, 0.98) 0.95 (0.91, 1.00) 0.94 (0.90, 1.00) 0.94 (0.89, 1.00) —aos* 0.90 (0.84, 0.96) 0.89 (0.83, 0.96) 0.95 (0.88, 1.02) 0.93 (0.85, 1.01) 0.92 (0.84, 1.02) —atvia 0.90 (0.79, 1.02) 0.89 (0.77, 1.02) 0.97 (0.87, 1.09) 1.04 (0.95, 1.15) 0.90 (0.81, 1.00) —alawi 0.96 (0.82, 1.11) 1.09 (0.93, 1.28) 0.93 (0.79, 1.10) 0.93 (0.80, 1.09) 1.10 (0.91, 1.32) —alaysia* 0.92 (0.88, 0.96) 0.95 (0.91, 0.99) 0.95 (0.91, 1.00) 0.95 (0.91, 1.00) 0.96 (0.91, 1.01) —ali* 0.83 (0.73, 0.94) 0.84 (0.74, 0.96) 0.90 (0.78, 1.05) 0.91 (0.79, 1.04) 1.00 (0.87, 1.15) —auritania 0.99 (0.98, 1.01) 1.01 (0.99, 1.02) 0.99 (0.97, 1.01) 1.01 (0.99, 1.03) 1.01 (0.99, 1.03) —auritius* 0.94 (0.90, 0.98) 0.93 (0.89, 0.98) 0.95 (0.91, 1.00) 0.94 (0.90, 0.99) 0.95 (0.90, 0.99) —orocco* 0.88 (0.83, 0.93) 0.93 (0.89, 0.98) 0.96 (0.91, 1.01) 0.97 (0.91, 1.03) 0.99 (0.93, 1.06) —yanmar 0.97 (0.93, 1.03) 0.95 (0.90, 1.00) 0.98 (0.94, 1.03) 0.99 (0.94, 1.04) 1.00 (0.95, 1.05) —amibia 0.98 (0.94, 1.02) 0.97 (0.92, 1.01) 1.00 (0.95, 1.04) 1.02 (0.97, 1.07) 1.02 (0.97, 1.07) —epal 0.99 (0.98, 1.00) 0.99 (0.98, 1.00) 0.99 (0.98, 1.00) 0.99 (0.98, 1.00) 1.00 (0.99, 1.00) —akistan 1.00 (0.99, 1.01) 1.00 (0.99, 1.01) 1.00 (0.99, 1.01) 1.00 (0.99, 1.01) 1.00 (0.99, 1.02) —araguay* 0.88 (0.82, 0.95) 0.91 (0.84, 0.99) 0.92 (0.85, 1.00) 0.96 (0.88, 1.05) 0.94 (0.85, 1.04) —hilippines* 0.94 (0.89, 1.00) 0.96 (0.90, 1.01) 0.93 (0.87, 0.98) 0.94 (0.89, 1.00) 0.95 (0.90, 1.02) —ussian Federation* 0.86 (0.81, 0.92) 0.89 (0.84, 0.94) 0.95 (0.91, 0.99) 0.93 (0.89, 0.97) 0.97 (0.94, 1.00) —enegal 0.94 (0.85, 1.03) 0.95 (0.87, 1.05) 0.93 (0.85, 1.02) 0.93 (0.84, 1.02) 0.89 (0.80, 1.00) —lovakia 0.95 (0.85, 1.06) 0.98 (0.89, 1.09) 0.99 (0.89, 1.11) 0.96 (0.86, 1.06) 0.94 (0.81, 1.08) —loveniab,c 1.11 (0.96, 1.29) 0.93 (0.78, 1.12) 1.01 (0.86, 1.20) 0.93 (0.78, 1.11) 0.92 (0.77, 1.11) —outh Africa 0.90 (0.78, 1.03) 0.95 (0.83, 1.10) 0.93 (0.81, 1.08) 0.88 (0.75, 1.04) 0.92 (0.77, 1.10) —pain* 1.19 (1.12, 1.26) 1.14 (1.07, 1.20) 1.06 (1.00, 1.12) 0.97 (0.91, 1.03) 0.95 (0.90, 1.01) —ri Lanka 0.98 (0.92, 1.05) 0.99 (0.91, 1.07) 0.99 (0.92, 1.06) 1.00 (0.93, 1.07) 1.00 (0.93, 1.08) —waziland 0.95 (0.85, 1.06) 0.97 (0.87, 1.08) 0.92 (0.81, 1.05) 0.96 (0.85, 1.09) 1.00 (0.86, 1.16) —unisia* 0.97 (0.95, 0.99) 0.99 (0.97, 1.02) 1.01 (0.98, 1.03) 1.01 (0.98, 1.04) 0.98 (0.96, 1.01) —urkeyd,* 1.00 (0.96, 1.04) 1.01 (0.97, 1.06) 0.99 (0.95, 1.03) 0.96 (0.92, 1.00) 0.94 (0.90, 0.99) —kraine* 0.81 (0.70, 0.93) 0.82 (0.70, 0.96) 0.84 (0.73, 0.98) 0.91 (0.79, 1.06) 1.03 (0.91, 1.16) —nited Arab Emirates 1.11 (0.80, 1.53) 1.07 (0.78, 1.48) 1.03 (0.75, 1.43) 1.06 (0.76, 1.48) 1.22 (0.87, 1.71) —ruguay* 1.19 (1.10, 1.28) 1.11 (0.97, 1.28) 1.08 (0.96, 1.22) 1.04 (0.92, 1.17) 1.11 (1.00, 1.22) —ietnam* 0.84 (0.77, 0.91) 0.83 (0.76, 0.90) 0.89 (0.82, 0.95) 0.87 (0.81, 0.94) 0.90 (0.84, 0.97) —ambiab 0.95 (0.88, 1.02) 0.94 (0.87, 1.01) 0.98 (0.90, 1.06) 0.92 (0.84, 1.01) 0.94 (0.85, 1.03) —imbabwe* 0.93 (0.88, 0.98) 0.95 (0.89, 1.00) 0.97 (0.93, 1.02) 0.96 (0.90, 1.02) 1.00 (0.94, 1.06) —
Adjusted for gender, urbanicity, and income, and using clustered robust SEs of primary sampling unitsRobust SEsUnadjusted for urbanicityUnadjusted for incomeIndicates significance (p�0.05) of at least one age group compared to oldest age group
RR, incidence rate ratio09.e3 American Journal of Preventive Medicine, Volume 36, Number 5
A
BBBBCCCCCCCDEEEGGGHIKKLLMMMMMMMNNPPPRSSSSSSSTTUUUVZZa
b
c
*
ppendix D. Poisson regression of low fruit and vegetable consumption on urban settings, World Health Survey, 2002–2003a
IRR (95% CI) Number of clusters n
angladesh* 1.21 (1.05, 1.39) 186 5,455osnia and Herzegovina 1.07 (0.97, 1.18) 112 1,024razil 1.28 (0.97, 1.68) 224 1,242urkina Faso 1.02 (0.92, 1.13) 148 4,520had 1.02 (0.85, 1.23) 102 3,436hina 1.04 (0.99, 1.09) 30 3,952omoros 1.00 (0.87, 1.15) 49 1,667ongo* 1.24 (1.06, 1.44) 109 1,809ôte d’Ivoire* 1.20 (1.07, 1.34) 172 2,778roatia 1.01 (0.95, 1.08) 184 935zech Republic 0.96 (0.90, 1.03) 191 907ominican Republic 1.01 (0.95, 1.06) 256 4,407cuador* 1.14 (1.03, 1.26) 218 2,712stonia 1.11 (0.98, 1.26) 49 996thiopia 1.02 (0.85, 1.23) 98 1,920eorgia 1.01 (0.85, 1.21) 68 2,635hana 0.97 (0.83, 1.14) 270 3,602uatemalab 0.97 (0.94, 1.01) — 4,185ungary 1.00 (0.93, 1.08) 194 1,365
ndia 1.03 (0.95, 1.12) 371 8,518azakhstan 1.08 (0.97, 1.21) 66 4,454enya* 1.05 (1.01, 1.08) 274 4,210aos 0.96 (0.90, 1.03) 248 3,860atvia 1.06 (0.94, 1.18) 134 850alawi 1.04 (0.74, 1.44) 71 5,070alaysia 0.98 (0.95, 1.01) 390 5,659ali 1.03 (0.89, 1.21) 260 1,690auritania 0.99 (0.97, 1.00) 157 2,923auritius 0.96 (0.90, 1.03) 100 3,802orocco 1.02 (0.96, 1.09) 250 4,057yanmar 1.03 (0.93, 1.15) 110 5,880amibia* 0.94 (0.90, 0.98) 229 3,703epal 1.00 (0.99, 1.01) 273 7,713akistan 1.00 (1.00, 1.00) 342 5,847araguay* 1.17 (1.11, 1.25) 497 5,076hilippines* 1.07 (1.01, 1.14) 240 10,013ussian Federation 0.96 (0.92, 1.01) 123 4,326enegal 1.05 (0.97, 1.13) 232 1,764lovakia 1.00 (0.92, 1.07) 286 1,684loveniab — — 577outh Africa 0.99 (0.87, 1.12) 174 2,194pain 1.02 (0.98, 1.06) 992 5,448ri Lanka 1.10 (0.95, 1.27) 144 6,172waziland 0.94 (0.86, 1.03) 95 1,990unisia* 1.04 (1.01, 1.07) 265 4,925urkeyc 1.01 (0.98, 1.04) 472 11,173kraine* 1.34 (1.01, 1.77) 111 2,250nited Arab Emirates 1.06 (0.91, 1.23) 60 1,151ruguay 1.06 (0.93, 1.19) 61 2,937ietnam 0.91 (0.78, 1.07) 137 3,364ambiab,* 1.07 (1.03, 1.11) — 3,734imbabwe 0.98 (0.93, 1.04) 130 3,768
Adjusted for gender, age category, and income, and using clustered robust SEs of primary sampling unitsRobust SEs
Unadjusted for incomeIndicates significance (p�0.05)Am J Prev Med 2009;36(5) 409.e4
A
BBBBCCCCCCCDEEEGGGHIKKLLMMMMMMMNNPPPRSSSSSSSTUUUVZZa
b
c
*
4
ppendix E. Poisson regression of low fruit and vegetable consumption on income quintiles, World Health Survey, 2002–2003a
IRR (95% CI)
Lowest IQ IQ 2 IQ 3 IQ 4 IQ 5 (ref) n
angladesh* 1.54 (1.35, 1.75) 1.47 (1.31, 1.66) 1.19 (1.06, 1.34) 1.14 (1.02, 1.28) — 5,455osnia and Herzegovina* 1.07 (0.93, 1.23) 1.19 (1.07, 1.32) 1.09 (0.98, 1.19) 1.10 (1.00, 1.21) — 1,024razil* 1.46 (1.20, 1.77) 1.23 (1.03, 1.48) 1.17 (0.99, 1.38) 1.06 (0.92, 1.22) — 1,242urkina Faso* 1.15 (1.06, 1.25) 1.11 (1.02, 1.21) 1.14 (1.06, 1.22) 1.06 (0.99, 1.13) — 4,520had* 1.29 (1.11, 1.49) 1.24 (1.09, 1.40) 1.16 (1.03, 1.30) 1.14 (1.04, 1.26) — 3,436hina 0.89 (0.79, 1.01) 0.94 (0.87, 1.01) 0.99 (0.96, 1.02) 1.01 (0.99, 1.03) — 3,952omoros 1.06 (0.93, 1.21) 1.03 (0.90, 1.17) 1.00 (0.89, 1.13) 1.02 (0.93, 1.12) — 1,667ongo 1.09 (0.92, 1.28) 1.02 (0.88, 1.18) 1.05 (0.92, 1.20) 1.00 (0.88, 1.15) — 1,809ôte d’Ivoire 0.96 (0.86, 1.07) 0.93 (0.86, 1.01) 0.94 (0.87, 1.02) 0.93 (0.86, 1.00) — 2,778roatia 1.05 (0.99, 1.13) 1.00 (0.94, 1.07) 0.93 (0.86, 1.00) 0.94 (0.88, 1.01) — 935zech Republic 1.04 (0.95, 1.13) 0.97 (0.89, 1.05) 0.97 (0.89, 1.06) 0.97 (0.90, 1.05) — 907ominican Republic* 1.05 (0.98, 1.12) 1.07 (1.01, 1.14) 1.03 (0.97, 1.09) 1.00 (0.95, 1.06) — 4,407cuador* 1.10 (0.99, 1.22) 1.09 (1.00, 1.18) 1.08 (1.01, 1.14) 1.05 (1.00, 1.11) — 2,712stonia* 1.20 (1.08, 1.33) 1.08 (0.96, 1.22) 1.08 (0.97, 1.20) 1.00 (0.90, 1.11) — 996thiopia* 1.30 (1.12, 1.50) 1.10 (0.92, 1.31) 1.01 (0.86, 1.19) 0.99 (0.87, 1.13) — 1,920eorgia* 1.13 (0.97, 1.32) 1.16 (1.02, 1.33) 1.16 (1.01, 1.32) 1.08 (0.95, 1.22) — 2,635hana* 0.90 (0.75, 1.08) 0.83 (0.70, 0.99) 0.74 (0.63, 0.88) 0.88 (0.76, 1.02) — 3,602uatemalab,* 1.17 (1.10, 1.24) 1.17 (1.11, 1.24) 1.14 (1.08, 1.21) 0.99 (0.93, 1.05) — 4,185ungary 1.11 (1.01, 1.22) 1.09 (0.99, 1.19) 1.04 (0.95, 1.13) 0.96 (0.88, 1.06) — 1,365
ndia* 1.26 (1.16, 1.36) 1.25 (1.16, 1.33) 1.22 (1.15, 1.31) 1.12 (1.05, 1.19) — 8,518azakhstan* 1.14 (1.08, 1.21) 1.12 (1.06, 1.18) 1.11 (1.05, 1.17) 1.09 (1.04, 1.14) — 4,454enya* 1.10 (1.06, 1.15) 1.06 (1.01, 1.10) 1.04 (1.00, 1.09) 1.04 (0.99, 1.08) — 4,210aos 1.05 (0.97, 1.14) 1.01 (0.94, 1.09) 1.02 (0.94, 1.09) 1.02 (0.96, 1.09) — 3,860atvia 1.12 (0.96, 1.30) 1.10 (0.96, 1.26) 1.05 (0.92, 1.20) 1.06 (0.95, 1.19) — 850alawi 1.21 (1.00, 1.48) 1.16 (0.98, 1.38) 0.99 (0.84, 1.16) 1.02 (0.89, 1.17) — 5,070alaysia* 1.10 (1.06, 1.15) 1.08 (1.04, 1.12) 1.04 (1.00, 1.08) 1.01 (0.98, 1.05) — 5,659ali* 1.29 (1.10, 1.51) 1.14 (0.98, 1.33) 1.06 (0.93, 1.22) 1.06 (0.92, 1.22) — 1,690auritania 1.01 (0.99, 1.03) 1.01 (0.99, 1.03) 1.01 (0.99, 1.03) 1.00 (0.98, 1.02) — 2,923auritius* 1.14 (1.07, 1.21) 1.09 (1.02, 1.16) 1.09 (1.02, 1.16) 1.06 (0.99, 1.13) — 3,802orocco* 1.30 (1.20, 1.41) 1.21 (1.13, 1.31) 1.19 (1.12, 1.26) 1.12 (1.06, 1.20) — 4,057yanmar* 1.13 (1.05, 1.23) 1.05 (0.97, 1.14) 0.99 (0.91, 1.07) 0.99 (0.93, 1.05) — 5,880amibia* 1.23 (1.16, 1.32) 1.18 (1.10, 1.26) 1.17 (1.09, 1.25) 1.12 (1.05, 1.20) — 3,703epal 1.01 (1.00, 1.02) 1.01 (1.00, 1.02) 1.01 (1.00, 1.02) 1.01 (1.00, 1.02) — 7,713akistan 1.01 (1.00, 1.02) 1.01 (1.00, 1.02) 1.01 (1.00, 1.02) 1.00 (0.99, 1.01) — 5,847araguay 1.04 (0.96, 1.12) 0.99 (0.92, 1.06) 1.06 (1.00, 1.02) 1.02 (0.97, 1.08) — 5,076hilippines* 1.03 (0.97, 1.09) 1.04 (0.99, 1.08) 1.07 (1.03, 1.12) 1.03 (1.00, 1.07) — 10,013ussian Federation 1.06 (0.98, 1.14) 1.05 (0.98, 1.14) 1.04 (0.97, 1.11) 1.04 (0.98, 1.10) — 4,326enegal* 1.15 (1.05, 1.25) 1.10 (1.02, 1.19) 1.04 (0.97, 1.12) 1.01 (0.95, 1.08) — 1,764lovakia* 1.08 (1.01, 1.15) 1.03 (0.95, 1.11) 1.00 (0.92, 1.08) 0.99 (0.94, 1.05) — 1,684loveniab,c 1.04 (0.89, 1.22) 1.05 (0.91, 1.22) 1.06 (0.91, 1.23) 1.05 (0.91, 1.22) — 577outh Africa* 1.37 (1.17–1.61) 1.21 (1.01, 1.44) 1.01 (0.84, 1.22) 1.01 (0.85, 1.21) — 2,194pain* 1.14 (1.08, 1.21) 1.09 (1.03, 1.15) 1.06 (1.01, 1.12) 1.03 (0.98, 1.08) — 5,448ri Lanka* 1.52 (1.35, 1.71) 1.38 (1.23, 1.56) 1.29 (1.16, 1.44) 1.22 (1.11, 1.35) — 6,172waziland* 1.30 (1.16, 1.46) 1.26 (1.12, 1.42) 1.16 (1.04, 1.29) 1.21 (1.09, 1.34) — 1,900unisia* 1.11 (1.07, 1.15) 1.09 (1.06, 1.12) 1.07 (1.04, 1.10) 1.04 (1.02, 1.07) — 4,925kraine* 1.26 (1.05, 1.52) 1.26 (1.08, 1.46) 1.20 (1.04, 1.39) 1.06 (0.94, 1.20) — 2,250nited Arab Emirates 1.10 (0.92, 1.31) 1.11 (0.94, 1.31) 1.06 (0.91, 1.24) 1.06 (0.95, 1.20) — 1,151ruguay* 1.17 (1.09, 1.26) 1.07 (1.00, 1.05) 1.08 (1.04, 1.13) 1.02 (0.95, 1.08) — 2,937ietnam* 1.09 (0.95, 1.25) 1.14 (1.02, 1.26) 1.10 (1.00, 1.21) 1.08 (0.99, 1.18) — 3,364ambiab,* 1.18 (1.11, 1.25) 1.07 (1.00, 1.14) 1.02 (0.96, 1.08) 1.06 (1.00, 1.12) — 3,734imbabwe 1.02 (0.97, 1.08) 0.99 (0.93, 1.04) 1.01 (0.96, 1.06) 1.03 (0.98, 1.08) — 3,768
Adjusted for gender, age category, and urbanicity, and using clustered robust SEs of primary sampling unitsRobust SEsUnadjusted for urbanicity
Indicates significance (p�0.05) of at least one income quintile compared to wealthiest quintile09.e5 American Journal of Preventive Medicine, Volume 36, Number 5