FRUIT AND VEGETABLE CONSUMPTION BY ECOLOGICAL ZONE AND SOCIOECONOMIC STATUS IN GHANA
20
Journal of Biosocial Science http://journals.cambridge.org/JBS Additional services for Journal of Biosocial Science: Email alerts: Click here Subscriptions: Click here Commercial reprints: Click here Terms of use : Click here FRUIT AND VEGETABLE CONSUMPTION BY ECOLOGICAL ZONE AND SOCIOECONOMIC STATUS IN GHANA JOSHUA AMO-ADJEI and AKWASI KUMI-KYEREME Journal of Biosocial Science / FirstView Article / July 2014, pp 1 - 19 DOI: 10.1017/S002193201400025X, Published online: 03 July 2014 Link to this article: http://journals.cambridge.org/abstract_S002193201400025X How to cite this article: JOSHUA AMO-ADJEI and AKWASI KUMI-KYEREME FRUIT AND VEGETABLE CONSUMPTION BY ECOLOGICAL ZONE AND SOCIOECONOMIC STATUS IN GHANA . Journal of Biosocial Science, Available on CJO 2014 doi:10.1017/S002193201400025X Request Permissions : Click here Downloaded from http://journals.cambridge.org/JBS, IP address: 41.190.88.101 on 04 Jul 2014
Transcript of FRUIT AND VEGETABLE CONSUMPTION BY ECOLOGICAL ZONE AND SOCIOECONOMIC STATUS IN GHANA

Journal of Biosocial Sciencehttp://journals.cambridge.org/JBS
Additional services for Journal of Biosocial Science:
Email alerts: Click hereSubscriptions: Click hereCommercial reprints: Click hereTerms of use : Click here
FRUIT AND VEGETABLE CONSUMPTION BY ECOLOGICALZONE AND SOCIOECONOMIC STATUS IN GHANA
JOSHUA AMO-ADJEI and AKWASI KUMI-KYEREME
Journal of Biosocial Science / FirstView Article / July 2014, pp 1 - 19DOI: 10.1017/S002193201400025X, Published online: 03 July 2014
Link to this article: http://journals.cambridge.org/abstract_S002193201400025X
How to cite this article:JOSHUA AMO-ADJEI and AKWASI KUMI-KYEREME FRUIT AND VEGETABLE CONSUMPTIONBY ECOLOGICAL ZONE AND SOCIOECONOMIC STATUS IN GHANA . Journal of BiosocialScience, Available on CJO 2014 doi:10.1017/S002193201400025X
Request Permissions : Click here
Downloaded from http://journals.cambridge.org/JBS, IP address: 41.190.88.101 on 04 Jul 2014
J. Biosoc. Sci., page 1 of 19, 6 Cambridge University Press, 2014doi:10.1017/S002193201400025X
FRUIT AND VEGETABLE CONSUMPTION BYECOLOGICAL ZONE AND SOCIOECONOMIC
STATUS IN GHANA
JOSHUA AMO-ADJEI1and AKWASI KUMI-KYEREME
Department of Population and Health, University of Cape Coast, Ghana
Summary. The disease burden in both developed and developing countries is
moving towards higher proportions of chronic diseases, and diseases such as
cancers are now considered to be of public health concern. In sub-Saharan
Africa, healthy behaviours such as fruit and vegetable consumption are recom-mended to reduce the chances of onset of chronic diseases. This paper examines
the determinants of fruit and vegetable consumption in Ghana with particular
emphasis on consumption by ecological zone. Data were from the 2008 Ghana
Demographic and Health Survey (n ¼ 4916 females; n ¼ 4568 males). Univariate
and multivariate analyses were performed using basic descriptive and Poisson
regression. The main independent variable was ecological zone and the depen-
dent variables were levels of fruit and vegetable consumption. The mean num-
ber of fruits and vegetables consumed in a week was higher among females(fruits: 7.5, 95% CI ¼ 7.3–7.7; vegetables: 8.1, 95% CI ¼ 7.8–8.3) than males
(fruits: 6.2, 95% CI ¼ 6.0–6.4; vegetables: 7.9, 95% CI ¼ 7.7–8.2). There were
significant differences in consumption by ecological zone. Respondents in the Sa-
vannah zone consumed less fruit than those in the Coastal and Forest zones, but
the differences in fruit and vegetable consumption between the Coastal and Sa-
vannah zones were not consistent, especially for vegetable consumption. The
findings suggest that one of the key interventions to improve fruit and vegetable
consumption could lie in improving distribution systems since their consump-tion is significantly higher in the Forest zone, where the production of fruit
and vegetables is more developed than in the Savannah and Coastal zones.
The findings relating to household wealth challenge conventional knowledge
on fruit and vegetable consumption, and rather argue for equal consideration
of spatial differences in critical health outcomes.
Introduction
In sub-Saharan Africa and many other developing countries, where animal and dairy
sources of nutrients are often insufficient, fruit and vegetables have been proposed as
1
1 Corresponding author. Email: [email protected]

an important alternative source of micronutrients (Ali & Tsou, 1997). However, the per
capita intake of fruit and vegetable is still considered far below the 400 g per capita per
day suggested by WHO and FAO (Vaino & Bianchini, 2003; Asfaw, 2008). The WorldHealth Survey (WHO, 2002a), which was conducted in 52 countries, indicated that
Ghana had the lowest proportion of fruit and vegetable intake (36.6% and 38% among
men and women respectively) among the surveyed countries compared with countries
such as Pakistan, where about 99.2% of men and 99.3% of women consumed fruits and
vegetables daily (Hall et al., 2009). In the 2008 Ghana Demographic and Health Survey,
only 28% of women and 21% of men consumed fruit on a daily basis, and about a quarter
(24%) of women and 30% of men consumed vegetables daily.
Increasingly, however, lifestyles in several African countries, including Ghana, arechanging towards those typical of Western countries due to improving incomes, urban-
ization and other factors. As Doku et al. (2013) pointed out, increased urbanization in
African countries has resulted in a shift from a typical agrarian economy to a service-
based economy. This shift in economic activity has resulted in changes in lifestyle from
more intensive physical activity to sedentary activities, the increased use of cars and an
explosion in the number of cinemas and fast-food restaurants. These changes have the
potential to increase the burden of non-communicable diseases. Indeed, de Graft Aikins
(2007) observed this in Ghana, largely arising from the changing lifestyle patterns in thecountry. The World Health Report (WHO, 2002b) pointed out that an insufficient in-
take of fruit and vegetables has been one of the factors accounting for the high rates of
chronic diseases and mortality globally. Lock et al. (2005) estimated that approximately
2.6 million deaths could be averted by adequate fruit and vegetable consumption. Further,
increasing the total consumption of fruit and vegetables to about 600 g per day could
potentially result in a 1.8% reduction in global disease burden. The potential reduction
increases to 31% in the case of ischaemic disease and 19% for all incidences of stroke
(Kamphuis et al., 2006).In response to the changing patterns of diseases in Ghana – from infectious diseases
towards more chronic non-communicable diseases – the Ministry of Health started a
regenerative health programme (Regenerative Health and Nutrition (RHN)). The main
objective was to transform lives and health for national development. The essential fea-
tures of the programme were to contribute towards reducing the prevalence of diseases
and disorders among individuals, households and communities so as to ensure a healthy
and productive population capable of creating wealth. Fruit and vegetable consumption
was indicated to be key to achieving the objectives (Ghana Statistical Service et al., 2009).Traditional and current economic theory of consumption patterns argues that individ-
ual or household consumption behaviours pass through several trajectories, including
income (economic ability), preferences and market prices of goods and services (Asfaw,
2008). The income argument posits that there is a linear relationship between income
and fruit and vegetable consumption since poor households would want to avoid hunger
because fruit and vegetables are not energy proficient. Poor households normally
concentrate first on satisfying hunger with energy-proficient diets before considering
low-energy foods whose health effects are not immediate but cumulative (Asfaw,2008). Prescott & Pradham (1999) found in Cambodia that certain fruit and vegetables
were about 100 times more expensive than a unit of rice. Studies conducted in the UK
J. Amo-Adjei and A. Kumi-Kyereme2

have also found higher fruit and vegetable intake in households of higher wealth status
(Shohiami et al., 2004).
Several broad socioeconomic factors also shape preferences, for example internalizedtastes and preferences (Domel & Thompson, 2002; Cullen et al., 2003; Lallukka et al.,
2010); parental controls, especially maternal modelling (Gibson et al., 1998); sensory
appeal; familiarity and habit; social desirability; convenience and food ideology (Pollard
et al., 2002). Other factors that have been observed to influence fruit and vegetable con-
sumption include extent of exposure to media productions on fruit and vegetable (Cullen
et al., 2000; Boynton-Jarrett et al., 2003; Story & French, 2004) and socioeconomic
factors such as marital status, age and educational attainment (Oliveira et al., 2013;
Franchini et al., 2013). Fruit and vegetable consumption is also correlated with urban-ization: urban settings tend to have better transportation, modern supermarkets and
cold storage facilities thereby helping to increase the stock of fruit and vegetables in
those areas (Azagba & Sharaf, 2011).
The main question this study addresses is how region of residence (ecological zone)
determines fruit and vegetable consumption among women (15–49 years) and men (15–
59 years) in Ghana. While the study is not directly designed to evaluate the successes or
otherwise of the RHN programme because of lack of baseline data for comparison, it
will provide some understanding of factors that correlate with fruit and vegetable con-sumption among Ghanaians. Boeing et al. (2012) justified national campaigns pro-
moting fruit and vegetable consumption following a critical review of the relationship
between fruit and vegetable consumption and the prevention of chronic diseases. But in
spite of the importance of fruit and vegetables for regenerative health, only a few studies
(Doku et al., 2013), to the best of the authors’ knowledge, have examined fruit and veget-
able consumption in Ghana in a nationally representative sample. For instance, Doku
et al.’s (2013) study was limited to adolescents in schools from three southern regions of
Ghana (Greater Accra, Volta and Eastern regions).This paper tests the hypothesis that fruit and vegetable intake has no relationship
with ecological zone. Some prior studies (Kamphuis et al., 2006; Yen et al., 2011; Lazzeri
et al., 2013; Tak et al., 2013; van Ansem et al., 2013) suggested that local availability (for
example, access to one’s own vegetable garden and high food security, accounted for by
factors such as local climate, vegetation and soil quality) is an important factor in fruit
and vegetable consumption. It must be stated, however, that by this assumption, it was
not intended to follow a deterministic ideology. Rather, the study deals with only pre-
vailing conditions, which are subject to possibilities, nonetheless. Nevertheless, individualsocioeconomic characteristics could also determine fruit and vegetable consumption,
and these are used to control for the anticipated ecological effects.
Data and Methods
Setting
The Republic of Ghana is centrally located on the West African coast and has a
total land area of 238,537 km2. Ghana is a lowland country except for a range of hills
on the eastern border where Mt Afadjato – the highest (884 m) point above sea level –
Fruit and vegetable consumption in Ghana 3

is found. Ghana can be divided into three ecological zones: the sandy coastline backed
by a coastal plain, which is intersected by numerous rivers and streams; the middle belt
and some sections of the western parts of the country with relative dense forest withstreams and rivers; and a northern savannah, which is drained by the Black and White
Volta Rivers. The country has a tropical climate with temperatures and rainfall vary-
ing according to distance from the coast and elevation. With an annual temperature of
approximately 26 �C (79 �F), there are two distinct rainy seasons: April to June and
September to November. In the north, however, the rainy season begins in March and
lasts until September. Annual rainfall ranges from about 1015 mm (40 inches) in the
north to about 2030 mm (80 inches) in the south-west. Food and crop production gen-
erally follows this pattern with tree crops rarely doing well in the savannah areas(Ghana Statistical Service et al., 2009). The vegetation of the Savannah zone is charac-
terized by wooded savannah with trees such as baobab, acacias and shea trees, which
have adapted to the environment over time (Dickson & Benneh, 1988).
Data
The 2008 DHS data form part of the on-going waves of demographic and health
surveys conducted at five-year intervals under the auspices of the Ghana Statistical Serviceand Macro International. The 2008 GDHS is the 5th in the series. As has been the norm
for DHSs, a multistage probability sampling technique was used for the 2008 version.
For each household selected, all eligible women (15–49 years) and men (15–59 years)
were interviewed, yielding a total of 4916 females and 4568 males. The survey was exe-
cuted from early September to late November 2008. The quality of the DHS data for
such national-level analysis is widely acknowledged and has consequently been used
for several studies (e.g. Gyimah, 2006, 2007). Data from the GDHS provide a represen-
tative sample of Ghanaians within the age categories selected. The accompanying surveyweights were taken into consideration during the analysis. Typical of nationally represen-
tative data sets, survey weights are used to adjust for effects of under- and over-sampling,
and such survey biases have the potential to affect the generalizability of the findings.
Sample weights are adjustment factors used to account for differences in probability of
selection and interview between cases as a result of survey design or chance and specifi-
cally; here, probability weight ( pweight) was applied to correct for the sampling design
effect (Ghana Statistical Service et al., 2009). The DHS data also provide important
geographic and socioeconomic variables such as age, household poverty index, religionand place of settlement, which are possible confounders of fruit and vegetable intake.
Ethical clearance for the use of the data set by this study was not required since it was
drawn from an existing data source. Permission for its use was, however, secured from
Measure DHS.
Measurement
This paper centres on four dependent variables: ‘days of eating fruit in a week’;‘servings of fruit on days when fruit is eaten’; ‘days of eating vegetables in a week’;
and ‘servings of vegetables on days when vegetables are eaten’. To derive the main out-
J. Amo-Adjei and A. Kumi-Kyereme4

come variable (frequency of fruit and vegetable consumption) the number of servings
of fruit and vegetables was multiplied by seven to obtain the number of times each
(fruit and vegetables) was consumed in a week. In order to derive the maximum benefitfrom fruit and vegetable consumption, a minimum of five servings of fruit and vegetables
a day is recommended. Therefore, the recommended number of fruit and vegetable serv-
ings per week is 35, although a few of the respondents reported having seven servings of
fruit or vegetables per day.
Statistical analysis
A three-outcome variable was created for region of residence to capture the broadecological zones coded as follows: Northern, Upper East and Upper West regions were
coded as the ‘Savannah zone’; the Brong-Ahafo, Ashanti and Eastern regions were desig-
nated as the ‘Forest zone’; while the Western, Central, Greater Accra and Volta regions
were coded as the ‘Coastal zone’. Wealth quintile was coded as: poorest ¼ 1; poorer ¼ 2;
average ¼ 3; richer ¼ 4; and richest ¼ 5. The following other factors were considered
conceptually relevant in determining fruit and vegetable consumption: education,
urban–rural residence, occupation, religion, ethnic background and exposure to media
(magazines/newspapers, radio and television). A number of behavioural change com-munication programmes have been rolled out by the Ghana Health Service to reach
out to as much of the population as possible on fruit and vegetable consumption
through the three major channels of media for communication: newspaper/magazine,
radio and television. This was the main reason for including media variables in the anal-
ysis in order to identify those that may be useful for health behavioural change com-
munication. Religion and ethnicity were included in the estimations as proxies for culture.
In Ghana, there are some cultural interpretations associated with fruit and vegetable
consumption that may present obstacles to their intake. For example, in some Ghanaiancommunities, fruit consumption is linked to whether one is satisfied or not, particularly,
after dinner, making the practice a matter of satisfaction rather than a health need. Simi-
larly, vegetable consumption is perceived to be a Western habit, particularly consump-
tion of exotic varieties such as cabbage, cucumber, carrots and lettuce (Awusabo-Asare,
personal communication). From this, ethnicity and religion probably best capture the
variable ‘culture’ (e.g. Gyimah, 2006). These variables were included to examine their
various effects, and whether or not they alter the magnitude and direction of effects of
ecological characteristics on fruit and vegetable consumption.Poisson regression was used because the main dependent variable (frequency of
fruit and vegetable consumption in a week) was captured as a count variable. Besides,
there was no indication of over-dispersion as none of the variances was greater than
any of the means. Poisson regression models are constructed on the assumption of
independence of subjects, but the GDHS is hierarchical in nature and respondents are
layered within survey clusters with a potential of biasing standard errors. To overcome
this, the Huber–White technique for dealing with clustering was applied to derive
robust standard errors. All the data analyses were conducted with STATA version 12(STATA Corp, College Station, TX, USA). The regression coefficients were transformed
into incident risk ratios through exponentiation aimed at simplifying interpretation of
the results.
Fruit and vegetable consumption in Ghana 5

Results
About 38%, 35%, 27% of the female sample (n ¼ 4916) were resident in the Coastal,
Forest and Savannah zones, respectively, and for males (n ¼ 4548) the respective distri-
bution was 38%, 33% and 29%. The proportions of respondents (both males and females)
in poorest and richest households were fairly similar: approximately the same proportion
of females and males belonged to each of the categories. Typical of developing countries,whereas a greater proportion of females had no formal education compared with males,
males outnumbered females at all other levels of education (see Table 1). The proportion
of females occupied in the sales and service sector (36.6%) was far higher than that of
males (9%), which is consistent with the results from the 2000 and 2010 censuses (Ghana
Statistical Service, 2000), an indication of the representativeness of the Ghanaian popu-
lation data. As for media exposure, radio was the highest with approximately 50% of
females and 70% of males reporting exposure. The culture of reading in Ghanaians is
poor, and this is shown in the proportion of females (2.6%) and males (7.8%) who readnewspapers/magazines ‘almost every day’ (data not shown).
Overall, the mean number of fruit and vegetables consumed in a week was slightly
higher among females (fruit: 7.5, 95% CI ¼ 7.3–7.7; vegetables: 8.1, 95% CI ¼ 7.8–8.3)
than males (fruits: 6.2, 95% CI ¼ 6.0–6.4; vegetables: 7.9, 95% CI ¼ 7.7–8.2). Impor-
tantly, education and wealth show a positive correlation with fruit intake for both
sexes, but for vegetable consumption, education and wealth show negative correlations
(data not shown).
Fruit and vegetable intake, however, varied by ecological zone. While fruit con-sumption varied between zones for females and males, vegetable consumption had a
positive correlation with ecological zone. Female respondents from the Savannah zone
reported the lowest number of fruit servings in a week, whereas for males it was those
from the Coastal zone who reported the least. Approximately, the highest mean fruit
and vegetable servings in a week was recorded in the Forest zone (Figs 2 and 3). Other
striking results were recorded for fruit and vegetable intake by religion. Both males
and females who were traditionalist/spiritualist reported the least servings of fruit and
vegetables (females: mean vegetable ¼ 4.5, 95% CI ¼ 3.7–5.4; mean fruit ¼ 6.6, 95%CI ¼ 5.9–7.3; and for males, mean vegetable ¼ 6.9, 95% CI ¼ 6.2–7.8; mean fruit ¼3.3, 95%, CI ¼ 2.7–3.9).
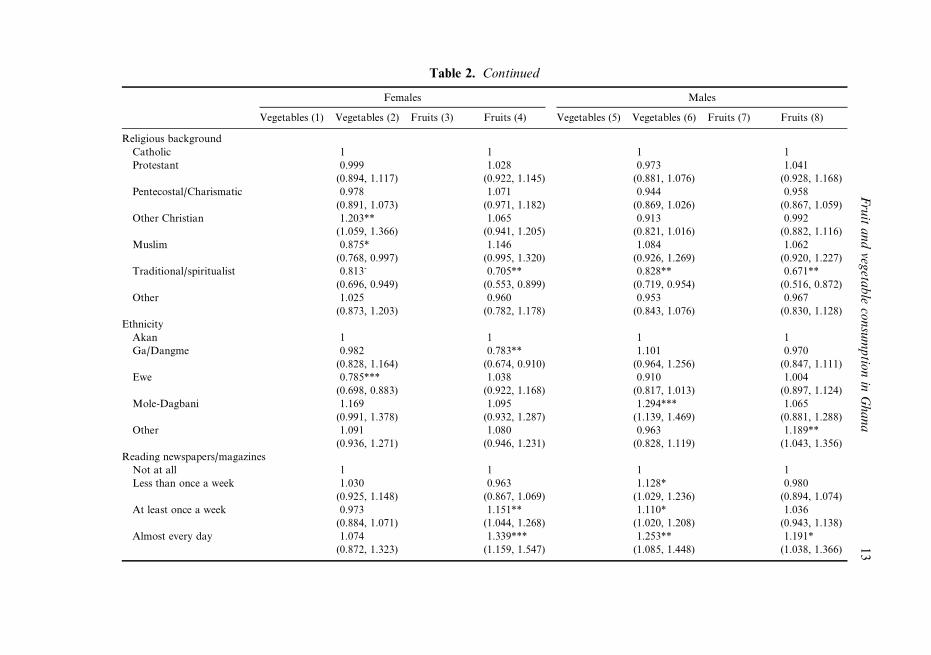
Table 2 presents the results obtained from the Poisson regression: Models 1–4
report on female fruit and vegetable intake and Models 5–8 that of males. Models 1,
3, 5 and 7 are bivariate, with the others (Models 2, 4, 6 and 8) being multivariable. For
both females and males the results reveal some differences in fruit and vegetable con-
sumption by ecological zone. In the bivariate analysis, females and males in the Forest
zone reported a higher frequency of fruit and vegetable consumption than those in theCoastal zone. Males and females in the Savannah zone reported a higher likelihood of
vegetable consumption but not of fruit consumption. The differences remained after
controlling for all other socioeconomic factors (see Table 2).
Contrary to expectation, increasing household wealth status did not significantly
influence fruit and vegetable consumption – there was an inverse relationship with
their consumption for both sexes (Table 2). Higher formal education improved fruit
J. Amo-Adjei and A. Kumi-Kyereme6

Table 1. Background characteristics of respondents by sex, 2008 GDHS
Females
(n ¼ 4916)
Males
(n ¼ 4568)
Explanatory variable % n % n
Ecological zone
Coastal 38.6 1897 38.2 1747
Forest 34.5 1697 32.7 1496
Savannah 26.9 1322 29.0 1325
Wealth index
Poorest 15.93 783 17.71 809
Poorer 18.31 900 17.84 814
Average 19.92 979 17.16 783
Richer 22.76 1118 23.63 1079
Richest 23.08 1134 23.65 1080
Type of place of residence
Urban 44.0 2162 41.9 1914
Rural 56.0 2754 58.1 2654
Highest educational level attained
No education 25.4 1247 17.6 803
Primary 20.3 999 15.8 723
Middle/JSS 38.5 1893 40.3 1839
Secondary/SSS 12.1 596 18.2 830
Higher 3.7 181 8.2 373
Age
15–19 20.84 1025 19.94 910
20–24 17.86 877 15.42 704
25–29 16.93 832 13.66 623
30–34 13.10 644 11.66 532
35–39 12.99 638 11.57 528
40–44 9.56 470 8.62 393
45–49 8.72 428 7.96 363
50–54 — — 6.51 287
55–59 — — 4.66 212
Marital status
Never married 32.41 1593 42.52 1942
Married 58.51 2876 52.63 2404
Formerly married 9.08 446 4.84 221
Occupation
Not working 22.5 1108 17.4 797
Professional/clerical 4.7 229 15 686
Sales/services 36.6 1798 9.0 410
Agricultural 26.4 1300 39.7 1813
Manual/other 9.8 481 18.9 862
Fruit and vegetable consumption in Ghana 7

and vegetable intake in females and fruit intake (but not vegetable intake) in males.
Increased age was associated with more fruit and vegetable consumption among females,and increased fruit intake (but not vegetable intake) among males. Both males and
females working in formal and informal agriculture sectors reported higher fruit and
vegetable consumption than those in other occupations. The most conspicuous observa-
tion for religion is the significantly lower inclination of traditionalist/spiritualist towards
fruit and vegetable intake. Vegetable intake was significantly higher among Mole-Dagbani
males and females than among Akans, who were used as the reference group (Models 2
and 6). The effect of media exposure was mixed: exposure to print/magazine at least
once a week or almost every day highly predicted fruit (but not vegetable) intake amongfemales (Model 4) as well as the consumption of fruit and vegetable among males
(Models 6 and 8).
Females
(n ¼ 4916)
Males
(n ¼ 4568)
Explanatory variable % n % n
Religion
Catholic 14.9 733 15.1 689
Protestant 14.7 723 15.2 695
Pentecostal 34.5 1696 25.7 1175
Other Christian 9.7 478 11.8 539
Muslim 16.9 832 18.8 861
Traditional/spiritualist 5.4 266 7.6 347
No religion/other 3.8 188 5.7 262
Ethnicity
Akan 43.4 2136 40.1 1833
Ga/Dangme 6.3 309 5.8 265
Ewe 13.0 637 14.3 653
Mole/Dagbani 21.8 1071 24 1097
Other 15.5 763 15.8 720
Reading newspapers/magazines
Not at all 78.3 3844 63.6 2899
Less than once a week 7.8 384 12.1 550
At least once a week 11.2 552 16.5 750
Almost every day 2.6 128 7.8 356
Listening to radio
Not at all 17.3 848 6.9 315
Less than once a week 8.1 396 6.2 284
At least once a week 25.1 1232 16.5 753
Almost every day 49.6 2437 70.4 3210
Watching television
Not at all 41.6 2041 31.4 1433
Less than once a week 8.7 429 13.6 621
At least once a week 19.1 939 19.9 910
Almost every day 30.6 1501 35.1 1600
Table 1. Continued
J. Amo-Adjei and A. Kumi-Kyereme8

Discussion
With the changing disease profile of Ghana as part of a natural response to improving
welfare, regenerative health, which embraces regular intake of fruit and vegetables, has
become an important concern to health policymakers in the country. In this paper, recent
data from the Ghana DHS has been used to explore whether fruit and vegetable con-
sumption varies by ecological region as well as other socioeconomic factors. However,
the frequencies of fruit and vegetable intake observed in this analysis were far belowrecommended levels, with respondents reporting about a four times lower intake than
the recommended five servings a day.
In general, females reported more fruit and vegetable consumption than males. This is
consistent with some earlier studies (Thompson et al., 1999; Ledoux et al., 2010; Azagba
& Sharaf, 2011; Nepal et al., 2011). Although the reasons for the differences between
females and males are not clear in the literature, some possible explanations are offered:
women are more likely to be concerned about losing weight than men and therefore
turn to more energy-deficient, high-fibre foods such as fruit and vegetables (Ledouxet al., 2010). More compelling is the fact that men are more likely to be engaged in
energy-demanding jobs than females, and therefore more likely to have high-energy
content diets. Whitehead et al. (2012) suggested that higher levels of fruit and veget-
able consumption can cause skin lightening. Fruit and vegetable intake enhances skin
Fig. 1. Fruit and vegetable consumption among females in Ghana by ecological zone,
2008 GDHS.
Fruit and vegetable consumption in Ghana 9

carotenoid concentration (Darvin et al., 2008; Lademann et al., 2011) with the potential
to change skin colour as well as contribute to overall health (Stephen et al., 2011).
Undoubtedly, women are very anxious about skin complexion, and may recourse to
fruit and vegetables to improve their skin tone. This benefit of fruit and vegetables couldprovide a persuasive tool for public promotion of their intake.
Significant differences in fruit and vegetable intake were found by ecological zone,
thereby rejecting the null hypothesis of this study. Respondents from the Forest zone
had a higher frequency of fruit and vegetable intake than those from the Coastal and
Savannah zones. While cultural factors may play a role (Azagba & Sharaf, 2011), it is
likely that production and distribution issues account for these differences, as the Forest
zone is a better physical environment for the production of fruit and vegetables than the
Savannah zone. As Dickson & Benneh (1988) showed, the soil quality coupled withclimatic conditions of the Savannah zone do not naturally support large-scale produc-
tion of fruit and vegetables, unless supported by great investments in soil enrichment
and irrigation. Not surprisingly therefore, data on fruit and vegetable production from
Ghana’s Ministry of Food and Agriculture indicate that less than 2% of fruits and
about 10% of vegetables are produced in the Savannah zone (Ministry of Food and Ag-
riculture, 2010). Certainly, these physical conditions in concert with other endogenous
factors might have contributed to the relatively low intake of fruit and vegetables in
the Savannah zone. However, it should be emphasized that there are some importantcultural, social, ethnic, economic and geographic idiosyncrasies that could confound
Fig. 2. Fruit and vegetable consumption among males in Ghana by ecological zone,
2008 GDHS.
J. Amo-Adjei and A. Kumi-Kyereme10

Table 2. Poisson regression results on relationships between socioeconomic factors and fruit and vegetable consumption inGhanaians
Females Males
Vegetables (1) Vegetables (2) Fruits (3) Fruits (4) Vegetables (5) Vegetables (6) Fruits (7) Fruits (8)
Ecological zone
Coastal 1 1 1 1 1 1 1 1
Forest 1.346*** 1.271*** 1.217*** 1.234*** 1.164** 1.112* 1.314*** 1.278***
(1.209, 1.497) (1.146, 1.409) (1.098, 1.349) (1.116, 1.364) (1.059, 1.280) (1.020, 1.213) (1.184, 1.458) (1.147, 1.423)
Savannah 1.248*** 1.053 0.680*** 0.694*** 1.122 0.848* 0.767** 0.770*
(1.103, 1.413) (0.885, 1.252) (0.585, 0.790) (0.575, 0.838) (0.968, 1.301) (0.723, 0.994) (0.654, 0.900) (0.621, 0.955)
Wealth index
Poorest 1 1 1 1
Poorer 0.938 1.067 1.066 1.166*
(0.855, 1.030) (0.939, 1.211) (0.948, 1.198) (1.028, 1.323)
Average 0.831** 0.971 0.937 1.066
(0.738, 0.936) (0.839, 1.125) (0.797, 1.100) (0.922, 1.233)
Richer 0.756*** 0.904 0.929 0.923
(0.662, 0.863) (0.771, 1.060) (0.794, 1.086) (0.790, 1.079)
Richest 0.826* 0.872 0.873 0.890
(0.713, 0.956) (0.736, 1.034) (0.741, 1.028) (0.750, 1.058)
Type of place of residence
Urban 1 1 1 1
Rural 1.065 1.116 0.968 1.109*
(0.948, 1.197) (0.990, 1.257) (0.857, 1.093) (0.986, 1.1248)
Education
None 1 1 1 1
Primary 1.090 1.069 0.930 1.181*
(0.996, 1.192) (0.969, 1.180) (0.831, 1.041) (1.036, 1.346)
Middle/Junior Secondary
School
1.077 1.112* 0.938 1.308***
(0.985, 1.178) (1.007, 1.228) (0.839, 1.048) (1.151, 1.485)
Secondary/Senior
Secondary School
1.239*** 1.188* 0.913 1.267**
(1.108, 1.385) (1.038, 1.359) (0.811, 1.028) (1.100, 1.459)
Higher 1.122 1.254* 0.907 1.358***
(0.925, 1.361) (1.031, 1.524) (0.790, 1.041) (1.147, 1.608)
Fru
ita
nd
vegeta
ble
con
sum
ptio
nin
Gh
an
a1
1

Females Males
Vegetables (1) Vegetables (2) Fruits (3) Fruits (4) Vegetables (5) Vegetables (6) Fruits (7) Fruits (8)
Age
15–19 1 1 1 1
20–24 0.985 1.052 1.002 0.972
(0.896, 1.083) (0.962, 1.150) (0.904, 1.109) (0.877, 1.076)
25–29 1.045 1.029 1.033 0.947
(0.951, 1.148) (0.928, 1.141) (0.929, 1.149) (0.844, 1.064)
30–34 1.179** 1.034 1.118 0.913
(1.056, 1.316) (0.928, 1.151) (0.998, 1.253) (0.803, 1.037)
35–39 1.086 1.006 1.078 0.989
(0.979, 1.204) (0.900, 1.125) (0.969, 1.198) (0.879, 1.113)
40–44 1.116* 0.990 1.140* 0.885*
(1.006, 1.237) (0.883, 1.109) (1.027, 1.265) (0.784, 1.000)
45–49 1.168** 0.936 1.097 0.990
(1.053, 1.295) (0.829, 1.057) (0.984, 1.223) (0.868, 1.130)
50–54 — — 1.101 1.003
(0.974, 1.244) (0.860, 1.169)
55–59 — — 1.138 0.937
(0.992, 1.307) (0.804, 1.092)
Marital status
Never married 1 1 1 1
Married 1.078 0.916 1.034 1.056
(0.990, 1.173) (0.830, 1.010) (0.946, 1.130) (0.955, 1.167)
Formerly married 0.952 0.934 0.902 0.934
(0.059) (0.069) (0.063) (0.076)
Occupation
Non-working 1 1 1 1
Professional/clerical 1.082 1.167* 1.008 1.095
(0.925, 1.265) (1.003, 1.358) (0.905, 1.123) (0.977, 1.226)
Sales/services 0.974 1.156** 1.072 1.034
(0.894, 1.062) (1.058, 1.263) (0.948, 1.213) (0.901, 1.188)
Agricultural 1.107* 1.173** 1.172** 1.250***
(1.003, 1.222) (1.054, 1.305) (1.064, 1.292) (1.114, 1.403)
Manual/other 0.943 1.092 1.025 1.084
(0.850, 1.046) (0.977, 1.220) (0.932, 1.128) (0.968, 1.215)
Table 2. Continued
J.
Am
o-A
djei
an
dA
.K
um
i-Ky
ereme
12
Females Males
Vegetables (1) Vegetables (2) Fruits (3) Fruits (4) Vegetables (5) Vegetables (6) Fruits (7) Fruits (8)
Religious background
Catholic 1 1 1 1
Protestant 0.999 1.028 0.973 1.041
(0.894, 1.117) (0.922, 1.145) (0.881, 1.076) (0.928, 1.168)
Pentecostal/Charismatic 0.978 1.071 0.944 0.958
(0.891, 1.073) (0.971, 1.182) (0.869, 1.026) (0.867, 1.059)
Other Christian 1.203** 1.065 0.913 0.992
(1.059, 1.366) (0.941, 1.205) (0.821, 1.016) (0.882, 1.116)
Muslim 0.875* 1.146 1.084 1.062
(0.768, 0.997) (0.995, 1.320) (0.926, 1.269) (0.920, 1.227)
Traditional/spiritualist 0.813- 0.705** 0.828** 0.671**
(0.696, 0.949) (0.553, 0.899) (0.719, 0.954) (0.516, 0.872)
Other 1.025 0.960 0.953 0.967
(0.873, 1.203) (0.782, 1.178) (0.843, 1.076) (0.830, 1.128)
Ethnicity
Akan 1 1 1 1
Ga/Dangme 0.982 0.783** 1.101 0.970
(0.828, 1.164) (0.674, 0.910) (0.964, 1.256) (0.847, 1.111)
Ewe 0.785*** 1.038 0.910 1.004
(0.698, 0.883) (0.922, 1.168) (0.817, 1.013) (0.897, 1.124)
Mole-Dagbani 1.169 1.095 1.294*** 1.065
(0.991, 1.378) (0.932, 1.287) (1.139, 1.469) (0.881, 1.288)
Other 1.091 1.080 0.963 1.189**
(0.936, 1.271) (0.946, 1.231) (0.828, 1.119) (1.043, 1.356)
Reading newspapers/magazines
Not at all 1 1 1 1
Less than once a week 1.030 0.963 1.128* 0.980
(0.925, 1.148) (0.867, 1.069) (1.029, 1.236) (0.894, 1.074)
At least once a week 0.973 1.151** 1.110* 1.036
(0.884, 1.071) (1.044, 1.268) (1.020, 1.208) (0.943, 1.138)
Almost every day 1.074 1.339*** 1.253** 1.191*
(0.872, 1.323) (1.159, 1.547) (1.085, 1.448) (1.038, 1.366)
Table 2. ContinuedF
ruit
an
dveg
etab
leco
nsu
mp
tion
inG
ha
na
13

Females Males
Vegetables (1) Vegetables (2) Fruits (3) Fruits (4) Vegetables (5) Vegetables (6) Fruits (7) Fruits (8)
Listening to radio
Not at all 1 1 1 1
Less than once a week 0.972 1.068 1.026 0.966
(0.863, 1.094) (0.921, 1.239) (0.895, 1.176) (0.795, 1.174)
At least once a week 0.971 1.198** 0.997 1.045
(0.891, 1.059) (1.066, 1.347) (0.881, 1.127) (0.880, 1.240)
Almost every day 1.029 1.305*** 0.990 1.051
(0.946, 1.118) (1.169, 1.457) (0.875, 1.121) (0.886, 1.248)
Watching television
Not at all 1 1 1 1
Less than once a week 1.052 0.974 1.055 1.137*
(0.936, 1.181) (0.879, 1.080) (0.940, 1.184) (1.007, 1.283)
At least once a week 1.020 1.063 0.981 1.043
(0.935, 1.113) (0.981, 1.152) (0.865, 1.113) (0.931, 1.168)
Almost every day 1.029 0.981 1.059 1.099
(0.932, 1.136) (0.899, 1.070) (0.946, 1.185) (0.968, 1.246)
Constant 6.333*** 6.046*** 7.710*** 4.462*** 7.255*** 7.059*** 5.844*** 3.822***
(5.890, 6.808) (4.861, 7.519) (7.180, 8.280) (3.496, 5.694) (6.760, 7.785) (5.822, 8.558) (5.421, 6.300) (2.982, 4.898)
AIC �21136.9 �20459.3 �23323.9 �22551.5 �18720.9 �18024.4 �18215.0 �17655.5
Log-likelihood 31.83 215.9 58.27 275.3 10.04 215.4 54.74 234.3
w2 4822 4806 4743 4728 4398 4379 4341 4322
N 6.333*** 6.046*** 7.710*** 4.462*** 7.255*** 7.059*** 5.844*** 3.822***
Exponentiated coefficients; 95% CI in parentheses.
*p < 0.05; **p < 0.01; ***p < 0.001.
Table 2. Continued
J.
Am
o-A
djei
an
dA
.K
um
i-Ky
ereme
14

the observed variations. For instance, in the Savannah zone, attachment to traditional
views on diets is stronger than in the Coastal or Forest areas, partly due to modernization
predicated on Western formal education in the latter areas (Shabaya & Konadu-Agyemang, 2004).
With improved fruit and vegetable distribution systems, some of the noted spatial
inequalities could be removed. However, there are virtually no storage facilities along
the major transport routes between the Forest, Coastal and Savannah zones. Although
physical environmental characteristics differ from one country to another, Ali & Tsou
(1997) pointed out that fruit and vegetable consumption in most developing countries
is negatively affected by poor distribution and storage systems. Issues about distribu-
tion of fruit and vegetables appear germane to consumption in Ghana. In Canada forinstance, Azagba & Sharaf (2011) observed spatial differences in fruit and vegetable
consumption and argued that this may be correlated with regional/state food policies,
which may encompass production, distribution and marketing practices. In a related
study in South Africa, greater fruit and vegetable intake was found in the Western
Cape than the Northern Cape, where socioeconomic conditions are poor and agri-
culture is underdeveloped (Nude, 2007). The Savannah zone of Ghana is similar to
the Northern Cape of South Africa, with less developed agriculture and poor socio-
economic conditions.The average consumption of vegetables among respondents was slightly higher
than that of fruit. Some common eating practices among Ghanaians may account for
this trend. Most Ghanaian diets (with dishes such as fufu, banku and Tuo Zaafi) are
soup-based, and prepared using mainly vegetables. Also, export and economic priorities,
rather than local consumption, have dominated fruit production in Ghana over the last
few years, as is often the case in developing countries (Ayeiko et al., 2006). For instance,
in 2008, Bomarts Farms Ghana Ltd, a major fruit producer, exported all the 300 tonnes
of pineapples it produced to European markets. In addition, a large chunk of funds ap-proved for Ghana under the US Millennium Challenge Account (MCA) was devoted to
developing road infrastructure connecting the airport with fruit and vegetable production
areas to cut travelling time for export. Besides, a high proportion of the MCA funds given
to farmers was to encourage large-scale production of fruit, mainly for export.
From another perspective, this study challenges popular notions about the positive
relationship between wealth status and high fruit and vegetable consumption. Azagba
& Sharaf (2011), Dave et al. (2010) and Doku et al. (2013) suggested that fruit and
vegetable intake is positively correlated with household wealth. However, in this case,we observed a negative association between household wealth status and fruit and
vegetable consumption in both the bivariate descriptive and inferential multivariate
analysis, and this cuts across gender. A plausible reason is the fact that fruit and veget-
able availability in Ghana is highly seasonal: during the peak season, fruit and veget-
ables are available and cheap, in and around proximate growing areas as well as areas
where distribution systems are better with production areas, particularly in large urban
areas such as Accra, Kumasi and Takoradi. This supposition is partly strengthened by
the fact that there are rarely differences in fruit and vegetable intake between urbanand rural dwellers. High frequency of fruit intake especially is even more likely in rural
areas than urban areas, albeit insignificant at the 5% level.
The findings of this study are consistent with those of other studies on the relation-
ship of other socioeconomic factors (for example education) with fruit and vegetable
Fruit and vegetable consumption in Ghana 15

consumption (Dave et al., 2010). Theoretically, the relationship between education and
healthy dietary practices can be attributed to allocative efficiency (Grossman, 2008).
Thus, all things being equal, higher education increases the stock of knowledge peoplehave about the benefits of healthy lifestyles, of which fruit and vegetable consumption is
instrumental. It is therefore consistent to observe that fruit and vegetable consumption
generally correlates with educational attainment. Nevertheless, this relationship may
not be straightforward in all cases due to the existence of possible confounders. For
example, an inverse relationship has been observed in this analysis between vegetable
intake and education among males.
Religious theologies have diverse prescriptions on dietary practices (Hoff et al., 2008).
In this study the most disadvantaged group was the traditional/spiritualists. These are agroup of people who may hold more conservative views about lifestyles considered
‘modern’ or ‘Western’. As recounted earlier, indigenous Ghanaians somehow view fruit
and vegetable consumption as a foreign culture, and prior studies on healthy lifestyles
have found this same group to be persistently disadvantaged (see Gyimah, 2007).
The study has some limitations. The use of cross-sectional data means that it is
impossible to control for other factors that determine fruit and vegetable intake. For
instance, childhood experiences and preferences (Gibson et al., 1998) were not avail-
able in the data set. Similarly, the outcome variables (fruit and vegetable consumption)are self-reported and could have been negatively affected by recall, causing under- and
over-reporting. Forshee (2004) for instance noted that over-reporting is possible be-
cause people can over-report ‘good’ foods like fruit and vegetables and under-report
those considered ‘bad’. Besides, the timing (September to November 2008) of the GDHS
survey coincided with the minor season of fruit and vegetable availability in the country.
Perhaps a different scenario would be noted if a similar study was conducted in a major
season of fruit and vegetable availability, such as between June and September. The self-
reported nature of the survey also calls for caution on servings of fruit and vegetable vis-
a-vis quantity. Thus, the study was constrained in its estimation of the fruit and veget-
able portion/quantity taken at each servings, and this limited its ability to make claims
of adequacy of quantity. However, the approach used in collecting data on fruit and
vegetable intake, which is the 24-hour dietary recall, has been found to be valid
(WHO, 2002b).
Another limitation is the categorization of the ecological zones, as these are not
strictly mutually exclusive. Regions such as Brong-Ahafo and Greater Accra have
some sections with characteristics of the savannah areas. Also, some parts of the Westernregion have features of the forest areas; there are elements of contiguity and one must
be circumspect in making attributions. Nonetheless, the fact that the results are consistent
with expectations is an indication that the categorization is unbiased.
Policy implications
These findings have important implications for policy in relation to improving fruit
and vegetable intake as part of the regenerative health agenda of Ghana. First, theareas with low potential for fruit and vegetable production fared relatively poorly. It
therefore seems that addressing short-term fruit and vegetable distribution inequities
and longer-term production, coupled with the intensive promotion of local consump-
J. Amo-Adjei and A. Kumi-Kyereme16

tion concurrently would be important here. One effective approach could be an appli-
cation of a sector-wide approach (SWAp), where a number of ministries and depart-
ments such as agriculture, finance, trade and industry, transportation and educationare fused to engage policy interventions to encourage fruit and vegetable intake. For
instance, the Ministry of Finance and Economic Planning could provide financial assis-
tance to producers across the country while the Ministry of Food and Agriculture could
provide technical assistance to farmers. Similarly, the Ministry of Trade and Industry is in
a position to facilitate storage and distribution. The current orientation of the Ministry of
Trade, which is more geared towards export, is counterproductive to the health needs of
the local population. Large-scale local production and consumption of fruit and veget-
ables would not only contribute to a healthy population, but would be an equally posi-tive mechanism for poverty alleviation.
Conclusion
It has been demonstrated in this study that the intake of fruit and vegetables in
Ghana overall is low and disparities are noted by ecological zone, as well as by educa-
tional attainment, wealth status, marital status, age and exposure to media. The effect
of ecological zone remains important even after controlling for other socioeconomicfactors, indicating the importance of location on fruit and vegetable intake in the country.
Even though the disparities observed are not causal, they point out the need for more
inclusive formal and informal education on the benefits of consumption of fruit and
vegetables. This will help the country reduce or probably curtail the emerging burden of
non-communicable diseases related to lifestyles.
References
Ali, M. & Tsou, S. C. S. (1997) Combating micronutrient deficiencies through vegetables – a
neglected food frontier in Asia. Food Policy 22, 18–38.
Asfaw, A. (2008) Fruits and vegetables availability for human consumption in Latin American
and Caribbean countries: patterns and determinants. Food Policy 33, 444–454.
Azagba, S. & Sharaf, M. F. (2011) Disparities in the frequency of fruit and vegetable consump-
tion by socio-demographic and lifestyle characteristics in Canada. Nutrition Journal 10, 118.
Boeing, H., Bechthold, A. & Bub, A. (2012) Critical review: vegetables and fruit in the prevention
of chronic diseases. European Journal of Nutrition 51, 637–663.
Boynton-Jarrett, R., Thomas, T. N., Peterson, K. E., Wiecha, J. S. & Gortmaker, S. L. (2003)
Impact of television viewing patterns on fruit and vegetable consumption among adolescents.
Paediatrics 112, 1321–1326.
Cullen, K. W., Baranowski, T., Owens, E., Marsh, T., Rittenberry, L. & de Moor, C. (2003)
Availability, accessibility, and preferences for fruit, 100% fruit juice, and vegetables influence
children’s dietary behaviour. Health Education Behaviour 30, 615–626.
Cullen, K. W., Eagan, J., Baranowski, T., Owens, E. & de Moor, C. (2000) Effect of a la carte
and snack bar foods at school on children’s lunch time intake of fruits and vegetables. Journal
of American Dietetic Association 100, 1482–1486.
Darvin, M. E., Patzelt, A., Knorr, F., Blume-Peytavi, U., Sterry, W. & Lademann, J. (2008) One-
year study on the variation of carotenoid antioxidant substances in living human skin: influence
of dietary supplementation and stress factors. Journal of Biomedical Optics 13(4), 44028.
Fruit and vegetable consumption in Ghana 17

Dave, J. M., Evansc, A. E., Pfeiffer, K. A., Watkins, K. W. & Saunders, R. P. (2010) Correlates
of availability and accessibility of fruits and vegetables in homes of low-income Hispanic families.
Health Education Research 25(1), 97–108.
de Graft Aikins, A. (2007) Ghana’s neglected chronic disease epidemic: a developmental challenge.
Ghana Medical Journal 114(4), 154–159.
Dickson, K. B. & Benneh, G. (1988) A New Geography of Ghana. Longman Group UK Limited.
Longman House, Harlow, Essex, UK.
Doku, D., Koivusilta, L., Raisamo, S. & Rimpela, A. (2013) Socioeconomic differences in adoles-
cents’ breakfast eating, fruit and vegetable consumption and physical activity in Ghana. Public
Health Nutrition 16(05), 864–872.
Domel, S. B. & Thompson, W. O. (2002) Fourth-grade children’s consumption of fruit and veget-
able items available as part of school lunches is closely related to preferences. Journal of Nutrition
Education & Behaviour 34, 166–171.
Forshee, R. A. & Storey, M. L. (2004) Controversy and statistical issues in the use of nutrient
densities in assessing diet quality. Journal of Nutrition 134(10), 2733–2737.
Franchini, B., Poınhos, R., Klepp, K. I. & Vaz de Almeida, M. D. (2013) Fruit and vegetables:
intake and sociodemographic determinants among Portuguese mothers. Annals of Nutrition
and Metabolism 63(1–2), 131–138.
Ghana Statistical Service (2000) 2000 Population and Housing Census. Accra.
Ghana Statistical Service (2010) 2010 Population and Housing Census. Accra.
Ghana Statistical Service, Ghana Health Service & ICF Macro (2009) Ghana Demographic and
Health Survey, 2008. ICF Macro, Calverton, MD.
Gibson, E., Wardle, J. & Watts, C. (1998) Fruit and vegetable consumption, nutritional knowl-
edge and beliefs in mothers and children. Appetite 31, 205–228.
Grossman M. (2008) The relationship between health and schooling. Eastern Economics Journal
34(3), 281–292.
Gyimah, S. O. (2006) Cultural background and infant survival in Ghana. Ethnicity and Health
11(2), 101–120.
Gyimah, S. O. (2007) What has faith got to do with it? Religion and child survival in Ghana.
Journal of Biosocial Science 39, 923–937.
Hall, J. N., Moore, S., Harper, S. B. & Lynch, J. W. (2009) Global variability in fruit and veget-
able consumption. American Journal of Preventive Medicine 36(5), 402–409.e5.
Hoff, A., Johannessen-Henry, C. T., Ross, L., Hvidt, C. N. & Johansen, C. (2008) Religion and
reduced cancer risk – what is the explanation? A review. European Journal of Cancer 44(17),
2573–2579.
Kamphuis, C. B. M., Giskes, K., de Bruijn, G., Wendel-Vos, W., Brug, J. & van Lenthe, F. J.
(2006) Environmental determinants of fruit and vegetable consumption among adults: a sys-
tematic review. British Journal of Nutrition 96, 620–635.
Lademann, J., Meinke, M. C., Sterry, W. & Darvin, M. E. (2011) Carotenoids in human skin.
Experimental Dermatology 20(5), 377–382.
Lallukka, T., Pitkaniemi, J., Rahkonen, O., Roos, E., Laaksonen, M. & Lahelma, E. (2010) The
association of income with fresh fruit and vegetable consumption at different levels of educa-
tion. European Journal of Clinical Nutrition 64, 324–327.
Lazzeri, G., Pammolli, A., Azzolini, E., Simi, R., Meoni, V., de Wet, D. R. & Giacchi, M. V.
(2013) Association between fruits and vegetables intake and frequency of breakfast and snacks
consumption: a cross-sectional study. Nutrition Journal 12(1), 123.
Ledoux, T. A., Hingle, M. D. & Baranowski, T. (2010) Relationship of fruit and vegetable intake
with adiposity: a systematic review. Obesity Reviews 12(5), e143–150.
Lock, L., Pomerleau, J., Causer, L., Altmam, D. R. & McKee, M. (2005) The global burden of
diseases attributable to low consumption of fruits and vegetables: implications for the global
strategy on diet. Bulletin of World Health Organization 83, 100–108.
J. Amo-Adjei and A. Kumi-Kyereme18

Ministry of Food and Agriculture (2010) Ghana Medium Term Agricultural Development program
(MTADP). An agenda for sustained agricultural growth and development (1991–2000), Accra,
Ghana.
Nepal, V. P., Mgbere, O., Banerjee, D. & Arafat, R. R. (2011) Disparities in fruits and vegetables
consumption in Houston, Texas: implications for health promotion. Journal of Primary Care
& Community Health 2(3), 142–147.
Nude, C. E. (2007) Fruits and vegetables consumption by South African children aged 12–108
months. Master’s Dissertation, University of Stellenbosch, South Africa.
Oliveira, A., Maia, B. & Lopes, C. (2013) Determinants of inadequate fruit and vegetable con-
sumption amongst Portuguese adults. Journal of Human Nutrition and Dietetics 27 (supplment
2), 194–203.
Pollard, J., Kirk, S. F. L. & Cade, J. E. (2002) Factors affecting food choice in relation to fruit
and vegetable intake: a review. Nutrition Research Reviews 15, 373–387.
Prescott, C. N. & Pradham, M. (1999) Poverty Profile for Cambodia. World Bank Discussion Paper
No. 373. The World Bank, Washington, DC.
Shabaya, J. & Konadu-Agyemang, K. (2004) Unequal access, unequal participation: some spatial
and socio-economic dimensions of the gender gap in education in Africa with special reference
to Ghana, Zimbabwe and Kenya. Compare 34(4), 395–424.
Shohaimi, S., Welch, A., Bingham, S., Luben, R., Day, N., Wareham, N. & Khaw, K. T. (2004)
Residential area deprivation predicts fruit and vegetable consumption independently of indi-
vidual educational level and occupational social class: a cross sectional population study in
the Norfolk cohort of the European Prospective Investigation into Cancer (EPIC-Norfolk).
Journal of Epidemiology and Community Health 58, 686–691.
Stephen, I. D., Coetzee, V. & Perrett, D. I. (2011) Carotenoid and melanin pigment coloration
affect perceived human health. Evolution and Human Behaviour, 32(3), 216–227.
Story, M. & French, S. (2004) Food advertising and marketing directed at children and adoles-
cents in the US. International Journal of Behavioural Nutrition and Physical Activity. URL:
http://www.biomedcentral.com/content/pdf/1479-5868-1-3.pdf.
Tak, N. I., te Velde, S. J., Kamphuis, C., Ball, K., Crawford, D., Brug, J. & van Lenthe, F. J.
(2013) Associations between neighbourhood and household environmental variables and fruit
consumption: exploration of mediation by individual cognitions and habit strength in the
GLOBE study. Public Health Nutrition 16(3), 505–514.
Thompson, R. L., Margets, B. M., Speller, V. M. & McVey, D. (1999) The health education
authority’s health and lifestyle survey 1993: who are the low fruit and vegetable consumers?
Journal of Epidemiology Community Health 53, 294–299.
Vainio, H. & Bianchini, F. (2003) Handbooks of Cancer Prevention. Vol. 8: Fruits and Vegetables.
International Agency for Research on Cancer (IARC) Press, Lyon.
van Ansem, W. J., Schrijvers, C., Rodenburg, G. & van de Mheen, D. (2013) Is there an associa-
tion between the home food environment, the local food shopping environment and children’s
fruit and vegetable intake? Results from the Dutch INPACT study. Public Health Nutrition
16(7), 1206–1214.
Whitehead, R. D., Re, D., Xiao, D., Ozakinci, G. & Perrett, D. I. (2012) You are what you eat:
within-subject increases in fruit and vegetable consumption confer beneficial skin-color
changes. PLoS ONE 7(3), e32988. doi:10.1371/journal.pone.0032988.
WHO (2002a) World Health Survey: Guide to Administration and Question-by-Question Specifi-
cations. WHO, Geneva.
WHO (2002b) World Health Report 2002 – Reducing Risks, Promoting Healthy Life. WHO,
Geneva.
Yen, S. T., Tan, A. K. G. & Nayga, R. M. (2011) Determinants of fruit and vegetable consump-
tion in Malaysia: an ordinal system approach. Australian Journal of Agricultural Research and
Economics 55(2), 239–256.
Fruit and vegetable consumption in Ghana 19