
development and evaluation of a stochastic blast damage ...
66
-
Upload
khangminh22 -
Category
Documents
-
view
4 -
download
0
Transcript of development and evaluation of a stochastic blast damage ...


DEVELOPMENT AND EVALUATION OF A STOCHASTIC
BLAST DAMAGE MODEL FOR AUTONOMOUS BLAST
DESIGN APPLICATIONS
MATTHEW O'CONNOR
MATTHEW O’CONNOR
DATE: 8TH JUNE 2020
A THESIS SUBMITTED FOR THE DEGREE OF BACHELOR OF ENGINEERING AT
THE UNIVERSITY OF QUEENSLAND
SCHOOL OF MECHANICAL AND MINING ENGINEERING

1
ABSTRACT
Drilling and blasting activities in open pit mines are an important part of mine to mill operations,
yet the underlying design principles are largely driven by empirical methods that fail to consider
the heterogenous nature of the rock mass. Beyond this, it is common practice for engineers in the
field to take a template-based approach when producing blast design patterns, despite the
opportunity for further optimization. This research project has been conducted to develop and
evaluate a stochastic blast damage modelling tool capable of providing the user with an estimate
for the extent of damage and fragmentation based on rock characteristics and explosive properties
that consider variability in these parameters. This tool was built using the iDamage model
developed by Onederra (2016) which is based on the stress attenuation function and a tensile
strength limiting criteria. Stochastic modelling was incorporated using the simulation software
ModelRisk, which provides a probability density function of key output parameters that were
identified such as the radius of fracture and P80 percent passing fraction. An initial sensitivity
analysis indicated that the model is most sensitive to the strength parameters, namely uniaxial
compressive strength and P-wave velocity of the rock material. Further testing of the model was
conducted to validate its reliability and potential use, and it was found that accurate estimates for
the relative variance of input parameters is required to ensure its efficacy. It is recommended that
these inputs be expert-driven and additional refinements to the model be made before its use in
industry. Overall, the stochastic blast damage model offers an improvement on existing engineering
practices as it more accurately reflects the true nature of rock breakage.

2
TABLE OF CONTENTS ABSTRACT ................................................................................................................................... 1
1.0 INTRODUCTION .............................................................................................................. 6
1.1 BACKGROUND ................................................................................................................... 6
1.1.1 Problem Statement .......................................................................................................... 6
1.1.2 Project Overview ............................................................................................................. 6
1.1.3 Significance and Relevance in Industry .......................................................................... 7
1.2 AIMS AND OBJECTIVES ................................................................................................... 7
1.3 PROJECT SCOPE ................................................................................................................. 7
1.5 THESIS STRUCTURE .......................................................................................................... 8
2.0 LITERATURE REVIEW ....................................................................................................... 9
2.1 UNDERLYING THEORY OF ROCK FRACTURE ............................................................ 9
2.2 TEMPLATE-BASED APPROACH TO BLAST DESIGN ................................................ 12
2.3 GEOTECHNICAL AND EXPLOSIVE PROPERTIES ...................................................... 14
2.1.1 Uniaxial Compressive Strength ..................................................................................... 14
2.1.2 Poisson’s Ratio .............................................................................................................. 16
2.1.3 P-Wave Velocity ........................................................................................................... 17
2.1.4 Rock Density ................................................................................................................. 17
2.1.5 Explosive Velocity of Detonation (VOD) ..................................................................... 18
2.4 EXISTING EMPIRICAL BLAST DAMAGE & FRAGMENTATION MODELS ........... 19
2.3.1 Holmberg-Persson Approach, 1980 .............................................................................. 20
2.3.2 Lu and Hustrulid, 2003.................................................................................................. 22
2.3.3 Onederra iDamage Model, 2016 ................................................................................... 22
2.5 DRILL AND BLAST DESIGN SOFTWARE SOLUTIONS ............................................. 25
2.5.1 Deswik OPDB Client .................................................................................................... 25
2.5.2 JKSimBlast .................................................................................................................... 26
2.6 STOCHASTIC APPROACH TO DRILL & BLAST DESIGN .......................................... 26
2.6 REVIEW SUMMARY ........................................................................................................ 29
3.0 PROJECT METHODOLOGY ............................................................................................ 29
3.1 OVERVIEW OF APPROACH TAKEN ............................................................................. 29
3.2 RISK MANAGEMENT PLAN ........................................................................................... 30

3
4.0 DEVELOPMENT & EVALUATION OF DAMAGE & FRAGMENTATION MODEL
34
4.1 MODEL INPUTS ............................................................................................................... 35
5.1.1 Material Properties ........................................................................................................ 37
5.1.2 Explosive Properties ...................................................................................................... 39
5.1.3 Blasthole Geometry ....................................................................................................... 41
4.2 MODEL OUTPUTS ........................................................................................................... 43
4.2.1 Damage Model Outputs ................................................................................................ 44
4.2.2 Fragmentation Model Outputs ...................................................................................... 45
4.3 MODEL EVALUATION .................................................................................................... 46
5.0 SENSITIVITY ANALYSIS OF DAMAGE & FRAGMENTATION MODEL............... 46
5.1 SENSITIVITY ANALYSIS ................................................................................................ 47
5.2 MODEL RELIABILITY ..................................................................................................... 51
6.0 CONCLUSIONS AND RECOMMENDATIONS .............................................................. 54
7.0 REFERENCES ...................................................................................................................... 55
8.0 APPENDICES ........................................................................................................................ 59
Appendix A: PROJECT GANTT CHART ................................................................................ 59
Appendix B: EXCEL MODEL INPUT PARAMETERS .......................................................... 61
Appendix C: EXCEL MODELY KEY OUTPUTS ................................................................... 61
Appendix D: EXCEL DAMAGE MODEL ............................................................................... 62
Appendix E: EXCEL FRAGMENTATION MODEL ............................................................... 63
Appendix F: EXCEL EXPLOSIVES DATABASE .................................................................. 64

4
LIST OF FIGURES
Figure 1: Typical radial crack pattern observed around a blasthole (Silva et al., 2019) ............... 10
Figure 2: Pressure-time graph for ideal and non-ideal detonation (Cunningham, 2006) .............. 11
Figure 3: Vertical section in a bench blasthole showing the pressure wave propagation through the
material (Saharan et al., 2006) ....................................................................................................... 12
Figure 4: Visualization of rock face for open pit mine D&B operations (Dyno Nobel, 2010) ..... 13
Figure 5: Typical ranges of values for UCS of common rock types (J.H.Schon, 2011) ............... 15
Figure 6: Typical ranges of values for Poisson's ratio of rock types (Vásárhelyi, 2009) .............. 16
Figure 7: Engineering systems for rock blasting (Silva et al., 2019) ............................................ 19
Figure 8: Geometric Parameters for the Holmberg-Persson model .............................................. 21
Figure 9:Radius of fracture based on pressure attenuation and tensile strength limit ................... 23
Figure 10: Stochastic model flowchart (Vidhya, 2017) ................................................................ 27
Figure 11: Probability histogram for density of the rock .............................................................. 37
Figure 12: Probability histogram for p-wave velocity................................................................... 38
Figure 13: Probability histogram for uniaxial compressive strength ............................................ 38
Figure 14: Probability histogram for Poisson’s ratio..................................................................... 39
Figure 15: Probability histogram for explosive density ................................................................ 40
Figure 16: Probability histogram for explosive velocity of detonation ......................................... 40
Figure 17: Probability histogram for explosive weight per blasthole ........................................... 41
Figure 18: Stochastic input parameters for blasthole geometry .................................................... 41
Figure 19: Probability histogram for charge length....................................................................... 42
Figure 20: Probability histogram for blasthole diameter ............................................................... 42
Figure 22: Probability histogram for stochastic damage radius .................................................... 44
Figure 24: Probability histogram for P80 percent passing fraction ............................................... 45
Figure 25: Probability histogram for explosives cost per blasthole .............................................. 45
Figure 26: Tornado plot of conditional mean for damage radius .................................................. 47
Figure 27: Tornado plot of contribution to variance for damage radius ....................................... 47
Figure 28: Tornado plot of conditional mean for P80 ................................................................... 49
Figure 29: Tornado Plot of contribution to variance for P80 ........................................................ 49
Figure 30: Tornado plot of conditional mean for explosives cost per blasthole ........................... 50
Figure 31: Tornado plot of contribution to variance for explosive cost per blasthole .................. 51
Figure 32: Effect of UCS on damage radius .................................................................................. 52
Figure 33: Effect of p wave velocity on P80 ................................................................................. 53

5
LIST OF TABLES
Table 1: Estimates for blast parameters based on rules of thumb (Dyno Nobel, 2010) ................ 13
Table 2:Review of existing software tools for stochastic modelling............................................. 28
Table 3: Detailed description of risk ratings (GHD, 2005) ........................................................... 32
Table 4: Hazard and risk register for project with ranked risks, associated consequences and
prevention controls (Lewis, 2016) ................................................................................................. 33
Table 5: Geotechnical properties of Granite test specimen (Lewis, 2016)) .................................. 36
Table 6: Explosive properties of Emulsion A (Lewis, 2016)) ....................................................... 36
Table 7: Stochastic input parameters for material properties ........................................................ 37
Table 8: Stochastic input parameters for explosive properties ...................................................... 39
Table 9: Key outputs of stochastic damage and fragmentation model .......................................... 43

6
1.0 INTRODUCTION
1.1 BACKGROUND
1.1.1 Problem Statement
Drilling and blasting in open pit mines are an important part of the ore extraction process which
affects all of the subsequent downstream processes including, excavation, transportation, crushing
and grinding prior to concentration and shipment. One pressing issue is that currently drilling and
blasting engineers on mine sites do not have time to design and optimize blasting practices and
usually take a simple template-based approach to issue designs describing the location of drill holes
and the amount of explosive to be used. They rarely consider the type of rock being blasted and the
impact of variability in the final result. There is therefore an opportunity to improve upon this
process, instead of continuing with the use of simple rules of thumb and the use of templates.
1.1.2 Project Overview
Optimal prediction of rock mass damage and fragmentation in the blasting industry is becoming a
priority as the mining sector is increasing operational efficiency through automation. Empirical
methods currently exist that can accurately reflect field data in most cases, however these models
do not account for the heterogeneity of the rock mass and may result in undesirable fragmentation
(Strelec, Gazdek, & Mesec, 2011). One such tool developed by Onederra (2016) named the
iDamage model uses these deterministic modelling techniques to estimate a radius of fracture,
given a set of rock mass and explosive properties. This project will build upon these developed
models for damage and fragmentation by applying stochastic techniques in an effort to capture the
impact of variability in the rock mass.

7
1.1.3 Significance and Relevance in Industry
For mine sites located in low-skilled regions of the world, such as South America, formal training
in the technical field of drill and blast engineering is limited. As such, the operational methods
employed largely rely on template-based design which yield inefficient fragmentation for
downstream operations. The effects of this include loss of productivity and an increase in energy
consumption for the secondary and tertiary crushing stages (Ouchterlony, 2003). The stochastic
model developed in this project will form the basis of an expert system that will allow blast design
to be moved off site into remote operations centres anywhere on the globe, where a skilled
technician can implement designs more rapidly and provide additional hours for optimization.
1.2 AIMS AND OBJECTIVES
The primary goals of the project are to:
• link existing blast damage and fragmentation models developed by Onederra (2016);
• incorporate stochastic modelling into the combined damage and fragmentation model; and
to
• evaluate the feasibility of replacing template-driven blast pattern design with a predictive
tool using stochastic modelling.
1.3 PROJECT SCOPE
As outlined above, the aim of this project is to build upon existing blast design methods by
incorporating stochastic modelling, and this will be achieved by developing a software tool in
Microsoft Excel capable of predicting rock fragmentation while accounting for variability. A
Monte Carlo simulation will be produced, which can then be interpreted, and potential future
improvements can be identified.

8
Prior to model development, it will be necessary to establish a core understanding of the underlying
theory of explosive detonation and resulting rock fracture and explosive detonation. This will be
limited to key geotechnical and explosive parameters that pertain primarily to the density and
strength of the materials in question. Other inputs to the model are also considered, including the
geometry of the blasthole and the amount of explosive used. Furthermore, the stochastic approach
to blast design will focus primarily on:
• identification of which parameters contain natural variability;
• statistical techniques in modelling heterogeneous rock materials;
• identifying key output parameters that are targets for on-site engineers to aim for when
determining a blast design pattern;
• comparison with other empirical software packages used in industry; and
• reliability of the model when information on variability is limited.
1.5 THESIS STRUCTURE
The thesis consists of six chapters that consider the approach taken to fulfill the project aims, and
the outcomes of the approach. As seen above, Chapter 1 outlined the problem this project seeks to
solve and provided some initial background to establish context within the mining industry.
Chapter 2 provides the reader with an in-depth understanding of the underlying theory for rock
fracture and the technical parameters that underpin the existing models for damage and
fragmentation, as well a review of the existing software solutions employed in industry. The
chapter aimed to identify the gaps in the design process that are present in order to justify the need
to incorporate stochastic modelling. Chapter 3 specifies the overall methodology used and outlines
any potential risks that need to be mitigated to ensure the project aims were met. Following this,
the subsequent chapters pertain to the execution and results obtained from the project. Chapter 4
describes the development and evaluation of the stochastic model and details the selected model
input parameters and their respective outputs. These results are analyzed, and a sensitivity analysis
is conducted in Chapter 5 to determine the overall model reliability. An indication of suggested

9
future improvements to the model is also provided. Finally, Chapter 6 summarizes the conclusions
drawn from each phase of the project, specifically the review of literature and the developed model,
and notes the contribution this project has made to the overall blast design process.
2.0 LITERATURE REVIEW
Prior to the development and evaluation of a stochastic damage and fragmentation model, it was
first necessary to gain an understanding of the underlying mechanics of rock fracture with specific
reference to the geotechnical and explosive parameters that will underpin said model. As the
developed stochastic model is based on the iDamage Model developed by Onederra (2016), it was
also prudent to evaluate the existing methods that preceded it, as well as evaluating mine planning
software packages that are currently being utilized in industry.
More specifically, a critical review of the literature was conducted, with the specific research
objectives to:
• outline current standards for template-driven blast design;
• identify key input parameters for estimating the extent of damage and fragmentation;
• investigate the underlying theory of rock breakage mechanisms;
• identify and appraise previously developed empirical blast damage models;
• evaluate and critique existing mine planning packages used in industry
• discuss types of models that allow for variability in rock mass characteristics through
stochastic techniques; and to
• investigate the possibility of moving away from template-based blast design and into more
accurate predictive modelling software.
2.1 UNDERLYING THEORY OF ROCK FRACTURE
In the case of open pit blasting, explosive charges are placed in pre-drilled cylindrical holes.
Detonation is initiated for each charge, often in a staggered pattern consisting of 25ms intervals
(Dyno Nobel, 2010). Explosive detonation occurs only if the velocity of detonation is greater than
10
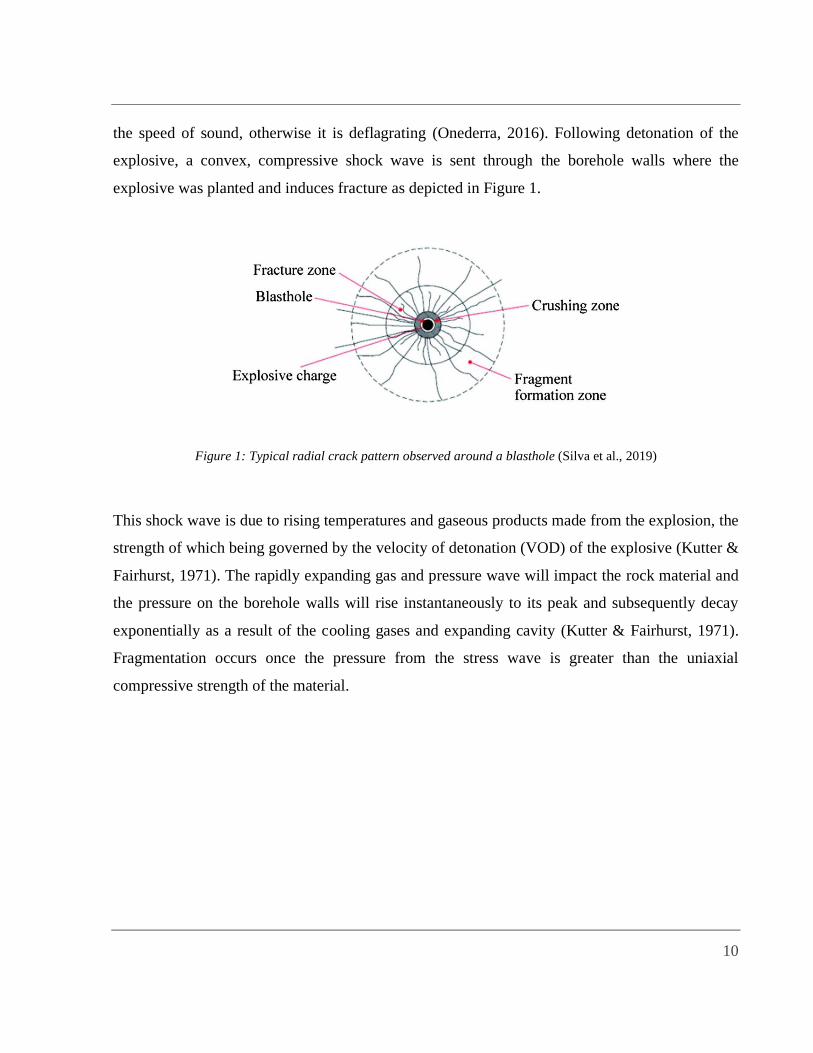
the speed of sound, otherwise it is deflagrating (Onederra, 2016). Following detonation of the
explosive, a convex, compressive shock wave is sent through the borehole walls where the
explosive was planted and induces fracture as depicted in Figure 1.
Figure 1: Typical radial crack pattern observed around a blasthole (Silva et al., 2019)
This shock wave is due to rising temperatures and gaseous products made from the explosion, the
strength of which being governed by the velocity of detonation (VOD) of the explosive (Kutter &
Fairhurst, 1971). The rapidly expanding gas and pressure wave will impact the rock material and
the pressure on the borehole walls will rise instantaneously to its peak and subsequently decay
exponentially as a result of the cooling gases and expanding cavity (Kutter & Fairhurst, 1971).
Fragmentation occurs once the pressure from the stress wave is greater than the uniaxial
compressive strength of the material.

11
Figure 2: Pressure-time graph for ideal and non-ideal detonation (Cunningham, 2006)
The deterioration of the pressure wave can be seen in Figure 2. In the case for ideal detonation
conditions, the entire explosive reacts in the detonation driving zone (DDZ) between the shock
front and sonic CJ (Chapman-Jouguet) plane. The Chapman-Jouguet plane is where the detonation
propagates in a manner where the gaseous products reach sonic velocity at the end of the reaction
(Cooper, 1996). Radial and sub-parallel tension cracks are formed due to the pressure wave and
other tension cracks arise from the pressure of the expanding gas (Torbica & Lapčević, 2018).

12
Figure 3: Vertical section in a bench blasthole showing the pressure wave propagation through the material
(Saharan et al., 2006)
Strain waves propagating through the material will eventually reach the free surface of the rock (or
open discontinuity) and the wave will be reflected, causing an extension of radial fractures from
the cavity to the free surface and may also cause spalling of surficial slabs as seen in Figure 3
(Kutter & Fairhurst, 1971).
It is important to note that the underlying mechanisms for rock fracture are still being debated.
There are many other damage models that are based on other assumptions, as some experts believe
that gas pressurization plays a larger role in fracture, with many others believing that stress wave
propagation is the determining factor.
2.2 TEMPLATE-BASED APPROACH TO BLAST DESIGN
In order to effectively model the rock fracture due to explosive detonation, a large amount of
information needs to be gathered pertaining to the rock mass and explosives used. Once this data
is collated, the extent of damage can be determined and a blast pattern is superimposed onto the
rock mass, as seen below.
13
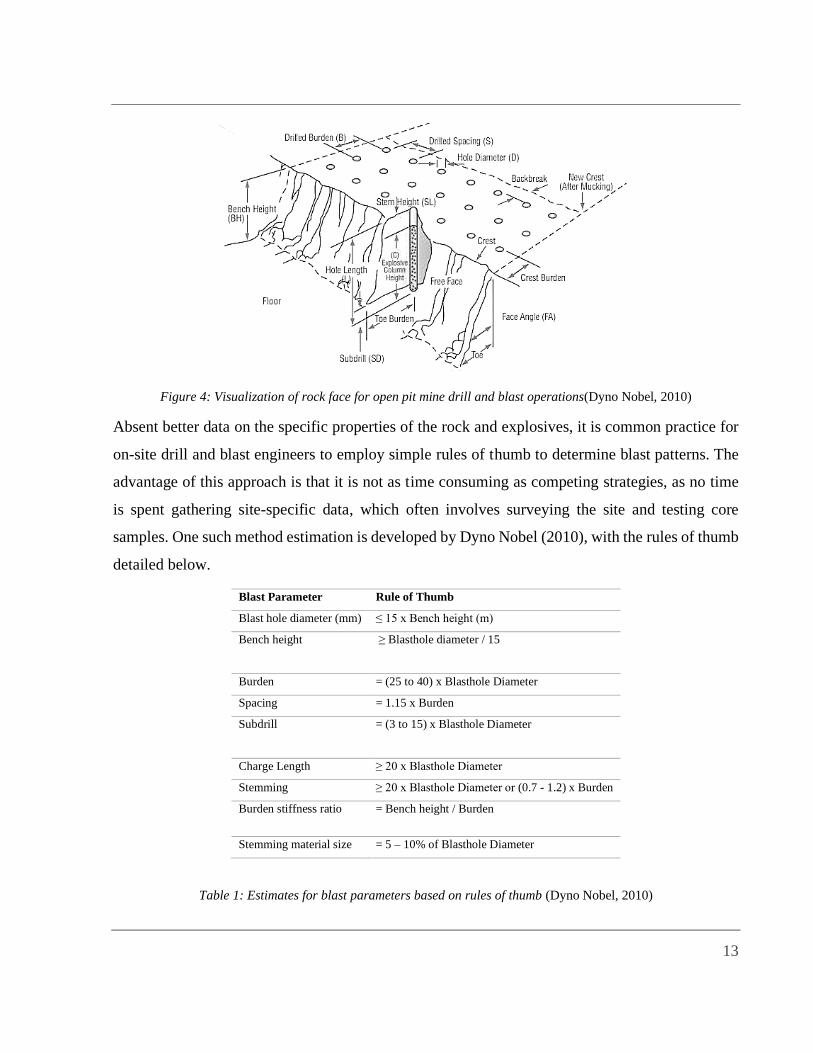
Figure 4: Visualization of rock face for open pit mine drill and blast operations(Dyno Nobel, 2010)
Absent better data on the specific properties of the rock and explosives, it is common practice for
on-site drill and blast engineers to employ simple rules of thumb to determine blast patterns. The
advantage of this approach is that it is not as time consuming as competing strategies, as no time
is spent gathering site-specific data, which often involves surveying the site and testing core
samples. One such method estimation is developed by Dyno Nobel (2010), with the rules of thumb
detailed below.
Blast Parameter Rule of Thumb
Blast hole diameter (mm) ≤ 15 x Bench height (m)
Bench height ≥ Blasthole diameter / 15
Burden = (25 to 40) x Blasthole Diameter
Spacing = 1.15 x Burden
Subdrill = (3 to 15) x Blasthole Diameter
Charge Length ≥ 20 x Blasthole Diameter
Stemming ≥ 20 x Blasthole Diameter or (0.7 - 1.2) x Burden
Burden stiffness ratio = Bench height / Burden
Stemming material size = 5 – 10% of Blasthole Diameter
Table 1: Estimates for blast parameters based on rules of thumb (Dyno Nobel, 2010)

14
These general rules can be effective in producing muck piles that are able to be transported for
downstream operations but are more costly in the long run when compared with more rigorous
methods that more accurately predict the resulting fragment distribution.
2.3 GEOTECHNICAL AND EXPLOSIVE PROPERTIES
The collection of the aforementioned data pertaining to the characteristics of the rock mass require
core samples to be taken and tested under loading conditions to measure key static and dynamic
properties that are used as inputs in the more detailed blast damage models. These properties
include, but are not limited to:
• Uniaxial Compressive Strength (𝜎𝑐)
• Poisson’s Ratio (ν)
• P-Wave Velocity (CP)
• Rock Density (ρ)
Properties of the explosives used in blasting are also required, including the velocity of detonation
(VOD) and density of the explosive. These properties will be discussed in more detail below, with
specific reference to the methods of measurement, reliability of the data and the natural variability
of these properties that is not captured by current empirical estimates.
2.1.1 Uniaxial Compressive Strength
Uniaxial compressive strength (also known as the unconfined compressive strength, or UCS) is
one of the most widely used parameters in describing the strength of a rock mass and is defined as
the maximum axial compressive stress that a material can withstand before failure occurs on a
cylindrical test sample (Mishra & Basu, 2013). This property can be measured directly from a
compression test, but several more efficient indirect methods of determination exist, including the
point load, Schmidt hammer and impact strength tests (Fener et al., 2005). The point load test is a
timely and inexpensive method as it can be performed on site using portable equipment. A rock
sample is loaded and placed under tension until the material fails and a point load index is assigned,
which can be converted into UCS by selecting one of several equations developed through research
15
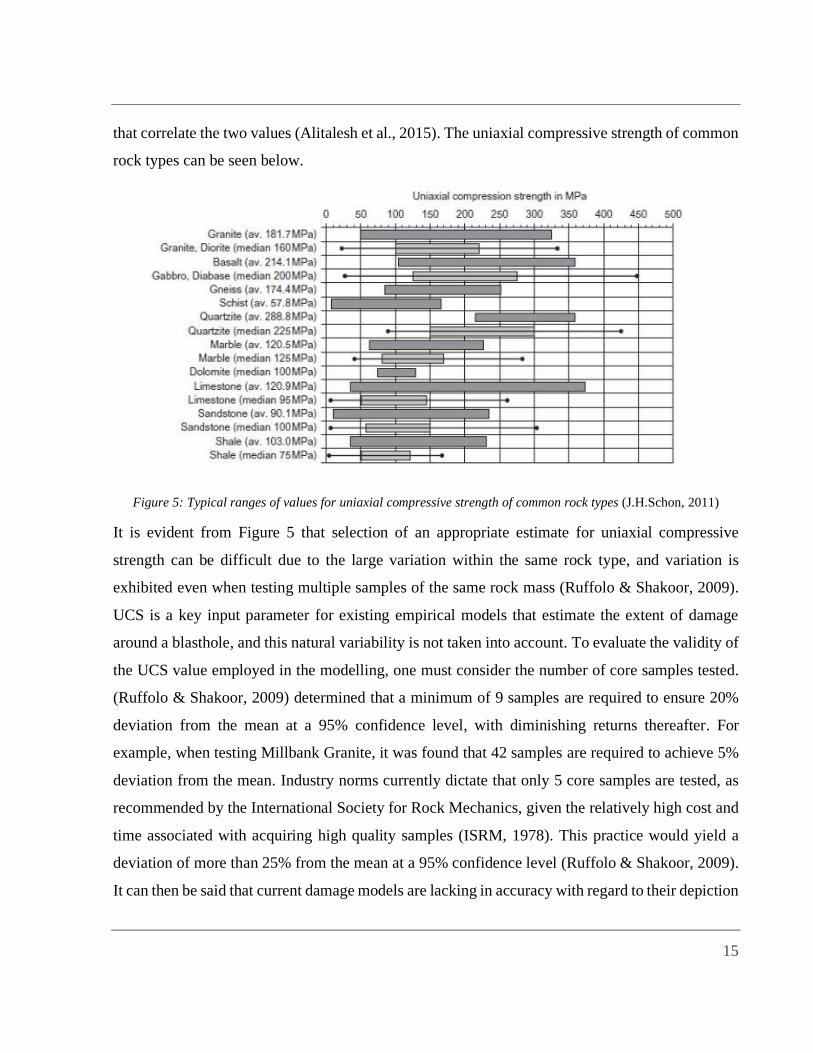
that correlate the two values (Alitalesh et al., 2015). The uniaxial compressive strength of common
rock types can be seen below.
Figure 5: Typical ranges of values for uniaxial compressive strength of common rock types (J.H.Schon, 2011)
It is evident from Figure 5 that selection of an appropriate estimate for uniaxial compressive
strength can be difficult due to the large variation within the same rock type, and variation is
exhibited even when testing multiple samples of the same rock mass (Ruffolo & Shakoor, 2009).
UCS is a key input parameter for existing empirical models that estimate the extent of damage
around a blasthole, and this natural variability is not taken into account. To evaluate the validity of
the UCS value employed in the modelling, one must consider the number of core samples tested.
(Ruffolo & Shakoor, 2009) determined that a minimum of 9 samples are required to ensure 20%
deviation from the mean at a 95% confidence level, with diminishing returns thereafter. For
example, when testing Millbank Granite, it was found that 42 samples are required to achieve 5%
deviation from the mean. Industry norms currently dictate that only 5 core samples are tested, as
recommended by the International Society for Rock Mechanics, given the relatively high cost and
time associated with acquiring high quality samples (ISRM, 1978). This practice would yield a
deviation of more than 25% from the mean at a 95% confidence level (Ruffolo & Shakoor, 2009).
It can then be said that current damage models are lacking in accuracy with regard to their depiction

16
of the strength in the rock, and a stochastic approach is necessary to reflect the true characteristics
of the rock mass.
2.1.2 Poisson’s Ratio
The Poisson’s ratio is another important input parameter used in the empirical blast damage
modelling, as this material property describes the extent of transverse contraction strain resulting
from longitudinal elongation in the direction of the applied force in tension (Lakes, 2019). For
isotropic rocks this value can range from 0 to 0.5, but absent any field data the value is commonly
assumed to be between 0.2 and 0.3 (Gercek, 2007). The motivation for approximating Poisson’s
ratio is due to the fact that directly measuring this value in core samples can be costly and time
consuming (Vásárhelyi, 2009), as discussed in the above section. Materials textbooks contain
literature on expected value ranges for commonly excavated rock types; an example of which can
be seen below.
Figure 6: Typical ranges of values for Poisson's ratio of common rock types (Vásárhelyi, 2009)

17
Laboratory test methods for Poisson’s ratio include measuring the parameter directly using static
methods, or indirectly through dynamic elastic tests, the latter of which being more prone to error
(Gercek, 2007).
Due to the time constraints of the project and potential lack of literature, specific experimental
research on the variability of Poisson’s ratio in rock core samples could not be identified. As such,
for the purposes of fulfilling the project aims in developing a stochastic model, the range of values
depicted in Figure 6 is taken as the natural variability in the rock mass. It is recommended that
future improvements to the model involve further research into the true nature of Poisson’s ratio
for the specific rock type being blasted.
2.1.3 P-Wave Velocity
The compressional wave velocity (or P-wave velocity) is defined as the speed at which the pressure
wave produced from explosive detonation propagates through a rock mass. It is used in blast design
to determine the extent of fracture and is dependent on a number of geotechnical properties such
as the density, uniaxial compressive strength, temperature, anisotropy and porosity of the material
(Fener, 2011). Given these properties are heterogenous in nature, it stands to reason that P-wave
velocity also varies across the rock. This is confirmed by (Fener, 2011) where nine different rock
groups containing six core samples were tested at varying diameters and exhibited variation in the
measured P-wave velocities resulting from differences in the aforementioned properties.
Furthermore, it was found that there is an inverse relationship between core sample diameter and
P-wave velocity (Fener, 2011), which is another source of error for geotechnical engineers to
consider when assigning a value for this parameter for drill and blast activities. The exact variance
is dependent on the type of rock in question and is not captured by existing modelling processes.
2.1.4 Rock Density
Precise measurement of rock density is an important part of mine to mill operations, not only for
drill and blasting activities, but in the estimation of ore tonnage for bulk materials handling. Despite
this fact, the determination of this parameter is often overlooked (Abzalov, 2013). Many operations
still use the ancient water displacement method developed by Archimedes, but several other
methods are also employed as this is not suitable for porous materials. It is common to measure the

18
density as the dry bulk density (DBD) of the rock, which is the mass of the rock absent any moisture
content, per unit of actual in situ volume. Core samples are collected from the mine site and dried
for 24 hours at 110℃ and subsequently cooled to ensure accuracy in the results (Abzalov, 2013)..
However, in industry there is not a consistent approach taken in terms of the quantity and spatial
distribution of these measurements. This can produce conflicting results and so geostatistical
modelling of spatial distributions was developed in the early 1960’s, which involve creating non-
biased 3D models of the ore deposit in question (Tete et al., 2013). These techniques aim to capture
the natural variability of the rock by testing multiple samples, but the final result of the modelling
is still a single value for the dry bulk density of the material. This value, if used in the blast design
model, will not reflect the true heterogeneous nature of the rock mass. An experiment conducted
by (Talhi et al., 2000) on the material properties of limestone found a relative standard deviation
of 0.769% for the density. It is important to note that this is an order of magnitude lower than the
variance in the strength parameters discussed above, but it will still be important to reflect these
findings in the developed stochastic model.
2.1.5 Explosive Velocity of Detonation (VOD)
Velocity of Detonation (VOD) is the main unit of measure for the strength of an explosive and
provides a strong indication of the explosive performance and subsequent fragmentation. It is the
speed at which a detonation wave travels through the material (Kutter & Fairhurst, 1971) and is a
function of the chemical properties of the explosive, as well as the density, homogeneity and size
of the charge (Tete et al., 2013). Accurate measurement of this parameter is key to ensuring that
the most efficient amount of explosive is used in blasting. VOD values can range from 2500m/s to
7000m/s and is dependent on the type and form of the explosive used. Various techniques are
employed by explosive manufacturers to measure the velocity of detonation, including electric and
photographic methods, the majority of which requires skilled operators and equipment that can be
costly (Saharan et al., 2006). Utilizing cost effect methods of VOD measurement can negatively
impact the degree of rock fragmentation predicted by software models including the design tool
this document pertains to. As such, this statement should be considered when evaluating the
efficacy of said model.

19
2.4 EXISTING EMPIRICAL BLAST DAMAGE & FRAGMENTATION MODELS
In an attempt to predict the extent of damage around a single blast-hole, numerous methods of
calculation have been theorized, each with varying degrees of accuracy and their own sets of
assumptions that have been called into question. Upon viewing the totality of research papers
written on the topic, it is evident that there are no less than 18 proposed solutions to this problem
(Sun, 2013). Each system of equations developed aim to take into account the geotechnical
properties of the rock mass and explosives, as well as the geological boundary conditions of the
rock face, each with varying levels of detail. The list of properties under consideration can be seen
below.
Figure 7: Engineering systems for rock blasting (Silva et al., 2019)
It is important to note that many of the commonly utilized damage models do consider all the
properties listed above. Most empirical models ignore the influence of rock characteristics and only
account for explosive properties when modelling the shock waves (Sun, 2013). In order to gain an
understanding into where the iDamage model developed by Onederra (2016) fits in the industry, a
small selection of existing models will be outlined and discussed below.

20
2.3.1 Holmberg-Persson Approach, 1980
This approach, which is based on cylindrical charges, calculates the Peak Particle Velocity, or PPV,
of the explosive shock wave and compares this value with known ranges of PPV damage. To
calculate this parameter however, many assumptions were made that may impact the accuracy of
the model. Firstly, it is assumed that the PPV amplitudes resulting from a small element of charge
can be added without considering the direction the arrival direction, and that the entire charge
detonates instantaneously (Onederra, 2013a). This model is also limited to fully confined single
charge modes and does not take into account effects from free face boundaries of the rock mass
(Lu & Hustrulid, 2003). The model proposes that PPV is proportional to the dynamic strain
experienced by the rock mass after detonation, and results in the following simplified equation:
𝑃𝑃𝑉 =𝐾𝑄𝛼
𝑅𝛽 [1]
Where PPV = Peak Particle Velocity
Q = Explosive Charge
R = Distance from Explosive Charge
And K, α, and β are constants that are determined from seismograph records.
A more detailed equation is the following:
𝑃𝑃𝑉 = 𝐾 [𝑙 ∫𝑑𝑥
[𝑟02+(𝑥−𝑥0)2]
𝛽2𝛼
𝑥𝑠+𝐻
𝑥𝑠]
𝛼
[2]
Where l = linear charge concentration, dx = element of charge contributing to the PPV at point P
and ro, x and xo are geometric parameters.

21
Figure 8: Geometric Parameters for the Holmberg-Persson model
Assuming that B = 2a, equation [2] can be simplified:
𝑃𝑃𝑉 = 𝐾 (𝑙
𝑟0) tan−1 (
𝐻+𝑥𝑠−𝑥𝑜
𝑟𝑜) + tan−1 (
𝑥𝑜−𝑥𝑠
𝑟𝑜) [3]
From this, an approximation for the extent of damage and fracturing can be determined. If the
attenuation constants K is known, then the threshold PPV value can be found.
𝑃𝑃𝑉𝑐𝑟𝑖𝑡 =𝑇𝑉𝑝
𝐸 [4]
Where T = tensile strength of the rock, E = static Young’s modulus and Vp = compressional wave
velocity.
The peak particle velocity for fracture is then determined.
𝑃𝑃𝑉𝑓𝑟𝑎𝑐𝑡𝑢𝑟𝑖𝑛𝑔 = 4 × 𝑃𝑃𝑉𝑐𝑟𝑖𝑡 [5]
Using this value for peak particle velocity, the extent of damage can be estimated, and a blast
pattern can be established as the burden (distance between the rows of blastholes, parallel to the
rock face) is simply a function of damage radius and the free face factor.
𝐵 = 𝑟𝑓(1 + 𝑐) [6]

22
Where rf = radius of fracture and c = free face factor.
Typical rules of thumb can then be employed to determine the spacing (distance between the
blastholes in a row), which is typically 1.15 times the burden. (Onederra, 2013b) argues that this
approach to blast design is cost-effective as PPV thresholds are easily measured, but it should be
noted that limitations of the model may inhibit industry-wide adoption. These limitations are shared
with the Lu and Hustrulid (2003) method and will be discussed below.
2.3.2 Lu and Hustrulid, 2003
Building on the work of Holmberg-Persson, the Lu and Hustrilid model is a modified approach
that is based on the elastic wave theory for cylindrical waves. This method quantifies the stress
wave by providing an estimate for peak particle velocity, which is a combination of the p-wave
and s-wave velocities (Onederra, 2013b). The PPV is related to the detonation pressure and is
described using attenuation constants.
𝑃𝑃𝑉 = 𝑘𝜌𝑒𝐷2
2(𝛾+1)𝜌𝐶𝑝𝑅𝑎 (
𝑎
𝑅)
𝛼
[7]
Where 𝜌𝑒 = explosive density, D = confined velocity of detonation, γ = adiabatic index of
explosive, ρ = rock density, 𝐶𝑝 = P-wave velocity, 𝑅𝑎 = decoupling ratio or air decking volume
ratio, a = radius of cylindrical charge, R = distance from charge and α, k = attenuation constants.
As with the Holmberg-Persson approach, the estimation of peak particle velocity then informs the
blast pattern as previously outlined. Both of these approaches are limited in describing the true
nature of blast damage however, as the PPV thresholds are only applicable in regions close to the
surface and do not accurately predict damage closer to the blasthole (Sun, 2013).
2.3.3 Onederra iDamage Model, 2016
The underlying principles governing the equations used by Onederra (2016) for the iDamage model
developed in Microsoft Excel were built on the approaches taken discussed in the previous section.
This modified approach focuses on pressure attenuation in the near field surrounding the borehole
and plots this decay in stress intensity against the dynamic tensile strength limit of the material.
The intersection of these two curves provides an estimate for the tensile radius of damage. This

23
value can then be used to determine the blast pattern, as it’s directly related to the burden and
spacing of the design.
Figure 9:Radius of fracture based on pressure attenuation and tensile strength limit
𝑃𝑥1= 𝑃𝑒𝑞 (
𝑟𝑥1
𝑟𝑐)
𝜔
[8]
Where Px1 = pressure at a radial distance, Peq = equilibrium pressure at the end of the crushed zone
and ω is the attenuation factor.
The attenuation factor, ω, is approximated by the following equation:
𝜔 = −1.54 (𝐶𝑝
𝑉𝑂𝐷)
−0.1
[9]
Where cp = P-wave velocity and VOD = confined velocity of detonation.
An estimate for equilibrium pressure is given by the following equation:

24
𝑃𝑒𝑞 = 𝑃𝑏 (𝑟𝑐
𝑟𝑜)
𝜙
[10]
Where Pb = borehole pressure, rc = crushing zone radius, ro = charge radius and 𝜙 = pressure decay
factor.
The pressure decay factor is dependent on the P-wave velocity and velocity of detonation, and is
estimated using the following equation:
𝜙 = −1.54 (𝐶𝑝
𝑉𝑂𝐷)
−0.33
[11]
Additionally, the Chapman-Jouguet pressure is determined by the expression:
𝑃𝐶𝐽 =𝜌0𝑉𝑂𝐷2
4 [12]
Where 𝜌0 = explosive density and VOD = velocity of detonation.
The borehole pressure is then simply half the Chapman-Jouguet pressure.
𝑃𝑏 =𝑃𝐶𝐽
2 [13]
Now the borehole pressure is known, the crushing zone index (CZI) can be determined. This value
provides an indication of the crushing potential of a charged blasthole and is used to calculate the
crushing radius (JKTECH, 2019).
𝐶𝑍𝐼 =(𝑃𝑏)3
𝐾×𝜎𝑐2 [14]
Where Pb = borehole pressure, 𝜎𝑐 = uniaxial compressive strength (UCS) and K = rock stiffness
dynamic young’s modulus, which is defined as:
𝐾 =𝐸𝑑
1+𝜐 [15]
Where Ed = dynamic Young’s modulus and ν = Poisson’s ratio.
The crushing radius can now be determined.
𝑟𝑐 = 0.812𝑟0(𝐶𝑍𝐼)0.219 [16]
25
When comparing the three models discussed above, the simplified pressure attenuation model is a
more balanced approach as it is moderately sensitive to both the properties of the rock and
explosive (Onederra, 2013b). This is contrasted with the Holmberg-Persson method, which does
not consider the velocity of detonation or density of the explosive in the determination of damage
extent, and the Lu-Hustrulid method, which is more sensitive to the explosive parameters. For this
reason, it is more appropriate to utilize the simplified pressure attenuation method, or iDamage
model, to calculate the burden and spacing of the design to be used as inputs in the existing
fragmentation model to approximate the fragmentation pattern, as the existing fragmentation model
currently assumes a blast pattern absent any method of determination. These linked models will
form the basis of the stochastic model.
2.5 DRILL AND BLAST DESIGN SOFTWARE SOLUTIONS
Several mine planning packages currently exist which can provide blast design patterns given
certain input parameters such as burden and spacing. Blast engineers located on site or at remote
operations centres use these software packages to predict, measure and analyze blast performance.
However, the predictive reliability of such models is undermined by their lack of consideration for
geotechnical properties of the rock mass, including the heterogeneity nature of these parameters.
For example, JKSim blast is a popular package, where the engineer can define the site-specific
parameters, the explosives being used, the operating conditions and objectives, and then be
provided with a drill and blast design using deterministic methods. Deswik is another one of these
tools that have offer tools specific to open pit blasting.
2.5.1 Deswik OPDB Client
Deswik is a global technology and consulting company that offers a range of software design tools
that pertain to both open-pit and underground mining operations. One of these tools is the ODPB
(Open Pit Drill & Blast) client, which allows the user to construct drill patterns from a number of
templates for varying design parameters including fixed/variable collar or toe spacing, angle
charges and variable toe horizons (Deswik, 2020). The drill hole pattern can be developed through
manual input or automated using proprietary algorithms. There is little information publicly

26
available pertaining to the underlying mechanisms that these algorithms are based on. The methods
used do take into account the geological structures in question and can be updated based on survey
changes and location constraints (Deswik, 2020).
2.5.2 JKSimBlast
JkSimBlast is a general-purpose software system developed by JKTech, a technology transfer
company that is wholly owned subsidiary of the University of Queensland. The software allows a
user to predict, measure and analyze blast performance based on the geometry of the blasting site,
explosives, operating conditions and objectives (JKTECH, 2019). It is capable of importing related
data from other applications and storing the design plans and subsequent results for easy access at
a later date. JKSimBlast also contains simulation tools that can be used for design optimization and
integrates all of these tasks in a single user interface (Kostić et al., 2013).
JKSimBlast is capable of predicting the extent of fragmentation as well, but again these estimation
tools are still deterministic in nature with no element of variability built into the input parameters
for properties such as the rock density, UCS, or velocity of detonation.
2.6 STOCHASTIC APPROACH TO DRILL & BLAST DESIGN
Each model for damage and fragmentation discussed thus far uses deterministic methods in
estimating the extent of damage around a blasthole and subsequent pattern of fracture. However,
(Rangavajhala et al., 2012) demonstrated that the underlying pressure attenuation equations
governing extent of damage due to blasting cannot be accurately predicted by empirical means.
Rather, the ground vibrations produced when blasting are in fact stochastic in nature and as such
can only be modelled using linear stochastic processes with Gaussian inputs. This finding is not
surprising given the natural variability in the rock characteristics detailed in Chapter 2.3.
Traditional deterministic models receive single values for various input parameters pertaining to
rock and explosive properties and propagate these through an objective function to achieve a single
output. In contrast, a stochastic model defines input variables in terms of probability distributions
and outputs values in the form of a probability density function.

27
Figure 10: Stochastic model flowchart (Vidhya, 2017)
The type and shape of distribution employed for each input parameter is dependent on experimental
data. Commonly utilized distributions include:
• Normal/Gaussian Distribution
• Exponential Distribution
• Log-Normal Distribution
• Uniform Distribution
• Bernoulli Distribution
(Kostić et al., 2013)
Given the inherent heterogeneity of rock characteristics, as well as the uncertainty in measuring
explosive properties such as velocity of detonation, development of a probabilistic framework in
modelling blast design is a sound proposal (Lewis, 2016). One example of a stochastic model is a
Monte Carlo simulation, which uses random sampling to produce probability histograms for
selected output variables. It is common for these types of simulations to involve sample sizes in
the thousands, and as such cannot be completed without the aid of computer software. A model

28
such as this also provides a platform for design optimization and sensitivity analysis. In
determining the most suitable software tool to utilize for this project several applications were
evaluated.
Software Package Vendor Advantages Disadvantages
@Risk Palisade • Vast array of help tutorials
and training available online
• Simple macro functionality
• Integration with Microsoft
Excel in form of add-in
• No free version and
student licenses are
expensive
RStudio R Core Team • Extremely versatile through
use of software code rather
than simple macro functions
• No free version
• High learning curve,
requiring
understanding of
coding language
ModelRisk Vose Software • Free version available,
containing all required
functionality
• Integration with Microsoft
Excel in form of add-in
• Advanced features
locked behind
paywall
• Little help tutorials
or free training
available online
Table 2:Review of existing software tools for stochastic modelling
Research was conducted into prior cases where stochastic modelling techniques have been
incorporated into established empirical methods, with one such case developed by (Morin &
Ficarazzo, 2006) utilizing a Monte Carlo-based simulation program that predicts fragmentation
using the Kuz-Ram method. This model produced promising results by accurately simulating the
percent passing fraction, confirmed through demonstrated similarity to field data. However, if the
desired outcome is to produce a software tool which streamlines the blast pattern design process
by linking damage and fragmentation, further development would be required. A limitation of the
29
Monte Carlo simulation method is its reliance on an extensive amount of field data required to
predict fragmentation (Morin & Ficarazzo, 2006). A more refined model would limit the amount
of field data required by pre-programming the model to recognize known variability in the rock
face by incorporating more global variables about the block pertaining to structure which influence
fragmentation.
2.6 REVIEW SUMMARY
After reviewing the relevant aspects of blast design outlined at the beginning of the chapter, it is
evident that more work is required with respect to accurately describing the geotechnical and
explosives properties that inform the extent of rock fracture. Beyond this, a number of gaps have
been identified:
• Established methods of determining extent of damage do not take into account variability
in the geotechnical and explosive parameters and are simplistic and empirical in nature
• These damage models are not linked to fragmentation methods that predict resulting particle
sizes
• Existing software packages lack consideration of specific properties of the rock mass in
question, and simply provide a pattern based on the user-provided burden and spacing, site
geometry and operating conditions
These flaws in the blast design process can be improved by incorporating stochastic modelling into
the framework, and it has been shown that this method is proven but the cases where it has been
utilized is limited.
3.0 PROJECT METHODOLOGY
3.1 OVERVIEW OF APPROACH TAKEN
At present, the project goals have been identified with clear milestones outlined. A Gantt chart was
produced to provide a schedule for key milestones, as the project was broken into six phases (refer
to Appendix A) The project began by looking into the underlying theory of rock breakage to find
out how an explosive break a rock and began describing the prediction of damage around a blast
30
hole. Following this, many existing empirical software tools available online that are currently
utilized in industry were researched and evaluated. The iDamage model developed by Onederra
(2016) was merged with the fragmentation model with respect to referencing of variables, as
previously these were standalone tools. Research was then conducted on various stochastic
modelling applications that offered Monte Carlo analysis and a ModelRisk by Vose Software was
selected. This was installed as a Microsoft Excel add-in and incorporated stochastic elements into
the deterministic model. Variability for each input parameter was researched and assigned to the
input parameters using normal distributions. For further detail on model development, refer to
Chapter 4. The stochastic model was then tested using inputs for Granite and Emulsion A explosive
provided by Lewis (2016) and evaluated by examining the tornado plots in the ModelRisk
simulation window. The model was further validated by conducting a sensitivity analysis, where
the volatility of key outputs was tested by varying the assigned standard deviation the most
sensitive input parameters. This process is discussed further in Chapter 5.
3.2 RISK MANAGEMENT PLAN
As outlined in the interim report (O’Connor, 2019), in order to ensure the project was completed
successfully within the time constraints it was imperative that all relevant risks and their associated
consequences were identified, and prevention controls be established. It is industry standard best
practices to conduct a HAZID study before commencing a project, and the method used below is
utilized by companies such as (GHD, 2005). Below is a Risk Ranking Matrix that forms part of
said HAZID study.

31
Risk Ranking Matrix Likelihood
Impact Low Moderate High
General Rare Unlikely Moderate Likely Almost
Certain
A B C D E
Catastrophic 5 5 10 15 20 25
Major 4 4 8 12 16 20
Moderate 3 3 6 9 12 15
Minor 2 2 4 6 8 10
Insignificant 1 1 2 3 4 5
Table 1: Standard Risk Ranking Matrix for thesis project (GHD, 2005)
The matrix above ranks the risk of a hazard based on its likelihood to occur and the significance of
impact if it occurred, providing the activity with a score of 1 to 25. A detailed description of these
scores can be seen below.
Risk Rating
15-25
High
Unacceptable Risk
Unacceptable – Report to Leadership Team and Board.
Leadership Team sign-off needed to accept risk. Risk must
be reduced as a priority, with close monitoring and regular
review.
10-14
Significant
Tolerable Risk
ALARP Band 1 – Report to Leadership Team. Senior
management attention and sign off needed. Reduce risk as
a priority, closely monitor and regular review. Documented
ALARP demonstration required.
4-9
Medium
ALARP Band 2 – Management responsibility must be
specified. Reduce risk where possible, monitor and review.
Risks with catastrophic consequences (5) in this band
should be reported to Leadership Team.
1-3
Low
Broadly
Acceptable
Generally Acceptable - Manage by routine procedure.

32
Table 3: Detailed description of risk ratings (GHD, 2005)
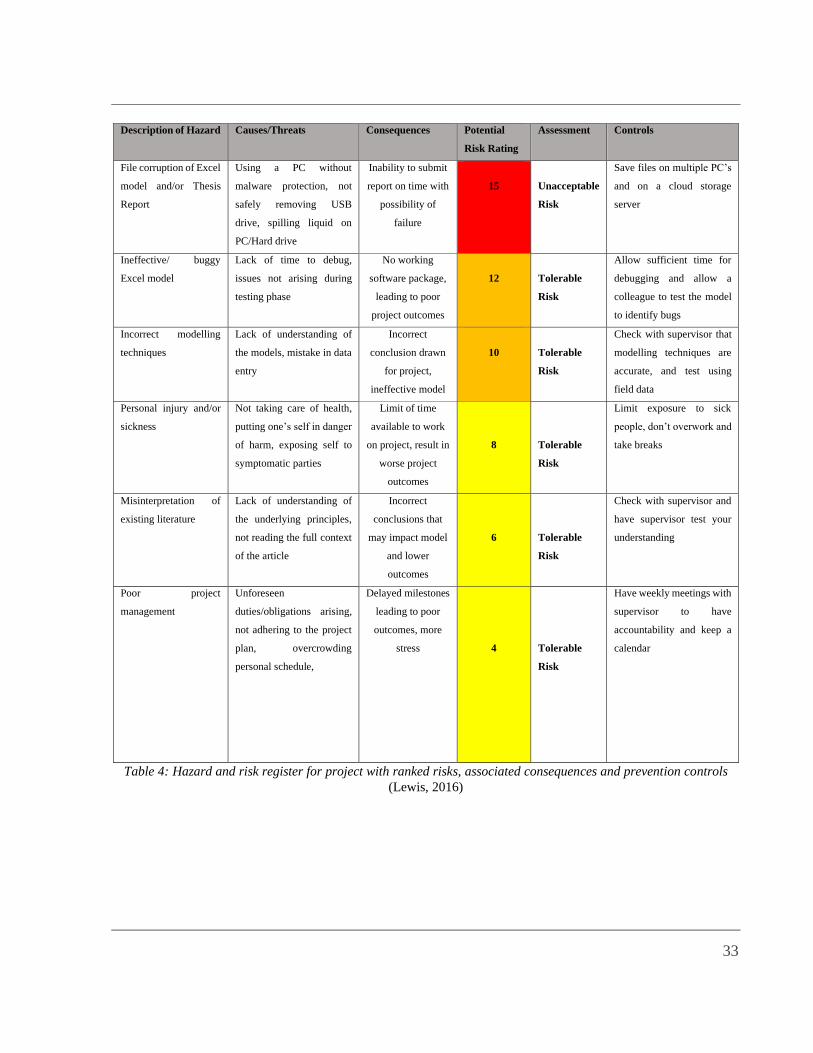
Using these qualitative metrics, the hazards associated with the research project can now be
identified and evaluated. The most notable risks are ones associated with project failure such as
data loss or ineffective modelling. A full list of these hazards and suggested control measures to
prevent these risks are outlined on the following page.
33
Description of Hazard Causes/Threats Consequences Potential
Risk Rating
Assessment Controls
File corruption of Excel
model and/or Thesis
Report
Using a PC without
malware protection, not
safely removing USB
drive, spilling liquid on
PC/Hard drive
Inability to submit
report on time with
possibility of
failure
15
Unacceptable
Risk
Save files on multiple PC’s
and on a cloud storage
server
Ineffective/ buggy
Excel model
Lack of time to debug,
issues not arising during
testing phase
No working
software package,
leading to poor
project outcomes
12
Tolerable
Risk
Allow sufficient time for
debugging and allow a
colleague to test the model
to identify bugs
Incorrect modelling
techniques
Lack of understanding of
the models, mistake in data
entry
Incorrect
conclusion drawn
for project,
ineffective model
10
Tolerable
Risk
Check with supervisor that
modelling techniques are
accurate, and test using
field data
Personal injury and/or
sickness
Not taking care of health,
putting one’s self in danger
of harm, exposing self to
symptomatic parties
Limit of time
available to work
on project, result in
worse project
outcomes
8
Tolerable
Risk
Limit exposure to sick
people, don’t overwork and
take breaks
Misinterpretation of
existing literature
Lack of understanding of
the underlying principles,
not reading the full context
of the article
Incorrect
conclusions that
may impact model
and lower
outcomes
6
Tolerable
Risk
Check with supervisor and
have supervisor test your
understanding
Poor project
management
Unforeseen
duties/obligations arising,
not adhering to the project
plan, overcrowding
personal schedule,
Delayed milestones
leading to poor
outcomes, more
stress
4
Tolerable
Risk
Have weekly meetings with
supervisor to have
accountability and keep a
calendar
Table 4: Hazard and risk register for project with ranked risks, associated consequences and prevention controls
(Lewis, 2016)

34
4.0 DEVELOPMENT & EVALUATION OF DAMAGE &
FRAGMENTATION MODEL
As outlined in the Literature Review, the model developed by Onederra (2016) is based upon the
pressure attenuation function and tensile strength limit criteria. Several steps were taken to achieve
the aim of developing a comprehensive model in Microsoft Excel that can be used to both estimate
the extent of damage around a single fully confined blast hole and predict the corresponding level
of fragmentation. Initially, it was critical to develop an understanding of the underlying
mechanisms for rock breakage pertaining to the empirical framework developed by Onederra
(2016). This provided a strong foundation to be able to comprehend and modify the existing
models. Upon completing the initial research phase, the algorithms were critically reviewed, and
minor changes were applied that pertained to circular referencing errors being raised by Microsoft
Excel. Once the two models were deemed acceptable and independently provided expected results
for the key output parameters, the existing models for damage and fragmentation were linked
together to form a single model. This involved identifying which outputs from the damage model
were relevant in determining the level of fragmentation, which included design parameters such as
the burden and spacing. As discussed in the Chapter 3, currently the best practice in industry is to
simply apply the burden and spacing recommended in the feasibility study for the open pit mine in
question, without applying rigorous methods in determining the extent of damage that informs the
burden/spacing. The purpose of linking the two models was to rectify this common source of error.
The linked model was then tested again, and the expected results were achieved, albeit from an
empirical perspective.
It was then necessary to incorporate stochastic modelling into the algorithm. This was the second
research phase, which involved gaining an understanding of the Monte Carlo simulation method
and various software programs that could be integrated into the existing model. Three software
tools were identified, as outlined in Chapter 3, and ModelRisk by Vose Software was selected as a
no cost option that proved to be capable of achieving the project aims. This Excel add-in had a

35
reasonable learning curve and contained functions that could be used to model the input parameters
as various distributions and provided the tools for sensitivity analysis.
Additional improvements to formatting was also made, with a consistent colour scheme and layout
throughout the model. Each sheet was designed to be print-friendly allowing the end user to print
the results and present to clients. To further assist with client engagement, separate sheets were
developed to consolidate key output parameters as discussed. A sheet dedicated to inputs was also
added, so the end user is only required to input data on this sheet and the subsequent modelling
process on all other tabs is completed without any further action.
4.1 MODEL INPUTS
Utilizing the knowledge gained from the initial research phase into rock mechanics, input
parameters that had natural variability were identified and normal distributions were applied with
variances and minimum/maximum bounds that were assumed from existing papers on the topic
(see Chapter 2.3). Due to time constraints, there were cases where the research phase could not
provide assumptions for variances pertaining to inputs and best approximations were utilized. The
Excel formulas for these input parameters were then modified using the built in functions provided
by the ModelRisk add-in by, specifically the VoseInput() and VoseNormal() functions.
The variance and minimum/maximum bounds selected for each input was researched, as a lot of
these inputs will be driven by some understanding of the deposit itself. For example, the range of
material density should reflect the natural variability in the rock. If the ore deposit in question were
sedimentary then the density may fall below 2.1 g/cc. In this case the test specimen was Granite,
which is an igneous rock and so the minimum bound was set to 2.5g/cc. Refer to Chapter 2 for
further justifications of selected input variance.
However, it is worth noting that this is just a framework that allows the user to test the capability
of the model. Quantification of accurate values for variability fall outside of the scope of this
project, as decisions such as these are largely driven by experts in the field of geology and

36
explosives or geology. Input variances were selected based on outstanding literature, but only to
test the overall capability and versatility of the model.
Following this, a test simulation was run tested using the rock characteristics of Granite and
Emulsion A explosive data provided by (Lewis, 2016).
Name Type UCS E Density Poisson’s
Ratio, ν
P-Wave
Velocity
MPa GPa t/m3 - m/s
Granite Hard 160 50 2.75 0.2 6000
Table 5: Geotechnical properties of Granite test specimen (Lewis, 2016))
Type VOD Density
m/s t/m3
Emulsion A 5500 1.22
Table 6: Explosive properties of Emulsion A (Lewis, 2016))
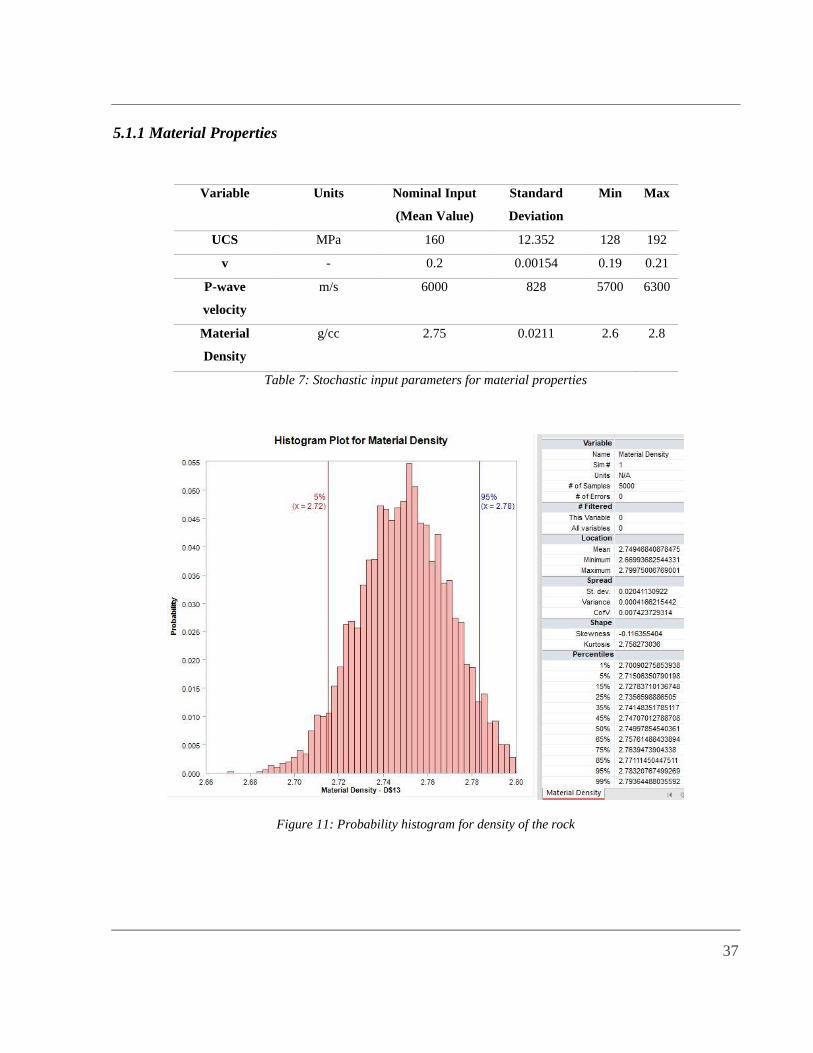
The model was run using 5000 samples, as initial testing determined that fewer samples produced
inconsistent results. To run a simulation, the user simply needs to locate the ModelRisk tab on the
Menu Ribbon and click start. The simulation will commence, and a dialog box automatically opens
with the outputs and inputs presented as probability histograms, along with key statistical data. The
stochastic inputs and results of the test simulation can be seen below.
37
5.1.1 Material Properties
Variable Units Nominal Input
(Mean Value)
Standard
Deviation
Min Max
UCS MPa 160 12.352 128 192
v - 0.2 0.00154 0.19 0.21
P-wave
velocity
m/s 6000 828 5700 6300
Material
Density
g/cc 2.75 0.0211 2.6 2.8
Table 7: Stochastic input parameters for material properties
Figure 11: Probability histogram for density of the rock

38
Figure 12: Probability histogram for p-wave velocity
Figure 13: Probability histogram for uniaxial compressive strength

39
Figure 14: Probability histogram for Poisson’s ratio
5.1.2 Explosive Properties
Variable Units Mean Value Standard
Deviation
Min Max
Explosive VOD m/s 5500 138.7 5225 5775
Explosive density kg/m3 1220 9.382 1100 1300
Table 8: Stochastic input parameters for explosive properties
40
Figure 15: Probability histogram for explosive density
Figure 16: Probability histogram for explosive velocity of detonation

41
Figure 17: Probability histogram for explosive weight per blasthole
5.1.3 Blasthole Geometry
Variable Units Nominal Input (Mean
Value)
Standard
Deviation
Min Max
Blasthole
diameter
mm 270 2.320 256.5 283.5
Column W kg 400 0.8 380 420
Length m 5.82 0.317 5.529 6.111
Figure 18: Stochastic input parameters for blasthole geometry

42
Figure 19: Probability histogram for charge length
Figure 20: Probability histogram for blasthole diameter
43
4.2 MODEL OUTPUTS
Key output parameters were then identified that were deemed essential in describing the extent of
damage and corresponding fragmentation. The selected parameters that were selected are ones that
the drill and blast engineer would basing his/her design, such as the radius of damage (as its related
to the burden and spacing) the ‘P80’ value (x80) which is the particle size that 80% of fragments
are less than. For the purposes of optimization in the future the total cost of explosives was also
identified as a key output parameter. It was also necessary to modify the formulas for these output
parameters using the VoseOutput() and VoseNormal() functions, so that probability density
functions were produced as part of the Monte Carlo simulation.
Output Variable Mean Relative Standard
Deviation
Min (95%
Confidence)
Max (95%
Confidence)
Damage Radius (m) 5.45 3.92% 5.09 5.80
P80 (mm) 784.6 4.38% 728.7 840.1
Explosive Costs per
Blasthole ($)
201.6 3.71% 189.7 214.9
Table 9: Key outputs of stochastic damage and fragmentation model
It is important to note that this is just one set of outputs and hundreds of different scenarios could
be conducted with the model. Confidence intervals of 95% were placed on these outputs in order
to produce a more accurate estimation of damage and fragmentation. The fragmentation output will
inform the engineer if he is using enough explosive for the job, so it stands to reason that a more
accurate P80 value will lead to less cases where too much explosive was used for the job. More
conservative explosive use leads to a reduction in explosive costs. Furthermore, more efficient
fragmentation would increase throughput downstream, increasing revenue for the mine. Also, a
more accurate measure of damage radius may lead to fewer holes needing to be drilled which could
bring down drilling costs. It is worth noting that this model is still relatively theoretical. There are
constraints in the real world that this model is not capable of considering. For example, you cannot

44
place two explosives too close together as the holes will dislocate. Moreover, the holes cannot be
too far separated as well, as the stress waves and gases need to work together in order for the rock
to fracture.
4.2.1 Damage Model Outputs
Figure 21: Probability histogram for stochastic damage radius
45
4.2.2 Fragmentation Model Outputs
Figure 22: Probability histogram for P80 percent passing fraction
Figure 23: Probability histogram for explosives cost per blasthole

46
4.3 MODEL EVALUATION
An initial check of the model outputs was observed, and several adjustments to the model was
made. Upon viewing the tornado plots for the output parameter, it was evident that the model was
not reflecting the true priority order of input sensitivity as illustrated in the previously discussed
literature. Initially, the outputs were heavily dependent on material density, which is erroneous in
practice, as the strength parameters should have greater variability and thus a greater impact on the
variability of the output. Further research was conducted and the standard deviations for the UCS
and density were modified. Subsequent testing was conducted, and additional variability was added
for the borehole geometry parameters, to reflect the inherent inconsistency in borehole length and
diameter caused when the borehole wall material caves in.
5.0 SENSITIVITY ANALYSIS OF DAMAGE &
FRAGMENTATION MODEL
In order to evaluate the combined stochastic damage and fragmentation model, it is first necessary
to conduct a sensitivity analysis of the key outputs of the model, namely the damage radius, P80
percent passing fraction and the cost of explosives. This analysis will establish the impact that each
base input parameter will yield over the output of the model, which will allow for the identification
of any parameters that may be disproportionally weighted in the determination of fracture radius.
47
5.1 SENSITIVITY ANALYSIS
Figure 24: Tornado plot of conditional mean for damage radius
Figure 25: Tornado plot of contribution to variance for damage radius

48
Above are tornado plots illustrating the sensitivity the radius of fracture is to each of its variable
inputs. The two figures present a rank order of priority of variables that is required to be accurately
modelled in order to ensure model validity. It was predicted from the literature that the strength
parameters would have the greatest impact on the damage envelopes produced from the model and
this is reflected in the results. Evidenced by Figure 26, which depicts the sensitivity of the mean
value for radius of fracture, the uniaxial compressive strength of the rock is most sensitive,
followed by the P-wave velocity. This is expected as the underlying objective function is heavily
governed by these parameters and as such provides validation of the efficacy of the developed
model. Furthermore, it is worth noting that these findings highlight a potential issue in modelling
extent of damage around a blasthole, given that these input parameters are often more difficult to
quantify and require experimentation on a number of core samples to measure. These core samples
can be expensive to procure and the results of these experimentation are prone to error. Following
these inputs for rock characteristics, the damage radius is also relatively sensitive to the explosive
velocity of detonation, although to a lesser extent. As outlined in the literature review, explosive
VOD can also be difficult to quantify and is directly proportional to the explosive pressure that
induces radial tension cracks in the rock, and the tornado plot confirms that the model reflects these
qualities.
Upon examination of the contribution to variance plot it is evident that the rock characteristics are
principally responsible for the magnitude of damage envelopes produced. Somewhat unexpectedly,
the distribution inputs selected for P-wave velocity yielded an increase in overall variance for the
radius of fracture, with the uniaxial compressive strength yielding a decrease. Further examination
of the model may be required to explain this outcome. In both plots it can be seen that inputs such
as the material and explosive density is low in priority order for the sensitivity of damage radius.
This was also expected as the material density is relatively more homogeneous than the strength
parameters of the rock, and this outcome proves further validity of the model. If this was not the
case, then further attention would be required for the assigned standard deviation of these stochastic
inputs.

49
Figure 26: Tornado plot of conditional mean for P80
Figure 27: Tornado Plot of contribution to variance for P80
50
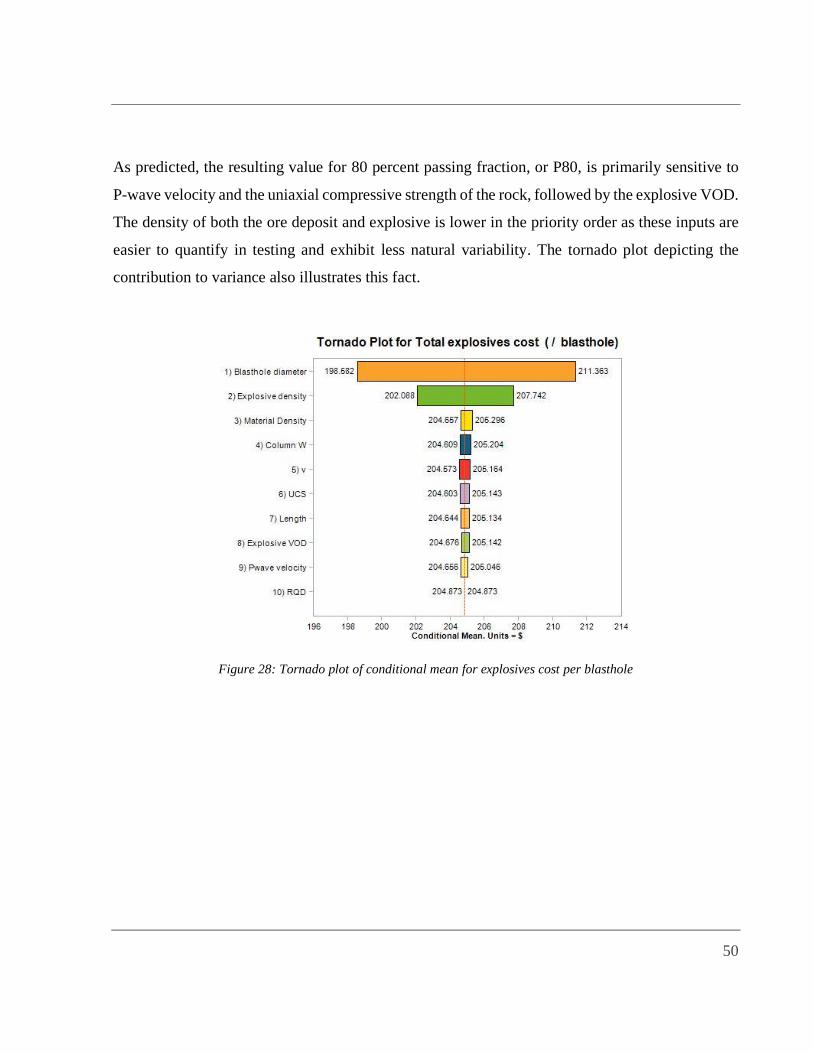
As predicted, the resulting value for 80 percent passing fraction, or P80, is primarily sensitive to
P-wave velocity and the uniaxial compressive strength of the rock, followed by the explosive VOD.
The density of both the ore deposit and explosive is lower in the priority order as these inputs are
easier to quantify in testing and exhibit less natural variability. The tornado plot depicting the
contribution to variance also illustrates this fact.
Figure 28: Tornado plot of conditional mean for explosives cost per blasthole

51
Figure 29: Tornado plot of contribution to variance for explosive cost per blasthole
As illustrated above, the total cost of explosive for each blasthole is sensitive primarily to the
blasthole diameter and the density of the explosive. This finding is somewhat surprising, as it would
be expected that the length of the borehole and weight of the charge (Column W parameter) would
also impact the output value. It may be the case that the model requires further scrutiny in its
modelling process to more accurately reflect this.
5.2 MODEL RELIABILITY
It was stated in Chapter 4 that the input variances for the test case were selected based on the
relevant literature research for each geotechnical and explosive property, but that these stochastic
assumptions should be largely expert-driven and require field test for the respective ore deposit to
determine the exact nature of these distributions. As a result, it cannot be definitively stated then
that this model is appropriate for all rock faces without input from on-site engineers with in-depth
knowledge of the rock face. However, the veracity of the model can be determined in cases when

52
the exact nature of the input parameters is not known. To quantify this, tests were conducted where
a number of input variances were simulated for the primary driving factors of sensitivity, namely
uniaxial compressive strength and P-wave velocity. Using these tests, the model can be deemed
reliable even if the selected properties of the test case were invalid.
Figure 30: Effect of UCS on damage radius
y = 0.0143ln(x) + 0.11R² = 0.96
0.00%
2.00%
4.00%
6.00%
8.00%
10.00%
12.00%
0.00% 5.00% 10.00% 15.00% 20.00% 25.00% 30.00% 35.00% 40.00% 45.00%
Rel
ativ
e St
and
ard
Dev
iati
on
Dam
age
Rad
ius
Relative Standard Deviation UCS
Effect of UCS on Damage Radius

53
Figure 31: Effect of p wave velocity on P80
These figures demonstrate that there is a logarithmic relationship between the relative standard
deviation of the output parameters with the relative standard deviation of the primary input
parameter. Therefore, in cases where the input variance is relatively high (greater than 30%), errors
in approximating the true nature of variability for the inputs will have marginal impact on the
reliability of the model. In cases where the input variance is low, the converse is true. This is an
important finding, as the relative standard deviation of the rock and explosive properties are
typically between 1 – 10%. It is therefore imperative that the appropriate stochastic parameters are
employed by the end user and these decisions should largely be expert-driven. Geotechnical best
practices dictate that a minimum of five core samples are tested when determining the
characteristics of the ore deposit. It is suggested that a greater number of samples be tested when
utilizing this model, but this can be difficult as previously discussed.
y = 0.0271ln(x) + 0.1623R² = 0.945
0.00%
2.00%
4.00%
6.00%
8.00%
10.00%
12.00%
14.00%
16.00%
0.00% 5.00% 10.00% 15.00% 20.00% 25.00% 30.00% 35.00% 40.00% 45.00%
Rel
ativ
e St
and
ard
Dev
iati
on
P80
Relative Standard Deviation P-Wave Velocity
Effect of P-Wave Velocity on P80

54
6.0 CONCLUSIONS AND RECOMMENDATIONS
In summary, the project aims have been fulfilled by demonstrating that it is possible to incorporate
stochastic modelling into the blast design process for open pit mine operations. review of the
relevant literature revealed that more work was required with respect to accurately describing the
geotechnical and explosive parameters with respect to the heterogenous nature of these properties.
Established models were reviewed, and it was concluded that these models are not sufficient for
this reason. Existing mine planning packages utilized in industry were also too simplistic in their
means of producing a blast design pattern, thus the need for a stochastic approach to modelling
damage was justified. A model was developed and evaluated using Microsoft Excel and ModelRisk
and a sensitivity analysis determined that the model was primarily sensitive to strength parameters
of the rock mass. The reliability of the model was verified by adjusting the variance input of the
primary drivers of sensitivity and it was concluded that careful consideration of these inputs should
be taken and should largely be expert-driven. It is recommended that the model undergo further
testing with actual field data to verify the model accuracy. Following this, it is recommended that
further work be conducted where this methodology is taken and implemented in a proprietary
software tool using a coding language such as C++. The development of such a tool could be used
in industry and outsource on-site drill and blast design activities to remote operations centres. This
would allow lower socioeconomic regions to receive consultation on drill and blast design from
experts located in urban areas and would also free up on-site engineers to then be able to spend
more time and resources on additional optimization.

55
7.0 REFERENCES
Abzalov, M. Z. (2013). Measuring and modelling of dry bulk rock density for mineral resource
estimation. Applied Earth Science, 122:1, 16–29.
Alitalesh, M., Mollaali, M., & Yazdani, M. (2015). Correlation between uniaxial strength and point
load index of rocks. 15th Asian Regional Conference on Soil Mechanics and Geotechnical
Engineering, ARC 2015: New Innovations and Sustainability, 504–507.
https://doi.org/10.3208/jgssp.IRN-08
Cooper, P. (1996). Explosives Engineering. Wiley-VCH.
Cunningham, C. (2006). Blasthole Pressure: What it really means and how we should use it.
Proceedings of the Annual Conference on Explosives and Blasting Technique, 255.
Deswik. (2020). Deswik.OPDB Open Pit Drill and Blast. Deswik.
Dyno Nobel. (2010). Blasting and Explosives Quick Reference Guide 2010.
Fener, M. (2011). The effect of rock sample dimension on the P-wave velocity. Journal of
Nondestructive Evaluation, 30(2), 99–105. https://doi.org/10.1007/s10921-011-0095-7
Fener, M., Kahraman, S., Bilgil, A., & Gunaydin, O. (2005). A comparative evaluation of indirect
methods to estimate the compressive strength of rocks. Rock Mechanics and Rock
Engineering, 38(4), 329–343. https://doi.org/10.1007/s00603-005-0061-8
Gercek, H. (2007). Poisson’s ratio values for rocks. In International Journal of Rock Mechanics
and Mining Sciences (Vol. 44, Issue 1, pp. 1–13). Pergamon.
https://doi.org/10.1016/j.ijrmms.2006.04.011
GHD. (2005). Queensland Coke and Power Plant Project.
ISRM. (1978). INTERNATIONAL SOCIETY FOR ROCK MECHANICS COMMISSION ON
STANDARDIZATION OF LABORATORY AND FIELD TESTS. In Int. J. Rock Mech. Min.
Sci. & Geomech. (Vol. 15). Pergamon Press Ltd.
J.H.Schon. (2011). Physhical Propertites of Rocks: A Workbook. Elsevier.
56
JKTECH. (2019). JK Sim Blast. https://jktech.com.au/jksimblast
Kostić, S., Perc, M., Vasović, N., & Trajković, S. (2013). Predictions of Experimentally Observed
Stochastic Ground Vibrations Induced by Blasting. PLoS ONE, 8(12), e82056.
https://doi.org/10.1371/journal.pone.0082056
Kutter, H. K., & Fairhurst, C. (1971). On the fracture process in blasting. International Journal of
Rock Mechanics and Mining Sciences And, 8(3), 181–202. https://doi.org/10.1016/0148-
9062(71)90018-0
Lakes, R. (2019). Meaning of Poisson’s ratio. Department of Engineering Physics, University of
Wisconsin.
Lewis, J. (2016). Evaluation of a blast damage model based on stress attenuation criteria.
Lu, W., & Hustrulid, W. A. (2003). The Lu-Hustrulid approach for calculating the peak particle
velocity caused by blasting. 2nd World Conference on Explosives and Blasting Technique,
291–300.
Mishra, D. A., & Basu, A. (2013). Estimation of uniaxial compressive strength of rock materials
by index tests using regression analysis and fuzzy inference system. Engineering Geology,
160, 54–68. https://doi.org/10.1016/j.enggeo.2013.04.004
Morin, M. A., & Ficarazzo, F. (2006). Monte Carlo simulation as a tool to predict blasting
fragmentation based on the Kuz-Ram model. Computers and Geosciences, 32(3), 352–359.
https://doi.org/10.1016/j.cageo.2005.06.022
O’Connor, M. (2019). Interim Thesis Report.
Onederra, I. (2013a). Empirical estimates of blast damage zones around fully coupled explosive
charges.
Onederra, I. (2013b). Empirical estimates of blast damage zones around fully coupled explosive
charges.
Onederra, I. (2016). Explosive rock interaction. Mining Education Australia.

57
Ouchterlony, F. (2003). Influence of blasting on the size distribution and properties of muckpile
fragments, a state-of-the-art review MinFo project P2000-10: Energioptimering vid
nedbrytning / Energy optimisation in comminution.
Rangavajhala, S., Liang, C., & Mahadevan, S. (2012). Design optimization under aleatory and
epistemic uncertainties. 12th AIAA Aviation Technology, Integration and Operations (ATIO)
Conference and 14th AIAA/ISSMO Multidisciplinary Analysis and Optimization Conference.
https://doi.org/10.2514/6.2012-5665
Ruffolo, R. M., & Shakoor, A. (2009). Variability of unconfined compressive strength in relation
to number of test samples. Engineering Geology, 108(1–2), 16–23.
https://doi.org/10.1016/j.enggeo.2009.05.011
Saharan, M. R., Mitri, H. S., & Jethwa, J. L. (2006). Rock fracturing by explosive energy: Review
of state-of-the-art. Fragblast, 10(1–2), 61–81. https://doi.org/10.1080/13855140600858792
Silva, J., Worsey, T., & Lusk, B. (2019). Practical assessment of rock damage due to blasting.
International Journal of Mining Science and Technology, 29(3), 379–385.
https://doi.org/10.1016/j.ijmst.2018.11.003
Sun, C. (2013). DAMAGE ZONE PREDICTION FOR ROCK BLASTING.
Talhi, K., Hannachi, B., & Hadja-Aoul, E. (2000). Strength Properties of a Natural Sandstone.
Science Des Materiaux, 225–230.
Tete, A. D., Deshmukh, A. Y., & Yerpude, R. R. (2013). Velocity of detonation (VOD)
measurement techniques - practical approach. International Journal of Engineering &
Technology, 2(3), 259. https://doi.org/10.14419/ijet.v2i3.1023
Torbica, S., & Lapčević, V. (2018). Rock fracturing mechanisms by blasting. Podzemni Radovi,
32, 15–31. https://doi.org/10.5937/podrad1832015t
Vásárhelyi, B. (2009). A possible method for estimating the Poisson’s rate values of the rock
masses. Acta Geodaetica et Geophysica Hungarica, 44(3), 313–322.
https://doi.org/10.1556/AGeod.44.2009.3.4

58
Vidhya, A. (2017). 6 Probability Distributions every data science professional should know.
Analytics Vidya. https://www.analyticsvidhya.com/blog/2017/09/6-probability-distributions-
data-science/

59
8.0 APPENDICES
Appendix A: PROJECT GANTT CHART

60
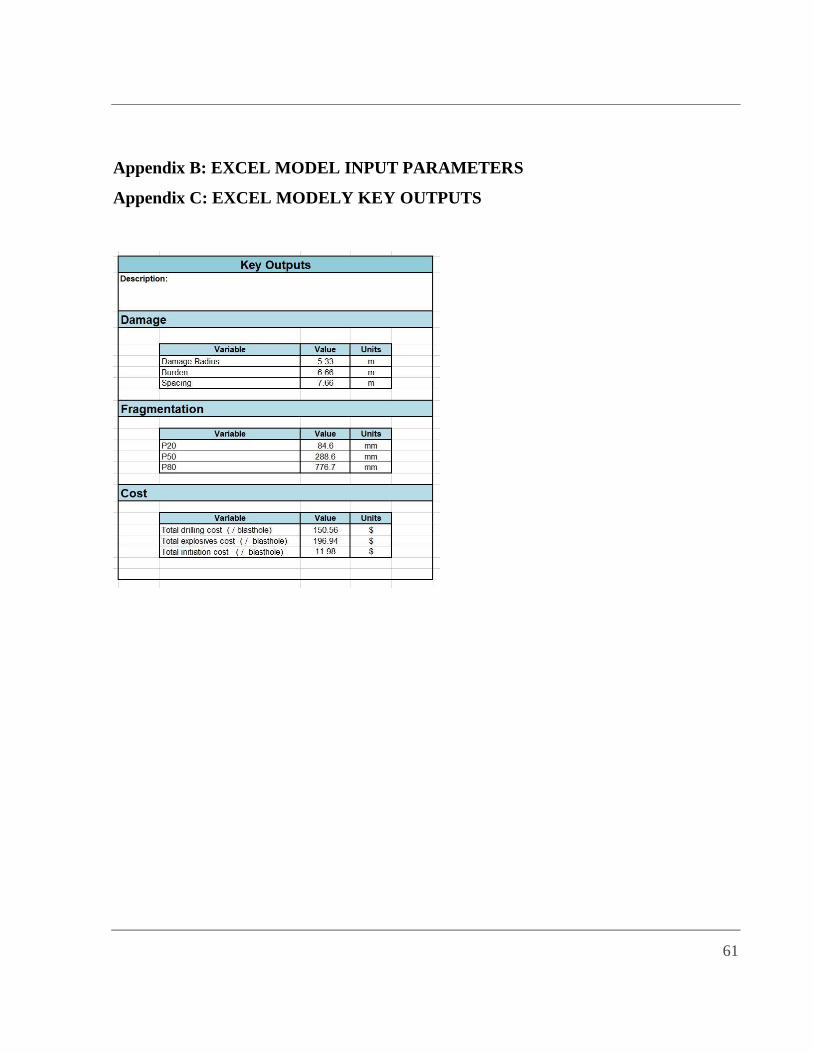
61
Appendix B: EXCEL MODEL INPUT PARAMETERS
Appendix C: EXCEL MODELY KEY OUTPUTS
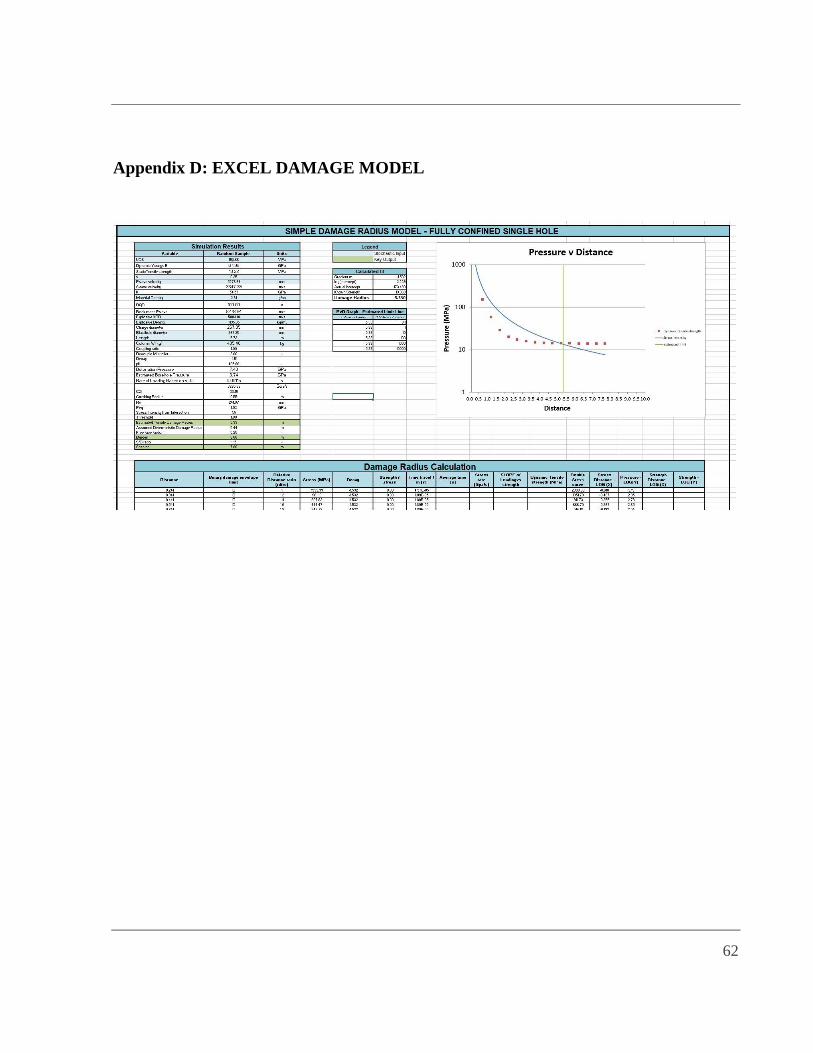
62
Appendix D: EXCEL DAMAGE MODEL

63
Appendix E: EXCEL FRAGMENTATION MODEL
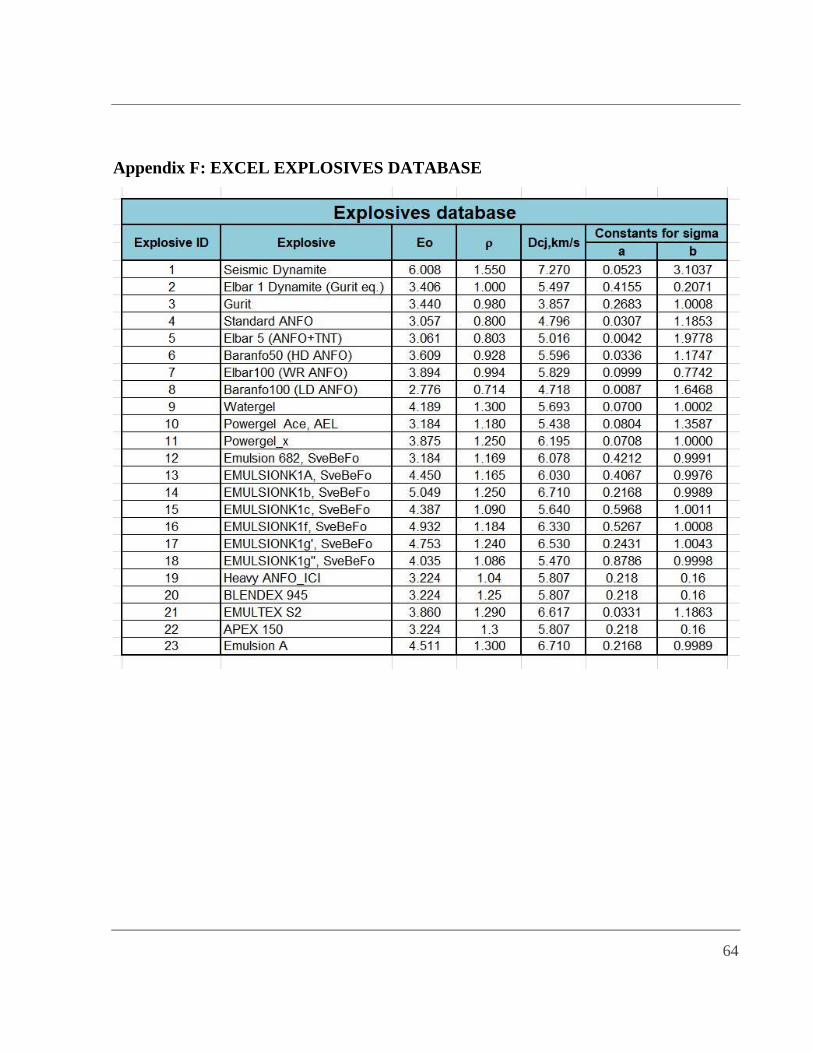
64
Appendix F: EXCEL EXPLOSIVES DATABASE