Stack ADT What is a Stack? Stack is a linear data structure in ...

i n t e r n a t i o n a l j o u r n a l o f h y d r o g e n e n e r g y 3 3 ( 2 0 0 8 ) 7 1 5 3 – 7 1 6 2
Avai lab le a t www.sc iencedi rec t .com
j ourna l homepage : www.e lsev ier . com/ loca te /he
Development and characteristics of a 400 W-class directmethanol fuel cell stack
Han-Ik Joha,b, Sang Youp Hwanga, Jae Hyung Choa, Tae Jung Haa, Soo-Kil Kima,Sang Heup Moonb,**, Heung Yong Haa,*aCenter for Fuel Cell Research, Korea Institute of Science and Technology (KIST), 39-1 Hawolgok-dong, Sungbuk-gu,
Seoul 136-791, Republic of KoreabSchool of Chemical & Biological Engineering and Institute of Chemical Processes, Seoul National University, San 56-1,
Shillim-dong, Kwanak-ku, Seoul 151-744, Republic of Korea
a r t i c l e i n f o
Article history:
Received 19 May 2008
Received in revised form
28 July 2008
Accepted 2 August 2008
Available online 18 October 2008
Keywords:
Direct methanol fuel cell
Stack
CO2
pH
Distributions of voltage and
temperature
* Corresponding author. Tel.: þ82 2 958 5275** Corresponding author. Tel.: þ82 2 880 7409
E-mail addresses: [email protected]/$ – see front matter ª 2008 Interndoi:10.1016/j.ijhydene.2008.08.016
a b s t r a c t
In this study, a 400 W-class direct methanol fuel cell (DMFC) stack is developed for large
size portable applications and its operating behaviors under the various conditions are
monitored. The DMFC stack comprising of 42-cells is assembled with graphite bipolar
plates and membrane–electrode assemblies (MEAs) having an active area of 138 cm2 per
each. The stack is operated by varying the concentrations of methanol, stoichiometry (l),
and the electric load. In addition, other associated factors, such as voltage and temperature
distributions along the individual unit cells, pressure drops inside the stack, voltage
behaviors in response to the dynamic change of the electric load and the pHs of the effluent
solutions from the outlets of both electrodes, are also studied in a detailed manner. The
stack produces a power of 400 W under an operating condition of feeding 0.8 M methanol
and 34 l/min air at 1 atm, and uniform distributions of temperature and voltage prevail in
all the 42 unit cells. A long-term operation coupled with performance restoration processes
shows that a typical single cell used in this stack is able to run with a good stability for
more than 500 h without any substantial degradation in the performance.
ª 2008 International Association for Hydrogen Energy. Published by Elsevier Ltd. All rights
reserved.
1. Introduction hundred watts, which can find its application in small size
Direct methanol fuel cells (DMFCs) have been developed
mainly as power sources for small scale (less than 50 W)
applications because they have some drawbacks in gener-
ating high powers, due to their inherent sluggish electrode
kinetics and methanol cross-over from anode to cathode.
However, the continuous research efforts devoted to improve
the catalysts, membranes and stacking techniques have
resorted to develop the DMFC system with a power of several
; fax: þ82 2 958 5199.; fax:þ 82 2 875 6697.r (S.H. Moon), [email protected] Association for H
vehicles, emergency auxiliary powers, and military portable
powers [1].
Generally, three types of stack configurations are used with
DMFC; namely, mono-polar strip stack, bi-cell stack, and
bipolar stack [2]. The mono-polar strip stack can be assembled
by placing the electrodes with the same polarity on the same
plane of a membrane and subsequently, connecting the
electrodes in series with the electric wire [3–5]. In this
configuration, the reactants are supplied by means of
re.kr, [email protected] (H.Y. Ha).ydrogen Energy. Published by Elsevier Ltd. All rights reserved.

Fig. 1 – Photograph of a 400 W-class DMFC stack.
i n t e r n a t i o n a l j o u r n a l o f h y d r o g e n e n e r g y 3 3 ( 2 0 0 8 ) 7 1 5 3 – 7 1 6 27154
diffusion without using any pump or blower to simplify the
system. However, in this system, the current flow is possible
only through the strip of electrodes, which can cause a huge
internal resistance [6,7] and likely to limit its power to appli-
cation of 10 W-class. The bi-cell stack is an array of bi-cell
units that is composed of one common anode and two sepa-
rated cathodes. In this system, the fuel is supplied by means of
a pump through a main fuel supply line and the oxidant is
supplied by means of natural convection along the space that
exists between bi-cell units. This system has advantages, like
an easy replacement of failed bi-cell units without disjointing
the whole stack and easier removal of heat and products [8].
On the other hand, the bipolar stack, which is the most widely
used one, is composed of unit cells that has an alternate
polarity and faces each other through a bipolar plate. In this
system, the fuel and oxidant are supplied by a pump and
a blower, respectively. This type of stack has a small internal
resistance due to the serial connection between unit cells
through bipolar plates, and thus it is suitable for high power
applications over 100 W-class [9,10].
It is interesting to mention some of the recent reports that
deal with the operating behaviors of various sizes of DMFC
stacks. Chen et al. [11] investigated the effects of various
operating parameters on the DMFC stack performance. These
parameters include the concentration of methanol, rate of
the air flow, thickness of gasket, and depth of the channel. The
stack generated a power of 33 W by feeding 3% (0.621 M)
methanol at 70 �C. Kim et al. [10] developed a 50 W-class DMFC
stack, consisting of 6 cells with an active area of 106 cm2. The
stack was able to generate a maximum power of 54 W under
the condition of feeding 2 M methanol and dry air at the flow
rates of 25 ml/min and 12 l/min, respectively, at room
temperature and atmospheric pressure. In another approach,
Dohle et al. [12] developed a 500 W-class DMFC stack having
72 unit cells. They investigated the effects of PTFE amount in
the GDLs, current collector material, air and methanol flow
rates and concentration of methanol on the performance of
the stack.
Besides, researchers also investigated the effects of the
nature of material of bipolar plates and the structure of
manifold on the performance of stacks. For example, Jiang
et al. [9] employed Ni incorporated and Au coated stainless
steels as anode and cathode bipolar plates. The stack with
these plates could generate a power of about 30 W with
a maximum power density of 26 mW/cm2 by supplying 1 M
methanol and 3 psi air. Shudo and Suzuki [13] used a highly
porous and corrosion-resisting stainless steel flow filed and
observed a 25% improvement in DMFC performance over
a conventional grooved flow field. Lee et al. [14] developed
a 40 W-class DMFC stack composed of 6 unit cells with an
external manifold, which exhibited a maximum performance
of about 41 W on 2 M methanol and air at 65 �C. The stack was
hybridized with three types of batteries and then the load
sharing characteristics of both the stack and the batteries
were evaluated.
As mentioned above, almost all of the investigations have
focused mainly on the DMFC stack with a capacity below
50 W, where small-size MEAs of area around 50 cm2 were
installed. In fact, the studies related to the development of
large-size stacks with capacity more than 100 W are found to
be scarce in the literature. Therefore, an understanding on the
performance of the larger size stacks is highly required.
In this study, we have developed a 400 W-class DMFC stack
consisting of 42 unit cells with internal manifolds and
graphite bipolar plates. Before testing the stack performance,
single cells and a 5-cells short-stack have been tested to verify
the suitability of all components used in our study and to
determine a range of operating conditions to test the 42-cells
stack. Furthermore, the stack characteristics including pres-
sure drops, distributions of unit cell voltage and temperature
and pHs of the exhausting liquids out of the stack have been
monitored and analyzed to completely understand the
operating behaviors of the large size DMFC stacks.
2. Experimental
The DMFC stack built in this study comprised of 42 cells with
an electrode area of 138 cm2 per cell and the pitch of the cell
was only 2.4 mm. The membrane–electrode assemblies
(MEAs) used in the stack consisted of Nafion 115, anodic and
cathodic catalyst layers and gas diffusion layers. The catalyst
loadings both in the anode and the cathode were 6.0 mg/cm2
PtRu black and 4.0 mg/cm2 Pt black (Johnson–Matthey),
respectively. The flow field of bipolar plates has a serpentine
structure. Fig. 1 displays a real image of the stack and its
specifications are summarized in Table 1.
Before assembling the stack, some experiments have been
conducted to characterize single cells and a 5-cells short stack
by means of changing the operation variables, such as

Table 1 – Specification of 400 W DMFC stack fabricatedand investigated in this study
Number of cells 42
Electrode area 138 cm2
Stack dimensions 196 mm� 126 mm� 140 mm
Design values
Current (current density) 20 A (145 mA/cm2)
Voltage
(unit cell voltage)
20 V (0.476 V/cell)
Power (power density) 400 W (69 mW/cm2)
MEA
Membrane Nafion-115
Anode PtRu black, 6.0 mg-PtRu/cm2
Cathode Pt black, 4.0 mg-Pt/cm2
i n t e r n a t i o n a l j o u r n a l o f h y d r o g e n e n e r g y 3 3 ( 2 0 0 8 ) 7 1 5 3 – 7 1 6 2 7155
methanol concentration, air flow rate under non-back pres-
sure, cell temperature, etc. The single cell and stack perfor-
mances were measured with an automated test station
(Smart-II DM, Wonatech Co.). The effectiveness of the flow
field and manifold design was also tested by measuring the
pressure drops at both sides of the electrodes in the cell
compartment. The distributions of voltage and temperature
across the entire stack were measured at different operating
conditions, such as at an open circuit (OC) state, during the
measurement of I–V characteristics, and on applying a load
with constant current of 20 A.
The behavior of CO2 that was produced in the stack was
indirectly monitored by measuring the pHs of the outflowing
methanol solution from the anode compartment and the
condensed water from the cathode compartment. The long-
term operation and durability tests of the MEAs were carried
out with single cells under the various air supply modes.
3. Results and discussion
In order to set the optimal operating conditions of the stack,
a set of experiments was conducted to see the effects of
operating temperature, methanol concentration and air flow
rate on the performance of a single cell. Fig. 2 exhibits the
performance of a single cell by varying the temperatures of
Fig. 2 – The effects of air flow rate and cell temperature on
the performance of a single cell (l [ stoichiometry of
reactants at 150 mA/cm2, anode/cathode).
the cell and cathode air flow rates (stoichiometry, lair), while
maintaining the supply of 1 M methanol at a stoichiometry
(lMeOH) of 3. The air flow rates were not varied as with
increasing the current, but were fixed at the values calculated
based on the stoichiometry at a load of 150 mA/cm2. When the
lair was maintained at 3, the performance was gradually
increased with increasing temperature of the cell irrespective
of the current ranges. On the other hand, when the lair was
kept at 2, the cell exhibited the lowest performance, particu-
larly at higher current range, that is, over 170 mA/cm2 at the
operating temperature of 80 �C. Generally, an increase in
the cell temperature has both positive and negative effects on
the performance of a cell. The increase in temperature of the
cell can enhance the kinetics of the electrochemical reaction,
which in turn contributes to the improvement in the perfor-
mance of a cell. On the other hand, an increase of water vapor
pressure resulting from higher cell temperature can decrease
the oxygen partial pressure within the cell, and thus hold
responsible for the deterioration in the performance of a cell
[15]. Besides, the higher cell temperature could also induce the
higher rate of methanol crossover, which has a negative
impact on the performance of a cell. Therefore, in the case of
lair¼ 3, the supply of oxygen to the cathode is sufficiently
available enough to enhance the overall performance of a cell,
whereas in the case of lair¼ 2 the performance of the cell
declines with increasing the temperature particularly at
currents over 150 mA/cm2, due to increased methanol cross-
over and lowered oxygen partial pressure at elevated
temperature of a cell. However, in all the cases, the difference
in the performance of a cell is found to be around 10% at all the
operating temperatures.
The effect of methanol concentration on the performance
of a single cell was investigated and the results are shown in
Fig. 3. As shown in the figure, the performances of the cell
didn’t show any significant difference in a lower current
density region, that is, up to 130 mA/cm2 with change of
concentration of methanol. In this lower current density
range, the 0.5 M methanol exhibited relatively a better
performance with that of the 1 M methanol and this can be
due to a lower methanol crossover in this lower concentration
Fig. 3 – The effect of concentration of methanol on the
performance of a single cell. Stoichiometries were fixed at
3/3 for methanol and air.

i n t e r n a t i o n a l j o u r n a l o f h y d r o g e n e n e r g y 3 3 ( 2 0 0 8 ) 7 1 5 3 – 7 1 6 27156
of methanol. At higher current density region, an abrupt drop
in the voltage of the cell has been noted, and this might be due
to lower rate of methanol diffusion when feeding with a 0.5 M
methanol solution. According to the Wilke–Chang equation
[16], the diffusivity of some diluted liquid solution can
increase with solution concentration;
DV ¼ 7:4� 10�8ðjBMBÞ1=2T
mV0:6A
(1)
D1 M
D0:5 M¼ 1:52
T1 Mm0:5 M
T0:5 Mm1 M
(2)
where DV is the diffusivity of a solution, T is the absolute
temperature, m is the viscosity of a solution, VA is the molar
volume of the solute as liquid at its normal boiling point, jB is
the association parameter for a solution; the recommended
value of jB is 1.9 for methanol, and MB is the molecular weight
of a solvent. Assuming that the temperature and the viscosity
of methanol solutions are the same regardless of the
concentration, changing the concentration of methanol from
0.5 to 1.0 M could result in an increase in the diffusivity by 1.5
times according to the equations. The faster diffusion rate of
methanol has a positive impact on the performance of a cell
by means of bringing down the overpotential of the anode
owing to increased mass transport of the reactant at high
current density regions.
Here, another set of experiments has been carried out to
study the operational characteristics of a short stack
composed of 5-cells before dealing with the stack composed of
42-cells. Fig. 4 shows the short-stack performance as a func-
tion of temperature and methanol concentration. The stoi-
chiometries of the reactants, such as methanol and air, were
fixed at 3.6/3.6 (anode/cathode) for a convenience of con-
ducting the experiments, which are slightly different from
that of a single cell test (3.0/3.0). As shown in the figure, the
1.0 M methanol exhibited a better performance than the 0.5 M
at the two different operating temperatures. At 25�C,
a remarkable difference in the performance could be observed
depending on the concentration of methanol whereas at 70�C
the performance had only a slighter dependence on the
Fig. 4 – The effects of concentration of methanol and cell
temperature on the performance of 5-cells short-stack.
Stoichiometries were fixed at 3.6/3.6 for methanol and air.
concentration of methanol. The appreciable impact of the
methanol concentration at 25�C is probably due to the heat
released by oxidation of crossed methanol at the cathode that
increases with increasing the methanol concentration. In the
case of feeding of 1.0 M methanol, the inside temperature of
the short-stack rose up to 40�C (at a load of 20 A) and thus
improved the performance of the cell. On the other hand, in
the case of feeding 0.5 M methanol, the feed flow rate was
doubled to make the stoichiometry of the methanol in the
anode the same as the case of feeding 1.0 M methanol, and
this higher flow rate is thought to cool down the cell to lower
the performance when it was being operated at room
temperature.
By keeping the experimental results of the single cell as
well as the short stack with 5-cells (Figs. 2–4) as the base, we
have operated the stack with 42-cells and compared its
performance with those of the single cell and the short stack
(see Fig. 5). The single cell and the short-stack were tested by
feeding 1.0 M methanol at 70�C by means of externally heating
the cells, whereas the full-stack with 42-cells was operated by
feeding 0.8 M methanol at room temperature without
providing any external heating. The full-stack was operated at
room temperature and was heated-up autonomously by the
exothermic reactions at the cathode after the incubation
period. The stack could yield 97% performance of a single cell
at 150 mA/cm2, implying the fact that the stack system,
including bipolar plates, gaskets, manifolds and fastening
bolts, was well designed and assembled.
The temperature and OCV distribution across the entire
42-cells stack were monitored and the results are shown in
Fig. 6(a) and (b). In these experiments, the supply of methanol
and air was maintained at room temperature of 25�C. The
temperature was measured by inserting a thermocouple for
every 3 unit cells, and the OCV measurement was done by
placing the metal pins on every single cell. The stoichiometry
was fixed at 3.6/3.6 based on an electric load of 150 mA/cm2. In
the case of feeding 0.5 and 0.8 M methanol, the cell tempera-
tures and OCVs were found to be around 25 �C and 0.78–0.81 V,
and 29 �C and 0.76–0.79 V, respectively, and these profiles
(temperature and OCV) appeared to be very uniform. On the
Fig. 5 – Comparison of the performances of a single cell, 5-
cells short-stack, and 42-cells stack. The single cell and
short-stack were operated at 70 8C with external heating,
whereas 42-cells stack was operated at room temperature.

Fig. 6 – Distributions of (a) temperature in the unit cell and
(b) OCV throughout the stack at an OC condition.
Stoichiometries were fixed at 3.6/3.6 for methanol and air.Fig. 7 – (a) The pressure drop and (b) pH variation
depending on methanol stoichiometry at an OC condition.
The air stoichiometry was fixed at 3.6.
i n t e r n a t i o n a l j o u r n a l o f h y d r o g e n e n e r g y 3 3 ( 2 0 0 8 ) 7 1 5 3 – 7 1 6 2 7157
other hand, when feeding 1.0 M methanol, there was a signif-
icant increase in the temperature of unit cells, varying from
60 �C (at the methanol inlet) to 83 �C (at the middle of the
stack). The OCV values also varied from 0.74 to 0.79 V, which
are lower than those of the 0.5 and 0.8 M methanol feeds.
The prevailed higher temperatures with 1.0 M methanol can
be attributed to the heat generated by crossed methanol in the
cathode side. In the case of feeding 1.0 M methanol, the heat
generated by crossed methanol is relatively higher than the
heat removed from the stack, which can lead to accumulation
of heat and result in a rise of the temperature of the stack
when compared with those of feeding 0.5 and 0.8 M methanol
feeds. The increase in temperature of the cells, in turn, can
induce higher rate of methanol crossover to the cathode side.
From these results, it is understood that the concentration of
methanol is a critical factor that can determine the perfor-
mance as well as temperature of a stack.
Fig. 7(a) exhibits the pressure drop both at the anode and
cathode compartments of the stack as a function of methanol
stoichiometry under an open circuit (OC) condition and a fixed
air stoichiometry (lair¼ 3.6). The pressure drop at the anode
gradually increased with the increase of lMeOH. In these set of
experiments, the air flow rate was not varied, and therefore
the cathode pressure drop remained the same (around
20 kPa). Since the pressure drop was measured under an OC
condition, naturally, there was no contribution from the
products. Hence, the anode pressure drop at lower concen-
tration of methanol is higher than at higher concentration due
to an increased flow rate of the feed to make the methanol
stoichiometry the same.
Fig. 7(b) shows the pHs of the outflowing methanol from
the anode compartment and the water produced from the
cathode under the OC condition. As shown in the figure, the
pHs of water produced at the cathode are about 3.75–3.80,
which is much lower than that of the methanol solution at the
anode, and is independent of lMeOH. The reason for the lower
pH of the water out of the cathode is that the CO2 produced by
the oxidation of crossed methanol subsequently dissolves in
water and thereby converts into carbonic acid. Under the OC
condition, the amount of CO2 generated might be relatively
larger than its solubility in the produced water and, eventu-
ally, the water can be fully saturated with CO2. This is likely to
be the reason for maintaining a constant pH of the cathode
water regardless of concentration of methanol and stoichi-
ometry. In contrast, at the anode, usually no reaction takes

i n t e r n a t i o n a l j o u r n a l o f h y d r o g e n e n e r g y 3 3 ( 2 0 0 8 ) 7 1 5 3 – 7 1 6 27158
place under the OC condition and therefore lowering down of
pH from 5.30 to 5.37 (pH of the 0.5–1.0 M aqueous methanol
solution) to below 5 is solely owing to the back diffusion of CO2
from cathode to anode. The higher concentration of methanol
can induce the higher rate of methanol crossover and thus the
more CO2 generation in the cathode, which accelerates the
back-diffusion of CO2 to the anode and consequently results in
the lower pH of the anode solution. It is interesting to mention
that Ye et al. [17] also confirmed the occurrence of back-
diffusion of CO2 in the anode effluent gas under the OC
condition, of which 40% of the gas was proved to be CO2.
The effluent solutions with low pHs are likely to corrode
the metal bus plates that were used as current collectors. In
our stack, the gold-coated brass plates have been employed as
the bus plates at both ends of the stack. After running the
stack for 17 days, a severe corrosion had occurred, particularly
at the areas where the plates were in direct contact with the
methanol solution, as shown in Fig. 8. Therefore, we have
employed other types of end plates for the stack. These were
designed in such a way that the direct contact of the metal end
plates, including the bus plates, could be completely avoided
from the methanol solution and the water condensate.
A similar characterization for the stack under loaded
conditions was done, and the results are presented in Figs.
9–11. Fig. 9(a) illustrates the performance of the stack by
feeding methanol under different operating conditions: 0.5 M
at 25�C, 0.8 M at 25�C, and 0.8 M at 48 �C. As we have discussed
in Fig. 6(a), when 1.0 M methanol was fed to the stack, the
temperature of the stack rose up to 80 �C, even though
the methanol feed temperature was maintained at 25 �C, and
the stack was placed under an OC condition without providing
any external heating. Therefore, there might be a possibility
for the occurrence of failure (a temperature overshoot) to the
stack due to thermal shock when a 1.0 M methanol was being
used under a current loaded condition. Because of this reason,
Fig. 8 – Photographs of the corroded bus plates that were
affected by effluent solutions of the stack; (a) anode bus
plate and (b) cathode bus plate.
we have deliberately avoided using 1.0 M methanol, and
instead fed 0.8 M methanol to test the performance of the
stack. In addition, to produce an electric power in a real DMFC
system, the heated methanol solution coming out of a stack
has to be recirculated into the stack after adjusting the
concentration of methanol and temperature. In this case the
temperature of the recirculating methanol solution may be
controlled at the range of 40–60 �C in order to avoid over-
shooting of temperature in the stack. That is why we have
tested the cell with a methanol solution warmed at 48 �C. The
stoichiometries were kept at 3.6/3.6, both for the anode and
the cathode on the basis of the current density of 150 mA/cm2.
As shown in Fig. 9(a), when the methanol solution was fed at
25�C, the 0.8 M methanol exhibited a better performance than
that of the 0.5 M methanol. When we fed 0.8 M methanol at
different temperatures, we did not observe any significant
difference in the performance except at the lower current
ranges (<12 A), where the self-heating of the stack was
insufficient.
Fig. 9(b) and (c) illustrate distributions of temperature and
voltage across the stack when applying a load of 20 A. As
shown in the figures, when the methanol was fed at 48�C,
more uniform distribution of temperature as well as voltage of
the cells has occurred than with feeding at 25�C. Therefore,
one can see that in real DMFC systems with a methanol
recirculating loop, the temperature and voltage distribution in
the stack will be more uniform compared with the DMFC
system measured in a test station that does not have a meth-
anol recirculation facility.
The operational characteristics of the stack, such as pres-
sure drop, temperature, pH of the effluents at both the elec-
trodes and the amount of water produced at the cathode, were
studied by means of gradually increasing the electric load; the
results are shown in Fig. 10(a)–(c). As shown in Fig. 10(a), the
pressure drops at both electrodes exhibited different behav-
iors. For instance, the cathode pressure drop maintained
a constant value around 20 kPa, irrespective of using different
concentrations of methanol at the anode or under applying
varying electric loads. The existence of a slight difference in
the pressure drop values between 0.5 and 0.8 M methanol is
probably due to relatively higher amount of methanol cross-
over induced by the latter, which results in higher rate of CO2
generation at the cathode. On the other hand, the anode
pressure drop tended to gradually increase with increasing
the current, especially at a lower current region (up to 12 A). At
higher currents, the anode pressure drop for 0.5 M methanol
continued to increase, whereas for 0.8 M methanol the pres-
sure drop started to decrease at a load of around 12 A. The
primary reason for an increase in the pressure drop in both
cases can be attributed to the generation of CO2 bubbles,
which would build up in the anode flow field. This view is also
supported by the study of Wong et al. [18] who recently
reported that transient capillary blocking by the CO2 gener-
ated at the anode could increase the anode channel pressure
drop. As the current load increases, the amount of CO2
generation also increases, which can consequently block the
channels; this can explain the linear increase in the anode
pressure drop in the case of using 0.5 M methanol.
On the other hand, a sudden decrease in the anode pres-
sure drop for the 0.8 M methanol at a high current region that
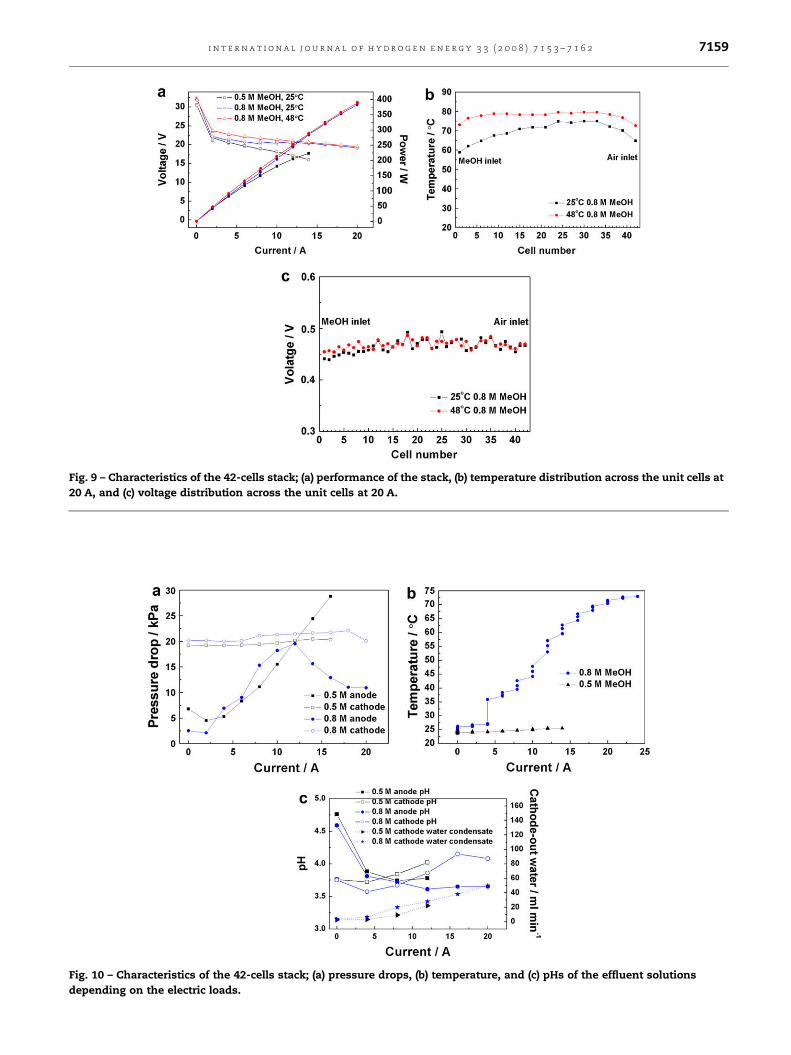
Fig. 9 – Characteristics of the 42-cells stack; (a) performance of the stack, (b) temperature distribution across the unit cells at
20 A, and (c) voltage distribution across the unit cells at 20 A.
Fig. 10 – Characteristics of the 42-cells stack; (a) pressure drops, (b) temperature, and (c) pHs of the effluent solutions
depending on the electric loads.
i n t e r n a t i o n a l j o u r n a l o f h y d r o g e n e n e r g y 3 3 ( 2 0 0 8 ) 7 1 5 3 – 7 1 6 2 7159

Fig. 11 – Characteristics of the 42-cells stack; (a) the
performance and (b) pressure drop behaviors of the stack
with response to dynamic change of the stack current. A
20 A load was instantly applied and maintained.
Fig. 12 – The effect of air supply mode on the long-tem
operation; (a) a 20 A load, continuous air flow, 10 h/day
operation and (b) a 20 A load, ON/OFF air flow (3 min ON
followed by 2 s OFF), 500 h continuous operation.
i n t e r n a t i o n a l j o u r n a l o f h y d r o g e n e n e r g y 3 3 ( 2 0 0 8 ) 7 1 5 3 – 7 1 6 27160
has been confirmed by our repeated experiments may be
explained like this: There are two probable reasons that can be
associated with this phenomenon [17,19,20]. Firstly, the
average viscosity and density of the liquid phase decrease
with increase of temperature, which might decrease the fric-
tional and gravitational pressure drop. Secondly, the rise in
temperature of the stack can slow down the solubility of CO2
in methanol solution and this can further promote the chance
for the evaporation of methanol solution. Eventually, there is
a possibility for the formation of more gas phase in the
channel, which can lead to decrease in the gravitational
pressure drop. In Fig. 10(b) we can see that the stack temper-
ature dependency on the current varies depending on the
methanol feed concentrations. There is no change in
temperature for 0.5 M feed when comparing with a propor-
tional increase in temperature to current for 0.8 M feed. It is
therefore speculated that the high temperature at the currents
above 12 A is the main reason for lowering the pressure drop
for 0.8 M feed.
The pHs of the effluent solutions at both electrodes of the
stack under an OC condition (Fig. 7) and electrically loaded
condition (Fig. 10(c)) differed to a large extent. It is obvious
from the figure that the pH of the anode effluent solution
gradually decreases, and attains a saturation at pH 3.75 and
3.65 for 0.5 and 0.8 M methanol, respectively, with the
formation of CO2 resulting from the increase of current.
Contrarily, in the cathode, pH of the effluent solution
increases only slightly with the increase of current because
generation of CO2 at the cathode decreases with the increase
of current owing to the lowered rate of methanol crossover,
due to consumption of methanol at the anode.
The performance and pressure drop behaviors of the
42-cells stack in response to the dynamic change of the elec-
tric load (current steps with a rise/decline time¼ 1 s) were
monitored, and are presented in Fig. 11. For the dynamic
change of the stack current, a 20 A load was applied instantly
to the stack under an OC condition and the same load has
been maintained for 30 min. The stack voltage has dropped
sharply from an OCV and attained a voltage of 18.8 V imme-
diately after applying the load; then the stack exhibited
a capacitive increment and reaching a steady voltage of 19.3 V
(see Fig. 11(a)). The change of transient capacitive voltage
during the period of first 5 min can be attributed to the
increased overpotential owing to an instant depletion of
reactants in both the electrodes [21]. In addition, the oxidative
removal of intermediate poison species, such as, CH2OH and
CO from the surface of the catalyst might result in subsequent
recovery of performance of the stack [22].
The pressure drops at both electrodes after applying a load
of 20 A were continuously monitored and are presented in
Fig. 11(b). The cathode and anode pressure drop values were

i n t e r n a t i o n a l j o u r n a l o f h y d r o g e n e n e r g y 3 3 ( 2 0 0 8 ) 7 1 5 3 – 7 1 6 2 7161
found to be around 22 and 13 kPa, respectively, which are
similar to the values that were obtained at 20 A load applied to
the stack (see Fig. 10(a)). As discussed in the preceding section,
the anode internal pressure is mainly affected by CO2
behavior; therefore, the anode pressure tends to fluctuate,
whereas the cathode pressure remains to be very stable.
Durability of the MEAs that were used in the 42-cells stack
was evaluated by carrying out a long-term operation on
a single cell. Although several factors can influence the
durability of MEAs [23–30], here we have investigated the
effect of air supply mode on the long-tem operational char-
acteristics and the results are presented in Fig. 12. We have
adopted two different operational modes for the long-term
testing; (a) 20 A loads, continuous air flow, 10 h/day operation
and (b) 20 A loads, ON/OFF air flow (3 min ON followed by 2 s
OFF), continuous operation for 500 h. The continuous opera-
tion for 10 h without any interruption in the supply of air
exhibited a slight degradation in the cell voltage as shown in
Fig. 12(a). After shutting down the cell for 14 h everyday (the
shutdown time is not shown in the figure), the performance
could be restored to its original state. On the other hand, the
repeated air interruption (3 min ON and 2 s OFF) as shown in
Fig. 12(b) seems to be arresting any voltage degradation during
the continuous operation and only a slight degradation in the
voltage of the cell has been observed over the continuous
operation for 500 h. The degradation rate in cell voltage has
been calculated from Fig. 12(b) and is found to be about 1.9 mV/
h. Interestingly, the degradation rate of our cell appears to be
much lower than the reported values in the literature (10–
25 mV/h) [23].
4. Conclusions
In this study, we developed a 400 W-class DMFC stack
comprising of 42 unit cells with an active area of 138 cm2 per
cell, and investigated the operational characteristics in
a detailed manner. The stack was able to generate a power of
400 W (69 mW/cm2 at 0.46 V/unit cell) at 20 A, and it attained
a temperature of 78 �C. A single cell made of a similar MEA
employed in the stack has provided a maximum power
density of 100 mW/cm2 at 0.4 V. In this investigation, it has
been found that the stack temperature was primarily influ-
enced by the concentration of methanol and, in fact, 0.8 M
methanol was an optimal concentration on the basis of
considering the performance and thermal stability of the
stack. The pressure drops of the stack were mainly influenced
by the CO2 generated in the electrodes during the courses of
operation. The pressure drops both at the anode and the
cathode were found to be 12 and 20 kPa, respectively, under
conditions of applying a load of 20 A and the reactant stoi-
chiometry at 3.6. The CO2 generation also lowered the pHs of
the effluent solutions both in the anode and in the cathode by
the way of forming carbonic acid, which accelerated the
corrosion of the metal bus plates used in the stack. A long-
term operation of a single cell with air interruption control
(3 min air-ON followed by 2 s air-OFF) exhibited a stable
performance for more than 500 h with a voltage decay rate of
1.9 mV/h.
Acknowledgement
The authors acknowledge the financial support for this work
from Korea Institute of Science and Technology, under the
contract number of KIST-2E20184.
AppendixSupplementary material
Supplementary data associated with this article can be found,
in the online version, at doi:10.1016/j.ijhydene.2008.08.016
r e f e r e n c e s
[1] Agnolucci P. Prospects of fuel cell auxiliary power units inthe civil markets. Int J Hydrogen Energy 2007;32:4306.
[2] Qian W, Wilkinson DP, Shen J, Wang H, Zhang J. Architecturefor portable direct liquid fuel cells. J Power Sources 2006;154:202–13.
[3] Kim YJ, Bae BC, Scibioh MA, Cho EA, Ha HY. Behavioralpattern of a monopolar passive direct methanol fuel cellstack. J Power Sources 2006;157:253–9.
[4] Guo Z, Faghri A. Development of planar air breathing directmethanol fuel cell stacks. J Power Sources 2006;160:1183–94.
[5] Chen CY, Tsao CS. Characterization of electrode structuresand the related performance of direct methanol fuel cells. IntJ Hydrogen Energy 2006;31:391–8.
[6] Ghosh PC, Wuster T, Dohle H, Kimiaie N, Mergel J, Stolten D.In situ approach for current distribution measurement infuel cells. J Power Sources 2006;154:184–91.
[7] Jiang R, Chu D. Stack design and performance of polymerelectrolyte membrane fuel cells. J Power Sources 2001;93:25–31.
[8] Fletcher NJ, Lamont GJ, Basura V, Voss HH, Wilkinson DP. USpatent, No 5470671.
[9] Jiang R, Rong R, Chu D. Determination of energy efficiency fora direct methanol fuel cell stack by a fuel circulation method.J Power Sources 2004;126:119–24.
[10] Kim D, Lee J, Lim TH, Oh IH, Ha HY. Operationalcharacteristics of a 50 W DMFC stack. J Power Sources 2006;155:203–12.
[11] Chen CY, Shiu JY, Lee YS. Development of a small DMFCbipolar plate stack for portable applications. J Power Sources2006;159:1042–7.
[12] Dohle H, Schmitz H, Bewer T, Mergel J, Stolten D.Development of a compact 500 W class direct methanol fuelcell stack. J Power Sources 2002;106:313–22.
[13] Shudo T, Suzuki K. Performance improvement in directmethanol fuel cells using a highly porous corrosion-resistingstainless steel flow field. Int J Hydrogen Energy 2008;33:2850–6.
[14] Lee BD, Jung DH, Ko YH. Analysis of DMFC/battery hybridpower system for portable applications. J Power Sources2004;131:207–12.
[15] Ge J, Liu H. Experimental studies of a direct methanol fuelcell. J Power Sources 2005;142:56–69.
[16] McCabe WL, Smith JC, Harriott P. Unit operation of chemicalengineering. 6th ed. New York: McGraw-Hill; 2001 [chapter 17].
[17] Ye Q, Zhao TS, Yang H, Prabhuram J. Electrochemicalreactions in a DMFC under open-circuit conditions.Electrochem Solid State Lett 2005;8:A52–4.
[18] Wong CW, Zhao TS, Ye Q, Liu JG. Transient capillary blockingin the flow field of a micro-DMFC and its effect on cellperformance. J Electrochem Soc 2005;152:A1600–5.

i n t e r n a t i o n a l j o u r n a l o f h y d r o g e n e n e r g y 3 3 ( 2 0 0 8 ) 7 1 5 3 – 7 1 6 27162
[19] Yang H, Zhao TS, Ye Q. Pressure drop behavior in the anodeflow field of liquid feed direct methanol fuel cells. J PowerSources 2005;142:117–24.
[20] Argyropoulos P, Scott K, Taama WM. Pressure dropmodeling for liquid feed direct methanol fuel cells Part II.Model based parametric analysis. Chem Eng J 1999;73:229–45.
[21] Yoo JH, Choi HG, Nam JD, Lee YK, Chung CH, Lee ES, et al.Dynamic behavior of 5-W direct methanol fuel cell stack. JPower Sources 2006;158:13–7.
[22] Kallo J, Kamara J, Lehnert W, Helmolt R. Cell voltagetransients of a gas-fed direct methanol fuel cell. J PowerSources 2004;127:181.
[23] Knights SD, Colbow KM, St-Pierre J, Wilkinson DP. Agingmechanisms and lifetime of PEFC and DMFC. J Power Sources2004;127:127.
[24] Eickes C, Piela P, Davey J, Zelenay P. Recoverable cathodeperformance loss in direct methanol fuel cells. J ElectrochemSoc 2006;153:A171–8.
[25] Uribe FA, Zawodzinski TA. A study of polymer electrolytefuel cell performance at high voltages. Dependence oncathode catalyst layer composition and on voltageconditioning. Electrochim Acta 2002;47:3799–806.
[26] Neergat M, Seiler T, Savinova ER, Stimming U. Improvementof the performance of a direct methanol fuel cell usinga pulse technique. J Electrochem Soc 2006;153:A997–1003.
[27] Taniguchi A, Akita T, Yasuda K, Miyazaki Y. Analysis ofdegradation in PEMFC caused by cell reversal during airstarvation. Int J Hydrogen Energy 2008;33:2323–9.
[28] Jianguo Liu ZZ, Zhao X, Xin Q, Sun GQ, Yi B. Studies onperformance degradation of a direct methanol fuel cell(DMFC) in life test. Phys Chem Chem Phys 2004;6:134–7.
[29] Colliera A, Wang H, Yuan XZ, Zhang J, Wilkinson DP.Degradation of polymer electrolyte membranes. Int JHydrogen Energy 2006;31:1838–54.
[30] Wang F, Tang T, Pan M, Li D. Ex situ investigation of theproton exchange membrane chemical decomposition. Int JHydrogen Energy 2008;33:2283–8.
Copyright © 2022 FDOKUMEN