DEVELOPING PRACTICAL APPLICATIONS OF PHOSPHONIC ACID
20
DEVELOPING PRACTICAL APPLICATIONS OF PHOSPHONIC ACID Skanda Amarnath, Matthew Chalkley, Rachel Chen, Reena Clements, Kevin Gu, Gawain Lau, Stephen Leh, Sarvagna Patel, Mark Vander Schaaf, Phyllis Schlafly, Smith Shah Advisor: Michael Avaltroni Assistant: Jennifer Cowell ABSTRACT Oxide surfaces make the application of any permanent coating extremely difficult because of the inherent inert nature of the surface. Thus, several anti-corrosion products that are typically applied post-production offer only short-term solutions as they only physically interact with the surfaces. Several variants of phosphonic acid present intriguing long-term solutions to corrosion through increased water resistance. The key lies in the substances’ ability to bond chemically with inert oxide surfaces. The benefits of covalently bonding a coating to the oxide surface include increased bond strength, durability, and consistency. Through employing a simple spray- on and heat method to apply one variant of phosphonic acid, octadecylphosphonic acid (OPA), a self-assembling monolayer on the surface is sought for better resistance to different corrosion mechanisms. Tests were done on copper, stainless steel, and glass, three practical examples of common oxide surfaces. The corrosion methods are different based upon specific practical concerns for each material. Findings, from observation, attenuated total reflectance evaluations, and contact angle tests, show encouraging signs of OPA as a particularly effective chemical coating for promoting water-resistance and anti-corrosion. INTRODUCTION Overview Octadecylphosphonic acid (OPA) was first intended as a possible replacement for Teflon ® due to the rising concern about the latter’s carcinogenic properties. These concerns sprung not only from the known toxicity Teflon but also from the innate weaknesses of physical bonding, which relies upon physical forces such as electrostatic attraction and gravity in order to maintain the coating. However, any time a force is applied or a condition introduced that is greater than the strength of the physical bond, the coating is compromised and may wear away [1]. As a result, the benefits any chemically bonding substance, which attaches via a permanent chemical reaction, are clear. OPA, consequently, has many advantages. One benefit of a chemically-bonded layer is the potential anti-corrosive qualities of OPA application on susceptible materials, like metal and glass. A common chemical, WD-40 ® uses physical bonding for anti-corrosive purposes. For over thirty years, this chemical, WD-40 ® , an aerosol-applied, petroleum-based lubricant, has been used as an anti-corrosive agent and water repellant. However, application of this material, consisting primarily of the Stoddard solvent, a petroleum-based mixture, releases harmful vapors that have been known to cause nausea, headaches, and dizziness, as well as eye, throat, and skin irritation [2]. The application of OPA can help decrease consumer exposure to these health risks and limit the emission of fluorocarbons from aerosols into the atmosphere [3]. The potential also exists for more optimal anti-rust capabilities as a result of OPA’s chemical interaction with the oxide surfaces as opposed [2-1]
-
Upload
independent -
Category
Documents
-
view
4 -
download
0
Transcript of DEVELOPING PRACTICAL APPLICATIONS OF PHOSPHONIC ACID

DEVELOPING PRACTICAL APPLICATIONS OF PHOSPHONIC ACID
Skanda Amarnath, Matthew Chalkley, Rachel Chen, Reena Clements, Kevin Gu, Gawain Lau, Stephen Leh, Sarvagna Patel, Mark Vander Schaaf, Phyllis Schlafly, Smith Shah
Advisor: Michael Avaltroni Assistant: Jennifer Cowell
ABSTRACT Oxide surfaces make the application of any permanent coating extremely difficult because of the inherent inert nature of the surface. Thus, several anti-corrosion products that are typically applied post-production offer only short-term solutions as they only physically interact with the surfaces. Several variants of phosphonic acid present intriguing long-term solutions to corrosion through increased water resistance. The key lies in the substances’ ability to bond chemically with inert oxide surfaces. The benefits of covalently bonding a coating to the oxide surface include increased bond strength, durability, and consistency. Through employing a simple spray-on and heat method to apply one variant of phosphonic acid, octadecylphosphonic acid (OPA), a self-assembling monolayer on the surface is sought for better resistance to different corrosion mechanisms. Tests were done on copper, stainless steel, and glass, three practical examples of common oxide surfaces. The corrosion methods are different based upon specific practical concerns for each material. Findings, from observation, attenuated total reflectance evaluations, and contact angle tests, show encouraging signs of OPA as a particularly effective chemical coating for promoting water-resistance and anti-corrosion.
INTRODUCTION
Overview
Octadecylphosphonic acid (OPA) was first intended as a possible replacement for Teflon® due to the rising concern about the latter’s carcinogenic properties. These concerns sprung not only from the known toxicity Teflon but also from the innate weaknesses of physical bonding, which relies upon physical forces such as electrostatic attraction and gravity in order to maintain the coating. However, any time a force is applied or a condition introduced that is greater than the strength of the physical bond, the coating is compromised and may wear away [1]. As a result, the benefits any chemically bonding substance, which attaches via a permanent chemical reaction, are clear. OPA, consequently, has many advantages.
One benefit of a chemically-bonded layer is the potential anti-corrosive qualities of OPA application on susceptible materials, like metal and glass. A common chemical, WD-40® uses physical bonding for anti-corrosive purposes. For over thirty years, this chemical, WD-40®, an aerosol-applied, petroleum-based lubricant, has been used as an anti-corrosive agent and water repellant. However, application of this material, consisting primarily of the Stoddard solvent, a petroleum-based mixture, releases harmful vapors that have been known to cause nausea, headaches, and dizziness, as well as eye, throat, and skin irritation [2]. The application of OPA can help decrease consumer exposure to these health risks and limit the emission of fluorocarbons from aerosols into the atmosphere [3]. The potential also exists for more optimal anti-rust capabilities as a result of OPA’s chemical interaction with the oxide surfaces as opposed
[2-1]

to WD-40’s® physical interaction. Benefits of OPA applications include increased lifespan of man-made structures, promotion of aesthetic qualities, and reduction in maintenance costs. This study focuses on the anti-corrosive properties of OPA on various oxide surfaces including metals and glass.
Principles of Corrosion Corrosion of metals often arises from simple oxidation-reduction reactions. Both copper and steel are metals typically susceptible to these effects by exposure to water and other aqueous solutions that facilitate the movement of electrons [4]. The removal of electrons from the oxide surfaces causes the dull, pitted look that characterizes corrosion. The common denominator of different corrosion mechanisms is an aqueous solvent. The hydrogen ions in acid and halides in saline solutions can corrode meals if they are dissolved in water. Even corrosion via oxygen requires a small film of water to form on the material’s surface. Therefore, increasing the hydrophobic quality of a surface can help to make materials resistant to many different corrosion mechanisms. Phosphonic Acid
Phosphonic acid consists of a central phosphorous atom bonded to three oxygen atoms and can be subsequently bonded to various functional groups and molecular subsets. Two of the oxygen atoms are each bonded to a single hydrogen atom which creates hydroxyl groups that exhibit acidic properties [5]. The phosphonic acid forms a self assembling monolayer (SAM). By altering the functional group attached to the central phosphorous atom, it is possible to create a variety of coatings each with properties uniquely designed based on need. This study utilizes octadecylphosphonic acid, a basic phosphonic acid with an 18 atom carbon chain as the R substituent group, as shown in Figure 1, giving the molecule a strong hydrophobic quality [6].
Figure 1. Octadecylphosphonic acid: Phosphonic acid with an 18 carbon chain as the R substituent group.
Principles of Self-Assembled Monolayers on Oxide Surfaces
The difficulty of chemical bonding to any oxide surface lies in the inert nature of the oxide structure. Traditionally, the oxide surface is composed of two different structures (Figure 2). The first structure is a µ-oxo group—a single oxygen atom attached to the surface at two sites [7]. The other structure is a hydroxyl group (OH), which is more reactive. The challenge is to
[2-2]

successfully increase the amount of bondable hydroxyl groups which are randomly spread across the surface of the material.
Figure 2. A generic oxide surface
Various unmodified oxide surfaces would be ill-suited for consistent coating if the few hydroxyl groups were the only possible attachment sites for a variety of SAMs [8]. Therefore a chemical must not only be able to create a SAM but also be able to open additional hydroxyl
Octadecylphosphonic acid emerged as a possible solution to
groups in a self-catalyzing mechanism (Figure 3).
these issues. It consists of a phosphonic acid subgroup and a long hydrocarbon chain. This is a diprotic acid that is unique in tha
ules can
The
Figure 3. A phosphonic acid as a self-assembling monolayer
t the acid dissociation constant (Ka) for both the first and second hydrogen atoms are sufficiently low to allow it to donate both protons, which is necessary to both initially bond the chemical to the surface and then unzip additional µ-oxo groups so that future OPA molecrepeat the process in the bonding mechanism pictured above [9]. Specifically a hydrogen atom from a hydroxyl group on the phosphonic acid dissociates and then attaches to the hydroxyl group on the specific oxide surface. This dehydration reaction can then be completed by removing the water through heating at over 100ºC. When the resulting water molecule evaporates, this creates a positively charged Lewis acidic defect on the material’s surface.
[2-3]
negatively charged oxygen is then attracted to the surface, chemically bonding the phosphonic acid to the material’s surface [10]. In order for that coating to be removed, an energy equivalento the bond strength would have to be applied directly, unlikely under practical circumstances. The other hydroxyl group on the phosphonic acid can subsequently donate a hydrogen ion to theµ-oxo group creating a new hydroxyl group on the material’s surface. The new functional group will be available to bond using the previously described process. Also, the remaining negatively charged oxygen on the phosphonic acid can bond to the material’s surface, increasing the amount of coverage. This is often characterized as controlled corrosion, a process during which a chemical breaks the material’s oxide but does so in such a manner that allows another oxygmolecule to bond to the surface [11]. This is done with the intent of establishing some new property that can be added through the newly attached molecule. In this study, the functionagroup will be used to add greater hydrophobic qualities which should reduce controlled corrosion
Project
t
en
l R .
Ultimately, the anti-corrosive properties arising from the application of OPA on various sur
yer
ation of OPA Solution
faces may prove helpful in preserving man-made structures and materials that undergo severely degrading effects of corrosion. The high hydrophobic quality of applied OPA is hypothesized to prevent corrosion because most corrosion mechanisms require an aqueousmedium. The main objective is to evaluate OPA’s effectiveness as a self-assembled monolaand corrosion inhibitor. Since various oxide materials, such as copper, stainless steel, and glass are susceptible to corrosion from acid rain, ocean spray, and other environmental factors, this study attempts to simulate the conditions.
PROCEDURE
Preparation and Applic
The OPA was dissolved in a 0.001 M solution with a 3:1 ethanol and toluene volume ratio. Th
es and
The OPA solution was sprayed onto the surfaces of the materials. The coating was sprayed on
ce
ted
in copper sheets, glass microscope slides, and thin stainless steel 316L alloy cylindrical chipswere used. To prepare the copper, the plastic backings and metal mesh of the sheets were removed, and the sheets were soaked in ethanol. Afterward, they were cut into small squarflattened. To prepare the glass, the microscope slides were cleaned with ethanol and Kimwipes®, washed with distilled water, and dried with paper towels. To prepare the stainless steel, the chips were sanded with ethanol and 220 grade sandpaper until all surface residues were removed.
to one side of the material and then a sharp straight edge of galvanized steel was used to spread the solution, ensuring a fully coated surface. The materials were then left to dry. Onthe solvent evaporated, the materials were heated to accelerate the dehydration reaction that chemically bonds the phosphonic acid to the surfaces. The glass and stainless steel were coaon both sides as these samples were to be fully submerged in solutions, while the copper was coated on one side as these samples floated in the solutions. For glass and stainless steel, the surfaces were heated with a Varitemp Heat Gun® VT-750C, held over the materials for thirty seconds each while the thin copper samples were ironed with a Black & Decker® Press’ n Go™S220 for thirty seconds. This is done because the copper samples would be unable to stay stationary under the strong airflow of the heat gun.
[2-4]
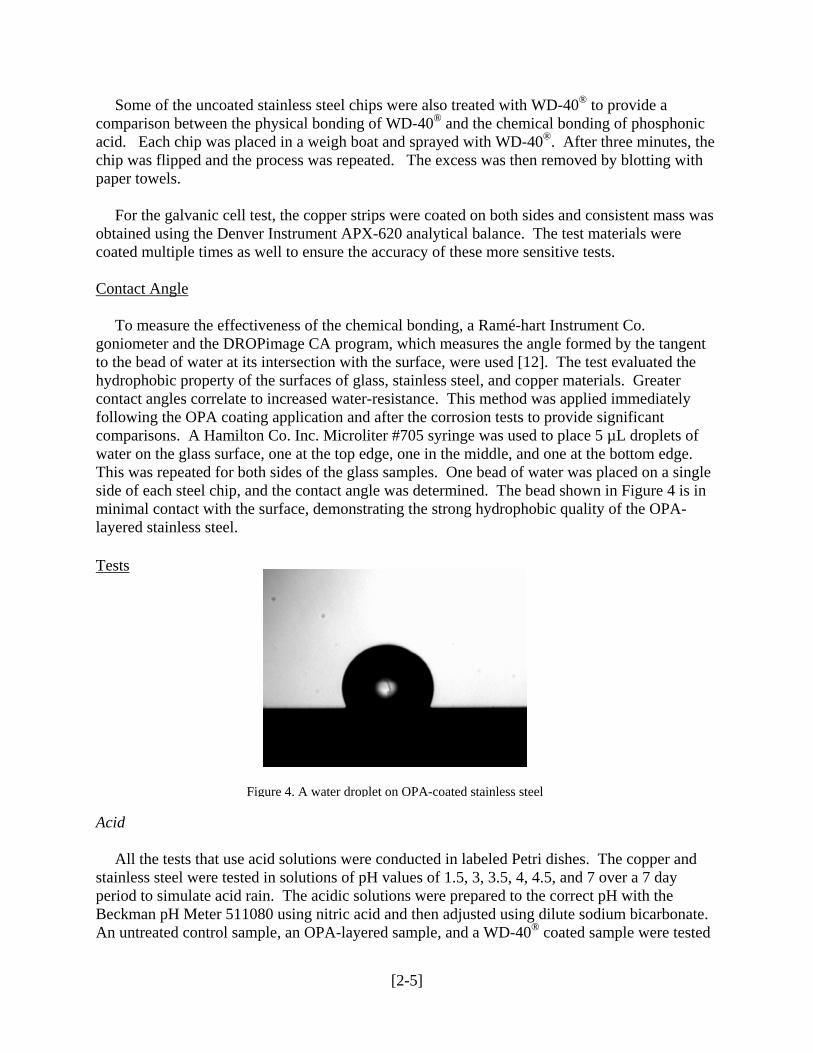
Figure 4. A water droplet on OPA-coated stainless steel
Som of the uncoated stainless steel chips were also treated with WD-40® to provide a co onic
For the galvanic cell test, the copper strips were coated on both sides and consistent mass was ob
ontact Angle
emparison between the physical bonding of WD-40® and the chemical bonding of phosph
acid. Each chip was placed in a weigh boat and sprayed with WD-40®. After three minutes, thechip was flipped and the process was repeated. The excess was then removed by blotting with paper towels.
tained using the Denver Instrument APX-620 analytical balance. The test materials were coated multiple times as well to ensure the accuracy of these more sensitive tests. C
To measure the effectiveness of the chemical bonding, a Ramé-hart Instrument Co. go tangent
ts of
le
sts
niometer and the DROPimage CA program, which measures the angle formed by theto the bead of water at its intersection with the surface, were used [12]. The test evaluated the hydrophobic property of the surfaces of glass, stainless steel, and copper materials. Greater contact angles correlate to increased water-resistance. This method was applied immediatelyfollowing the OPA coating application and after the corrosion tests to provide significant comparisons. A Hamilton Co. Inc. Microliter #705 syringe was used to place 5 µL droplewater on the glass surface, one at the top edge, one in the middle, and one at the bottom edge. This was repeated for both sides of the glass samples. One bead of water was placed on a singside of each steel chip, and the contact angle was determined. The bead shown in Figure 4 is in minimal contact with the surface, demonstrating the strong hydrophobic quality of the OPA-layered stainless steel. Te
Acid
All the tests that use acid solutions were conducted in labeled Petri dishes. The copper and sta
ate.
inless steel were tested in solutions of pH values of 1.5, 3, 3.5, 4, 4.5, and 7 over a 7 day period to simulate acid rain. The acidic solutions were prepared to the correct pH with the Beckman pH Meter 511080 using nitric acid and then adjusted using dilute sodium bicarbonAn untreated control sample, an OPA-layered sample, and a WD-40® coated sample were tested
[2-5]
in each specific acid solution. The glass samples were put into a solution of Stop & Shop Pure Power Bleach, which has a pH of 12.6.
Saline Test
Samples of stainless steel—uncoated, coated with OPA, and coated with WD-40®—were also tes
ong
Patina Test
To further test the OPA’s ability to prevent corrosion, five coated squares and five uncoated squ
Electro emical Cell
To further the corrosion process and challenge the OPA layer, copper samples were tested in a co
merican Society for Testing of Materials (ASTM) Surface Adhesion Test
The glass and copper samples were tested with an ASTM test for surface adhesion, consisting of
leach Test
ted in a 3.49% saline solution for 7 days, simulating the average salt content of the ocean surfaces. Iron, a main component of stainless steel, is known to be corroded by chlorides, amwhich, sodium chloride is an especially common and aggressive corroder [13].
ares of copper were sprayed with a solution that expedites the formation of patina, the green incrustation that forms as a result of oxidation. To create the solution, 278 grams of ammonium sulfate, 3.5 grams copper sulfate, 0.40 mL of concentrated ammonia, and 250 mL of tap water were mixed. The copper was sprayed with a light mist and then set to dry. Finally, the copper was placed in a greenhouse, to maximize humidity in order to speed up the patina formation.
ch
pper-zinc galvanic cell. A control copper strip and an OPA-coated copper strip were clipped to zinc strips in their respective set-ups. The copper was placed in a copper sulfate solution and the zinc in a zinc chloride solution. A salt bridge, filter paper saturated in ammonium nitrate, linked the two solutions. The potential difference across the electrochemical cells was recorded using a Micronta voltmeter as the reaction occurred. This tested how well the copper conducted electricity when coated and uncoated. A
applying permanent ink on control, OPA-layered, and WD-40®-treated oxide surfaces to test the hydrophobic quality of the surfaces. The permanent quality of Sharpie® ink lies in the abilityof its solute particles to bond with the surface of various materials [14]. This test seeks to further qualitatively evaluate the effectiveness of the OPA coating. After the application of the ink (see Appendix A), a dry paper towel was used with moderate vigor for approximately 30 seconds to remove the ink from the surfaces. This method attempts to observe the ease with which the ink isremoved. In a succeeding test, the new surfaces were rinsed with ethanol to test the coatings’ ability to adhere and remain effective. B
[2-6]
Bleach is a known corrosive of glass. Basic corrosion measured by loss of mass can be om
ch
ATR
The Attenuated Total Reflectance (ATR) test was used after the experimentation in order to deter
re 5
stal.
[16].
thousands of times stronger than acid corrosion on glass. When alkali metals are leached frthe glass surface into an aqueous solution, the pH value becomes more basic. This leaves the glass susceptible to eventual corrosion [15]. The glass samples were placed in a beaker of bleasolution at pH 12.6. After 2 days, the samples were removed and tested for water-resistance.
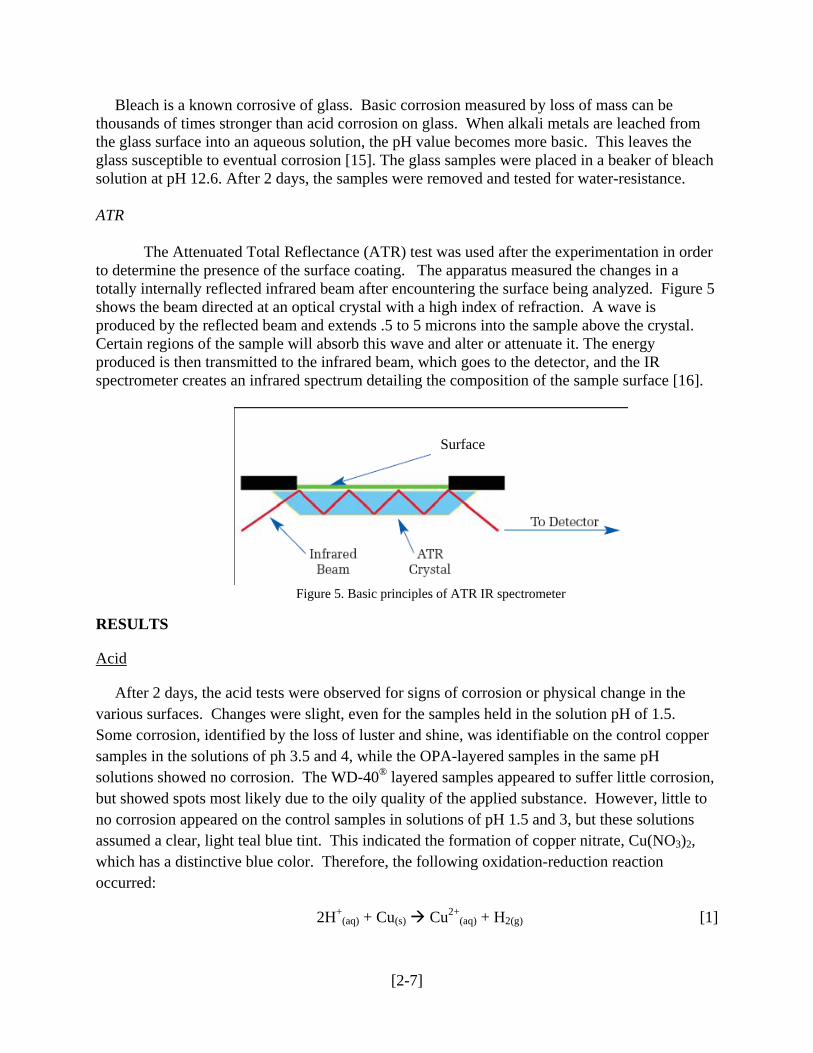
mine the presence of the surface coating. The apparatus measured the changes in a totally internally reflected infrared beam after encountering the surface being analyzed. Figushows the beam directed at an optical crystal with a high index of refraction. A wave is produced by the reflected beam and extends .5 to 5 microns into the sample above the cryCertain regions of the sample will absorb this wave and alter or attenuate it. The energy produced is then transmitted to the infrared beam, which goes to the detector, and the IR spectrometer creates an infrared spectrum detailing the composition of the sample surface
urface S
Figure 5. Basic principles of ATR IR spectrometer
RESULTS
Acid
After 2 days, the acid tests were observed for signs of corrosion or physical change in the
per
rrosion,
2H+(aq) + Cu(s) Cu2+
(aq) + H2(g) [1]
various surfaces. Changes were slight, even for the samples held in the solution pH of 1.5. Some corrosion, identified by the loss of luster and shine, was identifiable on the control copsamples in the solutions of ph 3.5 and 4, while the OPA-layered samples in the same pH solutions showed no corrosion. The WD-40® layered samples appeared to suffer little cobut showed spots most likely due to the oily quality of the applied substance. However, little to no corrosion appeared on the control samples in solutions of pH 1.5 and 3, but these solutions assumed a clear, light teal blue tint. This indicated the formation of copper nitrate, Cu(NO3)2, which has a distinctive blue color. Therefore, the following oxidation-reduction reaction occurred:
[2-7]
The oxidized copper than formed the visible bluish tint in solution. The solutions of pH 3.5, 4, 4.5, and 7, however, remained clear and colorless.
After 5 days of the samples’ exposure to these solutions, the effects of acid exposure became more pronounced on the copper control samples in the solutions of pH 3.5 and 4. The surfaces were severely darkened and pitted, completely losing the luster that characterizes non-oxidized copper. The control samples in the solutions of pH 1.5 and 3 showed only localized corrosion, probably attributed to impurities in these samples. The OPA-layered samples experienced no observable corrosion, retaining their luster. The exception was the copper in the pH 3 solution, which showed some signs of oxidation. The contact angle test would later show, though, that the appearance had little effect on the hydrophobicity of the sample. The WD-40® layered copper samples all retained their shine with occasional spots, most likely from remaining residue. All copper samples—control, OPA, and WD-40®—in solutions of pH 4.5 and 7 experienced no observable corrosion. 2 days later, the same results were observed (Appendix B).
Electrochemical Cells
The experiment showed that the potential difference across the uncoated copper cells was 1.05 V and the literature value of this cell is 1.10 V. The voltmeter also showed that the coated copper cells had potential differences between .60 V to .80 V.
Patina-Forming Solution
After 3 days in a greenhouse, the copper coated with OPA (with one outlier) showed slightly less corrosion than the uncoated copper.
ASTM Surface Adhesion Test
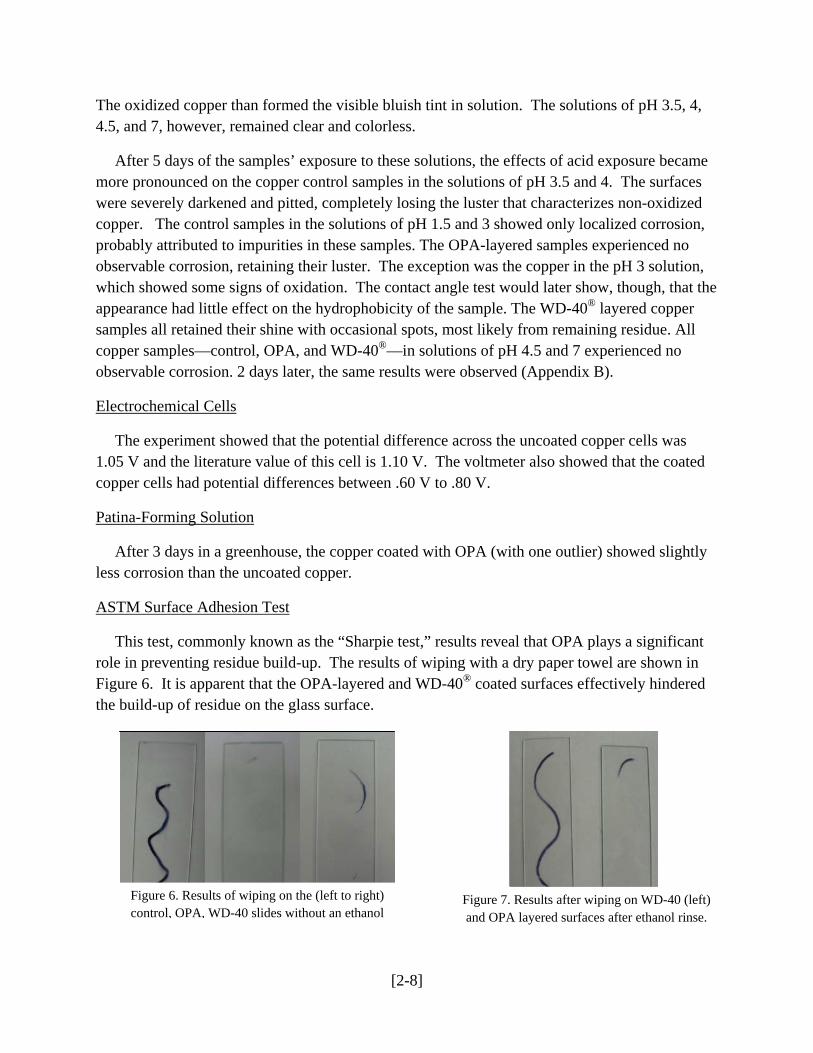
This test, commonly known as the “Sharpie test,” results reveal that OPA plays a significant role in preventing residue build-up. The results of wiping with a dry paper towel are shown in Figure 6. It is apparent that the OPA-layered and WD-40® coated surfaces effectively hindered the build-up of residue on the glass surface.
Figure 6. Results of wiping on the (left to right) control, OPA, WD-40 slides without an ethanol
Figure 7. Results after wiping on WD-40 (left) and OPA layered surfaces after ethanol rinse.
[2-8]

To fully test the longevity of these two different layers, the surfaces were rinsed with ethyl alcohol. Theoretically, the chemically bonded surface should remain while the simple physical interactions should be eradicated by the reaction of the hydroxyl groups on the oxide surface with the hydroxyl group on the ethanol. On the other hand the ethanol will simply run away from any part of the molecule because there is no polar region with which the ethanol can interact. Figure 7 demonstrates that the effectiveness of WD-40® is significantly reduced, generating similar results to the control glass slide. The OPA-layered slide still produced desirable results by repelling the water based solution of ink. This test confirms the greater effectiveness and durability of chemically bonded layers compared to simple physically bonded coats.
These same tests were performed on copper surfaces to demonstrate and validate the effectiveness of this methodology on various oxide surfaces (Figures 8 and 9). The OPA layered copper showed the best results.
Figure 8. The copper surfaces with applied Sharpie® ink before the wipe test
Figure 9. The copper surfaces are shown with applied Sharpie® ink after the wipe test.
Contact Angle
The contact angles were recorded for the various glass and steel surfaces before and after all tests and periodically during the experimentation. The untreated glass, stainless steel, and copper surfaces showed marked increase in contact angle after coating with OPA (Figure 10). The glass samples coated with two layers of OPA were also slightly more effective than the single-layered ones. The ethanol wash of the glass did not affect the contact angle and therefore, did not remove the OPA coating. The WD-40® decreased rather than increased the contact angles for stainless steel.
[2-9]

0
20
40
60
80
100
120
Con
tact
Ang
le
Uncoa
ted gl
ass
OPA-laye
red gl
ass
Double
OPA-la
yered
glas
s
Uncoa
ted st
ainles
s stee
l
OPA-laye
red st
ainles
s stee
l
WD-40® co
ated s
teel
Uncoa
ted co
pper
OPA-laye
red co
pper
WD-40® co
ated c
oppe
r
Surface
Average Contact Angles Before Tests
(Deg
rees
) A
vera
ge
Figure 10. The bar graph shows the increased contact angles on the OPA-coated surfaces.
The OPA-layered glass underwent a bleach wash. The contact angle decreased dramatically afterwards (See Figure 11). The coating on the glass was apparently degraded by the bleach, a highly basic solution.
0
10
20
30
40
50
60
70
80
90
Cont
act A
ngle
Uncoated 1 OPA layer 2 OPA layers 1 layer OPApost-ethanol
wash
1 layer OPApost-bleach
washSurface
Glass Tests
[2-10]
Figure 11. The bar graph shows the high contact angles on OPA-coated surfaces while illustrates the degrading effects of bleach.

The acid tests on the steel chips showed moderate effectiveness of the OPA layer, with contact angles consistently better than the uncoated samples and similar to the WD-40® results. After the first 2 days in the saline solution, the OPA-layered steel chips showed much higher contact angles than the control samples; after 7 days, the contact angles for each surface showed a small decrease (See Figure 12).
pH 1.5 pH 3 pH 3.5 pH 4 pH .5 pH 7 Saline
ControlWD40OPA
0
20
40
60
80
100
120
Aver
age
Con
tact
Ang
les
(Deg
rees
)
Solution
Stainless Steel Contact Angles Post-Tests
ControlWD40OPA
Figure 12. The OPA-coated samples provided greater average contact angles after seven days of immersion in the acid solutions.
After 7 days, the contact angles of the OPA-layered copper were consistently better compared to the control samples while meeting or exceeding the results of the WD-40® copper samples in all pH solutions (Figure 13).
1.5 3 3.5 4 4.5 7Control
OPA0
20
40
60
80
100
120
Ave
rage
Con
tact
An
gles
(Deg
rees
)
pH of Solutions
Copper Contact Angles Post-Acid Test
ControlWD40OPA
Figure 13. After 7 days of acid immersion, contact angles
remained high on OPA-coated surfaces.
[2-11]

Attenuated Total Reflectance
After the acid tests, the copper and stainless steel samples were analyzed for OPA presence. The infrared transmission spectra (Figure 14) from the ATR tests shows multiple peaks, two main peaks at -2917 (left peak) and -2845 wavenumbers (cm-1), indicating the numerous CH2 groups in the long hydrocarbon chain of OPA. These spectra confirm the presence of the OPA coating, proving the durability and effectiveness of this SAM even after the acid and saline tests and reinforcing the results obtained from the contact angle tests.
*TI/ octadecyl ph acid L16Wed May 05 10:02:18 1999
2845
2914
00 cm-1
*TI/ octadecyl ph acid L16Wed May 05 10:02:18 1999
2845
2914
00 cm-1
Figure 14. The partial infrared spectrums of the OPA-coated copper (left) and stainless steel (right) after tests in the pH 1.5 solution, confirming the presence of OPA
DISCUSSION
Initial Coating
Prior to any testing, the initial application of OPA showed a remarkable increase in the hydrophobic quality of the different oxide surfaces. The WD-40® application actually decreased in hydrophobic quality as evidenced by the initial contact angle. We believe this is due to the difficulty in evenly applying the WD-40®, because the natural surface tension of the water molecules were disrupted by the pools of oily residue that formed upon the application of the WD-40® . The application of the OPA coatings was much more convenient and effective and did not create the unpleasant smell like WD-40® does. OPA can also be applied faster because the WD-40® needed more time to dry. Even when any excess WD-40® was removed by paper towel, the drying time was still approximately four minutes compared to one minute for OPA.
Acid Test
Throughout all the different pH solutions, the OPA-layered copper samples resisted color change and retained their luster, as did the WD-40® coated samples. The only discrepancy was the copper sample in solution of pH 3, of which the most likely explanation is the improper
[2-12]

application of the OPA. A coating is considered to be hydrophobic if the contact angle is 90 degrees, although not all of the coatings achieved this, the OPA layer did consistently have results that outperformed the other surfaces. Therefore, the contact angles we obtained suggest that OPA has anti-corrosive properties that are at least comparable if not better than those of WD-40®, not only against acid corrosion, but oxidation by oxygen as well.
Electrochemical Cells
The initial voltage reading was 1.05 V, slightly less than the literature value of 1.10 V. This arises from the inaccuracies in the preparation of the standard 1 M copper sulfate and zinc sulfate solutions. The reduction of the voltage with the coated copper demonstrates that OPA served as an insulating coating. The reduction in the copper’s conductivity is a valuable property that shows even forced corrosion can be limited by the application of the OPA. Because copper is being reduced in this galvanic cell, there is an expected mass increase. However, the copper strips’ small surface area and low starting mass meant although most of the masses decreased, the changes could not be observed within the error of the analytic balance.
Patina Forming Solution
The result we achieved which did indeed have qualitatively less corrosion was not due to anti-corrosive properties. This can be determined by the fact that the patina did indeed form wherever a drop landed. Instead, the difference in the amount of corrosion is the result of the OPA’s hydrophobic properties, which reduced the surface area of the coated copper that was exposed to the patina-forming solution because the solution balled up rather than spread around on the surface.
ASTM Surface Adhesion Test
This test resulted in our greatest success. Both WD-40® and OPA could be cleaned with a reasonable effectiveness when not dipped in an ethanol bath. However, WD-40® lost its effectiveness to provide a hydrophobic coating to both copper and glass after the ethanol bath. This illustrates clearly the difference between a chemical and physical bond. The WD-40® was removed by the wash and would be ineffective in protecting the surface from any corrosion after such an interaction. The OPA on the other hand effectively remained on the surface and showed the same hydrophobic quality as when not treated with ethanol.
Contact Angle
There were two interesting results from the initial application of the coatings. The first was that the application of two coatings increased the hydrophobic nature of glass more than one coating. There are two possible explanations. One is that a second coating allowed the OPA to coat a greater percentage of the surface area because it was applied to areas that had perhaps been missed by the initial coating, or whose µ-oxo groups had not been unzipped. The other
[2-13]

possible explanation is that it was not the second application of OPA that increased the hydrophobic quality, but rather that the second heating evaporated all of the water in the coating from the dehydration reaction, reducing the interaction of these water molecules with the water droplet during contact angle tests. The second interesting result was that the steel coated with WD-40® actually had a reduced hydrophobic quality when compared to the control. The most reasonable explanation is that the WD-40® did not coat evenly on the stainless steel chips. The resulting rough surface degraded the surface tension of the water droplet, thus decreasing the contact angle.
The results of the bleach test were caused by the poor quality of the OPA application. The spray bottle containing the OPA solution squirted rather than sprayed. The solution accreted together on the glass slides. The slightly polar phosphonic acid groups will clump together to form micelles if they are not spread thinly enough. This reduces the effectiveness of the OPA greatly, because they are then unable to bond to the surface. The other possibility that we were unable to test because of time constraint is that OPA simply might not bond as strongly with glass, or silicon dioxide, as with metal oxides.
In the acid solutions, the steel chips performed as well as the WD-40® and better than the control. After 7 days of exposure though, there was a decrease in the contact angles, which can be attributed to slow corrosion of the surface. However, because these results came in conditions more extreme than those that the product would normally be subjected to, this is acceptable. The results for the copper were in more conclusively in favor of the OPA. The contact angles were consistently higher or at least equal to those achieved by WD-40®.
The greatest success of the project came in the encouraging evidence that a chemically bonding coating is indeed more effective than a physically bonding coating. The “Sharpie® test” in particular provided solid evidence that indicated any chemical that interacts strongly with WD-40® or the oxide surface will make it useless as a protective coating, because it will be immediately removed. Overall, the test results gave encouraging signs of OPA’s strong potential as an effective anti-corrosive coating.
CONCLUSION
Sources of Error
The application method of OPA requires improvement. There were several different manners in which the application process could have been improved. First, the stainless steel samples were not coated on the edges, potentially degrading the applied OPA’s effectiveness. Also, the copper samples were only coated on one side; this may have skewed the results if the non-coated side became submerged within the corrosive solvent. The OPA application was performed once per sample, leaving the possibility that the entire surface had not been coated. This error was compounded by the contact angle test which only tested localized parts of the samples, giving only a partial assessment of the OPA application. In addition, the testing of only one sample per
[2-14]

pH solution did not give very comprehensive results. This method of application, however, can be effective with greater vigilance.
The use of copper stripping made it extremely difficult to completely smooth the copper sample, which may have hindered the determination of accurate contact angles. Consistent readings, as a result, were difficult to obtain. Another factor of potentially skewed results is the surface residue on the stainless steel chips. The required sanding of each sample was difficult to standardize, making it a challenge to determine which surfaces had truly corroded the most.
The glass surfaces showed improvement in hydrophobic quality after just one additional coating. This would indicate that multiple coatings could have been applied for maximum effectiveness.
Areas for Future Experimentation
For future work, the surfaces and coatings should be tested for a longer duration to more accurately simulate environment factors and the true durability and effectiveness of the coatings. More physical means of corrosion can also be explored. Additional oxide surfaces should be tested for a more comprehensive view of OPA’s practical applications. Lastly, after the application of the coatings the materials could be rinsed in polar and non-polar solvents before the tests were performed to see if the evidence seen of the removal of WD-40® in the ASTM Surface Adhesion Test would be seen in other tests.
ACKNOWLEDGEMENTS
We would like to thank Dr. Avaltroni for his support and guidance throughout the project. We also wish to express our gratitude to Jennifer Cowell for her constructive criticisms and ideas. Finally, we want to thank all the donors who made the 2008 Governor’s School in the Sciences possible: Schering-Plough Foundation, Novartis, The Dorr Foundation, The Jennifer A. Chalsty Foundation, The Edward W. & Stella C. Van Houten Memorial Fund, The Jewish Communal Fund, and the many alumni and parents who donated, especially Laura and John Overdeck.
[2-15]

REFERENCES
[1] Barbalace R. [updated 22 Mar 2006]. DuPont's Teflon Cover-up. [cited 16 Jul 2008]. <http://environmentalchemistry.com/yogi/environmental/200603tefloncoverup.html>. [2] Agency for Toxic Substances & Disease Registry. [updated Sept 2006]. ToxFAQs™ for Stoddard Solvent. [cited 17 Jul 2008]. <http://www.atsdr.cdc.gov/tfacts79.html>. [3] ChemWatch. [updated 15 July 2004]. WD-40 Aerosol. [cited 17 Jul 2008]. Available from: <http://www.wd40.com.au/msds/ChemWatch%20MSDS%20WD-40_Aerosol.pdf>. [4] Kruger, Jerome. [updated Apr 2001]. Electrochemistry of Corrosion. Electrochemistry Encyclopedia. [cited 26 July 2008] <http://electrochem.cwru.edu/ed/encycl/art-c02-corrosion.htm>. [5] Freedman LD, Doak GO. 1956. The Preparation and Properties of Phosphonic Acid. University of North Carolina Press. [6] Sommers, Tiffany V. [updated Mar. 2005]. Octadecylphosphonate(ODP) for Corrosion Inhibition of Iron Using the T-BAG Technique. Princeton Chemistry Projects 2005. [cited 25 July 2008] <http://www.princeton.edu/~pccm/outreach/reu2005/reu2005presentations/sommers.pdf>. [7] Maege I, Jaehne E, Henke A, Adler H.-JP, Bram C, Jung C, Stratmann M. 1998. Self-assembling adhesion promoters for corrosion resistant metal polymer interfaces. Progress in Organic Coatings. 34: 1-12. [8] Schreiber F. Dec 2000. Structure and growth of self-assembling monolayers. Progress in Surface Science [cited 16 July 2008] 65: 151-256. <http://www.sciencedirect.com/science?_ob=ArticleURL&_udi=B6TJF-428DK9M-1&_user=799667&_rdoc=1&_fmt=&_orig=search&_sort=d&view=c&_acct=C000038258&_version=1&_urlVersion=0&_userid=799667&md5=274b633832f0a166f28f2213b36a4ad5>. [9] "Dissociation Constants for Common Acids and Bases." Chem Data. 23 July 2008 <http://www.csudh.edu/oliver/chemdata/data-ka.htm>. [10] Adden N, Gamble LJ, Castner DG, Hoffmann A, Gross G, Menzel H. 2006. Phosphonic Acid Monolayers for Binding of Bioactive Molecules to Titanium Surfaces. Langmuir [cited 17 Jul 2008]. 22: 8197-8204. [11] Nie HY, Walzak MJ, McIntyre NS. 2006. Delivering Octadecylphosphonic Acid Self-Assembled Monolayers on a Si Wafer and Other Oxide Surfaces. Journal of Physical Chemistry B. [cited 18 July 2008]. 110: 21101-21108. [12] Appicella T, et al. 2007. Phosphonic Acid: A Zero-Energy Approach to Teflon Replacement. New Jersey Governor’s School of the Sciences. [cited 17 July 2008]. <http://depts.drew.edu/govschl/NJGSS2007/Journal/TeamPapers/Team2.pdf>. [13] Amar H, Benzakour J, Derja A, Villemin D, Moreau B. 21 April 2003. A corrosion inhibition study of iron by phosphonic acids in sodium chloride solution. Journal of Electroanalytical Chemistry. [cited 21 July 2008]. 558: 131-139. <http://www.sciencedirect.com/science/article/B6TGB-49H122P-9/1/fcd88363592e1284e3af7d04c3a9f349.> [14] Kunjappu JT. Mar 2003. Ink chemistry. [cited 20 July 2008]. <http://www.rsc.org/chemistryworld/Issues/2003/March/inkchemistry.asp>. [15] Iroulart, Marie Gabrielle. Thermodynamic Stability of Radioactive Standard Solutions. LNE-Laboratoire National Henri Becquerel, CEA-Saclay, Gif-sur-Yvette Cedex F-91191, France. 6 May 2006. [cited 26 July 2008]. [16] PerkinElmer, Inc. “FT-IR Spectroscopy: Attenuated Total Reflectance (ATR).” 2005. [cited 22 July 2008]. <http://las.perkinelmer.com/content/TechnicalInfo/TCH_FTIRATR.pdf>.
[2-16]
APPENDIX A APPENDIX A
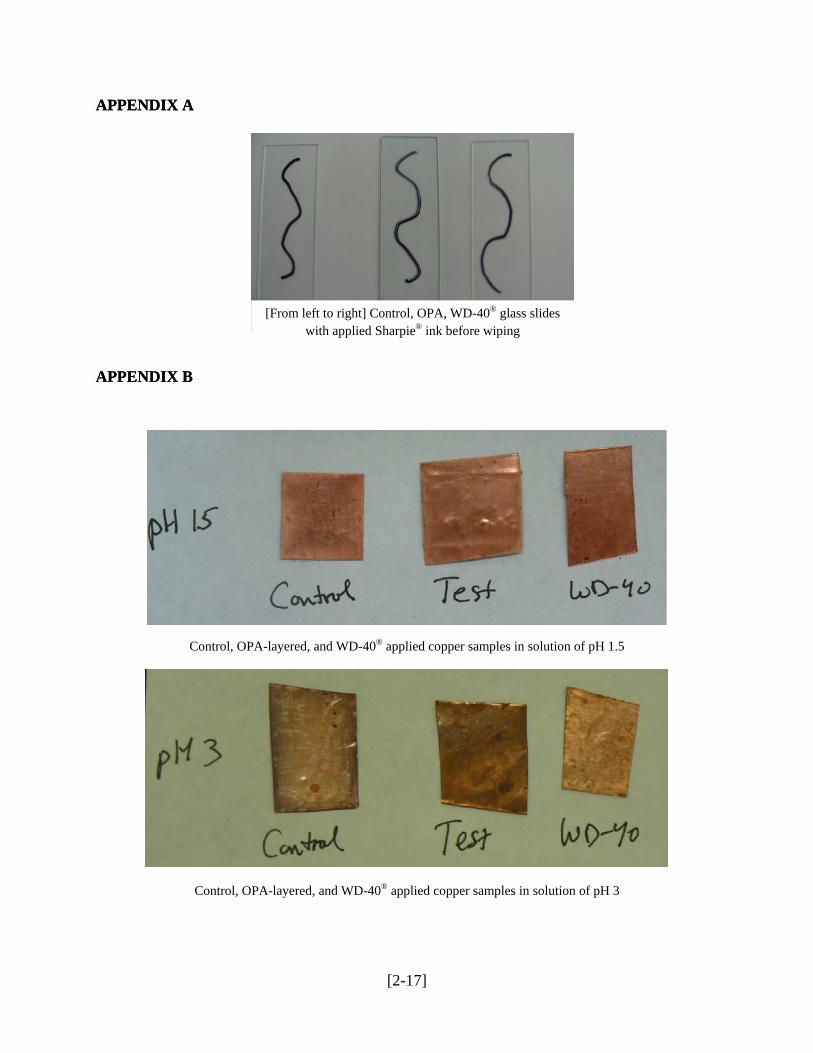
[From left to right] Control, OPA, WD-40® glass slides with applied Sharpie® ink before wiping
APPENDIX B APPENDIX B
Control, OPA-layered, and WD-40® applied copper samples in solution of pH 1.5
Control, OPA-layered, and WD-40® applied copper samples in solution of pH 3
[2-17]

Control, OPA-layered, and WD-40® applied copper samples in solution of pH 3.5
Control, OPA-layered, and WD-40® applied copper samples in solution of pH 4
Control, OPA-layered, and WD-40® applied copper samples in solution of pH 4.5
[2-18]

APPENDIX C
Water droplet on uncoated glass surface
Water droplet viewed on OPA-layered glass surface
Water droplet viewed after WD-40® application on stainless steel
Water droplet viewed on uncoated steel
Water droplet viewed on OPA-layered steel Water droplet viewed on uncoated copper
[2-19]

Water droplet viewed on OPA-layered copper
Water droplet viewed on WD-40® coated copper
[2-20]