Developing Economic Corridors in South Asia - Think Asia
258
DEVELOPING ECONOMIC CORRIDORS IN SOUTH ASIA Edited by Prabir De and Kavita Iyengar
-
Upload
khangminh22 -
Category
Documents
-
view
1 -
download
0
Transcript of Developing Economic Corridors in South Asia - Think Asia

ASIAN DEVELOPMENT BANK
6 ADB Avenue, Mandaluyong City
1550 Metro Manila, Philippines
www.adb.org
Publication Stock No.: BKK146474-2 Printed in India
Developing Economic Corridors in South Asia
As tariff-based barriers decline in South Asia, countries in the region are
recognizing the importance of transport and trade facilitation measures to
reap the benefits of trade liberalization. The next stage in regional
cooperation is the development of economic corridors. This book discusses
the shaping of economic corridors along regional transport arteries and
shows how opportunities for industrial agglomeration and expansion can
bring dynamic gains to the region. It identifies viable subcomponents to link
with principal transport networks and economic clusters while suggesting
policy measures to ensure that benefits are fully realized. Policy makers and
development economists will find this volume a valuable resource.
About the Asian Development Bank
ADB’s vision is an Asia and Pacific region free of poverty. Its mission is to
help its developing member countries reduce poverty and improve the
quality of life of their people. Despite the region’s many successes, it remains
home to approximately two-thirds of the world’s poor: 1.6 billion people
who live on less than $2 a day, with 733 million struggling on less than $1.25
a day. ADB is committed to reducing poverty through inclusive economic
growth, environmentally sustainable growth, and regional integration.
Based in Manila, ADB is owned by 67 members, including 48 from the region.
Its main instruments for helping its developing member countries are policy
dialogue, loans, equity investments, guarantees, grants, and technical
assistance.
DEVELOPINGECONOMIC CORRIDORS
IN SOUTH ASIA
Edited by Prabir De and Kavita Iyengar
ISBN 978-92-9254-510-9
9 7 8 9 2 9 2 5 4 5 1 0 9 >

DEVELOPINGECONOMIC CORRIDORS
IN SOUTH ASIA
Edited by Prabir De and Kavita Iyengar
DEVELOPINGECONOMIC CORRIDORS
IN SOUTH ASIA
Edited by Prabir De and Kavita Iyengar

© 2014 Asian Development Bank
All rights reserved. Published in 2014.Printed in India.
ISBN 978-92-9254-510-9 (Print), 978-92-9254-511-6 (PDF)Publication Stock No. BKK146474-2
Cataloging-In-Publication Data
De, P. and Iyengar, K. Developing economic corridors in South Asia.Mandaluyong City, Philippines: Asian Development Bank, 2014.
1. Regional economy. 2. Transport infrastructure. 3. Trade facilitation. I. Asian Development Bank.
The views expressed in this publication are those of the authors and do not necessarily reflect the views and policies of the Asian Development Bank (ADB) or its Board of Governors or the governments they represent.
ADB does not guarantee the accuracy of the data included in this publication and accepts no responsibility for any consequence of their use.
By making any designation of or reference to a particular territory or geographic area, or by using the term “country” in this document, ADB does not intend to make any judgments as to the legal or other status of any territory or area.
ADB encourages printing or copying information exclusively for personal and noncommercial use with proper acknowledgment of ADB. Users are restricted from reselling, redistributing, or creating derivative works for commercial purposes without the express, written consent of ADB.
Note:In this publication, “$” refers to US dollars.
Asian Development Bank6 ADB Avenue, Mandaluyong City1550 Metro Manila, PhilippinesTel +63 2 632 4444Fax +63 2 636 2444
www.adb.orgFor orders, please contact: Fax +63 2 636 [email protected]

Contents
Foreword v
Acknowledgments vii
Contributors viiiTables, Figures, Box, and Appendixes ixAbbreviations and Acronyms xiii
Overview: Making the Case for Economic Corridors in South Asia 1 Prabir De and Kavita Iyengar
Part I: Rationale, Challenges, and OpportunitiesChapter 1: Economic Corridors and Regional Economic Integration 15 Prabir De
Chapter 2: Infrastructure Development, Industrial Agglomeration 45 and Regional Trade in South Asia Chiranjib Neogi
Chapter 3: Economic Corridors, Trade Costs, and Regional Production 63 Networks in South Asia Ajitava Raychaudhuri and Prabir De
Chapter 4: Economic Corridors in South Asia: Exploring the 77 Benefits of Market Access and Trade Facilitation Selim Raihan
Part II: Case Studies
Chapter 5: Transit and Trade Facilitation across Economic 113 Corridors Connecting Bangladesh, India, and Nepal Pushpa Raj Rajkarnikar
Chapter 6: Transit and Trade Facilitation across South Asian Corridors: 139 India–Pakistan Land Connectivity Paramjit S. Sahai and Vijay Laxmi
Chapter 7: Trade Facilitation through Economic Corridors in South Asia: 157 The Pakistan Perspective Ghulam Samad and Vaqar Ahmed
Chapter 8: Trade Potential and Economic Cooperation between 179 Bangladesh and Northeast India Mohammad Masudur Rahman
Chapter 9: Economic Corridors and Pro-Poor Private Sector Development 195 in South Asia: A Case Study of Bangladesh and India Saikat Dutta and Suranjan Gupta
Appendixes 221

Foreword
South Asia needs to create more than 12 million jobs every year for sustained growth. A significant part of the jobs will have to be created in manufacturing and related logistics and services. Unlike in East and South East Asia, the manufacturing sector has underperformed in South Asia due to various constraints, which, if addressed effectively, can unlock untapped economic potential of the young demographics of South Asia. This is one of the key policy thrusts of the governments in the region. Facilitating industrial economic clusters around important transport corridors that link to global production networks—otherwise called ‘economic corridors’—is one of the important means to strengthening the manufacturing sector and creating jobs.
Economic corridors capitalize on efficient multimodal transport network within a defined geography with the help of quality infrastructure, logistics, distribution networks that link production centers, urban clusters, and international gateways. Equally important for transforming transport corridors into economic corridors is an enabling policy framework that eases doing business and non-tariff measures to facilitate trade. Economic corridors promote growth by removing infrastructure bottlenecks, improving access to markets, stimulating trade and investment and boosting productivity and efficiency through associated network externalities and agglomeration effects. They attract private investments in productive assets, which generate employment. Economic corridors also promote inclusive growth by expanding economic opportunities in backward regions and linking cities and towns with urban centers and industrial clusters.
This book describes through a series of papers, the key conditions for transforming transport corridors into economic corridors, and associated constraints. It establishes the rationale for developing economic corridors, and related benefits from production value chains along those corridors. It stresses the significant potential of economic corridors in South Asia, particularly those being developed under the South Asia Subregional Economic Cooperation program. Countries in the subregion would benefit by working closely to exploit the full economic potential of the economic corridors.
The book is a result of painstaking stakeholder consultations with policy makers, academics, businesspersons, among others. I appreciate the contribution of the South Asia Network for Economic Modeling in Dhaka, the Institute for Policy Research and Development in Kathmandu, and Research and Information System for Developing Countries (RIS) in New Delhi. I recognize the invaluable contribution of Mr. Biswajit Dhar, the then Director General of RIS in bringing together institutional partnerships, and providing the stewardship for this initiative.
vi
Developing Economic Corridors in South Asia
I hope that this book will be an important reference for policy makers, academics, and other stakeholders committed to rapid and sustainable economic growth through regional cooperation in South Asia.
Hun KimDirector General
South Asia DepartmentAsian Development Bank

Acknowledgments
The editors acknowledge the inputs from experts, policy makers, research scholars, and government officials. Paper reviewers include Syed Saif Hossain, Centre for Policy Dialogue (CPD), Dhaka and Macquarie Law School, Sydney; Fukunari Kimura, Keio University, Tokyo and Economic Research Institute of ASEAN and East Asia (ERIA), Jakarta; Javaid Mansoor, National Trade and Transport Facilitation Committee (NTTFC), Islamabad; Partha Pratim Pal, Indian Institute of Management Calcutta (IIM Calcutta), Kolkata; Sanjib Pohit, National Institute of Science Technology and Development Studies (NISTADS), New Delhi; Mustafizur Rahman, Centre for Policy Dialogue (CPD), Dhaka; Nisha Taneja, Indian Council for Research on International Economic Relations (ICRIER), New Delhi; and C. Veeramani, Indira Gandhi Institute of Development Research (IGIDR), Mumbai. Valuable comments were provided during consultation seminars by Monika Dhami, Department of Economic Affairs (DEA), Ministry of Finance, Government of India; Yuba Raj Khatiwada, Governor, Nepal Rastra Bank (NRB), Kathmandu; Purusottam Ojha, Secretary, Prime Minister’s Office (PMO), Government of Nepal, Kathmandu; Madhu Sudhan Pokhrel, Department of Custom, Government of Nepal, Kathmandu; Mozibur Rahman, Bangladesh Tariff Commission (BTC), Dhaka; K L Krishna, Centre for Economic and Social Studies (CESS), Hyderabad; Arup Mitra, Institute of Economic Growth (IEG), New Delhi; Manoj Pant, Jawaharlal Nehru University (JNU), New Delhi; Sadiq Ahmed, Policy Research Institute (PRI), Dhaka; Toufic Ahmad Chowdhury, Bangladesh Economic Association (BEA), Dhaka; Ismail Hossain, Jahangir Nagar University, Dhaka; Zaidi Sattar, Policy Research Institute (PRI), Dhaka; Helal Uddin Ahmed, SAARC Chamber of Commerce and Industry (SCCI), Dhaka; P.R. Legal, National Planning Commission (NPC), Kathmandu; Hemanta Dawadi, Federation of Nepalese Chamber of Commerce and Industry (FNCCI), Kathmandu; Shiba Devi Kafle, Nepal Rastra Bank (NRB), Kathmandu; and Posh Raj Pandey, South Asia Watch on Trade, Economics and Environment (SAWTEE), Kathmandu.
Special thanks are due to Pushpa Raj Rajkarnikar, Former Member, National Planning Commission (NPC), and Chairman, Institute for Policy Research and Development (IPRAD), Kathmandu and Selim Raihan, Dhaka University, and South Asia Network on Economic Modeling (SANEM), Dhaka; for hosting the stakeholders’ consultations at Kathmandu on 15–16 July 2011 and on 23 July 2011 at Dhaka. We are also thankful to research assistants and administrative staffs of SANEM, IPRAD and RIS for their wholehearted support to this study.

Contributors
Vaqar Ahmed Sustainable Development Policy Institute (SDPI), Islamabad
Prabir De Research and Information System for Developing Countries (RIS), New Delhi
Saikat Dutta International Policy and Trade Section, Confederation of Indian Industry (CII), New Delhi
Suranjan Gupta Engineering Export Promotion Council (EEPC), Kolkata
Kavita Iyengar Asian Development Bank (ADB), India Resident Mission, New Delhi
Vijay Laxmi Centre for Research in Rural and Industrial Development (CRRID), Chandigarh
Chiranjib Neogi Economic Research Unit, Indian Statistical Institute (ISI), Kolkata
Mohammad Masudur Rahman Bangladesh Foreign Trade Institute (BFTI), Dhaka
Selim Raihan Department of Economics, University of Dhaka, and South Asian Network on Economic Modeling (SANEM), Dhaka
Pushpa Raj Rajkarnikar Institute for Policy Research and Development (IPRAD), Kathmandu
Ajitava Raychaudhuri Centre for Advanced Studies, Department of Economics, Jadavpur University, Kolkata
Paramjit S. Sahai Centre for Research in Rural and Industrial Development (CRRID), Chandigarh
Ghulam Samad Pakistan Institute of Development Economics (PIDE), Islamabad

Tables, Figures, Box, and Appendixes
Tables1.1 Baseline Regression Results I: Cross-Section (2006) 261.2 Baseline Regression Results II: Cross-Section Pooled (1996 and 2006) 271.3 Baseline Regression Results I: Cross-Section (2006) (a) OLS (PII) 281.4 Baseline Regression Results I: Cross-Section (2006) (b) Ordered Probit (PII) 291.5 Baseline Regression Results II: Cross-Section Pooled (1996 and 2006)
(a) OLS (PII) 301.6 Baseline Regression Results II: Cross-section Pooled (1996 and 2006) (b)
Ordered Probit (PII) 311.7 Determinants of Infrastructure (Physical Infrastructure Index) 341.8 Country-Level Average Size of Governance Effect on
Regional Infrastructure 361.9 Marginal Effects of Governance on Regional Infrastructure 372.1 Panel Regression of Gravity Models 562.2 Effect of Border Cost and Time on Trade 572.3a Forces behind Industrial Agglomeration 582.3b Forces behind Industrial Agglomeration (Model with LNHW and without
LPOP and LNURBAN) 583.1 India’s Exports to South Asia 653.2 India’s Imports from South Asia 653.3 India’s Major Exports to Bangladesh 663.4 Intra-Industry Trade Index in 2007: Common Set of Products at 6-digit HS 673.5 Trade Cost Reduction if Transport Service is Liberalized 724.1 Trade among South Asian Countries in 2007 794.2 Increase in Exports and Imports among SAFTA Countries under Full SAFTA 824.3 Sensitive Lists among SAFTA Members 824.4 Exports of Top 10 Products from Bangladesh–Bhutan 834.5 Exports of Top 25 Products from Bangladesh–Nepal 844.6 Exports of Top 50 Products from Bangladesh–India 854.7 Exports of Top 44 Products from Bhutan–India 874.8 Exports of Top Eight Products from Bhutan–Nepal 894.9 Exports of Top 50 Products from India–Bangladesh 904.10 Exports of Top 25 Products from India–Bhutan 924.11 Exports of Top 50 Products from India–Nepal 934.12 Exports of Top 10 Products from Nepal–Bangladesh 944.13 Exports of Top 10 Products from Nepal–Bhutan 954.14 Exports of Top 25 Products from Nepal–India 964.15 Logistics Performance Index: South Asia vs. Other Regions in 2010 984.16 Logistics Performance Index: South Asian Countries in 2010 984.17 Enabling Trade Index in 2010 994.18 Welfare Effects of Tariff Cut and Trade Facilitation in SAFTA 1035.1 Documents, Time, and Cost Required for Export, 2006–10 119

x
Developing Economic Corridors in South Asia
5.2 Documents, Time, and Cost Required for Import, 2006–10 1205.3 Cost and Time for Completing a Trade Procedure, 2005 and 2009 1215.4 Logistics Performance Index, 2007 and 2010 1215.5 Ranking on the Ease of Doing Business, 2006–10 1225.6 Features of SAARC Highway Corridors 4 and 2 1235.7 Bangladesh Trade through Kakarvitta–Chittagong Corridor 1245.8 Documents Required in Kakarvitta–Chittagong Corridor 1255.9 Time Required in Kakarvitta–Chittagong Corridor 1265.10 Costs Involved in Kakarvitta–Chittagong Corridor 1275.11 Third-Country Trade through Birgunj–Kolkata Corridor 1285.12 Documents Required in Birgunj–Kolkata Corridor 1295.13 Time Required in Birgunj–Kolkata Corridor 1305.14 Costs Involved in Birgunj–Kolkata Corridor 1315.15 Documents, Time, and Cost in Both Corridors 1336.1 Imports from Pakistan through Attari–Wagah Border, 2007–10 1416.2 Exports to Pakistan through Wagah–Attari Border, 2007–10 1416.3 Exports to Pakistan in Trucks from Attari, 1 Oct 2007–31 Oct 2010 1426.4 Imports from Pakistan in Trucks from Wagah, 1 Oct 2007–31 Oct 2010 1436.5 Volume of Imports by Rail, 2007–10 1436.6 Volume of Exports by Rail, 2007–10 1436.7 Commodities Imported from Pakistan by Rail 1446.8 Commodities Exported to Pakistan by Rail 1456.8.1 Documents for Clearance of Export and Import Cargo 1466.9 India–Pakistan Bilateral Trade 1476.10 Reduction in Cost for Pakistan if Selected Items are Imported from India 1496.11 Constraints to Trade Facilitation 1506.12 Trade Facilitation Measures Implemented 1506.13 Trade Facilitation Measures Planned 1517.1 Quality of Infrastructure, 2010 1607.2 Trading Time and Procedures, 2010 1607.3 Road Sector in Pakistan, 1997–2009 1627.4 Rail Sector in Pakistan 1637.5 Breakup of Distances between Gwadar and Kushka (Turkmenistan) 1647.6 Cargo Handled at Karachi Port 1657.7 Trading across Borders in Pakistan: Exports 1677.8 Trading across Borders in Pakistan: Imports 1677.9 Pakistan Logistics Costs 1687.10 Pakistan–India Trade Routes 1708.1 Bangladesh’s Trade with India 1828.2 Top 10 Export (HS 2 digit) Items from Bangladesh to India in 2010 1828.3 Top 10 Export (HS 8 digit) Items from Bangladesh to India in 2010 1838.4 Export Potential of Bangladesh to Indian Market 1848.5 Capitals of Northeast India and Their Distances from Important
Centers in Bangladesh 1868.6 Per Capita Net Domestic Product of Northeast India 1868.7 Bangladesh’s Trade with Northeast India 187

xi
Tables, Figures, Box, and Appendixes
8.8 Bangladesh’s Exports through Land Customs Stations in 2010–11 1888.9 Potential Export Items to Northeast India 1898.10 Bangladesh–India Investment Scenario 1908.11 Problems in Trading with Northeast India 1909.1 India’s Trade with Bangladesh, 2005–09 1979.2 India’s Top 10 Export Commodity Groups to Bangladesh 1989.3 Top 10 Commodity Groups Imported by India from Bangladesh 1989.4 Trade Complementarity Index 1999.5 India’s Engineering Exports to Bangladesh, 2007–09 2009.6 India’s Engineering Imports from Bangladesh, 2007–09 2019.7 Bangladesh’s Exports of Light Engineering Products, 2006–09 2029.8 Land Customs Stations on India–Bangladesh Border 2049.9 Time and Money Spent by Indian and Bangladeshi Exporters 2089.10 Process Mapping of Exports 2089.11 Documents, Signatures, and Time Required for Export Clearance 2099.12 Other Fixed and Variable Costs per Shipment/Container 2109.13 Trade Route Preferred by Indian Respondents 2139.14 Trade Route Preferred by Bangladeshi Respondents 2139.15 India: Mode of Transport and Cost 2149.16 Bangladesh: Mode of Transport and Cost 2149.17 Measures Suggested for Enhancing Bilateral Trade 2149.18 Barriers Faced by Respondents in India and Bangladesh 2159.19 Potential Areas for Investment Identified by Respondents 2179.20 Factors Impeding Bilateral Investment 218
Figures1 Four Zones of Regional Corridors Development 22 Selected SAARC Road Corridors 41.1 Stages of Development of an Economic Corridor 161.2 Narrow versus Broad Corridors 161.3 Infrastructure and Regional Cooperation 181.4 Production Blocks and Service Links 191.5 Links among Income, Infrastructure and Integration 214.1 Country Shares in Intra–SAARC Imports and Exports in 2008 785.1 SAARC Highway Corridor 4 1245.2 SAARC Highway Corridor 2 1297.1 Connectivity–Growth Relation 1587.2 Processes in Trade Facilitation 1597.3 Logistics Performance Index, 2010 1617.4 Air Freight in Pakistan 1657.5 Ranking Pakistani Cities in Terms of Trading Across Borders 1667.6 Exporters Spent Most of Their Time on Paperwork 1677.7 Pakistan’s Trade with Afghanistan, 2001–10 1717.8 Afghanistan’s Transit Trade Through Pakistan 1717.9 Share of Countries Allowing Transit to Afghanistan 172
xii
Developing Economic Corridors in South Asia
8.1 Bangladesh’s Trade with India, 2004–10 1819.1 Documents Required in Indian Export to Bangladesh 208A2.1 Road Transport Route from Jalandhar to Dhaka 223
Box8.1 Transshipment in Action 185
Appendixes1 Tentative List of Economic Corridors 2212 Trade Costs Calculation and Impact of Possible Liberalization 2223 The Global Trade Analysis Project Model 2254 Commodity Classification in the Global Trade Analysis Project Model 2275 Region Aggregation in the Global Trade Analysis Project Model 2286 Interviews with Stakeholders 2297 List of Documents (Kakarvitta–Chittagong/Mongla Corridor) 2368 List of Documents (Birgunj–Kolkata Corridor) 2389 Important Agreements and Memoranda of Understanding for
Facilitating Trade and Economic Cooperation 240
Abbreviations and Acronyms
ACMA Auto Components Manufacturers’ AssociationADB Asian Development BankADBI Asian Development Bank InstituteAIFTA ASEAN–India Free Trade AgreementALTID Asian Land Transport Infrastructure DevelopmentAPTA Asia-Pacific Trade AgreementAPTTA Afghan–Pakistan Transit Trade AgreementASEAN Association of Southeast Asian NationsATTA Afghanistan Transit Trade AgreementBIMSTEC Bay of Bengal Initiative for Multisectoral Technical and Economic
CooperationBIS Bureau of Indian StandardsBPA business process analysisBSTI Bangladesh Standard and Testing InstituteBTH BIMSTEC Trilateral HighwayBTLS BIMSTEC Infrastructure Transport Logistic StudyC&F clearing and forwardingCAA Civil Aviation AuthorityCAREC Central Asia Regional Economic CooperationCBTA Cross Border Transport AgreementCDE constant difference of elasticityCES constant elasticity of substitutionCFL Central Food LaboratoryCGE computable general equilibriumCIF cost, insurance, and freightCMR Convention Relative au Contract-de Transport International de CRRID Centre for Research in Rural and Industrial DevelopmentCVD countervailing dutyCWC Central Warehousing CooperationDCCI Dhaka Chamber of Commerce and IndustriesDGCIS Directorate General of Commercial Intelligence and StatisticsDGFT Directorate General of Foreign TradeDMIC Delhi–Mumbai Industrial CorridorEAS East Asia SummitECE Economic Commission for EuropeECF Economic Corridor ForumECO Economic Cooperation OrganisationEEPC Engineering Export Promotion CouncilEPB Export Promotion BureauERIA Economic Research Institute for ASEAN and East AsiaFAP Farmers’ Association of PakistanFDI foreign direct investmentFICCI Federation of Indian Chambers of Commerce and Industry

xiv
Developing Economic Corridors in South Asia
FOB free on boardFTA free trade agreementGATT General Agreement on Tariffs and TradeGDP gross domestic productGMS Greater Mekong SubregionGMM generalized method of momentsGNP Gross National ProductGST goods and service taxGTAP Global Trade Analysis ProjectICA Investment Climate AssessmentICCI Islamabad Chamber of Commerce and IndustryICD inland container depotICP integrated check postICT information and communication technologyIDB Inter-American Development BankIEC import–export codeIIRSA Initiative for the Integration of Regional South American InfrastructureIIT intra-industry tradeIMTTH India–Myanmar–Thailand Trilateral HighwayIWT inland water transportIWTT inland water transit and tradeKPT Karachi Port TrustLC letter of creditLCS land customs stationLDC least developed countryLEIs light engineering industriesLPI Logistics Performance IndexMFN most favored nationMIEC Mekong–India Economic CorridorMOCI Ministry of Commerce and IndustryMOCS Ministry of Commerce and SuppliesMOU Memorandum of UnderstandingNAFTA North American Free Trade AgreementNBER National Bureau of Economic ResearchNBR National Board of RevenueNCAER National Council of Applied Economic ResearchNEI Northeast IndiaNHA National Highway AuthorityNHAI National Highway Authority of IndiaNLC National Logistics CellNOC no objection certificateNTB nontariff barrierNTC National Trade CorridorNTC Nepal Transport CooperationNTWC Nepal Transit and Warehousing CompanyODC over dimensional charges
xv
Abbreviations and Acronyms
OECD Organisation for Economic Co-operation and DevelopmentOLS ordinary least squaresPCI per capita incomePII Physical Infrastructure IndexPITEX Punjab International Trade ExpoPPP public–private–partnershipPRC People’s Republic of ChinaR&D research and developmentRBI Reserve Bank of IndiaRCA revealed comparative advantageRIS Research and Information System for Developing CountriesRMG readymade garmentsRTA regional trade agreementSAARC South Asian Association for Regional CooperationSAD special additional dutySAFTA South Asian Free Trade AreaSAPTA SAARC Preferential Trading ArrangementSASEC South Asia Subregional Economic CooperationSEP single entry permitSEZ special economic zone2SLS two-stage least squaresSMEs small and medium enterprisesSPS sanitary and phytosanitarySRI Silk Road InitiativeSRMTS SAARC Regional Multimodal Transport StudySSRN Social Science Research NetworkTBT technical barriers to tradeTAPI Turkmenistan–Afghanistan–Pakistan–IndiaTCD time/cost distance method TCI Trade Complementarity IndexTDAP Trade Development Authority of PakistanTEUs 20 equivalent unitsTFP total factor productionTIR Transit International RoutierUN Comtrade United Nations Commodity Trade Statistics DatabaseUNDP United Nations Development ProgrammeUNESCAP United Nations Economic and Social Commission for Asia and the
PacificUS-ITC United States International Trade CommissionWCO World Customs OrganizationWEF World Economic ForumWITS World Integrated Trade SolutionWTO World Trade Organization


1
Overview Making the Case for Economic
Corridors in South AsiaPrabir De and Kavita Iyengar
1. What are Economic Corridors?Transport and economic activity are inextricably bound with each other. Transport corridors are a set of routes that connect the economic centers within and across countries. A transport corridor encompasses several centers of economic activity. Subregional transport corridors connect to a regional transport system from urban areas in a country. Upgrading transport and energy infrastructure brings in investment to a region, initially into sectors where there is potential to develop projects. Subsequently, connectivity and growth attract investments in related sectors. Thus, a transport corridor in a geographic space is enhanced with improved infrastructure and logistics, and grows as an economic corridor. The economic corridor approach emphasizes the integration of infrastructure improvement with economic opportunities such as trade and investment, and it includes efforts to address the social and other outcomes of increased connectivity.
The economic corridor approach gained attention with the Asian Development Bank’s (ADB’s) support to the Greater Mekong Subregion (GMS). A major achievement of the GMS program is improved transport connectivity in the subregion as exemplified in the main economic corridors—the East–West, the North–South, and the Southern. The strategy adopted at the GMS Ministerial Meeting in 1992 sought to focus on investments in transport, energy, and telecommunications in the region. Asian Development Bank devised a set of three characteristics that typifies an economic corridor.
(i) It covers a small geographical space straddling a transport artery such as a road, rail, or canal.
(ii) It emphasizes bilateral rather than multilateral initiatives, focusing on strategic nodes at border crossings between two countries.
(iii) It highlights physical planning so that infrastructure development achieves positive benefits. In a national context, the concept is now increasingly used for development programs.

Developing Economic Corridors in South Asia
2
Srivastava (2011) discusses the stages of development of economic corridors. He argues that there are five stages in the transformation of a transport corridor to an economic corridor—Stage 1: Transport Corridor; Stage 2: Transport and Trade Facilitation Corridor; Stage 3: Logistics Corridor; Stage 4: Urban Development Corridor; and Stage 5: Economic Corridor. A framework for regional corridor development is based on the extent of regionality of corridors and their area of influence or width. On this basis, four zones are demarcated with interzone sequencing—Zone 1: Narrow National Corridor; Zone 2: Broad National Corridor, including area development and railroads; Zone 3: Narrow Regional Corridor, including trade facilitation and logistics; and Zone 4: Broad Regional Corridor, including cross-border economic zones (Figure 1). The development of a national corridor to a regional one, that is, the movement from Zone 2 to 3, may involve the linking of national corridors. It includes reducing barriers at national boundaries to enable moving people and goods at least cost. The growth of logistics companies has to be supported, while procedures are standardized. The private sector has a critical role in corridor development in Zone 3. And for movement to Zone 4, seamless integration requires regional plans and the coordination of national plans.
Figure 1: Four Zones of Regional Corridors Development
Zone II
Zone I
Zone IV
Zone III
National + Broad Regional + Broad
National + Narrow Regional + Narrow
(Area development,SMEs, rural roads)
(Cross-bordereconomic zones)
(Construction, upgrading) (Trade facilitation,logistics)
National Regional
Nar
row
Bro
ad
(Area development, small and medium enterprises, rural roads)
Source: Srivastava, P. 2011. Regional Corridors Development in Regional Cooperation. ADB Economics Working Paper Series No. 258. Manila: Asian Development Bank.
Various methodologies have been used to monitor the performance of corridors. The United Nations Economic and Social Commission for Asia and the Pacific (UNESCAP)

Overview: Making the Case for Economic Corridors in South Asia
3
uses the time/cost distance method (TCD) at border points or business process analysis (BPA) method, while the World Customs Organization (WCO) depends on time-release surveys.1 The time taken for the implementation of each stage affects the quality and development of an economic corridor. The corridor approach in the GMS was adopted in 1998 and a ministerial-level Economic Corridor Forum (ECF) was set up at Kunming, People’s Republic of China (PRC), in 2008 to coordinate regional initiatives. The GMS program is an advanced regional cooperation initiative, with Zone 3 activities strongly integrated into it, and the ECF providing the impetus for it growing into Zone 4 (Srivastava et. al 2012).
2. The South Asian ContextIndia is uniquely placed in South Asia. It connects most of the countries of the region that do not have contiguous borders, and also serves as a vital link between East and West Asia. Various studies have identified the important transport corridors in the region, including the ADB-supported SAARC Regional Multimodal Transport Study (SRMTS), the BIMSTEC Transport Logistics Study (BTLS), and the Asian Land Transport Infrastructure Development (ALTID) project, endorsed by UNESCAP in 1992, which includes plans for an Asian Highway (SASEC 2006).2 There are large opportunities for trade, investment, and economic growth in the region, particularly when the regional integration process is low in the region.
Each country in the region has national plans and priorities for corridor development, which include developing rural roads and rural growth centers. But transforming this into Zone 3 (Figure 1) requires the linking of national plans and corridors, a process that may not have high priority in national plans. Developing the road corridors identified by the SRMTS (Figure 2) could be a first step toward creating economic corridors in the region.
3. The Book PlanThis volume brings together important analytical work on identifying the prospects for—and challenges to—developing economic corridors in South Asia. It is divided into two parts. Part 1 provides the rationale for developing economic corridors. It also points out the benefits that can accrue from production value chains along corridors. Part 2 surveys certain transport corridors and analyzes the impediments that stand in the way of their moving to Zone 4. Connectivity emerges as central to regional and global economic cooperation in South Asia.
In Chapter 1, Prabir De empirically analyzes the linkages between economic corridors and regional integration. He sees a strengthening of ties among countries of the region after the South Asian Free Trade Area (SAFTA) agreement and the ASEAN-India Free Trade Agreement (AIFTA) in 2010, and argues that this will encourage more intra- and inter- regional fragmentation of production and services.3 Economic corridors
1 World Bank (2010) and Doing Business indicators (World Bank, various years) calculate the average performance at the corridors to compute a measure for the country as a whole.
2 South Asian Association for Regional Cooperation (SAARC); Bay of Bengal Initiative for Multisectoral Technical and Economic Cooperation (BIMSTEC)
3 Association of South East Asian Nations (ASEAN)

Developing Economic Corridors in South Asia
4
SAARC Road CorridorsFi
gure
2 :
Sele
cted
SA
AR
C R
oad
Cor
rido
rs
025
50
75
100
Kilo
mete
rs
N
SAARC C
orr
idor
1
SAARC C
orr
idor
2
SAARC C
orr
idor
3
SAARC C
orr
idor
4
SAARC C
orr
idor
5
SAARC C
orr
idor
6
SAARC C
orr
idor
7
SAARC C
orr
idor
8
SAARC C
orr
idor
9
SAARC C
orr
idor
10
SA
AR
C R
oa
d C
orr
ido
rs
Hald
ia P
ort
Ru
paid
iha
Kakarv
itta
Bir
gu
nj
Raxau
l
Ph
ulb
ari
Bh
air
ah
aw
a
Ag
art
ala
Ph
uen
tsh
olin
g
KA
TH
MA
ND
U
DE
LH
I
DH
AK
A
Mo
ng
du
Bu
rim
ari
Ch
en
gra
ban
dh
a
Jaig
ao
n
Rajs
hah
i
Tan
gail
Mald
a
Ran
gp
ur J
esso
re
Mo
ng
la
Sh
illo
ng
Go
rakh
pu
r
Mo
rad
ab
ad
Bara
ban
ki
Lu
ckn
ow
Am
rits
ar
Ch
an
dig
arh
Am
bala
Lah
ore
Barh
i
Hald
ia
Gu
wah
ati
Bu
twal
Silig
uri
Asan
so
l
Vara
nasi
M Y
A N
M A
R
BH
UT
AN
N
E
P A
L
I N
D
I
A
PA
KIS
T A
N
I N
D
I
AP
an
itan
ki
Ko
lkata
Akh
au
ra
Ban
gla
ban
dh
a
Nep
alg
un
j
B a
y o
f B
e n
g a
l
Ch
itta
go
ng
BA
NG
LA
DE
SH
Th
is m
ap
wa
s p
rod
uc
ed
by
th
e c
art
og
rap
hy
un
it o
f th
e A
sia
n D
ev
elo
pm
en
t B
an
k.
Th
e b
ou
nd
ari
es
, c
olo
rs,
de
no
min
ati
on
s,
an
d a
ny
oth
er
info
rma
tio
n s
ho
wn
on
th
is
ma
p d
o n
ot
imp
ly,
on
th
e p
art
of
the
As
ian
De
ve
lop
me
nt
Ba
nk
, a
ny
ju
dg
me
nt
on
th
e
leg
al
sta
tus
of
an
y t
err
ito
ry,
or
an
y e
nd
ors
em
en
t o
r a
cc
ep
tan
ce
of
su
ch
bo
un
da
rie
s,
co
lors
, d
en
om
ina
tio
ns
, o
r in
form
ati
on
.

Overview: Making the Case for Economic Corridors in South Asia
5
intensify vertical intra-industry trade, and by keeping real trade costs and trade and transport logistics barriers low, countries may realize the potential of higher production-sharing arrangements. The drivers of such trade go beyond relative factor endowments, to those such as the complementary use of information and communication technologies, and natural geographies, which leads to clustering, agglomeration, and scale effects. An important role is played by institutions because transaction costs are far higher if economic actors cannot fully trust property rights or the rule of law. De shows the links between institutions and trade, and how they influence each other, while stressing that it is the interaction between institutions and organizations that shapes the institutional evolution of an economy or a region.
Through a simple model to identify the determinants of regional infrastructure, De finds that countries with higher income, stronger institutions, good governance, and relatively open economies are likely to have higher levels of regional infrastructure. De observes that the demand for physical connectivity has increased in recent years to support export-led growth strategies and fragmented production networks. Economic corridors also attract private-sector investments, which generate employment. To realize the potential of subregional networks, their integration to proposed South Asian arteries has to be examined. The task is two-fold: first, integrating the different subregional economic corridors and modes of transport (railways, roads, air, and shipping) that facilitate the movement of goods and services in the region and beyond; and second, overcoming institutional constraints and bottlenecks that are hurting regional competitiveness by making trade expensive. The need to harmonize laws and processes among countries is emphasized.
The first step pertains to facilitating land transport, and South Asian countries ought to examine and adopt the seven major international conventions in this field.4 Integrated and intermodal connectivity would provide immense benefits to landlocked Afghanistan, Bhutan, and Nepal by giving them access to global markets at lower costs. Prioritizing South Asian corridor projects and enhancing regional integration through regional transit in a time-bound manner will facilitate the process of developing economic corridors.
Further, developing economic corridors requires soft infrastructure, and the relevant rules, regulations, and standards need to be in place. A common regional structure with an international design, similar to the Cross Border Transport Agreement (CBTA) adopted by the GMS countries, will improve the integration of South Asian countries. Coordination among the stakeholders and agencies concerned, such as transport, customs, immigration, and standard quarantine authorities, is required to help achieve single-stop and single-window customs along corridors. A financing mechanism to mobilize savings for infrastructure development needs to be devised. This could come from the public and private sectors, and multilateral development banks, and could
4 The seven international conventions are (i) The Convention on Road Traffic, 1968; (ii) The Convention on Road Signs and Signals, 1968; (iii) The Customs Conventions on the International Transport of Goods under Cover of TIR Carnets (TIR Convention), 1975; (iv) The Customs Convention on the Temporary Importation of Commercial Road Vehicles, 1956; (v) The Customs Convention on Container, 1972; (vi) The International Convention on the Harmonisation of Frontier Controls of Goods, 1982; and (vii) The Convention on the Contract for the International Carriage of Goods by Road (CMR), 1956.

Developing Economic Corridors in South Asia
6
follow a public-private partnership (PPP) model, with larger economies such as Japan, Republic of Korea, PRC, and India filling the financing gap.
In Chapter 2, Chiranjib Neogi emphasizes the need to adopt a comprehensive approach, stating that investments in priority infrastructure sectors such as transport, energy, telecommunications, and tourism in the same geographic space will maximize development impact, while minimizing development costs. Regional trade also promotes technology transfer from high-income countries to lower income ones. Studies have found that access to foreign technology is a significant determinant of the rate of total factor productivity (TFP) across the Organisation for Economic Co-operation and Development (OECD) and developing countries. The chapter analyzes the impact of transport cost and time on regional trade, and demonstrates the role of land infrastructure on agglomeration of industries in India. Looking into the role of cities in economic growth and technological progress, economic geography increasingly discerns a positive correlation between spatial agglomeration and growth.
Industrial agglomeration is influenced by two forces—forward linkages and backward linkages. If the location of an industry is such that it generates a high demand of goods, it offers a high backward linkage. Firms may also need good access to the products of other firms as inputs of production, and if the location provides a variety of goods as input, it offers a high forward linkage. However, there are some forces that act against agglomeration forces. A highly populated region offers a strong backward linkage, but land costs and rents, as well as the wage rates of skilled labor, will be high. If the forward and backward linkages are strong enough to overweigh the negative location effects, industrial agglomeration takes place. The transportation of raw materials and final goods also plays a major role. Agglomeration of industries in a specific location such as a special economic zone (SEZ) can provide better scope for exporting and importing industries. For less-developed regions in a country, the agglomeration of industries through a policy of trade liberalization will be beneficial, and cross-border road transportation will play a vital role in accentuating regional development.
Neogi estimates an augmented gravity model to analyze trade flows between countries of the South Asian region. Incorporating policy variables such as tariff rates, the forces behind industrial agglomeration are identified. Industrial concentration is measured at the regional level with industry-level data. There are differences in the factors responsible for industrial agglomeration in cross-border trade. Neogi points out that the new economic geography theory underplays economic policies and geography. When trade costs are in a certain range, both agglomeration and diversification are possible equilibriums, so history and policy have a potential role in influencing the equilibrium. The chapter tests the roles of both policies and history in influencing agglomeration. The findings corroborate the expected effects of border cost and time on trade volume. It confirms that agglomeration of industries in India, among other things, depends on new economic geography variables such as infrastructural facilities in the border region, and human capital. Thus, developed infrastructure in the border region facilitates trade and regional development through agglomeration of industries.

Overview: Making the Case for Economic Corridors in South Asia
7
In Chapter 3, Ajitava Raychaudhuri and Prabir De find that low trade costs do not necessarily promote production networks. They present stylized facts at the outset—infrastructure provides access to markets, promotes trade and economies of scale, and allows for agglomeration to come into play along transport routes; a seamless movement of goods is key to reducing trade costs; and high transport and logistics costs impede competition. The authors then examine the intra-industry trade potential between India and Bangladesh using the intra-industry trade (IIT) index so as to identify the scope for production networks and vertical trade. There are production-sharing opportunities in a static sense in 11 products with varying potential, from the textile and clothing sector with the most concentration to iron and steel with the least. Electrical machinery and equipment, and mechanical appliances fall in the middle of the value chain. The index scores indicate that there are only two sectors in which intra-industry trade accounted for a moderate share between India and Bangladesh—the textile and clothing, and electrical machinery and mechanical appliances sectors. In other sectors, intra-industry trade has a low or negligible share.
Textile yarn and fabrics exports from India to Bangladesh are examined. Bangladesh depends heavily on India for these inputs to produce readymade garments (RMG), which fetch more than 75% of its export earnings. A modified Deardorff model is used along with survey data, following the standard supply chain logic at two locations, Ludhiana in Punjab, which is a major yarn supplier to Bangladesh, and Dhaka, a leading RMG production center. In this case, the cross-border trade is only in raw materials, as the machines are procured mainly from PRC and Italy. Fragmentation in terms of processes is limited, though a network in terms of services may be possible. There may be gains from liberalizing services like banking and insurance, but these may not promote production networks. Yet, a production network always benefits from services trade liberalization. The authors conclude that since intraregional trade in South Asia is not always aligned to the global comparative advantage of nations in the region, the creation of production networks appear far more difficult than liberalization of services trade.
In Chapter 4, Selim Raihan explores the benefits of market access and trade facilitation in the countries of the South Asia Subregional Economic Cooperation (SASEC) program—Bangladesh, Bhutan, India, and Nepal. The study analyzes the potential impact better market access to India will have on Bangladesh’s trade and economic growth, as well as the effects improved physical connectivity will have on the SASEC countries. It applies a partial equilibrium model to explore the impact of better market access on bilateral trade among the SASEC countries, and a computable general equilibrium (CGE) model to assess regional welfare effects, factoring in trade facilitation issues. This study also conducts a field survey on trade facilitation at the firm level in Bangladesh to understand its importance on subregional trade. The costs of trading across borders in South Asia are high, especially among the SASEC countries, and trade facilitation is very important to enhance trade flows. Import duties are falling in most product categories in these countries, and the scope for gain through tariff reductions is increasingly limited. However, there is significant opportunity to generate through reducing transaction costs, and facilitating faster transportation. In the case of

Developing Economic Corridors in South Asia
8
market access, the analysis suggests that much of the potential for higher exports among the SASEC countries is restricted by the sensitive lists under SAFTA. In recent years, India has liberalized its sensitive list to a great extent. However, garment exporters in Bangladesh are concerned about nontariff barriers (NTBs) that restrict their exports. A reduction in NTBs will enhance the market access of these countries and help develop economic corridors.
Results from surveys among countries in the region and selected case studies are presented in Part II. The Nepal perspective is presented by Pushpa Raj Rajkarnikar in Chapter 5. Two transport corridors in Nepal, again in the SASEC region, are examined as they play a crucial role in the movement of transit traffic to and from the country—Kathmandu–Birgunj in Nepal to Kolkata or Haldia in India, and Kathmandu–Kakarvitta in Nepal through Panitanki–Phulbari in India to either Mongla or Chittagong in Bangladesh. The chapter identifies reform measures for enhanced trade. It covers customs and other border institutions and their governance, transit formalities, dispute settlement, safeguards, information flow, and other important aspects of trade facilitation, all necessary to develop economic corridors. A review of international agreements is also undertaken. Road transport is the most dominant mode of transportation in South Asia. Rajkarnikar stresses that these transport corridors can turn into economic corridors only if the quality of the transit regime improves, and institutions deliver services more efficiently.
Land connectivity between India and Pakistan is examined by Paramjit S. Sahai and Vijay Laxmi in Chapter 6, with a survey on the Wagah–Attari land route, which connects Amritsar in India with Lahore in Pakistan. Historically, this was a part of the Grand Trunk Road that linked Kolkata to Lahore. It continued to occupy a strategic position as a trade and transit route even after the partition of the subcontinent in 1947, but the 1965 India–Pakistan war put an end to it. The land route is largely used for the export of fresh vegetables and other agricultural commodities to Pakistan. It is also used for imports of cargo from Afghanistan to India, but not for Indian exports to Afghanistan. The rail route is primarily used for import of goods such as cement, rock salt, and dry dates from Pakistan. Transforming this into an economic corridor does not require creating a new one, but only re-operationalizing the erstwhile corridor. A multipronged effort is emphasized for increasing areas of collaboration, ranging from energy to investments.
Pakistan’s perspective is presented in Chapter 7 by Ghulam Samad and Vaqar Ahmed. Currently, Pakistan is developing a National Trade Corridor (NTC), and opening its transport and communication sectors to foreign direct investment. Linking to Central Asia and South Asia by road and rail is high on the agenda of the government. Of the $9 billion allocated for developing the NTC, $5 billion is for improving the country’s highways, $1.5 billion on Pakistan Railways for additional tracks, and the remaining amount for improving ports, airports, and other facilities. Trade zones are to be established along motorways to promote exports and reduce the cost of doing business. The authors examine three road corridors in Pakistan, one linking India–Pakistan–Afghanistan and two linking Pakistan with Afghanistan. Pakistan has taken initiatives to improve the transport logistics chain linking major ports in the south and south-west to industrial centers and neighboring countries.

Overview: Making the Case for Economic Corridors in South Asia
9
Nearly 80% of goods traded between Afghanistan and Pakistan is transported by private trucks authorized by the National Logistics Cell (NLC). There are now only two items in the negative list (cigarettes and auto parts), and the new trade treaty between the countries signed in 2010 includes free transit. This allows Pakistan access to Central Asia and Afghanistan access to Pakistan’s sea ports as well as Wagah for exports to India. Surveys reveal the absence of regional production networks in key industries, and complex and cumbersome procedures as major bottlenecks to trade. The high cost of uncertainty of trading with Afghanistan and India, quantitatively the highest in the world, is exacerbated by lack of infrastructural facilities and restrictive policies on intra-regional investment in Afghanistan. The survey also indicated, the volume of informal trade is large, but it is difficult to quantify. In overall infrastructure, Pakistan is almost on at par with regional competitors, but fares poorly in organizing and managing it.
In Chapter 8, Mohammad Masudur Rahman points out that India is Bangladesh’s fourth most important trading partner, and accounted for 9.1% of its global trade in 2010. India–Bangladesh relations have been on a firm footing since 2010, and realizing the trade potential with Northeast India (NEI) would be advantageous to both countries. Bangladesh’s trade with NEI was $50.45 million in exports and $237.6 million in imports in 2009. The share of exports to NEI was about 23.4% of Bangladesh’s total exports to India in 2010, and this is rising. The major items of export from Bangladesh to NEI included RMG, processed food, cement, pharmaceuticals, ceramic tiles, and hosiery. The main imports from NEI were agricultural products, fruits, and food items.
It has been estimated that even if 25% of the cargo between NEI and the rest of India is allowed to pass through Bangladesh, it would generate revenue earnings of $400 million. This would also help increase the purchasing power of the people and generate opportunities for higher exports to the region. The study identifies 23 items at the HS 6 digit level of trade classification that Bangladesh could export to the Indian market, which includes apparel products and accessories, fabrics, cement, jute and jute products, footwear, bicycle parts, and electrical equipment. Bangladesh has a clear price advantage in major export items such as jute, cement, plants and parts of plants, bicycle parts, and dyed plain cotton weaves. South Asian Free Trade Agreement, BIMSTEC, and Asia-Pacific Trade Agreement (APTA) could enhance trading opportunities. Among the survey’s respondents, 90% mentioned lack of connectivity, including weak road links, and lack of direct trains and flights between Bangladesh and NEI are the major constraints to trade.
Rahman highlights that economic corridors could facilitate trade, and persuade the private sector to push the pace of transformation. Bangladesh could emerge as a transport hub for the SASEC region if it opens up its transport system to provide regional connectivity. The two important corridors between Bangladesh and NEI identified by the SRMTS are Samdrup Jongkhar–Shillong–Sylhet–Dhaka–Kolkata, and Agartala–Akhaura–Chittagong. These corridors need to simultaneously develop telecommunications, energy infrastructure, and tourism, all with private-sector participation. The important issues that have to be addressed for effective economic corridors include cross-border investment liberalization policies, agribusiness

Developing Economic Corridors in South Asia
10
development, infrastructural improvements at the gateway nodes, secondary roads to allow rural communities to access the main artery, business development services for micro and small businesses in poorer areas, and coordination of tourism initiatives at all levels. Northeast India with a population of around 40 million and market size of about $20 billion offers an attractive opportunity to Bangladesh. Providing connectivity and use of port facilities would open up the region, and significantly enhance Bangladesh’s exports to it.
In Chapter 9, Saikat Dutta and Suranjan Gupta argue that the implementation of SAFTA in letter and spirit is a prerequisite to creating an encouraging environment for South Asia’s small and medium enterprises (SMEs). Small and medium enterprises constitute a very important part of the private sector and their role in providing productive employment and earning opportunities cannot be ignored by policymakers. They argue that the development of SMEs will help Bangladesh exploit the social benefits from greater competition and entrepreneurship. An analysis of the trade basket shows that certain types of goods from Bangladesh find a ready market in India. Light engineering industries (LEIs) are a significant segment of the Bangladesh economy, contributing to employment, output, value addition, and exports.
Connectivity to NEI is stressed, while nonprice factors such as administrative processes, government rules and regulations, and infrastructural bottlenecks are also discussed. Though facilitation measures are introduced, such as the electronic data interchange system (EDI) at India’s customs office at Petrapole, implementation often suffers because of poor planning and lack of capacity. Other NTBs are also discussed. Dutta and Gupta conclude that with seamless connectivity and removal of bottlenecks, India and Bangladesh have the potential to drive the economic growth of South Asia and development of economic corridors, which will go a long way toward alleviating poverty in the region.
Thus, a common thread that runs through all the chapters is that regional trade liberalization (for example, SAFTA) per se has not been able to achieve the desired increase in intraregional trade. Infrastructure development, capacity-building measures, removal of NTBs, and supportive policies and institutions that promote economic activities along identified transport corridors are essential to increase regional trade and economic welfare, and convert cross-border corridors into bona fide economic corridors.

Overview: Making the Case for Economic Corridors in South Asia
11
References
SASEC. 2006. SAARC Regional Multimodal Transport Study. Kathmandu, Nepal: South Asian Association for Regional Cooperation (SAARC) Secretariat.
Srivastava, P. 2011. Regional Corridors Development in Regional Cooperation. ADB Economics Working Paper Series No 258. Manila: Asian Development Bank.
Srivastava, P. and U. Kumar, eds. 2012. Trade and Trade Facilitation in The Greater Mekong Subregion. Manila: Asian Development Bank.
World Bank. 2010. Logistics Performances Index 2010. Trade Logistics and Facilitation. Washington, DC: World Bank. http://www.worldbank.org/INTLF/Resources/LPI-2010-for-web.pdf
World Bank. Various years. Doing Business Reports. Various issues. Washington, DC: World Bank. http://www.doingbusiness.org


I. Rationale, Challenges, and Opportunities


15
Chapter 1
Economic Corridors and Regional Economic Integration
Prabir De
1. IntroductionSouth Asia’s diversity provides huge opportunities for trade, investment, and economic growth, as the region’s remarkable success in recent decades shows. Its economies have flourished, becoming more closely intertwined with each other and the rest of the world. South Asia in general and its largest economy, India, now play an increasingly important role in the global economy. With India’s free trade agreement (FTA) with the Association of Southeast Asian Nations (ASEAN) in 2010 and the South Asian Free Trade Area (SAFTA) agreement in 2006, economic integration between South and East Asia is set to gain momentum. This will encourage more fragmentation of production and services between the two regions if the regional economy is adequately supported by cross-border infrastructure facilities, both hardware and software. A well-planned regional infrastructure would not only reduce trade costs, but also encourage efficiency-seeking industrial restructuring. On the one hand, economic corridors are meant to fill regional infrastructure gaps, and, on the other, promote pro-poor socio-economic development. They help increase trade flows, create employment, and reduce poverty.1
Sustained economic growth over the past decade and a half has increased the demand for transport services. Efficient transport networks have become very important to regional cooperation, in both absolute and relative terms, as tariff-based barriers have generally diminished. Better infrastructure, for example, through economic corridors, would encourage production networks across South Asia, enhance regional and global trade, and help accelerate the region’s economic integration.
1 The economic corridor is a relatively new concept in Asia, motivated by the Asian Development Bank’s Greater Mekong Subregion (GMS) economic corridors. As of now, 12 regional economic corridors are being developed across Asia (see Appendix 1).

Developing Economic Corridors in South Asia
16
In view of the above, the broader objective in this chapter is to investigate the role of institutions and governance in economic corridors. In particular, it attempts to identify the potential of and the obstacles to South Asia’s road to economic corridors and presents a vision for South Asian economic corridors, including the tasks needed to achieve this. It further attempts to identify regional infrastructure challenges, and recommends to address them.
2. Role of Economic Corridors: Literature SurveyThere is no clear definition of an economic corridor in the literature. The concept became popular through the ADB Greater Mekong Subregion (GMS) project. In general, an economic corridor is infrastructure that helps facilitate economic activities. Figure 1.1 shows the stages in the development of an economic corridor. We see an economic corridor as public capital summed over transportation networks, human resources, communication facilities, energy grids, and institutional infrastructure. An economic corridor can be national (for example, Delhi—Mumbai Industrial Corridor), regional (for example, the GMS corridors), or even international (for example, submarine telecommunication cables). Trade facilitation and logistics services are the main catalysts in its development.
Figure 1.1: Stages of Development of an Economic Corridor
etc
As Srivastava (2011) notes, a corridor begins with physical connectivity, a road or a highway connecting two or more nodes. It is natural to view it as the means of transport, and this view is useful and practical. But a corridor comprises not only the highway, but also the areas around it that use it. The relationship between the development of connectivity and the areas or zones around the connecting infrastructure is not always direct in terms of causality—the demand for connectivity may arise from developed areas already in existence, or connectivity may lead to new or further development. The concepts of narrow and broad corridors are depicted in Figure 1.2, where Y and X denote two nodes connected by a highway.
Figure 1.2: Narrow versus Broad Corridors
A
Corridor
CA+ C
B+ C
H < C
AB
X Y
B
Source: Srivastava, P. 2011. Regional Corridors Development in Regional Cooperation. ADB Economics Working Paper Series No. 258. Manila: Asian Development Bank.

Economic Corridors and Regional Economic Integration
17
A narrowly defined corridor comprises a highway/corridor X and Y, and the arrow in the middle (highway/corridor) simply connects X and Y. But consider the points A and B off the highway. Let CA represent the cost of moving from A to the highway, and CB represent the same for B. Presumably, CA (CB) depends upon the distance between A and the highway, the road conditions that determine fuel costs and the cost of wear and tear, the speed or time of travel, the availability of vehicles appropriate to the road, and other factors such as road maintenance, and local taxes and surcharges.
The choice of moving from A to B is between going directly across, and going to the highway from A, traveling along the highway and then getting off to reach B. If the cost of directly going from A to B is CAB, and the cost of traveling on the highway is CH, it is better to go from A to B via the highway if CA + CB + CH ≤ CAB. All points off the highway like A and B that satisfy this relationship can be deemed to be part of the corridor, which would then constitute a broader view of the corridor connecting “X” and “Y”.
In most developing economies, the lack of economic corridors, viewed as stocks of public capital, is a major constraint on growth. Inadequate infrastructure causes congestion, resulting in diminishing returns to capital in industry. The low rate of return acts as a disincentive to investment. This implies a low rate of labor absorption, which perpetuates a vicious circle of poverty. An economic corridor is a bulky commodity, such as a highway, and it calls for a large investment of capital and long gestation lags. But the service flows generated by economic corridors are often characterized by public good features—nonrivalry and nonexcludability—though the extent could vary across services.
Economic corridors play a key role in integrating economies across regions. Some of their environmental effects notwithstanding, well-functioning and efficient economic corridors are essential for the development of a region. For example, reducing the costs of transportation, both within and across regions, improves international market access, increases income, and reduces poverty. Regional infrastructure’s relation to welfare can be seen in both direct (through changes in distribution), and indirect (through wider growth effects and stimulating economic activity) terms. Therefore, economic corridors have been viewed as major determinants of economic integration (Vickerman 2002). They not only increase intraregional trade and investment, but also play a pivotal role in integrating economies across a region. It is well argued in the literature that regional integration slows down if countries are not interlinked through modern transportation and communication networks. The three distinct features reported are:
(i) Economic corridors have always played a key role in integrating economies across a region (Vickerman 2002).
(ii) Economic corridors’ relation to welfare can be seen in both direct and indirect terms (Venables 2007).
(iii) Economic corridors have become important building blocks of regional economic integration in an era of globalization (Kuroda et al. 2007).
Why do we need to focus on economic corridors? How do they differ from transport corridors? The literature suggests economic corridors have three specific

Developing Economic Corridors in South Asia
18
advantages over transport corridors. First, economic corridors help ease the demand for infrastructure, generating more output. Improved economic corridors help ease the demand for infrastructure services, generating more output. Second, efficient economic corridor networks are important to regional cooperation, in both absolute and relative terms, as tariff-based barriers have declined. Economic corridors help facilitate trade and investment, fostering regional integration. Third, better infrastructure (supply links) encourages fragmentation of production in a region, and enhances regional and global trade, expediting regional integration.
Figure 1.3: Infrastructure and Regional Cooperation
c
c flows
integration
c
Source: Brooks, D.H. and J. Menon, ed. 2008. Infrastructure and Trade in Asia. Cheltanham: Edward Elgar
The positive link between infrastructure and regional cooperation is well captured in Figure 1.3. Improved infrastructure reduces trade costs, generating higher trade flows through changes in comparative advantages. Higher trade facilitates regional integration in the long run, other things being equal. Finally, to sustain the integration, we need stronger regional cooperation.
Do improved economic corridors intensify vertical intra-industry trade? By driving down real trade costs, and lowering trade and transport logistics barriers, countries

Economic Corridors and Regional Economic Integration
19
may realize the potential of production-sharing arrangements. The drivers of such trade go beyond relative factor endowments to factors such as the complementary use of information, and communication technologies, and natural geographies (clustering, agglomeration, and scale effects). Kimura and Kobayashi (2009) argue that the key to attracting fragmented production blocks is (i) improving locational advantages by, for example, developing special economic zones (SEZs) with an improved climate for local investment; and (ii) reducing the cost of service links that connect remote production blocs by improving trade and transport facilities. Figure 1.4 shows the links between production blocks, illustrating why improved economic corridors between countries are important to strengthening production networks. In fragmentation of production, improved service links and better connectivity are important for the expansion of production networks across a region.
Figure 1.4: Production Blocks and Service Links
Large integrated factory
PB PBSL SL
SL
SL SL
PB
PB
PB : production blocksSL : service links
PB
After fragmentation
Before fragmentation
Source: Kimura, F. and I. Kobayashi. 2009. Why is the East Asia Industrial Corridor Needed? Policy Brief 2009–01. Jakarta: Economic Research Institute for ASEAN and East Asia.
Given the rapid growth of regional economic activities, in South Asia, economic corridors have become a strong catalyst regional economic integration. The development of infrastructure across the region, especially transport links and energy pipelines, is under way, and this is expected to contribute to integration by reducing transportation costs and facilitating intraregional trade and services.
South Asia’s merchandise trade due to regional and bilateral, FTAs, is expected to increase substantially in the coming years.2 Accompanying this will be an increase in demand for national and international infrastructure services, for both production
2 For example, SAFTA, India–Sri Lanka FTA, Sri Lanka–Pakistan FTA, India–Nepal FTA, and India–Bhutan FTA.

Developing Economic Corridors in South Asia
20
and consumption, and international trade. A failure to respond to this demand will slow down the region’s trade and hamper growth. Therefore, the infrastructure challenges South Asian countries face require better understanding and adequate support, and the region has to have a comprehensive policy that aims to achieve the following objectives:
(i) Exploiting synergies in the transportation system (ii) Moving toward an open and free market and integrated borders for transport
services (iii) Improving economic efficiency to reduce transportation costs (iv) Completing the South Asian transport network and improving links with other
regions/subregions (v) Encouraging the use of different modes of transportation
The challenges can broadly be divided into two segments. One, the hardware aspects, such as transport facilities (physical infrastructure, logistics networks, maintenance), that are important to ensure the flow of goods and services within and across South Asia and beyond. Two, the software aspects, such as trade facilities (standards, customs, time and cost spent at borders, institutions and governance, dispute settlement, safeguards), that are crucial to making the hardware work efficiently. Both will need drastic intervention from governments and policymakers. At the same time, a strategic partnership for policy development, and an action plan to foster regional cooperation and integration have to be in place.
Economic corridors are meant to serve as a blueprint for enhanced connectivity, increased competitiveness, and a greater sense of community in a region. In particular, they have specific benefits as follows:3
(i) Improving national and regional connectivity by making it faster, cheaper, and easier for people and goods to move within and across borders
(ii) Reducing the cost of national, regional, and global trade, thus enhancing the competitiveness of national and regional production networks, and promoting greater investment
(iii) Promoting greater national, regional, and global integration, and thus faster economic growth
(iv) Helping reduce poverty by improving poor people’s access to economic opportunities, lowering the cost of goods and services they consume, and providing better access to essential infrastructure services such as electricity
(v) Helping narrow development gaps among regional economies by providing small, poor, landlocked, and remote countries and areas with better access to regional markets and production networks, thereby stimulating investment, trade, and economic growth in those areas
(vi) Promoting greener technologies and a more efficient use of regional resources, such as gas reserves and rivers with hydroelectric potential, by developing cross-border projects that permit regional energy trade
3 This draws on ADB–ADBI (2009), ADB (2006), ADB (2009), ADB (2006a), and ADB (2006b), among others.

Economic Corridors and Regional Economic Integration
21
3. Economic Corridors, Institutions, and Growth: Empirical Linkages
Economic corridors are an important determinant of economic growth and income levels (Figure 1.5), since they affect, for example, transaction costs (Aron 2000; Rodrik et al. 2002). Transaction costs are high if economic actors cannot fully trust property rights or the rule of law. They then operate on a small scale, use inexpensive but less-efficient technologies, and are less competitive. They may even retreat to the black market economy and rely on corruption to facilitate operations (Busse et al. 2007). Overall, the impact of institutional quality on income levels can be explained through three different channels—(i) information asymmetries, as institutions channel information about market conditions, goods, and participants; (ii) reduced risk, as institutions define and enforce property rights; and (iii) restrictions on the actions of politicians and interest groups, as institutions make them accountable to citizens (Rodrik et al. 2002; WTO 2004). There may also be a reverse influence from income levels on institutions and governance, since citizens in richer countries are likely to have a stronger preference (as well as the knowledge and resources) for high-quality institutions and good governance.
Figure 1.5: Links across Income, Infrastructure and Integration
Note: In nontechnical terms, a variable is endogenous in a model if it is at least partly a function of other parameters and variables in the model, whereas a variable is exogenous to a model if it is not determined by other parameters and variables in the model, but is set externally, and changes to it come from external forces. An arrow indicates a causal direction.
Sources: (i) Rodrik, D., A. Subramanian and F. Trebbi. 2002. Institutions Rule: The Primacy of Institutions over Geography and Integration in Economic Development, NBER Working Paper 9305. Cambridge: National Bureau of Economic Research.
(ii) Busse, M., A. Borrmann, S. Fischer and S. Gröning. 2007. Institutions, Governance and Trade: An Empirical Investigation of the Linkage in Views of the Proposed ACP/EU Economic Partnership Agreements. Hamburg: Hamburg Institute of International Economics.

Developing Economic Corridors in South Asia
22
In addition to institutions and governance, trade has a positive effect on income levels (Figure 1.5). Economic growth rates and income levels are likely to rise from comparative advantages in particular goods, economies of scale in production, and availability of technology spillovers, and knowledge information. However, the extent to which a country is integrated with the rest of the world is endogenous in that trade influences economic growth rates and vice versa. For example, trade may boost welfare in the medium to long term, but expanded trade may be the outcome of increased productivity levels, which could be an attribute of the market attractiveness and competitiveness of a particular nation.
Institutions may also have an indirect impact on income levels through trade, as high-quality institutions reduce the risk premium required for international trade. Conversely, trade may influence the quality of institutions and their governance. From a theoretical perspective, there are three main channels for a positive linkage. First, economic agents in open economies may learn from their experience in other countries and adapt (or imitate) successful institutions and regulations. Second, international competition may force countries to improve their institutional and regulatory mechanisms. Third, rent-seeking and corruption may be harder in more open economies, as foreign firms increase the number of economic agents involved (Rajan and Zingales 2003). Better regional institutions improve the regional investment climate, and increase foreign direct investment (FDI) inflow into each country (Busse et al. 2007).
There is an important exogenous variable that affects income levels, trade, institutions, and governance directly—the geographical location of a country (Rodrik et al. 2004). Geography can have a direct impact on income levels through climate, resources, and agricultural productivity. More importantly, it has an indirect impact on income levels through its influence on trade, as the distance from major markets, and the degree of integration play vital roles. Geography can also influence infrastructure through trade, and income through natural resource endowments. Bulte and Damania (2005) argue that resource abundance can have an impact on institutional quality in developing countries, since it enriches (and may corrupt) the ruling class. Strong institutional coordination, coupled with improved infrastructure, helps minimize international trade costs (Francois and Manchin 2007).
Institutional quality can be proxied by good governance in a country (Busse et al. 2007). Bolaky and Freund (2004) demonstrate that regulatory quality influences the interaction between trade and economic growth, and that countries with excessive regulations do not benefit from trade. Excessive regulations may encourage a country to produce goods for which it has no comparative advantage, and which its terms of trade do not favor (Rodrik et al. 2002).4
4 Trade is only beneficial if the involved adjustment costs are relatively low; that is, if the reallocation of labor and capital from the import-competing sector to the export sector can be achieved at minimal costs. If the structure of an economy is relatively rigid, production factors cannot move to sectors where large welfare gains can be achieved. The economy may end up in a situation where trade does not have a beneficial impact on the allocation of resources within and between sectors.

Economic Corridors and Regional Economic Integration
23
Theoretically Asian countries can be expected to benefit from lowering trade barriers, mainly from exchange and specialization through trade. However, trade benefits would be suboptimal or unattainable if they are not supported by adequate infrastructure, and institutions that practice good governance (Kohsaka 2007). Smaller economies in Asia are less likely to achieve welfare gains from trade liberalization because of perennial economic asymmetry, where increased market access to them may have no positive effect in the short to medium term. The poor quality of institutions has been identified as a major reason for the disappointing export performance of smaller economies.5 Therefore, many FTAs go beyond the standard features by emphasizing the political dimension, explicitly addressing corruption, promoting participatory approaches, and refocusing development policies on poverty reduction.6 What follows is that infrastructure and growth are positively correlated, and the quality of institutions, and correct policies matter to long-run economic growth.
4. Relevance of Economic Corridors in South AsiaHigh transport costs and low connectivity are detrimental to a country’s development, and present particular challenges to landlocked countries. Promoting corridors and bilateral and regional transit arrangements between landlocked countries and their transit neighbors is an important means of overcoming obstacles to competitiveness. South Asian economic corridors envisage reducing trade costs, which will lead to increased trade and investment. They can also indirectly induce increased FDI, mainly through intra-firm vertical integration across borders that exploit the comparative advantages of each location. Such increases in FDI further increase regional trade. This defines a virtuous triangle of mutually reinforcing effects between cross-border infrastructure development, trade, and investment consequently one can expect higher economic growth and poverty reduction especially, if institutions and policies are in place to ensure the poor take part in this growth. Increased trade and growth also expand the fiscal resources available to governments, enabling them to consider new policy options (for example, investments in education, health, or social security systems). Any improvement of national and regional infrastructure (hardware and software) will enhance regional trade, improving the competitiveness of goods and services, encouraging their economic exchange, and adding to the growth momentum of trade and FDI.
Recognizing the importance of transport integration in South Asia, the South Asian Association for Regional Cooperation’s (SAARC) Islamabad summit in 2004 decided to strengthen transport, transit, and communication links across the region. With financial and technical support from ADB, the SAARC Regional Multimodal Transport Study (SRMTS) was completed in 2006. The study identifies 10 regional road corridors, 5 regional rail corridors, 2 regional inland waterways corridors, 10 maritime gateways, and 16 aviation gateways for implementation in Phase I. Building regional infrastructure through economic corridors is also planned to help facilitate international and national transportation, and promote industrialization in the hinterland. Examples are the Delhi–Mumbai Industrial Corridor (DMIC), a national economic corridor with
5 See, for example, World Bank (2001), Jütting (2003), Levine (2005), among others. 6 See, for example, the Cotonou Agreement between the African, Caribbean and Pacific Group of States
(ACP) and the European Union (EU).
Developing Economic Corridors in South Asia
24
regional implications; the Mekong–India Economic Corridor (MIEC), and the India–Myanmar–Thailand Trilateral Highway (IMTTH); the latter are both cross-regional economic corridors linking South Asia and Southeast Asia. The salutary effect of improving cross-border transport infrastructure in the GMS has been well documented, and better connectivity has helped the subregion reduce poverty.7
One of the challenges of establishing economic corridors is that their success closely depends on policy reform, capacity development, and the strengthening of institutions.8 This is where regional cooperation assumes importance. For instance, greater regional cooperation would end the isolation of landlocked Afghanistan, Nepal, and Bhutan by efficiently linking them to the rest of the South Asian region.
5. Determinants of Economic Corridors The bivariate associations between income, infrastructure, and governance indicate that institutional quality has a positive and significant effect on income and infrastructure. Importantly, trade also has a positive impact on governance, infrastructure, and a country’s output, suggesting that it can have an indirect effect on incomes by improving the quality of institutions and infrastructure.
To find the probable determinants of regional infrastructure, we define it as a product of the scale and structure of a country’s economic size, domestic and international demand through production and international trade, and governance in institutions, among others. We then estimate the following baseline equation.
Infra Gov X Instit i it it it i 1 2 3 (1)
where i represents a country, t time and εi is the error term. The dependent variable is
Infra (physical infrastructure index (PII) representing regional infrastructure), Gov is composite governance (represented by the governance index), X is a vector of additional regressors, and Inst is a dummy variable representing regional institutions engaged in infrastructure for a particular region—(i) Asia (=1 for Asian members of ADB, 0 otherwise); (ii) Europe (=1 for members of the European Union, 0 otherwise); and (iii) Latin America (=1 for members of the Inter-American Development Bank (IDB), 0 otherwise).9 Additional regressors (X) include some control variables to represent internal and external demand for infrastructure such as per capita income, population, industry, and trade. All regressions include country-fixed effects (αi).
7 The remarkable progress in the Mekong in recent years is reflected in an increase in average per capita income from about $630 in 1992 to about $1,100 in 2006 (World Bank 2007). Edmonds and Fujimura (2008) find a positive effect of cross-border infrastructure on trade in major goods in the Mekong region.
8 These lessons draw on the experience of GMS economic corridors. 9 The Inter-American Development Bank (IDB) is actively engaged in regional infrastructure projects in Latin
America such as the Initiative for the Integration of Regional South American Infrastructure (IIRSA) and the Plan Puebla Panama (PPP). IIRSA, established in 2000, covers 12 Latin American countries and is supported primarily by the IDB. It aims to build better regional connections. The PPP, established in 2001 by nine Latin American countries to create regional infrastructure, will develop the corridor from Puebla (in the south of Mexico) to Panama.

Economic Corridors and Regional Economic Integration
25
We introduce an interactive term between Gov and Ins to understand the impact of governance on regional infrastructure development. Equation (1) then becomes
Infra Gov X Inst Gov Instit i it it it it it i 1 2 3 4b e( * ) (2)
The base year for all the variables is 2006, except otherwise noted. All 98 sample countries with data for the dependent and independent variables are included. Included in the sample are the 16 East Asia Summit (EAS) countries and 35 Asian members of ADB, which represent the Asia region in this analysis.
A cross-section of pooled data can better explain the relevant relationships between regional infrastructure and governance over time both in terms of time-variant and time-invariant regressors. This approach is better able to capture the dynamic relationship between endogenous and exogenous variables—more variability, less collinearity, more degrees of freedom, and more efficiency. Baseline equation (2) is tested using both the cross-section (2006) and the cross-section and pooled (1996 and 2006) frameworks.
Given the bivariate associations in previous sections, we are yet to ascertain the functional relationship between endogenous and exogenous variables. To solve this, we take both linear ordinary least squares (OLS) and nonlinear (ordered probit) models. To check the relative robustness of the model, we replace Physical Infrastructure Index (PII) with the World Economic Forum (WEF) infrastructure index in the case of the cross-section analysis. We select generalized least squares (GLS) in Model 2 for two technical reasons—(i) the Hausman test (1978) rejects fixed effect (OLS) and selects random effect (GLS), and (ii) GLS provides higher R-squared, compared to OLS. The estimated results are presented in Tables 1.1 and 1.2. We only report the significant baseline models sequentially to discuss the estimated relations between the variables concerned. Another set of models to check robustness is also reported thereafter.
First, with a linear model and PII as the dependent variable, both the models explain 81% to 90% of the variation in observations. Most of the estimated coefficients are statistically significant, robust, and show the correct signs and magnitudes. The good fit tells us that good governance positively influences the development of regional infrastructure. Apparently, every 1-point improvement in governance leads to a 2-point rise in regional infrastructure in Model 1 (Table 1.1) and 0.85 in Model 2 (Table 1.2). With –0.04 as the sample average of the index of governance, and the value of the coefficient 2.010 (in Model 1, Table 1.1) and 0.851 (in Model 2, Table 1.2) in the baseline regression, the size of the effect with respect to the index of governance would vary between 1 and 2 points.
Second, a significant and positive interaction term [Governance x European Union (EU)] in both the models suggests that membership, other things being equal, is important for the development of regional infrastructure. The statistical significance also indicates that location of country is also important along with membership in a regional organization for development of regional infrastructure. The introduction of good governance in a region (as in the EU) increases regional infrastructure development. In sharp contrast, Latin America is at the other end, and Asia comes in between. In other words, appropriate institutions and policies are required for effective governance and regional infrastructure development. This also indirectly indicates a sort of regional diffusion—regional

Developing Economic Corridors in South Asia
26
institutions and governance have a direct positive effect on the local governance of each country in the region, which ultimately leads to regional infrastructure development. However, the estimated negative Latin America dummies (significant in both the models) suggest that membership in a regional institution did not help the development of regional infrastructure, and that the region is yet to witness regional governance diffusion.
Table 1.1: Baseline Regression Results I: Cross-Section (2006)
OLS (PII) OLS (WEF) OP (PII)
Governance 2.010*** 0.633*** 0.355
(4.48) (4.182) [0.859]
Ln per capita income 1.732*** 0.428*** 1.034***
(8.18) (6.602) [5.011]
Ln population 0.513*** 0.184*** 0.143
(3.679) (4.466) (1.141)
Trade openness 0.00455 0.00273*** –0.00135
(1.117) (2.795) [–0.342]
Manufacturing value added
0.00664 0.00371 0.0165
(0.212) (0.438) [0.651]
Asia (35) 0.697 0.0742 0.307
(1.416) (0.512) (0.704)
European Union (EU) (27)
1.064 0.890*** 0.513
(1.113) (3.430) [0.538]
Latin America (LA) (20) –2.912*** –0.466*** –1.218**
(–4.456) (–2.934) (–2.262)
Governance×Asia 0.707 –0.133 –0.285
(1.377) (–0.850) [–0.522]
Governance×EU 2.022** 0.539** 0.209
(2.441) (2.391) (0.156)
Governance×LA –1.455 –0.242 –0.0918
(–1.570) (–1.074) (–0.124)
Distance from equator 0.023*** 0.021*** 0.022
(4.651) (4.235) [1.431]
Adj. R2 0.898 0.841
Pseudo R2 0.555
F (Prob>F) 78.38 (0.00) 57.44 (0.00)
Wald chi2 (Prob > chi2) 119.52 (0.00)
Observations 98 118 98
Notes: (i) OLS Ordinary least squares; WEF World Economic Forum; PII Physical Infrastructure Index (ii) OP (Ordered Probit): 3 = Best (high), 2 = Good (medium), 1 = Worst (low) (iii) *** represents statistical significance at 1% (iv) ** represents statistical significance at 5% (v) * represents statistical significance at 10% (vi) Figures in first and third brackets rep t- and z-statistics, respectively.

Economic Corridors and Regional Economic Integration
27
Table 1.2: Baseline Regression Results II: Cross-Section Pooled (1996 and 2006)
GLS REM (PII) OP (PII)
Governance 0.851 0.0226(1.601) [0.079]
Ln per capita income 2.055*** 1.001***(10.27) (6.494)
Ln population 0.0108 0.0244(0.175) [0.386]
Trade openness 0.00326 0.0013(0.764) (0.476)
Manufacturing value added 0.0161 0.0576***(0.56) (2.694)
Asia (time variant) 0.392 0.114(0.674) [0.397]
European Union (EU) (time variant)
0.0363 1.853***(0.0595) (4.426)
Latin America (LA) (time variant) –3.357*** –1.343***(–5.341) [–5.616]
Governance×Asia 0.868 0.297(1.319) (0.998)
Governance×EU 1.738* 8.728***(1.669) (4.784)
Governance×LA –1.308 0.178(–1.636) (0.581)
Distance from equator 0.045** 0.051(2.355) [1.010]
R2 0.812
Pseudo R2 0.578
Wald chi2 (Prob > chi2) 570.69 (0.00) 129.22 (0.00)
Selection of model
Hausman test 0.215
chi2 (Prob>chi2) 0.086
Observations 192 192
No of countries in sample 99 99
Country fixed effect Yes Yes
Year fixed effect Yes Yes
Notes: (i) GLSREM = Generalized least squares random effect model; PII = Physical infrastructure index (ii) OP (Ordered Probit): 3 = Best (high), 2 = Good (medium), 1 = Worst (low) (iii) *** represents statistical significance at the 1% (iv) ** represents statistical significance at the 5% (v) * represents statistical significance at the 10% (vi) Figures in the parentheses represent t- and z-statistics (vii) Selection of random effect (GLS) over fixed effect is based on the Hausman test (1978)

Developing Economic Corridors in South Asia
28
Table 1.3: Baseline Regression Results I: Cross-Section (2006) (a) OLS (PII)
Model 1 Model 2 Model 3 Model 4 Model 5 Model 6
Ln per capita income
0.135** 0.133*** 0.132*** 0.140*** 0.137*** 0.131***
(12.170) (15.260) (11.820) (20.210) (19.610) (11.090)
Ln population 0.432*** 0.349** 0.326*** 0.202* 0.276* 0.673**
(3.180) (2.761) (3.347) (2.132) (1.880) (2.524)
Manufacturing value added
0.111*** 0.110*** 0.0883*** 0.127*** 0.116*** 0.123***
(4.550) (4.380) (3.540) (4.640) (4.520) (4.920)
Trade openness
0.002 0.002 0.001 0.003 0.028* 0.001
(0.700) (0.620) (0.390) (1.010) (1.910) (0.480)
Asia (35) 0.403 0.304 0.310 0.399 0.512 0.504
(1.010) (0.740) (0.790) (0.890) (1.220) (1.230)
Europe (27) 1.628*** 1.392*** 1.706*** 2.126*** 1.296** 1.735***
(3.490) (2.780) (3.760) (4.130) (2.410) (3.620)
Latin America (20)
–0.622 –0.950* –0.878* –0.846 –1.260** –0.965*
(–1.210) (–1.810) (–1.750) (–1.480) (–2.290) (–1.830)
Rule of law 1.395***
(4.820)
Regulatory quality
1.192***
(4.200)
Government effectiveness
1.546***
(5.260)
Politicalstability
0.119
(0.520)
Voice and accountability
0.860***
(3.520)
Control of corruption
1.268***
(4.090)
Distance from equator
0.011*** 0.093*** 0.054** 0.067** 0.045*** 0.076*
(3.132) (3.871) (2.972) (2.652) (3.450) (2.002)
Adjusted R2 0.928 0.924 0.931 0.910 0.920 0.924
Observations 98 98 98 98 98 98
Notes: (i) OLS = Ordinary Least Squares; PII = Physical Infrastructure Index (ii) ***, ** and * represent statistical significance at the 1%, 5%, and 10% level. Figures in
brackets represent t-statistics.

Economic Corridors and Regional Economic Integration
29
Table 1.4: Baseline Regression Results I: Cross-Section (2006) (b) Ordered Probit (PII)
Model 1 Model 2 Model 3 Model 4 Model 5 Model 6
Ln per capita income
0.367** 0.371** 0.378* 0.328*** 0.356*** 0.377**
[3.110] [3.410] [2.970] [4.070] [4.090] [3.200]
Ln population 0.113 0.109 0.126 0.131 0.111 0.138
(1.037) (1.040) (1.041) (1.087) (1.098) (1.035)
Manufacturing value added
0.078* 0.077* 0.067* 0.089* 0.082* 0.079*
[2.470] [2.410] [2.110] [2.360] [2.580] [2.450]
Trade open-ness
0.002 0.003 0.002 0.006 0.004 0.002
[0.450] [0.550] [0.450] [1.320] [0.800] [0.530]
Asia (35) 0.020 –0.065 –0.030 –0.214 0.078 0.058
[0.040] [–0.140] [–0.070] [–0.420] [0.170] [0.120]
Europe (27) 1.366* 1.160 1.322* 1.661* 0.913 1.400*
[2.310] [1.910] [2.340] [2.590] [1.400] [2.320]
Latin America (20)
–0.440 –0.590 –0.554 –0.604 –0.871 –0.584
[–1.010] [–1.440] [–1.400] [–1.400] [–1.950] [–1.420]
Rule of law 0.605
[1.730]
Regulatory quality
0.479
[1.520]
Government effectiveness
0.848*
[2.070]
Political stability
–0.382
[–1.640]
Voice and accountability
0.509*
[2.130]
Control of corruption
0.498
[1.440]
Distance from equator
0.030 0.064 0.034 0.021 0.028 0.033
[1.228] [1.112] [1.862] [1.231] [1.654] [1.481]
Pseudo R2 0.595 0.590 0.607 0.591 0.598 0.587
Observations 98 98 98 98 98 98
Notes: (i) PII = Physical Infrastructure Index (ii) ***, ** and * represent statistical significance at the 1%, 5%, and 10% level. Figures in
brackets represent z-statistics.

Developing Economic Corridors in South Asia
30
Table 1.5: Baseline Regression Results II: Cross-Section Pooled (1996 and 2006)
(a) OLS (PII)
Model 1 Model 2 Model 3 Model 4 Model 5 Model 6
Ln per capita income
0.1367*** 0.1374*** 0.1426*** 0.1358*** 0.1442*** 0.1412***
(16.18) (16.55) (22.67) (15.68) (25.05) (25.29)
Ln population
0.0145 0.0142 0.0154 0.0133 0.0132 0.0121
(0.172) (0.170) (0.176) (0.167) (0.167) (0.163)
Manufacturingvalue added
0.126*** 0.109*** 0.122*** 0.0961*** 0.127*** 0.113***
(6.251) (5.328) (5.812) (4.667) (6.006) (5.647)
Trade openness 0.00142 0.00145 0.00184 0.00102 0.00205 0.00514*
(0.531) (0.542) (0.658) (0.389) (0.716) (1.928)
Asia (time variant) 0.148 0.0962 0.155 –0.225 –0.0236 0.0543
(0.447) (0.288) (0.444) (–0.684) (–0.0672) (0.164)
Europe (time variant)
0.591 0.762* 0.893* 0.681 1.098** 0.355
(1.337) (1.722) (1.913) (1.561) (2.391) (0.772)
Latin America (time variant)
–1.531*** –1.289*** –1.588*** –1.404*** –1.342*** –1.771***
(–3.623) (–3.025) (–3.495) (–3.356) (–3.002) (–4.120)
Control of corruption
1.089***
(4.773)
Rule of law 1.071***
(4.553)
Regulatory quality 0.500**
(2.359)
Government effectiveness
1.280***
(5.305)
Political stability 0.244
(1.313)
Voice and accountability
0.925***
(4.993)
Distance from equator
0.034*** 0.038*** 0.037*** 0.031*** 0.039*** 0.038***
(4.345) (4.453) (4.450) (4.165) (4.309) (4.451)
Adjusted R2 0.900 0.897 0.888 0.901 0.886 0.899
Observations 189 192 192 192 192 192
Country fixed effect Yes Yes Yes Yes Yes Yes
Year fixed effect Yes Yes Yes Yes Yes Yes
Notes: (i) OLS = Ordinary Least Squares; PII = Physical Infrastructure Index (ii) ***, ** and * represent statistical significance at the 1%, 5%, and 10% level. Figures in
brackets represent t-statistics.

Economic Corridors and Regional Economic Integration
31
Table 1.6: Baseline Regression Results II: Cross-Section Pooled (1996 and 2006)
(b) Ordered Probit (PII)
Model 1 Model 2 Model 3 Model 4 Model 5 Model 6
Ln per capita income 0.1292*** 0.1256*** 0.1273*** 0.1244*** 0.1317*** 0.1287***
[6.103] [5.564] [6.313] [5.385] [6.975] [6.88]
Ln population 0.0241 0.0218 0.0276 0.0235 0.0241 0.0252
[0.325] [0.338] [0.322] [0.331] [0.308] [0.311]
Manufacturingvalue added
0.107*** 0.0893*** 0.0909*** 0.0860*** 0.0977*** 0.0924***
[5.724] [5.071] [5.171] [4.786] [5.569] [5.295]
Trade openness 0.00312 0.000493 0.000931 0.000896 0.00244 0.00147
[0.918] [0.149] [0.285] [0.271] [0.726] [0.449]
Asia (time variant) –0.414 –0.285 –0.326 –0.343 –0.337 –0.249
[–1.462] [–1.037] [–1.176] [–1.233] [–1.205] [–0.899]
Europe (time variant)
1.143* 1.185* 1.074* 1.116* 1.337** 0.944
[1.832] [1.914] [1.716] [1.795] [2.153] [1.462]
Latin America (time variant)
–0.857** –0.741** –0.871** –0.776** –0.801** –0.933***
[–2.444] [–2.144] [–2.467] [–2.227] [–2.316] [–2.604]
Control of corruption
0.0893
[0.411]
Rule of law 0.325
[1.595]
Regulatory quality 0.224
[1.256]
Government effectiveness
0.462**
[2.082]
Political stability
–0.19
[–1.275]
Voice and accountability
0.270*
[1.711]
Distance from equator 0.0232 0.0261 0.0287 0.0254 0.0276 0.0292
[0.867] [0.993] [1.109] [1.032] [1.103] [1.001]
Pseudo R2 0.576 0.562 0.559 0.566 0.560 0.563
Observations 189 192 192 192 192 192
Country fixed effect Yes Yes Yes Yes Yes Yes
Year fixed effect Yes Yes Yes Yes Yes Yes
Notes: (i) PII = Physical Infrastructure Index (ii) ***, ** and * represent statistical significance at the 1%, 5%, and 10% level. Figures in
brackets represent z-statistics.

Developing Economic Corridors in South Asia
32
Third, the results remain unchanged when we replace the aggregate governance index by its individual components as regressors in both models for both periods (Tables 1.3 and 1.4), except in the case of political stability, which came out with a negative coefficient, but statistically insignificant. Interestingly, it is the government’s effectiveness that has the strongest influence on regional infrastructure, varying between 1.280 and 1.546. It indicates a 1-point improvement in government effectiveness may lead to a rise of 1.28 to 1.55 points in regional infrastructure, other things being equal. The most striking result is the significance of the EU dummy. The Asia dummy has a negative sign in Table 1.4, but is not statistically significant. What all these estimates indicate is that government effectiveness, rule of law, regulatory quality, control of corruption, and voice and accountability are important to regional infrastructure development.
At the more general level, as in most of the models, Tables 1.2 and 1.3 show that income levels are significant in regional infrastructure development. So is population. At the same time, countries’ trade and manufacturing did not come out as significant in the models, but show the correct signs. This may be because levels of income and population (and variations among them) in the models neutralize the significance of trade and manufacturing. Income and population are associated with regional infrastructure development, reflecting that they increase the demand for it. At the same time, it suggests that a country’s growth is as important as improving governance.
To conclude, countries (and regions) with high incomes, strong institutions, good governance, and more open economies are likely to have higher levels of regional infrastructure. Indirectly, the estimated results of the baseline models suggest that efforts to promote regional infrastructure have to address policy reform in a number of areas, and not be limited to traditional measures to attract investment in infrastructure. There is thus an important complementary role to be played by the governance of institutions in enhancing South Asia’s regional infrastructure.
The above relationship cannot be interpreted as causal or accurate as we cannot rule out the possibility of endogeneity in equation (2). To resolve this, we use a dynamic generalized method of moments estimator (system-GMM) that allows us to analyze changes across countries and over time. The estimator also effectively deals with reverse causality by using a set of instruments for the endogenous variables, and includes the lagged dependent variable to account for the persistence of the infrastructure indicator.
One of the main advantages of the system-GMM is that it does not require any external instruments other than the variables already included in the dataset. It uses lagged levels and differences between two periods as instruments for current values of the endogenous variable, and also uses external instruments. For the infrastructure index 1996 and 2007, for example, the system-GMM method uses as instruments (i) levels of infrastructure, that is, data for 1995, 2006, and previous periods, and (ii) differences in infrastructure, namely, differences between 1995 and 1996, and 2006 and 2007. Importantly, the estimator does not use lagged levels or differences for the estimation, but
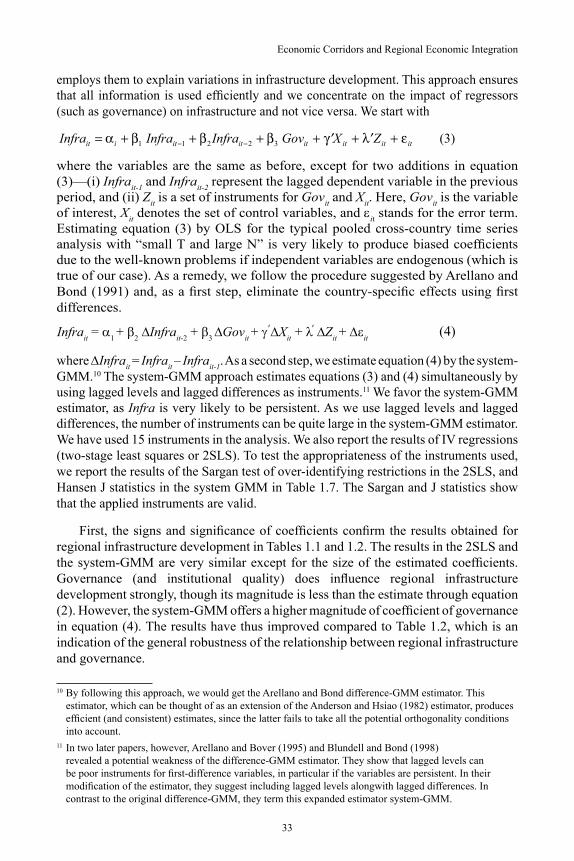
Economic Corridors and Regional Economic Integration
33
employs them to explain variations in infrastructure development. This approach ensures that all information is used efficiently and we concentrate on the impact of regressors (such as governance) on infrastructure and not vice versa. We start with
Infra Infra Infra Gov X Zit i it it it it it it 1 1 2 2 3 (3)
where the variables are the same as before, except for two additions in equation (3)—(i) Infra
it-1 and Infra
it-2 represent the lagged dependent variable in the previous
period, and (ii) Zit is a set of instruments for Gov
it and X
it. Here, Gov
it is the variable
of interest, Xit denotes the set of control variables, and ε
it stands for the error term. Estimating equation (3) by OLS for the typical pooled cross-country time series analysis with “small T and large N” is very likely to produce biased coefficients due to the well-known problems if independent variables are endogenous (which is true of our case). As a remedy, we follow the procedure suggested by Arellano and Bond (1991) and, as a first step, eliminate the country-specific effects using first differences.
'Infrait = α
1 + β
2 ∆Infra
it-2 + β
3 ∆Gov
it + γ ∆X
it + λ
∆Z
it + ∆ε
it '
(4)
where ΔInfrait = Infra
it – Infra
it-1. As a second step, we estimate equation (4) by the system-
GMM.10 The system-GMM approach estimates equations (3) and (4) simultaneously by using lagged levels and lagged differences as instruments.11 We favor the system-GMM estimator, as Infra is very likely to be persistent. As we use lagged levels and lagged differences, the number of instruments can be quite large in the system-GMM estimator. We have used 15 instruments in the analysis. We also report the results of IV regressions (two-stage least squares or 2SLS). To test the appropriateness of the instruments used, we report the results of the Sargan test of over-identifying restrictions in the 2SLS, and Hansen J statistics in the system GMM in Table 1.7. The Sargan and J statistics show that the applied instruments are valid.
First, the signs and significance of coefficients confirm the results obtained for regional infrastructure development in Tables 1.1 and 1.2. The results in the 2SLS and the system-GMM are very similar except for the size of the estimated coefficients. Governance (and institutional quality) does influence regional infrastructure development strongly, though its magnitude is less than the estimate through equation (2). However, the system-GMM offers a higher magnitude of coefficient of governance in equation (4). The results have thus improved compared to Table 1.2, which is an indication of the general robustness of the relationship between regional infrastructure and governance.
10 By following this approach, we would get the Arellano and Bond difference-GMM estimator. This estimator, which can be thought of as an extension of the Anderson and Hsiao (1982) estimator, produces efficient (and consistent) estimates, since the latter fails to take all the potential orthogonality conditions into account.
11 In two later papers, however, Arellano and Bover (1995) and Blundell and Bond (1998) revealed a potential weakness of the difference-GMM estimator. They show that lagged levels can be poor instruments for first-difference variables, in particular if the variables are persistent. In their modification of the estimator, they suggest including lagged levels alongwith lagged differences. In contrast to the original difference-GMM, they term this expanded estimator system-GMM.

Developing Economic Corridors in South Asia
34
Table 1.7: Determinants of Infrastructure (Physical Infrastructure Index)
2SLS System GMM
Infrastructure (t–1) 0.652*** 0.947***
[3.765] [5.048]
Infrastructure (t–2) –0.267* –0.272*
[–1.421] [–1.890]
Governance1.033* 1.513*
[1.560] [1.780]
Ln per capita income1.044*** 0.686*
[3.390] [1.820]
Ln population0.085 0.155*
[0.890] [1.480]
Trade openness0.002 0.003
[0.200] [0.290]
Manufacturing value added0.098** 0.128***
[2.580] [3.400]
Asia1.757** 1.567*
[2.420] [2.110]
Europe2.116** 1.165*
[2.270] [1.330]
Latin America–1.608** –1.434**
[–2.810] [–2.760]
Governance XAsia2.272** 1.876*
[2.450] [1.860]
R2 0.8182 0.7966
Wald chi2 (Prob > chi2) 242.37 (0.00) 288.95 (0.00)
Test of over-identification
Sargan chi2 (Prob > chi2) 18.6532 (0.0048)
Hansen’s J chi2 (Prob > chi2) 12.4553 (0.0031)
Instruments Yes (15) Yes (15)
Country fixed effects Yes Yes
Notes: (i) ***, ** and * represent statistical significance at the 1%, 5%, and 10% level. (ii) Figures in third brackets represent z-statistics. (iii) Due to limitation of space, we avoid placing estimated instruments, which are irrelevant
to the purpose of reporting.

Economic Corridors and Regional Economic Integration
35
Second, since our interest is in Asia and the corresponding interaction term, we find substantial improvement in results under equation (4), compared to equation (2). The interaction term has turned out to yield the best results in terms of significance and the overall explanatory power of the regressions. The estimated coefficients in Asia and the interaction term are significant at the 5% level in the 2SLS and at the 10% level in the system-GMM, thereby indicating that national governance and regional governance should move in parallel to have optimal regional infrastructure development in Asia, and regional governance diffusion is very important to regional infrastructure growth in Asia. A 1-point improvement in regional governance may lead to about 2 points increase in regional infrastructure in Asia, other things being equal, and with the average of the index of governance (–0.04), the size of the effect with respect to the index of governance would vary between 1 and 1.5.12
Third, if the governance index (institutional quality) takes a negative value (in the range –2.5 to +2.5), the interaction term (Gov*Asia) becomes negative. This means is that regional infrastructure may not yield the desired integration with the international market in corrupt countries with less efficient governments, and a low quality of institutions.
Fourth, the size of country-level governance effects (on regional infrastructure) varies between 0.02 and 6.92 (Table 1.8).13 Improvements in governance in regional institutions show a higher effect on regional infrastructure development (varies between 3.64 and 0.19) than improvement in national governance (varies between –0.17 and 3.28) in Asia. In some cases, while developing regional infrastructure, deficiencies in national governance are presumed to be managed if complemented by improved regional governance, other things being equal.
Finally, the total average effect of governance depends on the complex interactions and can be obtained by calculating the marginal effects. To facilitate the interpretation of the results in Table 1.7, we have computed the marginal effects for the variables of interest.14 Given the underlying equation (3), these marginal effects can be interpreted as variations relative to the mean value at a given income level. To put it differently, they quantify the observed improvement in regional infrastructure when a country has improved governance (and quality of institutions), relative to other countries at the same income level. The estimated marginal effects further strengthen our argument—governance national and/or regional, institutions, facilitates regional infrastructure development.
12 Governance refers to the scale of –2.5 to +2.5. 13 It is based on the Gov and Gov x Asia coefficients, estimated under the system-GMM in equation (3), and
adding it to individual country average governance scores.14 To compute the marginal effects of Gov (or the interaction term), we first calculated the derivate of
equation (4) with respect to Gov (and interaction term), setting all the other variables to their average value, and then tested the hypothesis that the derivate is equal to zero.

Developing Economic Corridors in South Asia
36
Table 1.8: Economy-Level Average Size of Governance Effect on Regional Infrastructure
Economy National Governance Regional Governance Total
Afghanistan –0.170 0.193 0.024
Armenia 1.172 1.535 2.706
Australia 3.113 3.476 6.589
Azerbaijan 0.644 1.007 1.650
Bangladesh 0.565 0.928 1.493
Bhutan 1.869 2.232 4.101
Brunei 1.910 2.273 4.183
Cambodia 0.651 1.014 1.664
PRC 0.950 1.313 2.262
Fiji 1.268 1.631 2.899
Hong Kong, China 2.964 3.327 6.290
India 1.367 1.730 3.098
Indonesia 0.889 1.252 2.142
Japan 2.748 3.111 5.860
Kazakhstan 0.885 1.248 2.132
Republic of Korea 2.146 2.509 4.656
Kyrgyz Republic 0.566 0.929 1.494
Lao PDR 0.571 0.934 1.506
Malaysia 1.868 2.231 4.099
Maldives 1.444 1.807 3.251
Mongolia 1.408 1.771 3.179
Myanmar –0.144 0.219 0.074
Nepal 0.523 0.886 1.409
New Zealand 3.281 3.644 6.924
Pakistan 0.576 0.939 1.515
Philippines 1.034 1.397 2.431
Singapore 2.989 3.352 6.340
Sri Lanka 1.122 1.485 2.607
Tajikistan 0.392 0.755 1.148
Thailand 1.290 1.653 2.943
Turkmenistan 0.074 0.437 0.512
Uzbekistan 0.051 0.414 0.466
Viet Nam 0.948 1.311 2.260
Notes: (i) PRC People’s Republic of China (ii) Total counts system-GMM estimators.

Economic Corridors and Regional Economic Integration
37
Table 1.9: Marginal Effects of Governance on Regional Infrastructure
Regional Infrastructure
2SLS System GMM
Total effects 4.316 4.316
National governance in Asia 4.339 4.329
Regional governance in Asia 4.144 4.329
Change in 1% point in GI 5.198 5.505
Note: GI = Governance index; GMM = Generalized method of moments; 2SLS = Two-stage least squares
6. Fostering Economic Corridors: The Enabling EnvironmentAn economic corridor network is essential for South Asian countries to get their goods to markets more efficiently, quickly, and cheaply, but progress on this has been limited because of many social, political, economical, and technical factors. The technical factors include the absence of integrated and harmonized railway networks (for example, between India and Bangladesh); the absence of adequate overland official trade outlets and associated facilities (for example, India-Bangladesh); the absence of trade facilitation policy measures (especially in the interior of countries); and the absence of transit trade (in the whole region, with some exceptions).
Though efforts to develop a South Asia-wide transport network began at the end of the 1990s, little progress was achieved till 2005. The demand for physical connectivity has increased in recent years to support export-led growth strategies and fragmented production networks, and this has led to the successful implementation of transportation corridors. Nevertheless, the need for full regional connectivity remains, highlighting the significant role regional cooperation can play. The chapters in this volume capture the initial findings of studies carried out on this, and they indicate improved corridors are essential for regional integration in South Asia. For instance, building economic corridors between countries helps infrastructure development that leads to better facilities for trade, and also promotes regional development through an agglomeration of industries, writes Chiranjib Neogi. Ajitava Raychaudhuri and Prabir De find that though transportation costs are not very significant in cost of production, a liberalization of regulations between countries allows the free movement of trucks across borders, reducing transport costs significantly. In this age of cutthroat competition, this may well tilt the comparative advantage toward countries like Bangladesh, creating significant welfare gains for the region as well.
Transit and trade facilitation are pivotal to well-functioning economic corridors. Paramjit S. Sahai and Vijay Laxmi analyze the effect of economic corridors on regional transit and trade facilitation, with special reference to the Wagah–Attari land route connecting Amritsar in India with Lahore in Pakistan. They suggest that the problem between India and Pakistan in trade and transportation is not the inadequacy of infrastructure, but policies that restrict its use to a limited number of commodities. This is further complicated by frequent changes in import and export policies. Pushpa Raj Rajkarnikar deals with transit and trade

Developing Economic Corridors in South Asia
38
facilitation in the economic corridors connecting Nepal, India, and Bangladesh. This study indicates that improvements in road connectivity and augmented trade facilitation will enhance regional trade, though domestic reform is important in Nepal. Saikat Dutta and Suranjan Gupta indicate that economic corridors attract private-sector investments, which lead to poverty alleviation by generating employment.
Therefore, unlocking South Asia’s trade potential is a daunting task, but achievable. The costs of not having uninterrupted road or railway connectivity across the region offset the gains from Free Trade Agreement (FTAs) and arrangements such as South Asian Free Trade Agreement (SAFTA). There is greater recognition in South Asia of the need for a better enabling environment for trade that offers lower trade costs. However, a favorable regional climate to create a modern-day Silk Road that operates at its full potential is missing. The agenda of South Asian regional cooperation has to go beyond policy barriers to include nonpolicy barriers such as regional connectivity, both as hardware (transport corridors) and software (facilitation of the movement of goods and vehicles across borders). A scrutiny of subregional programs shows that most countries in South Asia have undertaken projects to improve subregional connectivity. To realize the potential of these subregional networks, they have to be integrated with South Asian arteries such as the South Asian Association for Regional Cooperation (SARRC) corridors, Asian Highway, and the Trans-Asian Railway. Therefore, the primary task is two-fold. One, integrating the different subregional economic corridors and modes (railways, roads, air, and maritime shipping) that will facilitate the movement of goods and services in the region and beyond; and two, overcoming institutional constraints and bottlenecks that are hurting regional competitiveness by making trade expensive.
(i) Accession to International Conventions. As goods begin to move along international transport corridors, the need for harmonization of laws and processes among countries becomes clear. International conventions related to transport facilitate the movement of goods, especially at border crossings, by reducing procedures and formalities, and saving time. South Asian transport networks require appropriate legal frameworks to define the rights of passage for goods, people and vehicles, and to decide on permits, licenses and other measures, as well as mechanisms for consultation, and dispute settlement.
Recognizing that transport facilitation at the national and international levels are a prerequisite for enhancing international trade, South Asian countries must accede to international conventions on road and rail transport. Countries that have not done so, must consider acceding to seven international transport conventions, which were originally developed under the auspices of the Economic Commission for Europe (ECE)15—Convention on Road Traffic, 1968; Convention on Road Signs and Signals, 1968; Customs Convention on the International Transport of Goods under Cover of Transit International Routier (TIR) Carnets (TIR Convention), 1975; Customs Convention on the Temporary Importation of Commercial Road Vehicles, 1956; Customs Convention on Containers, 1972; International Convention on the Harmonization of Frontier Controls of Goods, 1982; and the Convention on the Contract for the International 15 Currently, there are 56 transport-related international legal instruments initiated by the ECE aimed at
facilitating the movement of goods, people, and vehicles across international borders.

Economic Corridors and Regional Economic Integration
39
Carriage of Goods by Road (CMR), 1956.16 While some South Asian countries are members of international conventions on the intercontinental movement of vehicles, progress on other international conventions has been uneven. In contrast, countries of Central Asia and the Caucasus have made good headway.
(ii) Intermodal Transport and Transit. Initiatives for building supply capabilities and trade liberalization in South Asian countries need to be complemented by a new approach to intermodal transport and transit with the goal of making the entire continent interconnected. Integrated overland connectivity would provide substantial benefits to landlocked countries like Afghanistan, Bhutan, and Nepal by giving them access to global markets at a lower cost. An integrated intermodal transport network would yield much larger economic benefits, while minimizing risks. There is an urgent need to prioritize Asian corridor projects, and enhance regional integration through regional transit in a time-bound manner. In South Asia, the lack of transit is a major reason for the low level of economic exchanges (RIS 2008). In general, the task ahead is to revive South Asia’s transportation networks and establish region-wide intermodal transport and transit to reduce transportation costs. South Asia should have its own regional transit arrangement, or all the countries of the region should accede to existing international conventions.
(iii) Strengthening and Harmonizing Rules, Regulations and Standards. For the infrastructure of a South Asia-wide transport network to function effectively, the necessary soft infrastructure, such as relevant rules, regulations, and standards, has to be in place. Rules, regulations, and standards must meet a common regional benchmark, or more preferably an international one. The participating countries need to formulate and agree on a harmonized set of rules, regulations, and standards, similar to the Cross-Border Transport Agreement (CBTA) adopted by the Greater Mekong Subregion (GMS) countries. A CBTA is an important step toward harmonizing the software related to cross-border infrastructure use.
Further, to make such an agreement effective, South Asian countries need to incorporate its provisions into their national laws, regulations, and standards. There is the need for higher-level coordination among the stakeholders and agencies concerned, such as transport, customs, immigration, and quarantine authorities. At the same time, the capacity of national institutions has to be enhanced for effective implementation of these agreements. There is also the need for a uniform or compatible standard for developing cross-border transport networks that are beneficial to all stakeholders. The establishment of an efficient management system and capacity building to look after the harmonization of standards would pave the way to achieving regional connectivity. This would ultimately help achieve single-stop and single-window customs offices across South Asian economic corridors.
(iv) Financing Cross-border Transport Projects. Connecting South Asia requires large investment. Given the current global economic crisis, this will be difficult to
16 For details of selected international conventions on transport facilitation, see UNESCAP (2007).

Developing Economic Corridors in South Asia
40
mobilize. This calls for an appropriate financing mechanism to muster South Asia’s huge savings for infrastructure development. Such a financing scheme should aim to raise resources from the public and private sectors, and multilateral development banks on a public-private partnership model. Bigger economies like Japan, Republic of Korea, People’s Republic of China (PRC), and India could have leading roles in filling financing gaps. They could unilaterally help to solve problems in the SAARC corridors, particularly by financing and managing missing links and bridges.
(v) Strengthening Coordination among Countries and Stakeholders. Weak coordination, like high tariffs, hinders trade among countries. Poor coordination between planning, implementing, and financing agencies leads to inefficiency in infrastructure development. Coordination among the various agencies or institutions concerned within a country is also required because each one may have different objectives. To implement South Asian economic corridors in a timely fashion, effective coordination between countries and other stakeholders is vital. Without this, it is unlikely that an optimal cross-border infrastructure will come into existence. An effective coordinating institution will be necessary to generate willingness in countries to participate in projects. It could also resolve conflicting interests between governments and stakeholders.
(vi) Closer Cooperation on Security. Secure trade is as important as free trade. Security concerns must be addressed adequately before countries adopt regional transport and transit arrangements. Using modern technology, governments in South Asia could address security issues that, if not managed properly, might drive up trade costs and, in the worst-case scenario, even close down corridors. There has to be focused attention on greater efficiency in international transportation, cooperation to adopt collective measures to promote transport security, and improvement in customs regimes, port facilities, and logistics management.
South Asian countries have to commit themselves to increase security for all transport modes, and to promoting policy coherence and coordination among international organizations. New programs will involve investment in new technology and infrastructure, possibly raising the costs of trade in the short to medium term. But the prospect of reducing future threats through technology-intensive security and customs inspections should be viewed as an investment in greater efficiency. Automated technology, such as bar codes, wireless communications, radio frequency identity tags, GPRS-enabled cargo movement, and tamper-proof seals, could improve security and accelerate global trade. Sharing information among security agencies, port and airport authorities, shippers, and customs can expedite the movement of freight through terminals without any new physical investment.
(vii) Strengthening Regional Cooperation. The experiences of Europe and Latin America, where cross-border infrastructure is comparatively developed, and to a lesser extent, Africa, where the development of cross-border infrastructure has taken a new shape, suggest that regional cooperation promotes greater prosperity and stability for participating countries. A major success factor in the ability to build regional initiatives that are based on a shared strategic vision, as seen in the Initiative for the Integration

Economic Corridors and Regional Economic Integration
41
of Regional Infrastructure in South America (IIRSA).17 South Asian subregional cooperation programs have to be much stronger to address regional infrastructure needs, and to cultivate enabling institutions and policies.18 Progress in South Asian subregional programs will complement those between Asia and Europe.
7. ConclusionsIn this study, we have empirically analyzed the linkages between economic corridors and regional integration. Our results indicate that institutions and governance are crucial to the development of economic corridors and that all South Asian countries will benefit from them. In other words, good governance helps achieve the full economic potential of a region (or a nation). Therefore, more effective policy approaches towards improved governance are needed to complement regional infrastructure development initiatives in South Asia.
The analysis shows that the linkage between regional infrastructure and governance is multiple and complex. It is unmistakably clear that good governance positively influences regional infrastructure. Every 1-point increase in governance will lead to a 1 to 1.5-point rise in regional infrastructure in South Asia.
The findings of this chapter suggest that membership in regional organizations, other things being equal, is not so important in the relative term to developing regional infrastructure. What matters is good governance in institutions (as in the European Union (EU)) that facilitate the development of regional infrastructure.
The bottom line of this study is that countries (and regions) with higher incomes, stronger institutions, good governance, and more open economies are likely to have higher levels of regional infrastructure. Regional infrastructure may not yield the desired integration with the international market if countries are very corrupt, governments are inefficient, and institutions are ineffective. The marginal effects estimated in this paper further strengthen our argument—good governance in institutions, national and regional, facilitates regional infrastructure development.
Indirectly, this study suggests that efforts to promote regional infrastructure need to address policy reform in a number of areas. An appropriate institutional and policy framework is required for the functioning of an effective governance framework and regional infrastructure development. This indicates a sort of regional diffusion—regional institutions and governance have a direct positive effect on local governance in each country, which leads to regional infrastructure development.
17 The IIRSA is a dialog forum among South American countries, which seeks to promote the development of transport, energy, and telecommunication infrastructure from a regional viewpoint, aimed at physical integration of the 12 South American countries, and the achievement of an equitable and sustainable territorial development pattern. An investment of $68.27 billion is being made in 508 infrastructure projects having direct or indirect cross-border implications, of which 12 are being executed under public-private partnerships (IIRSA 2009).
18 There has also been an attempt to foster regional cooperation centering on the Silk Road. For example, the Silk Road Initiative (SRI), which is a regional United Nations Development Programme (UNDP) project, aims to enhance cooperation and development among PRC, Kazakhstan, Kyrgyz Republic, Tajikistan, and Uzbekistan. It focuses on facilitating public private partnerships in three main areas: investment, trade and tourism. For further details, see http://www.undp.org.cn.

Developing Economic Corridors in South Asia
42
Poor governance isolates countries from good global markets. Countries face significant constraints in improving governance in institutions, a task that requires lead time, and structural adjustments. Regional cooperation has an important catalytic role to play in this. By sharing each other’s experiences, regional cooperation can make countries efficient by integrating them to regional and international governance.
Finally, improved governance in institutions, particularly at the sector level, can have huge payoffs in South Asia at a time the region is looking for higher investments in infrastructure, regional or otherwise, and planning to pursue free trade. Ignoring weaknesses in governance can stultify economic returns to regional infrastructure projects. Making South Asia seamless would require complementary policy initiatives by countries, regional organizations, and multilateral development organizations to strengthen governance in institutions. Economic corridors are the next phase of the SAARC transport corridors in South Asia.
Economic Corridors and Regional Economic Integration
43
References
ADB. 2006. Regional Cooperation and Integration Strategy. Manila.
ADB. 2006a. South Asia (2006–2008) Regional Cooperation Strategy and Program. Manila.
ADB. 2006b. Regional Cooperation and Integration Strategy. Manila.
ADB. 2009. Transport and Trade Facilitation in the Greater Mekong Subregion: Time to Shift Gears. Manila.
ADB–ADBI. 2009. Infrastructure for Seamless Asia. Manila and Tokyo: Asian Development Bank–Asian Development Bank Institute.
Anderson, T. W. and C. Hsiao. 1982. Formulation and Estimation of Dynamic Models Using Panel Data. Journal of Econometrics. 18 (1). pp. 47–82.
Arellano, M. and S. Bond. 1991. Some Tests of Specification for Panel Data: Monte Carlo Evidence and an Application to Employment Equations. Review of Economics Studies. 58 (2). pp. 277–97.
Arellano, M. and O. Bover. 1995. Another Look at the Instrumental Variable Estimation of Error Component Models. Journal of Econometrics. 68 (1). pp. 29–51.
Aron, J. 2000. Growth and Institutions: A Review of the Evidence. World Bank Research Observer. 15 (1). pp. 99–135.
Blundell, R. and S. Bond. 1998. Initial Conditions and Moment Restrictions in Dynamic Panel Data Models. Journal of Econometrics. 87 (1). pp. 115–43.
Bolaky, B. and C. Freund. 2004. Trade, Regulations, and Growth. World Bank Policy Research Paper 3255. Washington, DC: World Bank.
Bulte, E. and R. Damania. 2005. Resource Intensity, Institutions and Development. World Development. 33 (7). pp. 1029–44.
Busse, M., A. Borrmann, S. Fischer and S. Gröning. 2007. Institutions, Governance and Trade: An Empirical Investigation of the Linkages in View of the Proposed ACP/EU Economic Partnership Agreements. Hamburg: Hamburg Institute of International Economics.
Edmonds, C. and M. Fujimura. 2008. Road Infrastructure and Regional Economic Integration: Evidence from the Mekong. In D. H. Brooks and J. Menon, ed. Infrastructure and Trade in Asia. Cheltenham: Edward Elgar.
Francois, J. and M. Manchin. 2007. Institutions, Infrastructure, and Trade. World Bank Policy Research Working Paper No. 4152. Washington, DC: World Bank.
Jütting, J. 2003. Institutions and Development: A Critical Review. OECD Development Centre. Working Paper No. 210. Paris: Organisation for Economic Co-operation and Development.

Developing Economic Corridors in South Asia
44
IIRSA. 2009. IIRSA Project Portfolio 2008. Buenos Aires: Initiatives for the Integration of Regional South American Infrastructure. http://www.iirsa.org/bancomedios/documentos%20PDF/doc_cartera_2008_eng.pdf.
Kimura, F. and I. Kobayashi. 2009. Why Is the East Asia Industrial Corridor Needed? ERIA Policy Brief No 2009-01. Jakarta: Economic Research Institute for ASEAN and East Asia.
Kohsaka, A., ed. 2007. Infrastructure Development in the Pacific Region. London and New York: Routledge.
Kuroda, Haruhiko, Masahiro Kawai and Rita Nangia. 2007. Infrastructure and Regional Cooperation. In François Bourguignon and Boris Pleskovic, ed. Rethinking Infrastructure for Development. Washington, DC: World Bank.
Levine, R. 2005. Law, Endowments and Property Rights. Journal of Economic Perspectives. 19 (3). pp. 61–88.
Rajan, R. and L. Zingales. 2003. The Great Reversal: The Politics of Financial Development in the Twentieth Century. Journal of Financial Economics. 69 (1). pp. 5–50.
RIS. 2008. South Asia Development and Cooperation Report 2008. New Delhi: Research and Information System for Developing Countries.
Rodrik, D., A. Subramanian and F. Trebbi. 2002. Institutions Rule: The Primacy of Institutions over Geography and Integration in Economic Development. NBER Working Paper 9305. Cambridge: National Buerau of Economic Research.
Srivastava, P. 2011. Regional Corridors Development in Regional Cooperation. ADB Economics Working Paper Series No. 258. Manila: Asian Development Bank.
UNESCAP. 2007. Towards a Harmonized Legal Regime on Transport Facilitation in the ESCAP Region: Guidelines. ST/ESCAP/2489. New York: United Nations Economic and Social Commission for Asia and the Pacific.
Venables, A. J. 2007. Comment on Infrastructure and Regional Cooperation by Haruhiko Kuroda, Masahiro Kawai and Rita Nangia. In F. Bourguignon and B. Pleskovic, ed. Rethinking Infrastructure for Development. Washington, DC: World Bank.
Vickerman, R. 2002. Restructuring of Transportation Networks. In G. Atalik and M. M. Fischer, ed. Regional Development Reconsidered. Berlin: Springer.
World Bank. 2001. World Development Report 2002: Building Institutions for Markets. Washington, DC and New York: World Bank and Oxford University Press.
World Bank. 2007. World Development Indicators. Washington, DC: World Bank.
WTO. 2004. World Trade Report 2004: Exploring the Linkage between the Domestic Policy Environment and International Trade. Geneva: World Trade Organization.

45
Chapter 2
Infrastructure Development, Industrial Agglomeration and
Regional Trade in South AsiaChiranjib Neogi
1. IntroductionCountries in different regions of the world work together with trade agreements of different types to promote trade and regional cooperation, which is ultimately supposed to increase their welfare. Countries that share common boundaries have scope to increase their trade volumes by facilitating cross-border trade and investment. Economic corridors directly support some of the strategic thrusts of countries involved in the process of improving their competitiveness—(i) strengthening infrastructure linkages through a multisector approach; (ii) facilitating cross-border trade and investment; and (iii) enhancing private sector participation in development. The goal is to develop an efficient transport system, which allows goods and people to move around the region without significant impediments, or excessive costs or delays. An improvement in the transportation network is expected to catalyze economic growth and regional development, thereby reducing poverty.
To improve and maximize the benefits of intra-regional transport, countries may adopt a comprehensive approach to development in the form of economic corridors. Investments in priority infrastructure sectors, such as transport, energy, telecommunications, and tourism, will focus on the same geographic space to maximize the impact of development, while minimizing development costs.
It is argued that regional trade agreements promote the transfer of technology from high-income countries to low-income ones. Although the way this spillover works is not fully understood, most studies argue that it is promoted through trade flows. They find that access to foreign technology is a significant determinant of total factor productivity (TFP) across Organisation for Economic Co-operation and Development (OECD) countries and developing ones (Coe, Helpman and Hoffmaister 1997, Bernard

Developing Economic Corridors in South Asia
46
and Jones 1996, Keller 1998). Thus, deeper regional cooperation through trade is possible through integrated transport linkages in a region, and the competitiveness of countries improves with better infrastructure.1
This chapter has three objectives. First, it attempts to understand the scope of trade between two countries in a particular region, and the factors responsible for enhancing trade between countries. Second, it analyzes the impact of transport cost and time on regional trade. Third, it tries to understand the role of economic corridors, and the improvement of road infrastructure on agglomeration of industries in a region.2
2. Literature ReviewHanson (1994, 1996) examines the impact of economic integration between the United States and Mexico, and developed a model of regional production networks where assumed the process of industrial production had two parts. The first is the input processing stage, which is related to the technological components of the output. The second is the assembly stage, which is more labor intensive. The first stage can be outsourced to neighboring countries if the relative cost of production of part of the process or the whole process is less than that in the home country. Thus, this part of the production process is location specific and depends on the cross-border movement of goods. The second stage depends on the availability of skilled labor in the country. The location of specific industries would depend on the concentration of skilled labor for it in different parts of the country.
The gravity model emerged in the 1960s as an empirical specification without any rigorous theoretical underpinning (Tinbergen 1962, Poyhonen 1963, Linnemann 1966). Countries produce their goods and throw them all into a pot; then each draws out of the pot for consumption in proportion to its income. The expected value of country i’s consumption produced by country j will equal the product of country i’s share of world gross domestic product (GDP) times country j’s share of world GDP. In this way, bilateral trade is proportional to the product of the GDP shares. After being introduced by Tinbergen (1962), the gravity model was considered to be a useful physical analogy with empirical validity and supposed to be the most successful empirical trade device to explain the forces behind trade between countries. Subsequently, however, connections have been made to key elements of trade theory. The standard assumption of the Heckscher–Ohlin model that the prices of traded goods are the same in each country has proved to be faulty due to the prevalence of what trade economists call “border effects.” Properly accounting for these requires the prices of traded goods to differ among countries of the world.
1 In surveys assessing the investment climate at the entrepreneurial level, businesses usually rank deficient infrastructure as an important barrier to their operation and growth. For example, the World Bank investment climate assessments (ICAs) indicate that a large proportion of respondents (between 20% in East Asia and the Pacific and 55% in the Middle East, North Africa and Latin America) view problems with electricity, telecommunications, or transport as major or severe obstacles to doing business. Similarly, 33% of the Japanese firms operating in Viet Nam consider poor infrastructure as the major obstacle to doing business (Straub 2008).
2 Due to paucity of data we restrict the analysis in this part to only India.

Infrastructure Development, Industrial Agglomeration and Regional Trade in South Asia
47
Anderson (1979) was the first to provide clear microfoundations to the trade gravity model that rely on assumptions that would strike present-day readers as absolutely standard. The simplest gravity model stems from the pure expenditure system where no tariff or transport cost exists. From this simple specification, he introduces the concept of the trade share-expenditure system where traded goods’ shares of total expenditure vary widely across regions and countries. Finally, he derives a more general gravity model by introducing many goods, tariff, and distance (in the form of transit cost) into the model. By specifying demand in these terms, Anderson helps to explain the presence of income variables in the gravity model. This approach was also adopted by Bergstrand (1985), who specifies the supply side of economies more thoroughly to show that prices in the form of GDP deflators might be an important additional variable to include in the gravity equations described above. Price effects have also been captured using real exchange rates in some gravity models (for example, Brun et al. 2005).
The monopolistic competition model of new trade theory has been another approach to providing theoretical foundations to the gravity model (Helpman 1987, Bergstrand 1989). Here, product differentiation by country of origin is replaced by product differentiation among producing firms, and the empirical success of the gravity model is considered to support the monopolistic competition explanation of intra-industry trade. However, Deardorff (1998) and Feenstra (2004) cast doubt on this, stressing the need for empirical evidence to distinguish among potential theoretical bases, product differentiation by country of origin, product differentiation by firm, and particular forms of Heckscher–Ohlin based comparative advantage. In each of these cases, the common denominator is complete specialization by countries in a particular good, and bilateral trade could not be possible without this.
Alternatively, there are approaches to gravity-based explanations of bilateral trade that do not depend on complete specialization. As emphasized by Haveman and Hummels (2004), this involves accounting for trade frictions in the form of distance-based shipping costs or other trade costs, as well as policy-based trade barriers. Distance costs can also be augmented to account for infrastructure, oil price, and trade composition, as in Brun et al. (2005). The two approaches (complete versus incomplete specialization) can be empirically distinguished by category of good, such as differentiated versus homogeneous, as in Feenstra, Markusen, and Rose (2001). Westerlund and Wilhelmsson (2011) examine the effect of zero trade on the estimation of the gravity model using both simulated and real data.3
Krugman and Elizondo (1996) argue that when economists discuss trade policy in developing countries, they generally pay little attention to its effects on the internal economic geography of those countries. They hold that this is a mistake and that the trade policies of developing countries and their tendency to develop huge metropolitan centers are closely linked. Krugman and Venables (1995) propose to seriously consider the effects of globalization on real national incomes. They develop a core-periphery model of the world economy, and show how increased globalization affects the real
3 In a recent paper Helpman et al. (2008) propose a theoretical model rationalizing the zero trade flow and suggest estimating the gravity equation with a correction for the probability of countries’ trade.
Developing Economic Corridors in South Asia
48
incomes of core and periphery nations. In their simple model, regional differentiation is driven by the interaction of scale economies and transport costs.
Spatial agglomeration and economic growth are positively correlated, in particular in relation to the industrial revolution in Europe. Many economists (Henderson 1988, Williamson 1988, Lucas 1988) have emphasized the role of cities in economic growth and technological progress. Quah (1996) suggests a positive relation between growth and agglomeration of industries in a region of a nation.
Fan and Scott (2003) deal with industrial agglomeration and economic development in East Asia, with special reference to People’s Republic of China (PRC). Their empirical analysis of Chinese industries suggests that a positive relationship can be found between industrial agglomeration and productivity in economies that were formerly dominated by central planning. It also highlights that the sectors and spaces that are undergoing economic liberalization are the most prone to the formation of agglomeration economies. They find a strong relationship between industrial clustering and productivity in a few industries that have gained prominence after the government’s drive toward economic liberalization, especially in the coastal provinces and large cities. In a study, Ades et. al. (1995) show how trade and commerce, industry and government, influence the concentration of urbanization in a country. Okada and Siddharthan (2007) study the effect of agglomeration on industrial performance in India. They argue that there is a positive effect of industrial clusters on the productivity of firms, but the profit margins are similar in clustered and nonclustered firms. Most of these studies try to identify the effect of agglomeration on the performance of industries and on economic development. We, however, are interested in identifying the forces behind industrial agglomeration in a region.
There are two forces that influence the agglomeration of industry—forward linkages and backward linkages. If the location of an industry is such that it generates a high demand for goods produced by it, the location offers a high backward linkage. In other words, the location offers the best market access to the product of the industry. Firms would also want good access to the products of other firms as inputs of production, and if the location provides a variety of such goods, it offers a high forward linkage.4 There are some forces that act against the forces of agglomeration. A highly populated region offers a strong backward linkage because of high consumer demand for the product of an industry. On the other hand, the rent of land in this location and the wage rate of skilled labor could be high enough to prevent setting up new industries there. If the forward and backward linkages together are strong enough to outweigh the negative effects arising from the location, there will be industrial agglomeration.5
However, the phenomenon of agglomeration is not very simple because it depends on many other factors. The real wage of skilled labor for an industry located at a prime spot depends on the wage rate, the rent or cost of accommodation, and the transportation cost 4 To say location offers a forward linkage means setting up a new industry in a location is constrained by
the supply of inputs required by the new industry. On the other hand, backward linkages relate production to demand and are equal to the so-called indirect effects of final demand on sectoral production (Paelinck and Wagenaar 1981).
5 The backward and forward linkages play a major role in overcoming the disadvantages of high rents, wages, congestion, and pollution (Krugman and Elizondo 1996).

Infrastructure Development, Industrial Agglomeration and Regional Trade in South Asia
49
that has to be borne by laborers to commute from their residences to the industry. Also, the ease of transporting final goods and raw materials play a major role in setting up a new industry in any location. Thus, inland transportation facilities are very crucial. As we have pointed out, the first stage of production could be done by importing the processed input. For example, raw jute fiber can be imported from a neighboring country after initial treatment and skilled laborers of the home country can be employed for the production of goods using it. Here, the cross-border movement of the input is important. It is convenient to transport many bulk goods by road, but if cross-border transportation takes a long time or involves a huge cost, the exporting country will not be interested in trade with the partner country. As a result, setting up new industries in the region will be difficult.
It can be argued that industrial agglomeration has both positive and negative effects on regional development. Agglomeration in some specific regions such as special economic zones (SEZs) provides better scope for industries that depend on international trade for exporting their outputs and importing their inputs. But the concentration of industries in a particular location deprives other regions of a country of development, and accelerates economic disparities. On the other hand, if the necessary macroeconomic measures to distribute the income generated from a specific region where industrial agglomeration has taken place are in place, trade liberalization may help increase national income. Thus, in an underdeveloped country, the agglomeration of industries through trade liberalization could be a benefit, and cross-border road transportation will play a vital role in accentuating regional development.
To improve and maximize the benefits of interregional transport, countries should adopt a comprehensive approach to development in the form of economic corridors (De et. al. 2008 and De 2011). Investment in priority infrastructure sectors such as road transport, energy, and telecommunication generate the maximum developmental impact in a region.
The major areas covered by this study are as follows: (i) For augmenting the flow of trade by developing economic corridors among
countries in South Asia and beyond, the factors underlying the possibility of trade between two countries have to be investigated through a suitable econometric model. A general gravity-type model has been estimated to analyze trade flows between countries in the South Asian region. Some policy variables (like tariff rate) have been incorporated in the augmented gravity model for a better understanding of the flow of trade.
(ii) Trade through economic corridors depends heavily on the development of cross-border infrastructure. The literature suggests that a trade-foreign direct investment (FDI) nexus can be induced by investments in cross-border transport infrastructure. South Asian countries have the potential to benefit significantly from improving their cross-border infrastructure. Easier facilities for trade and financial transactions will enable them to better exploit their comparative advantages, and gain from increased specialization. However, the development of cross-border facilities involves complex bureaucratic coordination between the countries concerned. Cross-border facilities include not only good roads and the fast movement of goods, but also administrative efficiency.

Developing Economic Corridors in South Asia
50
(iii) Finally, an attempt has been made to identify the forces behind industrial agglomeration in general. The specific effect of economic corridors on industrial agglomeration is then examined. Industrial concentration is measured at the regional level with industry-level data. As mentioned, forward and backward linkages play a major role in setting up industries in any region. However, there are some other factors responsible for industrial agglomeration when it comes to trade.
3. MethodologyIn this section, we describe the models for analysis, and it is divided into three parts. The first concerns a general trade flow model among trading countries that explains the variability of exports, imports, and total trade using panel data. The second deals with cross-border infrastructure equations to explain the relationship of trade with cross-border facilities. The third analyzes the forces behind agglomeration of industries in a region.
3.1 Gravity ModelGravity models utilize the Newtonian concept of a gravitational force between two objects as an analogy to explain trade and capital flows among countries. Gravity models begin with Newton’s law for the gravitational force (GFij) between two objects i and j. This is expressed as
GFij=
Mi M
j
Dij
i ≠ j (1)
In this equation, the gravitational force is directly proportional to the masses of the objects and indirectly proportional to the distance between them. The gravity models are estimated in terms of natural logarithms, and can be defined as
ln GFij
= ln Mi + ln M
j - ln D
ij i ≠ j (2)
The gravity model of trade flow can be explained using the same analogy. Trade between two countries depends proportionally on their economic masses usually measured by GDP and inversely on the distance between them. Gravity models of international trade specify equation (2) by using trade flows or exports from country i to country j in place of gravitational force, while distance is often that between the capitals of two nations, or measured using “great circle” calculations.6 A simple gravity model can be extended using some independent variables for explaining trade flow. In an alternative, mass in equation (2) is associated with both GDP and population (POP). In this case, equation (2) becomes
ln Eij
= α + b1 ln GDPi+ b2 ln GDP
j+ b3 ln POP
i+ b4 ln POP
j+ b5 ln D
ij (3)
In general, the expected signs here are b1, b2 > 0. However, it is also possible that b2 > 0, since Engel’s Law allows for GDP in the destination country to have a negative 6 Since trade flows are observed as exports by the nation of origin and imports by the destination, most
have two independent observations. India has both imports from and exports to Bangladesh, and Bangladesh has the same, which implies that there are four values of bilateral trade between two trading countries.

Infrastructure Development, Industrial Agglomeration and Regional Trade in South Asia
51
effect on the demand for imports. The expected sign of the distance variable will be negative. With regard to the expected signs of the population variables, these are typically interpreted in terms of market size and are therefore positive. However, if import substitution effects dominate, the sign of the population of the importing country may be negative.
The generalized gravity model of trade states that the volume of trade (exports or imports) between two countries, X
ij , is a function of their incomes (GDP or gross
national product GNP), their population, their distance (proxy of transportation cost), and a set of other variables that influence trade between the countries.
A multiplicative gravity model for the purpose of estimation is linearized by taking the natural logarithm of all variables.
ln Xij = α + b1 ln Y
i + b2 ln Y
j + b3 ln PCI
i + b4 ln PCI
j + b5 ln R
i + b6 ln R
j
+ b7 ln Dij + b8 OP
i( j) + b9 ln FDIi + b10 ln FDI
j + u
ij (4)
where, Xij = export/import in value of country i to country j; Y
i(j) = GDP of country i(j) in
real terms; PCIi(j)= per capita income (GDP/population); Ri(j) = net road length/propor-tion of paved roads to total in country i(j);
D
ij = distance by road from regional center
of country i to target center of country j; = OPi = openness measured as share of trade in GDP or average tariff rate of country i; and FDI
i(j) = share of foreign capital to total
capital in country i(j).
In the gravity model, the product of GDP is considered as the size of the economy. It is expected that the larger the size of the economy, the larger the volume of trade between two countries. Naturally, the expected sign of the coefficient of product of GDP will be positive. The per capita GDP is a good proxy of development and infrastructural facilities that promote trade, and the expected sign of the parameter corresponding to PCI is positive. The positive relation between trade and FDI is expected because countries with a high inflow of FDI have a greater flow of raw materials and intermediate inputs needed to run an operation with foreign investment. The cross-border road infrastructure, which is represented by the net road length or proportion of paved roads, has a major role in augmenting trade between countries. Thus, we may expect a positive association between trade and cross-border road infrastructure variables. The more open or liberalized a country, the more the trade. We may expect a positive sign of the variable OP in this model. Finally, the distance between two countries is supposed to have a negative effect on the volume of trade between them. However, in some situations where bilateral trade between two countries is influenced by noneconomic factors (for example, a special diplomatic relation between two countries), the distance between the countries may have no effect on the trade volume.
3.2. Effect of Cross-Border Infrastructure on Trade of a CountryTransport costs are a key element of new economic geography models in determining the spatial distribution of economic activity. In the empirical literature, trade costs and time lapses at borders are also major determinants of the volume of trade between countries

Developing Economic Corridors in South Asia
52
(Limao and Venables 2001, Anderson and Wincoop 2004). We analyze the effect of cross-border infrastructure, trade costs, and time at the border on trade between some South Asian countries. An empirical estimation of trade costs is, however, not very easy because they are hard to quantify. Accurate transport cost data between country pairs are difficult to obtain and almost unavailable when considering transport costs between regions. In principle, between-country transport costs (mirror data) are inferred from cost, insurance, and freight/free-on-board (CIF/FOB) ratios. However, the data suffer from severe quality problems, and broad inferences based on these numbers may be unwarranted. The analysis is done with time-series, cross-section pooled data for eight countries and for three time points for which data on cross-border trade costs and time are available. It is based on a multiplicative functional form as follows:
Xit = aY
i
b1 BEC
it
b2 BIC
it
b3 BET
it
b4 BIT
it
b5uit (5)
where, Yi = GDP of country i, Xit = total trade of country i at time t; BECit = export
cost at border; BICit = import cost at border; BETit = export time at border; and BITit = import time at border.
It is considered that the variables BEC and BIC are endogenous. They are a function of RDit and RPit, where RDit = road density of each country; and RPit
= proportion of paved roads in each country.
To find the effect of costs and time at borders on export and import we take the respective time and cost variables as independent variables. For estimation of the model, we linearize the equation by taking the logarithm of the variables.7
It is expected that if the cost of trade or time of clearance at a border is high, the effect on the volume of trade will be negative. Naturally, the expected signs of the cost and time variables are negative. There may be inconsistence of ordinary least squares (OLS) in the model that explains the variability of trade volumes with the associated variation in border costs due to endogeneity. To get a consistent and efficient estimate of the independent variables, we use a 2-staged least squares (2SLS) model. It is expected that the relation between road infrastructure and border cost of a region will be inverse. Thus, we can expect negative signs of the two variables, road density (RD) and proportion of paved roads (RP) in the first-stage regression.
3.3 Industrial Agglomeration in IndiaTrade affects the internal location of an industry in two ways—it induces firms to specialize, and it expands the set of markets that firms serve. If there are industry-specific external economies, firms in related industries will spatially agglomerate (Hanson 1996). In the context of economic integration, diminished trade barriers affect the location of industries, particularly in less-developed countries. Liberalization induces many firms in developing countries to participate in production processes and to specialize in labor-7 One may argue that there is no need to estimate a separate model for identifying the effect of cross-border
cost and time on trade, and these variables could be incorporated in the gravity model. The basic problem of incorporating these variables in the gravity model is the limitation of data. The cross-border cost and time data are limited compared to the data used in the gravity model. A separate model to identify the effect of border-cost and time on trade is estimated in this study.

Infrastructure Development, Industrial Agglomeration and Regional Trade in South Asia
53
intensive activities, such as assembling foreign-made components, and their inputs as well as final products need to be carried across borders. Different factors might explain the differences in industrial concentration in Indian states.
We look at the effect of three groups of factors on industrial concentration of regions. The first group of variables is related to economic geography. According to traditional theory, geographical factors play the main role in determining industrial agglomeration. In India, we find that most industrial towns are located either around ports or mineral-rich areas in the early stage of industrialization. However, the theory cannot explain some important findings about industrial localization. First, some areas with less geographical advantage may attract more industries. Second, those with similar geographical conditions may differ substantially as far as agglomeration is concerned.
Variables related to economic policies are the second group that may influence industrial agglomeration. Economic opening might contribute to industrial agglomeration indirectly. For instance, local infrastructure will probably improve to attract more foreign direct investment (FDI), which consequently makes it more attractive for firms. It is argued that economic opening may also bring better management and technology to local firms through FDI, which helps attract more firms.
However, there is another possible explanation that cannot be neglected, which is emphasized by new economic geography theory. These variables are considered as a third group that influence industrial agglomeration. By assuming increasing returns, which borrows from new international trade theory, it tells a different story from the traditional one. Given two geographically similar regions, industrial concentration might begin by chance in one region. Increasing returns will enable it to continue attracting industries as long as inter-regional transaction costs are not high. This results in industrial agglomeration. According to the framework of new economic geography theory, the following factors are essential for industrial agglomeration.
(i) Local stock of human capital. The more the stock of human capital, the less the cost of research and development (R&D), and the easier to gain from innovation.
(ii) Market size. Firms tend to agglomerate where the regional market size is large. Other things being equal, the size of a local market will be large with high per capita income and a large population size.
(iii) Trade costs. These are one of the core parameters in new economic geography theory. Lower trade costs, such as lower transaction or transportation costs, will encourage industrial concentration. These are one of the core parameters in new economic geography theory. Lower trade costs, such as lower transaction or transportation costs, will encourage industrial concentration (Martinez-Zarzoso et. al. 2003)
What should be emphasized is that new economic geography theory does leave space for other factors such as economic policies and geography to play their roles. As stated by Neary (2001), when trade costs are in a certain range, both agglomeration and diversification are possible equilibriums, and history and policy have a role in influencing which equilibrium prevails. Accordingly, in this study, we test the roles

Developing Economic Corridors in South Asia
54
of both policies and history in influencing agglomeration, something that has not been given enough emphasis in recent studies.8
A general model for explaining industrial concentration in a region can be written as
ICit = α + b1PC
it + b2UR
it + b3RL
it + b4 RE
it + b5EDU
it + b6 BD
it + b7 EXP
it + u
it (6)
where ICit = share of industry in region i in the year t; economic policy variables—EXP
= share of exports in the region; PCit = population concentration in the region; economic
geography variables—BDi = border dummy; new economic geography variables—UR
it
= urbanization; RLit = length of national highways in the region i; RE
it = expenditure on
roads in the region i, and EDUit= enrolment in technical education.
A more general model of industrial agglomeration could be estimated using some more policy variables, such as the share of trade and government expenditure in the region, and an index of the state’s economic liberalization. Also, some variables that are characterized as new economic geography variables, such as the input share of industries, could be included in the model. Due to nonavailability of data, we restrict the model to using only the variables described in equation (6).
In this model, concentration of industries (IC) in a region is measured in terms of the share of three indicators—(i) output (ICOUT), (ii) number of firms (ICNF), and (iii) employment (ICEMP)—in a region to the total. The variable population concentration (PC) in the region captures the regional size effect. A larger population share indicates a larger output and input market. Thus, one can expect a positive relation between industrial concentration and population concentration. The value of the border dummy (BD) is 1 where the state has a boundary with another country, otherwise it will be zero. Industries close to the border have the advantage of easy access to a foreign market, both for exporting products and importing inputs. Thus, the expected sign of this dummy variable is positive. Urban development defined as the share of the nonagricultural population to the total in a region (URBAN) is a proxy of regional infrastructure. It is expected that a region with better infrastructure will attract more industries, and the expected sign of the variable is positive. Road length (RL) and expenditure on roads (RE) are the two proxies of cost and time incurred for transportation of goods. Good roads will reduce the cost of trade, and have a positive association with industrial concentration. The enrolment in technical education in a region (EDU) serves as a proxy for comparative advantage in human capital. A region with rich human capital attracts industries, and we can think of a positive association between (EDU) and industrial concentration.
4. Empirical Results
4.1 Gravity ModelWe first analyze the results of a gravity model with a panel data of 20 pair groups for 22 years from 1987 to 2008. Data on bilateral trade among five countries—Bangladesh, 8 However, the effects of these variables on the location of agglomeration are hard to predict due to the
complicated interaction of agglomeration and dispersion forces.

Infrastructure Development, Industrial Agglomeration and Regional Trade in South Asia
55
India, Nepal, Pakistan, and Sri Lanka—have been taken for the analysis from World Bank data. This is a balanced panel in the sense that we have used all the cross-section group observations of each year. We have estimated four separate panel regressions for the export and import equations without and with a year dummy. The results are presented in Table 2.1.
It is observed that the two variables, gross domestic products (GDPs) of the reporter country and the partner country, appear to be statistically significant with the expected sign when the dependent variable is either export of the exporter country or import of the importer country. Reporter and partner are exporter and importer when the trade flow in the gravity model is export and in case of import it is the reverse. The distance variable is not statistically significant. FDI of the reporting country appears to be positive and significant when import is taken as the dependent variable. However, when we take export as the dependent variable, the sign of FDI of the reporting country becomes negative, but always statistically significant. On the other hand, FDI of the partner country is positive and statistically significant when export is taken as the dependent variable. Road infrastructure does not always give the expected signs. In the case of export as the dependent variable, the sign of road infrastructure of the exporting country is positive as expected and statistically significant. However, with import as the dependent variable, the sign of the same variable is negative. When export is taken as the dependent variable, the sign of the road infrastructure of the partner country is negative. In all the cases, the coefficients of the border dummy are insignificant. The coefficients of the landlocked dummy are negative in the case of export as the dependent variable, and positive in the case of import as the dependent variable. We have estimated a number of alternative panel regressions, but took only those with high adjusted R2 values. We did not get good results of all the explanatory variables in the gravity model. This was expected because this is a partial gravity model that considers only a few countries in explaining the trade flow of a particular country.
We know that when the independent variables are correlated with the error term of the model in a panel regression, the usual model will be fixed-effect one. But if there is no correlation of the independent variables with the white noise, we can apply the random-effect model. We have done the Hausman test for our models and it suggests a random-effect model for the estimation of coefficients.
4.2 Effect of Cross-Border Infrastructure on TradeIn this section, we try to find the effect of cross-border transport facilities on trade, export, and import. This is a separate section due to the nonavailability of data on transport costs and time related to the countries and time span of the gravity analysis. We have taken data for seven South Asian countries—Afghanistan, Bangladesh, Bhutan, India, Nepal, Pakistan, and Sri Lanka—and for three time points—2007, 2008, and 2009.
On the basis of the Durbin-Wu-Hausman (DWH) test, it was decided whether a 2SLS model or a simple OLS was enough to find the effect of border cost and time on trade.

Developing Economic Corridors in South Asia
56
Table 2.1: Panel Regression of Gravity Models
Variables Random Effect Random Effect Random Effect-Year Dummy
Random Effect-Year Dummy
Export Import Export Import
GDP of reporter 1.3192 1.0526 1.4651 1.2167
(9.50) (8.26) (9.92) (9.00)
GDP of partner 1.0244 1.4535 1.1049 1.5405
(10.28) (15.89) (10.54) (16.06)
Bilateral distance –0.2706 0.1451 –0.3583 0.0186
(–0.95) (0.55) (–1.24) (0.07)
FDI of reporter –0.1328 0.1314 –0.0790 0.2063
(–2.57) (2.77) (–1.24) (3.53)
FDI of partner 0.0992 –0.0765 0.1211 –0.0394
(1.90) (–1.60) (2.03) (–0.72)
Road infrastrucure of reporter
0.3474 –0.6215 0.3357 –0.6311
(1.90) (–3.70) (1.82) (–3.73)
Road infrastructure of partner
–0.6391 0.0684 –0.5699 0.1545
(–4.01) (0.47) (–3.50) (1.04)
Border dummy –0.4000 –0.2616 –0.7503 –0.6676
(–0.99) (–0.71) (–1.78) (–1.73)
Landlocked dummy
–1.3151 0.7188 –0.8908 1.2199
(–2.56) (1.53) (–1.67) (2.50)
Constant –36.9589 –43.2417 –41.0013 –47.6215
Observations 440 440 440 440
R2 0.5656 0.5773 0.5907 0.6044
Note: Figures in parentheses represent t-statistics.
Source: World Bank data by country from http://data.worldbank.org.
Table 2.2 gives the final estimates of the models and the variables are in logarithms. In the first stage, we have estimated the predicted values of export and import cost using standard OLS where the independent variables are (i) road density (kilometers of road per square kilometer), and (ii) paved roads (as a % of total roads). The coefficients of these two variables are negative as expected, and statistically significant. When export as a dependent variable is regressed on GDP, openness, border time, and estimated border cost, the effect of GDP is significant and both export processing time and cost, as expected, have a negative impact on export. However, the coefficient of export cost is not statistically significant. To find the impact of the predicted import cost, the time for processing imports, and of the other two variables (GDP and openness), we regress these on import. The coefficient of both variables—import cost and time—are negative but the coefficient of time to import is not statistically significant. In both regressions, the coefficient of openness is not significant.

Infrastructure Development, Industrial Agglomeration and Regional Trade in South Asia
57
Table 2.2: Effect of Border Cost and Time on Trade
Independent Variables Export Import
Intercept –0.5477 –5.2081
(–0.14) (–2.52)
GDP Real 0.7477 0.8484
(11.46) (26.78)
Time to export (days) –1.5870
(–2.93)
Predicted real cost to export –0.5243
(–1.06)
Trade (% of GDP) 0.5892 0.0757
(1.55) (0.38)
Time to import (days) –0.2423
(–1.46)
Predicted real cost to import –0.4512
(–2.32)
Note: Figures in parentheses represent t-statistics.
Sources: (i) http://www.doingbusiness.org (ii) De, P., A.R. Khan, and S. Chaturvedi. 2008. Transit and Trade Barriers in Eastern
South Asia: A Review of the Transit Regime and Performance of Strategic Border Crossing. Asia-Pacific Research and Training Network on Trade (ARTNeT) Working Paper Series. No. 56. Bangkok: United Nations Economics and Social Commission for Asia and the Pacific.
(iii) http://www.dataworldbank.org.
4.3 Determinants of Industrial AgglomerationFinally, we examine the forces behind industrial agglomeration. The paucity of data restricts our analysis to only India. Data have been taken for 2003–04, 2004–05, and 2005–06. Note that different results may come out if we use data on other countries in a similar analysis. We analyze the agglomeration of industries in different regions of India in terms of three indicators—(i) the share of the number of industries in a region to the total; (ii) the share of the output of industries in a region to the total; and (iii) the share of employment of industries in a region to the total. All the variables are in logarithms. For each indicator, a separate regression has been estimated to find the factors that explain the agglomeration of industries. The interesting thing is that the results of the three regressions give the same sign as the independent variables, except in one case (Table 2.3a).
When we consider industrial concentration in terms of output, the coefficient of the variable LNURBAN is negative and statistically significant. The coefficient of the share of export indicated by the variable LNEXP is positive and statistically significant in all the cases we considered. Population concentration (LNPC), which captures the regional size effect, shows a positive and statistically significant effect of industrial concentration in the region. However, the effect of the border dummy is not always significant. Finally, the effect of human capital in terms of per capita enrolment in technical education in

Developing Economic Corridors in South Asia
58
the region shows a significant impact on industrial agglomeration. The high values of adjusted R2 indicate the explanatory power of the variables chosen for explaining the variation in agglomeration of industries in different regions of India.
Table 2.3a: Forces behind Industrial AgglomerationVariables LNICNF LNICOUT LNICEMPIntercept 2.3663 4.6852 3.3806LNEXP 0.3780 0.9861 0.3791
(3.35) (5.15) (3.28)LNURBAN 0.3296 –0.9721 0.1067
(1.85) (–3.21) (0.58)LNEDU 0.2782 0.2098 0.3724
(3.63) (1.61) (4.74)BD 0.1988 –0.0326 0.0535
(1.53) (–0.15) (0.40)LNPC 0.5927 0.2791 0.6029
(6.41) (1.78) (6.36)Adj. R2 0.8187 0.5684 0.8012Observations 48 48 48
Note: Figures in parentheses represent t-statistics.Sources: (i) MOSPI. Various years. Annual Survey of Industries. Various issues. New Delhi:
Ministry of Statistics and Programme Implementation. Government of India. (ii) MOSPI. Various years. Statistical Abstract of India. Various issues. New Delhi:
Ministry of Statistics and Programme Implementation. Government of India. (iii) MORTH. Various years. Road Transport Year Book. Various issues. New Delhi:
Ministry of Road Transport and Highways. Government of India.
Table 2.3b: Forces behind Industrial Agglomeration (Model with LNHW and without LPOP and LNURBAN)
Variables LNICNF LNICOUT LNICEMPIntercept –1.0982 –3.3878 –1.4718
LNRL0.2655 0.5368 0.3567(3.58) (5.97) (5.26)
LNEXP0.6963 0.6550 0.6046(7.29) (5.66) (6.92)
LNEDU0.2140 0.1063 0.2988(2.44) (1.27) (3.73)
BD0.2916 0.0936 0.1649(1.85) (0.49) (1.14)
Adj. R2 0.7299 0.6726 0.7642Observations 48 48 48
Note: Figures in parentheses represent t-statistics.Sources: (i) MOSPI. Various years. Annual Survey of Industries. Various issues. New Delhi:
Ministry of Statistics and Programme Implementation. Government of India. (ii) MOSPI. Various years. Statistical Abstract of India. Various issues. New Delhi:
Ministry of Statistics and Programme Implementation. Government of India. (iii) MORTH. Various years. Road Transport Year Book. Various issues. New Delhi:
Ministry of Road Transport and Highways. Government of India.

Infrastructure Development, Industrial Agglomeration and Regional Trade in South Asia
59
In the above models, we have taken the urbanization variable as a proxy of infrastructure development. However, it is sometimes argued that urbanization is a proxy of industrial concentration. Keeping this in mind, we run a separate set of models, explaining the variation in industrial concentration by replacing LNURBAN with the length of highways (LNRL), though the correlation between industrial concentration indicators and the urbanization variable is not high enough to consider urbanization as a proxy of industrial concentration. The problem with these results is that there is high multicollinearity among some of the variables, which we observed based on a VIF test of multicollinearity.9 In the correlation matrix, we see a high correlation between the variables LNRL and POP. Considering this, we estimated the models to explain the variability of industrial concentration without the variable LNPC. The coefficients of LNRL are positive and statistically significant. Since urbanization of any region positively affects industrial agglomeration, the sign of the coefficients of LNRL is expected to be positive. As in our previous model, the sign of the variables LNEXP and LNEDU are positive and statistically significant. Coefficients of the border dummy are, however, not always statistically significant. Population concentration (LNPC), which captures the regional size effect, again shows a positive and statistically significant effect of industrial concentration. The values of adjusted R2 are high enough to indicate a good fit of the models.
From these sets of models, it is found that trade has a significant positive role in explaining the variation of industrial agglomeration in a region. Again, it is observed that some of the new economic geography variables like urbanization and technical education are significant in explaining the variability of industrial agglomeration in any region. However, the effect of the traditional economic geography variable, the border dummy (BD), is not always significant in explaining industrial agglomeration.
5. Conclusions This study is an attempt to understand the effect of economic corridors (improvement of road transport and other infrastructure) on the development of countries through trade, and their impact on industrial agglomeration in border-sharing countries. However, the part on industrial agglomeration is confined to Indian states. The results of a gravity model with data from some South Asian countries suggest that the volume of GDP plays a crucial role in explaining the trade of a country. FDI, in most cases, influences promotion of regional trade. Contrary to general belief, the coefficients of road infrastructure are not always positive. Economic corridors could reduce the time and money spent at borders, and have a positive fallout on the volume of trade between countries, both in terms of exports and imports. In short, borders with developed infrastructures on either side facilitate trade between two countries. Our findings corroborate the expected effects of border cost and time on trade volume. This study confirms that agglomeration of industries in India, among many other things, depends on new economic geography variables such as improved infrastructural facilities such as economic corridors in the border region, and human capital.
9 Tolerance is defined as 21 jRTOL −= and VIF=1/TOL, where 2jR is the coefficient of determination
of regression of variable j on all other explanatory variables. A tolerance of less than 0.2 or 0.1 and a corresponding VIF value of 5 and 10 or above indicate a multicollinearity problem.

Developing Economic Corridors in South Asia
60
References
Ades, Alberto F. and Edward L. Glaeser. 1995. Trade and Circuses: Explaining Urban Giants. Quarterly Journal of Economics. 110 (1). pp. 195–227.
Anderson, James E. and Eric van Wincoop. 2004. Trade Costs. Journal of Economic Literature. XLII. pp. 691–751.
Anderson, James E. 1979. A Theoretical Foundation for the Gravity Equation. American Economic Review. 69 (1). pp. 106–16.
Bergstrand, Jeffrey H. 1985. The Gravity Equation in International Trade: Some Microeconomic Foundations and Empirical Evidence. Review of Economics and Statistics. 67 (3). pp. 474–81.
Bergstrand, Jeffrey H. 1989. The Generalized Gravity Equation, Monopolistic Competition, and the Factor-Proportions Theory in International Trade. Review of Economics and Statistics. 71 (1). pp. 143–53.
Bernard, A. B. and C. I. Jones. 1996. Productivities across Industries and Countries: Time Series Theory and Evidence. Review of Economics and Statistics. Feb.
Brun, Jean-François., Céline Carrère, Patrick Guillaumont and Jaime de Melo. 2005. Has Distance Died? Evidence from a Panel Gravity Model. World Bank Economic Review. 19 (1). pp. 99–120.
Coe, D. T., E. Helpman and A. Hoffmaister. 1997. North-South R&D Spillovers. Economic Journal. 107. pp. 134–46.
Deardorff, Alan V. 1998. Determinants of Bilateral Trade: Does Gravity Work in a Neoclassical World?. In Jeffrey A. Frankel, ed. The Regionalization of the World Economy. Chicago: University of Chicago Press.
De, P., A. R. Khan, and S. Chaturvedi. 2008. Transit and Trade Barriers in Eastern South Asia: A Review of the Transit Regime and Performance of Strategic Border-Crossings. Asia-Pacific Research and Training Network on Trade (ARTNeT) Working Paper Series. No. 56. Bangkok: United Nations Economic and Social Commission for Asia and the Pacific.
De, P. 2011. Why is Trade at Borders a Costly Affair in South Asia? An Empirical Investigation. Contemporary South Asia. 19 (4). pp. 441–464.
Fan, C. Cindy and Allen J. Scott. 2003. Industrial Agglomeration and Development: A Survey of Spatial Economic Issues in East Asia and a Statistical Analysis of Chinese Regions. Economic Geography. 79 (3). pp. 295–319.
Feenstra, Robert C. 2004. Advanced International Trade: Theory and Evidence. Princeton: Princeton University Press.
Feenstra, Robert C., James R. Markusen and Andrew K. Rose. 2001. Using the Gravity Equation to Differentiate among Alternative Theories of Trade. Canadian Journal of Economics. 34 (2). pp. 430–47.

Infrastructure Development, Industrial Agglomeration and Regional Trade in South Asia
61
Hanson, G. H. 1994. Localization Economies, Vertical Integration, and Trade. NBER Working Paper Series. No. 4744. Cambridge, MA: National Bureau of Economic Research.
Hanson, G. H. 1996. US-Mexico Integration and Regional Economies: Evidence from Border-City Pairs. NBER Working Paper Series. No. 5425. Cambridge, MA: National Bureau of Economic Research.
Haveman, Jon and David Hummels. 2004. Alternative Hypotheses and the Volume of Trade: The Gravity Equation and the Extent of Specialization. Canadian Journal of Economics. 37 (1). pp. 199–218.
Helpman, Elhanan. 1987. Imperfect Competition and International Trade: Evidence from Fourteen Industrial Countries. Journal of the Japanese and International Economies. 1 (1). pp. 62–81.
Helpman, E., M. Melitz and Y. Rubinstein. 2008. Estimating Trade Flows: Trading Partners and Trading Volumes. Quarterly Journal of Economics. 123. pp. 441–87.
Henderson, J. V. 1988. Urban Development: Theory Fact and Fusion. New York: Oxford University Press.
Henderson, J. V. 1996. Ways to Think About Urban Concentration: Neo-Classical Urban Systems versus the New Economic Geography. International Regional Science Review. 19 (1–2). pp. 31–36.
Keller, W. 1998. Are International R&D Spillover Trade-Related? Analyzing Spillovers among Randomly Matched Partners. European Economic Review. 42. pp. 1469 –81.
Krugman, Paul and Raul Livas Elizondo. 1996. Trade Policy and the Third World Metropolis. Journal of Development Economics. 49 (1). pp. 137–50.
Krugman, Paul and Anthony J. Venables. 1995. Globalization and the Inequality of Nations. Quarterly Journal of Economics. 110 (4). pp. 857–80.
Limão, N. and A. J. Venables. 2001. Infrastructure, Geographical Disadvantage, Transport Costs and Trade. World Bank Economic Review. 15. pp. 451–79.
Linnemau, H. 1996. An Econometric Study of International Trade Flows. Amsterdam: North Holland Publishing Company.
Lucas, R. E., Jr. 1988. On the Mechanics of Economic Development. Journal of Monetary Economics. 22. pp. 3–42.
Martinez-Zarzoso, I., L. Garcia-Menendez and C. Suarez-Burguet. 2003. Impact of Transport Costs on International Trade: The Case of Spanish Ceramic Exports. Maritime Economics & Logistics. 5. pp. 179–98.
Neary, J. P. 2001. Of Hype and Hyperbolas: Introducing the New Economic Geography. Journal of Economic Literature. 39 (2). pp. 536–61.

Developing Economic Corridors in South Asia
62
Okada, A. and N. S. Siddharthan. 2007. Industrial Clusters in India: Evidence from Automobile Clusters in Chennai and the National Capital Region. Discussion Paper No. 103. Chiba: Institute of Developing Economies.
Paelinck, J. H. P. and Sj. Wagenaar. 1981. Supply Effects in Regional Economic Models. Canadian Journal of Regional Science. IV (2). pp. 145–67.
Poyhonen, P. 1963. A tentative model for the volume of trade between countries. Neltwirtschaftliches Archiv, 93–100.
Quah, D. T. 1996. Regional Convergence Clusters across Europe. European Economic Review. 40. pp. 951–958
Straub, S. 2008. Infrastructure and Development: A Critical Appraisal of the Macro Level Literature. World Bank Policy Research Working Paper 4590. Washington, DC: World Bank.
Tinbergen, Jan. 1962. Shaping the World Economy: Suggestions for an International Economic Policy. New York: Twentieth Century Fund.
Westerlund, J. and F. Wilhelmsson. 2011. Estimating Gravity Model without Gravity Using Panel Data. Applied Economics. 43. pp. 641–49.
Williamson, J. G. 1988. Migration and Urbanization. In H. Chenery and T. N. Srinivasan, ed. Handbook of Development Economics. Vol. I. Amsterdam: North Holland. pp. 425–65.

63
Chapter 3
Economic Corridors, Trade Costs, and Regional Production Networks in South Asia
Ajitava Raychaudhuri and Prabir De
1. IntroductionAn economic corridor is a concept where infrastructure is specially promoted to strengthen trade and economic integration among two or more countries. The aim behind this is not only promotion of trade across borders, but also economic development along the trade routes (Wiemer 2009). The advantage of promoting economic corridors is realized when trade across them is sufficiently liberalized and seamless, thus lowering the cost of trade across borders.
As noted in Kimura and Kobayashi (2009), the fragmentation theory argues that the key to attract fragmented production blocks is improving locational advantages by, for example, developing special economic zones (SEZs) with an improved climate for local investment; and reducing the cost of service links that connect remote production blocs by improving trade and transport facilities. Figure 1.4 in this book graphically shows the links between production blocks and service links. In fragmentation of production, improved service links, such as economic corridors, are important for the expansion of production networks across a region.
Higher trade costs are an obstacle to trade and impede the realization of gains from trade liberalization. Along services links, they could discourage the fragmentation of production. Trade costs are measured in terms of transportation as well as border trade and distribution costs. They often increase due to obstacles to trade, of which inadequate infrastructure is a prominent one. Liberalization of trade services enables overcoming infrastructural inefficiency (Deardorff 2001). However, low trade costs do not necessarily promote production networks. One can say better infrastructure is a necessary, but not a sufficient condition for the development of production networks.
This study elaborates these issues and is organized as follows. Section 2 presents some stylized facts on economic corridors and trade costs. The data and methodology

Developing Economic Corridors in South Asia
64
are discussed in Section 3, and the estimated results are presented in Section 4. Section 5 discusses production networks along economic corridors, and Section 6 provides the conclusion.
2. Economic Corridors and Trade CostsEconomic corridors provide great opportunities for spreading economic benefits across a region. As Weimer explains,
The starting point for a transnational economic corridor is a link across borders defined by transport infrastructure. The infrastructure provides access to markets for buying inputs to production and consumer goods and for selling products. This promotes trade and the economies of scale that follow from specialization in production. Further, with geographical clustering of business activity along a transport route, economies of scope and agglomeration come into play. (Weimer 2009, 4).
Clearly, the cost of transport is a major component of the direct cost in trade. However, direct costs, which are observable, come with some indirect costs, which will be discussed later.
Anderson and van Wincoop (2004) note that trade costs include all costs incurred in getting a good to a final user other than the direct cost of production. They include transportation costs (both freight costs, which is a direct cost, and time costs, which need to be imputed) and policy barriers (tariffs and nontariff barriers, some of which again need to be imputed). Apart from these, there are costs associated with information gathering, contract enforcement, currency conversion, legal and regulatory measures, and local distribution (wholesale and retail). Costs are decomposed into three elements—monetary cost, time cost, and reliability/credibility/stability. The last is particularly important in the case of a developing country though it is difficult to get an accurate estimate of it.
The seamless movement of goods is vital to reducing trade costs. High transport and logistics costs impede competition, and Asia lags behind Europe and North America in reducing them (Kuroda et al. 2007). A lower trade cost helps generate higher regional trade. East Asia’s intraregional trade is the most developed in Asia, mainly due to its relative advantage in transportation. The Greater Mekong Subregion (GMS) initiative has been developed on the principle of economic corridors. However, compared to about 45% intraregional trade among East Asian countries (excluding Japan), intraregional trade in South Asia only grew from 3% in 1991 to around 5% in 2009. Low regional trade is an outcome of the excessive cost of doing business in South Asia (De 2011). As De (2011) points out, improved trade facilitation would enhance regional trade very much the way that tariff liberalization does. An important means of promoting regional trade is improving trade facilitation, which will also open links to landlocked countries.
Tables 3.1 and 3.2 reveal the great imbalance in trade between India and its South Asian partners. Although Bangladesh is now exporting to India at a faster rate than what India was exporting to it in 2009–10 and 2000–01, the small base in the initial years

Economic Corridors, Trade Costs, and Regional Production Networks in South Asia
65
still puts it in a disadvantageous position. Before one looks into plausible reasons, it would be meaningful to look at the items of export between Bangladesh and India in recent years.
Table 3.1: India’s Exports to South Asia
Country 2009–10 2000–01 CAGR
($ million) (%)
Afghanistan 463.55 25.86 37.81
Bangladesh 2,433.77 935.04 11.21
Bhutan 118.86 1.08 68.60
Maldives 79.86 24.61 13.97
Nepal 1,533.31 140.84 30.38
Pakistan 1,573.32 186.83 26.71
Sri Lanka 2,188.01 640.14 14.63
Total 8,390.69 1,954.41 17.57
Note: CAGR = Compounded annual growth rateSource: http://www.commerce.nic.in/eidb/default.asp. Department of Commerce. Ministry of
Commerce and Industry. Government of India.
Table 3.2: India’s Imports from South Asia
Country 2009–10 2000–01 CAGR
($ million) (%)
Afghanistan 125.19 26.59 18.78
Bangladesh 254.66 80.51 13.65
Bhutan 153.11 21.09 24.64
Maldives 3.63 0.19 38.79
Nepal 452.61 255.08 6.58
Pakistan 275.94 64.03 17.62
Sri Lanka 392.19 45.01 27.19
Total 1,657.34 492.49 14.43
Note: CAGR = Compounded annual growth rateSource: http://www.commerce.nic.in/eidb/default.asp. Department of Commerce. Ministry of
Commerce and Industry. Government of India.
Table 3.3 shows that certain groups of products figure prominently in India’s export basket—food products such as onions, rice and sugar; coal and related products; and yarn (cotton and polyester) and fabrics (mainly denim). Coal is exported mainly by rail, but yarn and fabrics are almost exclusively exported by road. Both modes are important to economic corridors. Multimodal transportation may also be considered, though that is not very common in this sector. This discussion aims at exploring the possibility of developing an economic corridor both by reducing trade costs, and promoting production networks. Taking up the latter in the next section, we now concentrate on the first aspect.

Developing Economic Corridors in South Asia
66
Table 3.3: India’s Major Exports to Bangladesh
HS code Item 2008–09
($ million)070310 Onions and shallots, fresh or chilled 157.70
100630 Semi-milled or wholly milled rice, whether or not polished or glazed 229.33
170111 Cane sugar 73.97
170199 Sugar refined not containing flavoring or coloring matter 82.82
230400 Oil-cake and other solid residues, whether or not ground or in the form of pellets 82.56
270119 Other coal whether or not pulverized, but not agglomerated 59.61
520100 Cotton, not carded or combed 78.71
520521 Cotton yarn (other than sewing thread), containing 85% or more by weight of cotton, measuring 714.29 decitex or more (not exceeding 14 metric number)
67.71
520522 Cotton yarn (other than sewing thread), containing 85% or more by weight of cotton, measuring equal to 232.56 decitex (exceeding 14 metric number but not exceeding 43 metric number)
24.07
520523 Cotton yarn (other than sewing thread), containing 85% or more by weight of cotton, measuring less than 232.56 decitex but not less than 192.31 decitex (exceeding 43 metric number but not exceeding 52 metric number)
51.21
520524 Cotton yarn (other than sewing thread), containing 85% or more by weight of cotton, measuring less than 192.31 decitex but not less than 125 decitex (exceed-ing 52 metric number but not exceeding 80 metric number)
21.19
520942 Denim 50.55
Source: http://www.commerce.nic.in/eidb/default.asp. Department of Commerce. Ministry of Commerce and Industry. Government of India.
Since trade in an era of globalization is more of the intra-industry type,1 we look at the potential for this between India and Bangladesh. The intra-industry trade (IIT) index identifies the scope for production networks and vertical trade between India and Bangladesh. IIT occurs when a country imports and exports similar types of products within the same industry or sector. There are two types of IIT—horizontal and vertical (Greenaway et al. 1995). The literature views the index as a measure of the degree to which trade in a particular sector represents trade within an industry (based on scale economies and/or market structure). By engaging in IIT, a country can reduce the number of similar goods it produces, and benefit from scale economies. Higher IIT ratios suggest that the sources of gain are being exploited. The IIT index measures the degree of overlap between imports and exports in the same commodity category, with a value of 1 indicating pure IIT and a value of 0 indicating pure inter-industry trade.2 1 Intra-industry trade produces extra gains from international trade, over and above those from comparative
advantage, because it allows countries to benefit from a larger market and economies of scale. See, for example, Krugman and Obstfeld (2000).
2 Before calculating IIT, data coordinates at HS nomenclature H2 were matched for both the countries. The traditional way to measure the degree of IIT is the Grubel–Lloyd Index (G–L Index). For further details on IIT, see Mikic and Gilbert (2007, 76).

Economic Corridors, Trade Costs, and Regional Production Networks in South Asia
67
Table 3.4: Intra-Industry Trade Index in 2007: Common Set of Products at 6-digit HS
HS Code Product IIT India IIT Bangladesh
230220 Rice bran oil 0.94 0.84
721550 Bars and rods other than free-cutting steel not further worked than cold-formed or cold-finished 0.92 0.42
850720 Other lead-acid accumulators 0.92 0.56
600622 Other knitted or crocheted fabrics of cotton , dyed 0.77 0.93
960719 Other slide fasteners 0.77 0.72
610510 Men’s/boys’ shirts of cotton 0.76 0.82
621790 Parts of garments/clothing accessories 0.73 0.46
848390 Parts of transmission shafts, cranks, bearing housings, gears or clutch 0.70 0.78
854419 Winding wires of other metals or substances 0.51 0.63
620319 Suits of other textile materials 0.49 0.70
521211 Other unbleached woven fabrics of cotton weighing not more than 200 g/m2 0.42 0.77
Note: IIT or intra-industry trade index was calculated for bilateral trade between India and Bangladesh.Source: De, P., S. Raihan and S. Kathuria. 2012. Unlocking Bangladesh–India Trade: Emerging
Potential and the Way Forward. Policy Research Working Paper 6155. Washington, DC: World Bank.
Table 3.4 presents the common set of traded goods between India and Bangladesh for which the IIT index scores are relatively high. The estimated scores indicate that IIT index levels are higher in manufactured products, reflecting the greater role of economies of scale. The IIT scores suggest that there are production-sharing opportunities in a static sense in 11 products with varying potential. The range of such potential varies from textiles and clothing (most concentration) to iron and steel (least concentration), while electrical machinery and equipment, and mechanical appliances occupy the middle (medium concentration).The index scores also indicate that there are only two sectors in which IIT accounted for a moderate share between India and Bangladesh—textiles and clothing, and electrical machinery and mechanical appliances. In other sectors, IIT accounted for either a low or negligible share. Therefore, we select textile yarn and fabric exports from India to Bangladesh for further investigation of the links between economic corridors, trade costs, and production networks.
It makes sense to focus on yarn and fabric exports because Bangladesh depends heavily on India for these inputs to produce readymade garments (RMG), which fetch more than 75% of its export earnings (Haider 2007). A good supply chain can be created between India and Bangladesh for this sector and it will enhance the competitiveness of Bangladesh’s RMG exports. Though Bangladesh has adopted the long-term goal of developing a textile sector to supplement the RMG sector, promoting regional cross-border trade based on the comparative cost principle holds the key to success (Knappe 2002, Quasem 2002).

Developing Economic Corridors in South Asia
68
Lack of infrastructural development and the low efficiency of existing facilities are two major reasons for high trade costs in South Asian regional trade (De and Bhattacharyay 2007, De et al. 2012). The importance of both quantity and quality of infrastructure in promoting trade and economic development cannot be overemphasized (Raychaudhuri and De 2010, Raychaudhuri 2010). At the same time, a true reduction in trade costs along any economic corridor can only be achieved if corresponding services such as transportation, insurance, and finance are liberalized. Deardorff (2001) shows with the help of a simple model how unit costs of production, inclusive of transportation cost, can decrease if trucks are allowed to cover the full distance from origin to destination. The same logic applies to other services, especially insurance and finance.
This paper makes an effort to calculate the benefit of trade service liberalization between India and Bangladesh. The reasons for this are worth summing up. First, Bangladesh and India do not allow trucks from either side to cross border checkpoints (Subramanian and Arnold 2001). This allows the more inefficient partner to carry on with inefficiency. Second, Bangladesh buys cotton and polyester yarn from India through cross-border trade. A relatively old estimate, in 1999–2000, shows import of yarn met 75% of the total demand, while more than 81% of exported finished garments used imported fabrics (Quasem 2002). Thus, yarn export from India is a good example to understand the impact of trade service liberalization in South Asia. Third, given the practice of Bangladeshi banks issuing exclusive letters of credit (LCs) to Indian exporters, one can study the possible loss due to their inefficiency in carrying out LC commitments in time. An LC is not an export credit granted by the exporting country to its exporters. It is simply an arrangement for carrying out international transactions in a hard currency that is guaranteed by a bank having a license for foreign exchange transactions. Bangladeshi importers are mandated to have LCs from only Bangladeshi banks, which take a relatively longer time than international banks. This is part of the trade costs affecting international trade between the two countries.
3. Data and Methodology: Deardorff’s Model of Trade ServicesBefore proceeding further, it would be useful to look at Deardorff’s model (2001), which discussed the rationale for liberalizing trade services. Trade services are those for which demand arises directly from international trade, such as transportation, communication, insurance, and banking. According to him, “The motive for liberalizing trade in services, coming as it did from the service industries themselves, was to permit rationalization of service activities along the lines of comparative advantage.” As an example, he cites US–Mexico cross-border transportation services. Before the North American Free Trade Agreement (NAFTA), Mexican truckers were not allowed to enter the US and vice versa. So, Mexican trucks would carry goods to the US up to the checkpoint, where they would be unloaded, and then reloaded on to US-registered trucks. Consignments faced a number of transaction costs in the form of time, customs delay, regulatory costs, and so on. After the NAFTA, liberalization has allowed consignments to be shipped in Mexican trucks up to their destination in the US. This has eliminated most trade transactions, leading to a reduction in transport costs and time. It has also led to a fall in the final goods price. Deardorff’s simple but elegant model is described below.

Economic Corridors, Trade Costs, and Regional Production Networks in South Asia
69
Here, S = a particular shipment of goods, F = foreign country where S originates, H = home country, which is the destination country, and L = a low-cost third country.
Suppose the trade service here is shipping transportation. Let, s = per unit shipping cost = constant at a rate c (actually a vector of variety of costs), cI = cI (AI,wI), where I = country and I = H or F or L; AI = available technology, and wI = vector of factor prices. In this model, cI determines the basis for trade either by the Ricardian principle (countries have different technologies, hence AI differs), or by the Heckscher–Ohlin principle (whereby difference in factor endowments leads to different factor prices, hence wI differs).
Let A and B be two specific locations in F and H, respectively, whereby S is shipped from A to B. The total cost of shipping is
CI = c0 + c
1Qs + c
2D
AB + c
3QsD (1)
where, c0 = fixed cost, which primarily is regulatory costs, c1 = cost of loading assumed to be invariant to volume, c2 = fixed cost per unit of time, like a driver’s wage, c3 = constant unit cost that depends both on time and distance, like fuel cost, Qs = quantity in the particular shipment s, and DAB = distance between A and B.
Thus, per unit cost of trade services, earlier denoted as s, looks as following
SI = cI/Qs = c(Qs,D, AI,wI)/QS = sI(D) (2)
For simplicity, let us redesignate some of the notations as follows: A = F = Origin, B = Border checkpoint, and H = Destination. Then, under autarky (or the preliberalization regime), the total cost of shipment is
CAut = Autarky cost = CF(Qs,DFB
, AF,wF) + CH(Qs,DBH
,AH,wH)
= ( ) ( )0 0 1 1 2 2 3 3
F H F H S F
FB
H
BH
F sFB
H SBHc c c c c c c cQ D D Q D Q D+ + + + + + + (3)
Under barriers to trade, sAut = CAut/QS. We have to remember that this is not an iceberg model, so that original shipment QS is carried as it is from origin to destination.
Now suppose the economies liberalize trade services across national boundaries so that these services can be traded across the border. In that case, a consignment from origin to destination can either be carried by truckers from the foreign country (F) where the shipment originates, or from the destination home country (H), or from a third country (L) that can provide such trade services at the cheapest possible cost. One should remember that L can be F or H or a separate third country. The advantage of such liberalization is that the original route touching the border checkpoint (B) becomes redundant. The shipment may move by another route that provides the cheapest alternative. Thus for L, the total cost will be given by
c c c Q c D c Q DL L L s LFH
L sFH= + + +0 1 2 3
(4)

Developing Economic Corridors in South Asia
70
Hence, by definition, free trade cost per unit of trade service = sfree = sL (DFH
)
= ≤ ( ) ( ) C Q s D s DH F
L S FFH
HFH/ min ,
. (5)
The question remains, is sfree + sAut? If the answer is yes, trade service liberalization across borders will reduce cost, thus being beneficial to countries.
Now, taking the difference sAut – sfree, we derive the following
s s s D s D s D s D s D
s D
Aut free FFB
HBH
LFH
FFB
LFB
H
− = ( )+ ( )− ( )= ( )− ( ) +
BBHL
BHL
FBH
BHL
FHs D s D s D s D( )− ( ) + ( )+ ( )− ( ) (6)
The first two terms above are usually nonnegative because a low-cost carrier has a cost advantage over others. We must, however, remember that the B point is an artificial construct here to get a proper intuitive result. The last term may be expanded and it turns out to be as follows
The last term = C
QC D D D
C
QC
SL
FB BH FH
L
SL2
1
30
1 2 1+
[ ]
+ + + −
( ) − (7)
Equation (7) is written the way Deardorff has it since it highlights the essential point unambiguously. The first part in equation (7) is nonnegative, due to the basic logic of cost saving. The last part is unambiguously positive the way it is written. The point to emphasize is that the last term clearly shows the fixed cost associated with the cost function is saved since duplication of costs in the form of loading and reloading or waiting time are avoided. This clinches the issue and the expression in equation (6) becomes positive, implying s sfree Aut⟨ or that autarky has a higher cost of shipment compared to liberalized trade services across borders.
To empirically estimate the cost of transportation of yarn to Bangladesh from India, we have adopted a modified Deardorff methodology. The empirical part of this study is motivated by the aforesaid model except that the cost per unit of transportation includes both direct transportation and logistics costs. The components are calculated differently, like cost of loading includes the opportunity cost of the time spent at the border checkpoints, and transportation costs are composite terms without a breakup between fuel and driver costs. The detailed calculations and assumptions are in Appendix 2.
A survey was conducted both in India and Bangladesh following the standard supply chain logic. This was needed to combine suppliers of inputs with users of the product in a backward linkage framework. Though supply chains can be more than one and may be at several stages, here we consider only the stage of yarn supply to Bangladesh’s RMG producers. The survey was conducted in Ludhiana in Punjab state of India, which is a major center for yarn production and a supplier to Bangladesh, and Dhaka in Bangladesh, which is a leading RMG production center. Since the survey had to be done in a short time, the number of respondents is limited,

Economic Corridors, Trade Costs, and Regional Production Networks in South Asia
71
but the methodology and findings will be of use to future large-scale surveys on similar lines.3
Seven producers in Dhaka and eight suppliers in Ludhiana were interviewed with a predesigned questionnaire. The primary focus was getting an estimate of the cost components of transportation from Ludhiana to Dhaka via the Petrapole–Benapole border crossing. Goods went from Ludhiana to Petrapole either by 10-ton trucks or 22-ton container trucks. At the border, there was waiting on either side, which included time for paperwork by the customs and border authorities on both sides. This duplicated some of the requirements, resulting in a higher transaction time, and hence higher trade cost. On average, three days each was spent on either side of the border since the goods had to be unloaded and reloaded at the checkpoint, with customs checking on both sides. In addition, road conditions in Bangladesh preclude the use of container trucks there.
The border checkpoint at Petrapole on the Indian side suffers from several regulatory and infrastructural inefficiencies. As Das and Pohit (2007, p.5) observe,
The delays at the border take place at the parking lots, customs clearances, and entry/exit points. It is mandatory for the trucks coming from Kolkata during daytime to park at the Bongaon Municipality Parking, instead of moving directly towards the Central Warehousing Corporation (CWC) parking lot, which is situated near the border gate and adjacent to the Indian Customs House. The trucks are allowed to move serially, based on their entry coupons, towards the Petrapole border only after 11 pm in the summer and after 10 pm in the winter. At the border, the trucks are again made to park at the parking space of the CWC. After getting clearances from the Indian customs authorities, trucks can cross the border between 10 am and 5.30 pm.
These clearly are part of trade costs and we have tried to impute values for these costs in the calculations below.
4. Estimated ResultsThe total cost of transportation consists of a direct monetary component as well as an imputed component, which reflects the costs of regulatory delays as well as infrastructural inefficiency. So this is really a partial picture of the trade cost. The calculation is done separately for the Indian and Bangladeshi segments, and the average trade cost per kilogram of yarn transported is calculated. This yarn is used to produce T-shirts or polo shirts by RMG producers in Bangladesh. Using the minimum and the maximum price per unit of each category of shirt and their corresponding standard weights in grams, an approximation of the minimum and maximum shares of trade cost in T-shirt and polo shirt export revenues for 1 kg of India-made imported yarn used in production is calculated. Next, assuming this kind of trade service is liberalized as per the Deardorff model, the cost saving is calculated (details in Appendix 2). The results are in Table 3.5.3 These questionnaires are available on request. Altogether, seven producers in Dhaka and eight producers
(suppliers) in Ludhiana were interviewed with a predesigned questionnaire.

Developing Economic Corridors in South Asia
72
Table 3.5: Trade Cost Reduction If Transport Service is Liberalized
Item Preliberalization Trade Cost
(as % of export revenue earned for 10 kg of imported yarn
from India)
Postliberalization Trade Cost
(as % of export revenue earned for 10 kg of imported yarn
from India)
Gain for Liberalized Trade Services
(in % of original)
T-shirt Maximum: 17.20 Maximum: 8.10 64.53
Minimum: 5.90 Minimum: 3.30 59.32
Polo shirt Maximum: 8.10 Maximum: 2.90 64.20
Minimum: 3.30 Minimum: 1.30 66.61
Source: Survey data.
As can be seen from Table 3.5, in relative terms, the transport cost is an insignificant component of the final revenue that Bangladeshi exporters earn, except perhaps for T-shirts. However, the gain from a liberalized regime (though only partial in nature) is significant and may be important to competitiveness in the international market where ruthless competition magnifies even minor cost advantages into significant gains. This is elaborated by Hummels (2007) although his discussion is centered on sea and air transportation.
The reduction in trade cost indicated in Table 3.5 is partial since it does not take into account the possible gain if LCs given by Bangladeshi banks to Indian exporters are liberalized. The back-to-back LC is a credit instrument that allows RMG producers in Bangladesh to order yarn from India without either advance payments or immediate transfer of funds to suppliers. This system is well recognized in international trade, but inefficiency in the Bangladeshi banking system leads holding up funds to suppliers. The survey revealed that end users in Bangladesh usually released funds in 18 to 30 days, while Indian suppliers reported that LCs were honored in 90 days on average. It is difficult to account for this delay. However, it can be minimized if the most efficient banker is given access to this transaction. What does this delay cost suppliers? If one assumes an interest rate of 9% per annum on borrowed funds from banks in India, suppliers add 60 days of opportunity cost at this rate on the exported yarn value. One may add exchange rate fluctuations to this, especially if the currency is appreciating against the US dollar. Suppliers usually factor in such trade costs in their transportation costs for a month’s time. The extra 60 days delay may well be avoided. This roughly amounts to 1.5% of the transportation cost per kg if the exchange rate is assumed to be stable. It will be more if the Indian rupee appreciates against the dollar. Though we have not included this trade cost in the figures in Table 3.5, such costs may be reduced if the most efficient banker gets the LC contract. This does not benefit the Bangladeshi producer, but it certainly reduces some deadweight loss for the region as a whole. It is always welfare enhancing.
5. Production Networks along Economic CorridorsA production network survives on the simple logic of demand and supply. One has to see what the constraints on the demand side are, which, fortunately, will relax if
Economic Corridors, Trade Costs, and Regional Production Networks in South Asia
73
one does an appropriate demand estimation analysis. This would suggest the optimal output mix in the region where the corridor is located. The radius of the market needs to be determined according to the commodity. The other side is the supply constraint, which needs to be assessed in terms of the availability of primary factors of production, appropriate infrastructure, and intermediate inputs. This is the standard argument.
The above standard argument does not address clearly the issue of comparative advantage of nations. As pointed out by Raychaudhuri (2008) and the IIT data cited earlier, trade between countries like India and Bangladesh is not based on their global comparative advantage, but on local demand. Unfortunately, this kind of trade usually does not promote production networks because (i) the trade pattern does not induce a supply chain through parts and components trade, and (ii) the traded items logically may not be sustained in the long run. The conditions (i) and (ii) may be termed as conditions for sustainable production networks along economic corridors. If the border trade is not consistent with the global comparative advantage of traded items of the two countries involved, a third country can always take it away. This has happened for some items where People’s Republic of China (PRC) has pushed India out of the picture.
An alternative viable model is the one followed in East Asia, where the concept of vertical production and supply chains is used to the fullest extent. This uses fragmentation, so that a number of industries grow up in production networks along economic corridors that specialize in parts and components production (Kuroda et al. 2007). Intermediate goods have a spatial linkage across countries in East Asia. As a result, over 1985–1995, the regional input ratio of intermediate goods in the eight East Asian countries increased by 38% (from 7% to 9.6%), while the overseas dependency ratio grew only by 21% (from 16.4% to 19.8%) (Kuroiwa 2005). This concept is not really a part of the policy dialogue in South Asia, and the result is that the idea of production networks does not satisfy the necessary conditions for their success.
In the case of readymade garments (RMG), the cross-border trade is only in raw materials. There is no trade in any intermediate products like parts and components. This could have been if the machines used to produce RMG were bought from India. But they are mainly from PRC and Italy, and it is most likely that there is a comparative advantage in this. Could there be some change in this pattern with India coming into the picture? This requires more research. One cannot rule out a future alignment of trade between South Asian countries according to their comparative advantage at a disaggregated level like HS 8 digit categories, which may satisfy both the conditions of sustainable production networks.
6. ConclusionThis chapter has made an effort to measure the potential gains of trade services liberalization in South Asia, a region with some of the fastest growing countries in the world, but poor in regional economic integration. Although political economy considerations may be important, high trade costs play a significant role in breeding inefficiency in the region. This ultimately erodes the competitive advantage of nations.
Developing Economic Corridors in South Asia
74
Economic integration in the region has been mainly limited to tariff reduction on commodities. Little attention is paid to the significant gain that can be made by reducing trade costs through eliminating some regulatory costs and time delays. We examined the case for liberalization of transportation services between India and Bangladesh. The commodity chosen was the RMG sector in Bangladesh, which buys yarn from India. Though transportation costs (in its broad sense of direct as well as regulatory costs) are not very significant in the cost of production, a liberalization of regulations between the countries would allow the free movement of vehicles across borders. This would reduce transport costs significantly, which may well tilt the comparative advantage toward Bangladesh, and create significant welfare gains for the region as well. If financial sector liberalization allows the most efficient providers to issue LCs and furnish insurance, this would be strengthened. A more general equilibrium analysis, integrating these partial results, would provide a better understanding of regional dynamics.
The study argues that trade between India and Bangladesh is not based on India’s global comparative advantage and that its sustainability is debatable. One may consider, among other things, the possibility of a production network along an economic corridor through India and Bangladesh, and this would bring the possibility of producing parts and components of capital goods to the fore. Such a scenario could emerge only if India supplies machinery to the RMG sector in Bangladesh. Unfortunately, though India has the technological capability, the machines are bought from PRC, Taipei,China and Italy because RMG producers in Bangladesh find they are better priced when weighted by quality. Given the nature of the commodity discussed, there is little scope for fragmentation of processes. A production network in terms of fragmentation can only be in terms of parts and components of textile machinery. Though one in terms of services could be possible, the traditional definition of a production network excludes this.
Finally, the gains from trade services liberalization, such as banking and insurance, and the creation of production networks along an economic corridor are not always like Siamese twins. One may gain from the other, but that may not always promote production networks. However, production networks always benefit from trade services liberalization. Since trade in South Asia is not always aligned to the global comparative advantage of nations in the region, the creation of production networks appears far more difficult than the liberalization of trade services. Future regional negotiations and roundtables should put more thought into exploiting the potential of this untapped area.

Economic Corridors, Trade Costs, and Regional Production Networks in South Asia
75
References
Anderson, James E. and Eric Van Wincoop. 2004. Trade Costs. Journal of Economic Literature. 42(3). pp. 691–751.
Das, Samantak and Sanjib Pohit. 2007. Quantifying Transport, Regulatory and Other Costs of India–Bangladesh Trade. Mimeo. New Delhi: National Council of Applied Economic Research.
De, P. 2008. Empirical Estimates of Trade Costs for Asia. In D. Brooks and J. Menon, eds. Infrastructure and Trade in Asia. Cheltenham: Edward Elgar.
De, P. 2009. Trade Transportation Costs in South Asia: An Empirical Investigation. In Douglas Brooks and David Hummels, eds. Infrastructure’s Role in Lowering Asia’s Trade Costs: Building for Trade. Cheltenham: Edward Elgar.
De, P. 2011. Why is Trade at Border a Costly Affair in South Asia? An Empirical Investigation. Contemporary South Asia. 19 (4). pp. 441–464.
De, P. and B. Bhattacharyay. 2007. Deepening India-Bangladesh Bilateral Economic Cooperation: Challenges and Opportunities. Discussion Paper 130. New Delhi: Research and Information System for the Developing Countries.
De, P and B. Ghosh. 2008. Reassessing Transaction Costs of Trade at the India-Bangladesh Border. Economic and Political Weekly. 43 (29). pp. 69–79.
De, P., S. Raihan and S. Kathuria. 2012. Unlocking Bangladesh – India Trade: Emerging Potential and the Way Forward. Policy Research Working Paper 6155. Washington, DC: World Bank.
Deardorff, A. V. 2001. International Provision of Trade Services, Trade and Fragmentation. Policy Research Working Paper No. 2548. Washington, DC: World Bank.
Dimaranan, Betina V. and Robert A. McDougal. 2002. Global Trade, Assistance, and Production: The GTAP 5 Data Base. Centre for Global Trade Analysis. Purdue University.
Greenaway, D., R. Hine and C. Milner. 1995. Vertical and Horizontal Intra-Industry Trade: A Cross Industry Analysis for the United Kingdom. Economic Journal. 105. pp. 1505–18.
Haider, M. Z. 2007. Competitiveness of the Bangladesh Readymade Garment Industry in Major International Markets. Asia-Pacific Trade and Investment Review. 3 (1). pp. 3–27.
Hummels, David. 2007. Transportation Costs and International Trade in the Second Era of Globalization. Journal of Economic Perspectives. 21 (3). pp. 131–54.
Kimura, Fuku and Izuru Kobayashi. 2009. Why Is the East Asia Industrial Corridor Needed?. ERIA Policy Brief No. 2009–01. Jakarta: Economic Research Institute for ASEAN and East Asia.

Developing Economic Corridors in South Asia
76
Kimura, Fuku and Ayako Obashi. 2007. International Production Networks in Machinery: Structure and Its Evolution. ERIA Discussion Paper 2010–09. Jakarta: Economic Research Institute for ASEAN and East Asia.
Knappe, Mathias. 2002. Inter-firm Strategic Alliances in the Textiles and Clothing Industry: Examples from Bangladesh and Sri Lanka. Geneva: International Trade Centre, WTO.
Kuroda, Haruhiko, Masahiro Kawai and Rita Nangia. 2007. Infrastructure and Regional Cooperation. ADBI Discussion Paper No. 76. Tokyo: Asian Development Bank Institute.
Kuroiwa, Ikuo. 2005. Formation of Inter-country Production Networks in East Asia: Application of International Input–Output Analysis. Paper presented at the 15th International Input–Output Conference. Beijing. 27 June–1 July.
Krugman, Paul, R. and Maurice Obstfeld. 2000. International Economics: Theory and Policy. Delhi: Addison Wesley Longman (Singapore)
Mikic, Mia., and John Gilbert. 2007. Trade Statistics in Policy making: A handbook of Commonly Used Trade Indices and Indicators. Bangkok: United Nations Economic and Social Commission for Asia and the Pacific.
Quasem, A. S. M. 2002. Adding Value: Building Value Addition Alliances. Geneva: International Trade Centre, World Trade Organization.
Raychaudhuri, Ajitava. 2010. Infrastructure and Development: Some Current Issues. Keynote Address to Bengal Economic Association. Artha Beekshan. 18 (4). pp. 28–55.
Raychaudhuri, Ajitava. 2008. India–Bangladesh Border Trade: Some Analytical Issues. In Gurudas Das and C. J. Thomas, eds. Indo Bangladesh Border Trade: Benefiting from Neighbourhood. New Delhi: Akansha. pp. 177–91.
Raychaudhuri, Ajitava and Prabir De. 2010. Trade, Infrastructure and Income Inequality in Selected Asian Countries: An Empirical Analysis. Working Paper Series. No. 82. ARTNeT, Bangkok: United Nations Economic and Social Commission for Asia and Pacific.
Subramanian, Uma and John Arnold. 2001. Forging Sub-Regional Links in Transportation and Logistics in South Asia. Washington, DC: World Bank.
Wiemer, Calla. 2009. Three Cases of Cross-Border Economic Corridor Development with Lessons from Greater Mekong Sub-Region. Manila: Asian Development Bank.

7777
Chapter 4
Economic Corridors in South Asia: Exploring the Benefits of Market Access and Trade Facilitation
Selim Raihan
1. IntroductionGiven its resources and strategic location, the region comprising the countries of the South Asia Subregional Economic Cooperation (SASEC) program—Bangladesh, Bhutan, India, and Nepal—has the potential to become an Asian powerhouse in terms of trade and investment (Dubey et al. 2000). Countries in South Asia have made impressive progress in developing their economies in the last two decades without much regional-level interaction. Some studies indicate South Asian countries could perhaps gain much higher growth if regional economic interaction grows (Srinivasan 2006). Others call for greater interaction among the SASEC countries for enhancement of trade and investment (Dubey et al. 2000, ADB 2008).
The prospects of cooperation between Bangladesh and India seem to be bright as their governments have shown the political will for it. A few areas of cooperation were agreed on during the last prime ministerial meeting between the two countries.1 Among them were better access to each other’s markets, and an improvement in physical connectivity. Cooperation in these areas can result in significant economic and social benefits.
Against this backdrop, the objective of this study is to analyze and document the potential impact better physical connectivity among the SASEC countries can have on trade and economic growth. Its broad objectives are to explore the macroeconomic, sectoral, and welfare impacts of (i) increased market access among the SASEC countries, involving a decline in tariffs and nontariff barriers (NTBs); and (ii) improved trade facilitation among the SASEC countries in general, and Bangladesh and India in particular. The findings of the study will help us better understand the market access aspect of regional trade flow, and the importance of trade facilitation in the economic corridors of the SASEC.
1 See the joint communiqué issued during Bangladesh Prime Minister Sheikh Hasina’s visit to India, 12 January 2010, in Bangladesh.

Developing Economic Corridors in South Asia
78
The research methodology involves the application of a partial equilibrium model and a computable general equilibrium (CGE) model. A partial equilibrium model like the World Integrated Trade Solution (WITS)/SMART model is applied to explore the effects of better market access on bilateral trade among the SASEC countries at the 6-digit HS level. A CGE model is used to address the welfare effects of regional integration in South Asia on the SASEC countries. Trade facilitation issues are forward in through a global general equilibrium model, such as the Global Trade Analysis Project (GTAP) model. This study includes a field survey on trade facilitation at the firm level in Bangladesh to understand its importance on subregional trade.
The organization of this chapter is as follows. Section 2 analyzes the pattern of intraregional trade in South Asia. Section 3 explores the potential of market access through free trade in goods under the South Asian Free Trade Area (SAFTA) agreement using the WITS/SMART partial equilibrium model. Section 4 highlights the importance of trade facilitation in the SASEC countries. Section 5 explores the welfare impact of regional integration in South Asia, and the role of trade facilitation in enhancing welfare gains. Section 6 summarizes the views of stakeholders in Bangladesh on trade between Bangladesh and other SASEC countries. Finally, Section 7 points out policy implications.
2. Intraregional Trade in South Asia South Asia has been characterized as a region of low intraregional trade. In 1990, intraregional trade was 2.91%, which increased to 5.3% in 2003.2 However, it came down to 4.84% in 2008. The intraregional trade intensity index was 3.03% in 1990, increasing to 6.21% in 2003, and falling to 2.53% in 20083 (De et al. 2012). The distribution of intraregional trade in South Asia is very imbalanced. Figure 4.1 indicates that India is the largest exporter in South Asia, accounting for 65% of intraregional exports, whereas Bangladesh’s exports to the region in 2008 were only 3% of the total regional exports. Bangladesh is the largest importer in South Asia, accounting for 26% of the total intraregional imports in 2008.
Figure 4.1: Country Shares in Intra-SAARC Imports and Exports in 2008
Share in Intra-SAARC Imports (%) Share in Intra-SAARC Exports (%)
Source: http://www.elibrary-data.imf.org/FindDataReports.aspx?d=330681e=170921. Direction of Trade Statistics (DOTS). International Monetary Fund.
2 Intraregional trade is measured as the percentage of intraregional trade to total trade of the region, calculated using exports data. A higher share indicates a higher degree of dependency on regional trade.
3 The intraregional trade intensity index is the ratio of the share of intraregional trade to the share of world trade with the region, calculated using exports data. An index of more than one indicates that trade flow within the region is larger than expected given the importance of the region in world trade.

Economic Corridors in South Asia: Exploring the Benefits of Market Access and Trade Facilitation
79
Except Nepal and Bhutan, the major export destinations of all other South Asian countries are outside the region. Regional exports constitute only 4.87% of the total exports from Bangladesh. The corresponding figure for India is 5.23%. India is the major export destination for Nepal (71%) and Bhutan (100%). Trade among the South Asian countries is unequally distributed. Bangladesh trades very little with Bhutan, Nepal, and Sri Lanka. India is the dominant import source for Bhutan and Nepal, and a major import source for Bangladesh. But trade with India is largely one-sided. The volume of imports from India to Bangladesh and Nepal is very large, while the volume of exports from these countries to India is very low (Table 4.1).
Table 4.1: Trade among South Asian Countries in 2007($ millions)
To
From
Bangla-desh
Bhutan India Maldives Nepal Pakistan Sri Lanka Total Exports to the Region
Export to the Region as a % of Country’s
Total Export
Bangla-desh
– 0.06 523.69 0.06 1.29 96.89 17.59 639.57 4.87
Bhutan 14.6 – 495.78 0.26 4.52 .. .. 515.16 98.8
India 2,063.79 70.84 – 79.71 1,237.1 1,584.29 2,594.19 7,629.92 5.23
Maldives .. .. 1.98 – .. .. 16.17 18.15 16.78
Nepal 60.84 2.52 562.81 0.05 – 1.11 2.09 629.41 71.04
Pakistan 279.25 0.03 291.70 4.01 0.81 – 208.57 784.37 4.4
Sri Lanka 22.74 0.14 515.83 50.89 0.18 55.4 – 645.19 8.42
Total importsfrom the region
2,441.22 73.59 2,391.79 134.98 1,243.90 1,737.69 2,838.61
Regional imports as % of country’s total import
13.85 13.55 1.09 12.31 33.13 5.33 24.93
Source: http://comtrade.un.org. International Merchandise Trade Statistics (IMTS): United Nations Statistics Division.
High tariff rates among the South Asian countries have long been pointed out as one of the major reasons for low intraregional trade. South Asia, as a region, has higher average tariff rates than in any other in the world. An important aspect of South Asian intraregional trade is that there is a huge volume of informal border trade. Some studies have pointed out that the informal and illegal trade between India and Bangladesh, India and Nepal, and India and Sri Lanka could equal a significant proportion of the recorded trade between them (Pohit and Taneja 2003, Taneja et al. 2004, Das and Pohit 2006, World Bank 2006).

Developing Economic Corridors in South Asia
80
3. Enhanced Market Access across Bangladesh, Bhutan, India and Nepal
3.1 The WITS/SMART Model Trade policy analysis is more robust when undertaken within a general equilibrium modeling framework. This can be seen as the first-best option as general equilibrium models not only measure the first-round effects of simulated changes, but also second-round ones, which include interindustry effects and macroeconomic adjustments. However, Nepal and Bhutan are not individually captured in the current version of the GTAP database. So, the partial equilibrium modeling framework lends itself as a second-best option for the analysis of the SASEC.
Milner et al. (2002) provide a simple analytical framework explaining the theory behind partial equilibrium modeling, and note that a general equilibrium model is desirable to adequately capture the interactions between sectors, and elasticities of substitution between factors. However, due to the scarcity of individual and regional CGE models for developing countries, partial equilibrium models would be alternative choices. Milner et al. also observe that the databases for general equilibrium models lack the commodity detail needed to consider specific sensitive and special products. Despite its shortcomings, a partial equilibrium framework is more suitable as it allows using widely available trade data at the appropriate level of detail to capture the principle of special and differential treatment in simulation analysis. Partial equilibrium models have the advantage of working at very fine levels of details, such as at the tariff line level.
For the purposes of this study, the WITS/SMART partial equilibrium model is applied. WITS brings together various databases ranging from bilateral trade and commodity trade flows to various levels and types of protection. It also integrates analytical tools that support simulation analysis. The SMART simulation model is one of the analytical tools in WITS. SMART contains built in analytical modules that support trade policy analysis, such as the effects of multilateral tariff cuts, preferential trade liberalization, and ad-hoc tariff changes. The underlying theory behind this analytical tool is the standard partial equilibrium framework that considers dynamic effects constant. Like any partial equilibrium model, it has strong assumptions allowing trade policy analysis to be undertaken one country at a time.
The underlying logic of the theory is clearly defined in Laird and Yeats (1986) and UNECA (2000). The derivation begins with a basic trade model composed of simplified import demand and export supply functions and an equilibrating identity.
A simplified import demand function for country j from country k of commodity i
Mijk
= f (Yj, P
ij, P
ik) (1)
The export supply function of commodity i of country k can be simplified as
Mijk
= f (Pikj
) (2)

Economic Corridors in South Asia: Exploring the Benefits of Market Access and Trade Facilitation
81
The equilibrium in the trade between the countries is the standard partial equilibrium equation
Mijk
= Xikj (3)
In a free-trade environment, the domestic price of the commodity i in country j from country k would change with the change in an ad valorem tariff as follows
Pijk
(1 + tikj
) (4)
To get the price equation, (4) is differentiated to obtain
dPijk
= Pijk
dtijk
+ (1+ tikj
)dPikj
(5)
Equations (4) and (5) are substituted into the elasticity of import demand function
∆ ∆M
M
P
Pijk
ijk
im ijk
ijk( )=
( )α (6)
Using (6), the change in imports can be obtained
dM
M
dt
t
dP
Pijk
ijkim ijk
ijk
ijk
ijk
=+
+
α
1 (7)
In a similar process, with the elasticity of export supply function, the change in exports can be obtained
dX
X
dP
Pijk
ijkix ikj
ijk
=
α (8)
3.2 Simulation and ResultsIn the WITS/SMART model, we simulate the South Asian Free Trade Area (SAFTA) scenario considering 2007 as the base year. In this, bilateral tariff rates for the SAFTA members are reduced to zero. It appears that with full implementation of SAFTA, some of the South Asian countries will be able to increase their exports within the region quite substantially (Table 4.2). India appears to be the largest gainer as its exports to the region increase by $858 million. For Pakistan, Bangladesh, and Nepal, the rise in exports is $169 million, $122 million, and $90 million, respectively. Sri Lanka’s exports to the region rise, but because of the India–Sri Lanka bilateral free trade agreement (FTA), its exports to India rise only marginally. It is rather obvious that for all countries, except the Maldives and Sri Lanka, the rise in their exports to India would constitute the major share of the rise in total exports to the region.
Since we are interested in looking at the impact of subregional cooperation in Bangladesh, Bhutan, India, and Nepal, we concentrate on them. In the following subsections, we identify the top products at 6-digit HS level that would experience a rise in exports from any of these four countries to the other three countries with full implementation of the SAFTA agreement. The WITS/SMART model also provides information on the sectoral increase in bilateral trade among the SASEC countries under such a scenario at the 6-digit HS classification.

Developing Economic Corridors in South Asia
82
Table 4.2: Increase in Exports and Imports among SAFTA Countries under Full SAFTA (Base Year 2007)
($ ’000)
To
From
Bangladesh Bhutan India Maldives Nepal Pakistan Sri Lanka Total Exports to the Region
Rise in Total Exports to the Region as a % of
the Rise in Exports to
India
Bangladesh 637.69 112,354.3 16.39 918.84 7,187.38 1,198.28 122,312.88 91.86
Bhutan – 21,693.89 – 113.13 84.88 0.01 21,891.91 99.10
India 308,829.02 62,326.78 21,173.76 124,825.11 231,657.51 109,515.26 858,327.44 –
Maldives – – 1,245.87 – 58.81 3,585.98 4,890.66 25.47
Nepal 22.08 247.99 89,542.48 2.67 699.28 30.63 90,545.13 98.89
Pakistan 37,194.78 – 126,458.46 318.64 640.96 4,667.98 169,280.82 74.70
Sri Lanka 4,301.66 0.81 2,946.48 16,549.71 973.74 7,040.32 31,812.72 9.26
Total imports 350,347.54 63,213.27 354,241.48 38,061.17 127,471.78 246,728.18 118,998.14
Source: WITS/SMART simulation. http://www.wits.worldbank.org/wits/WITS_analyticaltool.html. WITS Analytical Tool: SMART. Washington, D.C.: World Bank.
It should, however, be mentioned that one of the major barriers to free market access is the list of sensitive products that are excluded from tariff preferences in regional trade agreements. According to Baysan et al. (2006), there is a strong political economy in the selection of excluded sectors. When countries are allowed to choose sectors that can be excluded from tariff preferences in an FTA, domestic lobbies make sure that the sectors in which they may not withstand competition get excluded. Under SAFTA, the member countries maintain lists of such sensitive products. Bangladesh, India, and Nepal maintain different sensitive lists for least developed countries (LDCs) and non-LDCs. The number of products on the sensitive lists are in Table 4.3.
Table 4.3: Sensitive Lists among SAFTA Members in 2011
CountryTotal Number of Products at 6-Digit
HS level on the Sensitive ListCoverage of Sensitive List
as % of total HS Lines
For Non-LDCs For LDCs For Non-LDCs For LDCs
Bangladesh 1,254 1,249 24.00 23.90
Bhutan 157 157 3.00 3.00
India 865 744 16.60 14.20
Maldives 671 671 12.80 12.80
Nepal 1,335 1,299 25.60 24.90
Pakistan 1,191 1,191 22.80 22.80
Sri Lanka 1,079 1,079 20.70 20.70
Source: SASEC. 2004. Agreement on South Asian Free Trade Areas (SAFTA). Kathmandu. Nepal: SAARC Secretariat. http://saarc-sec.org/

Economic Corridors in South Asia: Exploring the Benefits of Market Access and Trade Facilitation
83
In the discussion on market access, the products that are on the sensitive lists of the export destination countries are identified to understand the role of sensitive lists in hampering free market access. In recent years, India has reduced the number of products on its sensitive list for LDCs from 744 to 480. Also, under the India–Sri Lanka FTA, the Pakistan–Sri Lanka FTA, the India–Bhutan FTA, and the India–Nepal trade agreement, the numbers of products on the sensitive lists are much lower than those under SAFTA.
3.2.1 Rise in Exports from Bangladesh to Bhutan, India and NepalBangladesh exports only 17 products to Bhutan at the 6-digit HS level, and their value is only $0.64 million (Table 4.4). Under SAFTA, Bangladesh’s exports to Bhutan would rise by 100%. Only 10 products would constitute 99% of this rise and none of them fall into the sensitive list of Bhutan.
Table 4.4: Exports of Top 10 Products from Bangladesh to Bhutan (Base Year 2007)
HS Tariff Line at 6-Digit Level
Exports Before($ ’000)
Exports After($ ’000)
Increase in Exports($ ’000)
% Rise inExports
392410 266.54 603.33 336.79 126.36
621141 241.76 484.28 242.53 100.32
190530 50.57 63.90 13.34 26.37
392590 9.56 21.46 11.91 124.61
621131 9.49 20.78 11.29 118.92
040299 13.56 18.71 5.15 38.00
850710 7.67 11.35 3.68 47.89
620199 3.99 7.51 3.52 88.12
340119 5.19 7.19 2.01 38.72
740819 11.30 12.92 1.62 14.35
Total for top 10 products exported to Bhutan
619.61 1,251.43 631.82 101.97
Total exports to Bhutan (17 products)
636.30 1,273.99 637.69 100.22
Share of top 10 products in total exports to Bhutan (%)
97.38 98.23 99.08
Source: WITS/SMART simulation. http://www.wits.worldbank.org/wits/WITS_analyticaltool.html. WITS Analytical Tool: SMART. Washington, D.C.: World Bank.
Bangladesh’s exports to Nepal in the base year were worth only $5.9 million, which would experience a 15% rise under SAFTA with no sensitive list (Table 4.5). The top 25 products would constitute more than 94% of the rise, but 15 of them fall into the sensitive list of Nepal, restricting much of the potential of the rise in exports.
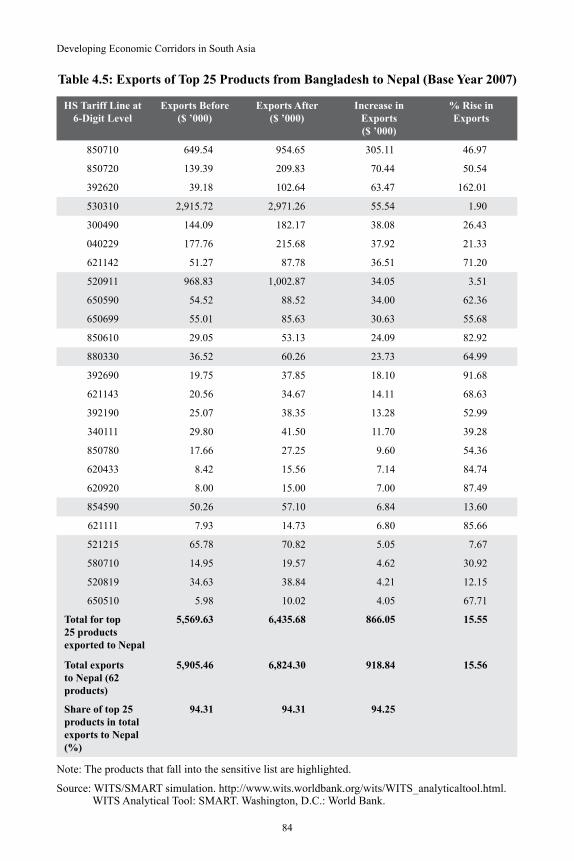
Developing Economic Corridors in South Asia
84
Table 4.5: Exports of Top 25 Products from Bangladesh to Nepal (Base Year 2007)
HS Tariff Line at 6-Digit Level
Exports Before($ ’000)
Exports After($ ’000)
Increase in Exports($ ’000)
% Rise inExports
850710 649.54 954.65 305.11 46.97
850720 139.39 209.83 70.44 50.54
392620 39.18 102.64 63.47 162.01
530310 2,915.72 2,971.26 55.54 1.90
300490 144.09 182.17 38.08 26.43
040229 177.76 215.68 37.92 21.33
621142 51.27 87.78 36.51 71.20
520911 968.83 1,002.87 34.05 3.51
650590 54.52 88.52 34.00 62.36
650699 55.01 85.63 30.63 55.68
850610 29.05 53.13 24.09 82.92
880330 36.52 60.26 23.73 64.99
392690 19.75 37.85 18.10 91.68
621143 20.56 34.67 14.11 68.63
392190 25.07 38.35 13.28 52.99
340111 29.80 41.50 11.70 39.28
850780 17.66 27.25 9.60 54.36
620433 8.42 15.56 7.14 84.74
620920 8.00 15.00 7.00 87.49
854590 50.26 57.10 6.84 13.60
621111 7.93 14.73 6.80 85.66
521215 65.78 70.82 5.05 7.67
580710 14.95 19.57 4.62 30.92
520819 34.63 38.84 4.21 12.15
650510 5.98 10.02 4.05 67.71
Total for top 25 products exported to Nepal
5,569.63 6,435.68 866.05 15.55
Total exports to Nepal (62 products)
5,905.46 6,824.30 918.84 15.56
Share of top 25 products in total exports to Nepal (%)
94.31 94.31 94.25
Note: The products that fall into the sensitive list are highlighted.
Source: WITS/SMART simulation. http://www.wits.worldbank.org/wits/WITS_analyticaltool.html. WITS Analytical Tool: SMART. Washington, D.C.: World Bank.
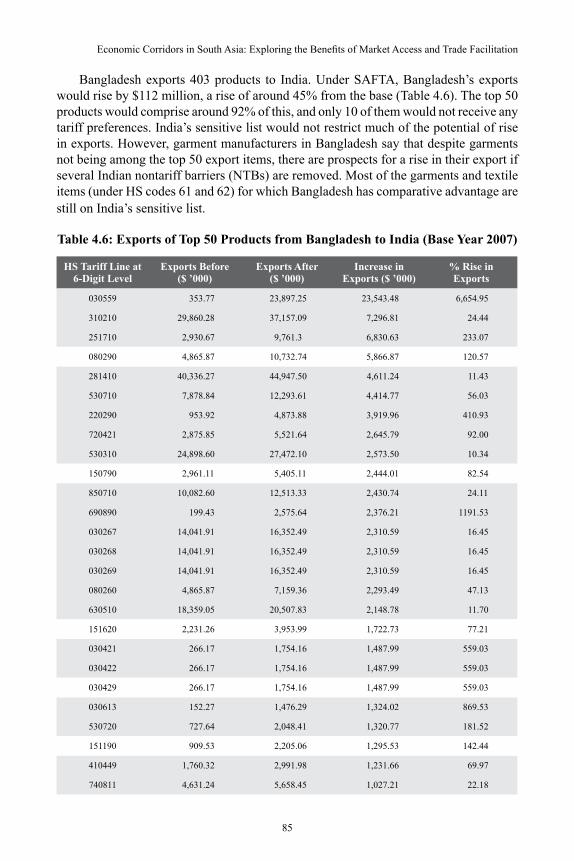
Economic Corridors in South Asia: Exploring the Benefits of Market Access and Trade Facilitation
85
Bangladesh exports 403 products to India. Under SAFTA, Bangladesh’s exports would rise by $112 million, a rise of around 45% from the base (Table 4.6). The top 50 products would comprise around 92% of this, and only 10 of them would not receive any tariff preferences. India’s sensitive list would not restrict much of the potential of rise in exports. However, garment manufacturers in Bangladesh say that despite garments not being among the top 50 export items, there are prospects for a rise in their export if several Indian nontariff barriers (NTBs) are removed. Most of the garments and textile items (under HS codes 61 and 62) for which Bangladesh has comparative advantage are still on India’s sensitive list.
Table 4.6: Exports of Top 50 Products from Bangladesh to India (Base Year 2007)
HS Tariff Line at 6-Digit Level
Exports Before ($ ’000)
Exports After($ ’000)
Increase in Exports ($ ’000)
% Rise inExports
030559 353.77 23,897.25 23,543.48 6,654.95
310210 29,860.28 37,157.09 7,296.81 24.44
251710 2,930.67 9,761.3 6,830.63 233.07
080290 4,865.87 10,732.74 5,866.87 120.57
281410 40,336.27 44,947.50 4,611.24 11.43
530710 7,878.84 12,293.61 4,414.77 56.03
220290 953.92 4,873.88 3,919.96 410.93
720421 2,875.85 5,521.64 2,645.79 92.00
530310 24,898.60 27,472.10 2,573.50 10.34
150790 2,961.11 5,405.11 2,444.01 82.54
850710 10,082.60 12,513.33 2,430.74 24.11
690890 199.43 2,575.64 2,376.21 1191.53
030267 14,041.91 16,352.49 2,310.59 16.45
030268 14,041.91 16,352.49 2,310.59 16.45
030269 14,041.91 16,352.49 2,310.59 16.45
080260 4,865.87 7,159.36 2,293.49 47.13
630510 18,359.05 20,507.83 2,148.78 11.70
151620 2,231.26 3,953.99 1,722.73 77.21
030421 266.17 1,754.16 1,487.99 559.03
030422 266.17 1,754.16 1,487.99 559.03
030429 266.17 1,754.16 1,487.99 559.03
030613 152.27 1,476.29 1,324.02 869.53
530720 727.64 2,048.41 1,320.77 181.52
151190 909.53 2,205.06 1,295.53 142.44
410449 1,760.32 2,991.98 1,231.66 69.97
740811 4,631.24 5,658.45 1,027.21 22.18

Developing Economic Corridors in South Asia
86
HS Tariff Line at 6-Digit Level
Exports Before ($ ’000)
Exports After($ ’000)
Increase in Exports ($ ’000)
% Rise inExports
740400 3,010.56 3,834.63 824.07 27.37
630492 900.29 1,604.89 704.60 78.26
721041 11.06 691.20 680.14 6149.58
050690 21.17 567.43 546.25 2580.20
340119 435.21 970.96 535.74 123.10
850720 1,343.54 1,877.02 533.48 39.71
410799 631.21 1,150.43 519.22 82.26
240120 43.52 537.20 493.68 1134.31
690810 39.57 532.39 492.81 1245.33
620462 17.08 449.95 432.87 2534.97
170390 58.31 485.39 427.09 732.48
340111 1,987.28 2,413.88 426.60 21.47
600622 41.14 450.07 408.92 993.96
620319 130.90 533.86 402.96 307.84
690790 282.16 672.03 389.87 138.17
700510 994.66 1,380.56 385.90 38.80
720221 1,068.09 1,418.74 350.66 32.83
631010 699.1 1,023.72 324.62 46.43
410719 443.8 754.62 310.82 70.03
721550 537.98 835.54 297.56 55.31
691110 74.46 362.74 288.28 387.19
853670 784.28 1,072.43 288.16 36.74
300691 784.28 1,070.35 286.08 36.48
392690 784.28 1,070.35 286.08 36.48
Total for top 50 products exported to India
219,882.52 323,232.90 103,350.38 47.00
Total exports to India (403 products)
250,932.56 363,286.71 112,354.15 44.77
Share of top 50 products in total exports to India (%)
87.63 88.97 91.99
Note: The products that fall into the sensitive list are highlighted.
Source: WITS/SMART simulation. http://www.wits.worldbank.org/wits/WITS_analyticaltool.html. WITS Analytical Tool: SMART. Washington, D.C.: World Bank.
3.2.2 Rise in Exports from Bhutan to India and NepalIn the World Integrated Trade Solution (WITS) database, there is no record of exports from Bhutan to Bangladesh in recent years. Therefore, this subsection analyzes the rise in exports from Bhutan to India and Nepal. Bhutan exports only 44 products to India worth $21.6 million, which would rise by around 25% under SAFTA (Table 4.7). Five of

Economic Corridors in South Asia: Exploring the Benefits of Market Access and Trade Facilitation
87
Bhutan’s top 10 exports would not receive tariff preference, which would restrict much of the potential of the rise in exports.
Table 4.7: Exports of Top 44 Products from Bhutan to India (Base Year 2007)
HS Tariff Line at 6-Digit Level
Exports Before($ ’000)
Exports After($ ’000)
Increase in Exports($ ’000)
% Rise inExports
720719 9,806.07 15,421.36 5,615.29 57.26
720229 10,650.41 15,511.73 4,861.32 45.64
284910 11,320.70 14,665.03 3,344.34 29.54
151190 1,679.97 3,061.99 1,382.02 82.26
540269 8,144.43 9,365.44 1,221.01 14.99
441029 3,315.69 4,311.14 995.45 30.02
151620 2,469.49 3,243.02 773.53 31.32
720221 1,291.30 2,034.14 742.84 57.53
720610 1,201.97 1,860.19 658.22 54.76
151590 859.26 1,362.68 503.43 58.59
370610 1731.80 2,142.30 410.50 23.70
220110 3,015.75 3,309.35 293.60 9.74
220210 1,045.49 1,219.60 174.11 16.65
441032 514.30 678.37 164.06 31.90
440810 691.42 839.62 148.21 21.43
110100 146.64 230.59 83.96 57.26
250510 206.69 272.60 65.91 31.89
200990 118.41 177.68 59.27 50.05
252100 114.96 160.49 45.52 39.60
252329 148.14 190.75 42.61 28.76
070190 419.66 453.77 34.11 8.13
481149 75.93 104.35 28.41 37.42
481029 130.68 156.30 25.63 19.61
480269 153.96 176.43 22.48 14.60
090830 30.36 52.50 22.14 72.94
480220 142.12 162.66 20.54 14.45
481099 78.47 94.05 15.58 19.85
440399 169.39 182.32 12.94 7.64
440200 151.50 162.06 10.56 6.97
391721 50.06 57.75 7.70 15.37

Developing Economic Corridors in South Asia
88
HS Tariff Line at 6-Digit Level
Exports Before($ ’000)
Exports After($ ’000)
Increase in Exports($ ’000)
% Rise inExports
252210 16.54 23.34 6.80 41.12
440349 59.90 64.47 4.57 7.63
441223 20.77 25.06 4.29 20.64
230990 10.20 14.36 4.15 40.70
200899 5.34 8.58 3.23 60.52
482390 6.41 8.84 2.43 37.82
441219 10.57 12.97 2.39 22.64
200929 6.86 9.11 2.25 32.86
441213 9.91 12.15 2.24 22.60
391729 3.47 4.06 0.59 16.84
441139 2.50 2.99 0.49 19.76
940330 9.40 9.40 0 –0.02
940350 17.96 17.95 –0.02 –0.08
740811 28,028.44 27,903.66 –124.78 –0.45
Total for top 44 products exported to India
88,083.29 109,777.18 21,693.89 24.63
Total exports to India (44 products)
88,083.29 109,777.18 21,693.89 24.63
Share of top 44 products in total exports to India (%)
100.00 100.00 100.00
Note: The products that fall into the sensitive list are highlighted.
Source: WITS/SMART simulation. http://www.wits.worldbank.org/wits/WITS_analyticaltool.html. WITS Analytical Tool: SMART. Washington, D.C.: World Bank.
Bhutan exports only eight categories of products to Nepal worth $0.1 million (Table 4.8). Under SAFTA, its exports would rise by around 20%, and the most exported product would fall into Nepal’s sensitive list.
3.2.3 Rise in Exports from India to Bangladesh, Bhutan and NepalIndia’s export products are much more diversified. It exports 2,841 products at the 6-digit HS level to Bangladesh. A list of the top 50 products is in Table 4.9 and they constitute more than 67% of the rise in exports to Bangladesh. India’s exports to Bangladesh would rise by $309 million, a rise of 25% from the base. Of the top 50 export products from India, 34 Bangladesh’s sensitive list and the top 10 would receive no tariff preferences.

Economic Corridors in South Asia: Exploring the Benefits of Market Access and Trade Facilitation
89
Table 4.8: Exports of Top Eight Products from Bhutan to Nepal (Base Year 2007)
HS Tariff Line at 6-Digit Level
Exports Before($ ’000)
Exports After($ ’000)
Increase In Exports($ ’000)
% Rise inExports
620791 85.42 143.80 58.38 68.35
270400 420.55 460.60 40.05 9.52
852110 16.37 22.59 6.22 38.01
441890 7.26 10.11 2.84 39.12
920790 10.22 12.70 2.48 24.28
900691 20.11 22.52 2.40 11.94
252010 7.69 8.25 0.56 7.34
920910 0.84 1.03 0.19 22.26
Total for top 8 products exported to Nepal
568.46 681.59 113.13 19.90
Total exports to Nepal (8 products)
568.46 681.59 113.13 19.90
Share of top 8 products in total exports to Nepal (%)
100.00 100.00 100.00
Note: The products that fall into the sensitive list are highlighted.
Source: WITS/SMART simulation. http://www.wits.worldbank.org/wits/WITS_analyticaltool.html. WITS Analytical Tool: SMART. Washington, D.C.: World Bank.
India exports 832 products to Bhutan and their value would rise by $62 million. The top 25 products would comprise 74% of the rise (Table 4.10). Bhutan’s sensitive list is more liberal, and only three of the top 25 products would fall into it.
India exports 3,429 products to Nepal. Under SAFTA, its exports to Nepal would rise by $125 million, or around 19% from the base (Table 4.11). The top 50 products would constitute more than 55% of the rise, but 41 of them would fall into Nepal’s sensitive list.
3.2.4 Rise in Exports from Nepal to Bangladesh, Bhutan and IndiaNepal exports 48 products to Bangladesh valued at just $26,000 (Table 4.12). Under SAFTA, this would rise by 84%. The top 10 products constitute 99% of the rise, and nine of them would fall into Bangladesh’s sensitive list.
Under SAFTA, Nepal’s exports to Bhutan would rise by $221,000, a 45% rise from the base (Table 4.13). Nepal exports only 29 products to Bhutan, and the top 10 would comprise 89% of the rise. None of these fall into the sensitive list of Bhutan.

Developing Economic Corridors in South Asia
90
Table 4.9: Exports of Top 50 Products from India to Bangladesh (Base Year 2007)
HS Tariff Line at 6-Digit Level
Exports Before($ ’000)
Exports After($ ’000)
Increase in Exports ($ ’000)
% Rise inExports
350691 1,456.22 55,290.40 53,834.17 3696.84
271011 46,977.98 77,911.62 30,933.64 65.85
520942 38,256.43 52,980.93 14,724.50 38.49
100190 70,084.59 78,002.02 7,917.42 11.30
870422 15,897.21 21,693.42 5,796.22 36.46
520521 45,834.72 51,500.65 5,665.94 12.36
871120 17,718.65 23,314.76 5,596.11 31.58
481092 6,711.73 11,533.79 4,822.06 71.85
070310 26,002.52 30,686.29 4,683.77 18.01
401120 18,942.37 23,358.34 4,415.97 23.31
730840 1,978.88 5,811.05 3,832.17 193.65
730610 7,245.37 10,812.42 3,567.05 49.23
870210 7,720.14 11,185.85 3,465.71 44.89
852812 6,474.04 9,904.33 3,430.29 52.99
760110 36,495.95 39,898.65 3,402.71 9.32
520511 19,518.32 22,503.41 2,985.09 15.29
720839 23,049.35 25,970.84 2,921.50 12.67
480257 8,174.07 10,743.93 2,569.86 31.44
271019 3,606.08 5,969.10 2,363.02 65.53
520939 2,982.62 5,324.36 2,341.75 78.51
854460 4,371.71 6,455.88 2,084.17 47.67
090420 14,890.08 16,892.15 2,002.07 13.45
620443 2,773.26 4,537.14 1,763.87 63.60
040210 3,487.71 5,141.98 1,654.27 47.43
100630 60,462.81 62,108.57 1,645.77 2.72
521213 3,937.58 5,525.87 1,588.30 40.34
850432 5,420.58 6912.10 1,491.52 27.52
841581 801.06 2,291.65 1,490.59 186.08
390210 14,564.88 16,008.45 1,443.57 9.91
320416 15,909.78 17,329.21 1,419.44 8.92
870390 7,165.52 8,512.22 1,346.70 18.79

Economic Corridors in South Asia: Exploring the Benefits of Market Access and Trade Facilitation
91
HS Tariff Line at 6-Digit Level
Exports Before($ ’000)
Exports After($ ’000)
Increase in Exports ($ ’000)
% Rise inExports
261800 7,518.73 8,793.10 1,274.37 16.95
380810 3,898.01 5,137.42 1,239.41 31.80
521214 1,548.06 2,782.25 1,234.19 79.73
852813 3,680.38 4,893.38 1,213.00 32.96
720719 6,216.13 7,414.22 1,198.09 19.27
071340 14,625.60 15,780.02 1,154.42 7.89
210690 3,629.03 4,780.16 1,151.13 31.72
760720 2,420.10 3,533.20 1,113.10 45.99
251810 465.25 1,553.42 1,088.17 233.89
551513 370.25 1,401.12 1,030.88 278.43
550931 4,282.32 5,308.25 1,025.93 23.96
481910 410.39 1,434.93 1,024.55 249.66
070960 450.63 1,442.06 991.43 220.01
151319 3121.80 4,060.19 938.39 30.06
730519 214.45 1,145.30 930.86 434.07
721710 2,321.55 3,244.46 922.91 39.75
841989 1,885.83 2,801.16 915.33 48.54
190110 2,042.32 2,916.47 874.15 42.80
291521 482.35 1,312.95 830.60 172.20
Total for top 50 products exported to Bangladesh
598,495.34 805,845.43 207,350.09 34.65
Total exports to Bangladesh (2,841 products)
1,248,754.13 1,557,583.16 308,829.02 24.73
Share of top 50 products in total exports to Bangladesh (%)
47.93 51.74 67.14
Note: The products that fall into the sensitive list are highlighted.Source: WITS/SMART simulation. http://www.wits.worldbank.org/wits/WITS_analyticaltool.html.
WITS Analytical Tool: SMART. Washington, D.C.: World Bank.
Nepal exports 532 products to India. Under SAFTA, their value would rise by $89.5 million, a 29.5% rise from the base (Table 4.14). The top 25 products would constitute around 72% of the rise and none of them fall into the sensitive list.

Developing Economic Corridors in South Asia
92
Table 4.10: Exports of Top 25 Products from India to Bhutan (Base Year 2007)
HS Tariff Line at 6-Digit Level
Exports Before($ ’000)
Exports After($ ’000)
Increase in Exports ($ ’000)
% Rise inExports
721041 1,686.23 11,865.30 10,179.08 603.66
870422 6,462.88 11,916.30 5,453.42 84.38
252210 507.38 4,097.74 3,590.36 707.62
271000 13,059.38 16,423.78 3,364.40 25.76
730300 1,473.05 3,958.56 2,485.51 168.73
230230 795.09 2,889.61 2,094.52 263.43
100620 8,459.03 10,535.26 2,076.23 24.54
110100 447.48 2,372.47 1,924.99 430.19
870600 1,735.51 3,387.44 1,651.93 95.18
030559 428.59 1,821.12 1,392.53 324.91
261900 129.02 1,504.31 1,375.30 1065.98
870332 343.29 1,509.08 1,165.79 339.59
100590 348.07 1,478.18 1,130.11 324.68
010290 304.27 1,352.58 1,048.31 344.53
151590 1,522.71 2,395.06 872.35 57.29
100110 3,184.04 4,021.38 837.34 26.30
440200 1,883.82 2,641.83 758.01 40.24
340119 620.61 1,353.94 733.33 118.16
730890 3,545.66 4,219.13 673.47 18.99
841229 2,422.47 3,028.12 605.65 25.00
220300 2,424.32 3,022.00 597.68 24.65
731300 240.48 786.68 546.20 227.13
070990 1,541.57 2,010.62 469.05 30.43
220710 369.01 837.43 468.42 126.94
480411 588.64 1,036.92 448.28 76.16
Total for top 20 products exported to Bhutan
54,522.60 100,464.84 45,942.26 84.26
Total exports to Bhutan (832 products)
135,465.01 197,791.80 62,326.79 46.01
Share of top 25 products in total exports to Bhutan (%)
40.25 50.79 73.71
Note: The products that fall into the sensitive list are highlighted.Source: WITS/SMART simulation. http://www.wits.worldbank.org/wits/WITS_analyticaltool.html.
WITS Analytical Tool: SMART. Washington, D.C.: World Bank.

Economic Corridors in South Asia: Exploring the Benefits of Market Access and Trade Facilitation
93
Table 4.11: Exports of Top 50 Products from India to Nepal (Base Year 2007)HS Tariff Line at
6-Digit LevelExports Before
($ ’000)Exports After
($ ’000)Increase in
Exports ($ ’000)% Rise inExports
600320 26,110.93 32,810.48 6,699.55 25.66
871120 15,113.52 20,414.04 5,300.52 35.07
870210 3,940.83 8,717.95 4,777.12 121.22
090300 292.07 4,257.70 3,965.64 1357.79
271119 20,866.77 24,343.49 3,476.72 16.66
300390 32,782.47 36,199.26 3,416.79 10.42
870600 10,160.27 13,227.50 3,067.22 30.19
800700 840.50 3,582.37 2,741.87 326.22
392310 6,396.77 8,883.55 2,486.79 38.88
720890 21,649.36 23,230.63 1,581.28 7.30
870323 1,818.14 3,378.00 1,559.86 85.79
621142 6,104.03 7,512.85 1,408.82 23.08
551449 1,766.40 3,068.73 1,302.33 73.73
350691 1,206.27 2,505.70 1,299.43 107.72
271129 785.18 2,061.35 1,276.16 162.53
730890 8,413.19 9,663.72 1,250.53 14.86
100590 2,411.62 3,591.95 1,180.33 48.94
120510 7,549.34 8,691.80 1,142.46 15.13
521215 15,599.10 16,520.11 921.02 5.90
040229 3,878.98 4,796.04 917.05 23.64
870321 3,818.06 4,733.25 915.19 23.97
240110 6,565.97 7,406.69 840.72 12.80
870421 1,654.25 2,481.82 827.58 50.03
690890 1,970.61 2,794.75 824.14 41.82
230400 11,693.51 12,509.92 816.40 6.98
251810 147.62 950.00 802.38 543.53
480240 192.64 978.50 785.86 407.93
720918 6,491.08 7,206.73 715.65 11.03
210690 2,111.38 2,810.60 699.22 33.12
251520 29.23 721.32 692.09 2367.75
320890 512.96 1,183.44 670.48 130.71
870322 2,082.01 2,729.38 647.38 31.09
392620 1,298.14 1,944.55 646.42 49.80
110100 377.50 1,017.98 640.48 169.67

Developing Economic Corridors in South Asia
94
HS Tariff Line at 6-Digit Level
Exports Before($ ’000)
Exports After($ ’000)
Increase in Exports ($ ’000)
% Rise inExports
700529 2,712.14 3,321.23 609.10 22.46
071350 201.00 798.58 597.59 297.31
870110 5,751.10 6,343.14 592.04 10.29
870332 84.66 642.11 557.45 658.49
870490 3,582.63 4,133.77 551.14 15.38
850680 2,271.04 2,818.92 547.88 24.12
621143 2,824.21 3,371.08 546.87 19.36
100630 8,853.45 9,375.94 522.49 5.90
720719 9,876.64 10,394.22 517.58 5.24
080132 160.98 677.59 516.61 320.91
690810 680.32 1,195.63 515.31 75.74
70310 3,267.25 3,775.68 508.43 15.56
721399 5,993.15 6,491.22 498.07 8.31
300320 681.62 1,178.36 496.74 72.88
121291 348.36 839.23 490.88 140.91
481910 1,274.39 1,755.42 481.04 37.75
Total for top 50 products exported to Nepal
275,193.63 344,038.28 68,844.65 25.02
Total exports to Nepal (3,429 products)
667,906.63 792,731.69 124,825.07 18.69
Share of top 50 products in total exports to Nepal (%)
41.20 43.40 55.15
Note: The products that fall into the sensitive list are highlighted.Source: WITS/SMART simulation. http://www.wits.worldbank.org/wits/WITS_analyticaltool.html.
WITS Analytical Tool: SMART. Washington, D.C.: World Bank.
Table 4.12: Exports of Top 10 Products from Nepal to Bangladesh (Base Year 2007)
HS Tariff Line at 6-Digit Level
Exports Before($ ’000)
Exports After($ ’000)
Increase in Exports ($ ’000)
% Rise inExports
870322 17.55 30.50 12.96 73.86
940490 4.42 10.64 6.22 140.93
870333 2.03 3.48 1.44 71.03
611710 0.36 0.75 0.39 109.78
848180 0.47 0.75 0.28 58.94
851790 0.50 0.75 0.25 49.40
940360 0.10 0.26 0.15 148.54

Economic Corridors in South Asia: Exploring the Benefits of Market Access and Trade Facilitation
95
HS Tariff Line at 6-Digit Level
Exports Before($ ’000)
Exports After($ ’000)
Increase in Exports ($ ’000)
% Rise inExports
481910 0.19 0.30 0.11 57.75
481019 0.14 0.21 0.08 57.78
482090 0.10 0.16 0.06 56.86
Total for top 10 products exported to Bangladesh
25.85 47.79 21.94 84.87
Total exports to Bangladesh (48 products)
26.28 48.36 22.08 84.01
Share of top 10 products in total exports to Bangladesh (%)
98.35 98.82 99.37
Note: The products that fall into the sensitive list are highlighted.Source: WITS/SMART simulation. http://www.wits.worldbank.org/wits/WITS_analyticaltool.html.
WITS Analytical Tool: SMART. Washington, D.C.: World Bank.
Table 4.13: Exports of Top 10 Products from Nepal to Bhutan (Base Year 2007)
HS Tariff Line at 6-Digit Level
Exports Before($ ’000)
Exports After($ ’000)
Increase in Exports ($ ’000)
% Rise inExports
940430 18.26 59.10 40.84 223.65
190211 187.52 223.63 36.11 19.25
620199 39.09 73.49 34.40 88.01
730300 79.22 105.62 26.41 33.33
630621 36.08 52.63 16.56 45.89
340119 60.51 76.03 15.52 25.64
630629 42.23 56.59 14.36 34.02
621131 11.99 26.23 14.24 118.77
621141 11.63 23.43 11.80 101.50
640299 11.31 22.33 11.02 97.42
Total for top 10 products exported to Bhutan
497.83 719.07 221.25 44.44
Total exports to Bhutan (29 products)
548.23 796.22 247.99 45.23
Share of top 10 products in total exports to Bhutan (%)
90.81 90.31 89.22
Note: The products that fall into the sensitive list are highlighted.Source: WITS/SMART simulation. http://www.wits.worldbank.org/wits/WITS_analyticaltool.html.
WITS Analytical Tool: SMART. Washington, D.C.: World Bank.

Developing Economic Corridors in South Asia
96
Table 4.14: Exports of Top 25 Products from Nepal to India (Base Year 2007)
HS Tariff Line at 6-Digit Level
Exports Before($ ’000)
Exports After($ ’000)
Increase in Exports ($ ’000)
% Rise inExports
090830 9,096.19 14,347.73 5,251.55 57.73
220290 16,519.10 21,755.05 5,235.95 31.70
721041 11,924.80 15,901.40 3,976.60 33.35
090240 2,884.44 6,407.66 3,523.22 122.15
392321 8,894.20 12,376.72 3,482.52 39.15
390690 8,641.92 12,084.40 3,442.48 39.83
721049 6,008.42 9,377.08 3,368.66 56.07
550921 17,059.54 20,420.90 3,361.36 19.70
291732 10,844.46 13,768.58 2,924.11 26.96
230990 7,427.25 10,251.54 2,824.29 38.03
730610 19,387.51 22,184.86 2,797.35 14.43
600129 5,320.47 8,035.54 2,715.08 51.03
381220 4,980.98 7,439.91 2,458.94 49.37
721790 4,408.28 6,750.50 2,342.22 53.13
090230 2,886.69 5,114.08 2,227.39 77.16
760410 12,505.81 14,642.27 2,136.46 17.08
071340 8,143.79 10,194.44 2,050.65 25.18
380610 4,984.10 6,809.26 1,825.16 36.62
091010 3,855.36 5,537.33 1,681.98 43.63
392350 2,559.46 3,738.64 1,179.18 46.07
210690 716.99 1,858.18 1,141.20 159.17
441032 3,688.73 4,824.98 1,136.25 30.80
391721 7,376.78 8,473.48 1,096.69 14.87
190219 3,383.56 4,416.56 1,033.00 30.53
392329 2,108.32 3,078.40 970.08 46.01
Total for top 25 products exported to India
185,607.15 249,789.49 64,182.37 34.58
Total exports to India (532 products)
303,275.03 392,817.51 89,542.48 29.53
Share of top 25 products in total exports to India (%)
61.20 63.59 71.68
Note: The products that fall into the sensitive list are highlighted.Source: WITS/SMART simulation. http://www.wits.worldbank.org/wits/WITS_analyticaltool.html.
WITS Analytical Tool: SMART. Washington, D.C.: World Bank.

Economic Corridors in South Asia: Exploring the Benefits of Market Access and Trade Facilitation
97
4. Trade Facilitation in Countries within South Asia Subregional Economic Cooperation
The costs of trading across borders in South Asia, especially among the South Asia Subregional Economic Cooperation (SASEC) countries, are high. Trade facilitation is thus very important to enhancing trade flows among these countries, especially with the prospect for gain through tariff reductions decreasing. However, there is significant scope for gains through reducing transaction costs and enabling faster transportation.
Limão and Venables (2001) find a link between the quality of infrastructure and transport costs, and conclude that infrastructure investments are important for export-led economic growth. However, Subramanian and Arnold (2001) argue that differences in logistics performance are driven only in part by the poor quality of physical infrastructure services such as road, rail, waterways, port services, and interfaces. The inadequacies are often caused by (nontariff) policy and institutional constraints—such as red tape, inadequate enforcement of contracts, poor definition and enforcement of rules of engagement, asymmetry in standards, delays in customs, delays at ports and border crossings, pilferage in transit, corruption, and highly restrictive protocols on movement of cargo. Ahmed and Ghani (2010) suggest that a key challenge facing South Asia is high trade cost. Improved infrastructure and growth through improved connectivity, stronger institutions, less conflict, and corruption, would allow the region to share its benefits widely.
De, Raihan and Kathuria (2012) show that improved trade facilitation and regional transit would help increase trade between India and Bangladesh. There is strong evidence to show that improving the efficiency of customs and administrative procedures, and simplifying trade-related documentation can facilitate trade between the two countries. The augmented gravity model shows that a 10% reduction in trade-related documentation could result in a 7.31% increase in bilateral trade, and a 10% reduction in the inefficiency of border control agencies, including customs, might lead to a 3.91% increase in trade. The strongest impact on bilateral trade would come from regional transit. In all, a 1% improvement in trade facilitation would increase Bangladesh’s exports by 4%.
Despite improvements, trade facilitation indicators in South Asia are much poorer than those in other regions of the world. According to the Logistics Performance Index (LPI), South Asia is just ahead of sub-Saharan Africa and well behind all other regions (Table 4.15). In terms of all subindicators of Logistics Performance Index (LPI), South Asia is very much behind East Asia and the Pacific.
According to the Doing Business reports published by the World Bank annually, there has been substantial progress in streamlining trade procedures in some South Asian countries over the last few years. However, this has not been equal across the region. There have been marked reductions in import documentation and the time required to process imports in Bangladesh and India. They have also achieved small but significant improvements in export trade facilitation. Trade costs in both countries fell for both exports and imports though the cost reductions were much

Developing Economic Corridors in South Asia
98
larger for imports. However, Nepal has showed very little change, and there was an increase in the documentation required for exports.
Despite improvement, the trade facilitation parameters in Bangladesh are poorer than in India (Table 4.16). According to the LPI 2010, Bangladesh was behind India, but ahead of other South Asian countries. Nepal’s performance was the worst. According to the Enabling Trade Index 2010 of the World Economic Forum, Bangladesh and Nepal were the worst performing countries in South Asia (Table 4.17).
Table 4.15: Logistics Performance Index: South Asia versus Other Regions in 2010
InternationalLPI Rank
Region LPI Customs Infras-tructure
Interna-tional
Shipments
LogisticsCompe-
tence
Trackingand
Tracing
Timeliness
1 Europe and Central Asia
2.74 2.35 2.41 2.92 2.60 2.75 3.33
2 Latin America and Caribbean
2.74 2.38 2.46 2.70 2.62 2.84 3.41
3 East Asia and Pacific
2.73 2.41 2.46 2.79 2.58 2.74 3.33
4 Middle East and North Africa
2.61 2.33 2.36 2.65 2.53 2.46 3.22
5 South Asia 2.49 2.22 2.13 2.61 2.33 2.53 3.04
6 sub-Saharan Africa
2.42 2.18 2.05 2.51 2.28 2.49 2.94
Note: LPI = Logistics Performance IndexSource: World Bank. 2010. Logistics Performance Index 2010. Trade Logistics and Facilitation.
Washington, DC: World Bank. http://www.worldbank.org/INTLF/Resources/LPI2010_for_web.pdf
Table 4.16: Logistics Performance Index: South Asian Countries in 2010
InternationalLPI Rank
Country OverallLPI
Customs Infrastructure Interna-tional
Shipments
Logistics Compe-
tence
Tracking and
Tracing
Timeliness
47 India 3.12 2.7 2.91 3.13 3.16 3.14 3.61
79 Bangladesh 2.74 2.33 2.49 2.99 2.44 2.64 3.46
110 Pakistan 2.53 2.05 2.08 2.91 2.28 2.64 3.08
137 Sri Lanka 2.29 1.96 1.88 2.48 2.09 2.23 2.98
143 Afghanistan 2.24 2.22 1.87 2.24 2.09 2.37 2.61
147 Nepal 2.2 2.07 1.8 2.21 2.07 2.26 2.74
Note: LPI = Logistics Performance Index; ranking is among 155 countries.Source: World Bank. 2010. Logistics Performance Index 2010. Trade Logistics and Facilitation.
Washington, DC: World Bank. http://www.worldbank.org/INTLF/Resources/LPI2010_for_web.pdf

Economic Corridors in South Asia: Exploring the Benefits of Market Access and Trade Facilitation
99
Table 4.17: Enabling Trade Index in 2010
Enabling Trade Index
Ranking
Countries OverallIndex
Sub Indices
MarketAccess
BorderAdministration
Transport andCommunications
Infrastructure
BusinessEnvironment
Rank Score Rank Score Rank Score Rank Score
84 India 3.81 115 3.42 68 3.98 81 3.34 58 4.48
99 Sri Lanka 3.59 107 3.68 79 3.71 86 3.27 100 3.68
112 Pakistan 3.39 120 3.24 73 3.85 92 3.14 117 3.31
113 Bangladesh 3.38 52 4.37 100 3.21 117 2.53 114 3.41
118 Nepal 3.27 49 4.42 118 2.71 107 2.76 121 3.19
Note: Ranking is among 125 countries.
Source: WEF. 2010. The Global Enabling Trade Report 2010. Geneva, Switzerland: World Economic Forum.
5. Welfare Impact of Regional Integration in South Asia and Role of Trade Facilitation
5.1 Review of StudiesBaysan et al. (2006) argue that the economic case for SAFTA is relatively weak. They point out that the economies in South Asia are relatively small in terms of the gross domestic product (GDP) and trade flows. Though the regions population is substantial (one-fifth of the world), current per capita incomes are so low that the economic size of the region is less than one twentieth of the world in terms of GDP. This proportion drops to 0.4% (if India is taken out of the picture). They further argue that the probability of the most efficient suppliers of the member countries being within the region is slim. Therefore, SAFTA is likely to be trade diverting. Another reason is the relatively high levels of protection in SAARC economies. If a country participating in a regional arrangement is open, it will not suffer from trade diversion even if it is tiny. There are also problems with the selection of excluded sectors and stringent rules of origin.
Empirical studies on quantitative assessments of South Asian Free Trade Area (SAFTA) and the SAARC Preferential Trading Arrangement, (SAPTA) differ significantly in terms of the methodologies employed. Three major types of methodologies have been used—gravity models, partial equilibrium models, and general equilibrium models.
The gravity models try to explain bilateral trade flows with a set of explanatory variables that try to predict the effect of the arrangement on bilateral trade flows.4 4 Typically, the exercise involves estimating a bilateral trade-flow equation with bilateral trade
(imports, exports, or total trade at the aggregate or sector level) as the dependent variable, and country characteristics such as GDP, population, land area, distance, common language, cultural ties, and the existence of preferential trade arrangements as independent variables. Once estimated, the equation can be used to predict the effect of a union between country pairs that did not have such a union during the sample period.
Developing Economic Corridors in South Asia
100
They have been widely used in analyzing regional trade agreements (RTAs) to predict their effect on bilateral trade flows. Studies that employ the gravity model include Srinivasan and Canonero (1995), Sengupta and Banik (1997), Hassan (2001), Coulibaly (2004), Hirantha (2004), Tumbarello (2006), Rahman (2003), Rahman et al. (2006), and Rodriguez-Delgado (2007). The findings of these studies have been mixed. For example, Srinivasan and Canonero (1995) and Sengupta and Banik (1997) predict that the impact of a South Asian free trade agreement (FTA) on trade flows would be small for India, but much larger for smaller countries. They predict a 30% increase in official intra-South Asian Association of Regional Cooperation (SAARC) trade, which could be 60% informal trade became a part of official trade. Coulibaly (2004) finds net export creation, and Tumbarello (2006) and Hirantha (2004) find net trade creation from SAPTA. On the other hand, Hassan (2001) finds SAPTA has a net trade diversion effect, while Rahman (2003) finds the dummy variable for South Asia to be insignificant, indicating that regional integration is unlikely to generate significant trade expansion.
Rahman et al. (2006) use an augmented gravity model to identify trade creation and trade diversion effects originating from SAPTA. It is found that there is significant intrabloc export creation, but also evidence of net export diversion. It also appears that Bangladesh, India, and Pakistan are expected to gain from joining the RTA, while Nepal, the Maldives, and Sri Lanka will be negatively affected. Rodríguez-Delgado (2007) evaluates SAFTA within the global structure of overlapping RTAs using a modified gravity equation and examines the effects of the trade liberalization program, which started in 2006. The study predicts that SAFTA will have a minor effect on regional trade flows. The gravity model simulation suggests that the program will influence regional trade flows mainly by increasing India’s exports and imports from Bangladesh and Nepal.
It should, however, be pointed out that studies based on the gravity model to estimate welfare gains from RTAs are methodologically flawed. First, the left hand side of the gravity equation is bilateral trade, not welfare. But, the concepts of trade creation and trade diversion directly relate to the welfare of the country in question. Gravity models cannot estimate the welfare effects of any RTA, and are therefore not capable of estimating their trade creation and trade diversion effects.
The major partial equilibrium studies on RTAs in South Asia are by Govindan (1994), DeRosa and Govindan (1995), Pursell (2004), and the World Bank (2006). The advantage of these models is that they are generally based on disaggregated data and are flexible, which facilitates sector-specific study. However, a major problem is that they ignore general-equilibrium interactions, and thus cannot capture inter-sector effects on an economy. A partial equilibrium model for the food sector, used by Govindan (1994), shows the effect of preferential liberalization within the region on intraregional trade in food. It finds that such preferential liberalization will generate welfare gains through an increased trade in food within the region. DeRosa and Govindan (1995), however, show that welfare gains are much higher when member countries go for unilateral liberalization on a nondiscriminatory basis. A partial equilibrium analysis of the cement industry by Pursell (2004) suggests that preferential liberalization between India and Bangladesh would lead to substantial gains through increased competition in the regional market.

Economic Corridors in South Asia: Exploring the Benefits of Market Access and Trade Facilitation
101
To explore the potential of an India-Bangladesh bilateral FTA, the World Bank (2006) assesses Bangladesh and India in a few industries such as cement, light bulbs, sugar, and readymade garments (RMG). The partial equilibrium simulation results suggest that in the case of cement, lights bulbs, and sugar the likely effects of an FTA between Bangladesh and India are an expansion of Indian exports to Bangladesh, but no exports from Bangladesh to India. This is because Indian export prices for these products are substantially lower than their ex-factory, before-tax prices in Bangladesh. The simulations for RMG predict increased Bangladeshi exports to India, but also increased exports from India to Bangladesh. The study finds that an FTA will bring large welfare gain to consumers in Bangladesh, provided there is adequate expansion of infrastructure and administrative capacity at customs checkpoints. It, however, cautions that the benefits of such an FTA to Bangladesh could be wiped out if it has the effect of keeping out cheaper third-country imports, mainly from East Asia, suggesting that further unilateral liberalization is the only way to minimize trade diversion costs. Interestingly, the World Bank (2006) study suggests that India has a comparative advantage in RMG over Bangladesh, but is still reluctant to allow Bangladeshi imports. In recent times, it has allowed Bangladesh, under a tariff-rate quota, to export up to eight million pieces of RMG to its market without paying duties. But this is very little when Bangladesh’s total RMG exports to the world market are considered.
Studies based on computable general equilibrium (CGE) models predict the effects of trading arrangements on all variables, including production, consumption, and trade flows, in all sectors of the economy as also on welfare. Those that apply the CGE model to SAFTA analysis are Pigato et al. (1997), Bandara and Yu (2003), and Raihan and Razzaque (2007). All three employ the Global Trade Analysis Project (GTAP) database and model, though they differ in details due to the evolution of the GTAP. Pigato et al. (1997) find that SAFTA would produce benefits for member nations, though unilateral trade liberalization would yield larger gains. Bandara and Yu (2003) find that in terms of real income, SAFTA would lead to 0.21% and 0.03% gains for India and Sri Lanka, respectively, while Bangladesh would lose by 0.10%. However, the rest of South Asia (Pakistan, Nepal, Bhutan, and the Maldives) would gain by 0.08%. The authors endorse the view that South Asian countries might gain more from unilateral and multilateral trade liberalization than from SAFTA.
Raihan and Razzaque (2007) explain the welfare effects of RTAs. Their main contribution is decomposing the welfare effects of SAFTA (calculated from GTAP simulation results) into trade creation and trade diversion effects for individual South Asian countries.5 It appears that Bangladesh will incur a net welfare loss.
5 It should, however, be noted that the original GTAP framework does not provide estimates of trade creation and trade diversion in total welfare effects. To estimate these two effects, the authors made some adjustments in the GTAP model. The GTAP model provides a net welfare estimate of the SAFTA simulation, which is a sum of the trade creation and trade diversion effects. With a view to isolating the trade creation effect from the total welfare effect, a separate simulation was run where necessary adjustments in the GTAP closure were made so that the imports to all South Asian countries from the rest of the world were held fixed. The welfare effects from this scenario were nothing but the trade creation effects for individual South Asian countries. This trade creation effect was then deducted from the total welfare effect in the original simulation to get the estimate of the trade diversion effect.

Developing Economic Corridors in South Asia
102
Though it will have a positive trade creation effect, the negative trade diversion effect will offset this. However, all other South Asian countries will gain from SAFTA, India the most. Raihan and Razzaque (2007) also explore the possible reasons for Bangladesh’s large trade diversion effect. From the GTAP simulation results, it appears that imports from People’s Republic of China (PRC) and other low-cost sources will decline under SAFTA, while those from India will increase significantly, which indicates the replacement of low-cost import sources with a high-cost source. However, two caveats apply while qualifying these GTAP simulation results. First, the GTAP database does not allow enough disaggregation of commodities, and second, since the model is a comparative static model, potential new trade (or, more precisely, dynamic effects) cannot be captured.
It appears from an analysis of the studies based on CGE models on SAFTA that most of them predict a welfare loss for Bangladesh, which is primarily driven by a large trade diversion effect that neutralizes the trade creation effect. These insights have been very useful because these models take into account the inter-sector and inter-regional effects of RTAs like SAFTA.
5.2 Welfare Analysis of SAFTA in Global Computable General Equilibrium Model: Incorporation of Trade Facilitation
To explore the effects of trade facilitation and an FTA in goods under SAFTA, a global CGE modeling technique, the GTAP model (Hertel 1997), has been applied. The GTAP model is the best possible way for ex-ante analysis of the economic and trade consequences of comprehensive multilateral or bilateral trade agreements. An elaboration on the GTAP model is provided in Appendix 3. This study uses version 7 of the GTAP database, which uses 2004 as the base and covers 57 commodities, 113 regions or countries, and five factors of production. We have maintained the 57 commodities classification, but the 113 regions have been aggregated into eight as shown in Appendix 4 and Appendix 5, respectively.
One scenario is considered in this study—a full FTA in goods among South Asian countries, plus a cut in the cost for intra-SAARC goods trade by 25%.6 The welfare effects are reported in Table 4.18. Since the shock in the GTAP model has two subcomponents, the welfare effects are also decomposed for them. The welfare effects of the tariff cuts on South Asian countries because of SAFTA are consistent with the results of earlier empirical studies (for example, Raihan and Razzaque 2007). The negative welfare effect for Bangladesh is because of a larger trade diversion effect than trade creation effect. Nepal, Bhutan, Afghanistan, and the Maldives will also incur small welfare loss. The biggest gain will be for India. Trade facilitation results in welfare gains for all the countries under consideration. Bangladesh’s welfare loss from tariff liberalization under SAFTA turns into a net welfare gain because of the cut in trade cost.
6 In the GTAP framework, such a reduction in trade cost is introduced by shocking on the transaction cost of the bilateral trade. In this regard, the “ams”—the import-augmenting “technical change” in the Armington nest (which can be used to lower the effective price of imported products)—is shocked.

Economic Corridors in South Asia: Exploring the Benefits of Market Access and Trade Facilitation
103
Table 4.18: Welfare Effects of Tariff Cut and Trade Facilitation in SAFTA ($ million at 2004 prices)
Countries TariffCut
Trade Facilitation
Total Gain Gain from Trade Facilitation as %
of Total Gain
Bangladesh –254.05 1,080.24 826.19 131.00
India 898.32 2,185.42 3,083.74 71.00
Pakistan 283.66 769.49 1,053.15 73.00
Sri Lanka 521.21 1,406.52 1,927.73 73.00
Rest of South Asia –1.94 1,311.71 1,309.77 100.00
Source: Global Trade Analysis Project (GTAP) simulation result. www.gtap.agecon.purdue.edu/databases/v7/default.asp
This analysis underscores the need for improved trade facilitation among South Asian countries to reap the benefit of regional integration. The gains from trade facilitation are much bigger than from tariff cuts. For Bangladesh, the gain from trade facilitation is 131% of the total gain. For the rest of South Asia and India, the figures are 100% and 71%, respectively.
6. Trade Facilitation in East South Asia Subregion and Implications for Bangladesh: Interviews of Stakeholders in Bangladesh
Nontariff Barriers (NTBs) refer to the wide and heterogeneous range of policy interventions other than border tariffs that affect and distort trade of goods, services, and factors of production. For Bangladesh being the only South Asian country without any bilateral Free Trade Agreement (FTA) with other South Asian countries, NTBs are crucial in the context of intensifying its trade under South Asian Free Trade Area (SAFTA). One of the main reasons of SAFTA not being able to enhance intra-regional trade at the desired level is the presence of NTBs, as SAFTA is yet to address the NTB issues directly. The NTBs, distorting exports from Bangladesh to her neighboring countries, mostly have to do with standards, testing and certification procedures in food processing, textiles, and other such areas. Other major NTBs faced by Bangladeshi exporters include licensing, classification of goods, custom valuation, and countervailing duties. Besides, the lack of trade facilitation is also acting as an NTB.
As part of the current research several interviews were conducted with different types of stakeholders including policymakers, exporters, importers, clearing and forwarding (C&F) agents, and mediators between exporters and importers to capture their views on the issue of trade facilitation involving trade between Bangladesh and three other South Asian countries namely India, Nepal, and Bhutan. The interviews were carried out on the basis of a questionnaire that included information about the respondent and the firm, information on trade of the firm, problems in the process of trade such as time and cost implication of the custom clearance, inland transportation, and suggestions for improvement by the respondent. Though the views of stakeholders, who were interviewed, cannot be generalized because the number of interviews is

Developing Economic Corridors in South Asia
104
limited, information from stakeholders’ interview revealed some imperative issues related to trade with India, Nepal, and Bhutan. The information collected from the interviews can be used to understand the dynamics of trade facilitation in this part of the world. The detailed report of these interviews is presented in Appendix 6. The summary is provided below.
The respondents mentioned a number of nontariff barriers (NTBs) in India. For example, India requires “permitted risk analysis” of agricultural imports in biosecurity and sanitary and phytosanitary categories, and this has turned out to be a complex process lacking transparency. Nearly all livestock, agricultural, and food imports require sanitary or phytosanitary (SPS) certificates and import permits from India’s Ministry of Agriculture. Moreover, the Indian Food Adulteration (Prevention) Act 1954 requires the shelf-life of processed foods to be not less than 60% of the original shelf-life at the time of import. While this objective is fine, the process of determining shelf-life is often arbitrary and nontransparent. India’s Prevention of Food Adulteration Rules, 1955, are complicated. Just one rule, Number 32, has 30 provisions with further subprovisions. It also cross-references other rules prescribing content, size and design of labels, display-panel specifications, details of colors and flavors, trade names, and so on. No certificate from the country of origin is accepted. The results of laboratory tests cannot be challenged. Separate regulations exist for various food types. Furthermore, to export textile and textile products to India, exporters must obtain a preshipment inspection certificate from a textile testing laboratory accredited to the national accreditation agency of the country of origin. Nonavailability of the certificate requires testing from the notified agencies in India for each and every consignment. In some cases, even certificates issued by labs accredited by the European Union have been rejected by Indian customs authorities and such consignments subject to repeat tests in India. In addition, the Textile (Consumer Protection) Regulation of 1988 imposes strict marking requirements for yarns, fibers, and fabrics imported into India. Also, exporters of jute products to India must have certificates from the exporting country, provided it does not contain more than 3%, by weight, of nonhomogenate hydrocarbon (jute batching oil). Jute bags/sacks require special labeling, and each bag/sack must carry machine-stitched marking of the country of origin. The respondents also complained about the Indian visa process as cumbersome and time consuming.
In addition, the respondents also mentioned the domestic bureaucratic problems, inefficiency of the customs officers, shortage of efficient manpower, and poor infrastructure at different land and sea ports (such as Benapole land port, Chittagong sea port), and also under-utilization of many land ports such as Hili, Shonamasjid etc in Bangladesh.
7. Policy Implications and ConclusionsThe analysis on using of market access the partial equilibrium model suggests that much of the potential of the rise in exports among the South Asia Subregional Economic Co-operation (SASEC) countries is restricted by the stringent sensitive lists under SAFTA. In recent years, India has liberalized its sensitive list and most of the top export products from Bangladesh, Nepal, and Bhutan to India are out of it. However, there are concerns
Economic Corridors in South Asia: Exploring the Benefits of Market Access and Trade Facilitation
105
among readymade garments (RMG) exporters in Bangladesh that their products are still on India’s sensitive list and that they also face other NTBs. It is also seen that the sensitive lists of Bangladesh and Nepal for India are very stringent, hampering exports from India to these countries. In contrast, Bhutan’s sensitive list is the most liberalized. To enhance the market access of intra-regional exports among SASEC countries, the sensitive lists have to be kept to a minimum.
Interviews with stakeholders in Bangladesh helped to identify some critical factors that should be eased for a substantial rise in exports from Bangladesh to India, Bhutan, and Nepal. Getting an Indian visa is a cumbersome process for Bangladeshi exporters. Most of the stakeholders viewed this as a crucial NTB. There is a need for immediate action by the governments of both countries on this.
The conditions at both sea and land ports are far from satisfactory. Improvements are needed at the Benapole land port and Chittagong port, while substantial work has to be done at the Burimari and Kakarvitta land ports. Inefficiencies at ports erode the competitive advantage of the country. Ports in Bangladesh are plagued by labor problems, poor management, and lack of equipment. Inefficiency and excessive costs are exacerbated by poor customs services. Apart from delay, a payment of “extra” money is required to complete customs formalities.
Most of the interviewees expressed dissatisfaction with the status of inland transportation and road infrastructure. Inland transportation suffers from such problems as illegal toll collection, bad road communication, congestion at ferries, and frequent disruption due to political programs and labor unrest. Inefficient and corrupt ports and inadequate inland transportation substantially increase the costs of production, making it difficult for many exporters to compete in the global market.
Physical infrastructure is weak in Bangladesh. Poor infrastructure requires firms to devote more resources to such tasks as procuring inputs and getting their products to market. All this undermines the competitiveness of exporting enterprises. There are two dimensions to this—one, the unavailability of a certain service or utility (such as telephone, water, electricity, roads and highways), and two, the unreliability of services provided.
It can also be argued that NTBs in India and other South Asian countries hold back the export potential of Bangladesh to these countries. To do away with the trade-impeding effects of these measures, there should be mutual recognition agreements among organizations in Bangladesh and their trading partners in South Asia, in particular India. There is also a need for harmonization of technical barriers to trade (TBT) and SPS measures. Further, Indian accreditation bodies or agencies could set up centers in Dhaka in collaboration with a designated national agency to facilitate cooperation and capacity building with technical and financial assistance. The nonacceptance of assessment certificates should be resolved through mutual cooperation. It is also important to note that NTBs and paratariff measures (PTMs) not notified by the World Trade Organization (WTO) should be prohibited. A code of good practice should be followed before the introduction of any new NTBs.

Developing Economic Corridors in South Asia
106
The analysis in this book suggests that there is the need for economic corridors among the SASEC countries. Reducing tariffs and eliminating sensitive lists will enhance the market access of these countries. Also, improved trade facilitation helps increase market access. Sustaining market access benefits on equitable terms is important in the medium to long term. Economic corridors would help the countries better integrate globally. Higher trade will only boost their confidence to do away with trade restrictions.

Economic Corridors in South Asia: Exploring the Benefits of Market Access and Trade Facilitation
107
References
ADB. 2008. Bay of Bengal Initiative for Multisectoral, Technical and Economic cooperation (BIMSTEC) Transport Infrastructure and Logistics Study (BTILS). Consultants Report. Manila (TA 6335-REG).
Ahmed, S. and Ghani, E. 2010. Making Regional Cooperation Work for South Asia’s Poor. In S. Ahmed, S. Kelegama and E. Ghani, eds. Promoting Economic Cooperation in South Asia. New Delhi: Sage Publications.
Bandara, J. S. and W. Yu. 2003. How Desirable is the South Asian Free Trade Area? A Quantitative Economic Assessment. In D. S. Greenaway, ed. World Economy: Global Trade Policy 2003. Oxford: Blackwell Publishing.
Baysan, T., A. Panagariya and N. Pitigala. 2006. Preferential Trading in South Asia. World Bank Policy Research Working Paper 3813. Washington, DC: World Bank.
Coulibaly, S. 2004. On the Assessment of Trade Creation and Trade Diversion Effects of Developing RTAs. Paper presented at the Annual Meeting 2005 of the Swiss Society of Economics and Statistics on Resource Economics, Technology, and Sustainable Development, Zurich. http://www.wif.ethz.ch/resec/sgvs/078.pdf.
Das, S. and S. Pohit. 2006. Quantifying the Transport, Regulatory and Other Costs of Indian Overland Exports to Bangladesh. World Economy. 29 (9). pp. 1227–42.
De, P., S. Raihan and S. Kathuria. 2012. Unlocking Bangladesh–India Trade: Emerging Potential and the Way Forward. Policy Research Working Paper 6155. Washington, DC: World Bank.
DeRosa, D. A. and K. Govindan. 1995. Agriculture, Trade and Regionalism in South Asia. Food, Agriculture, and the Environment Discussion Paper 7. Washington, DC: International Food Policy Research Institute.
Dubey, M., L. R. Baral, R. Sobhan. 2000. South Asian Growth Quadrangle: Framework for Multifaceted Cooperation. Allahabad: Society for Peace, Security and Development Study. New Delhi: Macmillan
Govindan, K. 1994. A South Asian Preferential Trading Arrangement: Implications for Agricultural Trade and Economic Welfare. Mimeo. Washington, DC: World Bank.
Hassan, M. K. 2001. Is SAARC a Viable Economic Block? Evidence from Gravity Model. Journal of Asian Economics. 12 (2). pp. 263–90.
Hertel, T. W. 1997. Global Trade Analysis: Modeling and Applications. Cambridge: Cambridge University Press.
Hirantha, S. W. 2004. From SAPTA to SAFTA: Gravity Analysis of South Asian Free Trade. Paper presented at the European Trade Study Group (ETSG) 2004 Programme, Nottingham, September.

Developing Economic Corridors in South Asia
108
Laird, S. and A. Yeats. 1986. The UNCTAD Trade Policy Simulation Model: A Note on Methodology, Data and Uses. UNCTAD Discussion Paper No. 19. Geneva: United Nations Conference on Trade and Development.
Limao, N. and A. J. Venables. 2001. Infrastructure, Geographical Disadvantage, Transport Costs and Trade. World Bank Economic Review. 15. pp. 451–79.
Milner, C., O. Morrissey and A. McKay. 2002. Some Simple Analytics of the Trade and Welfare Effects of Economic Partnership Agreements: The Case of the EU-EAC. Mimeo. CREDIT, University of Nottingham.
Pigato, M., et. al. 1997. South Asia’s Integration into the World Economy. Washington, DC: World Bank.
Pohit, S. and N. Taneja. 2003. India’s Informal Trade with Bangladesh: A Qualitative Assessment. World Economy. 26 (8). pp. 1187–214.
Pursell, G. 2004. An India-Bangladesh Free Trade Agreement? – Some Potential Economic Costs and Benefits. Mimeo. Washington, DC: World Bank.
Rahman, M. M. 2003. A Panel Data of Bangladesh’s Trade: The Gravity Model Approach. Paper presented at the European Trade Study Group (ETSG) 2003 Programme, Madrid. September.
Rahman, M., W. Shadat and N. C. Das. 2006. Trade Potential in SAFTA: An Application of Augmented Gravity Model. Occasional Paper 61. Dhaka: Centre for Policy Dialogue.
Raihan, S. and A. Razzaque. 2007. Regional Trading Arrangements (RTAs) in South Asia: Implications for the Bangladesh Economy. In S. Raihan and A. Razzaque, eds. WTO and Regional Trading Arrangement: Quantitative Assessment of Potential Implications for Bangladesh. Dhaka: Pathak Samabesh.
Rodríguez-Delgado, J. D. 2007. SAFTA: Living in a World of Regional Trade Agreements. IMF Working Paper 07/23. Washington, DC: International Monetary Fund.
Sengupta, N. and A. Banik. 1997. Regional Trade and Investment: Case of SAARC. Economic and Political Weekly. 32. 15–21 Nov. pp. 2930–31.
Srinivasan, T. N. and G. Canonero. 1995. Preferential Trading Arrangements in South Asia: Theory, Empirics and Policy. Mimeo. New Haven: Yale University Press.
Subramanian, Uma and John Arnold. 2001. Forging Subregional Links in Transportation and Logistics in South Asia. Washington, DC: World Bank.
Taneja, N. et. al. 2004. India’s Informal Trade with Sri Lanka and Nepal: An Estimation. South Asia Economic Journal. 5 (1). pp. 27–54.
Tumbarello, P. 2006. Are Regional Trade Agreements in Asia Stumbling or Building Blocks? Some Implications for the Mekong Countries. Paper at the Accelerating Development in the Mekong Region seminar. Siem Reap. Cambodia. 26–27 June.

Economic Corridors in South Asia: Exploring the Benefits of Market Access and Trade Facilitation
109
UNECA. 2000. The Economic and Welfare Impacts of the EU-Africa Economic Partnership Agreements: The Analytical Methodology—the GTAP and SMART Models and Related Databases. Addis Ababa: United Nations Economic Commission for Africa.
World Bank. 2006. India-Bangladesh Bilateral Trade and Potential Free Trade Agreement. Bangladesh Development Series. Paper No. 13. Dhaka: World Bank Bangladesh Office.
World Bank. Various years. Doing Business Reports. Various issues. Washington, DC: World Bank. http://www.doingbusiness.org.


Part IICase Studies


113
Chapter 5
Transit and Trade Facilitation across Economic Corridors Connecting Bangladesh,
India, and NepalPushpa Raj Rajkarnikar
1. IntroductionA cross-border economic corridor promotes regional economic cooperation through enhanced trade, investment, and production. A typical economic corridor covers a geographic space usually straddling a central transport artery. Transport infrastructure provides physical connectivity for trade between countries. The SAARC Regional Multimodal Transport Study (SRMTS) has identified a number of regional transport corridors, including 10 road corridors, to promote intraregional trade. Two of these are very important to landlocked Nepal as they play a crucial role in the movement of transit traffic to and from the country.1
(i) SAARC Highway Corridor 2: Kathmandu–Birgunj (Nepal)–Raxaul–Kolkata/Haldia (India)
(ii) SAARC Highway Corridor 4: Kathmandu–Kakarvitta (Nepal)–Panitanki–Phulbari (India)–Banglabandha–Mongla or Chittagong (Bangladesh)
However, such hardware is effective only with the support of adequate software facilities. With this in mind, this study deals with trade facilitation along these two corridors.
Trade facilitation is meant to reduce the complexities of international trade brought about by excessive documentation and regulations as well as cumbersome procedures that have to be followed along the route. This study reviews the existing status of trade facilitation along the two corridors, and identifies reforms that could foster regional cooperation and enhanced trade. It covers customs as well as other border institutions and their governance, transit formalities, dispute settlement, safeguards, information flow, and other important aspects of trade facilitation.1 South Asian Association for Regional Cooperation (SAARC)

Developing Economic Corridors in South Asia
114
This study does not enter into broad and related issues such as the economics of corridors and multilateralism versus regionalism. Given limited resources and time, the primary data were collected from 45 respondents in sample surveys conducted in Nepal and Bangladesh. They included 9 customs officials, 18 traders, and 18 freight forwarders. The major limitations of this study are as follows:
(i) Inadequate corridor-wise secondary data
(ii) Incomplete information from private-sector respondents, who were reluctant to provide details of cost
(iii) No respondents from India.
Secondary data and information were collected from studies, publications, and websites of national and international agencies such as the World Trade Organization (WTO), World Bank, ADB and the United Nations Economic and Social Commission for Asia and the Pacific (UNESCAP). These were used to evaluate the status of trade facilitation measures in Nepal, India, and Bangladesh, which are related to the proposed economic corridors under study. The time, cost, and documents required for imports and exports were examined, while the provisions of bilateral, regional or multilateral treaties and agreements were reviewed.
The primary data were collected through a sample survey of 30 respondents in Nepal (15 each for the two corridors) and 15 in Bangladesh. Five types of structured questionnaires were developed to cover all the important aspects of trade facilitation.2 The collected data and information were tabulated and analyzed to determine the current status of trade facilitation in the two corridors, and a draft report was discussed at a consultative meeting of stakeholders held in Kathmandu on 15–16 July 2011. The suggestions and comments received were considered in finalizing the report.
The Birgunj–Raxaul–Kolkata/Haldia road corridor is the main transit route for Nepal’s foreign trade (Nepal 2006, Rajkarnikar et. al 2010). Ojha (2006) describes the problems associated with the movement of transit goods along this road corridor. Kharel (2009) explains South Asian transit arrangements, focusing on issues related to the Birgunj–Kolkata and Kakarvitta–Chittagong corridors. Referring to transit facilities provided by India to Nepal, Kharel argues that Nepal does not enjoy the hassle-free transit Bhutan does.
The South Asia Subregional Economic Cooperation (SASEC) program’s subregional corridor operational efficiency study indicates that seamless transit transport through the Kakarvitta–Panitanki–Phulbari–Banglabandha corridor will allow Nepali traders easier access to the Mongla or Chittagong ports in Bangladesh, which will promote competition among transshipment ports such as Kolkata and Haldia, and help lower logistics costs (ADB 2006). In addition to providing the physical infrastructure, nonphysical barriers have to be lowered to promote the cross-border movement of goods. Rajkarnikar et. al (2010) examines the effectiveness of delivery of logistics services and its implication on Nepal’s export performance. The study discusses the various constraints on Nepalese exports beyond the issue of transit.2 These questionnaires are available on request.

Transit and Trade Facilitation across Economic Corridors Connecting Bangladesh, India, and Nepal
115
There are two World Bank publications that provide indicators on the strength of countries in terms of doing business and logistic performance separately. The Doing Business Report (IFC/WB 2010) ranks countries on the strength of their border trade. Nepal’s rank went down to 161 in 2010 from 136 in 2007, whereas India’s improved from 139 in 2007 to 94 in 2010, and Bangladesh’s from 134 in 2007 to 107 in 2010. The Logistics Performance Index (LPI) 2010 also of the World Bank ranks Nepal 147, Bangladesh 79, and India 47 among 155 countries. These indicators show that Nepal’s position in both trading across borders and logistics performance has deteriorated. Although India improved its rank in doing business, it fell in terms of logistics performance, whereas Bangladesh improved its position on both fronts.
According to a study on trade facilitation in Asia and the Pacific (ADB/ESCAP 2009), simplifying, harmonizing, and standardizing processes and documents are an essential step in reducing the time and cost needed for imports and exports, and also making them more predictable. Engman (2009) estimates that the transaction costs associated with import and export procedures amount to 7% to 10% of the value of the goods traded. Improving these processes can boost competitiveness. Completing export or import procedures in most developing economies of the Asia-Pacific region takes at least 50% more time than it does in developed economies. The average number of documents and time required for import/export in many subregions in Asia and the Pacific is at least twice as high as in the Organisation for Economic Co-operation and Development (OECD) (ADB/UNESCAP 2009). Duval (2006, 2007) highlights various issues of trade facilitation in Asia-Pacific countries, including Nepal, India, and Bangladesh, and also provides a broad perspective of trade facilitation beyond WTO negotiations.
The literature on trade facilitation in Nepal is, however, scant. Welling and Kaphley (1999) give a detailed account of import and exports procedures in Nepal. A study by Nepal’s Ministry of Commerce and Supplies (MOCS) (2004) has an account of trade facilitation measures and behind-the-border constraints. According to it, reducing transport and logistics costs is critical to increasing competitiveness. Likewise, Rajkarnikar et al. (2006, 2008) explain various aspects of trade facilitation in Nepal, including the private sector’s perception of it. According to Rajkarnikar et. al (2006), delays in the inspection and release of goods, customs valuation, tariff classification, and technical and sanitary requirements are the areas seen as most problematic by the private sector.
Security is very important for trade facilitation. Ojha (2006) finds container security and the high premiums for transit insurance to be major problems for Nepalese transit cargo to and from Kolkata and Haldia ports. He points out border measures alone are not sufficient and suggests comprehensive reform measures.
2. Trade and Transit AgreementsThe movement of goods along the Birgunj (Nepal)–Kolkata/Haldia (India) road corridor is governed mainly by a bilateral agreement between Nepal and India. The movement of goods along the Kakarvitta (Nepal)–Phulbari (India)–Banglabandha (Bangladesh)–Mongla/Chittagong road corridor is governed by bilateral agreements between Nepal and India, and Nepal and Bangladesh. Other regional or international agreements to

Developing Economic Corridors in South Asia
116
which these countries are signatories also have a legal impact on it. In this section, an attempt is made to review the related bilateral, regional, or international agreements.
2.1 World Trade OrganizationNepal uses both the corridors under study mainly for transit trade. It became the 147th member of the WTO in 2004, thus securing its transit right. Articles V, VII and X of the General Agreement on Tariffs and Trade (GATT) are related to trade facilitation. Article V ensures freedom of using transit facilities on the most convenient route. It calls on the parties to provide transit regardless of ownership of goods or means of transportation. It also stipulates not imposing restrictions that delay the movement of goods in transit or collecting discriminatory service charges. While Article VII deals with fees and formalities, Article X requires member countries to publish and fairly administer trade regulations. These WTO provisions are very important to Nepal.
The South Asian Free Trade Area (SAFTA) was first mooted at the 8th SAARC summit in Delhi in 1995, but an agreement was signed only in 2004 at the 12th SAARC summit in Islamabad. Apart from the broad objective of trade liberalization, SAFTA has additional measures such as harmonization and simplification of trade standards and procedures, and development of communication systems, and transportation infrastructure. The agreement also has provisions for providing transit facilities to landlocked member countries, and favorable treatment to the least developed member countries such as Bangladesh, Bhutan, the Maldives, Nepal, and Afghanistan.
After the Islamabad summit, studies were carried out to identify key transport corridors/gateways to enhance regional transport integration. Some of the identified road corridors, such as Kathmandu–Birgunj–Kolkata/Haldia and Kathmandu–Kakarvitta–Phulbari–Banglabandha–Mongla/Chittagong, have a direct bearing on enhancing Nepal’s bilateral and third-country trade. Rail corridors, such as Birgunj–Raxaul–Kolkata/Haldia and Birgunj–Katihar–Chittagong, also have special significance for exports from Nepal.
2.2 Trade and Transit Agreements with IndiaNepal and India signed a comprehensive bilateral treaty on trade and transit in 1950 and it was renewed in 1960 and 1971. Recognizing the transit right of landlocked Nepal, separate trade and transit treaties were signed in 1978. The transit treaty was unilaterally abrogated by India in 1989, and another was signed in 1991 with the provision of renewal. Renewal was made automatic after every seven years in 1999. If any contracting party does not want to renew, it can notify appropriately within the stipulated time. For Nepal’s trade with Bangladesh, there are separate arrangements for transit through the Indian routes of Phulbari and Radhikapur.
The transit treaty recognizes that Nepal needs access to and from the sea to promote its international trade. According to it, the contracting parties shall accord freedom of “traffic in transit” across their territories through routes mutually agreed on without discriminating against any goods or vehicles. The term “traffic in transit” covers transshipment, warehousing, breaking bulk, and changing the mode of transport, as well as the assembly, disassembly or reassembly of machinery and goods, provided this is done for convenience of transportation.
Transit and Trade Facilitation across Economic Corridors Connecting Bangladesh, India, and Nepal
117
The protocol to this treaty lays down that warehouse or storage facilities will be given on lease by the trustees of Kolkata port to an undertaking designated by the Government of Nepal and incorporated in India. The protocol also specifies mutually agreed routes and procedures for import/export. It requires covering sensitive goods in transit by an insurance policy or bank guarantee, or some such legally binding undertaking. Indian trucks carry Nepalese exports only from the Birgunj customs, and Nepalese private trucks are allowed to operate with the authorization of the Nepal Transit and Warehousing Company (NTWC) or the Nepal Transport Corporation (NTC).
The sensitive list includes only 20 to 25 commodities. It is frequently changed by the Government of India, after intimating the Government of Nepal, but is not made public. This creates problems for traders. Duty insurance is a burden to exporters, with the premium varying from 1.6% to 2.0% of the value depending on the kind of cargo. The duty insurance is to be taken at market value, and this unnecessarily raises the cost as the value goes up to two and half times the cost, insurance, and freight (CIF) value of goods (Ojha 2006).
A Rail Service Agreement was signed in May 2004 for operating and managing rail services between Kolkata and Haldia ports in India and Birgunj in Nepal for transit traffic, and between Indian stations and Birgunj for bilateral traffic. This lays down procedures on the movement of export and import cargo, and the modalities for train services. As transport by rail is cheaper, hassle free and faster, this agreement has had a positive impact on Nepal’s exports to India and other countries.
The trade treaty was revised in October 2009 and the number of agreed routes for mutual trade has gone up from 19 to 26. A notable feature of the revised treaty is that it recognizes sanitary and phytosanitary (SPS) certificates issued by the authority concerned in both countries. However, they need to satisfy the mandatory requirement of the importing country. There is also an Agreement of Cooperation to Control Unauthorized Trade between Nepal and India. All the four arrangements mentioned have had an impact on trade flow to and from Nepal.
2.3 Trade and Transit Agreements with BangladeshThe transit procedures prescribed in Nepal’s transit treaty with India apply, with necessary changes, to traffic in transit to Bangladesh and beyond through Radhikapur and Phulbari in India. But, in the Indian section of the corridor, trucks have to be escorted by Indian security and can only move as a convoy during the day. This has made movement along this corridor difficult.
Nepal and Bangladesh signed separate agreements on trade and payments, and on transit in 1976. The transit agreement allows Nepal to use the ports of Chittagong and Khulna as well as the border crossings at Birol, Banglabandha, Chilhati, and Benapole. Bangladesh will provide Nepal warehouses, transit sheds, and open space on a long-term lease at the ports and other points for the traffic in transit. This agreement provides Nepal with alternative access to sea ports. However, the use of these ports is not significant as there are many factors impeding it. There are also problems to be ironed out in transshipment processes.

Developing Economic Corridors in South Asia
118
Nepal has had a liberal trade policy in the last two decades or so. There is no quantitative restriction on imports, and no licenses are needed, except for a few commodities. Trade procedures, however, are not simple. Nepal made a commitment to the WTO at the time of accession that it would simplify trade procedures. A new trade policy was declared in 2009, and an act and regulations in accordance with it are being drafted. Its main strategy is reducing transaction costs through strengthening institutions and simplifying procedures. However, political instability pushed the economic agenda to the backburner for quite some time.
Customs reform is an important component of the trade facilitation measures that Nepal has initiated so far. Nepal introduced the ASYCUDA software for customs in 1996, and its use has been gradually expanded to different offices. The Department of Customs designed and implemented a three-year action plan in 2003–04. This accorded high priority to scientific customs valuation procedures, simplifying checking procedures, reducing documentary requirements, automating customs processes, and selectivity checking based on risk analysis.
A new Customs Act was implemented in 2007 that has many provisions in line with the revised Kyoto Convention and other agreements. The act and its rules specify nine documents for import and four for export. But, in practice, many more are required. The World Economic Forum’s (WEF) Enabling Trade Index ranks Nepal 117 among 118 countries in efficiency of customs administration. A four-year Customs Reform and Modernization Action Plan (2009–13) has been launched with the objective of facilitating trade and industry, and encouraging voluntary compliance. It envisages reworking all customs clearance procedures, including documentation and data requirements, and the use of risk management.
Nepal is committed to follow the WTO rule that recognizes transaction value as the basis for customs valuation, and this has been incorporated into the Customs Act 2007. But reports say there is undervaluation of imports on a large scale, indicating the need to strengthen risk management. The country still lacks an effective system of postclearance audit. A single-window system was implemented at the Birgunj customs office in 2006 on a trial basis. The customs action plan (2009–13) has the objective of developing single-window systems in all customs offices. But this is not easy as Nepal is far behind in information technology (IT)-based trade facilitation, while Southeast Asian countries have already moved towards paperless trade.
The availability of information on laws, regulations, and administrative policies and procedures is considered one of the basic tenets of trade facilitation. Nepal publishes all such material and the MOCS has a web page with trade-related information. Two trade points have been developed to integrate Nepal into the Global Trade Point Network, and a WTO reference center has also been established under the department of commerce to enhance flow of trade-related information among stakeholders. Enquiry points have been set up to respond to queries related to SPS and technical barriers to trade (TBT). The department of commerce has also developed a website, where all the relevant tariffs and laws are posted. There are also consultative arrangements with traders at different levels, trade facilitation committees, and a high-level trade advisory group in the MOCS.

Transit and Trade Facilitation across Economic Corridors Connecting Bangladesh, India, and Nepal
119
Considering the country’s landlocked status, the Government of Nepal has constructed inland container depots (ICDs), also known as “dry ports,” at different customs points. The rail-based ICD in Birgunj in Nepal is already functioning. Despite such reforms in transportation, customs, and information, the status of trade facilitation in Nepal lags behind India and Bangladesh. Inadequate physical facilities at border points, institutional ineffectiveness, and a lack of good governance like nonadherence to government rules and professional ethics are the factors responsible for this.
3. Trade Facilitation in Nepal, India and Bangladesh: A ComparisonA trade transaction involves the safe movement of goods, transfer of ownership, quality assurance, payment of dues, and so on. Different documents are required for these activities. A robust trading system with a liberal regulatory mechanism, good governance, capable human resources, and updated technology reduces the number of documents, simplifies procedures, and creates a business-friendly environment that reduces cost.
International Finance Corporation/World Bank’s Doing Business reports have country-wise information on the number of documents required and the time and cost (excluding tariffs) involved in export or import. Table 5.1 has the figures for export in Nepal, India, and Bangladesh during 2006–10.
Table 5.1: Documents, Time, and Cost Required for Export, 2006–10
2006 2007 2008 2009 2010
No. $ No. $ No. $ No. $ No. $
Nepal
Documents for export (number)
7 7 9 9 9
Time for export (days) 44 44 43 41 41
Cost per 20-ft container NA 1,599 1,600 1,764 1,764
India
Documents for export (number)
10 10 8 8 8
Time for export (days) 36 27 18 17 17
Cost per 20-ft container NA 864 820 945 945
Bangladesh
Documents for export (number)
7 7 7 6 6
Time for export (days) 35 35 28 28 25
Cost per 20-ft container NA 2,275 844 970 970
Source: World Bank. Doing Business database. www.doingbusiness.org.
Table 5.1 indicates that in 2006 the time required for export in India was 36 days and in Bangladesh, 35 days. This decreased to 17 days and 25 days, respectively in 2010. But in Nepal, it fell only marginally from 44 days to 41 days in the same period. The reform processes has been slow in Nepal, and the time required for exports is 141% more than that in India, and 64% more than that in Bangladesh.

Developing Economic Corridors in South Asia
120
The number of documents required decreased from 10 to eight in India and from seven to six in Bangladesh, whereas it increased from seven to nine in Nepal during 2006–2010. This again shows Nepal’s poor performance in improving trade facilitation. The cost of exports per 20-ft container in Nepal was $1,599 in 2007, which increased by 10.3% to $1,764 in 2010. In India, it increased by 9.3% to $945 in 2010. But the cost in Bangladesh declined by 57.4% to $970 in 2010 from $2,275 in 2007. So, in terms of cost as well, Nepal lags behind India and Bangladesh.
In the case of imports, the number of documents required in Nepal was 10 in 2007 and remained the same in 2010 (Table 5.2). But in India and Bangladesh, they fell by 40% and 50%, respectively. In India, from 15 in 2007 to nine in 2010, and in Bangladesh, from 16 in 2007 to eight in 2010. The time required for imports has declined in all the countries, but in varying magnitude. It decreased by 53.5% to 20 days in India, and by 49.1% to 29 days in Bangladesh. In Nepal, the decrease was only by 7.9% to 35 days. The cost of imports per 20-ft container in Nepal was $1,825 compared to $960 in India, and $1,375 in Bangladesh. The importing cost per container increased by $25 in Nepal, whereas it decreased by $284 and $1,200 in India and Bangladesh, respectively during 2007–10.
India and Bangladesh have achieved more progress in trade facilitation than Nepal. Most studies show the transportation costs of landlocked countries are higher than others, and Nepal is no exception. It has to bear high transportation costs to export goods and also import raw materials. Apart from distance, a low-quality transit regime, and several domestic factors, such as the lack of a business-friendly environment and political disturbances, have contributed to this.
Table 5.2: Documents, Time, and Cost Required for Import, 2006–10
2006 2007 2008 2009 2010
No. $ No. $ No. $ No. $ No. $
Nepal
Document for import (number)
10 10 10 10 10
Time for import (days) 38 37 35 35 35
Cost per 20-ft container NA 1,800 1,725 1,900 1,825
India
Document for import (number)
15 15 9 9 9
Time for import (days) 43 41 21 20 20
Cost per 20-ft container NA 1,244 910 960 960
Bangladesh
Document for import (number)
16 16 9 8 8
Time for import (days) 57 57 32 32 29
Cost per 20-ft container NA 2,575 1,148 1,375 1,375
Source: World Bank. Doing Business database. www.doingbusiness.org.

Transit and Trade Facilitation across Economic Corridors Connecting Bangladesh, India, and Nepal
121
The Trade and Investment Report 2009 (UNESCAP 2009) shows the time and cost involved in completing trade procedures in different countries. The country-wise data for Nepal, India, and Bangladesh are presented in Table 5.3.
Table 5.3: Cost and Time for Completing a Trade Procedure, 2005 and 2009
Time for Completing a Trade Procedure (days) Cost of Completing a Trade Procedure ($)
2005 2009 % change 2005 2009 % change
Nepal 39 38 –2.6 1,525 1,495 –2.0
India 40 19 –53.2 967 794 –17.9
Bangladesh 46 27 –41.3 1,004 977 –2.7
Source: UNESCAP. 2009. Trade and Investment Report 2009. Bangkok: United Nations Economic and Social Commission for Asia and Pacific.
The time and cost for completing a trade procedure decreased from 2005 to 2009 in all the countries, which meant a better level of efficiency. But the degree of improvement was higher in India than Bangladesh and Nepal. In Nepal, the time required fell by only 2.6%, while it declined by 53.2% and 41.3% in India and in Bangladesh respectively. The cost of completing a trade procedure decreased significantly by 17.9% in India, but only by 2.7% and 2.0% in Bangladesh and Nepal, respectively. Thus, there has been no significant change in Nepal’s trade facilitation status.
The picture the Logistics Performance Index (LPI) of the World Bank presents is no different (Table 5.4). The LPI comprises components such as ranks of customs, infrastructure, international shipment, logistics competence, domestic logistics cost, and timeliness. The overall LPI indicates that the situation of Nepal and India has worsened respectively, while Bangladesh has improved. The 2010 ranks of Nepal, India, and Bangladesh were 147, 47, and 79, respectively among 155 countries, while they were 130, 39, and 87, respectively among 150 countries in 2007. When examined at the disaggregated level, Nepal declined in all aspects, except customs, from 2007 to 2010. India’s status also fell in all components. But, Bangladesh improved in all components, except timeliness.
Table 5.4: Logistics Performance Index, 2007 and 2010
Nepal India Bangladesh
2007 2010 2007 2010 2007 2010
Logistics Performance Index 130 147 39 47 87 79
Customs rank 141 130 47 52 125 90
Infrastructure rank 144 143 42 47 82 72
International shipment rank 131 143 39 46 96 61
Logistics competence rank 124 143 31 40 103 96
Domestic logistics cost 22 46 50
Timeliness 110 139 47 56 54 70
Source: World Bank. 2007 and 2010. Connecting to Compete: Trade Logistics in the Global Economy. Washington, DC: World Bank.

Developing Economic Corridors in South Asia
122
Trade facilitation is a part of the overall business environment of a country. The Doing Business Report (2010) ranks countries in terms of the ease of doing business in them based on different activities ranging from firm registration to trading (Table 5.5). Nepal’s absolute rank was 55 out of 155 countries in 2006, and its relative position was 35. The relative position is determined assuming that the total number of countries is 100. India’s figures were 116 and 74, respectively in 2006, while Bangladesh’s were 65 and 42, respectively. So Nepal fared better than India and Bangladesh in 2006. But in 2010, Nepal ranked 123 out 178 countries, with a relative rank of 69. The absolute ranks of India and Bangladesh fell to 133 and 119, respectively. Although all three countries declined in absolute rank, India’s relative position remained almost the same, while Bangladesh and Nepal fell. Nepal’s fall was steeper than Bangladesh’s, indicating that doing business there is becoming more difficult. Also, in India, despite improvement in the overall business environment, the transit regime remained poor in both the corridors under study.
Table 5.5: Ranking on the Ease of Doing Business, 2006–10
Year Total Number of Countries
Nepal India Bangladesh
2006 155 55 116 65
2007 175 100 134 88
2008 183 111 120 107
2009 181 121 122 110
2010 178 123 133 119
Source: World Bank. Doing Business database. www.doingbusiness.org.
4. Survey FindingsRoad transport is the dominant mode of transportation in the South Asian region. On the border between India and Nepal, there are 26 official trading points, of which 15 are operative. Of these 15, only six are frequently used. Two of the 10 economic corridors the SAARC Regional Multimodal Transport Study (SRMTS) suggests are this study’s concern, and their features are given in Table 5.6.
To examine the status of trade facilitation measures, a survey was carried out in these corridors. It included 45 exporters/importers, freight forwarders, and customs officials—30 from the Kakarvitta–Phulbari–Chittagong corridor, including 15 from Bangladesh, and 15 respondents from the Birgunj–Raxaul–Kolkata/Haldia corridor. The corridor-wise findings of the survey are presented below.
4.1 Kakarvitta–Panitanki–Phulbari–Banglabandha–Chittagong/Mongla portThis corridor links Nepal with the sea ports of Chittagong and Mongla in Bangladesh. To date, trade through Bangladesh is negligible, but around 95% of Nepal’s trade with Bangladesh takes place through this route. According to 2010 data, exports to

Transit and Trade Facilitation across Economic Corridors Connecting Bangladesh, India, and Nepal
123
and imports from Bangladesh through this corridor accounted for 95% and 93%, respectively of the total trade with the country (Table 5.7).
Chittagong is a premier port and it handles 92% of Bangladesh’s import and export trade, but poor trade and port facilitation are major constraints. Mongla has a capacity of 6.5 million tons, of which only 1.7 million tons is used. Its labor productivity is low, and the trade facilitation system is inadequate. All this increases the procedural and operational time for moving goods towards destinations.
Table 5.6: Features of SAARC Highway Corridors 4 and 2
Name of Corridor
Distance (km)
Use of Road Number of Customs Points
Name of Port
Remarks
Kakarvitta–Panitanki–Phulbari–Banglabandha–Chittagong/Mongla
Chittagong 841
M o n g l a 762
India: NH 31C, NH 31 and SH 12 A
Bangladesh: N5 up to Hatikumrel, N507, N6, N704 and N7 to reach to Mongla and N405, N4 and N3 to reach Dhaka and N1 to reach Chittagong
5 Chittagong
Mongla
(i) Situated 20 km upstream from Bay of Bengal,
(ii) operating beyond capacity,
(iii) heavily congested, (iv) inadequate handling and
storage facilities, and(v) frequent labor unrest.
(i) Situated 130 km upstream from Bay of Bengal on Pasu river,
(ii) capacity is 6.5 million tons, but only 1.7 million per annum is used,
(iii) the rate of siltation is high, and
(iv) lacks inland connectivity.
Birgunj–Raxaul–Kolkata/Haldia
1,100 India: NH 28A, NH 28, NH 31, NH 34, NH 6 and NH 41 to reach Kolkata/Haldia
3 Kolkata
Haldia
(i) Situated on eastern bank of the Hoogly,
(ii) capacity is 43.9 million tons, which is fully utilized,
(iii) very congested.
(i) Situated on the Hoogly and close to Kolkata,
(ii) it is 121 km upstream from the sea,
(iii) catchment area is vast,(iv) capacity is 34.1 million
tons, and (v) it is almost congested.
Note: NH = National highway, SH = State highway.
Source: SASEC. 2006. SAARC Regional Multimodal Transport Study. Kathmandu, Nepal: SAARC Secretariat.

Developing Economic Corridors in South Asia
124
Table 5.7: Bangladesh Trade through Kakarvitta–Chittagong Corridor(NR 000s)
Trade Through this corridor (1)
Total Trade (2) 1 as % of 2
2009 Import 350,818 418,014 83.90
Export 4,586,858 4,710,402 97.40
Total 4,937,676 5,128,416 96.30
2010 Import 707,598 764,830 92.50
Export 3,191,602 3,373,718 94.60
Total 3,899,200 4,138,548 94.20
Note: NR Nepal RupeeSource: Trade and Export Promotion Centre. Ministry of Commerce and Supplies. Government of
Nepal. http://www.tepc.gov.np.
The Kakarvitta–Phulbari–Banglabandha–Mongla/Chittagong corridor (Figure 5.1) starts at Kakarvitta (Nepal) and reaches Panitanki (India). It goes along NH 31C, NH 31 and SH 12A to Phulbari (India) and Banglabandha (Bangladesh). From Banglabandha, it follows the N-5 up to Hatikumrel and takes the N-507, N-6, N-704 and N-7 to reach Mongla, and the N-405, N-4 and N-3 to reach Dhaka. From Dhaka, it follows the N-1 to Chittagong. The distance from Kakarvitta to Mongla is 762 km, and to Chittagong, 841 km.
Figure 5.1: SAARC Highway Corridor 4
B a y o f B e n g a l
Panitanki
Kakarbhitta PhulbariBanglabandha
Thimphu
Kathmandu
SiliguriRajbiraj
Mugling
NarayanghatHetauda
Pathlaiya
Chittagong
Camilla
Mongla
Khulna
Kolkata
Dhaka
TangailHatikamrul
Baraigram
Bogra
Gaibanda
Rangpur
BANGLADESH
BHUTANN E P A L
I N D I A
I N D I A
National RoadInternational Boundary
SH4: Kathmandu-Kalarbhitta-Phulbari-Banglabandia-Mongla/Chittagong
Map 6 SAARC Road Corridor 4
SAARC HIGHWAY CORRIDORSHC4: Kathmandu-Kakarbhitta-Phulbari-Banglabandha-Mongla/Chittagong
This map was produced by the cartography unit of the Asian Development Bank. The boundaries, colors, denominations, and any other information shown on this map do not imply, on the part of the Asian Development Bank, any judgment on the legal status of any territory, or any endorsement or acceptance of such boundaries, colors, denominations, or information.

Transit and Trade Facilitation across Economic Corridors Connecting Bangladesh, India, and Nepal
125
This corridor links Nepal, India, and Bangladesh. The survey focused on the documents, custom clearance procedures, and the time and cost required for import, export, and transit.
(i) Documents required. Each country requires different documents in its own format as specified in its rules. Such documents are related to transit, export, and import. Traders prepare separate set of documents for each customs point for exports and imports. In some cases, the harmonization code differs. The respondents reported that in India each customs point requires six documents for exports and five for imports (Table 5.8). In Bangladesh, eight are required for both imports and exports. In Kakarvitta (Nepal), nine are needed for imports and seven for exports. Thus, for both exports and imports through this corridor, 35 documents are needed (see Appendix 7).
Table 5.8: Documents Required in Kakarvitta–Chittagong Corridor 2010
Particular Nepal India Bangladesh Total
Import
Required number of documents at each customs point 9 5 8 22
Number of custom points 1 2 2 5
Total number of documents required 9 10 16 35
Export
Required number of documents 7 6 8 21
Number of customs points 1 2 2 5
Total number of documents required 7 12 16 35
Source: Raihan, Selim. 2010. Primary Survey on Trade Facilitation at the Firm level in Bangladesh and Nepal.
(ii) Customs Clearance Procedures. Customs clearance procedures also differ from country to country. The Kyoto Convention is supposed to provide common guidelines, but India, Bangladesh, and Nepal follow it in their own way. The working hours of customs offices differ in each country. The survey reveals that both importing and exporting cargo involves a number of agents (clearing, steamer, customs, forwarding, and shipping agents) and a confusing number of steps in which documents are prepared and submitted for approval to customs officials at five checkpoints in three countries. It also entails transshipment, moving in a convoy through India, and paying all duties and taxes. It suffices to say that the whole process is very complicated.
(iii) Time. There are five customs checkpoints in this corridor. Information on the time taken for customs clearance at each checkpoint and the total time required from entry to exit were collected from the respondents (Table 5.9).

Developing Economic Corridors in South Asia
126
The country-wise time taken for customs clearance depends on the number of customs checkpoints. Besides clearance time, transportation time is important and this depends on the distance, assuming road conditions are the same. The distance from Kakarvitta to Chittagong is 841 km, and to Mongla is 762 km. Bajracharya (2004) estimates that a truck travels 174 km a day on this route. On that basis, the tentative time taken from Kakarvitta to Chittagong is five days, and to Mongla, four days. The customs clearance time is 17 hours for imports to Kakarvitta through Chittagong/Mongla, and 11:15 hours for exports. The total time required (excluding transportation) for imports and exports from Kakarvitta to Chittagong and Mongla is 36 hours and 25 hours, respectively.
Table 5.9: Time Required in Kakarvitta–Chittagong Corridor 2010
Particulars Nepal India Bangladesh
Import Kakarvitta Panitanki Phulbari Banglabandha Chittagong/Mongla
Customs clearance time at each point
2 hrs 30 mins 2 hrs 45 mins 3 hrs 15 mins 4 hrs 45 mins 3 hrs 45 mins
Total time required
5 hrs 4 hrs 5 hrs 10 hrs 45 mins 11 hrs 15 mins
Export
Customs clearance time at each point
2 hrs 30 mins 2 hrs 3 hrs 2 hrs 1 hrs 45 mins
Total time required
5 hrs 3 hrs 45 mins 5 hrs 15 mins 5 hrs 45 mins 5 hrs 15 mins
Source: Raihan, Selim. 2010. Primary Survey on Trade Facilitation at the Firm Level in Bangladesh and Nepal.
(iv) Cost. In broad terms, trade cost includes all costs incurred in getting a product to an end user, such as transportation cost, information cost, cost associated with official and nonofficial charges, legal and regulatory charges, and clearing agent fees. In this study, only trade facilitation-related costs such as facilitation cost, loading and unloading charges, clearing agent fees, and informal charges are included. The country-wise cost per 20-ft container is given in Table 5.10.
The survey data on imports indicate that the official cost is highest in Phulbari (India), while loading and unloading charges are high in Banglabandha. Informal charges are higher in Bangladesh than elsewhere. In the case of exports, the official cost is high in Phulbari (India) and Chittagong (Bangladesh). Loading and unloading charges are highest in Kakarvitta (Nepal), and the informal cost is high in Bangladesh. The transportation cost for imports and exports per 20-ft container from Kakarvitta to Chittagong is $686.

Transit and Trade Facilitation across Economic Corridors Connecting Bangladesh, India, and Nepal
127
Table 5.10: Costs Involved in Kakarvitta–Chittagong Corridor 2010(in $)
Particulars Nepal India Bangladesh
Kakarvitta Panitanki Phulbari Banglabandha Chittagong/Mongla
Import
Official cost 35 16 42 – 26
Load/unload 45 64 36
Clearing agent 23 42 20 29 32
Informal 10 7 6 43 32
Total 113 65 68 136 126
Export
Official cost 9 – 43 36
Load/unload 46 – 42 32
Clearing agent 12 5 13 10 10
Informal cost 3 2 8 9 18
Total 70 7 64 51 96
Note: The transportation cost from Kakarvitta to Chittagong is $686 per 20-ft container.
Source: Raihan, Selim. 2010. Primary Survey on Trade Facilitation at the Firm Level in Bangladesh and Nepal.
(v) Quarantine, Information, Disputes, and Governance. Quarantine is only the concern of the final destination and depends on the nature of what is imported. However, 40% of the respondents alleged that custom checkpoints often unnecessarily asked exporters to submit quarantine-related documents, causing delay and increasing cost. The business community needs to be aware of changes in rules and directives. A majority (67%) of the respondents said that there was no mechanism to disseminate judicial decisions in time to traders. They also reported that there are no enquiry counters at any of the customs checkpoints.
As for dispute settlement, the respondents said there are mechanisms to appeal against decisions in all the three countries. But, there is no mechanism for arbitration or administrative reviews at customs checkpoints. In the context-of governance, only 20% of the respondents said that they were consulted when rules were changed. The discretionary power customs officials have to interpret rules, and the escorting of convoys were said to cause delays, increasing the time and cost of trading via this corridor.
(vi) Causes of Delay. The survey sought information on the causes of delay. The stakeholders pointed to road conditions, and loading and unloading as two main reasons for it. Public holidays are not on the same days, and these delay customs clearance. The distance to the customs house at Phulbari was another factor. The escorting of trucks and special security checks also result in delay. Frequent power outages are another contributory cause.

Developing Economic Corridors in South Asia
128
(vii) Customs-related Problems. The respondents indicated that there is a lack of space and modern equipment in Chittagong port. All customs houses require proper warehouses and cold storage facilities. Poor handling facilities and a disregard for punctuality result in delays. In addition, customs officials and clearing agents often lack adequate knowledge of international standards and modern customs clearance systems. In Kakarvitta, customs valuation is a problem because there is no updated database on products in the international market. Though the integrity of customs staff is mentioned in reform packages, much remains to be done to make it a reality.
4.2 Birgunj–Raxaul–Kolkata/HaldiaThis is a major corridor for Nepal’s third-country trade through the Kolkata and Haldia ports in India. Around 20% of the total third-country trade takes place through this corridor, and it accounted for 12% of total third-country exports and 20% of total third-country imports in 2010 (Table 5.11). Thus, 19% of the total third-country trade took place through this corridor in 2010.
Table 5.11: Third-Country Trade through Birgunj–Kolkata Corridor(NR million)
Trade Through this Corridor (1)
Total Trade (2) 1 as % of 2
2009
Import 29,491.00 122,032.00 24.20
Export 2,694.60 2,6691.60 10.10
Total 32,185.60 148,723.60 21.60
2010
Import 31,716.80 161,344.80 19.70
Export 2,526.10 21,046.80 12.00
Total 34,242.90 182,391.60 18.80
Note: NR Nepal RupeeSource: Trade and Export Promotion Centre. Ministry of Commerce and Supplies. Government of
Nepal. http://www.tepc.gov.np.
The Birgunj–Raxaul–Kolkata/Haldia corridor (Figure 5.2) starts from Birgunj (Nepal) and reaches Raxaul (India). From Raxoul, it follows NH 28A, NH 28, NH 31, NH 34, NH 6 and NH 41 to Kolkata and Haldia. The distance from Birgunj to both ports is approximately 1,100 km.
(i) Documents Required. Customs laws and regulations in Nepal and India have made different provisions for the documents related to transit, export, and import within the guidelines of the Kyoto Convention. Traders prepare sets of documents for each customs checkpoint for exports and imports. In some cases, the harmonization code differs, creating trouble. The respondents reported that nine documents are required for each customs checkpoint in India for imports and eight for exports of transit cargo. In Birgunj (Nepal), eight documents are required for imports and exports. Thus a total of 26 documents are required for imports and 24 for exports (Table 5.12; see Appendix 8).

Transit and Trade Facilitation across Economic Corridors Connecting Bangladesh, India, and Nepal
129
Haldia Port
BANGLADESH
MYANMAR
BHUTAN
N E P A L
I N D I A
0 25 50 75 100
Kilometers
N
SAARC Road 2 Corridor
KATHMANDU
DHAKA
Kolkata Port
Mongdu
This map was produced by the cartography unit of the Asian Development Bank.
The boundaries, colors, denominations, and any other information shown on this
map do not imply, on the part of the Asian Development Bank, any judgment on the
legal status of any territory, or any endorsement or acceptance of such boundaries,
colors, denominations, or information.
Raxaul
Allahabad
Muzaffarpur
Purnea
Barhi
Haldia
Pokhara
Narayanghat Hetauda
MotihariSagauli
Patna
Kolkata
Asansol
Birgunj
B a y o f B e n g a l
Table 5.12: Documents Required in Birgunj–Kolkata Corridor
Particular Nepal India Total
Import
Number of documents required at each customs point 8 9 17
Number of customs points 1 2 3
Total 8 18 26
Export
Number of documents required at each customs point 8 8 16
Number of customs points 1 2 3
Total 8 16 24
Source: Raihan, Selim. 2010. Primary Survey on Trade Facilitation at the Firm Level in Bangladesh and Nepal.
Figure 5.2: SAARC Highway Corridor 2

Developing Economic Corridors in South Asia
130
(ii) Customs Clearance Procedures. For customs clearance procedures, both countries follow the Kyoto Convention guidelines, but again in their own manner. Apart from differences in holidays, there are 25 procedural steps to be followed in the Birgunj–Kolkata corridor for imports and 20 for exports of customs-cleared transit cargo. As with the Kakarvitta–Chittagong corridor, both the processes are long drawn out, involving numerous agents and many documents, for obtaining approvals and paying taxes and duties.
(iii) Time. There are three customs checkpoints in this corridor and the survey obtained information on the time taken for customs clearance at each of them and the total time required from entry to exit (Table 5.13).
Table 5.13: Time Required in Birgunj–Kolkata Corridor 2010
Particulars Nepal India
Birgunj Raxaul Kolkata
Import to Nepal
Customs clearance time at each point 3 hrs 3 hrs 15 mins 8 hrs 45 mins
Total time required 8 hrs 8 hrs 20 hrs 45 mins
Export from Nepal
Customs clearance time at each point 2 hrs 45 mins 3 hrs 7 hrs 15 mins
Total time required 6 hrs 8 hrs 13 hrs 15 mins
Source: Raihan, Selim. 2010. Primary Survey on Trade Facilitation at the Firm Level in Bangladesh and Nepal.
The total time taken for customs clearance depends on the number of checkpoints. The total time required for cargo from entry to exit is 8 hours for imports and 6 hours for exports in Birgunj (Nepal). In Raxaul (India), it is 8 hours for both export and imports, whereas in Kolkata it is 20 hours 45 minutes for imports and 13 hours 15 minutes for exports. The total time, excluding transportation, is 36 hours for imports and 27 hours for exports. The distance from Birgunj to Kolkata and Haldia is about 1,100 km. Bajracharya (2005) estimates vehicles in this corridor cover an average 195 km a day. On that basis, it takes five days for cargo from Birgunj to reach Kolkata or Haldia and vice versa.
(iv) Cost. In this study, only trade facilitation-related costs are considered. The country-wise breakdown of the costs for a 20-ft container is given in Table 5.14. The survey reveals that in imports, all costs are higher in Kolkata compared to Raxaul (India) and Birgunj (Nepal). In the case of exports, official costs, loading and unloading charges, and informal costs are higher in Kolkata, but clearing agent fees are higher in Raxaul. This means that overall trade facilitation-related costs are higher in India than Nepal. The transportation cost of a 20-ft container is $913 for imports and exports. The cost of transit transport is high due to the cost of returning the empty container to the point of origin.

Transit and Trade Facilitation across Economic Corridors Connecting Bangladesh, India, and Nepal
131
Table 5.14: Costs Involved in Birgunj–Kolkata Corridor 2010(in $)
Particulars Nepal India
Birgunj Raxaul Kolkata
Import to Nepal –
Official cost – – 73
Port authority cost – – 99
Load/unload 32 – 44
Clearing agent 38 51 60
Informal 46 39 62
Total 116 90 338
Export from Nepal
Official cost 9 83 53
Port authority cost – – 124
Load/unload 33 – 39
Clearing agent 22 72 62
Informal 38 71 92
Total 102 226 370
Note: ‘–’ indicates that there is no cost.
Source: Raihan, Selim. 2010. Primary Survey on Trade Facilitation at the Firm Level in Bangladesh and Nepal.
(v) Quarantine, Information, Disputes, and Governance. Almost 25% of the re-spondents said some customs checkpoints asked exporters to submit quarantine-related documents, and also certificates of origin. A majority of the respondents (60%) reported that they missed getting information on time because of the lack of an appropriate information dissemination mechanism. However, customs of-ficials claimed the receptions in customs offices in Nepal provide traders with any information they require. The conflicting reports indicate that the receptions do not function very effectively. All respondents said that there is a mechanism to ap-peal against decisions in both countries, but no provision for arbitration or admin-istrative reviews at customs checkpoints. On governance, 40% of the respondents in Nepal reported that there was discretionary use of rules and directives, which resulted in nontransparent practices.
(vi) Causes of Delay. The causes of delay are mainly associated with traffic congestion and road conditions. Pilferage of goods along the route was a problem the respondents mentioned. Different holidays in India and Nepal, and power outages cause delays in customs clearance. Inspections at entry points are often lengthy and sometimes multiple agencies are involved. All these contribute to increasing the time and cost of trading.

Developing Economic Corridors in South Asia
132
(vii) Customs-related Problems. A majority of the respondents (67%) said space is at a premium in Kolkata and Haldia. The result is congestion, and a lack of modern warehouses and cold storage facilities. Some of the official procedures in Kolkata are cumbersome. In Birgunj, customs valuation is a problem due to the lack of a proper database.
5. Conclusions and Recommendations5.1 ConclusionsTrade affects poverty through its effects on economic growth and its distribution. Evidence from individual cases and cross-country analyses support the view that globalization leads to faster growth and poverty reduction in poor countries (Dollar and Kraay 2001). In the case of Nepal, a regression of real gross domestic product (GDP) growth with growth of real exports shows that real export growth has a positive and significant effect on GDP (Acharya et al. 2003). The impact of export-led GDP growth on employment is, however, not very clear. Mere export growth may not be enough for poverty reduction. It depends on many other factors such as, for example, factor intensity and backward linkages. For instance, a rise in exports of labor-intensive goods will increase the prices of those goods, and the demand for relatively low-skilled workers. The resulting increase in real wages may have a positive impact on poverty (CUTS 2007). Thus, though many other complementary reforms may be required, augmentation of trade is vital to poverty reduction.
With declining exports, Nepal’s trade performance is not satisfactory. As a landlocked country, its geography is a major constraint, which entails spending more money and time on transit. The Birgunj–Kolkata road corridor plays a crucial role in Nepal’s trade, but the time and cost borne by traders is high compared to the Kakarvitta–Chittagong corridor (Table 5.15). This, along with congestion in Kolkata port and the risk of depending on a single outlet, has made the Kakarvitta–Chittagong corridor important. But the quality of the transit regime in this corridor is poor and moving goods through it is very cumbersome. It is imperative that trade facilitation in both these corridors is improved. Unless the quality of transit regimes improve and institutions deliver services efficiently, the physical presence of corridors alone will not help Nepal’s or the region’s trade. Better trade facilitation in the Kakarvitta–Chittagong corridor will also benefit India and Bangladesh, giving the North Eastern states of India access to the sea ports of Bangladesh. Thus, smooth operation of this corridor will not only enhance Nepal’s transit trade, but also trade between Nepal and Bangladesh, and between India and Bangladesh. Trade-related economic activities will spur growth in the corridor. As the Greater Mekong Subregion (GMS) shows, improvement in the transportation infrastructure boosts economic activities in all the connected countries, leading to a reduction of poverty (Stone et al. 2010).
Nepal’s trade with Bangladesh is now negligible. It accounts for only 1.4% of Nepal’s total trade and 1.5% of Bangladesh’s total trade. Improving road connectivity through this corridor and augmenting trade facilitation will enhance bilateral trade between these two countries. But it has to be noted that Nepal’s disappointing trade performance has also been because of domestic factors such as political unrest,

Transit and Trade Facilitation across Economic Corridors Connecting Bangladesh, India, and Nepal
133
bureaucratic hassles, weak infrastructure, and power shortage. Therefore, domestic reform is equally important for Nepal.
Table 5.15: Documents, Time, and Cost in Both Corridors 2010
Birgunj (Nepal)–Kolkata (India) Corridor
Kakarvitta (Nepal)–Chittagong/Mongla (Bangladesh) Corridor
Export Import Export Import
Number of documents 16 17 21 22
Time 27 hrs 15 min 36 hrs 45 min 25 hrs 36 hrs
Cost in $ 698 544 320 508
Source: Raihan, Selim. 2010. Primary Survey on Trade Facilitation at the Firm Level in Bangladesh and Nepal.
5.2 RecommendationsWe find that most of the problems are common to both corridors. The following measures could address them and sort out the issues related to enhancing the flow of cargo in these corridors.
(i) Infrastructure Development. Adequate infrastructure should be developed at all the customs checkpoints in both corridors. Priority has to be accorded to customs yards, warehouses, cold storages, lifting equipment, X-ray machines, and similar facilities. A regular power supply system should be established in Birgunj, Raxaul, and Kakarvitta. Roads have to be improved and expanded in both corridors.
(ii) Establishment of Enquiry Counters. For timely dissemination of information regarding rules, regulations and directives, enquiry counters should be established at each of the customs checkpoints in both corridors.
(iii) Dispute Settlement. In practice, the existing mechanism for appeals is costly and time consuming. There must be an administrative tribunal that works promptly, and is accessible to general traders at each customs checkpoint in both the corridors.
(iv) Cost. Costs like informal costs and custom facilitation costs should be reduced. The informal cost in the Birgunj–Kolkata corridor is higher than in the Kakarvitta–Chittagong corridor. A competitive environment should be created to lower loading and unloading charges, and to keep the transportation cost reasonable. This will reduce the freight cost.
(v) Transit Procedures. The large number of procedural steps to be followed for the clearance of cargo for import and export in both corridors has resulted in increasing time and costs. There is room for cutting down the number of steps with simplified transit clearance procedures.
(vi) Time. The total time required to exit a customs checkpoint is more than double that taken to clear cargo, though it varies from place to place. Congestion and

Developing Economic Corridors in South Asia
134
having to collect documents from different places adds to the total time. If various services are made available through a single window, the total time expended can be reduced.
(vii) Capacity Building. Facilitating transit trade in these corridors requires stakeholders to be aware of developments in legal and procedural matters in each country. To address this, customs personnel and freight forwarders should be provided integrated training to make them more efficient and skilled.
(viii) Pruning and Publicizing Sensitive List. The sensitive list of each country should be shortened further and changes must be made publicly known to enhance predictability and transparency in trade transactions.
(ix) Regional Transit Arrangement. A regional transit arrangement is needed to harmonize rules, regulations, and procedures for goods and vehicles across trading and transit countries.
(x) Transit-related Agreement. For enhancing trade flow in the Kakarvitta–Chittagong corridor, a tripartite transit treaty, and movement of vehicle agreement should be concluded. Transshipment in Banglabandha and Phulbari should be eliminated, the escorting of convoys has to be reviewed, and the customs checkpoint in Phulbari should function efficiently. India’s role is central to all these improvements.
(xi) Integrated Customs. Nepal and India have agreed to establish integrated customs on four trade routes between the two countries, and this could reduce the time and cost of trade. It could also strengthen customs-to-customs relations, and help the transfer of technology between the two countries. Further, a harmonized approach to customs administration could evolve, which may be the basis for creating authorized economic operators to secure and facilitate regional trade. Such integrated customs should be extended to other trade routes between Nepal and India, as well as India and Bangladesh.
(xii) Partnership with Private Sector. To improve trade facilitation, trade associations are consulted by the governments in all three countries. Yet there are some problems at the levels of firms (for example, custom agents) and associations. Service delivery can be improved at these levels with public-private partnerships. Regional trade associations like the SAARC Chambers of Commerce could contribute to improving cooperation between the private sector and trade regulators.
(xiii) Rail Corridors. Rail transportation is generally cheaper. As the stakeholders rightly emphasized, studies on trade facilitation along rail corridors have to be undertaken.
(xiv) Use of Inland Container Depots. ICDs in Nepal have better infrastructure facilities compared to customs checkpoints, but they are less used. The reasons for this have to be identified and these inland container depot (ICDs) made more effective.

Transit and Trade Facilitation across Economic Corridors Connecting Bangladesh, India, and Nepal
135
(xv) Standardization of Documents. As trade along these corridors is governed by bilateral agreements, the documents required are specified by these agreements. Time and cost can be reduced if these documents are standardized according to international norms, while doing away with redundant ones.

Developing Economic Corridors in South Asia
136
References
Acharya, M. et al. 2003. Structural Adjustment Policies and Poverty Eradication. Kathmandu: Institute for Integrated Development Studies.
ADB. 2006. Regional Cooperation and Integration Strategy. Manila.
ADB. 2009a. CAREC Transport and Trade Facilitation: Partnership for Prosperity. Manila.
ADB. 2009b. Transport and Trade Facilitation in Greater Mekong Sub Region: Time to Shift Gear. Manila.
ADB–ADBI. 2009. Infrastructure for Seamless Asia. Manila: ADB. Tokyo: Asian Development Bank Institute.
ADB/UNESCAP. 2009. Designing and Implementing Trade Facilitation in Asia and the Pacific. Manila: ADB. Bangkok: United Nations Economic and Social Commission for Asia and the Pacific.
Adhikari, R. 2009. Intra-Regional Free Trade Agreements: Implementation for Regional Trade Integration in South Asia. Kathmandu: South Asia Watch on Trade, Economics and Environment.
Arvis, Jean-François et al. 2007. Connecting to Compete: Trade Logistics in the Global Economy. Washington, DC: World Bank.
Bajracharya, P. R. et al. 2004. A Study on the Preparation of Long-Term Export Promotion Plan and Strategies. Working Paper Series No. 79. Kathmandu: Research and Study Centre Pvt. Ltd.
CUTS. 2007. Strengthening the Linkages between Trade, Development and Poverty Reduction. Jaipur: CUTS Centre for International Trade, Economics & Environment.
De, Prabir. 2009. Regional Cooperation and Regional Infrastructure Development: Challenges and Policy Options for South Asia? Discussion Paper No. 160. New Delhi: Research and Information System for Developing Countries.
Dollar, D. and A. Kraay. 2001. Trade, Growth and Poverty. Washington, DC: World Bank.
Duval, Yann. 2007. Trade Facilitation beyond the Doha Round of Negotiations. Working Papers 5007. Bangkok: Asia-Pacific Research and Training Network on Trade (ARTNeT).
Duval,Yann. 2006. Cost and Benefits of Implementing Trade Facilitation Measures under Negotiations at the WTO: an Exploratory Survey, Working Papers 306. Bangkok: Asia-Pacific Research and Training Network on Trade (ARTNeT).
Edmonds, C. and M. Fujimura. 2008. Road Infrastructure and Regional Economic Integration: Evidence from the Mekong. In D. H. Brooks and J. Menon, ed. Infrastructure and Trade in Asia. Cheltenham: Edward Elgar.

Economic Corridors in South Asia: Exploring the Benefits of Market Access and Trade Facilitation
137
Engman, M. 2009. The Economic Impact of Trade Facilitation. In Overcoming Border Bottlenecks: The Costs and Benefits of Trade Facilitation. Paris: Organisation for Economic Co-operation and Development.
Francois, J. and M. Miriani. 2006. Institutional Quality, Infrastructure and the Propensity to Export. Milan: Tinbergen Institute and Centro Studi Luca D’ Agliano.
Government of Nepal, Ministry of Finance. 2010. Economic Survey. Vol. II. Kathmandu.
IFC/WB. 2010. Doing Business 2010. Washington, DC: World Bank/International Finance Corporation.
IFC/WB. 2009. Doing Business 2009. Washington, DC: World Bank/International Finance Corporation.
IFC/WB. 2008. Doing Business 2008. Washington, DC: World Bank/International Finance Corporation.
IFC/WB. 2007. Doing Business 2007. Washington, DC: World Bank/International Finance Corporation.
Kharel, P. 2009. South Asian Transit Arrangement. Kathmandu: South Asia Watch on Trade, Economics and Environment.
Kuroda, Haruhiko., Masahiro Kawai and Rita Nangia. 2007. Infrastructure and Regional Cooperation. In F. Bourguignon and B. Pleskovic, ed. Rethinking Infrastructure for Development. Washington, DC: World Bank.
Lakshmanam, T. R., Uma Subramanian and William P. Anderson. 2001. Integration of Transport and Trade Facilitation: Selected Regional Case Studies. Washington, DC: World Bank.
MOCS 2004. Nepal: Trade and Competitiveness Study. Kathmandu: Government of Nepal. Ministry of Commerce and Supplies.
Nepal, V. N. 2006. Policy Reorientation Study on Transit Trade of Nepal. Policy Paper 20. Kathmandu: Economic Policy Network.
Ojha, P. 2006. Nepalese Experience in Liberalization of Trade Logistic Services. Paper presented at the UNDP/ESCAP ARTNeT Consultative Meeting on Trade Facilitation and Regional Integration. 17-18 Aug. Bangkok. www.unescap.org/tid/artnet/mtg/tfrs_s3ojha.
Rajkarnikar, P. R. et al. 2006. The Need for and Cost of Select Trade Facilities Measures Related to the WTO Trade Facilitation Negotiation: A Case Study of Nepal. Working Paper Series, No. 8. ARTNeT, Bangkok: United Nations Economic and Social Commission for Asia and the Pacific.
Rajkarnikar, P. R. 2008. Implementation of the WTO Custom Valuation Agreement in Nepal: An Ex Ante Impact Assessment. In Trade Facilitation beyond the Multilateral Trade Negotiations: Regional Practices, Customs Valuation and other Emerging Issues. ARTNeT, Bangkok: United Nations Economic and Social Commission for Asia and the Pacific. pp. 195–220.

Developing Economic Corridors in South Asia
138
Rajkarnikar, P. R. et al. 2010. Adequacy and Effectiveness of Delivery of Logistic Services: Implication for Export Performance of Nepal. Working Paper Series, No. 79. ARTNeT. Bangkok: United Nations Economic and Social Commission for Asia and the Pacific.
RIS. 2008. South Asia Development and Cooperation Report. New Delhi: Research and Information System for Developing Countries.
SASEC. 2006: SAARC Regional Multimodal Transport Study. Kathmandu: SAARC Secretariat.
SACEPS. 2008. Assessing and Reformulating SAARC Road Map. Kathmandu: South Asia Centre for Policy Studies.
SAWATEE. 2008.World Trade Organization: An Introduction (in Nepali). Kathmandu: South Asia Watch on Trade, Economics and Environment.
Stone, Susan, Anna Strutt and Thomas Hertel. 2010. Assessing Socioeconomic Impacts of Transport Infrastructure Projects in the Greater Mekong Subregion. ADBI Working Papers 234. Tokyo: Asian Development Bank Institute.
TEPC. 2009–10. Nepal Overseas Trade Statistics, Trade and Export Promotion Centre. Kathmandu: Ministry of Commerce and Supplies, Government of Nepal.
UNESCAP. 2006. An Exploration of the Need for and Cost of Selected Trade Facilitation Measures in Asia and the Pacific in the Context of the WTO Negotiations. Bangkok: United Nations Economic and Social Commission for Asia and the Pacific.
UNESCAP. 2009. Asia-Pacific Trade and Investment Report: Trade-led Recovery and Beyond. Bangkok: United Nations Economic and Social Commission for Asia and the Pacific.
Venables, A. J. 2007. Comments on Infrastructure and Regional Cooperation by Haruinko Kuroda, Masahiro Kawai and Rita Nangia. In F. Bourguignon and B. Pleskovic, ed. Rethinking Infrastructure for Development. Washington, DC: World Bank. pp. 261–64.
Vickerman, R. 2002. Restructuring of Transportation Networks. In G. Atalik and M. M. Fischer, ed. Regional Development Reconsidered. Berlin: Springer. pp. 148–58.
Vitalis, Vangelis. 2003. The Development Impact of Developed World Policies on Developing Countries: The Case of Trade. Paper presented in GDN workshop, Cairo. 16–17 Jan.
Welling, M. and K. P. Kaphley. 1999. Import and Export Procedures: Promotion of the Trade and Transport Sectors of Nepal. Mimeo. Kathmandu: National Planning Commission.
World Bank. 2007. Connecting to Compete: Trade Logistics in the Global Economy. Washington, DC: International Bank of Reconstruction and Development and World Bank.
World Bank. 2010. Connecting to Compete: Trade Logistics in the Global Economy. Washington, DC: International Bank of Reconstruction and Development and World Bank.
139
Chapter 6
Transit and Trade Facilitation across South Asian Corridors:
India–Pakistan Land ConnectivityParamjit S. Sahai and Vijay Laxmi
I. IntroductionAn economic corridor as defined in this study is “a network industry and a pure public good,” which is a commodity that is “nonrival” as well as “nonexcludable.”1 Economic corridors are aimed at filling regional infrastructural gaps and promoting pro-poor socio-economic development, thus fostering regional economic integration. A typical economic corridor covers a well-defined space that usually straddles a central transport artery.
The SAARC Regional Multimodal Transport Study (SRMTS) has identified a number of regional transport corridors, including 10 road corridors. Among them, the following two road corridors connect India and Pakistan. (i) SAARC Road Corridor 1: Lahore–New Delhi–Kolkata–Petrapole/Benapole–
Dhaka–Akhaunra/Agartala (2,453 km). (ii) SAARC Road Corridor 7: Kathmandu–Nepalganj–New Delhi–Lahore–Karachi
(2,643 km).
This study looks at regional transit and trade facilitation issues across South Asian economic corridors, focusing on the Wagah–Attari land route, which connects Amritsar in India with Lahore in Pakistan. Two SAARC road corridors—No. 1 and No. 7—use this section to link India and Pakistan through Amritsar and Lahore. Historically, corridor No. 1 was the artery that linked Kolkata with Lahore through the famous Grand Trunk Road. After the partition of India, this corridor continued to occupy a strategic position and served as a trade and transit route between India and Pakistan till the India–Pakistan war in 1965. It was again opened for trade in 2005.
The Wagah–Attari border crossing worked very much like an economic corridor in the recent past. Even after the partition, the two countries, especially the two Punjabs, 1 Prabir De, Chapter 1.

Developing Economic Corridors in South Asia
140
had close economic links. Industries continued to operate even if they were in India, but owned by Pakistanis, or the other way round, and profits could be repatriated. However, this came to a halt after 1965.
How do we make the erstwhile economic corridor operational again, and further strengthen it? The process has begun with trade through the surface route, and the gradual adoption of trade facilitation measures. But this provides only the ground structure. The superstructure, by way of linking industries with trade, has to be the next step. Mindsets at the people-to-people level need to change, which could be a slow process and one that depends on the confidence-building measures implemented by both countries.
We focus both on physical infrastructure (hardware) and trade facilitation (software). To fully understand their role in regional transportation, it is important to look at government policies and trade flows through this surface route, both factors that are a barometer of its functioning. The analysis is based on a field survey and interaction with stakeholders who directly benefit from the Wagah–Attari surface route. They include government officials, customs and railway officials, representatives of trade and industry bodies, and those involved in border trade. This has been supplemented with the Chandigarh-based Centre for Research in Rural and Industrial Development’s (CRRID) experiences in promoting economic and commercial links and people-to-people contacts between the two countries through its Two Punjab Centre since 2005. Data were also collected from the relevant government departments and other studies. Secondary sources have been drawn on to serve as reference points to various ideas, suggestions, and recommendations.
2. Bilateral Trade Scenario There is no bilateral free trade agreement (FTA) between India and Pakistan, but India granted most favored nation (MFN) treatment to Pakistan in 1996. Pakistan had a positive list of 1,075 items for trade with India, but this was scrapped on 20 March 2012. Pakistan granted MFN status to India in 2012, and trade between the two countries is conducted on the basis of a negative list of items.2 Under the South Asian Free Trade Area (SAFTA) agreement, Pakistan has a negative list, but it is not applicable to India. For trade through the Wagah–Attari route, which is the only operational one now (the alternative Hussainwala–Fazilka route is closed), Pakistan has another list, which, at the time of the study, comprised 137 items. They include live animals and meat, agricultural products, oil cake and other solid residues, cement and clinker, cotton and cotton yarn of various specifications, cotton sheets of specified sizes, and paddy harvesters and dryers.
The land route is largely used for the export of fresh vegetables and other agricultural commodities to Pakistan. It is also used for importing cargo from Afghanistan. Under the
2 Until 2011, Pakistan allowed only a limited “Positive List” of 1,946 items to be imported from India. In November 2011, Pakistan decided to accord MFN status to India and in March 2012, it shifted to a “Negative List” approach which comprises items that are prohibited from being imported by Pakistan from India. Currently there are 1209 items on the negative list. All other items are permitted to be imported from India:
http://www.indiapakistantrade.org/policy/Trade%20Policy/Pakistan/Import%20policy%20order/IPO%202009-Amendment%20March%202012.pdf.

Transit and Trade Facilitation across South Asian Corridors: India–Pakistan Land Connectivity
141
Afghan–Pakistan Transit Trade Agreement (APTTA), signed in 2010, goods can come up to the Wagah–Attari border in trucks from Afghanistan. This should result in some cost reduction, but importers have so far not benefited. However, no such facilities are available for the export of Indian goods to Afghanistan. The rail line on this route is primarily used for imports, such as cement, rock salt, and dry dates, from Pakistan.
2.1 Trade through the Wagah–Attari BorderData collected from the customs at the Wagah–Attari border give us an indication of the volume of trade through it. Indian imports in 2009–10 from Pakistan were 34,382 tons (Table 6.1). This represented an increase of 51% over 2008–2009, while there was only a marginal increase in volume in 2008–09 from the previous year. However, there was no appreciable increase in duties during the period 2008–10. The main items of import through the Wagah border were dry apricots, raisins, fresh melons, grapes, and pomegranates.
Table 6.1: Imports from Pakistan through Attari–Wagah Border, 2007–10
Year No. of Bills of Entry
Volume(metric tons)
Value (Rs million) Duty Collected(Rs million)
2007–08 2,616 21,208 3,467.00 511.30
2008–09 2,719 22,775 4,211.90 530.80
2009–10 2,395 34,383 3,959.20 567.60
2010–11(Up to Aug. 2010)
435 2,750 462.10 79.00
Source: Wagah–Attari Border. Indian Customs. Central Board of Excise and Customs. Ministry of Finance. Government of India.
The volume of exports through the Wagah–Attari border was uneven from 2007 to 2010 (Table 6.2). There was a sudden spurt in 2008–09, an increase of around 169% over the previous year. However, it marginally declined in 2009–10, by around 10%. Despite the fall in volume, the value of exports was Rs 7980 million, around 83% higher than the previous year. This reflected a rise in prices of agricultural commodities, the main items exported to Pakistan. They included tomatoes, potatoes, onions, garlic, cotton, soybean meal, and halal meat.
Table 6.2: Exports to Pakistan through Wagah–Attari Border, 2007–10
Year No. of Bills of Export
Volume(metric tons)
Value (Rs million)
Duty Collected(Rs million)
2007–08 8,288 115,055 1,739.90 –
2008–09 14,498 309,087 4,353.40 –
2009–10 10,171 277,722 7,980.50 –
2010–11(Up to Aug. 2010)
3,050 190,681 3,716.70 17.4
Source: Wagah–Attari Border. Indian Customs. Central Board of Excise and Customs. Ministry of Finance. Government of India.

Developing Economic Corridors in South Asia
142
A commodity-wise breakup of items exported from October 2007 to October 2010 in terms of the movement of trucks reveals some interesting trends. Each truck, on an average, carries 20 tons of cargo, with tomatoes and onions having a major share in the trade basket.
As seen in Table 6.3, there was a mammoth increase in the movement of trucks of potatoes in 2008–09 from the previous year. But in the first half of the 2009–10, potatoes had to make an exit after Pakistan imposed an import duty and other taxes, which resulted in an increase of 40% in its landed price and made it uncompetitive in the local market. Afterwards, from second half of 2009–10 onwards, again the movement of potato trucks started.
Table 6.3: Exports to Pakistan in Trucks from Attari, 1 October 2007–31 October 2010
S. No.
Name of the Items Exported
No. of Trucks during Period
2007–08 2008–09 2009–10 2009–10 up to Oct 2009
2010–11 up to Oct 2010
1 Tomato 6,574 6,804 4,936 4,789 4,611
2 Soybean – – 2,391 – 8,061
3 Potato 27 4,435 56 – 209
4 Cotton – 983 3,836 1,288 585
5 Onion 225 4,537 4,376 4,310 2,038
6 Garlic – 12 243 53 105
7 Meat 123 61 65 51 35
8 Biscuit – 1,114 968 968 16
9 Chilly – – 73 – –
10 Pineapples – – 6 – –
11 Maize – – – – –
12 Stone – 115 – – 12
Total 6,949 18,061 16,950 11,459 15,672
Source: Wagah–Attari Border. Indian Customs. Central Board of Excise and Customs. Ministry of Finance. Government of India.
Indian imports through the Wagah–Attari border comprised two main items—dry fruits and fresh fruits (Table 6.4). There was a spurt in the import of dry fruits in 2008–09, an increase of 62% over the previous year.
The flow of trucks carrying fresh fruits was rather consistent over the period 2007–09. There was, however, an increase in the movement of trucks during April–December 2010, a rise of 20% over the corresponding period for the previous year.

Transit and Trade Facilitation across South Asian Corridors: India–Pakistan Land Connectivity
143
Table 6.4: Imports from Pakistan in Trucks from Wagah, 1 October 2007–31 October 2010
S. No.
Name of the Items Imported
No. of Trucks during Period
2007–08 2008–09 2009–10 2009–10 up to Oct 09
2010–11 up to Oct 10
1 Dry Fruits 902 1,460 1,329 578 620
2 Fresh Fruits 134 276 234 190 307
Total 1,036 1,736 1,563 768 927
Source: Wagah–Attari Border. Indian Customs. Central Board of Excise and Customs. Ministry of Finance. Government of India.
2.2 Trade through the Amritsar Railway Station Imports by rail spiked in 2008–09, with the volume at 605,847 tons, an increase of 114% over the previous year (Table 6.5).
Another increase of 19% was recorded the next year, 2009–10. However, there was no appreciable increase in duties in 2008–09, which may have been due to the commodity composition, their low value, and the customs duty rates.
Table 6.5: Volume of Imports by Rail, 2007–10
Year No. of Bills of Entry Filed
Volume(metric tons)
Value (Rs million)
Duty Realized (Rs million)
2007–08 5,304 283,675 2,077.00 450.702008–09 6,489 605,847 3,603.10 462.702009–10 7,773 719,843 4,178.90 841.102010–11(Up to Aug. 2010)
2,831 293,038 1,792.40 288.50
Source: Rail Cargo Amritsar. Indian Customs. Central Board of Excise and Customs. Ministry of Finance. Government of India.
In exports by rail, there was a decline during 2009–10, which at 200,636 tons was only half the 411,306 tons in 2008–09 (Table 6.6). This could be partially attributed to an increase in exports via road because trucks were allowed to cross the border to unload cargo in Pakistan from October 2007 onwards.
Table 6.6: Volume of Exports by Rail, 2007–10
Year No. of Shipping Bills
Volume (metric tons)
Value* (Rs million)
Cess(Rs million)
2007–08 6,171 375,425 8,593.00 –2008–09 5,293 411,306 8,922.30 –2009–10 4,880 200,636 6,403.60 –2010–11(Up to Aug. 2010)
2,238 35,366 2,085.60 –
Source: Rail Cargo Amritsar. Indian Customs. Central Board of Excise and Customs. Ministry of Finance. Government of India.

Developing Economic Corridors in South Asia
144
The main items of import by rail were dry dates, ordinary Portland cement, soda ash (light/dense), rock salt, plastic dinner sets, and crude drugs, while the principal exports were dyes, big cardamom, red chilies, crude drugs, vegetable seeds, automobile tires and tubes, and bicycle tires and tubes. Ordinary Portland Cement (OPC) is an imported item from Pakistan. It does not contain fly ash and is superior in quality and cheaper compared with the prevailing prices in India.
Commodity-wise data on imports and exports through the Amritsar railway station were obtained from the rail cargo customs office. During 2009–10, 514,718 tons of cement, 88,968 tons of dry dates, 37,831 tons of soda ash, and 27,864 tons of rock salt were imported into India (Table 6.7).
During 2010–11, in terms of cost, insurance, and freight (CIF) value, imports were worth Rs 3154.60 million, with dry dates and cement accounting for Rs 1876.90 million and Rs 856.90 million respectively. Customs duties had realized Rs 548.90 million until November 2010.
Table 6.7: Commodities Imported from Pakistan by Rail
S. No
Commodity Full Year 2009–10 Year 2010–11 Up to November 2010
Volume (metric tons)
CIF Value (Rs million)
Duty (Rs million)
Volume (metric tons)
CIF Value (Rs million)
Duty (Rs million)
1 Dry dates 88,968.00 1,756.50 360.70 59,648 1,876.90 356.60
2 Rock salt 27,864.00 55.00 – 18,873 37.10 –
3 Guggal 558.00 31.20 10.60 345 23.10 7.30
4 Crude drug 4,281.80 135.90 25.50 2,318 70.40 11.60
5 Soda ash 37,831.00 423.00 63.00 26,232 290.20 52.90
6 Cement 514,718.00 1,535.60 245.90 296,954 856.90 120.50
Total 674,320.80 3,937.70 705.70 404,370 3,154.60 548.90
Note: CIF = Cost, insurance, and freightSource: Rail Cargo Amritsar. Indian Customs. Central Board of Excise and Customs. Ministry of
Finance. Government of India.
Among exports from India, soybean meal emerged the largest item in terms of quantity and value in 2009–10, at 147,467 tons with an free on board (FOB) value of Rs 3330.00 million (Table 6.8). Automobile tires came second in terms of volume at 17,996 tons, followed by crude drugs, vegetable seeds, dyes, and printed books. The total FOB value of commodities during 2009–10 was Rs 4662.50 million.

Transit and Trade Facilitation across South Asian Corridors: India–Pakistan Land Connectivity
145
Table 6.8: Commodities Exported to Pakistan by Rail
S. No Commodity Full Year 2009–2010 Year 2010–2011 Up to November 2010
Volume (metric tons)
FOB Value(Rs million)
Volume (metric tons)
FOB Value (Rs million)
1 S.O Dyes 3,082 420.10 2,592 377.60
2 Veg. seeds 3,237 249.90 2,728 289.60
3 Soybean meal 147,467 3,330.90 8,965 197.00
4 Automobile tires 17,996 300.40 14,456 201.60
5 Printed books 2,227 226.80 648 151.20
6 Crude drugs 4,892 134.40 2,440 84.00
Total 178,901 4,662.50 31,829 1,301.00
Note: FOB = Free on-boardSource: Rail Cargo Amritsar. Indian Customs. Central Board of Excise and Customs. Ministry of
Finance. Government of India.
2.3 Volume of Traffic Handled by Road and Rail in 2009–10For transit by road, the data is available in terms of tons and the number of trucks, while for rail, it is only in terms of tonnage. Road transport has fewer impediments but only a limited numbers of items can be exported by road from India. In 2009–10, a total of 920,479 tons of cargo was moved by rail, while 312,104 tons went by road. For imports, rail was the preferred mode, while the road route is gaining significance for exports. Imports via road in 2009–10 were 277,722 tons, while exports were 34,382 tons. By rail, in 2009–10, 719,843 tons was imported, against exports of 200,636 tons.
During 2009–10, 16,950 trucks carrying export cargo were cleared. This was 6% lower than in 2008–09, which saw the highest figure of 18,061 trucks, an increase of 160% over the previous year. In 2009–10, only 1,563 trucks brought in imports, which was just 9.2% or a tenth of the volume of exports in that year. The combined movement of trucks was 18,513, which worked out to an average of 60 trucks crossing the border a day, assuming there were 300 working days in the year.
2.4 Features and Functioning of Road and Rail Customs CheckpointsSome of the salient features as observed by the authors during the visits spread over 20–30 mandays are as follows:
Road (i) There is easy access to the road customs checkpoints. (ii) Access is choked if there are more than 100 trucks awaiting clearance. This
problem more affects trucks with exports, as there are only a limited number coming in with imports.
(iii) On an average, it takes one to two hours to clear one truck. (iv) At the road customs checkpoint on the Indian side, there are two covered
warehouses with a capacity of 500 tons, one each for imports and exports. The

Developing Economic Corridors in South Asia
146
one for exports is not used as goods are directly taken in trucks for customs clearance.
(v) Laboratory facilities are available to inspect food and plant materials. (vi) Customs authorities at Wagah carry out a 5% check of outgoing trucks and a
100% check of incoming trucks, including empty ones. There is a well-laid-out drill for inspection. There is only one pit to carry out physical checks, which is inadequate.
(vii) All truck drivers are issued a single entry permit (SEP), which has data on the cargo exported/imported, and the personal particulars of the driver, and this obviates the need for a passport, visa, and international driving license.
(viii) The customs authorities are confident they can cope with an increase in the flow of trucks and feel up to 120 trucks can be cleared each day.
Rail (i) There are four warehouses with a capacity of 960 tons and some half-covered
sheds. Three of these are for imports and one for exports. They appear to be inadequate to meet requirements, especially in the rainy season.
(ii) On an average, it takes one to two hours to clear a railway wagon. (iii) Laboratory facilities exist at Rajasansi, Amritsar, for the inspection of food and
plant materials, and the process takes about one hour. (vi) A 100% check is carried out on all cargo. (v) The customs authorities feel that they can handle a 50% increase in the flow of
cargo.
The documents required for the clearance of import and export cargo are more or less similar, and in line with the standard international practice. The documents required for customs clearance do not seem to present a problem to traders, freight forwarders, and customs house agents. There is now a preference for the road route since trucks are allowed to cross over, and the railway incurs additional freight. The road seems more efficient in terms of time, cost, speed, and better transportation linkages to final destinations.
Table 6.8.1: Documents for Clearance of Export and Import Cargo
Export Documents Import Documents
Shipping bill (Bill of Export) Bill of Entry
Invoice Transit certificate
Packing list Invoice
Export license, if required Country of origin
ARE (Application of Removal Excise-1) wherever required
TR (Treasury Receipt) 6 Chalan
Letter of Credit/Contract/Performa Import license wherever required
Source: Rail Cargo Amritsar. Indian Customs. Central Board of Excise and Customs. Ministry of Finance. Government of India.

Transit and Trade Facilitation across South Asian Corridors: India–Pakistan Land Connectivity
147
The border trade is in the hands of well-established groups that have a long association with it, and operates on the basis of trust between the customs officers, traders, and freight forwarders. A large number of the freight forwarders are based in Amritsar. Checks on the railway are more stringent, given past instances of smuggling drugs and currency. While scanners are used, there is no electronic interface at the customs checkpoints.
The flow of trade through the Wagah–Attari route is indirectly linked to the trade along other points of the border, which allows the duty-free barter of commodities. Barter trade on the Poonch–Rawalakote axis began on 21 October 2008 (Government of India 2010). This has resulted in trade being diverted from the Wagah–Attari route, according to trade representatives and freight forwarders in Amritsar. A sudden spurt in this trade has been reported in the press, with goods worth Rs 240 million transacted in the Srinagar–Muzafarbad sector, and worth Rs 100 million in the Poonch–Rawalakote sector in December 2010 (Bukhari 2010).
2.5 Trade through Wagah–Attari as a Component of India’s Trade with Pakistan
India’s total trade with Pakistan during 2009–10 was Rs 87650 million. Of this, exports were Rs 74610 million, while imports were Rs 13040 million (Table 6.9). The share of India–Pakistan trade in India’s total trade was a meager 0.4%. The export component was 0.88% of total exports, but the import component was a dismal 0.10% of total imports.
Table 6.9: India–Pakistan Bilateral Trade (Rs million)
Year Export Import Total Trade Trade Balance
2005–06 30,514 7,249 38,464 22,564
2006–07 61,068 14,627 75,696 46,441
2007–08 78,273 11,587 89,860 66,686
2008–09 65,320 16,683 82,004 48,646
2009–10 74,610 13,046 87,656 61,564
Source: Department of Commerce. Ministry of Commerce and Industry. Government of India.
The total trade flow through the Amritsar railway station was Rs 8600 million during 2009–10. Of it, Rs 4660 million (FOB) was exports, while Rs 3940 million (CIF) was imports. This was close to 10% of the total official trade. In 2008, the share of trade by rail was only 8%, and this has gradually increased. The share of these imports and exports in total India-Pakistan trade stood at 30% and 6.25%, respectively.
Trade through the Wagah–Attari road border has shown a real increase, both in terms of volume and value. Total bilateral trade by road in 2009–10 was Rs 1,1930 million, which was 14% of the total India–Pakistan trade. In 2008, it was a mere 2% of the total trade. Exports at Rs 7980 million (FOB) accounted for 10.7% of the total exports to Pakistan, and imports at Rs 3950 million (CIF) were 30% of India’s total imports from the neighbor.

Developing Economic Corridors in South Asia
148
3. Results of Survey Findings from StakeholdersStakeholders, including 15–20 exporters–importers, 7–8 freight forwarders/clearing agents, 10–11 trade associations and 7–8 from custom officials of road and rail, answered a questionnaire and meetings were held with some of the leading persons and associations involved in India–Pakistan trade.3 The views commonly held by stakeholders have been summarized and their perceptions are discussed.
(i) Trade Facilitation at Customs Checkpoints. Facilities at the road checkpoints were adequate, though there was occasional congestion because of the excessive flow of trucks. The customs authorities seemed to devise satisfactory ways of coping with the traffic. But the lack of full scanners and electronic data interchange added to delays in clearance. The limited working hours, only six hours a day (9 am to 3 pm), were a major constraint. An integrated check post (ICP) was opened at Attari in April 2012, and this should help in dealing with the expected increase in traffic.
Railway facilities for cargo clearance were considered inadequate for a number of reasons. Among them were an inadequate number of wagons, uncertainty about their availability, poor infrastructure at the railway station, the bargaining power of the unionized laborers, and their availability till only 7 pm. An additional freight cost is involved for the Amritsar–Attari sector, which is becoming a disincentive for shipment of goods by rail.
(ii) Trade Flows. Pakistan decided on the items to be traded on this route by road and rail. Exports are dominated by agricultural commodities, while construction material is a large part of imports. At the Indian end, Punjab is not the only point of origin or consumption, as the goods come from and go to a number of other states, domestic compulsions dictating the flow.
(iii) Investments. There are barriers to investment, and government decisions could be taken on a case-to-case basis. Indian investors were reluctant to invest in Pakistan, given uncertain political conditions there. Pakistanis found India’s security concerns a hindrance. A recent visit by a Pakistani brewer to Amritsar met with a lukewarm response, though a Tata proposal to supply eco-friendly buses is said to be in the works. A proposal from Amritsar for contract farming potatoes in India for Pepsi Foods in Pakistan did not materialize because of tariff uncertainties. Such uncertainties act as a constraint to adopting long-term economic strategies, which in turn prevent Wagah–Attari from developing into a full-fledged economic corridor.
(iv) Impact of Barter Trade. There was overall concern that barter trade was hurting normal trade through the Wagah–Attari border. Concern was expressed that the commodity basket included not only items produced in India (red chilies, cardamom, onions) or Pakistan (pulses, dates), but also from Afghanistan (dry fruits) and the US (almonds). The duty-free nature of barter trade permits absorbing high freight costs. Another concern related to hawala (informal money transfer) transactions, which results in loss of revenue and channeling of illegal funds to undesirable activities.
3 The questionnaire is available on request.

Transit and Trade Facilitation across South Asian Corridors: India–Pakistan Land Connectivity
149
(v) Time and Cost. According to freight forwarders, the road route is 20% and 30% cheaper than shipping goods by rail and sea, respectively. Further, direct trade through the surface route enhances quality and revenue, while saving cost and time. A Federation of Indian Chambers of Commerce and Industry (FICCI) survey has tabulated the cost saved by Pakistan if selected items are imported from India (Table 6.10).
Table 6.10: Reduction in Cost for Pakistan if Selected Items are Imported from India
Sector Pakistan’s Cost Reduction if Item is Imported from India (in %)
Steel 55
Transport equipment 26
Engineering 15
Bicycles 20
Pharmaceuticals 35
Fruits and vegetables 40
Sugar 30
Source: FICCI. 2010. Status Paper on India–Pakistan Economic Relations. New Delhi: Federation of Indian Chambers of Commerce and Industry
(vi) Integration with Hinterland. Integration of the Wagah–Attari trade with the rest of India through rail and road is absolutely essential for the seamless flow of goods. A multimodal transport system connecting Amritsar with the rest of India is lacking. There is dedicated freight linkage only up to Ludhiana, which adds to costs, delays, and breakage. Inadequacy of warehousing facilities is another problem.
(vii) Bottlenecks. The foremost hurdle is the difficulty in obtaining visas, so much so traders cannot cross the border for discussions to resolve trade disputes. Even the visa is granted sparingly South Asian Association for Regional Co-operation (SAARC). Communication links are inadequate, which not only adds to uncertainty, but also costs because the rates are prohibitive. Uncertainty over the tariff structure, which responds to domestic compulsions, results in wiping out trade, as happened in the case of potatoes when Pakistan suddenly imposed a customs duty and other taxes. A reduction of the import duty on onions to zero facilitated imports to India from Pakistan during December 2010–January 2011. The import of cement from Pakistan is also troubled by uncertain tariff rates. Licensing procedures and standardization regulations are wanting (Table 6.11).
(viii) Recommendations. A number of pertinent suggestions were made, which could be considered by the authorities. Some of these were, however, specific to Amritsar. Trade facilitation measures that have been implemented are indicated in Tables 6.12, while Table 6.13 presents the trade facilitation measures.
Cross-border trade facilitation measures include:• Goods should be allowed to be transported in railway wagons up to the Attari
border.

Developing Economic Corridors in South Asia
150
• The Patti–Makhu railway link has to be established, as this will shorten the distance between Punjab and Maharashtra.
• A pragmatic approach has to be adopted to trade across the Line of Control.• A dedicated freight line must link Ludhiana to Amritsar.• Trade in more items should be allowed by road.• The railway has to ensure timely clearance of goods.Measures to support domestic business include:• The government should consider providing loans at a subsidized interest rate of
3%-4%.• A special income tax rebate should be given to residents of Amritsar, it being a
border town.• Traders should be provided electricity from the central pool.
Table 6.11: Constraints to Trade Facilitation
Issue to be addressed Existing situation
Trucks with up to 10 axles are allowed No containers permitted
Inadequate banking facilities Punjab National Bank is the only designated bank for collection of customs duty
No dedicated freight corridor A freight corridor exists only up to Ludhiana
Limited facilities for trade dispute settlement No visa facilities to go for a meeting across the border
Unreliability of service Insufficient number and poor quality of rail wagons
Unsatisfactory and costly commercial links Poor communication facilities
Railway drivers needs visas Delays disrupted rail cargo for a week in Dec 2010–Jan 2011
No electronic data interface Customs harmonization
Labor issues Organized labor with limited working hours
Working hours at Wagah Only six hours a day, leading in congestion
Table 6.12: Trade Facilitation Measures Implemented
Measures Status
Trucks allowed to discharge goods across the border to the other country
Since 1 October 2007
Single Entry Permit (SEP) given to truck drivers To serve as a passport, visa and driving license
A single form in triplicate To facilitate customs clearance, exit and re-entry
Sanitary and phytosanitary system (SPS) Electronic filling began on 1 January 2011
Entry of 10 trucks simultaneously for customs check
From September 2010. Earlier, only three trucks were permitted to enter the custom area.
Warehousing facilities Two warehouses each for import and export
Joint customs coordination mechanism Machinery for resolution of day-to-day issues between India and Pakistani traders
(Contd.)

Transit and Trade Facilitation across South Asian Corridors: India–Pakistan Land Connectivity
151
Measures Status
Introduction of Risk Management System 5% checks on exports
Dual road carriage – Jalandhar, Amritsar, Amrit-sar bypass to Attari
Near completion
Table 6.13: Trade Facilitation Measures
Separate gate for commercial traffic
Setting up an ICP at a cost of Rs 1,500 million
Electronic Data Interface
One point administrative hub at ICP
Warehousing facilities
Parking space
Setting up of a International Land Authority of India
Full body scanner
4. Pakistani Perspective In this part, we present a Pakistani perspective with information from various sources, including the Farmers’ Association of Pakistan (FAP).4 The points primarily relate to barriers to trade and trade facilitation measures.
(i) Pakistan’s adverse trade balance is seen as the outcome of nontariff barriers (NTBs) that operate in India in a rather opaque manner.
(ii) Subsidies in India’s agriculture sector result in Pakistan’s agricultural products becoming noncompetitive.
(iii) Uncertainty over India’s trade policies affects trade flows and economic integration, such as the sudden disruption of cotton exports from India, which affected Pakistan’s textile industry, a major export earner.
(iv) Cumbersome procedures on standardization, which lead to delays and cost. The export of cement from Pakistan is affected by delays in certification that it conforms to Indian Bureau of Standards (BIS) specifications.
(v) The existence of only one gate at the Wagah–Attari border for the movement of goods and persons. Further, the time for border clearance is inadequate, given that working hours are so short.
(vi) A good solution would be to opening a separate customs gate for trade, with
4 It also summarizes the comments of Kamal Mannoo, a businessman and associate of Centre for Research in Rural and Industrial Development (CRRID), as well as the views of the Pakistani Chamber of Commerce and Industry at the FICCI conference in November 2010, and those of other Pakistani stakeholders from commerce and industry, and academics. Based on interviews with stakeholders.
Table 6.12: (Contd.)
Developing Economic Corridors in South Asia
152
extended timings to facilitate the speedy clearance of goods. There should also be an agreement on the time trucks can spend in each other’s territory.
(vii) Visas have been a major hurdle to establishing commercial links. This relates not only to uncertainty and delay, but also the restricted terms of stay, using the same point for entry and exit, and the need for police registration.
(viii) Uncertainty over getting visas for promotional activities such as trade exhibitions. This was pointed out by participants at the Punjab International Trade Expo (PITEX) 2010 held in Amritsar on 8–12 December 2010. Visas were refused to a large number of participants and members of the Pakistan trade delegation.
(ix) Even obtaining a SAARC visa has become difficult. (x) The scanning system is far more efficient in Pakistan than in India, if gauged in
terms of performance. (xi) India’s slow response to a World Bank-backed initiative on warehousing facilities.
Facilities on the Pakistani side are nearing completion, while they are at an initial stage on the Indian side.
(xii) A good way to make meaningful progress would be to form a competent and autonomous joint team, comprising professionals from the public and private sectors, which could act to remove irritants and tap existing opportunities.
(xiii) The CRRID and FAP could work jointly to eliminate bottlenecks at the Wagah–Attari border. After streamlining it, the possibility of opening other routes, such as Monabao/Khokrapar, could be explored.
(xiv) The CRRID and FAP could recommend that visas be issued for visits by farmers and representatives of farm-associated industries.
The FAP made a number of other suggestions, primarily to do with agriculture and agriculture-related activities. These included establishing an information pool, exchange programs for students and farmers, and learning from each other’s experiences in technology and extension services. It, however, expressed concerns over agriculture subsidies in India. A key suggestion was setting up of a joint committee in the agriculture sector, with the CRRID and FAP as nodal agencies.
5. Major ConstraintsPakistan, which allows the import of only 110 items, holds the key to the movement of goods on the Wagah–Attari route. Though it has been showing greater flexibility recently to match its domestic compulsions, Pakistan alone decides which commodities can move, and which mode of transport can be used. So far, the trade has been in essential commodities, such as agricultural products and construction material. These commodities, which are of direct use to consumers and affect their personal budgets, have resulted in the building of a peace constituency in both countries.
The Wagah–Attari route cannot be used for transit of exports from India to Afghanistan, though Afghan goods are now given transit facilities for export to India. The customs clearance procedures at the border checkpoint are well known to traders and do not present special problems. The limited facilities were criticized by Pakistani traders, though there were no such complaints from Indians.

Transit and Trade Facilitation across South Asian Corridors: India–Pakistan Land Connectivity
153
The single gate for entry and exit of passengers and goods, and the limited working hours each day are major constraints. For rail cargo, problems exist in the form of insufficient rolling stock and warehousing facilities. Train drivers have visa problems because they do not have a single entry permit like truck drivers. The cumbersome visa procedure is a constraint to businessmen as well. The Indian government has expressed willingness to revisit the Visa Agreement of 1974, which provides for a three-month, single-entry visa for business people. At the trade level, cooperation among chambers of commerce and industry at the regional, national, and state levels seems adequate. The cooperation so far has been limited to trade and it has not moved to the next stage of investments in industrial projects because of security concerns in India, and political uncertainties in Pakistan.
While these political factors remain, adopting the following steps, not necessarily in the same order, could give a push towards an economic corridor. (i) Providing for more business-to-business connections through liberalizing visa
policies. The review of the 1974 Visa Agreement should take place sooner rather than later. The apex chambers in both countries could be designated as nodal points for vetting business visa applicants.
(ii) The issue of trade commodities on the sensitive list has to be addressed. If both countries could think in broader economic terms, and refrain from periodically imposing import and export controls, economic linkages could be established in core areas, such as textiles, leather, wheat, and cement, on a long-term basis. Frequent disruption of supplies has an adverse economic impact, and leads to a trust deficit.
(iii) Going a step further, India–Pakistan could become partners in meeting requirements on a global basis. One area suggested by the Pakistanis at the FICCI conference on 24 November 2010 was pooling resources in the field of milk products, and this deserves serious consideration.
(iv) Simultaneously, logistics on the surface route needs to be continuously improved, keeping pace with the growth in trade flow. The opening of an inland container depot (ICD) would certainly help. The setting up of an International Land Port Development Authority would facilitate greater coordination among various administrative agencies. More customs checkpoints could be opened in the future to cope with increasing cargo.
(v) The railway infrastructure is the weak link in the chain and this has to be addressed. Electronic data interfaces are essential.
(vi) Amritsar has to be linked to the dedicated freight corridor, and a multimodal transport system has to be developed with adequate warehousing facilities.
(vii) A permanent exhibition could be set up at the Wagah–Attari border, which could become a meeting place for business people. This should supplement existing efforts like the PITEX, which is to be replicated in Rawalpindi.
6. The Way AheadAn assured supply of cotton to Pakistan may be a first step to convert the Wagah–Attari border into a practical economic corridor. Various studies make a good theoretical

Developing Economic Corridors in South Asia
154
case on the importance of economic corridors, and many valuable suggestions, often repeated, have been made on how to enhance intraregional connectivity. This includes improving physical facilities at land borders, standardizing, rationalizing, and harmonizing technical specifications, harmonizing customs regulations, simplifying testing procedures, liberalizing visas, and so on. Some of this has been implemented, while the rest could be implemented if we are able to unlock the door at the Wagah–Attari border. This would open up the gates at other border checkpoints that link the two countries, not only for trade, but also for transit to Afghanistan and Central Asia.
It is neither physical infrastructure nor trade facilitation measures that have stood in the way of India–Pakistan trade. It is primarily governmental policies in the form of a restricted trading list and limited transit facilities that have stood in the way of this trade route becoming an economic corridor. In addition, fluctuating import-export policies have destabilized the trade pattern, making the governments give way to domestic pressures.
To optimize use of the land route, there is a need to allow transit facilities for Indian goods to Afghanistan and Central Asia, and bring about greater stability in trade regimes, in particular in essential goods. To advance toward economic integration through investments, visa policies for business visitors have to be liberalized.
Finally, a multipronged effort is needed because we are not only addressing commercial issues, but also a trust deficit. Forward movement depends on the political capital both governments are prepared to invest in this process. We can adopt either a big-ticket approach, such as building peace pipelines like the Turkmenistan–Afghanistan–Pakistan–India (TAPI) gas pipeline or setting up joint power grids, or an incremental approach. We need to realize the two nations stand to gain in a big way if the Wagah–Attari corridor attains full potential—annual bilateral trade though it has been projected at $10 billion (The Tribune 2010a).

Transit and Trade Facilitation across South Asian Corridors: India–Pakistan Land Connectivity
155
References
After 60 Years, India-Pakistan Trade finds a Direct Link. September 2007. www.nerve.in/ news:25350093363.
Assam Tribune. 2009. Indo-Pak Bilateral Trade Picking up. 4 May.
Bagga, Neeraj. 2010. Trade Fair Concludes. The Tribune. 13 December.
Bassi, Aseem. 2010. Pak-grown Onions Make First Trip across Border. Hindustan Times. 19 December.
Bhukhari, Shujaat. 2010. Record Levels of Trade across Line of Control. The Hindu. 19 December.
Chhabra, Shruti, Setia. 2010. PITEX: Bamboo Greens Promotes New Products. Times of India. 12 December.
Das, Sandip. 2010. Ban on Onion Export to Tame Prices. Financial Express. 21 December.
Economic Times. 2010. Pak to Import Vegetables from India Duty-Free. 11 November.
Financial Express. 2010a. Indian Tomato Exports to Flood-Hit Pakistan Soar. 21 October.
Financial Express. 2010b. Pakistan to Allow More Imports from India. 16 November.
Financial Express. 2010c. More Time to Exhaust Cotton Export Limit. 21 December.
Government of India, Ministry of Home Affairs. 2010. Annual Report 2009–10. New Delhi.
Hindustan Times. 2010. Onion Hits Rs75/kg, Exports Banned. 21 December.
Indian Express. 2010a. Ethiopia Invites Farmers from Region. 13 December.
Indian Express. 2010b. Layers of Crises. 23 December.
Indian Express. 2010c.Tears for Onion Policies. 23 December.
India, Pakistan Trade through Wagah Border Picking Up. 23 December 2009. http://www. onepakistan.com/finance/news/pakistan-buisness-general-news/3965-India-Pakistan trade-through-Wagah-border-picking.html.
Khan, Mohsin, S. 2009. India–Pakistan Trade: A Roadmap for Enhancing Economic Relations. Policy Brief No. 15. Washington, DC: Peterson Institute of International Economics.
Khanna, Ruchika, M. 2010. Now Onions at a Price That’ll Make You Cry. The Tribune. 21 December.
Lodhi, Iftikhar, A. 2008. Pakistan’s New Trade Policy Initiatives: Implications for India and Pakistan. ISAS Brief No. 78, 31 July.
Malhotra, Pia. 2009. Enhancing Indo-Pak Trade Perspectives from India. IPCS Issue Brief 119. September.

Developing Economic Corridors in South Asia
156
Mehta, Pardeep, S. and Siddhartha Mitra. 2008. Indo-Pak Trade: Cutting the Gordian Knot. Economic Times. 6 August.
Modi, K, K. 2008. FICCI’s Agenda to Boost Indo-Pak Trade. Commodity Online. 5 July.
Pakistan Ready to Export 100,000 Tonnes Cement to India. 19 December 2007. http://www. paktribune.com/news/index.shtml?195688.
Pranab Calls for Increased India-Pakistan Trade. 18 May 2010. http://www.khabarexpress.com/news/Business/Pranab-calls-for-increased-India-Pakistan-trade/158475.htm
Roy, Vijay, C. 2010. GoI Should Allow Pakistan to Export More Items to India: Pak Chambers. Business Standard. 13 December.
Singh, I, P. 2010. Construction Cost to Go Up as Import of Pak Cement Falls. Times of India. 7 December.
Singh, Perneet. 2010. Cinema No Challenge to Theatre: Brar. Sunday Tribune. 19 December.
Taneja, Mahima. 2010. India-Pakistan Trade Relations. 15 June. www.theviewspaper. net/india-pakistan-trade-relations/.
The Hindu. 2010a. New Routes 2 Roots Programme Launched. 19 December.
The Hindu. 2010b. Special Indo-Pakistan Show Begins. 19 December.
The Tribune. 2010a. Indo-Pak Trade Potential at $10bn. 26 November.
The Tribune. 2010b. Punjab Trade Expo to Generate Rs200 Cr Biz. 9 December.
The Tribune. 2010c. Lahore Chamber of Commerce Members denied Visa for Trade Expo. 10 December.
Times of India. 2010. India-Pak IT CEOs Seek Increased Ties. 14 December.
Vegetable Exports to Pakistan via Wagah Border up by 300%. 8 December 2007. http://www.thaindian.com/newsportal/buisness/vegetable-exports-to-pakistan-via-wagah border-up-by-3 00-percent_1 008227.html.
World Trade Review. 2009. Pakistan and WTO. 9(14) pp. 16–31 July.

157
Chapter 7
Trade Facilitation through Economic Corridors in South Asia:
The Pakistan PerspectiveGhulam Samad and Vaqar Ahmed
1. IntroductionPakistan is reforming its public-sector enterprises dealing with nationwide connectivity, developing a National Trade Corridor (NTC), and opening up the transport and communication sectors to foreign direct investment (FDI). Linking Pakistan to Central Asia, and South Asia through road and rail networks is high on the government’s agenda. To facilitate connectivity, a $9-billion program has been initiated for the NTC, which is expected to be completed in the next few years, but may take longer due to fiscal constraints. This substantial networking is intended to facilitate connectivity with Pakistan’s neighboring countries, and better integrate the urban and rural economies, small and medium enterprises (SMEs), and urban wholesale, retail, and warehousing sectors with port cities.1
Of the $9 billion allocated for the NTC, $5 billion is to be spent on improving highways, and $1.5 billion on modernizing Pakistan Railways and extending its lines to the borders with Afghanistan and Iran. The rest is to be invested in improving ports and airports, and providing other facilities to improve bilateral trade. Trade zones are planned along motorways to reduce the cost of doing business, and making Pakistani products more competitive internationally. The current dismal performance of the transport sector costs the economy around 4% to 6% of gross domestic product (GDP) annually (Government of Pakistan 2007a). Improved external logistics would generate a saving in costs of nonfactor services estimated at $525 million annually (Government of Pakistan 2007a).
1 It is estimated that improving major highways, railways, and ports has the potential to increase the country’s trade by well over $100 billion in the next decade (Government of Pakistan 2010).

Developing Economic Corridors in South Asia
158
Pakistan is well below the average of many other countries when it comes to achieving a level of connectivity that can supplement economic growth in the long run (Figure 7.1). The country’s total overland trade demand is likely to touch 160 billion ton-km in 2012, while the NTC will increase the capacity to 204 billion ton-km (Government of Pakistan 2007a). Container dwell times at ports are now seven days—three times that in developed countries and East Asia. Road freight (which carries 95% of cargo) takes four to six days between ports and the north of the country—twice the time it would take in Europe and East Asia. Trucking rates for high value-added commodity traders are higher than in India and Brazil, and the same as the People’s Republic of China (PRC) (where the quality of service is better). Rail carries less than 5% of freight, and takes one to two days on the main line (Karachi–Lahore) and up to 16 days (Karachi–Quetta) to deliver upcountry. This is three times slower than in PRC and the US (Government of Pakistan 2007a). Therefore, improved national and regional connectivity would help Pakistan enhance trade and growth, and reduce poverty.
Figure 7.1: Connectivity–Growth Relation
Note: PPP = Purchasing Power Parity; PRC = People’s Republic of China.Source: World Bank. 2010. Connecting to Compete: Trade Logistics in The Global Economy.
Washington, DC: World Bank.
The SAARC Regional Multimodal Transport Study (SRMTS) has identified a number of transport corridors to promote regional trade, including three road corridors that connect Pakistan with India and Afghanistan.2 The first links India–Pakistan–Afghanistan, whereas the second and third link Pakistan with Afghanistan.
This chapter presents the Pakistan perspective on the need for improved trade facilitation and transit along SAARC economic corridors. It reviews the status of trade facilitation measures in Pakistan, particularly with respect to its trade with India and Afghanistan and the region, and identifies measures to foster regional 2 These corridors are Wagah–Lahore–Rawalpindi–Peshawar–Torkham; Quetta-D.I. Khan–Peshawar–
Torkham; and Karachi–Kalat–Quetta–Chaman.

Trade Facilitation through Economic Corridors in South Asia: The Pakistan Perspective
159
cooperation (Figure 7.2). It covers customs as well as other border institutions, and reviews transit formalities, dispute settlement, safeguards, information flow, and other important aspects of trade facilitation. To evaluate trade and transit facilitation along the SAARC economic corridors, it considers customs checkpoints in the transport corridors connecting Pakistan, Afghanistan, and India.
Figure 7.2: Processes in Trade Facilitation
Reduced transport cost
Trade facilitation Automation of custom posts/sea and dry ports
Reducing documentation
procedures
Electronic custom declaration form
Road network
Rail network
Source: Authors
This study uses both primary and secondary data. For primary data collection, a detailed questionnaire was sent to 600 firms and the chambers of commerce in Lahore, Islamabad, Peshawar, and Karachi.3 In-depth interviews were also conducted and focus group discussions held in Gujranwala, Gujarat, Wazirabad, Sialkot, and Sargodha.4 The data procured thus yielded 60% response rate from the traders, and 100% from the key informant interviews and focused group discussions.
2. State of Transport and Logistics InfrastructureThe Global Competitiveness Report 2010 of the World Economic Forum ranked Pakistan 101 out of 133 countries and its score was 3.58 out of 7. In terms of the quality of overall infrastructure (roads, railroads, ports, and air transport, available seat kilometers, electricity supply, and telephone lines), Pakistan scored 3.06 out of 7 and ranked 89.
In three components of goods market efficiency—prevalence of trade barriers, burden of customs procedures, and tariff barriers—Pakistan ranked 108, 88, and 105 respectively. In comparison, India’s rank in the three had improved to 79, 71, and 104 respectively (Table 7.1).3 The questionnaire will be made available on request.4 We would like to acknowledge the help of Majid Shabbir, Secretary General, Islamabad Chamber of
Commerce and Industries. The facilitation for the meeting with the Punjab cluster by GIFT University, Gujranwala, is gratefully acknowledged.

Developing Economic Corridors in South Asia
160
Table 7.1: Quality of Infrastructure, 2010 (Country Ranking)
Quality of Overall
Infrastructure
Quality of Roads
Quality of Rail Road
Infrastructure
Quality of Port Infrastructure
Quality of Air Transport
Infrastructure
Pakistan 87 65 51 73 76
Bangladesh 125 95 65 113 116
India 89 89 20 90 65
Sri Lanka 63 60 44 43 64
Nepal 130 126 109 119 107
Source: WEF. 2010. Global Competitiveness Report 2010–11. Geneva, Switzerland: World Economic Forum.
World Bank (2010) ranked the country 78 among 183 on the ease of trading across borders (Table 7.2). This considers procedural requirements, and the time and cost involved in exporting and importing cargo by sea. On an average, it takes 20 days to import a container to Pakistan and 22 days to export it. The average export cost is $660 per container, and the average import cost is $870. A Pakistani exporter spends an average of 11 days on paperwork; 3.5 days on inland transportation and handling; 3 days on customs clearance and technical control; and 4 days on ports and terminal handling. The time needed for imports had improved from 39 days in 2006 to 18 days in 2010.
Table 7.2: Trading Time and Procedures, 2010Trading Across
Borders (ranked)
Document to Exports (number)
Time to Export (days)
Cost to Export ($ per
container)
Docu-ments to Imports
(number)
Time to Import (days)
Cost to Import ($ per
container)Pakistan 78 9 22 611 8 18 680Bangladesh 107 6 25 970 8 29 1,375India 94 8 17 945 9 20 960Sri Lanka 65 8 21 715 6 20 745Nepal 161 9 41 1,764 10 35 1,825Bhutan 153 8 38 1,210 11 38 2,140
Source: World Bank. 2010. Doing Business in Pakistan 2010. Washington, DC: World Bank.
The United Nations’ e-Government Survey 2008 ranked Pakistan 136 out of 192 countries. Investment in information and communication technology (ICT), and training of public-sector employees is required for improvement in e-governance. The Connectivity Scorecard (2010) is a global index that ranks countries in terms of the use of ICT in different sectors. Pakistan achieved a score of 0.36 in government infrastructure (highest 0.85); 0.32 in consumer infrastructure (highest 0.93); and a low 0.02 (highest 0.72) in business infrastructure. This indicated very low investments in ICT, and a wide gap between Pakistan and the best-performing countries.
The World Bank’s Logistics Performance Index (LPI) is a benchmarking tool to identify the challenges and opportunities countries face in the performance of trade logistics. Pakistan ranked 110 out of 155 countries in 2010, and its LPI score was 2.53 (Figure 7.3). This score ranges from 1 to 5, with 1 being the worst. India’s LPI score was 3.12, followed by Bangladesh with 2.74.

Trade Facilitation through Economic Corridors in South Asia: The Pakistan Perspective
161
Figure 7.3: Logistics Performance Index, 2010
3.12
2.742.53 2.4
2.22.242.29
3.5
2.5
1.5
0.5
2
1
0
3
India Bangladesh Pakistan Maldives Sri Lanka Afghanistan Nepal
Source: World Bank. 2010. Logistics Performance Index (LPI). 2010. Trade Logistics and Facilitation. Washington, DC: World Bank. http://www.worldbank.org/INTLF/Resources/LPI2010_for_web.pdf
We now look at the state of Pakistan’s infrastructure, and the issues and challenges it faces. We also discuss the key details of some reforms that are envisaged to strengthen trade facilitation and connectivity. Regulatory changes are equally important because no trade facilitation regime is successful unless it is accompanied by a shift towards openness in general.
2.1 Road NetworkPakistan’s road density is 0.32 km per square kilometer, which is much lower than the regional level (Government of Pakistan 2010). Road density is an important indicator of the level of infrastructure development of a country. India has a road density of 1 km/km2 and Afghanistan 0.08 km/km2. In developed economies, Japan has highest road density of 3.07 km/km2, the UK has 1.62 km/km2, and the US has 0.65 km/km2.5 The total road network of 259,618 km includes 179,290 km of high-type roads and 80,328 km of low-type roads. But, as seen in Table 7.3, the percentage change in the length of roads is minimal and even turns negative. Almost 92% of passenger traffic and 96% of inland freight is carried by roads.
The national highway and motorway network comprises 3.65% of the total road network and it carries 80% of Pakistan’s total traffic. With a growing population and increasing business activities, road traffic has been growing significantly. The National Highway Authority (NHA) of Pakistan is responsible for the operation and maintenance of the road network. The toll from roads and highways provides the funds for operation and maintenance. The NHA and related government bodies are also involved in road construction and regulating this sector.
5 Date was provided by the National Highway Authority of Pakistan.

Developing Economic Corridors in South Asia
162
Table 7.3: Road Sector in Pakistan, 1997–2009
Year High Type Low Type Total
Length (km) % Change Length (km) % Change Length (km) % Change
1996–97 126,117 6.5 103,478 3.6 229,595 5.21997–98 133,462 5.8 107,423 3.8 240,885 4.91998–99 137,352 2.9 110,140 2.5 247,484 2.71999–00 138,200 0.6 105,320 0 240,340 0.32000–01 144,652 4.7 102,784 –4.4 249,972 0.72001–02 148,877 2.9 98,943 –2.4 251,661 0.72002–03 153,255 2.9 97,527 –3.7 252,168 0.22003–04 158,543 3.5 95,373 –1.4 256,070 1.52004–05 162,841 2.7 91,491 –2.2 258,214 0.82005–06 167,530 2.9 86,370 –4.1 259,021 0.32006–07 172,827 3.2 84,038 –2.8 259,197 1.12007–08 175,000 0.8 83,140 –5.5 259,038 –1.32008–09 177,060 1.3 80,328 –2.7 260,200 0
Source: Government of Pakistan, Ministry of Finance. 2010. Economic Survey of Pakistan 2009–2010. Islamabad.
2.2 Rail NetworkThe total route kilometer of Pakistan Railways is 7,791 km, and track kilometer is 8,952 km. With changes in government priorities and irregular budget provisions, the performance of the railway has suffered. Its share in inland traffic has declined from 41% to 10% for passengers, and from 73% to 4% for freight (Government of Pakistan 2010). The Pakistan railway situation deteriorated and the controlling bodies like Ministry of Railways was not able to handle this weakening situation and claimed that they do not have enough funds to survive—not even to pay pension and salaries. In such a situation all the freights shifted to Pakistan Logistic Cell. The National Logistics Cell, provides state-emergency level management services to the government. Among its other functions, it resolves logistic problems in transportation of important commodities. From 1997–2009, the average percentage change of passenger traffic was 2.45%, and the growth in freight was 1.58%. The July–March data for 2009–10 shows the percentage change for passenger traffic was –7.15%, and for freight, –13.2% (Table 7.4). The reasons may have been changes in consumer preferences, recession, and internal security conditions. Further, internal inefficiencies have resulted in a less-than-competitive environment that keeps fares high.
In the 1980s, the total rail length was 8,817 route-km, but this fell to 7,791 route-km in 2008. This total was what was available for train services, irrespective of the number of parallel tracks. The railways transported 6,187 million ton-km in 2008, a decline from 7,918 million ton-km in 1980.6Pakistan Railways has been keen to double its track but financing has been a major hurdle. The doubling of track from Lodhran to Khanewal via Multan (121 km) has been completed, and work on the Sahiwal to Raiwind (Lahore) section of the Khanewal–Raiwind route (246 km) is in progress. The following are proposed new rail links (Government of Pakistan 2009).6 http://www.tradingeconomics.com

Trade Facilitation through Economic Corridors in South Asia: The Pakistan Perspective
163
Table 7.4: Rail Sector in Pakistan
YearPassenger Traffic
(million passenger km)Freight
(million ton km)
Rail Annual % Change Rail Annual % Change
1996–97 19,114 1.10 4,607 –9.30
1997–98 18,774 –1.80 4,447 –3.50
1998–99 18,980 1.10 3,967 –10.80
1999–00 18,495 –2.60 3,753 –5.40
2000–01 19,590 5.90 4,520 20.40
2001–02 20,783 6.10 4,573 1.20
2002–03 22,306 7.30 4,830 5.40
2003–04 23,045 3.30 5,336 10.70
2004–05 24,238 5.20 5,532 3.60
2005–06 25,621 5.70 5,916 6.90
2006–07 26,446 3.20 5,453 –7.80
2007–08 24,731 –6.50 6,178 13.30
2008–09 25,702 3.95 5,896 –4.10
2009–10 (Jul–Mar)
18,270 –7.15 3,925 –13.20
Source: Government of Pakistan. Ministry of Finance. 2010. Economic Survey of Pakistan
2009–2010. Islamabad
(i) Gwadar link to existing network. A new port has been developed at Gwadar and its success is related to attracting traffic from the landlocked Central Asian republics, which now depend on Iran. The proposed project will connect Gwadar with the Quetta–Taftan line, which is tied to Iran through Zahidan. The link to Central Asia will be via Chaman–Kundhar–Hirat–Khushka.
There is another proposal to construct a railway line from Havelian through Khunjrab to PRC, which will be able to cater for Chinese imports and exports. However, this is expected to take a long time. These projects have been conceived to develop Gwadar port as a “mother hub,” which will promote cooperation between Pakistan, Iran, Central Asia, and PRC.
(ii) Rail link from Chaman to Spin Boldak. A rail link from Chaman (Pakistan) to Spin Boldak (Afghanistan) (11.5 km) was to have been constructed during 2004. Work, however, has not commenced since the Government of Afghanistan is yet to provide a no-objection certificate (NOC).
There is a long-term project to connect Chaman to Kandahar and then further to Kushka in Balkh Province of Afghanistan (Government of Pakistan 2009). However, its implementation depends on the security situation in Afghanistan, the availability

Developing Economic Corridors in South Asia
164
of finance, and the Government of Afghanistan’s concurrence. Table 7.5 provides the breakup of distances on the proposed railway line from Gwadar port to Kushka (now called Serhetabat) in Turkmenistan.
Table 7.5: Breakup of Distances between Gwadar and Kushka (Turkmenistan)
Countries Routes Existing Track (km)
New Track (km)
Total (km)
Pakistan Gwadar to Mastung (proposed route) 0 901 901
Mastung to Chaman 190 0 190
Chaman to Pak–Afghan border 0 1 15
AfghanistanPak–Afghan border to Kandahar 0 97 97
Kandahar to Herat 0 535 535
Herat to Afghan–Turkmenistan border 0 98 98
Turkmenistan Afghan–Turkmenistan border toKushka (border city to Turkmenistan)
0 12 12
Total 190 1,658 1,848
Source: Government of Pakistan. Ministry of Communication. 2010. National Highway Authority Year Book 2009–10. Islamabad.
The efficiency of the railway has to be improved if it is to compete with road transport and ports (LCG 2006). Despite a large network, the productivity of its freight services is only about one-eighth of the network of the People’s Republic of China and one-third of Indian Railways. It cross-subsidizes passenger services from freight services, resulting in noncompetitive freight rates compared to road transport. Alongside, continuous increases in fares to overcome losses, corruption in procurement, and other operational inefficiencies have made it an uneconomical mode of transport. Pakistan Railways has a very low and stagnant market share, carrying less than 10% of passenger traffic and 5% of freight.
As noted in Chapter 6, the major operational trading road route is through Attari/Wagah. India has notified several road routes which are not operational. These routes were notified by the Government of India under Section 7 of the Customs Act, vide Notification no. 63/94-Cus (NT), dated 21.11.1994.7
Currently there is only one operational rail route along the Amritsar–Attari–Lahore railway line through the Attari and Amritsar rail stations for movement of cargo between the two countries. The cargo moves either by the goods trains or by freight cars attached to the bi-weekly Samjhauta Express.8
2.3 Civil Aviation NetworkThe Civil Aviation Authority (CAA) manages airport services in Pakistan. The new airports being constructed include Benazir Bhutto International Airport in Islamabad
7 http://www.cbec.gov.in/customs/cs-act/notifications/csnt63-94.htm.8 http://indiarailinfo.com/train/atari-amritsar-samjhauta-express-14608-att-to-asr/15276 ; http://
indiarailinfo.com/train/amritsar-atari-samjhauta-express-14607-asr-to-att/15277

Trade Facilitation through Economic Corridors in South Asia: The Pakistan Perspective
165
and New Gwadar International Airport, while Multan International Airport is being upgraded, and Peshawar International Airport is being expanded. Karachi International Airport is the largest, and it had a total of 43,014 aircraft movements in 2008–09. Karachi also moved 145,052 million ton of cargo, followed by Lahore (75,965 million ton), and Islamabad (51,557 million ton).
Air freight recorded a maximum of 445.5 million ton-km in 1995, but declined to 340.1 million ton-km in 2000 (Figure 7.4). The reasons were the worsening security climate, high premium charged by insurance companies, the CAA’s inability to boost marketing, and regulations prohibiting the growth of private carriers. After 2000, air freight improved to 407.3 million ton-km in 2005, only to fall to 319.8 million ton-km in 2008.
Figure 7.4: Air Freight in Pakistan
500450400350300250200150100
500
1970 1975 1980 1985 1990 1995 2000 2005 2008
Mill
ion
ton-
km
Source: http://www.tradingeconomics.com
The aviation sector in Pakistan carried a total of 5,605,758 passengers in 2008 on both domestic and international aircraft registered in the country. Air transport registered 52,165 takeoffs (domestic and foreign) in 2008, whereas the highest recorded was 70,300 in 1993.
2.4 Ports and Shipping The Karachi Port Trust (KPT) makes a substantial contribution to the Pakistan economy. It handled 38.73 million ton of cargo in 2008–09, which was the highest in a decade (Table 7.6), with exports at 35% and imports at 65%.
Table 7.6: Cargo Handled at Karachi Port (’000 tons)
Years Imports % Change Exports % Change Total % Change
1996–97 18,362 –1.9 5,113 5.2 23,475 –0.4
1997–98 17,114 –6.8 5,570 8.9 22,684 –3.4
1998–99 18,318 7.0 5,735 3.0 24,053 6.0
1999–2000 17,149 –6.4 5,613 –2.1 22,762 –5.4
2000–01 20,064 17.0 5,918 5.4 25,982 14.1
(Contd.)

Developing Economic Corridors in South Asia
166
Years Imports % Change Exports % Change Total % Change
2001–02 20,330 1.3 6,362 7.5 26,692 2.7
2002–03 19,609 –3.5 6,273 –1.4 25,882 –3.0
2003–04 21,732 10.8 6,081 –3.1 27,813 7.5
2004–05 22,100 1.7 6,515 7.1 28,615 2.9
2005–06 25,573 15.7 6,697 2.8 32,270 12.8
2006–07 23,329 –8.8 7,517 12.2 30,846 –4.4
2007–08 25,517 9.4 11,676 55.3 37,193 20.6
2008–09 25,367 –0.6 13,365 14.5 38,732 4.1
2009–10 14,009 6,536 20,545
Source: Government of Pakistan. Ministry of Finance. 2010. Economic Survey of Pakistan 2009–2010. Islamabad
3. Trading Across BordersWorld Bank (2010) ranked 13 of Pakistan’s main industrial cities in terms of their potential for trade across borders (Figure 7.5). With KPT and Port Qasim, Karachi tops the list, followed by Hyderabad, and Sukkur. Despite Lahore bordering India, and Peshawar bordering Afghanistan, both cities ranked low. With Lahore, the main reason could be the number of days it takes to import or export a container, and the high cost compared to other cities.9 It takes 20 days to import a container, and 22 days to export one, the same as in Peshawar. But Peshawar is cheaper at $784 to import a container and $715 to export one. The Lahore rates are $1,088 to import and $791 to export.
Figure 7.5: Ranking Pakistani Cities in Terms of Trading Across Borders
Faisala
bad
Mult
an
Lahor
e
Islam
abad
Sheikh
upur
a
Gujran
wala
Sukku
r
Pesha
war
Karach
i
Rawalp
indi
Sialko
t
Quetta
Hydera
bad
0
2
4
6
8
10
12
14
45
13
11
7
3
8
1
5
2
10
12
9
Rank
of t
he ci
ties
Ran
k of
the
city
Source: World Bank. 2010. Doing Business in Pakistan 2010. Washington, DC: World Bank.9 However, the poor ranking of Lahore is not accepted by some academics, who believe it is better
positioned and has relatively better connectivity. Moreover, when the state of doing business in Pakistan was discussed outside the academia, traders and members of the Chamber of Commerce were also not in agreement and the methodology of Doing Business reports of the World Bank was criticized.
Table 7.6: (Contd.)

Trade Facilitation through Economic Corridors in South Asia: The Pakistan Perspective
167
Pakistan has shown a decline in export facilitation since 2006, with the number of documents required increasing from eight in 2006 to nine in 2010 (Table 7.7). The cost in terms of exports shows improvement, with the cost per container decreasing to $611 in 2010 from $966 in 2006. The time taken also decreased from 33 days in 2006 to 24 in 2009, and 22 in 2010. However, exporters still spend a considerable portion of their time on paperwork (Figure 7.6). The number of documents required for imports decreased from 12 in 2006 to eight in 2010 (Table 7.8). The cost per container increased from $317 in 2006 to $680 in 2010. The time taken decreased from 39 days in 2006 to 18 in 2010 (IFC/WB 2010). In sharp contrast, Singapore requires just four documents, five days, and $456 to complete all export requirements.
Importing a container in 2010 through Karachi port required eight documents, 18 days and $680. The rest of South Asia averaged nine documents, 32 days, and $1,509 (IFC/WB 2010).
Figure 7.6: Exporters Spent Most of Their Time on Paperwork
Faisala
bad
Mult
an
Lahor
e
Islam
abad
Sheikh
upur
a
Gujran
wala
Sukku
r
Averag
e
Pesha
war
Karach
i
Rawalp
indi
Sialko
t
Quetta
Hydera
bad
0
2
4
6
8
10
12
No.
of D
asys
Documents PreparationCustoms Clearance and Technical Controls
Inland Transportation and HandlingPorts and Terminal Handling
Documents preparationCustoms clearance and technical controls
Inland transportation and handlingPorts and terminal handling
No.
of d
ays
Source: World Bank. 2010. Doing Business in Pakistan 2010. Washington, DC: World Bank.
Table 7.7: Trading Across Borders in Pakistan: Exports
Exports 2010 2009 2006
Number of documents 9 9 8
Cost ($) 611 611 966
Time taken (days) 22 24 33
Source: World Bank. 2010. Doing Business in Pakistan 2010. Washington, DC: World Bank.
Table 7.8: Trading Across Borders in Pakistan: Imports
Imports 2010 2009 2006
Number of documents 8 8 12
Cost ($) 680 611 317
Time taken (days) 18 18 39
Source: World Bank. 2010. Doing Business in Pakistan 2010. Washington, DC: World Bank.

Developing Economic Corridors in South Asia
168
4. Logistics CostPakistan’s logistics costs are shown in detail in Table 7.9. In 2006, ocean freight cost Pakistan 1.86% of its foreign trade account. The ocean freight for imports was lower than that for exports due to the higher value of imported goods, and surplus empty containers in Europe.
For 10 shipments looked at by the Pakistan Logistics Cost Study in 2006, the average insurance cost was 0.47% of their final value, and amounted to $166.06 million. The domestic land transport cost was 1.57% of the final value, which was high compared to other regional economies. The study suggested that the inland transportation cost, port charges, ocean freight, freight forwarding cost, and financial cost be reduced. A significant change was the reduction in import customs duties—its value came down to 4.81% in 2006, compared to 45.29% in 1996 (LCG 2006).
Table 7.9: Pakistan Logistics Costs
Cost FactorShipment/Cases 1 to 10
Average Cost of Final Value %Shipment/Cases 1 to 10
2004–05Imports + Nonfactor Surcharge ($ million)
2004–05Exports + Nonfactor Surcharge ($ million)
Cost Factor Value and % Share in 2004–05 Foreign Trade
($ million) (%)
Ocean freightImportsExportsTotal
0.693.54
20.6214.41
141.68509.72651.40
0.693.541.86
Insurance 0.47 20.62 14.41 166.06 0.47
Port charges (includes storage and demurrage)
0.23 20.62 14.41 80.58 0.23
Freight forwarding (includes customs clearance and handling)
0.52 20.62 14.41 180.78 0.52
Customs duties and taxesImportsExportsTotal
4.810.22
20.6214.41
990.9431.851,022.78
4.810.222.92
Land transport (domestic) 1.57 20.62 14.41 550.38 1.57
Financial cost (inventory + immobilizations)
0.76 20.62 14.41 265.91 0.76
Total nonfactor services and duties (2004–05 foreign service) 2,917.89 8.33
Nonfactor services–transport and insurance 1,895.10 5.41
Duties and taxes 1,022.78 2.92
Source: LCG. 2006. Pakistan Logistic Cost Study 2006. Kastrup, Denmark: Logistics Consulting Group. http://www.nttfe.org/reports/logistics_costs_study_Pakistan_report_June_06.pdf.

Trade Facilitation through Economic Corridors in South Asia: The Pakistan Perspective
169
The potential savings mentioned by the 2006 study in the four categories of insurance, inland transport, freight forwarding, and financial cost were 1.34% of Pakistan’s foreign trade, and nonfactor services were equivalent to $469.5 million.
5. Pakistan Trade CorridorsThe Planning Commission of Pakistan has repeatedly advised reducing transport costs, enhancing affordability, establishing an efficient and well-integrated transport system, and ensuring safety to enhance regional connectivity. These measures would improve Pakistan’s competitiveness internationally, and increase its share of world trade by 0.2%, taking exports from $17 billion to between $250 and $300 billion by 2030 (Government of Pakistan 2007b).
The aim of the major initiatives taken to improve trade and transport is linking the major ports in the south and south-west with the main industrial centers, and also neighboring countries. The ports, roads, and railways, along with the NTC, could handle 95% of the external trade, and 65% of the total land freight (World Bank 2006).
The NTC map shows Pakistan’s transit routes and major trade corridors. The possible transit routes are PRC (north); Afghanistan (east), and energy-rich Central Asian countries such as Tajikistan, Kyrgyz Republic, Uzbekistan, Kazakhstan, and Turkmenistan; Iran (south), and access to Turkey and energy supplies from the Middle East; and India (east), and East Asia. The total land trade demand is 132 billion ton-km now and the projected National Trade Corridor (NTC) figure is 160 billion ton-km.
The following recommendations have been made by the NTC program. (i) Operationalization of the Economic Cooperation Organization (ECO) Transit
Trade Framework Agreement (ii) Implementation of the Pakistan–PRC–Kyrgyz Republic-Kazakhstan quadrilateral
transit agreement (iii) Construction of the Chaman–Spin Boldak–Kandahar–Kushka rail link (iv) Construction of a rail link between Havelian and Khunjrab to the Pakistan-PRC
border (v) Opening multiagency border stations at Jamrod, Chaman, Taftan, and Wagah
Four customs stations now operate along the Pakistan–Iran border. Three customs stations operate on the Pakistan–Afghanistan border for facilitating transit trade via Afghanistan to Central Asia.
5.1 Trade Between India and PakistanOfficial trade by road and rail takes place through the Wagah border crossing near Lahore. Exports by rail are transported by Pakistan Railways up to Amritsar in India. Similarly, Indian exports are carried up to Lahore by Indian Railways. Table 7.10 has details on potential trade routes between India and Pakistan. There is a need for both sides to cut down on delays on the rail, road, and sea routes.

Developing Economic Corridors in South Asia
170
Table 7.10: Pakistan–India Trade Routes
Route Mode Transportation Time (days)
Delay (days) Total Time (days)
Delhi–Attari Rail 1 12 13
Delhi–Attari Road–Rail 1 12 13
Mumbai–Karachi Sea 1.5 7 8.5
Mumbai–Dubai–Karachi Sea 6 7 13
Delhi–Mumbai–Karachi Rail–Sea 4 8 12
Delhi–Mumbai–Karachi Road–Sea 6 10 16
Source: Taneja, Nisha. 2006. India–Pakistan Trade. Working Paper No. 182. New Delhi: Indian Council for Research on International Economic Relations
The constraints on bilateral economic integration are many (Khan 2009). They include high tariff and nontariff barriers, inadequate infrastructure, bureaucratic inertia, excessive red tape, and political opposition. In addition, transportation linkages are poor, making trade costly, there are constraints on visas, and customs and payment procedures are cumbersome.
It is estimated that if all was well between Pakistan and India, trade would have been $591 million in 2000 compared to the recorded $117 million, which would have meant a peace dividend of $474 million. Moreover, a 79% higher dividend would have been possible if there was a preferential trade agreement between the two countries. In sum, Pakistan-India trade loses a combined potential annual gain of $683 million, and is counting other dynamic gains (Baroncelli 2007).
5.2 Trade between Afghanistan and Pakistan Pakistan’s trade balance with Afghanistan rose between 2001 and 2010. Figure 7.7 indicates that exports to Afghanistan totaled $1.4 billion in 2009, which was a substantial increase from $140 million in 2001. Afghanistan’s exports to Pakistan also increased during the same time period. In 2001, Pakistan’s imports from Afghanistan were $30 million, which rose to $101 million in 2010 (July–March data). Pakistan provides Afghanistan with a ready market for harnessing its comparative advantage. For Pakistan, the reconstruction opportunities in Afghanistan provide immense potential, and export of services across the border has also been on the increase.
Afghanistan’s transit trade through Pakistan for exports through Wagah, Karachi, and Port Qasim has been rising. The Wagah route for Afghanistan’s exports to India opened in 1980. Afghanistan’s imports come through Karachi and Port Qasim. In 2009, the value of Afghan exports through Pakistan was $40 million. Transit imports through Pakistan increased from $366 million in 2005 to $1 billion in 2009 (Figure 7.8). This increase was largely because of the rebuilding in Afghanistan.

Trade Facilitation through Economic Corridors in South Asia: The Pakistan Perspective
171
Figure 7.8: Afghanistan’s Transit Trade Through Pakistan
US
$ M
illio
n
1200
1000
2005 2006 2007 2008 2009 2010
800
600
400
200
0
Exports
Imports
US
$ m
illio
n
Source: Government of Pakistan, Ministry of Finance. 2010. Economic Survey of Pakistan 2009–10. Islamabad
Pakistan is not the only country through which Afghan imports and exports go. Afghanistan also has transit agreements with Iran, Tajikistan, Turkmenistan, and Uzbekistan. The share of these countries in the transit load is given in Figure 7.9. Pakistan leads the list with 34%, followed by Uzbekistan and Iran.
Figure 7.7: Pakistan’s Trade with Afghanistan, 2001–10U
S $
Mill
ion
1600
1400
1200
1000
800
600
400
200
0
2001 2002 2003 2004 2005 2006 2007 2008 2009 2010
Exports
Imports
US
$ m
illio
n
Source: Comtrade.un.org. International Merchandise Trade Statistics (IMTS). United Nations Statistics Division.

Developing Economic Corridors in South Asia
172
Figure 7.9: Share of Countries Allowing Transit to Afghanistan
Pakistan Uzbekistan Iran Turkmenistan
3432
25
9
40
35
30
25
20
15
10
5
0
% S
hare
Source: Government of Pakistan. Respondents from the Ministry of Commerce and Textile Industry. 2010. Islamabad (Interview)
5.3 Afghanistan–Pakistan Transit Trade Agreement The Afghan Transit Trade Agreement, 1965 (ATTA) was signed with the objective of granting freedom of transit to both countries.10 The routes identified included Karachi–Peshawar–Torkhum, and Karachi–Chaman–Spin Boldak. A provision to include additional routes was incorporated in the agreement, and Port Qasim was included in 1988. The customs protocol of the agreement outlined the procedures for transit through the Wagah land route. It was envisaged that no customs duties, taxes, dues, or charges of any kind would be levied on traffic in transit, barring transportation and administrative expenses.
The need for a new Afghanistan–Pakistan Transit Trade Agreement (APTTA), 2010 arose as the 1965 agreement did not facilitate container cargo, nor foresee the impact that advanced technology would have on transit trade, and the emergence of the Central Asian republics. Both sides also wanted to take into account updated customs procedures, improve the dispute resolution mechanism, address the movement of psychotropic substances and illegal chemicals, and identify specific routes for the movement of transit goods by road. At present, 80% of the transit goods goes by road. After detailed negotiations, the new agreement came into force in 2011. Since then, issues that have come up have been dealt with on an incremental basis. The agreement has now been extended to Tajikistan.
The APTTA, 2010 allows freedom of transit to both countries, allowing Pakistan access to the Central Asian republics, and Afghanistan access to Pakistan’s sea ports. It also permits Afghan exports via Wagah to India, but does not allow Indian exports to Afghanistan the same way. An Afghanistan–Pakistan Transit Trade Coordination Authority is to monitor effective implementation of the agreement, formulate and 10 This section draws on Ahmed (2010), briefing paper presented to the Planning Commission of Pakistan.

Trade Facilitation through Economic Corridors in South Asia: The Pakistan Perspective
173
monitor measures to curb smuggling, and resolve disputes regarding its interpretation or implementation. Under the agreement, rights have been secured to the following entry and exit points for Pakistan’s exports.
(i) Torkham–Hairatan (with Uzbekistan) (ii) Torkham–Torghundi (with Uzbekistan) (iii) Torkham–Ai Khanum (with Tajikistan) (iv) Torkham–Sher Khan Bandar (with Tajikistan) (v) Torkham–Aqina (with Turkmenistan) (vi) Torkham–Torghundi (with Turkmenistan) (vii) Chaman–Islam Qala (with Iran) (viii) Chaman–Zaranji (with Iran)
Afghan trucks carrying exports are allowed access to Pakistan’s sea ports and they can also carry imports in transit through Pakistan. Only trucks having valid permits and drivers cleared by biometric security systems are allowed entry to Pakistan. Afghanistan is also allowed to use Pakistani trucks for transit of its goods to Afghanistan. Afghan trucks are allowed to travel only on designated routes up to the sea ports and Wagah.
6. Survey Results
6.1 Traders (Individuals/Business Groups)The Ministry of Commerce provided details of Pakistani traders trading with India and Afghanistan. The responses were spread over industries such as food and beverages, wood products, construction, textiles, and surgical products.11 Many did not respond, citing their low level of trade with the region. The results show that time delays, sensitive lists, ignorance of transit agreements, inadequate regional cooperation, tensions at border crossings, human trafficking, and nonharmonious political relations are the important issues affecting trade.
Approximately 40% of the goods traded with India are transported by road, 40% to 45% via sea, and the remaining 10% to 15% by air. Rating the efficiency of clearing processes by border control agencies, including customs, 50% were of the view that predictability of the timely completion of paperwork was very low, and 30% were not satisfied with the reforms for speeding up processes. About 70% of the respondents appreciated the trade-related infrastructure, especially the motorway linking Lahore and Peshawar. In the current trading regime and set of goods being traded, the respondents gave a low score to the importance of information technologies.
Around 30% reported difficulties in tracking and tracing consignments when trading with India. The figure for this was higher at 40% in the case of Afghanistan. The customs and border agencies apply the same export and import rules to India and Afghanistan, and all the traders said cargo logistics requirements from Pakistan to India and Afghanistan were the same. Security and insurance requirements are cumbersome in trade with Afghanistan. Delays were reported by 67% in trading with Afghanistan, and by 25% in trading with India (mostly in the case of exports).
11 Although contacts were established with most industries, we received responses from only these.

Developing Economic Corridors in South Asia
174
The traders (mostly in Peshawar and Lahore) were also asked about the operational logistics cost using different modes of transportation. Most of them traded via road and only a few used road-sea routes such as Lahore–Karachi–Dubai–Mumbai or Lahore–Karachi–Mumbai. Regardless of scale, all felt the operational logistics cost was high in all modes. This included port and airport charges, road levies, and rail rates while trading with India or Afghanistan.
The competence and quality of transport services were described as less than satisfactory. The respondents attached high importance to warehouses on both sides of the border. The quality and standard inspection agencies were seen as barriers, rather than facilitators. While customs officers were termed competent, the respondents pointed to the need for updating them on changing international regulations. Around 80% said lack of clarity among customs officers led to time delays. They also desired more transparency in customs procedures, and complained about not receiving timely information when regulations changed.
The respondents favored Bangladesh’s business environment, especially in the textile sector, and highlighted the factors that had prompted leading production units to shift from Pakistan to Bangladesh. These included power shortages, hikes in electricity tariff, withdrawal of government incentives, cancellation of foreign orders due to time delays, and coordination and information asymmetries between various institutions, including financial intermediaries. The traders were concerned about discount rate hikes by the State Bank of Pakistan, and believed that this could lead to business shifting to countries with easier terms.
6.2 Trade Associations Detailed responses to the questionnaires were received from the Peshawar, Islamabad, and Lahore chambers of commerce. A focus group discussion was also held with the Islamabad Chamber of Commerce and Industry (ICCI). They attached critical importance to the shortage of power in summer and gas in winter, which led to the closure of manufacturing firms. It also meant an increase in production cost, and a loss of competitiveness. On trade facilitation, they were critical of poor connectivity with India and Afghanistan, and the lack of personal contacts. Inadequate horizontal and vertical integration, the absence of regional production network in key industries, and complex and cumbersome procedures both at and behind borders were the main concerns.
A reason for inadequate transportation facilities was the high cost of uncertainty while trading with Afghanistan and India. This uncertainty is quantitatively ranked the highest in the world. Further, restrictive policies on intraregional investment, and the lack of warehouses and testing facilities at the border delayed shipments. They said that cross-border transit should be allowed, permitting movement beyond border areas, rail links with Afghanistan should be developed, and clearing houses should be designated for the fast disposal of merchandise.
The ICCI said the strict visa regime, especially on the Indian side, was a serious impediment. In 2010, 350 businessmen applied for visas to India through the ICCI and only 32 were granted them. They further objected to the quota on visa stickers,

Trade Facilitation through Economic Corridors in South Asia: The Pakistan Perspective
175
the period of validity, and the restricted scope of travel. They desired a move from the sticker scheme to an electronic business travel card, and installing electronic readers at airports. They also complained about paper-based customs procedures.
The proposals forwarded by the ICCI included establishing an uninterrupted transportation network, and world-class infrastructural facilities for cross-border transit. The steps comprised enhancing rail links with Afghanistan; improving customs checkpoints; expanding them by including parking, warehouses and testing laboratories of international standards; upgrading the checkpoints at Wagah and Torkham; and adopting e-business methods.
6.3 Government OrganizationsThe main organizations contacted were the Trade Development Authority of Pakistan (TDAP), Customs Pakistan, and the Ministry of Commerce. All wanted better inter-governmental coordination of trade policy reform. The ministry felt that several key proposals would not materialize if there were coordination failures and lack of finance.
In the case of Afghanistan, they believed the actual trade volume was greater. However, the large chunk of informal trade is difficult to quantify. It was also emphasized that insurgency on the Afghan side of the border required an immediate solution. Strong linkages are needed between the customs departments on both sides. The general lack of capacity of the Afghan customs hindered the movement of goods, and led to time and cost overruns.
The TDAP explained the need for trade exhibitions in Afghanistan. It felt that the capacity of Pakistan’s industry, especially in construction and food processing, should be showcased in Kabul more frequently. Afghanistan is a key destination for Pakistan’s services exports, mainly in the transport and communication sectors. The TDAP felt that these services could be improved by speedy implementation of the National Trade Corridor (NTC) program.
Former trade attaches and officials who had been involved with Pakistan-India trade facilitation stressed the need for improved relations at the level of the ministries of commerce and interior. There is a strong will in the business community to extend relations, but political issues related to the economy have to be resolved.
7. ConclusionThis study has highlighted the improvements required in infrastructure arrangements to facilitate trade between Pakistan and Afghanistan and India. However, trade facilitation requires harmonizing customs procedures, and the regulatory frameworks of the other authorities at border crossings. Linkages need to be established among customs organizations so that they can exchange data, and the export document of one country can serve as the import document of the other. SPS and other quality standards need to be harmonized to eliminate technical barriers to trade (TBT). Finally, relations between India and Pakistan must be broad-based and guarantee continuing with a liberalized

Developing Economic Corridors in South Asia
176
bilateral trading environment. Towards achieving this, the governments must be helped by the business communities and civil society on both sides.
Pakistan has to realize that while additional investment in trade infrastructure is necessary for sustaining economic growth, attention has to be paid to issues that prevent the existing infrastructure from being utilized fully. In overall infrastructure, Pakistan is almost on a par with its regional competitors, but it fares poorly when it comes to organizing and managing it.
Trade Facilitation through Economic Corridors in South Asia: The Pakistan Perspective
177
References
Ahmed, Vaquar. 2010. Afghanistan–Pakistan Transit Trade Agreement. United Nations Development Programme MPRA Paper No. 27157. Islamabad: Planning Commission of Pakistan.
Anson J., O. Cadot and M. Olarreaga. 2003. Tariff Evasion and Customs Corruption: Does Pre-Shipment Inspection Help? World Bank Policy Research Working Paper No. 4258. Washington, DC: World Bank.
Arvis, Jean-François et al. 2010. Connecting to Compete: Trade Logistics in the Global Economy. Washington, DC: World Bank.
Arvis, Jean-François., G. Raballand and F. J. Marteau. 2007. The Cost of Being Landlocked: Logistic Cost and Supply Chain Reliability. World Bank Policy Research Working Paper No. 4258. Washington, DC: World Bank.
Baroncelli, E. 2007. The ‘Peace Dividend,’ SAFTA, and Pakistan-India Trade. In Zareen F. Naqvi and Philip Schuler. The Challenges and Potential of Pakistan-India Trade. Washington, DC: World Bank.
Dennis, Allen. 2006. The Impact of Regional Trade Agreements and Trade Facilitation in the Middle East North Africa Region. World Bank Policy Research Working Paper No. 3837. Washington, DC: World Bank.
Economist Intelligence Unit. 2005, 2009. E-readiness Rankings. London: Economist Intelligence Unit.
Government of Pakistan, Ministry of Finance. 2010. Economic Survey of Pakistan 2009–10. Islamabad.
Government of Pakistan, Ministry of Railways. 2009. Pakistan Railways Year Book 2008–09. Islamabad.
Government of Pakistan, Planning Commission. 2007a. Pakistan National Trade Corridor Program. Islamabad.
Government of Pakistan, Planning Commission. 2007b. Pakistan in the 21st Century: Vision 2030. Islamabad.
Hausman, H. W., Lee L. Hau and U. Subramanian. 2005. Global Logistics Indicators, Supply Chain Metrics, and Bilateral Trade Patterns. World Bank Policy Research Working Paper No. 3773. Washington, DC: World Bank.
Khan, M. S. 2009. India Pakistan Trade: A Roadmap for Enhancing Economic Relations. Policy Brief PB09-15. Washington, DC: Peterson Institute for International Economics.
Khan, R. Shaheen. 2009. Regional Trade Integration and Conflict Resolution. New York, USA: Routledge

Naqvi, Z. Fationa. and Philip Schuler. 2007. The Challenges and Potential of Pakistan–India Trade. Washington D.C.: World Bank
LCG. 2006. Pakistan Logistics Cost Study 2006. Kastrup, Denmark: Logistics Consulting Group. http://ntlfc.org/reports/logistics_costs_study_Pakistan_report_June_06.pdf.
Soloaga I., S. J. Wilson and A. Mejia. 2006. Moving Forward Faster: Trade Facilitation Reform and Mexican Competitiveness. World Bank Policy Research Working Paper No. 3953. Washington, DC: World Bank.
Taneja, Nisha. 2006. India-Pakistan Trade. Working Paper No. 182. New Delhi: Indian Council for Research on International Economic Relations.
United Nations. 2008. United Nations e-Government Survey. New York: Division for Public Administration and Development Management.
Waverman, L. and K. Dasgupta. 2010. Connectivity Scorecard 2010. London: LECG and Nokia Siemens Networks.
Wilson, S. J., Mann L. Catherine and T. Otsuki. 2003. Trade Facilitation and Economic Development: Measuring the Impact. World Bank Policy Research Working Paper No. 2988. Washington, DC: World Bank.
Wilson, S. J., Mann L. Catherine and T. Otsuki. 2004. Assessing the Potential Benefit of Trade Facilitation: A Global Perspective. World Bank Policy Research Working Paper No. 3224. Washington, DC: World Bank.
Wilson, S. J. and T. Otsuki. 2007. Regional Integration in South Asia: What Role for Trade Facilitation? World Bank Policy Research Working Paper No. 4423. Washington, DC: World Bank.
World Bank. 2006. Pakistan—Second Trade and Transport Facilitation Project. Report no. AB2619. Washington, DC: World Bank. http://documents.worldbank.org/curated/en/2006/09/7166922/Pakistan_second_trade_transport_facilitation_project.
World Bank. 2010. Doing Business in Pakistan 2010. Washington, DC: World Bank.

179
Chapter 8
Trade Potential and Economic Cooperation between Bangladesh and Northeast India
Mohammad Masudur Rahman
1. Introduction Given the rapid growth of regional economic activities, trade, and investment in South Asia, regional infrastructure has become an important building block of regional economic integration in the era of globalization. The efficiency of border corridors and land customs stations is important to trade prospects between Bangladesh and India, and their competitiveness. The trade flow between these two countries is now very uneven across border corridors, and better connectivity, particularly between Bangladesh and Northeast India (NEI), is likely to more advantageously redistribute the trade flow.
The South Asian Association for Regional Cooperation (SAARC) initiated the SAARC Regional Multimodal Transport Study (SRMTS) with the objective of enhancing multimodal transport connectivity among member states to promote intraregional trade. It indicates the major corridors and gateways of regional significance in all modes of transport, and identifies their physical and nonphysical barriers. It also recommends some routes and priority measures to promote efficient and fully integrated multimodal transport connectivity among SAARC countries.
India is Bangladesh’s fourth most important trading partner, next to the European Union (EU), the US, and People’s Republic of China (PRC), and accounted for 9.1% of its global trade in 2010.1 India–Bangladesh relations have been put on a potentially stronger footing with the inking of a $1-billion loan agreement between the two countries in 2010.2 Northeast India is central to this new initiative. Bangladesh’s trade with Northeast India 1 The EU taken as a single entity was the largest trading partner of Bangladesh in FY2009–10 with a trade
value of $9.2 billion, US with $5.1 billion, and PRC with $4.2 billion followed it.2 The loan will be spent to implement 14 specific development projects amounting to $640 million, all
designed to strengthen physical connectivity between India and Bangladesh, with transit for Bangladesh to Nepal and Bhutan and vice-versa. The remaining $360 million were not finalized in 2011. However, the rest of the memory will be spent for importing train and locomotive from India.

Developing Economic Corridors in South Asia
180
comprised $50.45 million in exports and $237.6 million in imports in 2009. Exports to NEI were 23.4% of Bangladesh’s total exports to India in 2010, and are rising.
They included readymade garments (RMG), processed food, cement, pharmaceuticals, ceramic tiles, and hosiery. The main imports from NEI are agricultural products, fruits, and food items.
Bangladesh’s proximity to two landlocked countries (Nepal and Bhutan) and NEI, as well as its seaports of Chittagong and Mongla, hold great potential. Facilitating the movement of cargo between NEI and the rest of India could create huge opportunities for transport services in Bangladesh. According to some estimates, even if just 25% of the cargo between NEI and the rest of the country passes through Bangladesh, revenue earnings could be $400 million (Murshid 2010). However, given the low purchasing power of NEI, the scope for more exports to it has remained limited. If greater connectivity through Bangladesh creates faster development in NEI, the higher purchasing power of the people there could mean more imports from Bangladesh.
In view of the above, the broad objective of this study is to explore the business potential and investment opportunities between Bangladesh and NEI along selected economic corridors. Its specific aims are to (i) explore the trade and investment potential between Bangladesh and NEI; (ii) identify the major determining factors of trade and investment with NEI; (iii) indicate the major challenges and solutions to them for strengthening trade and investment relations between Bangladesh and NEI; and (iv) make policy recommendations. It is anticipated that this study will help governments, policymakers, development organizations, and stakeholders frame appropriate strategies and action plans to achieve seamless trade and investment relations between Bangladesh and India.
This chapter is organized as follows. Section 2 provides an overview of Bangladesh–India trade with some stylized facts, and discusses the potential for exports to the Indian market. Section 3 presents the findings of a firm-level survey in Bangladesh. Section 4 discusses the barriers to trade between Bangladesh and NEI, and measures to tackle them. The policy recommendations are in Section 5.
2. Bangladesh–India Trade2.1 Some Stylized FactsThe geographical proximity of India and Bangladesh, a common language, similar cultural features, and almost similar physical infrastructure offer good opportunities for mutual trade (Siriwardana and Yang 2007). The average tariff rate has declined over the years under the South Asian Free Trade Area (SAFTA) agreement.3 Of Bangladesh’s global trade, 9.1% is with India, which is the largest single source of imports (16% of the total) after PRC. Bangladesh’s imports food and beverages, industrial supplies,
3 Bangladesh’s customs duty on basic raw materials and capital machinery was 4.05%, though the duty on finished and luxury goods was 15.5% under SAFTA in 2010 (Government of Bangladesh 2010). In line with a free-trade agreement, the Bangladesh government cut customs duties on nearly 4,500 products of South Asian origin from January 2011.

Trade Potential and Economic Cooperation between Bangladesh and Northeast India
181
fuels and lubricants, capital goods, transport equipment, and consumer goods from India (Table 8.1).
Figure 8.1 shows Bangladesh’s trade with India from 2004 to 2010. Over this period, Indian exports to Bangladesh grew significantly, while imports from Bangladesh remained low. This has resulted in a large trade surplus for India, making it urgent for Bangladesh to devise new trade strategies.
Figure 8.1: Bangladesh’s Trade with India, 2004–10
-4000
-3000
-2000
-1000
0
1000
2000
3000
4000
2004 2005 2006 2007 2008 2009 2010
US
$ m
illio
n
Export Import Trade BalanceTrade balance
Source: elibrary-data.inf.org/FundDataReports.aspx?d=330618e=170921. Direction of Trade Statistics (DOTs). International Monetary Fund (IMF)
Bangladesh’s traditional exports to India have been chemical fertilizers, raw jute and jute manufactures, frozen fish, and RMG. Recently, textile fabrics, plastic goods, cement, furnace oil, batteries, cut flowers, pharmaceutical products, copper wires, and melamine have entered the basket. Bangladesh’s imports from India have been increasing over time. Tables 8.2 and 8.3 show the top 10 products (HS code 2 digit and 8 digit levels), which comprised 79% and 58%, respectively of Bangladesh’s exports to India in 2010.
Most of Bangladesh’s imports from India are through land border crossings. However, increasing congestion and delays at the Benapole–Petrapole and Akhaura–Agartala land border crossings have become barriers to trade between the two countries.

Developing Economic Corridors in South Asia
182
An important feature of Bangladesh–India bilateral trade is the large volume of informal or unrecorded trade, both in commodities and services.4
Table 8.1: Bangladesh’s Trade with India ($ millions)
Food and Beverages
Industrial Supplies (not
elsewhere specified)
Fuels and Lubricants
Capital Goods (except
Transport Equipment)
Transport Equipment and
Parts
Consumer Goods (not elsewhere specified)
Year Import Export Import Export Import Export Import Export Import Export Import Export
1991–95 62 0.5 175 8 9 0 37 0.4 36 0 6 0.5
1996–2000
191 0.5 621 20 18 0 82 0.2 83 1 23 1
2001–05 271 10 615 56 39 0 156 2 110 1 42 3
2006 410 50 953 169 106 13 186 8 158 7 62 11
2007 608 22 1,107 375 159 94 185 14 181 7 86 12
2008 i 1,022 60 1,508 228 129 23 178 3 280 2 110 12
2009 i 367 34 1,266 180 135 0 112 3 232 1 61 15
Note: iindicates mirror data.
Source: Comtrade.un.org. International Merchandise Trade Statistics (IMTS). United Nations Statistics Division. http://comtrade.un.org.
Table 8.2: Top 10 Export (HS 2 digit) Items from Bangladesh to India in 2010
Bangladesh Exports to India Value ($ million)
Total exports to India in 2010 304.63
63: Other made textile articles, sets, worn clothing etc 69.56
53: Vegetable textile fibers nes, paper yarn, woven fabric 65.26
03: Fish, crustaceans, molluscs, aquatic invertebrates nes 29.86
74: Copper and articles thereof 17.47
25: Salt, sulphur, earth, stone, plaster, lime and cement 16.14
41: Raw hides and skins (other than fur skins) and leather 11.37
62: Articles of apparel, accessories, not knit or crochet 9.99
73: Articles of iron or steel 7.57
08: Edible fruit, nuts, peel of citrus fruit, melons 7.17
31: Fertilizers 6.97
Source: Export Promotions Bureau. Ministry of Commerce. Dhaka: Government of Bangladesh.
4 Interviews conducted in local border areas; World Bank (2006); Bayes (2002).

Trade Potential and Economic Cooperation between Bangladesh and Northeast India
183
Table 8.3: Top 10 Export (HS 8 digit) Items from Bangladesh to India in 2010 Bangladesh Exports to India Value ($ million)
Total exports to India in 2010 304.63
63051000: Sacks and bags, used for packing goods 59.75
53031010: Raw or retted long jute 31.76
03026910: Hamoor fish, excluding livers, roes, fish fillets and other fish/meat of heading 03.04, fresh or chilled.
16.43
74040000: Copper waste and scrap. 16.22
53071010: Sin. yarn of jute or of other textile bast 15.68
41079900: Other, including sides other than full grains, unsplit or grain splits, leather further prepared after tanning or crusting of bovine (including buffalo) or equine animals, without hair on, other than leather of heading 41.14.
9.03
53101010: Unbleached woven fabrics of jute 8.15
73269020: Tree climbing irons 7.43
31021000: Nitrogenous fertilizer, urea, whether or not in aqueous solution, excluding tablets or similar forms or in packages of a gross weight not exceeding 10 kg.
6.97
25171000: Pebbles, gravel, broken or crushed stone, of a kind commonly used for concrete aggregates, for road metalling or for railway or other ballast, shingle and flint, whether or not heat-treated.
5.82
Source: Export Promotions Bureau. Ministry of Commerce. Dhaka: Government of Bangladesh.
2.2. Export Potential of Bangladesh to Indian MarketTwenty three items (at the HS 6 digit level) that Bangladesh could export to India have been identified. These commodities include, among others, apparel products and accessories, fabrics, cements, jute and jute products, footwear, bicycle parts, and electrical equipment (Table 8.4). Bangladesh has a price advantage in jute (HS 530510), cements (HS 232510), plants and parts of plants (HS 121191), bicycle parts (871499), dyed plain cotton weave (520931), and flat rolled products (HS 721041). The per unit export price of these is lower than in India, and they could have market opportunities in NEI because of geographical proximity, the lower carrying cost, and shorter lead time. Preferential market access under SAFTA, the Bay of Bengal Initiative for Multisectoral Technical and Economic Cooperation (BIMSTEC), and the Asia-Pacific Trade Agreement (APTA) could enhance these opportunities.
Estimates of revealed comparative advantage (RCA) have been widely used in the literature to understand the competitive strength of particular items in importing markets. To ascertain Bangladesh’s competitive edge in the Indian market, the RCAs of a select set of exportables to the Indian market were computed. Export data at the HS 6-digit level were accessed from the UN Comtrade database for 2007, 2008, and 2009. RCAs were estimated both for a select group of broad product groups and for items of export at the disaggregated level.5 In terms of the RCA index, raw jute ranks at the top.
5 The following formula was used to calculate the bilateral RCA index (Balassa 1965): RCA is equal to (Bangladesh’s export of commodity j to India) / (Bangladesh’s total export to India) by (Total exports of jth commodity by world to India) / (Total exports of world to India). A comparative advantage is “revealed” if RCA > 1, in which case the origin country (Bangladesh) has a revealed comparative advantage in exporting that particular product to the destination country (India).

Developing Economic Corridors in South Asia
184
As seen in Table 8.4, other important items with RCA > 1 are jute, chemical fertilizers, cement, RMG, leather, batteries, textile fabrics, bicycles, and medicines.
Table 8.4: Export Potential of Bangladesh to Indian Market in 2010
Product Product Name Bangla-desh’s Export to World Market ($ million)
India’s Import from World Market ($ million)
Bangla-desh’s Export Price ($/Unit)
India’s Import Price ($/Unit)
Average RCA
232510 Cements, portland, aluminous, slag, supersulfate and similar hydraulic
8.50 78.45 35.15 44.15 31.72
90240 Black tea (fermented) and partly fermented 11.71 24.62 1.26 1.56 0.23
271000 Petroleum oils, etc, (excluding crude) 208.86 8,618.07 0.30 0.64 0.15
271390 Other residues of petroleum oils 4.08 217.22 0.40 0.30 0.11
293339 Compounds containing an unfused pyr 2.72 63.108 20.16 8.35 0.10
300420 Medicaments of other antibiotics 3.08 11.46 10.1 95.60 2.10
490700 New stamps; stamp-impressed paper; 46.81 367.57 38.32 297.51 8.40
491199 Other printed matter, nes 6.05 83.95 36.82 27.37 0.34
520839 Dyed woven cotton fabrics, with >= 8 3.23 12.57 3.55 13.97 7.50
520931 Dyed plain cotton weave, with >= 85% 6.05 23.94 3.96 9.74 15.78
520932 Dyed 3 or 4-thread twill 2.16 14.97 7.17 9.51 1.78
520942 Denim, with >= 85% cotton, > 200g/m2 2.30 28.36 3.08 5.07 7.46
530510 Jute and other textile bast fibers, raw/retted 144.98 37.98 84.45 95.78 150.45
540752 Dyed woven fabrics of synthetic fil 6.70 40.92 5.73 7.93 10.75
590390 Textile fabrics impregnated with 5.44 67.86 6.31 9.83 1.01
640299 Footwear, nes, not covering the ankle 10.21 13.03 7.64 4.62 3.80
640319 Sports footwear, with rubber, plastic 47.63 11.34 7.03 4.96 4.79
640590 Footwear, nes 5.27 18.74 8.39 2.15 1.11
640620 Outer soles and heels of rubber 9.54 23.10 3.83 4.37 2.41
720924 Flat rolled prod, i/nas, in coil, cr 8.86 28.64 0.75 0.68 0.45
721041 Flat rolled prod, i/nas, plated or ct 16.29 18.46 1.15 1.14 0.62
721049 Flat rolled prod, i/nas, plated or 14.14 123.47 1.22 0.81 0.78
840690 Parts of steam and vapor turbines 4.73 81.60 22.4 56.03 0.12
840999 Parts for diesel and semi-diesel engines 5.54 240.87 2.21 21.24 0.22
841199 Parts of gas turbines nes 4.00 147.25 145.72 122.73 0.10
842290 Parts of dish washing, cleaning or dry 5.36 33.10 8.09 46.54 5.10
846693 Parts and accessories nes for use 38.72 130.24 23.70 35.14 1.11
853650 Electrical switches for a voltage not exceed-ing 1,000 volts, nes
3.38 85.97 13.59 13.75 0.97
871499 Bicycle parts nes 5.45 88.82 1.90 6.58 4.78
880390Parts of balloons, dirigibles 8.31 79.99 6.15 442.06 0.94
Note: RCA = Revealed comparative advantages; nes = not elsewhere specified.
Source: comtrade.un.org. International Merchandise Trade Statistics (IMTS). United Nations Statistics Division. Author’s Calculation

Trade Potential and Economic Cooperation between Bangladesh and Northeast India
185
Box 8.1: Transshipment in Action
Cooperation between Dhaka and Delhi has entered a new era with India sending its goods from Kolkata to Tripura through Bangladesh. The first four consignments of over dimensional cargoes (ODC) for the 726-megawatt Palatana power plant passed through the Akhaura border to Tripura on 27 March 2011. The transshipment facility grants the use of dual modes of transport like river and road, and it was given to India under the Protocol on Inland Water Transit and Trade (IWTT) signed in 1972. The consignments come from Kolkata to Ashuganj port by river and are carried by trailers to Akhaura. Four trailers, three of 120 wheels and one of 128, carried the first four consignments weighing about 80 tons from Ashuganj to Akhaura. A total of 96 consignments are to be shipped from Ashuganj to the Akhaura border in the next three months. Their weights range from 20 tons to 285 tons.
Source: Zaman, Sheikh Shahariar. 2011. Transshipment to Transform Ties. 27 March. bdnews24.com/business/2011/03/27/transshipment_to_transform_ties
3. Findings from the Firm-Level Survey The objective of this field survey was to understand the opportunities for business between Bangladesh and NEI, and the challenges they face along selected SAARC economic corridors. It was done among selected firms, exporters and importers, customs officials, freight and forwarding agencies, and trade economists in Bangladesh.
The team surveyed 10 firms and five groups of people—customs officials, export-import associations, freight forwarding and indenting agents, and trade economists—in a pilot survey. Many of the individual exporters were small businessmen, and the costs of operating on their own were too high. So, the practice was for those dealing in the same product to operate as a firm to keep costs down. There are only a few firms exporting through the Akhaura border crossing, Bangladesh’s largest with NEI, which handled exports of $44.3 million in 2010 or 61% of the total exports to the region. Ten firms conduct almost 85% to 90% of the total export to NEI.
3.1 Border Area of Bangladesh with Northeast IndiaBangladesh shares a 1,880-km-long border with four NEI states—Assam (263 km), Meghalaya (443 km), Tripura (856 km), and Mizoram (318 km). In other words, the Indian region shares 37% of its international border with Bangladesh.
That the NEI states are in an unfavorable location from the perspective of trade with the rest of the country is well known.6 Bangladesh’s proximity makes it their natural trading partner (Table 8.5). Some even go so far as saying that NEI is a captive market for Bangladeshi products, and providing transit facilities to Indian goods will ruin this.7 However, NEI is relatively poor even by all-India standards. It represents 8.9% of India’s geographical area (262,187 sq km) and 3.3% of the country’s population (40
6 The northeast region of India is connected to the rest of the county through the narrow Siliguri corridor or what is known as the “chicken-neck” area.
7 Captive markets are markets where consumers have only a limited number of competitive suppliers; their choice is to purchase what is available or to make no purchase at all.

Developing Economic Corridors in South Asia
186
million in 2009), but contributes only 1% to gross domestic product (GDP).8 Within the region, there is wide variation in terms of net domestic production. Assam accounts for 65% of the net domestic product of the region, followed by Tripura (10.6%), and Meghalaya (7.3%). Per capita net domestic product in the seven states was only $720 in 2008 (Table 8.6), which was lower than the rest of India ($995).
Table 8.5: Capitals of Northeast India and and Their Distances from Important Centers in Bangladesh
(in km)Capital Cities of NEI Kolkata
(Nearest Port City from NEI)
Dhaka (Capital of Bangladesh)
Chittagong (Sea Port in Bangladesh)
Sylhet (an important
Divisional City in Bangladesh)
Agartala (Tripura) 1,680 186 248 238
Aizawl (Mizoram) 1,550 555 250 255
Guwahati (Assam) 1,080 580 675 236
Imphal (Manipur) 1,565 635 735 335
Shillong (Meghalaya) 1,180 480 575 136
Kohima (Nagaland) 1,420 780 880 480
Note: NEI = Northeast IndiaSources: (i) Ministry of Development of North Eastern Region. Government of India. http://
mdoner.gov.in (ii) North East Resources Databank. http://databank.nedfi.com/content/general-information (iii) Rahmatullah, M. 2009. Regional Connectivity: Opportunities for Bangladesh to be a
Transport Hub. Journal of Bangladesh Institute of Planners. Vol. 2. pp. 13–29 (iv) Data Centre. National Statistics Development. United Nations Economic and Social
Commission for Asia and the Pacific
Table 8.6: Per Capita Net Domestic Product in Northeast India(in $)
State/Region 2005–06 2006–07 2007–08
Assam 455.70 491.70 611.50
Manipur 434.40 459.70 561.40
Meghalaya 589.30 658.80 817.40
Northeast region 551.82 595.40 710.11
Rest of India 690.10 771.40 994.90
All India 682.60 750.10 950.60
Source: Authors’ estimation based on Government of India (2009). Ministry of Finance. http://www.finmin.nic.in/statsdata/nsdpsdds/index.html and www.unidow.com.
3.2 Informal Trade with Northeast India Total unofficial trade between Bangladesh and India is more than $512 million per annum, and more than one-third of it takes place with NEI (World Bank 2006). This trade has to be reined in to boost formal trade and encourage investment. According to Bayes (2002), informal imports from NEI add up to $26 million and informal 8 North East Resources Databank, Northeastern Development Finance Corporation (NEDFi)
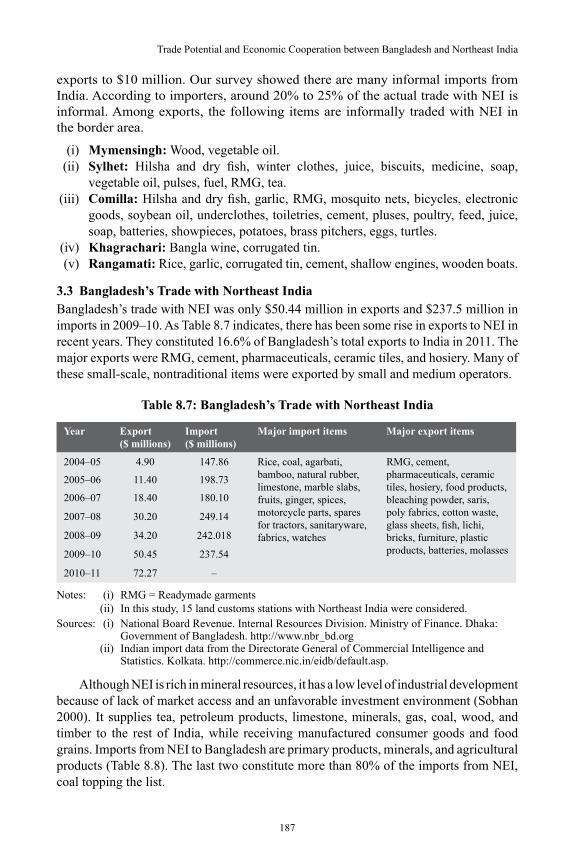
Trade Potential and Economic Cooperation between Bangladesh and Northeast India
187
exports to $10 million. Our survey showed there are many informal imports from India. According to importers, around 20% to 25% of the actual trade with NEI is informal. Among exports, the following items are informally traded with NEI in the border area.
(i) Mymensingh: Wood, vegetable oil. (ii) Sylhet: Hilsha and dry fish, winter clothes, juice, biscuits, medicine, soap,
vegetable oil, pulses, fuel, RMG, tea. (iii) Comilla: Hilsha and dry fish, garlic, RMG, mosquito nets, bicycles, electronic
goods, soybean oil, underclothes, toiletries, cement, pluses, poultry, feed, juice, soap, batteries, showpieces, potatoes, brass pitchers, eggs, turtles.
(iv) Khagrachari: Bangla wine, corrugated tin. (v) Rangamati: Rice, garlic, corrugated tin, cement, shallow engines, wooden boats.
3.3 Bangladesh’s Trade with Northeast IndiaBangladesh’s trade with NEI was only $50.44 million in exports and $237.5 million in imports in 2009–10. As Table 8.7 indicates, there has been some rise in exports to NEI in recent years. They constituted 16.6% of Bangladesh’s total exports to India in 2011. The major exports were RMG, cement, pharmaceuticals, ceramic tiles, and hosiery. Many of these small-scale, nontraditional items were exported by small and medium operators.
Table 8.7: Bangladesh’s Trade with Northeast India
Year Export ($ millions)
Import ($ millions)
Major import items Major export items
2004–05 4.90 147.86 Rice, coal, agarbati, bamboo, natural rubber, limestone, marble slabs, fruits, ginger, spices, motorcycle parts, spares for tractors, sanitaryware, fabrics, watches
RMG, cement, pharmaceuticals, ceramic tiles, hosiery, food products, bleaching powder, saris, poly fabrics, cotton waste, glass sheets, fish, lichi, bricks, furniture, plastic products, batteries, molasses
2005–06 11.40 198.73
2006–07 18.40 180.10
2007–08 30.20 249.14
2008–09 34.20 242.018
2009–10 50.45 237.54
2010–11 72.27 –
Notes: (i) RMG = Readymade garments (ii) In this study, 15 land customs stations with Northeast India were considered.Sources: (i) National Board Revenue. Internal Resources Division. Ministry of Finance. Dhaka:
Government of Bangladesh. http://www.nbr_bd.org (ii) Indian import data from the Directorate General of Commercial Intelligence and
Statistics. Kolkata. http://commerce.nic.in/eidb/default.asp.
Although NEI is rich in mineral resources, it has a low level of industrial development because of lack of market access and an unfavorable investment environment (Sobhan 2000). It supplies tea, petroleum products, limestone, minerals, gas, coal, wood, and timber to the rest of India, while receiving manufactured consumer goods and food grains. Imports from NEI to Bangladesh are primary products, minerals, and agricultural products (Table 8.8). The last two constitute more than 80% of the imports from NEI, coal topping the list.
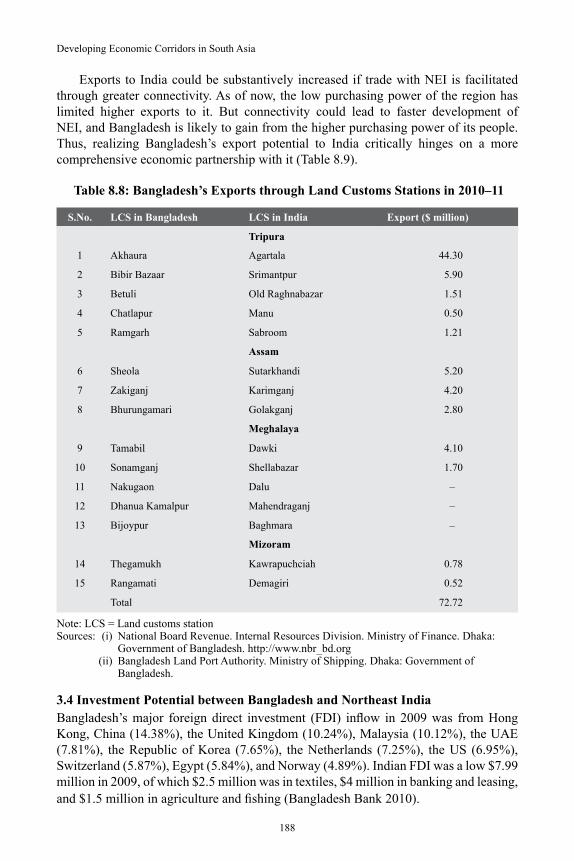
Developing Economic Corridors in South Asia
188
Exports to India could be substantively increased if trade with NEI is facilitated through greater connectivity. As of now, the low purchasing power of the region has limited higher exports to it. But connectivity could lead to faster development of NEI, and Bangladesh is likely to gain from the higher purchasing power of its people. Thus, realizing Bangladesh’s export potential to India critically hinges on a more comprehensive economic partnership with it (Table 8.9).
Table 8.8: Bangladesh’s Exports through Land Customs Stations in 2010–11
S.No. LCS in Bangladesh LCS in India Export ($ million)
Tripura
1 Akhaura Agartala 44.30
2 Bibir Bazaar Srimantpur 5.90
3 Betuli Old Raghnabazar 1.51
4 Chatlapur Manu 0.50
5 Ramgarh Sabroom 1.21
Assam
6 Sheola Sutarkhandi 5.20
7 Zakiganj Karimganj 4.20
8 Bhurungamari Golakganj 2.80
Meghalaya
9 Tamabil Dawki 4.10
10 Sonamganj Shellabazar 1.70
11 Nakugaon Dalu –
12 Dhanua Kamalpur Mahendraganj –
13 Bijoypur Baghmara –
Mizoram
14 Thegamukh Kawrapuchciah 0.78
15 Rangamati Demagiri 0.52
Total 72.72
Note: LCS = Land customs stationSources: (i) National Board Revenue. Internal Resources Division. Ministry of Finance. Dhaka:
Government of Bangladesh. http://www.nbr_bd.org (ii) Bangladesh Land Port Authority. Ministry of Shipping. Dhaka: Government of
Bangladesh.
3.4 Investment Potential between Bangladesh and Northeast India Bangladesh’s major foreign direct investment (FDI) inflow in 2009 was from Hong Kong, China (14.38%), the United Kingdom (10.24%), Malaysia (10.12%), the UAE (7.81%), the Republic of Korea (7.65%), the Netherlands (7.25%), the US (6.95%), Switzerland (5.87%), Egypt (5.84%), and Norway (4.89%). Indian FDI was a low $7.99 million in 2009, of which $2.5 million was in textiles, $4 million in banking and leasing, and $1.5 million in agriculture and fishing (Bangladesh Bank 2010).

Trade Potential and Economic Cooperation between Bangladesh and Northeast India
189
Table 8.9: Potential Export Items to Northeast India
Major Items Potential Products for Export from Bangladesh to Northeast India
Textiles Zamdani saris, cotton waste, fabrics, woven fabrics of paper yarn, staple fiber, synthetic fibers
RMG Readymade garments, underclothes, sportswear
Ceramics and porcelain Ceramic products
Jute Jute yarn
Cosmetics and toiletries Soap
Agro-based and food products Biscuits, dry fish, fruit drinks, ice cream, mineral water, molasses, potato crackers, waffles and wafers, soybean oil
Batteries Dry cells
Electrical appliances Electrical and electronic goods, brick crushing and cotton-cutting machines
Agriculture Meat (chicken, beef, mutton), eggs, garlic, potatoes, pulses, hilsha, puti and small fish, tobacco leaves
Furniture Fittings for furniture, foam, furniture
Construction materials Cement, mild steel rods, polyvinyl chloride (PVC) pipes, tiles, toilet fittings, stone chips
Others Bicycles, brass pitchers, filters, mosquito nets, polythene (lay flat tube), tin foil, poultry feed, showpieces
Source: Field survey (2010).
Bangladesh maintains a nondiscriminatory foreign direct investment (FDI) regime with restriction-free repatriation facilities for returns on investment. Indian investors have ample opportunities for investment in manufacturing, services, and infrastructure, including participation in public-private partnership initiatives. In recent years, telecommunications, healthcare, hospitality, and education have attracted substantial FDI. There is still ample room for Indian participation, particularly in the hospitality (hotels and tourism) sector. With expanding intra and extra-regional trade and travel, cross-border transport services by sea and air could be another area for cooperation (The Daily Star 2011) (Table 8.10).
4. Barriers and Remedies Most of the respondents (90%) mentioned that the main problem for trade with NEI was lack of connectivity, weak road links, no direct train services, and no flights between Bangladesh and any state in the region. There are also some nontariff barriers (NTBs) (Table 8.11). For example, Indian customs officials now demand that SAFTA/APTA certificates be submitted at the time of shipment, whereas it could earlier be done after shipment. Sanitary and phytosanitary (SPS) and other certifying agencies are situated very far from customs stations, even in other states of India. Getting these certificates takes a long time, and the exporter often has to pay compensation for perishable products.

Developing Economic Corridors in South Asia
190
Table 8.10: Bangladesh–India Investment Scenario ($ million)
Years Total FDI Inflow to Bangladesh
Total FDI Inflow to India
Indian FDI in Bangladesh
Bangladesh FDI in India
1991 1.39 75.00 0.03 –1992 3.72 252.00 – –1993 14.05 532.00 2.15 –1994 11.15 974.00 1.52 –1995 92.30 2,151.00 2.32 –1996 231.60 2,525.00 1.70 –1997 575.25 3,619.00 – 1.651998 576.46 2,633.00 – 10.911999 309.12 2,168.00 1.66 0.032000 578.70 3,585.00 8.50 0.122001 354.50 5,472.00 2.08 3.702002 328.30 5,627.00 4.30 2.932003 350.20 4,323.00 3.63 3.322004 460.40 5,771.00 6.80 2.962005 845.30 7,606.00 2.67 0.262006 792.50 20,336.00 6.09 –2007 666.40 25,127.00 1.67 –2008 1,086.30 41,554.00 11.29 –
2009 700.8 – 7.99 –
Note: FDI = Foreign direct investmentSources: (i) Dé, P. and Biswa. N. Bhattacharya 2007. Deepening India–Bangladesh Economic
Cooperation: Challenges and Opportunities. RIS–SP 130. New Delhi: Research and Information System of Developing Countries.
(ii) UNCTAD Statistics. 2010. Geneva. Switzerland: United Nations Conference on Trade and Development.
(iii) New Delhi: Ministry of Commerce. Government of India. (iv) Dhaka: Bangladesh Bank.
Table 8.11: Problems in Trading with Northeast India
Nature of Problem Faced % Respondents Who Reported the Problem
1 Lack of connectivity 90
(i) Weak and narrow road links
(ii) Lack of train and flight services
2 Nontariff barriers 80
(i) Early SAFTA documents submission
(ii) Lack of testing facilities
3 High tariffs 60
4 Poor infrastructure facilities at land customs stations 50
5 Banking facilities 40
Note: SAFTA = South Asian Free Trade AgreementSource: Field survey (2010).

Trade Potential and Economic Cooperation between Bangladesh and Northeast India
191
4.1 Inadequate Infrastructural FacilitiesLand customs stations on both sides are not trade-friendly. Most of them do not have warehouses or storage facilities. Poor physical infrastructure—particularly the lack of telecommunication links, parking space, cold storage, accommodation facilities, and power—is a major problem. Most of the rail lines are not properly maintained.
4.2 Inadequate Services and Unfair DutiesThere is no direct corresponding relationship between banks in NEI and Bangladesh. It sometimes takes 20-30 days to open a letter of credit (LC). The average time taken for issuing an import-export code (IEC) number is 10 to 30 days, and there is no office in any state capital for preshipment inspection. In the case of fruit juices, the Indian customs authority has changed the HS Code of the product from 2009.80 to 2202.90, which has a 20% higher duty. Bangladesh exports the same product to 43 different countries under HS Code 2009.80.
4.3 High Tariff, Paratariff, Nontariff Barriers and Others ChargesIndia has imposed a high tariff on some Bangladeshi goods that have good prospects of export to NEI, RMG (except eight million pieces) and corrugated iron sheets being examples. An anti-dumping duty and sales tax have been imposed, while health test reports, ISI certification, retail price marking, and lab test reports have been made compulsory. India has also imposed a 10% countervailing duty (CVD) on agro products and cosmetics; 4% special additional duties (SAD) on agro products, ceramics and cosmetics; and a 10% additional duty on ceramics, and a 15% surcharge on dry cell batteries.
4.4. Measures to Boost Trade between Bangladesh and NEI A number of initiatives could be taken to stimulate bilateral trade between the two countries, including comprehensive measures to remove tariff barriers and NTBs. As Bangladesh and India are members of SAFTA, BIMSTEC, and APTA, a holistic approach is needed to get rid of all NTBs to exports. In addition, there are many behind-the-border issues that need to be addressed.
(i) Land custom stations that have emerged as important export-import routes should be developed, particularly at Akhaura, Bibirbazar, Juri, and Sheola.
(ii) Roads need to be constructed, widened, or straightened to reduce trade costs and time. Roads from Bharkhar to Akhaura (30 km), and Phultali to Batuli (Juri) have to be constructed, as well as alternative routes connecting Sultanpur (Brahmanbaria) and Akhaura, and Kulaura and Phultali via Gazipur. The bridge to the Sheola station, and the Comilla–Bibirbazar road, has to be improved.
(iii) The facilities that need to be provided include: (a) An air link between Dhaka and Guwahati. (b) Multiple-entry business visas for one year. (c) A Bangladesh visa office in Guwahati in addition to the one now in Agartala. (d) Easing restrictions on banks in NEI on dealing in foreign currency. (e) A direct bus service from Sylhet to Guwahati and Shillong.

Developing Economic Corridors in South Asia
192
(f) A Bangladesh consulate office at Shillong. (g) Restoring the Agartala–Akhaura and Shahbazpur–Mohisashan rail links.
5. Conclusions and the Way ForwardFacilitating trade and promoting private-sector participation are essential to hasten the transformation of transport corridors to full-fledged economic corridors. Bangladesh could emerge as a transport hub for the subregion comprising Bhutan, Nepal, and India if it opens up its transport system to provide regional connectivity. Transport connectivity with India could create a win-win situation for all the countries.
The two important corridors between Bangladesh and NEI are Samdrup Jongkhar (Bhutan)–Shillong (India)–Sylhet (Bangladesh)–Dhaka–Kolkata (India) and Agartala (India)–Akhaura (Bangladesh)–Chittagong (Bangladesh), which have been pointed out in the SRMTS. The economic corridors between Bangladesh and India should use a holistic approach to developing a cost-effective transport system to move goods and people, while simultaneously promoting trade and investment, telecommunications, energy infrastructure, and tourism. The important issues that need to addressed are cross-border investment policies; agribusiness development; infrastructural improvements at gateway nodes; secondary roads to allow rural communities to access corridors; business development services for micro and small businesses; and coordination of tourism initiatives at the national level and across countries.
Northeast India with a population of around 40 million and market size of about $20 billion offers an attractive opportunity to Bangladesh. This region is landlocked and connected to the rest of India only through the narrow Siliguri corridor. It does not have any sea port and all the state capitals are between 1,080 km and 1,680 km from Kolkata. The NEI states have low production bases in both manufacturing and agricultural goods, but are within easy distance of important cities in Bangladesh, such as Chittagong, Sylhet, and Comilla. Bangladesh is also the bridgehead for access to Southeast Asia. Connectivity and sorting out the behind-the-border issues are pivotal to improving trade and investment between the two neighbors.
A comprehensive mechanism has to be put in place to deal with NTBs. Improvement of the trade-related infrastructure at borders and customs checkpoints is critical to not only increasing Bangladesh’s exports, but also bringing down the cost of imports from India. Attracting investments from India and targeting the Indian market are vital to realizing Bangladesh’s export opportunities in the region. Providing connectivity and the use of port facilities could open up opportunities for the export of services, which could significantly enhance exports to NEI.

Trade Potential and Economic Cooperation between Bangladesh and Northeast India
193
References
Balassa, Bela 1965. Trade Liberalization and Revealed Comparative Advantage, Manchester School of Economic and Social Studies. 33, pp. 99–123.
Bangladesh Bank. 2010. Foreign Direct Investment Survey in Bangladesh (2010). Dhaka: Bangladesh Bank. www.bangladeshbank.org.bd
Bayes. 2002. Bangladesh and India Trade Facts, January 16. http://bayesianheresy.blogspot.com/2007/01/bangladesh-and-india-trade-facts.html.
De, Prabir. 2007. Facilitating Overland Trade in South Asia. New Delhi: Research and Information System for Developing Countries.
De, Prabir and B. N. Bhattacharyay. 2007. Deepening India-Bangladesh Economic Cooperation: Challenges and Opportunities. RIS-DP No. 130. New Delhi: Research and Information System for Developing Countries.
Government of Bangladesh. 2010. National Board of Revenue. Dhaka: Government of Bangladesh. www.nbr_bd.org.
Inoue, Kyoko et al. 2007. Sub-regional Relations in Eastern South Asia with Special Focus on Bangladesh and Bhutan. JRP Series 132. Tokyo: Institute of Developing Economies.
Islam, Shahidul. 2008. Bangladesh-China-Northeast India: Opportunities and Anxieties. ISAS Insights. No. 36. Singapore: National University of Singapore.
Jalil, Altaf. 2004. North East India-Bangladesh Initiatives Map. Dhaka: Bangladesh Enterprise Institute.
Murshid, K.A.S. 2010. India, Bangladesh and Northeast Transit and Transshipment–Strategic Consideration. BIDS–PRP Working Paper Series-6. Bangladesh Institute of Development Studies. Dhaka: Bangladesh.
Nordås, H. K. and R. Piermartini. 2004. Infrastructure and Trade. World Trade Organization Staff Working Paper ERSD-2004-04. Geneva: World Trade Organization.
Rahman, M. M. and A. A. Laila. 2010. Bangladesh Trade Potential: A Dynamic Gravity Approach. Journal of International Trade Law and Policy. 9 (2). pp. 130–47.
Rahman, M. T. and M. A. Amin. 2009. Prospects of Economic Cooperation in the Bangladesh, China, India and Myanmar Region: A Quantitative Assessment. Working Paper Series. No. 73. ARTNeT. Bangkok: United Nations Economic and Social Commission for Asia and the Pacific.
Rahmatulla, M. 2009. Regional Connectivity: Opportunities for Bangladesh to be a Transport Hub. Journal of Bangladesh Institute of Planners. 2. pp. 13–92.
Sachdeva, Gulshan. 2005. Preparing the North Eastern Economy for the Future. Political Economy: Transformation, Challenges and Prospects: Eastern Quarterly. 3 (III).

Developing Economic Corridors in South Asia
194
Shepherd, S. B. and J. S. Wilson. 2009. Trade Facilitation in ASEAN Member Countries: Measuring Progress and Assessing Priorities. Journal of Asian Economics. doi:10/1016/j/asieco.2009.03.001.
Sinha, Tuli. 2009. Indo-ASEAN FTA and India’s North East. No. 2889. 9 June. New Delhi: Institute of Peace and Conflict Studies.
Siriwardana, M. and J. Yang. 2007. Effects of Proposed Free Trade Agreement between India and Bangladesh. South Asia Economic Journal. 8(1). pp 21–38.
Sobhan Rehman. 2000. Rediscovering the Southern Silk route: Integrating Asia’s Transport Infrastructure. Dhaka, Bangladesh: Centre for Policy Dialogue.
Suresh, P. S. and B. Mishra. 2010. Public Expenditure and Human Development in North East India: A Case Study of Meghalaya. In P. Nayak, ed. Growth and Human Development in North-East India. New Delhi: Oxford University Press. pp. 233–43.
The Daily Star. 2011. Airtel invested $300 million in Bangladesh in 2010. 24 April. Dhaka.
World Bank. 2010. World Development Indicators (WDI) 2010. Washington, DC: World Bank.
World Bank. 2010. World Integrated Trade Solution (WITS) database.
World Bank. 2006. India–Bangladesh Bilateral Trade and Potential Free Trade Agreement. Bangladesh Development Series. Paper No. 13. Bangladesh Country Office. Dhaka: World Bank.
195
Chapter 9
Economic Corridors and Pro-Poor Private Sector Development in South Asia: A Case Study of
Bangladesh and IndiaSaikat Dutta and Suranjan Gupta
1. IntroductionIndia’s border with Bangladesh is nearly 4,100 km long, and the states of West Bengal, Assam, Meghalaya, Tripura, and Mizoram are along it. Obstacles in the path of bilateral relations between India and Bangladesh have hindered the development of an efficient economic and transportation network between the two countries. With proper facilities, trade with India, particularly its Northeastern region, would be a major source of revenue for Bangladesh. Promoting investment in the telecommunication sector would enhance economic relations further, while information and communication technology (ICT) could be used as a tool to combat poverty.
Countries that wish to develop close bilateral economic relations have to not only allow cross-border investment and transfer of technology, but also facilitate market access to a wide range of small and medium enterprises (SMEs). Bangladeshi handicrafts, ethnic clothing, Jamdani saris, marine, poultry, and dairy products, and fruits and vegetables could be exported to India. It is more expedient to buy goods and services from each other than from distant sources. Implementation of the South Asian Free Trade Area (SAFTA) agreement in letter and spirit is a prerequisite to create an encouraging environment for South Asian SMEs. Infrastructural facilities for transport must be augmented among the contracting states to promote the free movement of goods and services.
This chapter presents the opportunities for SMEs in the development of economic corridors in South Asia. The paper is arranged as follows. Section 2 presents stylized facts about economic corridors and pro-poor private sector development. The bilateral trade profile between India and Bangladesh is presented in Section 3. Section 4 deals with trade barriers, which are critical to bilateral trade. The impact of trade barriers on bilateral trade between India and Bangladesh is discussed in Section 5. Field survey results are presented in Section 6. Finally, Section 7 provides the conclusion.

Developing Economic Corridors in South Asia
196
2. Economic Corridors and Pro-Poor Private Sector DevelopmentEconomic corridors are major centers of economic activities in well-defined geographical areas, usually centered on transport routes where infrastructure development and economic activities are integrated. The multiple benefits of economic corridors are less travel time, lower travel costs for passengers and goods, lower maintenance costs for vehicles, an increased volume of trade, and employment opportunities for the local population. Economic corridors connecting several cities with large populations, high incomes, and purchasing power have a domino effect on the lives of people living in poor rural and border areas.
Bangladesh is almost surrounded by India and Northeastern India (NEI) is connected to the rest of the country only through a narrow “chicken neck” at Siliguri. These features make the two countries very special neighbors. NEI’s real economic future lies in re-establishing routes through Bangladesh to its west and with Myanmar and Southeast Asia to its east. If it can use Bangladesh’s ports, export-oriented businesses can come up in the region, which is rich in energy resources such as natural gas and hydro-electricity. Economic progress in this region could end longstanding grievances and insurgency. Economic corridors connecting the east of India with NEI through Bangladesh would be a win-win situation for both. It would do away with the geographical segregation of NEI by drastically cutting down the cost of transportation and travel times.
Bangladesh can benefit greatly by opening up transit and giving landlocked neighbors (Bhutan and Nepal) access to the sea. Chittagong could become a world-class port like Singapore, serving the South Asian countries, while other underutilized ports could be improved. Economic corridors connecting the eight states of NEI, Nepal, Bhutan, and Bangladesh would attract huge private-sector participation, which would lead to employment and income generation.
It has been proved that growth is the most powerful weapon in the fight against poverty. And a necessary precondition for sustained poverty reduction is the development of a strong and dynamic private sector. A growing economy creates employment and income for millions. This increases the tax base, which enables governments to subsidize labor-intensive programs and provide basic social services to the underprivileged. The free play of market forces and more competition make services and goods affordable, which benefits both the haves and the have-nots. It is accepted by most nations that a crucial step toward sustainable economic growth is encouraging the private sector by providing it with a supportive environment and increased entrepreneurial capacity building. The private sector also participates in building physical and social infrastructure that is beneficial to all. With greater private-sector participation in the development of physical infrastructure, governments can utilize more resources for vital public investments, the creation of employment, and the generation of income. They can also divert funds for social services such as clean drinking water, sanitation, healthcare, and education. High population growth and poverty are characteristics shared by both Bangladesh and India. To ensure pro-poor economic development, private-sector participation is imperative.

Economic Corridors and Pro-Poor Private Sector Development in South Asia: A Case Study of Bangladesh and India
197
The role of SMEs in providing productive employment and earning opportunities should not be ignored by policymakers. There has been a growing recognition that large-scale industrialization in developing countries has had only modest success in generating employment and alleviating poverty. Enhancing the development of SMEs enhances competition and encourages entrepreneurship, which have positive effects on economy-wide efficiency, innovation, and aggregate productivity growth. Since SMEs are labor intensive, their expansion boosts employment, making them a means of poverty alleviation.
3. Bilateral Trade between India and BangladeshIn South Asia, bilateral trade between India and Bangladesh accounts for more than one-fourth of the total regional trade (Table 9.1). India has been Bangladesh’s largest trading partner in the last two decades.
Table 9.1: India’s Trade with Bangladesh, 2005–09 ($ million)
Year India’s Exports to Bangladesh
India’s Imports from Bangladesh
Total Bilateral Trade
Balance of Trade (BOT)
2005–06 1,664.36 127.03 1,791.39 1,537.33
2006–07 1,629.57 228.00 1,857.57 1,401.57
2007–08 2,923.72 257.02 3,180.74 2,666.7
2008–09 2,497.87 313.11 2,810.98 2,184.76
2009–10 2,433.77 254.66 2,688.43 2,179.11
Sources: (i) Directorate General of Commercial Intelligence and Statistics (DGCIS). Kolkata. Ministry of Commerce and Industry. Government of India. http://www.dgciskol.nic.in
(ii) http://commerce.nic.in/eidb/default.asp.
Despite India’s unilateral concessions to Bangladesh and the lengthy land border, its trade with Bangladesh has not grown at a healthy pace. The balance is tilted toward India—exports to Bangladesh are $2,433.77 million, while imports from it are only $254.66 million. India’s exports to Bangladesh grew 8% per annum between 2005–06 and 2009–10, whereas its imports from Bangladesh grew at 15%. Total bilateral trade grew 7% per annum between 2005–06 and 2009–10.
3.1 India’s Major Exports to BangladeshIndia’s export basket to Bangladesh is dominated by cereals, cotton, and vegetable products, which contribute more than 30% of the total (Table 9.2). Other important exports are residues and waste from food industries, iron and steel, mineral fuels, and mineral oils and their distilled products. The top 10 export commodity groups account for 72% of India’s total exports to Bangladesh.

Developing Economic Corridors in South Asia
198
Table 9.2: India’s Top 10 Export Commodity Groups to Bangladesh($ million)
HS Code
Commodity India’s Exports to Bangladesh in
2009–10
52 Cotton 455.29
7 Edible vegetables and certain roots and tubers 251.52
87 Vehicles other than railway or tramway rolling stock, and parts and accessories
244.02
23 Residues and waste from the food industries; prepared animal fodder 198.22
72 Iron and steel 133.69
27 Mineral fuels, mineral oils and products of their distillation; bituminous substances; mineral waxes
131.11
10 Cereals 121.00
29 Organic chemicals 84.40
54 Man-made filaments 75.60
84 Nuclear reactors, boilers, machinery and mechanical appliances; parts thereof.
65.21
Source: Directorate General of Commercial Intelligence and Statistics (DGCIS). Kolkata. The DGCIS provides data for various years and this can be seen from the weblink http://commerce.nic.in/eidb/default.asp. Data was compiled by the authors.
3.2 India’s Imports from BangladeshIndia imports much less than it exports to Bangladesh. The major items imported are vegetable products, textiles, and fish (Table 9.3). The top 10 imports account for 79% of the total.
Table 9.3: Top 10 Commodity Groups Imported by India from Bangladesh($ million)
HS Code
Commodity 2009–10
53 Other vegetable textile fibers; paper yarn and woven fabrics of paper yarn 55.26
63 Other made up textile articles; sets; worn clothing and worn textile articles; rags 51.18
3 Fish and crustaceans, molluscs and other aquatic invertebrates 25.43
25 Salt; sulphur; earths and stone; plastering materials, lime and cement 19.99
74 Copper and articles thereof 11.58
28 Inorganic chemicals; organic or inorganic compounds of precious metals, of rare-earth metals, or radi. elem. or of isotopes
9.79
41 Raw hides and skins (other than fur skins) and leather 7.91
31 Fertilizers 7.30
72 Iron and steel 7.00
52 Cotton 6.16
Source: Director General of Commercial Intelligence and Statistics (DGCIS), Kolkata. The DGCIS provides data for various years and this can be seen from the weblink http://commerce.nic.in/eidb/default.asp. Data was compiled by authors.

Economic Corridors and Pro-Poor Private Sector Development in South Asia: A Case Study of Bangladesh and India
199
3.3 Trade Complementarity between India and BangladeshThere is a certain degree of trade complementarity between India and Bangladesh. Trade complementarity exists when a particular country’s supply capability matches its trading partner’s demand capability, and the trading partner’s supply capability matches its potential demand. The supply capability of a particular country may match well with the demand of its trading partner, but the reverse may not always be the case. There would then only be partial complementarity. India has the potential to meet Bangladesh’s import demands, but it does not work the other way round. Table 9.4 has the Trade Complementarity Index (TCI), with Bangladesh as the source region and India as the destination region.
Table 9.4: Trade Complementarity Index
Year Trade Complementarity Index (%)
2007 5.25
2006 7.55
2005 5.95
2004 6.61
2003 6.26
2002 5.23
2001 5.09
2000 5.45
1999 5.56
1998 5.32
1997 4.92
Source: Interactive Trade Indicators. United Nations Economic and Social Commission for Asia and the Pacific (UNESCAP). http://www.unescap.org/tid/artnet/artnet_app/index_cmpl_fm.aspx
Studies have shown that India’s exports match Bangladesh’s imports fairly well, but there is a lack of complementarity in Bangladesh’s exports to India. Bangladesh’s exports, however, have not been constrained by tariff protection. India has been extending tariff preferences to Bangladeshi exporters, and the slow growth in exports to India is due to other factors such as a weak comparative advantage.
3.4 Engineering Trade between India and BangladeshEngineering products constitute more than 20% of India’s total exports to Bangladesh (Table 9.5). In 2008, Indian engineering exports to Bangladesh grew more than 100%. There was a downturn in 2009 due to the global recession. Indian automobiles and auto components have a huge market in Bangladesh, accounting for more than 35% of total engineering exports. Other important products are iron and steel, aluminium products, agricultural machinery, electric power machinery, nonferrous metal products, and instruments of all types.

Developing Economic Corridors in South Asia
200
Table 9.5: India’s Engineering Exports to Bangladesh, 2007–09 ($ million)
Product Description 2007 2008 2009
Iron and steel 61.75 97.49 126.48
Motor vehicles, excluding two wheelers and three wheelers 42.10 50.02 68.23
Two wheelers and three wheelers – complete 22.02 50.71 63.44
Automobile components 25.95 52.53 54.68
Aluminium and manufactures 27.58 34.32 35.63
Agricultural machinery 12.15 26.44 19.94
Electric power machinery, switchgear and control gear 21.20 103.73 19.65
Industrial machinery for manufacture of paper cement and chemicals 9.92 21.27 15.70
Nonferrous metals and manufactures 4.79 9.04 15.37
Industrial machinery 13.25 35.97 14.39
Instruments all types 9.88 10.11 14.14
Bicycle components and accessories 1.10 23.43 10.99
Textile mills machinery and accessories 10.99 20.14 10.31
Internal combustion engines, compressors and parts 3.29 7.09 5.37
Construction and earthmoving machinery 2.64 4.14 4.97
Ferrous hollow-ware and office equipment 4.97 10.38 4.68
Fabricated steel structures 3.15 3.63 4.61
Ferro alloys 1.16 4.54 4.06
Other steel products – all types 1.63 3.58 3.85
Food processing machinery 2.94 9.06 3.65
Electric and home appliances 2.63 3.32 3.63
Ferrous industrial castings 1.13 0.99 3.01
Machine tools 1.11 10.03 2.50
Small and cutting tools 0.66 4.29 1.74
Pumps, all types 1.08 2.34 1.57
Steel wire products 2.68 0.88 1.52
Fasteners, all types. 1.25 1.15 1.23
Steel pipes tubes and fittings 2.33 1.38 1.10
Hand tools 0.06 0.82 0.80
Stainless steel household products 0.22 3.32 0.65
Sanitary castings 2.58 0.72 0.40
Steel forgings, all types 0.81 0.10 0.28
Railway rolling stock and components 0.14 1.31 0.26
Builders hardware 0.23 0.34 0.13
Mica and other mineral-based products 0.45 0.36 0.03
Total engineering exports to Bangladesh 299.79 608.94 518.98
Source: Trade Statistics, International Trade Centre (ITC). http://www.intracen.org.

Economic Corridors and Pro-Poor Private Sector Development in South Asia: A Case Study of Bangladesh and India
201
In the case of imports, Bangladesh’s performance has been very poor. While Indian engineering exports to Bangladesh were $518.98 million in 2009, imports from Bangladesh were only $17.42 million (Table 9.6). The import basket of engineering goods from Bangladesh is dominated by ferrous and nonferrous metal products (80% of the total), with other products having meager shares in the total.
Table 9.6: India’s Engineering Imports from Bangladesh, 2007–09($ million)
Product Description 2007 2008 2009
Nonferrous metals and manufactures 12.18 8.62 10.68
Iron and steel 6.02 4.96 4.09
Automobile components 8.22 1.80 0.54
Steel forgings, all types 0.22 0.33 0.44
Ferrous industrial castings 0.04 0.10 0.40
Aluminium and manufactures 0.01 0.07 0.36
Pumps all types 0.03 0.09 0.18
Other steel products 0.28 0.15 0.16
Agricultural machinery 0.06 0.07 0.10
Motor vehicles, excluding two wheelers and three wheelers 0.53 1.08 0.08
Industrial machinery for manufacture of paper cement and chemicals 0.41 0.06 0.06
Steel pipes tubes and fittings 0.06 0.09 0.05
Instruments all types 0.00 0.04 0.05
Industrial machinery 0.08 0.03 0.05
Food processing machinery 0.11 0.01 0.04
Internal combustion engines, compressors and parts 0.11 0.02 0.04
Machine tools 0.00 0.09 0.03
Electric power machinery, switchgear and control gear 0.53 0.04 0.02
Bicycle components and accessories 0.00 0.06 0.02
Miscellaneous manufactures 0.02 0.07 0.02
Construction and earthmoving machinery 0.22 0.38 0.01
Fabricated steel structures, including transmission line towers 0.17 0.01 0.01
Total engineering imports from Bangladesh 29.27 18.16 17.42
Source: Trade Statistics, International Trade Centre. http://www.intracen.org.
3.5 Light Engineering Industries Sector in BangladeshFor pro-poor economic development, the growth of light engineering industries (LEIs) is important to Bangladesh. This sector is a significant segment of the economy in terms of its contribution to employment, output, value addition, and exports (Table 9.7). Light engineering industries are labor-intensive, require less capital, and generate more

Developing Economic Corridors in South Asia
202
employment per unit of capital. They have fewer management problems, low energy costs, and moderate infrastructure requirements. They also have more environment-friendly production processes, and promote agro-industrial linkages, and entrepreneurial talent. The spatial distribution of LEIs helps reduce the pressure of population in big cities. But their survival and rapid growth require infrastructural support.
Table 9.7: Bangladesh’s Exports of Light Engineering Products, 2006–09($ millions)
Products 2006–07 2007–08 2008–09 2009–10
Engineering products total 236.91 219.68 189.48 311.09
Bicycles 54.05 64.28 84.54 110.86
Iron chains 9.66 2.09 1.62 60.42
Others 173.20 153.31 103.32 139.81
Total exports 12,170.30 14,108.37 15,561.85 1,988.35
Source: Dhaka Chamber of Commerce and Industry (DCCI). The DCCI provided this data as part of this study that was commissioned by Research and Information System for Developing Countries, New Delhi and ADB. http://dcci.org.bd
Most developing countries provide institutional support to their LEIs over a long period by setting up different types of technical training centers to help train the workforce in using new and appropriate machines. For example, a CAD/CAM center in Bangalore, India, has been set up by the Government of India in association with the Auto Components Manufactures’ Association (ACMA) to give LEIs the necessary technical support. Bangladesh is yet to establish such centers. The need to establish a common facility center for LEIs to promote training and product development has been stressed at various forums.
4. Trade Barriers This section discusses the barriers that hold back the growth of bilateral trade between Bangladesh and India. A crucial impediment in India–Bangladesh trade is the lack of proper transportation infrastructure. A container from New Delhi to Dhaka has to go by sea via Mumbai and Singapore or Colombo to Chittagong port. From there, it travels by rail to Dhaka, taking approximately 35 days to reach its destination. But with direct rail connectivity between New Delhi and Dhaka, it would reach the Bangladesh capital in five days.
4.1 Roadways Neighboring countries sharing a long border find land routes are more convenient for trade. The primary road link between Bangladesh and West Bengal is Jessore Road, which crosses the border at Petrapole–Benapole, about 95 km north-west of Kolkata. The Petrapole–Benapole crossing is the primary channel for trade between the two Bengals, and 35% of India’s exports to Bangladesh go through it (Table 9.8). Other land ports in West Bengal are Changrabandha–Burimari, Hilli, Mohedipur–Shibganj, Ghojadanga Road–Bhomra, Singabad–Rohanpur, and Radhikapur–Birol. There is a Kolkata–Dhaka passenger bus service, which was launched on 19 June 1999 and is

Economic Corridors and Pro-Poor Private Sector Development in South Asia: A Case Study of Bangladesh and India
203
operated jointly by the West Bengal Surface Transport Corporation and Bangladesh Road Transport Corporation.
Road connectivity exists between NEI and Bangladesh. Bangladesh has sought permission for setting up a trade mission in Guwahati for direct trading with these states. Tripura, one of the Northeastern states, is almost surrounded by Bangladesh and has the potential to develop into a focal point for trade. Most of Bangladesh’s major cities are very close to it— Dhaka (150 km); Sylhet (90 km); Chittagong (75 km); and Comilla (25 km). Passing through Bangladesh, the distance between Agartala and Kolkata is only 350 km. The Agartala–Akhaura land customs station, which is to be developed as an integrated check post (ICP) by India, is the most active border crossing in Tripura.1
The principal customs checkpoints through which trade flows to Bangladesh from Assam are Sutarkandi, Dhubri, Mankachar, and Golokganj. Of these, the major share of Indian exports is through Sutarkandi. Meghalaya, a landlocked state with no rail lines and waterways, depends entirely on roads. Coal and limestone are exported through the checkpoints at Dawki, Borsora, Mahendragang, Ghasuapara, Dalu, Bhaghamara, and Mankachar along the Meghalaya-Bangladesh border. A memorandum of understanding (MoU) has been signed for setting up border haats (markets) along the Meghalaya–Bangladesh border. Mizoram has two land customs stations, at Kawrapuchciah and Demagiri. Table 9.8 has information on the customs checkpoints along the India–Bangladesh border.
The land routes face many physical constraints, such as narrow access roads, lack of parking and warehousing, duplicate checking procedures, and restrictions on crossing the border. Except for about 15-20 km, the 95-km road from Kolkata to Petrapole can hardly be called a highway. It takes an average of 6.2 days for a truck to complete the journey from Kolkata to Benapole. The problem is accentuated by a mismatch between the number of trucks that arrive from India and the lower availability of trucks in Bangladesh.
The operations of the customs authorities lack transparency, and erratic power supply adds to the problems. To avoid needless harassment, all exporters depend on clearing agents who work on a commission basis (0.3% to 1% of shipment value) to take care of the paperwork. Exporters have to bear the overtime allowance of the customs staff if they want their consignments to be cleared on holidays or before/after the scheduled working hours. The Bangladesh border is closed on Friday and Saturday, while India’s is on Sunday. A primary problem in the states of NEI is that the hilly terrain makes the movement of heavy trucks and containers difficult. In addition, brokers, criminals and other fringe elements call the shots in the border areas, and harassment of exporters is a regular occurrence.
1 Work on developing this checkpoint as an ICP began in May 2011 and is expected to be completed in 2013. The ICP will have terminal buildings for passengers, modern facilities for immigration, weigh bridges, scanning equipment, currency exchange booths, a cargo processing building, banks, and other public utilities.

Developing Economic Corridors in South Asia
204
Table 9.8: Land Customs Stations on India–Bangladesh Border
State in India LCS in India LCS in Bangladesh
West Bengal
Petrapole Benapole
Changrabanda Burimari
Hilli Road Hilli
Mohedipur Road Shibganj
Ghojadanga Road Bhomra
Ranaghat/Gede Rail Darshana
Kolkata Port (TT Shed) River Chittagong
Singabad Rail Rohanpur
Radhikapur Rail Birol
Tripura
Agartala Akhaura
Srimantpur Bibir Bazaar
Old Raghnabazar Betuli (Fultali)
Manu Chatlapur
Dhalaighat Khurma
Khowaighat Balla
MizoramKawrapuchciah Thegamukh
Demagiri Rangamati
Meghalaya
Borsora Borosora
Dawki Tamabil
Ghasuapara Karoitoli
Shellabazar Sonamganj
Bholaganj Chattak
Dalu Nakugaon
Mahendraganj Dhanua Kamalpur
Baghmara Bijoypur
Assam
Sutarkhandi Sheola
Karimganj Steamer Ghat Zakiganj
Mankachar
Karimganj Ferry Station Zakiganj
Dhubri Steamer Ghat Rowmati
Note: LCS = Land customs stationSources: (i) CBEC. 1994. Central Board of Excise Notification No. 63/94–cus. (N.T.) dated 21-
11-1994. Central Board of Excise and Customs. Ministry of Finance. New Delhi: Government of India.
(ii) Ministry of Development of North Eastern Region. New Delhi: Government of India. http://www.mdoner.gov.in/content/list
4.2 Inland Water Transport Waterways are the cheapest means of transporting people and goods. Bangladesh and India have a considerable length of navigable waterways, comprising rivers, canals, and

Economic Corridors and Pro-Poor Private Sector Development in South Asia: A Case Study of Bangladesh and India
205
backwaters. But the lack of a proper inland waterways infrastructure means organized water transport services are negligible. In the US, Netherlands and the People’s Republic of China (PRC), the share of inland water transport (IWT) in moving inland cargo is 8% to 20%, while in India and Bangladesh it is around 0.1%. IWT is environment-friendly, creates less pollution, and is safer than roads or railways. Proper channel maintenance prevents soil erosion and siltation of rivers, provides a better quality of water, and protects biodiversity.
There is an Inland Water Transit and Trade Protocol between India and Bangladesh, under which vessels of one country can transit through specified routes of the other. The protocol’s routes are (i) Kolkata–Pandu–Kolkata; (ii) Kolkata–Karimganj–Kolkata; (iii) Rajshahi–Dhulian–Rajshahi; and (iv) Pandu–Karimganj–Pandu. For inter-country trade, there are four ports of call each—Haldia, Kolkata, Pandu, and Karimganj in India, and Narayanganj, Khulna, Mongla, and Sirajganj in Bangladesh. A 50:50 cargo sharing by Indian and Bangladeshi vessels is permitted both for transit and inter-country trade. The two countries later added Ashuganj in Bangladesh and Silghat in India as new routes to the protocol.
NEI has many large and small rivers that provide facilities for water transport, especially in the plains. The Brahmaputra, for example, has several small river ports, such as Sadiya, Dibrugarh, Neamati, Tezpur, Guwahati, Jogighopa, and Dhubri. Besides the protocol routes, several other inter-country water transport routes could stimulate trade and commerce between NEI and Bangladesh.
A number of problems limit expanding the IWT network in the protocol. Infrastructural facilities are inadequate in Kolkata and Haldia, and there is no regular time-bound service to Bangladesh from these ports. Cumbersome documentation processes cause avoidable time delays and loss of earnings. Riverine trade with Bangladesh suffers from bureaucratic hurdles, and high freight rates to compensate for below-capacity loads in one direction. To facilitate movement of larger barges with full loads, buoys need to be installed at strategic locations to mark deep-water routes and access to mooring facilities. Lack of container handling facilities is another irritant.
4.3 Railways During the 1965 Indo-Pakistan war, the only railway link between Dhaka (then in East Pakistan) and Kolkata was shut down. It was resumed in 2008 with the launch of the Maitreyi Express. There are freight train services from Singhabad, Petrapole, Radhikapur, and Mahisasan in India to Rohanpur, Benapole, Birol, and Shabazpur in Bangladesh, respectively.
The railways are the most viable option for conducting trade between NEI and Bangladesh, given the hilly terrain. India wants to extend its network to Sabroom in southern Tripura, 135 km from Agartala, and Akhaura in western Tripura, 6 km from the Agartala railway station. Bangladesh operates regular train services up to Akhaura and various other places close to subdivisional towns in Tripura. If the Akhaura rail link is completed, the distance between Agartala and Kolkata via Guwahati would fall to 519 km from 1,200 km now. A direct service between Silchar and Dhaka is also required for enhancing trade between NEI and Bangladesh.

Developing Economic Corridors in South Asia
206
Bangladesh has a fragmented railway network that is an amalgamation of several gauges. Bangladesh Railway and Indian Railways use different coupling and braking systems, which makes transferring wagons between them impossible. While India is going ahead with a major program of gauge conversion from meter to broad gauge, progress on such work has been tardy in Bangladesh.
4.4 AirwaysAir India and Biman Bangladesh, the national carriers of India and Bangladesh, connect Dhaka with the Indian cities of New Delhi, Mumbai, Kolkata, and Bagdogra. Private carriers also operate regular flights. In NEI, the only international airport is the Lokopriya Gopinath Bordoloi International Airport in Guwahati.
4.5 Maritime NetworkIndia and Bangladesh together have about 9,000 km of coastline, which is dotted with more than 250 ports. Of these, only 27 can be treated as prominent regional ports. All the ports taken together handle more than 500 million tons of cargo, including over six million 20-equivalent units (TEUs) of containers. The main challenges in this area are the following.
(i) Rising handling costs at the ports. (ii) No direct calls between ports in India and Bangladesh, which results in containers
shipped to Bangladesh being transshipped at Colombo or Singapore, imposing additional costs and time.
(iii) Bangladesh’s seaports suffer from inefficient cargo clearance. Port and customs procedures are not automated, which generates considerable paperwork. Shortage of technical training means port labor lacks the required skills.
4.6 Lack of Transit and Transshipment Facility If Bangladesh can capitalize on its location, it can be a bridge between South and Southeast Asia and develop into a regional nucleus for the transportation needs of east India, NEI, Nepal, and Bhutan. It is essential that Bangladesh take into account the governing principles on transit and transshipment mandated under Article V of the General Agreement on Tariffs and Trade (GATT), 1994, and the obligations, options, and flexibilities available to it before accepting or adopting measures on regional connectivity, transit, and transshipment.
When Bangladesh became independent in 1971, it allowed transit on air and sea routes to India, while the key issue of transit through road remained unresolved. Though air transit is used much more than water transit, it has become uneconomical over the years. A Bangladesh–India inland water transit protocol was first signed in 1972. It provides for using each other’s waterways for trade, and maintaining river routes in a navigable condition. It was renewed in 1999, 2001, 2007, and 2010. The countries now allow each other 10 points as ports of call to ferry their goods—Ashuganj, Narayanganj, Mongla, Khulna and Sirajganj for India, and Kolkata, Haldia, Karimganj Silghat and Pandu for Bangladesh. Both the countries allow transit for cargo through eight routes, counting both ways.

Economic Corridors and Pro-Poor Private Sector Development in South Asia: A Case Study of Bangladesh and India
207
In the past decade, India has become increasingly dependent on foreign and private investments for growth, but NEI attracts very little of this. As mentioned, Bangladesh could provide better connectivity for NEI to the rest of India by land and through Chittagong port to the rest of the world. Despite the offer of a hefty transit fee, the Bangladesh government has not allowed India road transit on the grounds of national security. But if this changes, it could benefit both countries.
4.7 High Transaction CostThere are nonprice factors that are not related to the physical process of production of goods, such as administrative processes, government rules and regulations, and infrastructural bottlenecks, for which exporters pay either in terms of time or money before actually shipping export items. A multiplicity of rules and regulations, rule-bound administrative procedures and practices, and inadequate infrastructural facilities and institutional support adversely affect export promotion efforts. These nonprice factors, or transaction costs, throttle the impetus to export growth even when other trade policy issues have been addressed. In the globalized world, export promotion is highly price-sensitive and high transaction costs have to be addressed by trade policy reforms.
The Export-Import Bank of India has in a study classified the “procedural complexities” arising from the following factors (EXIM Bank 2003).
(i) Complex administrative processes; (ii) bureaucratic approach of public agents; (iii) procedural delays in clearing imported inputs for exports at the customs; (iv) multiplicity of rules and regulations; (v) stringent but inefficient implementation processes; (vi) information constraints on credit availability and export remittances; (vii) infrastructural bottlenecks related to transportation and communication; (viii) institutional factors that intensify rent-seeking activities; and (ix) political environment, as it affects any change in policy and all the factors listed
above.
While factors (i) and (ii) are interdependent due to a multiplicity of rules and regulations, excessive paperwork results from administrative processes that are not simple and transparent. Factors (i), (iii), (iv) and (v) could be clubbed together as they take too much time, or what is referred to as “procedural delays.” (Table 9.9) Institutional factors and the political environment prevailing in the exporting country, listed as factors (h) and (i), have a major bearing on all the other factors.
One of the major reasons for the high transaction costs of India’s exports to Bangladesh is cumbersome and complex cross-border trading procedures (Figure 9.1). This increases the possibility of corruption. An efficient, friendly and corruption-free customs can help boost trade and investment (De and Bhattacharyay 2007a).

Developing Economic Corridors in South Asia
208
Table 9.9: Time and Money Spent by Indian and Bangladeshi ExportersParticulars India Bangladesh Number of documents to export 8 6Time to export in days 17 28Cost to export ($ per container) 945 970
Source: World Bank (2010). Doing Business Database. www.doingbusiness.org.
Figure 9.1: Documents Required in Indian Export to Bangladesh
Commercial documents Regulatory documents
Principal Auxiliary 1. ARE Form (Excise)2. Shipping Bill/Bill of Export3. Dock challan4. Vehicle Ticket5. Guarantee Remittance Index
Form (where required)6. Freight payment certificate7. Insurance premium payment
certificate
1. Commercial invoice2. Packing list3. Bill of lading/ Airwaybill4. Certificate of inspection/
Quality control5. Certificate of origin6. Bill of exchange7. Shipment advice8. Insurance certificate
1. Proforma invoice2. Intimation for
inspection3. Shipping instructions4. Insurance declaration5. Application for
certificate of origin6. Mate’s receipt7. Letter to bank of
collection /negotiation of documents
Source: Gupta, Suranjan and Saikat Dutta. 2010. Primary Survey conducted among Engineering Export Promotion Council (EEPC) members under the study Economic Corridors and Pro-Poor Private Sector Development in South Asia. New Delhi: Research and Information Systems for developing Countries.
In this paper, we use a quantifiable definition of transaction cost based on a definition provided by Collins and Fabozzi (1991). This is Transaction costs = fixed costs + variable costs; where Fixed costs = commissions + transfer fees + taxes; and Variable costs = execution costs + opportunity costs. When it comes to exports, the main sources of transaction costs are the process mapping of exports (Table 9.10), and the time spent on documentation (Table 9.11).
Table 9.10: Process Mapping of ExportsHead Number of Processes/
Time taken/CostsComments
Number of steps to be carried out by the exporter from the time of receiv-ing the contract and remittance
28 steps/processes These 28 steps involve the excise authorities, the customs, the DGFT, CHA, ports, banks and RBI
Time taken to complete the entire chain Between 3 to 4 months Certain steps can extend up to 6 monthsTotal cost of process mapping Rs10,000 per shipment This is for a medium-sized engi-
neering export shipment.
Notes: (i) RBI = Reserve Bank of India (ii) DGFT = Directorate General of Foreign Trade (iii) CHA = Cargo Handling AgentsSource: Gupta, Suranjan and Saikat Dutta. 2010. Primary Survey conducted among Engineering
Export Promotion Council (EEPC) members under the study Economic Corridors and Pro-Poor Private Sector Development in South Asia. New Delhi: Research and Information Systems for developing Countries.

Economic Corridors and Pro-Poor Private Sector Development in South Asia: A Case Study of Bangladesh and India
209
Table 9.11: Documents, Signatures, and Time Required for Export ClearanceDocuments Total Number of
Copies RequiredNumber of Signatures
RequiredTime Spent on Typing/Filing the Document
(in minutes)Proforma Invoice 2 2 30Buyer’s Order 2 4 30Letter of Credit 1 4 30–45Shipping Instructions 2 2 30Commercial Invoice 8 8–12 60–75Packing List 8 8–12 60–75Guarantee Remittance Index Form
Not required for Electronic Data
Interchange/2 (shipment to Bangladesh)
(4) (30)
Freight Certificate 2 2 5Certificate of Origin 2 2 30ARE 1 6 16 30Inspection Certificate 2 2 15Insurance 3 3 120Shipping Bill 3 (Drawback)/4 (Duty
Entitlement-Pass Book Scheme)+Export
Promotion Copy of Shipping Bill Copy
4 60
Carting Order 4 5 15Forwarding Note 2 4 10Special Customs Invoice (for US)
2 4 15
Generalized System of Preference (GSP) Certificate of Origin, if required
4 4 60
Fumigation Certificate (if required)
3 3 15
Container Load Plan 3 3 30Railway Receipt 2 2 10Mate’s Receipt 3 3 10Bill of Lading 12 12 60Freight /cargo Manifest 2 2 180–240Application to Bank for Negotiation
2 2 30
Form 15A 1 1 15Total 81 102–114 950–1085
(16 hrs–18 hrs)Notes: (i) EDI = Electronic Data Interchange (ii) DEPB = Duty Entitlement Pass Book Scheme (This scheme has been withdrawn by the
Government of India with effect from 2011.) (iii) EP = Export Promotion Copy of Shipping Bill (iv) ARE1 is the name of the Central Excise Duty rebate form in IndiaSource: Gupta, Suranjan and Saikat Dutta. 2010. Primary Survey conducted among Engineering
Export Promotions Council (EEPC) members under The Study Economic Corridors and Pro-Poor Private Sector Development in South Asia. New Delhi: Research and Information System for Developing Countries.

Developing Economic Corridors in South Asia
210
Table 9.12: Other Fixed and Variable Costs per Shipment/Container
Head Costs in Rs (Indian)
Manpower cost of documentation 6,000
Process mapping execution cost (including charges of the chartered ac-countant for processing RBI 15A) 10,000
Customs House Agent charges including commission 3,000
Port charges for 20-ft container 6,000
Inland transport charges (including railway freight) 6,000 (near port)30,000 (from inland)
Higher incremental freight costs due to poor port infrastructure; higher turnaround time and oligopolistic shipping freight 20,000
Interest cost on bring the shipment from factory to B/L (minimum 15 days) 3,000
Interest cost on account of delays in excise refund (after taking into account DEPB/DDB benefit) @ 5% 2,000
Interest cost on account of delays in value added tax refund (4%) and for having paid income tax (133%) on expected refund for 2 to 3 years 16,000
Interest cost on account of delays in service tax refund 4,000
Total 76,000 (near port)100,000 (inland)
Notes: (i) DEPB = Duty Entitlement Pass Book Scheme (This scheme has been withdrawn by the Government of India with effect from October 2011.)
(ii) DDB = Duty Drawback Scheme
Source: Gupta, Suranjan and Saikat Dutta. 2010. Primary Survey conducted among Engineering Export Promotions Council (EEPC) members under The Study Economic Corridors and Pro-Poor Private Sector Development in South Asia. New Delhi: Research and Information System for Developing Countries.
So, the total transaction cost would be manpower cost of documentation plus other fixed and variable costs, which gives Rs 76,000 or Rs 100,000 approximately. The free on board (FOB) value of a medium-size engineering export consignment would be $20,000 or Rs 1,000,000. Thus, the transaction cost as a percentage of FOB value would be (Rs 76,000/Rs 1,000, 000)*100 = 7.6% of the FOB value of exports for shipment closer to ports; and (Rs 1,000,000/1,000,000)*100 = 10% of the FOB value of exports for shipments from inland cities (Table 9.12).
For low-value engineering exports, of say $10,000, the transaction cost as a percentage of FOB value will rise proportionately, while the reverse will happen in the case of high-value engineering goods.
India and Bangladesh need to minimize trade transaction costs by removing visible and invisible barriers to trade. Transaction costs can be tackled only through an improved and integrated trading infrastructure, which will be responsible for the faster movement of goods and services.
4.8 High Nontariff BarriersCountries resort to many mechanisms to restrict imports. Till the beginning of the 1970s, tariffs were the principal mode of protectionism. But successive rounds of

Economic Corridors and Pro-Poor Private Sector Development in South Asia: A Case Study of Bangladesh and India
211
GATT negotiations saw a large drop in the average tariff levels of manufactured goods, and countries then resorted to a form of administered protection known as nontariff barriers (NTBs). There is no single internationally agreed list of NTBs. In general, NTBs cover all measures affecting trade, and any list will not only be very long, but also grow as governments invent new measures. Being nontransparent, NTBs are difficult to identify and analyze. In the Bangladesh-India context, the following NTBs exist.
(i) Quantitative Limitation of TRQ. Under an MoU on tariff rate quota, Bangladesh can export only up to eight million pieces of apparels to India every year. Though the export potential to India is vast, exporters now hardly bother because of the quota limitation. This constraint of eight million pieces should be done away with.
(ii) Mandatory Requirement of Standardization Certificates. Bangladeshi exporters have to obtain standardization certificates from India’s Central Food Laboratory (CFL), which has offices only in Delhi, Kolkata, and Guwahati, for every consignment of biscuits and processed food products. Indian customs does not recognize certificates issued by the Bangladesh Standard and Testing Institute (BSTI). The BSTI and the Bureau of Indian Standards (BIS) are negotiating to resolve this problem. But till it happens, Indian customs should be requested to accept BSTI certificates.
(iii) Customs and Administrative Procedures. Bangladeshi exporters are very dissatisfied with Indian customs services and officials, whom they consider an NTB. Indian customs ask for laboratory tests for every consignment of food products, cosmetics, and leather and textile products. Samples have to be sent to distant laboratories and a report normally takes 15–20 days. Original South Asia preferential trading agreement (SAPTA) certificates issued by the Bangladesh Export Promotion Bureau are largely ignored by Indian customs. Officials also ask exporters and importers to submit the rules of the original calculation along with the documents, ignoring the criteria set by the regional agreement.
(iv) Entry of Trucks to Customs Stations. At some land customs stations, such as Benapole–Petrapole, Banglabanda–Phulbari, and Bibirbazar–Srimantapur, transshipment has to be done at the zero point.2 The Indian authorities do not allow Bangladeshi trucks to enter the sheds to load and unload goods, which exposes them to rain and other damages.
(v) Restriction on Jute Bags from Bangladesh. It has been mandatory since 2001 that jute bags from Bangladesh carry a “Made in Bangladesh” label. There is no such compulsory requirement on Indian jute bags entering Bangladesh. India has imposed another barrier by ordering that the jute bags should not have an oil content (non-halogenated hydrocarbon) of more than 3%. The respondents of the survey said the compulsory labeling had pushed up production costs by 3%, negatively affecting exports.
2 Zero point—means end of country’s territory or beginning depending upon which side the person comes from. So in case of Bangladesh, goods have to be loaded twice.

Developing Economic Corridors in South Asia
212
(vi) Paratariff Barriers on Bangladeshi Products. Some of the paratariffs are as follows.
(a) Countervailing duties (CVDs) are imposed at 4% and 8% on the tariff value of cotton and noncotton items, respectively.
(b) Educational Cess is imposed at 0.08% and 0.16% on the tariff value of cotton and noncotton items, respectively.
(c) Higher Educational Cess is imposed at 0.04% and 0.08% on the tariff value of cotton and noncotton items, respectively.
(d) Special additional duty (SAD) is imposed at 4% on the total of CVD, Educational Cess and Higher Educational Cess.
4.9 Other IssuesPorts in both countries possess inadequate infrastructure facilities, and their management is slipshod, with administrators doing little to make them more active and trader-friendly. To this has to be added the harassment at customs checkpoints, and corruption among customs personnel.3
5. Impact of Trade Barriers on Bilateral Trade between India and Bangladesh
Wide-ranging trade barriers prevent India and Bangladesh from fully realizing the benefits of bilateral trade. The governments of both these countries have pursued policies of trade liberalization since the beginning of the 1990s, but there are persisting issues and barriers that restrict seamless bilateral trade.
Had there been better connectivity between the two countries, Bangladesh’s trade with both NEI and the rest of India would have been a major source of revenue. For example, tea from Assam travels 1,400 km to the Kolkata port, whereas the distance could be truncated by 60% if it went to Chittagong port. Goods from Agartala travel 1,645 km to Kolkata, while the distance would be 350 km if they went through Bangladesh. Opening up entry through Chittagong port would incentivize exploitation of natural resources in NEI as well as northern Myanmar. Bangladesh could pick up containers from Kolkata to deliver to NEI, leading to increased investment by India.
NEI is underdeveloped because of a poor communication network, and promoting investment in it would enhance economic relations between India and Bangladesh. Bangladesh’s Grameenphone experience could be emulated for providing connectivity to rural areas and bridging the digital divide. This would act as a catalyst for private-sector investment.
6. Survey ResultsA survey was carried out among India’s Engineering Export Promotion Council (EEPC) members for a study titled “Economic Corridors and Pro-Poor Private Sector Development in South Asia.” The EEPC commissioned the Dhaka Chamber of Commerce and Industries (DCCI) to conduct a similar survey among its members in 3 Information provided by Dhaka Chamber of Commerce and Industry (DCCI).

Economic Corridors and Pro-Poor Private Sector Development in South Asia: A Case Study of Bangladesh and India
213
Bangladesh. This study, through these surveys, tries to understand the implications of seamless connectivity between the two countries would have on trade and pro-poor private-sector development.
(i) Preferred Trade Route. When asked about their preferred trade route, the majority of the respondents on either side picked Benapole Petrapole. Among Indian exporters, 70% said they preferred it, while other preferences were Hilli (12%), Agartala (7%), and Changrabandha–Burimari (4%) (Table 9.13).
Table 9.13: Trade Route Preferred by Indian Respondents
Name of Land Port Percentage of Respondents
Benapole–Petrapole 70
Hilli 12
Source: Survey conducted by Engineering Export Promotion Council (EEPC) India and Dhaka Chamber of Commerce and Industry (DCCI) amongst their members
Among Bangladeshi respondents, 55% preferred Benapole–Petrapole. The other routes mentioned were Akhaura–Agartala (33%), Shillong (4%), and Guwahati (6%) (Table 9.14).
Table 9.14: Trade Route Preferred by Bangladeshi Respondents
Name of land port Percentage of respondents
Benapole–Petrapole 55
Akhaura–Agartala 33
Source: Survey conducted by Engineering Export Promotion Council (EEPC) India and Dhaka Chamber of Commerce and Industry (DCCI) amongst their members
The respondents mentioned that the bus service from Agartala did not carry engineering products, though it took fish and other raw materials. By developing Agartala’s infrastructure, it could be used as an alternative to Benapole.
When respondents were asked about the alternative trade routes India and Bangladesh should work on to build successful economic (road/rail) corridors between the two countries, they did not come up with any. But most of the respondents believed the railway was the safest and cheapest mode of transport, though only 5.17% in Bangladesh and 3% in India used it.
(ii) Mode of Transport and Cost. The respondents were asked about their preferred mode of transport for carrying out trade. Of Indian exporters, 70% chose land transport. Other modes such as sea, air, and rail were used by 5%, 22%, and 3%, respectively (Table 9.15).
Most of the Bangladeshi respondents also said that they preferred land transport. While 50% use roadways, 38.48%, 5.17% and 10.35% used waterways, railways and airways, respectively (Table 9.16).

Developing Economic Corridors in South Asia
214
Table 9.15: India: Mode of Transport and Cost
Trade Route % Respondents by Trade Route Chosen
Cost of Transport Remarks
Road 70 Moderately expensive Time consumingSea 5 Moderately expensive Safe and time consumingAir 22 Expensive Safe and time savingRail 3 Moderately expensive Safe and less time consuming
Source: Survey conducted by Engineering Export Promotion Council (EEPC) India and Dhaka Chamber of Commerce and Industry (DCCI) amongst their members
Table 9.16: Bangladesh: Mode of Transport and Cost
Trade Route % Respondents by Trade Route Chosen
Cost of Transport Remarks
Road 50 Moderately expensive Risky and time consumingSea 34.48 Moderately expensive Safe and secureAir 10.34 Expensive Time savingRail 5.17 Moderately expensive Safe and less time consuming
Source: Survey conducted by Engineering Export Promotion Council (EEPC) India and Dhaka Chamber of Commerce and Industry (DCCI) amongst their members
(iii) International Airports and Maritime Transport. The survey revealed 37% of the Bangladeshi respondents preferred Kolkata airport, while 27% favored Delhi airport, and 29% other airports. Indian exporters mostly used Hazrat Shahjalal International Airport in Dhaka. The Indian respondents did not comment on inland or maritime trade, saying the land route was less time consuming. Bangladeshi respondents said using Indian sea ports took too much time and port services were mired in red tape.
(iv) Measures for Enhancing India-Bangladesh Border Trade. The survey brought to light various factors that hinder the free flow of cross-border trade (Table 9.17). Most of the respondents emphasized the need for a direct transit facility between the two countries. They said advanced transport and communication facilities were the mainstay of successful bilateral trade, suggesting that both governments focus on this.
Table 9.17: Measures Suggested for Enhancing Bilateral Trade
Suggestion Indian Respondents (%) Bangladeshi Respondents (%)Direct transit facility 41 32Reduce tax and fees 10 19Identical export/import policy for both countries 17 14
Development of infrastructure (technology /connectivity/quality) 24 22
Border open 24 × 7 × 365 6 10Others 2 3
Source: Survey conducted by Engineering Export Promotion Council (EEPC) India and Dhaka Chamber of Commerce and Industry (DCCI) amongst their members

Economic Corridors and Pro-Poor Private Sector Development in South Asia: A Case Study of Bangladesh and India
215
(v) Customs Clearance. Bangladeshi exporters were dissatisfied with the services provided by the Indian customs authorities, and Indian respondents complained about unnecessary delays caused by cumbersome administrative procedures. Table 9.18 highlights the barriers mentioned by the respondents.
Table 9.18: Barriers Faced by Respondents in India and Bangladesh
Category ResponsesTariff(as mentioned by Bangladeshi respondents)
CVDs are imposed at 4% and 8% on tariff value of cotton and noncotton items, respectivelyEducational cess is imposed at 0.08% and 0.16% on tariff value of cotton and noncotton items, respectively Higher educational cess is imposed at 0.04% and 0.08% on tariff value of cotton and noncotton items, respectivelySAD is imposed at 4% on the total of CVD, Educational cess and Higher educational cess
Physical infrastructure Ports are not automatedLoading and unloading is time consumingErratic power supply at portsNo facilities for mechanical unloading of cargoBangladesh border closed on Fridays and SaturdaysHilly terrain of NEI makes movement of heavy vehicles difficult Irregular flight schedule of Biman BangladeshShortage of cargo clearance facilities at Bangladesh portsLack of direct transit facility Harassment by anti-social elementsUnscrupulous customs personnel
NTBs The MoU on tariff rate quota allows Bangladesh to export only up to 8 million pieces of apparels to India annually Indian customs does not recognize the Bangladesh Standard and Testing Institute (BSTI) certificate, making Central Food Laboratory (CFL) reports mandatory for every consignment of biscuits and food products into India Extensive documentation required by Indian customs inhibits the free flow of trade and leads to superfluous processing delays A major nontariff barrier on Bangladeshi jute bags makes it mandatory to label them “Made in Bangladesh”
Financials The process of acquiring bank credit is time-consuming and cumbersome. High interest rates discourage small enterprises from participating in international trade
Customs Indian customs requires extensive documentation, which inhibits free flow of trade and leads to superfluous processing delays Customs and immigration authorities at Petrapole prefer to carry out their work manually, resulting in additional costs and delays to traders. Unscrupulous customs personnel force traders to grease their palms, leading to an enhanced cost of doing business Indian customs asks for laboratory tests that take 15–20 days for every consignment of food products, cosmetics, and leather and textile products
Notes: (i) CVD = Countervailing duty (ii) SAD = Special additional duty (iii) NEI = North East India (iv) MOU = Memorandum of Understanding (v) BSTI = Bangladesh Standard and Testing Institute (vi) CFL = Central Food Laboratory

Developing Economic Corridors in South Asia
216
(vi) Measures for Enhancing Bilateral Trade. The respondents believed that infrastructural development was most crucial for promoting bilateral trade between India and Bangladesh. The followings suggestions were made to ensure this.
(a) Both the countries should focus on modernizing land ports. (b) Roads have to be improved and widened, and flyovers constructed. Parking
and warehousing facilities also need to be provided. (c) Land customs checkpoints must be open for uninterrupted transactions and
not be closed on any holiday. (d) The border area has to be rid of brokers, criminals and other unsavory
characters. (e) Efficient person-to-person communications, technology transfer, and timely
shipment and delivery have to be ensured. (f) All ports must have mechanized loading facilities. (g) Regular shipping facilities are required between India and Bangladesh. (h) Complex and repetitive documentation procedures that delay customs
clearance should be addressed. (i) Container handling facilities are required for the movement of merchandise
across borders. (j) The issue of Bangladesh Railway and Indian Railways using different coupling
and braking systems needs to be addressed. (k) Private-sector participation is necessary for efficient cargo handling. (l) Bangladesh’s sea ports have to be modernized. On transit and transshipment, the respondents believed Bangladesh could
provide better connectivity for NEI to the rest of India by land, and to the rest of the world through Chittagong port. Coming to transaction costs, they had the following proposals.
(m) Make a single document acceptable to all agencies the principal document for exporters. For example, this could be the commercial invoice.
(n) Dispense with ARE1.4 All information required in ARE1 may be included in extra copies of the commercial invoice, thus eliminating two steps.
(o) Dispense with filing and maintaining a bond with the excise department. (p) Dispense with filing lengthy proof of export documents with the excise
office. The commercial invoice may be filed with all information. (q) Dispense with submitting a transference copy of the shipping bill, and this
will eliminate two steps. (r) The customs server should be aligned with the Directorate General of
Foreign Trade (DGFT) server at all times. This will get rid of two steps to do with verification.
The respondents also had a number of suggestions related to administrative efficiency and technology.
(s) A system of self-assessment with random checks needs to be implemented to ensure efficient administration and prevent harassment of traders.
4 ARE1 is the name of the Central Excise Duty rebate form in India. This rebate is taken under Rule 18 and Rule 19 of the Central Excise rules, 2002.

Economic Corridors and Pro-Poor Private Sector Development in South Asia: A Case Study of Bangladesh and India
217
(t) Smuggling and trafficking have to be restricted with the help of information technology.
(u) Ethical practices have to be followed at customs points to ensure shipments are not delayed because of unofficial reasons.
(v) The banking system needs to be simplified so that businessmen can easily get help from it.
(w) Technology transfer must be ensured between the two countries. (x) Technical knowledge sharing must be encouraged with the setting up of
mutual facilities like laboratories. They were of the view that customs procedures for exports and imports have to
be rationalized by eliminating redundant approvals. It was also pointed out that technological initiatives to integrate the different systems and processes used by various authorities and agencies could greatly reduce transaction time and cost.
(vii) Potential Areas for Investment. Respondents were asked whether seamless movement of goods and services would lead to a rise in bilateral investments between the two countries (Table 9.19). Those who replied positively were asked to identify potential areas for investment.
Table 9.19: Potential Areas for Investment Identified by Respondents
Indian Investment in Bangladesh Bangladeshi Investment in India
(i) Raw materials(ii) Heavy metals and machinery(iii) Electrical goods(iv) Chemicals(v) Cotton
No such areas were identified by the Indian respondents. A few said Bangladesh can invest in SEZs in India. But to identify sectors, a thorough study is required. Bangladeshi respondents said they can invest in cement and battery production in India.
Note: SEZ = Special economic zone
Source: Survey conducted by Engineering Export Promotion Council (EEPC) India and Dhaka Chamber of Commerce and Industry (DCCI) amongst their members.
The respondents were also asked to identify the problems or barriers that were obstructing the bilateral flow of investment (Table 9.20).
(a) The Indian respondents said corruption was a big problem in Bangladesh and it deterred foreign investment.
(b) Insufficient power supply discourages investment in power-intensive industries in Bangladesh.
(c) Tax administrators in Bangladesh have discretionary authority and they use it to bother businessmen and investors. It has also made many of the officials very corrupt.
(d) Policies and their implementation do not go hand-in-hand because of lack of administrative communication and coordination among government agencies. This results in high business costs and hassles to investors.
(e) The Bangladeshi respondents highlighted the lack of physical infrastructure, and complex bureaucratic procedures as major hurdles for investing in India.

Developing Economic Corridors in South Asia
218
Table 9.20: Factors Impeding Bilateral Investment
Category Investment Climate in Bangladesh
(% Indian Respondents Citing these Factors)
Investment Climate in India
(% Bangladeshi Respondents Citing these Factors)
Availability of low-cost labor 37 28
Investor-friendly policy regime 10 24
Infrastructure constraints 22 18
Complex bureaucratic procedures 15 18
Availability of institutional infrastructure 11 8
Political climate 5 4
Source: Survey conducted by Engineering Export Promotion Council (EEPC) India and Dhaka Chamber of Commerce and Industry (DCCI) amongst their members.
7. Conclusions and Recommendations Bangladesh has a growing trade deficit with India. A limited export base, backward industries, inadequate infrastructure, and low productivity have contributed to this. India’s tariffs and NTBs, a huge volume of illegal trade, and its diversified exports, and technologically advanced industrial base have added to the imbalance. The governments, private investors, and businessmen of both countries need to work towards reducing the deficit.
Both countries stand to make huge gains by establishing closer trade relations. Physical connectivity alone cannot guarantee seamless movement of goods and people across countries. Inefficient and lengthy cross-border procedures have to be eliminated. There is the need for a customs agreement that provides for the temporary import of vehicles from one country to the other for travel in connection with business. But the most crucial nonphysical barrier is the lack of a bilateral transport agreement to facilitate the uninterrupted movement of goods and vehicles across borders.
India and Bangladesh, along with other South Asian partners, should develop a regional transportation and transit system that would offer efficient transportation options and low transaction costs that are competitive with those found elsewhere. Connectivity with Nepal and Bhutan could mean Bangladesh can provide them with transport and port services. Chittagong port could become the busiest port in South Asia, serving the states of NEI, Nepal, and Bhutan, while the country’s underutilized ports are also pressed into service.
Northeast India is rich in both natural and human resources, which are important preconditions for development. However, their optimal use will not be possible without proper connectivity with Bangladesh, the other neighboring countries, and the rest of India, for which cooperation is necessary. If NEI develops economically through greater connectivity, it will automatically boost exports from Bangladesh.

Economic Corridors and Pro-Poor Private Sector Development in South Asia: A Case Study of Bangladesh and India
219
Economic corridors primarily take advantage of underutilized potential to ensure effective integration between industry and infrastructure. This is a prerequisite to attract investments into export-oriented industries and manufacturing, which leads to economic and social development. The participation of the private sector is indispensable to support rapid growth and industrialization, to create the infrastructure for economic development, to generate employment, and to distribute wealth and income more widely. Both India and Bangladesh should initiate steps to ensure private-sector participation, and use the funds this would spare for making basic social services such as clean drinking water, sanitation, healthcare, and education available to the people. In the private sector, SMEs are very important for pro-poor economic development, and both the countries should focus on fostering them.
The two major suggestions had to do with SME clusters and tax reform. In the World Trade Organization (WTO) regime, it is impractical for a single small unit to compete with global players. Similar SME units should come together to form clusters. Clusters are defined as sectoral and geographical concentrations of micro, small, and medium enterprises with interconnected production systems. This leads to firm/unit-level specialization, and developing local suppliers of material inputs, and human resources. The availability of local markets/intermediaries for products is also a characteristic of a cluster. Cluster development is of great significance to enable the SME sector to stand up to global challenges, and India and Bangladesh should focus on this aspect. In taxation, it was felt that a goods and services tax (GST) should be implemented as early as possible in India to reduce the complexity of the present system.
With greater regional integration, seamless connectivity, and the removal of bottlenecks, India and Bangladesh have the potential to drive the economic growth of South Asia. The development of economic corridors and private-sector investment will go a long way toward alleviating poverty in this region when jobs and income lead to a better standard of living.

Developing Economic Corridors in South Asia
220
References
Abdin, Md. Joynal. 2009. Need for Economic Integration of South Asia. The Independent. 27 July. http://www.theindependent-bd.com/details.php?nid=135630
Banerjee, P. 2009. Sub-regional Co-operation in Eastern India and Bangladesh: Prospects, Problems and Policies. Review of Market Integration. 1 (1). pp. 11–35.
Collins, Bruce and Frank J. Fabozzi. 1991. A Methodology for Measuring Transaction Costs. Financial Analysts Journal. 47 (March/April) pp. 24–36.
De, Prabir and B. N. Bhattacharyay. 2007a. Prospects of India–Bangladesh Bilateral Economic Cooperation: Implications for South Asian Regional Cooperation. ADBI Discussion Paper 78. Tokyo: Asian Development Bank Institute.
De, Prabir and B. N. Bhattacharyay. 2007b. Deepening India–Bangladesh Economic Cooperation: Challenges and Opportunities. RIS-DP No. 130. New Delhi: Research and Information System for Developing Countries.
De, Prabir and Buddhadeb Ghosh. 2008. Reassessing Transaction Costs of Trade at the India-Bangladesh Border. Economic and Political Weekly. 43 (29). pp. 69–79.
Dutta, Piyali. 2010. India-Bangladesh Relations – Issues, Problems and Recent Developments. Special report. New Delhi: Institute of Peace and Conflict Studies.
EXIM Bank. 2003. Transaction Costs of India Exports: A Review. Mumbai: Export–Import Bank of India.
Inland Waterways Authority of India. 2007. Perspectives of Inland Water Transport Development in the Northeast. Background Paper No. 7. New Delhi: IWAI.
Ishid, Masami. 2009. Special Economic Zones and Economic Corridors. Discussion Paper Series. Jakarta: Economic Research Institute for ASEAN and East Asia.
Pattanaik, Smruti S. 2010. India’s Neighbourhood Policy: Perceptions from Bangladesh. Strategic Analysis. New Delhi: Institute for Defence Studies and Analyses.
Rahman, M. M. 2005. Bangladesh–India Bilateral Trade: Causes of Imbalance and Measures for Improvement. School of Economics Working Papers. Sydney: University of Sydney.
Rahmatullah, M. 2007. BIMSTEC – Japan Cooperation in Transport: Bangladesh Perspective. CSIRD Discussion Paper No. 31. Kolkata: Centre for Studies in International Relations and Development.
Sengupta, J. 2007. Time to Boost India–Bangladesh Trade and Economic Relations. ORF Issue Brief No. 10. New Delhi: Observer Research Foundation.
Taneja, Nisha, Shravani Prakash, Pallavi Kalika. 2013. India’s Role in Facilitating Trade under SAFTA. ICRIER Working Paper 263. New Delhi: Indian Council for Research on International Economic Relations.

Appendix 1
221
Tentative List of Economic Corridors
S.No. Corridor Name Location Countries1 North–South Economic Corridor Asia PRC, Thailand, Lao PDR,
Myanmar and Viet Nam2 East–West Economic Corridor Asia Viet Nam, Myanmar, Lao PDR,
Thailand3 South Economic Corridor Asia Thailand, Cambodia, Viet Nam
and Lao PDR4 Kunming–Haiphong Transport
Corridor–Noi Bai–Lao Cai HwayAsia PRC, Viet Nam
5 GMS Southern Coastal Road Corridor II Viet Nam6 CAREC Regional Road Corridor
Improvement (Sary Tash–Karamik)Kyrgyz Republic
7 Mekong ICT Project Asia Lao PDR8 Indonesia/North Java Corridor Asia Indonesia, Indonesia 9 Indonesia/Eastern Sumatra Corridor Asia Indonesia, Sumatra 10 East Asia Industrial Corridor Asia Viet Nam, India, Thailand11 CAREC Transport Corridor 1b Asia Kazakhstan, PRC,
Russian Federation12 Western Regional Road Corridor Asia Mongolia, PRC,
Russian Federation 13 Caucasus Corridor North America Armenia and Georgia14 CAREC Transport Corridor 2 North America Georgia15 Pacific Northwest Corridor North America US16 North-Eastern Corridor North America US17 Central Western Corridor North America18 Central Eastern Corridor North America US and Canada 19 Atlantic Corridor North America US and Canada 20 Pacific Corridor North America Canada, US and Mexico21 Quito Guayaquil Corridor South America Ecuador22 Buenos Aires–Santiago–Valparaiso Corridor South America23 Brazil–Argentina–Chili Corridor South America Brazil, Argentina, Chili 24 Bolivia–US Corridor America25 Latin American Intraregional Corridor South America26 US/Costa Rica Corridor America27 BRT Corridor South America Brazil28 Peripheral Bogota Corridor South America Colombia29 10 Pan European Corridors Europe European Union
Notes: (i) CAREC = Central Asia Regional Economic Cooperation (ii) PRC = People’s Republic of China (iii) Lao PDR = Lao People’s Democratic Republic (iv) BRT = Bus Rapid Transit (v) GMS = Greater Mekong Subregion (vi) ICT = Information and Communication Technology

222
Appendix 2
Trade Costs Calculation and Impact of Possible Liberalization
This is a vertical supply chain model where Indian producers supply cotton yarn and units in Bangladesh produce readymade garments (RMG), mainly T-shirts and polo shirts. The trade cost is partial since it considers only the direct transport cost and the imputed cost of waiting on both sides of the border for loading/unloading and customs clearance.
Goods are transported from Ludhiana (Punjab, India) to Dhaka (Bangladesh). The Indian border checkpoint is at Petrapole (Figure A2.1).
The transportation time by either a 10-ton truck or 22-ton container truck from Ludhiana to Petrapole is seven days. The waiting time at the checkpoint for loading/unloading and customs checking is three days. The materials are then loaded on a Bangladeshi truck that carries only 10 tons (due to narrow roads). The Bangladesh checkpoint in Benapole also involves a waiting time of three days on an average. There is no ground rent for waiting near the checkpoint on the Bangladesh side. It takes three days to reach Dhaka from the border. Thus, the total time for a consignment to reach Dhaka (destination) from Ludhiana (origin) is on an average 16 days. Thus, for the Indian side, the opportunity cost of waiting is 43% of the actual travel time, while for the Bangladesh side, it is 100% of the actual travel time. This has to be taken into account as part of the trade cost.
From the survey, it is found that the minimum cost of transportation for the Indian side, including the opportunity cost of waiting, is Rs4 per kg and the maximum Rs6.5 per kg. The minimum and maximum cost for the Bangladesh side is Tk1.5 per kg and Tk2.1 per kg, respectively. Assuming an exchange rate of Tk1 = Rs0.6, and taking the time division between India and Bangladesh as 5:3, the average cost of transportation (or partial trade cost) comes out as a minimum of Rs4.9 per kg and a maximum of Rs7.76 per kg. Assuming Rs1 = $0.02, the minimum cost is $0.098 and the maximum cost is $0.1552.
The next part is the calculation of the revenue earned by RMG producers in Bangladesh from selling either a T-shirt or polo shirt. The motive is to avoid a direct calculation of the share of transportation cost in the total value or the cost of the product. The price and weight data were gathered from the survey as well as a website (www.alibaba.com), which give credible price ranges for the two products. The minimum weight of a T-shirt is 160 gm ($1.5 per piece) and the maximum 180 gm ($3). Since this weight is basically the weight of yarn, with 1 kg of yarn, six minimum and 5.5 maximum weight T-shirts can be produced. The minimum revenue from this is $9 and the maximum $16.5. Similar ranges for polo shirts are a minimum weight of 180 gm with an average price of $3.5 and a maximum weight of 200 gm with an average price of $6. Thus the transport cost (or partial trade cost) as a share of revenue is as follows.

Appendix 2
223
Source: SAARC Secretariat
Figu
re A
2.1:
Roa
d Tr
ansp
ort R
oute
from
Jal
andh
ar to
Dha
ka

Developing Economic Corridors in South Asia
224
For T-shirts (i) Minimum share of transport cost as a percentage of revenue = minimum transport
cost/maximum revenue = $0.098/$16.5 = 0.59%. (ii) Maximum share of transport cost as a percentage of revenue = maximum transport
cost/minimum revenue = $0.1552/$9 = 1.72%.
Similarly, for polo shirts (i) Minimum share of transport cost = 0.33%. (ii) Maximum share of transport cost = 0.81%.
PostliberalizationWe follow the Deardorff model. Suppose the cheapest transporter takes the consignment all the way. In this case, it would be a Bangladesh transport operator. This does not take into account environmental issues, like whether the Bangladeshi trucks satisfy pollution norms because they are generally poorly maintained (Subramanian and Arnold 2001). We adopt the costs incurred for the Bangladeshi segment to the entire route and reduce the border waiting time by three days. This possibly underestimates the true cost since Indian roads may have higher toll taxes. So the estimate presumes a similar road tax structure in the two countries (not entirely unfounded; under liberalization, such taxes tend to converge).
The new average cost of transportation of 1 kg of yarn has the following ranges.Minimum is $0.039 and maximum is $0.055.
Carrying on the same calculations as before, we arrive at the values reported in
Table 3.5.

Appendix 3
225
The Global Trade Analysis Project Model
The Global Trade Analysis Project (GTAP) model is a comparative static, global computable general equilibrium (CGE) model and is based on neoclassical theories.1 The linearized model uses a common global database for the CGE analysis. The model assumes perfect competition in all markets, constant returns to scale in all production and trade activities, and profit and utility maximizing behavior by firms and households, respectively. It is solved using the software GEMPACK (Harrison and Pearson 1996).
Household Income and ExpenditureIn the GTAP model, each region has a single representative household, termed the regional household. The income of the regional household is generated through factor payments and tax revenues (including export and import taxes) net of subsidies. The regional household allocates expenditure over private household expenditure, government expenditure, and savings according to a Cobb Douglas per capita utility function. Thus, each component of final demand maintains a constant share of total regional income.2
The private household buys commodity bundles to maximize utility, subject to its expenditure constraint. The constrained optimizing behavior of the private household is represented in the GTAP model by a Constant Difference of Elasticity (CDE) implicit expenditure function. The private household spends its income on consumption of both domestic and imported commodities and pays taxes. The consumption bundles are Constant Elasticity of Substitution (CES) aggregates of domestic and imported goods, where the imported goods are also CES aggregates of imports from different regions. Taxes paid by the private household cover commodity taxes for domestically produced and imported goods and the income tax net of subsidies.
Government ConsumptionThe government also spends on domestic and imported commodities and pays taxes. For the government, taxes consist of commodity taxes for domestically produced and imported commodities. Like the private household, government consumption is a CES composition of domestically produced goods and imports.
Savings and InvestmentIn the GTAP model, the demand for investment in a particular region is savings driven. In a multicountry setting, the model is closed by assuming that regional savings are homogenous and contribute to a global pool of savings. This is then allocated among 1 Full documentation of the GTAP model and the database can be found in Hertel (1997) and also in
Dimaranan and McDougall (2002).2 Savings enter in the static utility function as a proxy for future consumption.

Developing Economic Corridors in South Asia
226
regions for investment in response to the changes in the expected rates of return in different regions. If all other markets in the multiregional model are in equilibrium, if all firms earn zero profits, and if all households are on their budget constraint, such a treatment of savings and investment will lead to a situation where global investment must equal global savings, and Walras’ Law will be satisfied.
Producers’ IncomeIn the GTAP model, producers receive payments for selling consumption goods and intermediate inputs in the domestic market and to the rest of the world. Under the zero profit assumption employed in the model, these revenues must be precisely exhausted by spending on domestic intermediate inputs, imported intermediate inputs, factor income and taxes paid to regional households (taxes on both domestic and imported intermediate inputs and production taxes net of subsidies).
Production TechnologyIn the GTAP model, a nested production technology is considered with the assumption that every industry produces a single output and constant returns to scale prevail in all markets. Industries have a Leontief production technology to produce their output. Industries maximize profits by choosing two broad categories of inputs—a composite of factors (value added) and a composite of intermediate inputs. The factor composite is a CES function of labor, capital, land, and natural resources. The intermediate composite is a Leontief function of material inputs, which are in turn a CES composition of domestically produced goods and imports. Imports are sourced from all regions.
International Trade The GTAP model employs the Armington assumption which provides the possibility of distinguishing imports by their origin and explains intra-industry trade of similar products. Following the Armington approach, the import shares of different regions depend on relative prices and the substitution elasticity between domestically and imported commodities.

Appendix 4
227
Commodity Classification in the Global Trade Analysis Project Model
No. Sector Description No. Sector Description
1 Paddy rice 30 Wood products
2 Wheat 31 Paper products, publishing
3 Cereal grains nec 32 Petroleum, coal products
4 Vegetables, fruit, nuts 33 Chemical, rubber, plastic prods
5 Oil seeds 34 Mineral products nec
6 Sugar cane, sugar beet 35 Ferrous metals
7 Plant-based fibers 36 Metals nec
8 Crops nec 37 Metal products
9 Cattle, sheep, goats, horses 38 Motor vehicles and parts
10 Animal products nec 39 Transport equipment nec
11 Raw milk 40 Electronic equipment
12 Wool, silkworm cocoons 41 Machinery and equipment nec
13 Forestry 42 Manufactures nec
14 Fishing 43 Electricity
15 Coal 44 Gas manufacture, distribution
16 Oil 45 Water
17 Gas 46 Construction
18 Minerals nec 47 Trade
19 Meat: cattle, sheep, goats, horse 48 Transport nec
20 Meat products nec 49 Sea transport
21 Vegetable oils and fats 50 Air transport
22 Dairy products 51 Communication
23 Processed rice 52 Financial services nec
24 Sugar 53 Insurance
25 Food products nec 54 Business services nec
26 Beverages and tobacco products 55 Recreation and other services
27 Textiles 56 Public admin/Defense/Health/ Education
28 Wearing apparel 57 Dwellings
29 Leather products
Note: Nec = Not elsewhere classified

228
Appendix 5
Region Aggregation in the Global Trade Analysis Project Model
No. New Region Comprising Old Regions
1 Bangladesh Bangladesh
2 India India
3 Pakistan Pakistan
4 Sri Lanka Sri Lanka
5 Rest of South Asia Rest of South Asia
6 North America Canada; US; Mexico; Rest of North America
7 EU_25 Austria; Belgium; Cyprus; Czech Republic; Denmark; Estonia; Finland; France; Germany; Greece; Hungary; Ireland; Italy; Latvia; Lithuania; Luxembourg; Malta; Netherlands; Poland; Portugal; Slovakia; Slovenia; Spain; Sweden; United Kingdom
8 Rest of the world Australia; New Zealand; Rest of Oceania; People’s Republic of China; Hong Kong, China; Japan; Republic of Korea; Taipei,China; Rest of East Asia; Cambodia; Indonesia; Lao People’s Democratic Republic; Myanmar; Malaysia; Philippines; Singapore; Thailand; Viet Nam; Rest of Southeast Asia; Argentina; Bolivia; Brazil; Chile; Colombia; Ecuador; Paraguay; Peru; Uruguay; Venezuela; Rest of South America; Costa Rica; Guatemala; Nicaragua; Panama; Rest of Central America; Caribbean; Switzerland; Norway; Rest of EFTA; Albania; Bulgaria; Belarus; Croatia; Romania; Russian Federation; Ukraine; Rest of Eastern Europe; Rest of Europe; Kazakhstan; Kyrgyz Republic; Rest of Former Soviet Union; Armenia; Azerbaijan; Georgia; Iran Islamic Republic of; Turkey; Rest of Western Asia; Egypt; Morocco; Tunisia; Rest of North Africa; Nigeria; Senegal; Rest of Western Africa; Central Africa; South Central Africa; Ethiopia; Madagascar; Malawi; Mauritius; Mozambique; Tanzania; Uganda; Zambia; Zimbabwe; Rest of Eastern Africa; Botswana; South Africa; Rest of South African Customs
Note: EFTA = European Free Trade Association.

Appendix 6
229
Interview with Shareholders
I. Mr “Y”, Policy Maker, Ministry of Commerce, Government of Bangladesh.
Discussion with an important policy maker at the Ministry of Commerce, Government of Bangladesh helped to summarize the major nontariff barriers (NTBs) that Bangladeshi exporters face in the Indian market. These are discussed below:
i. For the export of cross-section of products including cement, gelatin, condensed milk, electrical appliances, mineral water, steel products, leather products, X-ray equipments, dry cell battery, and thermometers to India, prospective exporters are required to obtain licenses regarding compliance with quality standards from the concerned agency which is often highly time and cost-consuming.
ii. For the export of agricultural products to India, there are requirements of biosecurity and sanitary and phytosanitary requirement for import permit. Eligibility for import permit requires risk analysis of the products which is a complex process and lacks transparency. India continues import licensing of about 600 items on the ground that restrictions are needed to ensure protection for “human, animal or plant life or health”. Imports of nearly all livestock, agricultural, and food products require some kind of phytosanitary or sanitary certificate and import permit under the general supervision of the Ministry of Agriculture of India.
iii. For processed food products, compliance with Food Adulteration (Prevention) Act 1954 of India requires shelf life to be not less than 60% of original shelf life at the time of import. Determination of shelf life is often done arbitrarily and without transparency.
iv. In the case of prepackaged products (such as processed food, cosmetics, toiletries, spices, etc.), all commodities, imported into India, shall carry the following declarations: (a) name and address of the importer; (b) generic or common name of the commodity packed; (c) net quantity in terms of standard unit of weights and measures. If the net quantity in the imported package is given in any other unit, its equivalent in terms of standard units shall be declared by the importer; (d) month and year of packing in which the commodity is manufactured or packed or imported; and (e) maximum retail sale price at which the commodity may be sold to the ultimate consumer. This price shall include all taxes local or otherwise, freight, transport charges, commission payment to dealers, and all charges towards advertising, delivery, packing, forwarding, and the like, as the case may be.
v. Rule 32 of the Prevention of Food Adulteration Rules (PFA), 1955 of India deals with packing and labeling of foods. This rule alone has 30 provisos and provisos within provisos. In addition there are also cross-references to other rules. These rules prescribe the contents to be specified on the label, the size of the label, the design of the label, the areas specified for display panels, details of colors and flavors, trade name or description of food contained in the package, names of

Developing Economic Corridors in South Asia
230
ingredients used in the product by weight and volume etc. Goods are cleared only on receipt of the test report. No certificate from the country of origin is accepted. The results of the laboratory tests cannot be challenged. Separate regulations have been enacted for different food items.
vi. For textile and textile products exported to India, there is a requirement of pre-shipment inspection certificate from textile testing laboratory accredited to the National Accreditation Agency of the country of origin. Nonavailability of the certificate requires testing from the notified agencies in India for each and every consignment. In some cases, even certificates from labs accredited by the European Union have been rejected by Indian Customs and such consignments subjected to repeat tests in India. In addition, Textile (Consumer Protection) Regulation of 1988 imposes some strict marking requirements for yarns, fibers, fabrics imported into India.
vii. In the case of pharmaceutical products exported to India, there are stringent requirements of drug registration with the Central Drug Standard Control Organization, which involve an arduous and time consuming procedure. Foreign manufacturers must register and subject their premises to inspection along the lines of rules prepared by the Bureau of Indian Standards (BIS).
viii. For the export of jute products to India, there is a requirement of a certificate from the exporting country regarding content of nonhomogenate hydrocarbon (jute batching oil) which should not exceed 3% by weight. In the case of jute bags/sacks, Indian authority has special labeling requirements so that each jute bag/sack carries machine stitched marking of the country of origin.
ix. The exports of chemical fertilizer and lead acid batteries to India requires an environment-related certificate. For the leather, leather goods, and melamine products; Indian authority asks for chemical testing which is often extremely time-consuming. For export of poultry, dairy products and meat (frozen, chilled, or fresh) import permit from the Department of Animal Husbandry, and Dairying & Fisheries of India is required.
x. There are cases of nonacceptance of SAFTA certificate issued by the Export Promotion Bureau (EPB) of Bangladesh by the Indian authority at Akhaura/Agartala border customs for the export of hand pump, tube well filters, cast iron pipes, cast iron bends and Ts, water heaters, plastic pipes of various diameters, power paddy thrasher, power tiller, hand spray, engine filter-oil, fuel, and air.
II. Mr “X”, C&F Agent and CEO of “A” Enterprise, Benapole.Mr “X” is a C&F agent working at the Benapole land port. He has been working as C&F agent for many renowned companies since 1977 and has enormous experience in trading various products with India. In the interview he talked about a range of issues relating to trade with India through the Benapole port.
Mr X highlighted the issue of one-sidedness in the trading process between India and Bangladesh. In the case of export to India, export documents, sent to Indian importers are re-verified and only after getting the confirmation from the Indian importer can the products be loaded for export. But in the case of export to Bangladesh, there is no
231
Appendix 6
re-verification of documents by the Bangladeshi importers. The additional formalities with the documents in the former case usually take more time and in most cases cause harassment for the Bangladeshi exporters.
He also drew attention to the shortage of capacity at the Benapole warehouse. According to him, the capacity of the warehouse is about 37 thousand tons at a time, whereas on an average 60–70 thousand tons of products enter through the Benapole land port. This creates huge congestion of loaded trucks, and as a result unloaded products are kept in open spaces. This congestion causes loss of time as well as money for the trader. According to him, this adds an additional cost to the importers in Bangladesh to the tune of Tk1000 per 10-ton truck and Tk1200 per 12-ton covered van each day. Besides, no air-conditioned storage is available at Benapole which creates serious challenges for storing products like pharmaceuticals.
He also addressed the bureaucratic problems, inefficiency of the customs officers, shortage of efficient manpower and poor infrastructure at Benapole land port and under-utilization of other land ports such as Hili, Shonamasjid etc. Benapole is the largest land port in Bangladesh and is also the leading land port from the trading perspective. So, Mr. X urged that the port be modernized and also that it be officially declared the head office of all land ports. Besides he made some suggestions for facilitating trade between India and Bangladesh such as initiating automation in trade documents processing, infrastructural development of inland transportation, and inception of entry visa in India.
III. Mr “K”, Chairman, “C” Logistics Ltd.Mr “K”, Chairman of a well-known logistics company, shared his experiences of trading with India in the interview. This logistics company has been functioning as a mediator between the traders of India and Bangladesh for the last 18 years.
Mr K is quite disappointed with the processing of trade documents at the customs house. According to him, processing and clearance at the customs should be completed within 1–2 days whereas generally it takes 3–4 days. Sometimes customs clearance can even consume up to 8–10 days. Incompetent customs officers sometimes categorize a product under the wrong HS code which causes harassment to the trader. He also pointed to the deep-seated corruption in customs and urged for immediate action against corruption. Though he is dissatisfied with the performance of customs, custom-related cost seems satisfactory to him. He also expressed his disappointment in the visa procedures of the Indian Embassy and urged for a more liberal visa processing system.
Moreover he talked about the poor condition of the Chittagong sea port. He said that the Chittagong sea port was encumbered with outdated equipment, insufficient and inefficient manpower. He suggested that the port be modernized with up-to-date equipment and, more efficient workforce. He also gave his opinion in favor of initiating a shift-based work schedule to effectively increase the operating hours of customs and ports.
Developing Economic Corridors in South Asia
232
IV. Mr “I”, Chief Executive, “Z” PaintsMr “I” is the Chief Executive of a renowned company which has been producing and distributing paints in the local market for the last six years. For paint production, this company imports raw material from India mostly through the sea route and a small portion is imported by road through the Benapole land port.
Mr I is also dissatisfied with the documents processing and customs clearance at the Chittagong sea port. According to him, customs clearance at the sea port generally takes 4–5 days though sometimes it takes 12–15 days which causes great problems to the trader. Mr I also pointed at the inefficiency of the customs officials in identifying accurate HS codes for sophisticated products such as chemicals which are used as raw materials in paint production.
He counseled for further improvement in inland transportation to facilitate trade. Besides he laid emphasis on electronic submission and processing of trade documents, elimination of corruption amongst customs and government officials, increasing operating hours at customs and sea ports, and increasing the efficiency of customs officials as well as workers.
V. Mr “S”, Executive Director, “U” Pharmaceuticals (Bangladesh) Ltd.
Mr “S” is the Executive Director of a pharmaceutical company. This company has been operating in Bangladesh since 2004 and is importing all its necessary raw materials from India. Mr. “S” talked about his experience of doing business in Bangladesh and also about India–Bangladesh trade.
He said that the customs, in both India and Bangladesh, are encumbered with similar bureaucratic problems and corruption. He revealed that the use of “speed money” in customs clearance is quite common and those who refuse to pay bribes are harassed. He also revealed that importers can avoid the import duty by bribing unscrupulous officials which has an adverse impact on government revenue. He highlighted the poor infrastructure and inadequate storage capacity of Benapole land port in either side of the border.
He mentioned some advantages of investing in India. Investment in the Northeastern part (seven sisters region) enjoys 30% subsidy and also a tax holiday for 10 years. But Bangladeshi investors are yet to explore these opportunities.
Mr S recommended modernization of the Benapole land port, development of other land ports, improvement of inland transportation, and immediate steps to minimize corruption for facilitating trade. He also advocated the initiation of transshipment facility in Chittagong sea port since this would generate revenue earnings.

233
Appendix 6
VI. Mr “J”, Chief Operating Officer, “N” Exchange Environment Management (BD) Ltd.
Mr “J” is the country Chief Operating Officer of a multinational company and the parent company is from India. The parent company is doing business in around 20 countries and this company has been operating in Bangladesh for the last 56 years. This company usually imports engineering products for industries and water management machinery from India mostly through the Chittagong sea port and some through the Benapole land port.
Mr J was not satisfied with vessel management and unloading of consignments from the vessels at the sea port. Unloading of vessel usually takes 7–10 days and even 15 days in some cases whereas in his opinion this should be done within 4–5 days. He attributed the delays to the inefficiency of port management and workers’ unrest at the port. He also disclosed that bribery was quite common in the customs clearance process but he did not express disappointment with that as he thought that bribes actually speeded up the procedure. He also complained about the inefficiency of the officials in identifying accurate HS codes for sophisticated products.
Mr J was unhappy with inland road transportation in Bangladesh and mentioned ferry problems (in case of transportation through Mongla sea port or Benapole or some other land ports) and traffic problems (recently in Chittagong highway road) that caused delays. He was more disappointed with the status of infrastructure on the Indian side and expressed his annoyance as no significant action was being taken to develop the roads and infrastructure. In the interview, Mr J admitted that the business environment in Bangladesh was somehow better compared to other trading partners of India in this region.
VII. Mr “H”, Business Manager, “R” Ltd.Mr “H” is the business manager of a well known Bangladeshi company which has been conducting trade for more than a decade with India, Nepal, and Bhutan. This company is exporting its products (automotive battery) through Benapole port to India, Burimari port to Bhutan and Kakarvitta to Nepal. Mr H said that the trading procedure was quite similar across India, Bhutan and Nepal.
In the interview, Mr H expressed his utmost annoyance for the long-wound visa processing system of the Indian embassy. According to him, the visa procedure is nothing but harassment. It usually takes 22–25 days to get an Indian visa for a business trip. He added that the Indian embassy was reluctant to issue multiple-entry visas and sometimes even denied visas. He argued for immediate steps by both governments to smoothen the visa procedure which would eventually facilitate trade between the two countries.
The infrastructure at Benapole land port appeared to be satisfactory to him whereas he complained about the poor conditions at the Burimari and Kakarvitta land ports. There is no warehouse facility worth mentioning at these ports and even a customs

Developing Economic Corridors in South Asia
234
officer is not available at Kakarvitta. Though the present volume of trade through Burimari and Kakarvitta land ports is minimal this could increase if essential measures were taken for the development and modernization of the ports.
He was of the view that harassment at customs clearance on both sides of the border was not that common. He felt the customs administrative charges were reasonable. Mentioning his satisfaction over the road network between India and Bangladesh, he suggested further development of a railway network as it would be more cost effective. Besides he also laid emphasis on automation at the ports to expedite the trade processing.
VIII. Mr “M”, Executive Director, “R” Tyres and Chemicals Ltd.Mr “M” is the Executive Director of an organization that has been doing business with India for the last 30 years. This firm usually imports rubber machineries, China clay, and chemical products like carbon black, rubber chemicals through the sea port as well as by truck through Benapole port.
According to Mr M, required time at present for vessel management, unloading products at the sea port, for processing customs clearance and for customs inspections was not high though it used to be better in the recent past. He said that waiting time for vessels outside the port and unloading a vessels generally took 3–5 days and customs clearance took 4–5 days. However, inland transportation from Chittagong sea port to Dhaka had worsened in recent years because of poor conditions on the highway and traffic congestion. He advocated developing four-lane highway road infrastructure to facilitate transportation between the port city and the capital city.
He gave importance to electronic submission and processing of documents to alleviate bureaucratic problems at government offices and customs clearance and to increase the operating hours at customs and ports. Besides he also talked about the harassment in getting Indian visa and argued for immediate measures to simplify the procedure.
IX. Mr “P”, General Manager, “D” Group.Mr “P” is the General Manager of a renowned Bangladeshi company and has been serving the company for almost two decades. This well-established company has been exporting glass sheet to India and Nepal for last 5–6 years. Truck is the sole medium of transportation for exporting to India and Nepal through different land ports depending on destinations.
Like other respondents, Mr P is not satisfied with the facilities at some land ports, especially at Banglabandha and Shonamasjid. He is of the view that the process of customs clearance is quick enough as bribery actually speeds up this process.
Inland transportation, from the factory to land port, usually doesn’t consume too many days. The unusual delay in some occasions is mainly due to traffic jam and ferry problem. Mr “P also talked about the challenges of unavailability of trucks and the

235
Appendix 6
high fare charged by the truck service providers. He pointed out that the condition of roads to different land ports should be improved as early as possible for better trade opportunities. He also called for digitization of trading procedures, modernization of the ports, and shift system to increase working hours at ports and customs.

236
Appendix 7
List of Documents (Kakarvitta–Chittagong/ Mongla Corridor)
(i) Import
Bangladesh(a) Invoice(b) Packing list(c) Custom Transit Declaration(d) Letter of Credit(e) Certificate of Origin(f) Bill of Lading
India(a) Packing list(b) Insurance(c) Bill of Lading(d) Letter of Undertaking(e) Custom Transit Declaration
Nepal(a) Invoices(b) Packing list(c) Custom Transit Declaration(d) Letter of Credit(e) Firm Registration with PAN/VAT(f) Letter of Authority(g) Insurance(h) Import declaration form(i) Bill of Lading
(ii) Export
Nepal(a) Commercial Invoice/Performance Invoice(b) Packing list(c) Letter of Credit(d) Custom Transit Declaration(e) Certificate of Origin/Generalize System of Preference(f) Insurance policy(g) Export declaration form

237
Appendix 7
India(a) Invoice(b) Packing list(c) Letter of Credit(d) Custom Transit Declaration(e) Certificate of Origin(f) Insurance
Bangladesh(a) Custom Transit Declaration(b) Invoice(c) Packing list(d) Letter of Credit(e) Letter of Authorization(f) Bill of Lading(g) Insurance(h) Letter of Undertaking

238
Appendix 8
List of Documents (Birgunj–Kolkata Corridor)
(i) Import
India(a) Invoice(b) Packing list(c) Letter of Credit(d) Letter of Undertaking(e) Bill of Lading(f) Insurance policy(g) Custom Transit Declaration(h) Letter of Authority(i) Certificate of Origin
Nepal(a) Commercial Invoice(b) Packing list(c) Letter of Credit(d) Certificate of Origin/Quarantine(e) Custom Transit Declaration(f) Import declaration form(g) Bill of Lading/Transport document(h) Firm Registration/PAN
(ii) Export
Nepal(a) Commercial Invoice(b) Packing list(c) Letter of Credit(d) Custom Transit Declaration(e) Certificate of Origin(f) Firm Registration/PAN(g) Insurance policy(h) Export declaration form
India(a) Invoice(b) Packing list

Appendix 8
239
(c) Letter of Credit(d) Custom Transit Declaration(e) Certificate of Origin(f) Insurance(g) Letter of Undertaking(h) Letter of Authority

240
Appendix 9
Important Agreements and Memoranda of Understanding for Facilitating Trade and
Economic Cooperation
• The Protocol on Inland Water Transit and Trade (IWTT) was signed in 1972 and is renewed every two years.
• The Joint Rivers Commission was established in June 1972. • The Land Boundary Agreement (LBA) was signed in 1974. • The India–Bangladesh Convention for the Avoidance of Double Taxation came
into force on 27 May 1992.• The Ganga Waters Treaty based on the principle of equity was signed on 12
December 1996.• The Agreement on Revised Travel Arrangements between India and Bangladesh
was signed in 2001. • The Joint Boundary Working Group was formed in December 2001. • The Agreement on Mutual Cooperation for Preventing Illicit Trafficking in
Narcotic Drugs and Psychotropic Substances and Related Matters was signed in March 2006.
• The 14th SAARC Summit held in New Delhi in April 2007 agreed to zero-duty market access for products originating from SAARC less developed countries, barring items in the sensitive list, from 1 January 2008.
• A Memorandum of Understanding (MOU) was signed to extend duty-free, quota-free (DFQF) market access to 8 million pieces of readymade garments from Bangladesh every year under SAFTA. The customs notification was issued on 21 April 2008.
• The Bangladesh India Trade Agreement (BITA) and the Bilateral Investment Promotion and Protection Agreement (BIPPA) were signed in February 2009.
• 264 items were removed from the 744 items in the sensitive list in April 2009. • There are several other agreements and MOUs signed between Bangladesh and
India, among which the MOU between Bureau of Indian Standards and Bangladesh Standards and Testing Institution, and the protocols on bus services between Dhaka and Kolkata, and Dhaka and Agartala are important.
ASIAN DEVELOPMENT BANK
6 ADB Avenue, Mandaluyong City
1550 Metro Manila, Philippines
www.adb.org
Publication Stock No.: BKK146474-2 Printed in India
Developing Economic Corridors in South Asia
As tariff-based barriers decline in South Asia, countries in the region are
recognizing the importance of transport and trade facilitation measures to
reap the benefits of trade liberalization. The next stage in regional
cooperation is the development of economic corridors. This book discusses
the shaping of economic corridors along regional transport arteries and
shows how opportunities for industrial agglomeration and expansion can
bring dynamic gains to the region. It identifies viable subcomponents to link
with principal transport networks and economic clusters while suggesting
policy measures to ensure that benefits are fully realized. Policy makers and
development economists will find this volume a valuable resource.
About the Asian Development Bank
ADB’s vision is an Asia and Pacific region free of poverty. Its mission is to
help its developing member countries reduce poverty and improve the
quality of life of their people. Despite the region’s many successes, it remains
home to approximately two-thirds of the world’s poor: 1.6 billion people
who live on less than $2 a day, with 733 million struggling on less than $1.25
a day. ADB is committed to reducing poverty through inclusive economic
growth, environmentally sustainable growth, and regional integration.
Based in Manila, ADB is owned by 67 members, including 48 from the region.
Its main instruments for helping its developing member countries are policy
dialogue, loans, equity investments, guarantees, grants, and technical
assistance.
ISBN 978-92-9254-510-9
9 7 8 9 2 9 2 5 4 5 1 0 9 >