Data for Policymaking in the Pandemic Period - Think Asia
86
Debapriya Bhattacharya Towfiqul Islam Khan Muntaseer Kamal Najeeba Mohammed Altaf Marfia Alam DATA FOR POLICYMAKING IN THE PANDEMIC PERIOD The Bangladesh Experience Supported by Switzerland
-
Upload
khangminh22 -
Category
Documents
-
view
0 -
download
0
Transcript of Data for Policymaking in the Pandemic Period - Think Asia

Debapriya BhattacharyaTow�qul Islam Khan
Muntaseer KamalNajeeba Mohammed Altaf
Mar�a Alam
DATA FORPOLICYMAKING
IN THEPANDEMIC PERIOD
The BangladeshExperience
Supported bySwitzerland

Data for Policymaking in the Pandemic Period i
Data forPolicymaking
in thePandemic PeriodThe Bangladesh Experience
Debapriya BhattacharyaTowfiqul Islam Khan
Muntaseer KamalNajeeba Mohammed Altaf
Marfia Alam

Data for Policymaking in the Pandemic Periodii
Published in January 2022 by
Centre for Policy Dialogue (CPD)House 40/C, Road 11 (new)Dhanmondi, Dhaka-1209, BangladeshTelephone: (+88 02) 48118090, 55001185, 58156979Fax: (+88 02) 55001181E-mail: [email protected] Website: www.cpd.org.bd
© Centre for Policy Dialogue (CPD)
All rights are reserved. No part of this publication may be reproduced or transmitted in any form or by any means without prior permission in writing from the publisher. Any person who does any unauthorised act in relation to this publication may be liable to criminal prosecution and civil claims for damages.
The views expressed in the contributions to this report are those of the authors alone and do not necessarily reflect the views of the CPD, or Embassy of Switzerland in Bangladesh, or any other organisations with which they are affiliated.
Citation: Bhattacharya, D., Khan T. I., Kamal, M., Altaf, N. M., & Alam, M. (2022). Data for Policymaking in the Pandemic Period: The Bangladesh Experience. Dhaka: Centre for Policy Dialogue (CPD).
Cover and design concept byAvra Bhattacharjee
ISBN: 978-984-95073-3-8
Tk. 250
Printed at
Lithograph41/5 Purana Paltan, Dhaka 1000

Data for Policymaking in the Pandemic Period iii
FOREWORD
The ongoing COVID-19 pandemic has given rise to a range of adverse socio-economic and health impacts. These negative fallouts have exponentially increased the demand for reliable data from healthcare professionals, policymakers, and the public at large. Indeed, the government’s ability to pursue necessary and effective public policy activities is hampered by data deficit. Timely dissemination of reliable data is crucial to undertake public policies and health measures.
It is worth noting that the COVID-19 pandemic has created new challenges within the data ecosystem of Bangladesh and exacerbated the existing ones. As has been observed around the globe, public access to crucial COVID-19 related data was either limited or too complicated for the layperson to comprehend. The extent of the use of data to combat the pandemic remains a critical question. Thus, it is critical to understand the method of generating basic statistics in view of the pandemic in Bangladesh and assess how far these statistics have translated into policy responses by the government.
The relevance of the current publication must be taken into cognisance. The study is based on a wide-ranging appraisal of different data initiatives, a review of published materials including grey literature, and a structured analysis of the perspectives extracted through key informant interviews (KIIs) with data generators, data mobilisers, data users, and data appraisers. The results were validated through discussions with policymakers, researchers, academics, and development partners, both at the national and international levels.
The evidence put forward by the current study demonstrates that the data-driven approach to policymaking has gained some momentum during the pandemic. However, the data generators and the knowledge community must remain persistent in sensitising policymakers on the usefulness and use of data. It will be necessary to chronicle the experience, generate evidence of

Data for Policymaking in the Pandemic Periodiv
the positive consequences of such activities, and develop consensus through engaging different stakeholders. The adoption of the policy recommendations put forward by this study will hopefully contribute towards a well organised and sustainable data ecosystem in Bangladesh.
I congratulate the research team led by Dr Debapriya Bhattacharya and thank all other CPD colleagues involved in this scholarly and timely publication.
Fahmida Khatun, PhDExecutive Director Centre for Policy Dialogue (CPD), Bangladesh
DhakaJanuary 2022

Data for Policymaking in the Pandemic Period v
ABSTRACT
In response to the COVID-19 outbreak in Bangladesh, various government entities have undertaken several data-driven initiatives amid persisting challenges in the data ecosystem. Documenting the new and innovative initiatives and the lessons learnt from the experience during the pandemic could benefit the data ecosystem from the perspective of development strategy in a developing country in the longer term. Against this backdrop, the current study attempts to i) understand the process of generating basic statistics in view of COVID-19, ii) assess how far these statistics are translated into policy responses by the government and apprehend how data gaps have posed challenges in terms of policy actions, and iii) identify the best practices from global and national experience for replication and adaptation in future policymaking. The study primarily focuses on health-related data initiatives in Bangladesh taken in view of COVID-and public policy interventions and mainstream economic data during the pandemic. The study emphasises that the real-time data generation system developed within the health sector can be scaled up both vertically and horizontally. However, sustainability of the data initiatives will require substantial resources – in terms of finance, human capital and technology. The present study will offer some lessons for the international community and future policymaking in Bangladesh. Adopting these is likely to pave the way for an efficient and sustainable data ecosystem in Bangladesh.

Data for Policymaking in the Pandemic Periodvi

Data for Policymaking in the Pandemic Period vii
ACKNOWLEDGEMENTS
On behalf of the authors I would like to convey their sincere gratitude to Mr Thomas Baumgartner, Counsellor, Head of Political, Economic and Cultural Affairs, Embassy of Switzerland in Bangladesh, for his generous support in implementing the study and extending cordial cooperation at different times for various project related activities. The team would also like to register its profound gratitude to Mr Sohel Ibn Ali, Senior Programme Manager and Mr Md Sydur Rahman Molla, Programme Manager, Embassy of Switzerland in Bangladesh, for their contributions in delivering this project.
We are immensely grateful to the participants of the Key Informant Interviews (KIIs) for their insights which have been integral sources of information for this study. In this connection, the team would like to convey its sincere thanks to Mr Anir Chowdhury, Programme Advisor, Data Innovation Cluster, Aspire to Innovate (a2i); Mr Md. Anowarul Arif Khan, Results Management Expert, a2i; and Mr Kawsar Shojib, National Consultant, Data Innovation, a2i. The team is grateful to Dr Shah Ali Akbar Ashrafi, Chief, Health Information Unit, MIS, Directorate General of Health Services (DGHS); and Mr Md. Alamgir Hossen, Focal Point Officer, SDG Cell, Bangladesh Bureau of Statistics (BBS), for their valuable insights and helpful comments during the interviews.
The study team would also like to put on record their deep appreciation for the valuable insights and useful comments received from Dr Mushtaque Chowdhury, Convenor, Health Watch; Professor Rashid-E-Mahbub, Chair, National Committee on Health Rights Movement; Dr Firdausi Qadri, Emeritus Scientist, International Centre for Diarrhoeal Disease Research, Bangladesh (ICDDR,B); Dr Morseda Chowdhury, Director, Health, Nutrition and Population Programme (HNPP), BRAC; Dr Shafiun Nahin Shimul, Assistant Professor, Institute of Health Economics, University of Dhaka; and Mr Sadat Adnan Ahmed, Chief Commercial Officer, Nagad.
We gratefully acknowledge the insightful comments and suggestions offered by the participants of the expert group meeting (EGM) held on 28 September 2021. In this connection, the authors are profoundly grateful to Professor Dr Meerjady Sabrina Flora, Additional Director

Data for Policymaking in the Pandemic Periodviii
General, Planning and Development, Directorate General of Health Services (DGHS); Mr Anir Chowdhury, Programme Advisor, Data Innovation Cluster, Aspire to Innovate (a2i); Mr Md. Alamgir Hossen, Focal Point Officer, SDG Cell, Bangladesh Bureau of Statistics (BBS); Professor Rashid-E-Mahbub, Chair, National Committee on Health Rights Movement; Dr A. M. Zakir Hussain, Working Group Member, Bangladesh Health Watch (BHW); Dr Firdausi Qadri, Emeritus Scientist, International Centre for Diarrhoeal Disease Research, Bangladesh (ICDDR,B); Dr Morseda Chowdhury, Director, Health, Nutrition and Population Programme (HNPP), BRAC; Dr Rumana Huque, Professor, Department of Economics, University of Dhaka; Dr Shafiun Nahin Shimul, Assistant Professor, Institute of Health Economics, University of Dhaka; and Professor Mustafizur Rahman, Distinguished Fellow, CPD. The valuable inputs received from the EGM participants were very helpful in terms of validating the study findings.
The study team is indebted to the representatives of various stakeholder groups, and experts who took part in the national dialogue titled ‘Data-driven Policy Making During the Pandemic: Taking the Experience Forward’ for their comments and suggestions. This dialogue was held (virtually) on 25 November 2021 to discuss the findings of the present study. In this regard, the authors would like to put on record their deep appreciation of the valuable inputs provided by the Chief Guest at the event Dr Shahnaz Arefin, NDC, Secretary, Statistics and Informatics Division (SID), Ministry of Planning. The team thankfully recalls the insightful comments and suggestions offered by H E Ms Nathalie Chuard, Ambassador, Embassy of Switzerland in Bangladesh who attended the event as Guest of Honour. Valuable comments were received from the panellists, Mr Mohammad Tajul Islam, Director General (Additional Secretary), Bangladesh Bureau of Statistics; Mr Anir Chowdhury, Programme Advisor, Data Innovation Cluster, Aspire to Innovate (a2i); Dr A. M. Zakir Hussain, Working Group Member, Bangladesh Health Watch (BHW); and Dr Morseda Chowdhury, Director, Health, Nutrition and Population Programme (HNPP), BRAC.
The team gratefully acknowledges the valuable support extended by the Dialogue and Communication Division, CPD, in organising various activities planned under this study. In this connection, the team would like to especially thank Mr Avra Bhattacharjee, Joint Director, Dialogue and Outreach; Mr Md. Irtaza Mahbub Akhond, Dialogue Associate; Md. Shaiful Hassan, Programme Associate (DTP); Ms Anikah Ibtisam, Programme Associate and Ms Anneysha Zafrin, Programme Associate (Communication), CPD for conducting the project related activities efficiently and by maintaining the highest quality. Assistance of Ms Tamanna Taher, Executive Associate, CPD is highly appreciated for facilitating the coordination among different parties involved in the study.
Debapriya Bhattacharya, PhDStudy Team LeaderandDistinguished Fellow, Centre for Policy Dialogue (CPD)

Data for Policymaking in the Pandemic Period ix
ABOUT THE AUTHORS
Dr Debapriya Bhattacharya, a macroeconomist and public policy analyst, is the Convenor of the Citizen’s Platform for SDGs, Bangladesh, and a Distinguished Fellow at the Centre for Policy Dialogue (CPD)—a globally reputed think-tank in Bangladesh—where he had been earlier its first Executive Director. He is a member of the United Nations Committee for Development Policy (CDP) and also the Chair of two global initiatives, viz. LDC Monitor and Southern Voice. He was the Ambassador and Permanent Representative of Bangladesh to the World Trade Organisation (WTO), UN Office, and other international organisations in Geneva and Vienna. Dr Debapriya is engaged in high-level policy designing and advising for the national government and various bilateral and international development agencies at home and abroad. He has published extensively on trade, investment and finance related issues of the least developed countries (LDCs) and Sustainable Development Goals (SDGs). He serves in the boards and working groups of a number of national, regional and international development organisations and networks and in the editorial board of reputed journals. He holds a PhD in Economics from Plekhanov National Planning Institute, Moscow and had been a Postdoctoral Fellow at Queen Elizabeth House, Oxford. He held a number of visiting positions, including Senior Fulbright Fellow at the Centre for Global Development (CGD), Washington DC.
Mr Towfiqul Islam Khan is an economist and currently a Senior Research Fellow at the CPD. He has undertaken various research and published in a number of areas, including macroeconomic policies, fiscal policy and fiscal transparency, governance, financing for development, inclusive development and SDGs. Khan is a member of the ‘SDG Working Team’ constituted under the Prime Minister’s Office, Government of Bangladesh. He is also a member of the ‘SDGs NGO Sub-Committee’ constituted under the NGO Affairs Bureau of Bangladesh. Khan received the Australian Leadership Award (ALA) in 2008 to carry out his post-graduation academic degree at University of Melbourne, Australia. Khan also obtained his Masters in the area of Economics from Jahangirnagar University, Bangladesh.

Data for Policymaking in the Pandemic Periodx
Mr Muntaseer Kamal is an aspiring economist and currently working as a Senior Research Associate at the CPD. His primary research interests are in the areas of macroeconomics and development economics, with particular focus on Bangladesh’s development. His other areas of interest include international economics, inclusive development, SDGs and ICT issues. Prior to joining CPD, he received his Masters and Bachelors degrees in Economics from the University of Dhaka, Bangladesh.
Ms Najeeba Mohammed Altaf is a Research Associate at the CPD. Her current research work centres on the issues of youth in Bangladesh, SDG accountability, and the Eighth Five Year Plan. Her previous research work focused on issues of the youth and the education sector in Bangladesh. Previously, she had worked in account reconciliation in Schlumberger’s Financial Hub in Kuala Lumpur, Malaysia. She has obtained her Bachelor’s degree in Economics from the University of Malaya, Malaysia, and an MBA from the Institute of Business Administration, Dhaka University.
Ms Marfia Alam is currently working as a Programme Associate at the CPD. Her areas of research interest include development economics, governance, SDG implementation, and topics under microeconomics. She aspires to develop her research career in the field of health economics or behavioural economics in the long run. Prior to joining CPD, she secured her Master of Science in Economics from the University of Greenwich, London, UK, with a dissertation focusing on the effect of globalisation on income inequality, using the KOF index and panel data analysis. She has acquired her first masters from North South University, Dhaka, Bangladesh, with a thesis focusing on the effect of mental health on economic output, using panel data analysis. Ms Marfia has obtained her Bachelor of Science in Economics from United International University, Dhaka, Bangladesh.
Data for Policymaking in the Pandemic Period xi
CONTENTS
Foreword iiiAbstract vAcknowledgements viiAbout the Authors ixAcronyms xiii
Section 1: Introduction 1 1.1 Context 1.2 Objectives and scope 1.3 Conceptual framework, methodology and implementation 1.4 Layout of the paper
Section 2: Data to Address COVID-19: Global and Country Experience 5 2.1 Overview of global COVID-19 data initiatives
2.1.1 Online resources 2.1.2 Partnerships
2.2 Country initiatives 2.2.1 Health dimension 2.2.2 Quarantine and lockdown monitoring 2.2.3 Mainstream economic data dimension
2.3 Summary of observations
Section 3: Bangladesh During COVID-19 Period: A Mapping Exercise of Data Domains 17 3.1 Taxonomy of health-related data initiatives in view of COVID-19
3.1.1 Promotive health care 3.1.2 Preventive health care 3.1.3 Curative health care 3.1.4 Overall assessment

Data for Policymaking in the Pandemic Periodxii
3.2 Data initiatives for designing policy response 3.3 Implications for mainstream economic data flows 3.4 Summary of observations
Section 4: Interpreting Pandemic and Data Nexus: Insiders’ Perspectives 36 4.1 Importance of stakeholder perspective 4.2 Process, partnership, policy response and best practices
4.2.1 Motivation behind the data initiatives 4.2.2 Innovation and generation of data 4.2.3 Operational modality of individuals /organisations 4.2.4 Storage and accessibility of data 4.2.5 Usability and comparability of data 4.2.6 Policy use of data 4.2.7 Sustainability of data initiatives
4.3 Summary of observations
Section 5: Conclusions 49
References 52
Annexes 57
List of Tables, Figures, Boxes and Annexes Tables
Table 4.1: Categorisation of KIs with their respective organisations 36Table 4.2: Association between study objectives and activities of the data value chain 39
Figure 2.1: Categorisation of global COVID-19 data initiatives 5Figure 3.1: Classification of the health-related COVID-19 data initiatives 19Figure 4.1: Activities within the data value chain 38
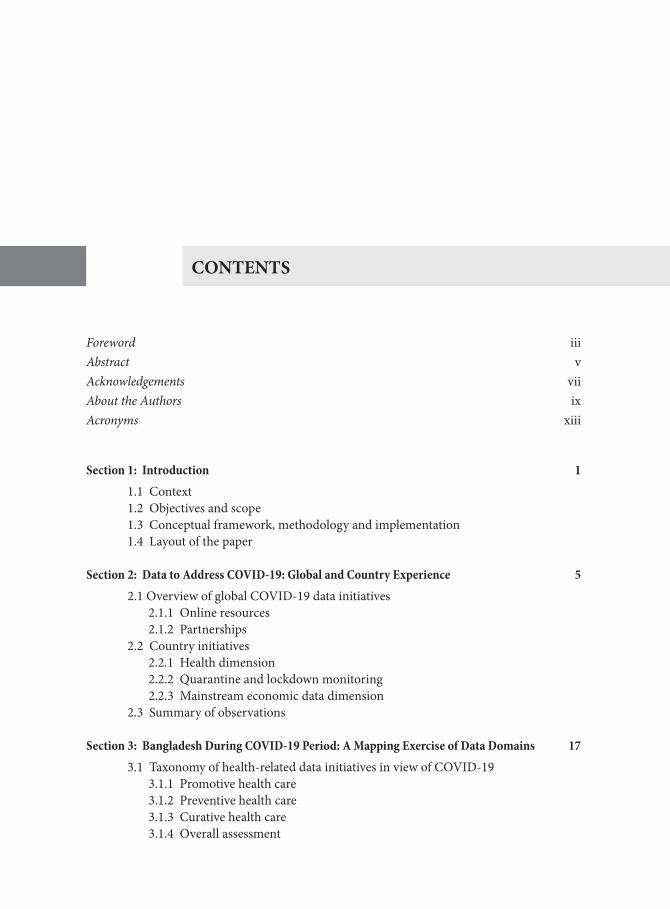
Box 3.2.1: How data-enabled the BDT 2,500 cash support programme 30Box 3.2.2: Use of data in the COVID-19 vaccination programme 32
Annex Table 1.1: Analytical framework of the study 57Annex Table 3.1: Mapping of COVID-19 related health data initiatives 59Annex Table 4.1: List of participants in the KIIs 70

Data for Policymaking in the Pandemic Period xiii
ACRONYMS
ADAPT Advanced Data Planning Tool AEFI Adverse Events Following ImmunisationAI Artificial Intelligence BBS Bangladesh Bureau of StatisticsBCC Bangladesh Computer Council BHW Bangladesh Health Watch BLE Bluetooth Low EnergyBRTC Bangladesh Telecommunication Regulatory CommissionCDC Centers for Disease ControlCSO Civil Society Organisations DC Deputy Commissioner DG Director GeneralDGHS Directorate General of Health Services EISS Epidemiological Investigation Support System EPI Expanded Programme of ImmunisationFOITT Federal Office of Information Technology, Systems and TelecommunicationsGPSDD Global Partnership for Sustainable Development Data GSS Ghana Statistical ServicesHDU High Dependency UnitHIES Household Income and Expenditure SurveyHNPP Health, Nutrition and Population ProgrammeICDDR, B International Centre for Diarrhoeal Disease Research, Bangladesh ICSC International Civil Society Centre

Data for Policymaking in the Pandemic Periodxiv
ICT Information and Communications TechnologyIEDCR Institute of Epidemiology, Disease Control and Research IVR Interactive Voice ResponseKCDC Korea Centre for Disease ControlKETI Korea Electronics Technology Institute KII Key Informant Interviews LFS Labour Force Survey LMIS Logistic Management Information System MIS Management Information SystemNCDC Non-Communicable Disease ControlNDA Non-Disclosure AgreementNRB Non-Resident Bangladeshi NSO National Statistics OfficeNTMC National Telecommunication and Monitoring CentreODW Open Data Watch OECD Organisation for Economic Co-operation and Development
PARIS21 Partnership in Statistics for DevelopmentPMT Proxy Means Test PPE Personal Protective EquipmentSDG Sustainable Development GoalsSID Statistics and Informatics Division SPARRSO Bangladesh Space Research and Remote Sensing Organization UNDESA United Nations Department of Economic and Social AffairsUNDP United Nations Development ProgrammeUNECA United Nations Economic Commission for AfricaUNESCAP United Nations Economic and Social Commission for Asia and the PacificUNICEF United Nations Children’s FundUNSD United Nations Statistics DivisionUNWDF United Nations World Data ForumWHO World Health Organisation

Data for Policymaking in the Pandemic Period 1
1.1 Context
The ongoing COVID-19 pandemic, undoubtedly, originated a vast range of adverse socio-economic and health impacts, along with seismic shifts in the demand for reliable data by healthcare professionals, policymakers, and the public at large (Lewis et al., 2021). Alongside the rise in demand for data, there has been a shift in the type of data demanded. COVID-19 related data and information may include not just numbers of infected persons and casualties, but also data about the vulnerable, ‘new poor’, volunteers, supply chain disruptions, and even impacts on the environment (Mitchell et al., 2020).
Conventionally, this data would have been collected through in-person or field surveys, presented in dashboards and reports, and further used in forecasting models. However, such modes of data collection have become too risky to execute and have been rendered near obsolete due to the obvious health risks and travel restrictions within countries and around the world (Siddiqui & Rathinam, 2021). The existing methods of attaining, processing, and using data on a policy level have been found to be outdated, resulting in data and information that is “late, incomplete, and error-prone” (Lewis et al., 2021). Additionally, the precariousness of the ongoing global pandemic makes it difficult to use historical data in a forecasting model (Fakhruddin, 2020).
In addition to the evolving data collection processes, providing access to said data has been identified as critical for both policymakers and the public alike (Pousadela, 2020). The former because, amidst the pandemic, reliable and up-to-date health and socio-economic data is a prerequisite to planning effectively targeted interventions. In the latter, the timely dissemination of reliable information to the masses is vital to communicating public health measures and other policies. Reportedly, public access to vital COVID-19 data was either hard to come by or too complex for the layman to understand across the world. Countries in which information was withheld by the state often resulted in confusion and overshadowing important public health messages (Pousadela, 2020).
Section 1
Introduction

Data for Policymaking in the Pandemic Period2
In this connection, it must be recognised that routine activities of national statistics offices (NSOs) around the world were severely disrupted as a consequence of the pandemic. A survey covering 122 countries revealed that nearly 65 per cent of the NSO headquarters around the world were partially or completely shut down as a result of the pandemic. NSOs from low-income and low-middle income countries were disproportionately affected (Fu & Schweinfest, 2020). This is a matter of critical concern given the dire need for accurate data for formulating targeted interventions across the world.
In response to the national emergency caused by the outbreak of COVID-19 in Bangladesh, a number of government agencies such as Access to Information in Bangladesh (a2i), Directorate General of Health Services (DGHS), Institute of Epidemiology, Disease Control and Research (IEDCR) has started several data-driven initiatives (UNStats, 2021). The objectives of these initiatives are to a) contain the spread of the virus; b) harness technology and big data sources in a manner that is customised to the Bangladeshi context and utilised by the masses for support of a potential COVID-19 patient surge; c) ensure the safety of healthcare providers and maximise their productivity; and d) enable data-driven policy making and response. These initiatives, however, are not free from the challenges persisting in the data ecosystem of Bangladesh.
As Bangladesh’s experience in attaining the Millennium Development Goals (MDGs) reveals, data generation and its disbursement to the public has increased over time. However, this overall rise in production and availability of data does not ascertain many of the finer qualities necessary to formulate policy responses. Such qualities would normally comprise adequate disaggregation and processing of data, timely dissemination, and even reliability checking mechanisms of the data (UNDP, undated). Indeed, the lack of an efficient data ecosystem has been recognised as a critical issue potentially undercutting the implementation of the Sustainable Development Goals (SDGs) (UNDP, undated).
The aforementioned are just some of the major issues that have been lingering within the country’s data ecosystem predating the COVID-19 pandemic. However, as available evidence suggests, there are other lingering issues within the data ecosystem. One of which is that the few surveys used by BBS to generate data do not, themselves, undergo an upgrade over the years. As such, the apparent outdated methodology and subsequent processes in handling data result in information that is itself outdated, unreliable, and unrepresentative of the population or of the country’s development progress (UNDP, undated). These lingering issues have only been exacerbated during the pandemic when timely, relevant, and reliable data is most crucial to inform necessary policies and strategies. It must be noted that the COVID-19 pandemic has also originated new issues within the data ecosystem of Bangladesh. One such example is the rather drastic but necessary move towards contactless data collection methods.
Against this backdrop, it is critically important to understand the process of generating basic statistics in view of COVID-19 in Bangladesh. It is also important to assess how far these statistics are translated into policy responses by the government. How data gaps have posed

Data for Policymaking in the Pandemic Period 3
challenges in terms of policy actions by the government is a key point of interest to this end. It is assumed that this exercise will also have lessons for the international community and future policymaking in Bangladesh. The adoption of these will hopefully pave the way for an efficient and sustainable data ecosystem in Bangladesh.
1.2 Objectives and scope
In the abovementioned context, the overarching objective of the study is to provide an overview of the data initiatives in Bangladesh that have been evolving in the backdrop of the COVID-19 pandemic.
The specific objectives of this study comprise:
1. Reviewing and documenting the process(es), tools, and partnerships deployed for generating statistics in view of the pandemic in Bangladesh.
2. Assessing the utilisation of data initiatives for designing policy response during the pandemic and identifying the implications of the revealed data gaps for required policy processes.
3. Identifying the best practices from global and national experience for replication and adaptation in future policymaking.
The study primarily focuses on health-related data initiatives in Bangladesh taken in view of the pandemic. The study also sheds light on how data initiatives have been used for COVID-19 related public policy intervention and how the pandemic has affected the flow of mainstream economic data. To this end, the data initiatives taken by government agencies such as DGHS, BBS and a2i will be focused upon. At the same time, data initiatives undertaken by non-government entities such as ICDDR, B and BRAC will be looked into. In order to identify the global best practices, data initiatives by international organisations such as United Nations World Data Forum (UNWDF), United Nations Statistical Division (UNStat), European Statistical System (Eurostat), Partnership in Statistics for Development (PARIS21), and the Global Partnership for Sustainable Development Data (GPSDD) are highlighted. A cross-country analysis to spotlight national-level data initiatives in diverse settings and contexts has been undertaken for which five countries (Ghana, Vietnam, Estonia, South Korea and Switzerland) were selected based on per-capita income level. As COVID-19 related data initiatives are emerging on a continuous basis, the timeline taken into consideration for this study spans the period from March 2020 to June 2021.
1.3 Conceptual framework, methodology and implementation
The current study takes on a qualitative approach to systematically review the data initiatives in Bangladesh which have been undertaken in view of the COVID-19 pandemic. To this end, the conceptual framework designed around the three specific objectives includes a number of hypotheses that will be tested.

Data for Policymaking in the Pandemic Period4
The first specific objective aims to review and document the processes, tools and partnerships used to generate COVID-19 related statistics in Bangladesh. Under this objective, the conceptual framework consists of three hypotheses that relate to:
i) institutional mechanisms and systemic efforts towards generating statistics, ii) integration, coordination and reconciliation within the data ecosystem, and iii) storage of generated statistics and stakeholders’ access.
The second specific objective attempts to assess whether the generated statistics were utilised for COVID-19 policy response and if data gaps were impeding this process. The two hypotheses in this regard are associated with:
i) usage of data enabling delivery of COVID-19 targeted policy responses and ii) data gaps undercutting policy design, implementation and monitoring.
The third and final specific objective is connected to the hypothesis that the global best practices can be adapted taking note of the Bangladesh context.
To test the aforementioned hypotheses, a combination of tools and techniques have been deployed. The present study heavily draws on a desk review of literature and analysis of secondary data and information available from both national and international sources. The study makes use of a number of case studies to highlight the use of data in the area of COVID-19 response in Bangladesh. The current study also utilises key informant interviews (KIIs) to elicit pertinent information and insights as regards the COVID-19 related data initiatives in Bangladesh. To this end, actors involved in different stages of the data value chain were interviewed based on a semi-structured questionnaire. The interconnection between the specific objectives, the related hypotheses and the tools to test these is presented in Annex Table 1.1.
1.4 Layout of the paper
The paper is organised as follows. Following this introduction (Section 1), Section 2 highlights selected COVID-19 targeted data initiatives that have been undertaken by international organisations and countries across the globe. Section 3 provides a mapping of the COVID-19 related data initiatives that have taken place in Bangladesh. Section 4 presents the perceptions and insights of the KIs as regards the COVID-19 related data initiatives in Bangladesh. Section 5 concludes the study by consolidating the findings and offering suggestions as regards the priority areas to act upon.

Data for Policymaking in the Pandemic Period 5
2.1. Overview of global COVID-19 data initiatives
Following the introduction, the subsequent section delves into some of the major international data platforms and their COVID-19 targeted data initiatives. These platforms include United Nations World Data Forum (UNWDF), United Nations Statistical Division (UNStat), European Statistical System (Eurostat), Partnership in Statistics for Development (PARIS21), and the Global Partnership for Sustainable Development Data (GPSDD). These platforms were selected based on the important roles they have played in aiding the capacity development of national statistics offices (NSOs) around the world to meet the rising demand for data in view of COVID-19. These platforms and their COVID-19 data initiatives have been categorised according to their functional framework illustrated in Figure 2.1. The categorisation by functional framework comprises two major clusters: i) online resources and ii) partnerships that have emerged and been leveraged during the pandemic to meet rising data needs.
Section 2
Data to Address COVID-19Global and Country Experience
Figure 2.1: Categorisation of global COVID-19 data initiatives�
Source: Authors’ elaboration.
Global COVID-19data initiatives
Onlineresources Partnerships
Taskforces
Onlineplatforms
Surveys onNSOs
Innovativetools andpractices
Virtualsharingsessions
Collaboratives
Websites Datadashboards

Data for Policymaking in the Pandemic Period6
The ‘online resources’ cluster is further broken down into four sub-clusters. The first of these sub-clusters includes the various ‘online platforms’ that have materialised as a result of the COVID-19 pandemic. Based on the ‘data products’ cluster from OECD’s analytical framework, ‘online platforms’ encompass data repositories, data dashboards and websites that have been created to collate and highlight relevant COVID-19 data (OECD and The GovLab, 2021). The second sub-cluster, ‘Surveys on NSOs’, relates to the surveys conducted regarding statistical reporting activities by the NSOs during the pandemic. The third sub-cluster, ‘innovative tools and practices’, highlights the new data tools and practices that the individual international institutions have launched. The final sub-cluster contains the ‘virtual sharing sessions’, which refers to the various peer-learning sessions and forums held online with the intent to share data experiences in the COVID-19 context.
The second major cluster of the functional framework refers to the new partnerships that have emerged due to the pandemic and the existing partnerships that have been utilised to create (i) data dedicated task forces and (ii) coalitions in the context of the pandemic.
2.1.1 Online resources
It is no surprise that the direction of the global institutions regarding data initiatives has shifted to online during the pandemic. As mentioned earlier, online resources take shape in the form of, among others, (i) websites or data repositories, (ii) online NSO surveys, (iii) new data initiatives and (iv) peer-learning sessions. A brief description of these four forms of online resources has been provided in the following paragraphs.
a. Online platforms
The most often online platforms established by international organisations took the form of dedicated COVID-19 websites or web pages. The websites/webpages provided an online location wherein relevant COVID-19 data had been collated and presented. Alongside these, there were data dashboards that presented information and statistics in a much more visual and highly interactive manner.
In this vein, Eurostat’s major contribution in terms of COVID-19 data initiatives takes shape in the form of the online ‘Statistics serving Europe’ platform. A section of Eurostat’s website that is solely dedicated to providing statistics arranged within topics such as economic data, population and health, society and work and sectoral data. The online platform presents this data as datasets, as interactive visualisations, in a ‘European Statistical Recovery Dashboard’ as well as provides links to further information (EuroStat, 2020). Within the ‘Statistics serving Europe’ platform is the ‘Support to Statisticians’ section. With the intent to set an example not only within Europe but to the global community, this particular section presents and continually updates guidelines and methodologies for statistical authorities that can be applied during the COVID-19 pandemic (EuroStat, 2020). Similarly, Paris21’s efforts towards fostering resilience within data ecosystems result in the development of the

Data for Policymaking in the Pandemic Period 7
resilience indicator dashboards in partnership with UNESCAP and World Bank to track ‘national statistical resilience’ (Paris21, 2020a).
GPSDD provides a common space for sharing information through their dedicated ‘COVID-19 resource page’. This resource page collates information from all other platforms and classifies them under several categories such as overall data, regional and country-level data, visualisations and maps, responses and calls to action, research and analysis reports, and guidelines and tools. The purpose of this website is to gather relevant COVID-19 resources on a single platform for ease of access (Melamed, 2020).
Following its own COVID-19 resource page, GPSDD partnered with UNStat and Open Data Watch (ODW) to create the ‘UN COVID-19 Response’ website. It is a platform created to collate global and local responses to the pandemic in terms of best practices and innovative tools and mechanisms of data collection and dissemination and serve as a guiding force for both international and national statistical offices. UNStat also partnered with ESRI to launch the ‘UN COVID-19 Data hub’ to create an interoperable environment by providing an online platform that collects and showcases COVID-19 data initiatives worldwide. This coalesced network of national and international COVID-19 data hubs is facilitated through the usage of web GIS technology (UNDESA, 2020a). Where the COVID-19 Data Hub is more focused on making data ‘open and interoperable’, the earlier mentioned COVID-19 Response website is centred on ‘sharing knowledge’ (UNDESA, 2020a). The core focus of this platform is about maintaining the continuity of operations and providing further information related to remote work, external data sources, other COVID-19 resources and overall sharing of experiences (Paz, 2020).
b. Surveys on NSOs
As the coronavirus spread rapidly throughout the world, conventional data collection methods such as field surveys and even in-office work rapidly became unfeasible. This, unsurprisingly, impacted the short and long-term functioning of NSOs everywhere. As such, UNStat not only adapted its core functions to the needs and requirements of COVID-19 data initiatives but partnered with World Bank to conduct a global survey on NSOs (UNDESA, 2020b). This particular survey was focused on the extent to which lockdown measures have impacted data collection, processing and statistical reporting and the capacities of NSOs to adapt to restrictions and disruptions alongside rising demand for data (UNSD, 2020).
While the aforementioned survey was focused more on the operations of NSOs, Eurostat conducted its own COVID-19 and data-related survey in March 2020. This survey encompassed mapping of new data initiatives induced by the pandemic, innovative new statistical products, the status of data dissemination, as well as COVID-19 targeted household or business surveys that have been conducted or are in the pipeline (EuroStat, 2020). Similarly, Paris21 partnered with World Data Lab and Dane Colombia to conduct

Data for Policymaking in the Pandemic Period8
their innovative poverty and population mapping study as part of their efforts to recover data ecosystems (Paris21, 2020a).
c. Innovative tools and practices
In terms of innovative data tools and practices that have emerged as a response to the COVID-19 pandemic, Paris21 has taken online-based initiatives to deliver technical assistance through the Paris21 e-learning academy to ‘transform tools and processes’ and virtually support NSOs in their daily operations, medium-term plans, and long-term planning (Jutting, 2020).
In the backdrop of the rising demand for data due to the pandemic, Paris21 focused on rapidly providing data by introducing and integrating new sources (such as citizen-generated and administrative data) and data from civil society organisations (CSOs) for a gender-sensitive response. Additionally, Paris21 utilised social media platforms to improve communications to the public during the pandemic alongside encouraging NSO partners to use the Paris21 Advanced Data Planning Tool (ADAPT) to implement a data needs assessment (Paris21, 2020a). Paris21 has also led efforts to establish a clearinghouse to match donor funding with the development data needs of a nation (Paris21, 2020a)
Apart from Paris21, GPSDD has curated an electronic mailing list of NSOs around the world for ease of communication and peer-to-peer knowledge sharing between the statistical offices (Melamed, 2020).
d. Virtual sharing sessions
While NSOs around the world were forced to suspend field-based activities and statistical operations as the virus spread, major international actors shifted their focus on providing platforms through which organisations could share their experiences over the pandemic period.
With the advent of the COVID-19 pandemic, UNWDF held a virtual data forum from 19 to 21 October 2020. This event was participated by more than 10,000 members of the global data community from 180 nations. The 2020 UNWDF redirected the focus of data generation, dissemination and usage on recovery from COVID-19 at the centre of the Sustainable Development Agenda. The virtual sessions and exhibitions during the forum contributed to the formation of partnerships within the data ecosystem with a focus on bringing back ‘trust in data, data privacy and governance.’ Most importantly, it was collectively recognised that data availability on a global, national and local level was an underlying impediment to not just achieving the 2030 Agenda but also to battling the pandemic across the world. Among the many takeaways, some of the major highlights were integrating artificial intelligence (AI) into the data collection and dissemination process, forming successful partnerships between the private sector and NSS as well as increasing the funding for data (United Nations, 2020).

Data for Policymaking in the Pandemic Period 9
Similarly, Paris21 has played a significant role in delivering virtual advice and technical support to NSOs that have been affected by the pandemic (Paris21, 2020a). To this end, Paris 21’s initiatives were designed around three main pillars: providing rapid response, fostering resilience within data ecosystems, and paving the way for recovery. Under the ‘resilience’ pillar, Paris21 reports on providing a platform to facilitate peer-learning between nations regarding crisis management and recovery techniques. An example of this would be the forums held by Paris21 on high-frequency phone surveys and communication in times of COVID-19 (Paris21, 2020a).
2.1.2 Partnerships
The majority of data initiatives tackling COVID-19 related issues have centred on online-based solutions and resources. However, an additional cluster of data-related initiatives has emerged based on leveraging existing relationships and forming new partnerships to address COVID-19 data challenges. Some examples of such initiatives are provided below.
a. Task forces
To tackle the emerging issues in the data landscape, international organisations have been found to form their own dedicated task force to take on the challenges pertaining to streamlining communication and activities among key stakeholders along the data value chain. For instance, in order to ameliorate the degradation of NSO activities around the world, Paris21 established the ‘COVID-19 task force’ as a bridge to engage NSO partners during this critical period as a means of streamlining global, regional, and national knowledge sharing (Paris21, 2020b).
b. New collaboratives
Alongside Paris21 establishing its own task force, GPSDD has also utilised its partnerships to form new collaboratives as described below:
Data for Now initiative
In partnership with the United Nations Economic Commission for Africa (UNECA), GPSDD brought forward the ‘Data for Now: Building Africa’s Resilience to COVID-19’ initiative. Through engaging 35 nations across Africa, this initiative has created a network connecting over 40 key stakeholders within the continent’s data ecosystem. The basis of the initiative is rooted in i) tracing COVID-19 infection concentration and at-risk areas, ii) providing skills training and capacity development opportunities to strengthen existing data ecosystems, iii) Strengthen existing healthcare systems through an enhanced emphasis on the adequacy of physical infrastructure and other requirements, and iv) monitoring mainstream economic indicators to track COVID-19 impact on economies. With the rising need for timely data,

Data for Policymaking in the Pandemic Period10
this initiative has already had 27 of the 40 partnerships deliver dedicated country-level COVID-19 data dashboards and updated sector-based information dissemination within countries (GPSDD, 2021a).
Administrative Data Collaborative
Data and information collected by governments and their agencies have become more important than ever as major sources of official data that could be used to fill in data gaps, monitor development progress and face pandemic-led challenges. To this end, GPSDD has partnered with UNSD to establish the ‘Administrative Data Collaborative’ with the objective of fostering a multi-stakeholder network of national, regional and international entities to uphold and strengthen the usage of administrative data for statistical purposes. This collaborative comprises over 20 NSOs and 20 NGOs, international and regional entities, and is divided into three specific task teams that are led by partner nations. The first team is led by Chile, Denmark, and Palestine and focuses on ‘Institutional framework, coordination, and partnerships.’ The second team focuses more on the data management aspect and data standardisation. This task team is led by Namibia and Norway. Finally, the third task team is led by both Ecuador and Uruguay and focuses on IT interoperability and the linking of administrative data (GPSDD, 2021b). The integration of these major sources of official data has the potential to improve the timeliness, quality, and coverage of data and provide a deeper level of disaggregation. As such, this collaborative’s efforts include sharing best practices, new and innovative tools, and urgent mitigating issues whilst forging the path to meet the long-term needs of NSOs across the globe (GPSDD, 2021b).
Civil Society Collaborative: Inclusive COVID-19 data
The ‘Civil Society Collaborative’ focuses on integrating data generated by CSOs to either fill in data gaps and/or bolster data produced by government agencies. This collaborative aims to leverage CSOs’ relationship with the left-behind or pushed-behind communities to understand the intersectionality of COVID-19 impacts and ‘collectively advocate’ for inclusivity, through data-focused movements, in pandemic-borne interventions (GPSDD, 2021c). Led by a steering committee that includes ActionAid Denmark, Christian Aid, Development Initiatives, International Civil Society Centre (ICSC), and GPSDD, the collaborative currently comprises over 20 CSOs who came together to achieve a specific set of objectives (GPSDD, 2021c). These include: i) encouraging inclusive actions in response to COVID-19 through increased understanding of marginalised communities, ii) highlighting voices from marginalised communities in both national and international forums, and iii) emphasising the value of CSO-generated data and information and its usage in inclusive actions.
2.2 Country initiatives
Alongside the global organisations, countries worldwide have taken various initiatives to meet their data needs during the COVID-19 pandemic. Of these countries, many have shared

Data for Policymaking in the Pandemic Period 11
their exemplary experience with the global community. This sub-section highlights a select set of such national initiatives. For this exercise, five countries have been selected based on their development status (e.g., income), geographical locations, statistical capacity and ‘best practices’ in terms of COVID-19 targeted data initiatives. The selected countries are Estonia, Ghana, South Korea, Switzerland and Vietnam. The information pertaining to the data initiatives of these countries is clustered according to the three core data dimensions they address, viz. (i) health and COVID-19, (ii) public policy interventions and (iii) mainstream economic data.
2.2.1 Health dimension
Unsurprisingly, given the nature of the global crisis and the need to contain the virus, the most in-demand types of data relate directly to health. Whether these are the figures for the infected population within countries and particular areas, adequacy of healthcare facilities or even mobility tracking of the citizens, COVID-19 data largely refers to health-related information. Consequently, the majority of COVID-19 targeted data initiatives are health-centric. As mentioned, conventional data collection methods such as in-person interviews, surveys, field visits, and others have lost their relevance in the pandemic context. Despite such setbacks, countries have risen to the challenge and evolved their data collection techniques to adapt to the new normal.
a. Contact tracing
With the intent to track down suspected patients and contain the contagion, the first move made by many of the countries was to monitor the spread of COVID-19 through contact tracing. What emerged through the cross-country review was that citizens had either taken up the responsibility to record and submit their own symptoms online or through mobile applications. Contact tracing was also carried out by leveraging Bluetooth functions on mobile phones.
Self-reporting: Estonia is one of the pioneers in terms of effectively implementing digital solutions for challenges originating from COVID-19. One of the new initiatives undertaken by Estonia’s Health Board was providing an online questionnaire, called the Koroonatest, through which citizens were able to submit their own health status information and probable COVID-19 symptoms. The data gathered through this mechanism bolstered the Health Board’s efforts towards tracking and predicting the spread of infection within Estonia. Simultaneously, this online platform would also provide individualised instructions and information to the citizens who have submitted their health status data (Basile, 2020).
Another example of self-reporting is Vietnam’s usage of a mobile app. In terms of COVID-19 response, Vietnam quickly became one of the success stories in Southeast Asia through the development of the NCOVI mobile app. This app allows individuals to submit their health status data voluntarily through an in-app survey (Vietnam News, 2020). The details regarding

Data for Policymaking in the Pandemic Period12
a person’s health status and symptoms are then fed back into Vietnam’s ‘National People’s Health Database’. Not only does this app provide a COVID-19 related data collection point for the country, but it is also a point of data dissemination to the people of Vietnam. The NCOVI app allows citizens to access a map that tracks COVID-19 hotspots and provides follow-up instructions in the case of a COVID-19 related emergency (Vietnam News, 2020).
While both locals and foreigners can access the NCOVI app, Vietnam has also introduced the Vietnam Health Declaration app for in-bound foreigners and locals. With over ten languages available on the app, it requires new arrivals to fill out a travel history form spanning the preceding two weeks with a particular focus on COVID-19 symptoms. While the form is available both in-app and online, it was not declared mandatory. The app also provides updates on COVID-19 cases, a map tracking the epidemic and other related government updates (Saigoneer, 2020).
Leveraging Bluetooth: Apart from the app-based and online surveys to obtain health status information of citizens, the majority of the countries under the current review have taken advantage of Bluetooth technology to trace the COVID-19 movement. Besides the NCOVI app, Vietnam has also introduced the Bluezone app, which utilises the ‘Bluetooth Low Energy’(BLE) technology. This official app ensured that the collected data would be encrypted and only be stored on the individual’s phone and not in any central database while being shared with relevant authorities for virus containment purposes. However, it is the usage of BLE that ensures anonymity through no collection or sharing of location data in addition to very limited battery drain on smartphones (Bluezone, 2020). For this app to work, the users would have to turn on their Bluetooth and come within 6.6 feet of each other for their respective phones to record that they had ‘come into contact’. The app would record the time and duration of close contact, and this information would remain encrypted in the users’ respective phones. In the event that one of the users tested positive for COVID-19, their status would be logged into the system by the health authority, and persons who had been in contact with the infected individual would be sent a warning message with the required instructions (Bluezone, 2020).
Similarly, both Estonia and Switzerland launched mobile apps that use Bluetooth for contact tracing. In the case of Estonia, the HOIA app works similar to the Bluezone app. Here the phones with the app and activated Bluetooth connection generate and exchange unique ID and record the period of ‘contact’. In the case when an individual tests positive for COVID-19, that individual may report it in the HOIA app. As the app updates the list of infected people, a person who had previously come into contact with the newly COVID-19 positive individual will receive a notification from the app (HOIA, 2020).
Switzerland’s ‘SwissCovid’ app also functions in a similar way. However, what differs is that this app also provides a ‘check-in’ function that requires neither Bluetooth nor GPS. This function is particularly useful for events where the organisers will take on the responsibility

Data for Policymaking in the Pandemic Period 13
of generating a QR code for the event. This QR code is to be scanned by each of the guests upon arrival, and when leaving, they can ‘’check out’ by confirming on the app. If an individual at the event tests positive for the virus, they will receive a COVID-code from relevant local authorities, doctors, other healthcare workers, and even testing centres. The code is then used to activate the notification function within the SwissCovid app, which then goes on to anonymously notify all other individuals who have encountered the infected person and allows them to avail a free COVID-19 test (FSO, 2020). The Federal Statistical Office then receives the information gathered through the app by the Federal Office of Information Technology, Systems and Telecommunications (FOITT). The information that is collected includes the installation and usage statistics of the SwissCovid app, the duration between identification of symptoms and entering of COVID-codes, the number of COVID-codes that have been entered and a subsequent number of warnings delivered. This information is also published and presented to the public in an easy-to-read, visualised format (FSO, 2020).
Alternative data use: While the majority of the countries under the current exercise have chosen to deploy online/in-app surveys or Bluetooth tracking or a combination of the two, South Korea has chosen to use alternative forms of data to track and monitor the population movement and the spread of the virus.
Jointly launched by the Korea Centre for Disease Control (KCDC) and the Ministry of Land, Infrastructure and Transport, the Epidemiological Investigation Support System (EISS) builds on South Korea’s ‘Smart City’ data system with the help of Korea Electronics Technology Institute (KETI). EISS streamlines the process of digitally recording credit card, location and smartphone usage data in a spreadsheet format. In addition to the recording process, EISS allows authorised investigators to send in requests regarding specific COVID-19 cases. The data that is then processed and provided requires the relevant law enforcement authorities to approve ‘requests for location data from three telecom service providers while the Credit Finance Association manages approval of credit card data from 22 credit card companies’. Despite privacy concerns, EISS has fast-tracked the survey process, subsequent movement tracking and notifying and monitoring persons who have come into contact with an infected individual (Shin, Jin, and Smith, 2020).
Alongside EISS, South Korea had launched the KI-Pass for high-traffic areas. The KI-Pass implements the voluntary usage of QR codes as a replacement for manual sign-in sheets in locations such as fitness centres, bars and restaurants, which are usually considered as ‘high-risk’ areas. With the rising concerns over data privacy, the KI-Pass ensures that data gathered will be deleted 14 days after the time of collection (Kim et al., 2021).
2.2.2 Quarantine and lockdown monitoring
As the numbers of infected persons and subsequent death tolls rise due to COVID-19, countries around the world have found themselves going into repeated lockdowns and

Data for Policymaking in the Pandemic Period14
enforcing quarantine for infected persons. Although the majority of the selected countries have focused primarily on contact tracing, countries such as Ghana, Vietnam and South Korea have gone a step further to monitor lockdown and quarantine related activities and their effectiveness.
With the objective of preventing new cases and slowing down the spread of COVID-19, Vietnam had released their Hanoi SmartCity app in early 2020. Infected persons were required to install and activate this app on their phones which would then monitor their symptoms, track their location and adherence to quarantine rules and regulations. In the event that an infected person strayed 20 or 30 meters away from their designated quarantine area, the app would then notify respected area heads and family members as regards the quarantine violations (Vietnam Times, 2020).
Much more invasive, however, was South Korea’s Self-Quarantine Safety Protection app. While the country had already been enforcing the conventional phone call monitoring process of persons in self-quarantine, the app launched by the country’s Ministry of Interior and Safety used GPS to monitor the locations of infected people. In the case of a quarantine violation, case officers monitoring the app will enforce the violator to wear an electronic ‘safety band’ that is connected to their phones. In addition to this electronic wristband, South Korea imposes a hefty fine of over USD 8000 for self-quarantine violators (Kim et al., 2021).
Finally, Ghana’s National Statistical Office (GSS) has reportedly leveraged its partnership with the private sector, including telecom operators, to conduct telephone surveys and use anonymised and aggregated call details records to aid decision-makers during the pandemic. GSS has used call details records to track, monitor, and analyse population mobility and produced two successive mobility analysis reports in collaboration with the Ministry of Planning and Ministry of Health. These reports were crucial in highlighting the impact on population mobility in the pre- and post-lockdown periods and, thus, analysing the effectiveness of imposing lockdowns in Ghana altogether (UNDESA, 2021).
2.2.3 Mainstream economic data dimension
As noted, COVID-19 targeted data initiatives have been health-centric in nature for the most part. However, the pandemic has been more than a global health crisis. The socio-economic costs of the pandemic have been enormous. Countries like Ghana and Estonia have taken data initiatives to map impacts on their economies alongside their health scenario.
In the case of Ghana, GSS has leveraged its partnerships with UNICEF, UNDP and World Bank to develop and launch COVID-19 business, local economy and household and job trackers. To understand and assess the impact of the pandemic across the three abovementioned areas, GSS primarily used telephone-based surveys to collect data, particularly regarding business activity and employment after the pandemic, the rise in criminal activity and other socio-economic issues across local areas and distribution of government assistance to households.

Data for Policymaking in the Pandemic Period 15
GSS then collated this information and published it in separate reports that are available to the public on the official GSS online platform (GSS, 2021; GSS, UNDP and World Bank, 2020; GSS and UNDP, 2020). While Ghana relied on telephone and panel surveys to obtain mainstream economic data, Statistics Estonia made use of employment registers and VAT returns to publish short-term labour and enterprise data (Statistics Estonia, 2020).
2.3 Summary of observations
The review of the initiatives led by the selected international organisations has shown that efforts towards supporting the data ecosystem during the pandemic fall within two major categories: shifting priorities online and leveraging partnerships. Within the scope of the first, the organisations discussed so far conducted surveys to assess the state of NSOs. Following this came the plethora of online platforms in the form of websites and data dashboards presenting relevant COVID-19 statistics and the development of new tools to support the continuity of NSO activities. COVID-19 data initiatives launched by the aforementioned international organisations also included virtual sessions facilitating peer-learning among the key stakeholders of the global data ecosystem. The second major category of global COVID-19 data initiatives included leveraging old partnerships and forming new ones to create new pandemic focused coalitions to address data gaps and related challenges.
Unsurprisingly, COVID-19 targeted data initiatives by the countries discussed above have placed greater emphasis on health. Within the health-focused initiatives, however, there has been a greater concentration on contact tracing through online based surveys and Bluetooth tracking. Whereas Vietnam, Estonia and Switzerland were found to favour dedicated COVID-19 mobile applications with Bluetooth tracking installed, South Korea has taken a much more invasive route through the usage of alternative sources of data. While the surveys and Bluetooth tracking of Vietnam, Estonia and Switzerland have already come under scrutiny for data privacy concerns, South Korea chose to coordinate with relevant agencies to obtain credit card data, location data and QR codes to track movements of infected individuals and people they made ‘contact’ with. For stricter monitoring, electronic wrist bands linked to smartphones were distributed to infected individuals along with fines for violating self-quarantine rules in some instances. Ghana, however, used alternative data sources to monitor the effectiveness of enforcing lockdowns by obtaining call detail records from telecom operators. Additionally, Ghana’s focus has also been on establishing COVID-19 data initiatives that address the pandemic’s impact on the country’s local business, employment, and households. Whereas the majority of the previously mentioned countries favoured digital solutions to the rising data challenges, Ghana pursued telephone-based methods.
Given that the data initiatives discussed in this section are largely targeted towards COVID-19, their sustainability in the post-pandemic era may come under pressure. The overall ‘digital’ nature of these initiatives is time appropriate in the pandemic context. However, it is also true that it has raised the critical concern of the digital divide. Data privacy has also emerged

Data for Policymaking in the Pandemic Period16
as a critical concern owing to the data initiatives taken with a view to controlling the spread of the pandemic. For a post-COVID era, the policy interest lies in the areas of sustainability of successful initiatives, data access, standardisation, interoperability and privacy. These issues are explored in the context of Bangladesh in the following sections highlighting the challenges and recommendations for the future.

Data for Policymaking in the Pandemic Period 17
3.1 Taxonomy of health-related data initiatives in view of COVID-19
The concept of promotive, preventive, curative and rehabilitative health care goes way back. In 1945, Henry E. Sigerist described the four vital functions of medicine as promoting health, preventing illnesses, curing the sick and rehabilitating the injured or the disabled (Kumar and Preetha, 2012). These four functions are part of primary health care which comprises a range of essential health services, from health promotion to prevention, treatment, rehabilitation, and palliative care throughout the life span of an individual (WHO, 2021a). OECD et al. (2017) classified health care functions into eight major groups viz. curative care, rehabilitative care, long-term care (health), ancillary services, medical goods, preventive care, governance and health system and financing administration, and other health-related services not elsewhere mentioned. A previous study by OECD (OECD, 2000) conceptualised health care functions as a combination of personal health care goods and services and collective health care services. Here, personal health care goods and services comprise services of curative care, rehabilitative care, long-term nursing type care, support services to health care, and medical goods allocated to out-patients. Similarly, collective health care services include prevention and public health services, and health administration and health insurance (OECD, 2000).
In the health system of Bangladesh, the Ministry of Health and Family Welfare (MoHFW) is primarily responsible for planning and management of preventive, curative, promotive health services to the population. However, this responsibility falls to the Ministry of Local Government, Rural Development and Cooperatives in the urban areas. The public sector provides most of the preventive, curative, promotive and rehabilitative services in Bangladesh (GoB, 2020). Given the significance of these four types of health care as components of both primary health care and universal health care (WHO, 2021a; 2021b), it is critical to see their usage in Bangladesh in the backdrop of COVID-19. Before doing so, it is essential to have a better understanding as regards these four types of health care functions.
Promotive care relates to an extensive political and social process to enhance the capacity of people to control over and improve their health. It focuses on the population as a whole (Kumar and Preetha, 2012) rather than concentrating on
Section 3
Bangladesh During COVID-19 PeriodA Mapping Exercise of Data Domains

Data for Policymaking in the Pandemic Period18
individuals with a particular disease and aims towards prompting actions related to determinants of health (WHO, 1998). One of the focuses of health promotion is to amass personal and societal influence to raise awareness of and create demand for health care through mobilisation of material and human resources (WHO, 1998; WHO, n.d). To this end, the health care providers and health activists can play a catalytic role, for instance, by providing access to information (WHO, 1998).
Preventive care includes measures that aim to avoid or decrease the number or severity of injuries and diseases, their consequences and complications (Pomey et al., 2000 cited in OECD et al., 2017). These interventions are conducted in three levels viz. primary, secondary and tertiary. Primary prevention measures relate to reducing health-related risks before these generate some effects, for example, by providing vaccines. Secondary prevention is associated with interventions aimed towards identifying the illness and providing measures to restrain it from exacerbating, for instance, via screening. Tertiary prevention aims at lessening the impact of an already existent disease, for instance, by early surgery on a damaged organ (OECD et al., 2017).
Curative care comprises health care services to mitigate illness symptoms, reduce the severity of illness, or restrain it from exacerbation that could otherwise be life-threatening or affect the normal functioning of an individual (OECD, 2000; OECD et al., 2017). Curative care includes all elements required to treat an illness or injury, ranging from diagnosis to formulating prescription, surgeries, therapeutic procedures, obstetric services etc. Curative care services also include routine administrative procedures, for instance, completing and updating patient records. Management of chronic illnesses for which complete recovery may not be possible also falls under the category of curative care if a partial recovery is expected (OECD et al., 2017).
Rehabilitative care includes services that are associated with improvement of the functional limitations of individuals caused by recent illness or injury, or injury of a recurrent nature, with the aim to help them achieve and maintain optimal functioning, a better quality of life and participation in the community and society. Rehabilitative care requires episodic patient assessment and review of treatment plans until the condition is stabilised (OECD et al., 2017).
As will be evinced in the following sub-section, the health-related data initiatives in Bangladesh which were taken in view of COVID-19 are mostly related to the promotive, preventive and curative aspects of health care. Clustering these data initiatives according to their various types under each aspect of health care will allow a clear understanding of where the primary focus has been. This exercise will also align with other literature that has classified the data initiatives during the COVID-19 period based on their type. For instance, OECD and The GovLab (2021) sorted various COVID-19 targeted data initiatives based on

Data for Policymaking in the Pandemic Period 19
five central elements viz. what is the type of data products, what are the needs addressed, what are the types of analysis provided, who are the potential users, and which crisis management phase is addressed. The various types of data products mentioned in the study include data repository, data dashboard, data visualisation, hybrid products, websites and reports, and press releases and bulletins1. Alamo et al., 2020 categorised the data initiatives based on their source. Such sources may include institutions providing worldwide COVID-19 data, open-source communities, and various regional and national statistical bodies.
For the present study, the health-related data initiatives in view of COVID-19 in Bangladesh will be classified by combining the ideas of Sigerist and the data product types described by OECD and The GovLab (2021). As such, the classification will be primarily done in two layers. The first layer will put each data initiative under the health care functions they serve. The second layer will provide information on the types of data products that are being generated. While doing the classification, whether the data initiatives are new or extension or continuation of old initiatives will also be mentioned. The framework for this classification is presented in Figure 3.1. Given the sheer number of health-related data initiatives, an exhaustive examination of each and every one of them may prove to be an unwieldy exercise.
1Data repository is an online platform which is designed in a logical manner, and stores and make data available for using. Data dashboard is a webpage which provides the summary of any progress or performance, usually in an easy-to-read or graphical format. Data visualisation demonstrates complex data in an easy-to-read format and through visuals such as graphs, maps or charts. Hybrid products intend to document information using various formats, such as, map, visualisation, dashboard etc. (OECD and The GovLab, 2021).
Figure 3.1: Classi�cation of the health-related COVID-19 data initiatives�
Source: Authors’ elaboration.
Data product type
Datadashboard
Datarepository
Datavisualisation
Hybridproducts
Websites,webpages
and reports
Press releasesand bulletins
Health care function
Promotive Preventive Curative Rehabilitative
Helath-related data initiatives

Data for Policymaking in the Pandemic Period20
As such, the current study will look at the more prominent sources that provide statistics and information related to health and COVID-19. Mapping of such initiatives is provided in Annex Table 3.1 in more detail.
3.1.1 Promotive health care
As has been mentioned, promoting health strategies refers to facilitating a supportive environment for health, ensuring and strengthening community participation, and mobilising material and human resources to protect health (WHO, 1998; n.d). Hence, providing health-related information to create mass awareness, disseminating information about telehealth services, and statistics on the provision and reception of such services provide indication towards the ongoing health promotion activities in a country. This is particularly pertinent in the context of COVID-19, where issues such as proper use of masks, social distancing and maintaining personal hygiene have attained heightened importance.
a. Data dashboard
The ‘COVID-19 Dynamic Dashboard for Bangladesh’ by DGHS provides designated mobile phone numbers to seek information on tests, treatment, and hospitals, which is part of promotive health care.
b. Hybrid product
‘Corona Info’ is a new initiative of the Government of Bangladesh, and the affiliated organisations are MoHFW, DGHS, IEDCR, NTMC (National Telecommunication and Monitoring Centre), a2i, Cabinet division, ICT division, and UNDP. This hybrid product contains a COVID-19 dashboard, a COVID-19 Telehealth Centre dashboard, COVID-19 Telehealth Centre daily reports, a web page that visualises ‘COVID related overall scenario’ and a link to another website named ‘COVID-19 Tracker’. The COVID-19 dashboard contains data, graphs and visualisation regarding infection, death, recovery and tests, whereas the COVID-19 Telehealth Centre dashboard contains data, graphs and visualisation regarding the total number of telehealth services provided, the total number of COVID positive patient assessments, the total number of COVID positive patients follow up and the number of calls received from the patients directly. Both cumulative and most recent individual values are provided but not in a downloadable format. On the web page for visualisation of ‘COVID related overall scenario’, there are graphs for the number of people tested positive, the number of deaths, the total recovered, and the total number of tests daily until the recent date. Moreover, there are web pages for ‘live corona test’, ‘contact tracing app’ and telemedicine services on the ‘Corona Info’ website. The webpage for telemedicine services provides contact details of several such services. This webpage also provides data and graphs related to the number of available doctors, number of patients during the past week and total suspected patients of the ongoing week. However, the data only provides cumulative values and is not present in downloadable format.

Data for Policymaking in the Pandemic Period 21
On the ‘Corona Info ’website, there is various information related to COVID-19 such as symptoms of infection and related actions, sample collection and hospital admission, direct consultation service with doctors through hotline numbers and information service, vaccine-related information, and emergency services such as oxygen and ambulance facilities. Provision of such information belongs to promotive health care as the purpose is to create awareness among people regarding prevention, diagnosis, treatment/cure, available logistics etc. There is another webpage on the website for providing feedback on the available information. This initiative also belongs to promotive health services.
c. Website
There is a website for ‘live corona risk test’, which is a new initiative undertaken by the ICT division and DGHS. This website hosts an app that helps to identify whether a person is infected with COVID-19 or not. This app also helps the suspected patient to understand the severity of the infection and recommend actions accordingly. The app has been created following the guideline of WHO.
d. Report
The ‘COVID -19 Telehealth Centre daily report’, available at the ‘Corona Info’ website, provides information such as hotline numbers and mobile numbers to seek telehealth services that can be considered part of promotive health care.
e. Bulletin
The ‘COVID-19 Situation Related Health Bulletin’ provides information related to sample collection facilities for people expected to travel abroad, for instance, names and contact details of government and private institutions that collect COVID samples, emergency contact numbers for COVID related activity, hotline numbers for seeking COVID related information and a web link to send COVID-19 related grievance. Providing these through the bulletin falls under the category of promotive health care as it makes people more aware.
f. Other products
The ‘Corona tracer BD’ app is a collaborative initiative by the ICT division, DGHS, IEDCR, a2i and SDMGA to prevent the spread of COVID-19. This contact tracing app utilises Bluetooth technology, as was evinced in many other countries. The data system of the app was developed by ‘SHOHOZ’. A section of the app provides the latest statistics on COVID-19 in Bangladesh. Apart from these, the app also provides information relevant to COVID-19 symptoms and possible actions in case of suspected infection. While the contact tracing helps prevent the spread of COVID-19, the other features help make people aware of COVID-19. Regrettably, this contract tracing app could not be successful due to its usage model and the poor public health behaviour of Bangladesh.

Data for Policymaking in the Pandemic Period22
3.1.2 Preventive health care
As discussed earlier, preventive health care refers to services that help to prevent illness either by deterring health risks completely or by lessening the intensity of illness by initiating immediate action. Preventive health care services are associated with health promotion activities (OECD et al., 2017), and hence the indicators for preventive and promotive health care may overlap. Among the COVID-specific data initiatives in Bangladesh, many provide statistics on the number of tests, infection, recovery, and death across locations and for different age groups and genders. These provide an indication regarding the prevalence, intensity and movement of COVID-19 and can help determine interventions duly. Thus, the data initiatives or data products that contain information related to the aforementioned indicators are associated with preventive health care and hence have been discussed in the subsequent part of the study.
a. Data dashboard
COVID-19 Dynamic Dashboard for Bangladesh
Interactive dashboards were the most visible data initiative that was taken during the onset of COVID-19. The majority of these dashboards were created and published by DGHS in collaboration with national, international, and private organisations. The ‘COVID-19 Dynamic Dashboard for Bangladesh’ is a new initiative by DGHS after the COVID-19 outbreak in Bangladesh. This dashboard provides an overview of the pandemic scenario based on various indicators and georeferenced data. The dashboard has been modified and taken different forms over time. For instance, initially, it was a single webpage consisting of a number of indicators. However, currently, the dashboard consists of four separate sections specific to four different groups of indicators. Among these four sections, three viz. ‘national statistics’, ‘weekly dashboard’, and ‘vaccination’ provide data relevant to preventive health care.
The ‘national statistics’ section of the ‘COVID-19 Dynamic Dashboard for Bangladesh’ comprises figures on daily infection rate (number of lab tests vs confirmed cases), the total number of confirmed cases (both the cumulative value and individual value) across the districts and divisions. The number of confirmed cases is also disaggregated by gender and age groups. Figures are also provided for the total number of daily deaths with disaggregated values by division, gender, and age group. There is a map in the dashboard where the cumulative number of confirmed cases are shown across districts. Another map exhibits COVID-19 testing facilities across the country. Two tables in the dashboard provide information pertaining to confirmed cases, one with daily updates and the other with the updates of the current week and previous week, with a particular focus on the most affected districts. These tables also contain other information, such as number of tests, positivity rate, total COVID-19 dedicated beds in hospitals, bed occupancy rate, number of patients. Apart from these, there is information provided in the dashboard for the number of lab tests,

Data for Policymaking in the Pandemic Period 23
number of recovered patients, number of persons in isolation, number of deaths, and number of second doses of vaccination administered, both in cumulative and daily-basis forms. There is a pie-chart in the dashboard that provides information regarding complaints related to COVID-19 patient admission and treatment. The pie chart shows the shares of COVID related complaints received from various sources, such as diagnostic centres, consultation centres, and hospitals and clinics. In the dashboard, data are available in downloadable excel format for the number of lab tests against confirmed cases, confirmed cases for the divisions and top 10 districts, number of deaths and COVID related complaints.
The ’weekly dashboard’ part of the ‘COVID-19 Dynamic Dashboard for Bangladesh’ provides comparative statistics for the number of tests, detection, and death for the previous one week; map of district-wise risk level based on detection rate; weekly city corporation infection map, a spreadsheet for the number of tests, test positivity rate and positive cases in last seven days; and a trend chart for detection rate at the district level based on daily examination. Data in this dashboard is not available in downloadable format. All the data are obtained from the MIS of DGHS and IEDCR.
The ‘vaccination’ section of the ‘COVID-19 Dynamic Dashboard for Bangladesh’ contains figures related to the total number and percentage of people who have received the vaccination. This information can be viewed specific vaccine wise or in an aggregate manner. The data is presented in an irregular time interval. The dashboard also provides time-series data for the number of vaccine recipients per 100 people. Apart from these, there are figures showing the total number of first and second doses of vaccination administered. Along with these disaggregated data, the dashboard also provides cumulative value for total vaccine targeted population (including people aged over 18 and frontline workers), number and percentage of total registration, percentage of the first dose against registration, percentage of the second dose against the first dose and total AEFI (Adverse Events Following Immunisation). Most of the statistics are provided for all districts and divisions of Bangladesh.
Shonkhay Corona Virus
The dashboard titled ‘Shonkhay Corona Virus’ (Corona Virus in Numbers) provides statistics relevant to daily and cumulative confirmed cases, daily and cumulative number and percentage of deaths, and cumulative number and percentage of the recovered patient across the world, including Bangladesh. This dashboard also provides information regarding infection rate in each million, cumulative and percentage of people under treatment, the cumulative number of vulnerable people in countries and the total number of countries affected, including Bangladesh. The data on the dashboard is regularly updated. However, it is not available in a downloadable format. This dashboard is a new data product created after the onset of COVID-19. The data has been collected through various international sources such as WHO, CDC, ACDC, Rapid API, DXY, and Worldometer.

Data for Policymaking in the Pandemic Period24
b. Hybrid product
COVID-19 Impact and Recovery Management System
In view of COVID-19, a hybrid product titled ‘COVID-19 Impact and Recovery Management System’ has been added to the pre-existing SDG Tracker of Bangladesh. In this new initiative, the statistics have been provided by DGHS and IEDCR in partnership with the Cabinet Division, with the technological assistance from a2i. This hybrid product consists of visualisations, maps, dashboards and data repositories presented in multiple sections with multiple indicators. For instance, a dashboard named ‘COVID-19 key statistics’ provides information relevant to daily and cumulative confirmed cases by districts, daily and cumulative number of deaths, and daily and cumulative number of tests done. There is one visualisation named ‘COVID-19 daily trend for Bangladesh’, which consists of trends of confirmed, recovered, death cases and percentage of positive tests. The ‘Corona spread over time’ section provides a map that shows confirmed cases by districts over time. One section titled ‘Dhaka city scenario’ provides a map for area-wise total confirmed cases in Dhaka city. The ‘COVID-19 demographic distribution’ visualisation provides graphs related to the percentage of confirmed cases by age group, gender, and percentage of deaths by age group. There is a dashboard named ‘Global cases’ where country-wise total number and percentage of confirmed cases, active cases, deaths and recovery are provided along with the total number of countries affected with COVID-19. The dashboard provides the latest statistics on COVID-19 for the whole world according to the data from Johns Hopkins University. None of the data in this new product of SDG tracker is in downloadable format. The data is updated on a regular basis.
The ‘COVID-19 Impact and Recovery Management System’ of SDG tracker includes a socio-economic dashboard that is again disaggregated into six subsections: health, education, economy, social protection, relief, and environment. The health subsection displays, among others, the upazila-wise total number of daily calls to 333 by collecting data from telecom operators. It also shows the time trend of daily callers to 333 per 100,000 population by districts. Information on district-wise COVID-19 affected institutions, division-wise closed educational institutions, division-wise affected students and teachers are recorded under the education subsection. The economy subsection provides data on household income and consumption, remittance, employment, banking and foreign trade. The data on employment is of particular interest as it shows the effect of lockdown on employment categories and households. The social protection subsection exhibits information on social safety net allowances and child protection. The relief subsection shows the data on the amount of corona cash relief, cash relief by division, the distribution of female and male beneficiaries etc. Using the satellite image data from SPARRSO, the environment subsection presents the data on the 2020 flood with the COVID-19 scenario.

Data for Policymaking in the Pandemic Period 25
COVID-19 tracker
The hybrid product named ‘COVID-19 tracker’ has been jointly developed by the ICT division and Bangladesh Computer Council (BCC) of the Government of Bangladesh. This new data initiative collects information from reliable and recognised international sources such as Worldometer and Johns Hopkins University. The information in this data product is updated at a very high frequency. This hybrid product contains two data visualisations. The first provides maps and statistics about the daily and the cumulative number of confirmed cases, daily and the cumulative number of death cases, daily and cumulative number of recovered cases, the cumulative number of people under treatment, the cumulative number of tests done, and death rate. This visualisation also provides cross-country data for the same indicators. The second data visualisation provides graphs about the same indicators mentioned above along with trend lines to show the total number of infections, recovery, and deaths over time. This data visualisation also provides graphs for demonstrating cross country statistics. In both of the visualisations, there is no option to download the data. Another data product in the ‘COVID-19 tracker’ is the data repository which provides a downloadable spreadsheet with data about the cumulative number of confirmed cases across the districts of Bangladesh and areas of Dhaka city. This repository provides data for the new and cumulative number of confirmed, death and recovered cases, the cumulative number of tests, the new number of people under treatment and the death rate.
c. Website
In order to facilitate the registration for the vaccination process, the ‘Surokkha’ website alongside a companion app has been developed by the ICT Division in collaboration with MoHFW and DGHS. Other affiliates include a2i, Bangladesh Computer Council, Bangladesh Election Commission, Finance Division, BRTC, WHO, UNICEF, BEXIMCO Pharma, SSL wireless, and mobile telecom operators. This website is dedicated to services such as providing vaccine registration status, vaccination card download facility, vaccination certificate download facility etc., besides the vaccination registration services. Although the website or app itself does not provide any data, the registration process generates data on a number of indicators such as the number of people registered for vaccine by age and gender, recipients of the first dose and second dose, recipients of first dose and second dose against registration etc. Some personal information such as mobile number, national ID number and comorbidity status are also collected during registration. The collected information is stored in a secure server managed by ICT Division and DGHS. Only authorised personnel are allowed to access the stored data. These data are shared with and analysed by the ICT Division and DGHS to design and implement COVID-19 targeted public health interventions or support COVID-19-related epidemiological research.

Data for Policymaking in the Pandemic Period26
d. Press release
Vaccination Press Release by DGHS
DGHS produces three types of press releases regarding COVID-19 vaccination in Bangladesh. The first one provides summary statistics on the overall vaccination scenario in Bangladesh. This press release includes indicators such as the number of people receiving first and second dose by gender and types of vaccines viz: Pfizer, Sinopharm, AstraZeneca and Moderna, and the number of people receiving first and second doses. The second press release contains data specific to Dhaka city on the aforementioned indicators. This document also provides the number of provisional AEFI for all four vaccines. This data is disaggregated by 47 hospitals or vaccination centres across Dhaka city. The third press release contains the same indicators as the second one, but the data is disaggregated by districts and divisions of Bangladesh. All three types of press releases are part of new data initiatives by the government, which have been developed and published by DGHS, MoHFW and MoH after the pandemic had started. All these press releases can be downloaded in PDF format.
COVID-19 Daily Press Release by IEDCR
The press release by IEDCR was the first of its kind in Bangladesh, which continued till March 2020. This press release contains information on the daily and cumulative number of people screened at different points, use of hotline services (such as number of calls to hotline numbers), lab tests (such as number of tests), number of people in isolation before doing the test, number of confirmed cases, number of people in quarantine. Apart from these, there is information regarding the prevention of COVID-19, and hotline numbers and Facebook links for seeking COVID related help.
Novel Coronavirus (COVID -19) Press Release by DGHS
The ‘Novel Coronavirus (COVID-19) Press Release’ contains data regarding COVID-related sample tests, confirm cases, death cases, recovery cases, isolation, quarantine, screening, logistics, telehealth services etc. However, the information or data is only available for March 2020, when the prevalence of COVID-19 first started. It is understood, with the emergence of new forms of communication tools, this press release was abandoned.
e. Bulletin
The ‘COVID-19 Situation Related Health Bulletin’ by DGHS contains a large amount of data on various indicators which can be divided into three clusters. Each cluster of indicators can be connected to different types of health care services. For instance, the first and third clusters can be associated with preventive health measures, while the second can be linked to curative health care. The first cluster includes information relevant to the daily and the cumulative number of tests done for people going abroad, daily and the cumulative number

Data for Policymaking in the Pandemic Period 27
of people entering and leaving quarantine, daily and the cumulative number of people entering and leaving isolation, daily and the cumulative number of people screened at different times, daily and the cumulative number of calls received through helplines, the total number of vaccination registration, daily and the cumulative number of the first and second doses of vaccination. The third cluster in the bulletin consists of data associated with infection, recovery, and death. This cluster includes indicators such as daily and cumulative number of COVID identified patients by division, districts and by per 100 sample tested; daily and cumulative number of COVID recovered patient by divisions, by per 100 positive cases identified, and per 10 lakhs population; daily and the cumulative number of death due to COVID-19 by gender, age group, by per 100 positive cases identified, and by per 10 lakhs population; the daily number of death across private and public hospitals and at home; the daily number of death who were brought to the hospital as dead.
3.1.3 Curative health care
Information pertaining to hospital logistics, health workforce, and health commodities provide some indication of the capacity of delivering curative health care services in a country. Hence, data products relevant to these indicators can be associated with curative health care.
a. Data dashboard
COVID-19 Dynamic Dashboard for Bangladesh
In the ‘hospital information’ section of ‘COVID-19 Dynamic Dashboard for Bangladesh’, there are data tables related to hospital bed information which include information on the total number of COVID-19 dedicated available and occupied general beds, ICU beds and HDU beds, bed occupancy rate and ICU equivalent bed with high flow nasal cannula. COVID-19 oxygen status includes occupied bed, vacant bed, bed occupancy rate, number of available and used high flow nasal cannula, number of oxygen concentrators available, number of oxygen cylinders available (full/empty/ in use), and the total number of beds with central oxygen supply. COVID-19 designated human resource includes data for the number of doctors, nurses, and other staff. The information is disaggregated by location (i.e., districts and divisions), hospital type (i.e., private and government). Data is made available on a cumulative basis till the latest period. A downloadable excel database is provided for all the data.
COVID-19 Commodities Dashboard
The DGHS website hosts the ‘COVID-19 Commodities Dashboard’, which provides information related to the stock of commodities such as the cumulative number of gloves, masks, aprons, sanitiser, head/face/eye shields, shoe protector and PPE kits available, and commodity movement trend. Statistics related to donation, procurement and stock of health

Data for Policymaking in the Pandemic Period28
care commodities such as the quantity of stock received from certain donors, name of the donors, and name of the districts and hospitals receiving the products; statistics for central donation, central procurement, local donation, local procurement; facility stock summary by districts; total stock at facilities are also provided. This dashboard is updated on a regular basis, but none of the data is downloadable. This is a new initiative of the Government of Bangladesh which has been undertaken by the MoHFW through DGHS, with the collaboration of USAID.
Coronavirus COVID-19 Dashboard, 2020
The ‘Coronavirus COVID-19 Dashboard, 2020’ is a new data product of the Government of Bangladesh which provides data related to cumulative and daily number of lab tests, confirmed cases, isolation, recovery, and deaths, with figures showing the scenario over time, daily case rate (number of lab tests vs confirmed cases) across division and districts. There is a downloadable spreadsheet for confirmed cases across districts. A trendline shows a daily number of people who were quarantined and released over time. There are figures for hospital logistics such as the number of general and ICU beds and number of admitted patients in such beds and the number of isolation beds across divisions and districts. All these data are downloadable in excel format. Apart from these, statistics relevant to the preparedness of hospital (e.g., control room, medical team, isolation unit, and separate OPD for RTI patient) and a spreadsheet for medical supplies (e.g., number of aprons, gloves, head, face and eye shields, PPE kits, sanitiser, shoe protector and others) are also provided. This dashboard has been prepared under the authority of MIS of DGHS, and data has been collected from HEOC and control room, IEDCR, and obtained from DHIS2 system, daily DGHS bulletin and eLMIS. UNICEF has provided technical assistance for this. The dashboard is being updated on a regular basis.
b. Webpage
On the DGHS website, there is a webpage titled ‘Information including empty beds in Corona hospital’. This is a new data product created by the DGHS to provide hospital-related information associated with COVID-19. This webpage contains indicators such as the number of general, ICU and HDU beds and number of admitted patients occupying such beds, number of ventilators, number of admitted or discharged patients in the last 24 hours, the total number of oxygen cylinders, total number of oxygen concentrators, total number of available and currently used high flow nasal cannulas, availability of central oxygen line etc. The data is provided for 44 hospitals of Dhaka and eight hospitals of Chattogram district, which is being updated on a regular basis. The data can be downloaded in PDF format.
c. Report
DGHS produces a report titled ‘COVID -19 Telehealth Centre Daily Report’, which is regularly published on the website of ‘Corona Info’. This report contains data related to total infection

Data for Policymaking in the Pandemic Period 29
rate, number of patients going through the daily assessment, number of people receiving health advice through telehealth, number of infected people who received telemedicine assessment services, number of infected people who received follow up services, number of infected people who were requested for taking telehealth advice, percentage of other diseases among the COVID-19 infected people, total number of infected people by divisions, age group and gender, and number of COVID-19 infected people by the level of intensity of the infection. Value for all the indicators, except for the percentage of other diseases among the COVID infected people, is provided in a cumulative manner till the reporting period. In the report, data are represented through graphs, and they are not in downloadable format. The data provided in the report are obtained from the ‘COVID-19 telehealth centre’, which is a digital platform established with the purpose to provide health services to the COVID positive and suspected population through doctors or Health Information Officers over mobile phone (audio/video).
d. Bulletin
The second cluster in the aforementioned ‘COVID-19 Situation Related Health Bulletin’ is related to hospital logistics and diagnosis-related information where the constituting indicators are the total number of empty and available ICU beds, ICU equivalent beds with high flow nasal cannula, HDU beds, HDU equivalent bed with oxygen concentrators, the total number of oxygen concentrator and the existence of central oxygen line. Data for all these indicators are disaggregated by location (divisions) and type of hospital (private and public). All these data have been collected from HEOC and Control Room, DGHS. The cumulative value for the number of oxygen cylinders, oxygen concentrators, high flow nasal cannulas, central oxygen lines is separately provided in the health bulletin for the eight divisions in Bangladesh, and the source of this data is Divisional Directorates, Health. Apart from these, data is also provided for indicators including the number of diagnostic centres by type of COVID-19 diagnosis methods (RT-PCR, Gene expert, Rapid Antigen) and for private and public hospitals, the daily number of samples collected and tested, and a cumulative number of samples tested by the aforementioned three types of diagnosis methods across divisions, districts, and hospitals.
3.1.4 Overall assessment
A number of observations emerge from the review of the COVID-19 targeted health data initiatives in Bangladesh. First, the sheer number of data initiatives can be quite overwhelming for the uninitiated. Lack of a central data repository can be often felt while going through such initiatives. Second, most health data initiatives have focused on the preventive and curative aspect of health care. The data initiatives did not reflect the rehabilitative aspect of health care. Third, the overwhelming majority of the data initiatives utilise data from DGHS and its various wings. Fourth, the same indicators from the same sources are often reported in different initiatives. Given the difference in reporting time and frequency, this often creates confusion as regards the latest state of affairs. Fifth, in terms of regularly providing up-to-date

Data for Policymaking in the Pandemic Period30
status of key variables of interest, the COVID-19 targeted health data initiatives exhibited considerable improvement compared to the pre-pandemic scenario. Sixth, data dissemination also took a more multipronged approach compared to the pre-COVID-19 situation.
3.2 Data initiatives for designing policy response
In view of COVID-19, countries across the world have taken various support measures to safeguard the health and revive the economic status of their people. The Government of Bangladesh has been no exception to this end. Among the various public policy interventions taken in Bangladesh in view of the pandemic, the BDT 2,500 each to five million households and the vaccination programme have received heightened attention. The current subsection will review the experience of application of data-driven initiatives while carrying out these interventions and assess their successes and limitations. While reviewing the BDT 2,500 cash support programme and the vaccination programme, two case studies were put together (Boxes 3.2.1 and 3.2.2). The relevant information was collected from KIIs, secondary literature, and from the deliberations of a dialogue held by CPD and Oxfam in 2021.2
Box 3.2.1: How data-enabled the BDT 2,500 cash support programme
The cash support programme of BDT 2,500 each to five million households is one of the stimulus packages that were initiated after the COVID-19 pandemic hit the country. The targeted population of this support programme includes people who do not generally fall under the tax net and was hit hard by the pandemic. The target groups include, inter alia, day labourers, domestic workers, farmers, transport workers etc. This cash support programme is one of the definite examples of data-driven public policy intervention during COVID times. Despite the attempt to integrate multiple actors and data systems for disbursing the cash support through a G2P3 system, the government was not able to reach the intended five million households in a timely manner. Hence, a closer look at the process of undertaking the initiative will help identify the challenges that must be addressed for future such initiatives.
At the early stage of the programme, the list of beneficiaries was prepared, verified, and modified by a number of government entities. The primary list of beneficiaries was prepared by BBS using the ‘National Household Database’ through proxy means test (PMT) scoring and then distributed among the Deputy Commissioner (DCs) via email. The DCs then sent the list to the UNOs in excel format, which was subsequently sent to the local government representatives (such as chairman or member of Union Parishad). The local government representatives updated the list as per requirement. For instance, in case someone has changed his/her mobile phone number or migrated elsewhere. Furthermore, the local government representatives modified the list as per field level realities. As was mentioned in the KIIs, the local government representatives might have added or replaced some people based on their own judgement.
2This dialogue was held on 27 May 2021.3G2P refers to Government to Person payment system.
(Box 3.2.1 contd.)
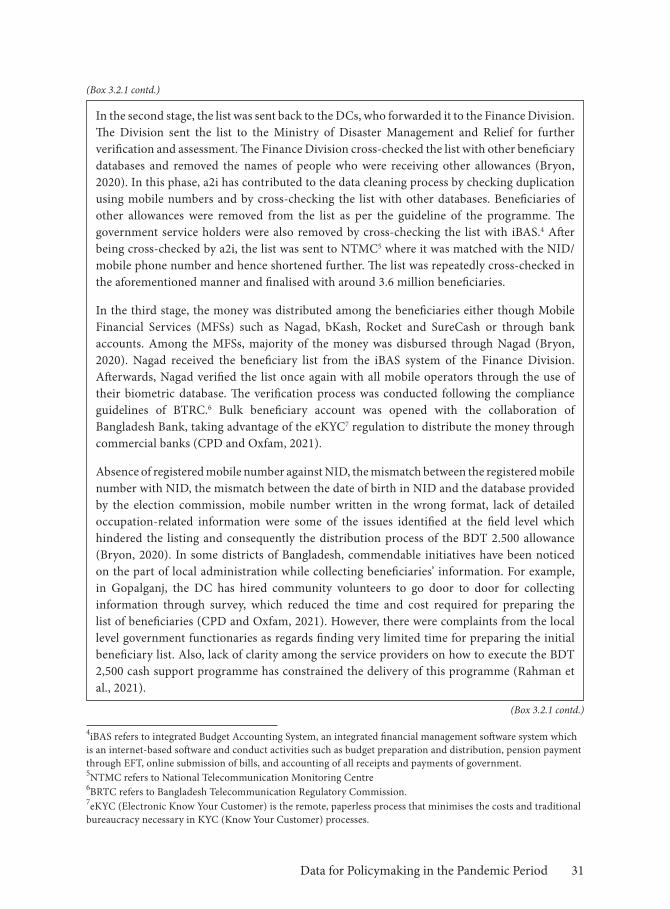
Data for Policymaking in the Pandemic Period 31
In the second stage, the list was sent back to the DCs, who forwarded it to the Finance Division. The Division sent the list to the Ministry of Disaster Management and Relief for further verification and assessment. The Finance Division cross-checked the list with other beneficiary databases and removed the names of people who were receiving other allowances (Bryon, 2020). In this phase, a2i has contributed to the data cleaning process by checking duplication using mobile numbers and by cross-checking the list with other databases. Beneficiaries of other allowances were removed from the list as per the guideline of the programme. The government service holders were also removed by cross-checking the list with iBAS.4 After being cross-checked by a2i, the list was sent to NTMC5 where it was matched with the NID/mobile phone number and hence shortened further. The list was repeatedly cross-checked in the aforementioned manner and finalised with around 3.6 million beneficiaries.
In the third stage, the money was distributed among the beneficiaries either though Mobile Financial Services (MFSs) such as Nagad, bKash, Rocket and SureCash or through bank accounts. Among the MFSs, majority of the money was disbursed through Nagad (Bryon, 2020). Nagad received the beneficiary list from the iBAS system of the Finance Division. Afterwards, Nagad verified the list once again with all mobile operators through the use of their biometric database. The verification process was conducted following the compliance guidelines of BTRC.6 Bulk beneficiary account was opened with the collaboration of Bangladesh Bank, taking advantage of the eKYC7 regulation to distribute the money through commercial banks (CPD and Oxfam, 2021).
Absence of registered mobile number against NID, the mismatch between the registered mobile number with NID, the mismatch between the date of birth in NID and the database provided by the election commission, mobile number written in the wrong format, lack of detailed occupation-related information were some of the issues identified at the field level which hindered the listing and consequently the distribution process of the BDT 2.500 allowance (Bryon, 2020). In some districts of Bangladesh, commendable initiatives have been noticed on the part of local administration while collecting beneficiaries’ information. For example, in Gopalganj, the DC has hired community volunteers to go door to door for collecting information through survey, which reduced the time and cost required for preparing the list of beneficiaries (CPD and Oxfam, 2021). However, there were complaints from the local level government functionaries as regards finding very limited time for preparing the initial beneficiary list. Also, lack of clarity among the service providers on how to execute the BDT 2,500 cash support programme has constrained the delivery of this programme (Rahman et al., 2021).
4iBAS refers to integrated Budget Accounting System, an integrated financial management software system which is an internet-based software and conduct activities such as budget preparation and distribution, pension payment through EFT, online submission of bills, and accounting of all receipts and payments of government.5NTMC refers to National Telecommunication Monitoring Centre6BRTC refers to Bangladesh Telecommunication Regulatory Commission.7eKYC (Electronic Know Your Customer) is the remote, paperless process that minimises the costs and traditional bureaucracy necessary in KYC (Know Your Customer) processes.
(Box 3.2.1 contd.)
(Box 3.2.1 contd.)

Data for Policymaking in the Pandemic Period32
The cash support programme undertaken in 2021 after the second wave of the pandemic added people from other occupations such as fisherman, motorbikers engaged in ride sharing etc. However, the list of such beneficiaries has not been integrated into the first version of the database yet (CPD and Oxfam, 2021). Creating a comprehensive database by integrating the list of all possible beneficiaries would bring the complete success of any such initiatives in the future.
Box 3.2.2: Use of data in the COVID-19 vaccination programme
The vaccination portal titled ‘Surokkha’ is one of the brightest examples of the use of data in the case of COVID-19 response in Bangladesh. This portal covers almost the entirety of the vaccination process, from registration to receiving the vaccination certificate. The data-driven vaccination management system has made it possible to push the vaccination drive in a systematic manner, to reach the targeted population without requiring any human contact (in most steps) and to administer the vaccines on the dot, subject to the availability of vaccines.
The use of data in the vaccination process can be divided into two separate stages. The first is related to the supply chain management of vaccines, while the second deals with vaccinating the citizens. As regards the first stage, the distribution of vaccines has been primarily determined by four major factors, viz. total availability of vaccines, the administering capacity of certain regions and vaccination centres, estimated daily coverage and estimated daily coverage for prioritised groups. Besides these, the infection rate of certain locations was also considered while distributing vaccines. However, this has not been considered as a strong determinant as the aforementioned four factors. In the case of supply chain management, two sources of data have been used. The first is the data collected from sources other than the ‘Surokkha’ portal, such as administrative data on the availability of vaccines and logistics, infection rate etc. The second is the data generated by the ‘Surokkha’ portal itself, such as the number of doses administered to date and the number of doses required down the line.
The capacity of the available cold chain facility oftentimes determines the regional distribution of vaccines. For instance, the Pfizer vaccine needs to be stored at temperatures below minus 60O and hence, is not feasible to administer in most parts of Bangladesh. As a result, this particular vaccine was distributed in Dhaka City Corporation only. Among the other vaccines, Moderna was distributed in 12 city corporations across the country. Besides these two, the available cold chain as part of the routine EPI8 can handle the vaccines from Sinopharm and AstraZeneca up to the Upazila level. Furthermore, availability and maintenance capacity of other logistics such as a syringe, mixing syringe, diluent, safety box, vaccine carrier etc., also determine the distribution of vaccine across regions.
8EPI refers to Expanded Programme of Immunisation.
(Box 3.2.1 contd.)
(Box 3.2.2 contd.)

Data for Policymaking in the Pandemic Period 33
Ensuring maximum coverage has been one of the highest priorities of the authorities with a view to reducing COVID-19 transmission. The front liners and the migrant workers have been prioritised in this regard. The distribution strategy of multiple vaccines was very much determined by the procurement or availability of vaccines and the number of people in prioritised groups. For instance, 100,620 doses of Pfizer vaccine were obtained, with which 50,310 people could be covered for both doses. In this case, the first challenge was to cover the entire country given the lack of cold chain capacity; and the second was to provide adequate coverage given the volume of available vaccines, which was again reserved for migrant workers as per instructions from the government. To facilitate this, a separate window was created to register migrant workers, particularly those from middle eastern countries (e.g., Saudi Arabia and Kuwait), to waive them from quarantine requirements in destination countries. In general, all relevant information pertaining to vaccination is analysed by the line manager of the EPI and the decision about the quantity and type of vaccine to be provided to each division and centre is taken by the line manager based on the aforementioned information.
The calculation of vaccine wastage is made in the EPI headquarters using the information on the number and type of distributed vaccine to a certain centre and the number of people receiving the vaccine in that centre. Vaccines with multi-dose vials require a certain number of people to be present and ready for vaccination before being unpacked. For example, the AstraZeneca vaccine, which has ten dose vials, require ten people to be present for vaccination before unpacking. Hence, the vaccination centres have been instructed to administer the vaccine considering the number of doses in each vial to reduce wastage. However, it has also been instructed that even if eight people are present instead of ten, they must get the vaccine. In such cases, ten to twenty per cent doses of each vial might get wasted. For single-dose vaccines, the wastage is less. However, such vaccines require substantial storage capacity.
When it comes to the vaccination of citizens, as soon as registration is completed in the ‘Surokkha’ portal, real-time data is generated based on which the citizens receive the vaccination card and registration number. Later, the citizens receive an SMS for vaccination appointments. Finally, the citizens can get the vaccine certificate using the ‘Surokkha’ portal through their devices. The data generated from the ‘Surokkha’ portal help the authorities to estimate the demand for vaccines in a certain centre and enable them to come up with a coverage plan given the cold chain and logistics capacity of the centre. An estimation is made for the percentage of the population of certain categories (e.g., medical students, general students, migrant workers) who can be covered, given the capacity of the centre. Based on this estimation, the SMS is sent to individuals and the sequence of coverage is maintained. However, as was found in the KIIs, maintaining the sequence of coverage can only be conducted based on occupational categorisation. Age-based sequencing is not feasible yet due to technical reasons.
The ‘Surokkha’ vaccination portal was planned to be created as a ‘turnkey solution where the entire journey of vaccines, starting from their arrival at the airport to reaching peoples’ hands,
(Box 3.2.2 contd.)
(Box 3.2.2 contd.)

Data for Policymaking in the Pandemic Period34
will be recorded. With this aim, the portal was designed with four modules viz. registration module, Logistic Management Information System (LMIS) module, certification module and Adverse Events Following Immunisation (AEFI) module. Among these modules, only the first and the third are activated at present. Activating the other two modules could be useful for a more accurate distribution of vaccines.
The data-driven vaccination programme can indeed be considered a success story for Bangladesh, given its population and limited technological prowess. The promptness of distribution, provided by the worldwide shortage of vaccines, is especially commendable. However, the requirement of an internet facility to register for vaccines leaves out a large number of eligible people. The Government of Bangladesh is trying to mitigate this through spot registration while carrying out the mass vaccination programme. But this is a deviation from the data-driven approach, which leverages the traditional system to ensure mass coverage. In these circumstances, estimation of coverage considering the percentage of ultra-poor people, percentage of people living in remote areas and reaching out to these people through local government functionaries could be useful.
3.3 Implications for mainstream economic data flows
As mentioned in Section 2.1, the COVID-19 pandemic has severely affected the regular functioning of NSOs across the world. Bangladesh has been no exception in this regard. The ongoing pandemic has adversely impacted the regular data-related activities in Bangladesh in various degrees, starting from data collection to dissemination. The current subsection will attempt to highlight the challenges faced by BBS in terms of mainstream data provided during the pandemic times.
As was found from the KIIs, the pandemic has forced a number of large-scale surveys in Bangladesh to be rescheduled because they require face-to-face interaction. For instance, the Population and Housing Census, one of the largest undertakings of BBS, has been rescheduled to October 2021, which was supposed to be started at the beginning of 2021. The unpredictable nature of the pandemic is still causing uncertainties as regards conducting the survey on the targeted timeline. The Household Income and Expenditure Survey (HIES), the primary source of poverty related information in Bangladesh, was scheduled to be conducted in 2020. However, it had to be postponed given the COVID-19 situation. The pilot survey for this round of HIES has been conducted. The Labour Force Survey (LFS) has also been delayed due to the COVID pandemic. However, BBS has started doing the background works, which are expected to be finished by 2021. For instance, updating of the household frame, which takes about three months, is expected to be started from September 2021. Accordingly, the main LFS is expected to start from January 2022.
According to the KIIs, the activities pertaining to regularly provided data (e.g., inflation, industrial production, wage rate, demographic data etc.) were continued despite the pandemic.
(Box 3.2.2 contd.)

Data for Policymaking in the Pandemic Period 35
Collection activities for such data, even at the field level, has never been stopped. Collecting price related information was less challenging given these can be obtained from facilities (e.g., shops or markets). However, obtaining demographic information, particularly from upscale parts of urban areas, proved to be challenging in view of the pandemic. In such cases, alternative approaches were required to collect the information. For example, information often had to be collected from the gatekeeper or through mobile phone conversation.
Apart from these, the data collection processes of some of the other initiatives have been hampered due to the pandemic along with their associated activities. For instance, the Literacy Assessment Survey was scheduled to be started in 2020 but has been shifted to 2021. The same case is also applicable for another survey on climate. A new survey on tourism was to be initiated by BBS in 2020. But the data collection process was hampered due to the pandemic. The survey was designed to focus on both outbound and inbound tourism. The data collection process for the latter involved interviewing the incoming tourists at airports and thus, was not feasible due to the pandemic. The survey report ultimately had to be finalised based on outbound tourism and secondary data sources.
3.4 Summary of observations
There has been a significant number of new and innovative data initiatives taken in view of the pandemic in Bangladesh. These initiatives have primarily focused on the health sector. Within the health sector, data related to preventive and curative aspects received heightened importance. Real-time data generation through digital pathways also rose to prominence. It was to be appreciated that the use of new data sources, such as the application of user-generated data and telecom data, have been observed in designing and implementing policy responses. The traditional methods of collecting mainstream economic data were disrupted. This is particularly true for large scale national level surveys. Barring one or two small-scale attempts, efforts towards analysing the impact of the pandemic on key macroeconomic correlates were largely absent. It might be safe to argue that the mainstream data generation system was not able to cater for the needs of data-driven pandemic response.

Data for Policymaking in the Pandemic Period36
4.1 Importance of stakeholder perspective
The review of the global and national data initiatives in the earlier sections provides a comprehensive overview of these initiatives. However, behind the scene dynamics are often not captured through such exercise. To this end, a diverse group of actors in the data ecosystem of Bangladesh, who were directly or indirectly involved in the COVID-19 targeted data initiatives, were interviewed (Annex Table 4.1). The data ecosystem generally includes multiple actors9 (Curry, 2016). However, to serve the specific objectives of the current study, only certain groups of conventional actors were selected for the interviews, which include data suppliers, technology providers, researchers and academicians, and data end-users. Based on the roles played by the mentioned actors, the key informants (KIs) were categorised into four groups (Table 4.1).
Table 4.1: Categorisation of KIs with their respective organisations
Category of KIs
Conventional key actors of
data ecosystem
Role of the conventional key actors Organisations of the KIs
Data generator
Data suppliers Individuals or organisations who generate, collect, integrate and transform data from multiple sources (public or private)
Bangladesh Bureau of Statistics (BBS); Aspire to Innovate (a2i); International Centre for Diarrhoeal Disease Research, Bangladesh (ICDDR,B); Institute of Health Economics, University of Dhaka
9Multiple actors of data ecosystem may include data suppliers, technology providers, data end users, data marketplace, start-ups and entrepreneurs, researchers and academics, regulators, standardisation bodies, and investors, venture capitalists and incubators (Curry, 2016).
Section 4
Interpreting Pandemic and Data NexusInsiders’ Perspectives
(Table 4.1 contd.)

Data for Policymaking in the Pandemic Period 37
Category of KIs
Conventional key actors of
data ecosystem
Role of the conventional key actors Organisations of the KIs
Data mobiliser
Technology providers
Organisations or agencies that provide tools, services, know-how and platform for data management
A2i; Directorate General of Health Services (DGHS)
Researchers and academicians
Individuals or organisations who explore and assess new technologies, methodologies, models and societal aspects essential to advance data initiatives
a2i; ICDDR,B; Institute of Health Economics, University of Dhaka
Data user Data end users Individuals, organisations or policymakers who leverage data initiatives to serve their respective objectives
Health, Nutrition and Population Programme, BRAC; Nagad; DGHS; ICDDR,B
Data appraiser
N/A Individuals or organisations who assess and provide an impartial and unbiased opinion about the execution of any data initiative
Health Watch; National Committee on Health Rights Movement
Source: Authors’ elaboration based on Curry (2016).
4.2 Process, partnership, policy response and best practices
While a data ecosystem refers to an environment supported by a community formed with a diverse group of interacting organisations and individuals, a data value chain refers to the key activities carried out within a data ecosystem10 (Curry, 2016). Data value chain involves the processes that data go through, starting from the identification of the need for data to its final use for impact. The data value chain comprises of four stages, viz. collection, publication, uptake and impact, which can be further disaggregated into twelve phases (Open Data Watch, n.d). The activities under each stage are presented in Figure 4.1.
Not all of the aforementioned activities are aligned with the objectives of this study. Hence, the subsequent analysis based on the KIIs will only consider the activities that distinctly address the three specific objectives of this study. The first objective (i.e., reviewing and documenting the process, tools and partnership of generating COVID-19 related statistics) relates to four activities within the data value chain, viz. identify, collect, process and
10In the present section, ‘data’ refers to both ‘traditional data’ and ‘big data’. ‘Big data’ is different from ‘traditional data’ based on three dimensions, viz. volume, variety and velocity, and hence, requires new methods of processing (Laney, 2001). In other words, ‘big data’ is not simply large volume of data but it is very much unstructured and assorted, and gathered so rapidly that the generally used methodologies and techniques for traditional data processing cannot be applied (Kaminskiy, 2017).
(Table 4.1 contd.)
Data for Policym
aking in the Pandemic Period
38 Figure 4.1: Activities within the data value chain�
Source: Authors’ elaboration based on Open Data Watch (n.d).
Identify Collect Process
Collection
Analyse Release
Publication
Connect Incentivise In�uence
Uptake
Use Change Re-use
Impact
Disseminate
• Involves consultation with future users.
• Determines the type and granularity of data.
• Determines the use of data.
• Mobilise new data sources.
• Involves survey/retrieval of administra-tive data.
• Enhance partnership with other producers.
• Involves correct recording, and storing in correct formats.
• Ensures interoperability of data.
• Involves extracting useful informa-tion from data.
• Helps to visualise data in clear manner.
• Involves making data accessible online and o�ine.
• Involves providing machine readable data.
• Involves circulating data, particu-larly to prospective users.
• Involves partnering with infomediaries
• Involves connecting data to users.
• Involves encouraging users to use data in decision making.
• Involves reduction of time-cost of data use.
• Involves encouraging users to value data.
• Involves promoting culture for data use.
• Involves applying data for understand-ing problem or decision.
• Involves receiving initial user feedback.
• Implies changing the outcome of an estimation based on data.
• Can improve situation based on data.
• Involves combining data with other datasets.
• Involves sharing data freely.

Data for Policymaking in the Pandemic Period 39
release. The KII findings pertaining to these activities were clustered under the following dimensions: motivation, innovation and generation, storage and accessibility. The second objective (i.e., assessing whether data initiatives are being translated into policy actions and the effect of existing data gaps in policy implementation) relates to five activities of the data value chain, viz. process, release, connect, use, and change. The information pertaining to these activities have been clustered under the dimensions titled usability and comparability, and policy use. The third objective (i.e., replicating and re-using the best practices in future) relates to the following activities: connect, incentivise, influence, change, and re-use. These have been further clustered into one dimension, i.e., sustainability. Additionally, this section aims to highlight the operational modality of the actors of the data ecosystem. Finally, the findings from the KIIs will also focus on the pre-existing strengths and weaknesses of the data ecosystem in Bangladesh, which have garnered renewed attention in view of the COVID specific data initiatives. Table 4.2 demonstrates the connection between the study objectives, the activities within the data value chain and the dimensions of the KII findings.
Table 4.2: Association between study objectives and activities of the data value chain
Objectives of the study Activities within the data value chain
Dimensions of KII findings
1. Reviewing and documenting the process(es), tools, and partnerships deployed for generating statistics in view of the pandemic in Bangladesh.
• Identify • Motivation• Collect• Process
• Innovation and generation
• Release • Storage and access• Operational modality11
2. Assessing the utilisation of data initiatives for designing policy response during the pandemic and identifying the implications of the revealed data gaps for required policy processes.
• Process• Release
• Usability and comparability
• Connect• Use• Change
• Policy use
3. Identifying the best practices from global and national experience for replication and adaptation in future policymaking.
• Connect• Incentivise• Influence• Change• Re-use
• Sustainability
Source: Authors’ elaboration.
4.2.1 Motivation behind the data initiatives
According to the KIIs, the government deeply felt the need for timely health data, particularly in the early days of the COVID-19 pandemic when the number of testing centres was very limited, and there was an exigency to predict the direction of transmission. It was mentioned
11It is not a distinct stage of data value chain rather a cross-cutting feature.

Data for Policymaking in the Pandemic Period40
that a number of government agencies took a ‘demand driven’ approach in terms of COVID-19 targeted data initiatives. For example, a ‘National Corona Care’ repository was developed by a2i under the leadership of DGHS in order to obtain real-time information pertaining to the pandemic. According to one KI, the government approached academicians and other relevant entities to predict the pandemic’s trajectory through various statistical projection techniques, particularly before the second wave of the pandemic. Some of the data initiatives were supply-driven in nature and led by non-resident Bangladeshi (NRB) academics from multidisciplinary backgrounds and other stakeholders such as policymakers, telephone companies (telcos), data scientists, and epidemiologists. One such example is the ‘syndromic surveillance’12 system which was set up to monitor the trend, cluster and outbreak of the coronavirus using telecom data13 before they were actually reported to public health agencies. However, there was some inertia on the part of policymakers towards accepting the various models and projections produced by independent actors. This was especially prevalent during the early phases of the pandemic, but the situation improved afterwards.
As per a KI from a non-government entity, the data initiatives used to be mostly supply-driven. However, the scenario changed in recent years. For example, in 2020, DGHS invited a number of non-government stakeholders such as BRAC while developing the strategic plan for digitalisation. Both positive and negative feedbacks were received with due admiration. According to a respondent from another non-government organisation, the COVID-19 targeted data initiatives received due assistance from the government, irrespective of them being demand-driven or supply-driven. In fact, there were certain supply-driven data initiatives that could not be possible without the partnership of government agencies. For instance, IEDCR is mandated to surveil COVID-19 trajectories, and such data initiatives require a partnership with IEDCR.
Collaborating with government agencies might often be difficult for non-government entities. However, it is not always due to the reticence on the part of the government. The in-built bureaucratic procedures can oftentimes be too cumbersome as these require permission from higher authorities regarding collaboration or sharing certain information.
4.2.2 Innovation and generation of data
A large volume of user-generated data has been accumulated during COVID times through a number of new data collection methods, which include syndromic surveillance through telehealth or telemedicine services or hotline numbers, IVR system,14 USSD etc. Data was collected under all these methods, either by inquiring people regarding their symptoms or
12Syndromic surveillance is a process to monitor diseases in real time or near real time to detect an outbreak. This system takes advantage of automated data processing and alerts the authorities before diseases are actually reported to public health agencies.13Obtained when people report their symptoms by calling in a number, sending text, using USSD (Unstructured Supplementary Service Data), or using an app.14Interactive Voice Response.

Data for Policymaking in the Pandemic Period 41
by allowing them to self-report.15 There have been collaborations between mobile operators and other government agencies such as a2i for such data initiatives. Apart from the hotlines and mobile-based data collection systems, the hospital-based data collection process has also evolved. For instance, hospitals are now connected to the DHIS2 system of DGHS. A designated person has been assigned to regularly upload the logistics-related data in this system which provides an almost real-time scenario.
A dashboard has been created based on data collected through various telehealth services. Another dashboard named NISE316 has been created to collect employment data from multiple offices and industry associations. However, this is based on administrative data rather than real-time data. Also, it lacks data and statistics for the informal sector. Even the data for the formal sector is not detailed and organised. The ‘Contact Tracing App’ was another innovative attempt in Bangladesh, even though it could not be successful due to its usage model and poor public health behaviour in the country. A system has been developed to track the nationwide distribution of masks through a collaboration of government and private entities. A ’socio-economic dashboard’, created to provide key socio-economic indicators, has been attached to the pre-existing SDG tracker. This dashboard was developed taking cognisance of the recommendations provided by various stakeholders at the national level, such as the SDG coordinator at the PMO, various government functionaries like DCs, DGs and agencies like BBS, among others.
The Health, Nutrition and Population Programme (HNPP) of BRAC has developed a community based digitalised syndromic surveillance system to identify the suspected COVID-19 cases through a combination of actors and entities, including community informants, community health workers, telemedicine services and further management support.17 HNPP has developed an online data management system for RT-PCR and Antigen test registration.
4.2.3 Operational modality of individuals /organisations
In the case of most of the initiatives, a ‘government agency centric’ approach was followed while a selected few took the ‘whole of society’ path. Government agencies such as IEDCR and DGHS played their part in various capacities viz. data generator, data mobiliser or data user for a number of data initiatives. For example, the ‘National COVID Dashboard’ was created under the authority of the Epidemiology and Public Health Committee, which is comprised of senior officials from IEDCR and DGHS. A team of experts analyses the
15For instance, people could call to a certain USSD number and answer 5 questions by pressing 0 and 1. This is how data could be generated about the symptoms of an individual.16National Intelligence and Skill Education, Employment and Entrepreneurship.17A community informant would inform about a suspected COVID-19 patient, then a community health worker would visit that person’s house to screen and verify based on an operational definition. If the suspected person would be confirmed based on the operational definition, then further support (follow up service or telemedicine) would be provided.

Data for Policymaking in the Pandemic Period42
dashboard on a weekly basis, and the analysis is presented to the committee for decision making. These agencies not only facilitate the data generation process of government entities but also for other non-government institutes. For instance, as was mentioned during the KIIs, IEDCR and DGHS have facilitated the data collection process of ICDDR,B for a number of COVID-19 related activities. These activities involved generating data for indicators such as seroprevalence of vaccine effectiveness, COVID mortality rate, vaccine test-negative design,18 vaccine response rate etc.
a2i has played the role of both generator and mobiliser for several COVID-19 related data initiatives. It has facilitated the data generation process by coordinating among multiple global and national organisations, the government, and private sector entities. a2i brought together their technologies and know-how for generating data besides developing new tools and methods for data generation on behalf of the government agencies. Furthermore, it has facilitated the educational process pertaining to data-driven real-time policy analysis and policy action within the government actors. As a data mobiliser, a2i has developed the pipeline to move data through interoperable systems by several entities and contributed to their synchronisation mechanism in order to exchange data in real-time. Examples of such activities include contributing in setting up labs for sample collection, coordinating with data operators for inputting data in the lab/hospital data system, re-creating sample collection PHP19 tool to overcome the challenge of continuous data inputs, and finally uploading the data in the DHIS2 system in real-time before sending the test results to people via SMS and uploading in the ‘National COVID Dashboard’.
Telecom companies have played the role of both data generator and manager for some COVID-19 targeted data initiatives. The role of data generator was played by contributing to data collection for real asymptomatic cases through the syndromic surveillance system. The data manager part was played by contributing to verifying, cleaning, and analysing the collected data using Artificial Intelligence and sending the final dataset to the DHIS2 system.
According to the KIIs, HNPP has performed as both data user and data generator during COVID times. For example, it has used the syndromic surveillance data mentioned above to design a project for reaching out to people who needed health services or food. Furthermore, HNPP was actively involved in disease surveillance and contact tracing committees that were formed during the pandemic and worked in all sectors of implementation such as sample collection, disease surveillance data management system improvement etc.
Some local administrations were involved in policy interventions and contributed to the utilisation of data. For example, the zone-wise lockdowns were imposed in Dhaka through
18The number of vaccinated people among the COVID-19 infected people.19Hypertext Pre-processor is an open source of scripting language that is suited for web development and can be embedded into HTML.

Data for Policymaking in the Pandemic Period 43
the collaboration with Mayors and the district-wise lockdown was imposed with assistance from the DCs. Regrettably, these could be implemented only at a limited level.
4.2.4 Storage and accessibility of data
According to the KIIs, storage systems have been developed for some of the COVID-19 related data initiatives undertaken by government agencies. For example, the aforementioned ‘National Corona Care’ repository is connected to the DHIS2 system of DGHS and the DHIS2 system itself is further connected to contact tracing app, hospital databases, vaccination database, and other systems that contain statistics related to transmission trends, hospital logistics, hospital wise death trend, area-specific demand for a certain measure etc. All this information is stored in the repository and can be viewed through a dashboard.
The online availability of the data resources was very encouraging in the backdrop of the pandemic. However, this also creates some concern of a ‘digital divide’ where people without internet access could not reap the benefits of the various data initiatives. While interviewing some data generators and managers, it was found that not all of the COVID-19 related data initiatives are available in public domains in their entirety. For example, the ‘National COVID Dashboard’ only provides some indicators to the general public through the online portal. However, all of the indicators and statistics of this dashboard can only be accessed by selected senior officials of DG Health, Health Ministry, Cabinet division, ICT division with limited access to DCs and civil surgeons. Member organisations of ‘Data Analysis Task Force’ have been given access to the ‘National COVID Dashboard’ database subject to signing an NDA.20 A2i has created a database to track peoples’ movement, which is accessible only by DGHS, IEDCR, PMO, and Cabinet division. Among the government agencies, IEDCR is less conservative compared to DGHS when it comes to sharing data. According to the KIIs, a protocol has been created for data alliance between government and private research organisations. However, it was evident from the interviews that both government and private organisations are reluctant to share data in a common platform.
As per the KIIs of data users, no formal mechanism has been set up to obtain COVID-19 related data. There is a scope for applying and obtaining data from DGHS or IEDCR through email. However, the subsequent lengthy and complex bureaucratic process often diminishes the usefulness of this mechanism, especially when immediate response is required. Other than the bureaucratic process, accessing data often require tumbling around through various segments (IEDCR to MIS to NCDC21 to ADG planning) of the pipeline due to the absence of a designated system and person.22 Additionally, there is no formal mechanism to
20Non-Disclosure Agreement.21Non-communicable disease control.22In some instances, even if approval of higher authorities could be attained, employees in the downstream were found to be less helpful. Lack of technical capacity to provide data as per requirement and being overburdened with work are the most common cited problems to this end.

Data for Policymaking in the Pandemic Period44
obtain data from the local level. Informal ways such as personal connection work in such cases. According to another KI, accessing data from government agencies might often be conditional upon pre-existing liaisons. For some of the big organisations like BRAC, it might be possible to obtain the data. But for small organisations or independent researchers, there may be no such scope.
More proactiveness is required on the part of the government for integrating data generated by non-government entities. The technical limitation might be an issue in this regard. However, the reticence of the government agencies towards utilising data generated by the non-government actors might be the main barrier. Also, it was mentioned during the KIIs that there a was lack of drive on the part of the government in terms of disseminating relevant statistics so that it can be used for further research, modelling, and policy response. The reason behind this gap includes inadequate capacity and a specific vision to invest in research.
4.2.5 Usability and comparability of data
The available data related to COVID-19 provides an overview regarding the spread of the disease in Bangladesh. However, as was opined by some of the key informants, the representativeness of this data often falls into question. One of the reasons behind the possible under-reporting of COVID-19 cases in Bangladesh could be that the data source is hospital-based, not community-based.23 Also, the COVID-19 reporting is done based on confirmed cases, not based on the presence of symptoms. Additionally, the shortage of testing facilities, a large number of outbound migrants within the testing samples, and false-negative cases of PCR tests might have contributed to the under-reporting of COVID-19 cases. There were also instances of mismatch between the data reported from the ground and the data shown in dashboards. Lack of synchronisation among different entities adds to the problem. For example, the Civil Surgeons send COVID-19 infection data to the MIS of DGHS on a daily basis, but the publicly reported data often do not reflect the updates.
As was mentioned during the KIIs, the usability of the data received from government agencies can be challenging as there are questions regarding the accuracy and format of the data. Data is often not present in a well-structured manner which implicates that these might have been collected in an unorganised way from the beginning. This reduces the usability of data and induces the reluctance of government agencies to provide the data to other entities when they are asked for it. Furthermore, there is a lack of granular data for detailed analysis. Despite the problems and the inherent limitations of the Bangladesh data ecosystem, the continuous provision of COVID-19 data can be perceived as a success.
Among the COVID-19 targeted data initiatives, interoperable data systems have been developed by both government and non-government entities. For instance, a system was
23The statistics are only collected from the people who take services from hospitals but are not available for the people who do not approach any formal health care service (stay home).

Data for Policymaking in the Pandemic Period 45
developed by a2i to track the mobility of positive COVID-19 cases. In this system, the data is passed through a number of channels such as DHIS2 platform to NTMC,24 NTMC to telcos and vice versa. The data curation process of the corona care repository also provides evidence for an interoperable data system. In the case of the non-government organisations, similar instances were mentioned. For example, the lab results of the COVID RT-PCR test conducted in ICDDR,B and three of its sample collection facilities (Gopalganj, Shariatpur and BRAC booths) can be directly uploaded in the DHIS2 system. When HNPP developed its digitalised data platform in 2019, it was done in a way so that the generated database was compatible with the DHIS2 system. Similarly, the COVID-19 surveillance database created by BRAC was also made compatible with the DHIS2 system with the aim to share the data with the government.
4.2.6 Policy use of data
Bangladesh has made notable progress in terms of developing systems for accumulating COVID-19 related data. However, when it comes to translating these data initiatives into policy action, the performance was less satisfactory. As was found from the KIIs, the understanding as regards the overall data initiatives is still very limited within the government. This poses a challenge towards utilising these initiatives in a timely manner, which is a must in COVID type pandemic scenario.
Nonetheless, a number of attempts have been made on the part of the government to translate the data initiatives into policy action. For example, the location-specific lockdown was imposed in some parts of Dhaka city based on risk zoning which was derived from data. However, this attempt was not successful due to the challenges coming from administration and law enforcement standpoints.25 According to the KIIs, the ‘National COVID Dashboard’ is actively used for policy action by the Health Ministry, PMO, and the experts of the public health committee created to monitor COVID-19 related issues. However, the uptake of this dashboard for policy use was rather slow. As was mentioned during the KIIs, this dashboard started getting due attention during the last quarter of 2020, which increased after the second wave of the pandemic. The DG Health has taken actions based on syndromic surveillance by calling suspected cases and bringing them for testing. The government was proactive in accepting data-driven analyses by academicians. However, some reservation was observed in the cases of using COVID-19 related forecasting for policy actions. One of the key reasons was the wide range of results generated by different forecasting models. Another caveat was the inherent limitation of the assumption-based forecasting models, which often fail to capture rapidly changing real-world dynamics.
24National Telecommunication Monitoring Centre.25Lockdown was imposed in one area, but the people living there might work in another area that does not have lockdown. In that case, it was hard to refrain people from moving out of the quarantine zone.

Data for Policymaking in the Pandemic Period46
Lack of coordination among different government entities hindered the effective use of data for policy actions during COVID times. The process and basis of decision making are often unclear, even amongst government officials, since a number of ministries, agencies and political actors are involved in the process. Sometimes the implementation of data initiatives was not congruent with their design. The top decision-making bodies oftentimes do not have adequate representation of public health experts. Furthermore, there was no in-built mechanism to involve local government officials in the data initiatives.
4.2.7 Sustainability of data initiatives
It was mentioned during the KIIs that the technical committee assigned for COVID-19 related data initiatives was rather homogenous. It should have accommodated young talents from multidisciplinary backgrounds such as economists, sociologists, anthropologists etc. The socio-economic dynamics of the country must be taken into cognisance while designing the data initiatives in order to ensure their sustainability. Furthermore, involvement and utilisation of the local government system would be useful in the case of the effectiveness of future data initiatives.
Some pre-existing data initiatives in Bangladesh are successfully functioning despite the pandemic and are able to provide useful information. For example, the DHIS2 system of DGHS is updated almost in real-time when any health-related activities take place in hospitals. According to a key informant, a real-time database of such a large volume is rare in the world. Apart from DHIS2, there are many systems attached to the MIS of DGHS that can be useful to take various decisions, such as resource allocation. The actual use and effectiveness of these systems in terms of decision making is questionable. However, a system is already in place if data-driven policymaking gains more momentum. The syndromic surveillance system, the COVID-19 testing and subsequent reporting system, and the ‘COVID-19 dashboard’ are some of the new data initiatives that have the scope for replication and possible future use.
As mentioned during the KIIs, research institutes, universities, and data scientists are conducting COVID-19 related research and generating data on a regular basis. Strengthening these entities through adequate funding can help expand the data ecosystem of Bangladesh, both vertically and horizontally. A number of COVID-19 targeted data initiatives have been undertaken by NGOs or CSOs in Bangladesh. Regrettably, their acceptance at the policy level remained very limited. By accommodating such initiatives into the policy decision process, Bangladesh could create an example in front of the world.
4.3 Summary of observations
A number of notable observations emerge from the in-depth discussions during the KIIs. These observations have been clustered under the six hypotheses mentioned in the conceptual framework.

Data for Policymaking in the Pandemic Period 47
Hypothesis 1.1: There are institutional mechanisms and systemic efforts currently in place in Bangladesh to generate basic statistics given COVID-19.
There have been institutional data initiatives in the face of the pandemic, but they are yet to evolve into a structured and regular system. First, the COVID-19 targeted data initiatives were both demand and supply-driven. The pandemic created an opportunity to build a partnership between government and non-government entities. In some instances, the higher-ups in the government had to be pursued proactively to sensitise them for undertaking the initiatives. Second, a number of innovative data initiatives were taken in view of the COVID-19 pandemic. Some of these were built upon pre-existing data generation and management systems, while others had to be developed from the ground up. It can be mentioned that while the former took a ‘doing by learning’ approach, the latter, in most cases, followed a ‘learning by doing’ method. The utilisation of user-generated data and telecom data gained heightened importance.
Hypothesis 1.2: There is an institutional arrangement of integration, coordination and reconciliation within the data ecosystem.
The institutional arrangements are concentrated on health and have not spilt over to other areas of the data ecosystem. First, both government and non-government entities had to take up multiple roles (e.g., data generator, data manager, data user, data appraiser etc.) in order to carry out the data initiatives. The government entities and officials were able to perform in a coordinated manner while performing these roles. The collaboration between the government and non-government organisations has become more robust after the COVID-19 outbreak. The acceptance of non-government data initiatives to the government has gradually increased. Second, among the COVID-19 targeted data initiatives, interoperable data systems were observed in the cases of both intra- and inter-governmental data initiatives. There were some instances where non-government entities were connected to such systems. Most of such data system is affiliated with the DHIS2 platform of DGHS.
Hypothesis 1.3: There is a systematic process of documenting and archiving the generated statistics, and relevant stakeholders can access these statistics when required.
The documenting and archiving process is mostly scattered, and accessing micro-level data may become an arduous task. First, the majority of the data initiatives, both government and non-government, have well defined and formal storage systems. Second, the absence of a formal mechanism for accessing COVID-19 related data from the government was highlighted during the KIIs. Accessing data becomes easier with pre-existing liaisons or through informal ways. Data access becomes difficult due to complex and lengthy bureaucratic processes, privacy concerns on the part of the government, or the absence of any designated person or system to provide data.
Data for Policymaking in the Pandemic Period48
Hypothesis 2.1: The generated statistics enabled efficient delivery of the various policy measures taken to tackle COVID-19.
All data and analyses did not result in decision making. Buy-in by the policy actors was slower for many cases and often did not take place. The policy use of data was found to be rather limited. There was a clear lack of understanding on the part of the government as regards the data initiatives. The multitude of actors involved in the decision-making process made the situation worse. Furthermore, the policymakers were not ready to accommodate the data initiatives undertaken by subordinate agencies at the beginning of the pandemic. The acceptability increased prior to the second wave. It was encouraging to find that the government is interested in accommodating data-driven findings from academicians and researchers in order to plan future interventions.
Hypothesis 2.2. The generated statistics are adequate for policy design, policy implementation, and monitoring process of the policies.
New data obviously contributed to policy actions; however, not all demands for data were met. Although the continuous provision of COVID-19 related data is commendable, there are some underlying concerns regarding the accuracy, representativeness and quality of data. This puts the usability of such data at serious risk.
Hypothesis 3.1. The experience of international organisations and other countries will help Bangladesh to adopt the best practices and vice-versa.
There are obvious scopes for cross-learning while being cognisant of the country context. The scope to utilise some pre-existing data initiatives and replicate some of the new ones is evident within the data ecosystem of Bangladesh. Strengthening the non-government entities would allow expanding the data ecosystem both vertically and horizontally. Data initiatives should take cognisance of the country-specific context.
Overall, there have been commendable efforts towards generating data and statistics in the face of the pandemic. These initiatives, however, were more agency-centric in nature and have yet to transform into a systemic effort. The pandemic provided an opportunity to enhance the collaboration between government and non-government entities. Overall acceptance of these initiatives gradually improved despite some initial reticence on the part of policymakers. Policy use of data and availability of data to design and implement policies were two areas where more improvement was necessary. The scope to replicate and scale up the successful data initiatives is evident within the Bangladesh data ecosystem. Accommodating the non-state actors could prove to be useful in this regard.

Data for Policymaking in the Pandemic Period 49
The COVID-19 pandemic has kept policymakers around the world on their toes. Indeed, the countries were not prepared for the nature of the challenges posed to them by the scourge, and often, they have tried out policy actions with limited information. In developing countries, where the data ecosystem is less mature, policymaking was doubly challenging. Bangladesh, being one of the emerging economies, faced considerable challenges in this context. At the same time, it provides renewed opportunities to improve the data ecosystem at the country level. The present paper documents the new initiatives regarding data in Bangladesh to address the challenges of policymaking in the COVID-19 pandemic period with a significant focus on health-related areas and public support as well as other development areas.
The paper highlights the fact that there have been several new and constructive data initiatives, particularly in pandemic-related health issues. The government primarily took these initiatives with the view to take immediate pandemic response. Despite some early reticence, the government accommodated supply-driven initiatives as and when necessary. With time, these initiatives also improved in terms of scope, efficiency, institutional capacities and utilisation in the policymaking. During this pandemic period, Bangladesh has made use of new and innovative data technology such as telecom data and apps. More proactive uses of existing databases such as NID for policy actions were also observed. Bangladesh has also embraced new institutional frameworks which enabled them to collect data in real-time. New partnerships were formed involving multiple stakeholders both within the government agencies and with the non-government organisations. Such initiatives were not necessarily absent in the past, but definitely broadening the scope and expediting the process compared to past experiences were notable. There has been a considerable improvement of data dissemination as evinced from developing dashboards, regular press releases and use of websites and social media platforms.
Along with the notable positive developments mentioned above, these initiatives had to face several challenges. It has been clear that the improvements in the data ecosystem during the pandemic were largely concentrated in the area of health. The use of such initiatives was limited in providing public support. Even within the health issues, for the rehabilitation domain, no such initiative was found. Pre-conditions were important for the success of the
Section 5
Conclusions

Data for Policymaking in the Pandemic Period50
initiatives. While using the NID database was possible as it covered a larger section of the population, the use of the tracing app failed due to very little penetration of smartphones and other technical issues. Overall mindset and flexibility of the stakeholders were also found to be critical. It is to be noted that all data and analyses did not result in decision making. Buy-in by the policy actors was slower than it should be for many cases and often did not take place. There is also ample scope for improving transparency in these initiatives. This has perhaps also constrained improving political buy-in. The scope for scaling up and involving more stakeholders could be done with improved transparency.
The future course of actions in view of the present achievements and the challenges will critically hinge on the following three issues: (i) the system-wide adaptation of the successful initiatives; (ii) enhanced scalability across domains - both horizontal and vertical; (iii) ensuring sustainability in terms of human resource, financing and institutionalisation.
i. In terms of system-wide adaptation, there is a need to establish a clear institutional architecture of the initiatives ensuring the issues related to governance and rules of business. The pertaining discussion should not be limited to a legalistic nature. Rather, the involvement of all relevant stakeholders, from both the demand and supply sides, should be ensured. The creation of a ‘knowledge hub’, containing all relevant data, statistics, research and analysis contributed by both government and non-government entities, might be beneficial in case of system-wide adaptation. The proposed knowledge hub could be an integrated form of the numerous existing data platforms. Issues pertaining to data standardisation, reconciliation, disaggregation, interoperability, access, and quality assurance should receive due attention during the formation of the knowledge hub. Data privacy and confidentiality must be ensured in such efforts. Formulation of data privacy policies and the development of data sharing frameworks should receive top priority.
ii. Taking cues from experience, the scaling up of the data initiatives should focus on involving more sectors/issues as well as stakeholders both within and outside the government. Formation of a ‘data community’, following a whole of society approach, might be useful in terms of scaling up the data initiatives. This will facilitate overcoming the traditional silos existing within the data ecosystem. This will also provide the non-state entities with a gateway to be integrated into the mainstream data-related activities, which will, in turn, ensure the utilisation of local capacities to their fullest.
iii. The sustainability of the data-related initiatives will require more resources – financial, human resources and technical – from both domestic and foreign sources. This is particularly pertinent for non-state actors who might lack the resources necessary to develop a robust data architecture. The learnings during the pandemic time should be utilised to bolster and modify the existing data initiatives. For instance, health-related modules could be integrated into the mainstream economic surveys. The real-time health data generation mechanisms developed during the pandemic should be maintained and expanded to other sectors. The use of administrative data, user-generated data and geospatial data must be expedited by the BBS in order to provide more up-to-date socio-economic scenarios.

Data for Policymaking in the Pandemic Period 51
Overall, political buy-in is critical for all three areas mentioned above. As has been mentioned, the data-driven approach towards policymaking has shown some improvement during the pandemic. However, the data generators and the knowledge community must continue their endeavour to sensitise the policymakers regarding the usefulness of data and its use. To ensure this, documenting the experience, generating evidence of the positive impacts of such initiatives and opinion building by engaging multiple stakeholders will be needed.

Data for Policymaking in the Pandemic Period52
References
Alamo, T., Reina, D. G., Mammarella, M., & Abella, A. (2020). Covid-19: Open-data resources for monitoring, modeling, and forecasting the epidemic. Electronics, 9(5), 827. Retrieved From: https://www.mdpi.com/2079-9292/9/5/827/htm
Basile, I. (2020, August 12). Estonia’s Digital Solutions to Covid-19 [Foreign Policy Research Institute Blog]. Retrieved from: https://www.fpri.org/article/2020/08/estonias-digital-solutions-to-covid-19/
Bluezone. (2020). About. Retrieved from: https://bluezone.ai
Byron, R. (2020 July 09). Two-thirds of poor families yet to receive Tk 2,500 cash support. The Daily Star. Retrieved from: https://www.thedailystar.net/business/news/two-thirds-poor-families-yet-receive-tk-2500-cash-support-1927257
CPD & Oxfam. (2021, May 27). Relief distribution during COVID – Need to develop integrated and updated database [Video]. CPD dialogue and events. Retrieved from: http://localizingsdg.cpd.org.bd/relief-distribution-during-covid-need-to-develop-integrated-and-updated-database/
Curry E. (2016). The Big Data Value Chain: Definitions, Concepts, and Theoretical Approaches. In J. Cavanillas, E. Curry, & W. Wahlster (Eds.), New Horizons for a Data-Driven Economy (pp. 29-37). Boston, MA: Springer.
EuroStat. (2020). Eurostat and ESS initiatives following the COVID-19 outbreak and their expected pivot post pandemic: Fourth Meeting of the Friends of the Chair Group on Economic Statistics. Retrieved from: https://unstats.un.org/unsd/statcom/groups/focg_econ/meetings/4th/FOCG_4th_Meeting_Session_2_Eurostat_ESS_Note.pdf
Fakhruddin, B. (2020, April 10). A Data Ecosystem to Defeat COVID-19 [web log]. https://council.science/current/blog/setting-up-a-data-ecosystem-to-defeat-covid-19/.
FSO. (2020). SwissCovid App Monitoring. Retrieved from: https://www.experimental.bfs.admin.ch/expstat/en/home/innovative-methods/swisscovid-app-monitoring.html
Fu, Haishan., & Schweinfest, Stefan. (2020, June 5). COVID-19 widens gulf of global data inequality, while national statistical offices step up to meet new data demands. World Bank Blogs. https://blogs.worldbank.org/opendata/covid-19-widens-gulf-global-data-inequality-while-national-statistical-offices-step-up.

Data for Policymaking in the Pandemic Period 53
GoB. (2020) . National Preparedness and Response Plan for COVID-19, Bangladesh. Dhaka: Health Services Division, Ministry of Health and Family Welfare, Government of Bangladesh. Retrieved From: https://reliefweb.int/sites/reliefweb.int/files/resources/nprp_covid-19_v6_18032020.pdf
GPSDD. (2021a). Data for Now: Building Africa’s Resilience to COVID-19. Retrieved from: https://www.data4sdgs.org/initiatives/data-now-building-africas-resilience-covid-19
GPSDD. (2021b). Administrative Data Collaborative. Retrieved from: https://www.data4sdgs.org/initiatives/administrative-data-collaborative
GPSDD. (2021c). Civil Society Collaborative: Inclusive COVID-19 Data. Retrieved from: https://www.data4sdgs.org/initiatives/civil-society-covid-collaborative
GSS & UNDP. (2020). Brief on COVID-19 Local Economies Tracker Wave 1. Retrieved from: https://statsghana.gov.gh/covidtracker/Local_econ_Brief_29_09_2020.pdf
GSS, UNDP, & World Bank. (2020). How COVID-19 is affecting firms in Ghana: Results from the Business Tracker Survey. Retrieved from: https://statsghana.gov.gh/covidtracker/Business%20Tracker%20Brief%20Report_GSS_web.pdf
GSS. (2021). Brief on COVID-19 Households and Jobs Tracker Wave 2. Retrieved from: https://statsghana.gov.gh/covidtracker/HH_tracker_wave_2_weighted_14_04_2021.pdf
HOIA. (2020). HOIA: protect yourself and your closest ones. Retrieved from: https://hoia.me/en/
Jutting, J. (2020). Supporting NSOs in times of crises and beyond. Retrieved from: https://unstats.un.org/unsd/undataforum/webinars/docs/PARIS21.pdf
Kaminskiy, D. (2017, December 04). What’s the difference between ‘Big Data’ and ‘Data’? Retrieved from: https://digileaders.com/whats-difference-big-data-data/
Kim, J. H., An, J. A. R., Oh, S. J., Oh, J., & Lee, J. K. (2021). Emerging COVID-19 success story: South Korea learned the lessons of MERS. Retrieved from: https://ourworldindata.org/covid-exemplar-south-korea
Kumar, S., & Preetha, G. S. (2012). Health promotion: An effective tool for global health. Indian Journal of Community Medicine, 37(1), 5-12. Retrieved From: https://www.ncbi.nlm.nih.gov/pmc/articles/PMc3326808/

Data for Policymaking in the Pandemic Period54
Laney, D. (2001). 3D data management: Controlling data volume, velocity, and variety. retrieved from: https://studylib.net/doc/8647594/3d-data-management--controlling-data-volume--velocity--an...
Lewis, S., Ravitz, A., Katz, A., & Piorkowski, J. (2021, May 21). A health-data ecosystem to protect against public-health threats [web log]. https://www.brookings.edu/techstream/a-health-data-ecosystem-to-protect-against-public-health-threats/.
Melamed, C. (2020). Working together against COVID19: A message from CEO Claire Melamed. Retrieved from: https://www.data4sdgs.org/news/working-together-against-covid-19-message-ceo-claire-melamed
Mitchell, C., Tennison, J., & Thereaux, O. (2020). Covid-19: Building an open and trustworthy data ecosystem. The ODI. https://theodi.org/project/building-an-open-and-trustworthy-data-ecosystem-for-covid-19/.
OECD and The GovLab. (2021). Open data in action: initiatives during the initial stage of the COVID-19 pandemic. Retrieved From: https://www.oecd.org/gov/digital-government/use-of-open-government-data-to-address-covid19-outbreak.htm
OECD, Eurostat, and World Health Organization. (2017). A System of Health Accounts 2011: Revised edition. Paris: OECD Publishing. Retrieved From: https://ec.europa.eu/eurostat/documents/3859598/7985806/KS-05-19-103-EN-N.pdf/60aa44b0-2738-4c4d-be4b-48b6590be1b0
OECD. (2000). A System of Health Accounts. Paris: OECD Publishing. Retrieved From: https://www.oecd.org/health/health-systems/21160591.pdf
Open Data Watch. (n.d.). The Data Value Chain: Moving from Production to Impact. Retrieved From: https://opendatawatch.com/wp-content/uploads/2018/03/Data_Value_Chain-WR-1803126.pdf
Paris21. (2020a). Strengthening data and policy capacities for an inclusive COVID19 response and recovery. Retrieved from: https://paris21.org/sites/default/files/inline-files/COVID-19_ONEPAGER.pdf
Paris21. (2020b). How PARIS21 is Supporting National Statistical Systems amid COVID-19. Retrieved from: https://paris21.org/news-center/news/Our-Response-to-COVID-19
Paz, C. R. (2020). 5 UN resources for adapting migration data collection in times of COVID-19. Retrieved from: https://migrationdataportal.org/blog/5-un-resources-adapting-migration-data-collection-times-covid-19

Data for Policymaking in the Pandemic Period 55
Pomey, M.P., Poullier, J.P., & Lejeune, B. (2000). Quel avenir pour le système de soins canadien?., Paris: Santé Publique.
Pousadela, I. (2020, September 25). Access to Information During a Pandemic: A Matter of Life and Death. Just Security. https://www.justsecurity.org/72557/access-to-information-during-a-pandemic-a-matter-of-life-or-death/.
Rahman, M., Khan, T.I., Kamal, M., Alam, M., Hossain, M.S., & Sabbih, M.A. (2021). An Assessment of the Effectiveness of Delivering the Relief Supports to Cope with COVID-19 in Bangladesh. Dhaka: Centre for Policy Dialogue (CPD).
Saigoneer. (2020, March 11). Vietnam Unveils Health Declaration App, Website to Aid Coronavirus Containment. Retrieved from: https://saigoneer.com/saigon-health/18493-vietnam-unveils-health-declaration-app,-website-to-aid-coronavirus-containment
Shin, H., Jin, H., & Smith, J. (2020, May 22). How South Korea turned an urban planning system into a virus tracking database. Retrieved from: https://www.reuters.com/article/us-health-coronavirus-southkorea-tracing-idUSKBN22Y03I
Siddiqui, Z., & Rathinam, F. (2021). Big Data in the time of a pandemic. Retrieved from: https://www.3ieimpact.org/blogs/big-data-time-pandemic
Statistics Estonia. (2020). COVID-19 impact in Estonia. Retrieved from: https://www.stat.ee/en/find-statistics/covid-19-impact-estonia/short-term-statistics-enterprises
UNDESA. (2020a). Background: COVID-19 Response. Retrieved from: https://covid-19-response.unstatshub.org
UNDESA. (2020b). Survey of National Statistical Offices during COVID-19. Retrieved from: https://covid-19-response.unstatshub.org/posts/survey-of-national-statistical-offices-during-covid-19/
UNDESA. (2021). COVID-19: How the data and statistical community stepped up to the new challenges. Retrieved from: https://www.un.org/development/desa/dpad/publication/un-desa-policy-brief-96-covid-19-how-the-data-and-statistical-community-stepped-up-to-the-new-challenges/
UNDP. (undated). Data ecosystems for sustainable development: An assessment of six pilot countries. Seoul: UNDP.
United Nations. (2020, October 23). Over 10,000 data producers and users connect to advance solutions for trusted data in COVID-19 response. Retrieved from: https://

Data for Policymaking in the Pandemic Period56
www.un.org/sustainabledevelopment/blog/2020/10/un-world-data-forum-2020-over-10000-data-producers-and-users-connect-to-advance-solutions-for-trusted-data-in-covid-19-response/
UNSD. (2020). Monitoring the State of Statistical Operations under the COVID-19 Pandemic. New York: UNSD.
UNStats. (2021). Bangladesh: SDG monitoring. Retrieved from UN Stats: https://unstats.un.org/capacity-development/UNSD-FCDO/bangladesh/#:~:text=The%20government%20has%20formed%20the,and%20monitor%20other%20international%20commitments.
Vietnam News. (2020, March 11). All citizens, foreigners living in Vietnam to provide health declarations. Retrieved from: https://www.nationthailand.com/in-focus/30383833
Vietnam Times. (2020, March 19). Hanoi launches “SmartCity” mobile app to track Covid-19 quarantined cases. Retrieved from: https://vietnamtimes.org.vn/hanoi-launches-smartcity-mobile-app-to-track-covid-19-quarantined-cases-18556.html
WHO. (1998). Health promotion glossary. Geneva: World Health Organization (WHO). Retrieved From: https://www.who.int/healthpromotion/about/HPR%20Glossary%201998.pdfWHO. (2018). A vision for primary health care in the 21st century: Towards universal health coverage and the Sustainable Development Goals (No. WHO/HIS/SDS/2018.15). Geneva: World Health Organization (WHO). Retrieved From: https://apps.who.int/iris/bitstream/handle/10665/328065/WHO-HIS-SDS-2018.15-eng.pdf
WHO. (2021a, April 01). Primary health care. Retrieved From: https://www.who.int/news-room/fact-sheets/detail/primary-health-care
WHO. (2021b, April 01). Universal health coverage (UHC). Retrieved from: https://www.who.int/news-room/fact-sheets/detail/universal-health-coverage-(uhc)
WHO. (n.d). Health promotion. Retrieved From: https://www.who.int/health-topics/health-promotion#tab=tab_3

Data for Policymaking in the Pandemic Period 57
Annexes
Annex Table 1.1: Analytical framework of the study
Objectives Hypotheses Scope Approach and method
1. Reviewing and documenting the process(es), tools, and partnerships deployed for generating statistics in view of the pandemic in Bangladesh.
1.1. There are institutional mechanisms and systemic efforts currently in place in Bangladesh to generate basic statistics given COVID-19.
The following domains and agencies will be considered for analysis:
Domains:• Health and
COVID-19• Public policy
interventions• Mainstream
economic data Agencies:• DGHS, ICDDR, B,
BRAC• BBS• a2i (crosscutting)
• Desk review of literature
• Analysis of secondary data
• Key informant interviews (KIIs)
1.2. There is an institutional arrangement of integration, coordination and reconciliation within the data ecosystem.1.3. There is a systematic process of documenting and archiving the generated statistics, and relevant stakeholders can access these statistics when required.
2. Assessing the utilisation of data initiatives for designing policy response during the pandemic and identifying the implications of the revealed data gaps for required policy processes.
2.1. The generated statistics enabled efficient delivery of the various policy measures taken to tackle COVID-19.
The following domains will be focused upon:
• Health and COVID-19
• Public policy interventions
• Desk review of literature
• Analysis of secondary data
• Key informant interviews (KIIs)
• Case studies focusing on i) the government’s distribution of BDT 2500 to 5 million households and ii) the vaccination drive in Bangladesh
2.2. The generated statistics are adequate for policy design, policy implementation, and monitoring process of the policies.
(Annex Table 1.1 contd.)

Data for Policymaking in the Pandemic Period58
Objectives Hypotheses Scope Approach and method
3. Identifying the best practices from global and national experience for replication and adaptation in future policymaking.
3.1. The experience of international organisations and other countries will help Bangladesh to adopt the best practices and vice-versa.
The following international organisations and countries will be considered:
International organisations:• UNWDF• UNStat• Eurostat• PARIS21• GPSDD
Countries:• Ghana• Vietnam• Estonia• South Korea• Switzerland
• Desk review of literature
• Analysis of secondary data
Source: Authors’ elaboration.
(Annex Table 1.1 contd.)

Data for Policym
aking in the Pandemic Period
59
Annex Table 3.1: Mapping of COVID-19 related health data initiatives
Data Initiatives
COVI
D-1
9 Dyn
amic
D
ashb
oard
Shon
khay
Cor
ona
Viru
s
COVI
D-1
9 Tra
cker
SDG
Trac
ker
Suro
kkha
por
tal
Vacc
inat
ion
Pres
s Re
leas
e
COVI
D -1
9 dai
ly
pres
s rel
ease
by
IED
CR
Nove
l cor
onav
irus
2019
(COV
ID -1
9)
pres
s rel
ease
by
DGH
S
COVI
D-1
9 situ
atio
n re
late
d he
alth
bu
lletin
COVI
D -1
9 Co
mm
oditi
es
dash
boar
d
Coro
navi
rus
COVI
D-1
9 D
ashb
oard
, 202
0
Info
rmat
ion
inclu
ding
empt
y be
ds in
Cor
ona
hosp
ital (
repo
rt)
COVI
D -1
9 te
lehe
alth
cent
re
daily
repo
rt
Live
coro
na ri
sk te
st
Coro
na In
fo
Coro
na tr
acer
BD
IndicatorsNumber of tests of COVID suspected peopleCumulative and/or daily tests
Trend of percentage of positive tests
Number of lab test vs. confirmed cases
Test positivity rate in last one week
Daily and cumulative number of tests before going abroad
Confirmed cases of COVID infectionCumulative and/or daily confirmed cases
Percentage of confirmed cases
District wise confirmed case distribution (high to low)
(Annex Table 3.1 contd.)

Data for Policym
aking in the Pandemic Period
60
Data Initiatives
COVI
D-1
9 Dyn
amic
D
ashb
oard
Shon
khay
Cor
ona
Viru
s
COVI
D-1
9 Tra
cker
SDG
Trac
ker
Suro
kkha
por
tal
Vacc
inat
ion
Pres
s Re
leas
e
COVI
D -1
9 dai
ly
pres
s rel
ease
by
IED
CR
Nove
l cor
onav
irus
2019
(COV
ID -1
9)
pres
s rel
ease
by
DGH
S
COVI
D-1
9 situ
atio
n re
late
d he
alth
bu
lletin
COVI
D -1
9 Co
mm
oditi
es
dash
boar
d
Coro
navi
rus
COVI
D-1
9 D
ashb
oard
, 202
0
Info
rmat
ion
inclu
ding
empt
y be
ds in
Cor
ona
hosp
ital (
repo
rt)
COVI
D -1
9 te
lehe
alth
cent
re
daily
repo
rt
Live
coro
na ri
sk te
st
Coro
na In
fo
Coro
na tr
acer
BD
Dhaka city confirmed cases (area wise distribution)
Total and percentage of active cases
Percentage of confirmed cases
Trend for confirmed cases
Number of COVID infected people by the level of intensity of infection
Percentage of other disease among the COVID infected people
Recovery from COVID-19Cumulative and/or daily number of COVID recovered patient
(Annex Table 3.1 contd.)
(Annex Table 3.1 contd.)

Data for Policym
aking in the Pandemic Period
61
Data Initiatives
COVI
D-1
9 Dyn
amic
D
ashb
oard
Shon
khay
Cor
ona
Viru
s
COVI
D-1
9 Tra
cker
SDG
Trac
ker
Suro
kkha
por
tal
Vacc
inat
ion
Pres
s Re
leas
e
COVI
D -1
9 dai
ly
pres
s rel
ease
by
IED
CR
Nove
l cor
onav
irus
2019
(COV
ID -1
9)
pres
s rel
ease
by
DGH
S
COVI
D-1
9 situ
atio
n re
late
d he
alth
bu
lletin
COVI
D -1
9 Co
mm
oditi
es
dash
boar
d
Coro
navi
rus
COVI
D-1
9 D
ashb
oard
, 202
0
Info
rmat
ion
inclu
ding
empt
y be
ds in
Cor
ona
hosp
ital (
repo
rt)
COVI
D -1
9 te
lehe
alth
cent
re
daily
repo
rt
Live
coro
na ri
sk te
st
Coro
na In
fo
Coro
na tr
acer
BD
Percentage of recovered people
Trend for recovered cases
Death of COVID infected peopleCumulative and/ or daily death cases
Percentage of death cases
Daily number of deaths who were brought to hospital as dead
Trend for death cases
Cumulative number of death rate
Number of death cases by place of death (hospital/home)
Quarantine of COVID infected peopleNumber of people in quarantine
(Annex Table 3.1 contd.)
(Annex Table 3.1 contd.)

Data for Policym
aking in the Pandemic Period
62
Data Initiatives
COVI
D-1
9 Dyn
amic
D
ashb
oard
Shon
khay
Cor
ona
Viru
s
COVI
D-1
9 Tra
cker
SDG
Trac
ker
Suro
kkha
por
tal
Vacc
inat
ion
Pres
s Re
leas
e
COVI
D -1
9 dai
ly
pres
s rel
ease
by
IED
CR
Nove
l cor
onav
irus
2019
(COV
ID -1
9)
pres
s rel
ease
by
DGH
S
COVI
D-1
9 situ
atio
n re
late
d he
alth
bu
lletin
COVI
D -1
9 Co
mm
oditi
es
dash
boar
d
Coro
navi
rus
COVI
D-1
9 D
ashb
oard
, 202
0
Info
rmat
ion
inclu
ding
empt
y be
ds in
Cor
ona
hosp
ital (
repo
rt)
COVI
D -1
9 te
lehe
alth
cent
re
daily
repo
rt
Live
coro
na ri
sk te
st
Coro
na In
fo
Coro
na tr
acer
BD
Number of people released from quarantine
Trend of daily quarantine
Number of people in quarantine before doing tests
Percentage of COVID infected quarantined people
Hospitals and hospital logistics dedicated to COVID-19Total number of COVID dedicated general bed and admitted patient at those bed
Total number of COVID dedicated ICU bed and admitted patient at those ICU bed
(Annex Table 3.1 contd.)
(Annex Table 3.1 contd.)

Data for Policym
aking in the Pandemic Period
63
Data Initiatives
COVI
D-1
9 Dyn
amic
D
ashb
oard
Shon
khay
Cor
ona
Viru
s
COVI
D-1
9 Tra
cker
SDG
Trac
ker
Suro
kkha
por
tal
Vacc
inat
ion
Pres
s Re
leas
e
COVI
D -1
9 dai
ly
pres
s rel
ease
by
IED
CR
Nove
l cor
onav
irus
2019
(COV
ID -1
9)
pres
s rel
ease
by
DGH
S
COVI
D-1
9 situ
atio
n re
late
d he
alth
bu
lletin
COVI
D -1
9 Co
mm
oditi
es
dash
boar
d
Coro
navi
rus
COVI
D-1
9 D
ashb
oard
, 202
0
Info
rmat
ion
inclu
ding
empt
y be
ds in
Cor
ona
hosp
ital (
repo
rt)
COVI
D -1
9 te
lehe
alth
cent
re
daily
repo
rt
Live
coro
na ri
sk te
st
Coro
na In
fo
Coro
na tr
acer
BD
Total number of COVID dedicated HDU bed and admitted patient at those HDU bed
Total number of COVID occupied bed
Bed occupancy rate
Total number of COVID dedicated occupied ICU bed
Total number of COVID dedicated occupied HDU bed
ICU equivalent bed with high flow nasal canula
Number of available and used high flow nasal canula
Number of oxygen concentrator available
(Annex Table 3.1 contd.)
(Annex Table 3.1 contd.)

Data for Policym
aking in the Pandemic Period
64
Data Initiatives
COVI
D-1
9 Dyn
amic
D
ashb
oard
Shon
khay
Cor
ona
Viru
s
COVI
D-1
9 Tra
cker
SDG
Trac
ker
Suro
kkha
por
tal
Vacc
inat
ion
Pres
s Re
leas
e
COVI
D -1
9 dai
ly
pres
s rel
ease
by
IED
CR
Nove
l cor
onav
irus
2019
(COV
ID -1
9)
pres
s rel
ease
by
DGH
S
COVI
D-1
9 situ
atio
n re
late
d he
alth
bu
lletin
COVI
D -1
9 Co
mm
oditi
es
dash
boar
d
Coro
navi
rus
COVI
D-1
9 D
ashb
oard
, 202
0
Info
rmat
ion
inclu
ding
empt
y be
ds in
Cor
ona
hosp
ital (
repo
rt)
COVI
D -1
9 te
lehe
alth
cent
re
daily
repo
rt
Live
coro
na ri
sk te
st
Coro
na In
fo
Coro
na tr
acer
BD
Number of oxygen cylinder available
Total number of beds with central oxygen supply
Availability of central oxygen line
Number of COVID dedicated manpower (doctors, nurses etc)
Number of isolation bed across district and division
Medical supplies (number of aprons, gloves, shield, PPE kits, sanitizer etc) available in hospital
(Annex Table 3.1 contd.)
(Annex Table 3.1 contd.)

Data for Policym
aking in the Pandemic Period
65
Data Initiatives
COVI
D-1
9 Dyn
amic
D
ashb
oard
Shon
khay
Cor
ona
Viru
s
COVI
D-1
9 Tra
cker
SDG
Trac
ker
Suro
kkha
por
tal
Vacc
inat
ion
Pres
s Re
leas
e
COVI
D -1
9 dai
ly
pres
s rel
ease
by
IED
CR
Nove
l cor
onav
irus
2019
(COV
ID -1
9)
pres
s rel
ease
by
DGH
S
COVI
D-1
9 situ
atio
n re
late
d he
alth
bu
lletin
COVI
D -1
9 Co
mm
oditi
es
dash
boar
d
Coro
navi
rus
COVI
D-1
9 D
ashb
oard
, 202
0
Info
rmat
ion
inclu
ding
empt
y be
ds in
Cor
ona
hosp
ital (
repo
rt)
COVI
D -1
9 te
lehe
alth
cent
re
daily
repo
rt
Live
coro
na ri
sk te
st
Coro
na In
fo
Coro
na tr
acer
BD
Preparedness of hospitals (control room, medical team, isolation unit, separate OPD for RTI patient etc)
Number of ventilators
Number of admitted and discharged patients in last 24 hours
COVID-19 tele-health servicesTotal number of calls received through helplines
Total number of service recipients from tele health service
Number of infected people who received tele-medical assessment service
(Annex Table 3.1 contd.)
(Annex Table 3.1 contd.)

Data for Policym
aking in the Pandemic Period
66
Data Initiatives
COVI
D-1
9 Dyn
amic
D
ashb
oard
Shon
khay
Cor
ona
Viru
s
COVI
D-1
9 Tra
cker
SDG
Trac
ker
Suro
kkha
por
tal
Vacc
inat
ion
Pres
s Re
leas
e
COVI
D -1
9 dai
ly
pres
s rel
ease
by
IED
CR
Nove
l cor
onav
irus
2019
(COV
ID -1
9)
pres
s rel
ease
by
DGH
S
COVI
D-1
9 situ
atio
n re
late
d he
alth
bu
lletin
COVI
D -1
9 Co
mm
oditi
es
dash
boar
d
Coro
navi
rus
COVI
D-1
9 D
ashb
oard
, 202
0
Info
rmat
ion
inclu
ding
empt
y be
ds in
Cor
ona
hosp
ital (
repo
rt)
COVI
D -1
9 te
lehe
alth
cent
re
daily
repo
rt
Live
coro
na ri
sk te
st
Coro
na In
fo
Coro
na tr
acer
BD
Number of infected people who were requested to receive tele-health advices
Number of infected people who received tele-medical follow-up services
Total number of tele-health service providers
COVID-19 vaccinationCumulative and /or daily number of vaccine registration
Cumulative and/or daily number of people administered for first and second doses
Percentage of people administered for first and second doses
Percentage of first doses against registration
(Annex Table 3.1 contd.)
(Annex Table 3.1 contd.)
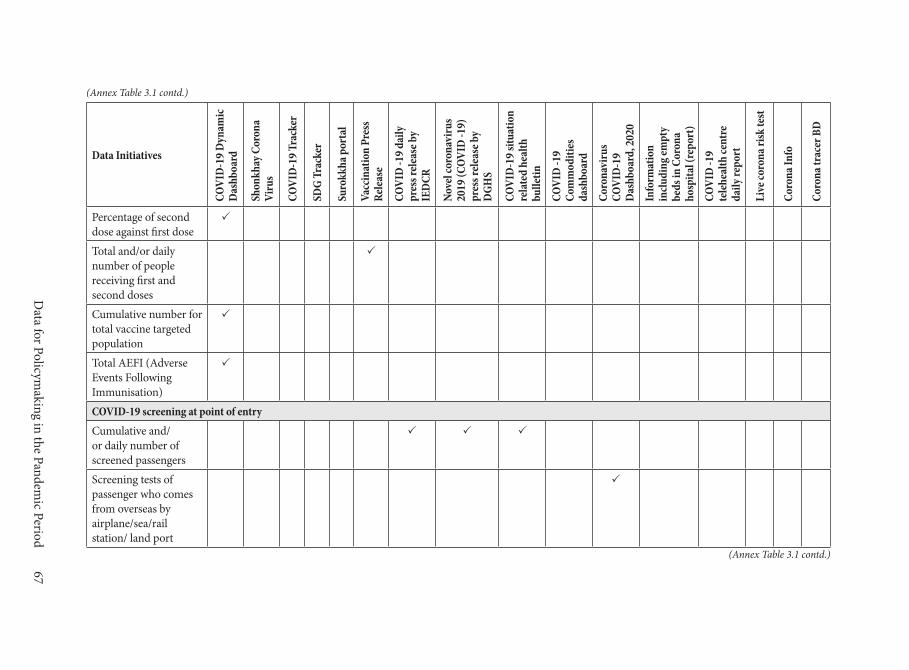
Data for Policym
aking in the Pandemic Period
67
Data Initiatives
COVI
D-1
9 Dyn
amic
D
ashb
oard
Shon
khay
Cor
ona
Viru
s
COVI
D-1
9 Tra
cker
SDG
Trac
ker
Suro
kkha
por
tal
Vacc
inat
ion
Pres
s Re
leas
e
COVI
D -1
9 dai
ly
pres
s rel
ease
by
IED
CR
Nove
l cor
onav
irus
2019
(COV
ID -1
9)
pres
s rel
ease
by
DGH
S
COVI
D-1
9 situ
atio
n re
late
d he
alth
bu
lletin
COVI
D -1
9 Co
mm
oditi
es
dash
boar
d
Coro
navi
rus
COVI
D-1
9 D
ashb
oard
, 202
0
Info
rmat
ion
inclu
ding
empt
y be
ds in
Cor
ona
hosp
ital (
repo
rt)
COVI
D -1
9 te
lehe
alth
cent
re
daily
repo
rt
Live
coro
na ri
sk te
st
Coro
na In
fo
Coro
na tr
acer
BD
Percentage of second dose against first dose
Total and/or daily number of people receiving first and second doses
Cumulative number for total vaccine targeted population
Total AEFI (Adverse Events Following Immunisation)
COVID-19 screening at point of entryCumulative and/or daily number of screened passengers
Screening tests of passenger who comes from overseas by airplane/sea/rail station/ land port
(Annex Table 3.1 contd.)
(Annex Table 3.1 contd.)

Data for Policym
aking in the Pandemic Period
68
Data Initiatives
COVI
D-1
9 Dyn
amic
D
ashb
oard
Shon
khay
Cor
ona
Viru
s
COVI
D-1
9 Tra
cker
SDG
Trac
ker
Suro
kkha
por
tal
Vacc
inat
ion
Pres
s Re
leas
e
COVI
D -1
9 dai
ly
pres
s rel
ease
by
IED
CR
Nove
l cor
onav
irus
2019
(COV
ID -1
9)
pres
s rel
ease
by
DGH
S
COVI
D-1
9 situ
atio
n re
late
d he
alth
bu
lletin
COVI
D -1
9 Co
mm
oditi
es
dash
boar
d
Coro
navi
rus
COVI
D-1
9 D
ashb
oard
, 202
0
Info
rmat
ion
inclu
ding
empt
y be
ds in
Cor
ona
hosp
ital (
repo
rt)
COVI
D -1
9 te
lehe
alth
cent
re
daily
repo
rt
Live
coro
na ri
sk te
st
Coro
na In
fo
Coro
na tr
acer
BD
Medical supplies dedicated to COVID-19Availability of commodities (gloves, masks, apron, sanitizer, PPE kit etc)
Donation and procurement of stock
Facility stock summary by district
Other indicatorsCumulative and percentage of COVID infected people under treatment
Total number of COVID affected countries
Comparative statistics for COVID infection, recovery, and death cases over time
(Annex Table 3.1 contd.)
(Annex Table 3.1 contd.)

Data for Policym
aking in the Pandemic Period
69
Data Initiatives
COVI
D-1
9 Dyn
amic
D
ashb
oard
Shon
khay
Cor
ona
Viru
s
COVI
D-1
9 Tra
cker
SDG
Trac
ker
Suro
kkha
por
tal
Vacc
inat
ion
Pres
s Re
leas
e
COVI
D -1
9 dai
ly
pres
s rel
ease
by
IED
CR
Nove
l cor
onav
irus
2019
(COV
ID -1
9)
pres
s rel
ease
by
DGH
S
COVI
D-1
9 situ
atio
n re
late
d he
alth
bu
lletin
COVI
D -1
9 Co
mm
oditi
es
dash
boar
d
Coro
navi
rus
COVI
D-1
9 D
ashb
oard
, 202
0
Info
rmat
ion
inclu
ding
empt
y be
ds in
Cor
ona
hosp
ital (
repo
rt)
COVI
D -1
9 te
lehe
alth
cent
re
daily
repo
rt
Live
coro
na ri
sk te
st
Coro
na In
fo
Coro
na tr
acer
BD
Statistics for infection, death, and recovery for top five COVID infected countries (USA, UK Brazil, Russia, India)
Availability of hotline numbers for seeking COVID related information and services
Information relevant to COVID-19
Percentage of COVID related complaints
Source: Authors’ compilation from various sources.
(Annex Table 3.1 contd.)

Data for Policymaking in the Pandemic Period70
Annex Table 4.1: List of participants in the KIIs
SL Name Designation Organisation1. Mr Md. Alamgir Hossen Focal Point Officer SDG Cell, Bangladesh Bureau
of Statistics (BBS)2. Mr Md. Anowarul Arif Khan Results Management
Expert Aspire to Innovate (a2i)
3. Mr Kawsar Shojib National Consultant Data Innovation, Aspire to Innovate (a2i)
4. Mr Anir Chowdhury Programme Advisor Aspire to Innovate (a2i)5. Dr Shah Ali Akbar Ashrafi Chief Health Information System,
MIS, Directorate General of Health services (DGHS)
6. Dr Firdausi Qadri Emeritus Scientist International Centre for Diarrhoeal Disease Research, Bangladesh (ICDDR,B)
7. Dr Mushtaque Chowdhury Convenor Health Watch8. Dr Morseda Chowdhury Director Health, Nutrition and
Population Programme, BRAC9. Dr Shafiun Nahin Shimul Assistant Professor Institute of Health Economics,
University of Dhaka10. Professor Rashid-E-Mahbub Chair National Committee on Health
Rights Movement11. Mr Sadat Adnan Ahmed Chief Commercial
Officer Nagad
Source: Authors’ compilation.

978-984-95073-3-8
ISBN 978-984-95073-3-8
DATA FOR POLICYMAKING IN THE PANDEMIC PERIODThe Bangladesh Experience
Multiple data-driven initiatives have contributed to decision-making during the critical period of COVID-19 in Bangladesh. A number of good practices can be identi�ed from the national experience, in view of cross-country and global measures, for replication and adaptation. Real-time data generated within the country’s health sector demonstrates the potential of being scaled up both vertically and horizontally. However, sustainability of these data initiatives will require substantial resources—�nance, human capital and technology. In this context, the study maps the data initiatives in Bangladesh during the pandemic, reviews the national experience in the context of relevant international development and puts forward policy recommendations towards putting in place an e�cient and sustainable data ecosystem in the country.