Deutsche Gruppe der WRSA e. V. - Asescu
223
Deutsche Gruppe der WRSA e. V. 20. Internationale Tagung über Haltung und Krankheiten der Kaninchen, Pelztiere und Heimtiere 20 th International Symposium on housing and diseases of rabbits, furproviding animals and pet animals in Zusammenarbeit mit dem Friedrich-Loeffler-Institut FLI Bundesforschungsinstitut für Tiergesundheit Leitung: Prof. Dr. Steffen Hoy (Gießen) Themenkreise: Haltung (Housing) Verhalten (Behaviour) Fütterung (Feeding) Zucht (Breeding) Krankheit und Prophylaxe (Diseases and prophylaxis) 17. - 18. Mai 2017 in Celle Deutsche Gruppe der WRSA e. V. Vorsitzender: Prof. Dr. St. Hoy Institut für Tierzucht und Haustiergenetik Justus-Liebig-Universität Gießen Leihgesterner Weg 52, 35392 Gießen Tel.: +49-641-99-37622; FAX: +49-641-99-37639 Email: [email protected]
-
Upload
khangminh22 -
Category
Documents
-
view
0 -
download
0
Transcript of Deutsche Gruppe der WRSA e. V. - Asescu

Deutsche Gruppe der WRSA e. V.
20. Internationale Tagung über Haltung und Krankheiten der
Kaninchen, Pelztiere und Heimtiere
20th
International Symposium on housing and diseases of rabbits,
furproviding animals and pet animals
in Zusammenarbeit mit dem
Friedrich-Loeffler-Institut FLI
Bundesforschungsinstitut für Tiergesundheit
Leitung: Prof. Dr. Steffen Hoy (Gießen)
Themenkreise:
Haltung (Housing)
Verhalten (Behaviour)
Fütterung (Feeding)
Zucht (Breeding)
Krankheit und Prophylaxe (Diseases and prophylaxis)
17. - 18. Mai 2017 in Celle
Deutsche Gruppe der WRSA e. V.
Vorsitzender: Prof. Dr. St. Hoy
Institut für Tierzucht und Haustiergenetik
Justus-Liebig-Universität Gießen
Leihgesterner Weg 52, 35392 Gießen
Tel.: +49-641-99-37622; FAX: +49-641-99-37639
Email: [email protected]

Anmerkung: Für die Herstellung der Proceedings wurden die von den Referenten
eingesandten Original-Manuskripte verwendet, die z.T. lediglich
stilistisch bearbeitet wurden.
For the preparation of the proceedings original manuscripts submitted
by the authors were used – in some cases slightly revised regarding
style.
I
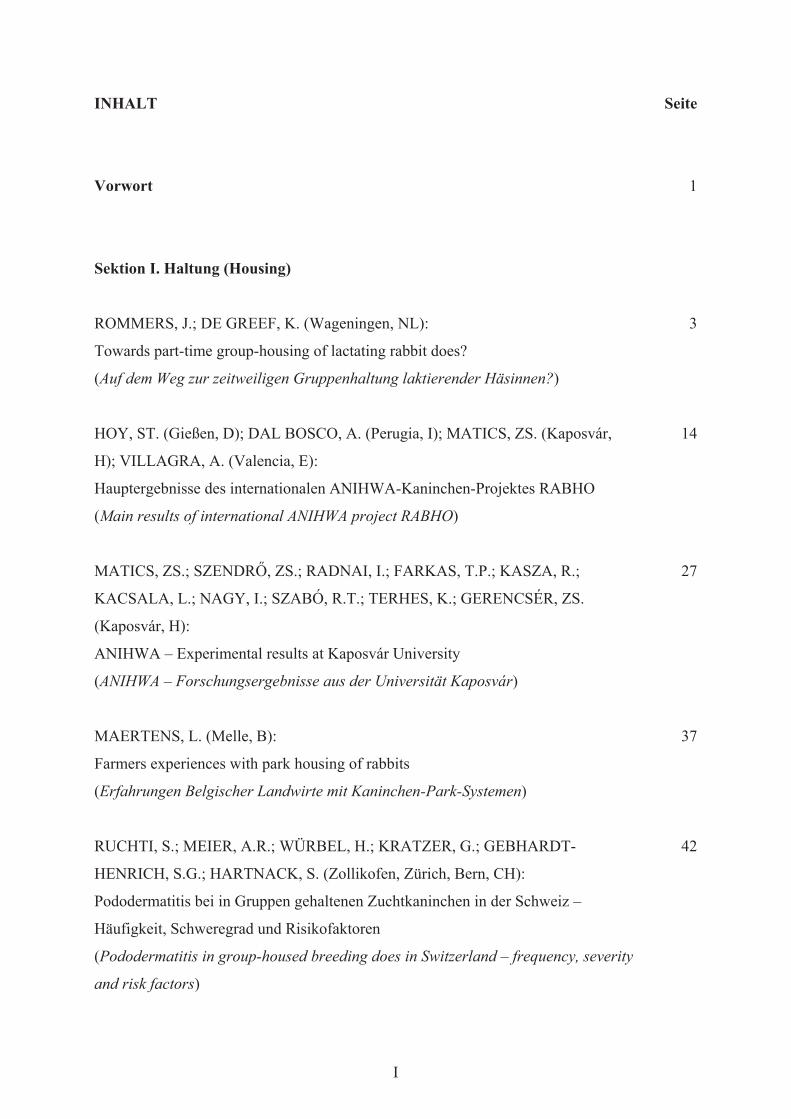
INHALT Seite
Vorwort 1
Sektion I. Haltung (Housing)
ROMMERS, J.; DE GREEF, K. (Wageningen, NL):
Towards part-time group-housing of lactating rabbit does?
(Auf dem Weg zur zeitweiligen Gruppenhaltung laktierender Häsinnen?)
3
HOY, ST. (Gießen, D); DAL BOSCO, A. (Perugia, I); MATICS, ZS. (Kaposvár,
H); VILLAGRA, A. (Valencia, E):
Hauptergebnisse des internationalen ANIHWA-Kaninchen-Projektes RABHO
(Main results of international ANIHWA project RABHO)
14
MATICS, ZS.; SZENDRŐ, ZS.; RADNAI, I.; FARKAS, T.P.; KASZA, R.;
KACSALA, L.; NAGY, I.; SZABÓ, R.T.; TERHES, K.; GERENCSÉR, ZS.
(Kaposvár, H):
ANIHWA – Experimental results at Kaposvár University
(ANIHWA – Forschungsergebnisse aus der Universität Kaposvár)
27
MAERTENS, L. (Melle, B):
Farmers experiences with park housing of rabbits
(Erfahrungen Belgischer Landwirte mit Kaninchen-Park-Systemen)
37
RUCHTI, S.; MEIER, A.R.; WÜRBEL, H.; KRATZER, G.; GEBHARDT-
HENRICH, S.G.; HARTNACK, S. (Zollikofen, Zürich, Bern, CH):
Pododermatitis bei in Gruppen gehaltenen Zuchtkaninchen in der Schweiz –
Häufigkeit, Schweregrad und Risikofaktoren
(Pododermatitis in group-housed breeding does in Switzerland – frequency, severity
and risk factors)
42
II
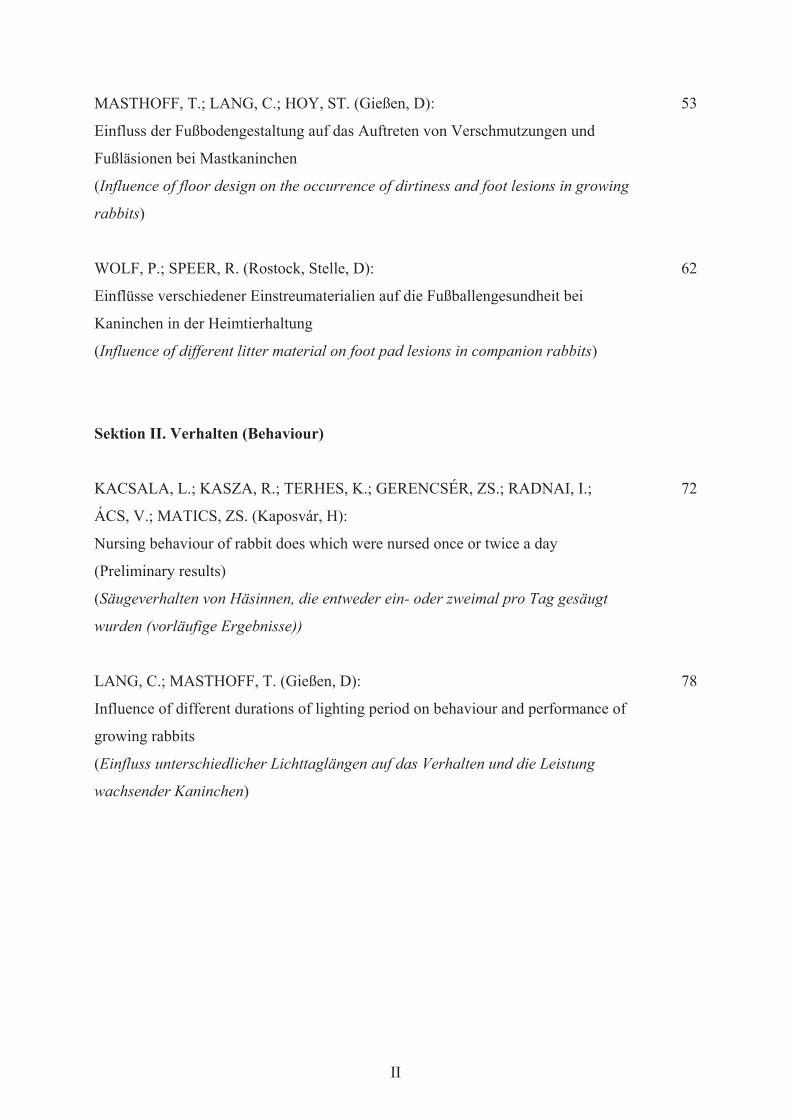
MASTHOFF, T.; LANG, C.; HOY, ST. (Gießen, D):
Einfluss der Fußbodengestaltung auf das Auftreten von Verschmutzungen und
Fußläsionen bei Mastkaninchen
(Influence of floor design on the occurrence of dirtiness and foot lesions in growing
rabbits)
53
WOLF, P.; SPEER, R. (Rostock, Stelle, D):
Einflüsse verschiedener Einstreumaterialien auf die Fußballengesundheit bei
Kaninchen in der Heimtierhaltung
(Influence of different litter material on foot pad lesions in companion rabbits)
62
Sektion II. Verhalten (Behaviour)
KACSALA, L.; KASZA, R.; TERHES, K.; GERENCSÉR, ZS.; RADNAI, I.;
ÁCS, V.; MATICS, ZS. (Kaposvár, H):
Nursing behaviour of rabbit does which were nursed once or twice a day
(Preliminary results)
(Säugeverhalten von Häsinnen, die entweder ein- oder zweimal pro Tag gesäugt
wurden (vorläufige Ergebnisse))
72
LANG, C.; MASTHOFF, T. (Gießen, D):
Influence of different durations of lighting period on behaviour and performance of
growing rabbits
(Einfluss unterschiedlicher Lichttaglängen auf das Verhalten und die Leistung
wachsender Kaninchen)
78

III
Sektion III. Fütterung (Feeding)
KERMAUNER, A.; LAVRENČIČ, A. (Ljubljana, SLO):
Relationship between in vitro gas production parameters and chemical composition
of sugar beet pulp in rabbits
(Zusammenhang zwischen Parametern der in vitro-Gasproduktion und der chem.
Zusammensetzung von Zuckerrübenschnitzeln in der Fütterung von Kaninchen)
85
LAVRENČIČ, A.; KERMAUNER, A. (Ljubljana, SLO):
Relationship between in vitro gas production parameters of predigested and intact
sugar beet pulps in rabbits
(Zusammenhang zwischen Parametern der in vitro-Gasproduktion bei vorverdauten
oder unbehandelten Zuckerrübenschnitzeln in der Fütterung von Kaninchen)
95
WOLF, P. (Rostock, D):
Ernährung von Kaninchen in der Heimtierhaltung zwischen Fakten, Mythen und
Slogans
(Nutrition of companion rabbits between facts, myths and slogans)
107
KACSALA, L.; SZENDRŐ, ZS.; KASZA, R.; TERHES, K.; GERENCSÉR, ZS.;
RADNAI, I.; ÁCS, V.; MATICS ZS. (Kaposvár, H):
Milk powder based supplementary feeding of suckling rabbits
(Milchpulver-basierte Ergänzungsfütterung bei Saugkaninchen)
116

IV
Sektion IV. Zucht (Breeding)
KASZA, R.; DALLE ZOTTE, A.; CULLERE, M.; DONKÓ, T.; SZENDRŐ, ZS.;
RADNAI, I.; NAGY, I.; ÁCS, V.; KACSALA, L.; GERENCSÉR, ZS.; MATICS,
ZS. (Kaposvár, H, Padova, I):
Effect of divergent selection for total body fat content determined by CT on the
carcass traits and fat content of meat cuts of rabbits
(Effekt der Selektion auf den durch CT bestimmten Körperfettgehalt auf die
Schlachtkörperparameter und den Fettgehalt in Kaninchenfleisch)
123
URANKAR, J.; FLISAR, T.; KERMAUNER, A.; MALOVRH, Š.; KOVAČ, M.
(Ljubljana, SLO):
Birth weight and consequences on subsequent performance in rabbits
(Das Geburtsgewicht und seine Auswirkungen auf die nachfolgenden Leistungen
von Kaninchen)
131
Sektion V. Krankheit und Prophylaxe (Diseases and prophylaxis)
KORN, A.K. (Hohenheim, D):
Enamel alterations in rabbits
(Zahnschmelz-Veränderungen bei Kaninchen)
139
JEREB, G.; ZDOVC, I.; KERMAUNER, A.; ZDOVC, K.; DOVČ, A.
(Ljubljana, SLO):
Occurrence of Trichophyton mentagrophytes in rabbit farm air samples
(Vorkommen von Trichophyton mentagrophytes in Luftproben aus
Kaninchenzuchtbetrieben)
149
V
Poster
MASTHOFF, T.; LANG, C.; HOY, ST. (Gießen, D):
Untersuchungen zum Einfluss der Haltung von Mastkaninchen in Parks oder
Flatdecks auf die Mastleistung
(Investigations on influence of housing of growing rabbits in parks or flatdecks on
fattening performance)
153
ZEGOWITZ, B.; MASTHOFF, T.; LANG, C. (Gießen, D):
Ergebnisse von Wahluntersuchungen zur Präferenz und Eignung verschiedener
Bodenstrukturen beim Kaninchen
(Results of choice tests regarding preference and suitability of different floor
structures in rabbits)
160
MARTINO, M.; MATTIOLI, S.; CAMBIOTTI, V.; MOSCATI, L.; CASTELLINI,
C.; DAL BOSCO, A. (Perugia, I):
Assessing the motivation of rabbit does to social contact or self-seclusion
(Bewertung der Motivation von Häsinnen für Aufnahme oder Vermeidung von
Sozialkontakten)
169
BRZOZOWSKI, M.; DOMINIAK, R.; GAJEWSKI, P. (Warsaw, P):
Efficiency of use yeast Yarrowia lipolytica as prebiotic preparation on growing
rabbits
(Bewertung des Einsatzes von Yarrowia lipolytica als Prebiotikum bei
Mastkaninchen)
174
ZEMZMI, J.; MABROUKI, S.; ABDOULI, H.; NAJAR, T. (Tunis, TN):
Preliminary characterization of fenugreek seeds gum for use as prebiotic in rabbits’
nutrition
(Vorläufige Bewertung von Bockshornkleesamen als Prebiotikum in der
Kaninchenfütterung)
179
VI
WARNCK, T.; LANG, C. (Gießen, D):
Maissilage als Grundfutter in der Kaninchenmast
(Maize silage as basic feed for fattening rabbits)
187
WOLF, P.; DIBBERT, R. (Rostock, D):
Futteraufnahme von Kaninchen und Futterhygienestatus bei Vorratsfütterung von
Heu oder Mischfutter
(Feed intake of rabbits and feed hygiene status for storage feeding of hay or a mixed
feed)
196
WOLF, P. (Rostock, D):
Daten zur Wasseraufnahme von Mastkaninchen
(Data on water intake in fattening rabbits)
202
WOLF, P.; CAPPAI, M. (Rostock, D; Sassari, I):
Einfluss eines auf zerkleinerten Eicheln (Quercus pubescens) basierenden Futters
auf Wachstum und Schlachtkörperparameter von Mastkaninchen
(Effects of a shred acorns (Quercus pubescens) based diet on growth and carcass
characteristics in fattening rabbits)
210

1
Vorwort
Vom 17. bis zum 18.5.2017 fand in Celle die 20. Internationale Tagung über Haltung und
Krankheiten der Kaninchen, Pelztiere und Heimtiere statt, die durch das Institut für Tierzucht
und Haustiergenetik der Justus-Liebig-Universität Gießen (AG Prof. Dr. Steffen Hoy)
organisiert wurde. An dem Symposium nahmen mehr als 60 Teilnehmer aus 12 Ländern teil
(Belgien, Großbritannien, Deutschland, Frankreich, Niederlande, Österreich, Polen, Schweiz,
Slowenien, Tschechien, Tunesien und Ungarn). Es wurden 18 Vorträge und 10 Poster (in
einer Postersession) präsentiert. Damit musste ein leichter Rückgang gegenüber 2015
registriert werden. Allerdings waren vier angemeldete ausländische Referenten nicht
angereist, sodass die Bilanz besser gewesen wäre. Das ist für den Veranstalter ärgerlich.
Allerdings ist dieses Problem schwer zu managen, da keinem Wissenschaftler die Teilnahme
verwehrt werden kann, sofern nicht erhebliche Zweifel an der Qualität des angemeldeten
Vortrages geäußert werden.
Zu Beginn der Tagung wurde Benedikt Zegowitz für seine Bachelorarbeit mit dem Titel
„Untersuchung zur Präferenz von Mastkaninchen für verschiedene Bodentypen und deren
Einfluss auf die Tiergesundheit“ mit dem Preis der Deutschen Gruppe der World Rabbit
Science Association (WRSA) e.V. für die beste Arbeit eines Nachwuchswissenschaftlers auf
dem Gebiet der Kaninchenwissenschaft geehrt. Die BSc-Arbeit fertigte Herr Zegowitz an der
AG Tierhaltung und Haltungsbiologie der Justus-Liebig-Universität Gießen unter der
Betreuung von Dr. Caroline Lang an. Damit wurde eine Zielstellung der deutschen Gruppe
der WRSA erfüllt, den wissenschaftlichen Nachwuchs auf dem Gebiet der
Kaninchenforschung zu fördern.
Die Tagung wurde erneut zweisprachig (englisch, deutsch) durchgeführt, was grundsätzlich
funktioniert hat. Unabhängig davon sollte die Deutsche Gruppe der WRSA e.V. überlegen,
die Tagung vollständig in englischer Sprache durchzuführen. Die Teilnahme von Praktikern,
darunter die Repräsentanten der Rassekaninchenzüchter, war bislang das Argument für die
Zweisprachigkeit. Die Zahl der anwesenden praktizierenden Rassekaninchenhalter war aber
sehr klein, und viele Vertreter von Futtermittel-, Pharma- oder anderen Unternehmen sowie
Tierärzte und Berater verstehen sicher die Ausführungen in Englisch.
Unser herzlicher Dank gilt den Mitarbeiterinnen und Mitarbeitern des Institutes für Tierschutz
und Tierhaltung des Friedrich-Löffler-Institutes FLI (Bundesforschungsinstitut für
Tiergesundheit), namentlich Herrn Dr. Lars Schrader und Frau Kerstin Krösmann, für ihre
tatkräftige Unterstützung. Das Institut bietet hervorragende Möglichkeiten für eine derartige
Veranstaltung. Leider war es das letzte Mal, dass die Räume des Institutes für die
2
Internationale Tagung zur Verfügung standen. Damit wird es eine klare Zäsur geben, denn es
gilt, nach über 40 Jahren einen neuen Modus für die Ausgestaltung dieser Tagung zu finden.
Dabei wurde bereits diskutiert, ob ein neuer Ort zu finden ist oder im zweijährigen Turnus der
Veranstaltungsort gewechselt wird. In jedem Fall wird es eine große Umstellung in der
gesamten Organisation bedeuten, da vertraute Räume und Gegebenheiten nicht mehr nutzbar
sind.
Ein herzliches Dankeschön gebührt auch in diesem Jahr Carmen Weirich für die
Unterstützung bei der gesamten Vorbereitung – insbesondere aber für die Anfertigung der
Kurzfassungen (inklusive der Übersetzungen deutsch-englisch/englisch-deutsch) und der nun
vorliegenden Proceedings.
Mit den Proceedings wurde ein repräsentatives Werk mit den neuesten wissenschaftlichen
Ergebnissen aus der europäischen „Kaninchen-Forschung“ vorgelegt. Aus aktuellem Anlass
muss darauf verwiesen werden, dass es sich bei diesem Kongress um eine wissenschaftliche
Tagung handelt und tendenziöse, unwissenschaftliche Beiträge nicht zur Publikation
akzeptiert werden.
Noch ist nicht festgelegt, wo die 21. Internationale Tagung über Haltung und Krankheiten der
Kaninchen, Pelztiere und Heimtiere stattfinden soll. Sie wird im Jahre 2019 organisiert
werden – dann mit einer neuen „Chefin”. Anlässlich der Tagung in Celle fand turnusmäßig
die Mitgliederversammlung der Deutschen Gruppe der WRSA statt. Im Zusammenhang mit
dem bevorstehenden Ruhestand kandidierte Prof. Hoy nicht wieder für das Amt des
Vorsitzenden. Zur neuen Vorsitzenden der Deutschen Gruppe der WRSA wurde Frau Prof.
Dr. Petra Wolf (Universität Rostock), zur Stellvertreterin Dr. Caroline Lang (Universität
Gießen) gewählt. Damit ist der Staffelstab weitergegeben. Ich wünsche dem neuen Team eine
erfolgreiche Arbeit – auch bei der Organisation des nächsten Kongresses, zu dem wir Sie
bereits jetzt sehr herzlich einladen.
Gießen im August 2017 Prof. Dr. Steffen Hoy
3
Wageningen Livestock Research
TOWARDS PART-TIME GROUP-HOUSING OF LACTATING RABBIT DOES?
J. Rommers and K. de Greef
1. INTRODUCTION
Public concern about animal welfare in livestock farming is high in The Netherlands. In
commercial rabbit production, most fatteners are now housed in welfare improved housing
systems nowadays, either in welfare cages or in so called parks, the latter is rewarded with a
price premium by the retail. Additional to this, group-housing of rabbit does is demanded by
politics in the future, and possibly rewarded by market partners.
Aggression between lactating does is the key problem that needs to be tackled before group-
housing of rabbit does is ready to be implemented at rabbit farms (ROMMERS and DE
JONG, 2005, 2010; ANDRIST et al., 2013). Fights between does mainly take place in the
first days after grouping of unfamiliar does when a dominance hierarchy needs to established.
Fights to establish the hierarchy in a group can be seen as adaptive social behaviour of does.
However, excessive fighting between rabbits leading to severe injuries and increased
mortality is unaccepted in terms of animal welfare. Enrichment in the form of hiding places
and escape possibilities helps to redirect attention away from fighting which could help to
prevent injury. Previous experiments at Wageningen Livestock Research (ROMMERS et al.,
2013) showed that panels and PVC pipes seemed to give good opportunities for escape.
Parks equipped with wooden panels and PVC pipes could enable group-housing of rabbit
does with reduced injuries. In a previous pilot at two commercial farms in the Netherlands
(ROMMERS et al., 2014) does were group-housed successfully from 18 days or 21 days of
4
lactation onwards in parks for fatteners. Only superficial to some moderate injuries were
observed. However, mortality of the rabbits during the fattening period was high (up to 25%).
In a recent pilot, the group housing went well for the kits, also after weaning. However, the
low level of aggression among does was not confirmed. Substantial damages were observed
after mixing. Therefore, five successive pilot studies were performed with the objective to
study opportunities to reduce aggression resulting in skin injuries in part-time group housed
lactating does in so-called combi-parks. In these combi-parks does can be kept individually
until group housing. By taking out the side-walls a park is formed and after weaning kits can
be kept in these parks until slaughter.
In the five successive pilot studies different factors were taken into account that could
influence skin injuries of rabbit does. Different pen layouts were tested, providing shelter for
the does to evade the aggressor. Besides park layout also other factors were taken into account
to minimize aggression in group-housed rabbit does. Factors studied were a) a crèche for the
kits as added value for kits as well as for the does; b) the stage of lactation (21 vs 23 days
after kindling) at which the does plus nests were group-housed; c) the number of does in the
group (4 vs. 6 does) and d) relocating does to another park at mixing or leaving them in their
own home range.
2. MATERIALS AND METHODS
Five successive pilots were performed from June 2016 until March 2017 using 144
multiparous lactating does (Hycole), which were artificially inseminated 11d postpartum. The
pilots were conducted at a commercial rabbit farm with 600 does and offspring in 2 similar
compartments each with 88 so called combi-parks for fatteners or 528 individual welfare pens
for does.
A combi-park is composed of 6 individual pens for lactating does. Each pen was 38 cm wide
and 100 cm deep and was open at the top. A slatted platform of 40 cm width was mounted at
25 cm above the floor. The slatted floor and platform were made out of plastic (Meneghin). In
the front part of the pen a nest box could be placed (25 x 38 cm; l x w). Each pen had 2
drinking nipples and a feeder. Roughage was provided in a pressed straw roll that was put in
the pen. Does were group-housed by taking out the side walls creating a combi-park of 2.28 m
x 1.00 m that was open at the top. The side walls of the nest boxes remained in the combi-
5
park (see Figure 1). In the fifth pilot the combi-park was transferred to a regular park for
fatteners, by also taking out the side-walls of the nest boxes that remained in the combi-park
(see Figure 4).
Factors tested in the pilots:
1. Park layout: when does were group-housed several wooden panels and a PVC pipe
were placed underneath the platform, giving the does escape possibilities. In the
successive pilots wooden panels were placed at different positions underneath the
platform. In the combi-parks the plastic panels belonging to the nest boxes remained in
the park. In the fifth pilot these panels were also removed, forming a regular park as
being used in the previous study (ROMMERS et al., 2014).
2. Days of lactation at which does were group-housed: depending on the pilot does were
housed individual until 21 or 23 days of lactating. The earlier mixing age at 18 days of
lactation was considered too early as kits are quite immature and their solid feed intake
is still too low to put them into a group (ROMMERS et al., 2014).
3. Stocking density: 4 or 6 does were group-housed depending on the pilot.
4. Crèche for the kits: parks were equipped with a crèche for the kits or not. The crèche
was formed by using one individual pen at the end of the park. There was a wire wall
that was open for 5 cm above the floor, giving the kits the opportunity to go
underneath the wire into the crèche. Does were not able to go into the crèche and kits
had a safe place in case does were chasing each other.
5. Territory: when mixing, does plus kits were transferred to another park or stayed in the
park were they had been housed individually. The idea behind this is to test whether
aggression among does may be related to does defending the range where their nest
had been.
Table 1 gives an overview of the different factors in the first four pilots with the number of
combi-parks and does involved. Group housing in the first four pilots was performed by
creating a park by removing the separation walls between the individual cages.
When removing the separation walls between the individual cages, small separation parts
remain (the sides of the former nest boxes). In the fifth pilot, the combi-parks were compared
with regular parks for fatteners by also removing the nest box remainders. By this, the long
wall on the front of the combi-park had no remaining obstacles, making it more comparable to

6
regular parks. This final pilot involved 3 original combi-parks (4 does/park) and 6 adapted
parks (3 with 4 does/park and 3 with 6 does/park) and housed 42 multi parous does in total. In
this pilot, the parks did not have a crèche for the kits.
Table 1: Overview of the different treatments in the four successive pilots
Pilot 1* 2 3 4* Total
Stage of
lactation at
group-
housing
23 d 23 d 21 d 21 d 23 d 23 d 23 d 23 d
Density,
no does
6 6 6 6 4 6 4 4
Creche
for kits
Yes none yes none none none none none
Territory Yes yes yes yes yes yes yes none
Number of
combi-
parks
2 2 2 2 3 3 3 3
Total parks 2 2 2 2 3 3 3 3 20
Total does 12 12 12 12 12 18 12 12 102
*In pilot 1 does were not scored at weaning. In pilot 4, 2 does died between mixing and
weaning.
Measurements
Skin injuries: all does were scored for skin injuries at four days after being group-
housed/mixed and at weaning (around 35 days). A scoring system (KALLE, 1994) was used
differentiating 0= none, 1= superficial, 2= moderate and 3= severe (wound) skin injuries on
different parts of the animal (head, ears, body, limbs, tail and genitals).
Because the pilots were performed with a limited number of parks (2 to 9) per pilot, the
results are descriptive and no statistical analyses could be performed.
7
3. RESULTS AND DISCUSSION
Pilot 1.
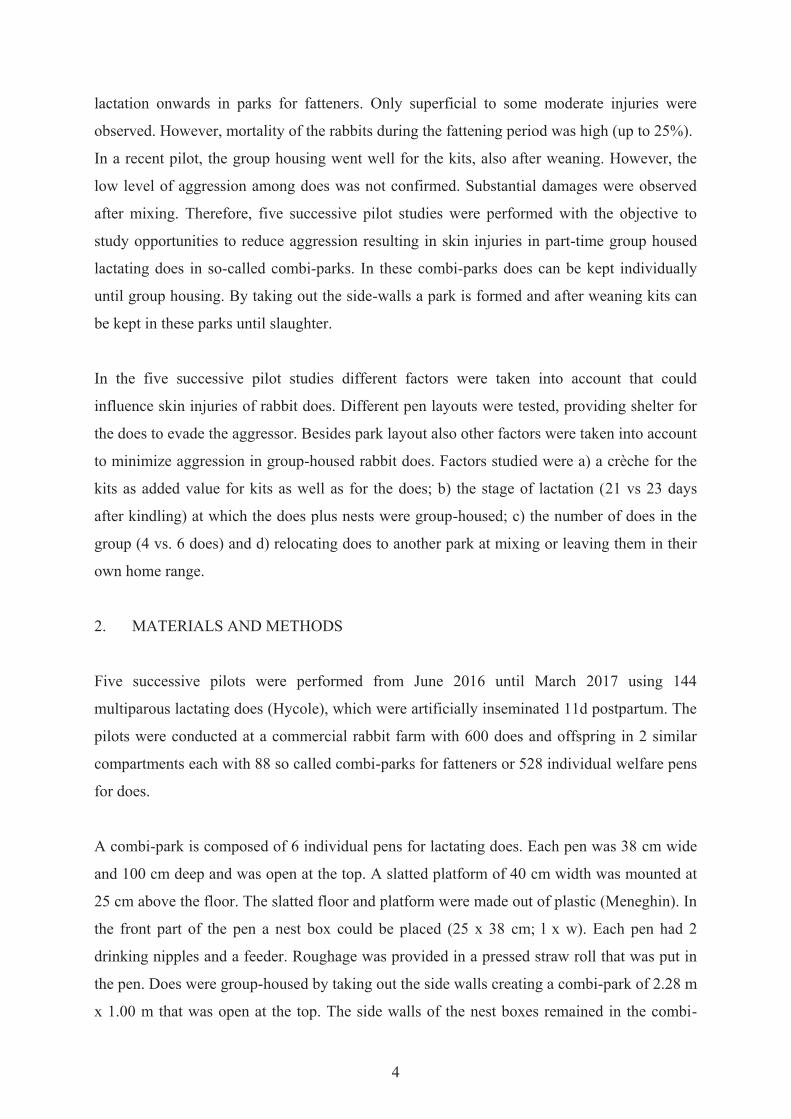
The first pilot was performed to test grouping lactating does in a combi-park from day 23 of
lactation onwards. For this, two combi-parks were used, in which 2 wooden panels in the
longitudinal direction under the platform and 1 wooden panel and a PVC pipe were placed in
the transversal orientation under the platform (see Figure 1).
Both combi-parks had a crèche for the kits. Does were mixed at 23 d of lactation. The
observed skin injuries are listed in Table 2. Some moderate to severely injured does were
observed. The evaluation afterwards brought forward that the wooden panels that were placed
in the longitudinal direction probably offered the does inadequate possibilities to hide, based
on to the severe injuries that had occurred. Also, these panels hindered the farmer in his
control of the animals in the park.
Figure 1: Combi-park layout in pilot 1
Table 2: Number of does injured according to place and severity of the injuries 4 d after
mixing in pilot 1
Score skin injury none superficial moderate severe
Ears 11 1 0 0
Body 5 2 4 1
Legs 11 1 0 0

8
The kits did not seem to use the crèche very often. Kits were mainly observed huddling
together underneath the platform. At 23 d kits seemed enough mature to get along in the
combi-park. No kits died during the fattening period until 11 weeks of age.
Pilot 2.
In the second pilot 6 combi-parks were tested. In all combi-parks all wooden panels were
placed in the width direction underneath the platform (see Figure 2).
Figure 2: Combi-park layout in pilot 2
To allow the does more space the crèche for the kits was left out in part of the combi-parks.
Does were mixed at day 21 or 23 of lactation. Because most of the injuries occur at the body,
we focussed on the body lesions in this and the next pilots. Skin injuries are listed in Table 3.
We still observed moderate to severe injured does. This could be the case because does could
still chase each other on the platform.
Table 3: Number of does injured at the body and severity of the injuries 4 d after mixing and
at weaning in pilot 2
Score skin injury none superficial moderate severe
4 d after mixing 26 6 3 1
At weaning 26 8 2 0
The culling of kits before and after weaning was low. From mixing to weaning average
mortality was 2.0%, during the fattening period average mortality rate was 2.8%. The absence
of a crèche did not seem to have negative effects on the kits. At this farm mixing does at 21d

9
of lactation was evaluated not to be a good moment for the kits. Nest boxes are removed at 21
days causing already some stress for the kits. By creating a combi-park at the same day,
caused the kits too much stress according to the rabbit farmer. Therefore, in the next pilots
mixing occurred at 23d of age.
Pilot 3.
In pilot three, a wooden panel was also placed on top of the platform (see Figure 3) in order to
give the does the opportunity to get out of sight while being chased. The stocking density was
reduced by housing 4 does in part of the combi-parks. No crèche was installed in order to give
the does as much available space as possible. Skin injuries are listed in Table 4. We still
observed moderate to severe injuries after mixing. However at weaning only superficial
injuries were observed.
Figure 3: Combi-park layout in pilot 3
Table 4: Number of does injured at the body and severity of the injuries 4 d after mixing and
at weaning in pilot 3
Score skin injury none superficial moderate severe
4 d after mixing 10 8 9 3
At weaning 16 14 0 0
Mortality of the kits before and after weaning was acceptable. From mixing to weaning
average mortality rate was 1.0%, during the fattening phase average mortality rate was 5.2%
(including the rabbits that could not be delivered to the slaughter plant, because they were too
small, 0.5%).

10
Pilot 4.
In pilot 4, the combi-park layout of pilot 3 was used. Does of 3 combi-parks were placed in a
clean combi-park at mixing, whereas does in the other 3 combi-parks remained in the same
combi-park. In the latter, the scents of the individual pens remained, and therefore does might
protect their “territory” for intruders causing aggression. The skin injuries are listed in Table
5.
Table 5: Number of does injured at the body and severity of the injuries 4 d after mixing and
at weaning in pilot 4
Score skin injury none superficial moderate severe
4 d after mixing 16 3 3 1
At weaning 12 5 5 1
We observed moderate to severe injured does after mixing and at weaning, which was
unexpected regarding the results of pilot 3. Evaluation brought forward the idea whether the
side walls of the nest boxes that remain in the comb-park might hinder the does in their
escape possibilities.
Mortality of kits from mixing until weaning and during the fattening period was low,
respectively 1.4% and 2.8%.
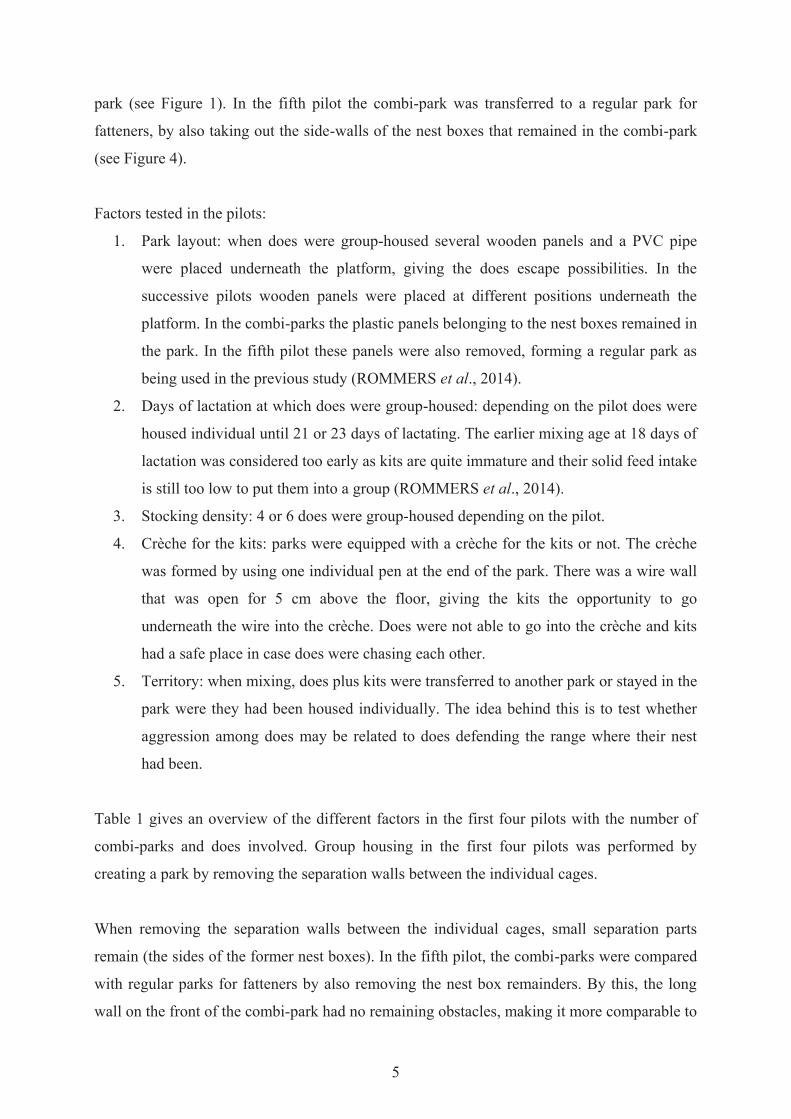
Pilot 5.
In pilot 5 we decided to change the combi-park layout into a regular park layout. This implies
removal of the side walls of the nest boxes that remain in the combi-park after taking out the
side walls of the individual pens, creating a park layout comparable to those commonly used
for fatteners in the Netherlands, and tested in the pilot in 2014 (ROMMERS et al., 2014). In
the adapted parks, stocking density was varied: either 4 or 6 does per park. This results in 3
regular combi-parks with 4 does each, 3 adapted parks with also 4 does each and 3 adapted
parks with 6 does each.
The observed skin injuries at the body at 4 days after mixing and at weaning are presented in
Table 6.
11
Figure 4: Adapted combi-park layout for fatteners in pilot 5: sides of nest boxes removed
Table 6: Number of does injured at the body and severity of the injuries 4 d after mixing and
at weaning in a regular combi-park or the adapted parks in pilot 5
Score skin injury none superficial moderate severe
4 d after mixing
Combi-park 5 3 3 1
Adapted park 24 4 2 0
At weaning
Combi-park 5 2 4 1
Adapted park 25 4 1 0
4. DISCUSSION AND CONCLUSIONS
In the successive pilots, group-housing does in combi-parks resulted repeatedly in some
moderate to severe skin injuries. When, in the final pilot, the plastic side walls of the nest
boxes were removed, creating a layout closer to that in regular fattening parks, the severity of
the skin injuries was reduced and no severe injuries were observed. Presence of the side walls
of the nest boxes in the combined park is thought to hinder does escaping agressive
interaction after mixing.

12
The severity of the skin injuries reduce from 4 d after mixing until weaning. On average, at
weaning less moderate to severe injuries were observed.
Kit mortality from mixing to weaning and during the fattening period was acceptable.
In an upcoming experiment, the pilot 5 will be repeated on a larger scale: comparison of
regular combi-parks with combi-parks where not only the mesh wire walls are removed, but
also the remaining nest box partitions. Ultimate aim is to find a layout which bears the
promise of a low number of skin injuries in does after mixing.
5. SUMMARY
Four successive pilots were performed with the objective to study opportunities to reduce
aggression resulting in skin injuries in part-time group-housed lactating does in so called
combi-parks. Park layout and several factors that could affect skin injuries were taken into
account. Skin injuries were scored four days after mixing (at 27 days of lactation) and before
weaning (at 35 days of lactation). Also, mortality of kits from mixing to weaning and from
weaning to slaughtering was recorded. In the combi-parks, layout and factors did not lead to a
desirable reduction of skin injuries. In every pilot severe and moderate skin injuries were
observed. In a fifth pilot the combi-park was adapted to a layout more comparable to a regular
park for fatteners. This pilot showed a marked contrast between the two parks. This final pilot
suggests that the level of aggression in the earlier pilots is caused by the park lay-out of the
combi-park, thus that combi-parks need to be transferred. In all pilots, skin injuries were less
severe at weaning than four days after mixing and mortality of the rabbits after weaning was
limited. Thus, aggression between does after mixing, resulting in skin injuries, seems the
main technical issue to be solved for successful part time group housing of does with young.
ACKNOWLEDGEMENT
This study was financed by the PPS “Duurzame konijnenhouderij” (TKI-AF-15234) and the
Ministry of Economic Affairs.
We thank Mr and Mrs Slegh at whose farm the pilots were performed. Without their help,
these pilots would not have been possible to perform.

13
REFERENCES
1. ANDRIST, C.A.; BORNE VAN DEN, H.P.; BIGLER, L.M.; BUCHWALDER, T.;
ROTH, B.A. (2013): Epidemiologic survey in Swiss group-housed breeding rabbits.
Extend of lesions and potential risk factors. Preventive Veterinary Medicine 108, 218-
224
2. KALLE, G. (1994): Kaninchen in Gruppenhaltung. DGS 25, 16-20
3. ROMMERS, J.M.; de JONG, I.C. (2005): De haalbaarheid van groepshuisvesting voor
voedsters in de praktijk. ASG rapport ASG 05/102047. Wageningen UR Livestock
Research, Lelystad, The Netherlands
4. ROMMERS, J.M.; de JONG, I.C. (2010): Haltung von Häsinnen: Gruppen- und
Einzelhaltung kombiniert. DGS Magazin 22, 55-58
5. ROMMERS, J.M.; REUVEKAMP, B.F.J.; GUNNINK, H.; de JONG I.C. (2013):
Effect of environmental enrichment and territory on aggression in group-housed rabbit
does. In: Proceedings of the Benelux ISAE conference, 10 October 2013, Sterksel, The
Netherlands, 18
6. ROMMERS, J.M.; de JONG, I.C.; REUVEKAMP, B.; de GREEF, K.H. (2014):
Onderzoek naar groepshuisvesting van voedsters in parken binnen de PPS duurzame
konijnenhouderij. Rapport 749, Wageningen UR Livestock Research, Lelystad, The
Netherlands
Corresponding author:
Wageningen Livestock Research
P.O. Box 338
6700 AH Wageningen
The Netherlands
14
1)Justus-Liebig-Universität Gießen, 2)Università degli Studi di Perugia, 3)Kaposvár University, 4)Centro de Tecnología Animal CITA-IVIA
HAUPTERGEBNISSE DES INTERNATIONALEN
ANIHWA-KANINCHEN-PROJEKTES RABHO
St. Hoy1), A. Dal Bosco2), Zs. Matics3) und A. Villagra4)
Zuchthäsinnen und wachsende Kaninchen werden in vielen Ländern noch in Käfigen mit
Metallgitterrosten gehalten. Das internationale ERA-NET anihwa Kaninchen-Projekt
RABHO wird gemeinsam durch Partner aus Italien (I), Ungarn (H), Spanien (SP) und
Deutschland (D) mit den Zielen durchgeführt:
a) Entwicklung und Prüfung experimenteller Gruppenhaltungssysteme für Häsinnen mit
Jungen
b) Prüfung eines Kombi-Systems für die gemeinsame Haltung von Häsinnen mit ihrem
jeweiligen Wurf bis zum Absetzen und danach Haltung der Absetzkaninchen in
größeren Gruppen bis zur Schlachtung im selben Haltungssystem
c) Entwicklung und Prüfung eines „Park“-Systems für wachsende (Mast-)Kaninchen
jeweils mit einer Vielzahl von Teilaspekten in Kaposvar (H), Perugia (I), Segorbe (ES) und
Gießen (D). Es werden nur die wesentlichsten Ergebnisse des Forschungsnetzwerkes
präsentiert. Auf die Beiträge von MATICS et al. (2017), MASTHOFF et al. (2017a, b) sowie
MARTINO et al. (2017), in denen die Ergebnisse der Arbeitsgruppen aus Kaposvar, Gießen
und Perugia vorgestellt werden, wird ausdrücklich hingewiesen. Die spanische Arbeitsgruppe
konnte noch keine Ergebnisse beisteuern, da die Forschungsstation durch ein Feuer zerstört
wurde.
EXPERIMENTELLE GRUPPENHALTUNG VON HÄSINNEN MIT JUNGEN
In Kitzingen (D) wurde eine experimentelle Gruppenhaltung für vier Häsinnen mit Jungen
installiert und untersucht. Nach den Vorschriften der aktuellen Tierschutz-

15
Nutztierhaltungsverordnung (TierSchNutztV) wurde dabei pro Häsin eine Einzelbox mit einer
Fläche von 6.000 cm2 gebaut, die mit Nestbox, erhöhter Ebene, Futtertrog, Tränke sowie einer
Heuraufe ausgestattet war. Zusätzlich wurde den 4 Häsinnen eine gemeinsam zu nutzende
Gruppenhaltungsfläche von 19.200 cm2 angeboten, die ebenfalls eine erhöhte Ebene,
Futterautomat, Tränke und Heuraufe besaß (Abb. 1 bis 3). Als Durchgang wurde eine
kommerzielle Katzenklappe mit elektronischer Verriegelung genutzt. Die Häsinnen waren
gechippt, sodass jede Häsin nur „ihre“ Nestbox aufsuchen konnte.
= drinker
= feeder
= hay rack
= cat flap
200
cm
30 c
m30
cm
20cm
100
cm80
cm
c
c cccnest box nest boxnest boxnest box
c
elevated platform
group area (19.200 cm²)
cccc
60 cm 60 cm 60 cm 60 cm
240 cm
controlcorridor
50 cm
controlcorridor
50 cm
elevated platform elevated platform elevated platform elevated platform
Abb. 1: Schema der experimentellen Gruppenhaltung
Die Anlage war videoüberwacht, sodass die Aufenthaltsdauer der Häsinnen in den
Einzelbereichen bzw. im Gruppenhaltungsbereich lückenlos über 24 h hinweg ausgewertet
werden konnte. Als Zielgröße neben den Verhaltensuntersuchungen wurde die
Aufzuchtleistung der Häsinnen erfasst (Wurfgröße, Jungtierverluste, Geburts- und
Absetzgewichte). Der Vergleich der Daten fand mit einer Einzelhaltung im selben
Stallgebäude, allerdings nicht immer exakt zur selben Zeit statt.

16
Abb. 2: Experimentelle Gruppenhaltung – Blick auf Eingänge zu den Einzelbereichen
Abb. 3: Experimentelle Gruppenhaltung – Blick in Einzelbereich mit erhöhter Ebene
Die Jungtiere aus der Gruppen- bzw. Einzelhaltung waren bei der Geburt annähernd gleich
schwer – im Mittel 66,0 bzw. 64,6 g. Beim Absetzen war das Gewicht der Jungkaninchen aus
der Einzelhaltung mit 0,87 kg signifikant (p < 0,05) höher als das aus der Gruppenhaltung
(0,75 kg). Die Jungtierverluste bis zum Absetzen waren in der Gruppenhaltung inakzeptabel
höher (18,1 %) als bei einzeln gehaltenen Häsinnen im selben Stall (8,5 %, p < 0,05) (Tab. 1).
Ansätze zur Reduzierung der Jungtierverluste ergeben sich aus einer verbesserten Gestaltung
der Vorderfront des Einzelbereiches. Durch die vorhandene Verstäbung war es für die
Jungtiere möglich, das Nest zu verlassen. Möglicherweise haben einzelne Jungtiere nicht
wieder rechtzeitig zum Säugen zurück in das Nest gefunden, sodass damit die Jungtierverluste
anstiegen.
Tab. 1: Ausgewählte Ergebnisse der Aufzuchtleistung von Häsinnen aus der Einzel- oder der
experimentellen Gruppenhaltung
Parameter Gruppenhaltung Einzelhaltung
Geburtsgewicht (g) 66,0 64,6
Absetzgewicht (kg) 0,75 0,87 *
Jungtierverluste bis Absetzen (%) 18,1 8,5 *
* p < 0,05
17
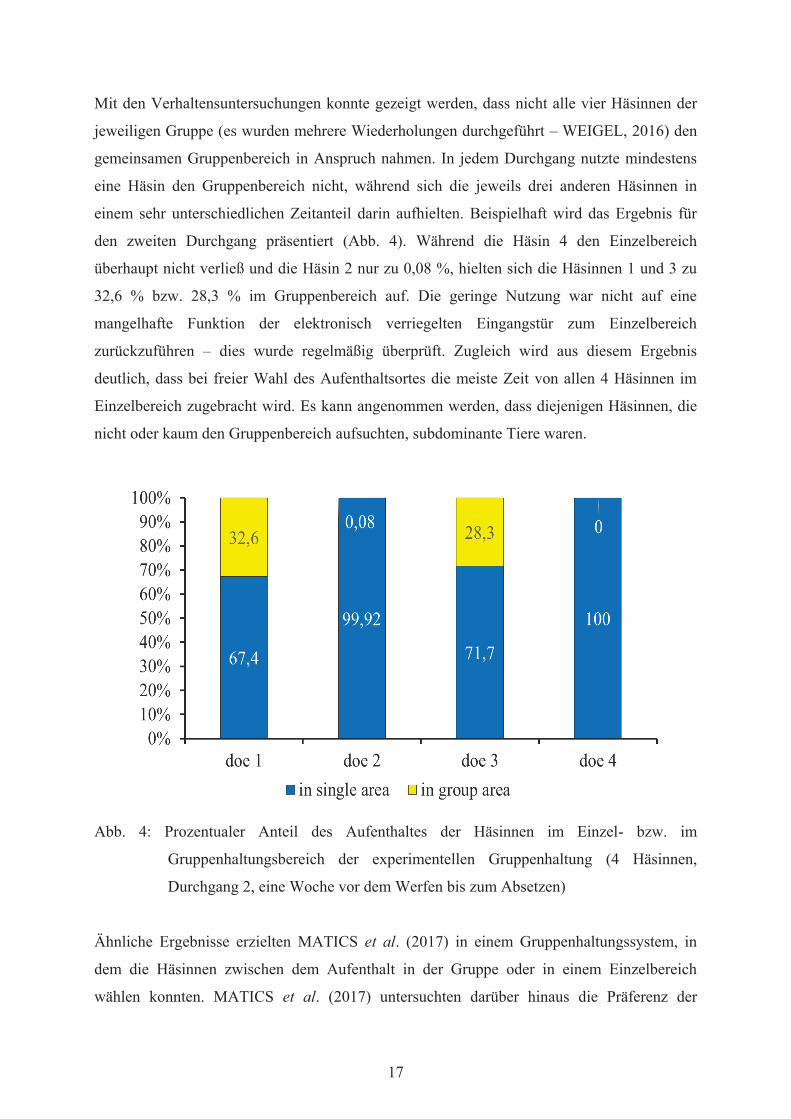
Mit den Verhaltensuntersuchungen konnte gezeigt werden, dass nicht alle vier Häsinnen der
jeweiligen Gruppe (es wurden mehrere Wiederholungen durchgeführt – WEIGEL, 2016) den
gemeinsamen Gruppenbereich in Anspruch nahmen. In jedem Durchgang nutzte mindestens
eine Häsin den Gruppenbereich nicht, während sich die jeweils drei anderen Häsinnen in
einem sehr unterschiedlichen Zeitanteil darin aufhielten. Beispielhaft wird das Ergebnis für
den zweiten Durchgang präsentiert (Abb. 4). Während die Häsin 4 den Einzelbereich
überhaupt nicht verließ und die Häsin 2 nur zu 0,08 %, hielten sich die Häsinnen 1 und 3 zu
32,6 % bzw. 28,3 % im Gruppenbereich auf. Die geringe Nutzung war nicht auf eine
mangelhafte Funktion der elektronisch verriegelten Eingangstür zum Einzelbereich
zurückzuführen – dies wurde regelmäßig überprüft. Zugleich wird aus diesem Ergebnis
deutlich, dass bei freier Wahl des Aufenthaltsortes die meiste Zeit von allen 4 Häsinnen im
Einzelbereich zugebracht wird. Es kann angenommen werden, dass diejenigen Häsinnen, die
nicht oder kaum den Gruppenbereich aufsuchten, subdominante Tiere waren.
Abb. 4: Prozentualer Anteil des Aufenthaltes der Häsinnen im Einzel- bzw. im
Gruppenhaltungsbereich der experimentellen Gruppenhaltung (4 Häsinnen,
Durchgang 2, eine Woche vor dem Werfen bis zum Absetzen)
Ähnliche Ergebnisse erzielten MATICS et al. (2017) in einem Gruppenhaltungssystem, in
dem die Häsinnen zwischen dem Aufenthalt in der Gruppe oder in einem Einzelbereich
wählen konnten. MATICS et al. (2017) untersuchten darüber hinaus die Präferenz der

18
Häsinnen für verschiedene Nestmaterialien und das Sexualverhalten, wenn ein Rammler
gemeinsam mit den Häsinnen in der Gruppe gehalten wurde.
SEMI-GRUPPENHALTUNG VON HÄSINNEN MIT JUNGTIEREN
International gibt es Entwicklungen von der dauerhaften Einzelhaltung der Häsinnen hin zu
einem Semi-Gruppenhaltungssystem. In Perugia (I) wird ein Kolonie-System für die Semi-
Gruppenhaltung von Häsinnen aus der Sicht von Verhalten, physiologischen Parametern und
Leistungsdaten untersucht (Abb. 5). Die Häsinnen werden beginnend 5 Tage vor der Geburt
der Jungtiere bis eine Woche danach einzeln gehalten. Dann werden die Zwischenwände
zwischen den Einzelboxen entfernt und die Gruppenhaltung von Häsinnen mit Jungen
beginnt. Nach dem Absetzen mit einem Alter von 30 Tagen werden die Häsinnen in Boxen
oberhalb der Jungtiere verbracht. Die Jungtiere verbleiben in dem bisherigen Bereich –
allerdings in größeren Gruppen aus mehreren Würfen. In den ersten Untersuchungen wurden
keine Unterschiede in der reproduktiven Leistung sowie in Zahl und Gewicht der Absetzer im
Vergleich zur traditionellen Einzelhaltung der Häsinnen mit Jungen gefunden.
Abb. 5: Schema eines Koloniesystems für die Semi-Gruppenhaltung (DAL BOSCO 2017,
persönl. Mitteilung)
KOMBISYSTEM FÜR HÄSINNEN MIT JUNGEN
Bei dem neuartigen Kombisystem für Häsinnen mit Jungen (Meneghin, I) werden die
Häsinnen mit Jungtieren zunächst jeweils einzeln gehalten. Als Besonderheit verlassen die
Häsinnen und nicht die Jungtiere nach dem Absetzen das Haltungssystem. Es werden die

19
Seitenwände zwischen einzelnen Kompartimenten und die Nestboxen herausgenommen, und
die Jungtiere werden in großen Gruppen (6 bis 8 Würfe zusammen) bis zur Schlachtung
gehalten. Hintergrund ist unter anderem die Flächendegression, die nach der deutschen
TierSchNutztV notwendig wird, um überhaupt noch wirtschaftlich Kaninchenmast betreiben
zu können. Das Kombisystem besitzt einen Rostenboden mit erhöhter Sitzebene, Nestbox,
Heuraufe, Tränke und Futterautomat in jeder Einzelbox (Abb. 6).
Abb. 6: Kombisystem nach Ausstallung der Häsinnen und Herausnahme der Zwischenwände,
die Position dieser ist durch die Seitenwände der ehemaligen Nestboxen zu erkennen
In unseren Untersuchungen wurden 4 oder 8 Würfe gemeinsam bis zur Schlachtung gehalten.
Die Vorteile des Kombisystems sind wie folgt zu definieren:
Unterbrechung von Infektionsketten nach Ausstallung der Mastkaninchen zur Schlachtung,
Reinigung und Desinfektion im leeren Stall nach Ausstallung der Masttiere,
höchstmögliche Auslastung der Stallplätze,
es werden nur zwei Stallabteile benötigt,
die Häsinnen werden umgestallt, nicht die Absetzer,
daher gibt es wenig Absetzstress – die Jungkaninchen bleiben in ihrer gewohnten
Umgebung
und es bestehen eine gute Übersichtlichkeit und Planbarkeit der Produktionsabläufe – im
Prinzip auf Jahre hinaus.

20
Folgende Nachteile können auftreten:
die Mastdauer ist sehr kurz – die Jungtiere werden mit 76 Tagen geschlachtet,
daher müssen sich die Umgebungsbedingungen, die Tiergesundheit und die Fütterung auf
einem hohen Niveau befinden, um hohe Zunahmen von Geburt bis Schlachtung bei sehr
guter Tiergesundheit zu erzielen,
die Endmasse und der Schlachterlös sind geringer als bei längerer Mastdauer, es muss ein
Markt vorhanden sein, der diese leichten Schlachttiere abnimmt,
die Zeit für Reinigung und Desinfektion ist sehr kurz, allerdings aber auch exakt planbar.
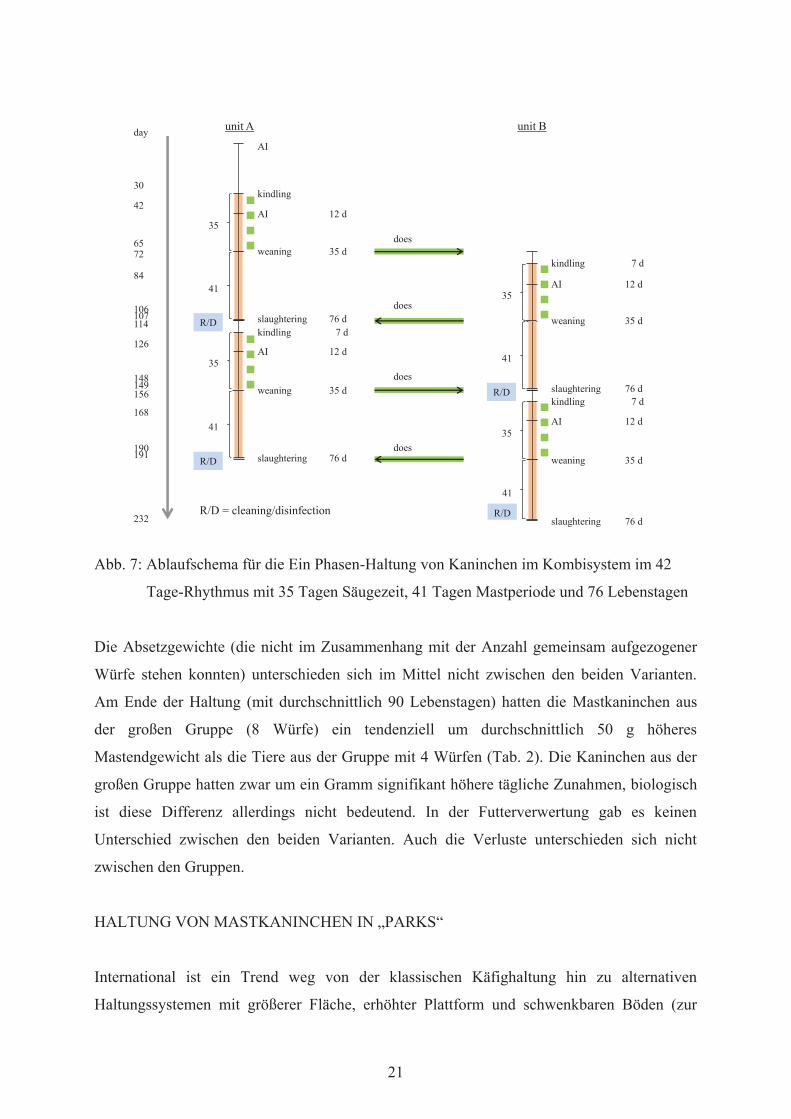
Bei konsequenter Anwendung dieses Systems wird eine Ein Phasen-Haltung von der Geburt
der Kaninchen bis zu ihrer Schlachtung in einem 42 Tage-Rhythmus mit 35 Tagen Säugezeit,
41 Tagen Mastperiode und somit 76 Lebenstagen durchgeführt (Abb. 7). Das Kombisystem
kann auch in anderen Rhythmen durchgeführt werden, wobei dann entweder die Häsinnen
früher als 11 Tage nach dem Absetzen wieder belegt werden müssten (was in Deutschland
nicht zulässig ist) oder ein drittes Stallabteil nötig werden würde und die Abläufe deutlich
komplizierter zu organisieren wären.
In unseren Untersuchungen verglichen wir im Kombisystem (Meneghin, I) die gemeinsame
Haltung von 4 oder 8 Würfen nach dem Absetzen bis zur Schlachtung. Insgesamt konnten wir
77 Würfe mit 644 Absetzern und 55 Tagen Mastdauer analysieren. Da in Kitzingen keine
zweite Einheit (für die Häsinnen, die nach dem Absetzen das Haltungssystem verlassen
müssen) vorhanden war, wurde das Zyklogramm nicht so konsequent wie beschrieben
angewendet, sondern es wurde eine im Mittel 55-tägige Mastdauer praktiziert. Nach
Ausstallung der Masttiere zur Schlachtung begann dann erst der nächste Durchgang mit der
Einstallung der tragenden Häsinnen in das Kombisystem.
Tab. 2: Leistungen und Verluste von Kaninchen in einem Kombisystem mit 4 oder 8 Würfen
nach dem Absetzen in jeweils einer Gruppe
8 Würfe 4 Würfe p
n 261 383 Absetzgewicht (kg) 0,88 0,86 - Endgewicht (kg) 2,97 2,92 - Lebenstagszunahmen (g) 38 37 p < 0,05 Futterverwertung (kg/kg) 1 : 3,62 3,69 - Tierverluste (%) 6,2 7,1 -
21
does
does
does
does
AI
kindling
AI
weaning
3512 d
35 d
AI
weaning
35
kindling 7 d
12 d
35 d
day
30
42
6572
84
106107114
126
148149156
190191
168
232
unit A unit B
41
slaughtering R/D 76 d
slaughtering
41
R/D 76 d
kindling
AI
weaning
35
7 d
12 d
35 dkindling
AI
weaning
35
7 d
12 d
35 d
slaughtering
41
R/D76 d
slaughtering
41
R/D 76 d
R/D = cleaning/disinfection
Abb. 7: Ablaufschema für die Ein Phasen-Haltung von Kaninchen im Kombisystem im 42
Tage-Rhythmus mit 35 Tagen Säugezeit, 41 Tagen Mastperiode und 76 Lebenstagen
Die Absetzgewichte (die nicht im Zusammenhang mit der Anzahl gemeinsam aufgezogener
Würfe stehen konnten) unterschieden sich im Mittel nicht zwischen den beiden Varianten.
Am Ende der Haltung (mit durchschnittlich 90 Lebenstagen) hatten die Mastkaninchen aus
der großen Gruppe (8 Würfe) ein tendenziell um durchschnittlich 50 g höheres
Mastendgewicht als die Tiere aus der Gruppe mit 4 Würfen (Tab. 2). Die Kaninchen aus der
großen Gruppe hatten zwar um ein Gramm signifikant höhere tägliche Zunahmen, biologisch
ist diese Differenz allerdings nicht bedeutend. In der Futterverwertung gab es keinen
Unterschied zwischen den beiden Varianten. Auch die Verluste unterschieden sich nicht
zwischen den Gruppen.
HALTUNG VON MASTKANINCHEN IN „PARKS“
International ist ein Trend weg von der klassischen Käfighaltung hin zu alternativen
Haltungssystemen mit größerer Fläche, erhöhter Plattform und schwenkbaren Böden (zur
22
besseren Reinigung und Desinfektion) zu erkennen. Vor diesem Hintergrund ging es auch im
anihwa-Forschungsnetzwerk darum, ein neues Haltungssystem („Kaninchenpark“) analog zu
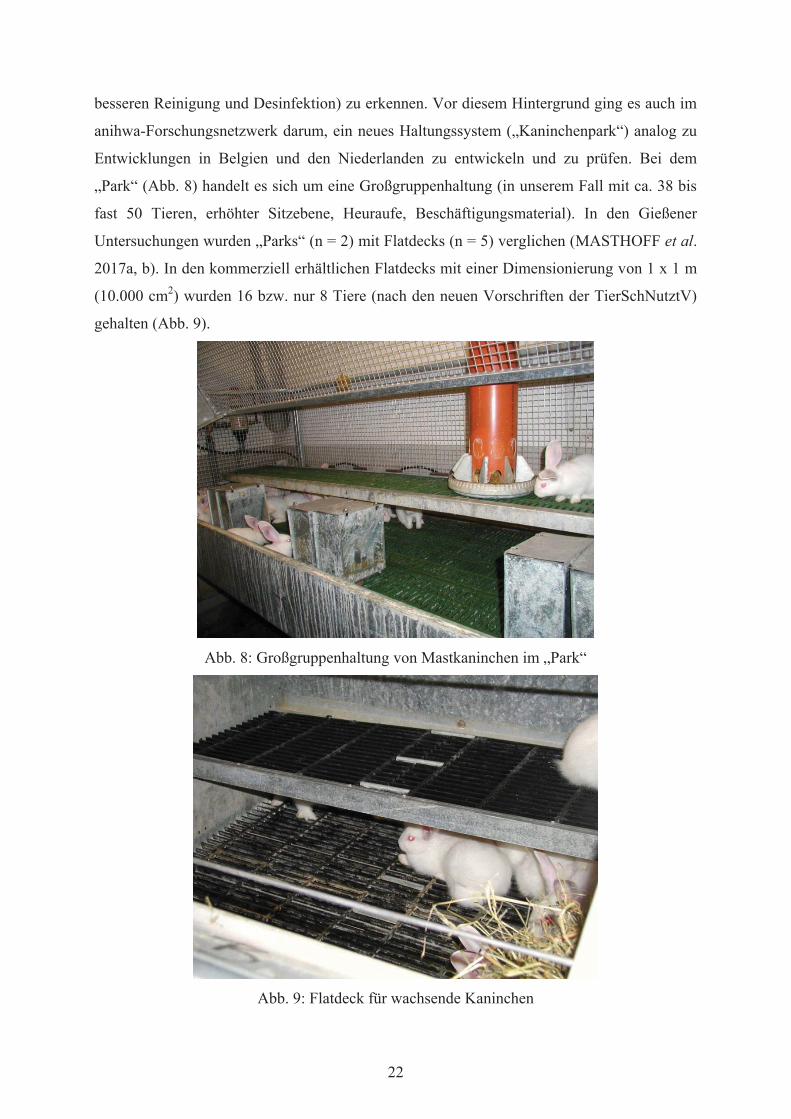
Entwicklungen in Belgien und den Niederlanden zu entwickeln und zu prüfen. Bei dem
„Park“ (Abb. 8) handelt es sich um eine Großgruppenhaltung (in unserem Fall mit ca. 38 bis
fast 50 Tieren, erhöhter Sitzebene, Heuraufe, Beschäftigungsmaterial). In den Gießener
Untersuchungen wurden „Parks“ (n = 2) mit Flatdecks (n = 5) verglichen (MASTHOFF et al.
2017a, b). In den kommerziell erhältlichen Flatdecks mit einer Dimensionierung von 1 x 1 m
(10.000 cm2) wurden 16 bzw. nur 8 Tiere (nach den neuen Vorschriften der TierSchNutztV)
gehalten (Abb. 9).
Abb. 8: Großgruppenhaltung von Mastkaninchen im „Park“
Abb. 9: Flatdeck für wachsende Kaninchen

23
Bei dem Parksystem wurden sowohl der Boden als auch die erhöhte Sitzebene schwenkbar
angeordnet, damit nach der Ausstallung der Tiere die Reinigung und Desinfektion von unten
erfolgen kann. Außerdem wurde ein Spalt von 2 cm vom Fußboden zu den Wänden
eingehalten, damit Kotpellets hindurchfallen können.
Tab. 3: Mastleistung in großen („Parks“) oder kleinen (Flatdecks) Gruppen
Flatdecks „Parks“ p
Absetzgewicht (kg) 1,01 1,01 -
Mastendgewicht (kg) 2,97 2,89 p < 0,05
Tägliche Zunahmen (g) 38,4 36,8 p < 0,05
Verluste (%) 3,3 3,4 -
Futterverwertung (kg/kg) 1 : 3,72 3,81 -
Die Tiere, die von einem Züchter stammten, wurden bei der Einstallung einzeln gewogen und
paritätisch nach Gewicht und Geschlecht ausgeglichen auf die beiden Haltungsvarianten
aufgeteilt. Damit ist es plausibel, dass in beiden Varianten die Tiere ein identisches
Absetzgewicht (= Einstallgewicht) aufwiesen. Die Tiere in den Flatdecks, also in den
kleineren Gruppen, erzielten in der im Mittel 8-wöchigen Mastperiode mit 38,4 g signifikant
höhere tägliche Zunahmen als die Vergleichstiere in den Parks mit dem größeren
Gruppenverband (36,8 g, p < 0,05). Daraus resultierte ein statistisch gesichert höheres
Mastendgewicht in den Flatdecks (im Mittel 2,97 kg) im Vergleich zu den Tieren in den Parks
(2,89 kg, p < 0,05). Bei der Futterverwertung und bei den Jungtierverlusten gab es keine
Differenzen zwischen den geprüften Varianten (Tab. 3).
Ein weiterer Focus lag auf der Prüfung des Einflusses der Fußbodengestaltung auf
Verschmutzungen und Verletzungen. Ein Fußboden mit 50 % Perforation auf der Grundfläche
und 10 % Perforation auf der erhöhten Sitzebene (nach den Vorgaben der TierSchNutztV)
führte zu der signifikant höchsten Quote von verschmutzten Tieren (99,8 %) und zu dem
statistisch gesichert höchsten Prozentsatz an Verletzungen (25,3 %), zumeist an den
Hinterbeinen. Die geringste Rate verschmutzter und verletzter Tiere war auf einem Fußboden
mit 75 %-iger Perforation nachzuweisen (15,8 % verschmutzte und 0,7 % gering- bis
mittelgradig verletzte Tiere, p < 0,05) (MASTHOFF et al., 2017a).
24
SCHLUSSFOLGERUNGEN
Mit dem RABHO-Projekt wurde eine internationale Zusammenarbeit realisiert, um die
Haltungsbedingungen für Häsinnen und Mastkaninchen zu verbessern. Unter den geprüften
Varianten befinden sich vielversprechende Ansätze, die ein höheres Tierschutz-Niveau mit
einer betriebswirtschaftlich machbaren Umsetzung verbinden. Im Einzelnen können folgende
Schlussfolgerungen abgeleitet werden:
1. Die ständige Gruppenhaltung von Häsinnen mit Jungen ist durch eine große Zahl an
Problemen (insbesondere durch hohe Jungtierverluste, aggressives Verhalten der Häsinnen
untereinander, schwierige Tierkontrolle, Ersatz ausgeschiedener Häsinnen,
arbeitswirtschaftliche Aufwendungen u.a.) zu charakterisieren und kann (noch) nicht
empfohlen werden. Die Semi-Gruppenhaltung wird intensiv untersucht, aber die Probleme,
die durch das Umgruppieren bzw. den Austausch von Häsinnen entstehen, sind noch nicht
gelöst.
2. Die Einzelhaltung von Häsinnen mit Jungen wird das dominierende Haltungssystem auch
in Zukunft bleiben, die weitere Entwicklung konzentriert sich auf die Ausgestaltung der
Haltungsumgebung („enrichment“).
3. Das Kombisystem für Häsinnen mit Jungtieren verspricht viele Vorteile aus der Sicht von
Hygiene (Realisierung des Alles rein-Alles raus-Verfahrens mit zwischengeschalteter
Reinigung und Desinfektion, Unterbrechung von Infektionsketten) und Verhalten bzw.
Welfare (Absetzkaninchen bleiben in ihrer gewohnten Umgebung, Häsinnen werden
umgesetzt) und kann nach einem Zyklogramm planbar gestaltet werden, sofern mindestens
zwei identische Einheiten (= Abteile) zur Verfügung stehen.
4. Das „Parksystem” hat keine Nachteile aus der Sicht der Tiergesundheit, wenn ein
Kunststoff-Fußboden mit einem Perforationsgrad von 50 bis 75 % auf der Grundfläche und
von 75 % vor allem auf der erhöhten Ebene angewendet werden darf.
5. Die Fußbodengestaltung nach der im Jahr 2014 novellierten Tierschutz-
Nutztierhaltungsverordnung (15 % Perforation auf der erhöhten Ebene) ist wegen des
hohen Anteils verschmutzter, vor allem aber verletzter Tiere tierschutzwidrig und ein
Verstoß gegen § 1 Tierschutzgesetz.
Es bleibt zu hoffen, dass wichtige Erkenntnisse aus dem anihwa-Projekt in die Praxis
umgesetzt werden und damit nicht nur das Wohlbefinden der Tiere, sondern auch die
Akzeptanz der intensiven Kaninchenhaltung in der öffentlichen Diskussion verbessert
werden.

25
DANKSAGUNG
Die Autoren danken dem anihwa-Büro für die Förderung des anihwa-Verbundprojektes
RABHO. Ein besonderer Dank geht an das Bundesministerium für Forschung und
Entwicklung für die stets gewährte unbürokratische Unterstützung des Vorhabens.
LITERATUR
MARTINO, M.; MATTIOLI, S.; CAMBIOTTI, V.; MOSCATI, L.; CASTELLINI, C.; DAL
BOSCO, A. (2017): Assessing the motivation of rabbit does to social contact or self-
seclusion. Proc. 20th Internat. Symposium on Housing and Diseases of Rabbits,
Furproviding animals and Pet animals. May 17 - 18, 2017 Celle, 169-173
MASTHOFF, T.; LANG, C.; HOY, ST. (2017a): Einfluss der Fußbodengestaltung auf das
Auftreten von Verschmutzungen und Fußläsionen bei Mastkaninchen. Proc. 20th Internat.
Symposium on Housing and Diseases of Rabbits, Furproviding animals and Pet animals.
May 17 - 18, 2017 Celle, 53-61
MASTHOFF, T.; LANG, C.; HOY, ST. (2017b): Untersuchungen zum Einfluss der Haltung
von Mastkaninchen in Parks oder Flatdecks auf die Mastleistung. Proc. 20th Internat.
Symposium on Housing and Diseases of Rabbits, Furproviding animals and Pet animals.
May 17 - 18, 2017 Celle, 153-159
MATICS, ZS.; SZENDRŐ ZS.; RADNAI, I.; FARKAS, T.P.; KASZA, R.; KACSALA, L.;
NAGY, I.; SZABÓ, R.T.; TERHES, K.; GERENCSÉR, ZS. (2017): ANIHWA –
Experimental results at Kaposvar University. Proc. 20th Internat. Symposium on Housing
and Diseases of Rabbits, Furprovinding animals and Pet animals, May 17-18, 2017 Celle,
27-36
WEIGEL, K. (2016): Untersuchung eines experimentellen Gruppenhaltungssystems für
tragende und säugende Häsinnen. MSc thesis, Univ. Gießen, Institut für Tierzucht und
Haustiergenetik 2016

26
Anschriften der Verfasser:
Prof. Dr. Steffen Hoy
Justus-Liebig-Universität Gießen, Institut für Tierzucht und Haustiergenetik,
Leihgesterner Weg 52, D-35392 Gießen,
Prof. Dr. Alessandro Dal Bosco
Università degli Studi di Perugia,
Dipartimento di Scienze Agrarie, Alimentari e Ambientali
Dr. Zsolt Matics
Kaposvár University,
Faculty of Agricultural and Environmental Sciences,
H-7400 Kaposvár, Guba S. str. 40., Hungary,
Dr. Arantxa Villagrá García
Centro de Tecnología Animal CITA-IVIA,
12400, Segorbe, Polígono La Esperanza 100

27
1Faculty of Agricultural and Environmental Sciences, Kaposvár University 2Faculty of Agricultural and Environmental Sciences, Szent István University
ANIHWA – EXPERIMENTAL RESULTS AT KAPOSVÁR UNIVERSITY
Zs. Matics1, Zs. Szendrő1, I. Radnai1, T.P. Farkas1, R. Kasza1, L. Kacsala1, I. Nagy1,
R.T. Szabó2, K. Terhes1 and Zs. Gerencsér1
1. INTRODUCTION
Within the framework of an international project (RABHO – Development and assessment of
alternative animal-friendly housing systems for rabbit does with kits and growing rabbits)
German, Italian, Spanish and Hungarian research groups work together to examine new
housing systems of rabbit does. The Hungarian part of the project consists of the following
examinations:
1. Mating and aggressive behaviour in group housing of rabbit does (GERENCSÉR et
al., 2016; SZENDRŐ et al., 2016);
2. Preference of rabbit does among different nest materials (FARKAS et al., 2016a);
3. Effect of different nest materials on performance of rabbit does (FARKAS et al.,
2016b);
4. Location and behaviour of group housed rabbit does in four interconnected cages
(FARKAS et al., 2016c);
5. Location and behaviour of group housed rabbit does in a huge pen with four identical
small cages and a common area (FARKAS et al., 2017).

28
2. EXPERIMENTS – RESULTS
2.1. Mating and aggressive behaviour in group housing of rabbit does
The aim of the experiment was to investigate the mating behaviour and the frequency of
aggressiveness in group housed does depending on the rank order.
The experiment was conducted at the Kaposvár University using maternal line (Pannon Ka)
rabbit does of the Pannon Rabbit Breeding Program. Does at the same age (17 weeks,
homogenous group, HOM) or different ages (three does were 17 weeks old and one doe was
one year old; heterogeneous group, HET) were housed according to the recommendation of
an animal protection group (Vier Pfoten). Four does and one buck were placed in each pen,
with a basic area of 7.7 m2 (Figure 1). Within the pen, half part of the floor was covered with
straw, whereas the other part was made of plastic-mesh. Every pen was equipped with a large
sized feeder, five nipple drinkers, hay rack, four wooden nest boxes and a plank tube for
hiding.
Figure 1: Layout of group-housing system for four does and one buck
The temperature in the room was 15-17 oC, and it was illuminated by natural light, and
artificial lighting was used to achieve 16 h daily lighting. Rabbits received a commercial
29
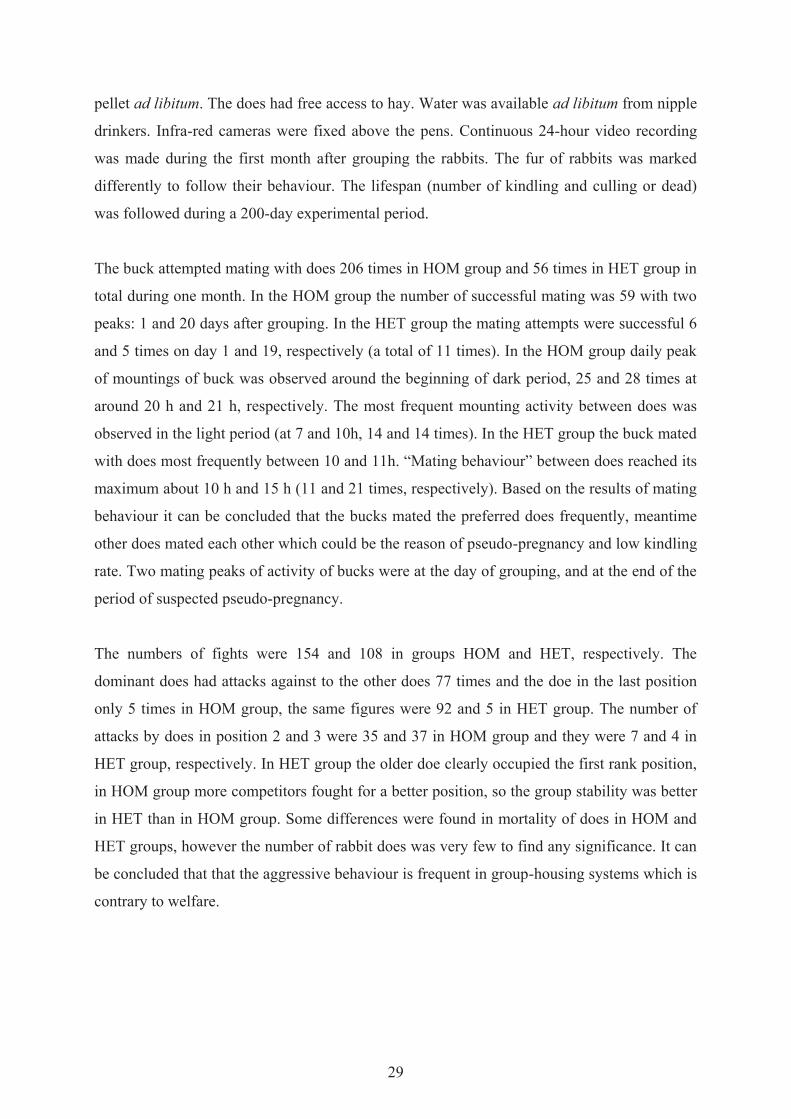
pellet ad libitum. The does had free access to hay. Water was available ad libitum from nipple
drinkers. Infra-red cameras were fixed above the pens. Continuous 24-hour video recording
was made during the first month after grouping the rabbits. The fur of rabbits was marked
differently to follow their behaviour. The lifespan (number of kindling and culling or dead)
was followed during a 200-day experimental period.
The buck attempted mating with does 206 times in HOM group and 56 times in HET group in
total during one month. In the HOM group the number of successful mating was 59 with two
peaks: 1 and 20 days after grouping. In the HET group the mating attempts were successful 6
and 5 times on day 1 and 19, respectively (a total of 11 times). In the HOM group daily peak
of mountings of buck was observed around the beginning of dark period, 25 and 28 times at
around 20 h and 21 h, respectively. The most frequent mounting activity between does was
observed in the light period (at 7 and 10h, 14 and 14 times). In the HET group the buck mated
with does most frequently between 10 and 11h. “Mating behaviour” between does reached its
maximum about 10 h and 15 h (11 and 21 times, respectively). Based on the results of mating
behaviour it can be concluded that the bucks mated the preferred does frequently, meantime
other does mated each other which could be the reason of pseudo-pregnancy and low kindling
rate. Two mating peaks of activity of bucks were at the day of grouping, and at the end of the
period of suspected pseudo-pregnancy.
The numbers of fights were 154 and 108 in groups HOM and HET, respectively. The
dominant does had attacks against to the other does 77 times and the doe in the last position
only 5 times in HOM group, the same figures were 92 and 5 in HET group. The number of
attacks by does in position 2 and 3 were 35 and 37 in HOM group and they were 7 and 4 in
HET group, respectively. In HET group the older doe clearly occupied the first rank position,
in HOM group more competitors fought for a better position, so the group stability was better
in HET than in HOM group. Some differences were found in mortality of does in HOM and
HET groups, however the number of rabbit does was very few to find any significance. It can
be concluded that that the aggressive behaviour is frequent in group-housing systems which is
contrary to welfare.
30
2.2. Preference of rabbit does among different nest materials
The aim of the experiments was to examine which nest materials were preferred by
multiparous does to build the nest.
The experiments were conducted at Kaposvár University using multiparous Pannon White
rabbit does between the third and fifth parturition. The temperature varied between 15 and
18 ºC, and 16-hour daily lighting was applied. The rabbit does consumed commercial pellet
ad libitum and water was available from nipple drinkers. In each 1.0 x 0.91 m sized pen one
rabbit doe and one empty nest box (0.37 x 0.23 m and 0.31 m height) and three 0.30 x 0.40 x
0.125 m hay racks were placed with 400 g nest materials: hay, straw or wooden thin long
fibre material (Lignocel®, J.Rettenmaier&Söhne GmbH) in random order in the experiment 1
(n=27 does). In the case of experiment 2 (n=20 does) two hay racks were placed with hay or
straw in the same schema. The hay racks were made of wire mesh (hole size: 25 x 50 mm and
the felled big holes were 50 x 250 mm).
The experiment started on the 27th day of pregnancy. During the preference test we observed
which nest material was preferred by rabbit does for nest building. The nests were visually
assessed on the day of parturition and at the same time photos were taken as documentation
from every nest. The nests which contained other nest material in more than 10% quantity
were assessed as mixed nest.
Experiment 1: The numbers of nest carrying occasions were significantly higher only on the
day of parturition in the case of every nest materials. The number of nest carrying
occasions/hour from Lignocel® hay rack were higher than that of hay or straw on day 1, 2
and 4 of observation. None amount of straw and very little hay was carried on day 2 and 3.
Every nest contained Lignocel®. 88.9% of does kindled in pure Lignocel®, another 7.4% of
does mixed it with hay and 3.7% mixed it with straw.
Experiment 2: In every day the nest material carrying occasions were significantly higher in
the case of straw, and they were the highest on the day of parturition. More does used purely
straw (65%) than hay (20%) in the completed nests, and in 15% of cases, rabbit does used
both materials to build the nest. 80% of the nests contained straw, 35% contained hay (purely
or mixed).

31
2.3. Effect of different nest materials on performance of rabbit does
The experiment was conducted at Kaposvár University. Pannon Ka and Pannon White rabbit
does (n=200) were randomly divided into four groups according to the nest materials used for
bedding the nest tray: hay (n=50), straw (n=50), wood shavings (n=50), Lignocel®
(J.Rettenmaier&Söhne GmbH; n=50). The temperature varied between 15-18 ºC, and 16-hour
lighting was applied. The rabbit does consumed commercial pellet ad libitum, and water was
available from nipple drinkers.
Rabbit does were housed in 0.60 x 0.54 m sized, and 0.30 m high flat-deck cages equipped
with 0.54 x 0.27 m nest boxes including the 0.37 x 0.20 m sized, 0.155 m deep nest tray. The
nest tray was made of plastic perforated underneath.
The experiment started on the 27th day of pregnancy, so the rabbit does had at least three days
for preparing the nest.
Photos of the nests were taken on 4-5 days after parturition, which were assessed by skilled
experts on scores between 1 and 5. The qualities of the nests were evaluated according to
SAWIN and CRARY (1953), and DENENBERG et al. (1963):
1: hair completely missing, no nest shape, kits were uncovered;
2: small amount of hair, shapeless nest, kits were hardly covered;
3: average amount of hair, meanly shaped nest, kits were partly covered;
4: sufficient amount of hair, well-shaped nest which covered the kits well;
5: large amount of hair, perfectly shaped nest which covered the kits completely.
The quality and contamination of the nest material were checked daily. The contaminated nest
materials were exchanged. Litter sizes (total, alive, stillborn, after equalization, at 21 day) and
kit’s mortality were recorded. The 21-day litter weights were measured, and the individual
weights were calculated.
The quality of nests made of different materials was significantly different: the hay nest
received the best quality scores (4.11), which were followed by straw (3.76), Lignocel®
(3.56) and wood shavings (3.13). The nest material did not influence the litter size, the litter-
and the individual weight at day 21, and the suckling mortality between 0 and 21 days. It was

32
concluded that the rabbit does built the best nest quality by hay and the worst by wood
shavings, however the nest material did not influence the performance of does; so the
commonly used wood shavings could be good nest material for the practice.
2.4. Location and behaviour of group housed rabbit does in four interconnected cages
The aim of the experiment was to test a group housing system, examination of location,
aggressive and sexual behaviour of rabbit does in four interconnected cages. The experiment
was conducted at Kaposvár University with non-pregnant Pannon White rabbit does (n=16).
The temperature was 15-18 ºC, and 16-hour daily lighting was applied in the room. The rabbit
does consumed commercial pellet ad libitum and water was available from spoon drinkers. A
1.00 x 1.75 m open top pen (Figure 2) was divided into four individual cages (0.5 x 0.875 m),
and four does were placed in it. At the beginning of the experiment the does were placed in
the closed cages, individually, to train the does to use their own cages. Three days later the
doors among the cages were opened to allow the does move freely, and the experiment lasted
for 14 days. 24-h video recordings were made on days 1, 3, 7 and 14 after opening the doors.
The location of rabbits was registered at every 15 min. The behavioural patterns (fighting,
chasing and “mating attempts”) were observed continuously. The injuries were registered on
days 8 and 14.
Figure 2: Layout of the four interconnected cages

33
Except on day 1 (46.6%), the majority of rabbit does stayed separately on days 3, 7 and 13
(54.5%, 62.8% and 61.2%, respectively). In most cases (53-68%) two does were present in
one of the cages, and the others were individually, the second most frequent (12-32%)
location was when all does were individually. Except for day 7 more rabbit does located in
their own cages (32-53%) than the expected probability (25%). Frequency of all examined
behavioural patterns was the highest during the first hours after opening the doors. The
number of fighting, chasing and “mating attempts” were the highest on day 1 (23, 128 and
178, respectively), and they were much lower on day 13 (1, 26 and 34, respectively). Higher
frequencies of injured rabbits (25%) were observed on day 8 than on day 14 (6%). Based on
the results, housing the rabbit does in group in interconnected cages is not recommended.
2.5. Location and behaviour of group housed rabbit does in a huge pen with four identical
small cages and a common area
The aim of the experiment was to test a special group housing system, examination of
location, aggressive and sexual behaviour of rabbit does in pens which had individual cages
and common area.
The experiment was conducted at Kaposvár University with non-pregnant Pannon White
rabbit does (n=44). The temperature was 15-18 ºC, and 16-hour daily lighting was applied in
the room. The rabbit does consumed commercial pellet ad libitum and water was available
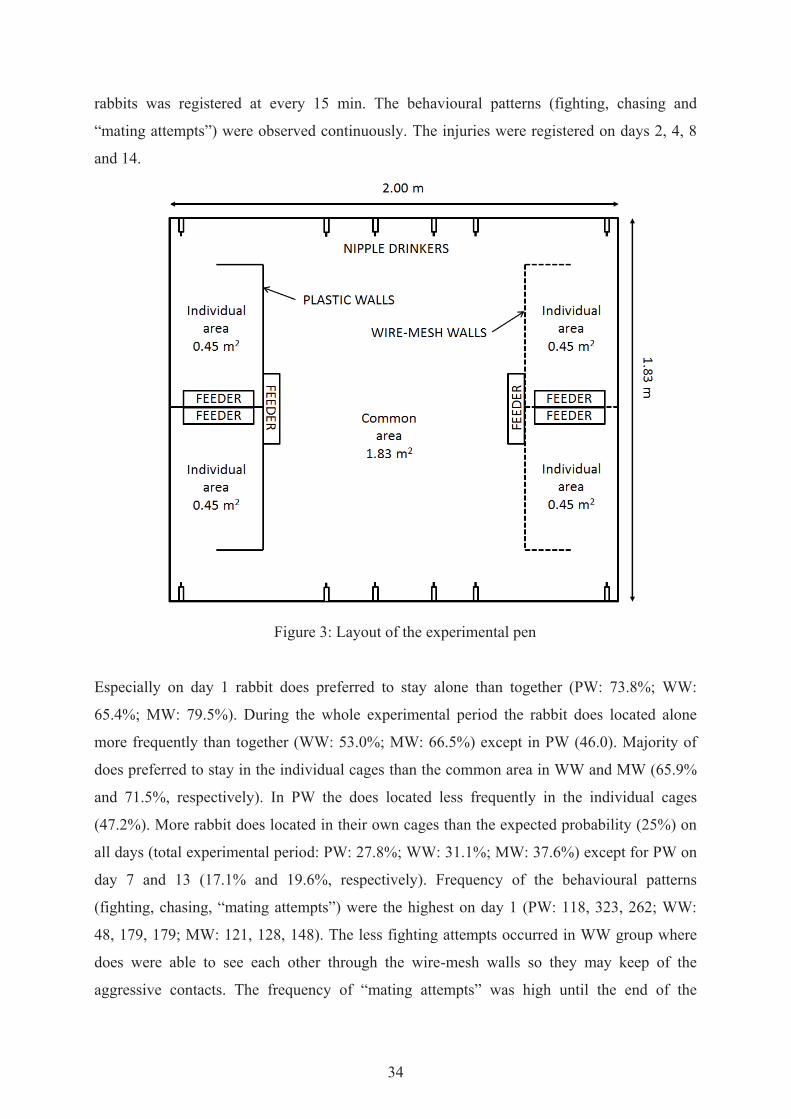
from nipple drinkers. The 1.83 x 2.00 m open top pen (Figure 3) contained four individual
cages (0.5 x 0.91 m) which were connected to the 1.83 x 1.00 m common area throughout a
0.25 m long and 0.20 m wide lockable corridor. The rabbit does were randomly divided into
three groups. The groups differed only in the walls of the individual cages, which were made
of wire mesh, plastic sheet or both. Pen with plastic slat walls (Plastic walls, PW, n=16); pen
with wire mesh walls (Wire walls, WW, n=12) and pen in which walls of two cages were
covered and walls of the other two cages were not covered with plastic sheet (Mixed walls,
MW, n=16).
At the beginning of the experiment the does were individually housed in the closed cages (4
does/pen) for 3 days, to train to use their own cages. After the adaptation period, the doors of
the cages were opened to allow the does move freely. The experiment lasted for 14 days. 24-h
video recordings were made on days 1, 3, 7 and 14 after opening the doors. Location of
34
rabbits was registered at every 15 min. The behavioural patterns (fighting, chasing and
“mating attempts”) were observed continuously. The injuries were registered on days 2, 4, 8
and 14.
Figure 3: Layout of the experimental pen
Especially on day 1 rabbit does preferred to stay alone than together (PW: 73.8%; WW:
65.4%; MW: 79.5%). During the whole experimental period the rabbit does located alone
more frequently than together (WW: 53.0%; MW: 66.5%) except in PW (46.0). Majority of
does preferred to stay in the individual cages than the common area in WW and MW (65.9%
and 71.5%, respectively). In PW the does located less frequently in the individual cages
(47.2%). More rabbit does located in their own cages than the expected probability (25%) on
all days (total experimental period: PW: 27.8%; WW: 31.1%; MW: 37.6%) except for PW on
day 7 and 13 (17.1% and 19.6%, respectively). Frequency of the behavioural patterns
(fighting, chasing, “mating attempts”) were the highest on day 1 (PW: 118, 323, 262; WW:
48, 179, 179; MW: 121, 128, 148). The less fighting attempts occurred in WW group where
does were able to see each other through the wire-mesh walls so they may keep of the
aggressive contacts. The frequency of “mating attempts” was high until the end of the

35
experiment. High frequencies of injured rabbits were observed in the whole experimental
period (PW: 37.5%; WW: 16.7%; MW: 50%). Based on our result we can conclude that the
main problems (aggressiveness, injuries) of group housing of does have not been solved in
this new group housing system.
ACKNOWLEDGEMENT
The experiment was supported by the ANIHWA (RABHO – Development and assessment of
alternative animal-friendly housing systems for rabbit does with kits and growing rabbits)
project and the János Bolyai Research Scholarship (BO/00373/14/4) of the Hungarian
Academy of Sciences.
REFERENCES
1. DENENBERG, V.H.; HUFF, R.L.; ROSS, S.; SAWINA, P.B.; ZARROW, M.X. (1963):
Maternal behaviour in the rabbit: The quantification of nest building. Anim. Behav. Vol.
11, 494-499
2. FARKAS, T.P.; SZENDRŐ, ZS.; MATICS, ZS.; RADNAI, I.; MAYER, A.;
GERENCSÉR, ZS. (2016a): Preference of rabbit does among different nest materials. In:
Proceedings 11th World Rabbit Congress. June 15-18, 2016, Qingdao, China, 667-670
3. FARKAS, T.P.; SZENDRŐ, ZS.; MATICS, ZS.; RADNAI, I.; MAYER, A.;
GERENCSÉR, ZS. (2016b): Effect of different nest materials on performance of rabbit
does. In: Proceedings 11th World Rabbit Congress. June 15-18, 2016, Qingdao, China,
197-200
4. FARKAS, T.P.; SZENDRŐ, ZS.; MATICS, ZS.; ODERMATT, M.; RADNAI, I.;
GERENCSÉR, ZS. (2016c): Location and behaviour of group housed rabbit does in four
interconnected cages (in Hung.). In: Proceedings 28th Hungarian Conference on Rabbit
Production. May 25, 2016, Kaposvár, Hungary, 87-95
5. FARKAS, T.P.; SZENDRŐ, ZS.; MATICS, ZS.; ODERMATT, M.; RADNAI, I.;
KACSALA, L.; KASZA, R.; JAKAB, M.; GERENCSÉR, ZS. (2017): Location and
behaviour of group housed rabbit does in pens included common area and individual
cages (in Hung.). In: Proceedings 29th Hungarian Conference on Rabbit Production. May
31, 2017, Kaposvár, Hungary (in press)
36
6. GERENCSÉR, ZS.; KUSTOS, K.; SZABÓ, R.T.; MIKÓ, A.; ODERMATT, M.;
RADNAI, I.; MATICS, ZS.; SZENDRŐ, ZS. (2016): Mating behaviour of rabbit does
and bucks in groups (preliminary results). In: Proceedings 11th World Rabbit Congress.
June 15-18, 2016, Qingdao, China, 675-678
7. SAWIN, P.B.; CRARY, D.D. (1953): Genetic and physiological background of
reproduction in the rabbit. II. Some racial differences in the pattern of maternal
behaviour. Behav. 6,128-146
8. SZENDRŐ, ZS.; MATICS, ZS.; SZABÓ, R.T.; KUSTOS, K.; MIKÓ, A.; ODERMATT,
M.; GERENCSÉR, ZS. (2016): Aggressivity and its effect on lifespan of group housed
rabbit does (preliminary results). In: Proceedings 11th World Rabbit Congress. June 15-
18, 2016, Qingdao, China, 719-722
Corresponding author:
Zsolt Matics
Faculty of Agricultural and Environmental Sciences
Kaposvár University
H-7400 Kaposvár, Guba S. str. 40., Hungary

37
Institute for Agricultural and Fisheries Research (ILVO)
FARMERS EXPERIENCES WITH PARK HOUSING OF RABBITS
L. Maertens
1. INTRODUCTION
Farmed rabbits are nearly exclusively housed in small wire cages in commercial units (EFSA,
2005). However, since some years a shift from cage to park housing of weaned rabbits has
taken place in some countries (HOY and MATICS, 2016). Moreover, with the publication of
the Belgian legislation (MAERTENS, 2013; ARRÊTÉ ROYAL, 2014) of the housing
conditions in commercial breeding units, it is no longer authorized in Belgium to house
fatteners in cages, with the exception of existing farms which have still some years to make
the transition.
Because of the increasing demand of the retail and the legislation, several rabbit breeders have
changed their housing system and house fattening rabbits in park systems. Although the
performances in park housing are quite the same as in cage housing (MAERTENS and
BUIJS, 2015), there exist still a lot of discussion about their practical usefulness.
In order to know the actual used housing and the opinion and experiences of the farmers with
park housing, a survey was executed in the autumn of 2015. For this objective, all commercial
farms in Belgium were visited and an interview based on a prepared questionnaire was
executed.

38
2. MATERIALS AND METHODS
A list with 25 questions was drawn asking for the actual housing system(s): e.g. the date of
installation, presence of park housing, details of the park housing system if present, their
motivation to invest or to reject park housing, their opinion concerning cage and park housing
(advantages, disadvantages) and their intentions for the future housing of rabbits.
A number of questions did not had a clear relationship with the housing system but were
useful to knew e.g. their management system, the rabbit strain present, the size of the farm or
the date of delivering to the slaughter house.
In total 24 commercial farms were contacted and willing to participate. All of them were
visited by a technician of the ILVO Institute and together with the farmer the questionnaire
was filled. Data were divided in those farms having already park housing or not.
3. RESULTS AND DISCUSSION
From the 24 commercial rabbit farms (nearly 100% of the sector), rabbit production was the
primary activity for 11 farms and for 13 an additional activity (but > 100 does). With the
exception of one farm delivering weaned rabbits and one just having a fattening activity, all
other farms were closed farms. Nineteen of the farms used artificial insemination and 2/3 of
the farms had commercial hybrid stock.
The majority of farms having parks (partial or the whole housing) had “homemade” parks and
only 3 farms had commercial parks (Meneghin, Chabeauti, Momeck or a mixture). Two farms
had polyvalent parks which can be used both for females as for fattening. A plastic slatted
floor was the standard, however a large variety of material was used: from piglet (or poultry)
slatted floor, till commercial available rabbit slatted plastic flooring.
Overall, the majority of farmers (15/24) had a negative opinion concerning park housing most
expressed in those still using exclusively cage housing (Table 1). Farmers with park housing
and having a negative opinion used “home-made” parks. The main disadvantages linked to
park housing were: more work, higher investment, problems with the plastic slatted floor,
lower hygiene and more difficult to restrict feed intake. The mentioned advantages were: an
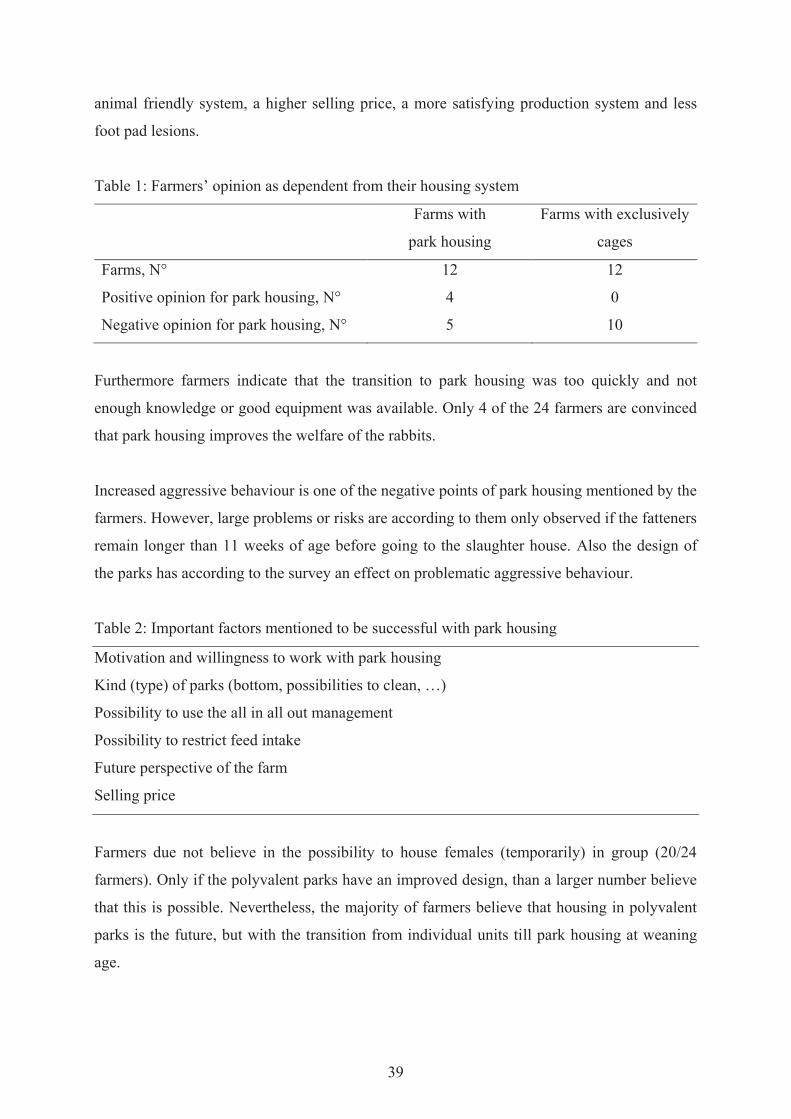
39
animal friendly system, a higher selling price, a more satisfying production system and less
foot pad lesions.
Table 1: Farmers’ opinion as dependent from their housing system
Farms with
park housing
Farms with exclusively
cages
Farms, N°
Positive opinion for park housing, N°
Negative opinion for park housing, N°
12
4
5
12
0
10
Furthermore farmers indicate that the transition to park housing was too quickly and not
enough knowledge or good equipment was available. Only 4 of the 24 farmers are convinced
that park housing improves the welfare of the rabbits.
Increased aggressive behaviour is one of the negative points of park housing mentioned by the
farmers. However, large problems or risks are according to them only observed if the fatteners
remain longer than 11 weeks of age before going to the slaughter house. Also the design of
the parks has according to the survey an effect on problematic aggressive behaviour.
Table 2: Important factors mentioned to be successful with park housing
Motivation and willingness to work with park housing
Kind (type) of parks (bottom, possibilities to clean, …)
Possibility to use the all in all out management
Possibility to restrict feed intake
Future perspective of the farm
Selling price
Farmers due not believe in the possibility to house females (temporarily) in group (20/24
farmers). Only if the polyvalent parks have an improved design, than a larger number believe
that this is possible. Nevertheless, the majority of farmers believe that housing in polyvalent
parks is the future, but with the transition from individual units till park housing at weaning
age.

40
All farmers indicate that the key point is the bottom of the park (Table 2). Plastic slats,
especially if not well adapted for rabbits, are much more difficult to clean than wire flooring.
As a result, disease problems are increased in park systems due to the lower hygienic status.
Finally, park housing has a higher work demand and less rabbits can be hold per m² than with
cage housing. For this reason a surplus selling price is necessary and a protection of the
market versus rabbits housed in cages. A certification system is according to them necessary.
4. CONCLUSIONS
Farmers experience park housing as more difficult. The change to park housing was according
to them too quickly because not enough knowledge and good equipment was available. The
obligation of a slatted plastic flooring complicates strongly the hygiene. However, dual
purpose parks are considered as future housing but a higher selling price is necessary to
compensate the disadvantages.
5. SUMMARY
The housing of fattening rabbits has changed dramatically in Belgium due to the demands of
the retail or because of recent legislation. In order to know the opinion of the breeders
concerning park housing, a survey was executed. In total 24 commercial rabbit breeders were
visited and a prepared list with 25 questions concerning the farm, their management and
opinion was presented.
Half of the farms (12/24) had installed park housing (partial or the whole farm). The majority
of farmers (15/24) had a negative opinion concerning park housing most expressed in those
still using exclusively cage housing. Farmers with park housing and having a negative opinion
used “home-made” parks. The main disadvantages linked to park housing were: more work,
higher investment, problems with the plastic slatted floor, lower hygiene and more difficult to
restrict feed intake. The mentioned advantages were: an animal friendly system, a higher
selling price, a more satisfying production system and less footpath lesions.
All farmers indicate that the key point is the bottom of the park. Plastic slats, especially if not
well adapted for rabbits, are much more difficult to clean than wire flooring. As a result,

41
disease problems are increased in park systems due to the lower hygienic status. Finally the
success of park housing also depends of the motivation of the breeder and if he receives a
higher selling price to compensate the higher work load.
ACKNOWLEDGEMENT
This study was funded by the Flemish Agriculture and Fisheries Department in the framework
of the Flemish program for the development of rural areas. The author is grateful to the
farmers for their willingness to participate in this survey. Thanks also to Dimitri van
Grembergen and Jolien Vander Linden for their contribution in the collection of the data.
6. REFERENCES
1) EFSA (2005): The impact of the current housing and husbandry systems on the health
and welfare of farmed domestic rabbits. EFSA Journal, 267, 1-137
2) HOY, S.; MATICS, Zs. (2016): Alternative housing for rabbit does. Proc. 11th World
Rabbit Congress, June 15-18, Qingdao (China), 637-651
3) MAERTENS, L. (2013): Housing regulation of rabbits in Belgium: the step by step
plan. 18th International Symposium on Housing and Diseases of Rabbits, Furproviding
Animals and Pet Animals, Celle (Germany), 22-23 May 2013. VVB Laufersweiler
Verlag (Ed), 12-19
4) ARRÊTÉ ROYAL relatif au bien-être des lapins dans les élevages (2014): Moniteur
Belge [C − 2014/24303], 60861-60864
5) MAERTENS, L.; BUIJS, St. (2015): Production performances of semi-group housed
rabbit does. Proc. 19th International Symposium on Housing and Diseases of Rabbits,
Furproviding Animals and Pet Animals, Celle (Germany), 27-28 May 2015. Ed.
Scientifique VVB Laufersweiler Verlag (Ed), Giessen, 22-31
Author address:
Institute for Agricultural and Fisheries Research (ILVO)
Scheldeweg 68
B-9090 Melle, Belgium
42
1Zentrum für Tiergerechte Haltung: Geflügel und Kaninchen (ZTHZ), 2Abteilung Veterinärepidemiologie, Vetsuisse Fakultät, Universität Zürich,
3Abteilung Tierschutz, Veterinary Public Health Institut, Vetsuisse Fakultät, Universität Bern, 4Institut für Mathematik, Universität Zürich
PODODERMATITIS BEI IN GRUPPEN GEHALTENEN ZUCHTKANINCHEN IN DER
SCHWEIZ – HÄUFIGKEIT, SCHWEREGRAD UND RISIKOFAKTOREN
S. Ruchti1, A.R. Meier2, H. Würbel3, G. Kratzer4, S.G. Gebhardt-Henrich1 und S. Hartnack2
1. EINLEITUNG
Pododermatitis, auch Sohlengeschwür oder wunde Läufe genannt, ist eine chronische
Dermatitis, die hauptsächlich auf der Plantarfläche der Hinterläufe von Kaninchen erscheint,
jedoch ab und zu auch an den Vorderpfoten zu finden ist. Es wird vermutet, dass die
Krankheit progressiv verläuft, wobei zunächst haarlose Stellen mit verdickter und geröteter
Haut zu finden sind, die später ulcerieren und zu Schmerzen und einer chronischen
Beeinträchtigung des Wohlergehens der Kaninchen führen (DRESCHER und SCHLENDER-
BÖBBIS, 1996; EFSA, 2005; HARCOURT-BROWN, 2002).
In den vergangenen Jahren wurden bereits einige prädisponierende Faktoren, die einen
Einfluss auf die Entstehung von Pododermatitis bei Kaninchen haben könnten, vorgeschlagen
und untersucht. Die Faktoren können grob in zwei Katego-rien eingeteilt werden, nämlich die
tier- und die umweltbezogenen Faktoren. Als tierbezogene Faktoren wurden das Alter, die
Rasse, das Körpergewicht oder die Krallenlänge der Kaninchen genannt (BIGLER und
OESTER, 2003; DRESCHER und SCHLENDER-BÖBBIS, 1996; ROMMERS und
MEIJERHOF, 1996). Die Temperatur und die Luftfeuchtigkeit im Stall, sowie das Material,
die Sauberkeit, die Feuchtigkeit und der Zustand des Untergrunds, auf dem die Kaninchen
gehalten werden, wurden als Umweltfaktoren genannt (DRESCHER und SCHLENDER-
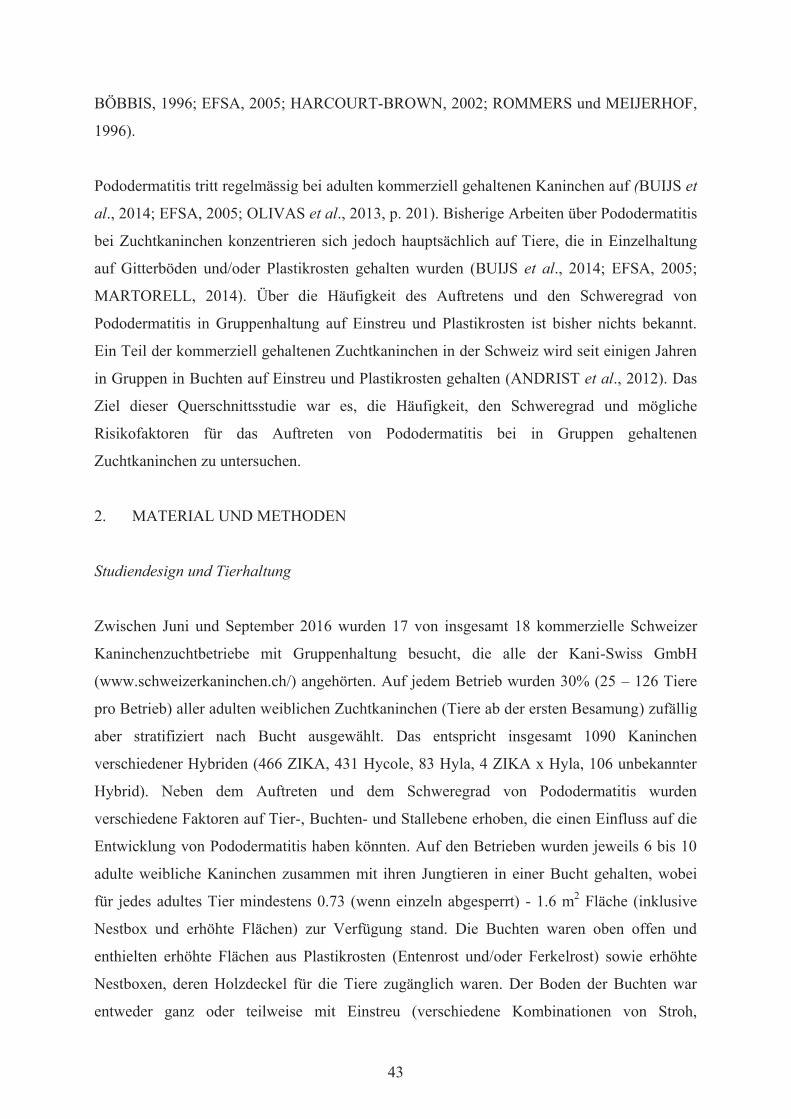
43
BÖBBIS, 1996; EFSA, 2005; HARCOURT-BROWN, 2002; ROMMERS und MEIJERHOF,
1996).
Pododermatitis tritt regelmässig bei adulten kommerziell gehaltenen Kaninchen auf (BUIJS et
al., 2014; EFSA, 2005; OLIVAS et al., 2013, p. 201). Bisherige Arbeiten über Pododermatitis
bei Zuchtkaninchen konzentrieren sich jedoch hauptsächlich auf Tiere, die in Einzelhaltung
auf Gitterböden und/oder Plastikrosten gehalten wurden (BUIJS et al., 2014; EFSA, 2005;
MARTORELL, 2014). Über die Häufigkeit des Auftretens und den Schweregrad von
Pododermatitis in Gruppenhaltung auf Einstreu und Plastikrosten ist bisher nichts bekannt.
Ein Teil der kommerziell gehaltenen Zuchtkaninchen in der Schweiz wird seit einigen Jahren
in Gruppen in Buchten auf Einstreu und Plastikrosten gehalten (ANDRIST et al., 2012). Das
Ziel dieser Querschnittsstudie war es, die Häufigkeit, den Schweregrad und mögliche
Risikofaktoren für das Auftreten von Pododermatitis bei in Gruppen gehaltenen
Zuchtkaninchen zu untersuchen.
2. MATERIAL UND METHODEN
Studiendesign und Tierhaltung
Zwischen Juni und September 2016 wurden 17 von insgesamt 18 kommerzielle Schweizer
Kaninchenzuchtbetriebe mit Gruppenhaltung besucht, die alle der Kani-Swiss GmbH
(www.schweizerkaninchen.ch/) angehörten. Auf jedem Betrieb wurden 30% (25 – 126 Tiere
pro Betrieb) aller adulten weiblichen Zuchtkaninchen (Tiere ab der ersten Besamung) zufällig
aber stratifiziert nach Bucht ausgewählt. Das entspricht insgesamt 1090 Kaninchen
verschiedener Hybriden (466 ZIKA, 431 Hycole, 83 Hyla, 4 ZIKA x Hyla, 106 unbekannter
Hybrid). Neben dem Auftreten und dem Schweregrad von Pododermatitis wurden
verschiedene Faktoren auf Tier-, Buchten- und Stallebene erhoben, die einen Einfluss auf die
Entwicklung von Pododermatitis haben könnten. Auf den Betrieben wurden jeweils 6 bis 10
adulte weibliche Kaninchen zusammen mit ihren Jungtieren in einer Bucht gehalten, wobei
für jedes adultes Tier mindestens 0.73 (wenn einzeln abgesperrt) - 1.6 m2 Fläche (inklusive
Nestbox und erhöhte Flächen) zur Verfügung stand. Die Buchten waren oben offen und
enthielten erhöhte Flächen aus Plastikrosten (Entenrost und/oder Ferkelrost) sowie erhöhte
Nestboxen, deren Holzdeckel für die Tiere zugänglich waren. Der Boden der Buchten war
entweder ganz oder teilweise mit Einstreu (verschiedene Kombinationen von Stroh,
44
Häckselstroh, Hobelspäne und/oder Strohpellets) bedeckt. Ein Reproduktionszyklus dauerte
entweder 31 Tage (Bock wird um den Geburtstermin zu den Weibchen gesetzt; 9 Betriebe)
oder 41 Tage (künstliche Besamung 10 Tage nach der Geburt, weibliche Tiere werden kurz
vor dem Werfen bis 12 Tage danach einzeln abgetrennt; 8 Betriebe).
Datenaufnahme
Bei jedem Kaninchen wurde an beiden Hinterläufen das Vorhandensein und der Schweregrad
von Pododermatitis anhand einer tagged visual-analogue-Skala bewertet, die auf den sechs
von DRESCHER und SCHLENDER-BÖBBIS (1996) publizierten Schweregraden (Tabelle
1) basierte. Für die tagged visual-analogue-Skala wurden die 6 Schweregrade gleichmässig
auf einer kontinuierlichen 10 cm langen Linie verteilt, wobei der Punkt bei 0 cm dem Stadium
0, also einer gesunden Pfote entspricht. Bei der Beurteilung der Pfoten wurde so abhängig
vom Schweregrad pro evaluierte Stelle ein Kreuz auf der 10 cm langen Linie gemacht, dessen
Abstand zum Punkt 0 dann gemessen und in eine kontinuierliche Variable (von 0 cm bis 10
cm) transformiert wurde. Bei jeder Pfote wurde das Vorhandensein und der Schweregrad von
Pododermatitis an 2 Stellen separat bewertet: Die caudalste Stelle auf der Plantarfläche der
Pfote, unter der der Fersenknochen liegt (nachfolgend als „Ferse“ bezeichnet) und der Rest
der Plantarfläche der Pfote bis zu den Zehen (nachfolgend als „Mitte“ bezeichnet). Somit
resultierten 4 Pododermatitiswerte pro Tier, wovon für die Analyse jeweils entweder der
höchste Wert (PDH) oder der Mittelwert der beiden mittleren Stellen (PDM) verwendet
wurden.
Des Weiteren wurde bei jedem Tier das Körpergewicht, die Krallenlänge (normal oder zu
lang), die Sauberkeit (sauber oder dreckig) und die Feuchtigkeit (trocken oder nass) des Fells
auf der Plantarfläche der Pfoten, sowie der Hybrid und das Alter (Monate) erfasst. Das Alter
konnte lediglich bei 661 Kaninchen auf 11 Betrieben eruiert werden, alle Analysen, die die
Variable „Alter“ beinhalten, beziehen sich somit auf ein reduziertes Datenset von 661 Tieren.
Auf jedem Betrieb wurden 10% der vorhandenen Buchten (1 – 20 Buchten pro Betrieb)
genauer bewertet. In jeder der zufällig ausgewählten Buchten wurde die totale nasse Fläche in
der Einstreu, auf den Nestdeckeln und den Rosten in cm2 gemessen, sowie die Anzahl
schadhafter Löcher in den Plastikrosten gezählt und der Prozentsatz der Plastikroste, bei
denen mehr als ein Drittel der Fläche angenagt war, ausgerechnet (Zustand Roste). Die
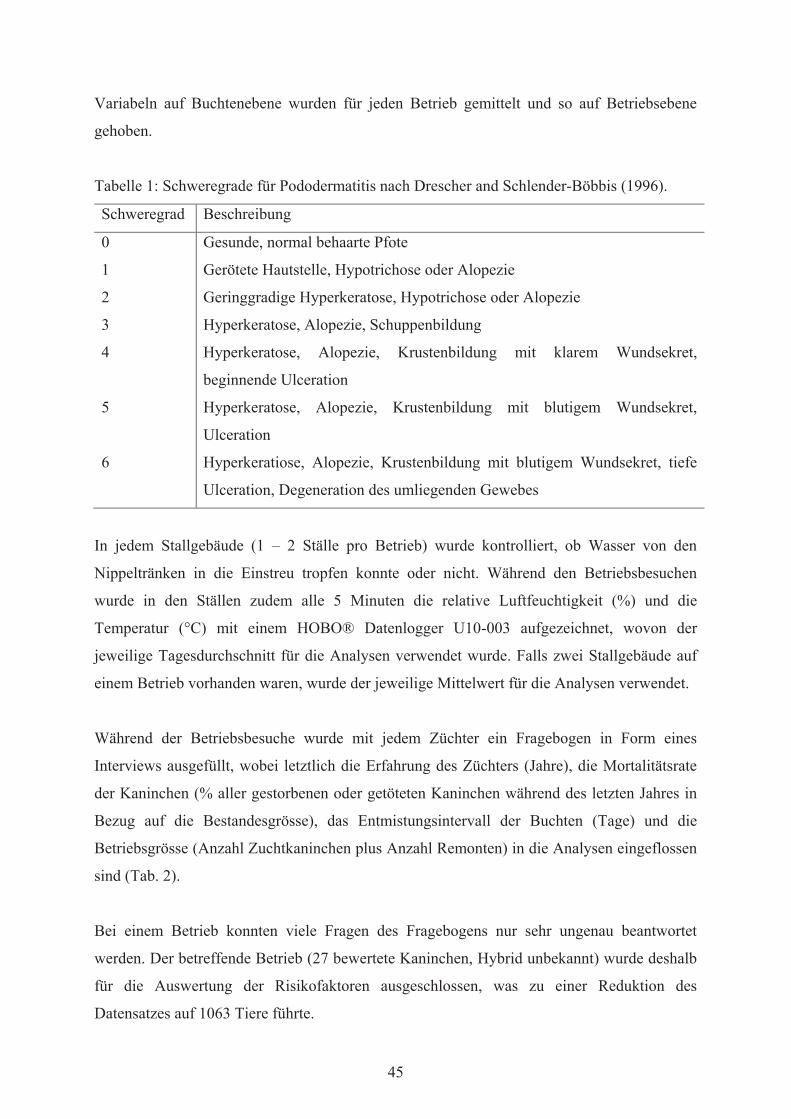
45
Variabeln auf Buchtenebene wurden für jeden Betrieb gemittelt und so auf Betriebsebene
gehoben.
Tabelle 1: Schweregrade für Pododermatitis nach Drescher and Schlender-Böbbis (1996).
Schweregrad Beschreibung
0 Gesunde, normal behaarte Pfote
1 Gerötete Hautstelle, Hypotrichose oder Alopezie
2 Geringgradige Hyperkeratose, Hypotrichose oder Alopezie
3 Hyperkeratose, Alopezie, Schuppenbildung
4 Hyperkeratose, Alopezie, Krustenbildung mit klarem Wundsekret,
beginnende Ulceration
5 Hyperkeratose, Alopezie, Krustenbildung mit blutigem Wundsekret,
Ulceration
6 Hyperkeratiose, Alopezie, Krustenbildung mit blutigem Wundsekret, tiefe
Ulceration, Degeneration des umliegenden Gewebes
In jedem Stallgebäude (1 – 2 Ställe pro Betrieb) wurde kontrolliert, ob Wasser von den
Nippeltränken in die Einstreu tropfen konnte oder nicht. Während den Betriebsbesuchen
wurde in den Ställen zudem alle 5 Minuten die relative Luftfeuchtigkeit (%) und die
Temperatur (°C) mit einem HOBO® Datenlogger U10-003 aufgezeichnet, wovon der
jeweilige Tagesdurchschnitt für die Analysen verwendet wurde. Falls zwei Stallgebäude auf
einem Betrieb vorhanden waren, wurde der jeweilige Mittelwert für die Analysen verwendet.
Während der Betriebsbesuche wurde mit jedem Züchter ein Fragebogen in Form eines
Interviews ausgefüllt, wobei letztlich die Erfahrung des Züchters (Jahre), die Mortalitätsrate
der Kaninchen (% aller gestorbenen oder getöteten Kaninchen während des letzten Jahres in
Bezug auf die Bestandesgrösse), das Entmistungsintervall der Buchten (Tage) und die
Betriebsgrösse (Anzahl Zuchtkaninchen plus Anzahl Remonten) in die Analysen eingeflossen
sind (Tab. 2).
Bei einem Betrieb konnten viele Fragen des Fragebogens nur sehr ungenau beantwortet
werden. Der betreffende Betrieb (27 bewertete Kaninchen, Hybrid unbekannt) wurde deshalb
für die Auswertung der Risikofaktoren ausgeschlossen, was zu einer Reduktion des
Datensatzes auf 1063 Tiere führte.
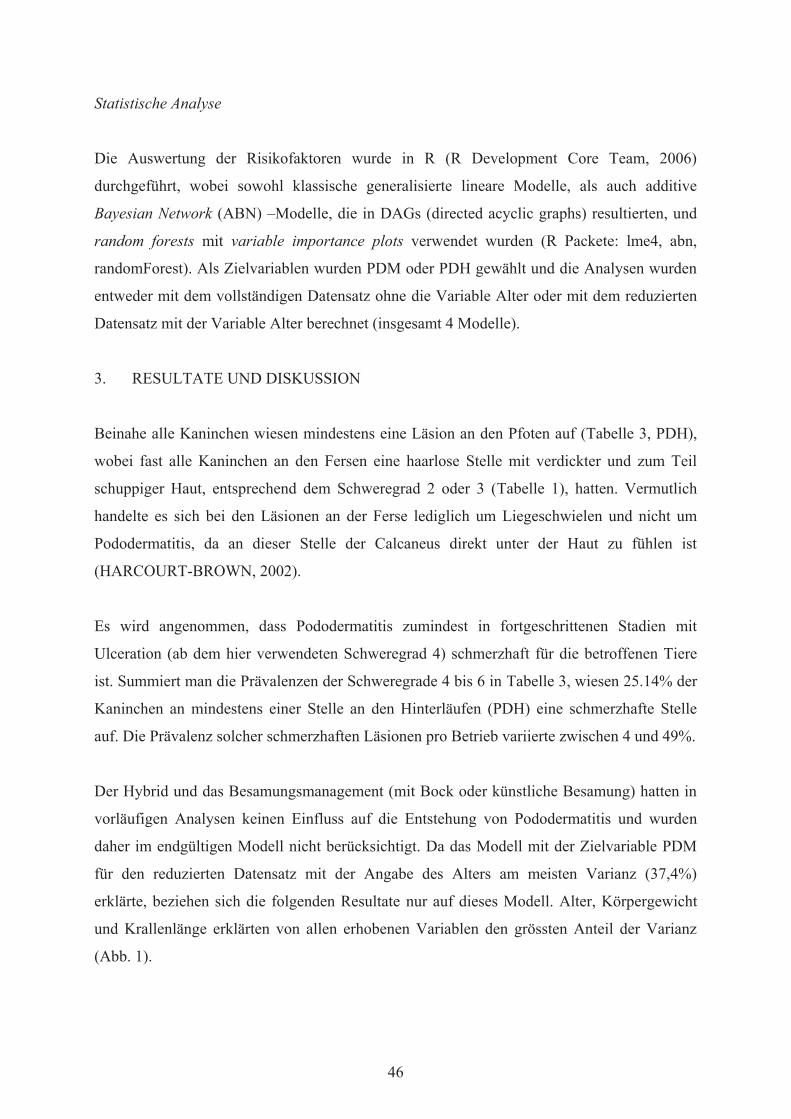
46
Statistische Analyse
Die Auswertung der Risikofaktoren wurde in R (R Development Core Team, 2006)
durchgeführt, wobei sowohl klassische generalisierte lineare Modelle, als auch additive
Bayesian Network (ABN) –Modelle, die in DAGs (directed acyclic graphs) resultierten, und
random forests mit variable importance plots verwendet wurden (R Packete: lme4, abn,
randomForest). Als Zielvariablen wurden PDM oder PDH gewählt und die Analysen wurden
entweder mit dem vollständigen Datensatz ohne die Variable Alter oder mit dem reduzierten
Datensatz mit der Variable Alter berechnet (insgesamt 4 Modelle).
3. RESULTATE UND DISKUSSION
Beinahe alle Kaninchen wiesen mindestens eine Läsion an den Pfoten auf (Tabelle 3, PDH),
wobei fast alle Kaninchen an den Fersen eine haarlose Stelle mit verdickter und zum Teil
schuppiger Haut, entsprechend dem Schweregrad 2 oder 3 (Tabelle 1), hatten. Vermutlich
handelte es sich bei den Läsionen an der Ferse lediglich um Liegeschwielen und nicht um
Pododermatitis, da an dieser Stelle der Calcaneus direkt unter der Haut zu fühlen ist
(HARCOURT-BROWN, 2002).
Es wird angenommen, dass Pododermatitis zumindest in fortgeschrittenen Stadien mit
Ulceration (ab dem hier verwendeten Schweregrad 4) schmerzhaft für die betroffenen Tiere
ist. Summiert man die Prävalenzen der Schweregrade 4 bis 6 in Tabelle 3, wiesen 25.14% der
Kaninchen an mindestens einer Stelle an den Hinterläufen (PDH) eine schmerzhafte Stelle
auf. Die Prävalenz solcher schmerzhaften Läsionen pro Betrieb variierte zwischen 4 und 49%.
Der Hybrid und das Besamungsmanagement (mit Bock oder künstliche Besamung) hatten in
vorläufigen Analysen keinen Einfluss auf die Entstehung von Pododermatitis und wurden
daher im endgültigen Modell nicht berücksichtigt. Da das Modell mit der Zielvariable PDM
für den reduzierten Datensatz mit der Angabe des Alters am meisten Varianz (37,4%)
erklärte, beziehen sich die folgenden Resultate nur auf dieses Modell. Alter, Körpergewicht
und Krallenlänge erklärten von allen erhobenen Variablen den grössten Anteil der Varianz
(Abb. 1).
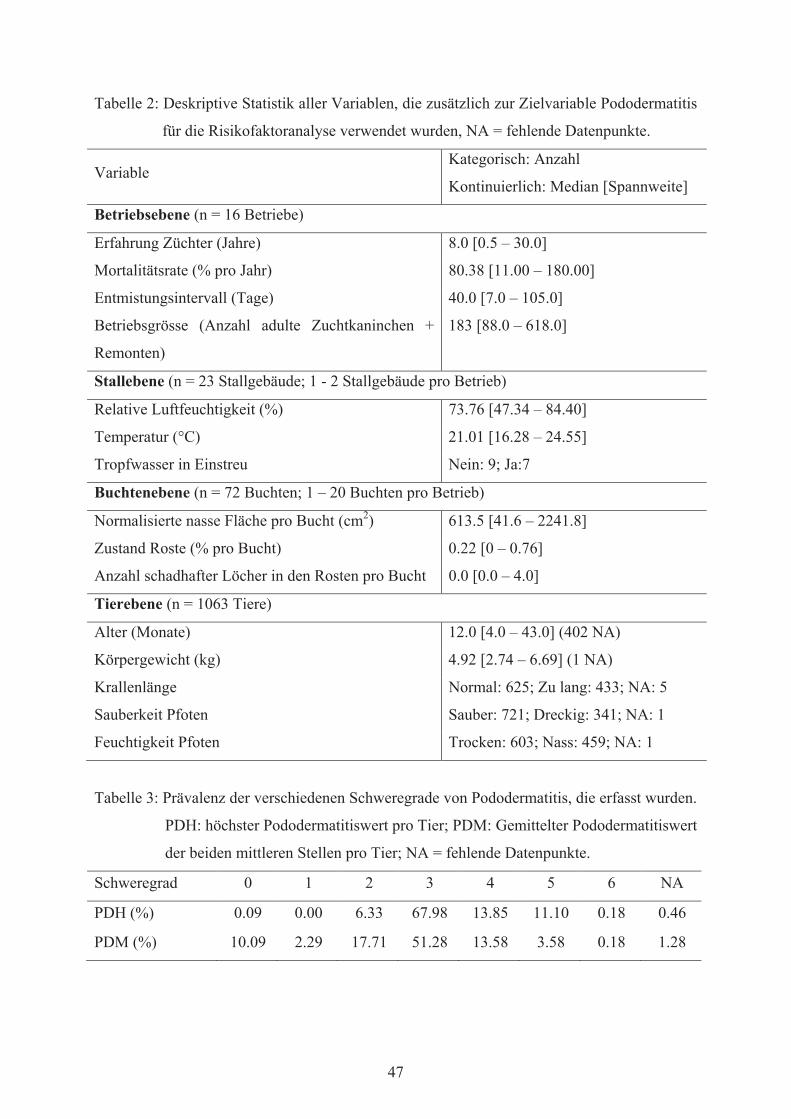
47
Tabelle 2: Deskriptive Statistik aller Variablen, die zusätzlich zur Zielvariable Pododermatitis
für die Risikofaktoranalyse verwendet wurden, NA = fehlende Datenpunkte.
Variable Kategorisch: Anzahl
Kontinuierlich: Median [Spannweite]
Betriebsebene (n = 16 Betriebe)
Erfahrung Züchter (Jahre) 8.0 [0.5 – 30.0]
Mortalitätsrate (% pro Jahr) 80.38 [11.00 – 180.00]
Entmistungsintervall (Tage) 40.0 [7.0 – 105.0]
Betriebsgrösse (Anzahl adulte Zuchtkaninchen +
Remonten)
183 [88.0 – 618.0]
Stallebene (n = 23 Stallgebäude; 1 - 2 Stallgebäude pro Betrieb)
Relative Luftfeuchtigkeit (%) 73.76 [47.34 – 84.40]
Temperatur (°C) 21.01 [16.28 – 24.55]
Tropfwasser in Einstreu Nein: 9; Ja:7
Buchtenebene (n = 72 Buchten; 1 – 20 Buchten pro Betrieb)
Normalisierte nasse Fläche pro Bucht (cm2) 613.5 [41.6 – 2241.8]
Zustand Roste (% pro Bucht) 0.22 [0 – 0.76]
Anzahl schadhafter Löcher in den Rosten pro Bucht 0.0 [0.0 – 4.0]
Tierebene (n = 1063 Tiere)
Alter (Monate) 12.0 [4.0 – 43.0] (402 NA)
Körpergewicht (kg) 4.92 [2.74 – 6.69] (1 NA)
Krallenlänge Normal: 625; Zu lang: 433; NA: 5
Sauberkeit Pfoten Sauber: 721; Dreckig: 341; NA: 1
Feuchtigkeit Pfoten Trocken: 603; Nass: 459; NA: 1
Tabelle 3: Prävalenz der verschiedenen Schweregrade von Pododermatitis, die erfasst wurden.
PDH: höchster Pododermatitiswert pro Tier; PDM: Gemittelter Pododermatitiswert
der beiden mittleren Stellen pro Tier; NA = fehlende Datenpunkte.
Schweregrad 0 1 2 3 4 5 6 NA
PDH (%) 0.09 0.00 6.33 67.98 13.85 11.10 0.18 0.46
PDM (%) 10.09 2.29 17.71 51.28 13.58 3.58 0.18 1.28

48
Das Alter der Kaninchen korrelierte sowohl positiv mit dem Körpergewicht als auch mit
demSchweregrad der Pododermatitis (Abb. 2). Ausserdem neigten Tiere mit schwerer
Pododermatitis dazu, längere Krallen zu haben. Die Zugehörigkeit zum Betrieb erklärte
ebenfalls einen wichtigen Anteil der Prävalenz von PDM. Aus technischen Gründen konnte
der „Betrieb“ nicht als zufälliger Effekt in die ABN-Analyse integriert werden. Aus diesem
Grund wurden zusätzlich ein generalisiertes lineares (GLM) und ein generalisiertes lineares
gemischtes Modell (GLMM) mit „Betrieb“ als zufälligem Effekt berechnet. Sowohl das GLM
als auch das GLMM mit PDM als Pododermatitiswert ergaben signifikante Effekte für die
Variablen „Alter“, „Körpergewicht“ und „Krallenlänge“. Diese Resultate erstaunen nicht, da
bereits mehrfach vermutet und gezeigt werden konnte, dass sowohl ältere als auch schwerere
Tiere zu schwerer Pododermatitis neigen (DRESCHER und SCHLENDER-BÖBBIS, 1996;
EFSA, 2005; MARTORELL, 2014; OLIVAS et al., 2013; ROMMERS und MEIJERHOF,
1996). Der Zusammenhang zwischen Pododermatitis und langen Krallen, der von BIGLER
und OESTER (2003) beobachtet wurde, konnte in unserer Studie ebenfalls bestätigt werden.
Mit der ABN-Analysemethode kann jedoch keine Aussage bezüglich Kausation gemacht
werden.
Abb. 1: Variable importance plot für die Risikofaktoranalyse mit PDM, inklusive der
Variable "Alter“. RG, RP und RB sind zufällig generierte Variablen mit
gauss’scher-, Poisson- und Binomialverteilung, die aus technischen Gründen für die
Analyse generiert wurden, n = 649.

49
Abb. 2: DAG der Risikofaktoranalyse mit PDM als Pododermatitiswert, inklusive der
Variable "Alter", ohne der Variable „Tropfwasser in Einstreu. Kreis = gauss’sche
Verteilung, Rechteck = Binomialverteilung, Ellipse = Poissonverteilung.
Verbindungen mit Nummern positive oder negative Korrelationen“, n = 649.
Diese Ergebnisse sollten vorsichtig interpretiert werden, da mit dem Modell lediglich 37.4%
der Varianz in der Ausprägung der Pododermatitis erklärt werden konnten. Es ist somit
möglich, dass eine für die Entstehung von Pododermatitis wichtige Variable ausser Acht
gelassen wurde. Eine Querschnittsstudie ist allerdings eine Momentaufnahme, bei der für
einige wichtige Variablen, z.B. Feuchtigkeit der Einstreu oder Temperatur im Stall, die
Langzeitbedingungen nicht zuverlässig abgebildet werden. Gerade aus letzterem Aus diesem
Grund führen wir derzeit eine Longitudinalstudie durch, die uns zuverlässig Aufschluss über
den Verlauf und mögliche Risikofaktoren für Pododermatitis in diesen Haltungssystemen
geben sollte.
4. SCHLUSSFOLGERUNG
Pododermatitis trat in Schweizer Gruppenhaltungssystemen mit Einstreu und Plastikrosten je
nach Betrieb relativ häufig auf. Die Resultate dieser Querschnittsstudie weisen darauf hin,
50
dass wichtige Faktoren mit einer kurzzeitigen Datenaufnahme möglicherweise verpasst oder
zu wenig präzise erfasst werden konnten. Weitere Untersuchungen zur Abschätzung von
Risikofaktoren sind nötig, um das Auftreten dieser schmerzhaften Krankheit zu verringern.
5. ZUSAMMENFASSUNG
Pododermatitis ist eine chronische Dermatitis, die hauptsächlich auf der Plantarfläche der
Hinterläufe von Kaninchen erscheint und zu Schmerzen und einer chronischen
Beeinträchtigung des Wohlergehens führt. Diese Krankheit tritt regelmässig bei kommerziell
gehaltenen Kaninchen auf, die Prävalenz bei in Gruppen gehaltenen Zuchtkaninchen auf
Einstreu und Plastikrosten ist allerdings unbekannt. Das Ziel dieser Querschnittsstudie war
deshalb, die Häufigkeit, den Schweregrad und mögliche Risikofaktoren für Pododermatitis
bei in Gruppen gehaltenen Zuchtkaninchen in der Schweiz zu untersuchen.
Zwischen Juni und September 2016 wurden auf 17 von insgesamt 18 Betrieben mit
Gruppenhaltung bei ca. 30% aller adulten weiblichen Zuchtkaninchen (Total 1090 Tiere) das
Auftreten sowie der Schweregrad von Pododermatitis bewertet. Des Weiteren wurden diverse
tier- und umgebungsbezogene Risikofaktoren erhoben und mit klassischen GLMMs sowie
additiven Bayesian Networks, die in DAGs (directed acyclic graphs) und random forests mit
variance importance plots resultierten, ausgewertet.
Im Durchschnitt zeigten 25% der Kaninchen an mindestens einem Hinterlauf schmerzhafte
Pododermatitis (Stadium 4 bis 6), wobei die Prävalenz pro Kaninchenzuchtbetrieb zwischen 4
und 49% variierte. Das Alter sowie das Körpergewicht und die Krallenlänge der Tiere waren
als wichtigste Risikofaktoren mit dem Auftreten von Pododermatitis assoziiert. Die Resultate
zeigen, dass Pododermatitis in Schweizer Gruppenhaltungssystemen mit Einstreu und
Plastikrosten auftritt. Es sind jedoch weitere Untersuchungen nötig, um die Risikofaktoren
von Pododermatitis besser abschätzen zu können, damit das Auftreten dieser schmerzhaften
Krankheit verringern werden kann.

51
DANKSAGUNG
Die Studie wurde vom schweizerischen Bundesamt für Lebensmittelsicherheit und
Veterinärwesen (BLV) finanziert (2.13.08). Ich danke allen Kaninchenzüchtern, die an
diesem Projekt teilgenommen haben, da die Durchführung der Studie ohne ihre Hilfe nicht
möglich gewesen wäre.
6. REFERENZEN
ANDRIST, C.A.; BIGLER, L.M.; WÜRBEL, H.; ROTH, B.A. (2012): Effects of group
stability on aggression, stress and injuries in breeding rabbits. Appl. Anim. Behav. Sci.
142, 182-188. doi:10.1016/j.applanim.2012.10.017
BIGLER, L.; OESTER, H. (2003): Ergebnisse einer Überprüfung der Tiergerechtheit eines
Haltungssystems für Hauskaninchen-Zuchtgruppen. Übersichtsaufnahme. Bericht zu
Handen des Bundesamts für Veterinärwesen
BUIJS, S.; HERMANS, K.; MAERTENS, L.; VAN CAELENBERG, A.; TUYTTENS,
F.A.M. (2014): Effects of semi-group housing and floor type on pododermatitis, spinal
deformation and bone quality in rabbit does. Anim. Int. J. Anim. Biosci. 8, 1728-1734.
doi:10.1017/S1751731114001669
DRESCHER, B.; SCHLENDER-BÖBBIS, I. (1996): Pododermatitis beim Kaninchen.
Kleintierpraxis 41, 99-104
EFSA (2005): The impact of the current housing and husbandry systems on health and
welfare of farmed domestic rabbits. 1-31
HARCOURT-BROWN, F. (2002): Chapter 9 – Skin diseases. In: Textbook of Rabbit
Medicine. Butterworth-Heinemann, Burlington, pp. 224–248. doi:10.1016/B978-
075064002-2.50012-6
MARTORELL, J. (2014): Scoring pododermatitis in pet rabbits. Vet. Rec. 174, 427-428.
doi:10.1136/vr.g2792
OLIVAS, I.; TORRES, A.G.; VILLAGRÁ, A. (2013): Development of a pododermatitis
score in breeding does using clustering methods. Anim. Int. J. Anim. Biosci. 7, 1011-1016
doi:10.1017/S1751731112002509
ROMMERS, J.M.; MEIJERHOF, R. (1996): The effect of different floor types on footpad
injuries of rabbit does. Proc. 6th World Rabbit Congr. Toulouse Vol 2 431-436

52
Corresponding author:
Sabrina Ruchti
Zentrum für tiergerechte Haltung:
Geflügel und Kaninchen
Burgerweg 22
CH-3052 Zollikofen, Schweiz

53
Institut für Tierzucht und Haustiergenetik der
Justus-Liebig-Universität Gießen
EINFLUSS DER FUSSBODENGESTALTUNG AUF DAS AUFTRETEN VON
VERSCHMUTZUNGEN UND FUSSLÄSIONEN BEI MASTKANINCHEN
T. Masthoff, C. Lang und St. Hoy
Im Jahre 2014 wurde die deutsche Tierschutznutztierhaltungsverordnung (TierSchNutztV) um
Vorgaben zur Kaninchenhaltung ergänzt. Insbesondere in § 32 machte der Gesetzgeber die
Forderung verbindlich, dass die Spaltenweite für Mastkaninchen kleiner als 11 mm sein muss
und dass die erhöhte Ebene zu höchstens 15 % perforiert sein darf. Damit setzte sich der
Verordnungsgeber über vorliegende wissenschaftliche Erkenntnisse hinweg. LANG (2009)
hatte nämlich bereits nachgewiesen, dass ein Kunststoffrost mit einer Schlitzweite von 13 mm
und einer Auftrittsbreite von 5 mm (Perforationsanteil ca. 75 %) zu keinen gravierenden
haltungsbedingten Schäden an den Läufen führte. Im Ergebnis dieser Untersuchungen hatten
wir den Vorschlag unterbreitet und im Vorfeld der Erarbeitung dieses Kapitels der
TierSchNutztV (§§ 31 bis 37) wiederholt unterstrichen, dass der Passus zur Bodengestaltung
diese wissenschaftlich begründeten Ergebnisse berücksichtigen sollte. Wir erwarteten, dass
insbesondere die Vorgaben zu Schlitzweite und Perforationsanteil (15 %) sehr kritisch
bezüglich der Tiergesundheit wachsender Kaninchen zu bewerten sind. Ein internationales
Forschungsnetzwerk (anihwa-Projekt RABHO – HOY et al., 2017) gab uns nun die
Möglichkeit, mit Unterstützung des Bundesministeriums für Bildung und Forschung die
Realisierung dieser Fußboden-Vorschriften im Vergleich zu anderen Varianten der
Fußbodengestaltung bezüglich der Verschmutzung und der Verletzungsquote der Tiere zu
untersuchen.
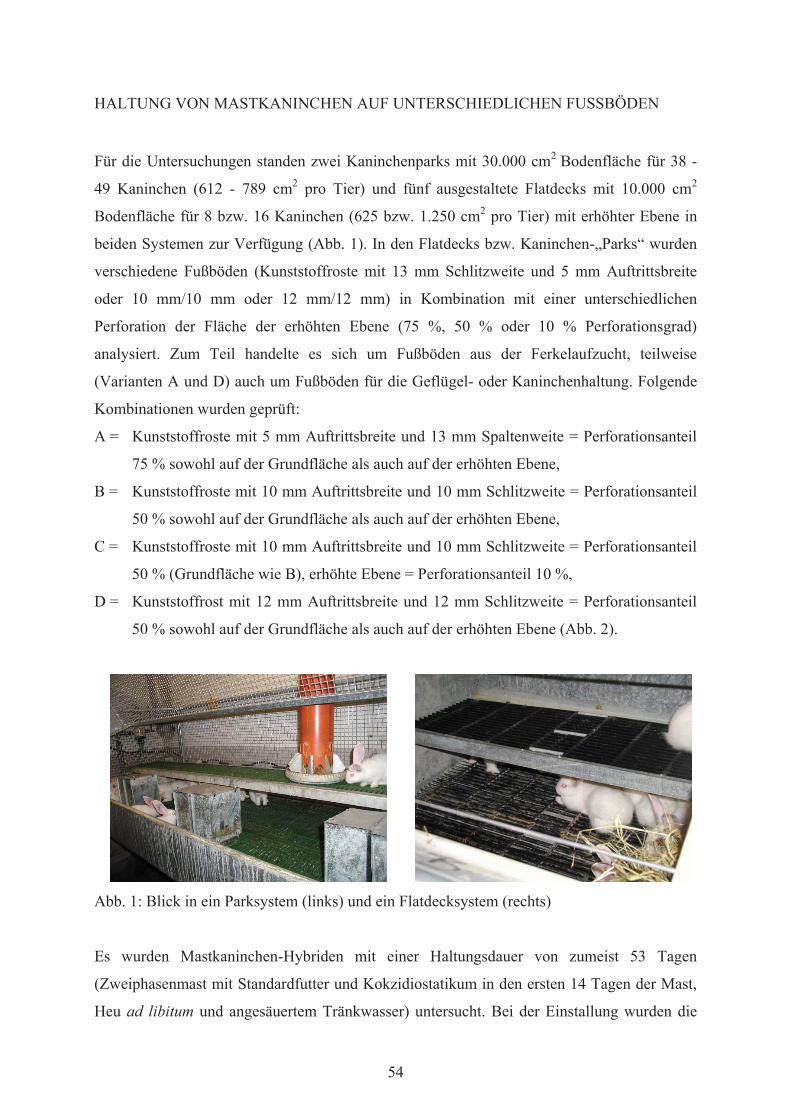
54
HALTUNG VON MASTKANINCHEN AUF UNTERSCHIEDLICHEN FUSSBÖDEN
Für die Untersuchungen standen zwei Kaninchenparks mit 30.000 cm2 Bodenfläche für 38 -
49 Kaninchen (612 - 789 cm2 pro Tier) und fünf ausgestaltete Flatdecks mit 10.000 cm2
Bodenfläche für 8 bzw. 16 Kaninchen (625 bzw. 1.250 cm2 pro Tier) mit erhöhter Ebene in
beiden Systemen zur Verfügung (Abb. 1). In den Flatdecks bzw. Kaninchen-„Parks“ wurden
verschiedene Fußböden (Kunststoffroste mit 13 mm Schlitzweite und 5 mm Auftrittsbreite
oder 10 mm/10 mm oder 12 mm/12 mm) in Kombination mit einer unterschiedlichen
Perforation der Fläche der erhöhten Ebene (75 %, 50 % oder 10 % Perforationsgrad)
analysiert. Zum Teil handelte es sich um Fußböden aus der Ferkelaufzucht, teilweise
(Varianten A und D) auch um Fußböden für die Geflügel- oder Kaninchenhaltung. Folgende
Kombinationen wurden geprüft:
A = Kunststoffroste mit 5 mm Auftrittsbreite und 13 mm Spaltenweite = Perforationsanteil
75 % sowohl auf der Grundfläche als auch auf der erhöhten Ebene,
B = Kunststoffroste mit 10 mm Auftrittsbreite und 10 mm Schlitzweite = Perforationsanteil
50 % sowohl auf der Grundfläche als auch auf der erhöhten Ebene,
C = Kunststoffroste mit 10 mm Auftrittsbreite und 10 mm Schlitzweite = Perforationsanteil
50 % (Grundfläche wie B), erhöhte Ebene = Perforationsanteil 10 %,
D = Kunststoffrost mit 12 mm Auftrittsbreite und 12 mm Schlitzweite = Perforationsanteil
50 % sowohl auf der Grundfläche als auch auf der erhöhten Ebene (Abb. 2).
Abb. 1: Blick in ein Parksystem (links) und ein Flatdecksystem (rechts)
Es wurden Mastkaninchen-Hybriden mit einer Haltungsdauer von zumeist 53 Tagen
(Zweiphasenmast mit Standardfutter und Kokzidiostatikum in den ersten 14 Tagen der Mast,
Heu ad libitum und angesäuertem Tränkwasser) untersucht. Bei der Einstallung wurden die

55
Tiere einzeln gewogen und gesext. Nach zwei Haltungswochen erfolgte die Umstellung auf
ein Aufzuchtfutter ohne Kokzidiostatikum. Nach vier Wochen und bei Ausstallung wurden
die Tiere erneut gewogen (Abb. 3).
Bei Ausstallung der Tiere zur Schlachtung erfolgte an 1.716 Tieren aus 12 Durchgängen
individuell eine Bonitur der (Hinter-)Läufe auf Verschmutzung (ohne, gering, mittel, stark)
und Verletzung (ohne, gering-, mittel-, hochgradig) (Abb. 4).
Abb. 2: Übersicht über die 4 untersuchten Fußbodenvarianten (A = Kunststoffroste mit 5 mm
Auftrittsbreite und 13 mm Spaltenweite = Perforationsanteil 75 %; B =
Kunststoffroste mit 10 mm Auftrittsbreite und 10 mm Schlitzweite =
Perforationsanteil 50 %; C = Grundfläche wie B, erhöhte Ebene = Perforationsanteil
10 %; D = Kunststoffrost mit 12 mm Auftrittsbreite und 12 mm Schlitzweite =
Perforationsanteil 50 %)

56
Abb. 3: Ablauf der Untersuchungen
Die statistische Bearbeitung erfolgte unter Zuhilfenahme des Statistik-Programmpaketes
SPSS Version 23. Zunächst und zugleich als Plausibilitätstest wurde die deskriptive Statistik
gerechnet. Zum Vergleich der Prozentsätze verschmutzter oder verletzter Tiere am Ende der
Haltung kam der Chi2-Unabhängigkeitstest in Kontingenztafeln zur Anwendung.
Abb. 4: Boniturschema für die Einstufung von Verschmutzungen und Verletzungen von 0 =
ohne Verschmutzung bzw. ohne Verletzung bis 4 (+++) mit schwerer Verschmutzung
oder Verletzung
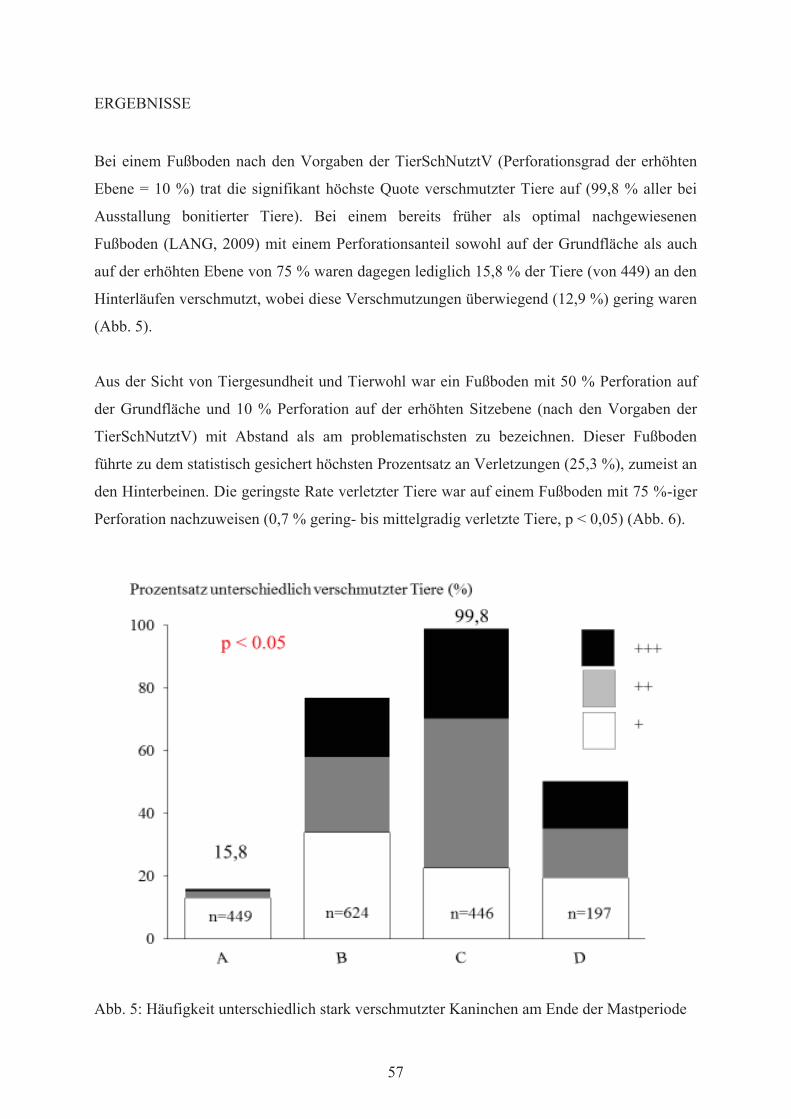
57
ERGEBNISSE
Bei einem Fußboden nach den Vorgaben der TierSchNutztV (Perforationsgrad der erhöhten
Ebene = 10 %) trat die signifikant höchste Quote verschmutzter Tiere auf (99,8 % aller bei
Ausstallung bonitierter Tiere). Bei einem bereits früher als optimal nachgewiesenen
Fußboden (LANG, 2009) mit einem Perforationsanteil sowohl auf der Grundfläche als auch
auf der erhöhten Ebene von 75 % waren dagegen lediglich 15,8 % der Tiere (von 449) an den
Hinterläufen verschmutzt, wobei diese Verschmutzungen überwiegend (12,9 %) gering waren
(Abb. 5).
Aus der Sicht von Tiergesundheit und Tierwohl war ein Fußboden mit 50 % Perforation auf
der Grundfläche und 10 % Perforation auf der erhöhten Sitzebene (nach den Vorgaben der
TierSchNutztV) mit Abstand als am problematischsten zu bezeichnen. Dieser Fußboden
führte zu dem statistisch gesichert höchsten Prozentsatz an Verletzungen (25,3 %), zumeist an
den Hinterbeinen. Die geringste Rate verletzter Tiere war auf einem Fußboden mit 75 %-iger
Perforation nachzuweisen (0,7 % gering- bis mittelgradig verletzte Tiere, p < 0,05) (Abb. 6).
Abb. 5: Häufigkeit unterschiedlich stark verschmutzter Kaninchen am Ende der Mastperiode
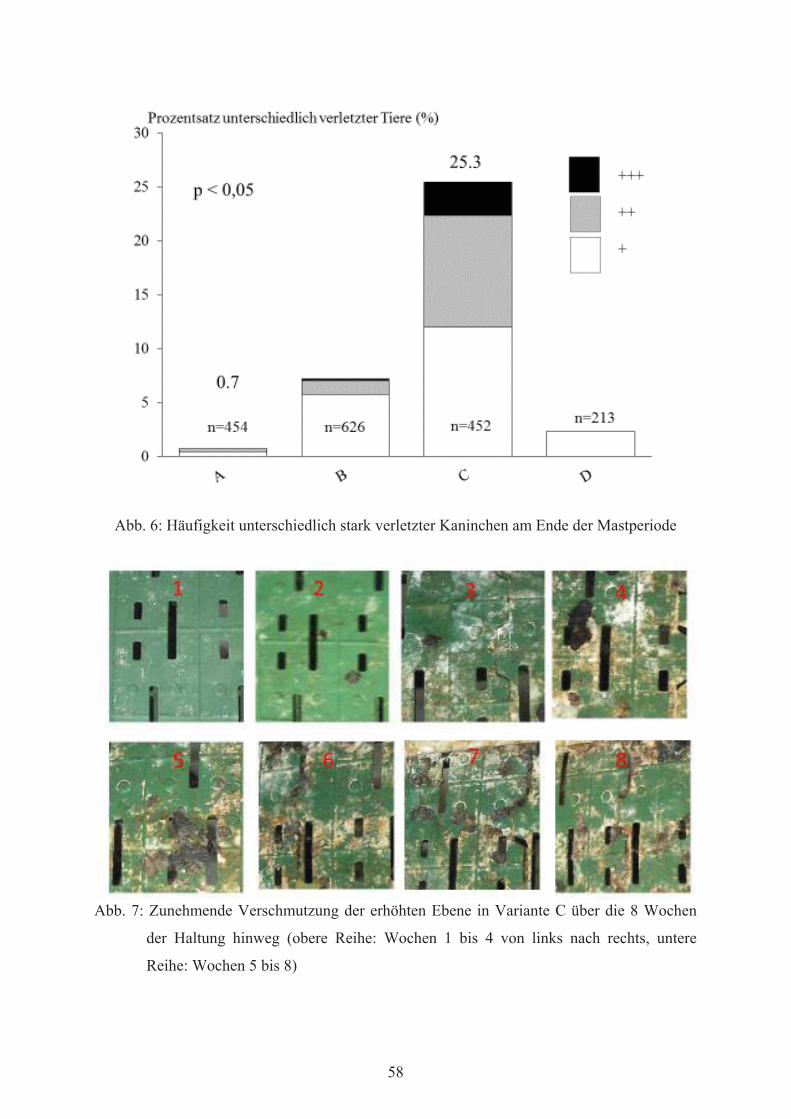
58
Abb. 6: Häufigkeit unterschiedlich stark verletzter Kaninchen am Ende der Mastperiode
Abb. 7: Zunehmende Verschmutzung der erhöhten Ebene in Variante C über die 8 Wochen
der Haltung hinweg (obere Reihe: Wochen 1 bis 4 von links nach rechts, untere
Reihe: Wochen 5 bis 8)
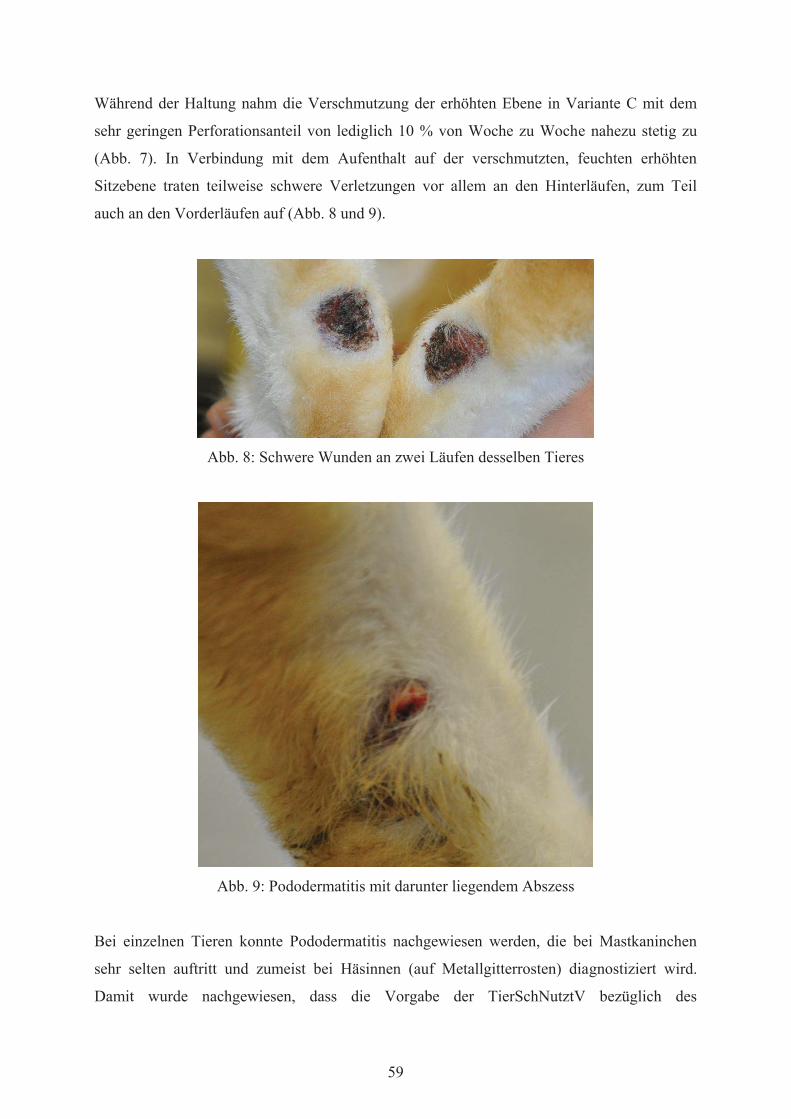
59
Während der Haltung nahm die Verschmutzung der erhöhten Ebene in Variante C mit dem
sehr geringen Perforationsanteil von lediglich 10 % von Woche zu Woche nahezu stetig zu
(Abb. 7). In Verbindung mit dem Aufenthalt auf der verschmutzten, feuchten erhöhten
Sitzebene traten teilweise schwere Verletzungen vor allem an den Hinterläufen, zum Teil
auch an den Vorderläufen auf (Abb. 8 und 9).
Abb. 8: Schwere Wunden an zwei Läufen desselben Tieres
Abb. 9: Pododermatitis mit darunter liegendem Abszess
Bei einzelnen Tieren konnte Pododermatitis nachgewiesen werden, die bei Mastkaninchen
sehr selten auftritt und zumeist bei Häsinnen (auf Metallgitterrosten) diagnostiziert wird.
Damit wurde nachgewiesen, dass die Vorgabe der TierSchNutztV bezüglich des
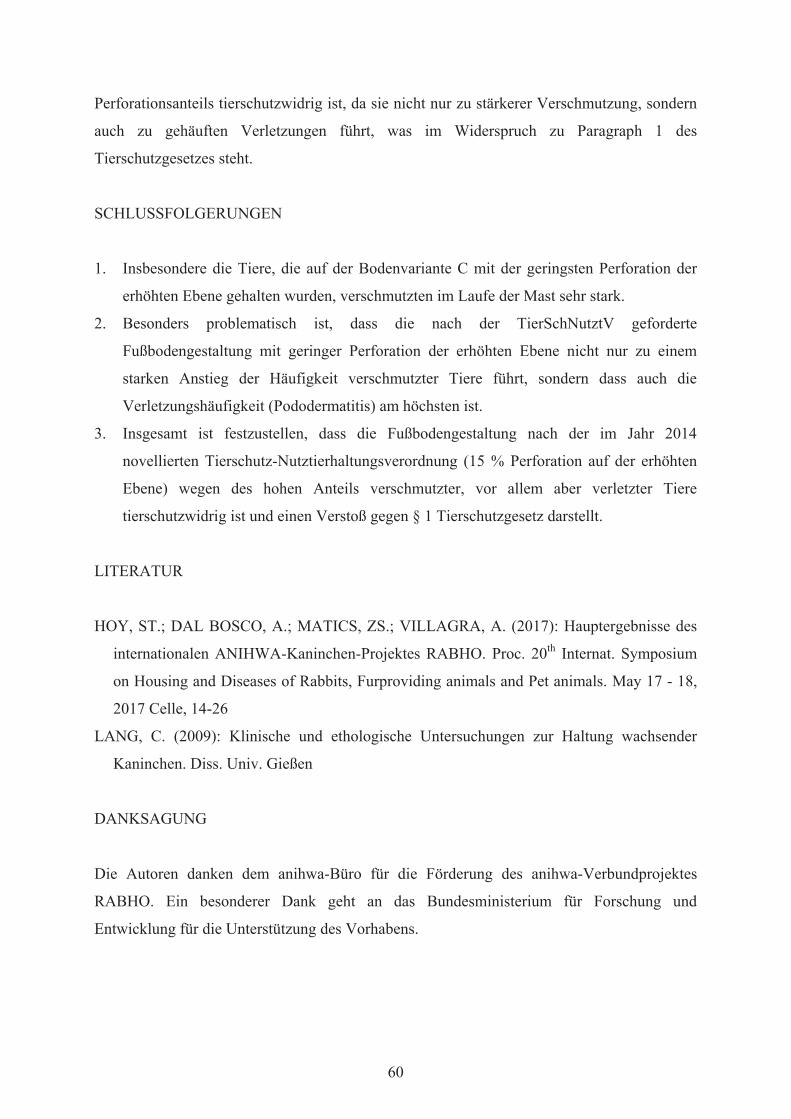
60
Perforationsanteils tierschutzwidrig ist, da sie nicht nur zu stärkerer Verschmutzung, sondern
auch zu gehäuften Verletzungen führt, was im Widerspruch zu Paragraph 1 des
Tierschutzgesetzes steht.
SCHLUSSFOLGERUNGEN
1. Insbesondere die Tiere, die auf der Bodenvariante C mit der geringsten Perforation der
erhöhten Ebene gehalten wurden, verschmutzten im Laufe der Mast sehr stark.
2. Besonders problematisch ist, dass die nach der TierSchNutztV geforderte
Fußbodengestaltung mit geringer Perforation der erhöhten Ebene nicht nur zu einem
starken Anstieg der Häufigkeit verschmutzter Tiere führt, sondern dass auch die
Verletzungshäufigkeit (Pododermatitis) am höchsten ist.
3. Insgesamt ist festzustellen, dass die Fußbodengestaltung nach der im Jahr 2014
novellierten Tierschutz-Nutztierhaltungsverordnung (15 % Perforation auf der erhöhten
Ebene) wegen des hohen Anteils verschmutzter, vor allem aber verletzter Tiere
tierschutzwidrig ist und einen Verstoß gegen § 1 Tierschutzgesetz darstellt.
LITERATUR
HOY, ST.; DAL BOSCO, A.; MATICS, ZS.; VILLAGRA, A. (2017): Hauptergebnisse des
internationalen ANIHWA-Kaninchen-Projektes RABHO. Proc. 20th Internat. Symposium
on Housing and Diseases of Rabbits, Furproviding animals and Pet animals. May 17 - 18,
2017 Celle, 14-26
LANG, C. (2009): Klinische und ethologische Untersuchungen zur Haltung wachsender
Kaninchen. Diss. Univ. Gießen
DANKSAGUNG
Die Autoren danken dem anihwa-Büro für die Förderung des anihwa-Verbundprojektes
RABHO. Ein besonderer Dank geht an das Bundesministerium für Forschung und
Entwicklung für die Unterstützung des Vorhabens.
61
Anschrift der Verfasser:
Till Masthoff
Dr. Caroline Lang
Prof. Dr. Steffen Hoy
Justus-Liebig-Universität Gießen
Institut für Tierzucht und Haustiergenetik
Leihgesterner Weg 52
D-35392 Gießen

62
1) Professur für Ernährungsphysiologie und Tierernährung, Universität Rostock 2) Speers Hoff, Stelle
EINFLÜSSE VERSCHIEDENER EINSTREUMATERIALIEN AUF DIE
FUßBALLENGESUNDHEIT BEI KANINCHEN IN DER HEIMTIERHALTUNG
P. Wolf1) und R. Speer2)
1. EINLEITUNG
Das Auftreten von Läsionen im Bereich der Fußballen gehört bei Kaninchen in der
Heimtierhaltung zu einem häufigen gesundheitlichen Problem. Neben genetischen Faktoren
sind auch die Haltungsbedingungen der Tiere prädisponierend. So führen fehlerhafte
Einstreumaterialien mit unzureichender Saugleistung rasch dazu, dass die Tiere nass sitzen
und die Fußsohlen entsprechend über einen längeren Zeitraum feucht sind. Diese
Gegebenheiten konnten bereits beim Nutzgeflügel als die eigentliche Ursache für das
Auftreten von Fußballenläsionen identifiziert werden. In der Kaninchenhaltung kommt noch
ein nur partieller bzw. insgesamt seltener Austausch des Einstreumaterials hinzu. Somit sind
die Tiere häufig gezwungen, längere Zeit auf feuchter Einstreu zu sitzen. Diese Problematik
wird zudem durch den Umstand forciert, dass Kaninchen in der Heimtierhaltung nicht selten
adipös sind, so dass mit dem Übergewicht quasi ein höherer Druck auf die Auflagefläche der
Fußsohle ausgeübt wird. In der vorliegenden Studie sollte der Einfluss verschiedener
Einstreumaterialien auf die Fußgesundheit von Kaninchen geprüft werden, wobei
Mastkaninchen als Modeltiere für adipöse und damit schwerere Zwergkaninchen gewählt
wurden.
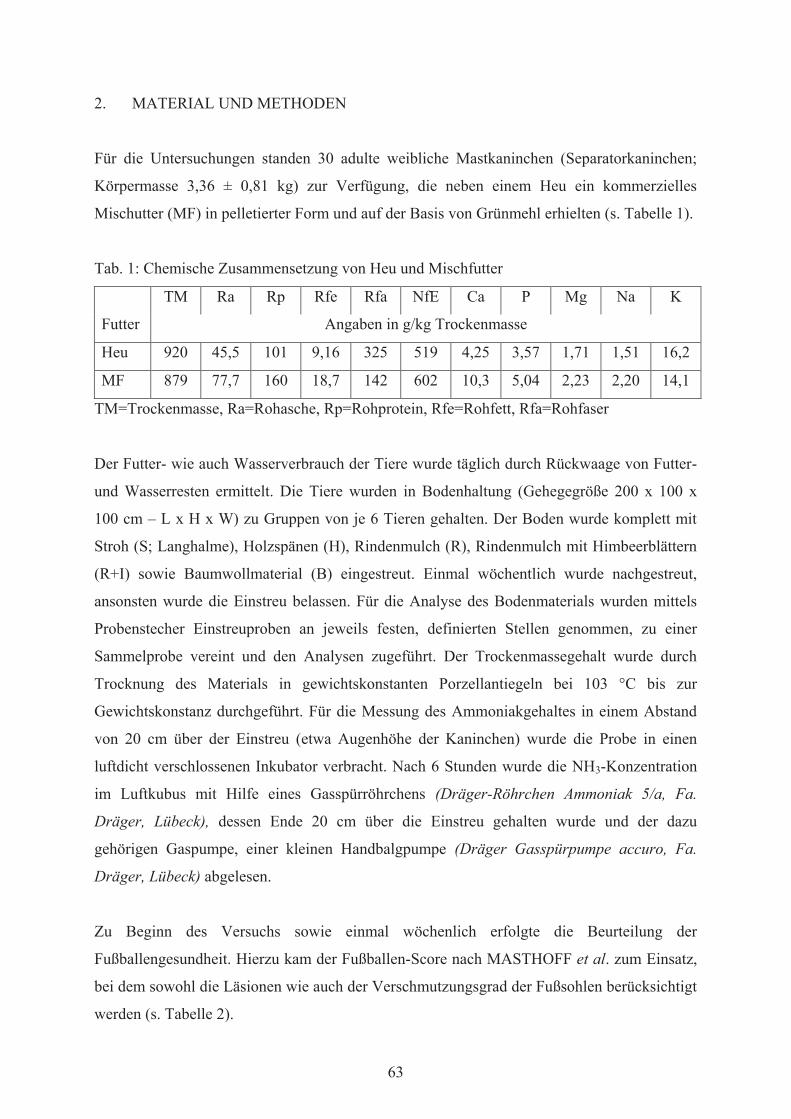
63
2. MATERIAL UND METHODEN
Für die Untersuchungen standen 30 adulte weibliche Mastkaninchen (Separatorkaninchen;
Körpermasse 3,36 ± 0,81 kg) zur Verfügung, die neben einem Heu ein kommerzielles
Mischutter (MF) in pelletierter Form und auf der Basis von Grünmehl erhielten (s. Tabelle 1).
Tab. 1: Chemische Zusammensetzung von Heu und Mischfutter
TM Ra Rp Rfe Rfa NfE Ca P Mg Na K
Futter Angaben in g/kg Trockenmasse
Heu 920 45,5 101 9,16 325 519 4,25 3,57 1,71 1,51 16,2
MF 879 77,7 160 18,7 142 602 10,3 5,04 2,23 2,20 14,1
TM=Trockenmasse, Ra=Rohasche, Rp=Rohprotein, Rfe=Rohfett, Rfa=Rohfaser
Der Futter- wie auch Wasserverbrauch der Tiere wurde täglich durch Rückwaage von Futter-
und Wasserresten ermittelt. Die Tiere wurden in Bodenhaltung (Gehegegröße 200 x 100 x
100 cm – L x H x W) zu Gruppen von je 6 Tieren gehalten. Der Boden wurde komplett mit
Stroh (S; Langhalme), Holzspänen (H), Rindenmulch (R), Rindenmulch mit Himbeerblättern
(R+I) sowie Baumwollmaterial (B) eingestreut. Einmal wöchentlich wurde nachgestreut,
ansonsten wurde die Einstreu belassen. Für die Analyse des Bodenmaterials wurden mittels
Probenstecher Einstreuproben an jeweils festen, definierten Stellen genommen, zu einer
Sammelprobe vereint und den Analysen zugeführt. Der Trockenmassegehalt wurde durch
Trocknung des Materials in gewichtskonstanten Porzellantiegeln bei 103 °C bis zur
Gewichtskonstanz durchgeführt. Für die Messung des Ammoniakgehaltes in einem Abstand
von 20 cm über der Einstreu (etwa Augenhöhe der Kaninchen) wurde die Probe in einen
luftdicht verschlossenen Inkubator verbracht. Nach 6 Stunden wurde die NH3-Konzentration
im Luftkubus mit Hilfe eines Gasspürröhrchens (Dräger-Röhrchen Ammoniak 5/a, Fa.
Dräger, Lübeck), dessen Ende 20 cm über die Einstreu gehalten wurde und der dazu
gehörigen Gaspumpe, einer kleinen Handbalgpumpe (Dräger Gasspürpumpe accuro, Fa.
Dräger, Lübeck) abgelesen.
Zu Beginn des Versuchs sowie einmal wöchenlich erfolgte die Beurteilung der
Fußballengesundheit. Hierzu kam der Fußballen-Score nach MASTHOFF et al. zum Einsatz,
bei dem sowohl die Läsionen wie auch der Verschmutzungsgrad der Fußsohlen berücksichtigt
werden (s. Tabelle 2).
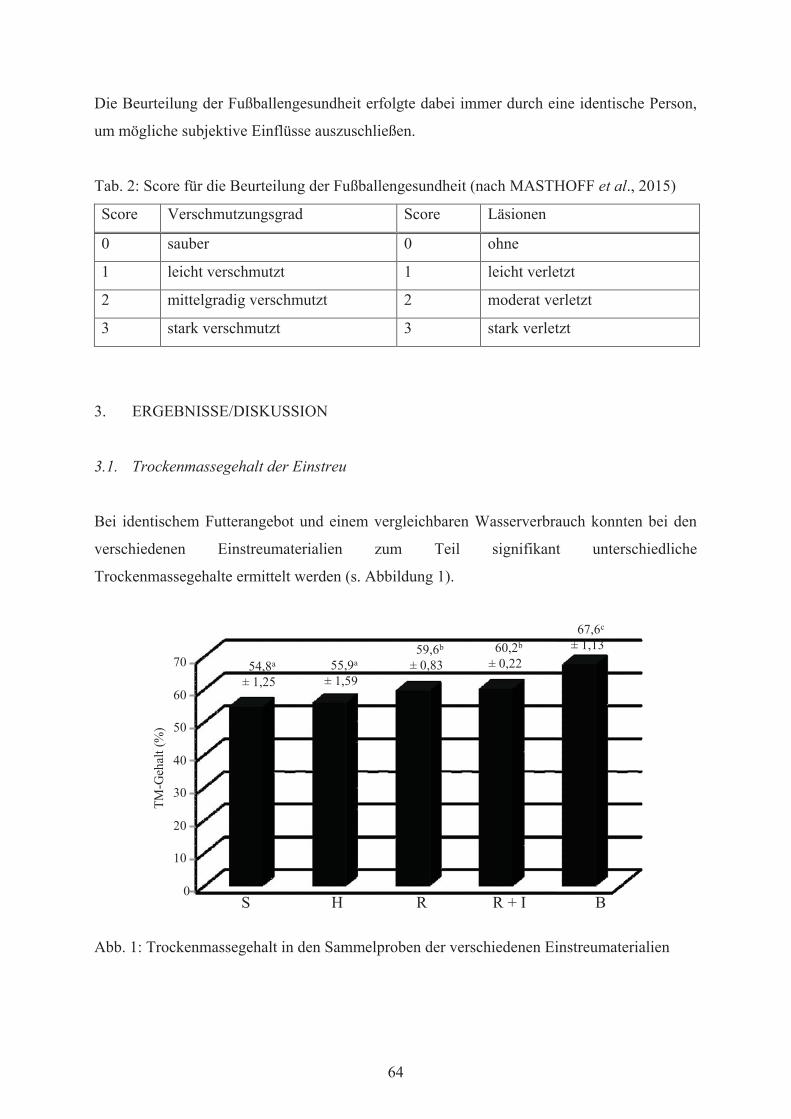
64
Die Beurteilung der Fußballengesundheit erfolgte dabei immer durch eine identische Person,
um mögliche subjektive Einflüsse auszuschließen.
Tab. 2: Score für die Beurteilung der Fußballengesundheit (nach MASTHOFF et al., 2015)
Score Verschmutzungsgrad Score Läsionen
0 sauber 0 ohne
1 leicht verschmutzt 1 leicht verletzt
2 mittelgradig verschmutzt 2 moderat verletzt
3 stark verschmutzt 3 stark verletzt
3. ERGEBNISSE/DISKUSSION
3.1. Trockenmassegehalt der Einstreu
Bei identischem Futterangebot und einem vergleichbaren Wasserverbrauch konnten bei den
verschiedenen Einstreumaterialien zum Teil signifikant unterschiedliche
Trockenmassegehalte ermittelt werden (s. Abbildung 1).
Abb. 1: Trockenmassegehalt in den Sammelproben der verschiedenen Einstreumaterialien
0
10
20
30
40
50
60
70
S H R R + I B
TM-G
ehal
t (%
)
54,8a
± 1,2555,9a
± 1,59
59,6b
± 0,8360,2b
± 0,22
67,6c
± 1,13

65
Der signifikant höchste Trockenmassegehalt konnte bei Einsatz der Baumwolle ermittelt
werden. Etwas feuchter war die Einstreu bei Einsatz von Rindenmulch, wobei der Zusatz der
Himbeerblätter für den Trockenmassegehalt keinerlei Effekt hatte. Zwischen dem
langhalmigen Stroh und den Holzspänen bestanden keine signifikanten Unterschiede im
Trockenmassegehalt. Beide Einstreumaterialien wiesen im Vergleich zu Rindenmulch und
Baumwolleinstreu den signifikant höchsten Feuchtegehalt auf.
Diese Unterschiede dürften zunächst auf die unterschiedliche Verdichtung der Einstreu
zurückzuführen sein. Die zwischen den einzelnen Partikeln des Rindenmulchs vorliegenden
Zwischenräume erlauben eine Luftzirkulation zwischen den einzelnen Partikeln, wodurch
eine raschere Abtrocknung gegeben ist. Bei den Holzspänen kommt es hingegen zu einer
Verdichtung des Materials. Während Rindenmulch zudem einen porösen Aufbau aufweist, hat
Stroh – insbesondere langhalmige Qualitäten – ein geringeres Wasserhaltevermögen.
3.2. Ammoniakgehalt über der Einstreu
Beim Ammoniak konnten keine statistisch signifikanten Unterschiede zwischen den einzelnen
Gruppen ermittelt werden (s. Abbildung 2). Allerdings zeigte sich, dass die Baumwolleinstreu
die höchste Geruchsbindungskapazität aufwies, hier konnten 20 cm über der Einstreu mit 1,15
ppm die geringsten Ammoniak-Gehalte gemessen werden. Die höchsten Konzentrationen
konnten in der Luft über dem Stroh gefunden werden. Stroh stellt eines der am häufigsten
verwendeten Einstreumaterialien in der Heimtierhaltung dar (BERGHOFF, 1989; BEYNON
u. COOPER, 1997; SCHALL, 2008), bietet den Tieren zusätzlich Beschäftigungs-
möglichkeiten (Spielen, Nagen, Graben), ermöglicht somit arttypische Verhaltensweisen und
reichert die Umwelt der Tiere an (ARRP, 2003). In diesem Fall trug es aber nichts zu einem
reduzierten Ammoniakgehalt in der Luft bei.
In Studien von LIPMAN (1999) sowie RAS et al. (2002) konnte gezeigt werden, dass nach
Einsatz von Holzspänen höhere NH3-Konzentrationen ermittelt wurden, was sich mit den
vorliegenden Ergebnissen deckt. Dem folgten Cellulose-Einstreu und Mais-Granulat (corn
cob substrate), bei dessen Einsatz die geringsten NH3-Emissionen entstanden.
In den vorliegenden Untersuchungen kam es bei Einsatz von Baumwolle zu den deutlichsten
Effekten auf die NH3-Freisetzung.
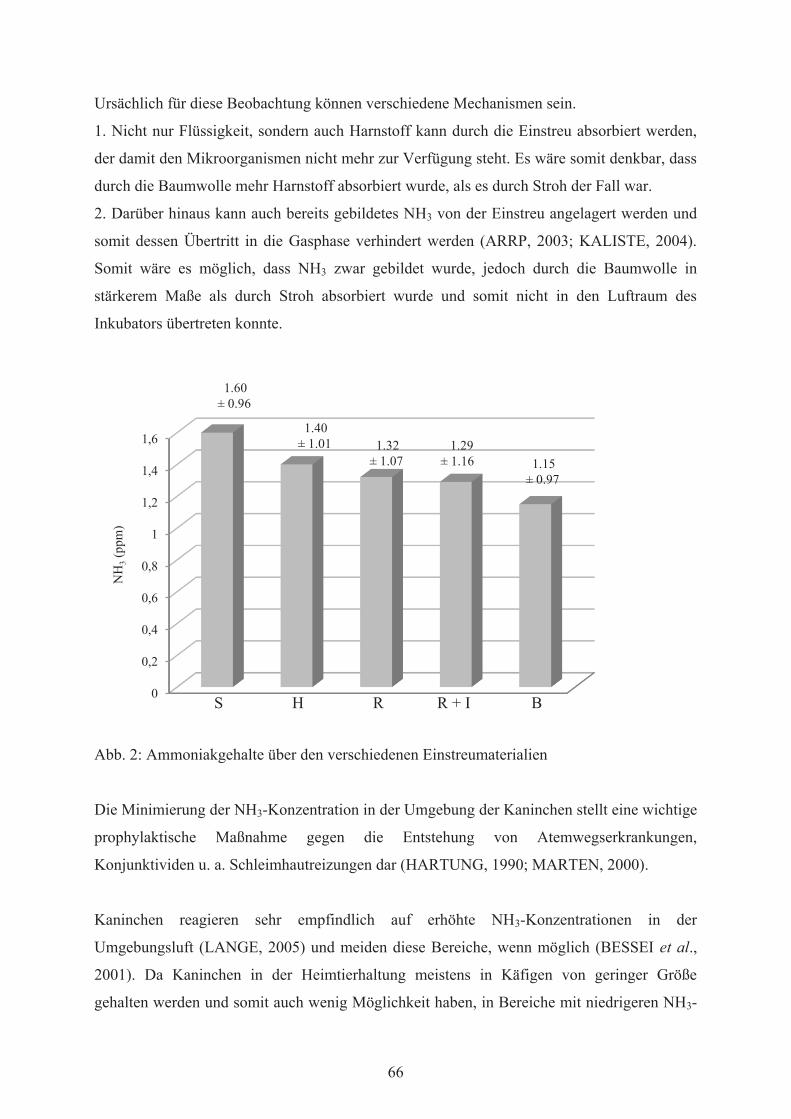
66
Ursächlich für diese Beobachtung können verschiedene Mechanismen sein.
1. Nicht nur Flüssigkeit, sondern auch Harnstoff kann durch die Einstreu absorbiert werden,
der damit den Mikroorganismen nicht mehr zur Verfügung steht. Es wäre somit denkbar, dass
durch die Baumwolle mehr Harnstoff absorbiert wurde, als es durch Stroh der Fall war.
2. Darüber hinaus kann auch bereits gebildetes NH3 von der Einstreu angelagert werden und
somit dessen Übertritt in die Gasphase verhindert werden (ARRP, 2003; KALISTE, 2004).
Somit wäre es möglich, dass NH3 zwar gebildet wurde, jedoch durch die Baumwolle in
stärkerem Maße als durch Stroh absorbiert wurde und somit nicht in den Luftraum des
Inkubators übertreten konnte.
Abb. 2: Ammoniakgehalte über den verschiedenen Einstreumaterialien
Die Minimierung der NH3-Konzentration in der Umgebung der Kaninchen stellt eine wichtige
prophylaktische Maßnahme gegen die Entstehung von Atemwegserkrankungen,
Konjunktividen u. a. Schleimhautreizungen dar (HARTUNG, 1990; MARTEN, 2000).
Kaninchen reagieren sehr empfindlich auf erhöhte NH3-Konzentrationen in der
Umgebungsluft (LANGE, 2005) und meiden diese Bereiche, wenn möglich (BESSEI et al.,
2001). Da Kaninchen in der Heimtierhaltung meistens in Käfigen von geringer Größe
gehalten werden und somit auch wenig Möglichkeit haben, in Bereiche mit niedrigeren NH3-
0
0,2
0,4
0,6
0,8
1
1,2
1,4
1,6
NH
3(p
pm)
1.60± 0.96
1.40± 1.01 1.32
± 1.071.29
± 1.16 1.15± 0.97
S H R R + I B

67
Konzentrationen auszuweichen, ist davon auszugehen, dass durch eine Reduktion der NH3-
Emissionen das Wohlbefinden der Tiere gesteigert würde.
Der Einfluss von NH3 auf die Entstehung von Dermatitiden der Sohlenflächen wird bei
verschiedenen Tierarten, z.B. Puten diskutiert, beim Kaninchen liegen hierzu keine
Untersuchungen vor. Es ist jedoch zu vermuten, dass hier identische Pathomechanismen
vorliegen. Insgesamt gelten ungeeignete Böden, fehlende Einstreu, Stressbelastung und
Übergewicht durch Adipositas als unmittelbare Ursachen für sog. „wunde Läufe“
(SCHLOLAUT, 1998; WOLF, 2005).
3.3. Fußballengesundheit
Einmal wöchentlich wurden die Fußsohlen der Kaninchen beurteilt. Neben dem Grad der
Verschmutzung wurde dabei insbesondere auch auf Läsionen geachtet (s. Tabelle 3).
Tab. 3: Beurteilung der Fußballengesundheit von Kaninchen in Abhängigkeit zur Einstreu
Fußballengesundheit
Einstreu Verschmutzung Läsionen
Stroh 0,9a ± 0,3 2,1a ± 0,5
Holzspäne 1,0a ± 0,2 1,9a ± 0,4
Rindenmulch 2,4b ± 0,3 1,7a ± 0,5
Rindenmulch + Himbeerblätter 2,0b ± 0,2 1,5a ± 0,2
Baumwolle 0,1c ± 0,0 0,6b ± 0,2
Den signifikant geringsten Verschmutzungsgrad der Läufe wiesen die Kaninchen auf, die auf
Baumwolleinstreu gehalten wurden, gefolgt von Stroh und Holzspänen. Hierbei handelt es
sich um Materialien, die per se keine Färbung aufweisen, somit die Läufe auch nicht
einfärben können. Anders verhielt es sich mit dem Rindenmulch. Dieser weist eine gewisse
Eigenfärbung auf, der in Verbindung mit den Huminsäuren zu einer Verfärbung der Läufe
(aber auch den Unterbauchs beim ausgetreckten Liegen) führte. Eine Verschmutzung durch
Kot und Harn fand zwar ebenfalls statt, da die Tiere in den einzelnen Gruppen allerdings eine
identische Fütterung erhielten, dürfte der Effekt hier nicht zum Tragen gekommen sein,
sondern sich in erster Linie auf die Einstreumaterialien zurückführen lassen.

68
Den höchsten Grad an Läsionen zeigten die Kaninchen auf der Stroheinstreu. Hierfür ist
vermutlich weniger eine mechanische Noxe der längeren Strohhalme verantwortlich zu
machen, als vielmehr der höhere Feuchtegehalt (s. Abbildung 1).
Zu den meist diskutierten Einflussfaktoren auf die Fußballengesundheit von
Wirtschaftsgeflügel zählen das Körpergewicht, die Genetik, das Stallklima, die Besatzdichte,
die Fütterung, das Einstreumaterial sowie die Einstreufeuchte (MAYNE et al., 2006; GROßE-
LIESNER, 2007; BERK, 2009; YOUSSEF, 2011; BELLOF et al., 2014). In diesem
Zusammenhang haben somit auch die Einstreuart und die damit verbundene
Wasserbindungskapazität des Materials zunehmend an Bedeutung. Studien an Putenhennen
bewiesen, dass Hobelspäne und Häckselstroh bzw. die Kombination aus beiden
Einstreuvarianten im Gegensatz zu Lignozellulose als Einstreu wesentlich schlechter
abschnitten und einen negativen Effekt auf die Fußballengesundheit hatten (BERK, 2009). In
dieser Studie schnitten die Holzspäne und das Stroh ebenfalls schlechter ab.
Auch hier beim Kaninchen zeigte sich, dass einer der entscheidenden Faktoren für das
Auftreten von Fußballennekrosen (Foot Pad Dermatits, FPD) die Feuchte ist, denen die
Fußsohle ausgesetzt wird.
Beim Wirtschaftsgeflügel kam es bei Feuchtigkeitsgehalten der Einstreu von über 35 % und
einer Exposition der Tiere von mehr als 4 Stunden am Tag zu einem erhöhten Aufkommen an
Pododermatiden. Empfehlungen gehen daher davon aus, dass die Einstreufeuchte nicht mehr
als 30 % betragen sollte, um eine gute Fußballengesundheit zu gewährleisten. In dieser Studie
konnten mit Ausnahme der Baumwolle bei allen anderen Einstreumaterialien Läsionen bei
den Kaninchen gefunden werden, so dass dieser Grenzwert auch in der Kaninchenhaltung
gerechtfertigt scheint. Das Auftreten von Läsionen war dabei jedoch nicht so stark ausgeprägt
wie beim Nutzgeflügel. Das mag zum einen daran liegen, dass Kaninchen die Körpermasse
auf vier Beine verteilen, wobei die Hinterläufe zudem eine größere Auflagefläche besitzen.
Zudem sind die Fußsohlen des Kaninchens behaart, während diese Isolierung beim Geflügel
fehlt.

69
4. ZUSAMMENFASSUNG
Ähnlich wie beim Nutzgeflügel dürfte das Auftreten einer Pododermatitis von der Feuchte des
Eintreumaterials beeinflusst werden. Die günstigsten Werte hinsichtlich Trockenmasse, NH3
und auch Bonitur waren allgemein bei Baumwolleinstreu zu beobachten. Hierfür dürften die
hohe Wasserbindung, die schnellere Wasserabgabe sowie Struktureffekte des Materials
verantwortlich sein.
5. SUMMARY
As observed in poultry a pododermatitis in rabbits is also caused by the moisture content of
the litter material. The most favourable data with respect to dry matter contents, NH3 und
score have been measured using cotton litter. This is probably mainly due to the high water
binding and delivery capacity and the effects of the structure of this material.
6. SCHRIFTTUM
ARRP (2003): Guideline for the housing of rabbits in scientific instsitutions. Animal
Research Review Panel (ARRP) Guidelines 18, 1-35
BELLOF, G.; BRANDL, G.M.; SCHMIDT, E.; CARRASCO, S.; SCHADE, B (2014):
Einfluss unterschiedlicher Fütterungsintensität und Haltungsform auf die Mastleistung und
den Schlachtkörperwert von langsam oder schnell wachsenden Genotypen in der
ökologischen Putenmast. Europ. Poult. Sci. 78, DOI: 10.1399/eps.2014.31.
BERGHOFF, P.C. (1989): Tierärztliche Heimtierpraxis Band 1: Kleine Heimtiere und ihre
Erkrankungen. 1. Aufl. Verlag Paul Parey, Berlin, Hamburg, S. 1-132
BERK, J. (2009): Effekte der Einstreuart auf Tiergesundheit und Tierleistungen bei
Putenhennen. In: RAHMANN, G.; SCHUMACHER, U. (Hrsg.) Neues aus der
Ökologischen Tierhaltung, 23-29
BESSEI, W.; TINZ, J.; REITER, K (2001): Die Präferenz von Mastkaninchen für
Kunststoffgitter und Tiefstreu bei unterschiedlichen Temperaturen. In: Proc. 12.
Arbeitstagung über Haltung und Krankheiten der Kaninchen, Pelztiere und Heimtiere. 09.-
10. Mai 2001 in Celle, 133-137
BEYNON, P.H.; COOPER, J.E. (1997): Kompendium der Heimtiere Haltung – Diagnostik –
Therapie. 1. Aufl. Verlag Schlütersche, Hannover, S. 70-100
70
GROßE-LIESNER, B. (2007): Vergleichende Untersuchungen zur Mast- und
Schlachtleistung sowie zum Auftreten (Häufigkeit/Intensität) primär nicht-infektiöser
Gesundheitsstörungen bei Puten fünf verschiedener Linien. Dissertation, Tierärztliche
Hochschule, Hannover
HARTUNG, J. (1990): Wirkung von Ammoniak auf Nutztiere. In: Kuratorium für Technik
und Bauwesen in der Landwirtschaft (Hrsg.): Ammoniak in der Umwelt: Kreisläufe,
Wirkungen, Minderung, KTBL-Schrift 341, Landwirtschaftsverlag GmbH, Münster, 14.1-
14.11
KALISTE, E. (2004): The welfare of laboratory animals. 1. Aufl. Verlag Kluwer, Dordrecht,
S. 40-222
KAMPHUES, J.; YOUSSEF, I.; ABD EL-WAHAB, A.; ÜFFING, B.; WITTE, M.; TOST, M.;
(2011): Einflüsse der Fütterung und Haltung auf die Fußballengesundheit bei Hühnern und
Puten. Übers. Tierernährg. 39(2), 147-195
LANGE, K. (2005): Anforderungen an die Haltung von Kaninchen. In: PETERSEN, J.
(Hrsg): Kaninchenfleischgewinnung. 1. Aufl. Verlag Oertel und Spörer, Reutlingen, S. 50-
65
MARTEN, J. (2000): Leitsatz: Bauliche Anlagen für die Pferdehaltung. In Zusammenarbeit
mit der KTBL - Arbeitsgemeinschaft „Bauwesen“. KTBL Arbeitsblatt Nr. 1108: Bauwesen
und Tierhaltung
MAYNE, R.; HOCKING, P.; ELSE, R. (2006): Foot pad dermatitis develops at an early age
in commercial turkeys. British poultry science 47 (1), 36-42
LIPMAN, N.S. (1999): Isolator rodent caging systems (state of the art): a critical review.
Contemporary Topics in Laboratory Animal Science 38, 9-17
MASTHOFF, T.; LANG, C.; BUHL, M.; HOY, S (2015): Einfluss der Bodengestaltung auf
Verschmutzung des Bodens und die Gesundheit der Läufe von Mastkaninchen. Proc. 19.
Tagung über Haltung und Krankheiten der Kaninchen, Pelztiere und Heimtiere, 27-28. Mai
2015, S. 284-297
RAS, T.; VAN DE VEN, M.; PATTERSON-KANE, E.G.; NELSON, K. (2002): Rats’
preferences for corn versus wood-based bedding and nesting materials. Lab. Anim. 36,
420-425
SCHALL, H. (2008): Kaninchen. In: GABRISCH, K.; ZWART, P. (Hrsg.): Krankheiten der
Heimtiere. 7. Aufl. Verlag Schlütersche, Hannover, S. 1-47
SCHLOLAUT, W. (2002): Das Hauskaninchen als Nutztier. www.lohmann-information.com,
Seite 1-11

71
WOLF, P. (2005): Ernährung der Heimtiere - Adipositas. Kleintier konkret 1, 19-22
Youssef, I. (2011): Experimental studies on effects of diet composition and litter quality on
development and severity of foot pad dermatitis in growing turkeys. Dissertation,
Tierärztliche Hochschule, Hannover
Anschrift der Verfasser:
Professur für Ernährungsphysiologie und Tierernährung
Universität Rostock
Justus-von-Liebig-Weg 6b
18059 Rostock

72
Kaposvár University, Kaposvár, Guba S. u. 40. Hungary
NURSING BEHAVIOUR OF RABBIT DOES WHICH
WERE NURSED ONCE OR TWICE A DAY (PRELIMINARY RESULTS)
L. Kacsala, R. Kasza, K. Terhes,
Zs. Gerencsér, I. Radnai, V. Ács and Zs. Matics
1. INTRODUCTION
The growing of kits is affected by the genetic background, maternal and environmental
effects. Kits consume exclusively the does’ milk till the 3rd week of the lactation. As a well-
known fact, rabbit does nurse their kits usually once a day (ZARROW et al., 1965) for 3-4
minutes and the kits spend the rest of the day resting inside the nest material. The consumed
milk of the kits equals the 1/3 of their body weight (MORGADO et al., 2008). Due to this
increased consumption of milk, the kits are able to double their body weight within the first
week of the lactation (DAVIES et al., 1964).
Unlike the above, several scientist observed multiple nursing events within 24h. According to
HOY and SELZER (2002) in a “free-range” system, the number of daily nursing events
reached 2-3 events per day at the second week of the lactation. They observed that the main
nursing period of the domesticated rabbit was between 7 and 9 pm. This finding is in close
connection with the observation of SEITZ et al. (1998). In their experiment the rabbit does
visited the nests 0.8-2.2 times a day, and the average duration between two nursing events
was 16.5 hours. MATICS et al. (2002) published similar results. Till the 9th day of the
lactation in 25% of the days the does nursed their kits more than once in 24 hours, later,
between the 10th and 21st day of lactation the frequency of more nursing events per day
decreased a little, it was 21%. Other observations show that the frequency of the nursing
73
events can be increased by changing the time of it (let the does into the nest earlier than usual)
(GONZÁLEZ-MARISCAL, 2007).
The suckling kits consume only the does’ milk till 15-18 d of age, thus the growth and the
survival of the kits depend on the milk production and the willingness of the does. There is a
need to find a way to improve the utilization of growing traits and the maximization survival
of suckling kits in early age. The aim of the experiment was to examine the nursing behaviour
and some production traits of rabbit does which were nursed once or twice a day.
2. MATERIALS AND METHODS
The experiment was conducted at Kaposvár University with does and kits of Pannon Rabbit
Breeding Program. In the first part of the experiment female rabbits were selected (n=90) and
were divided into 10 litters (9 kits/litter). The litters were divided into two groups (5
litters/group). In group C kits were nursed once a day (controlled nursing was applied at 8
am) till 21 d of age. While in group D kits were nursed twice a day (8 am and 4 pm) by two
does (kindled at same time) till 21 d of age. Kits were weaned at 5 weeks of age and were
reared under similar conditions.
During the second part of the experiment the does were inseminated at 16.5 weeks of age and
forty-nine-day reproduction rhythm was applied. The does were housed in flat deck cages (86
* 38 * 30 cm, included the nest box: 28.5 * 38 cm). The temperature varied between 20 and
25°C. The daily lighting was 16 hours (7 am - 11 pm). Does received commercial diet ad
libitum. Does had free access to the nest. Infrared cameras were placed over the cages. Does
were monitored from the 2nd to the 14th d of lactation (24h/d) during the first (CI, DI) and
second (CII, DII) lactation.
Number and time of nursing events per day were recorded. Litters were checked every day,
number of dead kits was recorded. Individual body weight of kits was measured at 2, 6, 13
and 21 d of age at 8am. Average body weight and average weight gain of kits were calculated.
The nursing behaviour of the does was evaluated by Chi2-test. The body weight and weight
gain of kits were evaluated in a merged form (C = CI and CII; D = DI and DII) by using

74
independent t-test. The survival of kits was evaluated by Chi2-test. Statistical analyses were
done by SPSS 10.0 program.
3. RESULTS AND DISCUSSION
Table 1 shows the frequency of number of daily nursing events during the first and second
lactations. Overall in 41.8% of the days the does nursed their kits more than once a day (24h).
Double nursed does (DI and DII) nursed the kits at least two times a day during almost 60%
of the observed time, while in case of once nursed does (CI and CII) it was 18.3% in total
(P<0.001).
Table 1: Frequency of number of daily nursing events, %
CI1 DI2 CII3 DII4
n 45 48 48 48
1/24h 78 38 85 33
2/24h 22 48 15 56
3+/24h 0 6 0 10 1CI: First lactation of single nursed does 2DI: First lactation of double nursed does 3CII: Second lactation of single nursed does 4DII: Second lactation of double nursed does
It can be stated, that 47.8% of the nursing events took place during the dark period (2am-6am;
Table 2). Does in group C nursed their kits usually at the end of the dark period, but not later
than 2pm. On the other hand in case of group D nursing events were observed during the
whole day. In both lactation double nursed does show a clear nursing peak at 4 pm, which is
the time of the second nursing of the does (when these does were infant).
Table 2: Daily distribution of nursing events, % h n 22-0 0-2 2-4 4-6 6-8 8-10 10-12 12-14 14-16 16-18 18-20 20-22 ∑
CI1 61 1.6 11.5 32.8 27.9 9.8 13.1 3.3 0 0 0 0 0 100
DI2 89 12.4 11.2 19.1 14.6 21.3 5.6 2.2 0 0 7.9 5.6 0 100
CII3 55 0 12.7 23.6 41.8 10.9 0 5.5 5.5 0 0 0 0 100
DII4 85 5.9 7.1 16.5 15.3 16.5 7.1 7.1 3.5 0 9.4 2.4 9.4 100 1CI; 2DI; 3CII; 4DII: See in Table 1.

75
A tendency can be seen in the body weight of the kits in favour of group D, which is
statistically proved at the age of 13d (P<0.05) (Table 3). The relatively high SD of group C
could result the lack of significant differences in the other dates.
There are no differences in body weight gain between the groups. The nursing method of does
did not have influence on the survival of suckling kits.
Table 3: Body weight, weight gain and survival of suckling kits
Age, day C1 D2 P-value
n 68 68
Body weight, g
2 66.4±29.4 65.3±18.3 0.054
6 91.4±30.8 89.6±19.4 0.061
13 189±30.2 192±12.2 0.029
21 298±33.8 319±31.2 0.978
Weight gain, g/day
2-6 8.71±0.79 8.60±0.66 0.304
6-13 13.9±2.79 14.69±2.60 0.687
13-21 13.7±2.66 15.8±3.05 0.637
2-21 12.2±1.94 13.3±2.06 0.661
Survival of kits, %
2-21 91.2 91.2 1.000 1K: Kits of single nursed does; 2D: Kits of double nursed does
4. CONCLUSIONS
In general we can state, that the nursing method affects the kits’ nursing behaviour as adult
does. Double nursed does most likely nurse their kits multiple times/24h. The nursing method
of does (as kits) did not have effect on the body weight, weight gain or survival of the
suckling kits. Although the body weight of D kits differed significantly from group C at the
age of 13d (+2g, P<0.05). Further studies should cover the following lactation periods.
Increased doe number strongly suggested to refine the outcome.
76
5. SUMMARY
In this study we examined the nursing behaviour of does which were nursed once or twice a
day. Kits were nursed once (C) or twice (D) a day till 21 d of age. At 16.5 weeks of age
rabbits were artificially inseminated and were housed in flat deck cages. 16h lighting (6am-
10pm) and free nursing was applied. During the first two lactations does were monitored
24h/day by infrared cameras, distribution and time of nursing events were recorded. The
suckling kits’ body weight was measured, the weight gain and survival of kits were
calculated. Body weight Double nursed does (D) nursed their kits more than once within 24h
almost 65% of total observed days (P<0.001) compare to the single nursed group (C; 18.3%).
The nursing method of does did not affect the weight gain and the survival of the kits.
Although the body weight of D kits differed significantly from group C at age 13d (+2g).
Time of the nursing as a kit could have an effect on the nursing behaviour of the does. In this
experiment only the double nursed does (8am and 4pm) nursed their kits after 4pm. An
experiment with increased number of animals is needed to improve the results.
ACKNOWLEDGEMENT
Supported through the New National Excellence Program of the Ministry of Human
Capacities /ÚNKP-16-3/. Authors would like to thank the colleges of the Department of
Nutritional Science and Production Technology of Kaposvár University for their help and
support.
6. REFERENCES
1. DAVIES, J.S.; WIDDOWSON, E.M.; MCCANE, R.A. (1964): The intake of milk and the
retention of its constituents while the newborn rabbit doubles its weight. British Journal of
Nutrition 18, 385-392
2. GONZÁLEZ-MARISCAL, G. (2007): Mother rabbits and their offspring: timing is
everything. Developmental Psychobiology 49, 71-76
3. HOY, ST.; SELZER, D. (2002): Frequency and time of nursing in wild and domestic
rabbits housed outdoors in free range. World Rabbit Science 10, 77-84

77
4. MATICS, ZS.; SZENDRŐ, ZS.; HOY, ST.; NAGY, I.; RADNAI, I.; BIRÓ-NÉMETH, E.;
GYOVAI, M. (2004): Effect of different management methods on the nursing behaviour of
rabbits. World Rabbit Science 12, 95-108
5. MORGADO, E.; GORDON M.K.; MINANA-SOLIS, M.C.; MEZA, E.; LEVINE, S.;
ESCOBAR, C.; CABA, M. (2008): Hormonal and metabolic rhythms associated with the
daily scheduled nursing in rabbit pups. American Journal of Physiology. Regulatory,
Integrative and Comparative Physiology 295, 690-695
6. SEITZ, K.; HOY, ST.; LANGE, K. (1998): Untersuchungen zum Einfluss verschiedener
Faktoren auf das Säugeverhalten bei Hauskaninchen. Berliner und Münchener
Tierärztliche Wochenschrift 111, 48-52
7. ZARROW, M.X., DENENBERG, V.M., ANDERSON, C.O. (1965): Rabbit: Frequency of
suckling in the pup. Science 150, 1835-1836
Corresponding author:
Faculty of Agricultural and Environmental Sciences of
Kaposvár University
Guba S. u. 40.
7400 Kaposvár
Hungary

78
Department of Animal Breeding and Genetics Justus Liebig University Giessen
INFLUENCE OF DIFFERENT DURATIONS OF LIGHTING PERIOD ON BEHAVIOUR
AND PERFORMANCE OF GROWING RABBITS
C. Lang and T. Masthoff
1. INTRODUCTION
Animals are influenced by lighting durations. For example different lighting regimes were
used in broiler housing to reduce aggressive behaviour or to increase the performance. Also
some experiments were done with rabbit does but no information about the influence of
lighting regimes in growing rabbits were available (SZENDRŐ et al., 2015). The latest
version of the German Animal Welfare Farm Animal Husbandry Ordinance – “Segment 6
Rabbit” states to hold the animals between 8 and 16 hours per day in a long-term bright
period with at least 40 lux (measured on animal height). This corresponds to a practise-
customary lighting duration with artificial light between 8:00 am and 4:00 pm (8 h lighting
duration) or 6:00 am and 10:00 pm (16 h lighting duration). Whether these 2 different lighting
regimes influence rabbit behaviour or performance was examined in the present work.
2. MATERIALS AND METHODS
Animals
Respectively 10 rabbits (hybrid, ♀and ♂, 5 weeks old, ø 1 kg) were kept in two identically
equipped housing systems until slaughtering (after ø 53 d).

79
Housing system and video analysis
In 4 rounds in two identical Flatdecks with plastic slatted floor, 10 fattening rabbits
respectively were housed in a common way and fed with pelletized feedstuffs and hay and
water ad libitum (Fig. 1). Both flatdecks were opaque covered and lighted with a halogen bulb
(77 watt, 230 volt, 40 Lux measured on animal high). One flatdeck was lighted with duration
of 8 h whereas in the other flatdeck the lighting duration was 16 hours a day (both conform to
the Animal Welfare Livestock Husbandry Ordinance). After two rounds à eight weeks of
housing the lighting programme was changed between the two flatdecks to prevent a possible
position effect. In the fourth housing week in both flatdecks digital video observations with
infrared technique over 48 hours were done to analyse the behaviours of the rabbits. Every 10
minutes the number of rabbits was counted that were staying in front of, in or on the house
(dark retreat). Also the following behaviours of rabbits were observed and divided into active
and passive behaviours:
feeding hay
feeding pellets
drinking
jumping/running
sitting
lying
2-h-means were calculated, additionally, rabbits were weighed weekly and the daily feed and
water consumptions were measured.
Fig. 1: Design of the two flatdecks
active behavioural patterns
passive behavioural patterns
dark retreat

80
3. RESULTS AND DISCUSSION
The results show that the lighting duration had a significant influence on the position of
rabbits. When light was switched on, the number of rabbits staying in the dark retreat
increased and the number of rabbits staying outside decreased, regardless of the duration of
lighting (Fig. 2 and 3).
Fig. 2: Positions of rabbits during the day; 8 h lighting regime.
Fig. 3: Positions of the rabbits during the day; 16 h lighting regime.

81
After calculating average of 24-h, the results show, that in darkness and brightness rabbits
with 8 h lighting duration spent more time in the dark retreat than rabbits with 16 h lighting
(Fig. 4).
Fig. 4: Percentage of rabbits staying in the dark retreat subdivided in lighting duration and
darkness and brightness.
The main active behaviour was feeding. A difference between the 24-h mean of active
patterns of rabbits housed in flatdecks with 8 or 16 hours lighting duration did not exist. The
highest mean percentage of feeding in groups with 8 h lighting duration was found in times of
darkness. The situation was quite different in rabbits housed in a flatdeck with 16 h lighting
duration. The highest mean percentage of feeding rabbits was found in times of brightness but
also the lowest percentage of feeding rabbits was found in brightness (Fig. 5).
Figure 6 shows the percentage of rabbits staying at the feeder (similar to the behaviour
feeding) subdivided into 8 or 16 hours of lighting. Only the behaviour feeding pellets showed
significantly different means. So, the average of rabbits staying at the pellet feeder in housing
systems with 8 h lighting duration was significantly higher than in rabbits housed in flatdecks
with 16 hours lighting duration.
P=0,007
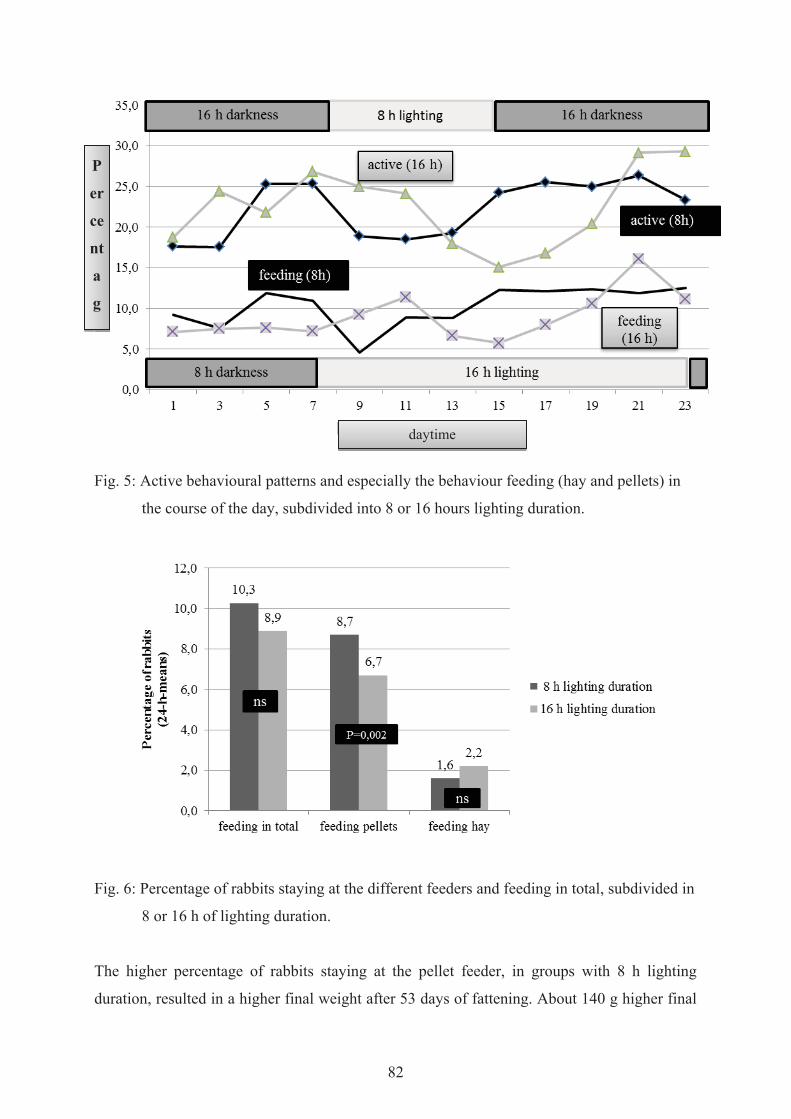
82
Fig. 5: Active behavioural patterns and especially the behaviour feeding (hay and pellets) in
the course of the day, subdivided into 8 or 16 hours lighting duration.
Fig. 6: Percentage of rabbits staying at the different feeders and feeding in total, subdivided in
8 or 16 h of lighting duration.
The higher percentage of rabbits staying at the pellet feeder, in groups with 8 h lighting
duration, resulted in a higher final weight after 53 days of fattening. About 140 g higher final
daytime
P
er
ce
nt
a
g

83
weight was found in rabbits housed with 8 h lighting duration than in those with 16 hours
lighting duration (Fig. 7).
Fig. 7: Final weight after 53 days of fattening.
4. CONCLUSION
Rabbit behaviour was significantly influenced by the duration of darkness and brightness. In
darkness and brightness rabbits with only 8 h lighting duration spent more time in the dark
retreat than rabbits with 16 h lighting.
Rabbits in housing systems with only 8 h lighting duration spent more time at the pellet feeder
than those in housing systems with 16 h lighting duration. This leads to a significantly higher
final weight.
5. SUMMARY
The aim of this study was to get information about the influence of different durations of
lighting regimes in housing systems for fattening rabbits. So in 4 rounds in two identical
flatdecks with plastic slatted floor, 10 fattening rabbits respectively (hybrids, five-weeks old,
ø 1 kg) were housed in a common way and fed with pelletized feedstuffs and hay and water
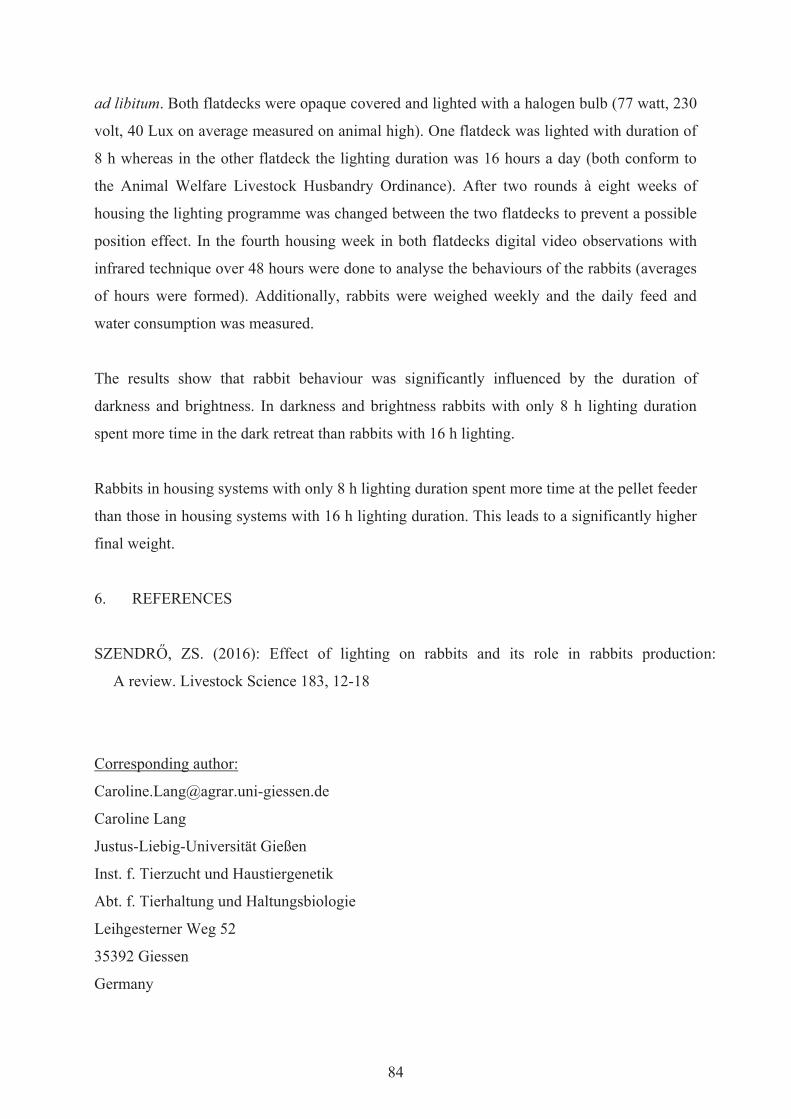
84
ad libitum. Both flatdecks were opaque covered and lighted with a halogen bulb (77 watt, 230
volt, 40 Lux on average measured on animal high). One flatdeck was lighted with duration of
8 h whereas in the other flatdeck the lighting duration was 16 hours a day (both conform to
the Animal Welfare Livestock Husbandry Ordinance). After two rounds à eight weeks of
housing the lighting programme was changed between the two flatdecks to prevent a possible
position effect. In the fourth housing week in both flatdecks digital video observations with
infrared technique over 48 hours were done to analyse the behaviours of the rabbits (averages
of hours were formed). Additionally, rabbits were weighed weekly and the daily feed and
water consumption was measured.
The results show that rabbit behaviour was significantly influenced by the duration of
darkness and brightness. In darkness and brightness rabbits with only 8 h lighting duration
spent more time in the dark retreat than rabbits with 16 h lighting.
Rabbits in housing systems with only 8 h lighting duration spent more time at the pellet feeder
than those in housing systems with 16 h lighting duration. This leads to a significantly higher
final weight.
6. REFERENCES
SZENDRŐ, ZS. (2016): Effect of lighting on rabbits and its role in rabbits production:
A review. Livestock Science 183, 12-18
Corresponding author:
Caroline Lang
Justus-Liebig-Universität Gießen
Inst. f. Tierzucht und Haustiergenetik
Abt. f. Tierhaltung und Haltungsbiologie
Leihgesterner Weg 52
35392 Giessen
Germany
85
University of Ljubljana, Biotechnical Faculty, Department of Animal Science,
Domžale, Slovenia
RELATIONSHIP BETWEEN IN VITRO GAS PRODUCTION PARAMETERS AND
CHEMICAL COMPOSITION OF SUGAR BEET PULP IN RABBITS
A. Kermauner and A. Lavrenčič
1. INTRODUCTION
Sugar beet pulp (SBP) is very common and popular feed for rabbits due to its high content of
pectins and hemicelluloses, which can be fermented in the caecum. It is well known that the
most important fibrolytic activity in rabbit caecum is pectinolytic, followed by xylanolytic,
while cellulolytic activity is lower (PINHEIRO et al., 2012; review from GIDENNE et al.,
2010). The stable and efficient microbial population is essential for rabbit health: in growing
rabbits better resistance to specific entheropathy was found when microbial fermentation in
caecum was more intensive (GIDENNE and LICOIS, 2005).
However, the variability in chemical composition of SBP is very high, mainly because of
different drying methods and because of the supplementation of SBP with different amounts
of molasses (DEPETERS et al., 1997; FEEDIPEDIA, 2017; Table 1).
Microbial activity in rabbit caecum can be measured in vitro. One of the methods frequently
used is in vitro gas production technique (e.g. WILLIAMS et al., 2001, LAVRENČIČ, 2007;
KARA, 2016). The in vitro fermentation of SBP in inoculum prepared from rabbit caecum
contents or faeces is very intensive and rapid (KERMAUNER and LAVRENČIČ, 2008,
LAVRENČIČ and KERMAUNER, 2011, KARA, 2016). In comparison of SBP fermentation
with that of other substrata, the fermentation of SBP is the most intensive with the shortest
TMFRs and the highest production of gas in the first (8 to 10) hours of incubation, what was

86
attributed to the high content of pectins in SBP (KERMAUNER and LAVRENČIČ, 2008,
LAVRENČIČ and KERMAUNER, 2011). On contrary, BELENGUER et al. (2011) found no
differences between in vitro gas production of SBP and lucerne hay, while KERMAUNER
and LAVRENČIČ (2013) found even higher amounts of gas produced after 8 hours of
incubation from substrata, such as wheat bran, barley, dehydrated Lucerne and soybean meal
than from SBP. This could be attributed to high variability in chemical composition of SBP.
Table 1: Chemical composition of nonmolassed and molassed sugar beet pulp (g/kg DM)
(Feedipedia, 2017: http://www.feedipedia.org/node/710)
Chemical
composition
(g/kg DM)
Beet pulp (dehydrated) Beet pulp, dehydrated,
molassed
Avg. Min Max Avg. Min Max
Dry matter (g/kg) 892 843 930 883 854 909
Crude protein 93 74 133 99 87 118
Crude fibre 199 162 246 194 142 221
NDF 481 390 551 475 292 475
ADF 241 209 269 238 170 238
Lignin 24 12 45 27 11 27
Crude fat 9 4 17 7 3 20
Ash 77 39 145 70 52 105
Total sugars 76 14 143 101 65 150
The aim of our study was to collect different samples of SBP and compare their in vitro
caecal fermentation parameters. We also want to estimate the in vitro fermentation parameters
from chemical composition of SBP.
2. MATERIAL AND METHODS
SUBSTRATA
For substrata five different samples of molassed and nonmolassed sugar beet pulp (SBP) from
Slovenian feed producers were used. Chemical analysis of SBP samples was performed in the

87
Chemical laboratory, Chair for nutrition, Department of Animal Science, Biotechnical Faculty
of University of Ljubljana, Slovenia.
IN VITRO FERMENTATION
The caecum contents of two 78 days old New Zealand White rabbits of Slovenian meat line
SIKA were used to prepare the inoculum. Manipulations and selection of animals and the
preparation of inoculum were performed according to the methods used by LAVRENČIČ
(2007). In vitro gas production was determined according to procedure described by MENKE
and STEINGASS (1988). Two hundred milligrams of substrate were anaerobically incubated
at 39 °C in duplicate in a 100 ml glass syringe containing 30 ml of inoculum.
CALCULATIONS AND STATISTICAL ANALYSIS
Measurements of in vitro gas production were corrected for substrate dry matter contents and
for the gas produced from blank samples. Corrected values were then fitted with the
Gompertz model (LAVRENČIČ et al., 1997). Parameter values and curve fitting were
estimated by the Marquard compromise of a non-linear regression method, using SAS
software (Proc NLIN) (SAS Institute Inc., 2015). From these parameters of Gompertz model
maximum fermentation rate (MFR; ml/h), time of maximum fermentation rate (TMFR; h),
delay between start of incubation and start of significant gas production (lag phase, LAG) and
volume of gas produced in the first 8 hours of incubation (Gas8) were calculated. Statistical
analysis was performed by GLM procedure using the SAS software (SAS Institute Inc.,
2015). Differences among samples were tested using LSMEANS with the PDIFF option.
Correlations between chemical composition and in vitro gas production parameters of SBP
was calculated using SAS’s REG procedure with STEPWISE method (SAS Institute Inc.,
2015).
3. RESULTS AND DISCUSSION
SBP samples varied in the contents of all analysed nutrients (Table 2). The content of sugars,
NDF and ADL compared to the data from Feedipedia (Table 1) indicate that samples no. 1
and 2 were probably nonmolassed, while to the samples 3, 4 and 5 molasses has been added.

88
Table 2: Chemical composition of five different samples of sugar beet pulp (g/kg DM)
Nutrient
(g/kg DM)
Sample
1 2 3 4 5
Dry matter (g/kg) 926 920 925 920 917
Crude protein 86 101 97 98 95
Crude fat 2 2 5 4 7
Crude fibre 198 205 189 166 176
Crude ash 65 42 83 114 98
Nitrogen free extract 649 650 626 617 625
Sugars 79 88 105 116 117
NDF 458 506 403 385 372
ADF 248 252 221 211 207
ADL 37 34 26 33 25
Cellulose (ADF–ADL) 211 217 195 178 182
Hemicelluloses (NDF–ADF) 210 254 182 174 165
Pectins (estimated)
(DM–(Ash+CP+EE+NDF+Sugars)) 309 262 307 282 311
The estimated parameters of in vitro gas production together with calculated parameters are
reported in Table 3, where the significance of sample as main effect is presented as well. All
parameters except parameter A were significantly (P<0.05) affected by the sample.
Sample no. 4 deviate greatly from other samples: it had the lowest total potential gas
production (parameter B) and MFR and the shortest TMFR and LAG. This resulted in the
highest amount of gas produced in the first 8 hours of incubation (Gas8). Gas8 was also the
highest in sample no. 5, which had the highest MFR and the shortest TMFR. Nonmolassed
samples (samples no. 1 and 2) had similar in vitro gas parameters with longer TMFRs and
LAGs and lower Gas8s than samples with added molasses (samples no. 3, 4 and 5). These
differences between nonmolassed and molassed SBP samples are presented also in Figure 1
as well.
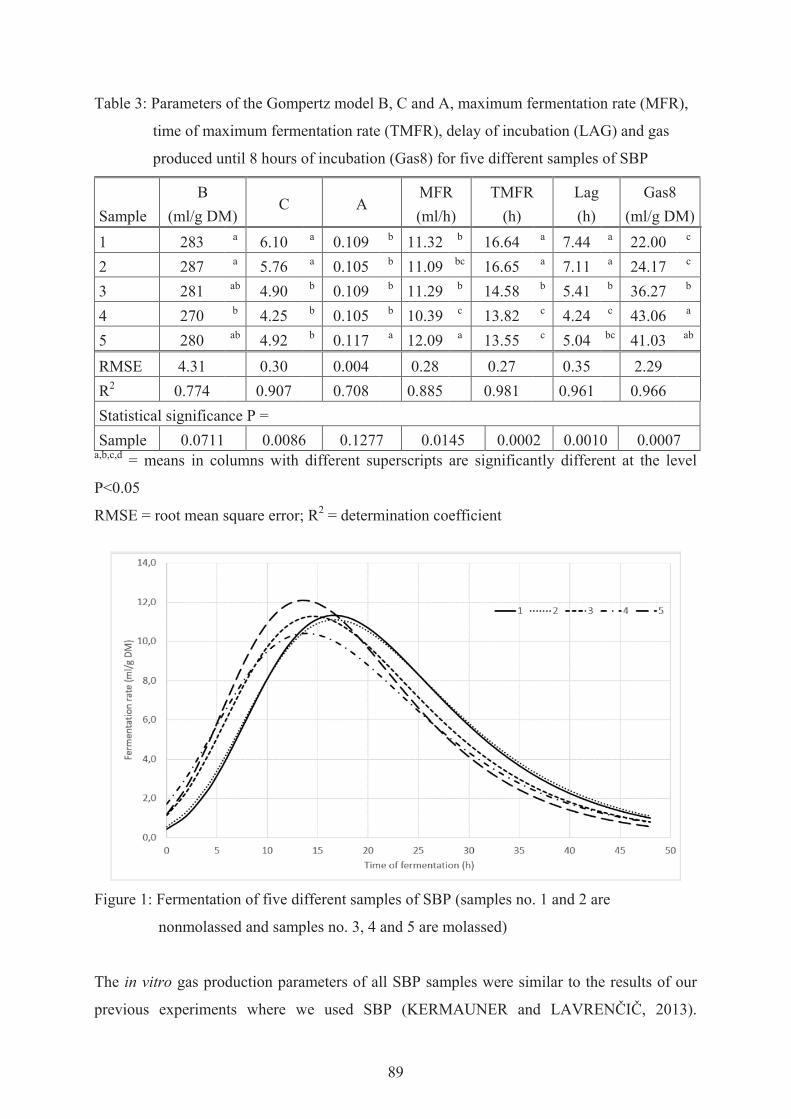
89
Table 3: Parameters of the Gompertz model B, C and A, maximum fermentation rate (MFR),
time of maximum fermentation rate (TMFR), delay of incubation (LAG) and gas
produced until 8 hours of incubation (Gas8) for five different samples of SBP
Sample B
(ml/g DM) C A
MFR (ml/h)
TMFR (h)
Lag (h)
Gas8 (ml/g DM)
1 283 a 6.10 a 0.109 b 11.32 b 16.64 a 7.44 a 22.00 c
2 287 a 5.76 a 0.105 b 11.09 bc 16.65 a 7.11 a 24.17 c
3 281 ab 4.90 b 0.109 b 11.29 b 14.58 b 5.41 b 36.27 b
4 270 b 4.25 b 0.105 b 10.39 c 13.82 c 4.24 c 43.06 a
5 280 ab 4.92 b 0.117 a 12.09 a 13.55 c 5.04 bc 41.03 ab
RMSE 4.31 0.30 0.004 0.28 0.27 0.35 2.29
R2 0.774 0.907 0.708 0.885 0.981 0.961 0.966
Statistical significance P =
Sample 0.0711 0.0086 0.1277 0.0145 0.0002 0.0010 0.0007 a,b,c,d = means in columns with different superscripts are significantly different at the level
P<0.05
RMSE = root mean square error; R2 = determination coefficient
Figure 1: Fermentation of five different samples of SBP (samples no. 1 and 2 are
nonmolassed and samples no. 3, 4 and 5 are molassed)
The in vitro gas production parameters of all SBP samples were similar to the results of our
previous experiments where we used SBP (KERMAUNER and LAVRENČIČ, 2013).
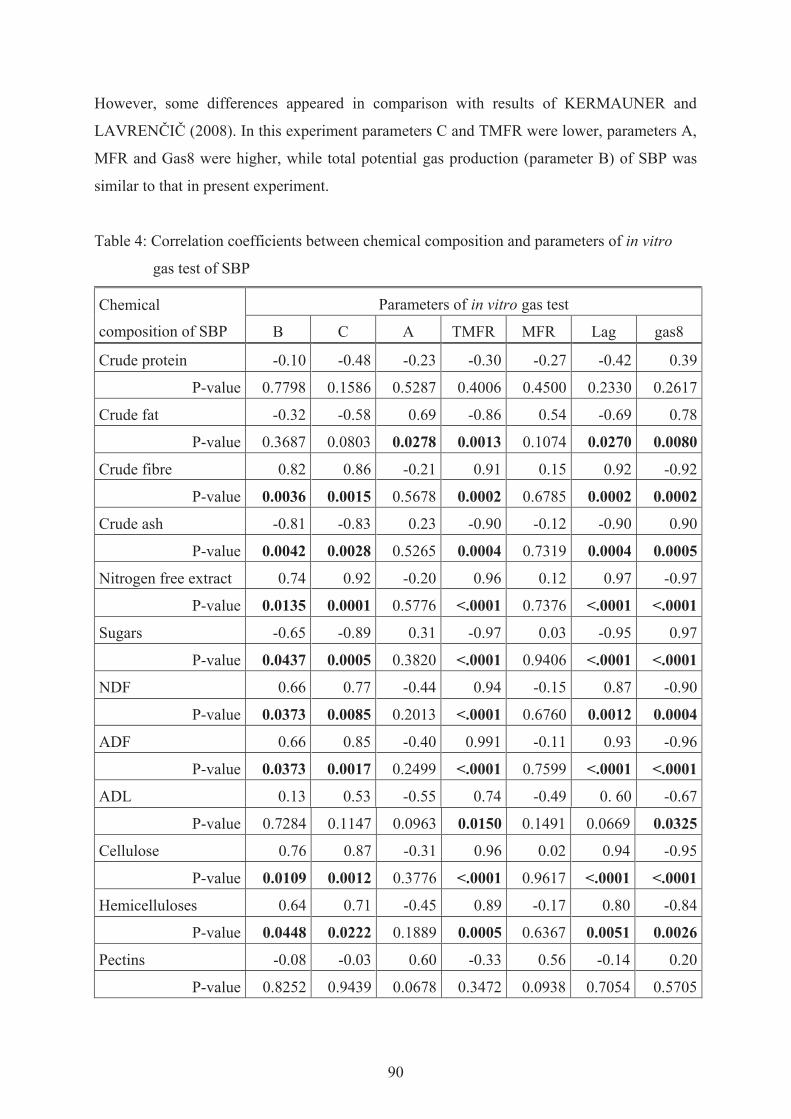
90
However, some differences appeared in comparison with results of KERMAUNER and
LAVRENČIČ (2008). In this experiment parameters C and TMFR were lower, parameters A,
MFR and Gas8 were higher, while total potential gas production (parameter B) of SBP was
similar to that in present experiment.
Table 4: Correlation coefficients between chemical composition and parameters of in vitro
gas test of SBP
Chemical
composition of SBP
Parameters of in vitro gas test
B C A TMFR MFR Lag gas8
Crude protein -0.10 -0.48 -0.23 -0.30 -0.27 -0.42 0.39
P-value 0.7798 0.1586 0.5287 0.4006 0.4500 0.2330 0.2617
Crude fat -0.32 -0.58 0.69 -0.86 0.54 -0.69 0.78
P-value 0.3687 0.0803 0.0278 0.0013 0.1074 0.0270 0.0080
Crude fibre 0.82 0.86 -0.21 0.91 0.15 0.92 -0.92
P-value 0.0036 0.0015 0.5678 0.0002 0.6785 0.0002 0.0002
Crude ash -0.81 -0.83 0.23 -0.90 -0.12 -0.90 0.90
P-value 0.0042 0.0028 0.5265 0.0004 0.7319 0.0004 0.0005
Nitrogen free extract 0.74 0.92 -0.20 0.96 0.12 0.97 -0.97
P-value 0.0135 0.0001 0.5776 <.0001 0.7376 <.0001 <.0001
Sugars -0.65 -0.89 0.31 -0.97 0.03 -0.95 0.97
P-value 0.0437 0.0005 0.3820 <.0001 0.9406 <.0001 <.0001
NDF 0.66 0.77 -0.44 0.94 -0.15 0.87 -0.90
P-value 0.0373 0.0085 0.2013 <.0001 0.6760 0.0012 0.0004
ADF 0.66 0.85 -0.40 0.991 -0.11 0.93 -0.96
P-value 0.0373 0.0017 0.2499 <.0001 0.7599 <.0001 <.0001
ADL 0.13 0.53 -0.55 0.74 -0.49 0. 60 -0.67
P-value 0.7284 0.1147 0.0963 0.0150 0.1491 0.0669 0.0325
Cellulose 0.76 0.87 -0.31 0.96 0.02 0.94 -0.95
P-value 0.0109 0.0012 0.3776 <.0001 0.9617 <.0001 <.0001
Hemicelluloses 0.64 0.71 -0.45 0.89 -0.17 0.80 -0.84
P-value 0.0448 0.0222 0.1889 0.0005 0.6367 0.0051 0.0026
Pectins -0.08 -0.03 0.60 -0.33 0.56 -0.14 0.20
P-value 0.8252 0.9439 0.0678 0.3472 0.0938 0.7054 0.5705

91
Correlations between SBP chemical composition and parameters of in vitro gas test are
reported in Table 4. Contents of crude protein (CP) and pectins (PEC) did not have any
significant effect on SBP fermentation. Parameter MFR of in vitro gas test was not
significantly influenced by any of nutrients in the SBP.
Figure 2: Linear regression equations for estimation of in vitro gas fermentation parameters:
constant factor of microbial efficiency A, total potential gas production (parameter
B, ml/g DM), specific fermentation rate C, estimated by Gompertz model, time of
MFR (TMFR, h), the delay of fermentation (LAG, h) and gas produced till 8 hours
of incubation (Gas8, ml/g DM)

92
Majority of in vitro gas test parameters could be reliably predicted from chemical
composition of SBP (Table 4 and Figure 2). Only nutrients from Weende analysis together
with ADF and sugar contents were considered by regression equations and the relationship
(R2) was very strong for TMFR, Gas8, LAG and parameter C. Correlation between total
potential gas production (parameter B) and chemical composition was not so strong (R2 =
0.68), while R2 for relationship between parameter C and chemical composition was only
0.47. When we wanted to estimate the MFR none of used variables meet the 0.05 significance
level for entry into the model.
4. CONCLUSIONS
SBP samples greatly differed in their chemical composition and in in vitro gas test parameters
as well. Majority of in vitro gas test parameters can be reliably predicted from chemical
composition of SBP, where the contents of carbohydrates prevailed: nitrogen free extract was
significantly correlated with parameter C and LAG, the contents of sugars with Gas8, the
contents of ADF with TMFR and the contents of crude fibre with parameter B. No correlation
between MFR and chemical composition of SBP was found.
To our knowledge this study was the first one dealing with in vitro fermentation of different
samples of SBP in rabbits. Our results were obtained on only 5 different samples of SBP and
the results gave no firm conclusions. The experiment should be expanded on greater number
of SBP samples, especially due to very different chemical composition of SBP.
5. REFERENCES
BELENGUER, A.; FONDEVILLA, M.; BALCELLS, J.; ABECIA, L.; LACHICA, M.;
CARRO, M.D. (2011): Methanogenesis in rabbit caecum as affected by the fermentation
pattern – in vitro and in vivo measurements. World Rabbit Sci. 19, 75-83
DEPETERS, E.J.; FADEL, J.G.; AROSEMENA, A. (1997): Digestion kinetics of neutral
detergent fiber and chemical composition within some selected by-product feedstuffs.
Anim. Feed Sci. Technol. 67, 127-140
FEEDIPEDIA (http://www.feedipedia.org/node/710) (16.5.2017)

93
GIDENNE, T.; LICOIS, D. (2005): Effect of a high fibre intake on the resistance of the
growing rabbit to an experimental inoculation with an enteropathogenic strain of
Escherichia coli. Anim. Sci. 80 (3), 281-288
GIDENNE, T.; CARABAÑO, R.; GARCÍA, J.; DE BLAS, C. (2010): Fibre digestion. In:
The nutrition of the rabbit. 2nd Ed. DE BLAS, C.; WISEMAN, J. (Eds.). Wallingford, CAB
International, 19-38
KARA, K. (2016): Effect of dietary fibre and condensed tannins concentration from various
fibrous feedstuffs on in vitro gas production kinetics with rabbit faecal inoculum. J. Anim.
Feed Sci. 25, 266-272
KERMAUNER, A.; LAVRENČIČ, A. (2008): Supplementation of rabbit diet with chestnut
wood extract: effect on in vitro gas production from three sources of carbohydrates. In:
Proc. 9th World Rabbit Congress, 2008-06-10/13, Verona, Italy: 683-387. http://world-
rabbit-science.com/WRSA-Proceedings/Congress-2008-Verona/Papers/N-Kermauner1.pdf
KERMAUNER, A.; LAVRENČIČ, A. (2013): Relationship between in vitro gas production
parameters between predigested and intact commonly used feeds for rabbits. In: HOY, ST.
(ed.). 18. Internationale Tagung über Haltung und Krankheiten der Kaninchen, Pelztiere
und Heimtiere, Celle, 2013-05-22/23. Gießen: VVB Laufersweiler Verlag, 109-120
LAVRENČIČ, A. (2007): The effect of rabbit age on in vitro caecal fermentation of starch,
pectin, xylan, cellulose, compound feed and its fibre. Animal 1, 241-248
LAVRENČIČ, A.; KERMAUNER, A. (2011): The relationship between in vitro short-chain
fatty acid and gas production in rabbits. In: HOY ST. (ed.). 17. Internationale Tagung über
Haltung und Krankheiten der Kaninchen, Pelztiere und Heimtiere, Celle, 2011-05-11/12.
Gießen, VVB Laufersweiler Verlag, 138-149
PINHEIRO, V.; FALCAO-E-CUNHA, L.; MOURAO, J.L.; GIDENNE, T. (2012): Total and
ileal digestibility and caecal bacterial fibrolytic activity in adult rabbit fed with resistant
starch. In: Proc. 10th World Rabbit Congress, 2012-09-03/06, Sharm El- Sheikh, Egypt:
691-695. http://world-rabbit-science.com/WRSA-Proceedings/Congress-2012-
Egypt/Papers/03-Nutrition/N-Pinheiro-01.pdf
SAS Institute Inc. (2015): SAS/STAT user’s guide: Statistics. Version 9.4. SAS Institute Inc.,
Cary, NC, USA
WILLIAMS, B.; VERSTEGEN, M.W.A.; TAMMINGA, S. (2001): Fermentation in the large
intestine of single-stomached animals and its relationship to animal health. Nutr. Res. Rev.
14, 207-227
94
Author’ address:
Ajda KERMAUNER, M.Sc.
University of Ljubljana, Biotechnical Faculty
Department of Animal Science
Groblje 3, SI-1230 Domžale, SLOVENIA
e-mail: [email protected]

95
University of Ljubljana, Biotechnical Faculty, Department of Animal Science,
Domžale, Slovenia
RELATIONSHIP BETWEEN IN VITRO GAS PRODUCTION PARAMETERS OF
PREDIGESTED AND INTACT SUGAR BEET PULPS IN RABBITS
A. Lavrenčič and A. Kermauner
1. INTRODUCTION
Sugar beets are noted for their storage carbohydrate in the form of sucrose. After sucrose is
extracted the primary by-product feedstuff is the sugar beet pulp (SBP). Variation in nutrient
composition in SBP may derive from the drying method used or the molasses added to the
pulp and the SBP fibre fraction was shown to be the most variable component among sources
(DEPETERS et al., 1997). Normally SBP contains around 500 g of NDF/kg DM, 250 g of
ADF/kg DM (ADF), 20 g of ADL/kg DM and 180 g of pectins/kg DM (DE BLAS and
CARABAÑO, 1996; FADEL et al., 2000). SBP NDF physical and digestion characteristics
are a high water holding capacity and digestibility, small proportion of long particles, low rate
of passage and high caecal retention time and thus serves as a substrate for caecal microbes
(DE BLAS and CARABAÑO, 1996; GIDENNE, 2015). According to these characteristics
SBP should have limited value to meet physically effective fibre requirements and should be
considered mainly as an energy concentrate feed in rabbits, because despite its very low starch
concentration contains considerable amounts of highly digestible fibre, pectins and sugars.
Inclusion of increased quantities of SBP in the rabbit diet implies changes in the site of
nutrient digestion. Digestible fibre intensively ferments in the hindgut where around 40 % of
the dry matter content of SBP is digested. Stable microbial fermentation and production of
fermentation end products (volatile fatty acids) in the caecum are essential for rabbit health, as

96
they are recognised as key factors for preventing digestive troubles in growing rabbits
(GIDENNE and LICOIS, 2005).
One of the tools to measure fermentative activity of caecum microorganisms is in vitro gas
production technique. We were able to find only the paper of KERMAUNER and
LAVRENČIČ (2013) who determined the gas production parameters in intact and pre-
digested of most common rabbit feeds. In all other studies considering microbial fermentation
in inoculum prepared from rabbit caecum only intact sample and/or pure nutrients were used
(CALABRO et al., 1999; MAROUNEK et al., 1997, 2000; LAVRENČIČ, 2007;
KERMAUNER and LAVRENČIČ, 2008, 2009, 2010, 2012; VILLAMIDE et al., 2009).
This study compares the rabbit in vitro caecal fermentation characteristics of different intact
and pre-digested SBP used by Slovene feed producers and to determine the relationship
between fermentation parameters between intact and pre-digested SBP.
2. MATERIAL AND METHODS
SAMPLE
Five samples of molassed and nonmolassed sugar beet pulp from Slovene feed producers
were used (for chemical composition see KERMAUNER and LAVRENČIČ, 2017). Each
substrate was treated with pepsin in HCl and pancreatin in NaOH (GARGALLO et al., 2006;
CARABAÑO et al., 2008) to simulate the digestion in the stomach and small intestine.
Approximately four grams of each substrate were weighed into five ANKOM’s 510 nylon
bags (Ankom Technology, Macedon, USA) and heat sealed. Bags were incubated for 1.5
hours at 39 °C in 2.5 L jars containing 2 g pepsin (Merck, art. 7185) dissolved in 2L of 0.5 N
HCl (pH was adjusted to 2). After this first stage of incubation the bags were rinsed 3 times
with cold tap water and incubated for 3.5 hours at 39 °C in 2.5 L jar containing 6 g of
pancreatin (Sigma, P7545) dissolved in 2 L of 0.5 M KH2PO4 (pH adjusted to 6.8). After
incubation the bags were rinsed 5 times with cold tap water and dried for 48 h at 55 °C. Bags
with residues were weighed to determine dry matter digestibility. Material from
corresponding bags was pooled, homogenized and weighed into syringes along with non
digested (intact) samples.

97
IN VITRO FERMENTATION
The caecum content of two 78 days old New Zealand White rabbits of Slovenian meat line
SIKA were chosen to prepare the inoculum. Manipulations and selection of animals and the
preparation of inoculum were performed according to the methods used by LAVRENČIČ
(2007). In vitro gas production was determined according to procedure described by MENKE
and STEINGASS (1988). Two hundred milligrams of substrate were anaerobically incubated
at 39 °C in duplicate in a 100 ml glass syringe containing 30 ml of inoculum.
CALCULATIONS AND STATISTICAL ANALYSIS
Measured in vitro gas production data were corrected for substrate dry matter (DM) content
and for the gas produced from blank samples. Corrected values were then fitted to the
Gompertz model (LAVRENČIČ et al., 1997). Parameter values and curve fitting were
estimated by the Marquard compromise of a non-linear regression method, using SAS
software (Proc NLIN) (SAS Institute Inc., 2015). Parameters “B” (total potential gas
production) of pre-digested samples were corrected also to the amount of DM remaining after
pre-digestion (residual DM; ml/g residual DM). From all obtained parameters of Gompertz
model maximum fermentation rates (MFR; ml/h), times of maximum fermentation rate
(TMFR; h), volumes of gas produced in the first 8 hours of incubation (Gas8; ml/g DM),
fermentation rates at 8 hours of incubation (FR8; ml/h) and delays from the start of incubation
until significant gas production starts (lag phase, LAG; h) were calculated. Statistical analysis
was performed by GLM procedure using the SAS software (SAS Institute Inc., 2015).
Differences among treatment were tested using LSMEANS with the PDIFF option.
Regression between chemical composition, in vitro gas production parameters of intact
sample and in vitro gas production parameters of predigested sample was calculated using
SAS’s REG procedure with STEPWISE method (SAS Institute Inc., 2015).
3. RESULTS AND DISCUSSION
The pre-digestion of SBP with pepsin-HCL and pancreatin-NaOH removed from 198 to 388 g
DM/kg DM (Figure 1).

98
Figure 1: Proportions of pre-digested and remaining substrate DM in SBP samples
(mg/g DM)
Estimated in vitro gas production parameters of SBP DM of intact samples and of SBP DM
remained after pre-digestion of samples are reported in Table 1.
The estimated in vitro gas production parameters of SBP of the most intact sample were
comparable with our previous results (KERMAUNER and LAVRENČIČ, 2008, 2009, 2013),
except that specific rates of fermentation (“C”) were generally higher and the decays in
specific fermentation rate (“A”) were generally lower in present experiment. On contrary,
total potential gas productions (“B”) were generally lower in present experiment than in
previous experiments.
We did not find any paper dealing with the in vitro gas production using pre-digested
samples, except the paper of KERMAUNER and LAVRENČIČ (2013), who tested most
commonly used rabbit feeds. It is impossible to compare gas production parameters obtained
in their study with the parameters obtained in this study as their parameters were not corrected
to the amount of DM remained after pre-digestion of samples. Comparing intact and pre-
digested in vitro gas production kinetic parameters it could be observed that the total potential
gas production (parameter “B”) of intact SBP was higher and that the specific fermentation
rate (parameter “C”) and decay in microbial fermentation rate (parameter “A”) were as lower
than corresponding parameters in pre-digested SBP (Table 1). These results were expected

99
especially for parameter “B” as a part of nutrients in intact SBP are highly digestible pre-
caecally and cannot be fermented in caecum.
Table 1: Total potential gas production (“B”), specific fermentation rate (“C”) and the decay
in specific gas production rate (“A”) from intact DM (1 g DM) and DM remained
after pre-digestion of SBP samples
Sample Treatment B C A
(ml)
1 intact 283a 6.1d 0.108c
2 intact 287a 5.8d 0.105c
3 intact 281a 4.9d 0.109c
4 intact 270b 4.2d 0.104c
5 intact 280a 4.9d 0.117c
1p pre-digested 221c 15.5a 0.159a
2p pre-digested 224c 12.9bc 0.136b
3p pre-digested 193d 13.4bc 0.134b
4p pre-digested 169e 12.4c 0.134b
5p pre-digested 173e 14.3ab 0.160a
RMSE 17.80 1.114 0.0101
R2 0.862 0.942 0.787 a,b,c,d = means in columns with different superscripts are significantly different at the level
P<0.05
RMSE = root mean square error; R2 = determination coefficient
The calculated parameters such as maximum fermentation rate (MFR), time of maximum
fermentation rate (TMFR), gas produced until 8 h of incubation (Gas8), fermentation rate at 8
h of incubation (FR8) and lag phase (LAG) help to describe better the fermentation pattern of
the SBP samples (Table 2).
In comparison with other samples the fermentation of SBP was always the most intensive
(KERMAUNER and LAVRENČIČ, 2008, 2009, 2013). They established that intact SBPs had
the shortest TMFRs and the highest production of gas in the first (8 to 10) hours of
incubation. This was attributed to the high content of pectins in SBP but also to the sugars
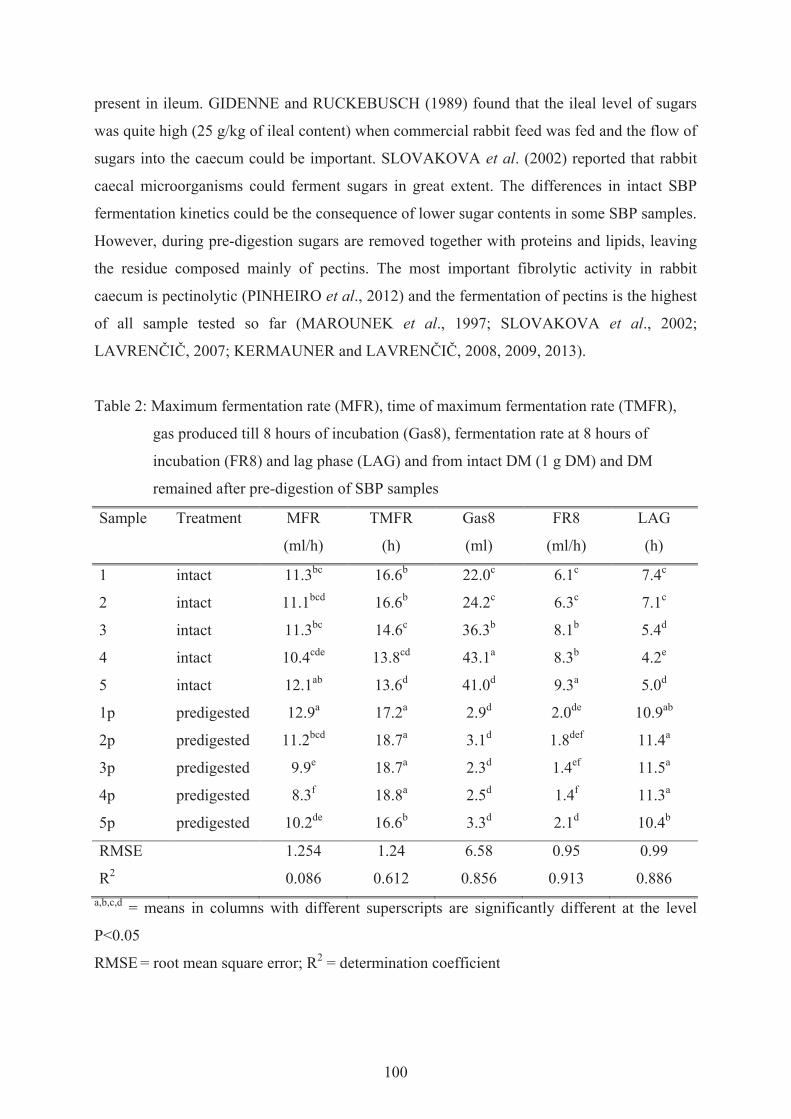
100
present in ileum. GIDENNE and RUCKEBUSCH (1989) found that the ileal level of sugars
was quite high (25 g/kg of ileal content) when commercial rabbit feed was fed and the flow of
sugars into the caecum could be important. SLOVAKOVA et al. (2002) reported that rabbit
caecal microorganisms could ferment sugars in great extent. The differences in intact SBP
fermentation kinetics could be the consequence of lower sugar contents in some SBP samples.
However, during pre-digestion sugars are removed together with proteins and lipids, leaving
the residue composed mainly of pectins. The most important fibrolytic activity in rabbit
caecum is pectinolytic (PINHEIRO et al., 2012) and the fermentation of pectins is the highest
of all sample tested so far (MAROUNEK et al., 1997; SLOVAKOVA et al., 2002;
LAVRENČIČ, 2007; KERMAUNER and LAVRENČIČ, 2008, 2009, 2013).
Table 2: Maximum fermentation rate (MFR), time of maximum fermentation rate (TMFR),
gas produced till 8 hours of incubation (Gas8), fermentation rate at 8 hours of
incubation (FR8) and lag phase (LAG) and from intact DM (1 g DM) and DM
remained after pre-digestion of SBP samples
Sample Treatment MFR TMFR Gas8 FR8 LAG
(ml/h) (h) (ml) (ml/h) (h)
1 intact 11.3bc 16.6b 22.0c 6.1c 7.4c
2 intact 11.1bcd 16.6b 24.2c 6.3c 7.1c
3 intact 11.3bc 14.6c 36.3b 8.1b 5.4d
4 intact 10.4cde 13.8cd 43.1a 8.3b 4.2e
5 intact 12.1ab 13.6d 41.0d 9.3a 5.0d
1p predigested 12.9a 17.2a 2.9d 2.0de 10.9ab
2p predigested 11.2bcd 18.7a 3.1d 1.8def 11.4a
3p predigested 9.9e 18.7a 2.3d 1.4ef 11.5a
4p predigested 8.3f 18.8a 2.5d 1.4f 11.3a
5p predigested 10.2de 16.6b 3.3d 2.1d 10.4b
RMSE 1.254 1.24 6.58 0.95 0.99
R2 0.086 0.612 0.856 0.913 0.886 a,b,c,d = means in columns with different superscripts are significantly different at the level
P<0.05
RMSE = root mean square error; R2 = determination coefficient
101
Maximum fermentation rate (MFR), gas produced till 8 hours of incubation (Gas8) and
fermentation rate at 8 hours of incubation (FR8) are parameters affected by DM contents of
sample while TMFR and lag are not. As expected, the correction of gas production kinetic
parameters to the DM remaining after pre-digestion lowered the MFR, Gas8 and FR8 and
prolonged TMFR and LAG. However, two of the pre-digested SBPs (samples no. 1 and 2)
had equal or higher MFR than their intact counterparts, suggesting that pre-digestion
eliminated the compounds which had an lowering impact on their MFR. From the proximate
analysis we cannot depict which substance is lowering the MFR of intact SBPs. However, it is
well known that the presence of proteins reduced gas production (about 1/3 of gas produced
from carbohydrates) when fermented in caecum (MAROUNEK et al., 2000; KERMAUNER
and LAVRENČIČ, 2011), while lipids do not ferment in anaerobic conditions prevailing in
the caecum (VAN SOEST, 1994). Another possibility are hydroxycinnamic acid derivatives
linking the polysaccharides with lignin. Their ester bonds between polysaccharides and
lignins can decrease the rate of fermentation but not the extent of fermentation (JUNG, 1989).
Relationships between the gas production kinetic parameters of intact and pre-digested
samples are presented in Table 3. The fermentation kinetic parameters “B” of pre-digested
SBPs is highly correlated with the majority of intact SBP parameters (p < 0.05), except with
parameter “A” and MFR. MFRs of pre-digested SBPs are also correlated with the majority of
intact fermentation parameters, except with “MFR”. Correlations of other fermentation
parameters of pre-digested SBP were not very strong (coefficients varying from 0.63 between
MFR of intact and parameter ”C” of pre-digested SBP (p < 0.05) to 0.79 between TMFR of
intact and MFR of pre-digested SBP.
Correlation coefficients were also calculated between chemical composition, which is given
in companion paper of KERMAUNER and LAVRENČIČ (2017) and fermentation kinetic
parameters of pre-digested SBP (Table 4).
Parameters “B” and MFR were significantly (P < 0.05) correlated with almost all analysed
chemical constituents and the correlation coefficients varied from -0.61 to 0.99 between MFR
and pectin content and between parameter “B” and cellulose contents, respectively. The
parameters “C”, “A” and TMFR are also correlated with CP and pectin contents.
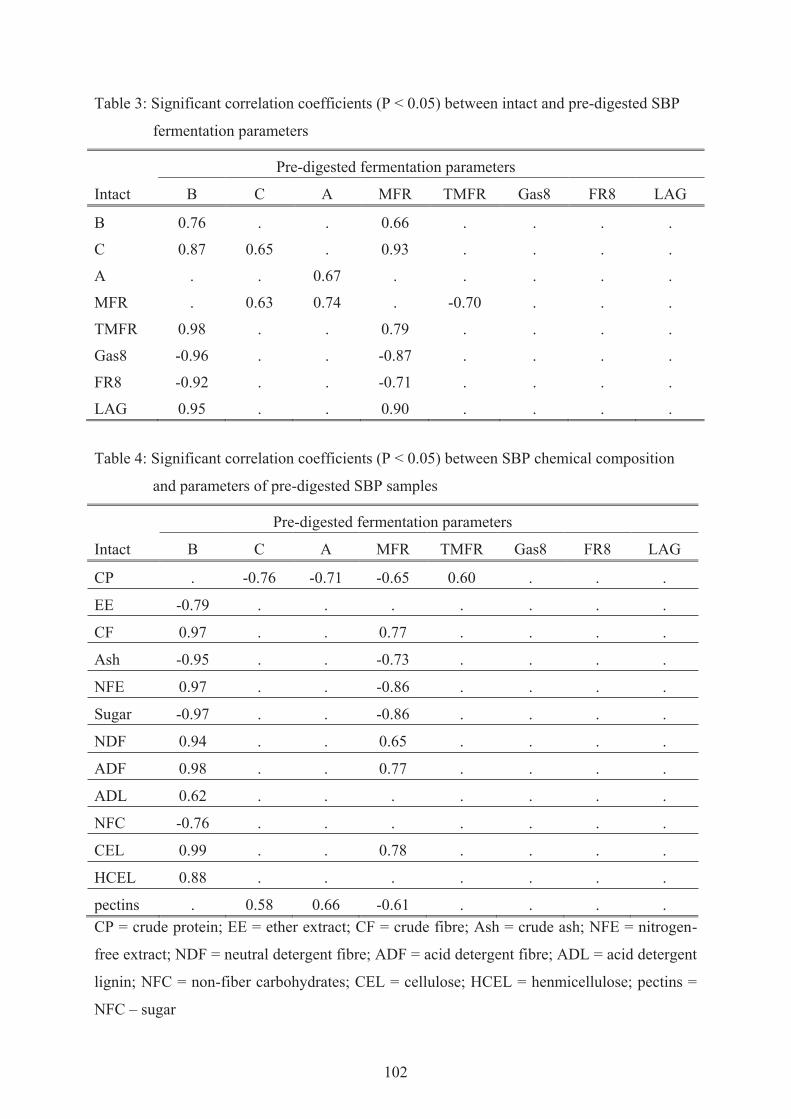
102
Table 3: Significant correlation coefficients (P < 0.05) between intact and pre-digested SBP
fermentation parameters
Pre-digested fermentation parameters
Intact B C A MFR TMFR Gas8 FR8 LAG
B 0.76 . . 0.66 . . . .
C 0.87 0.65 . 0.93 . . . .
A . . 0.67 . . . . .
MFR . 0.63 0.74 . -0.70 . . .
TMFR 0.98 . . 0.79 . . . .
Gas8 -0.96 . . -0.87 . . . .
FR8 -0.92 . . -0.71 . . . .
LAG 0.95 . . 0.90 . . . .
Table 4: Significant correlation coefficients (P < 0.05) between SBP chemical composition
and parameters of pre-digested SBP samples
Pre-digested fermentation parameters
Intact B C A MFR TMFR Gas8 FR8 LAG
CP . -0.76 -0.71 -0.65 0.60 . . .
EE -0.79 . . . . . . .
CF 0.97 . . 0.77 . . . .
Ash -0.95 . . -0.73 . . . .
NFE 0.97 . . -0.86 . . . .
Sugar -0.97 . . -0.86 . . . .
NDF 0.94 . . 0.65 . . . .
ADF 0.98 . . 0.77 . . . .
ADL 0.62 . . . . . . .
NFC -0.76 . . . . . . .
CEL 0.99 . . 0.78 . . . .
HCEL 0.88 . . . . . . .
pectins . 0.58 0.66 -0.61 . . . . CP = crude protein; EE = ether extract; CF = crude fibre; Ash = crude ash; NFE = nitrogen-
free extract; NDF = neutral detergent fibre; ADF = acid detergent fibre; ADL = acid detergent
lignin; NFC = non-fiber carbohydrates; CEL = cellulose; HCEL = henmicellulose; pectins =
NFC – sugar

103
From combined data of chemical composition and in vitro gas production parameters of intact
SBP only parameters “B”, “C”, “A”, MFR and TMFR of pre-digested SBP were included into
regression equation. The best regression (the highest R2) was obtained for the estimation of
parameter “B” of pre-digested SBP with sugar and cellulose contents (“B” = 43.444 – 0.479 ×
sugar + 1.022 × CEL; R2 = 0.992), while for the prediction of “C” and “A” the MFR and CP
were used in regression equation (16.977 + 1.055 × MFR – 0.158 × CP (R2 = 0.771) and
0.128 + 0.013 × MFR – 0.001 × CP (R2 = 0.833), respectively). MFR was used also for the
estimation of TMFR of pre-digested SBP (31.253 – 1.178 × MFR; R2 = 0.495), while “C” of
intact SBP was the only variable included in prediction of MFR of pre-digested SBP (-0.477
+2.119 × „C“; R2 = 0.868).
In our opinion the use of pre-digested SBP in in vitro gas tests where rabbit caecal content is
used as inoculum gives us more clear picture on what it is happening in caecum. However, we
used only 5 samples of SBP which are not sufficient to give a clear picture of on this matter
and the results should be taken with caution. Further research on this subject is strongly
advised and needed.
4. CONCLUSIONS
In general the in vitro caecal fermentation of predigested SBP was similar or less intensive
and slower than of intact SBP, which is not always true, as two of the pre-digested SBP
samples had MFRs equal or higher than their intact counterparts. We suppose that there are
some fermentation limiting fractions in intact SBPs which were eliminated with pre-digestion.
On the basis of only five SBP samples it is difficult to predict the fermentation parameters of
pre-digested SBP even when the chemical composition is considered together with intact SBP
in vitro gas production parameters. The greater number of sample is needed to give more firm
conclusion also because of large variations in SBPs chemical composition.
Results pose a serious question on the use of intact sample in in vitro fermentation studies
using rabbit caecum as inoculum, as sugars, starch and other digestible carbohydrates and
proteins are intensively digested prior to caecum.

104
5. REFERENCES
CALABRO, S.; NIZZA, A.; PINNA, W.; CUTRIGNELLI, M.I.; PICCOLO, V. (1999):
Estimation of digestibility of compound diets for rabbits using the in vitro gas production
technique. World Rabbit Sci. 7, 197-201
CARABAÑO, R.; NICODEMUS, N.; GARCÍA, J.; XICCATO, G.; TROCINO, A.;
PASCUAL, J.J.; FALCAO-E-CUNHA, L.; MAERTENS, L. (2008): In vitro analysis, an
accurate tool to estimate dry matter digestibility in rabbits. Intra- and inter-laboratory
variability. World Rabbit Sci. 16, 195-203
DE BLAS, C.; CARABAÑO, R. (1996): A review on the energy value of sugar beet pulp for
rabbits. World Rabbit Sci. 4, 33-36
DEPETERS, E.J.; FADEL, J.G.; AROSEMENA, A. (1997): Digestion kinetics of neutral
detergent fiber and chemical composition within some selected by-product feedstuffs.
Anim. Feed Sci. Technol. 67, 127-140
FADEL, J.G.; DEPETERS, E.J.; AROSEMENA, A. (2000): Composition and digestibility of
beet pulp with and without molasses and dried using three methods. Anim. Feed Sci.
Technol. 85, 121-129
GIDENNE, T. (2015): Dietary fibres in the nutrition of the growing rabbit and
recommendations to preserve digestive health: a review. Animal 9 (2), pp 227-242
GARGALLO, S.; CALSAMIGLIA, S.; FERRET, A. (2006): Technical note: A modified
three step in vitro procedure to determine intestinal digestion of proteins. J. Anim. Sci. 84,
2163-2167
GIDENNE, T.; LICOIS, D. (2005): Effect of a high fibre intake on the resistance of the
growing rabbit to an experimental inoculation with an enteropathogenic strain of
Escherichia coli. Anim. Sci. 80 (3) 281-288
GIDENNE, T.; RUCKEBUSCH, Y. (1989): Flow and rate of passage studies at the ileal level
in the rabbit. Reprod. Nutr. Develop. 29, 403-412
JUNG, H.G. (1989): Forage lignins and their effects on fiber digestibility. Agron. J. 81, 33-38
KERMAUNER, A.; LAVRENČIČ, A. (2008): Supplementation of rabbit diet with chestnut
wood extract: effect on in vitro gas production from three sources of carbohydrates. In:
Proc. 9th World Rabbit Congress, 2008-06-10/13, Verona, Italy: 683-387 http://world-
rabbit-science.com/WRSA-Proceedings/Congress-2008-Verona/Papers/N-Kermauner1.pdf

105
KERMAUNER, A.; LAVRENČIČ, A. (2009): Supplementation of the rabbit diet with
chestnut wood extract: effect on in vitro gas production and short chain fatty acid
production from two high fibre feeds. In: HOY, St. (ed.). 16. Internationale Tagung über
Haltung und Krankheiten der Kaninchen, Pelztiere und Heimtiere, Celle, 2009-05-13/14.
Giessen, DVG, 42-54
KERMAUNER, A.; LAVRENČIČ, A. (2010): In vitro fermentation of different
commercially available pectins using inoculum from rabbit caecum. World Rabbit Sci. 18
(1), 1-7
KERMAUNER, A.; LAVRENČIČ, A. (2012): The in vitro caecal fermentation of different
starch sources in rabbits. In: DOVČ P., PETRIČ N. (Eds.). Livestock production as a
technological and social challenge. Acta agriculturae slovenica, Suppl. 3, 71-75
http://aas.bf.uni-lj.si/zootehnika/supl/3-2012/PDF/3-2012-71-75.pdf. [COBISS.SI-ID
3108744]
KERMAUNER, A.; LAVRENČIČ, A. (2013): Relationship between in vitro gas production
parameters between pre-digested and intact commonly used feeds for rabbits. In: HOY S.
(ed.). 18. Internationale Tagung über Haltung und Krankheiten der Kaninchen, Pelztiere
und Heimtiere, Celle, 2013-05-22/23. Gießen, VVB Laufersweiler Verlag, 109-120
KERMAUNER, A.; LAVRENČIČ, A. (2017): Relationship between in vitro gas production
parameters and chemical composition of sugar beet pulp in rabbits. 20. Internationale
Tagung über Haltung und Krankheiten der Kaninchen, Pelztiere und Heimtiere, Celle,
2017-05-17/18, 85-94
LAVRENČIČ, A. (2007): The effect of rabbit age on in vitro caecal fermentation of starch,
pectin, xylan, cellulose, compound feed and its fibre. Animal 1, 241-248
LAVRENČIČ, A.; STEFANON, B.; SUSMEL, P. (1997): An evaluation of the Gompertz
model in degradability studies of forage chemical components. Animal Sci. 64, 423-431
MAROUNEK, M.; VOVK, S.J.; BENDA, V. (1997): Fermentation patterns in rabbit caecal
cultures supplied with plant polysaccharides and lactate. Acta Vet. Brno 67, 9-13
MAROUNEK, M.; SKRIVANOVÁ, V.; DUŠKOVÁ, D. (2000): In vitro caecal fermentation
of nitrogenous substrates in rabbits. J. Agric. Sci. 135, 437-442
MENKE, K.H.; STEINGASS, H. (1988): Estimation of the energetic feed value obtained from
chemical analysis and in vitro gas production using rumen fluid. Anim. Res. Develop. 28,
375-386

106
PINHEIRO, V.; FALCAO-E-CUNHA, L.; MOURAO, J.L.; GIDENNE, T. (2012): Total and
ileal digestibility and caecal bacterial fibrolytic activity in adult rabbit fed with resistant
starch. In: Proc. 10th World Rabbit Congress, 2012-09-03/06, Sharm El-Sheikh, Egypt,
691-695. http://world-rabbit-science.com /WRSA-Proceedings/Congress-2012-
Egypt/Papers/03-Nutrition/N-Pinheiro-01.pdf
SAS Institute Inc. (2015): SAS/STAT user’s guide: Statistics. Version 9.4. SAS Institute Inc.,
Cary, NC, USA
SLOVAKOVA, L.; DUŠKOVA, D.; MAROUNEK, M. (2002): Fermentation of pectin and
glucose and activity of pectin-degrading enzymes in the rabbit caecal bacterium
Bifidobacterium pseudolongum. Lett. Appl. Microb. 35, 126-130
VAN SOEST, P.J. (1983): Nutritional ecology of the ruminant, Corvallis, O & B Books
VILLAMIDE, M.J.; CARABAÑO, R.; MAERTENS, L.; PASCUAL, J.; GIDENNE, T.;
FALCAO-E-CUNHA, L.; XICCATO, G. (2009): Prediction of the nutritional value of
European compound feeds for rabbits by chemical components and in vitro analysis.
Animal Feed Sci. Technol. 150, 283-294
Author’ address:
Andrej LAVRENČIČ, Ph.D.
University of Ljubljana, Biotechnical Faculty
Department of Animal Science
Groblje 3, SI-1230 Domžale, SLOVENIA
e-mail: [email protected]
107
Professur für Ernährungsphysiologie und Tierernährung, Universität Rostock
ERNÄHRUNG VON KANINCHEN IN DER HEIMTIERHALTUNG
ZWISCHEN FAKTEN, MYTHEN UND SLOGANS
P. Wolf
1. EINLEITUNG
Jeder Kaninchenbesitzer möchte für sein Tier einen optimal zusammengesetzten Menüplan
haben. Die Komponenten sollen frisch und abwechslungsreich sein und den Bedürfnissen
seines Tieres entsprechen. Informationen zu den in Betracht kommenden Futtermitteln sowie
zur Rationsgestaltung bezieht der Besitzer aus einschlägigen Fachzeitschriften, von
erfahrenen Tierhaltern sowie aus der Fütterungssprechstunde seines Tierarztes. Eine nicht zu
unterschätzende Rolle spielt allerdings auch das Internet. In einschlägigen Foren werden
Fragen zur Haltung und Fütterung diskutiert und die Erkenntnisse dann oftmals unreflektiert
weiter gegeben. Schließlich werden aber auch universitäre Einrichtungen konsultiert und um
eine entsprechende Stellungnahme gebeten (WOLF und KAMPHUES, 2009).
Im Folgenden soll nun auf häufige Fragen eingegangen und entsprechende Antworten
gegeben und aufgezeigt werden, was Mythos oder Slogan ist bzw. wo es sich um echte Fakten
handelt.
Aussage: Kaninchen benötigen kein Heu – im Gegenteil, es ist sogar schädlich
Immer wieder wird von Kaninchenbesitzern das Argument angeführt, dass ihre Tiere das
angebotene Heu nicht anrühren und es daher wohl auch nicht erforderlich sei. Stattdessen
werden dann sogenannte „Buntfutter“ (Mischfutter auf der Basis originärer Komponenten)
gefüttert, die von den Tieren gerne gefressen werden. Entsprechend fühlt sich der Tierbesitzer
108
dann natürlich bestätigt und der Hinweis wird getätigt, dass das Tier schon wisse, was gut und
bekömmlich sei. Doch ist das tatsächlich so? Kaninchen gehören zu den herbivoren Spezies,
d.h. eine schwerpunktmäßig auf Körnern basierende Fütterung ist wohl nicht als artgerecht zu
bezeichnen.
Zudem benötigen die Tiere zur Gewährleistung artspezifischer ernährungsphysiologischer
Vorgänge das Angebot sogenannter strukturwirksamer Fasern, wie sie beispielsweise im Heu
vorkommen. Zu nennen ist hier zunächst der Abrieb der kontinuierlich nachwachsenden
Zähne. Der wesentliche Einfluss besteht hier in einem Aneinanderreiben der Zähne am
jeweiligen Gegenspieler. Dieser Vorgang ist umso effektiver, je länger das Tier mit der
Futteraufnahme beschäftigt ist. Aufgrund des höheren Energiegehaltes in Buntfuttern müssen
die Kleinsäuger zur Sättigung geringere Mengen aufnehmen als beispielsweise vom
energieärmeren Heu. Entsprechend kürzer sind auch die Zeiten der Futterzerkleinerung und
damit des Reibens eines Zahns am Antagonisten. Während bei Angebot von Heu
durchschnittlich 12 Minuten pro Gramm Futter benötigt werden, benötigen die Tiere lediglich
1,5 bis 5,0 Minuten pro Gramm Mischfutter.
Auch die Magenentleerung des Kaninchens erfordert das kontinuierliche Nachschieben von
Futter (sog. „Stopfmagen“), was bei den Mischfuttern die Gefahr der Energieüberversorgung
und damit der Adipositas beinhalten würde.
Schließlich verfügen die Spezies über einen ausgeklügelten Separationsmechanismus. So
werden gröbere Faserbestandteile mit dem Hartkot ausgeschleust, während feinere Partikel
zunächst im Blinddarm zurückbehalten und später mit der Caecotrophe abgegeben werden.
Bei fehlender Struktur kann es zu einer Stase im Blinddarm kommen, was gleichzeitig mit
einer unzureichenden Caecotrophie einhergeht (Aufnahme an Proteinen und B-Vitaminen↓).
Entscheidender sind oftmals aber die Verdauungsstörungen, die hieraus resultieren. Da es sich
um sogenannte Nager handelt, weichen die Tiere bei unzureichendem Angebot nagefähigen
Futters auf Alternativen aus. Bei einer Haltung auf Holzspänen in Käfigen aus Kunststoff
besteht diese oftmals in einer Aufnahme von Haaren (bei sich selbst oder bei Partnertieren),
was das Risiko einer Trichobezoarbildung zur Folge haben kann. Das Angebot von Heu ist
somit aus verschiedensten Gründen unabdingbar.
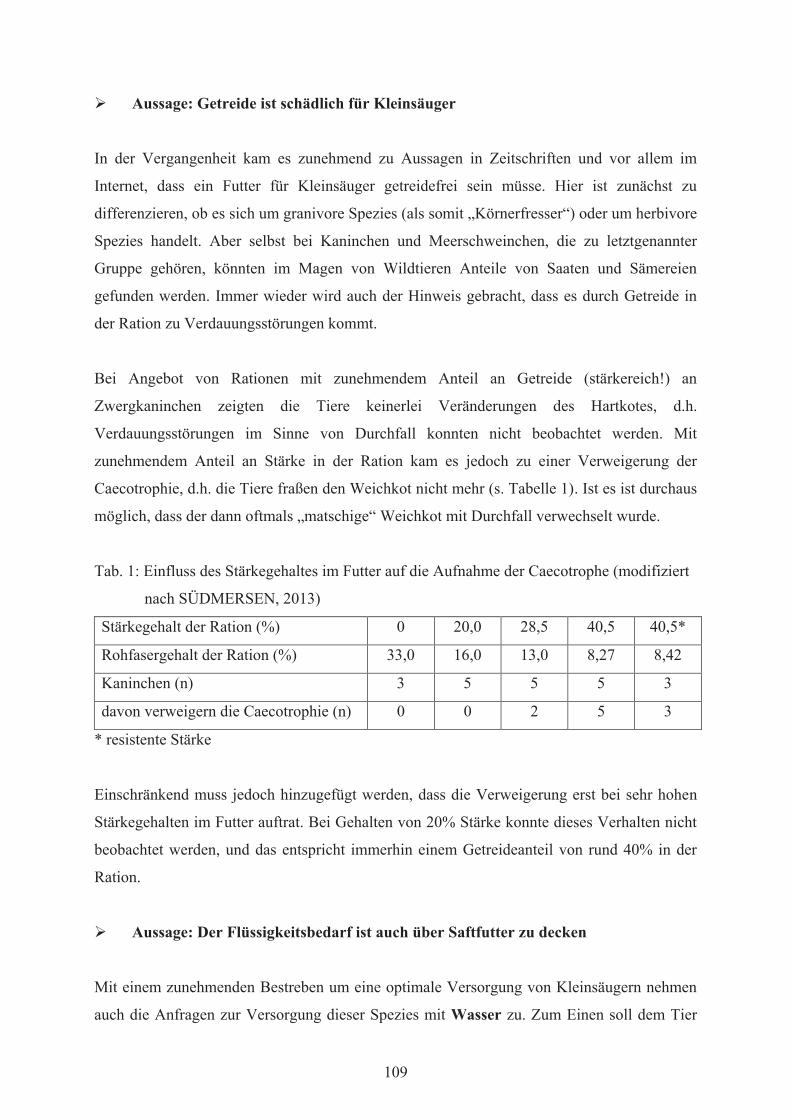
109
Aussage: Getreide ist schädlich für Kleinsäuger
In der Vergangenheit kam es zunehmend zu Aussagen in Zeitschriften und vor allem im
Internet, dass ein Futter für Kleinsäuger getreidefrei sein müsse. Hier ist zunächst zu
differenzieren, ob es sich um granivore Spezies (als somit „Körnerfresser“) oder um herbivore
Spezies handelt. Aber selbst bei Kaninchen und Meerschweinchen, die zu letztgenannter
Gruppe gehören, könnten im Magen von Wildtieren Anteile von Saaten und Sämereien
gefunden werden. Immer wieder wird auch der Hinweis gebracht, dass es durch Getreide in
der Ration zu Verdauungsstörungen kommt.
Bei Angebot von Rationen mit zunehmendem Anteil an Getreide (stärkereich!) an
Zwergkaninchen zeigten die Tiere keinerlei Veränderungen des Hartkotes, d.h.
Verdauungsstörungen im Sinne von Durchfall konnten nicht beobachtet werden. Mit
zunehmendem Anteil an Stärke in der Ration kam es jedoch zu einer Verweigerung der
Caecotrophie, d.h. die Tiere fraßen den Weichkot nicht mehr (s. Tabelle 1). Ist es ist durchaus
möglich, dass der dann oftmals „matschige“ Weichkot mit Durchfall verwechselt wurde.
Tab. 1: Einfluss des Stärkegehaltes im Futter auf die Aufnahme der Caecotrophe (modifiziert
nach SÜDMERSEN, 2013)
Stärkegehalt der Ration (%) 0 20,0 28,5 40,5 40,5*
Rohfasergehalt der Ration (%) 33,0 16,0 13,0 8,27 8,42
Kaninchen (n) 3 5 5 5 3
davon verweigern die Caecotrophie (n) 0 0 2 5 3
* resistente Stärke
Einschränkend muss jedoch hinzugefügt werden, dass die Verweigerung erst bei sehr hohen
Stärkegehalten im Futter auftrat. Bei Gehalten von 20% Stärke konnte dieses Verhalten nicht
beobachtet werden, und das entspricht immerhin einem Getreideanteil von rund 40% in der
Ration.
Aussage: Der Flüssigkeitsbedarf ist auch über Saftfutter zu decken
Mit einem zunehmenden Bestreben um eine optimale Versorgung von Kleinsäugern nehmen
auch die Anfragen zur Versorgung dieser Spezies mit Wasser zu. Zum Einen soll dem Tier
110
eine ausreichende Wasseraufnahme ermöglicht werden, wie es das Tierschutzgesetz fordert,
zum Anderen sind Mengenangaben insbesondere dann von Interesse, wenn bestimmte
Ergänzungsprodukte (z.B. Vitaminpräparate) über das Wasser appliziert werden sollen. Auch
zur Vermeidung bzw. nach dem Auftreten von Blasensteinen ist eine ausreichende
Flüssigkeitsaufnahme erforderlich.
Wird den Tieren parallel zu dem üblichen Mischfutter (auf der Basis nativer Komponenten)
noch Grün(Saft)futter angeboten, steigt die Gesamtwasseraufnahme signifikant an. Doch trotz
dieser forcierten Wasseraufnahme über das Saftfutter nehmen die Tiere aber dennoch Wasser
über die Tränke auf. Bei einem Verzicht auf ein zusätzliches Tränkwasserangebot geht nicht
nur die Gesamtwasseraufnahme, sondern auch die Futteraufnahme zurück.
Anfragen im Rahmen der Diätetik/diätetischer Maßnahmen
Vielfach werden gezielte Anfragen erst dann gestellt, wenn bereits eine Störung beobachtet
bzw. diagnostiziert wurde. Im Gegensatz zu Hund und Katze, bei denen eine Vielfalt und
Vielzahl kommerzieller Diätfuttermittel zur Verfügung stehen, ist bei den kleinen Nagern nur
die Einleitung diätetischer Maßnahmen möglich. An erster Stelle stehen Empfehlungen für
eine art- und bedarfsgerechte Ernährung, und zwar unter Berücksichtigung der
vorberichtlichen Informationen (z.B. bedarfsgerechte Ca-Zufuhr bei Urolithiasis oder
Reduktion der Kraftfuttermenge bei gleichzeitig höherem Angebot von Raufutter bei
Adipositas).
Welche diätetischen Maßnahmen sind zur Vermeidung einer Urolithiasis bzw. von
Rezidiven möglich?
Physiologischerweise zeigt der Harn von Kaninchen, Meerschweinchen und Degu bereits in
einem gewissen Umfang ungelöste Mineralien, welche als kreidige Trübungen bzw.
Sedimente im Harn sichtbar sind. Das Auftreten dieser kreideartigen Sedimente im Harn von
lässt sich wesentlich durch die Besonderheiten im Ca-Stoffwechsel von Kaninchen,
Meerschweinchen und Degu erklären. Steigt die Ca-Aufnahme dieser Tiere (d.h. der Ca-
Gehalt im Futter), so wird die Ca-Absorption aus dem Darm nicht reduziert, sondern forciert.
Aufgrund der renalen Elimination des im Überschuss absorbierten Calciums kommt es dann –
insbesondere bei einer unzureichenden Flüssigkeitsversorgung der Tiere, verbunden mit einer

111
Konzentrierung harnpflichtiger Substanzen – zum Auftreten eines „kreidigen“ Harns bzw. zur
Bildung calciumreicher Harnkonkremente bzw. -steine. Im Gegensatz hierzu scheidet der
Chinchilla bedarfsüberschreitende Ca-Gehalte mit dem Kot aus, d.h. dass Risiko
calciumhaltiger Steine in der Blase ist deutlich geringer.
Zur Vermeidung von Rezidiven aber auch im Rahmen der Prophylaxe ist zunächst auf eine
bedarfsgerechte Ca-Zufuhr (im Erhaltungsstoffwechsel etwa 5 – 6 g Calcium pro kg Futter)
zu achten. Auf calciumreiche Futtermittel wie beispielsweise Luzerne, Grünrollis oder
Nagesteine sollte verzichtet werden.
Vielfach wird auch danach gefragt, ob sich der Harn der Kleinsäuger nicht ansäuern lässt wie
bei Hund und Katze. Zu bedenken ist, dass diese einen stark alkalischen Harn (pH 8,5 – 9,2)
absetzen, während dieser bei den Fleischfressern nicht so hoch ist (pH 5,0 – 7,0). So konnte
der Harn-pH-Wert bei den Kleinsäugern weder durch Methionin, noch durch Calciumchlorid
oder Benzoesäure angesäuert werden. Auch die Gabe von Vitamin C hatte entgegen
vielfacher Berichte keinen Effekt auf den renalen Harn-pH.
Durch welche Futtermittel kommt es zu Verdauungsstörungen?
Oftmals ist zu lesen, dass die Aufnahme blähender Futtermittel wie z.B. Kohl zu Tympanien
führen würde. In diversen Fütterungsstudien zeigte sich aber, dass nicht der Kohl an sich,
sondern die Fütterungstechnik das eigentliche Problem ist. Werden die Tiere allmählich und
vor allem kontinuierlich an das Futter gewöhnt, so können auch diverse Kohlsorten in großen
Mengen verfüttert werden. Verdauungsstörungen treten hingegen auf, wenn es zu einem
diskontinuierlichem Angebot kommt (tagelang kein frisches Saftfutter und dann plötzlich bei
Verfügbarkeit wieder größere Mengen, die an die Tiere gefüttert werden).
Häufig werden bei Durchfällen Hefen im Kot der Tiere diagnostiziert. Entsprechend wird
nach Ursachen für diese hefebedingten Durchfälle gefragt. Da Hefen sich besonders gut in
Anwesenheit von Zucker vermehren, sollten zuckerreiche Komponenten vom Speiseplan
gestrichen werden.
Problematisch ist aber auch Obst, welches ohne Wechsel über einen längeren Zeitraum
angeboten wird. So konnte bei Fütterung von Apfelspalten bereits nach 6 Stunden ein

112
Hefengehalt ermittelt werden, welcher höher als übliche, zu tolerierende Orientierungswerte
war.
Wie sollte eine Ration für herbivore Kleinsäuger gestaltet werden?
Da es sich wie eingangs erwähnt um herbivore Spezies handelt, sollte die Basis einer jeden
Ration aus Heu (Angebot ad libitum) bestehen. Saftfutter hat den Vorteil, dass es bei
Aufnahme gleichzeitig auch die Flüssigkeitsversorgung des Tieres verbessert (im Rahmen
einer Urolithiasisprophylaxe hilfreich). Allgemein sind 200 g Saftfutter (bestehend aus 70%
Gras, Kräutern und Salaten sowie 20% Gemüse und 10% Obst) pro Kilogramm Körpermasse
zu empfehlen. Bei einem 2 kg schweren Kaninchen würde das demnach einer Menge von 280
g Grünfutter, 80 g Gemüse und 40 g Obst entsprechen.
Um bei überständigem Heu, aber auch trockensubstanzarmem Saftfutter die Energie- wie
auch Mineralstoffversorgung zu sichern, sollte die Ration mit einem pelletierten Alleinfutter
ergänzt werden.
ZUSAMMENFASSUNG
Die Ursachen für Fehler in der Fütterung von Kleinsäugern sind vielfältig, resultieren in erster
Linie aber aus einer fehlenden Beachtung der Artansprüche dieser Spezies. Neben einer
fehlerhaften Rationsgestaltung (mangelnder Anteil an kaufähigem Raufutter, forcierte
Aufnahme an Kohlenhydraten oder Calcium) und dem Angebot hygienisch nicht
einwandfreier Futter kommt auch der Fütterungstechnik (diskontinuierliches Futterangebot,
abrupte Futterwechsel) Bedeutung zu. Diätetische Maßnahmen zielen daher primär auf eine
Optimierung der Fütterung kleiner Nager im Rahmen der Prophylaxe bzw. den Ausgleich
bestehender Defizite. Um auf Fragen von Seiten der Tierbesitzer kompetent eingehen und
wertvolle Hilfestellungen sowie Tipps geben zu können, sind Kenntnisse zu
ernährungsphysiologischen Abläufen, aber auch zu den Nährstoffansprüchen dieser Spezies
unabdingbar.

113
SCHRIFTTUM
BJÖRNHAG, G. (1981): Separation and retrograde transport in the large intestine of
herbivores. Livest. Prod. Sci. 8, 351-360
EWRINGMANN, A.; GLÖCKNER, B. (2012): Leitsymptome bei Meerschweinchen,
Chinchilla und Degu: Diagnostischer Leitfaden und Therapie. Enke Verlag, 2. Aufl.,
Stuttgart
GRÜNBERG, W. (1971): Karbonat Harnsteine herbivorer Säugetiere. Zentralbl.
Veterinärmed. A 18, 797-823
HAGEN; K., CLAUSS, M.; HATT, J.M. (2014): Drinking preferences in chinchillas
(Chinchilla laniger), degus (Octodon degu) and guinea pigs (Cavia porcellus). J. Anim.
Physiol. Anim. Nutr. 98, 942-947
HANSEN, S. (2012): Untersuchungen zum Ca-Stoffwechsel sowie zur
Zahnlangenentwicklung und-zusammensetzung von Chinchillas bei Variation der Ca-
Zufuhr und des Angebots von Nagematerial. Hannover, Tierärztliche Hochsch., Diss.
HERRMANN, A. (1989): Untersuchungen über die Zusammensetzung des Chymus im
Magen-Darm-Kanal von Jungkaninchen in Abhängigkeit vom Rohfaser-und Stärkegehalt
des Futters. Hannover, Tierärztl. Hochschule, Diss.
HOLTENIUS, K.; BJÖRNHAG, G. (1985): The colonic separation mechanism in the guinea-
pig (Cavia porcellus) and the chinchilla (Chinchilla laniger). Comp. Biochem. Physiol. A.
Physiol. 82, 537-542
HOMMEL, D. (2012): Untersuchungen an Degus (Octodon degus) zur Futter-und
Wasseraufnahme sowie zur Verdaulichkeit von Nährstoffen bei Angebot unterschiedlicher
Futtermittel. Hannover, Tierärztliche Hochsch., Diss.
HÖRNICKE, H. (1978): Futteraufnahme beim Kaninchen – Ablauf und Regulation. Übers.
Tierernährg. 6, 91-148
HÖRNICKE, H. (1981): Utilization of caecal digesta by caecotrophy (soft faeces ingestion) in
the rabbit. Livest. Prod. Sci. 8, 361-366
KAMPHUES, J. (1999): Besonderheiten in der Verdauungsphysiologie kleiner Nager.
Praxisrelevante Fragen zur Ernährung kleiner Heimtiere (kleine Nager, Frettchen,
Reptilien), Hannover 2.10.1999, 7-13
KAMPHUES, J.; CARSTENSEN, P.; SCHROEDER, D.; MEYER, H.; SCHOON, H.A.;
ROSENBRUCH, M. (1986): Effekte einer steigenden Calcium und Vitamin D Zufuhr auf
den Calciumstoffwechsel von Kaninchen. J. Anim. Physiol. Anim. Nutr. 56, 191-208

114
KAMPHUES, J.; WOLF, P.; EDER, K.; IBEN, C.; KIENZLE, E.; COENEN, M.;
LIESEGANG, A.; MÄNNER, K.; ZEBELI, Q.; ZENTEK, J. (2014): Supplemente zur
Tierernährung für Studium und Praxis. M. & H. Schaper GmbH, 12. Aufl., Hannover
MEYER, H.; ZENTEK, J.; ADOLPH, P.; TAU, A.; MISCHKE, R. (1996): Untersuchungen
zur Ernährung des Meerschweinchens III. Nettoabsorption, renale Exkretion sowie Bedarf
an Mengenelementen. Kleintierpraxis 41, 275-286
SAKAGUCHI, E. (2003): Digestive strategies of small hindgut fermenters. Anim. Sci. J. 74,
327-337
SAKAGUCHI, E.; OHMURA, S. (1992): Fibre digestion and digesta retention time in
guinea-pigs (Cavia porcellus), degus (Octodon degus) and leaf-eared mice (Phyllotis
darwini). Comp. Biochem. Physiol. A. Physiol. 103, 787-791
SASSENBURG, L. (2015): Degu, In: Fehr M, Sassenburg LZwart P (Hrsg.), Krankheiten der
Heimtiere. Schlütersche, Hannover
SCHRÖDER, A. (2000): Vergleichende Untersuchungen zur Futteraufnahme von
Zwergkaninchen, Meerschweinchen und Chinchilla bei Angebot unterschiedlich
konfektionierter Einzel- und Mischfuttermittel. Hannover, Tierärztliche Hochsch., Diss.
SÜDMERSEN, K. (2013): Untersuchungen an Kaninchen zu verdauungsphysiologischen
Auswirkungen unterschiedlicher Stärke- und Rohfasergehalte im Mischfutter unter
Berücksichtigung futtermitteltechnologischer Einflüsse. Hannover, Tierärztl. Hochsch., Diss.
TAU, A. (1992): Verdaulichkeit verschiedener Futtermittel beim Meerschweinchen in
Abhängigkeit vom Rohfasergehalt. Hannover, Tierärztliche Hochsch., Diss.
WENGER, A.K. (1997): Vergleichende Untersuchungen zur Aufnahme und Verdaulichkeit
verschiedener rohfaserreicher Rationen und Futtermittel bei Zwergkaninchen,
Meerschweinchen und Chinchilla. Hannover, Tierärztliche Hochsch., Diss.
WOLF, P. (2005): Urolithiasis bei Kleinsäugern – Ursachen und diätetische Maßnahmen.
Kleintier Konkret 4, 22-25
WOLF, P. (2009): Störungen im Verdauungstrakt bei Kleinsäugern – Welche diätetischen
Maßnahmen helfen? Kleintier konkret 12 (3), 25-30
WOLF, P.; KAMPHUES, J. (1995): Probleme der art- und bedarfsgerechten Ernährung kleiner
Nager als Heimtiere. Prakt. Tierarzt 76, 1088-1092
WOLF, P.; KAMPHUES, J. (1999): Empfehlungen zur Fütterung kleiner Nager in der
Heimtierhaltung. Praxisrelevante Fragen zur Ernährung kleiner Heimtiere (kleine Nager,
Frettchen, Reptilien), Hannover, 41-50
115
WOLF, P.; KAMPHUES, J. (2009): Anfragen aus der tierärztlichen Fütterungsberatung zu
kleinen Nagern. Kleintierpraxis 54 (6), 317-321
WOLF, P.; BUCHER, L.; KAMPHUES, J. (1999): Die Futter-, Energie- und Wasseraufnahme
von Zwergkaninchen unter praxisüblichen Fütterungsbedingungen. Kleintierprax. 44, 263-280
WOLF, P.; BUCHER, L.; ZUMBROCK, B.; KAMPHUES, J. (2008): Daten zur
Wasseraufnahme bei Kleinsäugern und deren Bedeutung für die Heimtierhaltung.
Kleintierprax. 7, 217-223
Anschrift des Verfassers:
Professur für Ernährungsphysiologie und Tierernährung
Universität Rostock
Justus-von-Liebig-Weg 6b
18059 Rostock
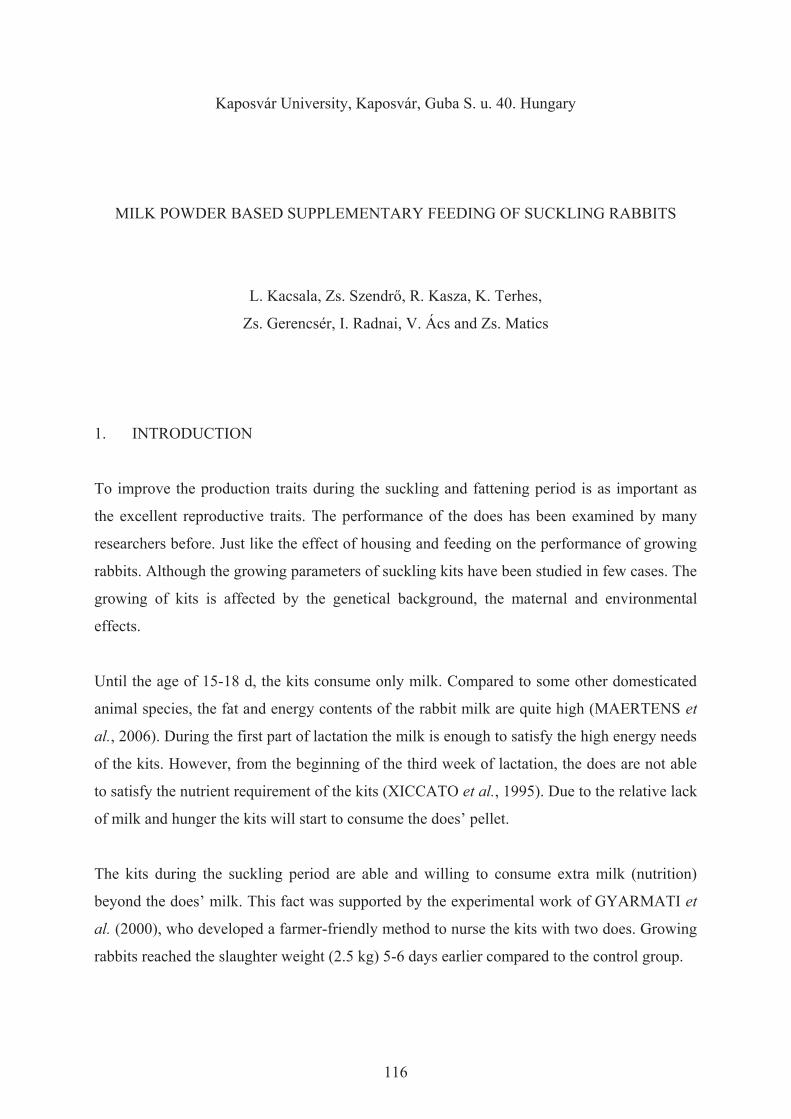
116
Kaposvár University, Kaposvár, Guba S. u. 40. Hungary
MILK POWDER BASED SUPPLEMENTARY FEEDING OF SUCKLING RABBITS
L. Kacsala, Zs. Szendrő, R. Kasza, K. Terhes,
Zs. Gerencsér, I. Radnai, V. Ács and Zs. Matics
1. INTRODUCTION
To improve the production traits during the suckling and fattening period is as important as
the excellent reproductive traits. The performance of the does has been examined by many
researchers before. Just like the effect of housing and feeding on the performance of growing
rabbits. Although the growing parameters of suckling kits have been studied in few cases. The
growing of kits is affected by the genetical background, the maternal and environmental
effects.
Until the age of 15-18 d, the kits consume only milk. Compared to some other domesticated
animal species, the fat and energy contents of the rabbit milk are quite high (MAERTENS et
al., 2006). During the first part of lactation the milk is enough to satisfy the high energy needs
of the kits. However, from the beginning of the third week of lactation, the does are not able
to satisfy the nutrient requirement of the kits (XICCATO et al., 1995). Due to the relative lack
of milk and hunger the kits will start to consume the does’ pellet.
The kits during the suckling period are able and willing to consume extra milk (nutrition)
beyond the does’ milk. This fact was supported by the experimental work of GYARMATI et
al. (2000), who developed a farmer-friendly method to nurse the kits with two does. Growing
rabbits reached the slaughter weight (2.5 kg) 5-6 days earlier compared to the control group.
117
In the first 1.5-2 weeks of the lactation does excrete faecal pellets in the nest during nursing
(HUDSON and DISTEL, 1982). According to KOVÁCS et al. (2006) and COMBES et al.
(2014) the maternal faecal pellets were consumed by the kits, and were involved in caecal
microbiota implantation. These results demonstrate that suckling kits are able to consume
solid material from very early age, when they are still unable to leave the nest. Thus the
nutrient requirement of the suckling kits in the early stage could be satisfied in a more explicit
way by providing extra feed source. Along with this method the utilization of the maximal
growth potential and the maximization of the survival of the kits could be achievable.
Moreover the creep feeding of suckling kits in early age could have a potential "positive"
impact on the doe: if the kits consume solid feed, it should reduce the "pressure" on the
milking, thus the doe may give less milk (if kits are less hungry) and thus the doe would have
a better health status and perhaps a longer career.
The hypothesis of the study is that the nutrient requirements of suckling kits are not fully
satisfied and that extra feed source provided in the nest could be a solution to meet these
requirements. There are no commercially available feed for suckling kits in early age. The
reason of the choice of milk powder based creep feed is due to its highly digestible protein
content and the fact of being especially made for suckling animals.
2. MATERIALS AND METHODS
The experiment was conducted at Kaposvár University with does and kits of Pannon Rabbit
Breeding Program (n=20 does, n=180 suckling kits). Forty-nine-day reproduction rhythm and
controlled nursing was applied till 16 d of age. According to ZARROW et al. (1965) and
GIDENNE et al. (2010) suckling rabbits begin to leave the nest box and start to eat significant
quantities of solid feed at around 16-18 days of age. The does were housed in flat deck cages
(86 * 38 * 30 cm, included the nest box: 28.5 * 38 cm). The temperature varied between 20
and 25 °C. The daily lighting was 16 hours (7 am - 11 pm). Does received commercial diet ad
libitum (Table 1). After kindling, the multiparous does (3-5th parturition; body weight: 4-4.5
kg) and litters were randomly divided into two groups (n= 10 does/group, 9 kits/litter,
crossfostering within groups was applied, dead kits were not replaced). The kits in control
group (C) did not receive additional pellets. In group P, the kits were additionally fed with
pellets made of milk powder : water in 9 : 1 weight ratio. Chemical compositions of the

118
supplemental creep feed are shown in Table 1. The cylinder-shaped solid pellets (20 mm
length and 8 mm of diameter; 3g/piece) – made with baitmaker (Carp Expert Mega Bojliroller
8mm®) – were scattered into the nest box near to the kits. The additional feeding lasted from
the age of 3 d till 15 d. Based on pre-experimental results, at the beginning of the experiment
two pieces of pellets were placed on the top of the nest material after each nursing. Later on it
was increased gradually to six pellets till 15 days of age (+1 pieces averagely every second
day). Kits did not have access to creep feed after 16 d of age. They had free access to the
commercial rabbit feed outside of the nest box.
Table 1: Composition of the does’ feed and the milk powder based pellet
Composition of feed
Does’ feed Kits’ Pellet
Component Amount Component Amount
DE 11.3 MJ/kg Dry matter 896 g/kg
Crude protein 182 g/kg Crude protein 196 g/kg
Ether extract 44 g/kg Crude fat 164 g/kg
Crude fibre 144 g/kg Ether extract 2 g/kg
Ash 70 g/kg Ash 80 g/kg
The pellet hardness was measured (10 pieces) at 18 oC by using Zwick Roell/Z005 (ProLine
table-top testing machine). The speed of the cutting was 500 mm/min, and the thickness of the
blade was 1 mm. Visual inspection was performed and video records were made in both
experiments to observe the pellet intake of kits. Individual body weight of kits was measured
at 5, 9, 12 and 16 d of age before nursing. The litter weights were measured at 5, 9, 12 and 16
d of age immediately after nursing (before urination) to calculate the milk production. At 19
and 21 d of the lactation the does had free access to the nest for nursing, and the kits’ weight
was measured at 8 am.
The milk production, body weight, weight gain and the hardness of pellet was evaluated by T-
test, the survivor rate of kits was evaluated by Chi2 test with SPSS 10.0 software.

119
3. RESULTS AND DISCUSSION
The suckling kits consumed the additional solid feed, which was visually observed (bitemarks
and missing pieces of the additional pellets) daily (9am) and in some cases they were
recorded by camera. The amount of consumed feed could not be measured due to the
consistency of the creep feed (evaporation and water binding capacity) and their
disappearance in the nest material.
KACSALA et al. (2016) provided piglet feed based solid additional pellets to the suckling
kits in early stage of life. In their study the hardness of pellet was 5.9±0.9 N. In this current
study the hardness was a higher value, 8.4±0.3 N. The difference could be based on the
different components (water holding capacity).
Table 2: Effect of supplementary feeding on the body weight and daily weight gain of
suckling kits
Days of age C1 P2 SE P
n 90 90
Body weight, g
5 97.7 101 1.38 0.259
9 150 158 2.27 0.067
12 199 208 3.11 0.148
16 260 272 3.86 0.124
19 335 354 4.56 0.077
21 363 383 5.22 0.590
Body weight gain, g/d
5-9 13.1 14.3 0.61 0.352
9-12 16.5 16.8 1.03 0.870
12-16 15.3 16.2 0.56 0.438
16-19 25.0 27.9 1.17 0.219
19-21 14.0 14.9 1.53 0.781
2-21 16.6 17.9 0.61 0.329
C1: Kits without creep feed; P2: Kits with milk powder based solid creep feed
120
The creep feeding had no effect on the milk production/consumption at any of the observation
day and in overall (daily average milk consumption: C: 375g/day, P: 357g/day). There were
no significant differences in body weight or in body weight gain of the suckling kits (Table
2). In another experiment of KACSALA et al. (2016) a significant difference was observed in
the body weight of the suckling kits (+6-9%) in favour of the piglet feed based pelleted group.
In case of the survival rate of the suckling kits, the group with the creep feed supplementation
(P) did not differ from the control group. Within the first 21 d of the lactation the survival rate
of the kits in the control group was 92.2% and in the additionally fed group it was 88.9%.
4. CONCLUSIONS
In general we can state, that the suckling kits consumed from the creep feed, although the
additional feeding did not affect the milk consumption, the body weight, the weight gain or
the survival rate of the kits. Further studies are needed to find a method to measure the
amount of consumed creep feed and to improve the consumption of the additional feed.
5. SUMMARY
The aim of the experiment was to examine the possibility of additional feeding of suckling
kits using solid feed based on commercially available milk powder. The experiment was
conducted with Pannon White rabbits (n=20 does, 180 kits), they were randomly divided into
two groups after crossfostering (2 days after kindling; 10 does and 90 kits per group). The
does were housed in flat deck cages. Controlled nursing was applied until 16d of lactation.
The litters in control group (C) did not receive additional pellets. In group P, the kits were
additionally fed with pellets (8 mm of diameter, 2 cm length cylinder shaped pellet) made of
milk powder : water in 9 : 1 weight ratio. At the beginning of the experiment (2 d) 2 pellets
were placed into the nest. Later on the number of pellets was gradually increased till 15 d.
Based on the visual observation and video recording kits consumed the additional solid feed.
There were no differences in milk consumption, body weight and body weight gain of kits.
The additional feeding did not affect the mortality of kits. Further studies are needed to
examine the effect of other components and techniques to improve the additional feed intake
and growth of the suckling kits in early age.
121
ACKNOWLEDGEMENT
Supported through the New National Excellence Program of the Ministry of Human
Capacities /ÚNKP-16-3/. Authors would like to thank the colleges of the Department of
Nutritional Science and Production Technology of Kaposvár University for their help and
support.
6. REFERENCES
1. COMBES, S.; GIDENNE, T.; CAUQUIL, L.; BOUCHEZ, O.; FORTUN-LAMOTHE, L.
(2014): Coprophagous behaviour of rabbit pups affect implantation of cecal microbiota and
health status. Journal of Animal Science 92, 652-665
2. GIDENNE, T.; LEBAS, F.; FORTUN-LAMOTHE, L. (2010) Feeding behaviour of
rabbits. In Nutrition of the rabbit (ed. C DE BLAS, J WISEMAN) pp. 233-252. CABI
Publishing, Wallingford, UK
3. GYARMATI, T.; SZENDRŐ, ZS.; MAERTENS, L; BIRÓ-NÉMETH, E.; RADNAI, I.;
MILISITS, G.; MATICS, ZS. (2000): Effect of suckling twice a day on the performance of
suckling and growing rabbits. In Proc. 7th World Rabbit Congress, 2000 July, Valencia,
Spain, Vol. C, 283-289
4. HUDSON, R.; DISTEL, H. (1982): The pattern of behaviour of rabbit pups in the nest.
Behaviour 79, 255-271
5. KACSALA, L.; GERENCSÉR, ZS.; SZENDRŐ, ZS.; NAGY, I.; RADNAI, I.;
ODERMATT, M.; MATICS, ZS. (2016): Piglet feed based additional feeding for suckling
kits In: Proc. 11th World Rabbit Congress. 2016 June, Qingdao, China, 281-284
6. KOVÁCS, M.; SZENDRŐ, ZS.; MILISITS, G.; BIRO-NEMETH, E.; RADNAI, I.;
PÓSA, R.; BÓNAI, A.; KOVÁCS, F.; HORN, P. (2006): Effect of nursing method and
faeces consumption on the development of bacteroides, lactobacillus and coliform flora in
the caecum of the newborn rabbits. Reproduction Nutrition Development 46, 205-210
7. MAERTENS, L.; LEBAS, F.; SZENDRŐ, ZS. (2006): Rabbit milk: A review of quantity,
quality and non-dietary affecting factors. World Rabbit Science 14, 205-230
8. XICCATO, G.; PARIGI-BINI, R.; DALLE ZOTTE, A.; CARAZZOLO, A.; COSSU, M.E.
(1995): Effect of dietary energy level, addition of fat and physiological state on
performance and energy balance of lactating and pregnant rabbit does. Animal Science 61,
387-398
122
9. ZARROW, M.X.; DENENBERG, V.M.; ANDERSON, C.O. (1965): Rabbit: Frequency of
suckling in the pup. Science 150, 1835-1836
Corresponding author:
Faculty of Agricultural and Environmental Sciences of
Kaposvár University
Guba S. u. 40.
7400 Kaposvár
Hungary

123
1Faculty of Agricultural and Environmental Sciences, Kaposvár University, Hungary 2Department of Animal Medicine, Production and Health, University of Padova, Italy
EFFECT OF DIVERGENT SELECTION FOR TOTAL BODY FAT CONTENT
DETERMINED BY CT ON THE CARCASS TRAITS AND FAT CONTENT OF MEAT
CUTS OF RABBITS
R. Kasza1, A. Dalle Zotte2, M. Cullere2, T. Donkó1, Zs. Szendrő1, I. Radnai1, I. Nagy1,
V. Ács1, L. Kacsala1, Zs. Gerencsér1 and Zs. Matics1
1. INTRODUCTION
There are four main fat depots in the body: subcutaneous, visceral, inter- and intramuscular.
However, there are differences in distributions across and within species. For example in pigs
the subcutaneous fat is 60-70 % of the total fat content, in cattle the intermuscular fat is the
main fat depot (GERBENS, 2004). In rabbits perirenal fat is the most pronounced, it
represents about 50-60 % of the fat content of carcass (HERNÁNDEZ et al., 2006; PLA et
al., 2004).
Rabbit meat has favourable characteristics (high protein, vitamin E, PUFA and omega-3 fatty
acids and low cholesterol, sodium and fat contents). It is a delicacy and a healthy food product
(DALLE ZOTTE, 2002; DALLE ZOTTE and SZENDRŐ, 2011). However, there are
significant differences in fat content of different carcass parts and meat cuts (PLA et al.,
2004).
As it was published by SELLIER et al. (2010) the average heritability of intramuscular fat
content in pigs is 0.5. Same values were found by MARSHALL (1999) in beef cattle (0.54).
High heritability of abdominal fat was estimated in chickens (0.71) (ZEREHDARAN et al.,
2004; BAÉZA and LE BIHAN-DUVAL, 2013). ZOMEÑO et al. (2013) published results
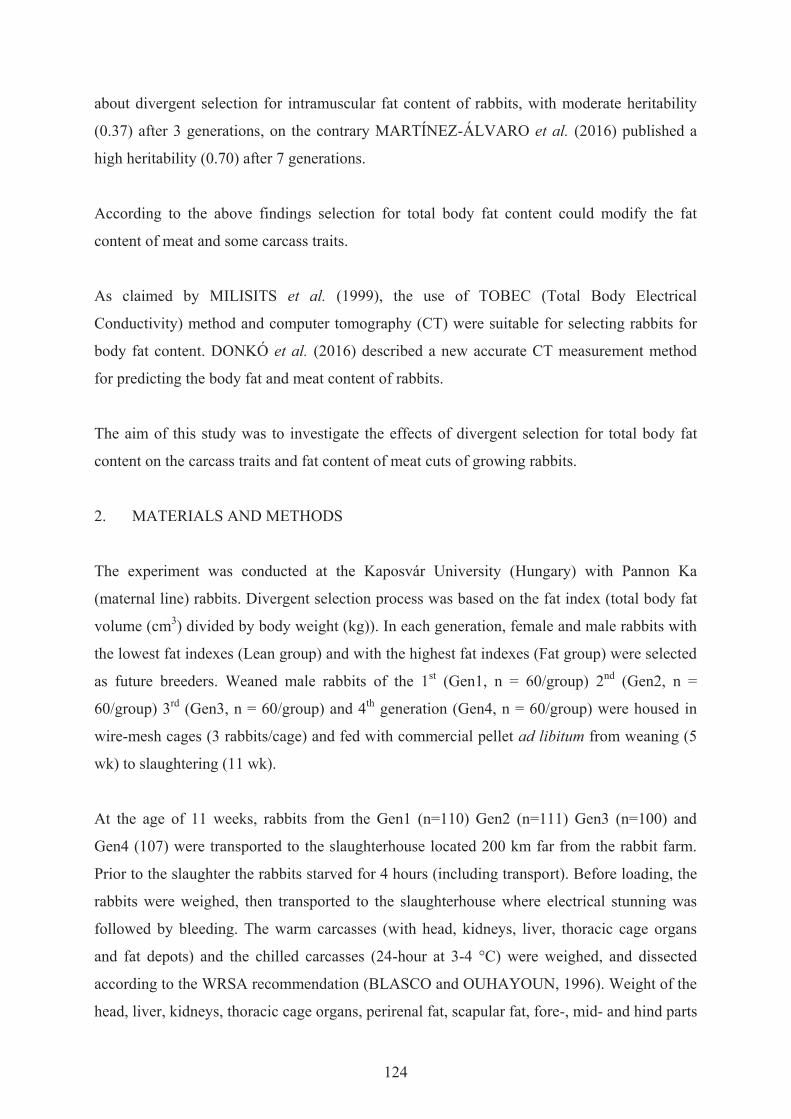
124
about divergent selection for intramuscular fat content of rabbits, with moderate heritability
(0.37) after 3 generations, on the contrary MARTÍNEZ-ÁLVARO et al. (2016) published a
high heritability (0.70) after 7 generations.
According to the above findings selection for total body fat content could modify the fat
content of meat and some carcass traits.
As claimed by MILISITS et al. (1999), the use of TOBEC (Total Body Electrical
Conductivity) method and computer tomography (CT) were suitable for selecting rabbits for
body fat content. DONKÓ et al. (2016) described a new accurate CT measurement method
for predicting the body fat and meat content of rabbits.
The aim of this study was to investigate the effects of divergent selection for total body fat
content on the carcass traits and fat content of meat cuts of growing rabbits.
2. MATERIALS AND METHODS
The experiment was conducted at the Kaposvár University (Hungary) with Pannon Ka
(maternal line) rabbits. Divergent selection process was based on the fat index (total body fat
volume (cm3) divided by body weight (kg)). In each generation, female and male rabbits with
the lowest fat indexes (Lean group) and with the highest fat indexes (Fat group) were selected
as future breeders. Weaned male rabbits of the 1st (Gen1, n = 60/group) 2nd (Gen2, n =
60/group) 3rd (Gen3, n = 60/group) and 4th generation (Gen4, n = 60/group) were housed in
wire-mesh cages (3 rabbits/cage) and fed with commercial pellet ad libitum from weaning (5
wk) to slaughtering (11 wk).
At the age of 11 weeks, rabbits from the Gen1 (n=110) Gen2 (n=111) Gen3 (n=100) and
Gen4 (107) were transported to the slaughterhouse located 200 km far from the rabbit farm.
Prior to the slaughter the rabbits starved for 4 hours (including transport). Before loading, the
rabbits were weighed, then transported to the slaughterhouse where electrical stunning was
followed by bleeding. The warm carcasses (with head, kidneys, liver, thoracic cage organs
and fat depots) and the chilled carcasses (24-hour at 3-4 °C) were weighed, and dissected
according to the WRSA recommendation (BLASCO and OUHAYOUN, 1996). Weight of the
head, liver, kidneys, thoracic cage organs, perirenal fat, scapular fat, fore-, mid- and hind parts

125
of the carcass and the Longissimus dorsi (LD) muscle was recorded. The dressing out
percentage and the ratio of the different carcass parts and fat depots to the reference carcass
were calculated (BLASCO and OUHAYOUN, 1996).
Four meat cuts were dissected from each carcass: Longissimus dorsi meat (LD), hind leg
(HL), fore leg (FL) and abdominal wall (AW). Three hundred and sixty frozen meat cuts (15
samples x 4 cuts x 2 groups x 3 generations) were analysed for lipids content at the
Department of Animal Medicine, Production and Health of Padova University (Italy).
Chemical Analysis
After overnight thawing at +4 °C, each LD, HL, FL and AW cut was prepared for grinding
with a Retsch Grindomix GM 200 (10 seconds at 4000 rpm). Then, each sample was freeze-
dried and stored in closed plastic tubes at +4 °C up to analysis. Lipid extraction was
performed with the Accelerated Solvent Extractor (M-ASE), in which chloroform/methanol
(1:2) was the binary solvent mixture used for extraction. Ether extract content was determined
gravimetrically after the removal of the solvent by vacuum evaporation under nitrogen stream
at 50 °C (AZ-2 PLUS machine, Genevac UK).
Statistical Analysis
The effect of the direction of selection (Fat, Lean), of the successive generation numbers (1-4)
and their interaction were tested using the GLM procedure of SAS. Tests of differences
between least-squares means were performed by means of Tukey test (pdiff option of GLM
procedure).
3. RESULTS AND DISCUSSION
There were not differences in the slaughter weight and dressing out percentage between Lean
and Fat groups in each generation (Table 1). In chickens, similar results were published when
they were divergently selected for high or low abdominal fat content (LECLERCQ et al.,
1989; BAÉZA and LE BIHAN-DUVAL, 2013).
Some significant differences emerged for the ratio of the fore part to reference carcass in
Gen2 and Gen4 in favour of Lean group. Oppositely, the ratio of mid part to reference carcass
was higher in Fat group in Gen1, but no difference was shown in the other generations. As for
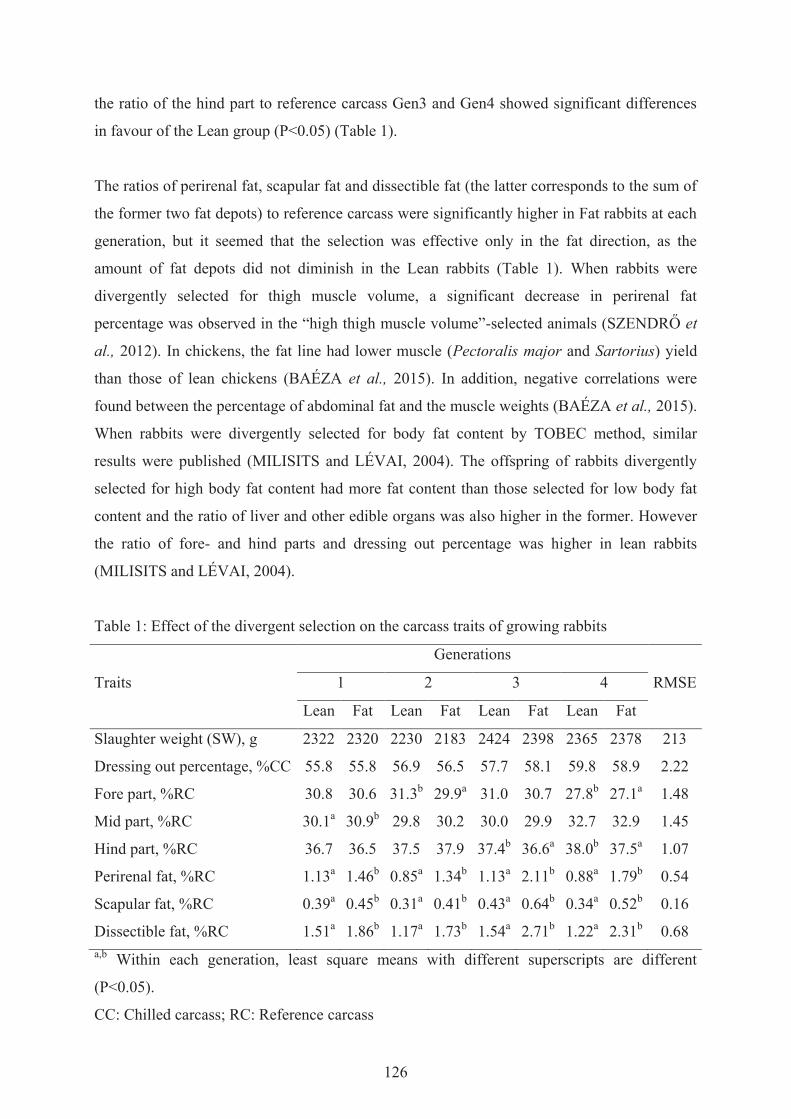
126
the ratio of the hind part to reference carcass Gen3 and Gen4 showed significant differences
in favour of the Lean group (P<0.05) (Table 1).
The ratios of perirenal fat, scapular fat and dissectible fat (the latter corresponds to the sum of
the former two fat depots) to reference carcass were significantly higher in Fat rabbits at each
generation, but it seemed that the selection was effective only in the fat direction, as the
amount of fat depots did not diminish in the Lean rabbits (Table 1). When rabbits were
divergently selected for thigh muscle volume, a significant decrease in perirenal fat
percentage was observed in the “high thigh muscle volume”-selected animals (SZENDRŐ et
al., 2012). In chickens, the fat line had lower muscle (Pectoralis major and Sartorius) yield
than those of lean chickens (BAÉZA et al., 2015). In addition, negative correlations were
found between the percentage of abdominal fat and the muscle weights (BAÉZA et al., 2015).
When rabbits were divergently selected for body fat content by TOBEC method, similar
results were published (MILISITS and LÉVAI, 2004). The offspring of rabbits divergently
selected for high body fat content had more fat content than those selected for low body fat
content and the ratio of liver and other edible organs was also higher in the former. However
the ratio of fore- and hind parts and dressing out percentage was higher in lean rabbits
(MILISITS and LÉVAI, 2004).
Table 1: Effect of the divergent selection on the carcass traits of growing rabbits
Traits
Generations
RMSE 1 2 3 4
Lean Fat Lean Fat Lean Fat Lean Fat
Slaughter weight (SW), g 2322 2320 2230 2183 2424 2398 2365 2378 213
Dressing out percentage, %CC 55.8 55.8 56.9 56.5 57.7 58.1 59.8 58.9 2.22
Fore part, %RC 30.8 30.6 31.3b 29.9a 31.0 30.7 27.8b 27.1a 1.48
Mid part, %RC 30.1a 30.9b 29.8 30.2 30.0 29.9 32.7 32.9 1.45
Hind part, %RC 36.7 36.5 37.5 37.9 37.4b 36.6a 38.0b 37.5a 1.07
Perirenal fat, %RC 1.13a 1.46b 0.85a 1.34b 1.13a 2.11b 0.88a 1.79b 0.54
Scapular fat, %RC 0.39a 0.45b 0.31a 0.41b 0.43a 0.64b 0.34a 0.52b 0.16
Dissectible fat, %RC 1.51a 1.86b 1.17a 1.73b 1.54a 2.71b 1.22a 2.31b 0.68 a,b Within each generation, least square means with different superscripts are different
(P<0.05).
CC: Chilled carcass; RC: Reference carcass

127
The fat content of hind leg, fore leg and abdominal wall meats was higher in Fat group in
Gen2 and Gen3, whereas the fat content of Longissimus dorsi muscle started to be
significantly higher only in Gen3 (Table 2). It seemed that the selection was effective only in
the fat direction, as the amount of fat content of the meat cuts did not diminish in the Lean
rabbits (Table 2). The effect of selection on the fat content of meat was confirmed by some
authors. ZOMEÑO et al. (2013) found positive correlations between lipids content in
Longissimus dorsi muscle and perirenal fat content in lines A and V (maternal lines);
however, no relationship was detected in line R (terminal line). The rabbits in the present
experiment also belonged to a maternal line. ZOMEÑO et al. (2013) reported also significant
differences in the perirenal fat content of rabbits selected for high or low intramuscular fat
presence. In fat chickens, carcass fatness was higher than lean chickens, but no difference in
the lipid content of Pectoralis major and Sartorius muscles was observed (BAÉZA et al.,
2015).
Table 2: Effect of the divergent selection on the lipids content (%) of the meat cuts of rabbits
Meat cuts
Generations
1 2 3
Lean Fat SE P Lean Fat SE P Lean Fat SE P
Longissimus
dorsi m. 3.68 3.79 0.09 0.552 3.61 3.78 0.05 0.105 3.73 3.96 0.06 0.040
Hind leg 5.01 5.45 0.18 0.217 5.20 5.85 0.11 0.002 5.52 6.27 0.14 0.004
Fore leg 9.58 9.96 0.42 0.660 8.95 11.71 0.39 <0.001 10.3 12.4 0.43 0.012
Abdominal
wall 9.46 11.2 0.60 0.140 8.75 11.82 0.50 0.001 10.4 13.7 0.56 0.001
4. CONCLUSIONS
It can be concluded that the divergent selection for total body fat content was effective in
increasing the ratio of fat depots in rabbit carcasses. The divergent selection also modified
significantly the lipids content of meat cuts, physiologically characterized by extremes values.

128
5. SUMMARY
The aim of the study was to investigate the effects of divergent selection for total body fat
content on the carcass traits and lipids content of meat cuts of rabbits. The study was
conducted at the Kaposvár University (Hungary) with Pannon Ka (maternal line) rabbits.
Divergent selection process was based on the fat index (total body fat volume (cm3) divided
by body weight (kg)). The rabbits with the lowest fat index formed the Lean-selected group
and those with the highest values formed the Fat-selected group. Weaned male rabbits of the
1st (Gen1, n = 60/groups) 2nd (Gen2, n = 60/groups) 3rd (Gen3, n = 60/groups) and 4th
generation (Gen4, n = 60/groups) were housed in wire-mesh cages (3 rabbits/cage) and fed ad
libitum a commercial pelleted diet from weaning (5 wk) to slaughter (11 wk). At the age of 11
weeks rabbits from each generation were slaughtered. Frozen meat cuts of the first three
generations (Longissimus dorsi muscle (n=15/group/generation), hind leg
(n=15/group/generation), fore leg (n=15/group/generation) and abdominal wall
(n=15/group/generation) were analysed at the Department of Animal Medicine, Production
and Health of Padova University (Italy). There were not differences in the slaughter weight
and dressing out percentage between Lean and Fat groups at each generation. The ratio of fat
depots to reference carcass was significantly higher in Fat rabbits from Gen1. The lipids
content of hind leg, fore leg and abdominal wall meat was higher in Fat group in Gen2 and
Gen3, whereas the fat content of Longissimus dorsi muscle was significantly higher only in
Gen3 in favour of Fat rabbits.
ACKNOWLEDGEMENT
Research funded by Padova University (Ex 60% code: 60A08-7341/15) and the
AGR_PIAC_13-1-2013-0031 project. Authors thank the technical support of Jesica L. Aquino
López.

129
6. REFERENCES
1. BAÉZA, E.; GONDRET, F.; CHARTRIN, P.; LE BIHAN-DUVAL, E.; BERRI, C.;
GABRIEL, I.; NARCY, A.; LESSIRE, M.; MÉTAYER-COUSTARD, S.; COLLIN, A.;
JÉGOU, M.; LAGARRIGUE, S.; DUCLOS, M.J. (2015): The ability of genetically lean
or fat slow-growing chickens to synthesize and store lipids is not altered by the dietary
energy source. Animal, 9 1643-1652
2. BAÉZA, E.; LE BIHAN-DUVAL, E. (2013): Chicken lines divergent for low or high
abdominal fat deposition: a relevant model to study the regulation of energy metabolism.
Animal 7, 965-973
3. BLASCO, A.; OUHAYOUN, J. (1996): Harmonization of criteria and terminology in
rabbit meat research. Revised proposal. World Rabbit Sci. 4, 93-99
4. DALLE ZOTTE, A. (2002): Perception of rabbit meat quality and major factors
influencing the rabbit carcass and meat quality. Livest. Prod. Sci. 75, 11-32.
doi:10.1016/S0301-6226(01)00308-6
5. DALLE ZOTTE, A.; SZENDRŐ, ZS. (2011): The role of rabbit meat as functional food.
Meat Sci. 88, 319-331
6. DONKÓ, T.; CZAKÓ, B.; KOVÁCS, GY.; PETNEHÁZY, Ö.; KASZA, R.; SZENDRŐ,
ZS.; GARAMVÖLGYI, R.; MATICS, ZS. (2016): Total body fat content determination
by means of computed tomography (CT) in rabbits. In: Proc. 11th World Rabbit Congress,
16-18 June 2016, Qingdao, China, 753-756
7. GERBENS, F. (2004): Genetic Control of Intramuscular Fat Accretion. In: M.F.W. TE
PAS, M.E. EVERTS, H.P. HAAGSMAN (editors): Muscle Development of Livestock
Animals. CAB International. Wallingford, UK. p. 343-361
8. HERNÁNDEZ, P.; GONDRET, F. (2006): Rabbit meat quality and safety. In: L.
MAERTENS and P. COUDERT (editors): Recent Advances in Rabbit Sciences. ILVO,
Melle, Belgium. p. 267-290
9. LECLERCQ, B.; GUY, G.; RUDEAUX, F. (1989): Growth characteristics and lipid
distribution in two lines of chicken selected for low or high abdominal fat. Genet. Sel.
Evol. 21, 69-80
10. MARTÍNEZ-ÁLVARO, M.; HERNÁNDEZ, P.; BLASCO, A. (2016): Divergent
selection on intramuscular fat in rabbits: Responses to selection and genetic parameters.
J. Anim. Sci. 94 (12), 4993-5003, doi:10.2527/jas.2016-0590
130
11. MARSHALL, D.M. (1999): Genetics of Meat Quality. In: R. FRIES and A. RUVINSKY
(editors): The genetics of cattle. CAB International. New York, USA. p. 605-636
12. MILISITS, G.; ROMVÁRI, R.; DALLE ZOTTE, A.; SZENDRŐ, ZS. (1999): Non-
invasive study of changes in body composition in rabbits during pregnancy using X-ray
computerized tomography. Ann. Zootechn. 48, 25-34
13. PLA, M.; PASCUAL, M.; ARIÑO, B. (2004): Protein, fat and moisture content of retail
cuts of rabbit meat evaluated with the NIRS methodology. World Rabbit Sci. 12,149-158
14. SELLIER, P.; MAIGNEL, L.; BIDANEL, P. (2010): Genetic parameters for tissue and
fatty acid composition of backfat, perirenal fat and longissimus muscle in Large White
and Landrace pigs. Animal 4, 497-504
15. SZENDRŐ, ZS.; METZGER, SZ.; NAGY, I.; SZABÓ, A.; PETRÁSI, ZS.; DONKÓ, T.;
HORN, P. (2012): Effect of divergent selection for the Computer Tomography measured
thigh muscle volume on productive and carcass traits of growing rabbits. Livest. Sci. 149,
167-172
16. ZEREHDARAN, S.; VEREIJKEN, A.J.L.; VAN ARENDONK, J.A.M.; VAN DER
WAAIJ, E.H. (2004): Estimation of genetic parameters for fat deposition and carcass
traits in broilers. Poultry Sci. 83, 521-525
17. ZOMEÑO, C.; BLASCO, A.; HERNÁNDEZ, P. (2013b): Divergent selection for
intramuscular fat content in rabbits. II. Correlated responses on carcass and meat quality
traits. J. Anim. Sci. 91, 4532-4539
18. ZOMEÑO, C.; HERNANDEZ, P.; BLASCO, A. (2013a): Divergent selection for
intramuscular fat content in rabbits. I. Direct response to selection. J. Anim. Sci. 91,
4526-4531, doi:10.2527/jas.2013-6361
Corresponding author:
Faculty of Agricultural and Environmental Scieces
Kaposvár University
H-7400, Kaposvár Guba S. str. 40
Hungary

131
University of Ljubljana, Biotechnical Faculty, Department of Animal Science
BIRTH WEIGHT AND CONSEQUENCES ON SUBSEQUENT PERFORMANCE
IN RABBITS
J. Urankar, T. Flisar, A. Kermauner, Š. Malovrh and M. Kovač
INTRODUCTION
Productivity in rabbit breeding is defined by does fecundity and kits growth and mortality.
Doe with 45 weaned kits per year can produces 80 kg of meat and thus enlarges her own body
weight for 25 times (GONZALES-REDONDO et al., 2008). Number of weaned kits depends
on number of total born, losses, and doe maternal ability.
Average preweaning mortality varies between 16 and 20%, but can increase up to 50%.
Around 70% of all losses occur in the first week after birth, and 17% more in the second week
(reviewed by RASHWAN and MARAI, 2000). Losses are higher in purebred animals and in
periods of hot weather. Higher mortality of lighter rabbits is associated with reduced viability,
lower milk intake, and within–litter heterogeneity, because lighter kits are not able to struggle
against their heavier littermates for teats during short suckling time (POIGNIER et al., 2000).
The weakest animals are also more susceptible to diseases and can contaminate the whole
litter. The difference in body weight between dead and alive kits was increasing with age
(PLANINC et al., 2011).
Birth weight of rabbit is on average between 60 and 70 g, with range from 35 to 90 g (DI
MEO et al., 2004). Birth weight between 40 and 45 g was reported as a critical for survival
(reviewed by SZENDRÕ, 2000). Generally, individual birth weights decrease with increase in
litter size. However, negative effect of larger litter size on growth rate is highest up to 21 days

132
of age. Birth weight is also unfavourable related to growth during whole rearing period, even
up to the age at first mating (SZENDRÕ et al., 2006).
Aim of the study was to assess the effect of birth weight on growth and survival in the
maternal B and terminal C line of SIKA rabbits for meat production.
MATERIAL AND METHODS
The experiment was performed in Rabbit centre at Department of Animal Science,
Biotechnical Faculty, University of Ljubljana. Animals were fed ad libitum with commercial
pelleted feed without coccidiostatic or preventive antibiotics. Rabbits were penned in wire-net
cages in a closed rabbitry which was heated in winter (min. temperature 18°C). Light period
was 16L:8D. Reproduction rhythm lasted 76 days, mainly because of limited space for
fattening.
Weights and survival were collected on 3988 kits born between December 2010 and
December 2012. All liveborn kits were individually identified by ear notching and weighed
within 24 hrs after birth. Later, kits were weighed once a week until weaning, and at 45 and
65 days of age. Lost kits were identified within 24 hrs after death. Survival (0=died,
1=survived) was studied on two intervals: from birth to weaning and from birth to 65 days of
age.
Table 1: Average losses by birth weight classes
Birth weight No. of kits Losses until
Class Range (g) 35 days (%) 65 days (%)
45 ≤50 443 51.2 54.2
55 51-60 725 23.9 29.9
65 61-70 1017 14.6 20.3
75 71-80 991 11.1 15.6
85 ≥81 812 10.1 14.4
Total 3988 19.2 23.0
Birth weights were categorized into five classes (Table 1). The first class contained kits under
50 g, middle three classes increased by 10 g, while kits heavier than 81 g were assigned in the

133
last class. The average litter size after cross-fostering was 8.01 kits alive and 6.47 kits weaned
per litter. Mortality during lactation amount to 19% and have increased up to 23% until 65
days of age. Losses until weaning and 65 days of age were the highest in class with the
lightest birth weight, where more than half kits died.
Average individual birth weight was 69 g (Table 2). A week old kits have doubled their birth
weights. They gained around 100 g per week before 21 days of age and more than 250 g in
the 4th and 5th week of lactation. Body weight was almost twofold from 3rd week to 4th week
of lactation when kits started to eat solid feed. At the end of test, kits weighed 2028 g.
Table 2: Body weights (g) at each weighing by birth weight classes
BW
class
Age at weighing (days)
0 7 14 21 28 35 45 65
45 44± 5 109±25 202±49 281±73 483±120 772±158 1132±247 1814±290
55 57± 3 128±25 223±47 309±71 540±107 843±151 1203±251 1914±316
65 66± 3 145±24 244±44 339±65 580±101 895±143 1258±238 1991±319
75 76± 3 161±24 265±49 370±77 632±110 957±155 1326±247 2064±327
85 90± 8 182±30 292±59 409±83 686±131 1036±177 1440±297 2172±368
Total 69±15 152±34 254±57 354±84 605±128 927±175 1300±273 2028±346
BW – birth weight
The statistical models for body weight at each weighing and survival included birth weight
class, line, dam parity, litter size after cross-fostering and season of birth. Additionally,
models for body weight included age at weighing due to age difference. Survival data was
analysed by LOGISTIC procedure and body weights by GLM procedure in SAS/STAT®
software (SAS Inst. Inc., 2011).
RESULTS AND DISCUSSION
Smaller birth weight resulted in smaller body weights at all ages (Figure 1). No compensatory
growth was observed. Initial differences in birth weight classes lead to different body weight
throughout the whole rearing period. Difference between group with low (below 50 g) and
high birth weight (above 81 g) increased from 66 g at 7 days of age to 271 g at 65 days of age.
In the experiment by SZENDRÕ et al. (2006), average weight difference between the group
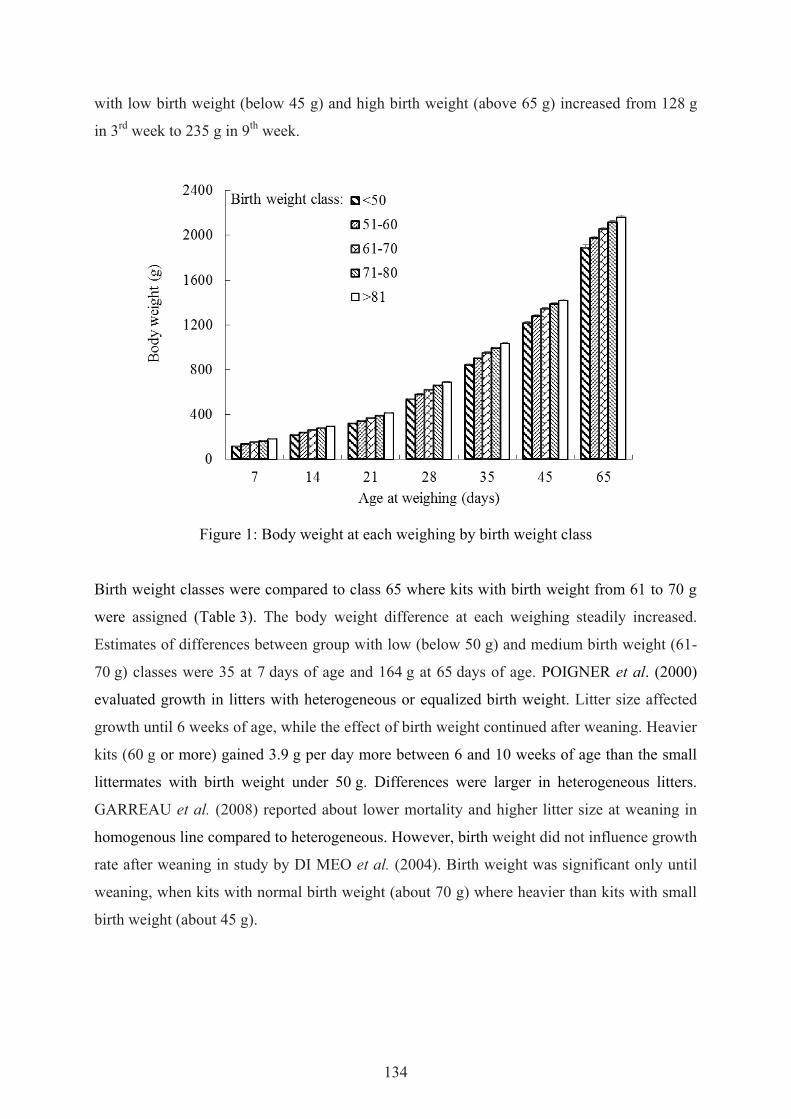
134
with low birth weight (below 45 g) and high birth weight (above 65 g) increased from 128 g
in 3rd week to 235 g in 9th week.
Figure 1: Body weight at each weighing by birth weight class
Birth weight classes were compared to class 65 where kits with birth weight from 61 to 70 g
were assigned (Table 3). The body weight difference at each weighing steadily increased.
Estimates of differences between group with low (below 50 g) and medium birth weight (61-
70 g) classes were 35 at 7 days of age and 164 g at 65 days of age. POIGNER et al. (2000)
evaluated growth in litters with heterogeneous or equalized birth weight. Litter size affected
growth until 6 weeks of age, while the effect of birth weight continued after weaning. Heavier
kits (60 g or more) gained 3.9 g per day more between 6 and 10 weeks of age than the small
littermates with birth weight under 50 g. Differences were larger in heterogeneous litters.
GARREAU et al. (2008) reported about lower mortality and higher litter size at weaning in
homogenous line compared to heterogeneous. However, birth weight did not influence growth
rate after weaning in study by DI MEO et al. (2004). Birth weight was significant only until
weaning, when kits with normal birth weight (about 70 g) where heavier than kits with small
birth weight (about 45 g).
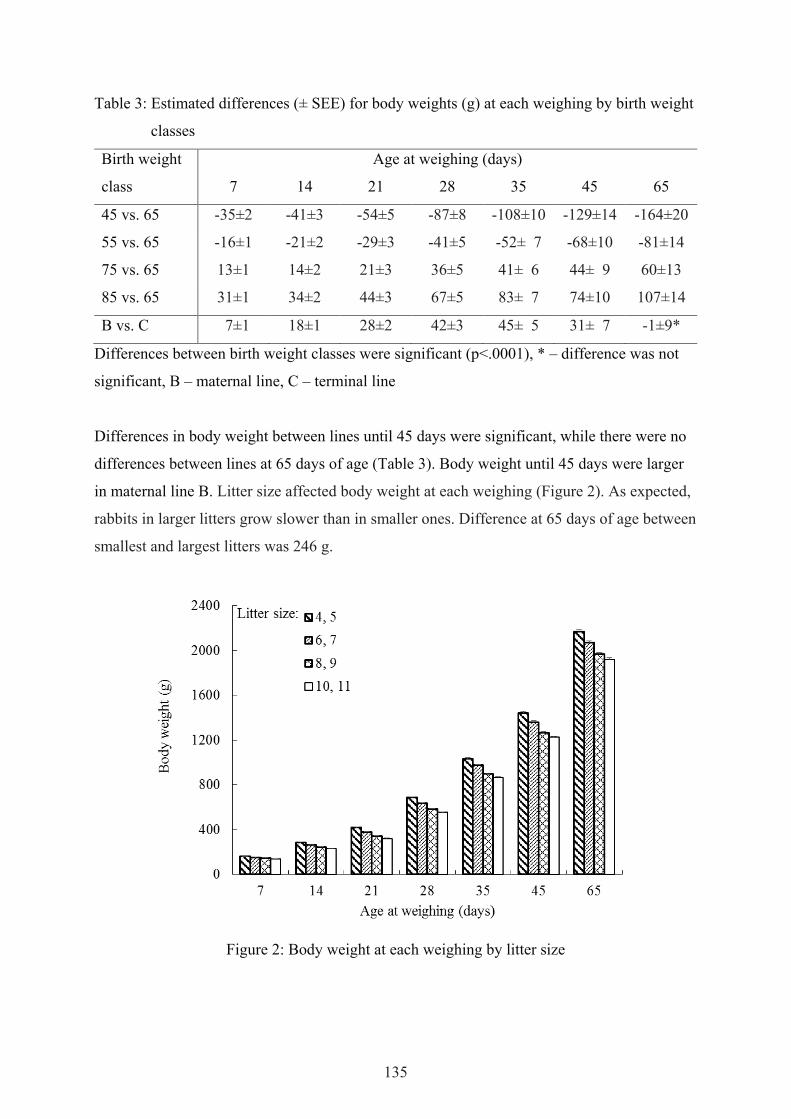
135
Table 3: Estimated differences (± SEE) for body weights (g) at each weighing by birth weight
classes
Birth weight
class
Age at weighing (days)
7 14 21 28 35 45 65
45 vs. 65 -35±2 -41±3 -54±5 -87±8 -108±10 -129±14 -164±20
55 vs. 65 -16±1 -21±2 -29±3 -41±5 -52± 7 -68±10 -81±14
75 vs. 65 13±1 14±2 21±3 36±5 41± 6 44± 9 60±13
85 vs. 65 31±1 34±2 44±3 67±5 83± 7 74±10 107±14
B vs. C 7±1 18±1 28±2 42±3 45± 5 31± 7 -1±9*
Differences between birth weight classes were significant (p<.0001), * – difference was not
significant, B – maternal line, C – terminal line
Differences in body weight between lines until 45 days were significant, while there were no
differences between lines at 65 days of age (Table 3). Body weight until 45 days were larger
in maternal line B. Litter size affected body weight at each weighing (Figure 2). As expected,
rabbits in larger litters grow slower than in smaller ones. Difference at 65 days of age between
smallest and largest litters was 246 g.
Figure 2: Body weight at each weighing by litter size

136
Mortality was the highest in rabbits with birth weight below 50 g. The risk to die until
weaning was 7.03-times larger compared to rabbits with birth weight between 61 and 70 g
(Table 4). Odds ratio was larger (1.21, p-value=0.04) in line B than in line C.
Other authors also showed the effect of birth weight on mortality. SZENDRO and BARNA
(1984) reported mortality of around 50% in kits with birth weight between 35 and 45 g, while
all kits with birth weight bellow 35 g died during 1st week. Mortality in kits heavier than 45 g
was only 7%. PIOGNIER et al. (2000) obtained mortality in the first three weeks (20%)
higher in litters with lighter kits compared to litters with heavier kits (7.4%). Birth weight
affected mortality until 10 weeks of age. Mortality was lower in litters with intra-litter
homogenization of birth weights. GARREAU et al. (2008) selected rabbits in divergent
selection experiment based on the homogeneity of birth weight. Reported 17% mortality in
homogenous line was lower compared to 32% in heterogeneous line of rabbits.
Table 4: Odds ratios for survival until weaning and 65 days of age by birth weight classes
Birth
weight
class
Losses until Risk to die until 35 days Risk to die until 65 days
35 days (%) 65 days (%) OR 95 % Cl OR 95 % Cl
45 51.2 54.2 7.03 5.33 9.27 6.62 5.04 8.69
55 23.9 29.9 1.91 1.48 2.47 1.91 1.49 2.45
65* 14.6 20.3 1.00 1.00
75 11.1 15.6 0.64 0.48 0.84 0.61 0.47 0.80
85 10.1 14.4 0.50 0.37 0.69 0.50 0.37 0.68
OR – odds ratio; Cl – confidence limits; * compared to this class
CONCLUSIONS
Birth weight affected growth and mortality of rabbits. Lighter rabbit at birth grew slower than
heavier siblings and deteriorated more at each age up to the end of the experiment. Risk to die
was larger at smaller birth weight.

137
SUMMARY
Aim of the study was to evaluate the effect of birth weight on growth and survival in the
maternal B and terminal C line of SIKA rabbits for meat production. Both lines are reared
under the same housing, management, and breeding conditions since 1995. Weights of 3988
kits born between December 2010 and December 2012 were collected. All liveborn kits were
weighed within 24 hrs after birth. Later, kits were weighed weekly until weaning, and at 45
and 65 days of age. Losses were identified daily. The statistical models for body weight at
each weighing and survival included birth weight class, line, dam parity, litter size after cross-
fostering, season of birth, and age at weighing due to age difference. Survival data was
analysed by LOGISTIC procedure and body weights by GLM procedure in SAS/STAT®
software. Birth weight was categorized into five classes. First class combined kits under 50 g,
while in the last class kits heavier than 82 g were gathered. Birth weight class affected body
weights at all ages. Smaller birth weight resulted in smaller body weight at all ages. Rabbits
were not able to compensate growth lag until slaughter. Mortality rate during lactation
represented 19% and increased on 23% on the rearing period. Losses until weaning and 65
days of age were the highest in class with the smallest birth weight, where more than half kits
died. The risk to die until weaning was 7.03-times larger in smallest kits compared to rabbits
with birth weight between 61 and 70 g.
REFERENCES
1. DI MEO, C.; GAZANEO, M.P.; RACCA, C.; BOVERA, F.; PICCOLO, G.; NIZZA, A.
(2004): Effect of birth weight and litter size on productive performance of rabbits. Asian-
Aust. J. Anim. Sci. 17 (8), 1158-1161
2. GARREAU, H.; BOLET, G.; LARZUL, C.; ROBERT-GRANIÉ, C.; SALEIL, G.;
SANCRISTOBAL, M.; Bodin, L. (2008): Results of four generations of a canalising
selection for rabbit birth weight. Livest Sci. 119, 55-62
3. GONZALES-REDONDO, P.; NEGRETTI, P.; FINZI, A. (2008): Analysis of the
efficiency and the reproductive seasonality of an alternative rabbit keeping system. In:
Proceedings 9th World Rabbit Congress, Verona, Italy: 1545-1549. http://world-rabbit-
science.com/WRSA-Proceedings/Congress-2008-Verona/Papers/M-Gonzalez-
Redondo.pdf (15.3.2013)
138
4. POIGNIER, J.; SZENDRÖ, Z.S.; LEVAI, A.; RADNAI, I.; BIRO-NEMETH, E. (2000):
Effect of birth weight and litter size on growth and mortality in rabbit. World Rabbit
Science 8, 103-109
5. PLANINC, M.; KERMAUNER, A.; MALOVRH, Š.; KOVAČ, M. (2011): Growth and
mortality of SIKA suckling rabbits in Slovenia. Acta Agriculturae Slovenica 98 (2), 135-
141
6. RASHWAN, A.A.; MARAI, I.F.M. (2000): Mortality in young rabbits: a review. World
Rabbit Sci. 8 (3), 111-124
7. SAS Inst. Inc. (2011): The SAS System for Windows, Release 9.3. Cary, NC.
8. SZENDRÕ, ZS. (2000): The nutritional status of foetuses and suckling rabbits and its
effects on their subsequent productivity: a review. Proc. 7th World Rabbit Congress,
Valencia, Spain, Vol. B (2000), 375-393
9. SZENDRÕ, ZS.; BARNA, J. (1984): Some factors affecting mortality of suckling and
growing rabbit. In: Proceedings 3th World Rabbit Congress, Rome, Italy, 166-173
10. SZENDRÕ, ZS.; GYOVAI, M.; MAERTENS, L.; BIRO-NEMETH, E.; RADNAI, I.;
MATICS, Z.; PRINCZ, Z.; GERENCSER, Z.; HORN, P. (2006): Influence of birth weight
and nutrient supply before and after weaning on the performance of rabbit does to age of
the first mating. Livest Sci. 103, 54-64
Corresponding author:
Janja Urankar
Department of Animal Science
Biotechnical Faculty, University of Ljubljana
Groblje 3, SI-1230 Domžale, Slovenia
e-mail: [email protected]
139
University of Hohenheim, Stuttgart, Veterinary Practice
ENAMEL ALTERATIONS IN RABBITS
A. K. Korn
1. INTRODUCTION
Generally, discolorations of tooth enamel in rabbits occur due to contact with staining
feedstuffs and can either be visible as brown-yellowish discolorations of the enamel of the
whole tooth (KORN, 2016) or appear as a dark brown rim at the molars in wild rabbits
(BÖHMER, 2015). These discolorations are physiological and have to be distinguished from
alterations like milk-white spots on an opaque background (BÖHMER, 2011) or horizontal
ridges, visible and often palpable in the incisors of rabbits (HARCOURT-BROWN, 1996).
Molar teeth can also be affected by enamel alterations, even though less frequent than the
incisors (KORN, 2015). In the literature, hypocalcification and osteodystrophia are published
to cause this clinical manifestation (HARCOURT-BROWN, 1996; BÖHMER, 2011). A lack
of calcium and an unbalanced calcium-phosphorus-ratio in the daily feed ration
(HARCOURT-BROWN, 1996), trauma (SCHWEIGART,1998; JEKL and REDROBE, 2013)
as well as housing conditions without exposure to sunlight (MOSALLANEJAD et al., 2010)
are discussed to account for these enamel alterations. Still, some relations remain
inconclusive. Therefore, the context between possible aetiological factors and the appearance
of enamel alterations in rabbits was further investigated in the course of a larger study of tooth
and jaw pathologies in rabbits, approved by the regional council Giessen, Germany (Gi 17/11
Nr. 65/2011).
The first aim of the current study was the documentation of enamel alterations in the course of
regularly performed clinical examinations focusing on teeth and jaws of rabbits. Additionally,
the context between the blood content of selected minerals and the appearance of the
investigated traits were to be illuminated. Furthermore, bodyweights were determined to
140
study possible links to enamel alterations. Finally, an estimation of heritability was
performed.
2. MATERIAL AND METHODS
Animals
In this study, data of 247 rabbits from 42 litters were evaluated. The rabbits were pure- and
crossbred offspring of 19 does and 15 bucks of ten different breeds: Holland Dwarf Lop,
German Lop, Small Silver, Rhinelander, Thuringer, Black Otter, Blue Vienna, New Zealand
Red, fattening hybrids (ZIKA), Flemish Giant. All breed sizes according to the ZDRK
standard (JAKOBS et al., 2004) were included to represent the wide variety of rabbit breeds
kept as pets, for breeding and fattening.
Housing and Feeding
All rabbits were kept outdoor at the Teaching and Research Unit “Oberer Hardthof” of the
Justus-Liebig-University, Giessen, Germany, according to the EU directive 63/2010.
Available for housing were concrete hutches with a height, length and width of 50 x 64 x 80
cm. Shavings and straw were used as bedding. Additionally, compartments with slatted
plastic floor with a size of 125 x 70 x 115 cm and 145 x 145 x 110 cm were provided and the
animals had the possibility to withdraw in a wooden box filled with shavings and straw.
Depending on the location of the individual compartment and the time of year, all rabbits
were partially exposed to natural sunlight, but could always move into the shade. To avoid
seasonal effects, the study was carried out all year round. Until weaning at the 8th week of life,
all offspring stayed with the doe and were than separated by sex. Female offspring were kept
in pairs or groups. To avoid injuries, male rabbits were single housed as soon as agonistic
behaviour was observed. Visual contact to other rabbits was ensured. All rabbits received
water via nipple drinkers, hay in hay racks and pelleted feed ad libitum. According to the
recommendations of NORRIS et al. (2001) and SCHLOLAUT (2003), the pelleted feed
contained 0.55% phosphorus and 1.0% calcium (Has Fit Carat, Raiffeisen, Cologne,
Germany). A calcium-phosphorus-ration of 1:1-2:1 was proposed by LOWE (2010).

141
Clinical Examination
From the 3rd week of life until weaning at the 8th week of life, all rabbits were examined
weekly, followed by a bi-weekly interval from weaning until adult. Adulthood was
determined according to sexual maturity, depending on the size of breed (LÖHLE, 1995;
GRÜN, 1999; WARRLICH, 2011). Rabbits of dwarf and small breeds were considered adult
with 5 months, those of intermediate breeds with 6 months and large breeds with 7 months.
Enamel alterations were either defined as milk-white spots on opaque background
(BÖHMER, 2011) or as horizontal ridges, palpable and/or visible (HARCOURT-BROWN,
1996). All findings were obtained from the incisors because molar teeth in rabbits are not
accessible without special devices. The use of these is not recommended in conscious animals
due to a high risk of injuries (BÖHMER, 2011). The rabbits were categorized in two size
groups: Dwarf/small breeds and intermediate/large breeds.
Blood Sampling and Analysis
Blood serum samples were taken from the marginal ear vein at weaning and when adult. Total
calcium and phosphate were analysed using a Pentra 400 (ABX Horiba, Axonlab,
Montpellier, France), ionized calcium and magnesium with a NOVA CRT 8 analyzer (Nova
Biomedical GmbH, Rödermark, Germany). All analyses were performed at the Central
Laboratory at the Veterinary Faculty of the Justus-Liebig-University, Giessen, Germany.
Weighing
The rabbits were weighted (scales DE 60K20N, Kern+SohnGmbH, Balingen-Frommern,
Germany) at weaning and when 3 months old, because this age is typical for fattening rabbits
to be slaughtered.
Estimation of Heritability
The VCE 6.0.2. programme was used for the estimation of the heritability of enamel
alterations and two different data sets were examined: First, all clinical findings from all

142
examinations were comprised to the estimation. For the second data set, only the results from
the last clinical examination of each rabbit when reaching adulthood were included.
3. RESULTS AND DISCUSSION
Altogether, hypocalcified incisors in the upper jaw, visible as milk-white spots, were detected
with the highest frequency in 3182 examinations (Fig. 1). Despite a pelleted feed to avoid
selection against the calcium enriched components (HARCOURT-BROWN, 1996), a
balanced calcium-phosphorus-ratio (LOWE, 2010) and at least partial exposure to sunlight,
these signs of osteodystrophia /hypocalcification (HARCOURT-BROWN, 1996; BÖHMER,
2011) occurred with an unexpectedly high frequency. However, the intestinal calcium uptake
in rabbits is, apart from very low calcium concentrations, independent from vitamin D
(BROMMAGE et al., 1988). An explanation for the findings would have been that rabbits,
low in rank had not enough time to take up feed but this was met with a sufficient animal
feeding place ratio and controlled with weighing. All other explanations as trauma and
infection would account for an event on an individual animal basis and not explain the
number of animals affected. So, further research is needed in terms of surveying the
calcification processes in rabbit teeth, as a varying mineral content in different teeth (incisors,
molars) and local cell activity as influencing factors were already described in 1936 by
MURRAY.
The highest overall incidence of enamel alterations was observed in the first examination in
the 3rd week of life. A possible reason for this might be the milk yield and especially the
calcium concentration in the milk of the doe (MAERTENS et al., 2006). This could be an
explanation, why the frequency in both size groups is decreasing rapidly with age when the
young rabbits start to take up hay and pelleted feed. As there were no blood samples taken at
this age, the assumption remains unproven so far. The level of enamel alterations differed
considerably between the two size groups. Whereas 70% of dwarf/small breed rabbits were
affected, only 49% of intermediate to large sized rabbits showed the examined traits (Fig. 2).
First of all, different group size numbers have to be taken into account when evaluating these
results. Also, the different growth and development rate between small and large rabbits
should be considered and might bias this result. Unfortunately, growth charts are currently
only available for experimentally used breeds (CHARLES RIVER LABORATORIES, 2014).
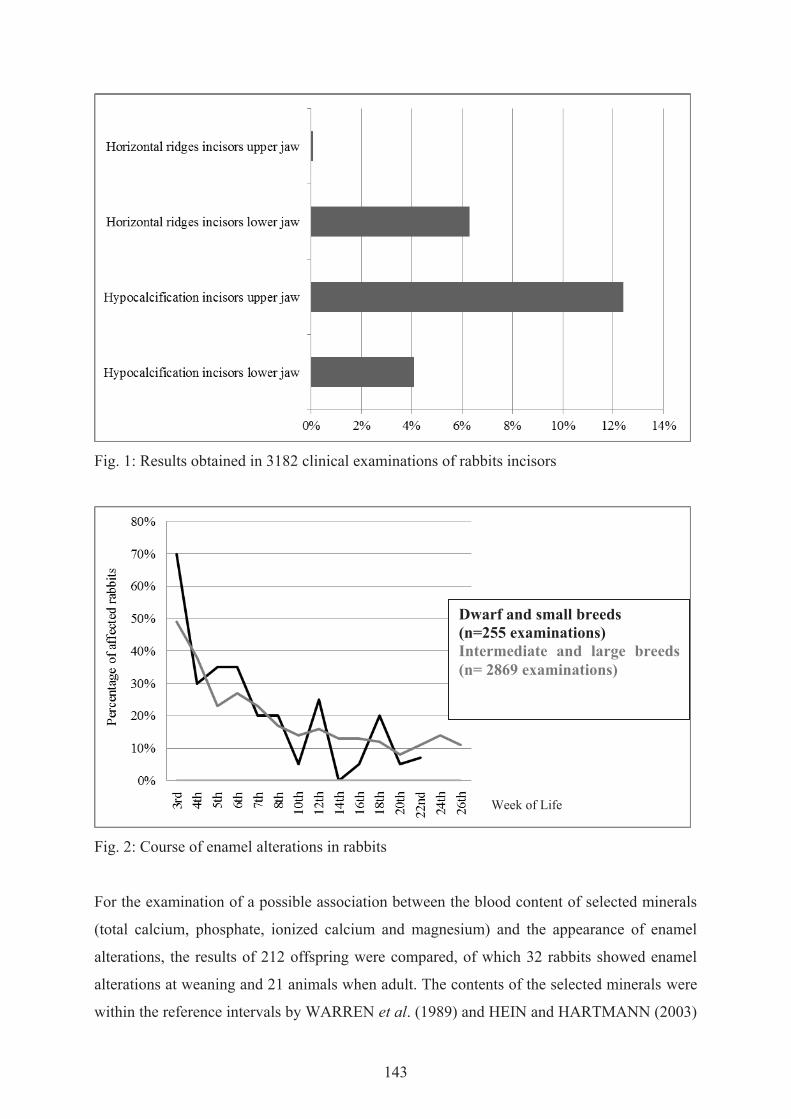
143
Fig. 1: Results obtained in 3182 clinical examinations of rabbits incisors
Fig. 2: Course of enamel alterations in rabbits
For the examination of a possible association between the blood content of selected minerals
(total calcium, phosphate, ionized calcium and magnesium) and the appearance of enamel
alterations, the results of 212 offspring were compared, of which 32 rabbits showed enamel
alterations at weaning and 21 animals when adult. The contents of the selected minerals were
within the reference intervals by WARREN et al. (1989) and HEIN and HARTMANN (2003)
Dwarf and small breeds (n=255 examinations) Intermediate and large breeds (n= 2869 examinations)
Week of Life

144
in all analysed blood samples, taking into account that these reference intervals were obtained
in different rabbit populations with varying housing and feeding regimes. However, rabbits
without enamel alterations at the time of blood sampling had a significantly higher
concentration of total calcium (p≤0.05) and at least a trend to a higher concentration of
ionized calcium. So, the ability for a high resorption of calcium seems to be advantageous.
Still, the time span between a lower uptake of calcium and the visible clinical onset of signs
of hypocalcification is unknown. While MULLAN and MAIN (2006) reported of a deficient
calcium supply lasting for years until clinical signs on teeth were visible, MEHROTRA et al.
(2006) showed effects on bone density already after a few weeks. Furthermore, the supply and
impact of other important components, as vitamin A (SCHOUR et al., 1941) and C
(BOYERA et al., 1988) on the tooth matrix, were not examined.
In the present study, rabbits with enamel alterations had lower bodyweights compared to
unaffected animals at weaning as well as at the age of 3 months. This applied to both size
groups but is depicted as average value in Table 1. The dependence of enamel alterations and
bodyweight could indicate an underlying disease, in the context or independent of the tooth
alterations. A possible disease impacting the rabbits was the infection with Pasteurella
multocida, which was detected in the stock as responsible agent for respiratory symptoms. All
rabbits were healthy at the time of sampling but subclinical infections can occur (DEEB et al.,
1989). Therefore, clinically apparent enamel alterations are important in the context of the
detection of latent diseases as well as an economic factor. A lower bodyweight, especially at
the age of 3 months, which is about the usual slaughtering age of commercially fattened
rabbits (GOLZE et al., 2008), could lead to financial losses.
No heritability could be estimated for both data sets. This might have been due to the low
number of animals; even though animal numbers were calculated at the start of the
experiment. In contrast, the litter effects in this study were high: 0.400 ± 0.0808 for all
examinations and 0.400 ± 0.0864 for the last examination of each rabbit, respectively. A
possible factor influencing these results could have been the milk yield of the doe as a main
factor for the supply with calcium especially in the first weeks of life. In this context, the
number of siblings might also have had an additional impact on this outcome. So, these
criteria should be considered for analyzing in further studies.

145
Table 1: Enamel alterations and bodyweight of rabbits
Enamel alterations Bodyweight (g)
(mean ± standard error)1
Weaning (8th Week of Life) Aged 3-months
2
negative 1561.8 ± 44.4 2549.9 ± 54.4
positive 1401.5 ± 89.8 2359.6 ± 233.1
1average of both size groups (applies to each group as well); 2p ≤ 0.05
4. CONCLUSION
Enamel alterations occurred in this study despite blood mineral levels within the reference
intervals published for rabbits. A lack of calcium, magnesium and phosphorus in the feed
could be excluded, as rabbits, in contrast to other animals, reflect the mineral content of the
feed directly in the blood. And furthermore, despite a sufficient supply with these minerals,
the examined traits were detectable. The assumption, a deficient feeding regime leading to
enamel alterations accordingly seems wrong. A possible reason for the findings might be an
altered calcification processes in the tooth substance in affected animals and requires
continuing research in this field. Enamel alterations can be a sign of underlying diseases,
which influence the wellbeing of the rabbit and have an economic relevance for fattening
rabbits as shown in the lower bodyweights at the age of 3 months. With the animal model, an
estimation of heritability for enamel alterations could not be achieved. Because of this,
experiments on molecular basis are currently performed to illuminate this fact further.
5. SUMMARY
In this study, enamel alterations of 247 rabbits of ten different breeds, bred and kept under
standardized conditions were documented in regularly performed clinical examinations,
beginning at the 3rd week of life. The last examination was performed, when the rabbits were
adult, varying between 5 and 7 months for breeds of different sizes depending on sexual
maturity. Enamel alterations occurred quite frequently despite optimal housing and feeding
conditions in accordance with the recommendations from literature. Signs of
hypocalcification affecting the incisors of the upper jaw were the most frequent recorded

146
findings. Blood samples, taken at weaning at the 8th week of life and when adult, analysed for
total and ionised calcium, magnesium and phosphate were within given reference intervals
and revealed no deficit of those minerals in the daily feed ration. These findings demonstrate
the need of further research i.e. in the field of calcification processes in the rabbit tooth.
However, rabbits without enamel alterations at the time of sampling had altogether higher
levels of total calcium and slightly higher levels of ionized calcium compared to affected
animals. The bodyweight, obtained at weaning and the 3rd month of life, was higher in
unaffected rabbits. No heritability could be estimated; only high litter effects were shown,
suggesting other factors like the milk yield of the doe and the calcium concentration of the
milk or the number of siblings influencing the appearance of enamel alterations.
6. ACKNOWLEDGEMENTS
I’d like to thank the team of the central laboratory at the JLU Giessen for the analysis of the
blood samples, Prof. Dr. G. Erhardt for the opportunity to achieve my doctoral thesis in his
working group and Prof. Dr. H. Brandt for the statistical evaluations.
7. REFERENCES
KORN, A.K. (2016): Veränderungen am Zahnschmelz – liegt ein Mineralstoffmangel
zugrunde? Kaninchenzeitung 6, 46-47
BÖHMER, E. (2015): Dentistry in rabbits and rodents. Wiley Blackwell, Chichester
BÖHMER, E. (2011): Zahnheilkunde bei Kaninchen und Nagern. Schattauer, Stuttgart
HARCOURT-BROWN, F.M. (1996): Calcium deficiency, diet and dental disease in pet
rabbits. Vet Rec 139, 567-571
KORN, A.K. (2015): Zahn- und Kieferveränderungen beim Kaninchen: Diagnostik, Auftreten
und Heritabilitäten. Diss. Vet. Med., JLU Giessen
SCHWEIGART, G. (1998): Zahnfehlstellungen bei Nagetieren und Kaninchen. In:
ALBRECHT, A. (Ed.): Fachpraxis 34, 11 Aulendorf
JEKL, V.; REDROBE, S. (2013): Rabbit dental disease and calcium metabolism – the science
behind divided opinions. JSAP 54: 481-490
MOSALLANEJAD, B.; MOARRABI, A.; AVIZEH, R.; GHADIRI, A. (2010): Prevalence of
dental malocclusion and root elongation in pet-rabbits of Ahvaz, Iran. IJVST 2, 109-116
147
JAKOBS, F.; DIETRICH, A.; HORNUNG, W.; MEISTER, D.; MICKMANN, P.;
FÖDISCH, A. (2004): Standard für die Beurteilung der Rassekaninchen und Erzeugnisse.
Wilh. von Lohr GmbH, Neuss
NORRIS, S.A.; PETTIFOR, J.M.; GRAY, D.A.; BUFFENSTEIN, R. (2001): Calcium
metabolism and bone mass in female rabbits during skeletal maturation: Effects of dietary
calcium intake. Bone 29, 62-69
SCHLOLAUT, W. (2003): Das große Buch vom Kaninchen, 3. Aufl., DLG-Verlag, Frankfurt
a.M.
LOWE, J.A. (2010): Pet rabbit feeding and nutrition. In: DE BLAS, C.; WISEMAN, J. (Eds.)
The nutrition of the rabbit, 2nd ed. Cab International Publishing, University Press,
Cambridge
LÖHLE, K. (1995): Fortpflanzung. In: SCHLOLAUT, W. (Hrsg.) Das große Buch vom
Kaninchen. DLG-Verlag, Frankfurt a.M.
GRÜN, P. (1999): Kaninchen halten, 3. Aufl. Eugen-Ulmer-Verlag, Stuttgart
WARRLICH, A. (2011): Das Kosmos Handbuch Kaninchen. Franckh-Kosmos-Verlags-
GmbH & Co.KG, Stuttgart
BROMMAGE, R.; MILLER, S.C.; LANGMAN, C.B.; BOUILLON, R.; SMITH, R.;
BOURDEAU, J.E. (1988): The effects of chronic vitamin D deficiency on the skeleton in
the adult rabbit. Bone 9, 131-139
MURRAY, M.M. (1936): The chemical composition of teeth. IV. The calcium, magnesium
and phosphorus contents of the teeth of different animals. A brief consideration of the
mechanism of calcification. Biochem J 30, 1567-1571
MAERTENS, L.; LEBAS, F.; SZENDRÖ, Z. (2006): Rabbit milk: A review of quantity,
quality and non-dietary affecting factors. World Rabbit Sci 14, 205-230
CHARLES RIVER LABORATORIES (2014): New Zealand White Rabbits.
http://www.criver.com/files/pdfs/rms/us-model-
pricing/rm_rm_c_new_zealand_white_rabbits.aspx. Accessed December 20, 2016.
WARREN, H.B.; LAUSEN, N.C.C.; SEGRE, G.V.; EL HAJJ, G.; BROWN, E.M. (1989):
Regulation of calciotrop hormones in vivo in the New Zealand white rabbit. Endocrinology
125, 2683-2690
HEIN, J.; HARTMANN, K. (2003): Labordiagnostische Referenzbereiche bei Kaninchen.
Tierärztl Prax 31, 321-328
MULLAN, S.M.; MAIN, D.C.J. (2006): Survey of the husbandry, health and welfare of 102
pet rabbits. Vet Rec 159, 103-109

148
MEHROTRA, M.; GUPTA, S.K.; KUMAR, K.; AWASTHI, P.K.; DUBEY, M.; PANDEY,
C.M.; GODBOLE, M.M. (2006): Calcium deficiency-induced secondary
hyperparathyroidism and osteopenia are rapidly reversible with calcium supplementation
in growing rabbit pups. Br J Nutr 95, 582-590
SCHOUR, I.; HOFFMAN, M.M.; SMITH, M.C. (1941): Changes in the incisor teeth of
albino rats with vitamin A deficiency and the effects of replacement therapy. Am J Pathol
17, 529-562
BOYERA, N.; GALEY, I.; BERNARD, B.A. (1998): Effect of vitamin C and its derivates on
collagen synthesis and cross-linking by normal human fibroblasts. Int J Cosmet Sci 20,
151-158
DEEB, B.J.; DI GIACOMO, R.F.; BERNARD, B.L.; SILBERNAGEL, S.M. (1990):
Pasteurella multocida and Bordatella bronchiseptica infections in rabbits. J Clin Microbiol
28, 70-75
GOLZE, M.; WEHLITZ, R.; WESTPHAL, K. (2008): Schlachtkörperwert und
Fleischqualität von verschiedenen Kaninchenrassen und Herkünfte.
http://www.landwirtschaft.sachsen.de/landwirtschaft/download/3399_1.pdf
Accessed: 23.01.2017
CORRESPONDENCE
Dr. med. vet Anne K. Korn
Tierärztliche Praxis
Schwerzstr. 15/4
70599 Stuttgart

149
University of Ljubljana, Faculty of Health Sciences1, Veterinary Faculty2 and Biotechnical
Faculty3
OCCURRENCE OF TRICHOPHYTON MENTAGROPHYTES IN RABBIT FARM AIR
SAMPLES
G. Jereb1, I. Zdovc2, A. Kermauner3, K. Zdovc2 and A. Dovč2
KEYWORDS
Rabbits, Trichophyton mentagrophytes, Noninvasive diagnostic method – Air Samples
1. INTRODUCTION
Dermatophytosis are skin infections caused by fungi from dermatophytes group. Infection is
rather common among rabbits. It is usually caused by Trichophyton mentagrophytes, rarely
with Mycrosporum canis. Circular, scaly, erythematous injuries are common, and in serious
cases extended to several body parts. Disease can be also asymptomatic. Dermatophytosis
threatens animal welfare and consequently affects the growth and survival of rabbits in
breeding. The disease also presents a great public health risk as zoonosis (LEBAS et al.,
1997; VAN ROOIJ et al., 2006; MOREIRA et al., 2012; MATTEI et al., 2014).
The aim of the study was to assess the concentration of Trichophyton mentagrophytes spores
in bioaerosol. Air samples from different critical points of infected rabbit farm were taken and
analysed. A total number of microorganisms was counted.
2. MATERIAL AND METHODS
About 60 does, 10 bucks and 180 youngs are constantly present on the rabbit farm infected
with Trychophyton mentagrophytes. Twenty-eight samples of air were taken in various places
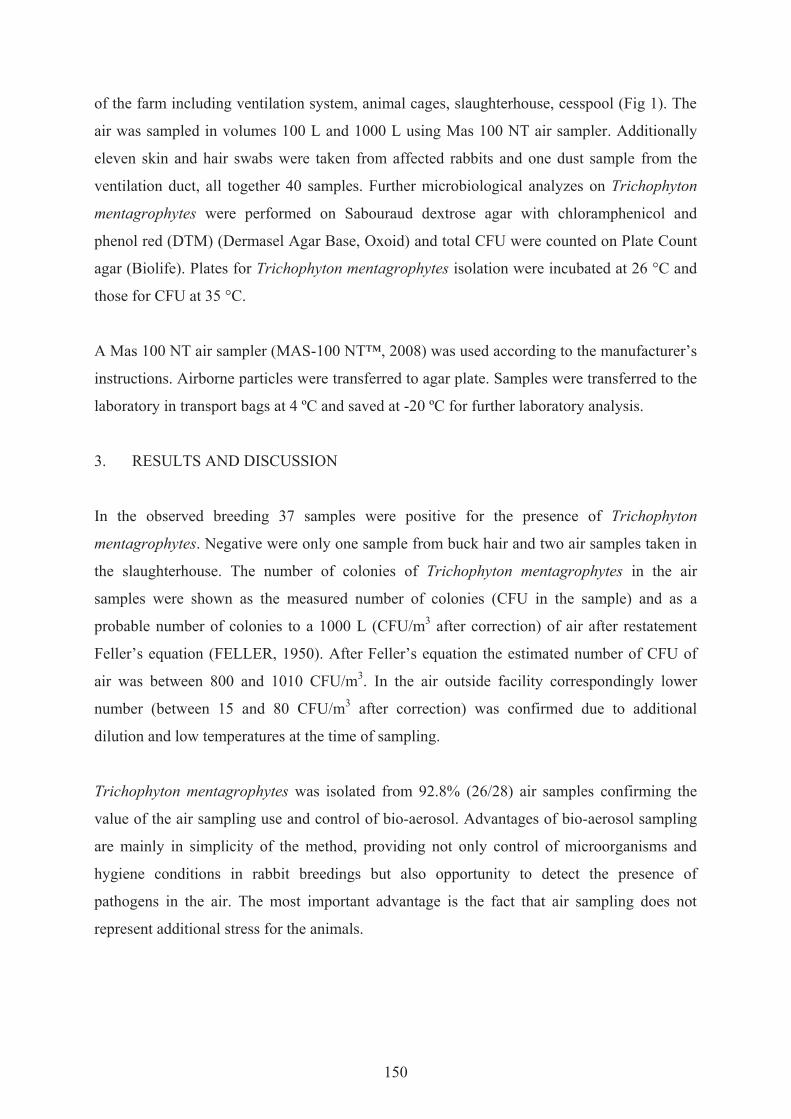
150
of the farm including ventilation system, animal cages, slaughterhouse, cesspool (Fig 1). The
air was sampled in volumes 100 L and 1000 L using Mas 100 NT air sampler. Additionally
eleven skin and hair swabs were taken from affected rabbits and one dust sample from the
ventilation duct, all together 40 samples. Further microbiological analyzes on Trichophyton
mentagrophytes were performed on Sabouraud dextrose agar with chloramphenicol and
phenol red (DTM) (Dermasel Agar Base, Oxoid) and total CFU were counted on Plate Count
agar (Biolife). Plates for Trichophyton mentagrophytes isolation were incubated at 26 °C and
those for CFU at 35 °C.
A Mas 100 NT air sampler (MAS-100 NT™, 2008) was used according to the manufacturer’s
instructions. Airborne particles were transferred to agar plate. Samples were transferred to the
laboratory in transport bags at 4 ºC and saved at -20 ºC for further laboratory analysis.
3. RESULTS AND DISCUSSION
In the observed breeding 37 samples were positive for the presence of Trichophyton
mentagrophytes. Negative were only one sample from buck hair and two air samples taken in
the slaughterhouse. The number of colonies of Trichophyton mentagrophytes in the air
samples were shown as the measured number of colonies (CFU in the sample) and as a
probable number of colonies to a 1000 L (CFU/m3 after correction) of air after restatement
Feller’s equation (FELLER, 1950). After Feller’s equation the estimated number of CFU of
air was between 800 and 1010 CFU/m3. In the air outside facility correspondingly lower
number (between 15 and 80 CFU/m3 after correction) was confirmed due to additional
dilution and low temperatures at the time of sampling.
Trichophyton mentagrophytes was isolated from 92.8% (26/28) air samples confirming the
value of the air sampling use and control of bio-aerosol. Advantages of bio-aerosol sampling
are mainly in simplicity of the method, providing not only control of microorganisms and
hygiene conditions in rabbit breedings but also opportunity to detect the presence of
pathogens in the air. The most important advantage is the fact that air sampling does not
represent additional stress for the animals.
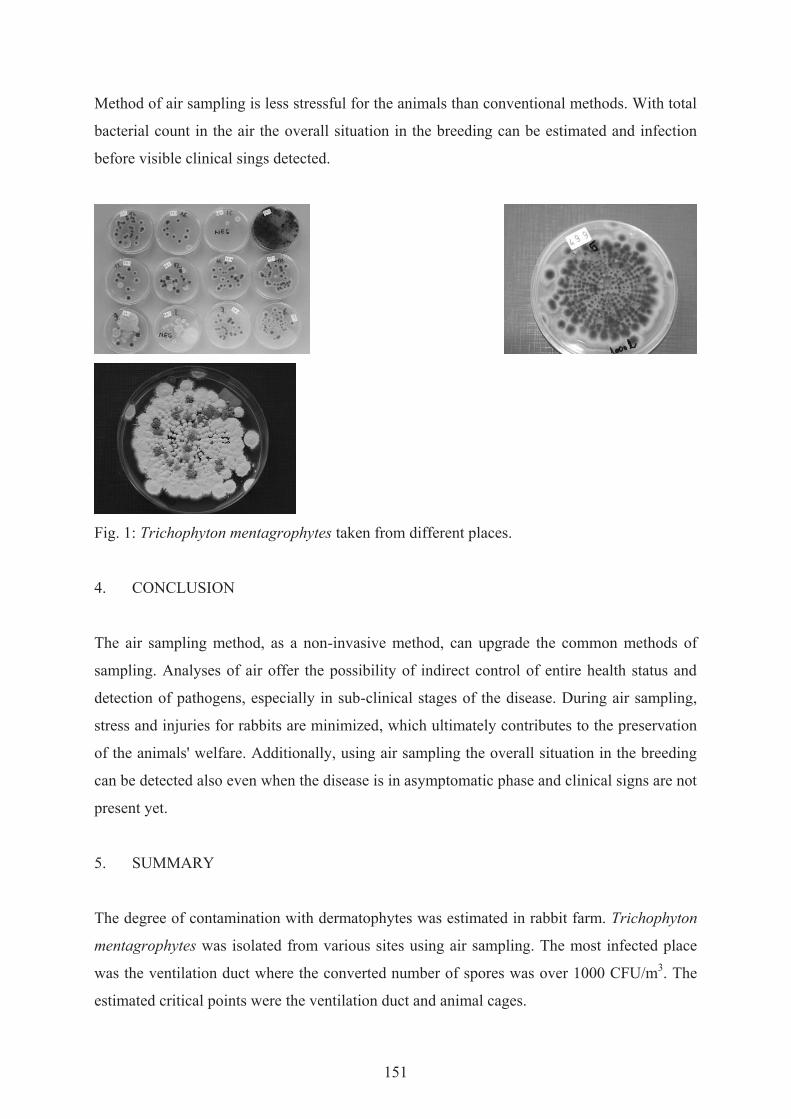
151
Method of air sampling is less stressful for the animals than conventional methods. With total
bacterial count in the air the overall situation in the breeding can be estimated and infection
before visible clinical sings detected.
Fig. 1: Trichophyton mentagrophytes taken from different places.
4. CONCLUSION
The air sampling method, as a non-invasive method, can upgrade the common methods of
sampling. Analyses of air offer the possibility of indirect control of entire health status and
detection of pathogens, especially in sub-clinical stages of the disease. During air sampling,
stress and injuries for rabbits are minimized, which ultimately contributes to the preservation
of the animals' welfare. Additionally, using air sampling the overall situation in the breeding
can be detected also even when the disease is in asymptomatic phase and clinical signs are not
present yet.
5. SUMMARY
The degree of contamination with dermatophytes was estimated in rabbit farm. Trichophyton
mentagrophytes was isolated from various sites using air sampling. The most infected place
was the ventilation duct where the converted number of spores was over 1000 CFU/m3. The
estimated critical points were the ventilation duct and animal cages.
152
6. REFERENCES
1. LEBAS, F.; COUDERT, P.; DE ROCHAMBEAU, H.; THÉBAULT, R.G. (1997): The
rabbit – husbandry, health and production. Rome, FAO, 205
2. VAN ROOIJ, P.; DETANDT, M.; NOLARD, N. (2006): Trichophyton mentagrophytes of
rabbit origin causing family incidence of kerion: an environmental study. Mycoses 49,
426-430
3. MOREIRA, F.; MIRANDA, A.; COELHO, A.M.; MONTEIRO, J.; COELHO A.C.
(2012): Epidemiological survey of dermatophytosis in meat rabbits with alopecia in
Portugal. World Rabbit Sci. 20, 43-48
4. MATTEI, A.S.; BEBER, M.A.; MADRID, I.M. (2014): Dermatophytosis in Small
Animals. SOJ Microbiol. Infect. Dis. 2, 1-6
5. MAS-100 NT™ (2008): Microbiological Air Sampler. User manual. MBVAG
Microbiology and Bioanalytic, version 5
6. FELLER, W. (1950): A sampling problem. An introduction to probability theory and its
applications. Volume 1, 174-175
Gregor Jereb, University of Ljubljana, Faculty of Health Sciences, Zdravstvena pot 5,
Ljubljana, Slovenia
Irena Zdovc, University of Ljubljana, Veterinary Faculty, Gerbičeva 60, Ljubljana, Slovenia
Ajda Kermauner, University of Ljubljana, Biotechnical Faculty, Jamnikarjeva 101, Ljubljana,
Slovenia
Katja Zdovc, University of Ljubljana, Veterinary Faculty, Gerbičeva 60, Ljubljana, Slovenia
Alenka Dovč, University of Ljubljana, Veterinary Faculty, Gerbičeva 60, Ljubljana, Slovenia
Corresponding author: Alenka Dovč
University of Ljubljana
Veterinary Faculty
PhD Professor Alenka Dovč, DVM, Dip ECAWBM (AWSEL)
Institute for Poultry, Birds, Small Mammals and Reptiles
1000 Ljubljana, Slovenia
E-mail address [email protected]
Telephone number 00386 (1) 477-92-50
Fax number 00386 (1) 477-93-39
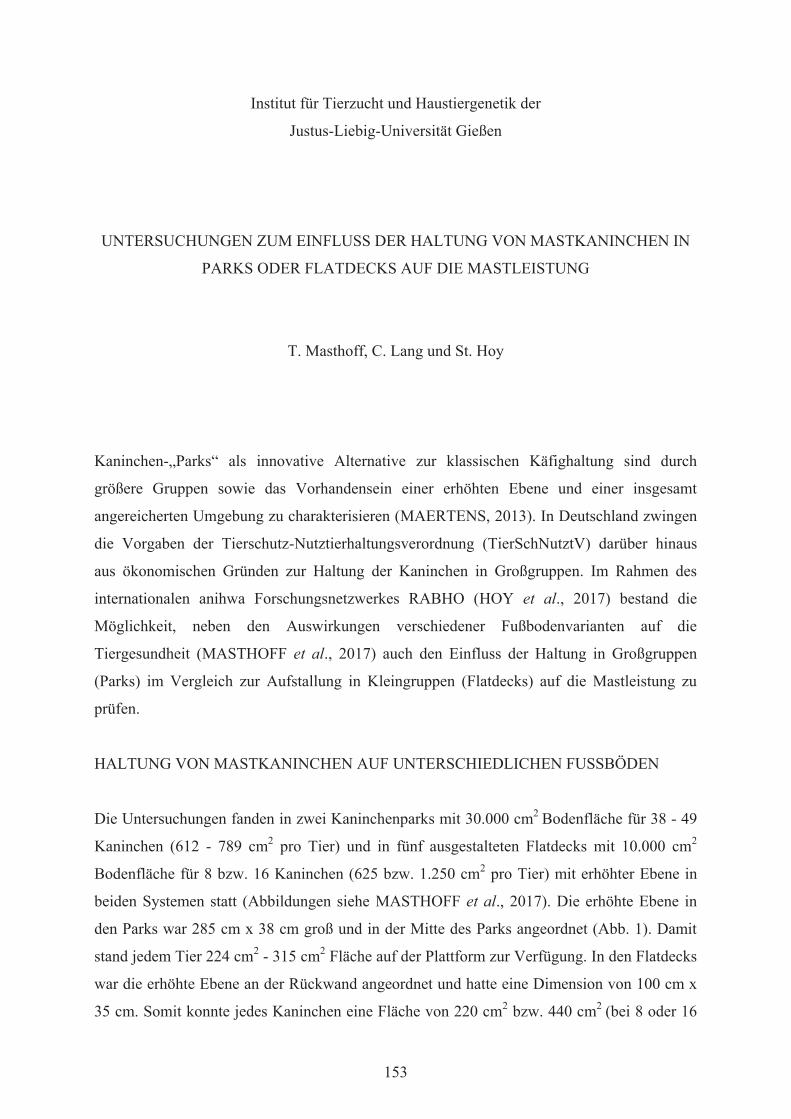
153
Institut für Tierzucht und Haustiergenetik der
Justus-Liebig-Universität Gießen
UNTERSUCHUNGEN ZUM EINFLUSS DER HALTUNG VON MASTKANINCHEN IN
PARKS ODER FLATDECKS AUF DIE MASTLEISTUNG
T. Masthoff, C. Lang und St. Hoy
Kaninchen-„Parks“ als innovative Alternative zur klassischen Käfighaltung sind durch
größere Gruppen sowie das Vorhandensein einer erhöhten Ebene und einer insgesamt
angereicherten Umgebung zu charakterisieren (MAERTENS, 2013). In Deutschland zwingen
die Vorgaben der Tierschutz-Nutztierhaltungsverordnung (TierSchNutztV) darüber hinaus
aus ökonomischen Gründen zur Haltung der Kaninchen in Großgruppen. Im Rahmen des
internationalen anihwa Forschungsnetzwerkes RABHO (HOY et al., 2017) bestand die
Möglichkeit, neben den Auswirkungen verschiedener Fußbodenvarianten auf die
Tiergesundheit (MASTHOFF et al., 2017) auch den Einfluss der Haltung in Großgruppen
(Parks) im Vergleich zur Aufstallung in Kleingruppen (Flatdecks) auf die Mastleistung zu
prüfen.
HALTUNG VON MASTKANINCHEN AUF UNTERSCHIEDLICHEN FUSSBÖDEN
Die Untersuchungen fanden in zwei Kaninchenparks mit 30.000 cm2 Bodenfläche für 38 - 49
Kaninchen (612 - 789 cm2 pro Tier) und in fünf ausgestalteten Flatdecks mit 10.000 cm2
Bodenfläche für 8 bzw. 16 Kaninchen (625 bzw. 1.250 cm2 pro Tier) mit erhöhter Ebene in
beiden Systemen statt (Abbildungen siehe MASTHOFF et al., 2017). Die erhöhte Ebene in
den Parks war 285 cm x 38 cm groß und in der Mitte des Parks angeordnet (Abb. 1). Damit
stand jedem Tier 224 cm2 - 315 cm2 Fläche auf der Plattform zur Verfügung. In den Flatdecks
war die erhöhte Ebene an der Rückwand angeordnet und hatte eine Dimension von 100 cm x
35 cm. Somit konnte jedes Kaninchen eine Fläche von 220 cm2 bzw. 440 cm2 (bei 8 oder 16
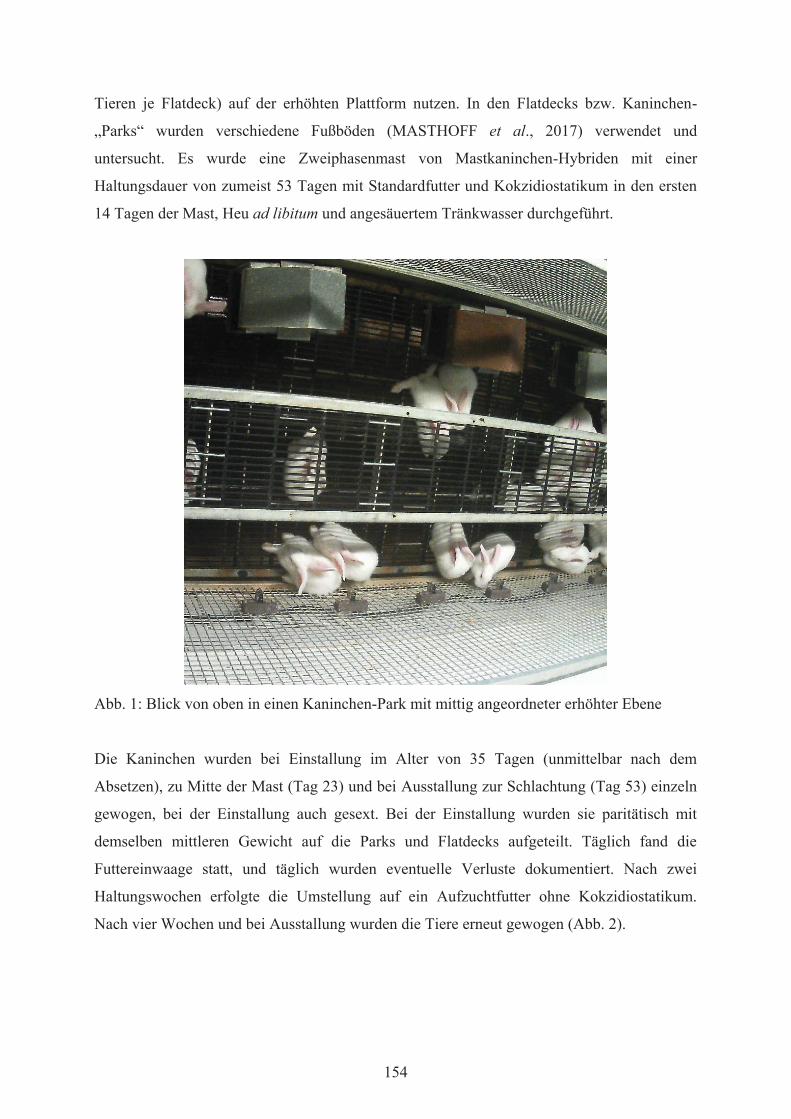
154
Tieren je Flatdeck) auf der erhöhten Plattform nutzen. In den Flatdecks bzw. Kaninchen-
„Parks“ wurden verschiedene Fußböden (MASTHOFF et al., 2017) verwendet und
untersucht. Es wurde eine Zweiphasenmast von Mastkaninchen-Hybriden mit einer
Haltungsdauer von zumeist 53 Tagen mit Standardfutter und Kokzidiostatikum in den ersten
14 Tagen der Mast, Heu ad libitum und angesäuertem Tränkwasser durchgeführt.
Abb. 1: Blick von oben in einen Kaninchen-Park mit mittig angeordneter erhöhter Ebene
Die Kaninchen wurden bei Einstallung im Alter von 35 Tagen (unmittelbar nach dem
Absetzen), zu Mitte der Mast (Tag 23) und bei Ausstallung zur Schlachtung (Tag 53) einzeln
gewogen, bei der Einstallung auch gesext. Bei der Einstallung wurden sie paritätisch mit
demselben mittleren Gewicht auf die Parks und Flatdecks aufgeteilt. Täglich fand die
Futtereinwaage statt, und täglich wurden eventuelle Verluste dokumentiert. Nach zwei
Haltungswochen erfolgte die Umstellung auf ein Aufzuchtfutter ohne Kokzidiostatikum.
Nach vier Wochen und bei Ausstallung wurden die Tiere erneut gewogen (Abb. 2).
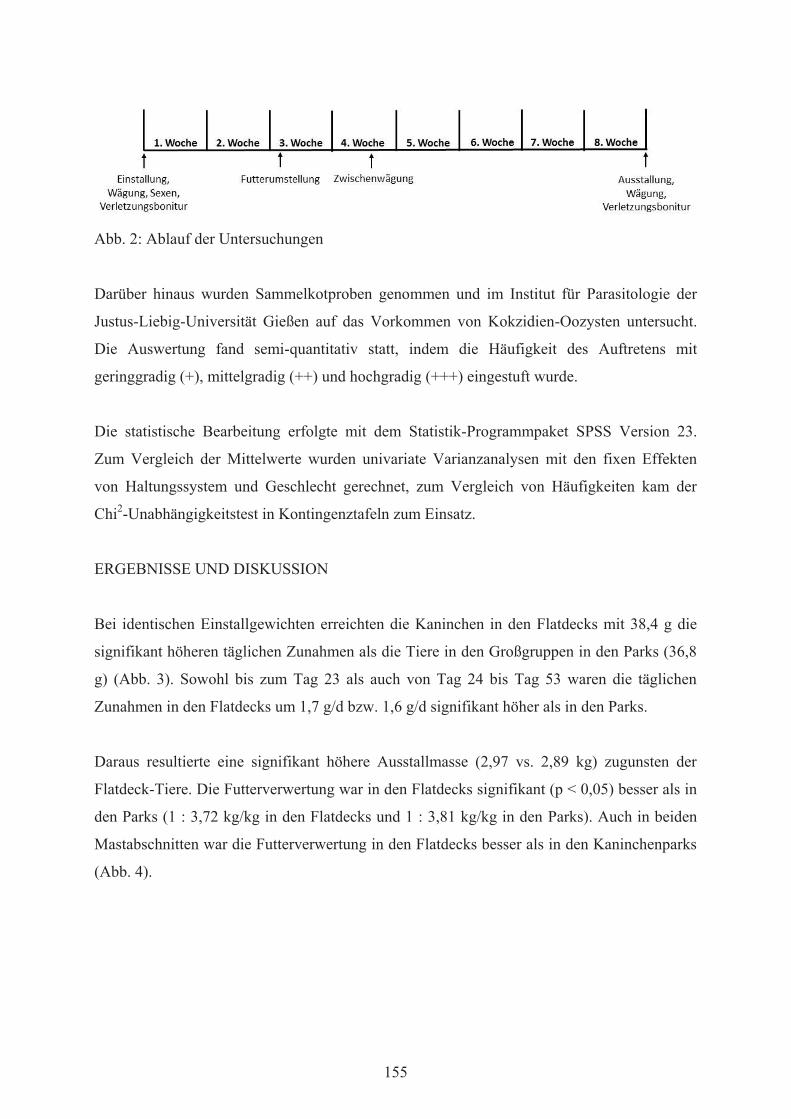
155
Abb. 2: Ablauf der Untersuchungen
Darüber hinaus wurden Sammelkotproben genommen und im Institut für Parasitologie der
Justus-Liebig-Universität Gießen auf das Vorkommen von Kokzidien-Oozysten untersucht.
Die Auswertung fand semi-quantitativ statt, indem die Häufigkeit des Auftretens mit
geringgradig (+), mittelgradig (++) und hochgradig (+++) eingestuft wurde.
Die statistische Bearbeitung erfolgte mit dem Statistik-Programmpaket SPSS Version 23.
Zum Vergleich der Mittelwerte wurden univariate Varianzanalysen mit den fixen Effekten
von Haltungssystem und Geschlecht gerechnet, zum Vergleich von Häufigkeiten kam der
Chi2-Unabhängigkeitstest in Kontingenztafeln zum Einsatz.
ERGEBNISSE UND DISKUSSION
Bei identischen Einstallgewichten erreichten die Kaninchen in den Flatdecks mit 38,4 g die
signifikant höheren täglichen Zunahmen als die Tiere in den Großgruppen in den Parks (36,8
g) (Abb. 3). Sowohl bis zum Tag 23 als auch von Tag 24 bis Tag 53 waren die täglichen
Zunahmen in den Flatdecks um 1,7 g/d bzw. 1,6 g/d signifikant höher als in den Parks.
Daraus resultierte eine signifikant höhere Ausstallmasse (2,97 vs. 2,89 kg) zugunsten der
Flatdeck-Tiere. Die Futterverwertung war in den Flatdecks signifikant (p < 0,05) besser als in
den Parks (1 : 3,72 kg/kg in den Flatdecks und 1 : 3,81 kg/kg in den Parks). Auch in beiden
Mastabschnitten war die Futterverwertung in den Flatdecks besser als in den Kaninchenparks
(Abb. 4).
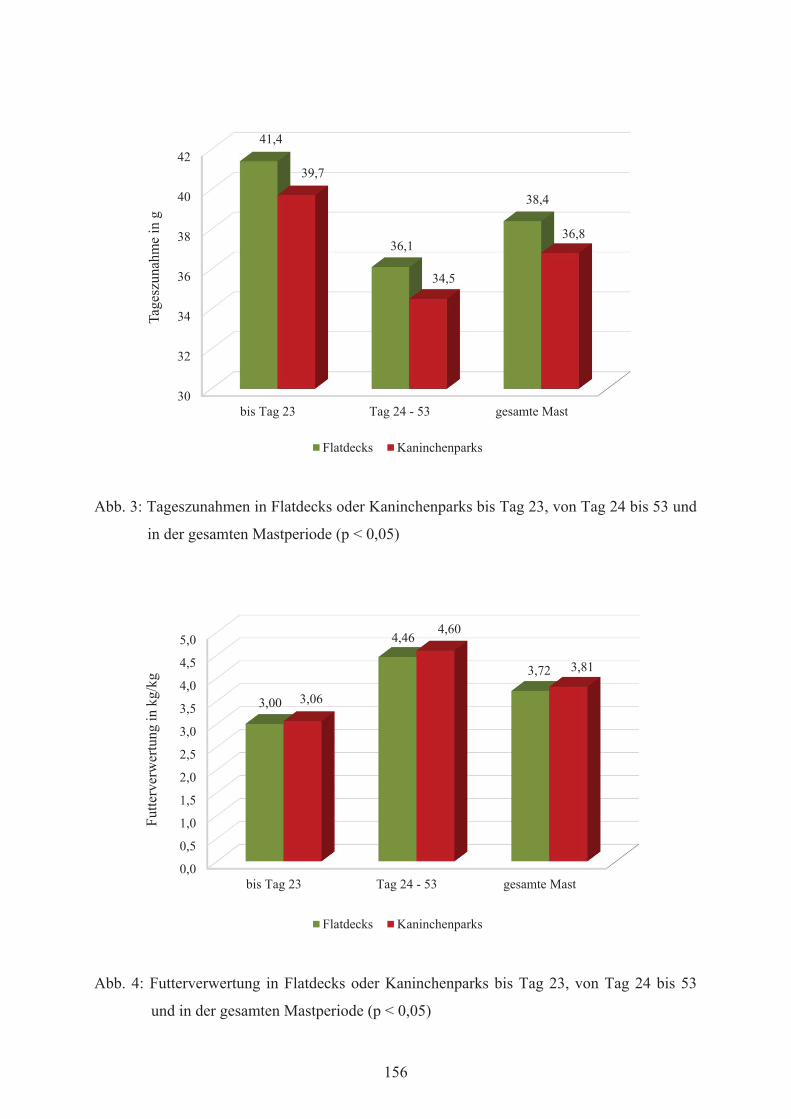
156
30
32
34
36
38
40
42
bis Tag 23 Tag 24 - 53 gesamte Mast
41,4
36,1
38,4
39,7
34,5
36,8
Tage
szun
ahm
e in
g
Flatdecks Kaninchenparks
Abb. 3: Tageszunahmen in Flatdecks oder Kaninchenparks bis Tag 23, von Tag 24 bis 53 und
in der gesamten Mastperiode (p < 0,05)
0,0
0,5
1,0
1,5
2,0
2,5
3,0
3,5
4,0
4,5
5,0
bis Tag 23 Tag 24 - 53 gesamte Mast
3,00
4,46
3,72
3,06
4,60
3,81
Futte
rver
wer
tung
in k
g/kg
Flatdecks Kaninchenparks
Abb. 4: Futterverwertung in Flatdecks oder Kaninchenparks bis Tag 23, von Tag 24 bis 53
und in der gesamten Mastperiode (p < 0,05)

157
Die Tageszunahmen (TZ) wie auch die weiteren Mastleistungsparameter schwankten
signifikant (p < 0,01) zwischen den Durchgängen (TZ: von 31,7 bis 40,3 g im Mittel des
jeweiligen Durchganges), wobei die wesentliche Ursache in der Qualität der Tiere bei
Einstallung (nach Abholung beim Züchter) gesehen wird. In einzelnen Durchgängen gab es
ein Krankheitsgeschehen (Kaninchenschnupfen – Rhinitis contagiosa cuniculi; Enterocolitis),
das die Tiere bereits kurz nach der Einstallung zeigten und offensichtlich auf eine Infektion
noch im Lieferbetrieb zurückzuführen ist. Die TZ der männlichen Tiere waren vor allem im
zweiten Mastabschnitt, aber auch insgesamt, signifikant niedriger als die der weiblichen
Tiere. In den Kleingruppen (Flatdecks – 8,4 %) traten signifikant weniger Verletzungen der
Geschlechtsorgane auf als in den Großgruppen (Parks – 16,0 %) (Abb. 5).
0
2
4
6
8
10
12
14
16
Flatdeck Kaninchenpark
6,8
11,81,4
3,3
0,2
0,9
Proz
ent d
er T
iere
mit
Läsi
onen
gering- mittel- hochgradig
Abb. 5: Anteil der Tiere mit Verletzungen im Anogenitalbereich in den Schweregraden
gering-, mittel- oder hochgradig für Flatdecks und Parks (p < 0,01)
In den Großgruppen der Kaninchenparks war der Kot der Kaninchen signifikant (p < 0,01)
stärker mit Kokzidien befallen als in den Flatdecks (Abb. 6). Der geringere Perforationsanteil
der Grundfläche (50 %) und der erhöhten Ebene (10 oder 50 %) gegenüber den Flatdecks (75
% – MASTHOFF et al., 2017) ist offensichtlich verantwortlich dafür, dass es zu einer

158
sichtbaren Akkumulation des Kotes und in Verbindung damit zu einer stärkeren
Verschmutzung der Tiere (Masthoff et al., 2017) kam. Die häufigeren Kontakte der Tiere mit
den Exkrementen sind mit großer Wahrscheinlichkeit die Ursache für die signifikant höhere
Quote hochgradig positiver Kokzidien-Oozystennachweise.
0
10
20
30
40
50
60
70
80
Flatdeck Kaninchenpark
39,0
22,2
27,6
24,1
13,0
31,5
Proz
ent p
ositi
ver K
otpr
oben
gering- mittel- hochgradig
Abb. 6: Anteil positiver Proben mit Kokzidien-Oozysten in den Befundklassen gering-,
mittel- und hochgradig für Flatdecks und Parks (p < 0,01)
Zwischen den beiden Haltungssystemen (Parks vs. Flatdecks) und zwischen männlichen und
weiblichen Tieren gab es keine Unterschiede in der Mortalität.
SCHLUSSFOLGERUNG
Kaninchen-„Parks“ stellen eine Möglichkeit dar, die TierSchNutztV bezüglich der
Flächenanforderungen umzusetzen. Als Nachteile sind geringere Tageszunahmen, eine
schlechtere Futterverwertung, eine höhere Verletzungsrate (Genitalien) und eine höhere
Kokzidienbürde im Kot zu nennen.
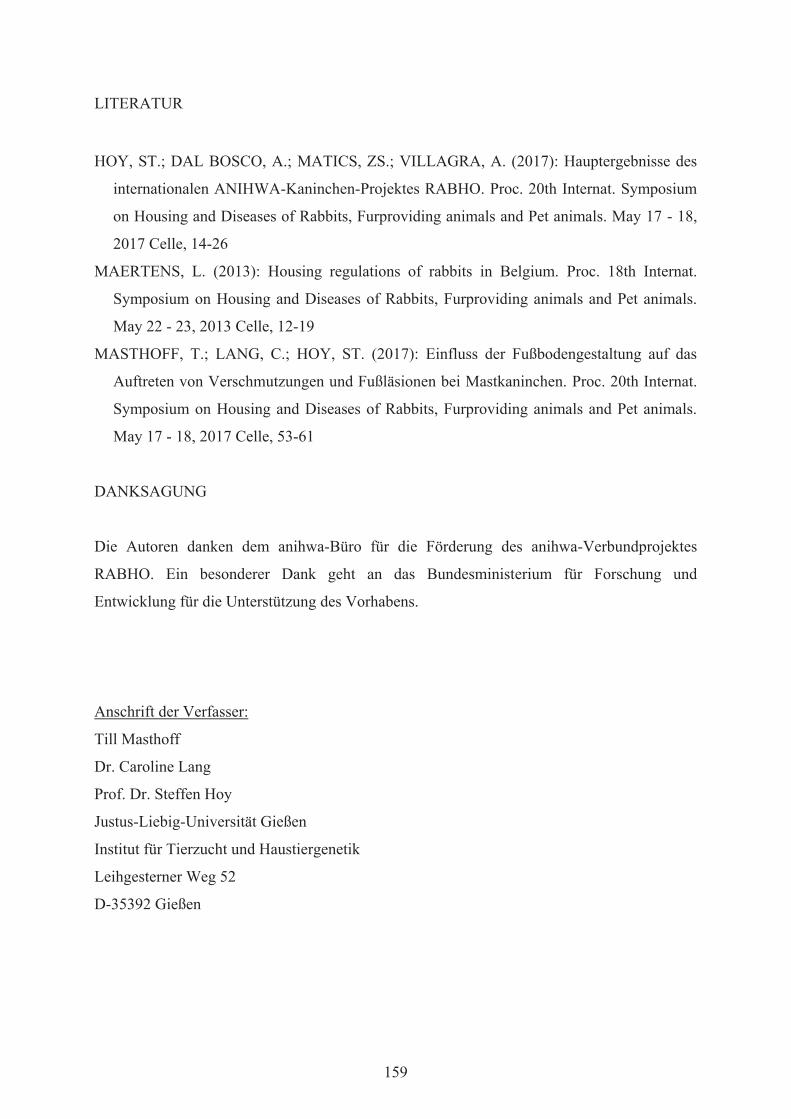
159
LITERATUR
HOY, ST.; DAL BOSCO, A.; MATICS, ZS.; VILLAGRA, A. (2017): Hauptergebnisse des
internationalen ANIHWA-Kaninchen-Projektes RABHO. Proc. 20th Internat. Symposium
on Housing and Diseases of Rabbits, Furproviding animals and Pet animals. May 17 - 18,
2017 Celle, 14-26
MAERTENS, L. (2013): Housing regulations of rabbits in Belgium. Proc. 18th Internat.
Symposium on Housing and Diseases of Rabbits, Furproviding animals and Pet animals.
May 22 - 23, 2013 Celle, 12-19
MASTHOFF, T.; LANG, C.; HOY, ST. (2017): Einfluss der Fußbodengestaltung auf das
Auftreten von Verschmutzungen und Fußläsionen bei Mastkaninchen. Proc. 20th Internat.
Symposium on Housing and Diseases of Rabbits, Furproviding animals and Pet animals.
May 17 - 18, 2017 Celle, 53-61
DANKSAGUNG
Die Autoren danken dem anihwa-Büro für die Förderung des anihwa-Verbundprojektes
RABHO. Ein besonderer Dank geht an das Bundesministerium für Forschung und
Entwicklung für die Unterstützung des Vorhabens.
Anschrift der Verfasser:
Till Masthoff
Dr. Caroline Lang
Prof. Dr. Steffen Hoy
Justus-Liebig-Universität Gießen
Institut für Tierzucht und Haustiergenetik
Leihgesterner Weg 52
D-35392 Gießen
160
Institut für Tierzucht und Haustiergenetik der
Justus-Liebig-Universität Gießen
ERGEBNISSE VON WAHLUNTERSUCHUNGEN ZUR PRÄFERENZ UND EIGNUNG
VERSCHIEDENER BODENSTRUKTUREN BEIM KANINCHEN
B. Zegowitz, T. Masthoff und C. Lang
1. EINLEITUNG
Die Entwicklung der Bedingungen, unter denen Kaninchen gehalten werden dürfen, ist in den
letzten Jahren rasant vorangeschritten. Nachdem es lange Zeit keine detaillierten Vorgaben
zur Haltung von Kaninchen gab, entwickelten die Mitglieder der World Rabbit Science
Association (WRSA) in Zusammenarbeit mit dem DLG Ausschuss für Kaninchenzucht und –
haltung im Jahr 2007 Leitlinien zu Mindeststandards bei der Haltung von Hauskaninchen
(novelliert 2009). Durch die Aufnahme von allgemeinen und speziellen Anforderungen an
Haltungseinrichtungen für Kaninchen in die Tierschutz-Nutztierhaltungsverordnung im Jahr
2014, wurde ein rechtlich verbindlicher Rahmen geschaffen. Mit in Kraft treten dieser
Verordnung, wurden der bis dahin weit in der Praxis verbreitete Drahtgitterboden und stärker
perforierte Kunststoffrostböden verboten.
Die Untersuchungen im Rahmen dieser Arbeit sollen dazu beitragen, festzustellen, welche
Auswirkungen die gesetzlichen Anforderungen an die Bodengestaltung in der
Kaninchenhaltung auf die Tiergesundheit, insbesondere auf die Gesundheit der Läufe, haben.
Dazu soll die Präferenz wachsender Kaninchen für unterschiedliche Kunststoffrostböden und
deren Eignung ermittelt werden.
161
2. MATERIAL UND METHODEN
Versuchstiere und Versuchsaufbau
Die 96 in der Untersuchung eingesetzten ZIKA-Mastkaninchen im Alter von etwa 35 Tagen
und einem durchschnittlichen Einstallgewicht von 0,97 kg wurden geschlechtergemischt in
zwei unterschiedlich große Untersuchungseinheiten (Flatdeck-Käfige) eingestallt. Käfig AB
wies eine nutzbare Grundfläche von 20000 cm² auf und Käfig C verfügte über eine nutzbare
Grundfläche von 10000 cm2. In Käfig AB fanden 16 Tiere Platz, in Käfig C 8 Tiere.
Tabelle 1: In der Untersuchung verwendete Kunststoffrostböden
Die beiden Untersuchungseinheiten wurden je zur Hälfte ihrer Grundfläche mit den in Tabelle
1 dargestellten Kunststoffrostböden bestückt. Die einzelnen Bodentypen waren allesamt aus
Kunststoff und unterschieden sich in der Spaltenweite, der Auftrittsbreite und dem
Perforationsgrad. Den Kaninchen standen auf jedem Bodentyp dieselbe Anzahl an Fress- und
Tränkplätzen zur Verfügung. Die beiden Käfighälften waren bis auf die jeweils
gegeneinander getesteten Bodentypen somit identisch aufgebaut.
Während den vier Haltungsdurchgängen wurden immer jeweils zwei verschiedene
Bodenvarianten miteinander verglichen. Die unterschiedlichen Versuchsvarianten sind in
Tabelle 2 aufgeführt.
Kameratechnik
Die Tiere wurden am 45., 66. und 86. Lebenstag (entspricht dem 10., 31. und 51. Masttag) für
jeweils 24 h mittels einer modifizierten Wildkamera beobachtet. Die Kamera zeichnete alle 60
Sekunden ein Bild auf. Die Anzahl der Kaninchen die sich jeweils auf den beiden
Bodentyp Spaltenweite
(mm)
Auftrittsbreite
(mm)
Perforationsgrad
(%)
Diamant 10 - 10
Rubin 10 10 35
Meneghin 12,6 12,6 42
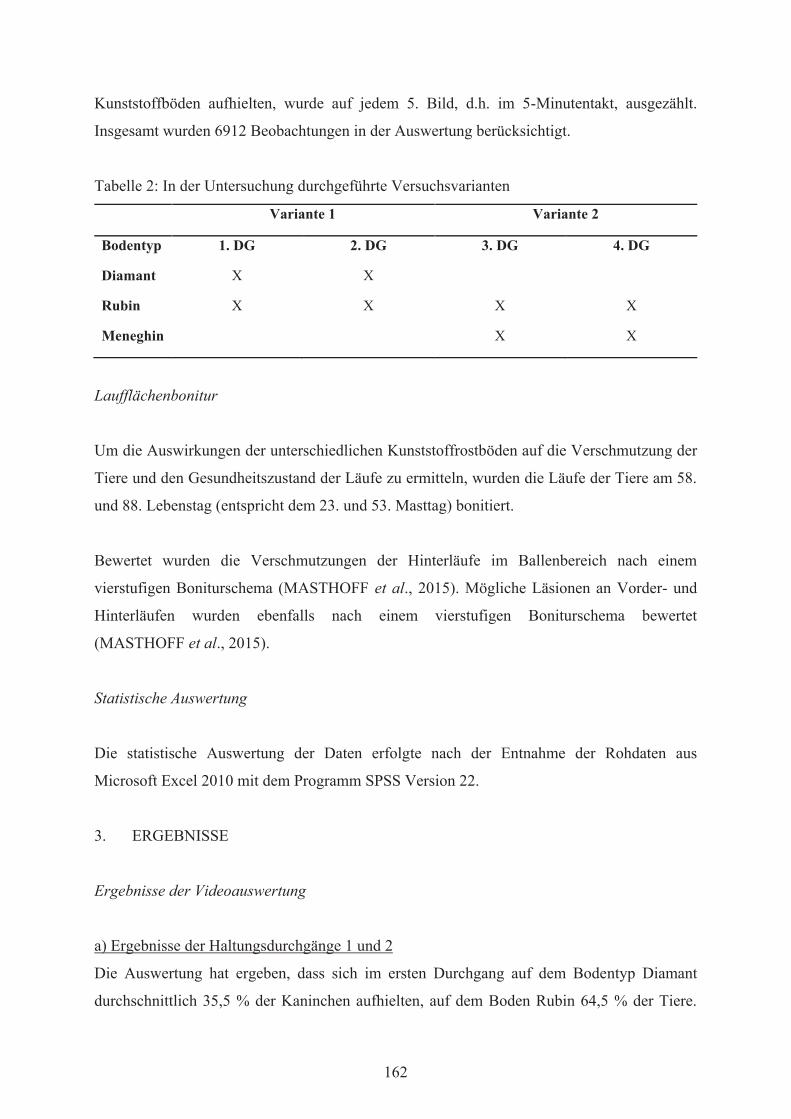
162
Kunststoffböden aufhielten, wurde auf jedem 5. Bild, d.h. im 5-Minutentakt, ausgezählt.
Insgesamt wurden 6912 Beobachtungen in der Auswertung berücksichtigt.
Tabelle 2: In der Untersuchung durchgeführte Versuchsvarianten
Variante 1 Variante 2
Bodentyp 1. DG 2. DG 3. DG 4. DG
Diamant X X
Rubin X X X X
Meneghin X X
Laufflächenbonitur
Um die Auswirkungen der unterschiedlichen Kunststoffrostböden auf die Verschmutzung der
Tiere und den Gesundheitszustand der Läufe zu ermitteln, wurden die Läufe der Tiere am 58.
und 88. Lebenstag (entspricht dem 23. und 53. Masttag) bonitiert.
Bewertet wurden die Verschmutzungen der Hinterläufe im Ballenbereich nach einem
vierstufigen Boniturschema (MASTHOFF et al., 2015). Mögliche Läsionen an Vorder- und
Hinterläufen wurden ebenfalls nach einem vierstufigen Boniturschema bewertet
(MASTHOFF et al., 2015).
Statistische Auswertung
Die statistische Auswertung der Daten erfolgte nach der Entnahme der Rohdaten aus
Microsoft Excel 2010 mit dem Programm SPSS Version 22.
3. ERGEBNISSE
Ergebnisse der Videoauswertung
a) Ergebnisse der Haltungsdurchgänge 1 und 2
Die Auswertung hat ergeben, dass sich im ersten Durchgang auf dem Bodentyp Diamant
durchschnittlich 35,5 % der Kaninchen aufhielten, auf dem Boden Rubin 64,5 % der Tiere.

163
Wie in Abbildung 1 zu sehen, verstärkte sich die Präferenz für den Bodentyp Rubin im
zweiten Haltungsdurchgang mit 75,7 % gegen 24,3 % auf dem Boden Diamant noch weiter (p
≤ 0,001).
Abbildung 1: Durchschnittlicher prozentualer Nutzungsanteil der Tiere während des 1. und 2.
Durchgangs
Die Nutzung der gegeneinander getesteten Bodenvarianten war zwischen den einzelnen
Haltungsdurchgängen ebenfalls höchst signifikant unterschiedlich (p ≤ 0,001). In
Haltungsdurchgang eins nutzten durchschnittlich 35,5 % der Tiere den Boden Diamant, in
Durchgang zwei waren es 24,3 % der Tiere. Den Boden Rubin präferierten in Durchgang eins
im Mittel 64,5 % der Tiere, was einem höchst signifikanten Unterschied zu der
Nutzungshäufigkeit in Haltungsdurchgang zwei mit durchschnittlich 75,7 % entspricht.
b) Ergebnisse der Haltungsdurchgänge 3 und 4
Im dritten und vierten Haltungsdurchgang wurden die beiden Böden Meneghin und Rubin
miteinander verglichen. Die statistische Auswertung hat ergeben, dass während des dritten
Durchgangs die Kaninchen den Bodentyp Rubin im Mittel zu 50,8 % und den
Kunststoffboden Meneghin zu 49,2 % präferierten. Diese Präferenz nahm im vierten
Haltungsdurchgang höchst signifikant zu. Die Tiere nutzten den Kunststoffrost Rubin
durchschnittlich zu 65,8 %, den Bodentyp Meneghin zu 34,2 % (p ≤ 0,001). In Abbildung 2
p ≤ 0,001 p ≤ 0,001
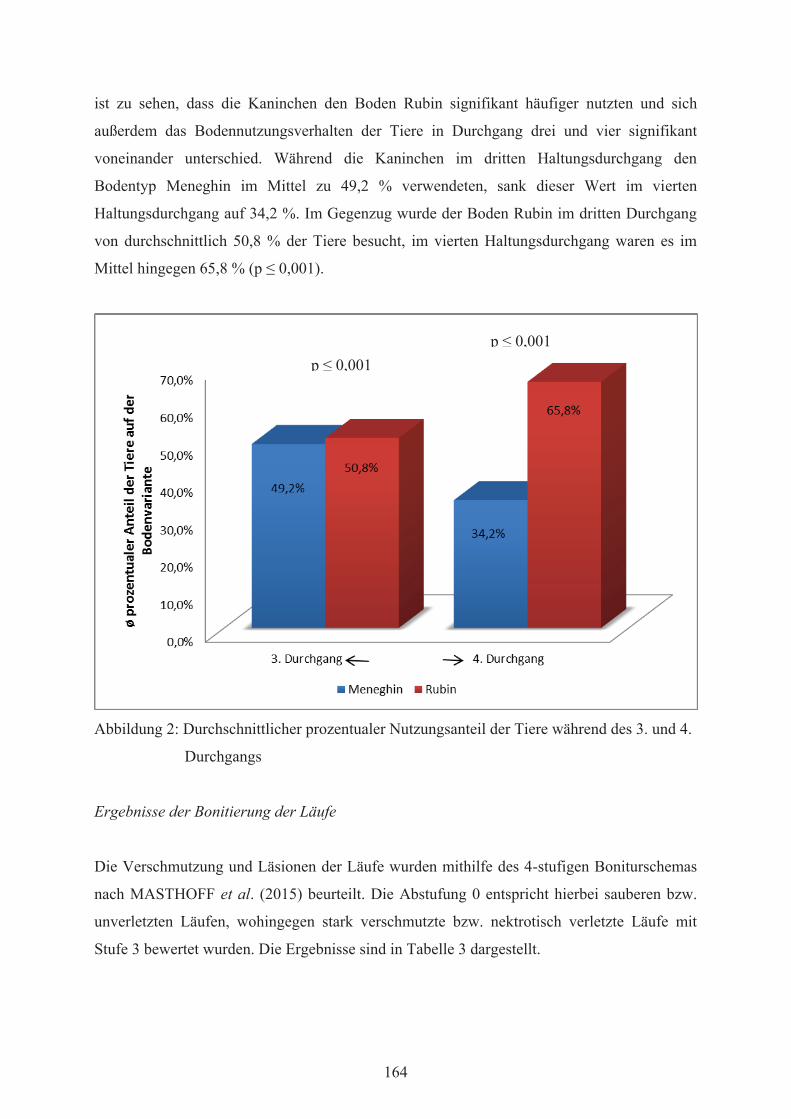
164
ist zu sehen, dass die Kaninchen den Boden Rubin signifikant häufiger nutzten und sich
außerdem das Bodennutzungsverhalten der Tiere in Durchgang drei und vier signifikant
voneinander unterschied. Während die Kaninchen im dritten Haltungsdurchgang den
Bodentyp Meneghin im Mittel zu 49,2 % verwendeten, sank dieser Wert im vierten
Haltungsdurchgang auf 34,2 %. Im Gegenzug wurde der Boden Rubin im dritten Durchgang
von durchschnittlich 50,8 % der Tiere besucht, im vierten Haltungsdurchgang waren es im
Mittel hingegen 65,8 % (p ≤ 0,001).
Abbildung 2: Durchschnittlicher prozentualer Nutzungsanteil der Tiere während des 3. und 4.
Durchgangs
Ergebnisse der Bonitierung der Läufe
Die Verschmutzung und Läsionen der Läufe wurden mithilfe des 4-stufigen Boniturschemas
nach MASTHOFF et al. (2015) beurteilt. Die Abstufung 0 entspricht hierbei sauberen bzw.
unverletzten Läufen, wohingegen stark verschmutzte bzw. nektrotisch verletzte Läufe mit
Stufe 3 bewertet wurden. Die Ergebnisse sind in Tabelle 3 dargestellt.
p ≤ 0,001 p ≤ 0,001

165
Tabelle 3: Durchschnittliche Verschmutzungen / Läsionen in den Haltungsdurchgängen
1. DG 2. DG 3. DG 4. DG
Ø Verschmutzung
Käfig AB
Käfig C
2,63
2,57
3,00
3,00
0,93
0,07
0,97
0,32
Ø Läsionen
Käfig AB
Käfig C
0,32
0,15
0,00
0,00
0,04
0,00
0,00
0,00
Im Mittel lagen die Verschmutzungen im ersten Haltungsdurchgang, bei dem die beiden
Böden Diamant (10 % Perforation) und Rubin (35 % Perforation) gegeneinander getestet
wurden, bei 2,63 (Haltungseinheit AB) bzw. bei 2,57 (Haltungseinheit C). Im zweiten
Durchgang konnte in beiden Untersuchungseinheiten eine durchschnittliche Verschmutzung
von 3,00 ermittelt werden. Die Tiere aus dem dritten Haltungsdurchgang, in dem die beiden
Kunststoffroste Meneghin (42 % Perforation) und Rubin (35 % Perforation) miteinander
verglichen wurden, wiesen mittlere Werte von 0,93 (Käfig AB) und 0,07 (Käfig C) auf. Im
vierten und letzten Durchgang konnten die durchschnittlichen Verschmutzungen der
Kaninchenläufe in Haltungseinheit AB auf 0,97 und in Haltungseinheit C auf 0,32 beziffert
werden. Die durchschnittlichen Läsionen können ebenfalls Tabelle 3 entnommen werden. Es
konnten in Haltungsdurchgang eins und zwei, in denen es zu einer starken Verschmutzung
des Bodentyps Diamant kam, deutlich häufiger Laufflächenläsionen diagnostiziert werden, als
in den Durchgängen drei und vier mit weitestgehend sauberen Bodenverhältnissen.
4. DISKUSSION
Ziel dieser Arbeit war es, unter Aspekten des Tierschutzes die Frage nach einer artgerechten
Bodengestaltung für wachsende Kaninchen wissenschaftlich zu beantworten und
Schlussfolgerungen für eine praxistaugliche Haltung dieser Tiere abzuleiten.
Über alle Durchgänge hinweg präferierten die Kaninchen den Boden Rubin höchstsignifikant
(p ≤ 0,001). In den beiden ersten Haltungsdurchgängen, in denen der Bodentyp Rubin und
Diamant verglichen wurde, favorisierten die Tiere stets den Kunststoffboden Rubin. Auf die
drei Beobachtungstermine bezogen hielten sich auch dem Boden Diamant lediglich im Mittel

166
halb so viele Tiere auf wie auf dem Boden Rubin. Sehr wahrscheinlich ist dies auf die starke
Verunreinigung des nur gering perforierten Bodens Diamant, sowohl im ersten als auch im
zweiten Haltungsdurchgang, zurückzuführen. Demnach ist ein Perforationsgrad der
Bodenfläche von 10 % offensichtlich zu gering um die anfallenden Exkremente sicher von
den Tieren abzuleiten. Durch die nur ungenügende Ableitung der Ausscheidungen der
Kaninchen durch den Boden Diamant, wurde die Bodenfläche zunehmend stärker
verschmutzt.
Während des dritten und vierten Haltungsdurchgangs, bei dem die Bodentypen Rubin und
Meneghin gegeneinander getestet wurden, waren die Verschmutzungen der beiden
Bodenvarianten minimal. Die zwei Kunststoffrostböden waren ähnlich gut in der Lage, die
anfallenden Exkremente der Tiere in Richtung Kotgrube nach unten abzuleiten. Der Bodentyp
Rubin wurde im Vergleich zum Kunststoffrost Meneghin von den Tieren höchstsignifikant
präferiert. Die wesentlichen Unterschiede zwischen diesen beiden Böden besteht in den
unterschiedlichen Spaltenweiten und der Gestaltung der Auftrittsfläche. Die Variante
Meneghin verfügt über eine größere Spaltenweite (12,6 mm vs. Bodentyp Rubin mit 10,0
mm) und eine abgerundete Auftrittsfläche die Kot und Harn effizienter nach unten ableiten
soll. Dagegen ist die Auftrittsfläche bei dem Kunststoffrostboden Rubin plan eben. Die
höchstsignifikante Bevorzugung des Bodentyps Rubin im vierten Haltungsdurchgang ist
wahrscheinlich auch auf die im Vergleich zum dritten Durchgang deutlich niedrigere
Stalltemperatur zurückzuführen. Während die durchschnittliche Stalltemperatur im dritten
Haltungsdurchgang 22,0 ᵒC betrug, herrschten im vierten Durchgang im Mittel 16,0 ᵒC im
Stall.
Die Ergebnisse der Bonituren der Läufe waren in den vier durchgeführten
Haltungsdurchgängen sehr unterschiedlich. Durch die starke Verschmutzung des wenig
perforierten Bodens Diamant in Haltungsdurchgang eins und zwei kam es dort bei nahezu
allen Tieren zu mittelschweren bis schweren Verschmutzungen der Läufe. Bedingt dadurch
war die Anzahl der Tiere die leichte bis mittelschwere Läsionen aufwiesen relativ hoch. Aus
Sicht der Tiergesundheit haben sich die beiden Bodentypen Rubin und Meneghin in der
durchgeführten Untersuchung bewährt. Kot und Harn der Kaninchen wurde von beiden
Bodenvarianten nahezu vollständig abgeleitet, weshalb auch so gut wie keine starken
Verschmutzungen der Läufe und infolge dessen Pododermatitiserkrankungen auftraten.
MASTHOFF et al. (2016) stellten in ihren Untersuchungen fest, dass es einen signifikanten
167
Einfluss zwischen der Verschmutzung des Bodens und dem Auftreten von Pododermatitis
gibt. Je stärker ein Stallboden verschmutzt war, desto häufiger und schwerer erkrankten die
Tiere an Pododermatitis. Diesem möglichen Zusammenhang kann durch die vorliegenden
Ergebnisse zugestimmt werden.
Während verschmutzte und lädierte Läufe in Haltungsdurchgang eins und zwei relativ häufig
zu beobachten waren, stellte sich die Situation in Durchgang drei und vier vollkommen anders
dar. Die gegeneinander getesteten Bodentypen Rubin und Meneghin waren in beiden
Durchgängen in einem jeweils guten hygienischen Zustand. Es konnten keine stärkeren
Verschmutzungen (Mittelwert der Haltungsdurchgänge drei und vier: 0,58) festgestellt
werden. Die Haltung der Kaninchen auf den beiden Kunststoffspaltenböden führte zu
geringen Verschmutzungen der Läufe und es traten so gut wie keine
Pododermatitiserkrankungen auf.
5. ZUSAMMENFASSUNG
Im Rahmen dieser Arbeit wurde die Präferenz von wachsenden Kaninchen für verschiedene
Bodentypen und deren Einfluss auf die Tiergesundheit untersucht. Dazu wurden in vier
Haltungsdurchgängen folgende drei Bodenvarianten gegeneinander getestet: Bodentyp
Diamant (10 % Perforationsgrad), Rubin (35 % Perforationsgrad), Meneghin (42 %
Perforationsgrad). An der Untersuchung nahmen 96 Mastkaninchen teil, die am 10., 31. und
51. Masttag mit einer modifizierten Wildkamera für 24 Stunden beobachtet wurden. Bei der
Auswertung der Daten, in die insgesamt 6912 Beobachtungen eingingen, wurde alle fünf
Minuten ausgezählt, wie viele Tiere sich auf dem jeweiligen Bodentyp aufhielten. In
Durchgang eins und zwei wurden die Bodentypen Diamant und Rubin miteinander
verglichen, in Durchgang drei und vier wurden die Kunststoffrostböden Rubin und Meneghin
gegeneinander getestet. In den Durchgängen eins und zwei wurde der Boden Rubin mit
durchschnittlich 70,1 % gegenüber 29,9 % für Bodentyp Diamant von den Kaninchen
höchstsignifikant bevorzugt (p ≤ 0,001). In den Haltungsdurchgängen drei und vier hielten
sich im Mittel 58,3 % der Tiere auf der Bodenvariante Rubin und 41,7 % auf dem
Kunststoffrostboden Meneghin auf (p ≤ 0,001). Die vorliegenden Ergebnisse machen
deutlich, dass die Präferenz von Mastkaninchen für einen bestimmten Bodentyp nicht nur
vom Perforationsgrad abhängig ist, sondern auch Einflussfaktoren wie Bodenbeschaffenheit,
hygienische Bodenverhältnisse oder Stalltemperatur eine Rolle spielen. Es konnte in
168
Haltungsdurchgang drei und vier gezeigt werden, dass bei niedrigeren Stalltemperaturen,
Bodenvarianten mit geringerem Perforationsgrad von den Kaninchen eindeutig präferiert
werden. Die Untersuchungsergebnisse zeigen ebenfalls, dass der Grad der Verschmutzung der
Läufe eng mit dem Auftreten von Pododermatitis korreliert ist. So konnten in
Haltungsdurchgang eins und zwei, in denen es zu einer starken Verschmutzung des
Bodentyps Diamant kam, deutlich häufiger wunde Läufe diagnostiziert werden, als in den
Durchgängen drei und vier mit guten hygienischen Bodenverhältnissen. Hinsichtlich der
Bewertung der Tiergerechtheit der untersuchten Bodentypen und unter Beachtung der
gesetzlichen Rahmenbedingungen (Tierschutz-Nutztierhaltungsverordnung – TierSchNutztV)
kann die Bodenvariante Rubin für den Einsatz in der Praxis empfohlen werden.
6. LITERATURVERZEICHNIS
MASTHOFF, T.; LANG, C.; BUHL, M.; HOY, S. (2015): Einfluss der Fußbodengestaltung
auf die Verschmutzung des Bodens und die Gesundheit der Läufe von Mastkaninchen. In:
Proc. 19. Internationale Tagung über Haltung und Krankheiten der Kaninchen, Pelztiere
und Heimtiere, 27.-28.5.2015, Celle, 284-297
MASTHOFF, T.; LANG, C.; HOY, S. (2016): Effect of group size on fattening performance
and of various types of slatted floor on dirtiness and occurrence of pododermatitis in
growing rabbits. In: Proceedings of the 11th World Rabbit Congress, June 15-18, 2016,
Qingdao, China, 290
Korrespondenzadresse:
Dr. Caroline Lang
Justus Liebig Universität Gießen
Inst. f. Tierzucht und Haustiergenetik
Abt. f. Tierhaltung und Haltungsbiologie
Leihgesterner Weg 52
35392 Gießen
email: [email protected]
169
University of Perugia
ASSESSING THE MOTIVATION OF RABBIT DOES TO SOCIAL CONTACT
OR SELF-EXCLUSION
M. Martino1, S. Mattioli1, V. Cambiotti2, L. Moscati2, C. Castellini1, A. Dal Bosco1
Alternative housing systems often using enrichments and the rearing in group can be
considered an important form of social enrichment (BAUMAN, 2005), but grouping rabbits
can also cause stress, fighting and wounds (ANDRIST et al., 2011). The motivational tests
permit to check the animal needs, and than they can positively contribute to proper handling.
1. OBJECTIVE
The aim of this study was to verify the motivation of rabbit does to social contact or self-
esclusion and to evaluate whether a change to the housing environment leads to improved
welfare conditions in group-reared does.
2. MATERIAL AND METHODS
Three-way experiment was performed to verify the motivation to social contact or seclusion
in New Zealand Withe rabbits does:
- 1st: 8 nulliparous rabbits (4 does / cage) are housed in a motivational cage with 4
compartments, constituted by doors with plastic panels that allow a visual contact
from the animals and where the entrance is free. (Figure 1a)
- 2nd: the same 4 individual areas were equipped with 4 environmental enrichments: straw,
sand box and hiding box, respectively. The 4th individual area is left empty and serves
as a control. Each rabbit can enter in all areas. Furthermore, every 48-h, additional

170
weights were added to each door. To reach these resources, rabbits had to pay entry
cost, pushing through weighted doors. (Figure1b)
- 3rd: This experiment was designed to evaluate the effect of straw substitution; 8 rabbit
does (4 does / cage) can stay the central group area (G zone) or in individual areas
(Figure1c), divided as follows:
- zone SS1-SS2: two zone equipped with stagnant straw (straw replacement every
8 days, at the end of each video recording cycle).
- zone FS1-FS2: two zone equipped with fresh straw (straw replacement every 2 days).
Figure 1: Scheme of motivational cages in the 1st (a), 2nd (b) and 3rd (c) experiment.
a
b
c
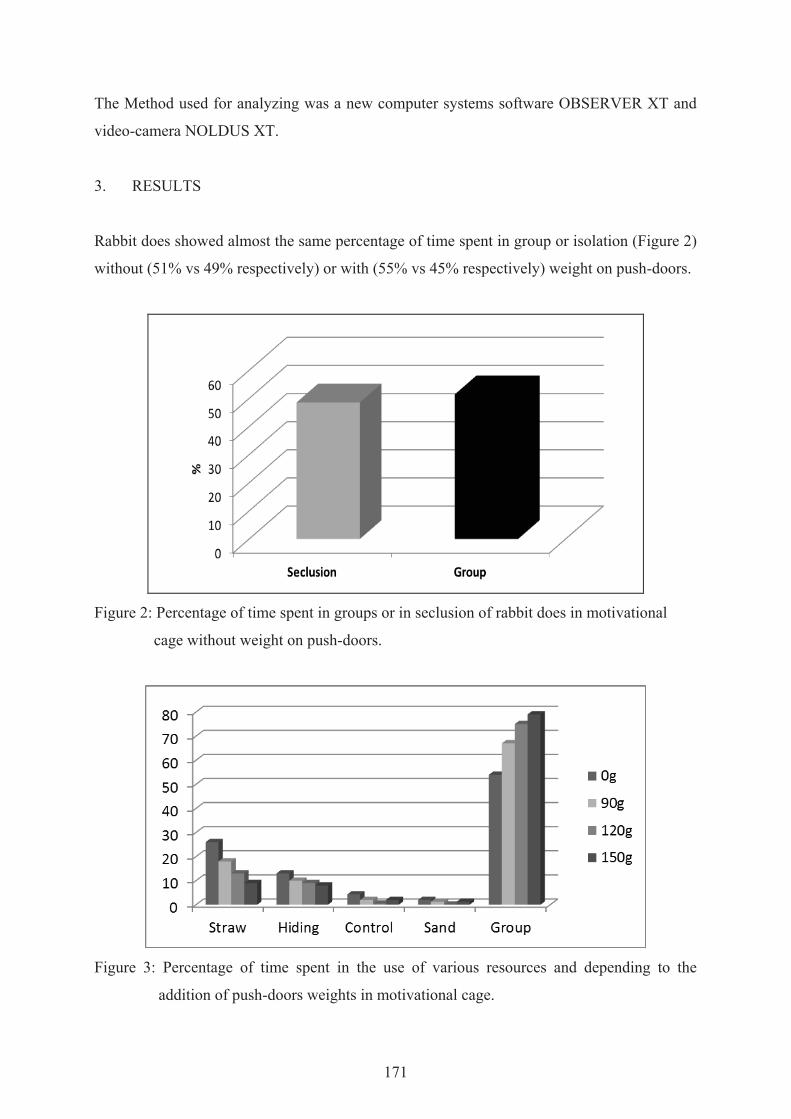
171
The Method used for analyzing was a new computer systems software OBSERVER XT and
video-camera NOLDUS XT.
3. RESULTS
Rabbit does showed almost the same percentage of time spent in group or isolation (Figure 2)
without (51% vs 49% respectively) or with (55% vs 45% respectively) weight on push-doors.
Figure 2: Percentage of time spent in groups or in seclusion of rabbit does in motivational
cage without weight on push-doors.
Figure 3: Percentage of time spent in the use of various resources and depending to the
addition of push-doors weights in motivational cage.
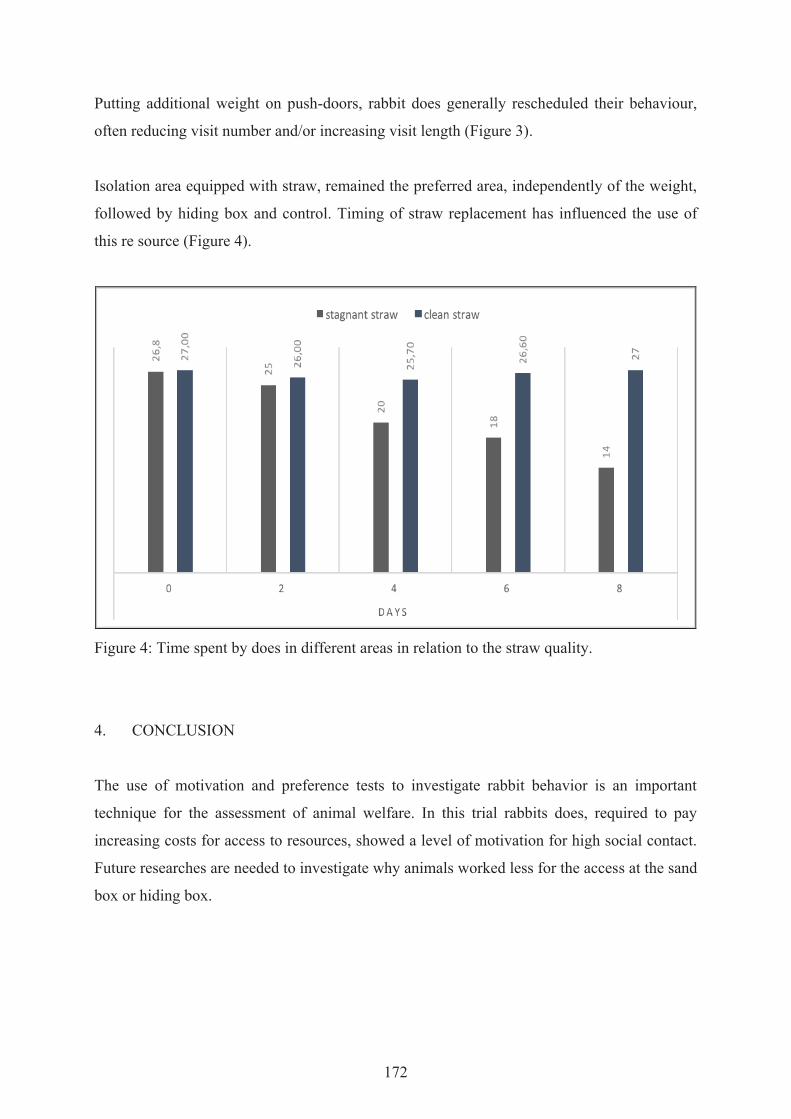
172
Putting additional weight on push-doors, rabbit does generally rescheduled their behaviour,
often reducing visit number and/or increasing visit length (Figure 3).
Isolation area equipped with straw, remained the preferred area, independently of the weight,
followed by hiding box and control. Timing of straw replacement has influenced the use of
this re source (Figure 4).
Figure 4: Time spent by does in different areas in relation to the straw quality.
4. CONCLUSION
The use of motivation and preference tests to investigate rabbit behavior is an important
technique for the assessment of animal welfare. In this trial rabbits does, required to pay
increasing costs for access to resources, showed a level of motivation for high social contact.
Future researches are needed to investigate why animals worked less for the access at the sand
box or hiding box.

173
5. REFERENCES
1. BAUMAN, V. (2005): Environmental enrichment for laboratory rodents and rabbits:
requirements of rodents, rabbits, and research. ILAR Journal 46 (2), 162-170
2. ANDRIST, C.A.; BIGLER, L.; BUCHWALDER, T.; ROTH, B.A. (2011): The extent of
lesions in group housed rabbits and potential risk factors. In: Proceedings of the 17th
International Symposium on Housing and Diseases of Rabbits, Fur Providing Animals and
Pet Animals. Celle, Germany, pp. 34-42
1 Department of Agricultural, Food and Environmental Science, University of Perugia, Via
Borgo 20 Giugno, 74, 06100 Perugia, Italy. 2 Istituto Zooprofilattico dell’Umbria e delle Marche, Via G. Salvemini 1, 06100 Perugia,
Italy.
Corresponding author:
Dr. Simona Mattioli
Department of Agricultural, Environmental and Food Science
University of Perugia
Borgo XX Giugno 74
06121 Perugia (PG), Italy
Tel. +39 075585 7121
Fax: +39 075 5857122
Email: [email protected]
174
Warsaw University of Life Sciences, Poland
EFFICIENCY OF USE YEAST YARROWIA LIPOLYTICA AS PREBIOTIC
PREPARATION ON GROWING RABBITS
M. Brzozowski, R. Dominiak and P. Gajewski
1. INTRODUCTION
Rabbits are a typical herbivorous, with active intestinal microbial population. Young rabbits
after weaning are susceptible to stress, which can result in multiplication of undesirable
germs. One of the ways counteract that problem seems to be supporting digestive system in
the first period after weaning rabbits, when their digestive system is not yet sufficiently
developed, by using nutritional additives, as probiotics or prebiotics.
Probiotics are the usual bacteria that all animals need for their digestive well being. The
function of probiotics is to improve the growth and development of the normal, desirable
microbial population in the gut, allowing them to maintain domination over the undesirable
organisms (Fuller, 1989; Bielecka et al., 2002). There are studies showing positive effect of
probiotics using in rabbits (Brzozowski et al., 2007a; Brzozowski et al., 2007b; Kamra et al.,
1996; Kermauner and Struklec, 2005).
By the term “prebiotics” we mean any feeding additives which are not digested in the
gastrointestinal tract. They improve the development of intestinal microflora especially in the
rabbit’s large intestine. (BRZOZOWSKI, 2015). As prebiotic substances can be used
oligosaccharides (the most important of these are oligofructose), inulin, lactose, Beta-glucans
constituting yeasts cell walls (NURIMI et al., 1996; LIBUDZISZ, 1999).

175
The aim of the experiment was to determine whether the use yeast Yarrowia lipolytica
biomass as prebiotic preparation on growing rabbits will help to improve the health status and
fattening results in rabbits.
2. MATERIAL AND METHODS
The supplement of 6% yeast during the first two weeks after weaning was added in
experimental group (n=20 animals). The control group (n=19 animals) was fed by commercial
feed. The following indicators were studied: survival rate, health status, final body weight,
dressing percentage.
3. RESULTS AND DISCUSSION
The results concerning survival rate are presented in figure 1.
0
20
40
60
80
100
Surv
ival
rate
(%)
1 2 3 4 5 6 7 8
Age after weaning (weeks)
controlexperimental
Figure 1. Comparison of survival rate between control and experimental rabbits
Survival rate was higher in experimental group. Mortality in experimental group (5%) was on
the level similar to presented by other authors (LEBAS et al., 1997; BIELAŃSKI and
KOWALSKA, 2007). It can be supposed that addition of prebiotic improves young rabbit’s
health.
The results concerning body weight changes are presented in table 1.

176
Table 1: Comparison of body weight changes between control and experimental groups
during fattening period
Group Weeks after weaning, body weight (g)
1 2 3 4 5 6 7 8
Control 898 1095 1152 1368 1542 1795 2035 2327
Experiment 896 1182 1354 1581 1796 1989 2207 2437
There were no statistical differences between groups in body weight changes and final body
weight. The results are comparable with cited in the literature (LEBAS, 1997; MC NITT et
al., 2002; BIELANSKI and KOWALSKA, 2007).
The dressing percentage results were similar in both compared groups: 47.95% in control
group and 48.92% in experimental group. The slaughter capacity of rabbits weighing 2.5 - 3
kg is 50-60% (KOWALSKA and KOBYLARZ, 2013). Rabbits participating in the
experiment achieved lower average yields, which may result from their lower final weight.
4. CONCLUSION
The results indicate, that the main effect of using the supplement of yeast biomass in the
rabbit’s diet after weaning seems to be the health status improving and falls reducing.
5. SUMMARY
The aim of the experiment was to determine whether the use yeast Yarrowia lipolytica
biomass as prebiotic preparation on growing rabbits will help to improve the health status and
fattening results in rabbits. The supplement of 6% yeast during the first two weeks after
weaning was added in experimental group (n=20 animals). The control group (n=20 animals)
was fed by commercial feed. The following indicators were studied: survival rate, health
status, final body weight, dressing percentage. It was found higher survival rate and better
health status in experimental group. The results concerning final body weight and dressing
percentage were similar in both groups. The results indicate, that the main effect of using the
supplement of yeast biomass in the rabbit’s diet after weaning seems to be the health status
improving and reducing the falls.
177
REFERENCES
1. BIELAŃSKI, P.; KOWALSKA, D. (2007): Króliki. Oficyna Wydawnicza „Hoża”,
Warszawa
2. BIELECKA, M.; BIEDRZYCKA, E.; MAJKOWSKA, A.; WASILEWSKA, E.;
ZDUŃCZYK, Z.; JUŚKIEWICZ, J.; JĘDRYCHOWSKI, L.; WRÓBLEWSKA, B.;
ROTKIEWICZ, T.; ROTKIEWICZ, Z. (2002): Probiotyki, prebiotyki i synbiotyki -
wpływ na mikroekosystem przewodu pokarmowego zwierząt zdrowych i infekowanych
bakteriami Salmonella. Pediatria Współczesna, 4/1:94-94
3. BRZOZOWSKI, M.; ANTUSZEWICZ, W.; ROKICKA, A. (2007a): Results of Bacillus
cereus var. toyoi (probiotic) use in fattening of rabbits, Proceedings of 15th Symposium
on Housing and Diseases of Rabbits, Furbearing Animals and Pet Animals, 15, 103-107
4. BRZOZOWSKI, M.; ROKICKA, A.; ANTUSZEWICZ, W. (2007b): The effect of
Bacillus cereus (probiotic) on rabbits growth and survivability up to weaning.
Proceedings of 15th Symposium on Housing and Diseases of Rabbits, Furbearing Animals
and Pet Animals, 15, 158-162
5. BRZOZOWSKI, M. (2015): Rola probiotyków i prebiotyków w prawidłowym
funkcjonowaniu układu pokarmowego królików. Wiadomości Zootechniczne Nr 3, 50-
53.
6. FULLER, R. (1989): Probiotics in man and animals. J. Appl. Bacteriol. 66, 365-378
7. LEBAS, F.; COUDERT, P.; DE ROCHAMBEAU, H.; THEBAULT, R.G. (1997): The
Rabbit. Husbandry, health and production. FAO Animal Production and Health Series,
No. 21, Rome, Italy
8. KAMRA, D.N.; CHAUDHARY, L.C.; SINGH, R.; PATHAK, N.N. (1996): Influence of
feeding probiotics on growth performance and nutrition digestibility in rabbits. World
Rabbit Sci. 4 (2), 85-88
9. KERMAUNER, A.; STRUKLEC, M. (2005): Effect of feed additive “Kanne
Fermentgetreide” (FPB) on fattening and some digestive parameters of growing rabbits.
14th Symposium on Housing and Diseases of Rabbits, Furbearing and Pet Animals.
Celle, Germany. Proceedings of Symposium, 57-68
10. KOWALSKA, D.; KOBYLARZ, P. (2013): Roślinożerne zwierzęta futerkowe –
użytkowanie mięsne, Wiadomości Zootechniczne, R.LI,1,9-17

178
11. LIBUDZISZ, Z. (2002): Mikrobiologiczne i technologiczne aspekty probiotyków.
Warsztaty zorganizowane w ramach projektu Accompaning Measure do projektu Flair-
Flow Europe IV, Kraków 20.06.2002, 11-21
12. MC NITT, J.; PATTON, N.M.; LUKEFAHR, S.D.; CHEEKE, P.R. (2002): Rabbit
production. Interstate Publishers, Danville, Il, USA
13. NURMI, E.; HAKKINEN, M.; NOUTIO, L. (1996): The use of probiotics for the
competitive exclusion of Salmonella in animals, Syposium Probiotics, Berlin
Corresponding author:
Marian Brzozowski
Warsaw University of Life Sciences – SGGW
Department of Animal Breeding and Production
Ciszewskiego 8
02-786 Warsaw, Poland
E-mail: [email protected]

179
Higher School of Agriculture of Mateur, University of Carthage, Tunisia
PRELIMINARY CHARACTERIZATION OF FENUGREEK SEEDS GUM FOR USE AS
PREBIOTIC IN RABBITS’ NUTRITION
J. Zemzmi, S. Mabrouki, H. Abdouli and T. Najar
ABSTRACT
Prebiotics are used in animal feeds to enhance health status and productivity. They are
oligosaccharides or water-soluble polysaccharides like locust bean gum and fenugreek seed
gum (FSG). The latter has not been tested in rabbits’ nutrition. This study aimed to isolate
FSG and determine its physico-chemical properties and in vitro caecal fermentation profile.
From a batch of ground fenugreek seeds, three subsamples (200g each) were used for gum
extraction. Extraction consisted of twice defatting in 200ml hexane-isopropanol (3/2, v/v),
washing with 150ml acetone, extraction and decanting off soluble sugars in 200ml of hot 80%
ethanol and then gum solubilisation in 2L water (24h), precipitation with ethanol (1L) and
freeze drying. For each of the three FSG, kinetic of in vitro gas production was carried out in
triplicate with and without nitrogen source addition. Rabbit’s caecal content homogenized
under CO2 in 1L of McDougall’s synthetic saliva and filtered through six layers of cheese-
clothe was used as inoculum (20ml/syringe, 200mg sample). Attempts were made to fit the
experimental data to four models and the one that fitted the data well and best (logistic
nonlinear with discrete lag time) was retained and used to characterize the fermentation
profiles. All measured parameters were not different (P > 0.05) between the three FSG
demonstrating the good repeatability of the extraction procedure. FSG was of a white color,
had dry matter and ash contents of 95.39±0.44 and 1.79±0.56, respectively; contained traces
of flavonoids, tannins, coumarins and nitrogen and no steroids, terpenoids, alkaloids, saponins
and reducing sugars. It had a bulk density of 0.2 ±0.04 and solubility in cold water of
0.0042g/ml. FSG incubated without nitrogen addition was characterized by a cumulative gas

180
volume at 24 h of 124.4ml/g, an asymptotic gas volume of 123.98ml/g; a fraction rate of gas
production (µ) of 0.127 h-1, a half-life (t0.5) of 7.98 h, and a fraction rate of gas production at
half-life (µ0.5) of 0.254 h-1. Nitrogen addition in the incubation medium increased (P<0.05)
(µ) to 0.148 h-1 and (µ0.5) to 0.296 h-1 and decreased (P<0.05) (t0.5) to 7.62 h. Results indicated
that FSG may be considered as prebiotic if its resistance to pre-caecal digestion and its
beneficial effect on caecal microbial population are demonstrated.
INTRODUCTION
Prebiotics are defined as “nondigestible and selectively fermented food ingredients that
increase the growth or activity of select members of the endogenous intestinal microbial
community and the new community benefits the host’’ (MANNING and GIBSON, 2004;
ROBERFROID, 2007). Prebiotics have been found to have beneficial effects for human
(CUMMINGS et al., 2001), poultry (PATERSON and BURKHOLDER, 2003; DONALSON
et al., 2008), swine (TJARDES et al., 2003) and rabbit (AGUILAR et al., 1996; MOURAO et
al., 2004; MORISSE et al., 2004; MAERTENS et al., 2004). Prebiotics such as inulin,
Fructo-oligosaccharides (FOS), manno-oligosaccharides (MOS) and Galacto-oligosaccharides
(GOS) have beneficial effects on the caecal environment by increasing the level and
composition of volatile fatty acids (VFA) (MOURÂO et al., 2006; MAERTENS et al., 2004;
PEETERS et al., 1992). FOS has a barrier effect in the caecum by increasing volatile fatty
acids (VFA) production, decreasing the ammonia levels in caecal contents (MORISSE et al.,
1992). MOS are known for their ability to prevent colonization more than stimulating
microorganisms. Many pathogens such as Escherichia coli and Salmonella enteritidis have
fimbriae which attach the MOS instead of attaching the mannose residues of intestinal cell
receptors (KOCHER, 1996; PRINTEMPS et al., 2000). Other non-starch polysaccharide fiber
made of mannose (main chain) and galactose (side chains) known as galactomannans (gums)
have been tested as prebiotics on rats, poultry and humans. They are typically isolated from
the endosperm of leguminous plant seeds or microbial sources. Galactomannans varities are
based on the galactose: mannose ratio (gal: man) with galactose molecules specifying the
solubility of each source (SRIVASTAVA et al., 2005). Galactomannans have cholesterol-
lowering and hypoglycemic effects, and improve mineral availability (PHILLIPS, 1998;
NASIR et al., 2004). Used in broilers diet, they improve growth performance, average daily
gain (REBOLE et al., 2010, PARK and PARK, 2011) and digestibility (COXAM, 2007).
Furthermore, several studies have shown that the use of guar gum as a source of
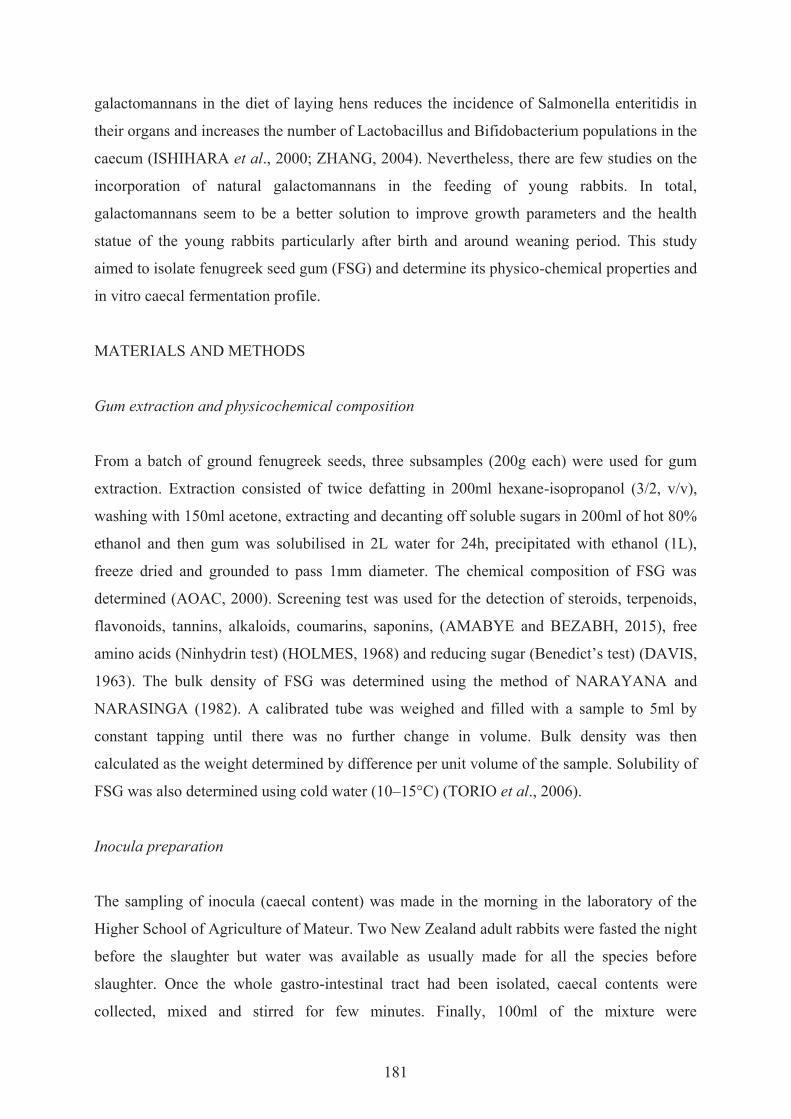
181
galactomannans in the diet of laying hens reduces the incidence of Salmonella enteritidis in
their organs and increases the number of Lactobacillus and Bifidobacterium populations in the
caecum (ISHIHARA et al., 2000; ZHANG, 2004). Nevertheless, there are few studies on the
incorporation of natural galactomannans in the feeding of young rabbits. In total,
galactomannans seem to be a better solution to improve growth parameters and the health
statue of the young rabbits particularly after birth and around weaning period. This study
aimed to isolate fenugreek seed gum (FSG) and determine its physico-chemical properties and
in vitro caecal fermentation profile.
MATERIALS AND METHODS
Gum extraction and physicochemical composition
From a batch of ground fenugreek seeds, three subsamples (200g each) were used for gum
extraction. Extraction consisted of twice defatting in 200ml hexane-isopropanol (3/2, v/v),
washing with 150ml acetone, extracting and decanting off soluble sugars in 200ml of hot 80%
ethanol and then gum was solubilised in 2L water for 24h, precipitated with ethanol (1L),
freeze dried and grounded to pass 1mm diameter. The chemical composition of FSG was
determined (AOAC, 2000). Screening test was used for the detection of steroids, terpenoids,
flavonoids, tannins, alkaloids, coumarins, saponins, (AMABYE and BEZABH, 2015), free
amino acids (Ninhydrin test) (HOLMES, 1968) and reducing sugar (Benedict’s test) (DAVIS,
1963). The bulk density of FSG was determined using the method of NARAYANA and
NARASINGA (1982). A calibrated tube was weighed and filled with a sample to 5ml by
constant tapping until there was no further change in volume. Bulk density was then
calculated as the weight determined by difference per unit volume of the sample. Solubility of
FSG was also determined using cold water (10–15°C) (TORIO et al., 2006).
Inocula preparation
The sampling of inocula (caecal content) was made in the morning in the laboratory of the
Higher School of Agriculture of Mateur. Two New Zealand adult rabbits were fasted the night
before the slaughter but water was available as usually made for all the species before
slaughter. Once the whole gastro-intestinal tract had been isolated, caecal contents were
collected, mixed and stirred for few minutes. Finally, 100ml of the mixture were
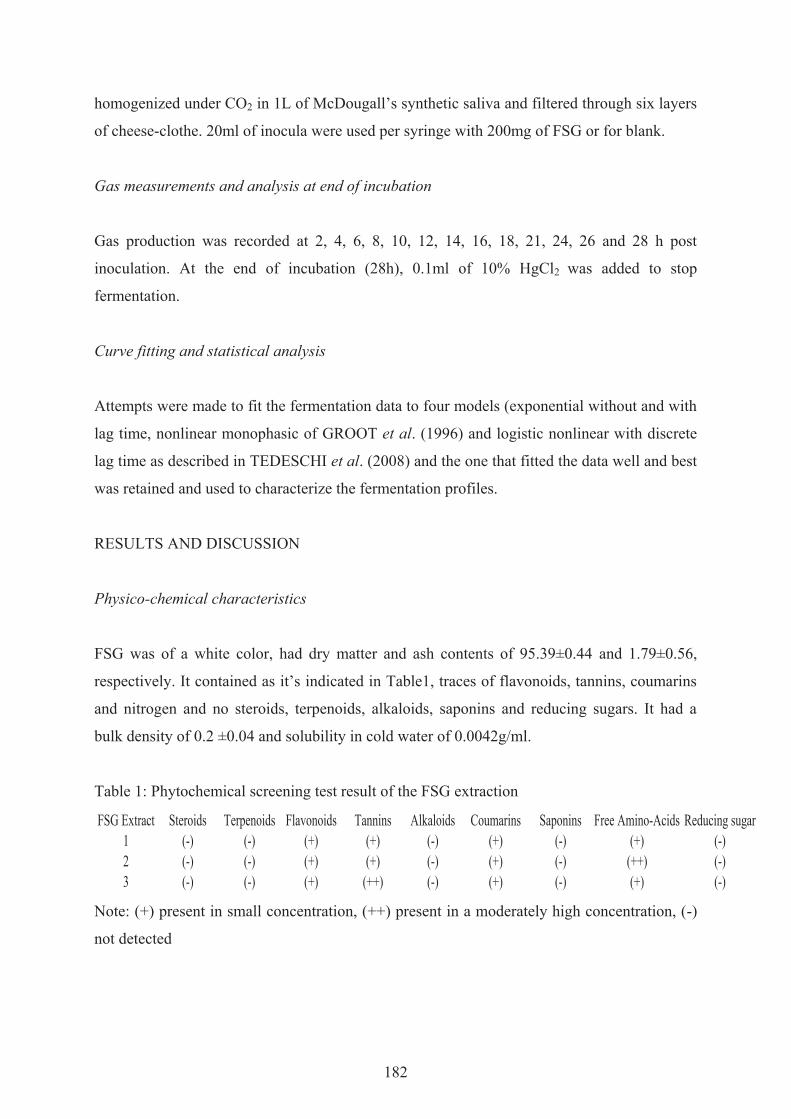
182
homogenized under CO2 in 1L of McDougall’s synthetic saliva and filtered through six layers
of cheese-clothe. 20ml of inocula were used per syringe with 200mg of FSG or for blank.
Gas measurements and analysis at end of incubation
Gas production was recorded at 2, 4, 6, 8, 10, 12, 14, 16, 18, 21, 24, 26 and 28 h post
inoculation. At the end of incubation (28h), 0.1ml of 10% HgCl2 was added to stop
fermentation.
Curve fitting and statistical analysis
Attempts were made to fit the fermentation data to four models (exponential without and with
lag time, nonlinear monophasic of GROOT et al. (1996) and logistic nonlinear with discrete
lag time as described in TEDESCHI et al. (2008) and the one that fitted the data well and best
was retained and used to characterize the fermentation profiles.
RESULTS AND DISCUSSION
Physico-chemical characteristics
FSG was of a white color, had dry matter and ash contents of 95.39±0.44 and 1.79±0.56,
respectively. It contained as it’s indicated in Table1, traces of flavonoids, tannins, coumarins
and nitrogen and no steroids, terpenoids, alkaloids, saponins and reducing sugars. It had a
bulk density of 0.2 ±0.04 and solubility in cold water of 0.0042g/ml.
Table 1: Phytochemical screening test result of the FSG extraction
FSG Extract Steroids Terpenoids Flavonoids Tannins Alkaloids Coumarins Saponins Free Amino-Acids Reducing sugar1 (-) (-) (+) (+) (-) (+) (-) (+) (-)2 (-) (-) (+) (+) (-) (+) (-) (++) (-)3 (-) (-) (+) (++) (-) (+) (-) (+) (-)
Note: (+) present in small concentration, (++) present in a moderately high concentration, (-)
not detected
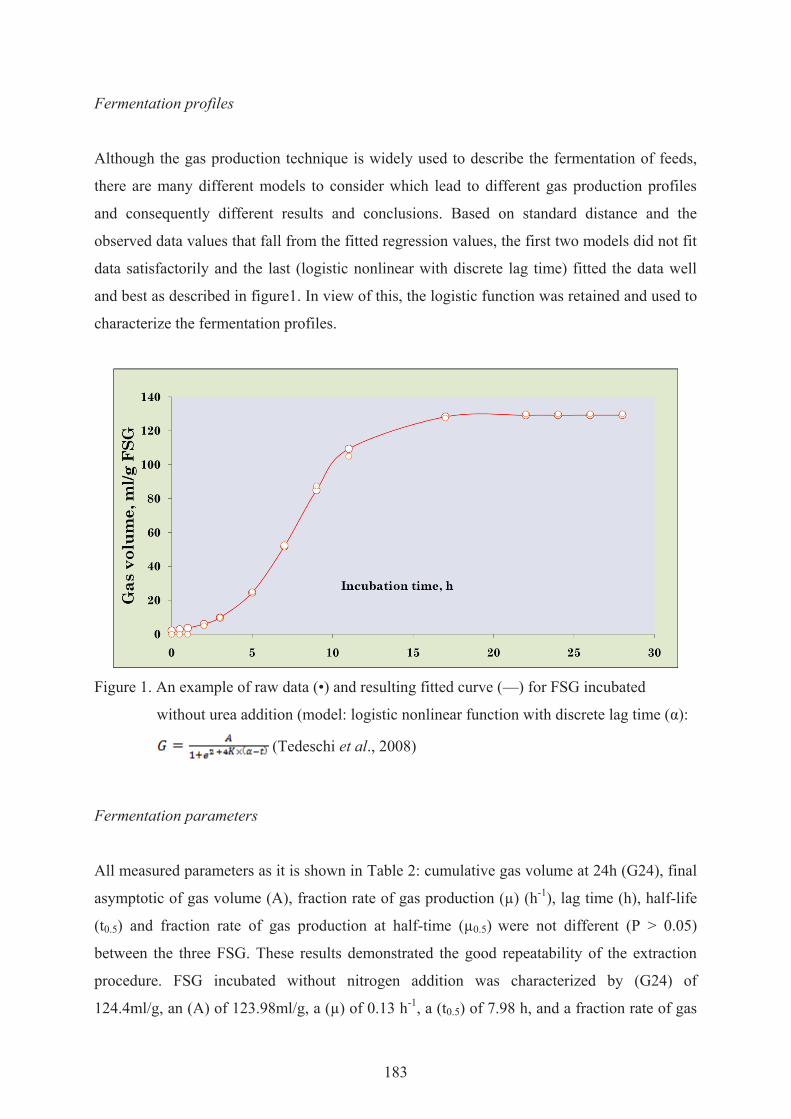
183
Fermentation profiles
Although the gas production technique is widely used to describe the fermentation of feeds,
there are many different models to consider which lead to different gas production profiles
and consequently different results and conclusions. Based on standard distance and the
observed data values that fall from the fitted regression values, the first two models did not fit
data satisfactorily and the last (logistic nonlinear with discrete lag time) fitted the data well
and best as described in figure1. In view of this, the logistic function was retained and used to
characterize the fermentation profiles.
Figure 1. An example of raw data (•) and resulting fitted curve (—) for FSG incubated
without urea addition (model: logistic nonlinear function with discrete lag time (α):
(Tedeschi et al., 2008)
Fermentation parameters
All measured parameters as it is shown in Table 2: cumulative gas volume at 24h (G24), final
asymptotic of gas volume (A), fraction rate of gas production (µ) (h-1), lag time (h), half-life
(t0.5) and fraction rate of gas production at half-time (µ0.5) were not different (P > 0.05)
between the three FSG. These results demonstrated the good repeatability of the extraction
procedure. FSG incubated without nitrogen addition was characterized by (G24) of
124.4ml/g, an (A) of 123.98ml/g, a (µ) of 0.13 h-1, a (t0.5) of 7.98 h, and a fraction rate of gas
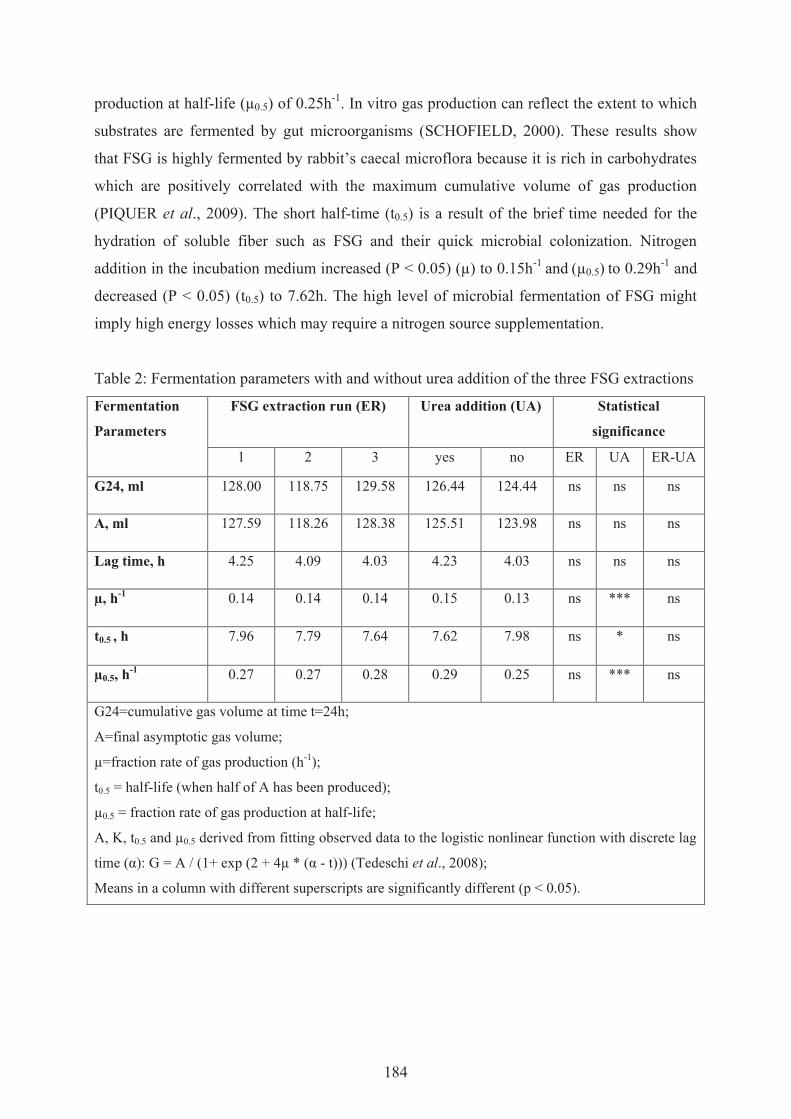
184
production at half-life (µ0.5) of 0.25h-1. In vitro gas production can reflect the extent to which
substrates are fermented by gut microorganisms (SCHOFIELD, 2000). These results show
that FSG is highly fermented by rabbit’s caecal microflora because it is rich in carbohydrates
which are positively correlated with the maximum cumulative volume of gas production
(PIQUER et al., 2009). The short half-time (t0.5) is a result of the brief time needed for the
hydration of soluble fiber such as FSG and their quick microbial colonization. Nitrogen
addition in the incubation medium increased (P < 0.05) (µ) to 0.15h-1 and (µ0.5) to 0.29h-1 and
decreased (P < 0.05) (t0.5) to 7.62h. The high level of microbial fermentation of FSG might
imply high energy losses which may require a nitrogen source supplementation.
Table 2: Fermentation parameters with and without urea addition of the three FSG extractions
Fermentation
Parameters
FSG extraction run (ER) Urea addition (UA) Statistical
significance
1 2 3 yes no ER UA ER-UA
G24, ml 128.00 118.75 129.58 126.44 124.44 ns ns ns
A, ml 127.59 118.26 128.38 125.51 123.98 ns ns ns
Lag time, h 4.25 4.09 4.03 4.23 4.03 ns ns ns
µ, h-1 0.14 0.14 0.14 0.15 0.13 ns *** ns
t0.5 , h 7.96 7.79 7.64 7.62 7.98 ns * ns
µ0.5, h-1 0.27 0.27 0.28 0.29 0.25 ns *** ns
G24=cumulative gas volume at time t=24h;
A=final asymptotic gas volume;
µ=fraction rate of gas production (h-1);
t0.5 = half-life (when half of A has been produced);
µ0.5 = fraction rate of gas production at half-life;
A, K, t0.5 and µ0.5 derived from fitting observed data to the logistic nonlinear function with discrete lag
time (α): G = A / (1+ exp (2 + 4µ * (α - t))) (Tedeschi et al., 2008);
Means in a column with different superscripts are significantly different (p < 0.05).

185
CONCLUSION
FSG satisfy one of the three criteria that characterize a food component as a prebiotic which is
fermentation by intestinal or caecal microflora. However it may be considered as prebiotic if
its resistance to pre-caecal digestion and its beneficial effect on caecal microbial population
are demonstrated.
REFERENCES
AGUILAR, JC.; ROCA, T.; SANZ, E. (1996): Fructo-oligo-saccharides in rabbit diet. Study
of efficiency in suckling and fattening periods. In Proc.: 6th World Rabbit Congress,
Toulouse, France, 73-77
DAVIS, G.R. (1963): Yagoda papers: A permanent record of Benedict’s Test for reducing
sugar. Clin. Chem. Acta 8, 635-636
GIBSON, G.R.; PROBERT, H.M.; VAN LOO, J.A.E.; RASTALL, R.A.; ROBERFROID,
M.B. (2004): Dietary modulation of the human colonic microbiota: updating the concept of
prebiotics. Nutrition Research Reviews 17, 259-275
GROOT, J.C.J.; CONE, J.W.; WILLIAMS, B.A.; DEBERSAQUES, F.M.A.; LANTINGA,
E.A. (1996): Multiphasic analysis of gas production kinetics for in vitro fermentation of
ruminant feeds. Animal Feed Science and Technology 64, 77
HOLMES, E.J. (1968): A ninhydrin histochemical test specific for hair keratin. J. Histochem.
Cytochem. 16 (6),428-432
ISHIHARA, N.; CHU, D.C.; AKACHI, S.; JUJENA, L.R. (2000): Poultry Sci. 79, 689-697
TEDESCHI, L.O.; SCHOFIELD, P.; PELL, A.N. (2008): Determining feed quality for
ruminants using in vitro gas production technique. 2. Evaluating different models to assess
gas production measurements (2008) page 15, in the forth workshop in Modeling in
Ruminant nutrition application of the gas production technique. Juiz de For a, MG Brazil,
Embrapa
MAERTENS, L.; AERTS, J.M.; DE BOEVER, J. (2004): Degradation of dietary
oligofructose and inulin in the gastro-intestinal tract of the rabbit and the effects on caecal
pH and volatile fatty acids. World Rabbit Science, v.12, p.235-246
MAERTENS, L. (1992): Rabbit nutrition and feeding: a review of some recent developments.
Proc. 5th Cong. of World Rabbit Sci. Assoc., 25-30 July, Corvallis, OR, J. Appl. Rabbit
Res. 15, 889-913
186
MOURÃO, J.L.; ALVES, A.; PINHEIRO, V. (2004): Effects of fructooligosaccharides on
performances of growing rabbits. In Proc.:8th World Rabbit Congress, Puebla, México,
915-921
NARAYANA, K.; NARSINGA, R.M.S (1982): Functional properties of raw and heat
processed winged bean Psophocarpus tetragonolobus) flour. J. Food Sci. 42, 534-538
PATTERSON, J.A.; BURKHOLDER, K.M. (2003): Application of prebiotics and probiotics
in poultry production. Poultry Science 82 (4), 627-631
PEETERS, J.E.; MAERTENS, L.; GEEROMS, R. (1992): Influence of
galactooligosaccharides in zootechnical performance, cecal biochemistry and experimental
colibacillosis O103/8+ in weanling rabbits. J. Appl. Rabbit Res. 15, 1129-1136
PERRET, J.P. (1982): Gastric lipolysis in the young rabbit: origin and physiological
importance of the lipase. Journal de Physiologie 78, 221-230
ROBERFROID, M.; GIBSON, G.R.; HOYLES, L. et al. (2010): Prebiotic effects: metabolic
and health benefits. Br. J. Nutr. 104 (Suppl 2), S1-63
ROBERFROID, M. (2007): Prebiotics: The concept revisited. Journal of Nutrition, 137: 830–
837.
AMABYE, T.G.; BEZABH, A.M. (2015): Physicochemical Characterization and
Phytochemical Screening of Jatropha Curcas L. Seed Oil Cultivated in Tigray Ethiopia.
Advances in Biochemistry 3 (3), 35-39
TORIO, M.A.O.; SAEZ, J.; MERCA, F.E. (2006): Physicochemical Characterization of
Galactomannan from Sugar Palm (Arenga saccharifera Labill.) Endosperm at Different
Stages of Nut Maturity. Philippine Journal of Science 135 (1), 19-30
187
Institut für Tierzucht und Haustiergenetik der
Justus-Liebig-Universität Gießen
MAISSILAGE ALS GRUNDFUTTER IN DER KANINCHENMAST
T. Warnck und C. Lang
1. MATERIAL UND METHODEN
Der Fütterungsversuch wurde an der Lehr- und Forschungseinrichtung Oberer Hardthof in
35398 Gießen durchgeführt. Zur Verfügung standen vier Stallungen in einer schattigen Lage.
Der Boden der Stallungen war 159 cm lang und 107 cm tief, die nutzbare Bodenfläche war
vollständig perforiert und mit Plastikspalten einer Spaltenweite von 14 mm ausgelegt. Neben
der nutzbaren Bodenfläche standen den Mastkaninchen auch eine erhöhte Bodenfläche mit
159 cm Länge und 42 m Tiefe zur Verfügung.
Es wurden Zimmermann-Kaninchen (Zika) eingesetzt. Dabei wurden, in 2 Durchgängen mit
jeweils 7 Haltungswochen, insgesamt 100 Mastkaninchen im Alter von ca. 5 Wochen
eingestallt. Pro Fütterungsvariante wurden 2 Gruppen gehalten (1. Durchgang 12 Tiere pro
Gruppe, 2. Durchgang 13 Tiere pro Gruppe). Die ersten beiden Gruppen erhielten ein
pelletiertes Alleinfuttermittel, Wasser und Heu ad libitum. Die dritte und vierte Gruppe erhielt
neben dem pelletierten Alleinfuttermittel und Wasser Maissilage ad libitum. Das pelletierte
Alleinfutter bestand bei beiden Fütterungsvarianten aus zwei Regimen. Zu Beginn wurde
vorbeugend ein pelletiertes Alleinfutter mit Kokzidiostatika gewählt. Die Zusammensetzung
dieses Futtermittels bestand aus Luzernemehl, Weizenkleie, Sonnenblumenextraktionsschrot,
Haferschälkleie, Rapsextraktionsschrot mit Soapstock, Rübenmelasseschnitzel,
Rübenmelasse, Calciumcarbonat, Weizen, pflanzliche Öle und Fette (Palm-, Raps-, Sonnen-,
Olivenöl, Kokosfett), pflanzliche Fettsäuren (Palm-, Raps-, Sonnen-, Olivenöl, Kokosfett),
Natriumchlorid. Nach sieben Tagen wurde dieses Futtermittel mit dem darauffolgenden
188
Alleinfutter verzogen, sodass nach 14 Tagen eine völlige Futterumstellung zu diesem
stattgefunden hatte. Die Zusammensetzung des nun verwendeten Alleinfuttermittels bestand
aus Luzernengrünmehl, Weizenkleie, Gerste, Zuckerrübenmelasseschnitzel, Haferschälkleie,
Sonnenblumenextraktionschrotfutter, Rapsextraktionschrotfutter mit Soapstock,
Zuckerrübenmelasse, Leinextraktionsschrotfutter, Lignozellulose Kieselgurdiamol,
Fettsäuren, Natriumchlorid, Calciumcarbonat.
Als Fütterungsvorrichtung für Heu wurde ein Futtertrog aus Metall für die Geflügelfütterung
verwendet. Dieser war von oben und zur Seite geöffnet, um die Zugangsmöglichkeiten zu
verbessern. Verfüttert wurde die Maissilage in Ferkeltrögen, die sich im Verlauf der beiden
Durchgänge als zuverlässig im verlustarmen Verfüttern der Maissilage herausstellten. Jeden
Tag wurden die verbrauchten Mengen an pelletiertem Alleinfutter, Grundfutter und Wasser
dokumentiert und auf eine zu Beginn des Durchgangs festgelegte Menge aufgefüllt, um diese
am Ende wieder zurückzurechnen. Die Maissilage wurde aus futterhygienischen Gründen
täglich frisch aufgefüllt.
Die Tiere im Mastversuch wurden jede Woche am selben Wochentag gewogen. Neben der
Notierung des Gewichts wurde auch der allgemeine Zustand der Tiere begutachtet.
Nach Ende der Versuchszeit wurde das Ausstallungsgewicht ermittelt. Dann wurden die
Masttiere in Transportboxen aufgeteilt und mittels eines Transporters zum Schlachter
verbracht.
2. ERGEBNISSE UND DISKUSSION
2.1. Futteraufnahme
Wie bereits vermerkt im Teil Material und Methoden wurde als Kraftfutter das pelletierte
Alleinfuttermittel ad libitum in beiden Versuchen angeboten. Der Unterschied lag also
ausschließlich in der Grundfuttervariante. Zunächst widme ich mich der Analyse des
Verbrauchs des pelletierten Alleinfuttermittels. Die Auswirkung der Grundfuttervariante auf
den Pelletverbrauch wird im Folgenden dargestellt (Abb. 1).

189
Abb. 1: Mittlerer Verbrauch an pelletiertem Alleinfuttermittel in beiden Grundfuttervarianten
Der Mittelwert von 144,58 g Pellets pro Tag bei Heuzugabe und 127,75 g Pellets pro Tag bei
der Variante Maissilage ist zudem signifikant unterschiedlich. Die Kaninchen der Gruppe Heu
fraßen durchschnittlich signifikant mehr Pellets als die Gruppe Maissilage (p = 0,005 < 0,05 =
α).
Zur genaueren Untersuchung dieses Ergebnisses möchte ich nun den Verbrauch des
pelletierten Alleinfuttermittels pro Tier und Tag aufgeteilt in die beiden Durchgänge
betrachten (Abb. 2).
Abb. 2: Mittlerer Verbrauch an pelletiertem Alleinfuttermittel in Grundfuttervarianten und
Durchgängen

190
Wie im vorherigen Schaubild ist der Mehrverbrauch der Pellets bei der Variante Gräserheu zu
erkennen. Diese Abbildung zeigt nun darüber hinaus, dass die Kaninchen der Variante Heu
unabhängig vom Durchgang mehr pelletiertes Alleinfuttermittel zu sich nahmen als die Tiere
mit Maissilagezugabe. Die Differenz der Pelletverbräuche nach Varianten hat sich in
Durchgang 2 gegenüber Durchgang 1 sogar noch verstärkt. Des Weiteren kann aus dieser
Aufschlüsselung der Daten entnommen werden, dass es keinen Durchgangseffekt bei der
Fragestellung nach dem Einfluss der Grundfuttermittelvariante auf den Verbrauch an
pelletiertem Alleinfuttermittel gab. Wie schon dargestellt haben in beiden Durchgängen die
mit Heu versorgten Tiere mehr Alleinfuttermittel aufgenommen als die mit Maissilage
versorgten Tiere.
Dieses Ergebnis allein betrachtet deutet finanzielle Vorteile des Grundfutters Maissilage an,
wenn die Gewichtsentwicklung trotz geringeren Verbrauches an pelletiertem Alleinfutter mit
denen der Vergleichsgruppe Gräserheu konkurrieren kann. Dazu näheres im folgenden
Abschnitt.
Nach der Betrachtung der Auswirkung der Grundfutterzugabe auf den Verbrauch an
pelletiertem Alleinfuttermittel möchte ich nun einen genaueren Blick auf die Untersuchung
des Grundfutters selbst richten (Abb. 3).
Abb. 3: Mittlerer Verbrauch an Grundfuttermitteln in beiden Grundfuttervarianten
Neben dem erkennbaren (Mehr-)Verbrauch an Grundfutter in der Gruppe Maissilage ist aber
auch eine deutlich höhere Streuung der dokumentierten täglichen Verbräuche um den
Mittelwert zu erkennen als bei der Vergleichsvariante. Die Differenz von 8,26 g
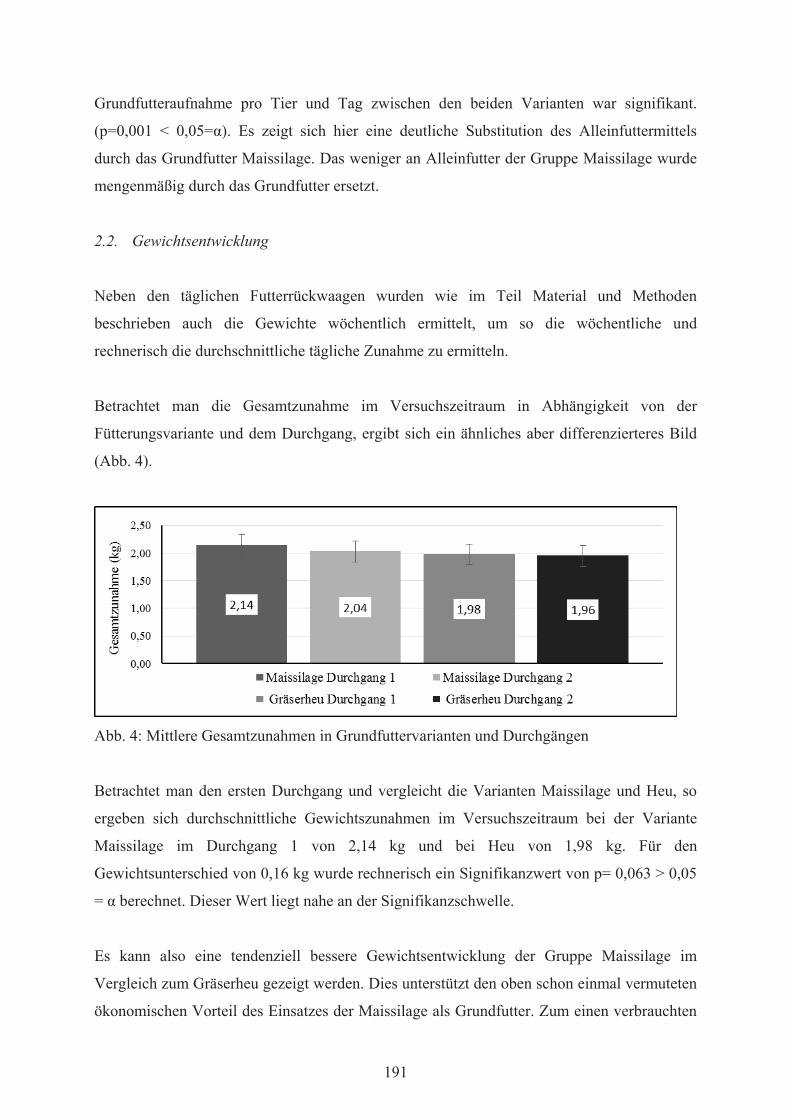
191
Grundfutteraufnahme pro Tier und Tag zwischen den beiden Varianten war signifikant.
(p=0,001 < 0,05=α). Es zeigt sich hier eine deutliche Substitution des Alleinfuttermittels
durch das Grundfutter Maissilage. Das weniger an Alleinfutter der Gruppe Maissilage wurde
mengenmäßig durch das Grundfutter ersetzt.
2.2. Gewichtsentwicklung
Neben den täglichen Futterrückwaagen wurden wie im Teil Material und Methoden
beschrieben auch die Gewichte wöchentlich ermittelt, um so die wöchentliche und
rechnerisch die durchschnittliche tägliche Zunahme zu ermitteln.
Betrachtet man die Gesamtzunahme im Versuchszeitraum in Abhängigkeit von der
Fütterungsvariante und dem Durchgang, ergibt sich ein ähnliches aber differenzierteres Bild
(Abb. 4).
Abb. 4: Mittlere Gesamtzunahmen in Grundfuttervarianten und Durchgängen
Betrachtet man den ersten Durchgang und vergleicht die Varianten Maissilage und Heu, so
ergeben sich durchschnittliche Gewichtszunahmen im Versuchszeitraum bei der Variante
Maissilage im Durchgang 1 von 2,14 kg und bei Heu von 1,98 kg. Für den
Gewichtsunterschied von 0,16 kg wurde rechnerisch ein Signifikanzwert von p= 0,063 > 0,05
= α berechnet. Dieser Wert liegt nahe an der Signifikanzschwelle.
Es kann also eine tendenziell bessere Gewichtsentwicklung der Gruppe Maissilage im
Vergleich zum Gräserheu gezeigt werden. Dies unterstützt den oben schon einmal vermuteten
ökonomischen Vorteil des Einsatzes der Maissilage als Grundfutter. Zum einen verbrauchten
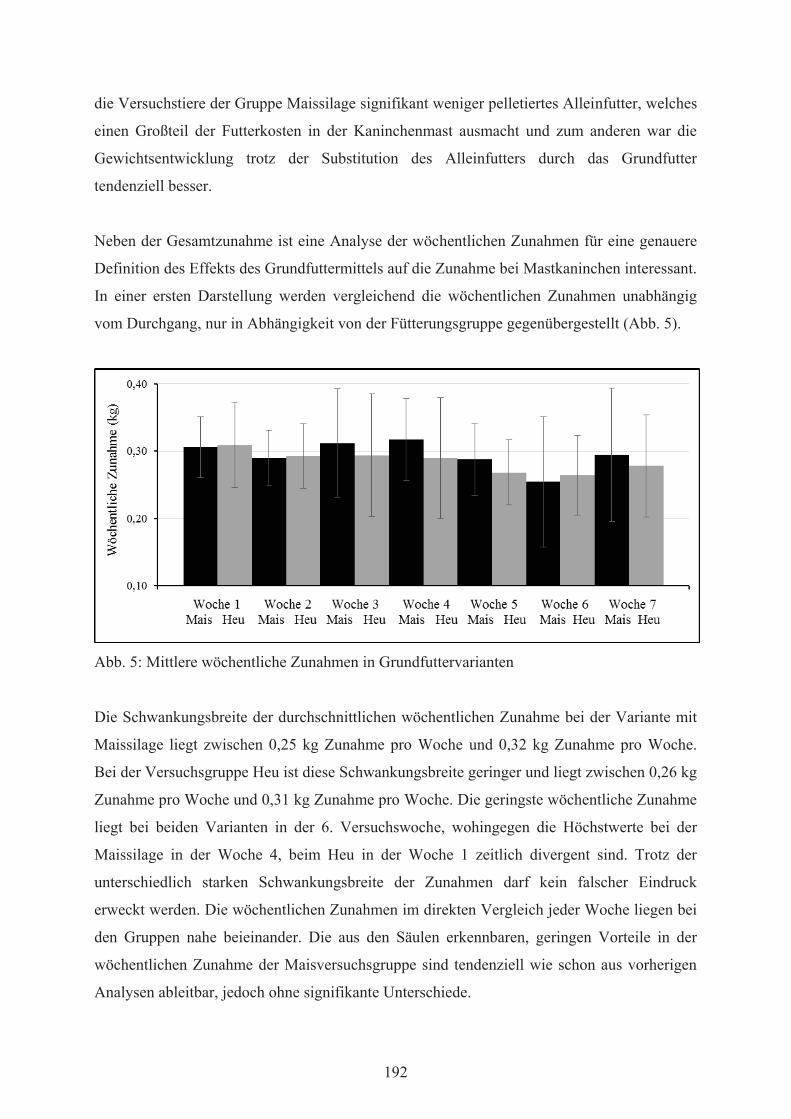
192
die Versuchstiere der Gruppe Maissilage signifikant weniger pelletiertes Alleinfutter, welches
einen Großteil der Futterkosten in der Kaninchenmast ausmacht und zum anderen war die
Gewichtsentwicklung trotz der Substitution des Alleinfutters durch das Grundfutter
tendenziell besser.
Neben der Gesamtzunahme ist eine Analyse der wöchentlichen Zunahmen für eine genauere
Definition des Effekts des Grundfuttermittels auf die Zunahme bei Mastkaninchen interessant.
In einer ersten Darstellung werden vergleichend die wöchentlichen Zunahmen unabhängig
vom Durchgang, nur in Abhängigkeit von der Fütterungsgruppe gegenübergestellt (Abb. 5).
Abb. 5: Mittlere wöchentliche Zunahmen in Grundfuttervarianten
Die Schwankungsbreite der durchschnittlichen wöchentlichen Zunahme bei der Variante mit
Maissilage liegt zwischen 0,25 kg Zunahme pro Woche und 0,32 kg Zunahme pro Woche.
Bei der Versuchsgruppe Heu ist diese Schwankungsbreite geringer und liegt zwischen 0,26 kg
Zunahme pro Woche und 0,31 kg Zunahme pro Woche. Die geringste wöchentliche Zunahme
liegt bei beiden Varianten in der 6. Versuchswoche, wohingegen die Höchstwerte bei der
Maissilage in der Woche 4, beim Heu in der Woche 1 zeitlich divergent sind. Trotz der
unterschiedlich starken Schwankungsbreite der Zunahmen darf kein falscher Eindruck
erweckt werden. Die wöchentlichen Zunahmen im direkten Vergleich jeder Woche liegen bei
den Gruppen nahe beieinander. Die aus den Säulen erkennbaren, geringen Vorteile in der
wöchentlichen Zunahme der Maisversuchsgruppe sind tendenziell wie schon aus vorherigen
Analysen ableitbar, jedoch ohne signifikante Unterschiede.

193
2.3. Futterverwertung
Nach der Darlegung der Futterverbräuche beider Fütterungsvarianten aufgeteilt auf die
jeweiligen Durchgänge in der Aufteilung zwischen pelletiertem Alleinfuttermittel und
verwendete Grundfutter stelle ich zum Abschluss dieses Kapitels die aus diesen Angaben und
den dokumentierten wöchentlichen Zunahmen rechnerisch ermittelten Futterverwertungen
nach Durchgang und der Raufuttervariante getrennt dar (Abb. 6).
Abb. 6: Mittlere Futterverwertung in Grundfuttervarianten und Durchgängen
Ein Blick auf das Diagramm zeigt im ersten Durchgang eine erkennbar bessere
Futterverwertung der Grundfuttervariante Maissilage im Vergleich zum Heu unter denselben
Umweltbedingungen. Die Futterverwertung in den sieben Wochen Durchgangsdauer belief
sich beim Mais auf 1:3,368 und liegt im Vergleich dazu beim Heu mit 1:3,943 erkennbar
niedriger und damit besser.
Der zweite Durchgang liegt im Durchschnitt unter dem ersten Durchgang. Dies wird auch in
der Betrachtung der Futterverwertungen deutlich. Die Gesamtfutterverwertung bei der
Variante Maissilage lag im zweiten Durchgang bei 1:3,739 und beim Heu bei 1:4,148. Auch
hier stellt sich eine bessere Futterverwertung der Maissilage im Vergleich zum Heu dar.
Zudem ist wie im vorherigen Teil schon einmal kurz angedeutet aus dem Diagramm zu
erkennen, dass im Vergleich der beiden Durchgänge für den ersten Durchgang unabhängig
194
von der betrachteten Variante bessere Futterverwertungen errechnet wurden. Somit lieferte
der erste Durchgang bei beiden Varianten ein besseres Ergebnis der Futterverwertung als der
zweite Durchgang.
3. SCHLUSSFOLGERUNG
Kaninchen der Grundfuttervariante Maissilage nahmen signifikant weniger pelletiertes
Alleinfutter und signifikant mehr Grundfutter auf. Dabei war die Gewichtsentwicklung im
Vergleich zum Gräserheu tendenziell besser.
4. ZUSAMMENFASSUNG
In der vorliegenden Ausarbeitung wurde die Möglichkeit des Einsatzes von Maissilage als
Grundfutter in der Kaninchenmast untersucht. Untersuchungsschwerpunkt war dabei in den
zwei Durchgängen mit jeweils sieben Wochen die Futteraufnahme im Vergleich zum
Gräserheu und der Unterschied in der Gewichtsentwicklung der Jungtiere.
Durch angepasste Fütterungstechnik wurde dabei versucht die Verluste an Gräserheu und
Maissilage zu minimieren. Die gleichbleibende Qualität der Maissilage wurde durch täglichen
Austausch der angebotenen Silage in den Stallungen sowie Kühllagerung der Silage für den
jeweils nächsten Tag erreicht.
Beim Vergleich der Futteraufnahme zwischen den Gruppen mit den Grundfuttervarianten
Gräserheu oder Maissilage wurde der Wasserverbrauch, der Verbrauch an pelletiertem
Alleinfutter und dem Grundfutter täglich dokumentiert. Die statistische Auswertung dieser
Aufzeichnungen hat ergeben, dass in Bezug zur Trockenmasse in der Gruppe Maissilage
signifikant mehr Grundfutter verbraucht wurde als im Vergleich zum Gräserheu. Zudem
wurde in der Gruppe Gräserheu in beiden Durchgängen signifikant mehr pelletiertes
Alleinfutter aufgenommen als bei der Gruppe Maissilage. Ein Überblick über die
verbrauchten Wassermengen deutete höhere Verbräuche der Gruppe mit dem Grundfutter
Gräserheu an.
Durch wöchentliche Wiegungen jedes Tieres wurde für jede Gruppe des jeweiligen
Durchgangs die individuelle wöchentliche Gewichtsentwicklung der Tiere ermittelt. Eine
195
statistische Auswertung bezüglich der Gewichtsentwicklung der Gruppen Maissilage und
Gräserheu ergab eine tendenziell bessere Gewichtsentwicklung der Masttiere der
Grundfuttervariante Maissilage. So konnten unter anderem durch den statistisch
nachgewiesenen Durchgangseffekt bezüglich dieses Untersuchungsschwerpunkts keine
belastbareren Zahlen herausgearbeitet werden.
Eine abschließende Beurteilung der Futterverwertung der beiden Grundfuttervarianten ergab
zudem eine in beiden Durchgängen bessere Futterverwertung der Grundfuttervariante
Maissilage. Diese war auch im Vergleich zu Angaben aus der Literatur als niedrig und somit
vorteilhaft im Hinblick auf den Einsatz von Maissilage als Grundfutter in der Kaninchenmast
zu bewerten.
Meine abschließende Beurteilung der Maissilage als Grundfutter für Kaninchen ist durchaus
positiv. Wirtschaftlich gesehen ist eine geringere Aufnahme an pelletiertem Alleinfutter mit
dem Wissen einer trotzdem tendenziell besseren Gewichtsentwicklung der Masttiere mit dem
Grundfutter Maissilage nicht außer Acht zu lassen. Maissilage ist ein lohnenswertes
Grundfutter in der Haltung von Mastkaninchen.
Korrespondenzadresse:
Dr. Caroline Lang
Justus Liebig Universität Gießen
Inst. f. Tierzucht und Haustiergenetik
Abt. f. Tierhaltung und Haltungsbiologie
Leihgesterner Weg 52
35392 Gießen
email: [email protected]
196
1) Professur für Ernährungsphysiologie und Tierernährung, Universität Rostock 2) Professur für Tiergesundheit und Tierschutz, Universität Rostock
FUTTERAUFNAHME VON KANINCHEN UND FUTTERHYGIENESTATUS BEI
VORRATSFÜTTERUNG VON HEU ODER MISCHFUTTER
P. Wolf1) und R. Dibbert2)
1. EINLEITUNG
Da Kaninchen zu den Pflanzenfressern gehören ist in erster Linie Heu Bestandteil vieler
Rationen, um die Bedürfnisse dieser Tiere im Hinblick auf ihre Ernährungsphysiologie zu
erfüllen. Das Heu wird dabei überwiegend in großen Mengen angeboten und verbleibt daher
für viele Tage im Käfig. Allerdings wird diese Fütterungsmethode in jüngster Zeit wiederholt
kontrovers diskutiert. Der am häufigsten angeführte Einwand ist, dass obwohl die Tiere am
ersten Tag vorzugsweise Heu fressen, dieses Futter sowohl in der Praxis als auch in
experimentellen Einrichtungen danach abgelehnt wird und damit auf das Angebot komplett
verzichtet werden könnte. Vor diesem Hintergrund stellt sich die Frage nach der
abnehmenden Akzeptanz des Heus. Ziel der Studie war es, mögliche Veränderungen des
Futtermittels (Geruch, mikrobiologischer Status) während des Angebotes in
Kaninchenkäfigen zu untersuchen.
2. MATERIAL UND METHODEN
Zwergkaninchen (n = 10) wurden während der gesamten Versuchsperiode in Einzelkäfigen
(80 x 100 cm) auf Holzspänen ohne Wechsel der Einstreu gehalten. Ein ad libitum Zugang zu
Wasser erfolgte über Nippeltränken. Die Rationen beinhalteten Heu oder Mischfutter,
welches aus Luzernehäckseln, getrocknetem Gemüse und verschiedenen Getreidearten
zusammengesetzt war. Das Futter wurde in Schalen angeboten, welche in größeren Gefäßen

197
standen, um Futterverluste zu bestimmen. Sowohl Heu als auch Mischfutter wurden entweder
jeden Tag frisch angeboten (Kontrolle) oder verblieben für vier Tage in den Käfigen. Zur
Beurteilung des Futters wurde eine repräsentative Probe zum Zeitpunkt des Angebots und
außerdem nach 12, 24, 48 und 72 h genommen. Die Proben wurden organoleptisch und
mikrobiologisch (herkömmliche Kultivierungsmethoden) untersucht. Eine zu Beginn des
Versuchs genommene Futterprobe (Kontrolle, Ausgangswert) wurde in einem
geruchsneutralen Plastikbehälter an einem kühlen und trockenen Ort gelagert und als
Vergleichsprobe herangezogen.
3. ERGEBNISSE/DISKUSSION
Bei der sensorischen Beurteilung fiel bereits nach 12 h ein unangenehmer Geruch nach
Ammoniak auf. Verblieb das Futter für 72 h in den Käfigen, war die tägliche Aufnahme nach
ungefähr 24 h signifikant reduziert (s. Tabelle 1). Üblicherweise fressen Kaninchen im
Erhaltungsstoffwechsel täglich rund 4 bis 5% der Körpermasse.
Tab. 1: Futter- und Wasseraufnahme von Kaninchen und mikrobiologischer Status von Heu
und Mischfutter während einer 72-stündigen Verfügbarkeit
Stunden 0 12 24 48 72
Futteraufnahme (g TM/100 g Körpergewicht)
Heu 3,98a ± 0,17 3,87a ± 0,20 3,46b ± 0,21 3,03c ± 0,09 2,76d ± 0,12
Mischfutter 5,84a ± 0,28 5,57a ± 0,17 4,93b ± 0,08 4,66c ± 0,17 4,26d ± 0,11
Wasseraufnahme (ml/g Trockenmasse)
Heu 2,37a ± 0,18 2,40a ± 0,11 2,57b ± 0,18 2,89c ± 0,10 3,28d ± 0,14
Mischfutter 1,97a ± 0,12 2,01a ± 0,04 2,17a ± 0,14 2,98b ± 0,21 3,04b ± 0,08
Gehalt an Bakterien (KbE/g) im Futter
Heu 1,0 x 10⁵ 0,15 x 10⁶ 3,5 ± 106 1,0 x 10⁷ 3,5 x 10⁷
Mischfutter 3,0 x 10⁵ 1,0 x 10⁶ 3,5 x 10⁶ 6,5 x 10⁶ 3,5 x 10⁶ abMittelwerte unterscheiden sich signifikant zwischen den Zeitpunkten bei P<0.05.
In Übereinstimmung mit dem Rückgang der Futteraufnahme stieg der Wasserverbrauch der
Tiere an. Nach ungefähr 24 h überschritt die Keimzahl der Bakterien die empfohlenen
Richtwerte. Mikroorganismen auf Futtermitteln verändern und verbrauchen Substrat,

198
produzieren verschiedene Substanzen und hinterlassen Reststoffe (evtl. erst bei ihrem Zerfall).
Ihre vielfältigen Potenzen reichen von der Wasser- und CO2-Bildung über die Desaminierung
und Decarboxylierung bis hin zur Abgabe von spezifischen Enzymen (z.B. Thiaminasen) oder
von Toxinen (Endo- und Exotoxine). Mit der Aktivität von Mikroorganismen sind nicht selten
Veränderungen in der Konsistenz sowie geruchlichen und geschmacklichen Qualität des
Futters verbunden, die häufig schon bei einer intensiveren sensorischen Prüfung des Futters
erkennbar werden. Bei einer stärkeren mikrobiellen Belastung des Futters sind auch
Auswirkungen am Tier bzw. nachteilige Effekte auf die Gesundheit und Leistung möglich
(BAUER und HÖRMANNSDORFER, 2000; BAUER et al., 2000). Diese reichen von einer
nur leicht eingeschränkten Futteraufnahme über Störungen in der Magen-Darm-Flora
(insbesondere im cranialen Verdauungstrakt) bis zu Infektionen (bestimmte Bakterien und
Pilze), Intoxikationen (biogene Amine, bestimmte Myko-, Endo- und Ektotoxine) oder auch
zu Allergien (allergisierende Potenz von Bestandteilen der Vorratsschädlinge, Pilze).
Erwähnung verdient hierbei, dass sich die Exposition eben nicht nur auf den Magen-Darm-
Trakt beschränkt, sondern auch den Atmungstrakt oder die Haut betreffen kann (BAUER,
1982). Letzteres betrifft evtl. auch den Menschen, der mit derart belasteten Futtermitteln
umgeht und die Tiere füttert und betreut, d.h. sich in der Nähe aufhält und damit ebenfalls
exponiert ist (RADE und KAMPHUES, 1999).
Das Angebot eines einwandfreien Heus in ausreichenden Mengen ist in vielerlei Hinsicht von
Bedeutung. Argumente, die für ein ausreichendes Angebot an Heu sprechen sind zunächst die
Anforderungen des Tierschutzgesetzes (Forderung nach art- und bedarfsgerechter
Ernährung), wobei Kaninchen eben zu den herbivoren Spezies zählen. Daneben sind diese
Kaninchen, deren Zähne lebenslang wachsen, aber auch auf eine ausreichend lange
Beschäftigung mit der Futteraufnahme angewiesen, damit sich die Zähne bei der
Futteraufnahme aneinander abreiben. Während bei Angebot von Heu durchschnittlich 12
Minuten pro Gramm Futter benötigt werden, beträgt der Zeitaufwand bei Angebot von
Mischfutter lediglich 1,5 bis 5,0 Minuten pro Gramm Futter (WENGER, 1997; SCHRÖDER,
2000). Folgen könnten möglicherweise Langeweile und Verhaltensstörungen sein. In
Ermangelung einer ausreichenden Faserversorgung werden die Tiere zudem bemüht sein,
alternative Faserquellen auszunehmen. Nicht selten kann es dann auch zum Fellfressen mit
der Folge von Trichobezoaren kommen.

199
Auch im Hinblick auf das Auftreten einer Adipositas ist Heu von besonderer Bedeutung, da
es zu einer „Verdünnung der Energiedichte“ in der Ration führt. Schließlich sichert ein
ausreichendes Raufutterangebot aber auch den Ablauf physiologischer Verdauungsprozesse
(Chymuspassage aus dem Magen, Separationsprozesse bzw. Bildung flüchtiger Fettsäuren im
Bereich des Dickdarms) und beugt somit auch Verdauungsstörungen vor.
Frisst das Kaninchen hingegen zu wenig Rohfaser, so wird es in Ermangelung der
Faserversorgung nach Alternativen suchen. Eine mögliche Folge wäre das Fellfressen,
welches unweigerlich zu Trichobezoaren führen würde (BEYNEN et al., 1992).
Neben der Lagerungsdauer sind auch die Lagerungsbedingungen von Bedeutung
(REICHMUTH und KROOS, 2006). Bei einer Aufbewahrung des Futters in der Wohnung
kommen häufig die für einen Verderb entscheidenden Faktoren wie Feuchte (z.B.
Kondenswasserbildung bei Lagerung in Kunststoffverpackungen), Integrität (z.B. Eröffnen
von Samen und Saaten durch den Prozess des Quetschens/Walzens) oder Zeit
(Generationsintervall der beteiligten Organismen) zum Tragen. Da zudem auch eine
Substratverfügbarkeit (höhere Anteile an stärkereichen Komponenten) gegeben ist, kann es
hier neben einem pilzbedingten Verderb durchaus auch zu einem Besatz mit aeroben
Bakterien kommen. Fraglich bleibt allerdings, ob die bei den Kaninchen beobachteten
Indigestionen dann auch tatsächlich durch den Keimgehalt oder die Menge des
aufgenommenen Kraftfutters (hohe Gehalte an Kohlenhydraten, unzureichender
Rohfasergehalt für ungestörte verdauungsphysiologische Prozesse) verursacht werden
(WOLF und KAMPHUES, 1995).
4. SCHLUSSFOLGERUNGEN
Die sensorische Prüfung von Futtermitteln für Kleinsäuger liefert erste wichtige
Informationen für die hygienische Beschaffenheit eines Futtermittels. Weitere Informationen
bietet der Trockensubstanz-Gehalt, der neben der Temperatur, der Substratverfügbarkeit und
dem Generationsintervall den wichtigsten Faktor zur Einleitung eines mikrobiellen Verderbs
darstellt. Dieser ist ein dynamischer Prozess, der in erster Linie durch die Milieubedingungen
(Feuchtegehalt, Temperatur, Lagerdauer) bestimmt wird. Schimmelpilze benötigen zum
Wachstum nur wenig Feuchte, so dass eine optimierte Lagerung (kühl und trocken) die beste
Präventivmaßnahme zur Vermeidung eines Schimmelpilzwachstums darstellt.

200
Hinzu kommen Faktoren wie beispielsweise die Integrität eines Futtermittels (z.B. durch
Vorratsschädlinge eröffnetes Korn) oder auch die Zeit (z.B. Dauer der Lagerung,
Generationsintervall beteiligter Organismen), welche maßgeblich Einfluss auf den Verlauf
eines Verderbs haben (KAMPHUES, 2007). Dieser hängt zudem auch von der
Ausgangsbelastung des Futtermittels mit Vorratsschädlingen sowie Keimen (Bakterien, Pilze,
Hefen) ab.
Neben dem mikrobiologischen Verderb ist aber anzunehmen, dass vielfach auch der
Fütterungstechnik (abrupte Futterwechsel, unzureichende Frequenz des Futterwechsels,
unzureichendes Angebot an Raufutter) am Vorkommen nutritiv bedingter Störungen
ätiologische Bedeutung zukommt.
5. ZUSAMMENFASSUNG
Die Merkmale eines mehrtägigen Futterangebotes werden durch viele Faktoren beeinflusst.
Trotz größtmöglichem Abstand zum Bereich des Kotabsatzes hatte das Futter
Ammoniakgeruch absorbiert. Des Weiteren nahm die Bakterienkeimzahl vermutlich aufgrund
einer Kontamination mit Speichel usw. zu. Die Folge dieser Veränderungen ist eine reduzierte
Futteraufnahme, die Kaninchen mit einer höheren Wasseraufnahme zu kompensieren
versuchen.
6. SUMMARY
The properties of multi-day offered feed are influenced by many factors. Despite its position
is in utmost distance to the defecation area the feed absorbed ammonial odour. In addition, the
number of bacteria increased, suggesting a contamination with saliva a.s.o. A decreased feed
intake is the result of these changes, which rabbits try to compensate with a higher water
intake.
7. SCHRIFTTUM
BAUER, J. (1982): Mykotoxikosen in der tierischen Produktion – Bedeutung und Diagnose
(eine Übersicht). Berl. Münch. Tierärztl. Wschr. 95, 301-307

201
BAUER, J.; HÖRMANNSDORFER, S. (2000): Bakterien in Futtermitteln, Potenzielle
Schadorganismen und Stoffe in Futtermitteln sowie in tierischen Fäkalien,
Sachstandsbericht, Mitteilung 4, DFG, Wiley-VCH, Weinheim, 56-164
BAUER, J.; SCHNEWEISS, I.; HÖRMANNSDORFER, S. (2000): Pilze und deren
Stoffwechselprodukte in Futtermitteln. Potenzielle Schadorganismen und Stoffe in
Futtermitteln sowie in tierischen Fäkalien, Sachstandsbericht, Mitteilung 4, DFG, Wiley-
VCH, Weinheim, 165-217
BEYNEN, A.C.; MULDER, A.; NIEUWENKAMP, A.E.; VAN DER PALEN, J.G.P.; VAN
ROOIJEN, G.H. (1992): Loose gras hay as a supplement to a pelleted diet reduces fur
chewing in rabbits. J. Anim. Physiol. Anim. Nutr. 68, 226-234
KAMPHUES, J. (2007): Futtermittelhygiene: Charakterisierung, Einflüsse und Bedeutung.
Landbauforschung Völkenrode, 306, 41-55
RADE, C.; KAMPHUES, J. (1999): Zur Bedeutung von Futter und Fütterung für die
Gesundheit des Atmungstraktes von Tieren sowie von Menschen in der Tierbetreuung.
Übers. Tierernährg. 27, 65-121
REICHMUTH, C.; KROOS, G. (2006): Vorratsschutz und LM-Qualität. Forschungsreport, 2,
24-26
WOLF, P.; KAMPHUES, J. (1995): Probleme der art- und bedarfsgerechten Ernährung
kleiner Nager als Heimtiere. Der praktische Tierarzt 12, 1088-1092
Anschrift der Verfasser:
Professur für Ernährungsphysiologie und Tierernährung
Universität Rostock
Justus-von-Liebig-Weg 6b
18059 Rostock

202
Professur für Ernährungsphysiologie und Tierernährung, Universität Rostock
DATEN ZUR WASSERAUFNAHME VON MASTKANINCHEN
P. Wolf
1. EINLEITUNG
Angaben zum Wasserbedarf von Mastkaninchen sind in der Literatur relativ selten, für den
Halter wie auch den Tierarzt aber durchaus von Bedeutung (z.B. wenn über das Tränkwasser
Vitamine oder Zusätze im Rahmen einer therapeutischen Behandlung zu applizieren sind). Da
die Wasseraufnahme eng mit der Futteraufnahme korreliert, stellt die Wasser : Futter –
Relation eine sinnvolle und praktikable Angabe dar. Die jeweils realisierten
Wasseraufnahmen werden durch verschiedene Faktoren wie Umgebungstemperaturen, die
Aufnahme renal zu eliminierender Substanzen (z.B. Calcium), aber auch durch die
Tränketechnik beeinflusst. Mitunter spiegeln sich auch Verhaltensauffälligkeiten in einem
Anstieg des Wasserkonsums wider, wenn beispielsweise die Wasseraufnahme als
Ersatzhandlung bei einer schlechten Akzeptanz des Futters bzw. einer fehlenden
Beschäftigung des Tieres dient. Nicht zuletzt aus tierschutzrelevanten Gründen ist eine
ausreichende und jederzeit verfügbare Wasserversorgung von Kleinsäugern unabdingbar.
Praktisch erfolgt die Wasseraufnahme von Kleinsäugern nur über das Tränkwasser und das
Futter. Letzteres zeigt mitunter größere Variationen im Trockensubstanzgehalt („trockene“
Futtermittel wie kommerzielle Mischfutter enthalten durchschnittlich nur 10% Wasser,
während beispielsweise frische Grünfutter wie Möhren oder Gras mitunter bis zu 80 – 90%
Wasser enthalten). Um die Wasserversorgung der Tiere beurteilen zu können ist es daher
wichtig, nicht nur die Aufnahme über das separate Wasserangebot zu erfassen, sondern auch
die Anteile der verschiedenen Futtermittel an der Gesamtration zu berücksichtigen.

203
2. MATERIAL UND METHODEN
Die Untersuchungen wurden mit Separatorkaninchen (n = 10; Körpermassen 3,0 – 3,7 kg)
durchgeführt, die während der gesamten Versuchsperiode in Einzelkäfigen (80 x 100 cm) auf
Holzspänen saßen. Die Tiere erhielten das Wasser (kommunales Netz) über Nippeltränken
bzw. offene Schalen. Um die tatsächliche Wasseraufnahme und nicht den Wasserverbrauch zu
erfassen, befanden sich unter den Nippeltränken bzw. Wasserschalen etwas größere Schalen,
die mit einem feinen Drahtgeflecht abgedeckt waren. Ein Trinkgefäß befand sich zur
Erfassung von möglichen Verdunstungsverlusten jeweils außerhalb des Käfigs. Die Rationen
beinhalteten ein pelletiertes Mischfutter (MF; s. Tabelle 1) sowie die Kombination von
Misch- und Saftfutter (SF) mit wie auch ohne separatem Wasserangebot. Die Futter wurden
jeweils ad libitum angeboten.
Tab. 1: Chemische Zusammensetzung von Saft- und Mischfutter
TM Ra Rp Rfe Rfa NfE Ca P Mg Na K
Futter Angaben in g/kg Trockenmasse
SF 327 40,2 117 6,87 304 532 6,87 4,12 1,56 1,34 23,6
MF 879 77,7 160 18,7 142 602 10,3 5,04 2,23 2,20 14,1
TM=Trockenmasse, Ra=Rohasche, Rp=Rohprotein, Rfe=Rohfett, Rfa=Rohfaser
Die Tiere wurden bei 18 °C gehalten, das Lichtregime betrug 14:10 (Hell-/Dunkelphase).
Die Wassergefäße wurden täglich bei der Rückwaage des noch verbliebenen Wassers vor
Einwaage des neuen Tränkwassers gereinigt. Um die Wasseraufnahme von unterschiedlich
schweren Kaninchen vergleichen zu können, wurden die Daten in ml/kg Körpermasse
angegeben. Bei der Aufzucht der Kaninchen war darauf geachtet worden, dass diese sowohl
Nippeltränken wie auch Wasserschalen zur Verfügung hatten.
3. ERGEBNISSE/DISKUSSION
3.1. Wasseraufnahme der Kaninchen
Allgemein nahmen die Kaninchen über die Nippeltränken im Vergleich zu den offenen
Schalen mehr Wasser auf (Tabelle 2).

204
Tab. 2: Wasseraufnahme von Mastkaninchen als Folge von Futterart und Tränketechnik
ml/kg KM/Tag
Wasseraufnahme
Mischfutter (MF)
+ Wasser
MF + Wasser
+ Saftfutter
MF + Saftfutter
kein Wasser
über Nippel Schale Nippel Schale
Tränke 60,3 ± 19,8a 57,6 ± 11,3a 3,41 ± 2,89b 1,64 ± 1,12b ---
Futter 2,25 ± 0,47a 145 ± 11,6b 128 ± 27,8b
gesamt 62,6 ± 12,4a 59,9 ± 12,1a 149 ± 12,7b 147 ± 11,9b 128 ± 27,8b
KM = Körpermasse; abMittelwerte unterscheiden sich signifikant zwischen den Rationen bei
P<0,05.
Das mag zum einen daran liegen, dass die Kaninchen auf Holzspänen gehalten wurden.
Obwohl die Wassernäpfe leicht erhöht standen, fanden sich doch immer wieder in
unterschiedlichem Umfang Holzspäne im Wasser. Eine mögliche Prägung während der
Jungtierphase scheidet hingegen aus, da während der Aufzucht sowohl Nippeltränken wie
auch Wasserschalen angeboten wurden.
Bedingt durch das parallele Angebot von Saftfutter zu einem üblichen Mischfutter für
Kaninchen (auf der Basis nativer Komponenten) stieg die Gesamtwasseraufnahme signifikant
an (s. Tabelle 2). Trotz der forcierten Wasseraufnahme über das Saftfutter nahmen die Tiere
aber dennoch Wasser über die Tränke auf. Bei einem Verzicht auf ein zusätzliches
Tränkwasserangebot geht nicht nur die Gesamtwasseraufnahme, sondern auch die
Futteraufnahme zurück.
Die Wasseraufnahme der Kleinsäuger wird durch eine Vielzahl an Faktoren beeinflusst, zu
denen beispielsweise u.a. die Art des Futterangebotes, die Haltungsbedingungen bzw.
Umgebungstemperaturen, aber auch speziesbedingte Einflüsse gehören (XU, 1996;
KAMPHUES, 2000).
Ein Luxuskonsum ist relativ selten. Mitunter kann es jedoch bei Verhaltensstörungen zu einer
forcierten Wasseraufnahme kommen. Hierbei handelt es sich um Übersprungshandlungen
oder Ersatzhandlungen bei Einzeltierhaltung oder bei zu geringer Futteraufnahme bzw.
Beschäftigung mit dem Futterverzehr (COENEN, 1999; SCHRÖDER, 2000). So beißen
Meerschweinchen von einem angebotenen Futter lediglich ab, ohne es – wie beispielsweise
Kaninchen – mit den Vorderfüßen zu fixieren. Wird nun ein Futter angeboten, von dem die

205
Tiere aufgrund der Konfektionierung nicht ohne weiteres abbeißen können, so reduziert sich
einerseits die Trockensubstanzaufnahme (KAMPHUES et al., 2001), kompensatorisch nimmt
die Wasseraufnahme zu, dass heißt der Wasserverzehr stellt eine Art Ersatzhandlung dar
(KAMPHUES, 2000, 2001). Ähnlich reagieren kleine Nager auf ein mangelhaftes Angebot
benagbarer Komponenten mit einer forcierten Wasseraufnahme (WOLF et al., 1999), die
durch Angebot von Rauhfutter bzw. von benagbaren Hölzern wieder reduziert werden kann
(POTTER und BORKOWSKI, 1998).
Mitunter ist aber auch die so genannte „Einverleibungsarbeit“ von Interesse (HÖRNICKE,
1978; GROBNER et al., 1985); hierdurch bedingt lassen sich die z.T. deutlichen Unterschiede
in der Wasseraufnahme einzelner Kaninchenrassen erklären. So müssen Zwergkaninchen im
Vergleich zu Neuseeländern aufgrund ihres kleineren Kopfschädels das Futter intensiver
zermahlen, um es abschlucken zu können. Begleitet von dieser längeren Dauer für die
Futteraufnahme nehmen sie parallel auch vergleichsweise mehr an Wasser auf
(ZUMBROCK, 2002).
Die Wasseraufnahme steigt aber auch bei rohfaserreichen Rationen; so besteht eine straffe
Korrelation zwischen der Gesamtwasseraufnahme und dem Rohfasergehalt des Futters (DE
BLAS et al., 1986; TAU, 1992); somit sind die bei Rauhfuttergaben aufgenommenen
Wassermengen höher als bei Angebot von Mischfuttermitteln auf der Basis nativer
Komponenten (WENGER, 1997).
3.2. Wasserabgabe der Kaninchen
Die Aufnahme des Saftfutters führte nicht nur zu einer höheren Wasseraufnahme, sondern
bedingte folglich auch eine höhere Harnmenge (s. Tabelle 3). So führte das Angebot des
Saftfutters zu einer mehr als doppelt so hohen Abgabe mit dem Harn.
Es ist nicht überraschend, dass Veränderungen der Wasseraufnahme mit entsprechenden
Veränderungen der Wasserabgabe einhergehen. Eine regulative Stellgröße ist das
Harnvolumen, d.h. die Harnmenge korreliert mit der Wasseraufnahme. Eine Reduktion der
Harnmenge als Folge einer geringeren Wasseraufnahme führt zu einem Konzentrationsanstieg
harnpflichtiger Substanzen mit dem Risiko der Harnsteinbildung (WOLF und KAMPHUES,
1995). Dieses Geschehen wird durch die Aufnahme bedarfsüberschreitender Calciumgehalte

206
im Futter forciert, so dass die Bildung von Harnsteinen bei Kleinsäugern mit zu den
häufigsten Problemen in der Kleintierpraxis gehört. Möglicherweise kann die infolge geringer
Harnmengen reduzierte Miktionsfrequenz auch zu einer bakteriellen Besiedlung des
Urogenitaltraktes führen (ZENTEK et al., 1996).
Tab. 3: Wasserabgabe von Mastkaninchen als Folge von Futterart und Tränketechnik
ml/kg KM/Tag
Wasseraufnahme
Mischfutter (MF)
+ Wasser
MF + Wasser
+ Saftfutter
MF + Saftfutter
kein Wasser
Wasserabgabe
Harn 39,8 ± 11,8a 91,8 ± 15,1b 85,7 ± 24,1b
Kot 6,50 ± 2,46 5,3 ± 1,1 4,43 ± 2,56
gesamt 46,3 ± 13,7a 97,1 ± 15,3b 90,2 ± 25,7b
KM = Körpermasse; abMittelwerte unterscheiden sich signifikant zwischen den Rationen bei
P<0,05.
Kritisch sind höhere Wasserabgaben aber auch im Hinblick auf die Stallhygiene zu sehen. So
konnte in Untersuchungen zur Fußballengesundheit der Kaninchen gezeigt werden, dass der
entscheidende Faktor für das Auftreten von Läsionen der Fußsohle die Feuchte der Einstreu
ist. Je länger das Tier auf feuchtem Untergrund sitzt – wobei dieser Prozess durch eine
Adipositas und damit eine höhere Gewichtsbelastung der Läufe noch forciert wird (WOLF
und SPEER, 2017).
4. SCHLUSSFOLGERUNG
Unter tierschutzrelevanten Aspekten ist ein ausreichendes und jederzeit verfügbares Angebot
von Tränkwasser unabdingbar. Ein ausschließlicher Ersatz durch Saftfutter ist aufgrund der
erforderlichen Mengen der Saftfutteraufnahme (Problem der Aufnahmekapazität) nicht immer
möglich, auch wenn einige Spezies durchaus größere Flüssigkeitsmengen über diese
Komponente aufnehmen. Dennoch ist bei allen Spezies ein zusätzliches Tränkwasserangebot
zu empfehlen, da bei unbefriedigender Wasserversorgung die Trockensubstanzaufnahme
zurück geht und es zu Risiken einer energetischen Unterversorgung kommen kann.
207
5. ZUSAMMENFASSUNG
Angaben zum Wasserbedarf von Kleinsäugern sind relativ selten. Dabei steigt mit
zunehmender Futteraufnahme auch der Wasserverzehr, so dass die Wasser : Futter – Relation
eine durchaus sinnvolle Angabe darstellt.
Ein ausschließlicher Ersatz durch Saftfutter ist aufgrund der erforderlichen Mengen der
Saftfutteraufnahme (Problem der Aufnahmekapazität) nicht immer möglich, auch wenn einige
Spezies durchaus größere Flüssigkeitsmengen über diese Komponente aufnehmen können.
Dennoch ist bei allen Spezies ein zusätzliches Tränkwasserangebot – auch unter
tierschutzrelevanten Aspekten (TierSchutzG) – vorgeschrieben, da bei unbefriedigender
Wasserversorgung die Trockensubstanzaufnahme zurückgeht und es zu Risiken einer
energetischen Unterversorgung kommen kann.
Daneben sind jedoch verschiedenste Einflussfaktoren wie Umgebungstemperatur oder die
Aufnahme renal zu eliminierender Substanzen (z.B. Calcium) zu berücksichtigen. Zudem
äußern sich Verhaltensauffälligkeiten in Variationen des Wasserkonsums, wenn
beispielsweise die Wasseraufnahme als Ersatzhandlung dient. Nicht zuletzt aus
gesundheitlichen Gründen (Prophylaxe einer Urolithiasis) und tierschutzrelevanten
Konsequenzen ist eine ausreichende und jederzeit verfügbare Wasserversorgung von
Kleinsäugern unabdingbar.
6. SUMMARY
Data on the water requirement in rabbits are seldom. Due to a clear correlation between water
consumption and feed intake it is recommended to use the water : feed-relation. An exclusive
water replacement by offering feeds with a high moisture content is not always possible due
to the necessary amount of this moist feed (limitation due to the dry matter intake capacity)
even if some species are in a position to ingest high fluid amounts caused by these
components. Nevertheless, an additional water offer is prescribed (even due to welfare
aspects). An insufficient water intake caused a reduced dry matter intake and combined a
lower energy supply.

208
Furthermore, different influence factors like the ambient temperature as well as the intake of
substances that must be eliminated via kidneys (for example calcium) have to be considered.
Moreover, behavioural problems lead to variations of the water consumption (water intake as
a form of compensation). Due to consequences concerning animal health (prophylaxis of
urolithiasis) and welfare and to prevent negative effects a sufficient as well as freely
disposable water supply must be ensured.
7. SCHRIFTTUM
COENEN, M. (1999): Zur Wasserversorgung kleiner Heimtiere. In: KAMPHUES, J.; WOLF,
P.; FEHR, M. (Hrsg.): Praxisrelevante Fragen zur Ernährung kleiner Heimtiere (kleine
Nager, Frettchen, Reptilien), Beiträge einer Fortbildungsveranstaltung des Instituts für
Tierernährung und der Klinik für kleine Haustiere, 2. Oktober 1999, Hannover
DE BLAS, J.C.; SANTOMÀ, G.; CARABAÑO, R.; FRAGA, M.J. (1986): Fiber and starch
levels in fattening rabbit diets. J. Anim. Sci. 63, 1897-1904
GROBNER, M.A.; ROBINSON, K.L.; CHEEKE, P.R.; PATTON, N.M. (1985): Utilization
of low and high energy diets by dwarf (Netherland Dwarf), intermediate (Mini Lop, New
Zealand White) and giant (Flemish Giant) breeds of rabbits. J. Appl. Rabbit Res. 8, 12-18
HÖRNICKE, H. (1978): Futteraufnahme beim Kaninchen – Ablauf und Regulation. Übers.
Tierernährg. 6, 91-148
KAMPHUES, J. (2000): Zum Wasserbedarf von Nutz- und Liebhabertieren. Dtsch. Tierärztl.
Wschr. 107, 297-302
KAMPHUES, J. (2001): Die artgerechte Fütterung von Kaninchen in der Heimtierhaltung.
Dtsch. Tierärztl. Wschr. 108, 131-135
POTTER, M.P.; BORKOWSKI, G.L. (1998): Apparent psychogenic polydipsia and
secondary polyuria in laboratory-housed New Zealand White rabbits. Lab. Anim. Sci. 49,
664-667
SCHRÖDER, A. (2000): Vergleichende Untersuchungen zur Futteraufnahme von
Zwergkaninchen, Meerschweinchen und Chinchilla bei Angebot unterschiedlich
konfektionierter Einzel- und Mischfuttermittel. Hannover, Tierärztl. Hochsch., Diss.
TAU, A. (1992): Verdaulichkeit verschiedener Futtermittel beim Meerschweinchen in
Abhängigkeit vom Rohfasergehalt. Diss. med. vet., Hannover
209
WENGER, A. (1997): Vergleichende Untersuchungen zur Aufnahme und Verdaulichkeit
verschiedener rohfaserreicher Rationen und Futtermittel bei Zwergkaninchen,
Meerschweinchen und Chinchilla. Hannover, Tierärztl. Hochsch., Diss.
WOLF, P.; KAMPHUES, J. (1995): Probleme der art- und bedarfsgerechten Ernährung
kleiner Nager als Heimtiere. Prakt. Tierarzt 76, 1088-1092
WOLF, P.; SPEER, R. (2017): Einflüsse verschiedener Einstreumaterialien auf die
Fußballengesundheit bei Kaninchen in der Heimtierhaltung. Tagungsband der 20. Tagung
über Haltung und Krankheiten der Kaninchen, Pelztiere und Heimtiere (im Druck)
WOLF, P.; BUCHER, L.; KAMPHUES, J. (1999): Die Futter-, Energie- und
Wasseraufnahme von Zwergkaninchen unter praxisüblichen Fütterungsbedingungen.
Kleintierprax. 44, 263-280
XU, H.T. (1996): The behaviour of the rabbit. 6th World Rabbit Congress, Toulouse, Vol. 2,
437-440
ZENTEK, J.; MEYER, H.; TAU, A.; ADOLPH, P. (1996): Untersuchungen zur Ernährung
des Meerschweinchens. IV. Wasseraufnahme, Harnmenge und Harnzusammensetzung.
Kleintierprax. 41, 347-356
ZUMBROCK, B. (2002): Untersuchungen zu möglichen Einflüssen der Rasse auf die
Futteraufnahme und -verdaulichkeit, Größe und Füllung des Magen-Darm-Traktes sowie
zur Chymusqualität bei Kaninchen (Deutsche Riesen, Neuseeländer und Zwergkaninchen),
Diss. med. vet., Hannover
Anschrift des Verfassers:
Professur für Ernährungsphysiologie und Tierernährung
Universität Rostock
Justus-von-Liebig-Weg 6b
18059 Rostock

210
1) Professur für Ernährungsphysiologie und Tierernährung, Universität Rostock 2) Institut für Tierproduktion, Universität Sassari, Italien
EINFLUSS EINES AUF ZERKLEINERTEN EICHELN (QUERCUS PUBESCENS)
BASIERENDEN FUTTERS AUF WACHSTUM UND
SCHLACHTKÖRPERPARAMETER VON MASTKANINCHEN
P. Wolf1) und M. Cappai2)
1. EINLEITUNG
Im Mittelmeerraum können freilebende Schweine reife Eicheln direkt vom Boden weg
konsumieren oder erhalten sie eingemischt über das Endmastfutter. In solchen
Futtermischungen dienen die Eicheln als Energiequelle in der extensiven Aufzucht.
Hinsichtlich der chemischen Zusammensetzung bestehen Eicheln in erster Linie aus Stärke
(51-57% in der Trockenmasse) und 4-6% Rohfett. Es gibt viele Studien zum Einsatz von
Eicheln beim Schwein, aber nur wenige bei Wiederkäuern und beim Geflügel. Auch beim
Kaninchen liegen bisher nur wenige Untersuchungen vor, obwohl die Ergebnisse der Studie
von ZAMORA-LOZANO et al. (1985) sehr vielversprechend waren. Durch den Einsatz
ganzer Eicheln (mit Schalen) werden die Qualität und der Hygienestatus auch während einer
Lagerung gewährleistet. Zudem bietet diese Form der Eichelmast ökonomische Vorteile,
zumal das Entfernen der Schalen mit Kosten verbunden wäre. Ein weiterer Vorteil des
Einsatzes von Eicheln besteht in der Produktion besonderer Endprodukte wie beispielsweise
Fleisch vom Ibericoschwein und hier insbesondere der Ibericoschinken. Vor diesem
Hintergrund stellte sich die Frage, ob derartige Effekte auf die Fleischqualität auch bei
Kaninchen möglich wären.

211
2. MATERIAL UND METHODEN
Die Versuche wurden mit 40 frisch abgesetzten Kaninchen (37 Tage alt, Körpermasse 703 ±
22,5 g) durchgeführt. Die Tiere wurden entsprechend Körpermasse und Wurfabstammung auf
zwei Gruppen verteilt. Während der folgenden 6 Wochen erhielten die Tiere ein
kommerzielles Mastfutter (16 % Rohprotein, 14% Rohfaser/kg) ohne bzw. mit 20%
zerkleinerten Eicheln (s. Tabelle 1).
Tab. 1: Chemische Zusammensetzung der Eicheln
Trockenmasse g/kg uS 612 Calcium g/kg TM 1,64
Rohasche g/kg TM 21 g/kg TM 0,97
Rohprotein g/kg TM 57 g/kg TM 0,62
Rohfett* g/kg TM 83 g/kg TM 0,25
Rohfaser g/kg TM 145 mg/kg TM 5,14
NfE g/kg TM 694 mg/kg TM 9,67
Stärke g/kg TM 453 mg/kg TM < 0,01
* Fettsäuremuster (%): 60 Ölsäure, 24 Linolsäure, 14 Palmitinsäure, 1,5 Linolensäure
Der Gehalt an Tannin-Equivalenten (TAE) betrug 51,6 g/kg Trockenmasse.
Durch das Einmischen der Eicheln stieg der Energiegehalt des Futters an, was sich in erster
Linie auf den höheren Stärke- und Fettgehalt der Eicheln (RODRIGUEZ-ESTEVEZ et al.,
2008) zurückführen lässt. Der Proteingehalt im Mischfutter fiel jedoch leicht ab, wobei
insbesondere die Aminosäuren Lysin, Methionin, Cystin und Prolin in der Versuchsgruppe
geringer waren (s. Tabelle 2).
Dies lässt sich auf den niedrigeren Proteingehalt der Eicheln zurückführen, der laut GALVAN
et al. (2011) in einer Größenordnung zwischen 29 und 59 g/kg variiert. Der in dieser Studie
analysierte Proteingehalt von 57 g/kg entspricht dem oberen Bereich, deckt sich zugleich aber
auch mit Werten aus anderen Studien, in denen 59 (NOWAR et al., 1994) bzw. 56 g/kg
(GASMI-BOUBAKER et al., 2007) nachgewiesen wurden.
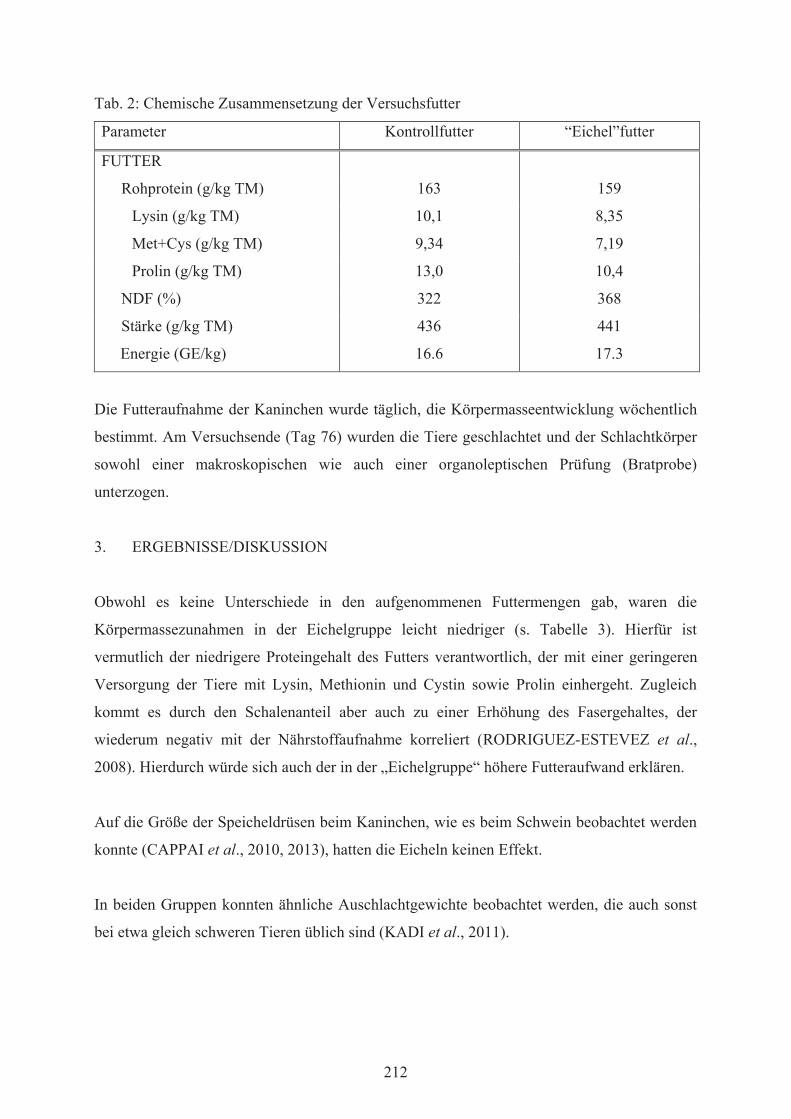
212
Tab. 2: Chemische Zusammensetzung der Versuchsfutter
Parameter Kontrollfutter “Eichel”futter
FUTTER
Rohprotein (g/kg TM) 163 159
Lysin (g/kg TM) 10,1 8,35
Met+Cys (g/kg TM) 9,34 7,19
Prolin (g/kg TM) 13,0 10,4
NDF (%) 322 368
Stärke (g/kg TM) 436 441
Energie (GE/kg) 16.6 17.3
Die Futteraufnahme der Kaninchen wurde täglich, die Körpermasseentwicklung wöchentlich
bestimmt. Am Versuchsende (Tag 76) wurden die Tiere geschlachtet und der Schlachtkörper
sowohl einer makroskopischen wie auch einer organoleptischen Prüfung (Bratprobe)
unterzogen.
3. ERGEBNISSE/DISKUSSION
Obwohl es keine Unterschiede in den aufgenommenen Futtermengen gab, waren die
Körpermassezunahmen in der Eichelgruppe leicht niedriger (s. Tabelle 3). Hierfür ist
vermutlich der niedrigere Proteingehalt des Futters verantwortlich, der mit einer geringeren
Versorgung der Tiere mit Lysin, Methionin und Cystin sowie Prolin einhergeht. Zugleich
kommt es durch den Schalenanteil aber auch zu einer Erhöhung des Fasergehaltes, der
wiederum negativ mit der Nährstoffaufnahme korreliert (RODRIGUEZ-ESTEVEZ et al.,
2008). Hierdurch würde sich auch der in der „Eichelgruppe“ höhere Futteraufwand erklären.
Auf die Größe der Speicheldrüsen beim Kaninchen, wie es beim Schwein beobachtet werden
konnte (CAPPAI et al., 2010, 2013), hatten die Eicheln keinen Effekt.
In beiden Gruppen konnten ähnliche Auschlachtgewichte beobachtet werden, die auch sonst
bei etwa gleich schweren Tieren üblich sind (KADI et al., 2011).
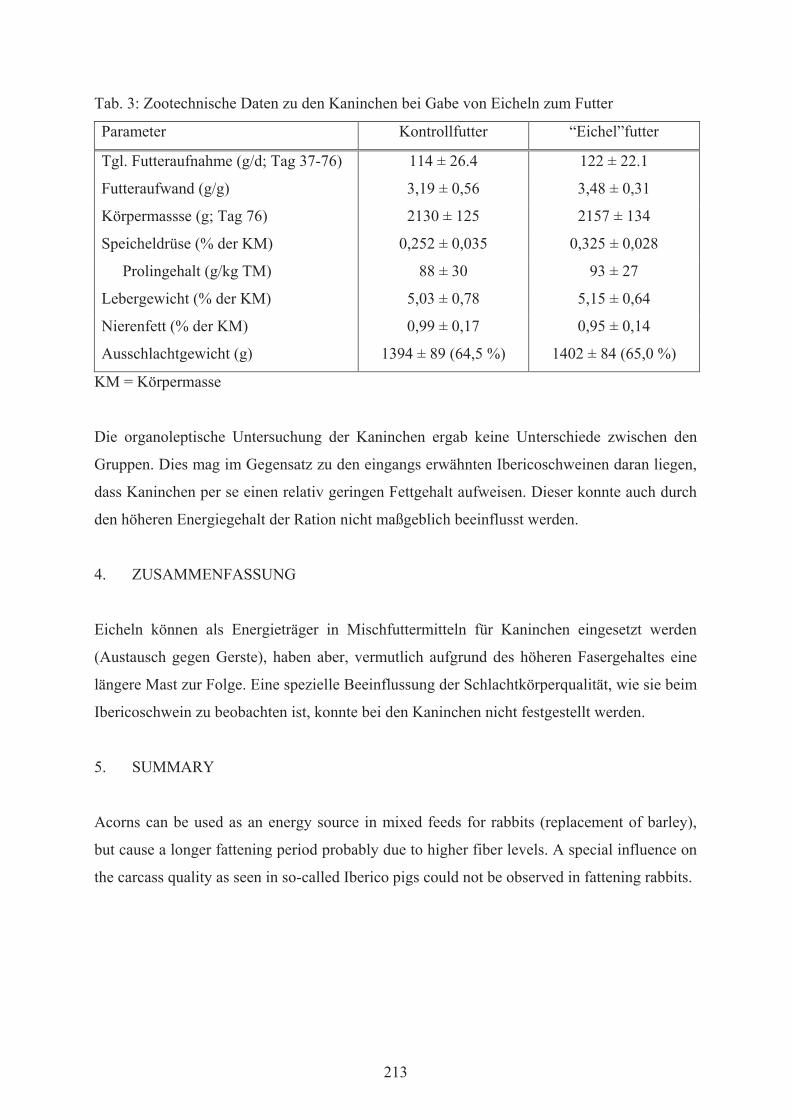
213
Tab. 3: Zootechnische Daten zu den Kaninchen bei Gabe von Eicheln zum Futter
Parameter Kontrollfutter “Eichel”futter
Tgl. Futteraufnahme (g/d; Tag 37-76) 114 ± 26.4 122 ± 22.1
Futteraufwand (g/g) 3,19 ± 0,56 3,48 ± 0,31
Körpermassse (g; Tag 76) 2130 ± 125 2157 ± 134
Speicheldrüse (% der KM) 0,252 ± 0,035 0,325 ± 0,028
Prolingehalt (g/kg TM) 88 ± 30 93 ± 27
Lebergewicht (% der KM) 5,03 ± 0,78 5,15 ± 0,64
Nierenfett (% der KM) 0,99 ± 0,17 0,95 ± 0,14
Ausschlachtgewicht (g) 1394 ± 89 (64,5 %) 1402 ± 84 (65,0 %)
KM = Körpermasse
Die organoleptische Untersuchung der Kaninchen ergab keine Unterschiede zwischen den
Gruppen. Dies mag im Gegensatz zu den eingangs erwähnten Ibericoschweinen daran liegen,
dass Kaninchen per se einen relativ geringen Fettgehalt aufweisen. Dieser konnte auch durch
den höheren Energiegehalt der Ration nicht maßgeblich beeinflusst werden.
4. ZUSAMMENFASSUNG
Eicheln können als Energieträger in Mischfuttermitteln für Kaninchen eingesetzt werden
(Austausch gegen Gerste), haben aber, vermutlich aufgrund des höheren Fasergehaltes eine
längere Mast zur Folge. Eine spezielle Beeinflussung der Schlachtkörperqualität, wie sie beim
Ibericoschwein zu beobachten ist, konnte bei den Kaninchen nicht festgestellt werden.
5. SUMMARY
Acorns can be used as an energy source in mixed feeds for rabbits (replacement of barley),
but cause a longer fattening period probably due to higher fiber levels. A special influence on
the carcass quality as seen in so-called Iberico pigs could not be observed in fattening rabbits.
214
6. SCHRIFTTUM
CAPPAI, M.G.; WOLF, P.; LIESNER, V.G.; KASTNER, A.; NIEDDU, G.; PINNA, W.;
KAMPHUES, J. (2010): Effect of whole acorns (Quercus pubescens) shred based diet on
parotid gland in growing pigs in relation to tannins. Livest. Sci. 134, 183-186
CAPPAI, M.G.; WOLF, P.; RUST, P.; PINNA, W.; KAMPHUES, J. (2013): Raw hulled
shredded acorns from Downy Oak (Quercus pubescens) in the diet of pigs. JAPAN 97(1),
1-5
GALVAN, J.V.; VALLEDOR, L.; MA, R.; CERRILLOC, N.; PELEGRIND, E.G.; JORRIN-
NOVOA, J.V. (2011): Studies of variability in Holm oak (Quercus iles subsp. Ballota)
trough acorn protein profile analysis. J. Proteomics 74, 1244-1255
GASMI-BOUBAKER, A.; ABDULI, H.; LOZADA, M.M.; TAYACHI, L.; MANSOURI, M.;
ZAIDID, I. (2007): Cork oak (Quercus suber L.) acorn as a substitute for barley in the diet of
rabbits; effect on in vivo digestibility, growth and carcass characteristics. J. Anim. Vet. Adv.
6, 1219-1222
KADI, S.A.; BELAIDI-GATER, N.; CHEBAT, F. (2004): Inclusion of crude olive cake in
growing rabbits diet: Effect on growth and slaughter yield. In: 8th World Rabbit
Congress,Puebla, Mexico, Vol. 2, 1202-1207
KADI, S.; GUERMAH, H.; BANNELIER, C.; BERCHICHE, M.; GIDENNE, T. (2011):
Nutritive value of sun-dried Sulla (Hedysarum flexuosum) and its effect on performance and
carcass characteristics of growing rabbits. World Rabbit Sci. 19, 151-159
NOWAR, M.S.; AL-SHAWABKEH, K.; NISSOUR, H. (1994): Evaluation of oak acorn
(Quercus coccifera) as untraditional energy feedstuff for complete substitution of corn
grains in fattening rabbit ration. Cahiers Options Mediterraneennes (CIHEAM)
RODRIGUEZ-ESTEVEZ, V.; GARCIA MARTINEZ, C.; PEREA MUNOZ, J.M.; GOMEZ
CASTRO, A.G. (2008): Measures and nutritional characteristics of Quercus acorns from
the dehesa. Arch. Zootec., 57, 1-12
ZAMORA-LOZANO, M.; SANCHEZ RODRIGUEZ, M.; GELLEGO BARRERA, J.;
MATA MORENO, C.; PEINADO L.E. (1985): Intake of acorn by rabbits kept under
continuous grazing. Arch. Zootec. 34, 257-265

215
Anschrift der Verfasser:
Professur für Ernährungsphysiologie und Tierernährung
Universität Rostock
Justus-von-Liebig-Weg 6b
18059 Rostock