Neurophysiological effects of spinal manipulation - CiteSeerX
Upload
khangminh22Category
view
0download
0
NORTH CAROLINA JOURNAL OF NORTH CAROLINA JOURNAL OF
INTERNATIONAL LAW INTERNATIONAL LAW
Volume 35 Number 1 Article 2
Fall 2009
Deterring Double-Play Manipulation in Financial Crisis: Increasing Deterring Double-Play Manipulation in Financial Crisis: Increasing
Transaction Cost as a Regulatory Tool Transaction Cost as a Regulatory Tool
Lynn Bai
Rujing Meng
Follow this and additional works at: https://scholarship.law.unc.edu/ncilj
Recommended Citation Recommended Citation Lynn Bai & Rujing Meng, Deterring Double-Play Manipulation in Financial Crisis: Increasing Transaction Cost as a Regulatory Tool, 35 N.C. J. INT'L L. 137 (2009). Available at: https://scholarship.law.unc.edu/ncilj/vol35/iss1/2
This Article is brought to you for free and open access by Carolina Law Scholarship Repository. It has been accepted for inclusion in North Carolina Journal of International Law by an authorized editor of Carolina Law Scholarship Repository. For more information, please contact [email protected].

Deterring Double-Play Manipulation in Financial Crisis: Increasing Transaction Deterring Double-Play Manipulation in Financial Crisis: Increasing Transaction Cost as a Regulatory Tool Cost as a Regulatory Tool
Cover Page Footnote Cover Page Footnote International Law; Commercial Law; Law
This article is available in North Carolina Journal of International Law: https://scholarship.law.unc.edu/ncilj/vol35/iss1/2

Deterring "Double-Play" Manipulation in FinancialCrisis: Increasing Transaction Cost
as a Regulatory Tool
Lynn Bait
Rujing Mengf t
I. Introduction .................................................................... 138II. A Double-Play Manipulator's Portfolio Choice Problem. 142
A . The M odel Setup ...................................................... 142B. A Double-Play Manipulator's Optimization of
Term inal U tility ........................................................ 144C. The Effect of Higher Transaction Fee r on the
Manipulator's Optimal Choice of Short Positions . 145III. Empirical Testing for the Impact of Increasing
Transaction Fee on the Volatility, Price and Volume ofthe Index Futures Market ................................................ 147A. Identification of Events ............................................. 147B . V olatility Effect ........................................................ 149C . Price E ffect ............................................................... 153D . V olum e Effect .......................................................... 158
IV . C onclusion ...................................................................... 163Appendix A: Derivation of Key Formulas ................................. 165
tAssistant Professor, University of Cincinnati College of Law, Clifton Avenue &Calhoun Street, Cincinnati, OH 45221. Phone number: (513) 556-0194. E-mail:[email protected].
ttAssistant Professor, School of Economics and Finance, University of Hong Kong.Pokfulam Road, Hong Kong. Phone number: (852) 2859-1048. Email: [email protected] for this research project is provided by the University Research Committee of
University of Hong Kong (Project Number 10206136). We thank Jennifer Lewis andHongjun Wang for excellent research assistance and careful editing. The authors areresponsible for any errors in this paper.

N.C. J. INT'L L. & COM. REG.
I. Introduction
The 2008 worldwide financial crisis entered developingcountries in the form of a currency crisis. The sudden cutback inlending by banks going through a credit crunch heightened thedefault risk of developing countries that relied on foreign debt toprovide short-term financing and to sustain domestic growth. In2008, it was estimated that net private capital inflows to emergingmarkets was US$619 billion, down almost one-third from the 2007level.1 More than US$20 billion flowed out of emerging marketequities in the third quarter of 2008.2 As foreign investors fledemerging markets, they converted assets held in local currenciesinto assets denominated in more "secure" currencies, such as theU.S. Dollar, Euro and Japanese Yen.3 This pullback exacerbatedpressure on local currencies that were already weakened bysoaring inflation as a result of years of over-exuberance inemerging market investment.4 The macro-economic environmentin emerging markets was similar to that of Asian countriesimmediately before the outbreak of the Asian currency crisis just adecade ago. In September and October of 2008, the worldwitnessed massive moves in every major currency, and in somenot so major ones, which economists interpreted as a prelude to anew episode of currency crisis of a severity unmatched by anyprevious crisis.'
I See Capital Flows to Emerging Market Economies, INST. INT'L FIN., Oct. 12,
2008, at 1, http://miha.ef.uni-lj.si/_dokumenti3plus2/191241/EMERGINGMARKETS.pdf.
2 See id. at 3.
3 See, e.g., Mark Landler & Vikas Bajaj, Some Currencies Plunge as Stocks SinkWorldwide, N.Y. TIMES, Oct. 25, 2008, at Al.
4 On November 3, 2008, the Korean Won was 35% weaker against the U.S. Dollarthan the exchange rate at the beginning of 2008. On October 29, 2008, the exchange ratebetween the Euro and the Hungarian Forint reached 1-284 from the rate of 1-230 in lateJuly of 2008. On October 26, 2008, Ukraine currency fell to its historical low against thedollar at 6.01-1. See generally Yahoo! Finance, http://finance.yahoo.com/currency-converter (allowing the conversion of currencies on the given dates).
5 See, e.g., Paul Krugman, The Conscience of a Liberal: The mother of allcurrency crises, N.Y. TIMEs BLOG, http://krugnan.blogs.nytimes.com/2008/10/26/the-mother-of-all-currency-crises (Oct. 26, 2008, 10:37 EST)
(I've been reading reports from Stephen Jen, a former student of mine who'snow the chief currency strategist at Morgan Stanley. He points out that sincethe fall of Lehman, we've been seeing clear signs of currency crises throughout
[Vol. XXXV

DETERRING "DOUBLE-PLAY" MANIPULATION
Some developing countries going through the crisis haveestablished a currency board system,6 whereby the local currencyis pegged to a more stable currency - typically the U.S. Dollar orthe Euro - or a composite of currencies in order to maintain thestability of the local currency.7 One salient feature of the currencyboard is that domestic interest rates adjust automatically topressures on the local currency. In late October 2008, Hungaryraised its base interest rate by 3.0% to 11.5% (the highest increasesince 2003) as a defensive move against speculative attacks on itsplunging Forint.8 On November 28, 2008, Russia's central bankannounced its decision to raise key interest rates to stem furtherdevaluation of the Ruble.9 Interest rate hikes at times of economicrecessions further hinder growth and inflict additional pressure onthe local stock market.10 On the day of their respective interestrate increases, the Hungarian benchmark stock index BUX wasdown 3.4%11 and the Russian 30-Stock Micex Index sank 2.8%.12
This is a perfect setting for manipulators to carry out, on a largescale, a "double-play manipulation" strategy. They attack theweakening local currency and simultaneously park large shortpositions in the equity market, typically by utilizing the leverageeffect of the index futures product, in anticipation of the negative
the world of emerging markets, including Eastern Europe. This time, it's not anAsian crisis or a Latin American crisis, it's a global crisis.).
6 See generally Mart S6rg & Vello Vensel, Development of the Banking System
Under the Estonian Currency Board, 8 INT'L ADVANCES ECON. RES. 35, 35 (2002)(examining countries such as Bulgaria, Estonia, Hong Kong and Argentina that haveestablished currency board systems).
7 See id. at 35-36.
8 See Vidya Ram, Hungary Raises Rates To Defend Currency, FORBES, Oct. 22,2008, 2, available at http://www.forbes.com/2008/10/22/eastern-europe-downturn-markets-econ-cxvr 1 022markets18.html; Zoltan Simon, Hungary Raises Rates,Sacrificing Growth to Protect Currency, BLOOMBERG, Oct. 22, 2008, 6,http://www.bloomberg.com/apps/news?pid-newsarchive&sid=ajzKRzwcQxkY.
9 See Emma O'Brien & Maria Levitov, Ruble Collapse Prompts Russia to RaiseInterest Rates (Update]), BLOOMBERG, Nov. 28, 2008, $ 12,http://www.bloomberg.com/apps/news?pid--newsarchive&sid=aS9UcWrGGfOY.
10 See Jeff Faux, The Next Recession, ECON. POL'Y INST., Mar. 4, 2002, 16-19,http://www.epi.org/publications/entry/webfeaturesviewpoints-next recession.
11 See Simon, supra note 8.12 See Maria Levitov, Russian Central Bank Raises Key Rates to Cap Prices
(Update2), BLOOMBERG, Nov. 28, 2008, 7 14,http://www.bloomberg.com/apps/news?pid-newsarchive&sid=aFLezuUrI6k.
2009]

N.C. J. INT'L L. & COM. REG.
stock market impact of increased interest rates. Double-playmanipulation was believed to have been carried out a decade agoduring the Asian currency crisis and exacerbated the pain forAsian countries going through major corrections in theireconomies. 3
In order to deter such a manipulative scheme, and to alleviatethe pressures that it inflicted on the local currency and the equitymarket, some Asian governments, in particular the Hong KongMonetary Authority, took an unprecedented approach byintervening in both the currency market and the equity market."We wish to send the very clear message to those manipulatingour currency for this purpose that they may stand to lose moneyinstead," said the Chief Executive of the Hong Kong MonetaryAuthority in explaining the motivation of the intervention to theHong Kong public.' 4 During the two-week intervention period(August 14 to August 28, 1998), the Hong Kong governmentbought US$12 billion to US$15 billion (about 15.5% of HongKong's foreign reserves) worth of local stocks and long positionsin the benchmark Hang Seng Index Futures. 5 For the single dayof August 28, 1998, when the August Hang Seng Index Futurescontract was expiring, the government was forced to lay outapproximately US$9 billion.' 6 This action held the Hang SengIndex to a slight drop of 1.2% on a day when markets around theworld plummeted. "7
The high cost of intervention gives rise to the concern andcriticism that equity market intervention is not sustainable andthus lacks credibility in the long run as an effective tool incombating double-play manipulations. "Even with its vast foreignexchange fund - worth roughly $97 billion - most analysts said
13 See Joseph Yam, Why We Intervened, ASIAN WALL ST. J., Aug. 20, 1998, at 6,available at http://www.info.gov.hk/hkma/eng/speeches/speechs/joseph/speech_200898b.htm ("I have no doubt that there has been manipulation of our currency toengineer extreme conditions in the interbank market and high interest rates in order toreap profits from large short positions in stock index futures.").
14 Id.15 See Mark Landler, Hong Kong Shifts Gears, This Time Trying Reverse, N.Y.
TIMES, Sept. 1, 1998, at Cl.16 See G. Bruce Knecht, Hong Kong Intervention Escalates; More Hinted, WALL
ST. J., Aug. 31, 1998, at A8.17 See id.
[Vol. XXXV

DETERRING "DOUBLE-PLAY" MANIPULATION
Hong Kong could not afford a run-and-gun battle with traders formore than a few weeks. And experts are now focusing on howHong Kong officials plan to extricate themselves from thisstandoff," wrote a commentator in the New York Times shortlyafter the Hong Kong intervention. '
In this paper, we seek to address this problem by exploring thefeasibility of increasing temporarily (i.e., during the crisis period)the transaction cost on short positions in the equity market andusing a transaction levy to sustain the continuation of thegovernment's intervention. The selective imposition of highertransaction costs on short positions is justified on the ground thatthose who have inflicted the pain on the financial market arecharged with the responsibility of paying for the consequences.Intervention sustained by the transaction levy also avoids thecriticism that the government squanders its hard-earned tax dollarson stock market gambling. Moreover, the government's financialresources are positively linked to the magnitude of the shortpressures in the market-the larger the short volumes, the biggerthe government's coffer to support its market interventions.
Increasing transaction costs to deter undesirable financialmarket activities was advocated by Nobel Laureate James Tobin(and hence called the "Tobin Tax") in 1978. Professor Tobincalculated that a 0.5% tax (each way) on foreign exchangetransactions would yield more than US$1.5 trillion in annualrevenue and would be a considerable deterrent to personscontemplating a quick round-trip trade to another currency. 19 TheTobin Tax was urged for implementation during the Asianfinancial crisis,2" and is currently a focal point of discussion againas the world's emerging economies are experiencing speculativeattacks on their currencies."
18 Landler, supra note 15, at C8.
19 See James Tobin, A Proposal for International Monetary Reform, 4 E. ECON. J.,
153, 153-59 (1978).20 In 1997, Ignacio Ramonet, the editor-in-chief of the French publication Le
Monde Diplomatique, renewed the debate around the Tobin tax with an editorial titled"Disarming the Markets". Ramonet proposed to create an association for the
introduction of this tax. See Ignacio Ramonet, Disarming the Markets, LE MONDEDIPLOMATIQUE, Dec. 1, 1997, 11, available at http://mondediplo.com/1997/12/leader.
21 See, e.g., Paul Rogers, A World in Flux: Crisis to Agency, OPENDEMOCRACY
NEws ANALYSIS, Oct. 16, 2008, at 4, http://www.opendemocracy.net/node/46530/pdf
2009]

N.C. J. INT'L L. & COM. REG.
An important question associated with extending the TobinTax concept to the stock market is whether such a measure will beeffective in the double-play manipulation setting by forcingmanipulators to reduce short positions in both the currency andstock markets. The answer to this question is not immediatelyapparent given the lack of studies on manipulators' behaviorswhen facing such a regulatory measure. Our paper seeks to fillthis void by setting up an optimal portfolio choice problem fromthe perspective of a double-play manipulator and examining howhis optimal short positions change when he faces interventions andhigher transaction costs.
This paper proceeds in the following order: Section II sets up aportfolio choice model as mentioned above and derives theconditions under which a double-play manipulator reduces shortpositions. Section III empirically tests for the existence of theconditions derived in Section II by studying historical events ofincreases in transaction costs at times of financial crisis orsubstantial downturns. Section IV states the conclusions of thisstudy.
II. A Double-Play Manipulator's Portfolio Choice Problem
A. The Model Setup
A double-play manipulator implements a strategy of shortingthe local currency and shorting the futures contract in the index ofthe local stock market.22 Let (S,, S, t) be the manipulator's shortpositions in the currency and the stock index futures markets. Themanipulator chooses his short positions at time t to maximize hisexpected terminal utility at time t+]. His utility function is givenby U =e , where R0 is the risk aversion parameter andW,, is his terminal wealth at t+1. Let W0 be the manipulator's
(describing the need for some version of the Tobin Tax to curb excesses of currencyspeculation).
22 It is more advantageous for the manipulator to short the index futures market due
to the limited upfront capital requirement. In addition, some emerging countries prohibitshort selling in the underlying stock market. See, e.g., ANCHADA CHAROENROOK &HAZEM DAOUK, FIN. MARKETS RES. CTR., THE WORLD PRICE OF SHORT SELLING, 34, 35
(October 2004), available at httpJ/www.owen.vanderbilt.edu/finrc/papers%20data/2004%20papers%20pdf/short saleAida.pdf (providing examples of emergingcountries prohibiting short selling).
[Vol. XXXV

DETERRING "DOUBLE-PLAY" MANIPULATION
initial endowment. The manipulator borrows the local currency attime t and sells it immediately in the spot currency market for U.S.dollars, which he then invests at the rate of r,,,.
The government imposes a one-way transaction fee, payable attimes of order execution, of r% on the value of short positions inthe index futures contract. The government intervenes in theindex futures market by taking long positions. Any revenuegenerated by trades executed at a given price level is used forintervention at the same price level. For example, if US$100 iscollected from trades executed at a price level of 900, thegovernment will use up to US$100 to long contracts at the pricelevel of 900.
Let r,, be the local-currency interest rate at time t+].Let r,- r+ (S , (-), Or(')). In words, r,+, is a function of themanipulator's short positions in the local currency, S,,, (r), and allother relevant factors captured by the variable Or(r ) . Both ofthese variables are influenced by the transaction fee r. Thecurrency market is deep and thus, under normal market conditions,positions of any single player have no palpable effects on theinterest rate. However, a panic herding behavior occurs in timesof currency crisis and makes it possible for trades of a singleplayer to generate a market-wide response.23
Let v1, (r) be the aggregate trading volume (i.e., the number ofindex futures contracts traded) during the period of t to t+], afterexcluding the volume generated by the government intervention.Trading volume is influenced by the transaction fee r. Let g, bethe number of index futures contracts that the government buysduring its intervention in the period of t to t+]. The governmentintervenes at each traded price level, but the magnitude of itsintervention at each level is limited to the transaction fee collectedfrom trades executed at that price level. In addition, we assumethat on average the government loses 20% on each trade, withcontracts bought earlier during the period losing more and thosebought toward the end of the period losing less. 24 Under these
23 See, e.g., Ansgar Belke & Ralph Setzer, Contagion, Herding and Exchange-rate
Instability -A Survey, INTERECONOMICS, 222, 225 (2004).24 This extremely cautious assumption is used in deriving the government's financial
position as a result of its intervention activities in the downward moving futures market.The government's loss in the market constitutes a financial constraint on its continuedintervention in the market. Given what had happened in Hong Kong in late August 1998
2009]

N.C. J. INT'L L. & CoM. REG.
assumptions, g, = vl, (r)r /(20 - r) (see Appendix A. 1 forderivation).
Let F, be the price of index futures contract at time t, andE(F,+) be the manipulator's expected price of the index futurescontract at time t+]. The expected index futures price level is afunction of the interest rate at time t+l that is captured by thevariable rt+(S 5, (r), 0r (r)), the magnitude of the government'sintervention that is captured by the variable g, (r), and all otherfactors that are captured by Of (r). These elements are, in turn,functions of the transaction fee T. ThusF, l = F[r,+, (S$,, (r), Or (r)), g, (Z-), 0Of (r)]. Note that F, l is not setas a function of Sf.,, which represents the manipulator's shortpositions in the index futures market at time t, due to the depth ofthe index futures market and trading restrictions.25
Let F. +lbe the variance of F,+1 and influenced by thetransaction fee r. Thus, 7 .Ft+ -- F2,t,1 (").
B. A Double-Play Manipulator's Optimization of TerminalUtility
Costs associated with a double-play strategy are as follows:First, there is the difference in the interest rates for the localcurrency and the U.S. Dollar. By shorting the local currency, themanipulator foregoes the local currency interest that is typicallyhigher than the interest on an equivalent amount of the U.S.Dollar. His cost is S$,, (r, - rus,), where r, is the interest rate onthe local currency and rus., is the interest rate on the U.S. Dollar.
Second, the manipulator pays a transaction fee on shortpositions in index futures in the amount of VFS,,r%, where V isthe value assigned to one index point by the futures exchange.The manipulator borrows the entire amount of the cost and pays
(the real life incident of government's futures market intervention to deter double-playmanipulation in financial crisis), an average loss of 20% during the intervention period isa conservative and worst-case-scenario assumption about the government's financialloss.
25 For example, Hong Kong Exchange has a 10,000 position delta limit for HangSeng Index Futures Contracts, Mini-Hang Seng Index Futures and Mini-Hang SengIndex Options in all contract months. See HONG KONG EXCHANGE, RULES, REGULATIONSAND PROCEDURES OF H.K. FUTURES EXCH., CONTRACT SPECIFICATIONS FOR MINI-HANG
SENG CHINA ENTERPRISES INDEX (HSCEI) FUTURES 1 (2009), available at
http://www.hkex.com.hk/rule/dervrule/SIF-CS.pdf.
[Vol. XXXV

DETERRING "DOUBLE-PLAY" MANIPULATION
back VFtSf ,r%( + r )at time t+].At time t+], the manipulator unwinds the short positions in
index futures. There is no transaction fee imposed on longpositions, so his transaction cost for the unwinding is zero. Hisgain or loss is captured by (F, - F,, )VS,, i.e., the change in theindex futures price multiplied by the value of each index point andthe size of his short positions. The manipulator's terminal wealthat time t+1 from trading in both the currency market and the indexfutures market isW,+, = (Wo - VFSf,r%)(1 + r,) + (F - F+, )VSf, t - S,, (r, - rus) .
The manipulator has a utility function given by -ewhich is expected to have the value at time t+1 equal toexp {[ R. (Wo - VFS ,r%)(l + r,) + (F, - E(F,+ ))VSf, - S., (i, - rs)]R 2 Z2 2 2 'n "
RS,t t+,). (See Appendix A.2 for derivation). Themanipulator sets his short positions in the currency and the indexfutures markets (Sf, S$,, ) at time t to maximize the value of thisexpected utility.
C. The Effect of Higher Transaction Fee r on theManipulator's Optimal Choice of Short Positions
A double-play manipulator's optimal choice of short positionsin the currency and the index futures markets must satisfy theconditions given by equations (1) and (2) in Appendix A.2 (the"first order conditions"). We would like to see how his optimalchoices change in response to an increase in the transaction fee r.Based on the Implicit Function Theorem,26 we take derivativeswith regard to the transaction fee T on both sides of the first orderconditions and obtain equations (3) and (4) in Appendix A.3 (SeeAppendix A.3 for derivation). We prove in Appendix A.4 that anincrease in the transaction fee r results in the manipulatorlowering short positions in both the currency market and the indexfutures market if A and B in these equations are both positive.
Components of A are shown in Appendix A.3. The first twocomponents capture the effect of an increase in the transaction feer on the expected price of the index futures contract through theoperation of factors other than the manipulator's currency market
26 The Theorem allows one to take derivatives on an unspecified function with
regard to any of its variables.
2009]

N.C. J. INT'L L. & COM. REG.
short position and the government's index futures marketintervention. In other words, an increase in the transaction feer causes changes in these factors, which in turn causes change inthe index futures price. The third component of A, "EF,) ", isthe change in the index futures price given the increase in thetransaction fee r through the government's intervention. In otherwords, an increase in the transaction fee permits the government tointervene in a bigger magnitude and results in, as experiencesuggests, a positive movement in the index futures price if thehigher transaction fee does not desiccate trading volume.27 Thefunction aor,+1 /ar of the last component captures changes in thevolatility of the index futures price at time t+1 as a result of anincrease in the transaction fee -T. It is straightforward to see that Ais positive if components one, two, three and five (component fouris necessarily positive) are non-negative. That is, A is positive ifthe increase in transaction cost does not lead to lower price (nottaking into account the government's intervention and themanipulator's short positions), lower trading volume and lowerprice volatility.
The components of B are also shown in Appendix A.3. Thecombination of the first two components captures the price effectof an increase in the transaction fee r that is attributable to factorsother than the government's intervention. The third componentcaptures the price effect of changes in the transaction fee that isattributable to the government's intervention. This component ispositive because an increase in the transaction fee strengthens thegovernment's intervention, which in turn has a positive impact onthe index futures price. In addition, the factor 8r,+4 /aS,, in thiscomponent is positive, as established by well-recognized financialmarket experience," since it reflects how the manipulator's shortpositions in the local currency affect the local interest rate. Thus,if the increase in the transaction fee has a non-negative effect onthe index futures price (not considering the price effect of thegovernment's intervention and the manipulator's short positions inthe index futures market), B is positive.
In sum, a double-play manipulator will optimize by reducingshort positions in both the currency and the index futures markets
27 See infra pp. 112-13.
28 See supra p. 104 and accompanying notes.
[Vol. XXXV

DETERRING "DOUBLE-PLAY" MANIPULATION
if the increase in the transaction cost does not result in lower price,volatility, and volume in the index futures market.
III. Empirical Testing for the Impact of IncreasingTransaction Fee on the Volatility, Price, and Volume of theIndex Futures Market
A. Identification of Events
Since manipulators adjust their trading strategies to the highertransaction fee r depending on how r affects the index futuresprice, volatility, and volume, we proceed to identify events ofincreases in transaction costs in the recent past when the marketwas subject to substantial and persistent downward pressures, andanalyze the effect of these events on volatility, price, and volume.Events were identified from news releases covering the periodfrom January 1, 1991 to December 1, 2008, and were filtered toexclude those for which data was unavailable 29 and those thatoccurred during multiple event periods,3" such that it is difficult tosegregate the effect of the increase in transaction costs from theeffect of other simultaneously occurring events. We also includedevents causing increases in transaction costs that occurred in thestock market rather than the index futures market because the twomarkets are closely linked by index arbitrage activities. Theseevents were also included because the volatility, price, and volumeeffects in the underlying stock market are good indicators of whatthe effects would have been had the increase occurred in the indexfutures market.
29 For example, we have excluded the event on March 15, 2001, when the BombayStock Exchange increased the initial margin on SENSEX futures contracts from 9% to14%. India's SENSEX stood at 3666.20 on March 15, 2001, a near 20% decline fromthe 4372.60 level just a month before. For a description of the event, see Sangita Shah,BSE Steps up Initial Futures Margin to 14 Percent, Mar. 17, 2001, 1,http://www.rediff.com/money/2001/mar/17bse.htm.
30 For example, on September 1, 1998, the Hong Kong Futures Exchange imposeda 150% margin surcharge on position-holders who had accumulated more than 10,000contracts. Starting from August 31, 1998, the exchange also required members to reportany open account holding 250 contracts or more and identify the beneficial owner ofeach reportable position. Previously, the reporting level had been 500 contracts andposition-holders remained anonymous. For discussion of this event, see Bayani Cruz,Stephen Seawright & Dennis Ng, Short Selling to be Curbed, THE STANDARD, Sept. 1,1998, 7, available at http://www.thestandard.com.hk/archive-newssearch_resu.asp?d-str=19980901 &page= 13 (follow "Short-selling to be curbed" hyperlink).
20091

N.C. J. INT'L L. & CoM. REG.
The following events are included in our sample: (1) Japan:On January 31, 1991, the Tokyo Stock Exchange raised marginson index futures contracts from 15% to 20%.31 The Nikkei 225Index dropped 35% from 32,891 on May 28, 1990 to 23,157 onJanuary 28, 1991.32 (2) Poland: On December 6, 1994, after theWarsaw Stock Exchange had been experiencing a downhill slidefor 10 months, Poland announced a 0.2% sales tax to be imposedon stock market transactions starting January 2, 1995." 3 (3)Australia: On October 24, 1997 (in the midst of the Asianfinancial crisis), the Sydney Futures Exchange raised the initialmargin payable on its Share Price Index Futures Contract fromAU$2,500 to AU$3,000 per contract.34 (4) Hong Kong: OnAugust 21, 1997, the initial margin on Hang Seng Index Futureswas raised from HK$50,000 to HK$55,000.3 5 (5) Hong Kong: OnSeptember 4, 2007, the initial margin on Hang Seng Index Futureswas increased again from HK$55,000 to HK$60,000.3 6 (6) HongKong: On October 24, 1997, the initial margin on Hang SengIndex Futures was increased from HK$70,000 to HK$75,000.3 7
(7) Hong Kong: On November 4, 1997, the initial margin on HangSeng Index Futures was increased from HK$75,000 toHK$90,000.38 (8) India: On June 18, 2001, the National StockExchange of India raised existing margins on ALBM 39 from17.5% to 40%.4' India's SENSEX index stood at 3,353 on June18, 2001, a decline of 30% since the high of 4,392 on February 5,
31 See Margins on Stock-Index and Options Trading to Rise, JAPAN ECON.
NEWSWIRE, Jan. 30, 1991, 2.32 See Yahoo! Finance, http://finance.yahoo.com/q/hp?s=^IN225&a=04&b=
28&c= 1990&d=00&e=28&f= 1991&g--d&z=66&y=132 (last visited Oct. 21, 2009).33 See Finance Minister Says Transaction Tax at WSE a Sure Thing, PAP NEWS
WIRE, Dec. 5, 1994, 1.34 See SFE Makes Margin Calls on Contracts, AAP NEWSFEED, Oct. 28, 1997, 2.35 See Enoch Yiu, Futures Exchange Lifts Margins to Guard Against Sharp Market
Moves, SOUTH CHINA MORNING POST, Sep. 3, 1997, at 1.36 Id.
37 See Enoch Yiu, Futures Margins Up in Market Dive, SOUTH CHINA MORNING
POST, Oct. 28, 1997, at 2.38 See Rodney Diola, HKFE Plans to Increase Margin Limit, THE STANDARD, Oct.
31, 1997, 2, available at http://www.thestandard.com.hk/news-detail.asp?ppcat=&artid=58497&sid=&con type=1 &d str=19971031 &searyear=1997.
39 Automated Lending and Borrowing Mechanism40 See Stocks - BSE Opens 45.4 pts down, ASIA PULSE, June 18, 2001.
[Vol. XXXV

DETERRING "DOUBLE-PLAY" MANIPULATION
2001.41
B. Volatility Effect
The effectiveness of using higher transaction costs tosupplement government intervention and deter double-playmanipulation depends on the absence of any negative impact ofsuch measures on volatility, price, and volume. Although anumber of papers have examined the volatility impact of imposinghigher transaction costs, their studies have not focused on marketsin times of financial crisis or in substantial downturns.42
In the analysis of the volatility effect of our sample events, weuse daily In(high price) - In(low price) as a proxy for volatility.Where the daily high or low prices are not available, we use the"Modified Levine Statistics" as substitute.43 We define Event Dayas the day on which an increase in transaction costs first becomeseffective. Our method is to compare the pre-event volatility withthe volatility on the Event Day and during the period shortly after
41 See Stocks - BSE Closes 19.83 Points Down, ASIAPULSE, June 18, 2001.
42 David A. Hsieh & Merton H. Miller, Margin Regulation and Stock Market
Volatility, 45 J. OF FIN. 3, 3-90 (1990). The authors used daily data to test for signs ofshort-term or impact relations between twenty-two historical changes in marginrequirements and the immediately subsequent changes in volatility. They found anabsence of strong and consistent impact effects of margins changes on volatility. Seealso Steven R. Umlauf, Transaction Taxes and the Behavior of the Swedish StockMarket, 33 J. OF FIN. ECON. 227, 227-40 (1993). The author used the Swedish stockmarket data from the 1980s and showed that the introduction of, or an increase inSwedish tax, led to an increase in volatility of stock prices. See also Charles M. Jones &Paul J. Seguin, Transaction Costs and Price Volatility: Evidence from CommissionDeregulation, 87 AM. ECON. REv. 728, 728-37 (1997). The paper has shown that thereduction in the commission portion of the transaction costs in 1975 led to a decrease inthe volatility of stock prices and an increase in trading volume. See also Ian Domowitz,Jack Glen & Ananth Madhavan, Liquidity, Volatility and Equity Trading Costs AcrossCountries and Over Time, 4 INT'L FIN. 221, 221-55 (2001). The paper analyzed data ofthe average trading costs as a percentage of trade value for active portfolio managers inforty-two countries and found that transaction costs do not have a significant impact onthe standard deviations of returns.
43 See Howard Levene, Robust Tests for Equality of Variances, in CONTRIBUTIONSTO PROBABILITY AND STATISTIcs 278, 278-80 (Ingram Olkin ed., 1960). Suppose thereare G groups of data, indexed i - 1, 2, 3 ... G. Each group contains n observations. Let
2 .th 2 2 !V0-i be the variance of the I group. The null hypothesis is 71 2 . Let X be
the j observation in the i't group. The Levine Statistic is computed as follows:
W =[n(z, - )2 /(G- 1)] /-- (z -Z. i )2
/ (n -1), where
z= - , = > xn .
2009]

N.C. J. INT'L L. & COM. REG.
the Event Day. Specifically, we bootstrap the distribution for thepre-Event average volatility from observations for the five-dayperiod prior to the Event Day. We then examine the standings ofthe Event Day volatility and the average volatility for the fivepost-Event Days in this distribution. In addition, we use theWilcoxon Rank Sum Test44 to compare the volatility levels for thefive-day period before and the five-day period after the Event Day.We pay attention to events in which both the Event Day volatilityand the post-Event average volatility were significantly lower thanthe pre-Event volatility. Lower Event Day volatility but higher orunchanged post-Event average volatility indicates that anydeclination in volatility is transitory and unlikely to continuebeyond the Event Day or shortly thereafter. Lower post-Eventaverage volatility but higher or unchanged Event Day volatilityindicates that the declination in post-Event volatility is likelycaused by factors other than the increase in transaction cost.
Table 1 reports the average volatility before and after the EventDay as well as the volatility on the Event Day. Among the eightevents included in our study, only Event #2 (the imposition of a0.2% sales tax on stocks traded on the Warsaw Stock Exchange onJanuary 2, 1995) shows a volatility decline on both the Event Dayand the five-day period after the Event Day. Events #5 and #7(Hong Kong's imposition of a higher initial margin on Hang SengIndex Futures on September 4 and November 4, 2007,respectively) have lower post-Event average volatility. However,the volatility on the Event Day is actually higher or unchanged.
Table 1Volatility Before and After Imposition of Higher Transaction Cost
This table reports, for the relevant index futures contract or the stock market index,daily volatility on the Event Day, the average daily volatility during the 5-day periodprior to the Event Day, and the average daily volatility during the 5-day period afterthe Event Day. Volatility is proxied by daily ln(high price) - ln(low price). Wheredaily high and low prices are unavailable, daily volatility is calculated by using theModified Levene Statistics described in Footnote 45.
44 See generally David Anderson et al., INTRODUCTION TO STATISTICS 406, 406-10(Bradley Schiller ed., West Publishing Co. 1981) (describing the "Wilcoxon Rank SumTest").
[Vol. XXXV

DETERRING "DOUBLE-PLAY" MANIPULATION
Pre-Event Event Post-EventAverage Day Average
0.01 0.02 0.021 Japan, January 31, 1991, initial marginson Nikkei 225 Futures was raised from15% to 20%.
2 Poland, January 2, 1995, 0.2% tax onsales of stocks on Warsaw StockExchange
3 Australia, October 24, 1997, SFE raisedinitial margin on All Ordinary IndexFutures from A$2,500 to A$3,000.
4 Hong Kong, August 21, 1997, HangSengIndex Futures initial margin wasincreased from HK$50,000 toHK$55,000
5 Hong Kong, September 4, 1997,HangSeng Index Futures initial marginwas increased from HK$55,000 toHK$60,000
6 Hong Kong, October 24, 1997,HangSeng Index Futures initial marginwas increased from HK$70,000 toHK$75,000.
7 Hong Kong, November 4, 1997,HangSeng Index Futures initial marginwas increased from HK$75,000 toHK$90,000.
8 India, June 18, 2001, National StockExchange increased margins on theALBM session from 17.5% to 40%.
Table 2 reports the standing of the Event Day volatility and thepost-Event average volatility in the bootstrapped distribution of thepre-Event average volatility. If the imposition of a highertransaction cost results in lower volatility, we should see that theEvent Day volatility and the post-Event average volatility standwithin 5% or 10% of the distribution on the lower end. Thisoccurs only in Event #2. For Event #7, although the post-Eventaverage volatility is significantly lower than the pre-Eventvolatility at the 5% significance level (with a distribution standingof 0%), the Event Day volatility has a distribution standing at44%, suggesting the insignificance of its difference from the pre-Event level. These results are confirmed by the Wilcoxon RankSum Test results listed in Table 2. In sum, the above evidencestrongly suggests that an increase in transaction costs does not leadto volatility declines in markets that are going through majorcorrections.
0.02 0.03
0.02 0.02
0.07 0.11
0.09 0.09
20091

N.C. J. INT'L L. & COM. REG.
Table 2The Volatility Effect of Increasing Transaction Cost in Bear Markets
This table reports the standing of the Event Day volatility and post-Event averagedaily volatility in the distribution bootstrapped from the daily volatilties in the 5-dayperiod prior to the Event Day. The table also reports the result of the Wilcoxon RankSum Test used to compare the daily volatilities 5 days before and 5 days after theEvent Day. Significant lower post-event volatility is noted.
WilcoxonDistribution Percentile Rank Sum
Event Day Post-EventEvent
I Japan, January 31, 1991,initial margins on Nikkei225 Futures was raisedfrom 15% to 20%.
2 Poland, January 2, 1995,0.2% tax on sales of stockson Warsaw StockExchange.
3 Australia, October 24,1997, SFE raised initialmargin on All OrdinaryIndex Futures fromA$2,500 to A$3,000.
4 Hong Kong, August 21,1997, HangSeng IndexFutures initial margin wasincreased from HK$50,000to HK$55,000.
5 Hong Kong, September 4,1997, HangSeng IndexFutures initial margin wasincreased from HK$55,000to HK$60,000.
6 Hong Kong, October 24,1997, HangSeng IndexFutures initial margin wasincreased from HK$70,000to HK$75,000.
7 Hong Kong, November 4,1997, HangSeng IndexFutures initial margin wasincreased from HK$75,000to HK$90,000.
8 India, June 18, 2001,National Stock Exchangeincreased margins on theALBM session from 17.5%
Volatility Volatility p Value100% 100% 0.01
100%
99%
31%
99%
100%
61%
19%
94%
44%
100% 94%
0.03**
0.01
0.5
0.42
0.1
0.07*
0.15
[Vol. XXXV

DETERRING "DOUBLE-PLAY" MANIPULATION
to 40%.
** Significantly lower at 5%level.* Significantly lower at 10%
level.
C. Price Effect
Existing research on the price effect of an increase intransaction costs has drawn mixed conclusions. Barclay, Kandeland Marx have found that the changes in the "bid-ask spread" (aproxy for transaction costs) do not have any significant impact onstocks' returns.45 However, Domowitz, Glen and Madhavan havefound that transaction costs have a negative impact on the annualreturns of stocks traded in some countries.46 Again, these studieshave not focused on the price effect in financial crisis orsubstantial bear markets.
We take a similar approach to our analysis of the volatilityeffect discussed in Section l1l(B) above by (1) comparing returns,defined as the difference in log settlement prices between twoconsecutive trading days, of the Event Day with the average dailyreturns for the five-day period immediately before the Event Day;(2) comparing settlement prices on the Event Day with the averagesettlement prices for the five-day period immediately before theEvent Day; and (3) comparing the average post-Event settlementprices with the average pre-Event settlement prices.
45 Michael J. Barclay, Eugene Kandel & Leslie M. Marx, The Effects ofTransaction Costs on Stock Prices and Trading Volume, 7 J. OF FIN. INTERMEDIATION130, 130-50 (1998).
46 Domowitz et al., supra note 42, at 241-44.
2009]

N.C. J. INT'L L. & COM. REG. [Vol. XXXV
Table 3Daily Returns Before and After Imposition of Higher Transaction Cost
This table reports, for the relevant index futures contract or the stock market index,the daily return on the Event Day, the average daily return for the 5-day period beforethe Event Day, and the average daily return for the 5-day period after the Event Day.Daily return is defined as In(close price for the day) - In(close price for the previousday).
Pre-Event Event Post-EventAverage Day Average
I Japan, January 31, 1991, initialmargins on Nikkei 225 Futureswas raised from 15% to 20%.
2 Poland, January 2, 1995, 0.2%tax on sales of stocks on WarsawStock Exchange.
3 Australia, October 24, 1997,SFE raised initial margin on AllOrdinary Index Futures fromA$2,500 to A$3,000.
4 Hong Kong, August 21, 1997,HangSeng Index Futures initialmargin was increased fromHK$50,000 to HK$55,000.
5 Hong Kong, September 4, 1997,HangSeng Index Futures initialmargin was increased fromHK$55,000 to HK$60,000.
6 Hong Kong, October 24, 1997,HangSeng Index Futures initialmargin was increased fromHK$70,000 to HK$75,000.
7 Hong Kong, November 4, 1997,HangSeng Index Futures initialmargin was increased fromHK$75,000 to HK$90,000.
8 India, June 18, 2001, NationalStock Exchange increasedmargins on the ALBM sessionfrom 17.5% to 40%.
0.003 -0.010 0.003
0.0001
0.002
-0.007
-0.008
-0.051
0.022
-0.007
0.026
-0.032
-0.016
-0.040
0.059
-0.062
-0.006
0.0005
-0.015
-0.006
-0.001
-0.010
-0.028
0.001
Table 3 reports the average daily returns before and after theEvent Day as well as the daily return on the Event Day. Events #3,#5 and #7 have both a lower Event Day return and a lower averagepost-Event return, while Events #1 and #4 have a lower Event Day

DETERRING "DOUBLE-PLAY" MANIPULATION
return but a higher or unchanged post-Event return. Table 4reports the average settlement prices before and after the EventDay as well as the settlement price on the Event Day. Events #1,#3, #4, #6 and #8 all have lower Event Day settlement prices andpost-Event average settlement prices, although the differencesfrom the pre-Event level in Events #1 and #3 appear nominal.
Table 4Settlement Price Before and After Imposition of Higher Transaction Cost
This table reports, for the relevant index futures contract or the stock market index,the settlement price on the Event Day, the average settement price for the 5-dayperiod before the Event Day and the average settlement price for the 5-day periodafter the Event Day.
Pre-Event Event Post-EventAverage Day Average
1 Japan, January 31, 1991, initialmargins on Nikkei 225 Futureswas raised from 15% to 20%.
2 Poland, January 2, 1995, 0.2%tax on sales of stocks onWarsaw Stock Exchange.
3 Australia, October 24, 1997,SFE raised initial margin on AllOrdinary Index Futures fromA$2,500 to A$3,000.
4 Hong Kong, August 21, 1997,HangSeng Index Futures initialmargin was increased fromHK$50,000 to HK$55,000.
5 Hong Kong, September 4,1997, HangSeng Index Futuresinitial margin was increasedfrom HK$55,000 toHK$60,000.
6 Hong Kong, October 24, 1997,HangSeng Index Futures initialmargin was increased fromHK$70,000 to HK$75,000.
7 Hong Kong, November 4,1997, HangSeng Index Futuresinitial margin was increasedfrom HK$75,000 toHK$90,000.
8 India, June 18, 2001, NationalStock Exchange increasedmargins on the ALBM session
23,824 23,570 23,808
36
2,651
16,000
14,159
12,198
10,352
3,467
37
2,594
15,725
14,300
11,240
10,710
3,353
38
2,492
15,576
14,782
10,248
10,368
3,392
2009]

N.C. J. INT'L L. & COM. REG.
from 17.5% to 40%.
Whether or not the differences from the pre-Event level arestatistically significant is reported in Table 5. At the 10%significance level, only Event #3 has a significantly lower returnand settlement price on the Event Day as well as for the five-dayperiod after the Event Day. This is evidenced by the low standingsof the Event Day and post-Event numbers in the distribution of thepre-Event average returns and settlement prices (1%, 0% and 1%for the Event Day return, settlement price and post-Event averagesettlement price, respectively). Event #8 has a significantly lowerEvent Day settlement price and average post-settlement price, butits Event Day return is indifferent from the pre-Event average.This suggests that the lower Event Day and post-Event settlementprice are likely due to a temporary declining time trend insettlement prices rather than the increase in transaction costs, sinceany significant impact of the higher cost would have beenreflected in the Event Day return. Events #1, #5 and #7 havesignificantly low Event Day returns, but their post-Event averagesettlement prices are statistically indifferent from the pre-Eventaverages, suggesting that any price impact of an increase intransaction costs does not last beyond the first day of itsimposition. Events #4 and #6 have significantly lower post-Eventaverage settlement prices but higher or unchanged Event Dayreturns and settlement prices. This suggests that the lower post-Event average price is unrelated to the increase in transactioncosts, whose impact, if any, is expected to be more prominent onthe first day of its imposition. In sum, there is no compellingevidence to suggest that an increase in transaction costs in asubstantial bear market has any long-lasting negative price impact.
Table 5The Price Effect of Increasing Transaction Cost in Bear Markets
This table reports (1) the standing of the Event Day return in the distributionbootstrapped from the daily returns in the 5-day period prior to the Event Day, (2) thestanding of the Event Day settlement price in the distribution bootstrapped from thesettlement prices in the 5-day period prior to the Event Day, (3) the standing of thepost-event average settlement prices in the distribution bootstrapped from settlement
[Vol. XXXV

DETERRING "DOUBLE-PLAY" MANIPULATION
prices for the 5-day period prior to the Event Day, and (4) the result of the WilcoxonRank Sum Test used to compare the settlement prices 5 days before and 5 days afterthe Event Day. Significant lower Event Day and post-Event return and settlement priceare noted.
WilcoxonDistribution Percentile Rank Sum
Event- Event-Day Day Post-Event
Event Return Price Average Price p Value1 Japan, January 31, 0%** 0%** 26% 0.34
1991, initial marginson Nikkei 225Futures was raisedfrom 15% to 20%.
2 Poland, January 2,1995, 0.2% tax onsales of stocks onWarsaw StockExchange.
3 Australia, October24, 1997, SFE raisedinitial margin on AllOrdinary IndexFutures fromA$2,500 to A$3,000.
4 Hong Kong, August21, 1997, HangSengIndex Futures initialmargin wasincreased fromHK$50,000 toHK$55,000.
5 Hong Kong,September 4, 1997,HangSeng IndexFutures initialmargin wasincreased fromHK$55,000 toHK$60,000.
6 Hong Kong, October24, 1997, HangSengIndex Futures initialmargin wasincreased fromHK$70,000 toHK$75,000.
7 Hong Kong,November 4, 1997,HangSeng IndexFutures initial
100% 100% 100%
1%** 0%**
20%
9%*
100%
0.01**
0.02**
0.07
0.02**
0.34
2% 0%**
77%
20091
N.C. J. INT'L L. & COM. REG.
margin wasincreased fromHK$75,000 toHK$90,000.
8 India, June 18, 2001, 58% 0%** 0%** 0.05**National StockExchange increasedmargins on theALBM session from17.5% to 40%.
** Significantly lower at5% level.* Significantly lower at10% level.
D. Volume Effect
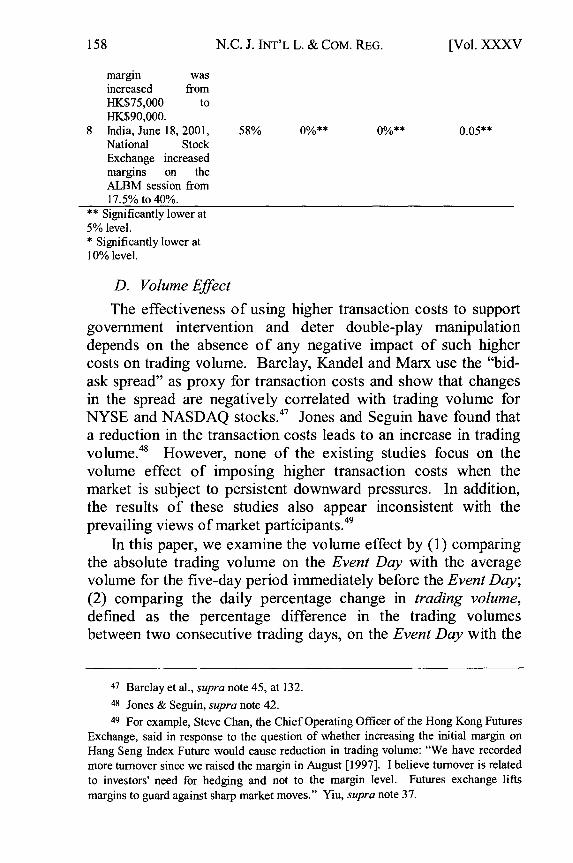
The effectiveness of using higher transaction costs to supportgovernment intervention and deter double-play manipulationdepends on the absence of any negative impact of such highercosts on trading volume. Barclay, Kandel and Marx use the "bid-ask spread" as proxy for transaction costs and show that changesin the spread are negatively correlated with trading volume forNYSE and NASDAQ stocks.47 Jones and Seguin have found thata reduction in the transaction costs leads to an increase in tradingvolume.48 However, none of the existing studies focus on thevolume effect of imposing higher transaction costs when themarket is subject to persistent downward pressures. In addition,the results of these studies also appear inconsistent with theprevailing views of market participants.49
In this paper, we examine the volume effect by (1) comparingthe absolute trading volume on the Event Day with the averagevolume for the five-day period immediately before the Event Day;(2) comparing the daily percentage change in trading volume,defined as the percentage difference in the trading volumesbetween two consecutive trading days, on the Event Day with the
47 Barclay et al., supra note 45, at 132.48 Jones & Seguin, supra note 42.49 For example, Steve Chan, the Chief Operating Officer of the Hong Kong Futures
Exchange, said in response to the question of whether increasing the initial margin onHang Seng Index Future would cause reduction in trading volume: "We have recordedmore turnover since we raised the margin in August [1997]. I believe turnover is relatedto investors' need for hedging and not to the margin level. Futures exchange liftsmargins to guard against sharp market moves." Yiu, supra note 37.
[Vol. XXXV

DETERRING "DOUBLE-PLAY" MANIPULATION
average daily percentage change in the trading volume for thefive-day period immediately before the Event Day; and (3)comparing the average post-Event daily trading volume with thepre-Event average daily trading volume. A conclusion that highertransaction costs lead to a lower trading volume that is non-transitory in nature should be supported by consistent evidence inall of the above measures.
Table 6 reports the absolute trading volume on the Event Dayand the average volume before and after the Event Day. Only twoEvent Days, #5 and #7, show a reduced trading volume for boththe Event Day and the post-Event period.
Table 6Daily Trading Volume Before and AfterImposition of Higher Transaction Cost
This table reports, for the relevant index futures contract or the stock market index, thetrading volume on the Event Day, the average daily trading volume for the 5-day periodbefore the Event Day and the average daily trading volume for the 5-day period after theEvent Day.
Pre-Event Post-EventEvent Averag Event Day Average
I Japan, January 31, 1991, initialmargins on Nikkei 225 Futures wasraised from 15% to 20%.
2 Poland, January 2, 1995, 0.2% taxon sales of stocks on Warsaw StockExchange.
3 Australia, October 24, 1997, SFEraised initial margin on All OrdinaryIndex Futures from A$2,500 toA$3,000.
4 Hong Kong, August 21, 1997,HangSeng Index Futures initialmargin was increased fromHK$50,000 to HK$55,000.
5 Hong Kong, September 4, 1997,HangSeng Index Futures initialmargin was increased fromHK$55,000 to HK$60,000.
6 Hong Kong, October 24, 1997,HangSeng Index Futures initialmargin was increased fromHK$70,000 to HK$75,000.
60,349 56,733 70,805
911 2,053
31,650
40,317
53,290
41,188
32,803
54,817
570
1,984
39,884
26,480
54,227
2009]
N.C. J. INT'L L. & COM. REG.
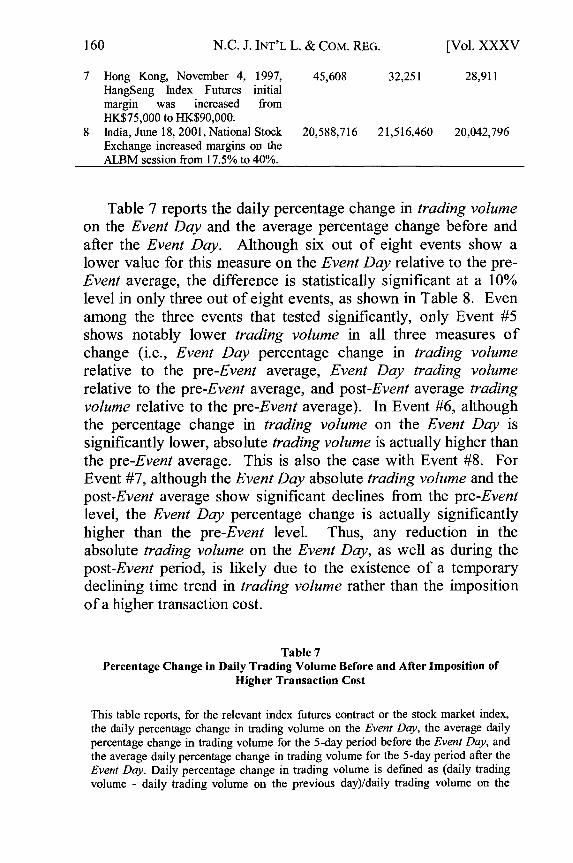
7 Hong Kong, November 4, 1997, 45,608 32,251 28,911HangSeng Index Futures initialmargin was increased fromHK$75,000 to HK$90,000.
8 India, June 18, 2001, National Stock 20,588,716 21,516,460 20,042,796Exchange increased margins on theALBM session from 17.5% to 40%.
Table 7 reports the daily percentage change in trading volumeon the Event Day and the average percentage change before andafter the Event Day. Although six out of eight events show alower value for this measure on the Event Day relative to the pre-Event average, the difference is statistically significant at a 10%level in only three out of eight events, as shown in Table 8. Evenamong the three events that tested significantly, only Event #5shows notably lower trading volume in all three measures ofchange (i.e., Event Day percentage change in trading volumerelative to the pre-Event average, Event Day trading volumerelative to the pre-Event average, and post-Event average tradingvolume relative to the pre-Event average). In Event #6, althoughthe percentage change in trading volume on the Event Day issignificantly lower, absolute trading volume is actually higher thanthe pre-Event average. This is also the case with Event #8. ForEvent #7, although the Event Day absolute trading volume and thepost-Event average show significant declines from the pre-Eventlevel, the Event Day percentage change is actually significantlyhigher than the pre-Event level. Thus, any reduction in theabsolute trading volume on the Event Day, as well as during thepost-Event period, is likely due to the existence of a temporarydeclining time trend in trading volume rather than the impositionof a higher transaction cost.
Table 7Percentage Change in Daily Trading Volume Before and After Imposition of
Higher Transaction Cost
This table reports, for the relevant index futures contract or the stock market index,the daily percentage change in trading volume on the Event Day, the average dailypercentage change in trading volume for the 5-day period before the Event Day, andthe average daily percentage change in trading volume for the 5-day period after theEvent Day. Daily percentage change in trading volume is defined as (daily tradingvolume - daily trading volume on the previous day)/daily trading volume on the
[Vol. XXXV

DETERRING "DOUBLE-PLAY" MANIPULATION
previous day.
Event Pre-Event Event Post-EventAverage Day Average
-0.6% -3.8% 10.2%I Japan, January 31, 1991,initial margins on Nikkei 225Futures was raised from 15%to 20%.
2 Poland, January 2, 1995,0.2% tax on sales of stockson Warsaw Stock Exchange
3 Australia, October 24, 1997,SFE raised initial margin onAll Ordinary Index Futuresfrom A$2,500 to A$3,000.
4 Hong Kong, August 21,1997, HangSeng IndexFutures initial margin wasincreased from HK$50,000to HK$55,000.
5 Hong Kong, September 4,1997, HangSeng IndexFutures initial margin wasincreased from HK$55,000to HK$60,000.
6 Hong Kong, October 24,1997, HangSeng IndexFutures initial margin wasincreased from HK$70,000to HK$75,000.
7 Hong Kong, November 4,1997, HangSeng IndexFutures initial margin wasincreased from HK$75,000to HK$90,000.
8 India, June 18, 2001,National Stock Exchangeincreased margins on theALBM session from 17.5%to 40%.
-12.6%
194.1%
7.3%
-25.8%
-34.3%
23.6%
-10.9%
-3.8%
37.6%
1.5%
-11.5%
-9.2%
2.5%
-2.2%
Table 8The Volume Effect of Increasing Transaction Cost in Bear Markets
This table reports (1) the standing of the Event Day percentage change in tradingvolume in the distribution bootstrapped from the daily percentage change in tradingvolume in the 5-day period prior to the Event Day, (2) the standing of the Event Daytrading volume in the distribution bootstrapped from the daily trading volume in the5-day period prior to the Event Day, (3) the standing of the post-event average daily
12.1%
10.5%
14.6%
4.2%
23.9%
-5.2%
-0.1%
2009]

N.C. J. INT'L L. & COM. REG.
trading volume in the distribution bootstrapped from the daily trading volume for the5-day period prior to the Event Day, and (4) the result of the Wilcoxon Rank SumTest used to compare the daily trading volumes 5 days before and 5 days after theEvent Day. Significant lower Event Day and post-Event daily trading volume andlower Event Day percentage in trading volume are noted.
WilcoxonDistribution Percentile Rank Sum
Event-Day Event-Day Post-EventVolume Change Volume Average Volume p Value
29% 12% 100% 0.07
19%
100%
26%
97%
100%
99%
99%
100%
98%
EventI Japan, January
31, 1991, initialmargins onNikkei 225Futures wasraised from 15%to 20%.
2 Poland, January2, 1995, 0.2% taxon sales of stockson Warsaw StockExchange.
3 Australia,October 24, 1997,SFE raised initialmargin on AllOrdinary IndexFutures fromA$2,500 toA$3,000.
4 Hong Kong,August 21, 1997,HangSeng IndexFutures initialmargin wasincreased fromHK$50,000 toHK$55,000.
5 Hong Kong,September 4,1997, HangSengIndex Futuresinitial margin wasincreased fromHK$55,000 toHK$60,000.
6 Hong Kong,October 24, 1997,HangSeng IndexFutures initialmargin wasincreased fromHK$70,000 toHK$75,000.
7 Hong Kong,November 4,1997, HangSengIndex Futuresinitial margin was
97%
0.11
0.01
0.11
0.01**
0.42
[Vol. XXXV

DETERRING "DOUBLE-PLAY" MANIPULATION
increased fromHK$75,000 toHK$90,000.
8 India, June 18, 8%* 82% 29% 0.52001, NationalStock Exchangeincreased marginson the ALBMsession from17.5% to 40%.
** Significantly lowerat 5% level.* Significantly lowerat 10% level.
In sum, only one out of eight events shows a significantlylower Event Day percentage change in trading volume, the EventDay absolute trading volume and post-Event average tradingvolume. This result is inconsistent with the hypothesis thatincreasing transaction costs has the tendency to reduce tradingvolume.
IV. Conclusion
This paper proposes a solution to the dilemma that financialmarket regulators in developing economies face when theircurrency board system is subject to attacks by the so-calleddouble-play manipulation strategy typically implemented at timesof financial crisis. Interventions in equity markets may berequired to break the self-fulfilling prophecy of the double-playmanipulation, but the intervention demands an enormous capitalresource that is typically beyond the budgetary limit and financialmeans of most governments in developing economies. We believethe solution lies in raising transaction costs on short sellers andsupplementing the intervention with the revenue generated by suchadditional levy. Such a measure can only claim to be effective if itresults in the alleviation of short pressures in the currency and/orstock markets. We set up a portfolio choice problem from theperspective of a double-play manipulator and examined how hisoptimal choice for short positions in both markets changes whenfacing such a regulatory measure. We find that the manipulatorwill be prompted to reduce his short positions in both the currencyand the equity markets if the higher transaction costs do not lowervolatility, reduce trading volume, and plunge the price. Ourempirical study of eight historical events of regulators increasingtransaction costs at times of financial crisis or substantial price
2009]

164 N.C. J. INT'L L. & COM. REG. [Vol. XXXV
corrections suggests that these market conditions do not typicallyfollow the imposition of higher costs. Our study has shown theviability of using higher transaction costs as a regulatory tool incombating double-play manipulations that exacerbate the painsuffered by developing economies going through difficultcorrections. How such a tool is best implemented in differentmarkets naturally depends on the geopolitical and economicenvironment of each individual country. A currency board systemthat is essential for the political and economic stability ofdeveloping economies has been, and will continue to be, alucrative prey for financial sharks eyeing a long line of currencyand stock market kills when a temporary dislocation existsbetween the pegged currencies. It is imperative for regulators toestablish defense plans in preparation for future double-playattacks. We hope our study helps in this regard.
DETERRING "DOUBLE-PLAY" MANIPULATION
Appendix A: Derivation of Key Formulas
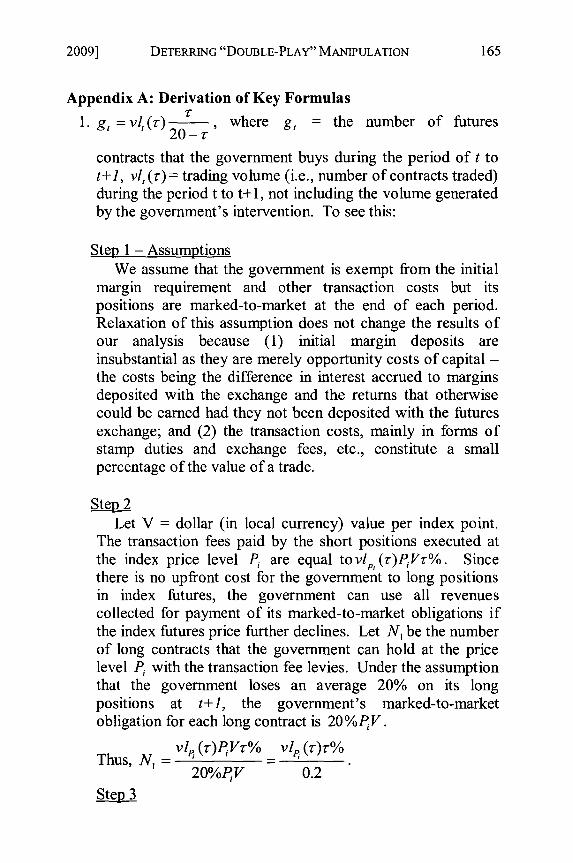
1. g, = vl, (T) , where g, = the number of futures20 -
contracts that the government buys during the period of t tot+J, vl, (r) = trading volume (i.e., number of contracts traded)during the period t to t+l, not including the volume generatedby the government's intervention. To see this:
Step 1 - AssumptionsWe assume that the government is exempt from the initial
margin requirement and other transaction costs but itspositions are marked-to-market at the end of each period.Relaxation of this assumption does not change the results ofour analysis because (1) initial margin deposits areinsubstantial as they are merely opportunity costs of capital -the costs being the difference in interest accrued to marginsdeposited with the exchange and the returns that otherwisecould be earned had they not been deposited with the futuresexchange; and (2) the transaction costs, mainly in forms ofstamp duties and exchange fees, etc., constitute a smallpercentage of the value of a trade.
Step 2Let V = dollar (in local currency) value per index point.
The transaction fees paid by the short positions executed atthe index price level Pi are equal to vlp, (r)PVr%. Sincethere is no upfront cost for the government to long positionsin index futures, the government can use all revenuescollected for payment of its marked-to-market obligations ifthe index futures price further declines. Let N, be the numberof long contracts that the government can hold at the pricelevel P with the transaction fee levies. Under the assumptionthat the government loses an average 20% on its longpositions at t+1, the government's marked-to-marketobligation for each long contract is 20%PiV.
vl, (r)PjVr% vi, (r)r%20%PV
0.2
Step 3
20091

N.C. J. INT'L L. & COM. REG.
Given the imbalance between short and long orders attimes of crisis, we assume that the government's long ordersare matched immediately with short orders. Short positionsprovide the government with revenues in the form oftransaction fees against which the government is able to hold
vl (r)r%2
additional N 2 = long contracts at the index price
level P. This process goes on. Thus, at each price level P,the number of long contracts that the government can hold isequal to the following under the assumption that0% < r% < 20%:1, (*-*% vl ,),%2 Vl (,),%
+ + +0.2 0.22 0.2 3
vl, (_.)_ % ,.% .% 2 r% 3
0.2 (1 + + + +...)0.2 0.2 0.
VIP (z.)r.% _ _VIP (z.)r.%
0..% 0.2 - r%0.2,
Step 4Adding the government's long positions at each price level
gives:vl (r-)T% vlz,,(*)% vl,,(r)i%
gt-+ + "
0.2-% 0.2-z-% 0.2-T%
-02-3% [Vl ( -) + V1P (T-) + VIP (-) +..
- vl,(r)=vl,(r)T
0.2 -r-% 20-r
2. The Objective Function and the First Order Conditions
The original objective function is:
[Vol. XXXV

2009] DETERRING "DOUBLE-PLAY" MANIPULATION 167
Max EL-exp(-Ra[(W -S ,FV-%/1 +r,)+(F -F,,)Sf,V-Sr, (, -r,DOE(x)+ -Ra 80o
2
" E(exo) = e 2
-RaE(Wt+ )+- Ra Var(Wt+|)
. E (e taw 1) -e2
.E(W,+,) = (Wo - Sf,,FVr%X1 + rt)+ (F - E(F~ ))g f,tv - g$t(t- tS
Var(Wt+,) =Var(Ft+l f 2 2 tS2 V2t: )Sf~V = c f,t+l1_f,tv
whereC + 2, o.+ 1 (=) = Var(F+1 )
In addition,
Max{-e- Ra W ' I= Minte -RaW,, I
= i{e - R aE(Wl*)+Ra 2Var(W,+l)
SMax{ eRaE(W, ) - IRa2Var(W,)}
Thus, the objective function can be written as:Ra{(W -SfFVr%Xl+r)(F t -E(F,+I))SfjV-Sj (r, -)} Ra
2S
2 V
2o2+0
Max e 2 f85, ,Sf
Let
Ra{(Wo-S f,,tFVr% Xl+rt )( F-E (F +, ))S f ,t-S$, t (r-r ,us)}-R R a 2S ft V2", 1L=e 2 -
the first order conditions are given by:
aL 2 F)
-- F - E(F - Fr%(1 + - RaSfIVf,t+ = 0 (1)S f ,t I l
aL E(F,+,)Q- as s , (2)as, s,

N.C. J. INT'L L. & COM. REG.
3. The Implicit Function Theorem and the Gramer's Rule
Taking derivative on both sides of first order conditions withregard to transaction fee r produces the followingconditions:
0E(F+l) ( laS$,1 O+, Or )+ aE(F>1 )Og, +E(F+I)OOf 1
Ir+ as,, ~+ 2L, -+,+L L_ - ( ,
0:-- as$" ar aO--r) a g, Or Of Ozr 100
+ Ra V,,+, asf" + R aVSf, fc4.r ar
aSf,, OE(F,+l) Or, , ar,+, [2E(F,+1 ) ('ar+, OS$,, + ar+, aO]TOr ar,+l as,, f" O , O ,- s,, ar O0 Or
r,, ' 2E(F+I) Og, +Si. , a 2E(F,I) OOf" f 1+1 __________
OS,, Or.,41 g, Or as$, Or,+ OO f Or
OE(F+l) t+ 3, +2r+l aOr"S ,t r OS, Or OS$, 0r Otr )
The above can be expressed in a matrix form as follows:
-_RaV 2 OE(F,+,) Or,+, S
,+I, +s, ) -r
Or,+, as__$,, as$,, &;+, r+ as2, -. Oa j
[Vol. XXXV

DETERRING "DOUBLE-PLAY" MANPULATION
OE(F+,) ar,, OOr OE(F,+,) aOf +E(F,+,) Og,
art 00 r a 00z 0 O13 Fag, Or
1 aaf-fl++ 100 F(I+r,)+RaVSf,t icr = A
Or,+, a O2E(F,,) Or,+, 00 r + 2E(F+,) a01Sf,t c r 0 O rr Oa z Of O r
OE(F,+,) O2r+, 00, Or,+, a2E(F+,) Og,+ Sf,1 - -+ Sf,l
Or,+, )SstaoQ Or OS$,, Or+Og, Or
LetM=-
Ra 2 aE(F+l) ar,+,2Ra f.+ 1 r+l a $
Or,- O S f 2' as o,,r,+ 1 o5S2
ar,, ssl ssl r,+ $S$t
The above system of equations can be solved by using theGramer's Rule:
A M 1 2
asf'l - M22 AM22-BM 12 (3)Or detIMI detIMI
Mil A
OS$,t M 21 B BMl - AM21 (4)
Or detIMI detIMI
4. Proof that the signs of aS, and OS-'" depend on the signs ofA and B. Or Or
2009]

170 N.C. J. INT'L L. & COM. REG. [Vol. XXXV
The elements of matrix M are second order derivatives of theobjective function with regard to St and Ss,, . To see this:
aL V(F E(F,,)) - F, Vr%(I + r,) RaSfVo•,* . . Ra f , 1~rf,+1
a 2 L aE(Ft+l) RaVo -- RaVor2
asy2 V asf Ra ft+I -Ra j1+..os --7=v (,,because (Ft) - 0 by assumption
OSf,,
aL - aE(F +,) r (
aSs,, -f r,+, ass,2 a + rE(F,+,) 2r+
LS, E(Ft+l)(arI 2 5 aE(~~1)a2 "Ias2- SV ar2 ass +I ) ~ as2
$ ~ CIas, a(E+)a2L aE(,+ 1) a - (s v ar a0L = -V. =E(t+ ) tr+, .
ass,, asf, ar+, ass,, as ,,*." By assumption,E(F,+.) = E[f(r,+, (S,, (0) r () t (), Of()
aE(F+,) a r,,.and are not functions of Sf*,.ar,+l tass,t
a( aE(F,+,)jTherefore, " r, = 0 and
asf,,
02 L E(F,+,) ar,as$,,osf, &+l Cos$,t
By second order necessary conditions,

DETERRING "DOUBLE-PLAY" MANIPULATION
M 22 < 0 and Ml 1 0
M 1 *M22 -M 12 *M2 =detl O0
By well-recognized financial market experience, attacks onthe local currency lead to higher local currency interestrate, thus
->0.as$,t
By well-recognized financial market experience, anincrease in local currency interest rate leads to lower localstock prices, thusaE(F, 0)<0.
aE(F,, ) ar,,, 0Thus, M12 = M21 as$"0
ar OS as I
Thus, if A > 0 and B > 0, j- < 0 and " <0.Or Or
2009]

N.C. J. INT'L L. & COM. REG. [Vol. XXXV
Copyright © 2022 FDOKUMEN