Determination of velum opening for french nasal vowels by magnetic resonance imaging
14
Determination of Velum Opening for French Nasal Vowels by Magnetic Resonance Imaging *Didier Demolin, *Ve ´ronique Delvaux, †Thierry Metens, and *Alain Soquet Brussels, Belgium Summary: MRI techniques have been used to describe velum opening of French vowels. Data based on 18 joined axial slices of 4 mm thickness were recorded with four subjects. Differences in velum opening are calculated from areas measured in the tract between the lowered velum and the back pharynx wall. Results show that for all subjects, the back vowel /ɔ ˜/ has the smallest opening, while some variations are observed for the other vowels. Key Words: Nasal vowels—Magnetic resonance imaging—Velum opening. INTRODUCTION Magnetic resonance imaging (MRI) has been used to obtain midsagittal cuts of the vocal tract and to extract area functions from the latter. 1,2 Recent prog- ress in MRI allows us to gather data much faster and with better accuracy than before. Magnetic reso- nance imaging allows us to obtain accurate slices of the velum opening in the coronal, transversal, and sagittal plans, without any invasive effect for the subject. MRI completes a set of techniques al- ready used to study nasality phenomena such as those described by Krakow and Huffman. 3 MRI has been used to make measurements of the nasal Accepted for publication September 11, 2002. From the *Laboratoire de Phonologie, Universite ´ Libre de Bruxelles, Brussels, Belgium; †Unite ´ de Re ´sonance Magne ´tique, Ho ˇpital Erasme, Universite ´ Libre de Bruxelles, Brussels, Belgium. Address correspondence and reprint requests to Didier De- molin, Laboratoire de Phonologie, Universite ´ Libre de Bruxel- les, 50 av. F.D. Roosevelt, CP 175, B-1050 Brussels, Belgium. E-mail: [email protected] Journal of Voice, Vol. 17, No. 4, pp. 454–467 2003 The Voice Foundation 0892-1997/2003 $30.000 doi:10.1067/S0892-1997(03)00036-5 454 cavities, 4,5 but only recently data on velic lowering were presented. 6 In this article, we describe velum opening for French nasal vowels. Images have been recorded at the Magnetic Resonance Unit of the Erasmus Hospital, Free University of Brussels. CORPUS, IMAGE ACQUISITION, AND IMAGE ANALYSIS Corpus Data were recorded on two female speakers (sub- jects 1 and 2) and two male speakers (subjects 3 and 4), all of them native French speakers living in Brussels. The task of the subjects was to pronounce and to sustain each of the nasal phonemes /ε ˜/, /œ ˜ /, /ɑ ˜/, /ɔ ˜/ and the corresponding oral phonemes /ε/, /œ/, /a/ and /ɔ/. A reference was a word that con- tained the vowel to be pronounced. This reference word was given a few seconds before the recording session by one of the experimenters. Table 1 displays the reference words and the vowels contained in these words. Image acquisition The imaging was done with a 1.5 T MRI system with a quadrature head–neck coil (Philips Gyroscan
Transcript of Determination of velum opening for french nasal vowels by magnetic resonance imaging
Determination of Velum Opening for French NasalVowels by Magnetic Resonance Imaging
*Didier Demolin, *Veronique Delvaux, †Thierry Metens, and *Alain Soquet
Brussels, Belgium
Summary: MRI techniques have been used to describe velum opening ofFrench vowels. Data based on 18 joined axial slices of 4 mm thickness wererecorded with four subjects. Differences in velum opening are calculated fromareas measured in the tract between the lowered velum and the back pharynxwall. Results show that for all subjects, the back vowel /ɔ/ has the smallestopening, while some variations are observed for the other vowels.
Key Words: Nasal vowels—Magnetic resonance imaging—Velum opening.
INTRODUCTION
Magnetic resonance imaging (MRI) has been usedto obtain midsagittal cuts of the vocal tract and toextract area functions from the latter.1,2 Recent prog-ress in MRI allows us to gather data much fasterand with better accuracy than before. Magnetic reso-nance imaging allows us to obtain accurate slicesof the velum opening in the coronal, transversal,and sagittal plans, without any invasive effect forthe subject. MRI completes a set of techniques al-ready used to study nasality phenomena such asthose described by Krakow and Huffman.3 MRIhas been used to make measurements of the nasal
Accepted for publication September 11, 2002.From the *Laboratoire de Phonologie, Universite Libre de
Bruxelles, Brussels, Belgium; †Unite de Resonance Magnetique,Hopital Erasme, Universite Libre de Bruxelles, Brussels,Belgium.
Address correspondence and reprint requests to Didier De-molin, Laboratoire de Phonologie, Universite Libre de Bruxel-les, 50 av. F.D. Roosevelt, CP 175, B-1050 Brussels, Belgium.E-mail: [email protected]
Journal of Voice, Vol. 17, No. 4, pp. 454–467� 2003 The Voice Foundation0892-1997/2003 $30.00�0doi:10.1067/S0892-1997(03)00036-5
454
cavities,4,5 but only recently data on velic loweringwere presented.6
In this article, we describe velum opening forFrench nasal vowels. Images have been recordedat the Magnetic Resonance Unit of the ErasmusHospital, Free University of Brussels.
CORPUS, IMAGE ACQUISITION, AND IMAGEANALYSIS
CorpusData were recorded on two female speakers (sub-
jects 1 and 2) and two male speakers (subjects 3and 4), all of them native French speakers living inBrussels. The task of the subjects was to pronounceand to sustain each of the nasal phonemes /ε/, /œ/,/ɑ/, /ɔ/ and the corresponding oral phonemes /ε/,/œ/, /a/ and /ɔ/. A reference was a word that con-tained the vowel to be pronounced. This referenceword was given a few seconds before the recordingsession by one of the experimenters. Table 1 displaysthe reference words and the vowels contained inthese words.
Image acquisitionThe imaging was done with a 1.5 T MRI system
with a quadrature head–neck coil (Philips Gyroscan
VELUM OPENING OF FRENCH VOWELS BY MRI 455
TABLE 1. Reference words
Nasal Oral
Word Vowel Word Vowel
un /œ/ peur /œ/bon /ɔ/ pot /ɔ/vin /ε/ pres /ε/blanc /ɑ/ papa /a/
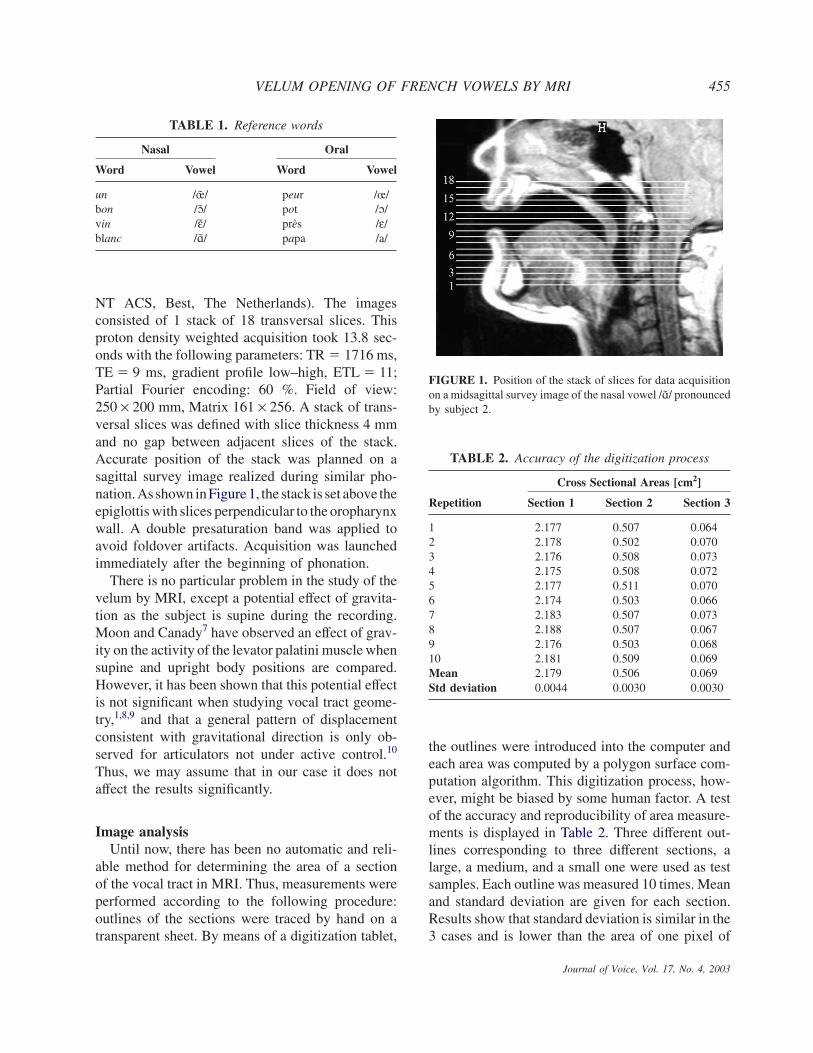
NT ACS, Best, The Netherlands). The imagesconsisted of 1 stack of 18 transversal slices. Thisproton density weighted acquisition took 13.8 sec-onds with the following parameters: TR � 1716 ms,TE � 9 ms, gradient profile low–high, ETL � 11;Partial Fourier encoding: 60 %. Field of view:250 × 200 mm, Matrix 161 × 256. A stack of trans-versal slices was defined with slice thickness 4 mmand no gap between adjacent slices of the stack.Accurate position of the stack was planned on asagittal survey image realized during similar pho-nation. As shown inFigure 1, the stack is set above theepiglottis with slices perpendicular to the oropharynxwall. A double presaturation band was applied toavoid foldover artifacts. Acquisition was launchedimmediately after the beginning of phonation.
There is no particular problem in the study of thevelum by MRI, except a potential effect of gravita-tion as the subject is supine during the recording.Moon and Canady7 have observed an effect of grav-ity on the activity of the levator palatini muscle whensupine and upright body positions are compared.However, it has been shown that this potential effectis not significant when studying vocal tract geome-try,1,8,9 and that a general pattern of displacementconsistent with gravitational direction is only ob-served for articulators not under active control.10
Thus, we may assume that in our case it does notaffect the results significantly.
Image analysisUntil now, there has been no automatic and reli-
able method for determining the area of a sectionof the vocal tract in MRI. Thus, measurements wereperformed according to the following procedure:outlines of the sections were traced by hand on atransparent sheet. By means of a digitization tablet,
FIGURE 1. Position of the stack of slices for data acquisitionon a midsagittal survey image of the nasal vowel /ɑ/ pronouncedby subject 2.
TABLE 2. Accuracy of the digitization process
Cross Sectional Areas [cm2]
Repetition Section 1 Section 2 Section 3
1 2.177 0.507 0.0642 2.178 0.502 0.0703 2.176 0.508 0.0734 2.175 0.508 0.0725 2.177 0.511 0.0706 2.174 0.503 0.0667 2.183 0.507 0.0738 2.188 0.507 0.0679 2.176 0.503 0.06810 2.181 0.509 0.069Mean 2.179 0.506 0.069Std deviation 0.0044 0.0030 0.0030
the outlines were introduced into the computer andeach area was computed by a polygon surface com-putation algorithm. This digitization process, how-ever, might be biased by some human factor. A testof the accuracy and reproducibility of area measure-ments is displayed in Table 2. Three different out-lines corresponding to three different sections, alarge, a medium, and a small one were used as testsamples. Each outline was measured 10 times. Meanand standard deviation are given for each section.Results show that standard deviation is similar in the3 cases and is lower than the area of one pixel of
Journal of Voice, Vol. 17, No. 4, 2003
DIDIER DEMOLIN ET AL456
Journal
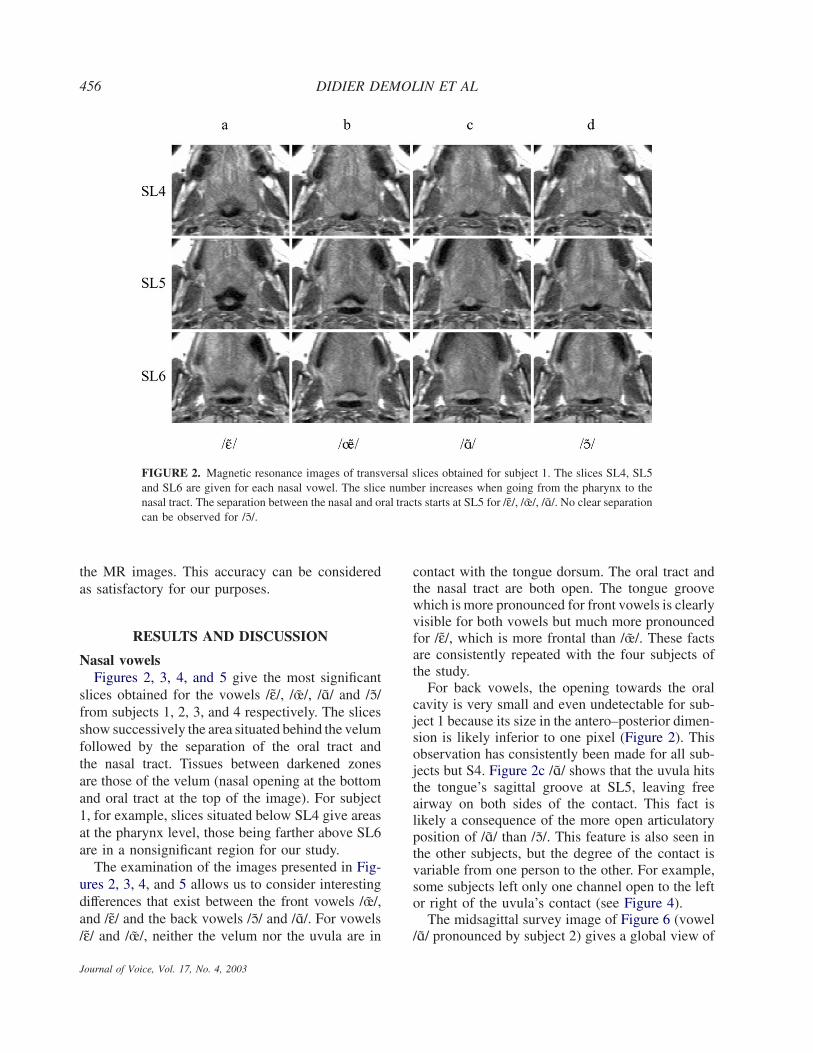
FIGURE 2. Magnetic resonance images of transversal slices obtained for subject 1. The slices SL4, SL5and SL6 are given for each nasal vowel. The slice number increases when going from the pharynx to thenasal tract. The separation between the nasal and oral tracts starts at SL5 for /ε/, /œ/, /ɑ/. No clear separationcan be observed for /ɔ/.
the MR images. This accuracy can be consideredas satisfactory for our purposes.
RESULTS AND DISCUSSION
Nasal vowelsFigures 2, 3, 4, and 5 give the most significant
slices obtained for the vowels /ε/, /œ/, /ɑ/ and /ɔ/from subjects 1, 2, 3, and 4 respectively. The slicesshow successively the area situated behind the velumfollowed by the separation of the oral tract andthe nasal tract. Tissues between darkened zonesare those of the velum (nasal opening at the bottomand oral tract at the top of the image). For subject1, for example, slices situated below SL4 give areasat the pharynx level, those being farther above SL6are in a nonsignificant region for our study.
The examination of the images presented in Fig-ures 2, 3, 4, and 5 allows us to consider interestingdifferences that exist between the front vowels /œ/,and /ε/ and the back vowels /ɔ/ and /ɑ/. For vowels/ε/ and /œ/, neither the velum nor the uvula are in
of Voice, Vol. 17, No. 4, 2003
contact with the tongue dorsum. The oral tract andthe nasal tract are both open. The tongue groovewhich is more pronounced for front vowels is clearlyvisible for both vowels but much more pronouncedfor /ε/, which is more frontal than /œ/. These factsare consistently repeated with the four subjects ofthe study.
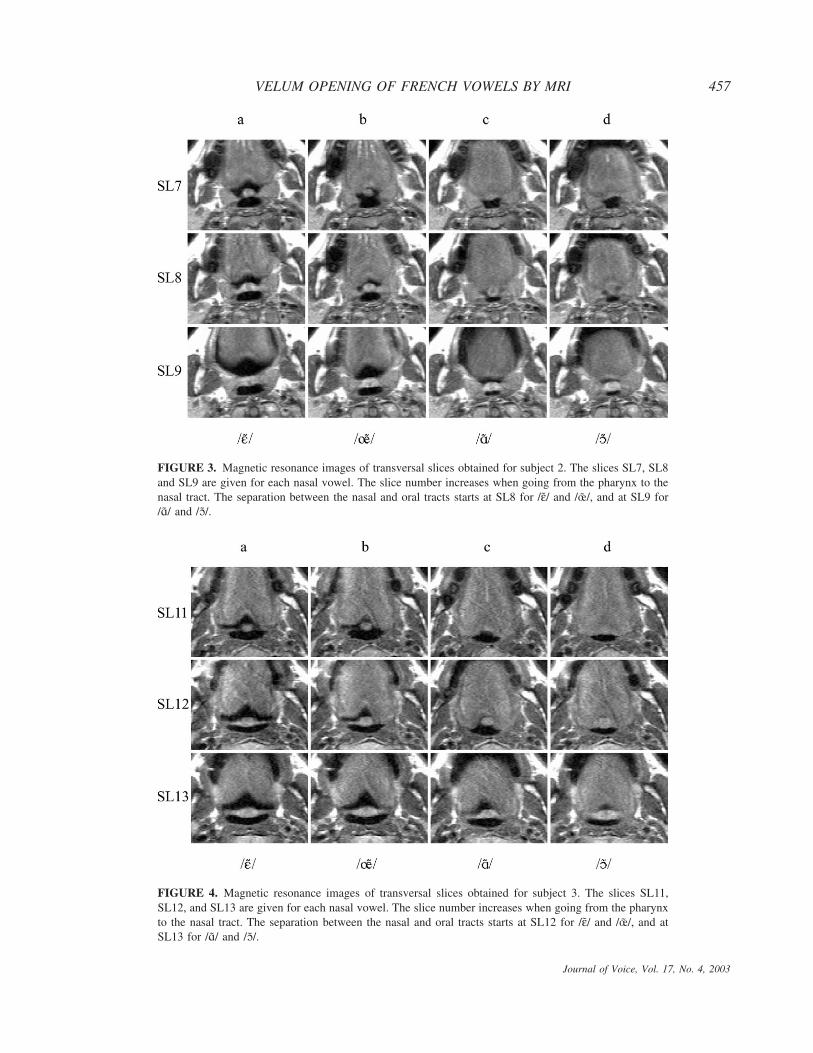
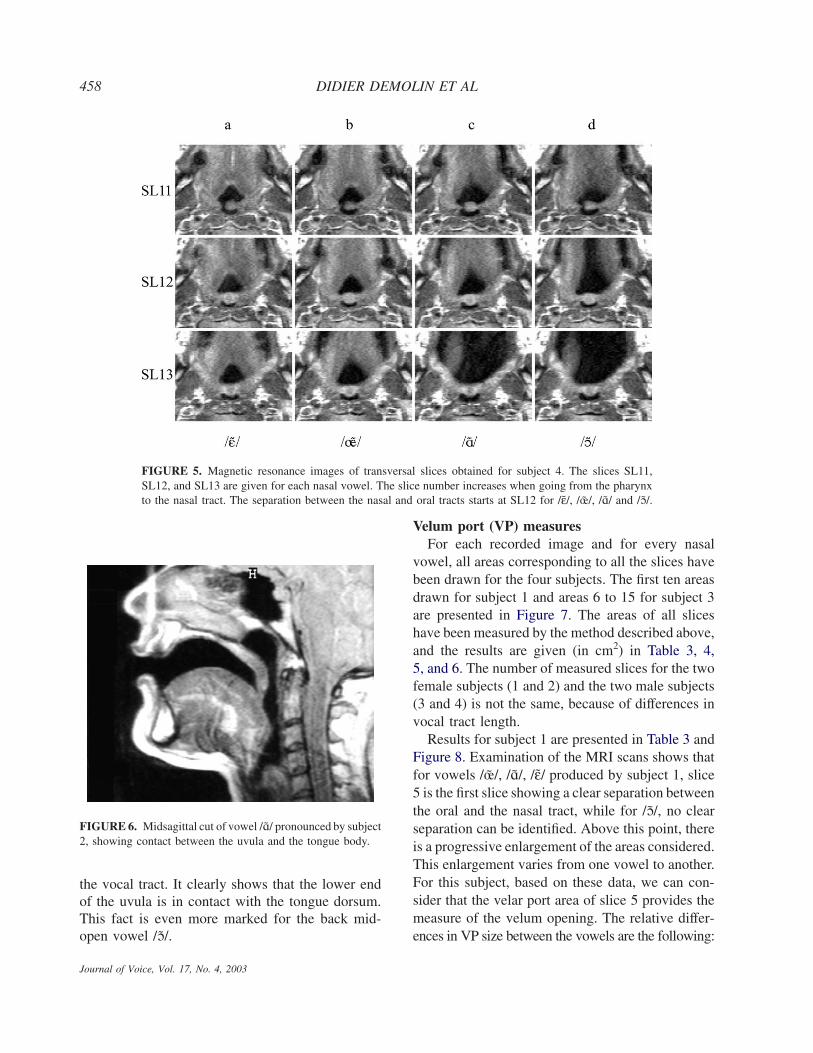
For back vowels, the opening towards the oralcavity is very small and even undetectable for sub-ject 1 because its size in the antero–posterior dimen-sion is likely inferior to one pixel (Figure 2). Thisobservation has consistently been made for all sub-jects but S4. Figure 2c /ɑ/ shows that the uvula hitsthe tongue’s sagittal groove at SL5, leaving freeairway on both sides of the contact. This fact islikely a consequence of the more open articulatoryposition of /ɑ/ than /ɔ/. This feature is also seen inthe other subjects, but the degree of the contact isvariable from one person to the other. For example,some subjects left only one channel open to the leftor right of the uvula’s contact (see Figure 4).
The midsagittal survey image of Figure 6 (vowel/ɑ/ pronounced by subject 2) gives a global view of
VELUM OPENING OF FRENCH VOWELS BY MRI 457
FIGURE 3. Magnetic resonance images of transversal slices obtained for subject 2. The slices SL7, SL8and SL9 are given for each nasal vowel. The slice number increases when going from the pharynx to thenasal tract. The separation between the nasal and oral tracts starts at SL8 for /ε/ and /œ/, and at SL9 for/ɑ/ and /ɔ/.
FIGURE 4. Magnetic resonance images of transversal slices obtained for subject 3. The slices SL11,SL12, and SL13 are given for each nasal vowel. The slice number increases when going from the pharynxto the nasal tract. The separation between the nasal and oral tracts starts at SL12 for /ε/ and /œ/, and atSL13 for /ɑ/ and /ɔ/.
Journal of Voice, Vol. 17, No. 4, 2003
DIDIER DEMOLIN ET AL458
Journal of V
FIGURE 5. Magnetic resonance images of transversal slices obtained for subject 4. The slices SL11,SL12, and SL13 are given for each nasal vowel. The slice number increases when going from the pharynxto the nasal tract. The separation between the nasal and oral tracts starts at SL12 for /ε/, /œ/, /ɑ/ and /ɔ/.
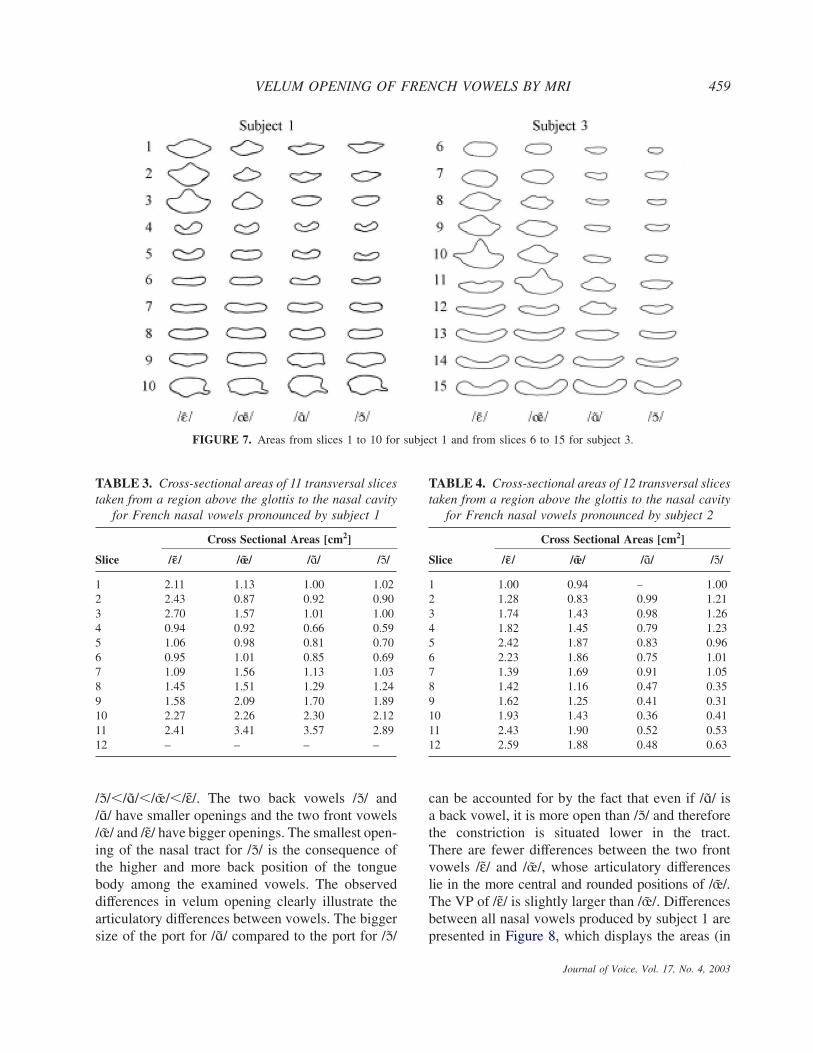
FIGURE 6. Midsagittal cut of vowel /ɑ/ pronounced by subject2, showing contact between the uvula and the tongue body.
the vocal tract. It clearly shows that the lower endof the uvula is in contact with the tongue dorsum.This fact is even more marked for the back mid-open vowel /ɔ/.
oice, Vol. 17, No. 4, 2003
Velum port (VP) measuresFor each recorded image and for every nasal
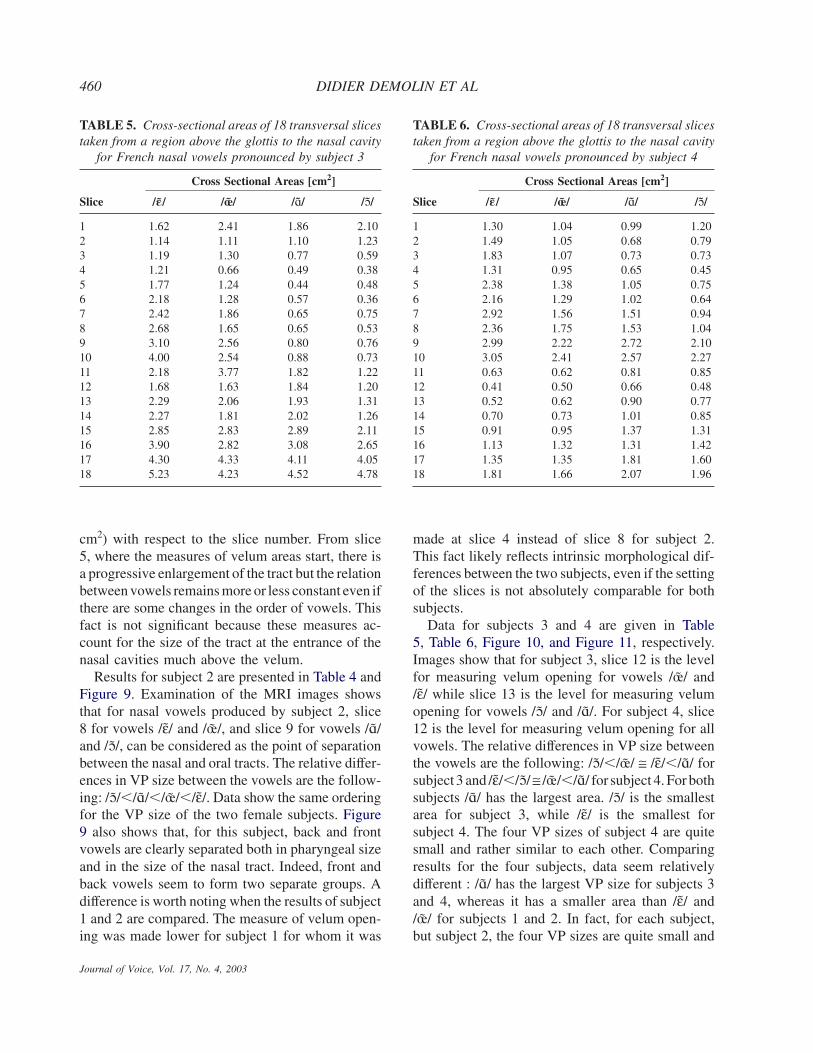
vowel, all areas corresponding to all the slices havebeen drawn for the four subjects. The first ten areasdrawn for subject 1 and areas 6 to 15 for subject 3are presented in Figure 7. The areas of all sliceshave been measured by the method described above,and the results are given (in cm2) in Table 3, 4,5, and 6. The number of measured slices for the twofemale subjects (1 and 2) and the two male subjects(3 and 4) is not the same, because of differences invocal tract length.
Results for subject 1 are presented in Table 3 andFigure 8. Examination of the MRI scans shows thatfor vowels /œ/, /ɑ/, /ε/ produced by subject 1, slice5 is the first slice showing a clear separation betweenthe oral and the nasal tract, while for /ɔ/, no clearseparation can be identified. Above this point, thereis a progressive enlargement of the areas considered.This enlargement varies from one vowel to another.For this subject, based on these data, we can con-sider that the velar port area of slice 5 provides themeasure of the velum opening. The relative differ-ences in VP size between the vowels are the following:
VELUM OPENING OF FRENCH VOWELS BY MRI 459
FIGURE 7. Areas from slices 1 to 10 for subject 1 and from slices 6 to 15 for subject 3.
TABLE 3. Cross-sectional areas of 11 transversal slicestaken from a region above the glottis to the nasal cavity
for French nasal vowels pronounced by subject 1
Cross Sectional Areas [cm2]
Slice /e/ /œ/ /ɑ/ /ɔ/
1 2.11 1.13 1.00 1.022 2.43 0.87 0.92 0.903 2.70 1.57 1.01 1.004 0.94 0.92 0.66 0.595 1.06 0.98 0.81 0.706 0.95 1.01 0.85 0.697 1.09 1.56 1.13 1.038 1.45 1.51 1.29 1.249 1.58 2.09 1.70 1.8910 2.27 2.26 2.30 2.1211 2.41 3.41 3.57 2.8912 – – – –
/ɔ/�/ɑ/�/œ/�/ε/. The two back vowels /ɔ/ and/ɑ/ have smaller openings and the two front vowels/œ/ and /ε/ have bigger openings. The smallest open-ing of the nasal tract for /ɔ/ is the consequence ofthe higher and more back position of the tonguebody among the examined vowels. The observeddifferences in velum opening clearly illustrate thearticulatory differences between vowels. The biggersize of the port for /ɑ/ compared to the port for /ɔ/
TABLE 4. Cross-sectional areas of 12 transversal slicestaken from a region above the glottis to the nasal cavity
for French nasal vowels pronounced by subject 2
Cross Sectional Areas [cm2]
Slice /e/ /œ/ /ɑ/ /ɔ/
1 1.00 0.94 – 1.002 1.28 0.83 0.99 1.213 1.74 1.43 0.98 1.264 1.82 1.45 0.79 1.235 2.42 1.87 0.83 0.966 2.23 1.86 0.75 1.017 1.39 1.69 0.91 1.058 1.42 1.16 0.47 0.359 1.62 1.25 0.41 0.3110 1.93 1.43 0.36 0.4111 2.43 1.90 0.52 0.5312 2.59 1.88 0.48 0.63
can be accounted for by the fact that even if /ɑ/ isa back vowel, it is more open than /ɔ/ and thereforethe constriction is situated lower in the tract.There are fewer differences between the two frontvowels /ε/ and /œ/, whose articulatory differenceslie in the more central and rounded positions of /œ/.The VP of /ε/ is slightly larger than /œ/. Differencesbetween all nasal vowels produced by subject 1 arepresented in Figure 8, which displays the areas (in
Journal of Voice, Vol. 17, No. 4, 2003
DIDIER DEMOLIN ET AL460
TABLE 5. Cross-sectional areas of 18 transversal slicestaken from a region above the glottis to the nasal cavity
for French nasal vowels pronounced by subject 3
Cross Sectional Areas [cm2]
Slice /e/ /œ/ /ɑ/ /ɔ/
1 1.62 2.41 1.86 2.102 1.14 1.11 1.10 1.233 1.19 1.30 0.77 0.594 1.21 0.66 0.49 0.385 1.77 1.24 0.44 0.486 2.18 1.28 0.57 0.367 2.42 1.86 0.65 0.758 2.68 1.65 0.65 0.539 3.10 2.56 0.80 0.7610 4.00 2.54 0.88 0.7311 2.18 3.77 1.82 1.2212 1.68 1.63 1.84 1.2013 2.29 2.06 1.93 1.3114 2.27 1.81 2.02 1.2615 2.85 2.83 2.89 2.1116 3.90 2.82 3.08 2.6517 4.30 4.33 4.11 4.0518 5.23 4.23 4.52 4.78
cm2) with respect to the slice number. From slice5, where the measures of velum areas start, there isa progressive enlargement of the tract but the relationbetween vowels remains more or less constant even ifthere are some changes in the order of vowels. Thisfact is not significant because these measures ac-count for the size of the tract at the entrance of thenasal cavities much above the velum.
Results for subject 2 are presented in Table 4 andFigure 9. Examination of the MRI images showsthat for nasal vowels produced by subject 2, slice8 for vowels /ε/ and /œ/, and slice 9 for vowels /ɑ/and /ɔ/, can be considered as the point of separationbetween the nasal and oral tracts. The relative differ-ences in VP size between the vowels are the follow-ing: /ɔ/�/ɑ/�/œ/�/ε/. Data show the same orderingfor the VP size of the two female subjects. Figure9 also shows that, for this subject, back and frontvowels are clearly separated both in pharyngeal sizeand in the size of the nasal tract. Indeed, front andback vowels seem to form two separate groups. Adifference is worth noting when the results of subject1 and 2 are compared. The measure of velum open-ing was made lower for subject 1 for whom it was
Journal of Voice, Vol. 17, No. 4, 2003
TABLE 6. Cross-sectional areas of 18 transversal slicestaken from a region above the glottis to the nasal cavity
for French nasal vowels pronounced by subject 4
Cross Sectional Areas [cm2]
Slice /e/ /œ/ /ɑ/ /ɔ/
1 1.30 1.04 0.99 1.202 1.49 1.05 0.68 0.793 1.83 1.07 0.73 0.734 1.31 0.95 0.65 0.455 2.38 1.38 1.05 0.756 2.16 1.29 1.02 0.647 2.92 1.56 1.51 0.948 2.36 1.75 1.53 1.049 2.99 2.22 2.72 2.1010 3.05 2.41 2.57 2.2711 0.63 0.62 0.81 0.8512 0.41 0.50 0.66 0.4813 0.52 0.62 0.90 0.7714 0.70 0.73 1.01 0.8515 0.91 0.95 1.37 1.3116 1.13 1.32 1.31 1.4217 1.35 1.35 1.81 1.6018 1.81 1.66 2.07 1.96
made at slice 4 instead of slice 8 for subject 2.This fact likely reflects intrinsic morphological dif-ferences between the two subjects, even if the settingof the slices is not absolutely comparable for bothsubjects.
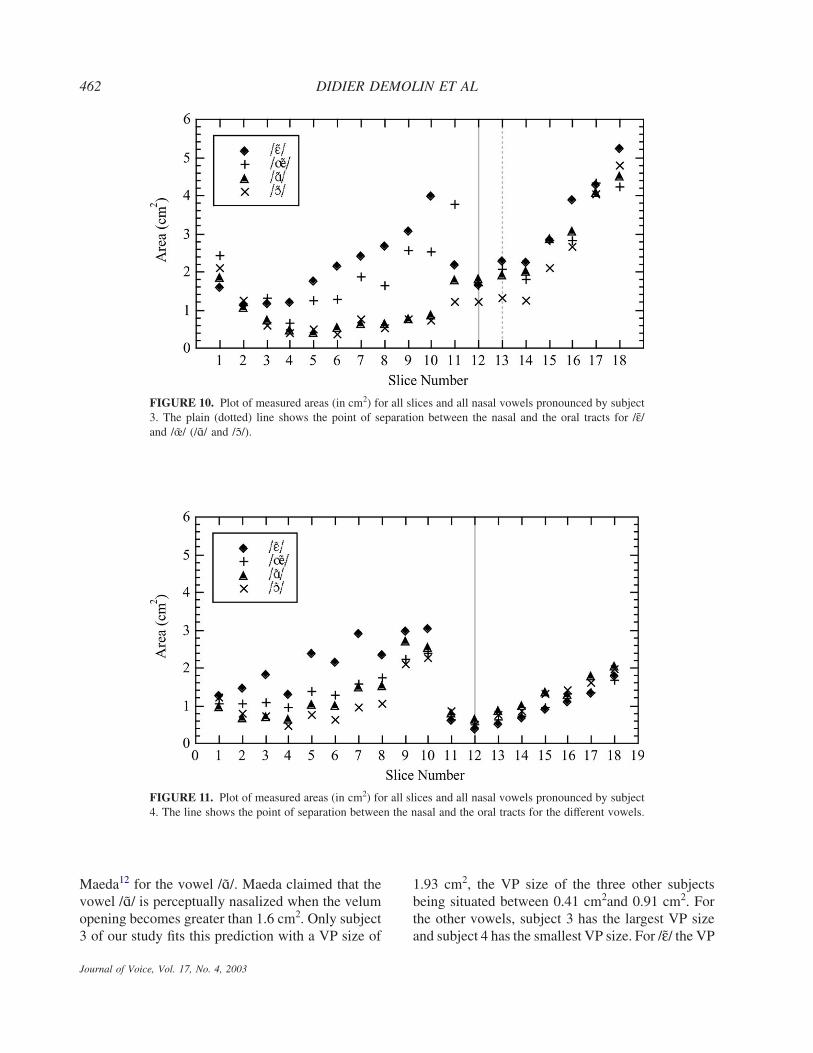
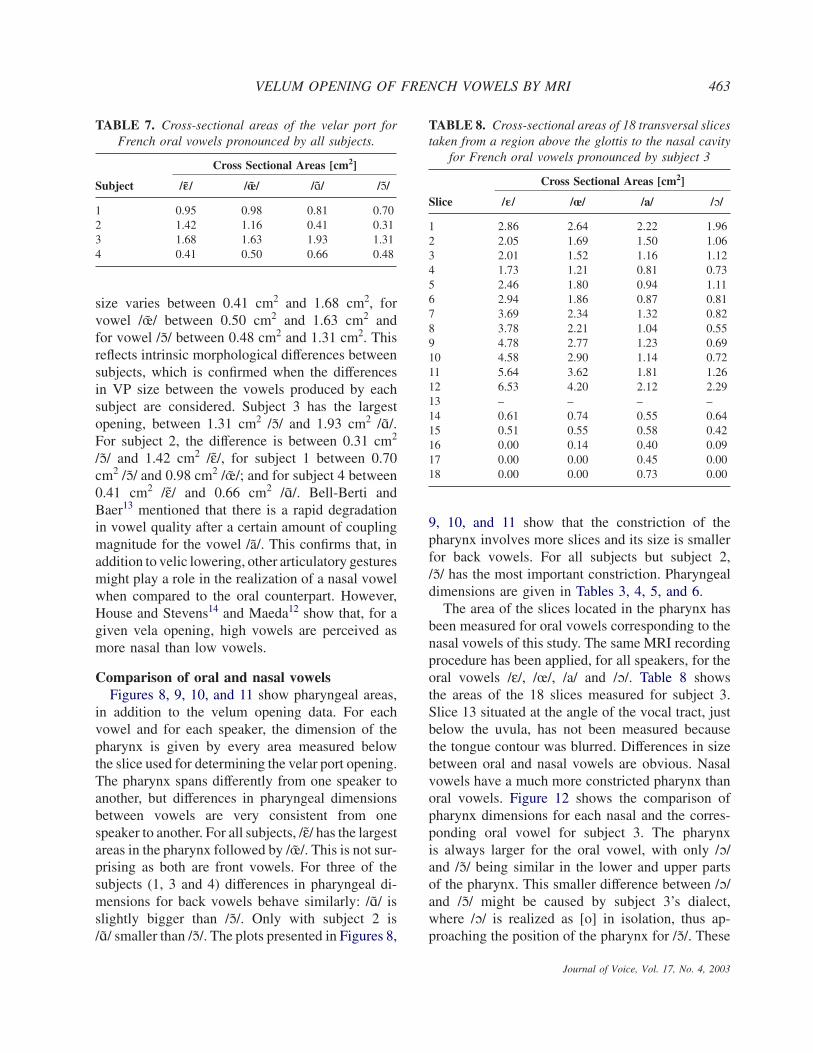
Data for subjects 3 and 4 are given in Table5, Table 6, Figure 10, and Figure 11, respectively.Images show that for subject 3, slice 12 is the levelfor measuring velum opening for vowels /œ/ and/ε/ while slice 13 is the level for measuring velumopening for vowels /ɔ/ and /ɑ/. For subject 4, slice12 is the level for measuring velum opening for allvowels. The relative differences in VP size betweenthe vowels are the following: /ɔ/�/œ/ ≅ /ε/�/ɑ/ forsubject 3 and /ε/�/ɔ/ ≅ /œ/�/ɑ/ for subject 4. For bothsubjects /ɑ/ has the largest area. /ɔ/ is the smallestarea for subject 3, while /ε/ is the smallest forsubject 4. The four VP sizes of subject 4 are quitesmall and rather similar to each other. Comparingresults for the four subjects, data seem relativelydifferent : /ɑ/ has the largest VP size for subjects 3and 4, whereas it has a smaller area than /ε/ and/œ/ for subjects 1 and 2. In fact, for each subject,but subject 2, the four VP sizes are quite small and
VELUM OPENING OF FRENCH VOWELS BY MRI 461
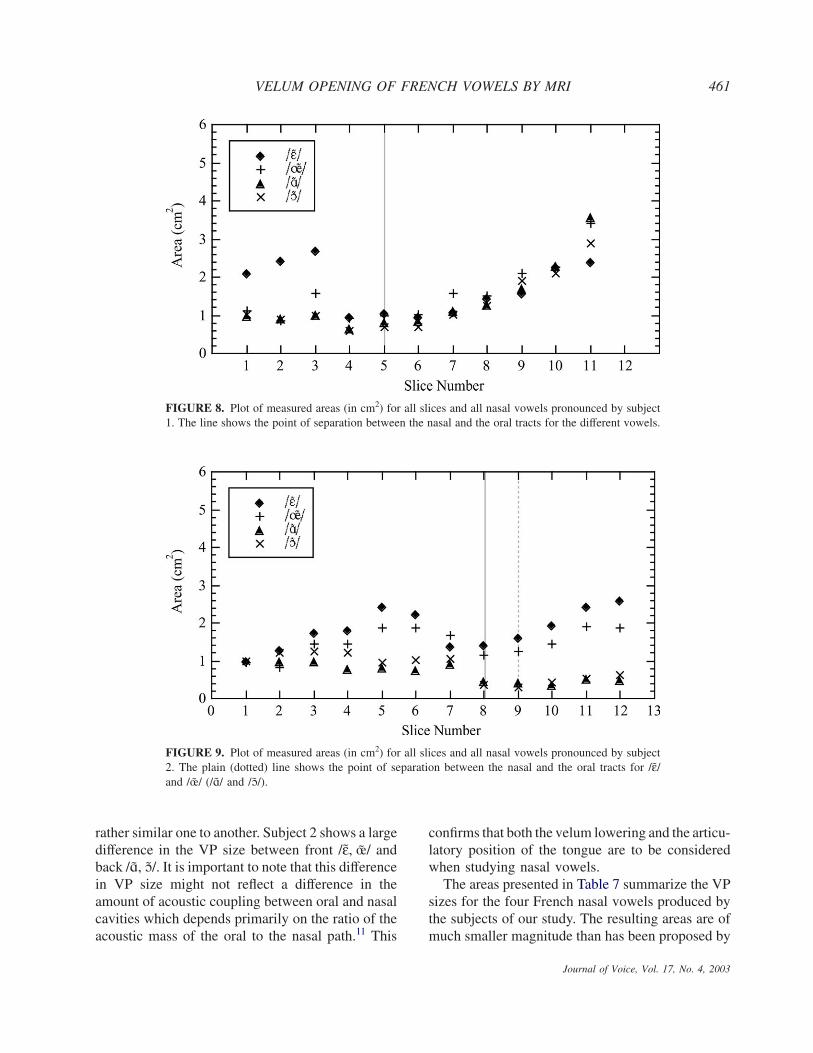
FIGURE 8. Plot of measured areas (in cm2) for all slices and all nasal vowels pronounced by subject1. The line shows the point of separation between the nasal and the oral tracts for the different vowels.
FIGURE 9. Plot of measured areas (in cm2) for all slices and all nasal vowels pronounced by subject2. The plain (dotted) line shows the point of separation between the nasal and the oral tracts for /ε/and /œ/ (/ɑ/ and /ɔ/).
rather similar one to another. Subject 2 shows a largedifference in the VP size between front /ε, œ/ andback /ɑ, ɔ/. It is important to note that this differencein VP size might not reflect a difference in theamount of acoustic coupling between oral and nasalcavities which depends primarily on the ratio of theacoustic mass of the oral to the nasal path.11 This
confirms that both the velum lowering and the articu-latory position of the tongue are to be consideredwhen studying nasal vowels.
The areas presented in Table 7 summarize the VPsizes for the four French nasal vowels produced bythe subjects of our study. The resulting areas are ofmuch smaller magnitude than has been proposed by
Journal of Voice, Vol. 17, No. 4, 2003
DIDIER DEMOLIN ET AL462
Journal of V
FIGURE 10. Plot of measured areas (in cm2) for all slices and all nasal vowels pronounced by subject3. The plain (dotted) line shows the point of separation between the nasal and the oral tracts for /ε/and /œ/ (/ɑ/ and /ɔ/).
FIGURE 11. Plot of measured areas (in cm2) for all slices and all nasal vowels pronounced by subject4. The line shows the point of separation between the nasal and the oral tracts for the different vowels.
Maeda12 for the vowel /ɑ/. Maeda claimed that thevowel /ɑ/ is perceptually nasalized when the velumopening becomes greater than 1.6 cm2. Only subject3 of our study fits this prediction with a VP size of
oice, Vol. 17, No. 4, 2003
1.93 cm2, the VP size of the three other subjectsbeing situated between 0.41 cm2and 0.91 cm2. Forthe other vowels, subject 3 has the largest VP sizeand subject 4 has the smallest VP size. For /ε/ the VP
VELUM OPENING OF FRENCH VOWELS BY MRI 463
TABLE 7. Cross-sectional areas of the velar port forFrench oral vowels pronounced by all subjects.
Cross Sectional Areas [cm2]
Subject /e/ /œ/ /ɑ/ /ɔ/
1 0.95 0.98 0.81 0.702 1.42 1.16 0.41 0.313 1.68 1.63 1.93 1.314 0.41 0.50 0.66 0.48
size varies between 0.41 cm2 and 1.68 cm2, forvowel /œ/ between 0.50 cm2 and 1.63 cm2 andfor vowel /ɔ/ between 0.48 cm2 and 1.31 cm2. Thisreflects intrinsic morphological differences betweensubjects, which is confirmed when the differencesin VP size between the vowels produced by eachsubject are considered. Subject 3 has the largestopening, between 1.31 cm2 /ɔ/ and 1.93 cm2 /ɑ/.For subject 2, the difference is between 0.31 cm2
/ɔ/ and 1.42 cm2 /ε/, for subject 1 between 0.70cm2 /ɔ/ and 0.98 cm2 /œ/; and for subject 4 between0.41 cm2 /ε/ and 0.66 cm2 /ɑ/. Bell-Berti andBaer13 mentioned that there is a rapid degradationin vowel quality after a certain amount of couplingmagnitude for the vowel /a/. This confirms that, inaddition to velic lowering, other articulatory gesturesmight play a role in the realization of a nasal vowelwhen compared to the oral counterpart. However,House and Stevens14 and Maeda12 show that, for agiven vela opening, high vowels are perceived asmore nasal than low vowels.
Comparison of oral and nasal vowelsFigures 8, 9, 10, and 11 show pharyngeal areas,
in addition to the velum opening data. For eachvowel and for each speaker, the dimension of thepharynx is given by every area measured belowthe slice used for determining the velar port opening.The pharynx spans differently from one speaker toanother, but differences in pharyngeal dimensionsbetween vowels are very consistent from onespeaker to another. For all subjects, /ε/ has the largestareas in the pharynx followed by /œ/. This is not sur-prising as both are front vowels. For three of thesubjects (1, 3 and 4) differences in pharyngeal di-mensions for back vowels behave similarly: /ɑ/ isslightly bigger than /ɔ/. Only with subject 2 is/ɑ/ smaller than /ɔ/. The plots presented in Figures 8,
TABLE 8. Cross-sectional areas of 18 transversal slicestaken from a region above the glottis to the nasal cavity
for French oral vowels pronounced by subject 3
Cross Sectional Areas [cm2]
Slice /e/ /œ/ /a/ /ɔ/
1 2.86 2.64 2.22 1.962 2.05 1.69 1.50 1.063 2.01 1.52 1.16 1.124 1.73 1.21 0.81 0.735 2.46 1.80 0.94 1.116 2.94 1.86 0.87 0.817 3.69 2.34 1.32 0.828 3.78 2.21 1.04 0.559 4.78 2.77 1.23 0.6910 4.58 2.90 1.14 0.7211 5.64 3.62 1.81 1.2612 6.53 4.20 2.12 2.2913 – – – –14 0.61 0.74 0.55 0.6415 0.51 0.55 0.58 0.4216 0.00 0.14 0.40 0.0917 0.00 0.00 0.45 0.0018 0.00 0.00 0.73 0.00
9, 10, and 11 show that the constriction of thepharynx involves more slices and its size is smallerfor back vowels. For all subjects but subject 2,/ɔ/ has the most important constriction. Pharyngealdimensions are given in Tables 3, 4, 5, and 6.
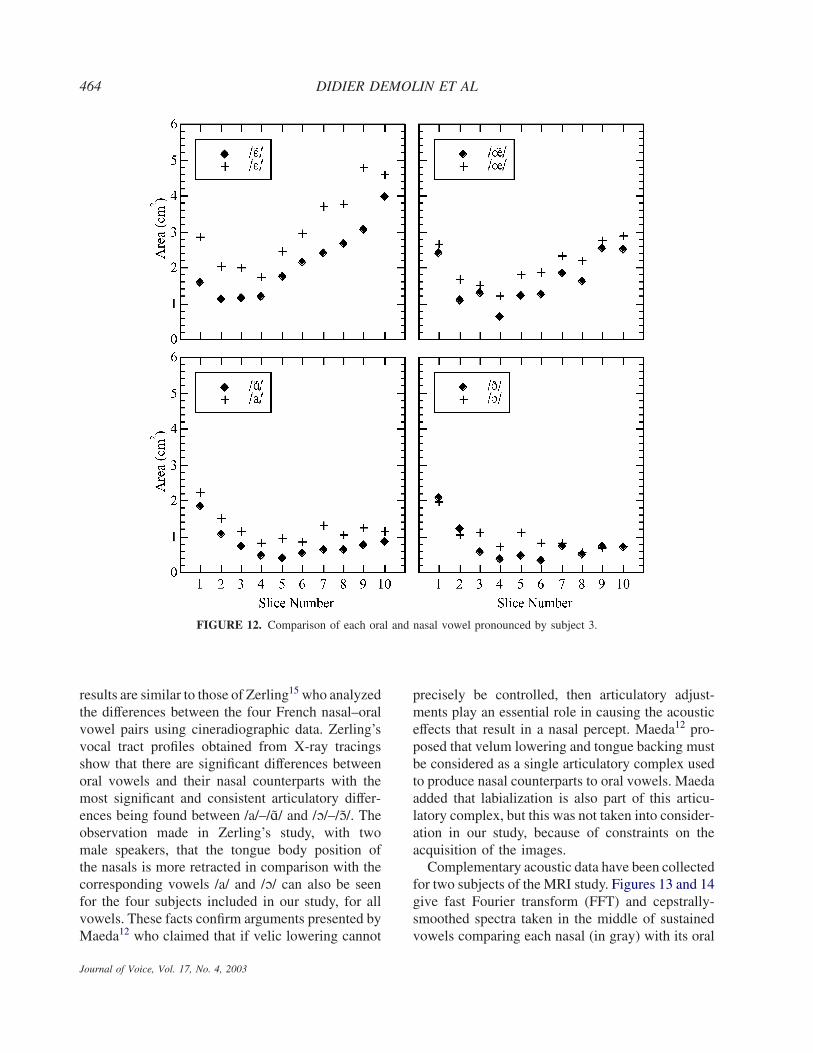
The area of the slices located in the pharynx hasbeen measured for oral vowels corresponding to thenasal vowels of this study. The same MRI recordingprocedure has been applied, for all speakers, for theoral vowels /ε/, /œ/, /a/ and /ɔ/. Table 8 showsthe areas of the 18 slices measured for subject 3.Slice 13 situated at the angle of the vocal tract, justbelow the uvula, has not been measured becausethe tongue contour was blurred. Differences in sizebetween oral and nasal vowels are obvious. Nasalvowels have a much more constricted pharynx thanoral vowels. Figure 12 shows the comparison ofpharynx dimensions for each nasal and the corres-ponding oral vowel for subject 3. The pharynxis always larger for the oral vowel, with only /ɔ/and /ɔ/ being similar in the lower and upper partsof the pharynx. This smaller difference between /ɔ/and /ɔ/ might be caused by subject 3’s dialect,where /ɔ/ is realized as [o] in isolation, thus ap-proaching the position of the pharynx for /ɔ/. These
Journal of Voice, Vol. 17, No. 4, 2003
DIDIER DEMOLIN ET AL464
Journal of V
FIGURE 12. Comparison of each oral and nasal vowel pronounced by subject 3.
results are similar to those of Zerling15 who analyzedthe differences between the four French nasal–oralvowel pairs using cineradiographic data. Zerling’svocal tract profiles obtained from X-ray tracingsshow that there are significant differences betweenoral vowels and their nasal counterparts with themost significant and consistent articulatory differ-ences being found between /a/–/ɑ/ and /ɔ/–/ɔ/. Theobservation made in Zerling’s study, with twomale speakers, that the tongue body position ofthe nasals is more retracted in comparison with thecorresponding vowels /a/ and /ɔ/ can also be seenfor the four subjects included in our study, for allvowels. These facts confirm arguments presented byMaeda12 who claimed that if velic lowering cannot
oice, Vol. 17, No. 4, 2003
precisely be controlled, then articulatory adjust-ments play an essential role in causing the acousticeffects that result in a nasal percept. Maeda12 pro-posed that velum lowering and tongue backing mustbe considered as a single articulatory complex usedto produce nasal counterparts to oral vowels. Maedaadded that labialization is also part of this articu-latory complex, but this was not taken into consider-ation in our study, because of constraints on theacquisition of the images.
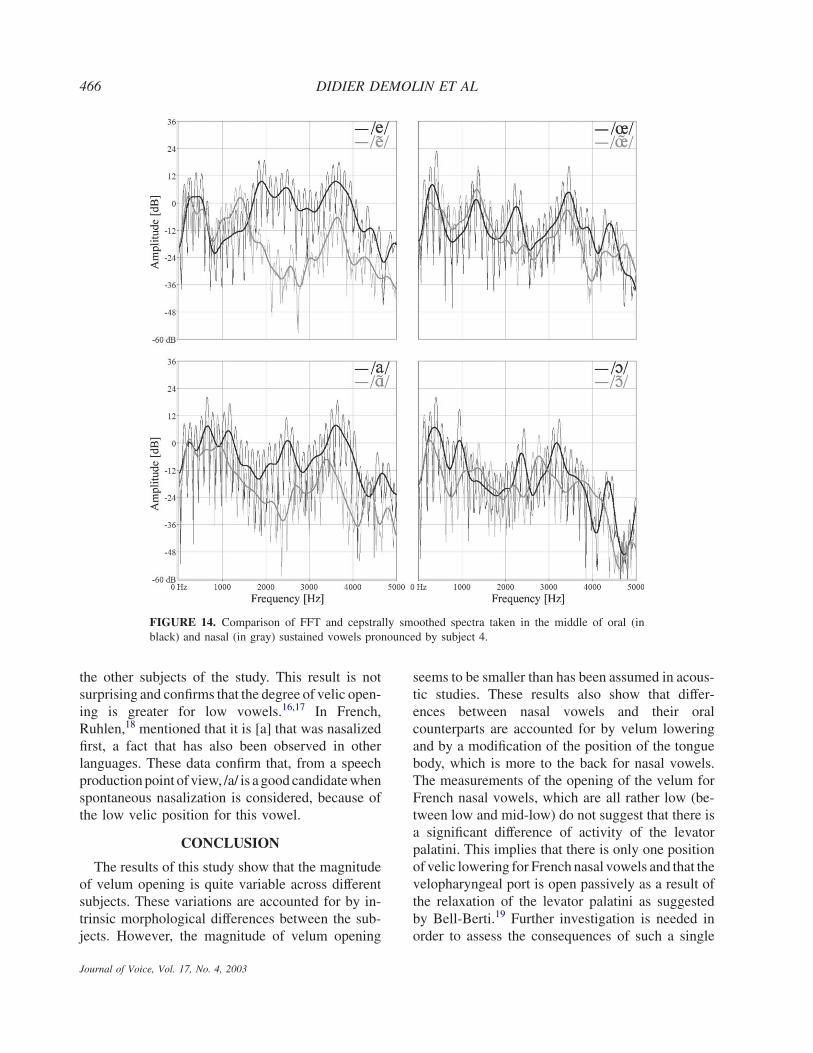
Complementary acoustic data have been collectedfor two subjects of the MRI study. Figures 13 and 14give fast Fourier transform (FFT) and cepstrally-smoothed spectra taken in the middle of sustainedvowels comparing each nasal (in gray) with its oral
VELUM OPENING OF FRENCH VOWELS BY MRI 465
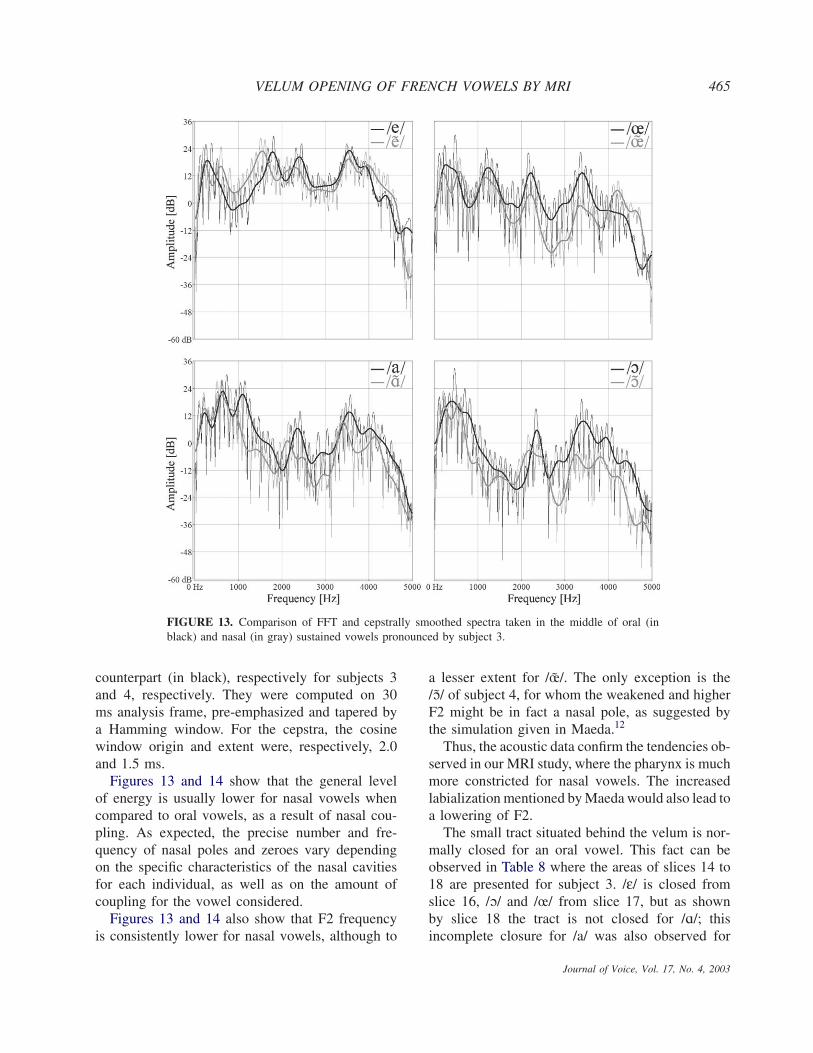
FIGURE 13. Comparison of FFT and cepstrally smoothed spectra taken in the middle of oral (inblack) and nasal (in gray) sustained vowels pronounced by subject 3.
counterpart (in black), respectively for subjects 3and 4, respectively. They were computed on 30ms analysis frame, pre-emphasized and tapered bya Hamming window. For the cepstra, the cosinewindow origin and extent were, respectively, 2.0and 1.5 ms.
Figures 13 and 14 show that the general levelof energy is usually lower for nasal vowels whencompared to oral vowels, as a result of nasal cou-pling. As expected, the precise number and fre-quency of nasal poles and zeroes vary dependingon the specific characteristics of the nasal cavitiesfor each individual, as well as on the amount ofcoupling for the vowel considered.
Figures 13 and 14 also show that F2 frequencyis consistently lower for nasal vowels, although to
a lesser extent for /œ/. The only exception is the/ɔ/ of subject 4, for whom the weakened and higherF2 might be in fact a nasal pole, as suggested bythe simulation given in Maeda.12
Thus, the acoustic data confirm the tendencies ob-served in our MRI study, where the pharynx is muchmore constricted for nasal vowels. The increasedlabialization mentioned by Maeda would also lead toa lowering of F2.
The small tract situated behind the velum is nor-mally closed for an oral vowel. This fact can beobserved in Table 8 where the areas of slices 14 to18 are presented for subject 3. /ε/ is closed fromslice 16, /ɔ/ and /œ/ from slice 17, but as shownby slice 18 the tract is not closed for /ɑ/; thisincomplete closure for /a/ was also observed for
Journal of Voice, Vol. 17, No. 4, 2003
DIDIER DEMOLIN ET AL466
Journal of Vo
FIGURE 14. Comparison of FFT and cepstrally smoothed spectra taken in the middle of oral (inblack) and nasal (in gray) sustained vowels pronounced by subject 4.
the other subjects of the study. This result is notsurprising and confirms that the degree of velic open-ing is greater for low vowels.16,17 In French,Ruhlen,18 mentioned that it is [a] that was nasalizedfirst, a fact that has also been observed in otherlanguages. These data confirm that, from a speechproduction point of view, /a/ is a good candidate whenspontaneous nasalization is considered, because ofthe low velic position for this vowel.
CONCLUSION
The results of this study show that the magnitudeof velum opening is quite variable across differentsubjects. These variations are accounted for by in-trinsic morphological differences between the sub-jects. However, the magnitude of velum opening
ice, Vol. 17, No. 4, 2003
seems to be smaller than has been assumed in acous-tic studies. These results also show that differ-ences between nasal vowels and their oralcounterparts are accounted for by velum loweringand by a modification of the position of the tonguebody, which is more to the back for nasal vowels.The measurements of the opening of the velum forFrench nasal vowels, which are all rather low (be-tween low and mid-low) do not suggest that there isa significant difference of activity of the levatorpalatini. This implies that there is only one positionof velic lowering for French nasal vowels and that thevelopharyngeal port is open passively as a result ofthe relaxation of the levator palatini as suggestedby Bell-Berti.19 Further investigation is needed inorder to assess the consequences of such a single
VELUM OPENING OF FRENCH VOWELS BY MRI 467
velum position for nasal vowels differing in theirtongue configuration, as the amount of acoustic cou-pling is expected to differ with the ratio of nasal tooral tract areas. Furthermore, studies in languageshaving nasal vowels at all levels of tongue height(from low to high) should reveal any significant dif-ferences in the magnitude of velum opening and inthe activity of the levator palatini when high vowelsare taken into consideration.
Acknowledgements: This work has been partially sup-ported by the “Communaute Francaise de Belgique” inthe framework of the ARC 226-98/02.
REFERENCES
1. Demolin D, Hombert J-M, Lecuit V, Soquet A, Sege-barth C. An MRI study of French vowels. Eurospeech.1995:2235–2238.
2. Story BH, Titze IR, Hoffman E. Vocal tract area functionsfrom magnetic resonance imaging. J Acoust Soc Am. 1996;100:537–554.
3. Krakow MK, Huffman RA. Nasals, Nazalization and theVelum. New York, NY: Academic Press; 1993.
4. Matsamura M. Measurement of three-dimensional shapesof vocal tract and nasal cavity using magnetic resonanceimaging. Proceedings of the ICLSP. Yokohama, Japan:ICLSP; 1992:779–782.
5. Matsamura M, Niikawa T, Shimizu K, Hashimoto Y, MoritaT. Measurement of 3D shape of vocal tract, dental crownand nasal cavity using MRI: vowels and fricatives. Proceed-ings of the ICLSP. Yokohama, Japan: ICLSP; 1994:619–622.
6. Demolin D, Lecuit V, Metens T, Nazarian B, Soquet A.Magnetic resonance measurements of the velum port open-ing. Proccedings of the ICLSP. Sidney, Australia: ICLSP;1998:425–428.
7. Moon JB, Canady JW. Effects of gravity on velopharyngealmuscle activity during speech. Cleft Palate-Craniofac J.1995;32:371–375.
8. Baer T, Gore JC, Gracco LC, Nye PW. Analysis of vocaltract shape and dimensions using magnetic resonance im-aging: vowels. J Acoust Soc Am. 1991;90:799–828.
9. Demolin D, Segebarth C. Analyse de la production desvoyelles de quelques langues Soudan central par IRM.Actes des XIXemes Journees d’Etude de la Parole. 1992:37–42.
10. Tiede MK, Masaki S, Vatikiotis-Bateson E. Contrasts inspeech articulation observed in sitting and supine condi-tions. Proceedings of the 5th Seminar on Speech Produc-tion: Models and Data. Bavaria, Kloster Seeon; 2000:25–28.
11. Stevens KN. Acoustic phonetics. Cambridge, MA: The MITPress; 1998.
12. Maeda S. Acoustics of vowel nasalization and articulatoryshifts in French nasal vowels. In: Krakow MK, HuffmanRA, eds. Nasals, Nasalization and the Velum. New York,NY: Academic Press; 1993:147–167.
13. Bell-Berti F, Baer T. Velar position, port size and vowelspectra. Proceedings of the 11th International Congress ofAcoustics. Paris, France; 1983:19–21.
14. House AS, Stevens KN. Analog studies of nasalization ofvowels. J Speech Hear Dis. 1956;21:218–232.
15. Zerling J-P. Phenomenes de nasalite et de nasalisation vo-caliques: Etude cineradiographique pour deux locuteurs.Travaux de l’Institut de Phonetique de Strassbourg. 1984;16:241–266.
16. Ladefoged P. Preliminaries to Linguistic Phonetic. Chicago,IL: University Press; 1971.
17. Vaissiere J. Nasalite et phonetique. Voile pathologique. So-ciete Francaise de Phoniatrie et Societe Francaise d’Acoustique. 1995:81–92.
18. Ruhlen M. Nasal vowels. In: Greenberg JH, ed. Universalsof Human Language. Vol 2. Phonology. Palo Alto, CA:Stanford University Press; 1978:203–241.
19. Bell-Berti F. Understanding velic motor control: studies ofsegmental context. In: Krakow MK, Huffman RA, eds.Nasals, Nasalization and the Velum. New York: AcademicPress; 1993:63–85.
Journal of Voice, Vol. 17, No. 4, 2003