Determination of the virus diversity associated with Grapevine ...
120
Determination of the virus diversity associated with Grapevine leafroll disease By: Nicholas Molenaar Thesis presented in partial fulfillment of the requirements for the degree of Master of Science in the Faculty of AgriSciences at Stellenbosch University Supervisor: Dr. H.J. Maree Co-supervisor: Prof. J.T. Burger March 2015
-
Upload
khangminh22 -
Category
Documents
-
view
1 -
download
0
Transcript of Determination of the virus diversity associated with Grapevine ...

Determination of the virus diversity associated with Grapevine leafroll disease
By: Nicholas Molenaar
Thesis presented in partial fulfillment of the requirements for the degree of Master of Science in the Faculty of AgriSciences at Stellenbosch University
Supervisor: Dr. H.J. Maree Co-supervisor: Prof. J.T. Burger
March 2015

! II!
Declaration
By submitting this thesis electronically, I declare that the entirety of the work contained therein is
my own, original work, that I am the sole author thereof (save to the extent explicitly otherwise
stated), that reproduction and publication thereof by Stellenbosch University will not infringe any
third party rights and that I have not previously in its entirety or in part submitted it for obtaining
any qualification.
December 2014
Copyright © 2015 Stellenbosch University
All rights reserved
Stellenbosch University https://scholar.sun.ac.za

! III!
Abstract
Vitis vinifera is the woody crop most susceptible to intracellular pathogens. Currently 70 pathogens
infect grapevine, of which 63 are of viral origin. Grapevine leafroll-associated virus 3 (GLRaV-3)
is the type species of the genus Ampelovirus, family Closteroviridae. It is considered to be the
primary causative agent of Grapevine leafroll disease (GLD) globally; however, the etiology of
GLD is not completely understood. Here we report on the viral populations present in GLD
symptomatic grapevines across the Western Cape province, South Africa. A widespread survey was
performed to screen 315 grapevines for 11 grapevine-infecting viruses using RT-PCR. Additionally,
GLRaV-3 variant groups were distinguished with high-resolution melt (HRM) curve analysis used
in conjunction with real-time RT-PCR. Members of the family Closteroviridae were detected with
the highest frequency, particularly GLRaV-3 that was detected in 87% of tested plants. Next-
generation sequencing (NGS) is capable of detecting known and novel viruses without prior
knowledge of viral sequences and when used in a metagenomic approach is able to detected viral
populations within diseased vines. A total of 17 grapevine samples were subjected to NGS using
either an Illumina MiSeq or HiSeq 2500 instrument to determine the virome within GLD vines.
Collectively, more than 190 million reads were generated through NGS. Read datasets were
trimmed and filtered for quality and subjected to both read-mapping and de novo assembly. Contigs
assembled de novo were analyzed with BLAST (Basic Local Alignment Search Tool) against the
NCBI (National Centre for Biotechnology Information) database and it was determined that
GLRaV-3 was the best-represented virus, comprising 97.5% of the assembled contigs. Grapevine
virus F (GVF) was detected for the first time in South African vineyards through de novo
assemblies and the complete genome sequence validated through direct Sanger sequencing. The
complete genome of GVF isolate V5 spans 7 539 nucleotides and shares 89.11% nucleotide identity
to existing GVF genomes. The data generated through this study will assist in further understanding
the etiology of GLD, support the current hypothesis of GLRaV-3 as the primary contributor to GLD,
aid in understanding virus associations in diseased vines and potentially develop systems in which
to control disease spread and symptom severity.
Stellenbosch University https://scholar.sun.ac.za

! IV!
Opsomming
Vitis vinifera is die houtagtige oes wat die mees vatbaarste is vir intrasellulêre patogene. Tans word
wingerde deur 70 patogene geïnfekteer, waarvan 63 van virale oorsprong is. Grapevine leafroll-
associated virus 3 (GLRaV-3) is die tipe spesie van die genus Ampelovirus, familie Closteroviridae.
Dit word globaal beskou as die primêre oorsaak van Wingerd krulblaar-siekte (GLD), alhoewel die
etiologie van GLD nie heeltemal begryp word nie. In hierdie verslag word die virale populasies
teenwoordig in GLD simptomatiese wingerde oor die Wes-Kaap provinsie in Suid-Afrika
gerapporteer. ‘n Wydverspreide opname was uitgevoer om 315 wingerde met 11 wingerd-
infekterende virusse te ondersoek, deur gebruik te maak van tru-transkripsie polimerase ketting
reaksie (PKR). Verder is variantgroepe van GLRaV-3 onderskei met hoë-resolusie smeltingskurwe-
analise, tesame met die gebruik van in-tyd tru-transkripsie PKR. Die hoogste frekwensie was van
die lede van die familie Closteroviridae, veral GLRaV-3 wat in 87% van die ondersoekte plante
gevind is. Nuwe-generasie volgorderbepaling (NGS) beskik oor die vermoë om bekende en nuwe
virusse te herken in virale populasies in geaffekteerde wingerde sonder vorige kennis van virale
volgorderbepalings en wanneer dit in ‘n metagenomiese benadering gebruik word kan die virale
bevolkings binne siek wingerde ontdek. ‘n Totaal van 17 wingerd-steekproewe was blootgestel aan
NGS deur die gebruik van of ‘n Illumina MiSeq of ‘n HiSeq 2500 instrument om die virome te
bepaal van GLD wingerde. In totaal is meer 190 miljoen lesings gegenereer deur NGS. Hierdie data
lesings was verwerk en gefilter vir kwaliteit om onderwerp te word vir beide kartering en de novo
samestellings. Contigs verkry deur de novo samestellings was geanaliseer met BLAST (Basic
Local Alignment Search Tool) teenoor die NCBI (National Centre for Biotechnology Information)
databasis en dit was vasgestel dat GLRaV-3 was die mees-verteenwoordigende virus, bestaande uit
97.5% van die saamgestelde contigs. Grapevine virus F (GVF) was vir die eerste keer in Suid-
Afrikaanse wingerde waargeneem deur de novo samestellings en die volledige genoom volgordger
is geverifieer deur middel van direkte Sanger volgorderbepaling. Die volledige genoom van GVF
isoleer V5 spanwydte van 7539 nukleotiedes en deel 89.11% nukleotied identiteite van bestaande
GVF genome. Die gegenereerde data van hierdie studie sal bykomende begrip van die etiologie
van GLD bystaan, die huidige hipotese van GLRaV-3 as die primêre bydraer tot GLD ondersteun,
verhoogde begrip van virus-assosiasies in wingerdsiektes verseker en potensiële sisteme ontwikkel
om siektes en simptome te beheer.
Stellenbosch University https://scholar.sun.ac.za

! V!
Acknowledgements
I would like to acknowledge the following people and institutions for their various contributions to
this study:
• Professor J.T. Burger, for granting me the opportunity to form part of an outstanding
research group and for his guidance and supervision throughout this study.
• Doctor H.J. Maree, for providing me with the knowledge and skills to perform this study
and for his ongoing guidance and supervision.
• Doctor A.E.C. Jooste, for allowing me to form part of her research.
• Members of the Vitis lab, for their support and guidance.
• Wine farm owners and managers, for allowing and assisting in sample collections.
• Family and friends.
• Winetech, for research funding.
• THRIP, for research funding.
• The financial assistance of the National Research Foundation (NRF) towards this research is
hereby acknowledged. Opinions expressed and conclusions arrived at, are those of the
authors and are not necessarily to be attributable to the NRF.
• SASEV, for allowing me to present my research at the 35th South African Society for
Enology and Viticulture congress, Somerset West, South Africa, November 2013.
• The Agricultural Bioscience International Conference (ABIC), for their travel grant to
attend ABIC 2014 and present at the Tomorrows Leaders Forum, Saskatoon, Canada,
October 2014.
• Stellenbosch University, for providing me with the resources to accomplish my research.
Stellenbosch University https://scholar.sun.ac.za

! VI!
Table of contents
Declaration ..................................................................................................................................... II
Abstract .......................................................................................................................................... III
Opsomming ................................................................................................................................... IV
Acknowledgements ...................................................................................................................... V
Table of contents ......................................................................................................................... VI
List of abbreviations .................................................................................................................. IX
List of figures ............................................................................................................................. XIII
List of tables ................................................................................................................................ XV !
Chapter 1: Introduction ............................................................................................................. 1
1.1. General introduction ................................................................................................................. 1
1.2. Aims and objectives .................................................................................................................. 3 1.3. Chapter layout ........................................................................................................................... 3
1.4. Research outputs ....................................................................................................................... 4 1.4.1. Publications .................................................................................................................... 4
1.4.2. Conference proceedings ................................................................................................. 4 1.4.3. International presentation ............................................................................................... 5
1.4.4. Poster .............................................................................................................................. 5 1.5. References ................................................................................................................................ 5
1.6. Internet Sources ........................................................................................................................ 6!!
Chapter 2: Literature review .................................................................................................... 7
2.1. Introduction .............................................................................................................................. 7 2.2. Grapevine leafroll disease ........................................................................................................ 7
2.2.1. Distribution and etiology ............................................................................................... 7 2.2.2. Symptomatology ............................................................................................................ 8
2.2.3. Associated viruses ........................................................................................................ 10 2.2.4. Transmission ................................................................................................................ 10
2.2.5. Disease management .................................................................................................... 11 2.3. Grapevine leafroll-associated virus type 3 ............................................................................. 12
2.3.1. Taxonomy .................................................................................................................... 12 2.3.2. Morphology and genome organization ........................................................................ 13
2.3.3. Virus replication and genome expression .................................................................... 15
Stellenbosch University https://scholar.sun.ac.za

! VII!
2.3.4. Distribution and genetic variants ................................................................................. 16
2.4. A means to viral diagnostics .................................................................................................. 17 2.4.1. Biological indexing ...................................................................................................... 17
2.4.2. Serological assays ........................................................................................................ 18 2.4.3. Nucleic-acid based techniques ..................................................................................... 19
2.5. Metagenomics and next-generation sequencing .................................................................... 20 2.5.1. Introduction .................................................................................................................. 20
2.5.2. Next-generation sequencing platforms ........................................................................ 21 2.5.3. Bioinformatics associated with next-generation sequencing ....................................... 23
2.5.4. Application of next-generation sequencing with grapevine diseases .......................... 25 2.6. Conclusion ............................................................................................................................. 26
2.7. References .............................................................................................................................. 26 2.8. Internet Sources ...................................................................................................................... 33
!Chapter 3: Identification and distribution of multiple virus infections in grapevine leafroll diseased vineyards .................................................................................. 35
3.1. Introduction ............................................................................................................................ 35
3.2. Materials and Methods ........................................................................................................... 36 3.2.1. Sampling ...................................................................................................................... 36
3.2.2. GLRaV-3 variant status ............................................................................................... 37 3.2.3. RT-PCR diagnostics ..................................................................................................... 38
3.3. Results and Discussion ........................................................................................................... 40 3.3.1. GLRaV-3 variant status ............................................................................................... 40
3.3.2. Adjusted HRM confidence intervals ............................................................................ 40 3.3.3. Distribution of GLRAV-3 variants in vineyards .......................................................... 40
3.3.4. Virus populations in GLD-affected plants ................................................................... 44 3.4. Conclusion ............................................................................................................................. 49
3.5. References .............................................................................................................................. 49 !
Chapter 4: Determination of the virus diversity associated with Grapevine Leafroll disease using next-generation sequencing ........................................................ 52
4.1. Introduction ............................................................................................................................ 52 4.2. Materials and Methods ........................................................................................................... 53
4.2.1. Plant material ............................................................................................................... 53 4.2.2. Double-stranded RNA extractions from grapevines .................................................... 54
4.2.3. Library preparations and next-generation sequencing ................................................. 55 4.2.4. Sequence analysis and pre-processing ......................................................................... 55
Stellenbosch University https://scholar.sun.ac.za
! VIII!
4.3. Results and Discussion ........................................................................................................... 58
4.3.1. Plant material and double-stranded RNA extractions .................................................. 58 4.3.2. Illumina sequencing and pre-processing ...................................................................... 59
4.3.3. Read-mappings and analyses ....................................................................................... 60 4.3.4. De novo assemblies and analyses ................................................................................ 64
4.4. Conclusion ............................................................................................................................. 69 4.5. References .............................................................................................................................. 69
4.6. Internet Sources ...................................................................................................................... 71 !
Chapter 5: Detection of Grapevine virus F in South African vineyards through de novo assemblies ...................................................................................................................... 72
5.1. Introduction ............................................................................................................................ 72 5.2. Materials and Methods ........................................................................................................... 74
5.2.1. Plant material ............................................................................................................... 74 5.2.2. Next-generation sequencing and post-sequencing analyses ........................................ 74
5.2.3. Total RNA extractions and RT-PCR ........................................................................... 75 5.2.4. Sanger sequencing and amplicon assembly ................................................................. 77
5.2.5. Genetic variability ........................................................................................................ 77 5.3. Results and Discussion ........................................................................................................... 78
5.3.1. Next-generation sequencing and sample selection ...................................................... 78 5.3.2. RT-PCR and Sanger sequencing ................................................................................. 79
5.3.3. Genetic variability ........................................................................................................ 79 5.4. Conclusion ............................................................................................................................. 82
5.5. References .............................................................................................................................. 83 5.6. Internet Sources ...................................................................................................................... 84
!Chapter 6: Conclusion ............................................................................................................... 85
6.1. Conclusion and future prospects ............................................................................................ 85
6.2. References .............................................................................................................................. 87 6.3. Internet Sources ...................................................................................................................... 87
!
Supplementary data ................................................................................................................... 88
Stellenbosch University https://scholar.sun.ac.za

! IX!
List of abbreviations
aa Amino acid
ABI Applied Biosystems
ABIC Agricultural Bioscience International Conference
AGVd Australian grapevine viroid
AlkB 2-oxoglutarate-Fe2 oxygenase
AMV Avian myeloblastosis virus
ARC-BP Agricultural Research Council Biotechnology Platform
BLAST Basic Local Alignment Search Tool
bp Base pair
BWT Burrows-Wheeler Transform
BYV Beet yellows virus
CAF Central Analytical Facilities
CCD Charge-couple device
cDNA Complementary DNA
CP Coat protein
CPm Minor capsid protein
CTAB Cetyltrimethylammonium bromide
CTV Citrus tristeza virus
cv Cultivar
DAC-ELISA Direct antigen-coating ELISA
DAS-ELISA Double antibody sandwich ELISA
DNA Deoxyribonucleic acid
dNTP Deoxynucleotide triphosphate
DOI Digital object identifier
dsRNA Double-stranded RNA
EDTA Ethylenediamine tetra-acetic acid
ELISA Enzyme-linked immunosorbent assay
EtBr Ethidium Bromide
EtOH Ethanol
Stellenbosch University https://scholar.sun.ac.za

! X!
FSM First strand master mix
GB Gigabase
GEEV Grapevine endophyte endornavirus
GLD Grapevine leafroll disease
GLRaV Grapevine leafroll-associated viruses
GLRaV-1 Grapevine leafroll-associated virus 1
GLRaV-2 Grapevine leafroll-associated virus 2
GLRaV-3 Grapevine leafroll-associated virus 3
GLRaV-4 Grapevine leafroll-associated virus 4
GLRaV-5 Grapevine leafroll-associated virus 5
GLRaV-6 Grapevine leafroll-associated virus 6
GLRaV-7 Grapevine leafroll-associated virus 7
GLRaV-8 Grapevine leafroll-associated virus 8
GLRaV-9 Grapevine leafroll-associated virus 9
GLRaV-Car Grapevine leafroll-associated virus Car
GLRaV-De Grapevine leafroll-associated virus De
GLRaV-Pr Grapevine leafroll-associated virus Pr
GNV Grapevine-associated narnavirus
GRSPaV Grapevine rupestris stem pitting-associated virus
GRVFV Grapevine rupestris vein-feathering virus
GSyV-1 Grapevine syrah virus 1
GVA Grapevine virus A
GVB Grapevine virus B
GVD Grapevine virus D
GVE Grapevine virus E
GVF Grapevine virus F
GYSVd Grapevine yellow speckled viroid
HLV Heracleum latent virus
HRM High-resolution melt
HSP70h Heat shock protein 70 homologue
HSVd Hop stunt viroid
Stellenbosch University https://scholar.sun.ac.za

! XI!
IC-PCR Immunocapture PCR
ICTV International Committee on Taxonomy of Viruses
ICVG International Council for the Study of Virus and Virus-like Diseases of grapevine
IF Immunofluorescence
kb Kilobase
LAMP Loop-mediated amplification of nucleic acids
LChV Little cherry virus
LIYV Lettuce infectious yellow virus
MAQ Mapping and Assembly Quality
Mha Million hectares
Mhl Million hectoliters
mRNA Messenger RNA
MV2 Mint virus 2
NCBI National Centre for Biotechnology Information
NGS Next-generation sequencing
NRF National Research Foundation
nt Nucleotide
nts Nucleotides
OD Optical density
ORF Open reading frame
OS Operating system
PCR Polymerase Chain Reaction
PGM Personal genome machine
PVP Polyvinylpyrrolidone
qPCR Quantitative PCR
RAM Random access memory
RdRp RNA-dependent RNA polymerase
RNA Ribonucleic acid
RO-H2O Reverse Osmosis water
rpm Revolutions per minute
Stellenbosch University https://scholar.sun.ac.za

! XII!
RSA Republic of South Africa
RT Room temperature
RT-PCR Reverse-transcription Polymerase Chain Reaction
SASEV South African Society for Enology and Viticulture
SAWIS South African Wine Industry Information and Systems
SBS Sequencing by synthesis
SDS Sodium dodecyl sulfate
sgRNA Sub-genomic RNA
SMRT Single-molecule real-time
SOLiD Sequencing by Oligonucleotide Ligation and Detection
SRT Superscript II reverse transcriptase
SSCP Single-stranded conformation polymorphism
ssRNA Single-stranded RNA
SSM Second strand master mix
STE Sodium/ Tris/ EDTA
TAE Tris-acetic acid/ EDTA
Taq Thermus aquaticus DNA polymerase
TAS-ELISA Triple antibody sandwich ELISA
Tris-HCL 2-amino-2-(hydroxymethyl)-1,3-propanediol-hydrochloric acid
U Unit
UTR Untranslated region
Stellenbosch University https://scholar.sun.ac.za

! XIII!
List of figures
Figure 2.1: Visual symptoms of GLD. A) Infected red-fruited cultivar, Vitis vinifera cv Cabernet Franc. B) Infected white-fruited cultivar, Vitis vinifera cv Chardonnay (Maree et al. 2013) ............. 9
Figure 2.2: Photographs of Vitis vinifera mealybugs. A) Planococcus ficus (www.udec.ru/vrediteli/chervec.php) B) Pseudococcus longispinus (http://www.bcpcertis.com/Certis.bcp/English/Home/Our+Solutions/Biological+Controls/Pests+Find+out+more/Mealybug+find+out+more/page.aspx/1091) ................................................................ 11
Figure 2.3: Purified GLRaV-3 virion particles, isolated from a GLD vine, visualized with a transmission electron microscope and stained with 1% (w/v) aqueous uranyl acetate. (Picture by G.G.F. Kasdorf) ................................................................................................................................. 13
Figure 2.4: Schematic representation, drawn to scale, of the GLRaV-3 isolate GP18 genome. Outlined are the ORF sizes and positions (nt) and corresponding encoded proteins as well as the untranslated regions (UTRs) adapted from Maree et al. 2008 ........................................................... 15
Figure 3.1: Bar graphs representing the distribution and occurrence of single and mixed virus infections. A) Distribution of single variant infections per district. B) Percentage occurrence of 14 mixed variant combinations in vineyards with variant groups II/VI as the most prevalent .............. 41
Figure 3.2: Bar graphs of the infection frequency between regions of the Western Cape and between red and white cultivars. A) The total GLRaV-3 variant distribution per region. B) The total GLRaV-3 distribution in white and red cultivars ............................................................................... 42
Figure 3.3: Pie chart representing the distribution of individual GLRaV-3 variant percentage infection detected in vineyards .......................................................................................................... 43
Figure 3.4: Distribution of viruses in three regions of the Western Cape including the Breede river valley region, Cape south coast region and the Coastal region (c2
(df=14)=22.56 P=0.0678) ............... 45
Figure 3.5: Pie chart illustration of the grapevine virus percentage distribution of detected viruses in vineyards and signifying the differences in proportion between viruses ....................................... 45
Figure 3.6: Average virus population per cultivar where cultivars are representative of the five most economically important in South Africa. Virus populations range between 2.31 and 3.03 viruses per sample .............................................................................................................................. 48
Figure 3.7: Average virus population per age of grapevine sampled. Ages of grapevines range from 6 to 18 years and average virus population ranges from 2 to 3.2 viruses .......................................... 49
Figure 4.1: Graphical representation of the bioinformatic workflow followed in processing the Illumina short read data using the FASTX-Toolkit package, CLC Genomics Workbench 7 and Blast2GO. This workflow was implemented with each of the 17 read datasets ................................ 58
Figure 4.2: Graphs illustrating the quality of the sample 4 (49STOK) sequence dataset, generated in FastQC. A) The percentage nucleotide composition per base, used to trim nucleotides from the 5’-end. B) The average quality score (Phred scores), used to trim nucleotides from the 3’-end. Blue line indicates mean quality score across dataset C) A minimum Phred score of Q20 was used for filtering. D) The sequence dataset quality following trimming and filtering. Checkered red lines display thresholds at which trimming and filtering occurred ............................................................ 59
Figure 4.3: Line graph displaying the loss in sequencing data through the trimming and filtering process for each Illumina platform used, namely: MiSeq (2013 samples) and HiSeq 2500 (2014 samples ............................................................................................................................................... 60
Stellenbosch University https://scholar.sun.ac.za

! XIV!
Figure 4.4: Graphical representations of the distribution of de novo assembly data to different categories of organisms, determined through Blast2GO. A) Distribution of de novo assembled reads using the tblastx function of Blast2GO. B) Distribution of de novo assembled reads using the blastn function of Blast2GO ......................................................................................................................... 66
Figure 4.5: Bar chart displaying the percentage distribution of total reads generated through blastn (blue shade) and tblastx (red shade) searches (Blast2GO) to grapevine viruses per sample ............. 67
Figure 4.6: Chart representations of the pooled viral population within sampled grapevines, established through de novo assemblies. A) Percentage distribution of GLRaV-3 variant groups (denoted in brackets), as the primary causative agents of GLD. B) Viruses detected at lower frequencies whose percentage distribution comprises “Other” (1A) ................................................. 68
Figure 5.1: Electron micrograph of a GVA virion particle stained in uranyl acetate. The bar positioned on the bottom left corner of the image represents a length of 100 nm (Martelli et al., 2011) .................................................................................................................................................. 72
Figure 5.2: Schematic representations of the scaled size and organization of the GVF isolate V5 genome and the phylogenetic relationship shared between vitiviruses. A) Relative sizes drawn to scale, and protein domains encoded by ORFs present in the GVF isolate V5 genome. ORF1 encodes the conserved domains of methyltransferase (Met), a member of the Fe (II)-oxoglutarate-dependent dioxygenase superfamily (AlkB), RNA Helicase1 (Hel) and RNA-dependent RNA polymerase (RdRP). ORF2 to ORF5 encode a hypothetical protein (HP), movement protein (MP), coat protein (CP) and RNA-binding protein (RBP), respectively. B) Circular cladogram, of an unrooted tree of Vitiviruses using the neighbor-joining algorithm and a bootstrap replicate of 1000 for full length replicase genes, with the exception of the GVD representative. Values on branches represent bootstrap percentages ......................................................................................................................... 82
Protocol S.1: Illumina TruSeq RNA Sample Preparation (Adapted protocol, truncated for dsRNA as input RNA) .................................................................................................................................... 98
Stellenbosch University https://scholar.sun.ac.za

! XV!
List of tables
Table 2.1: Members of the genus Ampelovirus with corresponding subgroup number. (Abou Ghanem-Sabanadzovic et al., 2010; Maliogka et al., 2009; Maliogka et al., 2008; Martelli et al., 2002) .................................................................................................................................................. 12
Table 2.2: Fully sequenced GLRaV-3 isolates with corresponding genome size, variant group and GenBank accession numbers ............................................................................................................. 17
Table 2.3: The comparison of next-generation sequencers available on the market ........................ 23
Table 3.1: List of primers used in RT-PCR and RT-qPCR-HRM assays*. GenBank accessions used for primer design in this study are listed ............................................................................................ 39
Table 3.2: PCR cycle condition for the detection of other Clostero-, Viti- and Fovea viruses ........ 39
Table 3.3: Descriptive statistics and re-calculation of variant group I HRM confidence intervals .. 40
Table 3.4: Mixed virus infections detected in 270 plants of the survey. The four main virus combinations are highlighted ............................................................................................................. 46
Table 4.1: List of samples subjected to next-generation sequencing with respective name, cultivar and the location at which the samples were collected ....................................................................... 54
Table 4.2: Table displaying the nucleotides generated through NGS for each sample, the nucleotides lost during trimming and filtering for Q20 as well as filtering of V. vinifera genome sequences (percentage nucleotides remaining in brackets) and the total percentage of nucleotides lost through the quality trimming and filtering processes .................................................................. 60
Table 4.3: Table outlining the average coverage and the fraction of the reference genome covered for each sample against viruses from the families Closteroviridae, Betaflexiviridae, Pospiviridae, Endornaviridae and Narnaviridae, generated through read-mappings ............................................. 63
Table 4.4: Table depicting the percentage of total reads mapped for each sample to reference genomes during the read-mapping process as well as the total number of reads remaining after quality trimming and filtering ............................................................................................................ 64
Table 4.5: Table illustrating the de novo assembly characteristics as well as features of the contigs created per sample .............................................................................................................................. 65
Table 4.6: Illustration of the reads that were classified, per sample, into each category after Blast2GO analyses with blastn (n) and tblastx (t-x) functions .......................................................... 66
Table 4.7: De novo assembly characteristics displaying the total contig count and coverage of the pooled viruses and viroids from all sampled grapevines ................................................................... 68
Table 5.1: Genome sizes, sequence accession numbers and protein molecular weights for five members of the genus Vitivirus. Adapted from du Preez (2011) ....................................................... 73
Table 5.2: PCR primers used for the amplification of the complete genome of GVF isolate V5; included are the primer names, primer sequences (5’ to 3’ orientation), the PCR product length with each primer used, primer lengths and melting temperatures for each of the primers ........................ 76
Table 5.3: PCR cycle conditions for each of the primary primer pairs used in the amplification of the complete GVF isolate V5 genome ............................................................................................... 76
Table 5.4: Mapping and alignment characteristics of NGS reads to reference genome GVF isolate AUD46129 (JX105428.1). Nucleotide and read count, mean read length, fraction of the reference covered and average coverage are displayed for read-mapping characteristics. Percentage identity, determined through multiple alignments, for each sample to GVF isolate AUD46129 is shown ..... 78
Stellenbosch University https://scholar.sun.ac.za

! XVI!
Table 5.5: Comparison of the next-generation read mapping characteristics of each GVF positive sample to GVF isolate AUD46129 and GVF isolate V5. Outlined is the read count of mapped reads for each sample as well as the fraction of the GVF isolates covered ................................................. 80
Table 5.6: Mapping and alignment characteristics of NGS reads and GVF isolate AUD46129 to reference genome GVF isolate V5 (KP114220). Nucleotide and read count, mean read length, fraction of the reference covered and average coverage are displayed for read-mapping characteristics. Percentage identity and a calculated variation quality for each sample to GVF isolate V5 are outlined under alignment characteristics .................................................................... 80
Table 5.7: Molecular weights and amino acid numbers of the five open reading frames present in the GVF isolate V5 genome. Molecular weight was calculated as an average from calculations taken from four online calculators, namely: web.expasy.org/cgi-bin/compute_pi/pi_tool (1), bioinformatics.org/sms/prot_mw.html (2), encorbio.com/protocols/Prot-MW.htm (3) and protcalc.sourceforge.net/cgi-bin/protcalc (4) ..................................................................................... 82
Table S.1: List of available bioinformatic tools with the corresponding compatible platform and internet sources for additional information. Adapted from Zang et al. (2011) .................................. 88
Table S.2: Vitis vinifera sequences retrieved from GenBank databases, used to filter host genome sequences from read datasets ............................................................................................................. 91
Table S.3: Organisms with corresponding Family and GenBank accession number. Used as reference genomes in read-mappings. Adapted from Martelli (2014) ............................................... 92
Table S.4: Fraction of the reference covered for each virus determined per sample through read-mapping. Viruses illustrated in red had a greater than 80% reference coverage,viruses represented in green had less that 10% coverage of the reference.............................................................................95
Table S.5: List of chemicals used for dsRNA and total RNA extractions with corresponding solution components, concentrations, pH, molecular formula, supplier and catalogue number ....... 96
Table S.6: GVF isolate representatives of the replicase gene with corresponding lengths and GenBank accession numbers. Used for multiple alignments with GVF isolate V5 .......................... 97
Table S.7: Oligonucleotide adaptors for Truseq RNA and DNA Sample Prep Kits ........................ 98
Stellenbosch University https://scholar.sun.ac.za

! 1!
Chapter 1
Introduction
1.1. General introduction
Vitis vinifera, commonly known as grapevine, is of the genus Vitis, family Vitaceae. Grapevine can
be cultivated from tropical to temperate climatic regions in six continents of the world (Burger et al.,
2009). It consists of more than 5 000 varieties; however, only a fraction of these have economic
value for the production of wine and table grapes (Wine & Spirits Education Trust, 2012).
Grapevine fruit (grape) has been used in the production of wine since the Neolithic era, 7 000 years
ago (Berkowitz, 1996) and has been used for medicinal purposes. The phytochemicals present in
grapes, such as quercetin, polyphenols, proanthocyanidins, resveratrol, ellagic acid, flavonols and
phenolic acids have cardio-protective properties that reduce mortality by coronary heart disease
(Frankel et al., 1993); furthermore they display anti-cancer properties (Jang et al., 1997),
antioxidant, antibacterial and antiviral activity (Pisha and Pezzuto, 1994). A study on wound
healing by Nayak et al. in 2011, examined the medicinal qualities that grapes exhibit. The wounds
of rats treated with grape-oil showed a 10% increase in the reduction of the wound area when
compared to the controls (Nayak et al., 2011), further signifying the medicinal properties of grapes.
In 2012, 7.5 million hectares (Mha) of the world’s surface area was covered by vineyards,
translating to 0.05% of the world’s terrestrial capacity; with global wine production at 252 million
hectolitres (Mhl), a 10% decrease in the wine production from 2000 (www.oiv.int). The global
economy has placed significant focus on the viticulture industry, where the 11 major wine exporting
countries (including South Africa) generated approximately R 3.3 trillion in 2012; South Africa
produced 10 037 Mhl of wine which amounted to a sum of R 82.8 billion (www.oiv.int). Additional
to revenue, the wine industry also generates over 275 000 jobs in South Africa
(http://www.sawis.co.za/info/statistics.php).
The majority of wine produced in South Africa is from the Cape winelands; mostly from the
Breedekloof region that supplies 17.7% of the wine produced. Wine is, however, produced
geographically across South Africa including the provinces: KwaZulu-Natal, the Northern Cape, the
Eastern Cape and Limpopo (Krige et al., 2012). Currently, Stellenbosch and surrounding areas
occupy the most widespread grapevine plantings, contributing 16.5% of the total hectares of
vineyard in South Africa (Krige et al., 2012).
Stellenbosch University https://scholar.sun.ac.za
! 2!
South African wine is diverse, evident in the multitude of varieties available, and grown throughout
the country. South Africa produces 21 red wine varieties that make up 45% of the total wine grapes;
Cabernet is the most planted red grape variety occupying 12% of vineyardsl; followed by Shiraz,
Pinotage and Merlot. White wine grapes comprise of 20 varieties, occupying 55% of South Africa’s
vineyards. Chenin blanc occupies 18% of vineyards followed by Sauvignon blanc and Chardonnay
(Krige et al., 2012). From 2008, an average of 1 000 hectares of wine vineyards have been uprooted
opposed to planted every year, which has contributed to a general decline in the land occupied by
vineyards in South Africa. Furthermore, 58.2% of total vines are over the age of 10 years while
8.2% of vines are under the age of 4 years (Krige et al., 2012).
To date, more than 70 infectious agents have been identified that infect grapevine (Martelli, 2014),
making it the most infected woody crop host known (Martelli, 2012). Although pesticides can
control most pathogens and pests, there is little that can be done to eliminate the viruses, viroids and
phytoplasmas that infect grapevine. Controlling virus spread mostly depends on management
strategies. In the case of Grapevine leafroll disease (GLD) these strategies include the planting of
virus-free material, effective control of the insect vectors and the rogueing of infected vines. While
some grapevine infecting viruses show seasonal symptoms, others display little to no
symptomology (Martelli and Boudon-Padieu, 2006) that may differ depending on the extent of the
virus diversity in an infected host (Komar et al., 2007) or the strain of virus infecting the host
(Monette and James, 1990). Methods such as enzyme-linked immunosorbent assays (ELISA) and
reverse-transcription polymerase chain reaction (RT-PCR) allow for the detection of known viruses.
However more recent techniques such as metagenomics, when coupled with next generation
sequencing (NGS), allow for the identification of novel viruses as well as viruses present at low
titre, with higher sensitivity. The recent techniques provide far greater insight into the etiology of
grapevine diseases.
Grapevine leafroll disease is one of the most economically destructive viral diseases affecting
grapevine production globally, and has major implications in the overall harvest and quality of both
premium wine and table grapes (Wine & Spirits Education Trust, 2012). A number of grapevine
leafroll-associated viruses (GLRaVs) have been associated with GLD; however Grapevine leafroll-
associated virus 3 (GLRaV-3) remains the primary contributing agent to GLD. Disease and pests in
vineyards may have a significant negative impact on the longevity of grapevine, which can cause
substantial damage in the wine industry. Research regarding treatment and management of
vineyards is of imperative value to the wine economy in South Africa and other wine producing
countries.
Stellenbosch University https://scholar.sun.ac.za

! 3!
1.2. Aims and objectives
The aim of this study was to identify the virus diversity associated with GLD using NGS
technology as well as to determine the full complement of viruses present in grapevines that display
GLD symptoms, across the Western Cape province. The following objectives were set in order to
achieve these aims:
• To survey the Western Cape province to identify grapevines displaying typical GLD
symptoms.
• To extract high quality double-stranded RNA (dsRNA) from a subset of vines to be used in
metagenomic NGS to determine the virome of these grapevines.
• To perform bioinformatics analysis, including read mapping and de novo assemblies, of
NGS data received.
• To determine the viral population present in grapevines collected in the survey using RT-
PCR.
• To determine the complete genome of a Grapevine virus F isolate through direct Sanger
sequencing.
• To further describe GLD and the virus diversity involved with this disease.
1.3. Chapter layout
This thesis is comprised of 6 chapters: a general introduction, a literature review, followed by three
research chapters and a general conclusion. All chapters are introduced and referenced
independently.
Chapter 1: Introduction
An introduction to the research and its relevance, the aims and objectives of the research study, an
outline of the chapter layout as well as the research outputs accomplished throughout this study.
Chapter 2: Literature review
Information pertaining to agents infecting grapevine, GLD and virus detection methods.
Chapter 3: Identification and distribution of multiple virus infections in Grapevine Leafroll
diseased vineyards.
In this chapter, a widespread survey of grapevines displaying GLD symptoms in Western Cape
vineyards is described together with the virus populations identified in diseased vineyards.
Stellenbosch University https://scholar.sun.ac.za

! 4!
Chapter 4: Determination of the virus diversity associated with Grapevine leafroll disease using
next-generation sequencing.
In this chapter, the use of NGS in identifying the virus populations in 17 GLD symptomatic
grapevines is described. The bioinformatics analysis used for quality control of NGS data and in
determining the populations of viruses is also reported in this chapter.
Chapter 5: Detection of Grapevine virus F in South African vineyards through de novo assemblies.
In this chapter, the discovery of GVF isolate V5 is reported. The use of NGS in detecting the isolate
and direct Sanger sequencing in validating the genome are described together with the genetic
variation shared with existing GVF isolates.
Chapter 6: Conclusion
General concluding statements and future prospects of this study.
1.4. Research outputs
The subsequent publications, conference proceedings, international presentation as well as poster
were based on results of the research study.
1.4.1. Publications
• Jooste, A.E.C., Molenaar, N., Maree, H.J., Bester, R., Morey, L., de Koker, W.C., Burger,
J.T. (2014). Identification and Distribution of Multiple Virus Infections in Grapevine
Leafroll Diseased Vineyards. European Journal of Plant Pathology. Accepted
• Molenaar, N., Burger, J.T., Maree, H.J. (2014). Detection of Grapevine virus F in South
African vineyards through de novo assemblies. Archives of Virology. Submitted
1.4.2. Conference proceeding
• Molenaar, N., Maree, H.J., Burger, J.T. Determination of the virus diversity associated with
Grapevine leafroll disease using next-generation sequencing. Research produced was based
on work performed in Chapter 4 and was presented by N. Molenaar at the 35th South African
Society for Enology and Viticulture (SASEV) congress, Somerset West, Cape Town, South
Africa, 13 – 15 November 2013.
Stellenbosch University https://scholar.sun.ac.za

! 5!
• Jooste, A.E.C., Molenaar, N., Maree, H.J., Bester, R., de Koker, C., Burger, J.T.
Distribution of GLRaV-3 variants and other grapevine viruses in the Western Cape
vineyards. Research produced was based on work performed in Chapter 3 and was presented
by Dr. A.E.C. Jooste at the 35th South African Society for Enology and Viticulture (SASEV)
congress, Somerset West, Cape Town, South Africa, 13 – 15 November 2013.
1.4.3. International presentation
• Molenaar, N. Global food security and attempts to relieve world hunger. Presented by N.
Molenaar, as bursary and grant holder, at the Tomorrows Leaders Forum, Agricultural
Bioscience International Conference (ABIC), Saskatoon, Saskatchewan, Canada, 5 – 8
October 2014.
1.4.4. Poster:
• Molenaar, N., Maree, H.J., Burger, J.T. Determination of the efficiency of next-generation
sequencing as a diagnostic tool for plant viral diseases. Poster summarizing research
performed in Chapter 4 was presented at the Agricultural Bioscience International
Conference (ABIC), Saskatoon, Saskatchewan, Canada, 5 – 8 October 2014, by N.
Molenaar. Poster won first prize in the category of emerging technologies.
1.5. References
Berkowitz, M. 1996. World's Earliest Wine. The Archeaological Institute of America. 49.
Burger, P., Bouquet, A., Striem, M.J. 2009. Grape breeding. In: Jain, S.M., Priyadarshan, P.M. (eds.), Breeding plantation tree crops: Tropical species. Springer Science, New York. 2009: 161-189.
Frankel, E.N., German, J.B., Kinsella, J.E., Parks, E., Kanner, J. 1993. Inhibition of oxidation of human low-density lipoprotein by phenolic substances in red wine. The Lancet. 1: 454-457.
Jang, M., Cai, L., Udeani, G.O., Slowing, K.V., Thomas, C.F., Beecher, C.W., Fong, H.H., Farnsworth, N.R., Kinghorn, A.D., Mehta, R.G., Moon, R.C., Pezzuto, J.M. 1997. Cancer chemporeventive activity of resveratrol, a natural product derived from grapes. Science. 275: 218-220.
Komar, V., Emmanuelle, V., Demangeat, G., Fuchs, M. 2007. Beneficial effect of selective virus elimination on the performance of Vitis vinifera cv. Chardonnay. American Journal of Enololgy and Viticulture. 58: 202-210.
Krige, J., Thompson, S., Wehring, J. 2012. Facts and figures. Wines of South Africa. [Online]. Available: http://www.winesofsa.co.uk/about/ [2014, July 5].
Martelli, G.P. 2012. Grapevine virology highlights: 2010-2012. Proceedings of the 17th Congress of the International Council for the study of Virus and Virus-like Diseases of the Grapevine (ICVG), Davis, California, USA. October 7-14, 2012: 13-31.
Martelli, G.P. 2014. Directory of virus and virus-like diseases of the grapevine and their agents. Journal of Plant Pathology. 96 (1, Supplement): 1-136.
Stellenbosch University https://scholar.sun.ac.za

! 6!
Martelli, G.P., and Boudon-Padieu, E. 2006. Directory of infectious diseases of grapevines and viroses
andvirus-like diseases of the grapevine: Bibliographic report 1998-2004. Options Méditerranéennes série B:Studies and Research. 55, CIHEAM, 2006: 279.
Monette, P.L., and James, D. 1990. Detection of two strains of grapevine virus A. Plant Disease. 74: 898-900.
Nayak, S.B., Ramdath, D.D., Marshall, J.R., Isitor, G., Xue, S., Shi, J. 2011. Wound-healing properties of the oils of Vitis vinifera and vaccinium macrocarpon. Phytotherapy Research. 25: 1201-1208.
Pisha, E., and Pezzuto, J.M. 1994. Fruits and vegetables containing compounds that demonstrate pharmocological activity in humans. In: N.R. Farnsworth and H. Wagner (eds.), Economic and Medicinal Plant Research. Academic Press, London. 6: 189-233.
Wine & Spirits Education Trust. 2012. Wine and Spirits: Understanding Wine Quality. Second Revised Edition, London. 2012: 2-5. ISBN 9781905819157.
1.6. Interent Sources
International Organisation of Vine and Wine (OIV). 2013. Statistical report on world vitiviniculture. [Online]. Available: http://www.oiv.int/oiv/info/enstatistiquessecteurvitivinicole#bilan [2014, July 5].
South African Wine Industry Information and Systems (SAWIS). 2014. Information and statisitcs. [Online]. Available: http://www.sawis.co.za/info/statistics.php [2014, July 5].
!
Stellenbosch University https://scholar.sun.ac.za

! 7!
Chapter 2
Literature review
2.1. Introduction
Grapevine is a deciduous woody species that can be cultivated in temperate regions across the globe.
It is an economically important crop as its fruit has been used comprehensively for thousands of
years; from eating fresh to producing jam, juice, vinegar, jelly and, most importantly, wine.
Grapevine is, however, the most susceptible crop plant to intracellular pathogens, among which
viroids, viruses and xylem- or phloem-limited prokaryotes remain the most significant grapevine-
infecting agents. In 1964 the International Council for the Study of Virus and Virus-like Diseases of
Grapevine (ICVG) was established to provide a database of methodologies and research pertaining
to the viruses that affect grapevine. The ICVG has identified 70 infectious agents of grapevine, 63
of which are viruses belonging to eight separate families (Martelli, 2014). These viruses are
distributed across five major diseases affecting grapevine, namely: Infectious degeneration and
decline, Grapevine leafroll disease (GLD), Graft incompatibility, Rugose wood complex and Fleck
complex (Martelli and Boudon-Padieu, 2006; Martelli and Digiaro, 1999). Grapevine leafroll
disease, caused by viruses from the family Closteroviridae, remains the most extensive and
economically destructive grapevine viral disease (Martelli and Boudon-Padieu, 2006; Pietersen,
2004). These diseases negatively affect grapevine in terms of yield, quality and longevity of the
crop. The advances in technology have allowed research of grapevine and the associated disease
etiology to be studied at a far greater depth (Martelli and Boudon-Padieu, 2006).
The development of NGS has permitted an unprecedented approach to detect viruses that are
present at a low titre, new variants of viruses as well as novel viruses on a metagenomic scale. NGS
offers a technology capable of producing large amounts of data at greater cost-effectiveness when
compared to conventional detection techniques. Furthermore, the time taken to produce this data is
significantly reduced, making the efficiency of NGS unparalleled. (Beerenwinkel and Zagordi,
2011). The use of NGS allows for the identification of the complete genetic material in an
environmental sample and has been used in the determination of the virome of combined grapevine
samples (Al Rwahnih et al., 2011; Coetzee et al., 2010).
2.2. Grapevine leafroll disease
2.2.1. Distribution and etiology
Grapevine leafroll disease was identified more than a century ago; however, nutrient deficiency was
Stellenbosch University https://scholar.sun.ac.za

! 8!
thought to be the initial cause of the symptoms. Through the grafting of plant material displaying
typical GLD symptoms onto healthy stock, the transmission of the symptoms was a clear indication
of a pathogen-derived disease (Charles et al., 2006a; Over de Linden and Chamberlain, 1970). It
was not until 1989, after the observation of GLD spread in California, that scientists suspected
mealybug as a potential vector for the transmission of the disease (Habili et al., 1995; Jordan et al.,
1993; Engelbrecht and Kasdorf, 1990; Tanne et al., 1989; Teliz et al., 1989). The etiology of GLD
is not well understood, however viruses from the family Closteroviridae are known to cause the
disease. The first evidence of this occurred with the identification of closterovirus-like particles
within infected plant phloem (Namba et al., 1979) and with ultrastructure research done on the leaf
tissue of GLD symptomatic vines (Castellano et al., 1983; Faoro et al., 1981). Subsequent studies
revealed nine serologically unrelated clostero-like viruses that are connected with GLD (Hu et al.,
1990; Zimmermann et al., 1990; Rosciglione and Gugerli, 1987; Rosciglione and Gugerli, 1986;
Gugerli et al., 1984); however this number was recently reduced to five (Martelli et al., 2012). The
first confirmation of GLD occurred through ELISA in 1992 at UC Davis in the Foundation vineyard
(Rowhani and Golino, 1995) where-by samples displaying optical density (OD) readings of three
times greater than the control were considered to be infected (Rowhani, 1992). GLD is detected in
all grape-growing regions of the world, which includes Africa, Europe, the Middle East, New
Zealand and North and South America (Sharma et al., 2011; Charles et al., 2009; Fuchs et al., 2009;
Maliogka et al., 2009; Fiore et al., 2008; Maree et al., 2008; Mahfoudhi et al., 2008; Akbas et al.,
2007; Charles et al., 2006a; Habili et al., 1995). The international exchange and distribution of
infected material is responsible for the primary spread of the disease.
2.2.2. Symptomatology
GLD is an economically important disease, responsible for up to a 60% loss in grapevines product
yield (Rayapati et al., 2008). Symptoms may vary considerably and are dependent on a variety of
conditions, which include: regional climate, geographical distribution, grape cultivar, age of
vineyard, pruning techniques, virus strain and length of infection, season as well as soil composition
(Mannini et al., 2012; Freeborough and Burger, 2008; Rayapati et al., 2008; Cabaleiro et al., 1999).
Physical symptoms may not always be present as, in the case of certain white-fruited cultivars (Vitis
vinifera) and rootstocks.
Symptoms become evident in early spring, during which the development of buds and shoots are
delayed. From early to midsummer, physical symptoms on the leaves become apparent. The
interveinal regions of leaves of red-fruited cultivars exhibit dark-red or purple pigmentation while
primary and secondary veins remain green (Figure 2.1.B). In white-fruited cultivars the symptoms
Stellenbosch University https://scholar.sun.ac.za

! 9!
are less evident where the interveinal areas of leaves are visible in a pale green or yellow chlorotic
coloration (Figure 2.1.C). For both red- and white-fruited cultivars the downward rolling along the
margins of leaves remains uniform and progresses towards the end of autumn; however, the type of
cultivar determines the extent of leaf-rolling. White-fruited cultivars may either show pronounced
leaf-rolling by harvest, evident in Chardonnay; or may not show any signs of leaf-rolling, as evident
in Sauvignon blanc and Tompson Seedless, making the visual identification of infected vines much
more challenging (Rayapati et al., 2008).
Other symptoms of GLD include the degeneration of phloem cells in stems and leaves which results
in reduced photosynthetic activity. The degeneration of phloem cells causes an accumulation of
starch caused by hindered carbohydrate movement (Charles et al., 2006a; Charles et al., 2006b;
Cabaleiro et al., 1999; Mannini et al., 1996) and results in delayed ripening of the fruit, reduced
levels of soluble solids and anthocyanin pigments, and an increase in titratable acidity and
grapevine susceptibility in unfavorable environmental conditions (Fuchs, 2007). The viruses
associated with GLD may also trigger young vine failure as well as graft incompatibility (Golino et
al., 2002).
Figure 2.1: Visual symptoms of GLD. A) Infected red-fruited cultivar, Vitis vinifera cv Cabernet Franc. B) Infected white-fruited cultivar, Vitis vinifera cv Chardonnay (Maree et al. 2013).
Stellenbosch University https://scholar.sun.ac.za

! 10!
2.2.3. Associated viruses
Viruses of the family Closteroviridae are associated with the onset of GLD symptoms, in particular
Grapevine leafroll-associated virus 3 (GLRaV-3), which is believed to be the primary causative
agent of the disease. Members of the family Closteroviridae include Grapevine leafroll-associated
viruses 1 to 9 (GLRaV-1, -2, -3, -4, -5, -6, -9), numbered in the order that they were discovered, as
well as GLRaV-Pr, GLRaV-De and GLRaV-Car. More recently it has been proposed that GLRaV-4,
-5, -6, -9, -Pr, -De and -Car be grouped together (Martelli et al., 2012). All members, with the
exception of GLRaV-2 and GLRaV-7 that belong to the genera Closterovirus and Velarivirus
respectively, are of the genus Ampelovirus (Martelli et al., 2012; Al Rwahnih et al., 2011; Maliogka
et al., 2009; Martelli and Boudon-Padieu, 2006).
2.2.4. Transmission
The primary means for transmission of GLD is through vegetative propagation; however, GLD can
also be spread to adjacent vines and vineyards by mealybugs (Martelli and Boudon-Padieu, 2006;
Charles et al., 2006b). Soft scale insects (Coccidae) and certain mealybug (Pseudococcidae) species,
particularly the vine mealybug (Planococcus ficus) (Figure 2.2.A), have the capacity to vector
GLRaV-1, -3, -4, -5 and -9, all members of the genus Ampelovirus (Martelli et al., 2002).
Planococcus ficus (Signoret), a small phloem-feeding, hemi-metabolous insect was first identified
in the Western Cape province by Joubert in 1943 and has remained a pest in viticultural practices
(Charles et al., 2006a; Walton and Pringle, 2004). The average Planococcus ficus female will lay
approximatelly 362 eggs that will overwinter as eggs or as young instar nymphs, residing on the
roots and beneath the bark of vines. As the seasons progress and an optimum growth temperature
between 23oC and 27oC is reached, the development of the mealybugs progresses through the
second and third nymphal instar stages. After the third nymphal instar stage it is possible to
distinguish between mealybug sexes. The males develop long filamentous anal setae and wings but
lack mouthparts for transmitting GLRaVs; the females are wingless, exhibiting limited mobility
(Fuchs, 2007). Upon sexual maturity, the female mealybugs release pheromones, promoting
copulation through which the cycle of reproduction continues (Walton and Pringle, 2004). There are
two monitoring systems used to determine the population density of mealybug species within
infected vineyards; these include taking physical samples of P. ficus infected vines, a labour-
intensive system, and pheromone-based monitoring (Walton and Pringle, 2004).
Stellenbosch University https://scholar.sun.ac.za

! 11!
Figure 2.2: Photographs of Vitis vinifera mealybugs. A) Planococcus ficus (www.udec.ru/vrediteli/chervec.php) B) Pseudococcus longispinus (http://www.bcpcertis.com/Certis.bcp/English/Home/Our+Solutions/Biological+Controls/Pests+Find+out+more/Mealybug+find+out+more/page.aspx/1091).
Research by Tsai et al. in 2008, studied the transmission parameters involving Planococcus ficus
and the transfer of GLRaVs to grapevine. The study determined that the first instars had greater
vector efficiency when compared to mature mealybugs. The acquisition of virus transmission
occurred within one hour of mealybug exposure and peaked at twenty-four hours where it remained
constant for four days until individuals lost the ability to transmit GLRaV-3 (Tsai et al., 2008). Tsai
et al. noted that GLRaV-3 was not transmitted from female to progeny and that virus transmission
occured in a semi persistent fashion.
The spread of GLD is dependent on the type of cultivar infected, as indicated by a study performed
in 2009. GLD spread at a higher rate in young Chardonnay vines compared to young Merlot vines
through the mealybug vector Pseudococcus longispinus (Figure 2.2.B); suggesting that Chardonnay
is more susceptible to the spread of GLD through Pseudococcus longispinus (Charles et al., 2009).
2.2.5. Disease management
No curative measures successful in eliminating GLRaV in an infected vine has been documented.
The prevention of infection and of further spread of the disease is the most efficient manner in
which to manage GLRaV infection (Almeida et al., 2013; Rayapati et al., 2008). Removing and re-
planting entire vineyards that contain infected vines is the most effective strategy by which to
remove virus infection; however, this has associated economic implications. Selective rogueing of
vines adjacent to infected individuals may act as a sensible method, but may overlook infected
vines that display no visual signs of infection (Almeida et al., 2013; Rayapati et al., 2008).
Furthermore, root remnants are capable of housing the virus for up to one year, allowing newly
planted material to become infected through another mealybug vector transmission (Bell et al.,
2009). To ensure that infected young grapevines are not planted, there are a number of methods
available to eliminate virus infection. These methods include: heat therapy, somatic embryogenesis
B A!
Stellenbosch University https://scholar.sun.ac.za

! 12!
Virus Name: Abbreviation: Subgroup:Grapevine leafroll-associated virus 4 GLRaV-4Grapevine leafroll-associated virus 5 GLRaV-5Grapevine leafroll-associated virus 6 GLRaV-6Grapevine leafroll-associated virus 9 GLRaV-9Grapevine leafroll-associated virus Pr GLRaV-PrGrapevine leafroll-associated virus De GLRaV-DeGrapevine leafroll-associated Camelian virus GLRaV-CarPineapple mealybug wilt-associated virus 1 PMWaV-1Pineapple mealybug wilt-associated virus 3 PMWaV-3Plum bark necrosis stem-pitting-associated virus PBNSPaVGrapevine leafroll-associated virus 1 GLRaV-1Grapevine leafroll-associated virus 3 GLRaV-3Pineapple mealybug wilt-associated virus 2 PMWaV-2Little cherry virus 2 LChV-2
I
II
Genus Ampelovirus
and meristem tip cultures. Other methods applicable in the reduction of virus spread and insect
control include the use of chemicals such as chlorpyrifos, imidacloprid and/ or prothiophos, in the
dormant period of mealybug development, as well as implementing natural enemies, such as
parasitoids (Coccidoxenoides perminutus and Leptomastix dactylopii) and predatory beetles
(Nephus angustus, N. bineavatus and N. quadrivittatus) which aid in the control of mealybug
circulation. The negative effects of mealybug can be further reduced through the cultural control of
surrounding vegetation (Walton et al., 2004). Certification programs for virus-free plant material
have been introduced in many countries to reduce the spread of viruses across countries and within
local vineyards.
2.3. Grapevine leafroll-associated virus 3
2.3.1. Taxonomy
GLRaV-3 is the type species of the genus Ampelovirus and a member of the family Closteroviridae
(Martelli et al., 2012; Cabaleiro et al., 1999). The establishment of the family Closteroviridae, in
1998, determined that the members of this family be distinguished based on whether the viruses
involved comprised of genomes that were either monopartite or bipartite (Martelli et al., 2011). In
2002, the International Committee on Taxonomy of Viruses (ICTV) reviewed the classification of
viruses to distinguish between individuals based on biological and molecular properties (Martelli et
al., 2002). They determined that the genus Ampelovirus was associated with the family
Closteroviridae. Virus members of the genus Ampelovirus are divided into an additional two
subgroups based on genome structure and size (Table 2.1); subgroup I viruses form a coherent
phylogenetic cluster and are considered divergent variants of GLRaV-4 (Martelli et al., 2012; Abou
Ghanem-Sabanadzovic et al., 2010).
Table 2.1: Members of the genus Ampelovirus with corresponding subgroup number. (Abou Ghanem-Sabanadzovic et al., 2010; Maliogka et al., 2009; Maliogka et al., 2008; Martelli et al., 2002).
Stellenbosch University https://scholar.sun.ac.za

! 13!
2.3.2. Morphology and genome organization
Members of the genus Ampelovirus are comprised of a linear, positive sense single-stranded RNA
(ssRNA), monopartite genome that ranges between 13 kb and 18.6 kb (Martelli et al., 2002). The
virion particles are flexible, filamentous and remarkably long (1 400 to 2 200 nm) in length with a
diameter of between 10 nm and 13 nm. The body of the virion is assembled through a 34 kDa major
capsid protein (CP) while the minor capsid protein (CPm) is a main component of the virion head,
responsible for cell-to-cell movement (Martelli et al., 2002; Ling et al., 1997; Zee et al., 1987).
Figure 2.3: Purified GLRaV-3 virion particles, isolated from a GLD vine, visualized with a transmission electron microscope and stained with 1% (w/v) aqueous uranyl acetate. (Picture by G.G.F. Kasdorf).
GLRaV-3 isolate GH11 has the second largest genome, of 18 671 nt in size (NCBI Accession:
JQ655295.1), of all plant infecting viruses, second to Citrus tristeza virus (19 296 nt) (NCBI
Accession: NC_001661.1). The first reporting of a GLRaV-3 genome (isolate NY-1) occurred in
2004; NY-1 possessed 13 open reading frames (ORFs) and included 5’ and 3’ untranslated regions
(UTRs) of 158 and 277 nts, respectively (Ling et al., 2004). A study performed in 2008 disproved
isolate NY-1 as being a complete genome due to a shortened 5’ UTR (Maree et al., 2008); the
evidence based on the findings that GLRaV-3 isolates GP18 (NCBI Accession: EU259806.1), 621
(NCBI Accession: GQ352631.1) and 623 (NCBI Accession: GQ352632.1) have 737 nucleotide 5’
UTRs (Jooste et al., 2010; Maree et al., 2008). Subsequent findings revealed that GLRaV-1 has the
longest 5’ UTR (780 nt) of any representative of the family Closteroviridae. Other Closteroviridae
members and corresponding 5’ UTR lengths include: Little cherry virus (LChV-2; 539 nt) (NCBI
Accession: AF531505); Citrus tristeza virus (CTV; 107 nt) (NCBI Accession: DQ272579);
Grapevine leafroll-associated virus 2 (GLRaV-2; 105 nt) (NCBI Accession: AY881628) and
Lettuce infectious yellow virus (LIYV; 97 nt) (NCBI Accession: NC_003617) (Martelli et al., 2002).
The 5’ UTR of the members of the family Closteroviridae has little known function, however,
remains highly variable between variants of GLRaV-3, a valuable characteristic for the studies of
GLRaV-3 variation.
Stellenbosch University https://scholar.sun.ac.za

! 14!
GLRaV-3 has a genome organization consistent with that of the conventional closterovirus
described by Agranovsky et al. (1994). It comprises of 13 ORFs labeled 1a, 1b and 2 to 12 (Figure
2.4) as well as a lengthy GC-rich intergenic region situated between ORFs 2 and 3, which is
uncharacteristic of members of the family Closteroviridae. ORFs 1a and 1b house the replication
genes that encode the replication-associated proteins. More specifically, ORF 1a contains four
conserved domains: a papain-like protease, a viral methyltransferase, AlkB and a Viral RNA
helicase protein. These encode a large polypeptide, while ORF 1b encodes the RNA-dependent
RNA-polymerase (RdRp) expressed through a +1 translational frameshift due to an overlapping
nucleotide with ORF 1a (Maree et al., 2008; Ling et al., 2004; Ling et al., 1998). ORF 2 is believed
to encode a small peptide (p6), however, it is absent in GLRaV-3 group VI isolates. Homologs have
been detected within the closteroviruses, however the functionality of this protein is unknown
(Bester et al., 2012; Peremyslov et al., 2004a). ORF 3 encodes a small hydrophobic transmembrane
protein (p5) whose equivalent in Beet yellows virus (BYV) is responsible for cell-to-cell movement
and is contained within the endoplasmic reticulum (Peremyslov et al., 2004a). The ORF 4-encoded
homolog of cellular HSP70 molecular chaperones (HSP70h) is responsible for cell-to-cell
movement (Peremyslov et al., 1999) and the assembly of small virion heads (Peremyslov et al.,
2004b; Alzhanova et al., 2001). The 60 kDa protein (p55) encoded by ORF 5 shares little sequence
similarity when compared to other members of the family Closteroviridae; however, it shares a
similar function to HSP70h and is believed to assist in cell-to-cell movement as well as in the
assembly of virion heads (Alzhanova et al., 2007). Open reading frame 6 encodes a coat protein
(CP) that aids in cell-to-cell movement (Alzhanova et al., 2000), while ORF 7 encodes a minor
capsid protein (CPm; p53), a major component of the virion head (Agranovsky et al., 1995). Open
reading frames 3 through to 7 encode five genes conserved throughout the family Closteroviridae
and are collectively implicated in virus cell-to-cell movement (Dolja et al., 2006). Open reading
frames 8 (p21), 9 (p19.6), 10 (19.7), 11 (p4) and 12 (p7) do not have determined function due to
their conservation exclusively within the genus Ampelovirus. However, ORFs 8 to 10 are believed
to play a role in viral transport as well as RNA silencing suppression (Dolja et al., 2006). The p19.7
protein encoded by ORF 10 exhibits varying suppressor activity, as a result of amino acid
substitutions, across GLRaV-3 variants and is strongly believed to have an association with RNA
silencing (Gouveia and Nolasco, 2012). ORFs 11 and 12 remain unique to GLRaV-3 (Ling et al.,
1998).
Stellenbosch University https://scholar.sun.ac.za

! 15!
Figure 2.4: Schematic representation, drawn to scale, of the GLRaV-3 isolate GP18 genome. Outlined are the ORF sizes and positions (nt) and corresponding encoded proteins as well as the untranslated regions (UTRs) adapted from Maree et al., 2008.
2.3.3. Virus replication and genome expression
GLRaV-3 replication, unlike other members of the family Closteroviridae (CTV, BYV), has not
been studied comprehensively and is assumed to follow similar modes of replication to these
closteroviruses (Maree et al., 2013; Dolja et al., 2006). The majority of closteroviruses are
transmitted through insect vectors to the host plant whereby positive stranded RNA viruses will
follow a four-stage replication cycle. Replication commences with virus uncoating, which is
followed by primary and secondary translation of the exposed viral nucleic acids to construct both
structural as well as non-structural proteins. Genomic replication then occurs and finally the
formation of capsids around genomic RNA progenies, which allows for the spread of virions
through the plant (Dolja et al., 2006). Viral replication is mediated through the RdRp, which
initially synthesizes a complementary negative RNA strand serving as the template for subsequent
synthesis of subgenomic RNAs (sgRNAs) and genomic RNA progenies. The number of sgRNAs
synthesized by a virion is equivalent to the number of ORFs enclosed within that virion, allowing
for a monocistronic translation of the ORFs beginning with the 5’-proximal ORF (Dolja et al.,
2006). The synthesis of sgRNAs occurs in a timely fashion to optimize virion competence. In order
to achieve greater efficiency the host defense systems need to be disrupted, therefore sgRNAs
responsible for the translation of RNA silencing suppressors are effectively formed in the initial
phases of infection (Dolja et al., 2006). Once the translation of the genome has commenced, a
number of replication complexes will form, giving rise to multitudes of structural proteins aiding in
the assembly of the virion (Dolja et al., 2006). Studies performed, in 2010, by Maree and Jarugula
0 1000 2000 3000 4000 5000 6000 7000 8000 9000 10000 11000 12000 13000 14000 15000 16000 17000 18000
2OG-Fe2 oxygenase (AlkB) Leader papain-like protease
Viral methyltransferase Viral RNA helicase
ORF1a ! ! ! !
ORF1b (RdRp)
ORF2 (p6)
ORF3 (p5)
ORF4 (Hsp70h)
ORF5 (Hsp90h)
ORF6 (CP)
ORF7 (dCP)
ORF8 (p21)
ORF9 (p19.6)
ORF10 (p19.7)
ORF12 (p4)
ORF11 (p7)
3’OH 5’
kb
Stellenbosch University https://scholar.sun.ac.za

! 16!
et al. indicated that sgRNAs can be used to translate additional ORFs and that ORFs 6, 8, 9 and 10
occurred in greater quantities during infection. Their results demonstrate the differences in the
levels of expression of sgRNAs during various stages of replication in grapevine.
2.3.4. Distribution and genetic variants
Geographically, GLD is distributed across all regions of the world and as the primary infectious
agent contributing towards GLD, GLRaV-3 is also assumed to be present in the listed regions
(Sharma et al., 2011; Charles et al., 2006a). The distribution of GLRaV-3 variants within vineyards
varies as a range of factors determines the level of distribution. These include: viticulture practices,
wind direction, introduced infected material, vector transmission of the virus as well as the range of
GLRaV-3 variants already present in the vineyard. GLRaV-3 variant group II and VI have been
shown to be most prevalent in South African vineyards (Bester et al., 2012; Jooste et al., 2011). In
China group I variants were found most common (Farooq et al., 2012) and GLRaV-3 variant group
II and I most frequent in Portugal (Gouveia et al., 2009). The occurrence of single and mixed
variant infection is, likewise, dependent on a multitude of factors. A study performed in the
vineyards of Napa Valley in 2011 found that 21% of the diseased vines had multiple infections
(Sharma et al., 2011).
Currently, 11 distinct isolates of GLRaV-3 have been fully sequenced (Table 2.2). Previous
research, regarding the genetic variability of GLRaV-3, made use of single-stranded conformation
polymorphisms (SSCP) along with sequence comparisons of the RdRp, CP and HSP70h genes
(Jooste and Goszczynski, 2005; Turturo et al., 2005). The results revealed that the above-mentioned
regions shared greater than 90% nucleotide identity when compared and that GLRaV-3 isolates 623
and 621 fall within the divergent variant group II and I, respectively (Jooste and Goszczynski,
2005). Further research performed in 2009 revealed nucleotide differences in the range of 74.1% to
100% and amino acid identity differences in the range of 85.9% to 100% when comparing the
HSP70h gene of various GLRaV-3 isolates, confirming a potential five variant groups numbered I
to V (Fuchs et al., 2009). Successive research, making use of phylogenetic analysis, revealed an
additional two variant groups (VI and VIIP) (Sharma et al., 2011; Bester et al., 2012a; Chooi et al.,
2009; Seah et al., 2012). However divergent, the greatest variation among isolates of GLRaV-3
remains in the 5’ UTR regions of the genomes, whereby isolates 621, 623 and PL-20,
representatives from variant group I, II and III, respectively, show between 22% and 33% variation
(Jooste et al., 2010).
Stellenbosch University https://scholar.sun.ac.za

! 17!
Table 2.2: Fully sequenced GLRaV-3 isolates with corresponding genome size, variant group and GenBank accession numbers.
2.4. A means to viral diagnostics
Virus detection in diseased plants is complicated by various factors, including: mixed viral infection,
low virus titre in early infections, comparable disease symptoms from unrelated viruses, uneven
viral spread in infected vines as well as less visible symptoms in certain cultivars and rootstock
plants. Viruses are detectable in most regions of a plant, including the veins of leaves, roots, trunk
and canes; phloem remains the most useful tissue in which to sample GLRaV-3 (Ling et al., 2001;
Teliz, 1987). Currently, there are a number of techniques available for the detection of viruses in
plant material, these include: biological indexing, serology, electron microscopy, nucleic-based
techniques as well as next-generation sequencing.
2.4.1. Biological indexing
Biological indexing was one of the initial techniques developed in order to detect grapevine virus
diseases (Nicholas, 2006; Weber et al., 2002). Before molecular detection techniques became
available in the late 1980s, biological indexing was used to identify a plant’s response to pathogen-
derived diseases through the inoculation of a test vine with a control vine, either through grafting or
rub-inoculation (Constable et al., 2010). There are three primary types of biological indexing for
grapevine viruses, herbaceous indexing, green grafting and hardwood indexing. Sensitive indicator
plants are used in each technique that includes the Vitis vinifera cultivars Cabernet Franc, Cabernet
Virus Name: Isolate: Genome Size (nt): Variant Group: Accession Number:Grapevine leafroll-associated virus 3 LN 18 563 III JQ423939.1Grapevine leafroll-associated virus 3 GH30 18 576 VI JQ655296.1Grapevine leafroll-associated virus 3 GH11 18 671 VI JQ655295.1Grapevine leafroll-associated virus 3 GP18 18 498 II EU259805.1Grapevine leafroll-associated virus 3 CI-766 17 919 I EU344893.1Grapevine leafroll-associated virus 3 PL-20 18 433 III GQ352633.1Grapevine leafroll-associated virus 3 623 18 498 II GQ352632.1Grapevine leafroll-associated virus 3 621 18 498 I GQ352631.1Grapevine leafroll-associated virus 3 WA-MR 18 498 I GU983863.1Grapevine leafroll-associated virus 3 3138-07 18 498 I JX559645.1Grapevine leafroll-associated virus 3 GH24 18 493 - KM058745
Stellenbosch University https://scholar.sun.ac.za

! 18!
Sauvignon, Barbera or Pinot Noir. Herbaceous indexing makes use of rub-inoculation practices
whereby extracts from a test vine are rubbed onto the leaves of an indicator plant, inside a
greenhouse. Within several weeks, diagnostic symptoms in the test plant will develop upon virus
infection (Weber et al., 2002). Green-grafting makes use of undeveloped scions grafted onto young
test shoots. The advantages of this technique are evident in the graft success rate as well as in the
ability of the graft to overcome incompatibility with distant V. vinifera species (Walker and Golino,
1999). The most labor-intensive and time-consuming means to index is through hardwood or
woody indexing; the practice required to determine the diseased state of plants infected with
GLRaV-3. Woody indexing involves the grafting of test plants onto indicator plants in a field
whereby the symptoms of the disease are observed over two consecutive growing seasons (Weber
et al., 2002). In order for the results obtained through woody indexing to have significance, test
fields should be geographically isolated as to minimize interference with external pathogens and
test plants should be healthy (Constable et al., 2010). Results obtained through indexing may vary
depending on unpredictable criteria, which may include: strain of virus, virus distribution and titre
as well as minimal symptom expression (Constable et al., 2010; Rowhani et al., 1997). Other
complications remain in the ambiguous symptom expression of certain viruses in indicator plants as
well as non-specific symptoms that may be evident due to environmental stress or viruses that
display similar visual symptoms (Monis and Bestwick, 1996). However successful biological
indexing may be as a viral disease-associated detection technique, the practice of disease
confirmation requires skilled virologists with reliable observations.
2.4.2. Serological assays
Various immunodiagnostic methodology designs exist whose primary approach for viral detection
is through antigen-antibody reactions, a few of these techniques involve: Enzyme-linked
ImmunoSorbent assays (ELISA), Immuno-strip tests and immunofluorescence (IF) (Schaad et al.,
2003). ELISA offers a robust, simple, cheap and high throughput approach in the detection of
viruses and remains the most frequently used immunodiagnostic method since the 1970s (Ward et
al., 2004; Clark and Adams, 1977; Engvall and Perlmann, 1971). There are four forms of ELISA
used under different conditions, namely: direct antigen-coating (DAC) ELISA, indirect ELISA,
triple antibody sandwich (TAS) ELISA and double antibody sandwich (DAS) ELISA. The latter is
one of the most common forms of the technique used in the detection of viruses. The mechanisms
involved in each technique remain similar while the detection of the antigen-antibody complex
varies (Koenig and Paul, 1982). DAS-ELISA functions through the attachment of a virus antigen to
a particular antibody attached to a microtitre plate, after which the plate is washed leaving behind
the desired antigen-antibody complex. A color change occurs with the addition of a second enzyme-
Stellenbosch University https://scholar.sun.ac.za

! 19!
labeled antibody that binds to the attached antigen, signifying the presence of a certain virus. Color
intensity, upon viral occurrence, permits virus detection as well as virus titre quantification (Ward
et al., 2004; Clark and Adams, 1977).
2.4.3. Nucleic-acid based techniques
Ever since the invention of the Polymerase Chain Reaction (PCR) in 1985 (Mullis et al., 1986),
genetic studies have increasingly advanced. Currently more than 25 variations in the rudimentary
PCR technique exist, a few of which include: immunocapture PCR (IC-PCR), Spot-PCR, Nested
PCR, Nanoparticle-Assisted PCR (nanoPCR) (Cenchao, 2013; Cenchao et al., 2009), Miniprimer
PCR (Isenbarger et al., 2008), Simple Sequence Repeat (SSR)-anchored PCR (Zietkiewicz et al.,
1994), Inverse PCR (Ochman et al., 1988), Ligation-mediated PCR (Mueller and Wold, 1988),
Methylation-specific PCR (Herman et al., 1996), Touchdown PCR (Don et al., 1991), Quantitative
PCR (qPCR), Multiplex-PCR and, most relevant to this study, reverse-transcription PCR (RT-PCR).
A majority of the viruses infecting grapevine possess RNA genomes and GLRaV-3 is no exception
(Schaad and Frederick, 2002). The use of RT-PCR in the diagnostic detection of viruses associated
with grapevine is an effective strategy. Initially, in the application of RT-PCR, primers specific to
genomic regions of interest, derived from viral RNA, need to be designed and when used amplify
complimentary DNA (cDNA) exponentially. The product of this amplification is then visualized on
a stained gel after electrophoresis; however the results are not definite as the molecular weight of
the product alone is not conclusive as to the products identity (Schaad and Frederick, 2002).
Sequencing needs to be applied to validate the amplified sequence. PCR-based techniques have the
advantages of being highly sensitive, specific to a region of interest and have the ability to detect
several pathogens at a time (Ward et al., 2004). Disadvantages of PCR-based techniques include the
inability to calculate virus titre as well as the challenge of designing specific primers aimed at
variants with high mutation rates. To overcome the inability of calculating virus titre and post-
reaction analysis of PCR products, quantitative RT-PCR (RT-qPCR) was developed. RT-qPCR
releases fluorescence with each consecutive PCR cycle making it possible to detect and quantify a
virus-containing sample in real time (Ward et al., 2004).
PCR-based techniques can be time consuming when the detection of multiple viruses is required, as
in the case of numerous grapevine infections. To overcome this difficulty, oligonucleotide
microarray analysis was developed to identify numerous genes or viruses simultaneously. In 2010, a
study identified ten grapevine viruses when using a 570-probe microarray. This was designed to
detect the conserved species-specific regions of 44 virus genomes affecting plants (Engel et al.,
2010). A study by Thompson et al., in 2012, developed a macroarray platform for grapevine viruses
Stellenbosch University https://scholar.sun.ac.za
! 20!
that successfully detected multiple viruses in a single run. Microarray analyses offer a relatively
simple and robust method for the detection of multiple viruses at a time. However, this technology
requires a great deal of post-operation analysis, is limited by available sequence data, is relatively
expensive and remains less sensitive than techniques such as qPCR.
2.5. Metagenomics and next-generation sequencing
2.5.1. Introduction
In the past, techniques such as ELISA and nucleic acid-based methods have been the most suitable
in identifying viruses associated with plant diseases (Adams et al., 2009). Despite how specific and
consistent these techniques may be, they do not reflect the entire complement of viruses that may be
involved in certain disease etiology and may even neglect the presence of dissimilar virus variants.
Metagenomic sequencing has overcome these restrictions through the identification of the complete
compliment of viruses present in any given sample (Coetzee et al., 2010; Adams et al., 2009; Al
Rwahnih et al., 2009).
Metagenomics or environmental genomics refers to the analysis of genetic material sampled
directly from the environment and takes into account the complete composition of all organisms
inhabiting the shared environment sampled (Hugenholtz and Tyson, 2008). Multiple metagenomic
studies have been performed to investigate the population of organisms in a number of
environments. These environments include salt water (Williamson et al., 2008), terra firma (Kim et
al., 2008; Fierer et al., 2007), plant matter (Coetzee et al., 2010; Adams et al., 2009; Al Rwahnih et
al., 2009) and the excrement of Homo sapiens (Zhang et al., 2005). The process through which
metagenomic studies function involves the collection of nucleic acids from a designated area, after
which fragmentation of the genetic material occurs. The smaller fragments are then cloned into
vectors, producing a library of clones, and sequenced to determine the total organismal composition
(Hugenholtz and Tyson, 2008). Initially metagenomic studies made use of Sanger sequencing, a
capillary-based method. However, limitations regarding the requirements of known sequence
information as well as the construction of cloned fragments makes this technique cost and time-
inefficient (Adams et al., 2009). In 2005 the introduction of NGS, also known as second generation
sequencing, massively parallel or deep sequencing, delivered an unparalleled approach in
identifying the genetic components of numerous organisms at a time; providing faster and more
sensitive data than before (Adams et al., 2009; Margulies et al., 2005).
NGS occurs with the random fragmentation of nucleic material collected from a desired sample.
Fragments are then attached to universal adaptors immobilized on specific sequencing beads or a
Stellenbosch University https://scholar.sun.ac.za
! 21!
flow cell, depending on the NGS platform selected. The fragments, along with universal adaptors,
are clonally amplified to produce clusters of identical sequences that show no bias towards a
particular organism, essential in the discovery of novel viruses. NGS avoids chain termination
chemistry and electrophoresis, as used in Sanger sequencing. This is carried out by employing
chemistries such as sequencing-by-ligation, sequencing-by-synthesis and pyrosequencing (Ware et
al., 2012) to sequence the fragments. The use of NGS results in the detection of novel virus
genomes before identification and characterization of the virus is initiated, as established in
previous NGS studies (Koonin and Dolja, 2012).
Previous metagenomic studies have been unsuccessful in determining the complete pool of viruses
present in a specified sample. Metagenomics, when combined with NGS, can successfully identify
the complete set of viruses given in any environmental sample whether the viruses are known or
novel (Mokili et al., 2012). Coupling metagenomic and NGS techniques provides a sensitive
manner in which to detect low titre viruses and establish genetic variation within strains of virus
variants (Al Rwahnih et al., 2009). Furthermore, specific viruses within the community can be
quantified according to the frequency at which the reads related to that virus occur (Mardis, 2008b).
NGS comprises of three primary elements, which include the preparation of the sample, high-
throughput sequencing and the bioinformatics analysis of the data generated (Mokili et al., 2012).
NGS technology does not require a large amount of initial material, however it does require high
quality material in order to construct suitable libraries through RT-PCR (Yuzuki, 2012). RNA
viruses, viroids, ribosomal RNA (rRNA), messenger RNA (mRNA) and replicating DNA viruses
all mark RNA as the preferred form of starting material. In addition to this, the use of RNA
eliminates host genomic DNA that may be present in the sample (Adams et al., 2009). Double-
strand RNA (dsRNA) is an intermediate produced from complementary RNA during the replication
of either a positive or negative ssRNA viral genome (Martelli et al., 2012). dsRNA, when used as
the starting material for NGS applied to grapevine, selects the detection of sequences derived from
viruses.
2.5.2. Next-generation sequencing platforms
Various next-generation sequencing technologies are commercially available from a number of
companies; however, Illumina Genome Analyzer, ABI SOLiD and Roche 454 FLX are the three
most extensively employed (Liu et al., 2012; Zhang et al., 2011; Mardis, 2008a). These platforms
provide larger output data in a high-throughput manner compared to traditional sequencing
techniques. The Illumina MiSeq, Life Technologies Ion Torrent PGM and Roche 454 GS Junior are
examples of personal genome machines (PGM) that generate less output data at a faster rate
Stellenbosch University https://scholar.sun.ac.za
! 22!
(Loman et al., 2012). The above-mentioned platforms require PCR amplification, which
complicates the process of genotyping by incorporating sequencing errors as well as producing
duplicate template molecules (Kozarewa et al., 2009). The development of third-generation
sequencers, such as Pacific Biosciences PacBio RS, allows researchers to overcome these problems
by eliminating the PCR amplification process; instead a single DNA molecule is used whereby
emitted signals during sequencing are observed in real time (Liu et al., 2012).
Illumina offers innovative technologies that allow the analysis of genetic variation and function,
making studies like this possible across the globe. Illumina provides the largest output data per run
with high accuracy across short reads and was selected as the instrument of choice based on these
facts. The Illumina Genome Analyzer / HiSeq System makes use of sequencing by synthesis (SBS)
chemistry. The sequencing process begins with fragmented DNA of less than 800 bps, to which
universal adaptors are ligated and single-stranded DNA molecules generated through denaturation
(Zhou et al., 2010). The DNA templates are then distributed on a flow cell and immobilized on a
glass slide, where clonal DNA fragments are generated through bridge amplification (Mercier et al.,
2003). A reaction mixture containing four fluorescently labelled reversible terminator nucleotides
(2’,3’-dideoxynucleotide triphosphates), is then added to the glass slide during sequencing. The
2’,3’-dideoxynucleotide triphosphates contain a 3’-block that, when incorporated, terminates the
sequencing cycle; a charge-couple device (CCD) sensor detects the position of the incorporated
nucleotide through the uniquely labelled fluorescent dye (Zhou et al., 2010). Once the cycle is
complete, the fluorescent dye and terminators are chemically removed to prepare complementary
strands for the following sequencing cycle. The number of cycles is determined based on the focus
of the sequencing reaction. Once the sequencing has completed, reads that show poor quality are
removed and a base-calling algorithm is used to determine the cluster sequences (Liu et al., 2012;
Mokili et al., 2012; Zhang et al., 2011; Mardis, 2008a; Mardis, 2008b). Commercially available
Illumina sequencers include the MiSeqDx, NextSeq 500, HiSeq 2500, HiSeq X Ten and the HiScan
(Table 2.3).
Stellenbosch University https://scholar.sun.ac.za

! 23!
Company: Instrument: Sequencing Mechanism: Read Length (bp):Reads/ Run:
Output Data/ Run:
Time/ Run: Advantages: Disadvantages:
High Quality, High Cost,Long Reads Low Output
HiSeq 2500 Sequencing-by-Synthesis 2 x 100 640 Ma 600 Gb 11 db
HiScanSQ Sequencing-by-Synthesis 2 x 100 1.5 Ba 150 Gb 8.5 dPaired End: 75 x 35Mate Pair: 60 x 60
Fragment: 75
Illumina MiSeq Sequencing-by-Synthesis 2 x 250 34 Ma 7.5 - 8.5 Gb 39 hrs High Output Long Run TimeIon Torrent 314 chip 0.1 M 20 Mb 2.4 hrsIon Torrent 316 chip 1 M 200 Mb 3 hrsIon Torrent 318 chip 5 M 1 Gb 4.5 hrsIon Proton I 80 M 10 Gb 4 hrs
10 hrs Short Run Time
Low Output, Low Read/ Run
Life Technologies 200 Short Run Time
High Cost, Long Sample Preparation Time
454 Sequencing GS Junior Pyrosequencing 400 0.1 M 35 Mb
Proton sensing by Semiconductor
Pacific Biosciences PacBio RS (SMRT) 2200 10 K 10 Mb 2 hrs
1000 1 M 700 Mb 23 hrs
3730xl DNA Analyzer
Long Reads, Accurate
High Cost, Long Run Time
Illumina
Applied Biosystems SOLiD 5500xl Sequencing-by-Ligation
454 Sequencing Pyrosequencing
7 d
0.7 - 2 Mb96400 - 900Dideoxy Chain Termination
Conventional Sequencing (Sanger):
Second-Generation Sequencers:
Third-Generation Sequencer:
Personal Genome Machines:
GS FLX Titanium XL+FLX System
Real-Time Flourescent DNA Polymerization
High-Throughput
Short Read Assembly
2 hrsLife Technologies
Short Run Time, Long Reads
High Cost, Low Read/ Run
Accurate, Low Cost
Short Read Assembly
2.8 Ba 180 Gb
Table 2.3: The comparison of next-generation sequencers available on the market.
a Number of paired-end reads. b Dual flow cell time/ run. Data was acquired from the following websites: Applied Biosystems: http://www.appliedbiosystems.com/absite/us/en/home/applications-technologies/solid-next-generation-sequencing/next-generation-systems.html Illumina: http://www.illumina.com/technology/sequencing_technology.ilmn Life Technologies: http://www.lifetechnologies.com/global/en/home.html Pacific Biosciences: http://www.pacificbiosciences.com/products/smrt-technology/ Roche: http://454.com/products/gs-flx-systems/index.asp
2.5.3. Bioinformatics associated with next-generation sequencing
The invention of NGS has enabled the scientific community to produce vast amounts of sequencing
data at an increased rate. The data, however, requires extensive interpretation that requires a
suitable amount of storage not only to supply the capacity of produced raw data but in analysis and
comparisons of the sequences generated (Zhang et al., 2011; Hugenholtz and Tyson, 2008). In the
order of 100 GB storage is needed to store NGS data with a compute capacity of 2-4 multicore
CPUs and roughly 500 GB of random access memory (RAM) for processing the data generated.
Difficulties in bioinformatics occur with the immense memory needed for read assemblies and the
independent formats of output data produced through different sequencing platforms. As a result
there are no universal bioinformatics tools that can be applied for all platforms (Zhang et al., 2011).
The preliminary step in analyzing NGS data is trimming the short read datasets with low quality
scores to generate high quality reads. Following this is a filtering process whereby the reads that
match unwanted sequences, such as host and adaptor sequences, are removed from the database.
Once the reads have been trimmed and filtered the process of either read-mapping or de novo
Stellenbosch University https://scholar.sun.ac.za

! 24!
assemblies can be performed (Mokili et al., 2012). Generated reads can be aligned to a set of
reference sequences or genomes, located in GenBank databases or in personal archives, through
read-mappings or assembled through de novo assemblies to produce contiguous sequences (contigs)
that can be analyzed using BLAST searches. Both processes functioning in identifying the origin of
the NGS reads generated. The most common practice in sequence alignment is to compare the
translated query sequences generated with translated sequences in a database. Through this
approach a greater hit count is obtained and limitations associated with base-calling can be
overcome. However, comparing sequences in this manner requires a greater computing power and
additional time (Edwards and Rohwer, 2005).
The process of aligning short reads to a reference genome is termed read-mapping. Performing
mapping assemblies determines the percentage of the reference genome covered, the number of
reads aligning to a reference and the depth of reference coverage by aligned reads. Read-mapping
can be performed using either a Burrows-Wheeler Transform (BWT) or spaced seed indexing based
algorithm (Schbath et al., 2012). Spaced seed indexing requires greater RAM on computers and
generates alignments at a lower rate. This algorithm is employed by MAQ (Mapping and Assembly
Quality), where BWT is used for Bowtie (Trapnell and Salzberg, 2009).
There are substantial numbers of metagenomic reads or contigs that are non-homologous to known
sequences present in databases. To determine where these sequences originate, de novo assemblies
can be used. Through de novo assemblies, raw reads are distributed into groups of fragments,
termed k-mers, of a defined length (hash length). Overlapping reads are then concatenated to form
longer contigs made possible with de Bruijn graphs (Scholz et al., 2012; Zerbino and Birney, 2008).
The above-mentioned process requires between 256 and 512 GB of RAM to construct a medium
sized genome; however, the assembly time is significantly reduced when using the k-mer based
assembly (Scholz et al., 2012).
There are a number of open source bioinformatics tools available online (Supplementary Table
S.1); however a majority make use of UNIX-like operating systems which has limitations in user
graphical interface ability. CLC Genomics Workbench (CLC Bio) offers a user-friendly analysis
package for visualizing, comparing and analyzing NGS data. CLC Genomics Workbench supports
the major NGS platforms and is available for Mac OS X, Windows and Linux. The functions of
CLC are versatile, as one can check for quality, trim reads, assemble reads either through read-
mapping or de novo assemblies, providing users with a complete set of analyses (CLC Bio). Data
can also be imported and exported in a multitude of formats, allowing versatility in subsequent
analysis.
Stellenbosch University https://scholar.sun.ac.za

! 25!
2.5.4. Application of next-generation sequencing to grapevine diseases
There are many viruses infecting grapevine, including those that cause diseases of unknown
etiology and the latent viruses with unknown disease association. The association of viruses to form
virus complexes causing disease is less known and may contribute to symptoms more severe than
with single infections. With the advent of NGS, a more comprehensive understanding in disease
etiology can be attained. There have been multiple studies on grapevine disease using NGS (Maree
et al., 2012; Al Rwahnih et al., 2011; Coetzee et al., 2010; Al Rwahnih et al., 2009), each of which
employs a different approach. These approaches differ in the type of starting material used, NGS
technology applied, sampling methods and bioinformatics analysis. The following information links
to previously performed research on grapevine diseases using NGS.
Al Rwahnih et al. (2009) made use of the 454 GS FLX NGS platform to sequence dsRNA extracted
from the bark scrapings of two healthy and two Syrah decline symptomatic vines. Direct
comparison of generated reads to GenBank databases revealed that Grapevine leafroll-associated
virus type 9 (GLRaV-9), Grapevine Yellow speckled viroid (GYSVd), Australian grapevine viroid
(AGVd) and Hop stunt viroid (HSVd) existed in the diseased vines; Grapevine rupestris stem
pitting-associated virus (GRSPaV) and Grapevine rupestris vein-feathering virus (GRVFV) were
present in all of the vines sampled. The study also detected a novel virus named Grapevine syrah
virus-1 (GSyV-1) (Al Rwahnih et al., 2009).
In 2010, Coetzee et al. performed a survey of 44 random Merlot samples in a South African
diseased vineyard. dsRNA was extracted from phloem and subsequently sequenced as a combined
sample to generate paired-end reads using the Illumina Genome Analzyer II. Velvet was used to
perform de novo assemblies, after which generated scaffolds were subjected to homology BLAST
searches; MAQ was used to map reads to existing virus genomes. They identified GLRaV-3 as the
most prevalent virus, representing 59% of the generated reads, followed by GRSPaV and GVA.
GVE and mycoviruses were detected for the first time in South African grapevines (Coetzee et al.,
2010).
Maree et al. (2012) made use the Illumina HiScanSQ NGS platform to sequence the dsRNA
extracted from five vines displaying either shiraz disease or leafroll disease (control) symptoms.
Through read-mappings and homology searches using BLAST, eight viruses and virus variants
were identified along with 46 mycoviruses and four viroids (GYSVd-1, GYSVd-2, HSVd and
AGVd). GLRaV-3 was detected in all of the tested vines and GVA was present in 80% of the tested
vines; further signifying the hypothesis that GVA group II variants are coupled with Shiraz disease
(Maree et al., 2012).
Stellenbosch University https://scholar.sun.ac.za

! 26!
2.6. Conclusion
GLD has been documented to cause up to 60% loss in product yield in some vineyards; placing
significant limitations on the production of premium quality wines and delaying wine sales.
Extensive research has shown that the most significant of the GLRaVs in GLD infection is GLRaV-
3. However, grapevine is host to 70 infectious agents and the association of these viruses to
different diseases has yet to be identified. The symptom expression of GLD differs considerably
between cultivars creating difficulties in the visual selection of diseased vines. As a result, virus
screening of infected plants remains the basis of accurate detection for the development of disease
management programs.
The genetic information for many viruses have been documented, however, there remain a number
of viruses of which little or nothing is known. NGS has provided opportunities to conduct research
into understanding the entire complement of viruses present in any given sample, whether they are
known or unknown. This has enabled scientists to establish a more comprehensive understanding
into disease etiology and potentially reduce the negative effects that viruses present during infection.
2.7. References!
Abou Ghanem-Sabanadzovic, N., Sabanadzovic, S., Uyemoto, J., Golino, D., Rowhani, A. 2010. A putative new ampelovirus associated with grapevine leafroll disease. Archives of Virology. 155: 1871-1876.
Adams, I.P., Glover, R.H., Monger, W.A., Mumford, R., Jackeviciene, E., Navalinskiene, M., Samuitiene, M., Boonham, N. 2009. Next-generation sequencing and metagenomic analysis: a universal diagnostic tool in plant virology. Molecular Plant Pathology. 10: 537-545.
Agranovsky, A.A., Koonin, E.V., Boyko, V.P., Maiss, E., Frotschl, R., Lunina, N.A., Atabekov, J.G. 1994. Beet yellows closterovirus: Complete genome structure and identification of leader papain-like thiol protease. Journal of Virology. 198: 311-324.
Agranovsky, A.A., Lesemann, D.E., Maiss, E., Hull, R., Atabekov, J.G. 1995. "Rattlesnake" structure of a filamentous plant RNA virus built of two capsid proteins. Proceedings of the National Academy of Sciences, USA. 92: 2470-2473.
Akbas, B., Kunter, B., Ilhan, D. 2007. Occurrence and distribution of grapevine leafroll-associated viruses 1, 2, 3 and 7 in Turkey. Journal of Phytopathology. 155: 122-124.
Al Rwahnih, M., Daubert, S., Golino, D., Rowhani, A. 2009. Deep sequencing analysis of RNAs from a grapevine showing Syrah decline symptoms reveals a multiple virus infection that includes a novel virus. Journal of Virology. 387: 395-401.
Al Rwahnih, M., Daubert, S., Úrbez-Torres, J.R., Cordero, F., Rowhani, A. 2011. Deep sequencing evidence from single grapevine plants reveals a virome dominated by mycoviruses. Archives of Virology. 156: 397-403.
Almeida, R.P., Daane, K.M., Bell, V.A., Blaisdell, G.K., Cooper, M.L., Herrbach, E., Pietersen, G. 2013. Ecology and management of grapevine leafroll disease. Frontiers in Microbiology. 4:94. doi: 10.3389/fmicb.2013.00094.
Stellenbosch University https://scholar.sun.ac.za

! 27!
Alzhanova, D.V., Hagiwara, Y., Peremyslov, V.V., Dolja, V.V. 2000. Genetic analysis of the cell-to-cell movement of beet yellows closterovirus. Journal of Virology. 268: 192-200.
Alzhanova, D.V., Napuli, A., Creamer, R., Dolja, V.V. 2001. Cell-to-cell movement and assembly of a plant closterovirus: roles for the capsid proteins and Hsp70 homolog. EMBO Journal. 20: 6997-7007.
Alzhanova, D.V., Prokhnevsky, A.I., Peremyslov, V.V., Dolja, V.V. 2007. Virion tails of Beet yellows virus: Coordinated assembly by three structural proteins. Journal of Virology. 359: 220-226.
Beerenwinkel, N., and Zagordi, O. 2011. Ultra-deep sequencing for the analysis of viral populations. Current opinions in Virology. 1: 413-418.
Bell, V.A., Bonfiglioli, R.G.E., Walker, J.T.S., Lo, P.L., Mackay, J.F., McGregor, S.E. 2009. Grapevine leafroll-associated virus 3 persistence in Vitis vinifera remnant roots. Journal of Plant Pathology. 91: 527-533.
Bester, R., Maree, H.J., Burger, J.T. 2012. Complete nucleotide sequence of a new strain of grapevine leafroll-associated virus 3 in South Africa. Archives of Virology. 157: 1815-1819.
Cabaleiro, C., Segura, A., García-Berrios, J.J. 1999. Effects of grapevine leafroll-associated virus 3 on the physiology and must of Vitis vinifera L. cv. Albariño following contamination in the field. American Journal of Enology and Viticulture. 50: 40-44.
Castellano, M.A., Martelli, G.P., Savino, V. 1983. Virus-like particles and ultrastructural modifications in the phloem of leafroll-affected vines. Vitis. 22: 23-39.
Cenchao, S. 2013. Bio-Nanotechnology: A Revolution in Food, Biomedical and Health Sciences: An Overview of Nanoparticle-Assisted Polymerase Chain Reaction Technology. US: Wiley-BlackwellPublishing Ltd. 2013: 97-106.
Cenchao, S., Wenjuan, Y., Qiaoli, J., Hisaji, M., Anjie, D., Zhizhou, Z. 2009. NanoPCR observation: different levels of DNA replication fidelity in nanoparticle-enhanced polymerase chain reactions. Nanotechnology. 20: 455103.
Charles, J.G, Froud, K.J., van den Brink, R., Allan, D.J. 2009. Mealybugs and the spread of grapevine leafroll-associated virus 3 (GLRaV-3) in a New Zealand vineyard. Australas. Journal of Plant Pathology. 38: 576-583.
Charles, J.G., Cohen, D., Walker, J.T.S., Forgie, S.A., Bell, V.A., Breen, K.C. 2006a. A review of Grapevine leafroll-associated virus type 3 (GLRaV-3) for the New Zealand wine industry. Report to New Zealand Winegrowers. HortResearch Client Report. 18447: 1-79.
Charles, J.G., Cohen, D., Walker, J.T.S., Forgie, S.A., Bell, V.A., Breen, K.C. 2006b. A review of the ecology of grapevine leafroll-associated virus type 3 (GLRaV-3). New Zealand Plant Protection. 59: 330-337.
Chooi, K.M., Pearson, M.N., Cohen, D., Pong, J.C.H. 2009. Sequence variation in Grapevine leafroll-associated virus-3 (GLRaV-3) New Zealand isolates. Proceedings of the 16th Congress of the International Council for the study of Virus and Virus-like Diseases of the Grapevine (ICVG), Dijon, France. 31 August-4 September, 2009: 290-291.
Clark, M.F., and Adams, A.N. 1977. Characteristics of the microplate method of enzyme-linked immunosorbent assay for the detection of plant viruses. Journal of General Virology. 34: 475-483.
Coetzee, B., Freeborough, M.J., Maree, H.J., Celton, J.M., Reese, D.J.G., Burger, J.T. 2010. Deep sequencing analysis of viruses infecting grapevines: Virome of a vineyard. Journal of Virology. 400: 157-163.
Constable, F.E., Nicholas, P., Rodoni, B.C. 2010. Development and validation of diagnostic protocols for the detection of endemic and exotic pathogens of grapevines. Final report to grape and wine research &
Stellenbosch University https://scholar.sun.ac.za
! 28!
development corporation. Department of primary industries, DPI 05/04: 283.
Dolja, V.V., Kreuze, J.F., Valkonen, J.P.T. 2006. Comparative and functional genomics of closteroviruses. Virus Research. 117: 38-51.
Don, R.H., Cox, P.T., Wainwright, B.J., Baker, K., Mattick, J.S. 1991. Touchdown' PCR to circumvent spurious priming during gene amplification. Nucleic Acids Research. 19: 4008.
Edwards, R.A., and Rohwer, F. 2005.Viral metagenomics. Nature Reviews Microbiology. 3: 504-510.
Engel, E.A., Escobar, P.F., Rojas, L.A., Rivera, P.A., Fiore, N., Valenzuela, P.D.T. 2010. A diagnostic oligonucleotide microarray for simultaneous detection of grapevine viruses. Journal of Virological Methods. 163: 445-451.
Engelbrecht, D.J., and Kasdorf, G.G.F. 1990. Field spread of corky bark, fleck, leafroll and Shiraz decline diseases and associated viruses in South African grapevines. Phytophylactica. 22: 347-354.
Engvall, R., and Perlmann, P. 1971. Enzyme-linked immunosorbent assay (ELISA). Quantitative assay of immunoglobulin G. Immunochemistry. 8: 871-874.
Faoro, F., Tornaghi, R., Belli, G. 1981. Association of a possible closterovirus with grapevine leafroll in northern Italy. Journal of Plant Pathology. 17: 183-189.
Farooq, A.B.U., Ma, Y., Wand, Z., Zhou, N., Wenxing, X. 2012. Genetic diversity analyses reveal novel recombination events in Grapevine leafroll-associated virus -3 in China. Virus Research. 171: 15-21.
Fierer, N., Breitbart, M., Nulton, J., Salamon, P., Lozupone, C., Jones, R., Robeson, M., Edwards, R.A., Felts, B., Rayhawk, S., et al. 2007. Metagenomic and small subunit rRNA analyses reveal the genetic diversity of bacteria, archaea, fungi, and viruses in soil. Applied and Environmental Microbiology. 73: 7059-7066.
Fiore, N., Prodan, S., Montealegre, J., Aballay, E., Pino, A.M., Zamorano, A. 2008. Survey of grapevine viruses in Chile. Journal of Plant Pathology. 90: 125-130.
Fuchs, M., Marsella-Herrick, P., Loeb, G.M., Martinson, T.E., Hoch, H.C. 2009. Diversity of Ampeloviruses in Mealybug and Soft Scale Vectors and in Grapevine Hosts from Leafroll-Affected Vineyards. Phytopathology. 99: 1177-1184.
Golino, D., Sim, S., Gill, R., Rowhani, A. 2002. California mealybugs can spread grapevine leafroll disease. California Agriculture. 56: 196-201.
Gouveia, P., and Nolasco, G. 2012. The p19.7 RNA silencing suppressor from Grapevine leafroll-associated virus 3 shows different levels of activity across phylogenetic groups. Virus Genes. 45: 333-339.
Gouveia, P., Esteves, F., Teixeira Santos, M., Fonseca, F., Eiras-Dias, J.E., Nolasco, G. 2009. Assessment of GLRaV-3 variants occurring in Portuguese grapevine varieties according to the coat protein gene. Proceedings of the 16th Congress of the International Council for the study of Virus and Virus-like Diseases of the Grapevine (ICVG), Dijon, France. 31 August-4 September, 2009: 316-317.
Gugerli, P., Brugger, J. J., Bovey, R. 1984. L’enroulement de la vigne: mise en évidence de particules virales et développement d’une méthode immunoenzymatique pour le diagnostic rapide. Revue Suisse de Viticulture Arboriculture Horticulture. 16: 299-304.
Habili, N., Fazeli, C., Ewart, A., Hamilton, R., Cirami, R., Saldarelli, P., Minafra, A., Rezaian, M. 1995. Natural spread and molecular analysis of grapevine leafroll-associated virus 3 in Australia. Phytopathology. 85: 1418-1422.
Herman, J.G., Graff, J.R., Myöhänen, S., Nelkin, B.D., Baylin, S.B. 1996. Methylation-specific PCR: a novel PCR assay for methylation status of CpG islands. Proceedings of the National Academy of Sciences, USA. 93: 9821-9826.
Stellenbosch University https://scholar.sun.ac.za

! 29!
Hu, J.S., Gonsalves, D., and Teliz, D. 1990. Characterization of closterovirus-like particles associated with grapevine leafroll disease. Journal of Phytopathology. 128: 1-14.
Hugenholtz, P., and Tyson, G.W. 2008. Microbiology: Metagenomics. Nature. 455: 481-483.
Isenbarger, T.A., Finney, M., Ríos-Velázquez, C., Handelsman, J., Ruvkun, G. 2008. Miniprimer PCR, a New Lens for Viewing the Microbial World. Applied and Environmental Microbiology. 74: 840-9.
Jarugula, S., Gowda, S., Dawson, W., Naidu, R. 2010. 3' co-terminal subgenomic RNAs and putative cis-acting elements of Grapevine leafroll-associated virus 3 reveals 'unique' features of gene expression strategy in the genus Ampelovirus. Journal of Virology. 7: 180.
Jooste A.E.C., and Goszczynski D.E. 2005. Single-strand conformation polymorphism (SSCP), cloning and sequencing reveal two major groups of divergent molecular variants of grapevine leafroll-associated virus 3 (GLRaV-3). Vitis. 44: 39-43.
Jooste, A.E.C., Maree, H.J, Bellstedt, D., Goszczynski, D.E, Pietersen, G., Burger, J.T. 2010. Three genetic grapevine leafroll-associated virus 3 (GLRaV-3) variants identified from South African vineyards show high variability in their 5’UTR. Archives of Virology. 155: 1997-2006.
Jooste, A.E.C., Pietersen, G., Burger, J.T. 2011. Distribution of grapevine leafroll associated virus-3 variants in South African vineyards. European Journal of Plant Pathology. 131: 371-381.
Jordan, D., Peterson, C., Morgan, L., Segaran, A. 1993. Spread of grapevine leafroll and its associated virus in New Zealand vineyards. Proceedings of the 11th Congress of the International Council for the study of Virus and Virus-like Diseases of the Grapevine (ICVG), Montreauz, Switzerland. 6-9 September, 1993: 113-114.
Joubert, C.J. Mealybugs on vines. Bulletin of the Deaprtment of Agriculture of South Africa. 243: 1-20.
Kim, K.H., Chang, H.W., Nam, Y.D., Roh, S.W., Kim, M.S., Sung, Y., Jeon, C.O., Oh, H.M., Bae, J.W. 2008. Amplification of uncultured single-stranded DNA viruses from rice paddy soil. Applied andEnvironmental Microbiology. 74: 5975-5985.
Koenig, R., and Paul, H.L. 1982. Variants of ELISA in plant virus diagnosis. Journal of Virological Methods. 5: 113-125.
Koonin, E.V., and Dolja, V.V. 2012. Expanding networks of RNA virus evolution. BMC Biology. 10: 54.
Kozarewa, I., Ning, Z., Quail, M.A., Sanders, M.J., Berriman, M., Turner, D.J. 2009. Amplification-free Illumina sequencing-library preparation facilitates improved mapping and assembly of (G+C)-biased genomes. Nature Methods. 6: 291-295.
Ling, K.S, Zhu, H.Y., Gonsalves, D. 2004. Complete nucleotide sequence and genome organization of Grapevine leafroll-associated virus 3, type member of the genus Ampelovirus. Journal of General Virology. 85: 2099-2102.
Ling, K.S., Zhu, H.Y., Alvizo, H., Hu, J.S., Drong, R.F., Slightom, J.L., Gonsalves, D. 1997. The coat protein gene of grapevine leafroll-associated closterovirus-3: cloning, nucleotide sequencing and expression in transgenic plants. Archives of Virology. 142: 1101-1116.
Ling, K.S., Zhu, H.Y., Drong, R.F., Slightom, J.L., McFerson, J.R., Gonsalves, D. 1998. Nucleotide sequence of the 3'-terminal two-thirds of the grapevine leafroll-associated virus-3 genome reveals a typical monopartite closterovirus. Journal of General Virology. 79: 1299-1307.
Ling, K.S., Zhu, H.Y., Petrovic, N., Gonsalves, D. 2001. Comparative effectiveness of ELISA and RT-PCR for detecting Grapevine leafroll-associated closterovirus-3 in field samples. American Journal of Enology and Viticulture. 52: 21-27.
Liu, L., Li, Y., Li, S., Hu, N., He, Y., Pong, R., Lin, D., Lu, L., Law, M. 2012. Comparison of next-
Stellenbosch University https://scholar.sun.ac.za

! 30!
generation sequencing systems. Journal of Biomedicine and Biotechnology. 2012: 251364.
Loman, N.J., Misra, R.V., Dallman, T.J., Constantinidou, C., Gharbia, S.E., Wain, J., Pallen, M.J. 2012. Performance comparison of benchtop high-throughput sequencing platforms. Nature Biotechnology. 30: 434-441.
Mahfoudhi, N., Digiaro, M., Dhouibi, M.H. 2008. Incidence and distribution of grapevine leafroll-associated viruses in Tunisian vineyards. Journal of Phytopathology. 156: 556-558.
Maliogka, V., Dovas, C., Katis, N. 2008. Evolutionary relationships of virus species belonging to a distinct lineage within the Ampelovirus genus. Virus Research. 135: 125-135.
Maliogka, V., Dovas, C., Lotos, L., Efthimiou, K., Katis, N. 2009. Complete genome analysis and immunodetection of a member of a novel virus species belonging to the genus Ampelovirus. Archives of Virology. 154: 209-218.
Mannini, F., Argamante, N., Credi, R. 1996. Improvement in the quality of grapevine ‘Nebbiolo’ clones obtained by sanitation. Acta Horticulturae. 427: 319-324.
Mannini, F., Mollo, A., Credi, R. 2012. Field performance and wine quality modification in a clone of Vitis vinifera cv. Dolcetto after GLRaV-3 elimination. American Journal of Enology and Viticulture. 63: 144-147
Mardis, E.R. 2008a. Next-generation DNA sequencing methods. Annual Review of Genomics and Human Genetics. 9: 387-402.
Mardis, E.R. 2008b. The impact of next-generation sequencing technology on genetics. Trends in Genetics. 24: 133-141.
Maree, H.J. 2010. Identification and characterisation of Grapevine-leafroll-associated virus 3 genomic and subgenomic RNAs. Ph.D thesis, University of Stellenbosch.
Maree, H.J. Almeida, R.P.P. Bester, R, Chooi, K.M., Cohen, D., Dolja, V.V., Fuchs, M.F., Golino, D.A., Jooste, A.E.C., Martelli, G.P., Naidu, R.A., Rowhani, A., Saldarelli P., Burger, J.T. 2013. Grapevine leafroll associated virus 3. Frontiers in Microbiology. 4:82. doi: 10.3389/fmicb.2013.00082.
Maree, H.J., Espach, Y., Rees, D.J.G., Burger, J.T. 2012. A study of Shiraz Disease Etiology Using Next-Generation Sequencing Technology. Proceedings of the 17th Congress of the International Council for the study of Virus and Virus-like Diseases of the Grapevine (ICVG), Davis, California, USA. 7-14 October, 2012: 13-31.
Maree, H.J., Freeborough, M.J., Burger, J.T. 2008. Complete nucleotide sequence of a South African isolate of grapevine leafroll-associated virus 3 reveals a 5’ UTR of 737 nucleotides. Archives of Virology. 153: 755-757.
Margulies, M., Egholm, M., Altman, W.E., Attiya, S., Bader, J.S., Bemben, L.A., Berka, J., Braverman, M.S., Chen, Y.J., Chen, Z., et al. 2005. Genome sequencing in microfabricated high-density picolitre reactors. Nature. 437: 376-380.
Martelli, G.P. 2014. Directory of virus and virus-like diseases of the grapevine and their agents. Journal of Plant Pathology. 96 (1, Supplement): 1-136.
Martelli, G.P., Agranovsky, A.A., Al Rwahnih, M., Dolja, V.V., Dovas, C.I., Fuchs, M., et al. 2012. Taxonomic revision of the family Closteroviridae with special reference to the grapevine leafroll-associated members of the genus Ampelovirus and the putative species unassigned to the family. Journal of Plant Pathology. 94: 7-19
Martelli, G.P., Agranovsky, A.A., Bar-Joseph, M., Boscia, D., Candresse, T., Coutts, R.H.A., Dolja, V.V., Falk, B.W., Gonsalves, D., Jelkmann, W., Karasev, A.V., Minafra, A., Namba, S., Vetten, H.J., Wisler, G.C., Yoshikawa, N. 2002. The family Closteroviridae revised. Archives of Virology. 147: 2039-2044.
Martelli, G.P., Agranovsky, A.A., Bar-Joseph, M., Boscia, D., Candresse, T., Coutts, R.H.A., et al. 2011.
Stellenbosch University https://scholar.sun.ac.za

! 31!
Family Closteroviridae. In: King, A., Adams, M.J., Carstens, E.B., Lefkowitz, E., (eds.), Virus Taxonomy: Ninth Report of the International Committee on Taxonomy of Viruses. Elsevier-Academic Press, Amsterdam. 2011: 987-1001
Martelli, G.P., and Boudon-Padieu, E. 2006. Directory of infectious diseases of grapevines and viroses andvirus�like diseases of the grapevine: Bibliographic report 1998 - 2004. Options Méditerranéennes série B: Studies and Research. 55, CIHEAM, 2006: 279.
Martelli, G.P., and Digiaro, M. 1999. Proceedings of the Mediterranean network on grapevine closteroviruses 1992-1997 and the viroses and virus-like diseases of the grapevine: Bibliographic report 1985 - 1997. Options Méditerranéennes série B: Studies and Research. 29, CIHEAM, 1999: 280.
Mercier, J.F., Slater, G.W., Mayer, P. 2003. Solid Phase DNA Amplification: A Simple Monte Carlo Lattice Model. Biophysical Journal. 85: 2075-2086.
Mokili, J.L., Rohwer, F., Dutilh, B.E. 2012. Metagenomics and future perspectives in virus discovery. Current Opinion in Virology. 2: 63-77.
Monis, J., and Bestwick, R.K. 1996. Detection and localization of grapevine leafroll-associated closteroviruses in greenhouse and tissue culture grown plants. American Journal of Enology and Viticulture. 47: 199-205.
Mueller, P.R., and Wold, B. 1988. In vivo footprinting of a muscle specific enhancer by ligation mediated PCR. Science. 246: 780-786.
Mullis, K., Faloona, F., Scharf, S., Saiki, R., Horn, G., Erlich, H. 1986. Specific enzymatic amplification of DNA in vitro: the polymerase chain reaction. Cold Spring Harbor Symposia Quantitative Biology. 51: 263-273.
Namba, S., Yamashita, S., Doi, I., Yora, K., and Yano, R. 1979. Grapevine leafroll virus, a possible member of closteroviruses. Annals of the Phytopathological Society of Japan. 45: 497-502.
Nicholas, P.R. 2006. Selection of clones for the Australian national nuclear grapevine collection. The Australian & New Zealand Grapegrower & Winemaker. 2006: 32-35.
Ochman, H., Gerber, A.S., Hartl, D.L. 1988. Genetic Applications of an Inverse Polymerase Chain Reaction. Genetics. 120: 621-623.
Over de Linden, A.J., and Chamberlain, E.E. 1970. Effect of grapevine leafroll virus on vine growth and fruit yield and quality. New Zealand Journal of Agricultural Research. 13: 689-698.
Peremyslov, V.V., Andreev, I.A., Prokhnevsky, A.I., Duncan, G.H., Taliansky, M.E., and Dolja, V.V. 2004. Complex molecular architecture of beet yellows virus particles. Proceedings of the National Academy of Sciences, USA. 101: 5030-5035.
Peremyslov, V.V., Hagiwara, Y., Dolja, V.V. 1999. HSP70 homolog functions in cell-to-cell movement of a plant virus. Proceedings of the National Academy of Sciences, USA. 96: 14771-14776.
Peremyslov, V.V., Pan, Y.W., Dolja, V.V. 2004a. Movement protein of a closterovirus is a type III integral transmembrane protein localized to the endoplasmic reticulum. Journal of Virology. 78: 3704-3709.
Rosciglione, B., and Gugerli, P. 1986. Maladies de l’enroulement et du bois strié de la vigne: analyse microscopique et sérologique. Revue Suisse de Viticulture Arboriculture Horticulture. 18: 207-211.
Rosciglione, B., and Gugerli, P. 1987. Transmission of grapevine leafroll disease and an associated closterovirus to healthy grapevines by the mealy bug Planococcus ficus Signoret. Proceedings of the 9th Congress of the International Council for the study of Virus and Virus-like Diseases of the Grapevine (ICVG), Kyriat Anavim, Israel. 6-11 September, 1987: 67-69.
Rowhani, A. 1992. Use of F(ab')2 antibody fragment in ELISA for the detection of grapevine viruses.
Stellenbosch University https://scholar.sun.ac.za
! 32!
American Journal of Enology and Viticulture. 43: 38-40.
Rowhani, A., and Golino, D. 1995. ELISA test reveals new information about leafroll disease. California Agriculture. 49: 26-29.
Rowhani, A., Uyemoto, J.K., Golino, D.A. 1997. A comparison between serological and biological assays in detecting grapevine leafroll-associated viruses. Plant Disease. 81: 799-801.
Schaad, N.W., and Frederick, R.D. 2002. Real-time PCR and its application for rapid plant disease diagnostics. Canadian Journal of Plant Pathology. 24: 250-258.
Schaad, N.W., Frederick, R.D., Shaw, J., Schneider, W.L., Hickson, R., Petrillo, M.D., Luster, D.G. 2003. Advances in molecular-based diagnostics in meeting crop biosecurity and phytosanitary issues. Annual Review of Phytopathology. 41: 305-324.
Schbath, S., Martin, V., Zytnicki, M., Fayolle, J., Loux, V., Gibrat, J.F. 2012. Mapping reads on a genomic sequence: An algorithmic overview and a practical comparative analysis. Journal of Computational Biology. 19: 796-813.
Scholz, M.B., Lo, C.C., Chain, P.S.G. 2012. Next generation sequencing and bioinformatic bottlenecks: The current state of metagenomic data analysis. Current Opinions in Biotechnology. 23: 9-15.
Seah, Y.M., Sharma, A.M., Zhang, S., Almeida, R.P.P., Duffy, S. 2012. A divergent variant of Grapevine leafroll-associated virus 3 is present in California. Journal of Virology. 9: 235.
Sharma, A.M., Wang, J., Duffy, S., Zhang, S., Wong, M.K., Rashed, A., Cooper, M.L., Daane, K.M., Almeida, R.P.P. 2011. Occurrence of grapevine leafroll-associated virus complex in Napa Valley. PLoS ONE. 6: e26227.
Tanne, E., Ben-Dov, Y., Raccah, B. 1989. Transmission of closterovirus-like particles by mealybugs (Pseudococcidea) in Israel. Phytoparasitica. 17: 63-64.
Teliz, D. 1987. Field serological detection of viral antigens associated with grapevine leafroll disease. Plant Disease. 71: 704-709.
Teliz, D., Gonsalves, D., Hu, J.S., Hummer, D.J. 1989. Detection of grapevine leafroll associated closteroviruses in recently infected tissue in New York and spread of the disease in Mexico. Phytoparasitica. 17: 9.
Thompson, J.R., Fuchs, M., Fischer, K.F., Perry, K.L. 2012. Macroarray detection of grapevine leafroll-associated viruses. Journal of Virological Methods. 183: 161-169.
Trapnell, C., and Salzberg, S.L. 2009. How to map billions of short reads onto genomes. Nature Biotechnology. 27: 455-457.
Tsai, C.W., Chau, J., Fernandez, L., Bosco, D., Daane, K.M., Almeida, R.P.P. 2008. Transmission of grapevine leafroll-associated virus 3 by the vine mealybug (Planococcus ficus). Journal of Phytopathology. 98: 1093-1098.
Turturo, C., Salderelli, P., Yafeng, D., Digiaro, M., Minafra, A., Savino, V., and Martelli, G.P. 2005. Genetic variability and population structure of grapevine leafroll-associated virus 3 isolates. Journal of General Virology. 86: 217-224
Walker, M.A., and Golino, D.A. 1999. Rapid propagation of grape planting stock. Practical winery and vineyard journal. 20: 29-38.
Walton, V.M., and Pringle, K.L. 2004. Vine mealybug, Planococcus ficus (Signoret) (Hemiptera: Pseudococcidae), a Key Pest in South African vineyards. A Review. South African Journal of Enology and Viticulture. 25: 54-62.
Stellenbosch University https://scholar.sun.ac.za

! 33!
Ward, E., Foster, S. J., Fraaije, B. A., McCartney, H. A. 2004. Plant pathogen diagnostics: immunological and nucleic acid-based approaches. Annal of Applied Biology. 145: 1-16.
Ware, J.S., Roberts, A.M., Cook, S.A. 2012. Next generation sequencing for clinical diagnostics and personalised medicine: Implications for the new generation cardiologist. Heart. 98: 276-281.
Weber, E., Golino, D., Rowhani, A. 2002. Laboratory testing for grapevine diseases. Practical Winery and Vineyard XXII. 2: 13-26.
Williamson, S.J., Rusch, D.B., Yooseph, S., Halpern, A.L., Heidelberg, K.B., Glass, J.I., Andrews, P., Fannkoch, C., Fadrosh, D., Miller, C.S., Sutton, G., et al. 2008. The sorcerer II global ocean sampling expedition: Metagenomic characterization of viruses within aquatic microbial samples. PLoS ONE. 3: e1456.
Zee, F., Gonsalves, D., Goheen, A., Kim, K.S., Pool, R., Lee, R.F. 1987. Cytopathology of leafroll-diseased grapevines and the purification and serology of associated closteroviruslike particles. Phytopathology. 77: 1427-1434.
Zerbino, D.R., and Birney, E. 2008. Velvet: Algorithms for de novo short read assembly using de Bruijn graphs. Genome Research. 18: 821-829.
Zhang, J., Chiodini, R., Badr, A., Zhang, G. 2011. The impact of next-generation sequencing on genomics. Journal of Genetics and Genomics. 38: 95-109.
Zhang, T., Breitbart, M., Lee, W.H., Run, J.Q., Wei, C.L., Soh, S.W.L., Hibberd, M.L., Liu, E.T., Rohwer, F., Ruan, Y. 2005. RNA viral community in human feces: Prevalence of plant pathogenic viruses. PLoS Biology. 4: e0108-0118
Zhou, X., Ren, L., Meng, Q., Li, Y., Yu, Y., Yu, J. 2010. The next-generation sequencing technology and application. Protein & Cell. 1: 520-536.
Zietkiewicz, E., Rafalski, A., Labuda, D. 1994. Genome fingerprinting by simple sequence repeat (SSR)-anchored polymerase chain reaction amplification. Genomics. 20: 176-183.
Zimmermann, D., Bass, P., Legin, R., Walter, B. 1990. Characterization and serological detection of four closterovirus-like particles associated with leafroll disease of grapevines. Journal of Phytopathology. 130: 205-218.
2.8. Internet Sources
Freeborough, M.J., and Burger, J.T. 2008. Leafroll: Economic implications. Wynboer. [Online]. Available: http://www.wynboer.co.za/recentarticles/200812-leafroll.php3 [2014, July 25].
Fuchs, M.F. 2007. Grape leafroll disease. Cornell University and the New York state IPM Program. [Online] Available: http://www.nysipm. cornell.edu/factsheets/grapes/diseases/grape_leafroll.pdf [2014, July 25].
Pietersen, G. 2004. Spread of grapevine leafroll disease in South Africa – A difficult, but not insurmountable problem. Wynboer-A Technical Guide for Wine Producers. [Online]. Available: http://www.wynboer.co.za/recentarticles/0406leaf.php3 [2014, July 26].
Rayapati, N., O'Neal, S., Walsh, D. 2008. Grapevine leafroll disease. Washington State University Extension Bulletin. 2008: 20. [Online]. Available: http://cru.cahe.wsu.edu/CEPublications/eb2027e/eb2027e.pdf EB2027E [2014, July 5].
Yuzuki, D. 2012. Next Generation Sequencing – Template Preparation. [Online]. Available from: http://www.yuzuki.org/next-generation-sequencing-template-preparation/ [Accessed: 5 March 2013].
Stellenbosch University https://scholar.sun.ac.za

! 34!
Stellenbosch University https://scholar.sun.ac.za

! 35!
Chapter 3
Identification and distribution of multiple virus infections in
grapevine leafroll diseased vineyards
3.1. Introduction
Performed research, described within this chapter, was executed in collaboration with the
Agriculture Research Council (ARC) and excludes sample collections and total RNA extractions
performed in the year 2012 as well as any additional statistical analysis.
In excess of 70 pathogens infect grapevine of which 63 are of viral origin, this represents the
highest number of pathogens detected in a single crop (Martelli, 2014; Martelli et al., 2012).
Grapevine leafroll disease (GLD) is one of the major viral diseases affecting grapevine and is
present in most wine-growing regions of the world. Grapevine leafroll-associated virus 3 (GLRaV-
3) variants are the primary causative agents of GLD and are seen commonly within South African
diseased vineyards. GLRaV-3 variants are, however, not the sole infectious agents in a majority of
GLD instances; viruses belonging to the families Flexiviridae, Betaflexiviridae, Tymoviridae,
Endornaviridae, and other Closteroviridae are commonly found, together, in GLD vines (Table 4.3).
To date, six GLRaV-3 variant groups exist that comprise 13 complete or near complete genomes
(Chooi et al., 2013a; Chooi et al., 2013b; Bester et al., 2012a; Gouveia et al., 2011; Sharma et al.,
2011; Jooste et al., 2010; Maree et al., 2008), which share between 99.57% and 62.70% sequence
identity. The identity, relative variant group and accession numbers as well as the genome size of
each isolate can be found in Table 2.2. Six full genome sequences, representing four genetic variant
groups of GLRaV-3, have been published in South African studies. These variant groups include:
group I (represented by isolate 621), group II (represented by isolates GP18 and 623), group III
(represented by isolate PL-20) and group VI (represented by isolates GH11 and GH30) (Bester et
al., 2012a; Jooste et al., 2010; Maree et al., 2008). Recently, an additional two GLRaV-3 isolates
were detected, namely: GTG10 (Goszczynski, 2013) and GH24 (GenBank: KM058745). It was
determined, based on sequence comparisons of a 305 nt section of the HSP70h gene of
representatives of GLRaV-3 variant groups, that isolates GTG10 and GH24 are the same genetic
variant, however, are grouped outside of the variant group VI cluster.
Research performed on the genetic variability of GLRaV-3 from various countries around the world,
including: South Africa (Goszczynski, 2013; Bester et al., 2012a; Jooste et al., 2011; Jooste et al.,
2010), the USA (Seah et al., 2012; Sharma et al., 2011; Wang et al., 2011; Fuchs et al., 2009), New
Stellenbosch University https://scholar.sun.ac.za
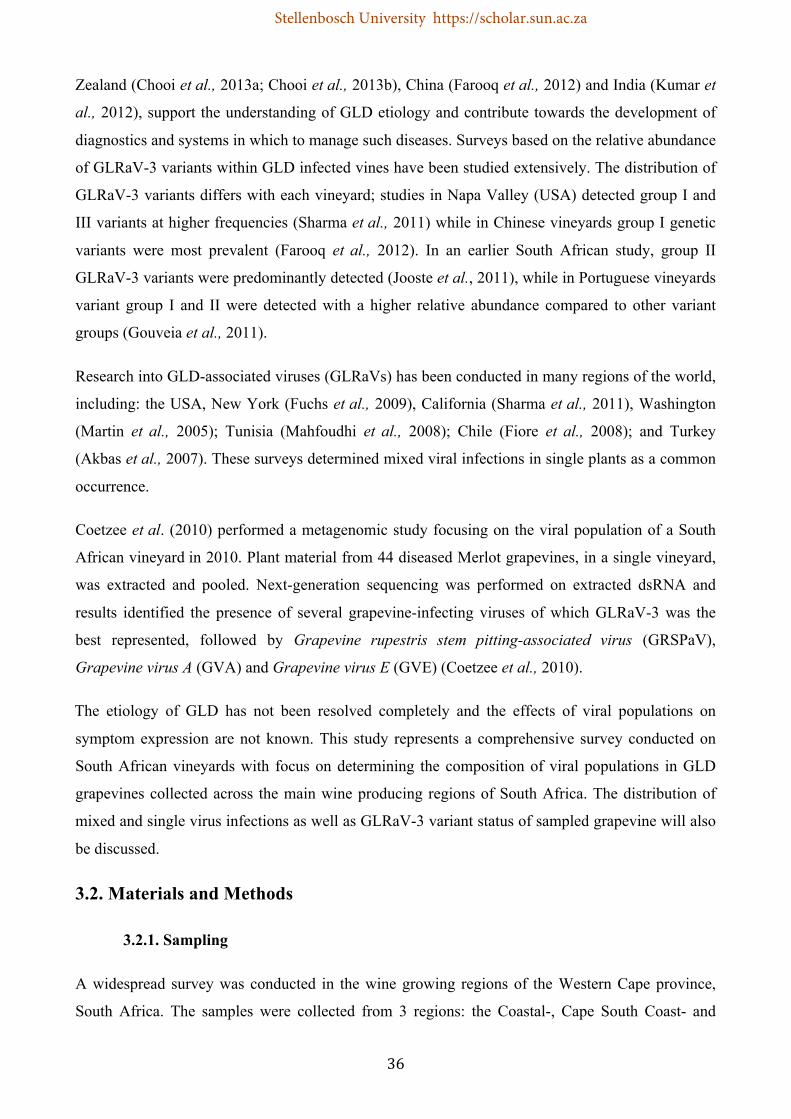
! 36!
Zealand (Chooi et al., 2013a; Chooi et al., 2013b), China (Farooq et al., 2012) and India (Kumar et
al., 2012), support the understanding of GLD etiology and contribute towards the development of
diagnostics and systems in which to manage such diseases. Surveys based on the relative abundance
of GLRaV-3 variants within GLD infected vines have been studied extensively. The distribution of
GLRaV-3 variants differs with each vineyard; studies in Napa Valley (USA) detected group I and
III variants at higher frequencies (Sharma et al., 2011) while in Chinese vineyards group I genetic
variants were most prevalent (Farooq et al., 2012). In an earlier South African study, group II
GLRaV-3 variants were predominantly detected (Jooste et al., 2011), while in Portuguese vineyards
variant group I and II were detected with a higher relative abundance compared to other variant
groups (Gouveia et al., 2011).
Research into GLD-associated viruses (GLRaVs) has been conducted in many regions of the world,
including: the USA, New York (Fuchs et al., 2009), California (Sharma et al., 2011), Washington
(Martin et al., 2005); Tunisia (Mahfoudhi et al., 2008); Chile (Fiore et al., 2008); and Turkey
(Akbas et al., 2007). These surveys determined mixed viral infections in single plants as a common
occurrence.
Coetzee et al. (2010) performed a metagenomic study focusing on the viral population of a South
African vineyard in 2010. Plant material from 44 diseased Merlot grapevines, in a single vineyard,
was extracted and pooled. Next-generation sequencing was performed on extracted dsRNA and
results identified the presence of several grapevine-infecting viruses of which GLRaV-3 was the
best represented, followed by Grapevine rupestris stem pitting-associated virus (GRSPaV),
Grapevine virus A (GVA) and Grapevine virus E (GVE) (Coetzee et al., 2010).
The etiology of GLD has not been resolved completely and the effects of viral populations on
symptom expression are not known. This study represents a comprehensive survey conducted on
South African vineyards with focus on determining the composition of viral populations in GLD
grapevines collected across the main wine producing regions of South Africa. The distribution of
mixed and single virus infections as well as GLRaV-3 variant status of sampled grapevine will also
be discussed.
3.2. Materials and Methods
3.2.1. Sampling
A widespread survey was conducted in the wine growing regions of the Western Cape province,
South Africa. The samples were collected from 3 regions: the Coastal-, Cape South Coast- and
Stellenbosch University https://scholar.sun.ac.za

! 37!
Breede River Valley regions. A total of 315 (171 red cultivar and 144 white cultivar) grapevines
were sampled from 29 farms. In 2012, 125 samples were collected while 190 grapevines were
sampled in the year 2013. Most of the collections were done in the Coastal region that included
farms in the Darling, Klein Karoo, Paarl, Stellenbosch, Swartland, Tulbagh and Wellington districts.
Sampling in the Breede river valley occurred in the Breedekloof and Worcester farms, while Cape
South coast sampling was done in the Walker Bay district. A selection of 15 different red-fruited
cultivars and 10 different white-fruited cultivars were sampled that included the economically
important cultivars Chardonnay, Sauvignon blanc, Cabernet Sauvignon, Merlot and Shiraz. The
vineyards selected for the study were all previously used for propagation material by the grapevine
industry, but lost their “mother block” status in the 2008/2009 growing season (for plants selected
in the 2012 survey) and in the 2010/2011 growing season (for plants selected in the 2013 survey)
due to GLD infection of more than 3%, based on symptom expression. These vineyards were
selected to collect data for newly infected plants, assuming that the infection was transmitted from
surrounding vineyards. Petioles and canes from four infected plants were randomly sampled per
vineyard. In red-fruited cultivars, leafroll symptoms were easily visible and sampling was
performed to include a variety of leafroll symptoms, ranging from plants displaying severely
downward rolling leaves with dark red coloration to the plants with milder leafroll symptoms. In
white-fruited cultivars the physical symptoms of GLD was not always distinctive, with the
exception of Chardonnay plants where clear downward rolling of the leaves was observed. In white-
fruited cultivar blocks, sampling was performed randomly and in some cases based on
abnormalities, i.e. yellowing of grapevine leaves.
3.2.2. GLRaV-3 variant status
Petioles and phloem scrapings of the collected grapevines were stored at -80°C. Total RNA was
extracted from 0.2 g of plant tissue using a modified CTAB (2% [w/v] CTAB, 2.5% [w/v] PVP-40,
100 mM Tris-HCL [pH8], 2 M NaCl, 25 mM EDTA [pH8] and 3% [v/v] β-mercaptoethanol)
method (White et al., 2008). Total RNA quality and integrity was evaluated spectrophotometrically
(Nanodrop 1000) and with gel electrophoresis (1% [w/v] Agarose-TAE).
To differentiate between GLRaV-3 variants in plants and to establish the distribution of single and
mixed infections, a one-step, reverse transcription, quantitative PCR high-resolution melting curve
(RT-qPCR-HRM) assay was used (Bester et al, 2012b). Between 100 ng and 200 ng of purified
total RNA was used as template in the RT-qPCR-HRM assay that was performed on a Qiagen
Rotor-Gene Q instrument. An RT-PCR assay was developed and used for the specific detection of
the GLRaV-3 variant similar to isolate GH24 (GenBank: KM058745).
Stellenbosch University https://scholar.sun.ac.za

! 38!
In order to perform the variant identification, the confidence interval method described in Bester et
al. (2012b) was applied, with the exception of the variant group I interval. By including more data
points from the 2013 survey, this confidence interval was refined. All variant group I infections
from 2013 were confirmed by screening the samples with the multiplex RT-PCR described in
Bester et al. (2012b). The melting temperature of the confirmed variant group I infections could as
a result be added to the existing melting curve data points. New variant group I confidence intervals
were calculated for both LR3.HRM4 and LR3.HRM6 primer pairs using the extended data point
database.
3.2.3. RT-PCR diagnostics
Primers were either designed through the selection of a conserved region of multiple aligned
sequences (CLC Main Workbench V.6.8.4) extracted from GenBank, or selected from publications
and databases (Table 3.1). Positive controls for Grapevine virus F (GVF), Grapevine leafroll-
associated virus 1 (GLRaV-1), -2 (GLRaV-2), -3 (GLRaV-3), Grapevine leafroll-associated virus 4
-like (GLRaV-4), and GRSPaV were obtained from the collection at ARC-Plant Protection
Research Institute, Pretoria, South Africa. GLRaV-3 isolate GH24, as well as positive controls for
GVA and GVE were obtained from the plant collection at the Department of Genetics, Stellenbosch
University, South Africa. No positive controls for Grapevine virus B (GVB) and Grapevine virus D
(GVD) could be sourced, results using the primer pairs developed for the detection of these viruses
will therefore not be discussed. A 200 mg portion of each sample was pulverised in a mortar and
pestle using liquid nitrogen, and total RNA extracted following an adapted CTAB method (White et
al., 2008).
Complementary DNA (cDNA) was synthesised by adding 200 ng of total RNA of each sample to
0.3 µl of random hexamers (Promega) and incubating for 5 minutes at 65°C before placing on ice
for 2 minutes to complete the primer annealing reaction. A solution containing 1X AMV RT Buffer
(Thermo Scientific), 5 U AMV reverse transcriptase (Thermo Scientific), 10 mM dNTPs (Thermo
Scientific) and dH2O was then added to the 5 µl primer annealing reaction and incubated for 60
minutes at 48°C to produce cDNA.
A PCR mixture containing 1X KAPA Taq buffer A (KAPA Biosystems), 10 mM dNTPs (Thermo
Scientific), 20 mM forward primer (Integrated DNA Technologies), 20 mM reverse primer
(Integrated DNA Technologies), 2 µl 5X Cresol loading dye (30% sucrose; 125 mg cresol red dye),
1 U KAPA Taq DNA polymerase (KAPA Biosystems), 2 µl cDNA and dH2O was used to detect
each of the viruses in the respective samples. The primer pairs had varying PCR cycle conditions
Stellenbosch University https://scholar.sun.ac.za

! 39!
Target Virus: Primer Pairs: Sequence (5'- 3'): Amplicon Size (bp): Reference/ Genbank Accession Numbers:GVA-P-F-7038 AGG TCC ACG TTT GCT AAGGVA-P-R-7273 CAT CGT CTG AGG TTT CTA CTAGVB_26/6.F ATG TCC CAG GTC TCA AGG AGGVB_26/6.R TTG TCC AGA CTT AAC TTG GGT GGVD_26/6.F TGC ATT CTC GCC TCT TTCGVD_26/6.R CCC GTT TCA CGA ACT CTA ACGVE_1_Diag_1_7055F ATG ATT TGA TGC TCA GTC ACA GGGVE_1_Diag_1_7251R GGG TTC TTA TGG CCT GCT TAGVF_PRIMER_F TTGGGAGTGGAGGATCTGTAGVF_PRIMER_R ATGGGCAGTCTGGGTCTATCLR1_HSP70-417F GAG CGA CTT GCG ACT TAT CGALR1_HSP70-737R GGT AAA CGG GTG TTC TTC AAT TCTLR2-P24-F-SacI ATGAGCTC ATGAGGGTTATAGTGTCTCLR2-P24-R-XbaI ATTCTAGA TTAACATTCGTCTTGGAGTTCGLR3.HRM4.F TAA TCG GAG GTT TAG GTT CCLR3.HRM4.R GTC GGT TCG TTA ACA ACA ALR3.HRM6.F GTC ACC AGG TGT TCC AAA CLR3.HRM6.R AAC GCC CTG TAT GTC TCC TCT CGLRaV-4.like.F ATG GCA TTG TCT GCG ACT AGGLRaV-4.like.R TAA ACA CAG ACA TGG GAG TAG CRSP13-F GATGAGGTCCAGTTGTTTCC RSP14-R ATCCAAAGGACCTTTTGACC CB19_72F GCG AAG ACG GAT ACT GTA TCG ATACB19_1267R CAC GAC CCC TAT ATC AGC CGGLRaV-3-GTG10-HSP70-F TAA AGT TCG ATA GCG GGG GCGLRaV-3-GTG10-HSP70-R CGG CTG AGA CCG TAG ATG AC
This study (KC731554.1; KC731553.1)
MacKenzie, 1997
This study (KJ524452.1; GU733707.1)
This study (JQ031716.1; JQ031715.1; Y07764.1)
This study (GU903012.1; JX402759.1; AB432910.1; NC_0011106.1)
This study (JX105428.1; NC_018458.1)
Osman et al., 2007
This study (JX559644.1; NC_007448.1; DQ286725.2; AY881628.1)
This study (NC_016416.1; NC_016081.1; AY297819.1)
Meng et al., 1999.
Unpublished
146
238
815
251
213
217
320
354
338
226
305
1195
Bester et al., 2012b
Bester et al., 2012b
GTG10
GVA
GVB
GVD
GVE
GVF
GLRaV-1
GLRaV-2
GLRaV-4-like
GRSPaV
GH24-like
GLRaV-3*
GLRaV-3*
617
(Table 3.2); all included an initial denaturation step at 94°C for 3 minutes and a final extension step
at 72°C for 7 minutes.
Table 3.1: List of primers used in RT-PCR and RT-qPCR-HRM assays. GenBank accessions used for primer design in this study are listed.
* Primers used in the one step RT-qPCR-HRM assays.
Table 3.2: PCR cycle condition for the detection of other Clostero-, Viti- and Fovea viruses.
Temp. (°C): Duration (sec.): Temp. (°C): Duration (sec.): Temp. (°C): Duration (sec.): Temp. (°C): Duration (sec.): Temp. (°C): Duration (sec.):GVA 56GVB 56GVD 58GVE 60GVF 56GLRaV-1 58/56 10 + 25GLRaV-2 58/56 10 + 25GLRaV-3 58 35GLRaV-4 62/60 10 + 25GTG10 60GRSPaV 58GH24 55 60
50
35
35
72 42094 180 94 30 30 72
Primer Pair: Initial Denaturation: Denaturation: Annealing: Extension: Final Extension:Cycles:
Stellenbosch University https://scholar.sun.ac.za

! 40!
3.3. Results and Discussion
3.3.1. GLRaV-3 variants status
Initial screening of the samples detected the presence of four GLRaV-3 variant groups: I, II, III and
VI. Results from the additional RT-PCR assay also confirmed the presence of the new variant,
GH24, similar to isolate GTG10 (Goszczynski, 2013). Positive isolates hereafter were referred to as
GH24-like.
3.3.2. Adjusted HRM confidence intervals
Twenty-one plants were identified with the RT-qPCR-HRM assay to be potentially infected with
only GLRaV-3 variant group I. The multiplex RT-PCR confirmed 15 of these variant group I
infections. More than one melting point temperature per sample was generated due to duplex
reactions. As a result an additional 29 (LR3.HRM4) and 36 (LR3.HRM6) melting curve data points
were generated. After the re-calculation of the 95% melting point confidence interval, using the 2.5
and 97.5 percentiles, the confidence interval for variant group I was adjusted. The confidence
interval for LR3.HRM4 was re-calculated as 83.22°C to 84.05°C and for LR3.HRM6 as 84.82°C to
85.90°C (Table 3.3).
Table 3.3: Descriptive statistics and re-calculation of variant group I HRM confidence intervals
3.3.3. Distribution of GLRaV-3 variants in vineyards
Single and mixed variant infections were detected in the 315 plants screened. The significance of
the chi-square test will be indicated in the results description.
Bester et al., 2012 Adjusted
Bester et al., 2012 Adjusted
Bester et al., 2012 Adjusted
Bester et al., 2012 Adjusted
Bester et al., 2012 Adjusted
LR3.HRM4 31 60 83.20 83.20 82.98 84.10 83.60 83.68 0.78 0.90LR3.HRM6 27 63 84.78 84.78 85.42 86.08 85.03 85.33 0.64 1.30
Bester et al., 2012 Adjusted
Bester et al., 2012 Adjusted
Bester et al., 2012 Adjusted
LR3.HRM4 83.22 83.22 84.08 84.05 0.43 0.37LR3.HRM6 84.79 84.82 85.39 85.90 0.09 0.52
Interquartile Range (IQR) (75 % - 25 %)
97.5 th Percentile2.5 th Percentile
Primer Pair:Number of Data Points Min Max Mean
Temperature Range between Upper and
Lower Limit:
Stellenbosch University https://scholar.sun.ac.za

! 41!
Single variant infections
In total, 119 of the 315 tested plants had single variant infections. Variant groups II and VI were
found to be the most prevalent, occurring at frequencies of 47.06% and 37.82% in 119 singly
infected plants, respectively. Single infections of group I and GH24-like were recorded in 6.72%
and 7.56% of single virus infected plants, respectively. The distribution of single variant infections
was detected in each of the districts (Figure 3.1.A). Variant group II single infections occurred
predominantly in the Coastal regions, including Stellenbosch, Swartland, Tulbagh, Wellington,
Paarl, and Darling. In the Breede River Valley region, variant group VI was marginally more
frequent in the Breedekloof district, while in the Worcester district only one plant with a variant
group VI infection was detected. In the Cape South Coast region, the Walker Bay district, variant
group VI was the only single variant infection detected in five plants (Figure 3.1.A).
Figure 3.1: Bar graphs representing the distribution and occurrence of single and mixed virus infections. A) Distribution of single variant infections per district. B) Percentage occurrence of 14 mixed variant combinations in vineyards with variant groups II/VI as the most prevalent.
Stellenbosch University https://scholar.sun.ac.za

! 42!
0
10
20
30
40
50
60
70
80
90
100
Breede River Valley Cape South Coast Coastal Region
Fre
qu
ency
of
infe
ctio
n
I II VI GH24-like III
0
10
20
30
40
50
60
70
80
90
100
Red cultivars White cultivars
Fre
qu
ency
of
infe
ctio
n
I II VI GH24-like III A B
Mixed variant infections
As expected, a high number of plants tested positive for mixed variant infections. Fourteen variant
combinations were detected in 130 plants. In total, 56.25% of plants collected in the Breede River
Valley region were infected with multiple variants. In the Cape South Coast region 36.36% of
plants had multiple variant infections and in the Coastal region 34.51% of plants were mixed
infected. The proportion of mixed variant infections was more than 20% higher in the Breede River
Valley region. The variant group II/VI combination was the most frequent combination, detected in
43% of the infected plants. Mixed infections of variant group I/II/VI, I/VI and the II/GH24-like
combinations were identified in 9% of the plants. The third most frequent variant combination was
the II/VI/GH24-like combination, occurring in 6.92% of the plants (Figure 3.1.B).
The total distribution of GLRaV-3 variants in red- and white-fruited cultivars were analysed in the
three regions (Figure 3.2.A). Group VI variants occurred predominantly in the Walker Bay district
in the Cape South Coast region (Figure 3.2.A) as well as in the Breede River Valley region. Variant
group II dominated in the Coastal region. No difference between the infections of GLRaV-3
variants in red- and white-fruited cultivars was detected (Figure 3.2.B). The newly identified GH24-
like variant was detected in all the regions and had a high infection percentage in white cultivars in
the South Coast region. In the Coastal region all five variants were detected, including variant group
III from Paarl district. Although the chi-square test was not significant, variant group III was only
detected in the Coastal region. The overall distributions of variants are seen in Figure 3.3.
Figure 3.2: Bar graphs of the infection frequency between regions of the Western Cape and between red and white cultivars. A) The total GLRaV-3 variant distribution per region. B) The total GLRaV-3 distribution in white and red cultivars.
Stellenbosch University https://scholar.sun.ac.za

! 43!
Group I 12.50%
Group III 1.96%
Group II 38.48%
GH24-like 10.29%
Group VI 37.76%
Figure 3.3: Pie chart representing the distribution of individual GLRaV-3 variant percentage infection detected in vineyards.
Detection methods were developed to test for five GLRaV-3 variant groups. Four variant groups: I,
II, III, and VI, were detected in the one step RT-qPCR-HRM assay. Another variant, GH24 (GH24-
like), was detected with a specific RT-PCR. Single and mixed variant infections were detected in
plants showing GLD symptoms. Plants with single infections were detected for all variant groups
with group II and VI being the most prevalent. A clear regional distribution of plants with single
infected variants was seen with variant group II dominating in the Darling, Paarl, Stellenbosch,
Swartland, Tulbagh and Wellington districts. Variant group VI was detected prevalently in the
Breede River Valley region, including the Breedekloof and Worcester districts, as well as in the
Cape South Coast region (Figure 3.2.A). The overall distribution of the different GLRaV-3 variants
showed similar distribution in red- and white-fruited cultivars as shown in Figure 3.2.B. The study
highlighted the importance of testing for viruses in white-fruited cultivars. White-fruited cultivars
harbour a wide range of viruses although symptoms are not expressed on plants.
The detection of plants with mixed variant infections was expected. A total of 14 mixed variant
combinations were detected in 130 of the tested plants. The variant group II/VI combination was
detected as the primary mixed infection in all regions and was well distributed between cultivars.
In a previous study, the predominant occurrence of variant group II was shown in 10 mother blocks
in South African vineyards (Jooste et al., 2011). Results of this earlier study also showed the spread
of variant group II to be faster in a specific disease cluster compared to variant group III (Jooste et
al., 2011). This fact may explain the faster spread of variant group II per row in a vineyard. At the
time of the earlier study, variant group VI had not yet been identified and the spread of this variant
was not investigated. The widespread detection of variant group II and VI in this survey suggest
that these two variants are transmitted more effectively to adjacent plants in a disease cluster. A
Stellenbosch University https://scholar.sun.ac.za

! 44!
study is underway to test the transmission efficiency of GLRaV-3 variants. Reports from other
countries did not show the dominant presence of variant group II and VI in plants. In China, group I
was the most prevalent variant group identified (Farooq et al., 2012), while in the Napa Valley both
variant group I and III were the most common variants detected (Sharma et al., 2011). In a limited
survey in New Zealand, variant group I and VI were the most frequently detected variant groups
(Chooi et al., 2013b). It is interesting to note that variant group III was found in high numbers in the
Napa Valley, but in South African vineyards this variant was detected in only eight plants,
representing less than 2% of the tested plants. The overall distribution of isolates similar to the
recently described isolate GH24 (GH24-like) was just over 10%. GH24-like was detected
significantly in red- and white-fruited cultivar vines in the Breede River Valley, Cape South Coast
and Coastal regions.
More GLRaV-3 variants have been identified and recently described. Comparison of different
variant groups showed two main phylogenetic clades of the virus (Maree et al., 2013): the clade that
include isolates from groups I-V and the clade containing the group VI and group VI-like (NZ2)
isolates. A revision of the second phylogenetic clade, group VI and group VI-like, should be done
to include the other divergent variants detected, i.e. GH24 and GTG10. In future, full-length coat
protein sequences, and preferably full genome sequences, of all newly identified GLRaV-3 variants
should be compared to clarify the phylogenetic position of these variants.
3.3.4. Virus populations in GLD-affected plants
Virus-specific primers with appropriate positive controls were used in RT-PCR reactions to detect
GVA, GVE, GVF, GLRaV-1, GLRaV-2, GLRaV-3, GLRaV-4–like viruses and GRSPaV. There
were 50 plants with single virus infections of GLRaV-2, GLRaV-3, GLRaV-4, GVE, GVF, and
GRSPaV. GLRaV-3 was a single infection in 29 of these plants and GRSPaV was found as a single
infection in 13 plants.
Most of the plants tested were infected with multiple viruses. Mixed virus infections were found in
251 plants, representing 36 combinations of seven grapevine viruses, indicating that proportions are
significantly different. A summary of the mixed virus combinations can be seen in Table 3.4. The
most prevalent mixed virus infection, GLRaV-3/GVE, was detected in almost 28% of mixed
infected plants. The next most prevalent mixed virus combinations were GLRaV-3/GVE/GRSPaV,
GLRaV-3/GRSPaV and GLRaV-3/GVA that occurred between 8% and 10% in plants.
The distribution of these viruses per region is shown in Figure 3.4. GLRaV-3 was detected
predominantly in all three regions. Other closteroviruses, GLRaV-1, GLRaV-2 and GLRaV-4-like
Stellenbosch University https://scholar.sun.ac.za

! 45!
GLRaV-1 0.72%
GLRaV-2 3.75%
GLRaV-3 36.22%
GLRaV-4 like 0.29%
GVA 8.80%
GVE 26.12%
GVF 7.36%
GRSPaV 16.74%
!
viruses, were detected in low frequencies in all regions, except GLRaV-2 detected in 19 plants in
the Coastal region. The Foveavirus, GRSPaV, was detected between 16% and 22% in all regions in
both red- and white-fruited cultivar plants. The vitiviruses screened for, GVA, GVE, and GVF,
were present in all regions. GVE was found to be the most common Vitivirus in all regions. The
recently discovered GVF virus (Al Rwahnih et al., 2012) was detected in all three regions. The
virus distribution was independent of region, meaning the virus distribution of the different viruses
in the three regions followed the same pattern.
Figure 3.4: Distribution of viruses in three regions of the Western Cape including the Breede river valley region, Cape south coast region and the Coastal region (c2
(df=14)=22.56 P=0.0678).
Figure 3.5: Pie chart illustration of the grapevine virus percentage distribution of detected viruses in vineyards and signifying the differences in proportion between viruses.
Cape!South!Coast!region!!Breede!River!Valley!region! Coastal!region!
Stellenbosch University https://scholar.sun.ac.za

! 46!
Table 3.4: Mixed virus infections detected in 270 plants of the survey. The four main virus combinations are highlighted.
The total distribution of detected viruses is summarised in Figure 3.5. GLRaV-3 was predominantly
found in the plants tested in the study, followed by GVE and GRSPaV. The same RNA samples
were analysed for the presence of other Clostero-, Viti- and Foveaviruses. Results were obtained for
the presence of GVA, GVE, GVF, GLRaV-1, GLRaV-2, GLRaV-3, GLRaV-4-like and GRSPaV.
GLRaV-3, GVE, GVA and GRSPaV were detected in a previous deep sequencing analysis of a
Mixed virus combination Number of infected plants % infectionGLRaV-1/GLRaV-3/GRSPaV 2 0.8GLRaV-2/GLRaV-3 3 1.2GLRaV-2/GLRaV-3/GRSPaV 1 0.4GLRaV-3/GRSPaV 20 7.97GVA/GLRaV-3 21 8.37GVA/GLRaV-3/GLRaV-4 1 0.4GVA/GLRaV-3/GRSPaV 5 1.99GVA/GVE/GLRaV-3 14 5.58GVA/GVE/GLRaV-3/GRSPaV 8 3.19GVA/GVE/GVF 2 0.8GVA/GVE/GVF/GVRaV-2/GLRaV-3 1 0.4GVA/GVE/GVF/GVRaV-2/GLRaV-3/GRSPaV 1 0.4GVA/GVE/GVF/GLRaV-3 4 1.59GVA/GVE/GRSPaV 1 0.4GVA/GVF/GLRaV-3 2 0.8GVA/GVF/GLRaV-3/GRSPaV 1 0.4GVE/GLRaV-1 2 0.8GVE/GLRaV-2 2 0.8GVE/GLRaV-2/GLRaV-3 5 1.99GVE/GLRaV-2/GLRaV-3/GRSPaV 5 1.99GVE/GLRaV-2/GRSPaV 2 0.8GVE/GLRaV-3 70 27.89GVE/GLRaV-3/GRSPaV 26 10.36GVE/GVF 1 0.4GVE/GVF/GLRaV-1/GLRaV-3 1 0.4GVE/GVF/GLRaV-2/GLRaV-3 2 0.8GVE/GVF/GLRaV-2/GRSPaV 1 0.4GVE/GVF/GLRaV-3 8 3.19GVE/GVF/GLRaV-3/GRSPaV 6 2.39GVE/GVF/GRSPaV 1 0.4GVE/GRSPaV 13 5.18GVF/GLRaV-2/GLRaV-3 1 0.4GVF/GLRAV-2/GLRaV-3/GRSPaV 1 0.4GVF/GLRaV-3 8 3.19GVF/GLRaV-3/GRSPaV 5 1.99GVF/GRSPaV 4 1.59
Stellenbosch University https://scholar.sun.ac.za

! 47!
South African vineyard (Coetzee et al., 2010). A widespread survey was conducted in this study
and GLRaV-3 was found to be the primary virus detected in the plants, occurring in 87% of
sampled grapevines. A less than 4% infection rate was observed for other closteroviruses, namely:
GLRaV-1, GLRaV-2 and GLRaV-4-like viruses. The Vitivirus, GVE, was detected in significant
percentages (58%) in these plants and GVA and GVF at 19% and 17% respectively. The
Foveavirus, GRSPaV, was the third most prevalent virus detected in this study, detected in 37% of
plants. The detection of the different viruses was based on primers designed in previous studies (for
the detection of GVA, GLRaV-1, GLRaV-3, and GRSPaV) and primers designed based on
sequence data deposited in GenBank (for the detection of GVE, GVF, GLRaV-3 GH24-like,
GLRaV-2 and GLRaV-4-like viruses). Detection is limited to the accuracy and sensitivity of the
primers used and we present the results based on this fact.
Most plants (80%) tested positive for mixed virus infections and only 9.2% of plants were singly
infected with GLRaV-3. The infection with multiple viruses has a direct effect on the symptom
expression of infected plants. Plants showing a typical GLD symptom might be infected with
GLRaV-3 and one to four other viruses leading to the mild or severe leafroll symptoms observed.
Mixed virus populations occur more frequently in South African vineyards compared to results
from the Napa Valley. There, 81% of tested plants had single infections of GLRaV-3 (Sharma et al.,
2011), a much higher relative abundance of single infected plants when compared to South African
vineyards. This is also the case with the GLRaV-3 variants, where 41% of plants were infected with
multiple GLRaV-3 variant groups in South African vineyards opposed to 22% multiple infected
plants in the Napa Valley study (Sharma et al., 2011). In a survey for GLRaV-1, GLRaV-2 and
GLRaV-3 conducted in the Finger Lakes vineyards in New York, single infections occurred in 10%,
3% and 15% of plants, respectively; mixed infections of these viruses affected only 3.6% of plants
(Fuchs et al., 2009). Although the presence of only three viruses was studied in the Finger Lakes
district, the low percentage of mixed infected plants were in contrast to what we observe in South
African vineyards. A study from Turkey showed a higher prevalence of GLRaV-1 in their vineyards
compared to GLRaV-3 (Akbas et al., 2007). The Turkish study noted that mixed infections are
common in vines affected by leafroll-associated viruses and detected mixed infections between
different GLRaVs. A GLRaV based survey in Tunisia showed that 45.8% of plants tested had
mixed multiple infections (Mahfoudhi et al., 2008). GLRaV-3 was the most widespread virus,
contributing to 76.3% of the total viruses detected in Tunisian vineyards. The GLRaV-4-like viruses
(GLRaV-5, -6) had the second highest count followed by GLRaV-1, GLRaV-2, and GLRaV-7,
occurring with less than 10% infection (Mahfoudhi et al., 2008). In Chile, a low percentage
infection was reported for GLRaVs and a high relative abundance of GLRaV-2 reported in their
Stellenbosch University https://scholar.sun.ac.za

! 48!
vineyards (Fiore et al., 2008). It is clear that in certain parts of the world certain viruses occur
predominantly. The influence of mealybug vectors in the transmission efficiency of GLRaV-3
variants and other virus populations needs to be studied. This confirms the importance of detecting
all possible variants of viruses in vineyards, especially when screening planting material distributed
by industry to producers.
The viral population per cultivar was identified (Figure 3.6). White-fruited cultivar grapevines,
namely Chardonnay and Chenin blanc, were found to contain an average of 2.67 different viruses
per infected sample; where-as red-fruited cultivars, namely Cabernet Sauvignon, Merlot and Shiraz,
were found to contain an average of 2.55 different viruses per sample. In total an average of 2.61
different viruses was found to infect individual diseased grapevines. The viral population within
grapevines was determined per age of grapevine (Figure 3.7) and the average population calculated
at 2.55 different viruses. 10-year old grapevines were found to contain, on average, less viruses (2
different viruses per sample), while higher average populations of viruses (3.2 different viruses per
sample) were detected in 16-year old grapevines.
Based on the data generated for virus populations in various cultivars and grapevine ages, it was
determined that no significant differences exist between viral populations in grapevines of varying
age and cultivar. A uniform distribution of viruses was seen between dissimilar grapevines,
suggesting that not one type of cultivar or age of grapevine is preferred in terms of virus infection
and replication. Instead, the frequency of a virus in grapevines relies purely on the transmission of
that virus and the relationship shared among viral populations.
Figure 3.6: Average virus population per cultivar where cultivars are representative of the five most economically important in South Africa. Virus populations range between 2.31 and 3.03 different viruses per sample.
0"
0,5"
1"
1,5"
2"
2,5"
3"
3,5"
Cabernet Sauvignon
Chardonnay Chenin blanc Merlot Shiraz
Aver
age V
irus P
opula
tion
Cultivar
Average Virus Population per Cultivar
Stellenbosch University https://scholar.sun.ac.za

! 49!
Figure 3.7: Average virus population per age of grapevine sampled. Ages of grapevines range from 6 to 18 years and average virus population ranges from 2 to 3.2 different viruses.
3.4. Conclusion
In this chapter, the distribution of GLRaV-3 variants and other grapevine infecting viruses were
presented. We confirmed that GLRaV-3 is the predominant virus in South African vineyards
associated with plants showing GLD symptoms. We targeted GLD-affected plants based on
symptom expression; however, not all grapevines displayed clear symptomatology, especially in the
case of certain white cultivars. With the high relative abundance of GLRaV-3 in these plants we
strongly suggest, and confirm previous reports, that GLRaV-3 is the main causative agent of GLD
in South African vineyards. Overall, in comparison to other Clostero-, Viti-, and Foveaviruses,
GLRaV-3 was the most abundant of the detected viruses and was detected in 87% of sampled vines.
This confirms the importance of GLRaV-3 in South African vineyards and the significance of
detecting all variants of the virus. This study demonstrated the complexity of virus infections in
South African vineyards and contributed to the knowledge for the detection of viruses and variants
of viruses.
3.5. References
Akbas, B., Kunter, B., Ilhan, D. 2007. Occurrence and distribution of grapevine leafroll-associated viruses 1, 2, 3 and 7 in Turkey. Journal of Phytopathology. 155: 122-124.
Al Rwahnih, M., Sudarshana, M.R., Uyemoto, J.K., Rowhani, A. 2012. Complete genome sequence of a novel Vitivirus isolated from grapevine. Journal of Virology. 86: 9545.
Bester, R., Maree, H.J., Burger, J.T. 2012a. Complete nucleotide sequence of a new strain of grapevine leafroll-associated virus3 in South Africa. Archives of Virology. 157: 1815-1819.
0,0#
0,5#
1,0#
1,5#
2,0#
2,5#
3,0#
3,5#
6# 7# 8# 9# 10# 11# 12# 13# 14# 15# 16# 17# 18#
Aver
age V
irus P
opul
atio
n
Age of Grapevine (years)
Average Virus Population with Age
Stellenbosch University https://scholar.sun.ac.za

! 50!
Bester, R., Jooste, A.E.C., Maree, H.J., Burger, J.T. 2012b. Real- time RT-PCR high-resolution melting curve analysis and multiplex RT-PCR to detect and differentiate grapevine leafroll-associated virus3 variant groups I, II, III and VI. Virology Journal. 9: 219.
Chooi, K.M., Cohen, D., Pearson, M.N. 2013a. Molecular characterisation of two divergent variants of Grapevine leafroll-associated virus 3 in New Zealand. Archives of Virology. 158: 1597-1602.
Chooi, K.M., Cohen, D., Pearson, M.N. 2013b. Generic and sequence-variant specific molecular assays for the detection of the highly variable Grapevine leafroll-associated virus3. Journal of Virological Methods. 189: 20-29.
Coetzee, B., Freeborough, M.J., Maree, H.J., Celton, J., Rees, D.J., Burger, J.T. 2010. Deep sequencing analysis of viruses infecting grapevines: virome of a vineyard. Journal of Virology. 400: 157-163.
Farooq, A.B.U., Ma, Y., Wand, Z., Zhou, N., Wenxing, X. 2012. Genetic diversity analyses reveal novel recombination events in Grapevine leafroll-associated virus- 3 in China. Virus Research. 171: 15-21.
Fiore, N., Prodan, S., Montealegre, J., Aballay, E., Pino, A.M., Zamorano, A. 2008. Survey of grapevine viruses in Chile. Journal of Plant Pathology. 90: 125-130.
Fuchs, M., Martinson, T.E., Loeb, G. M., Hoch, H.C. 2009.Survey for the three major leafroll disease- associated viruses in Finger Lakes vineyards in New York. Plant Disease. 93: 395:401.
Goszczynski, D.E. 2013. Brief Report of a New Highly Divergent Variant of Grapevine leafroll-associated virus 3 (GLRaV-3). Journal of Phytopathology. 161: 874-879.
Gouveia, P., Santos, M.T., Eiras- Dias, J.E., Nolasco, G. 2011. Five phylogenetic groups identified in the coat protein gene of grapevine leafroll-associated virus 3obtained from Portuguese grapevine varieties. Archives of Virology. 156: 413-420.
Jooste, A.E.C., Maree, H.J., Bellstedt, D.U., Goszczynski, D.E., Pietersen, G., Burger, J.T. 2010. Three Grapevine leafroll-associated virus3 (GLRaV-3) variants identified from South African vineyards show high variability in their 5’ UTR. Archives of Virology. 155: 1997–2006.
Jooste, A.E.C., Pietersen, G., Burger, J. T. 2011. Distribution of grapevine leafroll associated virus-3 variants in South African vineyards. European Journal of Plant Pathology. 131: 371–381.
Kumar, S., Baranwal, V.K., Singh, P., Jain, R.K., Sawant, S., Singh, S.K. 2012. Characterization of a Grapevine leafroll-associated virus 3 from India showing incongruence in its phylogeny. Virus Genes. 45: 195-200.
MacKenzie, A. 1997. A standard protocol for the detection of viruses and viroids using a reverse transcription-polymerase chain reaction technique. Document CPHBT-RTPCR1.00 The Food Inspection Agency Canada.
Mahfoudhi, N., Digiaro, M., Dhoubi, M.H. 2008. Incidence and distribution of grapevine leafroll-associated viruses in Tunisian vineyards. Journal of Phytopathology. 156: 556-558.
Maree, H.J. Almeida, R.P.P. Bester, R, Chooi, K.M., Cohen, D., Dolja, V.V., Fuchs, M.F., Golino, D.A., Jooste, A.E.C., Martelli, G.P., Naidu, R.A., Rowhani, A., Saldarelli P., Burger, J.T. 2013. Grapevine leafroll associated virus 3. Frontiers in Microbiology. 4:82. doi: 10.3389/fmicb.2013.00082.
Maree, H.J., Freeborough, M.J., Burger, J.T. 2008.Complete nucleotide sequence of a South African isolate of grapevine leafroll- associated virus 3 reveals a 5’ UTR of 737 nucleotides. Archives of Virology. 153: 755-757.
Martelli, G.P. 2014. Directory of virus and virus-like diseases of the grapevine and their agents. Journal of Plant Pathology. 96 (1, Supplement): 1-136.
Martelli, G.P., Agranovsky, A.A., Al Rwahnih, M., Dolja, V.V., Dovas, C.I., Fuchs, M., et al. 2012. Taxonomic revision of the family Closteroviridae with special reference to the grapevine leafroll-associated
Stellenbosch University https://scholar.sun.ac.za

! 51!
members of the genus Ampelovirus and the putative species unassigned to the family. Journal of Plant Pathology. 94: 7-19.
Martin, R.R., Eastwell, K.C., Wagner, A., Lamprecht, S., Tzanetakis, I.E. 2005. Survey for viruses of grapevine in Oregon and Washington. Plant Disease. 89: 763-766.
Meng, B., Zhu, H.Y., Gonsalves, D. 1999. Rupestris stem pitting associated virus-1 consists of a family of sequence variants. Archives of Virology. 144: 2071-2085.
Osman, F., Leutenegger, C., Golino, D., Rowhani, A. 2007. Real-time RT-PCR (TaqMan) assays for the detection of Grapevine Leafroll associated viruses 1-5 and 9. Journal of Virological Methods. 141: 22-29.
SAS Institute Inc. 2012. What’s New in SAS® 9.3. Cary, NC: SAS Institute Inc.
Seah, Y.M., Sharma, A.M., Zhang, S., Almeida, R.P.P., Duffy, S. 2012. A divergent variant of Grapevine leafroll-associated virus 3 is present in California. Virology Journal. 9: 235. doi: 10.1186/1743-422X-9-235.
Sharma, A.M., Wang, J., Duffy, S., Zhang, S., Wong, M.K., Rashed, A., et al. 2011. Occurrence of grapevine leafroll-associated virus complex in Napa Valley. PloS ONE. 6: e26227.
Wang, J., Sharma, A.M., Duffy, S., & Almeida, R.P.P. 2011. Genetic diversity in the 30 terminal 4.6-kb region of Grapevine leafroll associated virus3. Phytopathology. 101: 445-450.
White, E.J., Venter, M., Hiten, H.F., Burger, J.T. 2008. Modified Cetyltrimethylammonium bromide method improves robustness and versatility: The benchmark for plant RNA extraction. Biotechnology Journal. 3: 1424-1428.
!
Stellenbosch University https://scholar.sun.ac.za

! 52!
Chapter 4
Determination of the virus diversity associated with grapevine leafroll
disease using next-generation sequencing
4.1. Introduction
The viruses and fungi that infect grapevine are the most devastating of the infectious agents that
infect grapevine (Martelli, 2014) and contribute to an extensive decrease in fruit yield and vigor
(Martelli and Boudon-Padieu, 2006; Ferreira et al., 2004). No means of natural resistance against
these pathogens exists in grapevine, adding additional pressure to an already stressed industry
(Oliver and Fuchs, 2011; Fisher et al., 2004; Yamamoto et al., 2000). The etiology of grapevine
diseases is not well documented, making studies, like this, important in identifying the relationships
shared within viral populations in an attempt to better understand grapevine diseases.
To understand the etiology of a disease, the complete population of pathogens in a host needs to be
characterized and methods capable of detecting these populations need to be performed in an
unbiased manner. Technologies, like microarray analyses, are capable of detecting numerous
viruses simultaneously; however require known sequence information of the viruses tested for
(Boonham et al., 2007). Next-generation sequencing (NGS), executed in a metagenomic approach,
allows for the simultaneous detection of viral populations without requiring prior knowledge of the
viral sequences present in a sample (Adams et al., 2009). Through the ligation of universal adaptors
to nucleic acid sequences retrieved from environmental samples, libraries can be constructed to
create a dataset of sequences derived from known viruses, novel virus variants as well as entirely
new viruses (Adams et al., 2009). Recently, NGS was used for the detection of viral populations in
grapevines (Espach, 2013; Al Rwahnih et al., 2011; Coetzee et al., 2010; Adams et al., 2009).
Espach et al. (2012) and Al Rwahnih et al. (2011) detected a population of mycoviruses in
grapevine samples by using NGS, in a metagenomic approach (Espach, 2013; Al Rwahnih et al.,
2011). Both studies made use of dsRNA as template for library preparation preceding NGS, and
detected novel viruses belonging to the families Chrysoviridae, Endornaviridae, Hypoviridae,
Narnaviridae, Partitiviridae and Totiviridae. Coetzee et al. (2010) identified a novel chrysovirus
with the second most reads in 44 pooled grapevines in their metagenomic NGS study.
Mixed viral infections within single grapevines are a common occurrence; Thompson et al. (2014)
made use of a macroarray multiplex platform to detect multiple viruses in single grapevine samples.
They found 53% of tested grapevines to have mixed infections with viruses from the families
Betaflexiviridae, Closteroviridae, Secoviridae and Tymoviridae (Thompson et al., 2014). Research
Stellenbosch University https://scholar.sun.ac.za

! 53!
performed in the USA (Sharma et al., 2011; Fuchs et al., 2009; Martin et al., 2005), Chile (Fiore et
al., 2008) and Turkey (Akbas et al., 2007) found mixed viral infections, in single GLD
symptomatic plants, to be a common occurrence.
Grapevine Leafroll disease is the most economically devastating of the grapevine virus diseases and
has been reported to contribute up to 60% loss in yield of fruit (Rayapati et al., 2008). The
grapevine leafroll-associated viruses (GLRaVs) are the collective infectious agents commonly
found in GLD symptomatic grapevines, where Grapevine leafroll-associated virus 3 (GLRaV-3)
(genus Ampelovirus, family Closteroviridae) is the primary causative agent. Six variant groups of
GLRaV-3 have been identified and their presence in diseased grapevines, as either single or mixed
infections, varies between plants (Chooi et al., 2013b; Farooq et al., 2012; Jooste et al., 2011;
Sharma et al., 2011). Other viruses commonly infecting grapevine are of the families
Closteroviridae, Betaflexiviridae and Secoviridae (Le Maguet et al., 2012; Golino et al., 1992). The
interaction of GLRaVs, within diseased grapevines, in affecting plant physiology and
symptomatology is not well documented and further research with this focus needs to tale place.
Samples were selected based on typical GLD symptoms and were subjected to NGS with either the
Illumina MiSeq platform (for samples processed in 2013) or the Illumina HiSeq 2500 platform (for
samples processed in 2014). Results were analyzed with the focus of determining the complexity of
viruses within GLD vines.
4.2. Materials and Methods
4.2.1. Plant material
Canes were collected from 17 diseased grapevines from eight different farms in the Western Cape
province, South Africa. A selection of four rootstocks, six white- and seven red-fruited cultivars
were selected that represented 10 different cultivars of grapevine. The cultivar and location for each
sample can be located in Table 4.1. Grapevines were selected based on typical GLD physical
symptoms for red-fruited cultivars and white-fruited cultivars where applicable, or selected based
on previous knowledge of GLD infection (white-fruited cultivars and rootstock plants). Samples
were collected during late summer (February and March) for the years 2013 and 2014, when the
visual symptoms of GLD were most prominent. Samples collected in 2013 included samples 7-11.
Samples collected in 2014 included samples 1-6, and 12-17. Phloem was scraped off the cane
material for each sample and used for dsRNA extractions.
Stellenbosch University https://scholar.sun.ac.za

! 54!
Table 4.1: List of samples subjected to next-generation sequencing with respective name, cultivar and the location at which the samples were collected.
4.2.2. Double-stranded RNA extractions from grapevine
Double-strand RNA extractions were performed using an adapted cellulose affinity chromatography
method (Morris and Dodds, 1979). For each sample, 20 g of phloem scrapings were pulverized in
liquid nitrogen using a mortar and pestle and 112.2 ml of extraction buffer added (45 ml 2X STE [1
X STE (100 mM NaCl, 50 mM Tris-base, 1 mM Na2EDTA at pH 6.8)], 15 ml 10% [w/v] SDS, 25
ml STE-saturated phenol, 25 ml chloroform, 1.2 ml Bentonite [40 mg/ ml] and 1 ml β-
mercaptoethanol) and shaken at 135 rpm for 30 minutes at room temperature. Samples were then
centrifuged at 16 000 xg for 20 minutes at 22oC. The supernatant was collected and adjusted to 16%
EtOH [v/v] with absolute ethanol and 3 g of cellulose powder (MN 2100) was added. The total
volume was adjusted to 300 ml with 16% EtOH 1X STE [v/v] and shaken at 135 rpm for 45
minutes at room temperature. The cellulose, containing dsRNA, was allowed to settle and the liquid
poured off. The cellulose suspension was run through a 13 mm chromatography column. The
column was washed with 100 ml 16% EtOH 1X STE [v/v] and the dsRNA eluted from the cellulose
with 42 ml 1X STE. A combination of 500 mg of cellulose (MN 2100) and 8 ml absolute EtOH was
added to the elution and the volume of the mixture adjusted to 200 ml with 16% EtOH 1X STE
[v/v]. The mixture was shaken at 135 rpm for 60 minutes at room temperature. The mixture was
then run through a 9 mm chromatography column. The column was washed with 50 ml 16% EtOH
Sample Number:
Sample Name: Cultivar: Area:
1 1.49.1 Chardonnay Malmesbury2 27.16.74 Pinot Noir Hermanus3 38.36.31 Carignan Malmesbury4 49STOK Richter '99 Malmesbury5 BJ3 Richter '99 Stellenbosch6 BJ4 Richter '99 Stellenbosch7 GH23 Cabernet Sauvignon Stellenbosch8 GH24 Cabernet Sauvignon Stellenbosch9 H35 Semillion Stellenbosch10 H36 Shiraz Rawsonville11 H38 Chenin blanc Rawsonville12 V1 Chardonnay Vredendal13 V3 Chardonnay Vredendal14 V4R Ramsey Vredendal15 V5 Chenin blanc Vredendal16 V6 Merlot Vredendal17 10.15.14 Shiraz Wolseley
Stellenbosch University https://scholar.sun.ac.za

! 55!
1X STE [v/v] and the dsRNA eluted with 9 ml 1X STE. After the addition of 0.9 ml 3M NaOAc
(pH 5.5) and 25 ml absolute ethanol [v/v], the elution was stored at -20oC overnight. The
precipitated dsRNA was centrifuged at 16 000 xg for 80 minutes at 4oC, washed with 70% EtOH
[v/v] and resuspended in 50 µl reverse osmosis water (RO-H2O). The dsRNA suspension was
subjected to RNase and DNase treatment through which 12.5 µl 10X DNase buffer (Promega), 2.5
µl DNase RQ1 (Promega) and 5 µl RNase T1 (Roche) were added to the suspension and
subsequently incubated at 37oC for 30 minutes using an Applied Sciences thermal cycler 2720. A
combination of 250 µl phenol, 240 µl chloroform, 10 µl isoamylalcohol and 430 µl 1X STE were
added to the dsRNA suspension, mixed thoroughly and centrifuged at 16 000 xg for 10 minutes at
4oC. The supernatant was removed and added to 480 µl chloroform and 20 µl isoamylalcohol,
mixed thoroughly and centrifuged at 16 000 xg for 10 minutes at 4oC. The supernatant was removed,
2.5X absolute EtOH and 10% 3M NaOAc was added and mixed before storing at -20oC for 2 hours.
A fraction (20%) of the total volume was then removed and added to a new tube. Both tubes were
centrifuged at 19 500 xg for 60 minutes at 4oC after which the liquid was drained and the pellets
washed with 70% EtOH [v/v]. A combination of 20 µl 1X TE (1 M Tris-base, 500 mM Disodium
Salt Dihydrate), 2 µl 3M NaOAc and 50 µl absolute EtOH was added to the tube containing 80% of
the total volume and stored at -20oC to be sent for library preparation and NGS. A total of 15 µl
RO-H2O and 5X Cresol loading dye (30% sucrose; 125 mg cresol red dye) was added to the tube
containing 20% of the total volume and the dsRNA separated in a 1% [w/v] TAE (40 mM Tris-base,
1 mM Na2EDTA and 0.1% [v/v] glacial acetic acid at pH 8.0) agarose gel stained with ethidium
bromide (EtBr). The quality and quantity of the dsRNA was evaluated through visualization on a
1% [w/v] TAE Agarose gel stained with EtBr. All 17 dsRNA samples were selected for sequencing
(Table 4.1) at the Agricultural Research Council Biotechnology Platform (ARC-BP), Pretoria.
4.2.3. Library preparation and next-generation sequencing
Library preparations were performed using an adapted protocol for dsRNA as input RNA that
followed an Illumina TruSeq RNA sample preparation protocol (Supplementary Protocol S.1).
Samples processed in the year 2013, namely: 7, 8, 9, 10 and 11 were subjected to sequencing using
an Illumina MiSeq platform while samples processed in the year 2014, that include: 1-6 and 12-17
were sequenced using Illumina’s HiSeq 2500 platform. All samples were sequenced as 100-
nucleotide paired-end reads.
4.2.4. Sequence analysis and pre-processing
Short read datasets generated for each sample were processed separately. Generated reads were
evaluated for quality using FastQC (http://! bioinformatics.babraham.ac.uk/projects/fastqc/).
Stellenbosch University https://scholar.sun.ac.za

! 56!
Individual sequencing adaptors were identified and trimmed from the reads using Cutadapt v1.6
(Google Code) (Supplementary Table S.7). Nucleotides on the 5’-ends of the datasets were trimmed
of unevenly distributed nucleotides to remove potentially incorporated sequencing errors and
improve the quality of reads for de novo assemblies. The 3’ region of the dataset sequences whose
mean quality score was less than 28 were trimmed to improve the overall quality of datasets to
ensure more accurate read-mappings and de novo assemblies. Trimming of datasets was performed
using the fastx_trimmer command of FASTX-Toolkit (http://hannonlab.cshl.edu/fastx_toolkit/).
Datasets were then filtered for quality using the fastq_quality_filter command of FASTX_Toolkit
(http://hannonlab.cshl.edu/fastx_toolkit/); the minimum quality score to keep was set at Q20 (-q 20)
and the minimum percent of bases with Q20 Phred quality scoreQ was set at 96% (-p 96) (Figure
4.2). Through filtering datasets for Q20 Phred scores it was assured that 99% of bases were called
correctly, further improving the quality of reads for subsequent analyses. Reads shorter than 20
nucleotides in length were removed from the dataset.
Datasets that had been quality trimmed and filtered were uploaded into CLC Genomics Workbench
7 (CLC Bio) for subsequent analysis. The datasets were imported as fastq Illumina files with
Sanger/ Illumina pipeline 1.9 base encoding. Reads were aligned to the complete set of Vitis
vinifera chromosomes (19 chromosomes) as well as the Vitis vinifera chloroplast and mitochondrial
genomes (Supplementary Table S.2). Mapping parameters to host genomes specified that the
reference genomes would not be masked, read alignment was set to default (mismatch cost: 2;
insertion cost: 3; deletion cost: 3; length fraction: 0.7; similarity fraction: 0.7) with global alignment
and random mapping of non-specific matches; un-mapped reads were collected and used for further
analysis. Data sets hereafter will be referred to as “high-quality reads”.
Read-mapping
High-quality reads were mapped to 124 reference genomes of grapevine-infecting viruses and
viroids, obtained from the NCBI GenBank database (Supplementary Table S.3). Parameters of the
read-mappings included no masking of the reference genomes, read alignment costs for mismatches,
insertions and deletions were set at 2, 3 and 3 respectively; reads that mapped to references required
that 90% of the read length match the reference and that 90% of read nucleotides match those of the
reference. Reads were utilized in a global alignment with random mapping of non-specific matches
and the results were then saved.
!!!!!!!!!!!!!!!!!!!!!!!!!!!!!!!!!!!!!!!!!!!!!!!!!!!!!!!!Q!Phred quality scores are allocated to each sequence base call and are logarithmically related to the base-calling error probability. A Phred score of Q20 implies that the probability of an incorrect base call is 1% therefore base calling accuracy is 99%.!
Stellenbosch University https://scholar.sun.ac.za

! 57!
De novo assembly
De novo assemblies of NGS reads were performed in CLC Genomics Workbench 7 (CLC Bio)
through CLC bio’s de novo assembly algorithm which functions through the use of de Bruijn
graphs, a method also used by other de novo assemblers such as Velvet (Zerbino et al., 2009;
Zerbino and Birney, 2008), ALLPATHS (Butler et al., 2008) and Euler-SR (Chaisson and Pevzner,
2008). First, read sequences were assembled into simple contig sequences at which point the reads
were mapped back to the simple contig sequences as a reference, by doing so the coverage levels of
individual contigs was established. Parameters for each de novo assembly included: a default word
size and bubble size of 20 and 50, respectively; a minimum contig length of 200; global alignment
with reads mapping back to contigs using default settings (mismatch cost: 2, insertion cost: 3,
deletion cost: 3, length fraction: 0.5 and similarity fraction: 0.8); and update contigs was selected.
Contigs created through de novo assemblies were selected based on the criteria that they had an
average coverage of greater than 50X or were 1 kb in length and subjected to BLAST (Basic Local
Alignment Search Tool) searches with both blastn (searches a nucleotide database with a nucleotide
query) and tblastx (searches a translated nucleotide database using a translated nucleotide query)
analysis against the NCBI non-redundant database with the use of Blast2GO (Conesa et al., 2005).
To ensure that high confidence matches were selected the E-value cut-off was set at 1.0E-6. Contigs
were classified according to their highest identity. Figure 4.1 illustrates the workflow followed in
processing and analyzing the NGS data obtained.
Stellenbosch University https://scholar.sun.ac.za
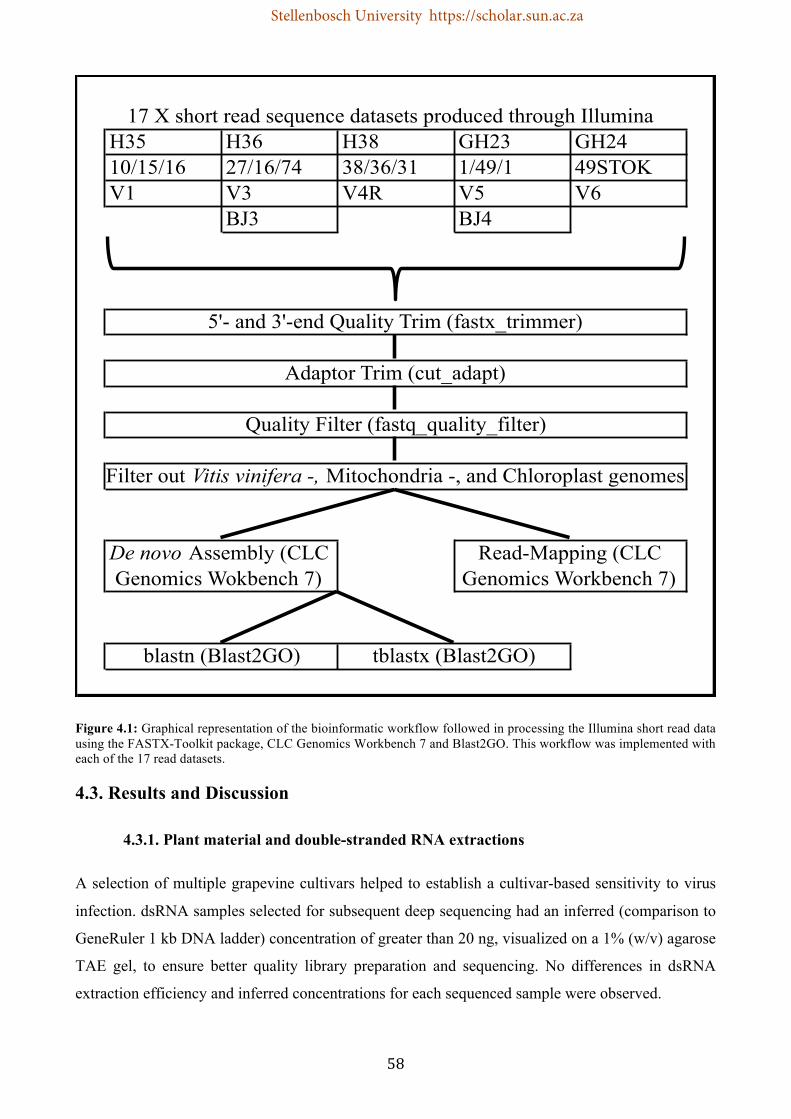
! 58!
Figure 4.1: Graphical representation of the bioinformatic workflow followed in processing the Illumina short read data using the FASTX-Toolkit package, CLC Genomics Workbench 7 and Blast2GO. This workflow was implemented with each of the 17 read datasets.
4.3. Results and Discussion
4.3.1. Plant material and double-stranded RNA extractions
A selection of multiple grapevine cultivars helped to establish a cultivar-based sensitivity to virus
infection. dsRNA samples selected for subsequent deep sequencing had an inferred (comparison to
GeneRuler 1 kb DNA ladder) concentration of greater than 20 ng, visualized on a 1% (w/v) agarose
TAE gel, to ensure better quality library preparation and sequencing. No differences in dsRNA
extraction efficiency and inferred concentrations for each sequenced sample were observed.
H35 H36 H38 GH23 GH2410/15/16 27/16/74 38/36/31 1/49/1 49STOKV1 V3 V4R V5 V6
BJ3 BJ4
blastn (Blast2GO) tblastx (Blast2GO)
5'- and 3'-end Quality Trim (fastx_trimmer)
17 X short read sequence datasets produced through Illumina
Adaptor Trim (cut_adapt)
Quality Filter (fastq_quality_filter)
Filter out Vitis vinifera -, Mitochondria -, and Chloroplast genomes
De novo Assembly (CLC Genomics Wokbench 7)
Read-Mapping (CLC Genomics Workbench 7)
Stellenbosch University https://scholar.sun.ac.za

! 59!
4.3.2. Illumina sequencing and pre-processing
Approximately 31 gigabases of data were generated through NGS (Table 4.2). Short read datasets,
generated for each sample, were visualized using FastQC (http://!bioinformatics.babraham.ac.uk/projects/fastqc/) and trimmed and filtered for quality with
FASTX_Toolkit (http://hannonlab.cshl.edu/fastx_toolkit/) (Figure 4.2). Once the data had been
trimmed of sequencing adaptors and reduced quality sequence sections as well as filtered for high
quality reads, between 39.6% and 81.0% of the total reads, per sample, were discarded (Table 4.2).
In total, 46.65% of nucleotides produced through NGS were discarded after quality trimming and
filtering. The respective losses of nucleotides for each Illumina platform used can be seen in Figure
4.3, where the Illumina Miseq sequencer lost 25% less data than the HiSeq sequencer during the
initial quality trimming and filtering process, indicating greater sequencing efficiency in the
Illumina MiSeq sequencing platform. Regardless, a large amount of sequencing data was lost due to
insufficient quality, which could be on account of substandard sequencing and extraction practices
as well as sample handling.
Figure 4.2: Graphs illustrating the quality of the sample 4 (49STOK) sequence dataset, generated in FastQC. A) The percentage nucleotide composition per base, used to trim nucleotides from the 5’-end. B) The average quality score (Phred scores), used to trim nucleotides from the 3’-end. Blue line indicates mean quality score across dataset C) A minimum Phred score of Q20 was used for filtering. D) The sequence dataset quality following trimming and filtering. Checkered red lines display thresholds at which trimming and filtering occurred.
D)
A)
B)
C)

! 60!
0
500
1000
1500
2000
2500
Raw Illumina Data Data after Trim and Q20 Filter
Data after Host Genome Filter
Numb
er of
Nt (
X 1 0
00 00
0)
Stage of Analysis
MiSeq
HiSeq
Figure 4.3: Line graph displaying the loss in sequencing data through the trimming and filtering process for each Illumina platform used, namely: MiSeq (2013 samples) and HiSeq 2500 (2014 samples).
Table 4.2: Table displaying the nucleotides generated through NGS for each sample, the nucleotides remaining after trimming and filtering for Q20 as well as filtering of V. vinifera genome sequences (percentage nucleotides remaining in brackets) and the total percentage of nucleotides lost through the quality trimming and filtering processes.
4.3.3. Read-mappings and analyses
Between 54.5% and 93.1% of the total reads were removed after trimming and filtering for quality
and against Vitis vinifera genomes, to enrich for viral reads (Table 4.2). High-quality reads were
mapped to 124 reference genomes (Supplementary Table S.3), comprised of grapevine-infecting
pathogens and a table drawn indicating the prevalence of identified pathogens in each sample
(Table 4.3). A total of 100,751,463 reads, representing 52.8% of the total reads remaining after
Sample Number: Output (Gb): Illumina Nt: Nt after Q20 Filter/ (%): Nt after Read-Mapping/ (%): Total Nt Discarded (%):1 1.49 1 485 733 800 308 275 947/ (20.8) 189 592 067/ (61.5) 87.22 0.88 879 073 800 173 310 988/ (19.7) 125 934 927/ (72.7) 85.73 2.24 2 241 305 000 1 300 448 836/ (58.0) 487 433 827/ (37.5) 78.34 3.56 3 561 818 800 1 828 296 372/ (51.3) 1 573 627 535/ (86.1) 55.85 2.51 2 513 532 000 476 657 766/ (19.0) 369 204 150/ (77.5) 85.36 2.63 2 632 451 800 1 590 475 027/ (60.0) 651 082 521/ (41.0) 75.37 2.58 2 580 219 397 1 522 329 444/ (59.0) 788 799 711/ (51.8) 69.48 0.95 948 053 661 559 351 660/ (59.0) 65 750 496/ (11.8) 93.19 0.46 461 955 729 272 553 880/ (59.0) 155 250 096/ (60.0) 66.410 0.22 215 134 427 126 929 312/ (59.0) 97 986 320/ (77.2) 54.511 0.53 525 086 997 309 801 328/ (59.0) 220 141 376/ (71.1) 58.112 2.14 2 140 140 400 1 277 088 322/ (59.7) 493 206 390/ (38.6) 77.013 1.84 1 836 598 400 1 085 870 839/ (59.1) 243 880 121/ (22.5) 86.714 2.20 2 201 147 600 748 338 994/ (34.0) 464 116 339/ (62.0) 78.915 3.94 3 940 633 200 2 139 374 475/ (54.3) 1 206 398 861/ (56.2) 69.416 1.25 1 247 294 800 402 735 760/ (32.3) 260 120 627/ (64.6) 79.117 1.64 1 644 256 600 366 321 918/ (22.3) 203 294 359/ (55.5) 87.6
! 61!
quality trimming and filtering (Table 4.4), were mapped to reference genomes and detected a total
of 300 viruses across 17 samples. Figure 4.3 illustrates the loss of nucleotide data for each of the
Illumina sequencers used. 78.86% and 68.30% of the nucleotide data was lost after pre-processing
of NGS data using Illumina HiSeq and MiSeq sequencers, respectively. 10.56% less sequencing
data was discarded from the Illumina MiSeq platform based on sequencing quality (Figure 4.3).
DNase and RNase treatment was performed consistently on each dsRNA sample. Through the
removal of DNA and RNA, the quality of dsRNA samples sent for sequencing was increased;
however, a large amount of NGS data, assumedly produced from dsRNA, was not mapped to
grapevine-infecting viruses (Table 4.4). Possible reasons for this occurrence include: stringent
mapping parameters to reduce non-specific mappings, suboptimal DNase and RNase treatment,
contamination of dsRNA sample after treatment of DNA and RNA and contamination of samples
during library preparation and NGS.
Read mapping results for each of the 17 datasets were pooled and GLRaV-3 was found to be the
most prevalent virus, comprising 31.29% of the total mapped reads. GLRaV-3 variant groups VI
and II were the most commonly detected variants, contributing 22.16% and 8.23% of the total
mapped reads, respectively. Members of the genus Vitivirus contributed to 0.55% of all detected
viruses, GVE being the best represented Vitivirus with 0.47% contribution. Reads mapping to
Grapevine endophyte endornavirus (GEEV) were detected in all samples and contributed towards
6.6% of all mapped reads. Three families of viruses contributed towards greater than 1% of the
identified viruses, they are: Closteroviridae, Betaflexiviridae and Endornaviridae, the remaining
viruses were identified at lower percentages.
The average coverage of reference genomes and the fraction of reference covered per virus for each
sample can be seen in Table 4.3. The average coverage of each virus reference and the fraction of
the reference covered give a good indication of the presence and titre of an identified virus. Results
that display a high read count with a low fraction of reference covered indicate the mapping of
reads to conserved regions of the reference sequence, as can be seen for GLRaV-3 variant group III
viruses in samples 4, 6, 13 and 14 (Table 4.3). This may be a possible indication of the presence of
alternative isolate representatives of the viruses mapped or an indication of abundance of specific
subgenomic RNAs. The stringent parameters set for read-mappings would exclude the mapping of
reads to references with less than 90% nucleotide similarity, disallowing the detection of genetically
variable isolate genomes. On the other hand, viruses detected with a high percentage of sequence
covered and a low read count, as for viroids belonging to the family Pospiviroidae and certain
Vitivirus infections, can be accounted to relatively small genomes, uniform replication across all
Stellenbosch University https://scholar.sun.ac.za

! 62!
open reading frames (ORFs) as well as better quality reads mapping to regions across the reference
genomes.
Supplementary Table S.4 displays the fraction of the reference covered for each virus per sample
and is a good indicator for the confidence of virus presence. GLRaV-3 variant groups I, II and VI as
well as viroids of the family Pospiviroidae, were detected with a high fraction of the reference
covered. Therefore, there is a high confidence in the presence of these viruses in their respective
samples. References of viruses from the families Secoviridae, Geminiviridae, Tymoviridae,
Tombusviridae, Bunyaviridae and certain members of the families Betaflexiviridae and
Virgaviridae were detected with less than 10% of the reference covered. An average of two of each
of these viruses was detected across all of the samples. Further validation, through RT-PCR, of
these viruses needs to be completed in order to determine their presence.
Samples were considered to have positive virus infection based on certain criteria. The criteria
stating that reads mapping to individual viruses cover greater than 10% of the reference genome
with greater than 10X average coverage. Viral populations were calculated using the
aforementioned criteria and ranged between zero and nine virus species per sample. Sample number
3 and 6 had the highest diversity of infection with nine viruses each, while no viruses were
confidently detected in samples 2 and 16. Rootstocks were found to contain the highest average
virus population with 5.5 different viruses per sample, followed by white-fruited cultivars (3.8
viruses per sample) and red-fruited cultivars (2.8 viruses per sample). On average, four different
viruses were detected in each sample with confident virus calling.
Samples were selected based on physical symptom expression of GLD; red-fruited cultivars exhibit
a more pronounced phenotype compared to white-fruited cultivars and rootstocks. Interesting to
note, samples 2 and 16 had no positive virus calling and originated from Pinot Noir and Merlot,
respectively. The expression of GLD symptoms with these red-fruited cultivars is attributable to
low titres of GLRaV-3, indicating that a low virus titre is adequate for the expression of GLD
symptoms in grapevine. Moreover, the higher levels of virus diversity in white-fruited cultivars and
rootstocks may indicate a potential masking of visual expressions established through relationships
shared between different virus species. Such a relationship may include Grapevine-associated
narnavirus (GNV) that was only detected in white-fruited cultivars and rootstocks and potentially
GLRaV-2 (Table 4.3), detected predominantly in rootstocks with a single finding in a red-fruited
cultivar (Carignan). Further research into the association of distinctive viruses and subsequent
physical expression in differing grapevine cultivars needs to be performed to establish viral
relationships that could reduce the negative effects of GLD.
Stellenbosch University https://scholar.sun.ac.za

! 63!
Table 4.3: Table outlining the average coverage (Ave. Cov.) and the fraction of the reference genome (Frac. Ref. Cov.) covered for each sample against viruses from the families Closteroviridae, Betaflexiviridae, Pospiviridae, Endornaviridae and Narnaviridae, generated through read-mappings. Values in bold represent viruses with confident identification.
!
Ave. Cov.
Frac. Ref. Cov.
Ave. Cov.
Frac. Ref. Cov.
Ave. Cov.
Frac. Ref. Cov.
Ave. Cov.
Frac. Ref. Cov.
Ave. Cov.
Frac. Ref. Cov.
Ave. Cov.
Frac. Ref. Cov.
Ave. Cov.
Frac. Ref. Cov.
Ave. Cov.
Frac. Ref. Cov.
Ave. Cov.
Frac. Ref. Cov.
Ave. Cov.
Frac. Ref. Cov.
Ave. Cov.
Frac. Ref. Cov.
Ave. Cov.
Frac. Ref. Cov.
Ave. Cov.
Frac. Ref. Cov.
Ave. Cov.
Frac. Ref. Cov.
Ave. Cov.
Frac. Ref. Cov.
Ave. Cov.
Frac. Ref. Cov.
1 1/49/1 Chardonnay 0.09 0.01 1.33 0.14 16 0,19 0.20 0.02 3.78 0.12 0.32 0.10 0.01 0.01 0.15 0.11 0.62 0.312 27/16/74 Pinot Noir 0.03 0.01 1.40 0.11 9.60 0.18 0.18 0.02 2.12 0.11 0.01 0.01 0.26 0.10 0.02 0.02 0.05 0.04 0.91 0.403 38/36/31 Carignan 1165 1 225 0,33 27096 1 74.79 0.08 0.51 0.08 1E+06 1 0.03 0.01 11 0,66 198 0,97 0.05 0.03 117 1 1424 1 0.18 0.18 0.23 0.164 49STOK Richter '99 0.04 0.02 16411 1 29592 1 1780 0,11 1.29 0.17 7806 1 0.31 0.02 28 0,97 741 1 0.27 0.18 0.15 0.11 25 0,94 1.34 0.50 12950 1 0.13 0.135 BJ3 Richter '99 0.07 0.01 4.60 0.25 3249 0,81 0.97 0.05 0.48 0.13 4.21 0.16 5.39 0.39 0.19 0.12 0.48 0.12 0.57 0.306 BJ4 Richter '99 0.02 0.01 937 0,32 66591 1 172 0,13 10 0,25 1.08 0.12 0.09 0.01 138 0,96 0.05 0.05 0.01 0.01 1889 1 12,00 0,81 47 1 19 1 0.18 0.137 GH23 Cab. Sav. 0.05 0.03 0.05 0.02 21880 1 0.07 0.038 GH24 Cab. Sav. 0.07 0.03 7507 1 0.73 0.18 0.09 0.059 H35 Semillion 0.02 0.01 1712 0,9 0.50 0.06 0.24 0.01 565 0,92 0.08 0.02 0.01 0.01 0.14 0.11 21 0,96 0.07 0.05
10 H36 Shiraz 0.01 0.00 0.60 0.10 43 0,14 18 0,13 0.71 0.06 0.17 0.17 0.01 0.0111 H38 Chenin Blanc 0.01 0.01 158 0,44 1209 0,6 0.23 0.01 378 0,61 0.03 0.03 2.66 0.15 11 0,86 0.22 0.1412 V1 Chardonnay 0.23 0.04 0.40 0.08 7.50 0.19 0.03 0.01 22644 1 0.03 0.02 0.40 0.10 0.08 0.03 0.03 0.03 7.16 0.81 1.40 0.55 13 0,71 0.56 0.13 11 0,713 V3 Chardonnay 0.03 0.01 9927 1 7494 1 252 0,11 5.74 0.18 3299 1 0.01 0.01 30 0,98 1398 1 94 0,71 0.06 0.03 4.2 0.77 3.12 0.93 1.22 0.46 3.13 0.5514 V4R Ramsey 0.05 0.02 1353 0,93 10114 0,93 88 0.07 0.46 0.14 7277 0,88 0.02 0.00 0.24 0.18 0.18 0.07 38 0,43 0.19 0.09 0.45 0.45 1.99 0.44 0.76 0.33 0.52 0.2815 V5 Chenin Blanc 0.05 0.02 148 0,33 1E+05 1 49 0.07 0.94 0.17 6.09 0.23 0.01 0.01 0.02 0.02 2019 1 128 0,6 0.03 0.03 3.81 0.79 8.9 0.96 34 0,87 0.21 0.13 4.05 0.7616 V6 Merlot 0.03 0.02 0.90 0.12 6.90 0.16 0.06 0.02 1.73 0.12 0.03 0.03 0.11 0.08 0.01 0.01 0.04 0.04 0.31 0.2317 16/15/14 Shiraz 0.06 0.01 1.36 0.13 10 0,14 0.20 0.02 2.69 0.14 0.02 0.02 0.26 0.11 0.04 0.04 0.05 0.04 0.19 0.19 0.59 0.35
Sa
mp
le N
um
ber:
Descrip
tio
n:
Cu
ltiv
ar:
Grapevine Infecting Pathogen and Corresponding FamilyClosteroviridae Betaflexiviridae Pospiviridae Endornaviridae Narnaviridae
GLRaV-2 GLRaV-3 (I)
GLRaV-3 (II)
GLRaV-3 (III)
GLRaV-3 (IV)
GLRaV-3 (VI)
GLRaV-3 (GH24) GVA Yellow
Speckled GEEV GNVGVE GVF GRSPaV Hop Stunt Viroid
Yellow Speckled
Stellenbosch University https://scholar.sun.ac.za

!
! 64!
Table 4.4: Table depicting the percentage of total reads mapped for each sample to reference genomes during the read-mapping process as well as the total number of reads remaining after quality trimming and filtering.
4.3.4. De novo assemblies and analyses
High-quality reads were assembled into contigs using the de novo assembly function in CLC
Genomics Workbench 7 (CLC Bio). A total of 50.7 million reads were used to construct 37 382
contigs with a total length of 12.65 million nucleotides (Table 4.5). Sample numbers 10 and 14 had
almost four times as many contigs constructed compared to the remaining samples. The average
N50 and average calculated contig lengths were 400 and 392, respectively. Sample number 13 had
the highest N50 value of 756 base pairs. Percentages of matched reads ranged between 2.27% and
95.88% per sample, with an average of 44.22% across all of the samples. The data generated
through de novo assemblies per sample is highly variable. This is an indication of inconsistent
sequencing quality and/ or variable levels of virus infection within each sample.
Sample Number: Total Reads: Mapped Reads:
Percentage of Reads Mapped
(%):1 5715240 6826 0,1192 3192973 4405 0,1383 18602935 11581763 62,2584 27121822 17792469 65,6025 8914237 999449 11,2126 22760310 18249348 80,1817 9172090 4706118 51,3098 2853489 2385590 83,6039 1213840 550190 45,32610 728523 16236 2,22911 1674079 427620 25,54412 17642034 5769627 32,70413 15591971 5742202 36,82814 11994784 5420584 45,19115 30483476 27091189 88,87216 6356502 2991 0,04717 6734818 4856 0,072
Stellenbosch University https://scholar.sun.ac.za
!
! 65!
Table 4.5: Table illustrating the de novo assembly characteristics as well as features of the contigs created per sample.
z N50 is a statistic based on the median of contig lengths, with preference to longer conitgs, in a set of sequences. It is the length at which 50% of sequence bases are included into contigs that equal or exceed N50 lengths.
A total of 1 334 contigs, generated through de novo assemblies, were selected for subsequent
BLAST analysis. Criteria for contig selection included that contigs have a greater than 50X average
coverage or that contig length was greater than 1 kb. These criteria were selected to increase the
confidence in correct virus identification through BLAST analysis and aid in the detection of full-
length virus genomes.
Table 4.6 and Figure 4.4 display the distribution of de novo assembly data categorized as grapevine
viruses, bacteria, viroids, fungi, other viruses and other or unidentified groups after BLAST
searches. NGS reads were assembled into contigs and determined that a greater percentage of reads
originated from grapevine viruses representing 83% of the total reads subjected to BLAST searches,
followed by fungi (6%) and then bacteria (5%). Similar results were obtained through blastn and
tblastx searches indicating a good consistency with nucleotide as well as protein searches.
N50 Average:
1 257 267 2739 730737 143022 4.222 271 282 2139 603578 65474 2.873 434 468 344 161034 2532592 36.354 557 502 729 365605 12380502 53.065 254 271 741 200713 159194 2.276 375 408 596 243451 7264946 78.377 324 336 2559 860565 855466 9.668 514 460 539 247729 3208395 63.769 521 517 809 418307 2042208 95.8810 349 331 10664 3526097 238475 25.1511 523 512 803 411292 2237148 94.9612 492 469 176 82586 5896215 86.6413 756 565 223 126057 3198852 91.4214 330 334 11831 3950184 4260484 57.7015 316 380 312 118536 5571768 32.6016 274 291 879 255696 550739 13.3317 257 271 1299 351761 121015 3.46
Sample Number:
Length:
Contig Count:
Total Length:
Matched Reads:
Total Reads
Assembled (%):
z!
Stellenbosch University https://scholar.sun.ac.za

!
! 66!
Sample: n t-x n t-x n t-x n t-x n t-x n t-x n t-x1 682 682 39093 39093 6963 5218 4497 62422 547 547 19564 19564 248 2483 1286272 1286013 259 365 3654 7648714 7556672 560170 551897 29461 419317 2399625 2531583 769953 363605 600600 5854495 92592 92592 46547 46547 463 4636 6813573 6834300 328283 335590 1001 26200 25612 24669 19398 39332 161567 514980 514980 21638 23224 77993 60241 3676 198428 2703450 2703450 23124 23124 113695 112652 2644 36879 1120093 1117376 2105 2105 299 299 61 23902 23841 2717
10 17778 17778 8938 8632 193 193 86620 90487 31534 2720511 1453518 1453653 5799 4468 2045 2288 346718 25569 286067 60816912 5643173 5643173 82120 79358 5910 960 960 53891 50489 571 82513 1261100 126110014 1257569 1257569 10133 1013315 3961148 3961148 103627 104227 210 210 798 798 3164 2564 928 92816 499136 499136 197 7919 7415 2445 275217 41794 41794 40546 40546 3313 3313
Grapevine Virus:Read Distribution per Category
Bacteria: Viroid: Other Virus: Fungi: Other: Unidentified:
Table 4.6: Illustration of the reads that were classified, per sample, into each category after Blast2GO analyses with blastn (n) and tblastx (t-x) functions.
Figure 4.4: Graphical representations of the distribution of de novo assembly data to different categories of organisms, determined through Blast2GO. A) Distribution of de novo assembled reads using the tblastx function of Blast2GO. B) Distribution of de novo assembled reads using the blastn function of Blast2GO.
An average of 83% of de novo data was found to be of viral origin. Figure 4.5 displays the
distribution of reads, used to construct contigs, to virus populations per sample. 100% of the reads
used in de novo assemblies for samples 3 and 13 originated from viral populations while no viral
contigs were constructed from samples 16 and 17, both red-fruited cultivars. This indicates that
either the sequence data had too poor quality to assemble longer contigs or further signifies the low
quantity of viral infection needed for visual symptoms to be evident in red-fruited GLD plants.
83%$
5%$0%$
0%$
6%$
4%$ 2%$
Distribution*of*Reads*(blastn)*
Grapevine$Virus$
Bacteria$
Viroid$
Other$Virus$
Fungi$
Other$
Unidentified$
83%$
5%$0%$
1%$
6%$
2%$ 3%$
Distribution*of*Reads*(tblastx)*
Grapevine$Virus$
Bacteria$
Viroid$
Other$Virus$
Fungi$
Other$
Unidentified$
A) B)
Stellenbosch University https://scholar.sun.ac.za
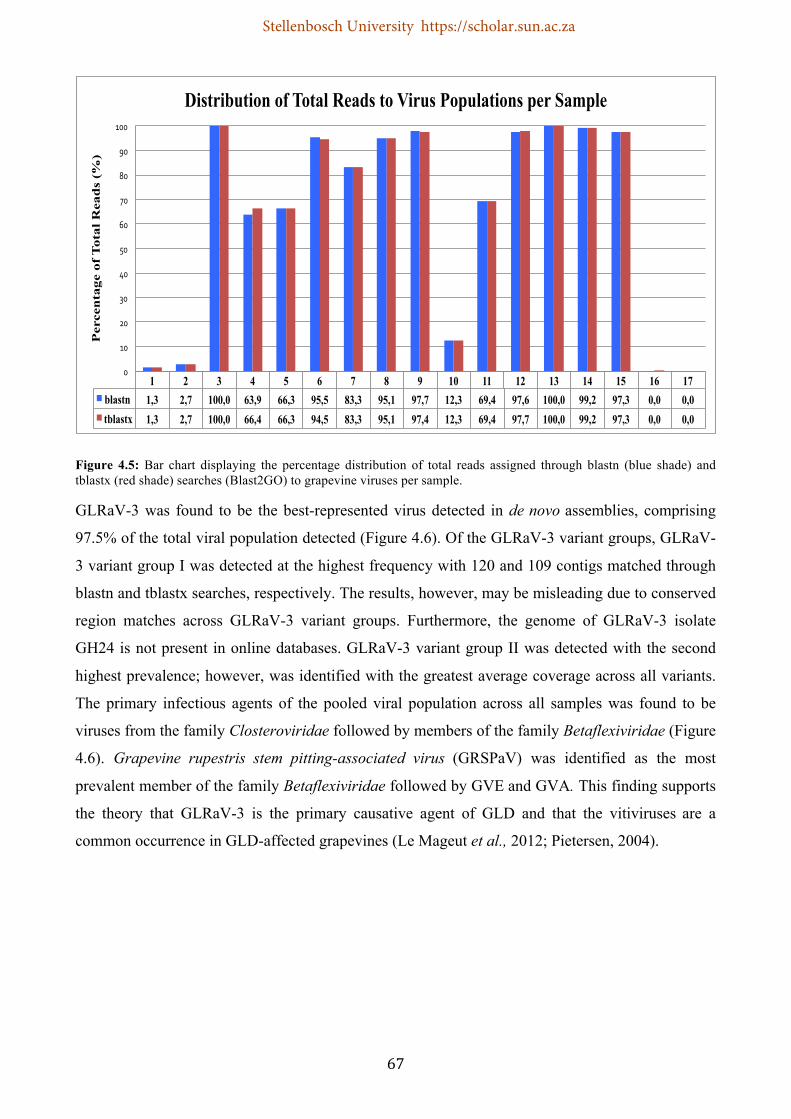
!
! 67!
Figure 4.5: Bar chart displaying the percentage distribution of total reads assigned through blastn (blue shade) and tblastx (red shade) searches (Blast2GO) to grapevine viruses per sample.
GLRaV-3 was found to be the best-represented virus detected in de novo assemblies, comprising
97.5% of the total viral population detected (Figure 4.6). Of the GLRaV-3 variant groups, GLRaV-
3 variant group I was detected at the highest frequency with 120 and 109 contigs matched through
blastn and tblastx searches, respectively. The results, however, may be misleading due to conserved
region matches across GLRaV-3 variant groups. Furthermore, the genome of GLRaV-3 isolate
GH24 is not present in online databases. GLRaV-3 variant group II was detected with the second
highest prevalence; however, was identified with the greatest average coverage across all variants.
The primary infectious agents of the pooled viral population across all samples was found to be
viruses from the family Closteroviridae followed by members of the family Betaflexiviridae (Figure
4.6). Grapevine rupestris stem pitting-associated virus (GRSPaV) was identified as the most
prevalent member of the family Betaflexiviridae followed by GVE and GVA. This finding supports
the theory that GLRaV-3 is the primary causative agent of GLD and that the vitiviruses are a
common occurrence in GLD-affected grapevines (Le Mageut et al., 2012; Pietersen, 2004).
1 2 3 4 5 6 7 8 9 10 11 12 13 14 15 16 17 blastn 1,3 2,7 100,0 63,9 66,3 95,5 83,3 95,1 97,7 12,3 69,4 97,6 100,0 99,2 97,3 0,0 0,0 tblastx 1,3 2,7 100,0 66,4 66,3 94,5 83,3 95,1 97,4 12,3 69,4 97,7 100,0 99,2 97,3 0,0 0,0
0"
10"
20"
30"
40"
50"
60"
70"
80"
90"
100"
Per
cen
tag
e o
f T
ota
l R
ead
s (%
) Distribution of Total Reads to Virus Populations per Sample
Stellenbosch University https://scholar.sun.ac.za
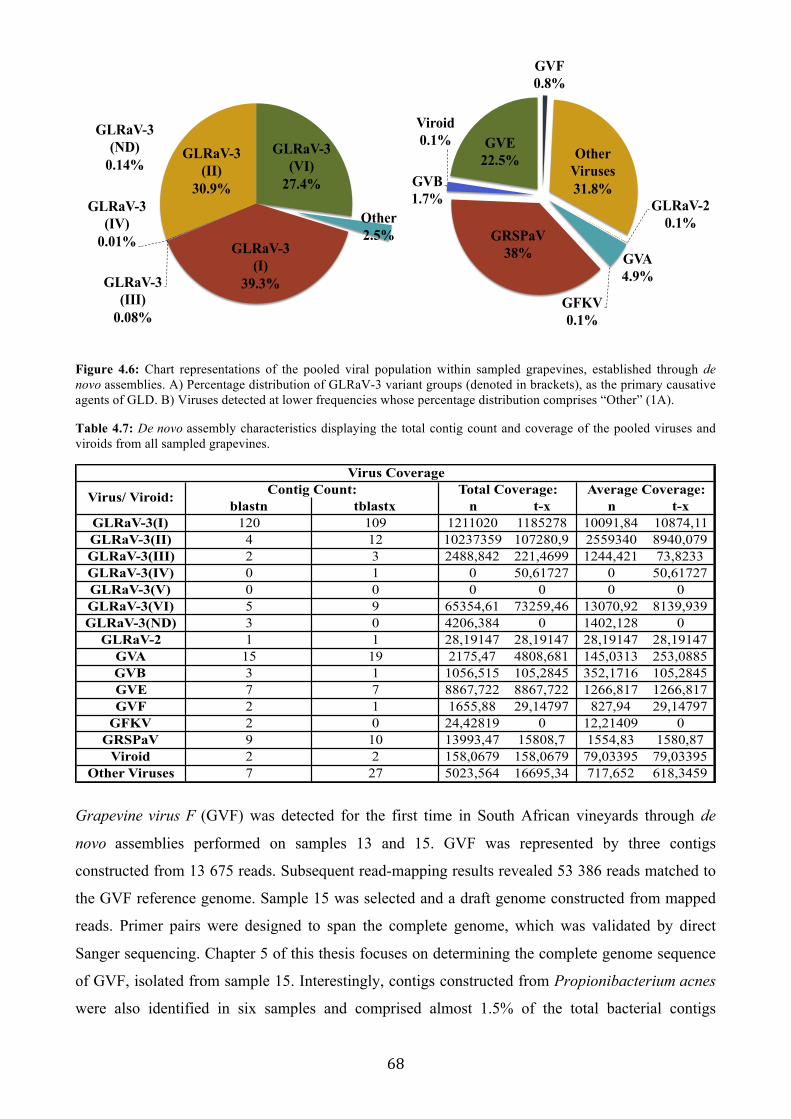
!
! 68!
GVF 0.8%
Other Viruses 31.8%
GLRaV-2 0.1%
GVA 4.9%
GFKV 0.1%
GRSPaV 38%
GVB 1.7%
Viroid 0.1% GVE
22.5% GLRaV-3
(VI) 27.4%
Other 2.5%
GLRaV-3 (I)
39.3% GLRaV-3 (III)
0.08%
GLRaV-3 (IV)
0.01%
GLRaV-3 (ND)
0.14% GLRaV-3
(II) 30.9%
Figure 4.6: Chart representations of the pooled viral population within sampled grapevines, established through de novo assemblies. A) Percentage distribution of GLRaV-3 variant groups (denoted in brackets), as the primary causative agents of GLD. B) Viruses detected at lower frequencies whose percentage distribution comprises “Other” (1A).
Table 4.7: De novo assembly characteristics displaying the total contig count and coverage of the pooled viruses and viroids from all sampled grapevines.
Grapevine virus F (GVF) was detected for the first time in South African vineyards through de
novo assemblies performed on samples 13 and 15. GVF was represented by three contigs
constructed from 13 675 reads. Subsequent read-mapping results revealed 53 386 reads matched to
the GVF reference genome. Sample 15 was selected and a draft genome constructed from mapped
reads. Primer pairs were designed to span the complete genome, which was validated by direct
Sanger sequencing. Chapter 5 of this thesis focuses on determining the complete genome sequence
of GVF, isolated from sample 15. Interestingly, contigs constructed from Propionibacterium acnes
were also identified in six samples and comprised almost 1.5% of the total bacterial contigs
blastn tblastx n t-x n t-xGLRaV-3(I) 120 109 1211020 1185278 10091,84 10874,11GLRaV-3(II) 4 12 10237359 107280,9 2559340 8940,079GLRaV-3(III) 2 3 2488,842 221,4699 1244,421 73,8233GLRaV-3(IV) 0 1 0 50,61727 0 50,61727GLRaV-3(V) 0 0 0 0 0 0GLRaV-3(VI) 5 9 65354,61 73259,46 13070,92 8139,939GLRaV-3(ND) 3 0 4206,384 0 1402,128 0
GLRaV-2 1 1 28,19147 28,19147 28,19147 28,19147GVA 15 19 2175,47 4808,681 145,0313 253,0885GVB 3 1 1056,515 105,2845 352,1716 105,2845GVE 7 7 8867,722 8867,722 1266,817 1266,817GVF 2 1 1655,88 29,14797 827,94 29,14797
GFKV 2 0 24,42819 0 12,21409 0GRSPaV 9 10 13993,47 15808,7 1554,83 1580,87
Viroid 2 2 158,0679 158,0679 79,03395 79,03395Other Viruses 7 27 5023,564 16695,34 717,652 618,3459
Virus CoverageContig Count: Total Coverage: Average Coverage:Virus/ Viroid:

!
! 69!
generated. This result supports the finding of an interkingdom transfer of bacteria from humans to
grapevine (Campisano et al., 2014).
4.4. Conclusion
In this study, the viromes of 17 GLD symptomatic grapevines were investigated. It was determined
that there is an average of four different viruses per sample, with rootstock and white-fruited
cultivars hosting more diverse populations of viruses (Table 4.3). The most abundant virus was
GLRaV-3, particularly GLRaV-3 variant group II representatives, supporting the hypothesis that
GLRaV-3 is the primary causative agent of GLD in South Africa (Pietersen, 2004). Through read
mapping it was determined that viruses from the family Closteroviridae are the most prevalent in
GLD-affected vines, comprising up to 31% of the mapped reads, while 0.6% of the total mapped
reads originated viruses of the genus Vitivirus. Although 76% of the raw data generated was lost
through quality trimming and filtering, NGS functioned effectively in identifying grapevine-
infecting viruses and was capable of identifying a new isolate of GVF. Further research, with focus
on viral populations and associations between virus species, needs to commence to broaden the
understanding of GLD etiology and assist in reducing the negative effects of this disease.
4.5. References
Adams, I.P., Glover, R.H., Monger, W.A., Mumford, R., Jackeviciene, E., Navalinskiene, M., Samuitiene, M., Boonham, N. 2009. Next-generation sequencing and metagenomic analysis: a universal diagnostic tool in plant virology. Molecular Plant Pathology. 10: 537-545.
Akbas, B., Kunter, B., Ilhan, D. 2007. Occurrence and distribution of grapevine leafroll-associated viruses 1, 2, 3 and 7 in Turkey. Journal of Phytopathology. 155: 122-124.
Al Rwahnih, M., Daubert, S., Úrbez-Torres, J.R., Cordero, F., Rowhani, A. 2011. Deep sequencing evidence from single grapevine plants reveals a virome dominated by mycoviruses. Archives of Virology. 156: 397-403.
Boonham, N., Tomlinson, J., Mumford, R. 2007. Microarrays for rapid identification of plant viruses. Annual Review of Phytopathology. 45: 307-328.
Butler, J., MacCallum, M., Kleber, M., Shlyakhter, I.A., Belmonte, M.K., Lander, E.S., Nusbaum, C., Jaffe, D.B. 2008. ALLPATHS: De novo assembly of whole-genome shotgun microreads. Genome Research. 18: 810-820.
Campisano, A., Ometto, L., Compant, S., Pancher, M., Antonielli, L., Varotto, C., Anfora, G., Pertot, I., Sessitsch, A., Rota-Stabelli, O. 2014. Interkingdom transfer of the acne causing agent, Propionibacterium acnes, from human to grapevine. Molecular Biology and Evolution. 31: 1059-1065.
Chaisson, M.J., and Pevzner, P.A. 2008. Short read fragment assembly of bacterial genomes. Genome Research. 18: 324-330.
Chooi, K.M., Cohen, D., Pearson, M.N. 2013b. Generic and sequence-variant specific molecular assays for the detection of the highly variable Grapevine leafroll-associated virus3. Journal of Virological Methods. 189: 20-29.
Stellenbosch University https://scholar.sun.ac.za

!
! 70!
Coetzee, B., Freeborough, M.J., Maree, H.J., Celton, J., Rees, D.J., Burger, J.T. 2010. Deep sequencing analysis of viruses infecting grapevines: virome of a vineyard. Journal of Virology. 400: 157-163.
Conesa, A., Götz, S., García-Gómez, J.M., Terol, J., Talón, M., Robles, M. 2005. Blast2GO: a universal tool for annotation, visualization and analysis in functional genomics research. Bioinformatics. 21: 3674-3676.
Espach, Y. 2013. The determination of mycoviral sequences in grapevine using next-generation sequencing. MSc thesis, Stellenbosch University.
Espach, Y., Maree, H.J., Burger, J.T. 2012. Complete genome of a novel endornavirus assembled from next-generation sequence data. Journal of Virology. 86: 13142.
Farooq, A.B.U., Ma, Y., Wand, Z., Zhou, N., Wenxing, X. 2012. Genetic diversity analyses reveal novel recombination events in Grapevine leafroll-associated virus- 3 in China. Virus Research. 171: 15-21.
Ferreira, R.B., Monteiro, S.S., Piçarra-Pereira, M.A., Teixeira, A.R. 2004. Engineering grapevine for increased resistance to fungal pathogens without compromising wine stability. Trends in Biotechnology. 22: 168-173.
Fiore, N., Prodan, S., Montealegre, J., Aballay, E., Pino, A.M., Zamorano, A. 2008. Survey of grapevine viruses in Chile. Journal of Plant Pathology. 90: 125-130.
Fisher, B.M., Salakhutdinov, I., Akkurt, M., Eibach, R., Edwards, K.J., Töpfer, R., Zyprian, E.M. 2004. Quantitative trait locus analysis of fungal disease resistance factors on a molecular map of grapevine. Theoretical and Applied Genetics. 108: 501-515.
Fuchs, M., Martinson, T.E., Loeb, G.M., Hoch, H.C. 2009. Survey for the three major leafroll disease- associated viruses in Finger Lakes vineyards in New York. Plant Disease. 93: 395-401.
Golino, D.A., Verdegaal, P.S., Rowhani, A., Walker, M.A. 1992. Two-year study in San Joaquin County indicates sampling procedures to find nepoviruses in grapevines need improvement. California Agriculture. 46: 11-13.
Jooste, A.E.C., Pietersen, G., Burger, J.T. 2011. Distribution of grapevine leafroll associated virus-3 variants in South African vineyards. European Journal of Plant Pathology. 131: 371-381.
Le Maguet, J., Beuve, M., Herrbach, E., Lemaire, O. 2012. Transmission of six ampeloviruses and two vitiviruses to grapevine by Phenacoccus aceris. Phytopathology. 102: 717-723.
Martelli, G.P. 2014. Directory of virus and virus-like diseases of the grapevine and their agents. Journal of Plant Pathology. 96 (1, Supplement): 1-136.
Martelli, G.P., and Boudon-Padieu, E. 2006. Directory of infectious diseases of grapevines and viroses and
virus-like diseases of the grapevine: Bibliographic report 1998 - 2004. Options Méditerranéennes série B:Studies and Research. 55, CIHEAM, 279.
Martin, R.R., Eastwell, K.C., Wagner, A., Lamprecht, S., Tzanetakis, I.E. 2005. Survey for viruses of grapevine in Oregon and Washington. Plant Disease. 89: 763-766.
Morris, T.J., and J.A. Dodds. 1979. Isolation and analysis of double-stranded RNA from virus infected plant and fungal tissue. Phytopathology. 69: 854-858.
Oliver, J.E., and Fuchs, M. 2011. Tolerance and resistance to viruses and their vectors in Vitis sp.: A virologist’s perspective of the literature. American Journal of Enology and Viticulture. 62: 438-451.
Sharma, A.M., Wang, J., Duffy, S., Zhang, S., Wong, M.K., Rashed, A., et al. 2011. Occurrence of grapevine leafroll-associated virus complex in Napa Valley. PloS ONE 6: e26227.
Stellenbosch University https://scholar.sun.ac.za

!
! 71!
Thompson, J.R., Fuchs, M., McLane, H., Celebi-Toprak, F., Fischer, K.F., Potter, J.L., Perry, K.L. 2014. Profiling viral infections in grapevine using a randomly primed reverse transcription-polymerase chain reaction/macroarray multiplex platform. Phytopathology. 104: 211-9.
Yamamoto, T., Iketani, H., Ieki, H., Nishizawa, Y., Notsuka, K., Hibi, T., Hayashi, T., Matsuta, N. 2000. Transgenic grapevine plants expressing a rice chitinase with enhanced resistance to fungal pathogens. Plant Cell Reports. 19: 639-646.
Zerbino, D.R., and Birney, E. 2008. Velvet: algorithms for de novo short read assembly using de Bruijn graphs. Genome Research. 18: 821-829.
Zerbino, D.R., McEwen, G.K., Margulies, E.H., Birney, E. 2009. Pebble and rock band: heuristic resolution of repeats and scaffolding in the velvet short-read de novo assembler. PloS ONE. 4: e8407.
4.6. Internet Sources
Pietersen, G. 2004. Spread of grapevine leafroll disease in South Africa – A difficult, but not insurmountable problem. Wynboer-A Technical Guide for Wine Producers. [Online]. Available: http://www.wynboer.co.za/recentarticles/0406leaf.php3 [2014, July 26].
Rayapati, N., O'Neal, S., Walsh, D. 2008. Grapevine leafroll disease. Washington State University Extension Bulletin. 2008: 20. [Online]. Available: http://cru.cahe.wsu.edu/CEPublications/eb2027e/eb2027e.pdf EB2027E [2014, July 5].
!
Stellenbosch University https://scholar.sun.ac.za
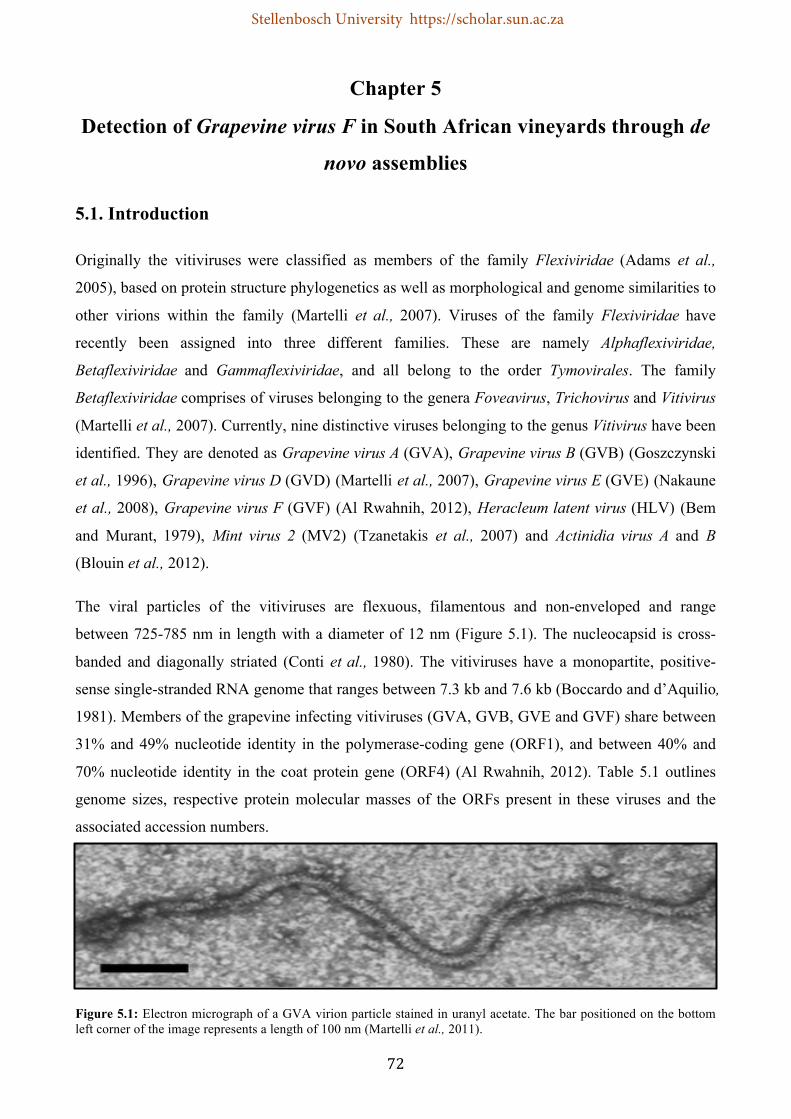
!
! 72!
Chapter 5
Detection of Grapevine virus F in South African vineyards through de
novo assemblies
5.1. Introduction
Originally the vitiviruses were classified as members of the family Flexiviridae (Adams et al.,
2005), based on protein structure phylogenetics as well as morphological and genome similarities to
other virions within the family (Martelli et al., 2007). Viruses of the family Flexiviridae have
recently been assigned into three different families. These are namely Alphaflexiviridae,
Betaflexiviridae and Gammaflexiviridae, and all belong to the order Tymovirales. The family
Betaflexiviridae comprises of viruses belonging to the genera Foveavirus, Trichovirus and Vitivirus
(Martelli et al., 2007). Currently, nine distinctive viruses belonging to the genus Vitivirus have been
identified. They are denoted as Grapevine virus A (GVA), Grapevine virus B (GVB) (Goszczynski
et al., 1996), Grapevine virus D (GVD) (Martelli et al., 2007), Grapevine virus E (GVE) (Nakaune
et al., 2008), Grapevine virus F (GVF) (Al Rwahnih, 2012), Heracleum latent virus (HLV) (Bem
and Murant, 1979), Mint virus 2 (MV2) (Tzanetakis et al., 2007) and Actinidia virus A and B
(Blouin et al., 2012).
The viral particles of the vitiviruses are flexuous, filamentous and non-enveloped and range
between 725-785 nm in length with a diameter of 12 nm (Figure 5.1). The nucleocapsid is cross-
banded and diagonally striated (Conti et al., 1980). The vitiviruses have a monopartite, positive-
sense single-stranded RNA genome that ranges between 7.3 kb and 7.6 kb (Boccardo and d’Aquilio,
1981). Members of the grapevine infecting vitiviruses (GVA, GVB, GVE and GVF) share between
31% and 49% nucleotide identity in the polymerase-coding gene (ORF1), and between 40% and
70% nucleotide identity in the coat protein gene (ORF4) (Al Rwahnih, 2012). Table 5.1 outlines
genome sizes, respective protein molecular masses of the ORFs present in these viruses and the
associated accession numbers.
Figure 5.1: Electron micrograph of a GVA virion particle stained in uranyl acetate. The bar positioned on the bottom left corner of the image represents a length of 100 nm (Martelli et al., 2011).
Stellenbosch University https://scholar.sun.ac.za

!
! 73!
ORF1 ORF2 ORF3 ORF4 ORF5GVA 7471 194 19.8 31 21.5 10 Complete DQ855082.2GVB 7599 195 20 36.5 21.6 14 Complete NC_003602.1GVD 963 - - - 17.7 10.5 Partial Y07764.1GVE 7571 192.2 21.4 29.2 21.8 12.5 Complete KF588015.1GVF 7551 196.9 17.9 30.4 21.7 12.3 Complete JX105428
Molecular Weights (kDa): Genome Status:
Accession Number:
Genome Size (nt):
Virus:
Table 5.1: Genome sizes, sequence accession numbers and protein molecular weights for five members of the genus
Vitivirus. Adapted from du Preez et al. (2011).
The grapevine infecting vitiviruses are common pathological agents of Vitis vinifera, which is their
natural host. Some have been associated with the Rugose wood complex, a disease associated with
pitting and grooving under the bark of grapevines (Martelli, 1993). GVA and GVB are associated
with Kober Stem Grooving and corky bark disease, respectively; however, symptoms are usually
only visible on grafted vines (Weber et al., 2002). GVE, GVD and GVF have not been proven to
cause disease in grapevine. In a majority of instances, the vitiviruses remain in diseased grapevines
as latent viruses, their disease symptoms are not well understood. The primary mean of
transmission of vitiviruses is through the foregut of insects; namely Cavariella, Heliococcuc,
Neopulvinaria, Ovatus, Parthenolecanium, Planococcus and Pseudococcus (La Notte et al., 1997;
Garau et al., 1995; Engelbrecht and Kasdorf, 1987; Rosciglione et al., 1983). Simultaneous
transmission of vitiviruses and GLRaVs has been documented. A study by Hommay et al. (2008)
identified the simultaneous transmission of GVA and Grapevine leafroll-associated virus-1
(GLRaV-1) through the scale insect Parthenolecanium corni to Vitis vinifera. This supports the
notion of transmission interaction between distinctive viruses. Le Maguet et al. (2012) supported
this concept by identifying Phenacoccus aceris as an insect vector for GVA and GVB and the
Ampelovirus genus. Vitiviruses are common in GLD symptomatic grapevines (Chapter 3 of this
thesis); however, their contribution, if any, towards the disease is not well documented or
understood. As GLD is considered the most economically devastating grapevine virus disease, it is
necessary to identify and understand the relationships between each infectious agent (Maree et al.,
2013).
NGS provides an accurate and sensitive approach to identify known and novel viruses in diseased
plants. With the application of bioinformatics, NGS has been used in the discovery of new genetic
variants (Pabinger et al., 2013; Kumar et al., 2012; Marroni et al., 2012; Deschamps and Campbell,
2009); however, it is prone to errors and requires validation. Direct Sanger sequencing identifies
Stellenbosch University https://scholar.sun.ac.za

!
! 74!
long adjacent DNA sequences using sequence specific primers and is an efficient tool in the
validation of novel virus variants detected through NGS (Park et al., 2014).
Little is known about the effect that members of the genus Vitivirus have on GLD. Associations
between vitiviruses and other grapevine viruses have been reported (La Maguet et al., 2012;
Hommay et al., 2008) and found to occur commonly in GLD symptomatic grapevines (Chapter 3 of
this thesis). Currently, one complete GVF genome has been reported (Al Rwahnih et al., 2012). The
following discussion reports on the first discovery of a GVF isolate in South Africa with the use of
NGS and the validation of the whole genome with conventional Sanger sequencing.
5.2. Materials and Methods
5.2.1. Plant material
A total of 15.9% of the screened plants tested positive for GVF in the survey discussed in Chapter 3
(Table 3.4). Of the 17 deep sequenced samples, discussed in Chapter 4, 11 showed reads mapping
to GVF isolate AUD46129 (JX105428.1) (Table 4.3). Sample V5 (sample number 15) (Table 4.1)
was selected for subsequent analysis based on the quantity of read data produced and was attained
from the cultivar Chenin blanc in Vredendal, in the Western Cape province, South Africa.
5.2.2. Next-generation sequencing and post-sequencing analysis
Double-stranded RNA (dsRNA) was extracted from 17 grapevine samples and sent for library
preparation (Adapted Illumina TruSeq RNA sample preparation protocol) and subjected to next-
generation sequencing using either an Illumina HiSeq 2500 or MiSeq platform (Agricultural
Research Council Biotechnology Platform, Onderstepoort, RSA). The subsequent process of
trimming and filtering to increase the quality of short read datasets is explained in Chapter 4. Reads
were mapped to the whole genome sequence of GVF isolate AUD46129 (JX105428.1), using CLC
Genomics Workbench 7 (CLC Bio). Mapping parameters included no masking of the reference
genome, a global alignment with default settings (mismatch cost: 2; insertion cost: 3; deletion cost:
3; length fraction: 0.7; similarity fraction: 0.7) and random mapping of non-specific matches. A
flow diagram illustrating the processing of NGS data can be seen in Figure 4.1. To determine the
variability between GVF sequences generated per sample, read datasets were mapped to GVF
isolate AUD46129 and consensus sequences extracted with low coverage regions filled with ‘N’
ambiguity symbols. Conflicts were resolved by voting for the best nucleotides, using quality scores.
Sample V5 was selected for further analysis based on the quality and variability of sequence data
generated. The consensus sequence (draft sequence) from the V5 reads mapping to GVF isolate
Stellenbosch University https://scholar.sun.ac.za

!
! 75!
AUD46129 (JX105428.1) was used to create a full-length sequence on which 14 primer sets were
designed, using Oligo Explorer software 1.1.2, to produce 15 overlapping amplicons for direct
Sanger sequencing (Table 5.3).
5.2.3. Total RNA extraction and RT-PCR
A positive control for GVF was obtained from a collection at ARC-Plant Protection Research
Institute in Pretoria, South Africa. A total of 200 mg of each sample was pulverized with liquid
nitrogen using mortar and pestle and the total RNA extracted using an adapted CTAB (2% [w/v]
CTAB, 2.5% [w/v] PVP-40, 100 mM Tris-HCL [pH8], 2 M NaCl, 25 mM EDTA [pH8] and 3% β-
mercaptoethanol) method (White et al., 2008). Complementary DNA (cDNA) was synthesised by
adding 200 ng of total RNA of each sample to 0.3 µl of random hexamers (Promega) and
incubating at 65°C for 5 minutes before placing on ice for 2 minutes to complete the primer
annealing reaction. A mixture containing 1X AMV RT Buffer (Thermo Scientific), 5 U AMV
reverse transcriptase (Thermo Scientific), 10 mM dNTPs (Thermo Scientific) and dH2O was then
added to the 5 µl primer annealing reaction and incubated for 60 minutes at 48°C to produce cDNA.
A PCR mixture containing 1X KAPA Taq buffer A (KAPA Biosystems), 10 mM dNTPs (Thermo
Scientific), 20 mM forward primer (Integrated DNA Technologies), 20 mM reverse primer
(Integrated DNA Technologies), 2 µl 5X cresol, 1 U KAPA Taq DNA polymerase (KAPA
Biosystems), 2 µl cDNA and dH2O was used to amplify each of the GVF sequence fragments. The
primer pairs had varying PCR cycle conditions (Table 5.2), all included an initial denaturation step
at 94°C for 3 minutes and a final extension step at 72°C for 7 minutes.
Stellenbosch University https://scholar.sun.ac.za

!
! 76!
Table 5.2: PCR primers used for the amplification of the complete genome of GVF isolate V5; included are the primer names, primer sequences (5’ to 3’ orientation), the PCR product length with each primer used, primer lengths and melting temperatures for each of the primers.
Table 5.3: PCR cycle conditions for each of the primary primer pairs used in the amplification of the complete GVF isolate V5 genome.
Primer Number: Primer Names: Sequence (5'-3'): Primer Length (bp): Amplicon Size (bp): Tm (°C):1 GVF_F_27-929 CTA TAC GTG CAC AAA ACC TC 20 55.72 GVF_R_27-929 TCC TCC GTG ATG GTA GAA C 19 58.43 GVF_F_757-1755 TGG TAC CCT GAC GGA AAA G 19 60.94 GVF_R_757-1755 CAT TGC TCG CTC ATC TGT C 19 60.55 GVF_F_1517-2426 TAG CAC CGA TCA CGA GGA TTC 21 64.76 GVF_R_1517-2426 GCT CTG TTT GCC TGG ATA CTC 21 61.27 GVF_F_2801-3738 AAG GTC ATA CGG GTA TTC TGC 21 60.28 GVF_R_2801-3738 CTC TTC ATA CTC CTC GGT GTT GT 23 62.39 GVF_F_3514-4468 GTA ATC GTG GCA TTT ACT CG 20 58.1
10 GVF_R_3514-4468 GCT CCC TCA ACT TTC TCT C 19 56.411 GVF_F_4243-5118 AAG AGG CTG AAC AAA AGT GC 20 59.512 GVF_R_4243-5118 CTG GGC GTC AAT GTC TAT G 19 60.113 GVF_F_4818-5663 CTT TGC TGG GGA TGA TAT GTA CG 23 64.714 GVF_R_4818-5663 CCT TCC TTA CTC ACC ACG ATT G 22 6315 GVF_F_5400-6221 GTT GGG AGT GGA GGA TCT GTA C 22 62.116 GVF_R_5400-6221 TCA GGT CGG CAG TGG ATA TG 20 64.417 GVF_F_6133-6944 CGT GAT TGG GAG TAT GGT TG 20 61.218 GVF_R_6133-6944 CTG CGG TTC TTT ATT GCC 18 59.219 GVF_F_5965-6946 TGT GGA GAT GGA GAT AAT GGA C 22 61.120 GVF_R_5965-6946 ACC TGC GGT TCT TTA TTG CC 20 63.521 GVF_F_6713-7485 TAA GGT TAG GGG TGT AGA TGC 21 58.122 GVF_R_6713-7485 CAC GGG TCA TAT AAC TTC AG 20 55.523 GVF_F_803_1812 ACC CGT GGC TGC TAA CTA CAT C 22 64.724 GVF_R_803_1812 GAC CTC TGA CAC CCT TTC TTG C 22 64.625 GVF_F_2122_4296 AAA TGC TAT CTG CCT GGT TC 20 59.126 GVF_R_2122_4296 ATC GCT CCT TAT GTT GTG C 19 58.727 GVF-5'_END GAA AAA TTG ATT TAG TTT CCG AC 23 400 48.828 GVF-3'_END AAC AGG GGG TAC ACC TG 17 809 54.0
875
Terminal Primers
Primer Pairs
954
937
909
998
902
2174
845
821
811
981
772
1009
Temp. (°C): Duration (sec): Temp. (°C): Duration (sec): Temp. (°C): Duration (sec): Temp. (°C): Duration (sec): Temp. (°C): Duration (sec):GVF_F_27-929GVF_R_27-929GVF_F_757-1755GVF_R_757-1755GVF_F_1517-2426GVF_R_1517-2426GVF_F_2801-3738GVF_R_2801-3738GVF_F_3514-4468GVF_R_3514-4468GVF_F_4243-5118GVF_R_4243-5118GVF_F_4818-5663GVF_R_4818-5663GVF_F_5400-6221GVF_R_5400-6221GVF_F_6133-6944GVF_R_6133-6944GVF_F_5965-6946GVF_R_5965-6946GVF_F_6713-7485GVF_R_6713-7485GVF_F_803_1812GVF_R_803_1812GVF_F_2122_4296GVF_R_2122_4296GVF-5'_ENDGVF_R_27-929GVF_F_6713-7485GVF-3'_END
Primer Pair: Initial Denaturation: Denaturation: Annealing: Extension: Final Extension:Cycles:
55
55
120
60
50
60
50
50
55
55
60
60
55
60
55
50
50
56
60
54
58
58
72 42060
60
58
55
58
58
58
55
94 180 94 30 72 3530
Stellenbosch University https://scholar.sun.ac.za

!
! 77!
5.2.4. Sanger sequencing and amplicon assembly
Amplified PCR products were visualized under ultraviolet light, excised and purified using a
ZymocleanTM Gel DNA Recovery Kit protocol (Zymo research). Purified PCR products were then
sent to the Central Analytical Facilities (CAF), at Stellenbosch University, for direct Sanger
sequencing. Sequencing results were analyzed in CLC Main Workbench 6.8.4 (CLC Bio) and
evaluated for correct base calling before continuing with further analysis. Sequences showing clear
base calling were assembled to the GVF isolate V5 draft consensus genome, constructed in CLC
Genomics Workbench 7 (CLC Bio). Parameters of the assembly specified that the nucleotide
conflicts be resolved by voting based on quality and a minimum read length of 50 bp to be set for
assembly with low alignment stringency. The consensus sequence generated through the alignment
of PCR amplicons to the GVF isolate V5 draft genome was extracted and named GVF isolate V5
(KP114220).
5.2.5. Genetic variability
Read datasets for 17 samples (Table 4.1) were trimmed of low quality nucleotides and filtered of
low quality reads and host genomes. The reads from each dataset were mapped to GVF isolate V5
in CLC Genomics Workbench 7 (CLC Bio). Parameters specified that there should be no masking
of the reference genome; alignments were done globally with default settings and non-specific
matches be mapped randomly. Consensus sequences for each sample were extracted; regions with
low coverage were filled with ‘N’ ambiguity symbols and conflicts were resolved by voting based
on quality scores. Table 5.6 shows the alignment characteristics of the read datasets to GVF isolate
V5 and GVF isolate AUD46129. The completed genome sequence of GVF isolate V5 was
translated and uploaded into Open Reading Frame Finder (NCBI) to determine the location of and
proteins encoded by each of the ORFs present in the genome. The molecular weights of each ORF
were determined by taking the average calculation produced through four online websites
(encorbio.com/protocols/Prot-MW.htm; expasy.org/compute_pi; protcalc.sourceforge.net/;
bioinformatics.org/sms/prot-mw.html). ORFs from GVF isolate V5 and GVF isolate AUD46129
were compared through multiple alignments in CLC Main Workbench 6.8.4 (CLC Bio) on an
amino acid and nucleotide level. GVF partial sequences (Supplementary Table S.6), representing
the replicase gene of 34 isolates, were downloaded from GenBank and aligned to GVF isolate V5
using CLC Main Workbench 6.8.4 (CLC Bio), to determine the genetic variability between various
GVF isolates.
Stellenbosch University https://scholar.sun.ac.za

!
! 78!
5.3. Results and Discussion
5.3.1. Next-generation sequencing and sample selection
Double-stranded RNA was extracted from 17 GLD symptomatic grapevines (Table 4.1) and
sequenced on an Illumina sequencing platform (ARC-BP). Read datasets, for each sample, were
trimmed and filtered to improve the quality of the read data (Figure 4.1 and Figure 4.2) and mapped
to GVF isolate AUD46129 (JX105428.1). Of the 17 samples that had undergone NGS, 15 were
found to contain traces of GVF (Table 5.4). Samples 13 and 15 were found to contain the highest
number of reads mapping to GVF isolate AUD46129 with approximately 26 000 and 20 000 reads,
respectively. Furthermore, samples 13 and 15 were both found to cover an excess of 90% of the
GVF reference genome with an approximated average coverage of 4.5 times more than any other
sample (Table 5.4).
Consensus sequences were extracted from each mapping to give full draft genomes with low
coverage areas filled with ‘N’ ambiguity symbols. A multiple alignment of the extracted consensus
sequences revealed that samples 13 and 15 share 88.17% and 90.15% nucleotide identities to GVF
isolate AUD46129, respectively (Table 5.4).
Table 5.4: Mapping and alignment characteristics of NGS reads to reference genome GVF isolate AUD46129 (JX105428.1). Nucleotide and read count, mean read length, fraction of the reference covered and average coverage are displayed for read-mapping characteristics. Percentage identity, determined through multiple alignments, for each sample to GVF isolate AUD46129 is shown.
The fraction of the reference genome covered is proportional to the amount of data produced (read
count) (Table 5.4) and is an indication of GVF titre. The percentage identity of aligned consensus
sequences to GVF isolate AUD46129 is an indication of the variability of each sample to the
reference. Based on the values generated for fraction of reference covered and percentage identity
to reference genome (GVF isolate AUD46129), samples 13 and 15 were selected as the final
candidates in selecting a draft genome for further RT-PCR analysis. Sample 15 was selected as the
Alignment Characteristcs:Number: Name: Nucleotide Count: Read Count: Mean Read Length: Fraction of Ref Covered: Average Coverage: Identity (%):
1 1491 14132 273 51.77 0.5 1.81 73.722 271614 7354 140 52.53 0.44 0.97 74.903 383631 - - - - - -4 49STOK 315449 4766 66.19 0.48 41.79 87.325 BJ3 6680 128 52.19 0.32 0.86 76.356 BJ4 32230 464 69.46 0.28 4.23 80.577 GH23 516 6 86.00 0.03 0.06 87.608 GH24 11737 206 56.98 0.31 1.49 75.559 H35 1112 11 101.09 0.11 0.14 84.8110 H36 3072 48 64.00 0.27 0.40 78.0711 H38 3096 42 73.71 0.09 0.41 85.6912 V1 3962 55 72.04 0.13 0.51 85.9413 V3 1837700 26376 69.67 0.91 240.88 88.1714 V4R - - - - - -15 V5 1413208 20146 70.15 0.90 186.86 90.1516 V6 12051 194 62.12 0.49 1.56 71.1217 161514 27679 531 52.13 0.77 3.58 69.07
Sample: Mapping Characteristics:
Stellenbosch University https://scholar.sun.ac.za

!
! 79!
final sample for subsequent analysis based on a lower level of virus infection, which may
potentially assist in understanding the effects of GVF infection in grapevine.
5.3.2. RT-PCR and Sanger sequencing
In total, 28 primers (Table 5.3) were designed to cover the complete GVF isolate V5 NGS-
generated draft genome in 14 overlapping amplicons under varying PCR conditions (Table 5.2).
PCR primers were used in combination (Table 5.3) to amplify regions ranging between 772 and 2
174 nucleotides of the complete GVF genome. Additional primer combinations were used to
increase the coverage and accuracy of the sequences aligning to GVF isolate V5. In total 82
sequences were assembled to the GVF isolate V5 draft genome. The complete genome spanned 7
539 nucleotides with polyadenylation at the 3’-end that was determined with the 3’-end primer
(Table 5.3, primer number 28). The genome sequence was extracted and named GVF isolate V5
(KP114220).
5.3.3. Genetic variability
High-quality reads from 17 read datasets were mapped to GVF isolate V5 (Table 5.5). In total, 3.16
million nucleotides, amounting to 45 417 reads, were mapped to the GVF isolate V5 genome with a
27.8X average coverage. An average of 40.5% of the GVF isolate V5 genome was covered over the
15 samples that had between 67.66% and 100% nucleotide identities in multiple alignments created
with each consensus. Based on calculations of the quality and quantity of data produced, it is
evident that high levels of variation exist between GVF in samples. Reads from sample 13 covered
98% of the GVF isolate V5 genome and shared 86.92% nucleotide identity. Reference genome
GVF isolate AUD46129 (JX105428.1) covered the entire length of GVF isolate V5 and shared
88.96% nucleotide identity. In a multiple alignment of a 287 nucleotide region of the replicase gene
of 35 GVF representatives (Supplementary Table S.6), GVF isolates shared between 79.44% and
100% nucleotide identity and an average of 90.28% nucleotide identity to GVF isolate V5. In a
read-mapping comparison of consensus sequences created from GVF isolate V5 and AUD46129
(Table 5.6) it was determined that a greater number of total reads were mapped to GVF isolate
AUD46129, with a total of 53 386 reads compared to 45 416 reads mapping to GVF isolate V5. A
greater average percentage of the reference genome covered, across all GVF positive samples, was
seen with GVF isolate V5 with 40.46% of the reference covered (Table 5.6).
Stellenbosch University https://scholar.sun.ac.za

!
! 80!
Table 5.5: Comparison of the next-generation read mapping characteristics of each GVF positive sample to GVF isolate AUD46129 and GVF isolate V5. Outlined is the read count of mapped reads for each sample as well as the fraction of the GVF isolates covered.
Table 5.6: Mapping and alignment characteristics of NGS reads and GVF isolate AUD46129 to reference genome GVF isolate V5 (KP114220). Nucleotide and read count, mean read length, fraction of the reference covered and average coverage are displayed for read-mapping characteristics. Percentage identity and a calculated variation quality for each sample to GVF isolate V5 are outlined under alignment characteristics.
There is significant genetic variation between GVF isolates. GVF isolate V5 shares 88.96%
nucleotide identities to the sole complete genome reference on GenBank records (JX105428.1) and
87.94% nucleotide identity to the near complete GVF sequence generated for sample 13. In a
multiple alignment of partial replicase genes of 35 GVF representatives, between 77.94% and 100%
nucleotide identities were identified. The comparisons of consensus sequences generated through
GVF isolate V5 and GVF isolate AUD46129 (Table 5.6) further demonstrates the variation between
potential GVF isolates. The variable number of reads aligning to each genome and the fraction of
Number: Name: AUD46129 V5 AUD42169 V51 1491 273 389 50 552 271614 140 92 44 324 49STOK 4766 831 48 565 BJ3 128 108 32 296 BJ4 464 481 28 317 GH23 6 6 3 48 GH24 206 80 31 239 H35 11 5 11 710 H36 48 52 27 3011 H38 42 9 9 1212 V1 55 59 13 1413 V3 26376 22588 91 9815 V5 20146 20084 90 9816 V6 194 178 49 5017 161514 531 454 77 68
Sample: Fraction of Ref Covered:Read Count:
Alignment Characteristcs:Number: Name: Nucleotide Count: Read Count: Mean Read Length: Fraction of Ref Covered: Average Coverage: Identity (%):
1 1491 19772 389 50.83 0.55 2.5 71.532 271614 4955 92 53.86 0.32 0.64 73.743 383631 - - - - - -4 49STOK 55906 831 67.28 0.56 7.33 85.345 BJ3 5733 108 53.08 0.29 0.73 78.086 BJ4 33492 481 69.63 0.31 4.39 79.807 GH23 516 6 86 0.04 0.07 85.458 GH24 4531 80 56.64 0.23 0.59 76.789 H35 592 5 118.40 0.07 0.08 84.97
10 H36 3328 52 64.00 0.3 0.42 74.5511 H38 1256 9 139.56 0.12 0.17 84.7612 V1 4250 59 72.03 0.14 0.56 86.5113 V3 1573646 22588 69.67 0.98 208.2 86.9214 V4R - - - - - -15 V5 1412654 20084 70.34 0.98 187.19 10016 V6 11183 178 62.83 0.5 1.46 70.1417 161514 23842 454 52.52 0.68 3.09 71.31
JX105428 GVF isolate AUD46129 7551 1 7,551 1 1 88.96
Sample: Mapping Characteristics:
Stellenbosch University https://scholar.sun.ac.za

!
! 81!
reference covered indicates a high level of dissimilarity between GVF species in each sample.
Taking into account the quantity of data generated (read count), the greater percentage of reference
covered illustrates the similarity of the sample specific GVF isolate to each reference isolate. It is
evident that GVF isolate V5 is genetically variable from GVF isolate AUD46129, and that other
potential GVF isolates, located in South African vineyards, may have greater genetic variability to
known GVF isolates.
The complete genome sequence of GVF isolate V5 was translated and ORFs determined through
ORF Finder (NCBI). It was determined that GVF isolate V5 contains five ORFs that share a similar
genome organization to other Vitivirus species (du Preez et al., 2011). Through the comparison to
existing characterized genes, it was determined that ORF1 encoded a replicase gene that contains
methyltransferase, AlkB, Viral helicase and RNA-dependent RNA polymerase conserved domains.
ORFs 2 to 5 encoded a hypothetical hydrophobic protein, a viral movement protein, a coat protein
and RNA-binding protein domains, respectively. The average molecular weight, of four separate
calculations (Table 5.7), for each ORF was computed. ORF 1 to 5, of GVF isolate V5, shared
94.79%, 87.50%, 94.12%, 98.99% and 94.55% amino acid identity and 87.09%, 85.42%, 91.79%,
94.30% and 94.85% nucleotide identity to the GVF isolate AUD46129 ORFs, respectively. The
average amino acid similarity of all ORFs was calculated as 93.99%, indicating that ORFs within
GVF isolate are highly conserved, especially the viral coat protein encoded by ORF4.
A multiple alignment of the amino acids comprising the full replicase gene of Vitivirus
representatives confirmed the phylogenetic relationship between members of the Vitivirus genus
(Figure 5.2.B). Figure 5.2.B indicates the relationship between GVA and GVF, where their
evolutionary progress is more uniform to that of GVE and then GVB and GVD. This may be due to
the prevalence of these viruses in certain diseases and the association that vitiviruses may share
with one another during infection and transmission (La Maguet et al., 2012; Hommay et al., 2008).
Little is known about the etiology of GLD and other grapevines diseases. Further research of these
diseases will be beneficial in gaining knowledge into the physiology and progression of grapevine
infecting viruses.
Stellenbosch University https://scholar.sun.ac.za

!
! 82!
Figure 5.2: Schematic representations of the scaled size and organization of the GVF isolate V5 genome and the phylogenetic relationship shared between vitiviruses. A) Relative sizes drawn to scale, and protein domains encoded by ORFs present in the GVF isolate V5 genome. ORF1 encodes the conserved domains of methyltransferase (Met), a member of the Fe (II)-oxoglutarate-dependent dioxygenase superfamily (AlkB), RNA Helicase1 (Hel) and RNA-dependent RNA polymerase (RdRp). ORF2 to ORF5 encode a hypothetical protein (HP), movement protein (MP), coat protein (CP) and RNA-binding protein (RBP), respectively. B) Circular cladogram, of an unrooted tree of Vitiviruses using the neighbor-joining algorithm and a bootstrap replicate of 1000 for full length replicase genes, with the exception of the GVD representative. Values on branches represent bootstrap percentages.
Table 5.7: Molecular weights and amino acid numbers of the five open reading frames present in the GVF isolate V5 genome. Molecular weight was calculated as an average from calculations taken from four online calculators, namely: web.expasy.org/cgi-bin/compute_pi/pi_tool (1), bioinformatics.org/sms/prot_mw.html (2), encorbio.com/protocols/Prot-MW.htm (3) and protcalc.sourceforge.net/cgi-bin/protcalc (4).
5.4. Conclusion
In this chapter we report on the identification of a new GVF isolate, namely V5 (KP114220), found
in the Western Cape province, South Africa. The complete genome spans 7 539 nucleotides with
polyadenylation at the 3’-end. The genome shares 88.96% nucleotide similarity to existing
complete genome sequences in GenBank records and between 87.50% and 98.99% amino acid
1 2 3 4 Average:1 1727 197.05 197.07 197.05 197.05 197.062 160 17.80 17.80 17.80 17.80 17.803 272 30.33 30.33 30.33 30.33 30.334 199 21.71 21.71 21.71 21.71 21.715 110 12.47 12.48 12.49 12.47 12.48
Molecular Weights (kDa):ORF: Amino Acids:
kb
Stellenbosch University https://scholar.sun.ac.za

!
! 83!
identities in the five encoded protein domains. NGS was effective in initially detecting GVF within
sampled grapevines and in determining the prevalence and degree of infection within each sample.
Direct Sanger sequencing was used to finalize the genome by filling in gaps of missing read data
and to validate the sequences generated through NGS. Multiple alignments of replicase genes and
complete consensus sequences determined that a number of genetically variable GVF isolates exist
in South African vineyards and vineyards around the world. Further research in the detection and
characterization of GVF and other vitivirus species may aid in understanding the effect that these
viruses play in grapevine diseases. Further research may assist in establishing an association
between different virus types that could potentially reduce the negative effects of grapevine diseases.
5.5. References
Adams, M.J., Accotto, G.P., Agranovsky, A.A., Bar-Joseph, M., Boscia D, et al. 2005. Family Flexiviridae. In: Fauquet, C.M., Mayo, M.A., Maniloff, J., Desselberger, U., Ball, L.A., (eds.), Virus Taxonomy: Eighth Report of the International Committee on Taxonomy of Viruses. Elsevier-Academic Press, San Diego. 1089-1124.
Al Rwahnih, M., Sudarshana, M.R., Uyemoto, J.K., Rowhani, A. 2012. Complete Genome Sequence of a Novel Vitivirus Isolate from Grapevine. Journal of Virology. 86: 9545.
Bem, F., and Murant, A.F. 1979. Host range, purification and serolog- ical properties of heracleum latent virus. Annals of Applied Biology. 92: 243-256.
Blouin, A.G., Chavan, R.R., Pearson, M.N., MacDiamid, R.M., Cohen, D. 2012. Detection and characterization of two novel vitiviruses infecting Actinidia. Archives of Virology. 157: 713-722.
Boccardo, G., and d’Aquilio, M. 1981. The protein and nucleic acid of a Closterovirus isolated from a grapevine with stem-pitting symptoms. Journal of General Virology. 53: 179-182.
Conti, M., Milne, R.G., Luisoni, E., Boccardo, G. 1980. A clostero-virus from a stem pitting-diseased grapevine. Phytopathology. 70: 394-399.
Deschamps, S., and Campbell, M.A. 2009. Utilization of next-generation sequencing platforms in plant genomics and genetic variant discovery. Molecular breeding. 25: 553-570.
du Preez, J., Stephan, D., Mawassi, M., Burger, J.T. 2011. The grapevine-infecting vitiviruses, with particular reference to grapevine virus A. Archives of Virology. 156: 1495-1503.
Engelbrecht, D.J., and Kasdorf, G.G.F. 1987. Occurrence and transmission of GVA in South African grapevines. South African Journal of Enology and Viticulture. 8: 23-29.
Garau, R., Prota, V.A., Boscia, D., Fiori, M., Prota, U. 1995. Pseudococcus affinis Mask., a new vector of trichovirus A and B. Vitis. 34: 67-68.
Goszczynski, D.E., Kasdorf, G.G.F., Pietersen, G. 1996. Western blot reveals that grapevine virus A and B are serologically related. Journal of Phytopathology. 144: 581-583.
Hommay, G., Komar, V., Lemaire, O., Herrbach, E. 2008. Grapevine virus A transmission by larvae of Parthenolecanium corni. European Journal of Plant Pathology. 121: 185-188. doi: 10.1007/s10658-007-9244-3.
Kumar, S., Banks, T.W., Cloutier, S. 2012. SNP discovery through next-generation sequencing and its applications. International journal of plant genomics. 2012: 831460. doi: 10.1155/2012/831460.
Stellenbosch University https://scholar.sun.ac.za

!
! 84!
La Notte, P., Buzkan, N., Choueiri, E., Minafra, A., Martelli, G.P. 1997. Acquisition and transmission of Grapevine virus A by the mealybug. Pseudococcus longispinus. Journal of Plant Pathology. 78: 79-85.
Le Maguet, J., Beuve, M., Herrbach, E., Lemaire, O. 2012. Transmission of six ampeloviruses and two vitiviruses to grapevine by Phenacoccus aceris. Phytopathology. 102: 717-723.
Maree, H.J. Almeida, R.P.P. Bester, R, Chooi, K.M., Cohen, D., Dolja, V.V., Fuchs, M.F., Golino, D.A., Jooste, A.E.C., Martelli, G.P., Naidu, R.A., Rowhani, A., Saldarelli P., Burger, J.T. 2013. Grapevine leafroll associated virus 3. Frontiers in Microbiology. 4:82. doi: 10.3389/fmicb.2013.00082.
Marroni, F., Pinosio, S., Morgante, M. 2012. The quest for rare variants: Pooled multiplexed next generation sequencing in plants. Frontiers in plant science. 3: 133. doi: 10.3389/fpls.2012.00133.
Martelli, G.P. 1993. Rugose wood complex. In: Martelli, G.P. (eds.), Food and Agriculture Organization of the United Nations. Handbook for Detection and Diagnosis, Rome. 1993: 45-54.
Martelli, G.P., Adams, M.J., Kreuze, J.F, Dolja, V.V. 2007. Family Flexiviridae: a case of study in virion and genome plasticity. Annual Review of Phytopathology. 45: 73-100. doi:10.1146/annurev.phyto.45.062806.094401.
Martelli, G.P., Minafra, A., Saldarelli, P. 2011. Virus particle mounted in uranyl acetate. Length of bar (nm): 100 [Grapevine virus A]. The Springer Index of Viruses. Second Edition: 551-552.
Nakaune, R., Toda, S., Mochizuki, M., Nakano, M. 2008. Identification and characterization of a new vitivirus from grapevine. Archives of Virology. 153: 1827-1832.
Pabinger, S., Dander, A., Fischer, M., Snajder, R., Sperk, M., Efremova, M., Krabichler, B., Speicher, M.R., Zschocke, J., Trajanoski, Z. 2013. A survey of tools for variant analysis of next-generation genome sequencing data. Briefings in Bioinformatics. 15: 256-278.
Park, M.H., Rhee, H., Park, J.H., Woo, H.M., Choi, B.O., Kim, B.Y., Chung, K.W., Cho, Y.B., Kim, H.J., Jung, J.W., Koo, S.K. 2014. Comprehensive analysis to improve the validation rate for single nucleotide varaints detected by next-generation sequencing. PloS ONE. 9: e86664.
Rosciglione, B., Castellano, M.A., Martelli, G.P., Savino, V., Cannizzaro, G. 1983. Mealybug transmission of GVA. Vitis. 22: 331-347.
Tzanetakis, I.E., Postman, J.D., Martin, R.R. 2007. Identification, detection and transmission of a new vitivirus from Mentha. Archives of Virology. 152: 2027-2033.
Weber, E., Golino, D.A., Rowhani, A. 2002. Laboratory testing for grapevine diseases. Practical Winery and Vineyard Journal. 22: 13-26.
White, E.J., Venter, M., Hiten, H.F., Burger, J.T. 2008. Modified Cetyltrimethylammonium bromide method improves robustness and versatility: The benchmark for plant RNA extraction. Biotechnology Journal. 3: 1424-1428.
5.6. Internet Sources
Calculate the molecular weight of a protein sequence. 2014. Encorbio. [Online]. Available: http://www.encorbio.com/protocols/Prot-MW.htm [2014, October 20].
Compute pI/Mw. 2014. ExPASy. [Online]. Available: http://web.expasy.org/compute_pi/ [2014, October 20].
Protein Calculator v3.4. 2013. Protein Calculator v3.4. [Online]. Available: http://protcalc.sourceforge.net/ [2014, October 20].
Protein Molecular Weight. 2000. The Sequence Manipulation Suite. [Online]. Available: http://bioinformatics.org/sms/prot_mw.html [2014, October 20].
Stellenbosch University https://scholar.sun.ac.za

!
! 85!
Chapter 6
Conclusion
6.1. Conclusion and future prospects
Grapevine-infecting viruses pose a great threat to the global viticulture industry. Grapevine leafroll
disease (GLD) is the most widespread of the grapevine diseases and is economically the most
devastating. Present research into GLD is mostly centered on epidemiology and the development of
viral diagnostic techniques. Viruses from the families Closteroviridae and Betaflexiviridae are
commonly detected in GLD vines, however, Grapevine leafroll-associated virus 3 (GLRaV-3) is
the primary contributing agent to the disease. Molecular techniques such as PCR (Mullis et al.,
1986) and Sanger sequencing (Sanger et al., 1977) function efficiently in detecting known viruses
but are time consuming and costly for large scale experiments. The development of next-generation
sequencing (NGS), in 2005, revolutionized molecular biology and viral diagnostics. It is capable of
producing large amounts of data in a relatively short period of time and is able to detect novel
viruses and variants of viruses. Metagenomics coupled with NGS has provided the ability to
identify the virome of an environmental sample, such as a grapevine. It also provides an unbiased
technique in identifying all dsRNA species, including those with low titre or novel. This research
study focused on identifying the viral populations in GLD vines through RT-PCR and NGS and
determining the efficiency of NGS as a diagnostic tool for plant viral diseases. The sequencing of a
South African isolate of Grapevine virus F (GVF) is also described.
A widespread survey of GLD-affected grapevines was performed in the Western Cape province,
South Africa. Virus specific primers were designed to screen 11 viruses using RT-PCR. GLRaV-3
variant groups were distinguished with high-resolution melt (HRM) curve analysis coupled with
real-time RT-PCR. Closteroviruses that were detected comprised of 41% of all identified viruses.
Viruses from the family Betaflexiviridae comprised the remaining 59% of detected viruses. The
most frequently identified viruses were from the genus Ampelovirus; GLRaV-3 variant group II
contributing 38.48% to the combined GLRaV-3 population and GLRaV-3 variant group VI
contributing 37.76%. No differences were evident in the number of viruses infecting red- and
white-fruited cultivars or in grapevines of varying age.
GLD-affected grapevines were selected based on symptomology; however, not all grapevines
displayed clear visual symptomology, particularly in certain white-fruited cultivars. A high
incidence of GLRaV-3 was detected throughout the sample set, confirming previous reports that
GLRaV-3 is the primary causative agent of GLD in South African vineyards (Pietersen, 2004).
Stellenbosch University https://scholar.sun.ac.za

!
! 86!
Further research on the viral complexes within GLD-affected grapevines is recommended,
especially in white-fruited cultivars where symptomology is masked in a majority of infected
grapevines.
Seventeen GLD-affected grapevines were selected for NGS, comprising seven red-, six white-
fruited cultivar and four rootstock plants. Either the Illumina MiSeq or Hiseq 2500 NGS platforms
were used and generated in excess of 190 million reads. After trimming and filtering for quality and
Vitis vinifera sequences, 52.8% of the total reads were assembled into contigs through de novo
assemblies and mapped to grapevine-infecting viruses and viroids. GLRaV-3 was the best
represented virus detected through de novo assemblies, comprising 97.5% of the analyzed contigs,
followed by Grapevine rupestris stem pitting-associated virus (GRSPaV) and Grapevine virus E
(GVE). GLRaV-3 variant group I, representing 39.3% of the total assembled contigs, was found to
be the best represented variant followed by GLRaV-3 variant group II viruses, representing 30.9%
of the total contigs analyzed. Read-mappings revealed similar results, where each NGS sample was
infected with GLRV-3 variant group II, confirming previous studies that indicated high occurrence
of GLRaV-3 variant group II in South African vineyards (Jooste et al., 2011; Coetzee et al., 2010;
Jooste et al., 2010). On average, four viruses were detected in each sample with rootstock vines and
white-fruited cultivars hosting larger populations of viruses compared to red-fruited cultivars. Two
red-fruited cultivar samples were identified with a low coverage of GLRaV-3, indicating that a low
titre of infection is adequate for GLD symptom expression. This study further confirms the
hypothesis that GLRaV-3 is the main causative agent of GLD and states that NGS functions as an
efficient tool in the detection of grapevine-infecting viruses.
A widespread survey detected Grapevine virus F (GVF) in 16% of the sampled grapevines. Further
studies identified GVF in 15 of 17 deep-sequenced samples through read-mapping to a GVF
reference (Chapter 5 of this thesis). One sample, namely V5, was selected for subsequent
sequencing based on the amount of data generated and the fraction of the reference covered. A draft
genome was created and primers designed to span the complete GVF genome. Through direct
sequencing the complete genome sequence was identified and validated. The GVF isolate V5
genome encoded five open reading frames (ORFs) that share a similar genome organization to other
vitiviruses. The complete genome spanned 7 539 nucleotides with polyadenyltation at the 3’ end
and shared 89.11% nucleotide identity to existing GVF genomes. A multiple alignment of partial
replicase genes of 35 GVF representatives revealed that isolates shared between 74.99% and 100%
nucleotide identity to GVF isolate V5. This is the first report of a complete GVF genome in South
African vineyards and the second globally. Further research into the latency of GVF in GLD-
affected vines and the potential association that GVF shares with other grapevine-infecting viruses
Stellenbosch University https://scholar.sun.ac.za

!
! 87!
needs to take place to fully understand the etiology of grapevine diseases and the role of GVF in
diseased vines.
This study furthered the understanding of GLD etiology and supports the hypothesis that GLRaV-3
is the primary causative agent of the disease. Furthermore, the complex of viruses affecting GLD
symptomatic grapevine was investigated and indicated that large populations of viruses exist within
GLD-affected vines. Their role in the onset and expression of GLD symptoms needs further
investigation. We found NGS to be an efficient tool in detecting various virus types and
determining the prevalence of viruses within each sample. Here we define our research through
expanding the knowledge of GLD etiology by investigating the populations of viruses in GLD-
affected grapevines and identifying a new isolate of GVF found in GLD-affected vines.
Future research should investigate the complex of viruses affecting GLD vines, particularly those in
white-fruited cultivars. Performing NGS on a larger sample size would be most beneficial in such
investigations. The role of latent viruses in disease association and the transmission of these viruses
across grapevine hosts would be of interest. Research into pathogen interactions should be
considered with regard to disease symptom expression and the reduction of the negative effects of
virus infection. Correct management of Vitis vinifera vineyards is important in maintaining virus
infection and helping to establish a sustainable virus population for future virus association and
evolution studies.
6.2. References
Coetzee, B., Freeborough, M.J., Maree, H.J., Celton, J., Rees, D.J., Burger, J.T. 2010. Deep sequencing analysis of viruses infecting grapevines: Virome of a vineyard. Virology. 400: 157-163.
Jooste, A.E.C., Maree, H.J., Bellstedt, D., Goszcynski, D.E., Petersen, G., Burger, J.T. 2010. Three genetic grapevine leafroll-associated virus 3 variants identified from South African show high variability in their 5’ UTR. Archives of Virology. 155: 1997-2006. doi.org/10.1007/s00705-010-0793-y.
Jooste, A.E.C., Pietersen, G., Burger, J.T. 2011. Distribution of grapevine leafroll-associated virus-3 variants in South African vineyards. European Journal of Plant Pathology. 131: 371-381.
Mullis, K., Faloona, F., Scharf, S., Saiki, R., Horn, G., Erlich, H. 1986. Specific enzymatic amplification of DNA in vitro: the polymerase chain reaction. Cold Spring Harbor Symposia Quantitative Biology. 51: 263-273.
Sanger, F., Nicklen, S., Coulson, A.R. 1977. DNA sequencing with chain-terminating inhibitors. Proceedings of the National Academy of Sciences, USA. 74: 5463-6467.
6.3. Internet Sources
Pietersen, G. 2004. Spread of grapevine leafroll disease in South Africa – A difficult, but not insurmountable problem. Wynboer-A Technical Guide for Wine Producers. [Online]. Available: http://www.wynboer.co.za/recentarticles/0406leaf.php3 [2014, July 26].
Stellenbosch University https://scholar.sun.ac.za

!
! 88!
Supplementary data
Table S.1: List of available bioinformatic tools with the corresponding compatible platform and Internet sources for additional information. Adapted from Zang et al. (2011).
Program Name: Platform: Website (URL):
De novo assembly
Abyss Illumina http://www.bcgsc.ca/platform/bioinfo/software/abyss
ALLPATHS Illumina http://www.broadinstitute.org/science/programs/genome-biology/crd
AMOScmp Roche http://sourceforge.net/projects/amos/files/
ARACHNE Roche http://www.broadinstitute.org/science/programs/genome-biology/crd
CAP3 Roche http://pbil.univ-lyon1.fr/cap3.php
Consensus/SeqCons
Roche http://www.seqan.de/downloads/projects.html
Curtain Illumina/Roche/ABI http://code.google.com/p/curtain/
Edena Illumina http://www.genomic.ch/edena
Euler-SR Illumina/Roche http://euler-assembler.ucsd.edu/portal/?q=team
FuzzyPath Illumina/Roche ftp://ftp.sanger.ac.uk/pub/zn1/fuzzypath/fuzzypath_v3.0.tgz
IDBA Illumina http://www.cs.hku.hk/∼alse/idba/
MIRA/MIRA3 Illumina/Roche http://chevreux.org/projects_mira.html
Newbler Roche roche-applied-science.com/
Phrap Illumina/Roche http://www.phrap.org/consed/consed.html#howToGet
RGA Illumina http://rga.cgrb.oregonstate.edu/
QSRA Illumina http://qsra.cgrb.oregonstate.edu/
SHARCGS Illumina http://sharcgs.molgen.mpg.de/
SHORTY ABI http://www.cs.sunysb.edu/∼skiena/shorty/
SOAPdenovo Illumina http://soap.genomics.org.cn
SOPRA Illumina/ABI http://www.physics.rutgers.edu/%7Eanirvans/SOPRA/
SR-ASM Roche http://bioserver.cs.put.poznan.pl/sr-asm-short-reads-assembly-algorithm
SSAKE Illumina/Roche http://www.bcgsc.ca/platform/bioinfo/software/ssake
Taipan Illumina http://sourceforge.net/projects/taipan/files/
VCAKE Illumina/Roche http://sourceforge.net/projects/vcake
Velvet Illumina/Roche/ABI http://www.ebi.ac.uk/%7Ezerbino/velvet
Stellenbosch University https://scholar.sun.ac.za

!
! 89!
Read-mapping
BFAST Illumina/ABI http://sourceforge.net/apps/mediawiki/bfast/index.php?title=Main_Page
Bowtie Illumina/Roche/ABI http://bowtie-bio.sourceforge.net
BWA Illumina/ABI http://bio-bwa.sourceforge.net/bwa.shtml
CoronaLite ABI http://solidsoftwaretools.com/gf/project/corona/
CABOG Roche/ABI http://wgs-assembler.sf.net
ELAND/ELAND2 Illumina/ABI http://www.illumina.com/
EULER Illumina http://euler-assembler.ucsd.edu/portal/
Exonerate Roche http://www.ebi.ac.uk/∼guy/exonerate
EMBF Illumina http://www.biomedcentral.com/1471-2105/10?issue=S1
GenomeMapper Illumina http://1001genomes.org/downloads/genomemapper.html
GMAP Illumina http://www.gene.com/share/gmap
gnumap Illumina http://dna.cs.byu.edu/gnumap/
ICON Illumina http://icorn.sourceforge.net/
Karma Illumina/ABI http://www.sph.umich.edu/csg/pha/karma/
LAST Illumina http://last.cbrc.jp/
LOCAS Illumina http://www-ab.informatik.uni-tuebingen.de/software/locas
Mapreads ABI http://solidsoftwaretools.com/gf/project/mapreads/
MAQ Illumina/ABI http://maq.sourceforge.net
MOM Illumina http://mom.csbc.vcu.edu/
Mosaik Illumina/Roche/ABI http://bioinformatics.bc.edu/marthlab/Mosaik
mrFAST/mrsFAST Illumina http://mrfast.sourceforge.net/
MUMer ABI http://mummer.sourceforge.net/
Nexalign Illumina http://genome.gsc.riken.jp/osc/english/dataresource/
Novocraft Illumina http://www.novocraft.com/
PerM Illumina/ABI http://code.google.com/p/perm/
RazerS Illumina/ABI http://www.seqan.de/projects/razers.html
RMAP Illumina http://rulai.cshl.edu/rmap
segemehl Illumina/Roche http://www.bioinf.uni-leipzig.de/Software/segemehl/
SeqCons Roche http://www.seqan.de/projects/seqcons.html
SeqMap Illumina http://biogibbs.stanford.edu/*jiangh/SeqMap/
Stellenbosch University https://scholar.sun.ac.za

!
! 90!
SHRiMP Illumina/Roche/ABI http://compbio.cs.toronto.edu/shrimp
Slider/SliderII Illumina http://www.bcgsc.ca/platform/bioinfo/software/slider
SOCS ABI http://solidsoftwaretools.com/gf/project/socs/
SOAP/SOAP2 Illumina/ABI http://soap.genomics.org.cn
SSAHA/SSAHA2 Illumina/Roche http://www.sanger.ac.uk/Software/analysis/SSAHA2
Stampy Illumina http://www.well.ox.ac.uk/∼marting/
SXOligoSearch Illumina http://synasite.mgrc.com.my:8080/sxog/NewSXOligoSearch.php
SHORE Illumina http://1001genomes.org/downloads/shore.html
Vmatch Illumina http://www.vmatch.de/
Visualization
FastQC Illumina/ABI http://www.bioinformatics.bbsrc.ac.uk/projects/fastqc/
PIQA Illumina http://bioinfo.uh.edu/PIQA
ShortRead Illumina/Roche http://bioconductor.org/packages/2.6/bioc/html/ShortRead.html
TileQC Illumina http://www.science.oregonstate.edu/∼dolanp/tileqc
!!!!!!!!!!!!!
Stellenbosch University https://scholar.sun.ac.za

!
! 91!
Table S.2: Vitis vinifera sequences retrieved from GenBank databases, used to filter host genome sequences from read datasets.
Reference Description: Accession Number:
Vitis vinifera chromosome 1 NC_012007
Vitis vinifera chromosome 2 NC_012008
Vitis vinifera chromosome 3 NC_012009
Vitis vinifera chromosome 4 NC_012010
Vitis vinifera chromosome 5 NC_012011
Vitis vinifera chromosome 6 NC_012012
Vitis vinifera chromosome 7 NC_012013
Vitis vinifera chromosome 8 NC_012014
Vitis vinifera chromosome 9 NC_012015
Vitis vinifera chromosome 10 NC_012016
Vitis vinifera chromosome 11 NC_012017
Vitis vinifera chromosome 12 NC_012018
Vitis vinifera chromosome 13 NC_012019
Vitis vinifera chromosome 14 NC_012020
Vitis vinifera chromosome 15 NC_012021
Vitis vinifera chromosome 16 NC_012022
Vitis vinifera chromosome 17 NC_012023
Vitis vinifera chromosome 18 NC_012024
Vitis vinifera chromosome 19 NC_012025
Vitis vinifera mitochondrion genome NC_012119
Vitis vinifera chloroplast genome NC_007957
!!!!!!
Stellenbosch University https://scholar.sun.ac.za
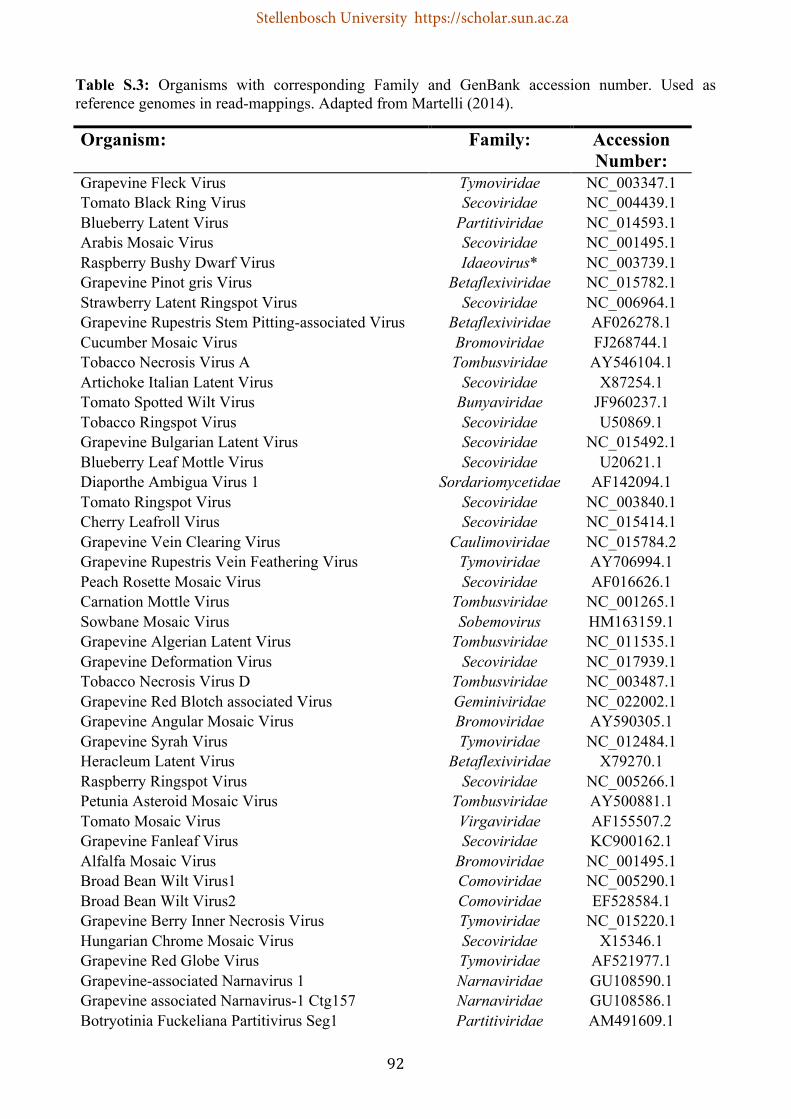
!
! 92!
Table S.3: Organisms with corresponding Family and GenBank accession number. Used as reference genomes in read-mappings. Adapted from Martelli (2014).
Organism: Family: Accession Number:
Grapevine Fleck Virus Tymoviridae NC_003347.1 Tomato Black Ring Virus Secoviridae NC_004439.1 Blueberry Latent Virus Partitiviridae NC_014593.1 Arabis Mosaic Virus Secoviridae NC_001495.1 Raspberry Bushy Dwarf Virus Idaeovirus* NC_003739.1 Grapevine Pinot gris Virus Betaflexiviridae NC_015782.1 Strawberry Latent Ringspot Virus Secoviridae NC_006964.1 Grapevine Rupestris Stem Pitting-associated Virus Betaflexiviridae AF026278.1 Cucumber Mosaic Virus Bromoviridae FJ268744.1 Tobacco Necrosis Virus A Tombusviridae AY546104.1 Artichoke Italian Latent Virus Secoviridae X87254.1 Tomato Spotted Wilt Virus Bunyaviridae JF960237.1 Tobacco Ringspot Virus Secoviridae U50869.1 Grapevine Bulgarian Latent Virus Secoviridae NC_015492.1 Blueberry Leaf Mottle Virus Secoviridae U20621.1 Diaporthe Ambigua Virus 1 Sordariomycetidae AF142094.1 Tomato Ringspot Virus Secoviridae NC_003840.1 Cherry Leafroll Virus Secoviridae NC_015414.1 Grapevine Vein Clearing Virus Caulimoviridae NC_015784.2 Grapevine Rupestris Vein Feathering Virus Tymoviridae AY706994.1 Peach Rosette Mosaic Virus Secoviridae AF016626.1 Carnation Mottle Virus Tombusviridae NC_001265.1 Sowbane Mosaic Virus Sobemovirus HM163159.1 Grapevine Algerian Latent Virus Tombusviridae NC_011535.1 Grapevine Deformation Virus Secoviridae NC_017939.1 Tobacco Necrosis Virus D Tombusviridae NC_003487.1 Grapevine Red Blotch associated Virus Geminiviridae NC_022002.1 Grapevine Angular Mosaic Virus Bromoviridae AY590305.1 Grapevine Syrah Virus Tymoviridae NC_012484.1 Heracleum Latent Virus Betaflexiviridae X79270.1 Raspberry Ringspot Virus Secoviridae NC_005266.1 Petunia Asteroid Mosaic Virus Tombusviridae AY500881.1 Tomato Mosaic Virus Virgaviridae AF155507.2 Grapevine Fanleaf Virus Secoviridae KC900162.1 Alfalfa Mosaic Virus Bromoviridae NC_001495.1 Broad Bean Wilt Virus1 Comoviridae NC_005290.1 Broad Bean Wilt Virus2 Comoviridae EF528584.1 Grapevine Berry Inner Necrosis Virus Tymoviridae NC_015220.1 Hungarian Chrome Mosaic Virus Secoviridae X15346.1 Grapevine Red Globe Virus Tymoviridae AF521977.1 Grapevine-associated Narnavirus 1 Narnaviridae GU108590.1 Grapevine associated Narnavirus-1 Ctg157 Narnaviridae GU108586.1 Botryotinia Fuckeliana Partitivirus Seg1 Partitiviridae AM491609.1
Stellenbosch University https://scholar.sun.ac.za

!
! 93!
Botryotinia Fuckeliana Partitivirus Seg2 Partitiviridae AM491610.1 Botryotinia Fuckeliana Partitivirus Seg3 Partitiviridae AM491611.1 Ophiostoma Quercus Partitivirus Partitiviridae AM111099.1 Australian Grapevine Viroid Pospiviroidae NC_003553.1 Grapevine Yellow Speckled Viroid 1 Pospiviroidae NC_001920.1 Grapevine Yellow Speckled Viroid 2 Pospiviroidae FJ597947.1 Citrus Exocortis Viroid Pospiviroidae S67442.1 Hop Stunt Viroid Pospiviroidae NC_001351.1 Grapevine Viroid Clone Syrah Pospiviroidae AF462154 Grapevine Viroid Clone Cari2 Pospiviroidae AF462155 Grapevine Endophyte Endornavirus Endornaviridae NC_019493.1 Chalara Endornavirus Endornaviridae GQ494150.1 Grapevine-associated Mycovirus 1 unclassified GU108587.1 Grapevine-associated Mycovirus 2 unclassified GU108600.1 Grapevine-associated Mycovirus 3 unclassified GU108601.1 Grapevine Virus A (92/778) Betaflexiviridae AF441234.2 Grapevine Virus A (JP98) Betaflexiviridae AF441235.2 Grapevine Virus A (P163) Betaflexiviridae DQ855088.1 Grapevine Virus F Betaflexiviridae JX105428 Grapevine Virus D Betaflexiviridae YO7764.1 Grapevine Virus E Betaflexiviridae NC_011106.1 Grapevine Virus E (SA94) Betaflexiviridae GU903012.1 Grapevine Virus B Betaflexiviridae NC_003602.1 Rosellinia Necatrix Megabirnavirus 1 Megabirnavirus AB512282.1 Rosellinia Necatrix Megabirnavirus 2 Megabirnavirus AB512283.1 Discula Destructiva Virus 1 seg 1 Partitiviridae AB316992.1 Discula Destructiva Virus 1 seg 2 Partitiviridae AF316993.1 Discula Destructiva Virus 1 seg 3 Partitiviridae AF316994.2 Discula Destructiva Virus 1 seg 4 Partitiviridae AF316995.1 Discula Destructiva Virus 2 seg 1 Partitiviridae AY033436.1 Discula Destructiva Virus 2 seg 2 Partitiviridae AY033437.1 Fragaria Chiloensis Cryptic Virus Partitiviridae NC_009519.1 Raphanus Sativus Cryptic Virus 3 seg 1 Partitiviridae FJ461349.1 Raphanus Sativus Cryptic Virus 3 seg 2 Partitiviridae FJ461350.1 Rosa Multiflora Cryptiv Virus seg 1 Partitiviridae EU024675.1 Rosa Multiflora Cryptiv Virus seg 2 Partitiviridae EU024676.1 Rosa Multiflora Cryptiv Virus seg 3 Partitiviridae EU024677.1 Vicia Cryptic Virus Partitiviridae EU371896.1 Black Raspberry Cryptic Virus (CRUB) Partitiviridae EU082132.1 Grapevine-associated Chrysovirus 1 Chyrsoviridae GU108588.1 Grapevine-associated Chrysovirus 2 Chyrsoviridae GU108589.1 Grapevine-associated Chrysovirus 3 Chyrsoviridae GU108596.1 Grapevine-associated Chrysovirus 4 Chyrsoviridae GU108597.1 Cryphonectria Nitschkei Chrysovirus 1 Chyrsoviridae GQ290652.1 Verticillium Chyrsovirus 1 seg 1 Chyrsoviridae HM004067.2 Verticillium Chyrsovirus 1 seg 2 Chyrsoviridae HM004068.2 Verticillium Chyrsovirus 1 seg 3 Chyrsoviridae HM004069.2 Verticillium Chyrsovirus 1 seg 4 Chyrsoviridae HM004070.2
Stellenbosch University https://scholar.sun.ac.za

!
! 94!
Aspergillus Fumigatus Chrysovirus seg 1 Chyrsoviridae FN178512.1 Aspergillus Fumigatus Chrysovirus seg 2 Chyrsoviridae FN178513.2 Aspergillus Fumigatus Chrysovirus seg 3 Chyrsoviridae FN178514.1 Aspergillus Fumigatus Chrysovirus seg 4 Chyrsoviridae FN178515.1 Fusarium Oxysporum Chyrsovirus 1 Chyrsoviridae EF152346.1 Aster Yellows Witches Broom Phytoplasma Acholeplamataceae NC_007716.1 Aster Yellows 16S rRNA Acholeplamataceae JQ675713.1 Maryland Aster Yellows Phytoplasma Acholeplamataceae DQ837760.1 Grapevine Leafroll-associated Virus 1 Closteroviridae NC_016509.1 Grapevine Leafroll-associated Virus 2 Closteroviridae DQ286725.2 Grapevine Leafroll-associated Virus 2 isolate 3138/07
Closteroviridae JX559644.1
Grapevine Leafroll-associated Virus 2 isolate 93/955 Closteroviridae AY881628.1 Grapevine Leafroll-associated Virus 3 isolate 621 Closteroviridae GQ352621.1 Grapevine Leafroll-associated Virus 3 isolate GP18 Closteroviridae EU259806.1 Grapevine Leafroll-associated Virus 3 isolate PL20 Closteroviridae GQ352633.1 Grapevine Leafroll-associated Virus 3 var. grp. IV Closteroviridae HQ401015.1 Grapevine Leafroll-associated Virus 3 isolate CI817 Closteroviridae EU344894.1 Grapevine Leafroll-associated Virus 3 var. grp. V Closteroviridae HQ401016.1 Grapevine Leafroll-associated Virus 3 isolate GH30 Closteroviridae JQ655296.1 Grapevine Leafroll-associated Virus 3 isolate NZ2 Closteroviridae JX220899.2 Grapevine Leafroll-associated Virus 3 isolate GH24 Closteroviridae KM058745 Grapevine Leafroll-associated Virus 4 Closteroviridae NC_016416.1 Grapevine Leafroll-associated Virus 5 Closteroviridae NC_016081.1 Grapevine Leafroll-associated Virus 6 Closteroviridae NC_016417.1 Grapevine Leafroll-associated Virus 7 Closteroviridae NC_016436.1 Grapevine Leafroll-associated Virus 9 Closteroviridae AY297819.1 Grapevine Chrome Mosaic Virus Secoviridae NC_003622.1 Grapevine Asteroid Mosaic-associated Virus Tymoviridae AJ249357.2 Grapevine Anatolian Ringspot Virus Secoviridae NC_018383.1 Tobacco Mosaic Virus Virgaviridae NC_001367.1 Penicillium Chrysogenum Virus seg 1 Chyrsoviridae NC_007539.1 Penicillium Chrysogenum Virus seg 2 Chyrsoviridae NC_007540.1 Penicillium Chrysogenum Virus seg 3 Chyrsoviridae NC_007541.1 Penicillium Chrysogenum Virus seg 4 Chyrsoviridae NC_007542.1
Stellenbosch University https://scholar.sun.ac.za

! 95!
Sample: Year Sampled: Cultivar: Area:
Number of Reads (X 1 000
000)
GL
RaV
-2 (
CG
)
GL
RaV
-2 (
3138)
GL
RaV
-2 (
93|9
55)
GL
RaV
-3_1
GL
RaV
-3_2
GL
RaV
-3_3
GL
RaV
-3_4
GL
RaV
-3_5
GL
RaV
-3_6 (
GH
30)
GL
RaV
-3_6 (
NZ
2)
GL
RaV
-3_6 (
GH
24)
GL
RaV
-4
GL
RaV
-6
GL
RaV
-9
GR
SP
aV
Grapevin
e F
leck V
irus
GV
A_1
GV
A_2
GV
A_3
GV
B
GV
E
GV
F
GE
EV
Hop S
tunt
Austr
ali
an G
rapevin
e
Grapevin
e Y
ell
ow
Speckle
d 1
Grapevin
e Y
ell
ow
Speckle
d 2
Grapevin
e V
iroid
Clo
ne C
ari2
Grapevin
e-a
ssocia
ted N
arnavir
us-1
Alf
alf
a M
osaic
Vir
us
Aste
r Y
ell
ow
s W
itchesB
room
Phyto
pla
sm
a
Aste
r Y
ell
ow
s 1
6S
Grapevin
e A
nato
lian R
ingspot
Vir
us
Grapevin
e B
ulg
aria
n L
ate
nt
Vir
us
Grapevin
e D
efo
rm
ati
on V
irus
Grapevin
e F
anle
af
Vir
us
Grapevin
e P
inot
Gris
Vir
us
Grapevin
e R
ed B
lotc
h-a
ssocia
ted V
irus
Grapevin
e S
yrah V
irus
Petu
nia
Aste
roid
Mosaic
Vir
us
Raspberry R
ingspot
Vir
us
Grapevin
e R
upestr
is V
ein
Feath
erin
g V
irus
Tobacco M
osaic
Vir
us
Tom
ato
Bla
ckrin
g V
irus
Tom
ato
Mosaic
Vir
us
Tom
ato
Spott
ed W
ilt
Vir
us
GH23 2012 Cabernet Sauvignon Stellenbosch 4.71GH24 2012 Cabernet Sauvignon Stellenbosch 2.40
38.36.31 2013 Carignan Malmesbury 18.60V6 2013 Merlot Vredendal 6.36
27.74.16 2013 Pinot Noir Hermanus 3.1910.15.14 2013 Shiraz Wolseley 6.73
H36 2012 Shiraz Rawsonville 0.951.49.1 2013 Chardonnay Malmesbury 5.71
V1 2013 Chardonnay Vredendal 17.64V3 2013 Chardonnay Vredendal 15.59
H38 2012 Chenin Blanc Rawsonville 2.35V5 2013 Chenin Blanc Vredendal 30.48
H35 2012 Semillion Stellenbosch 2.13V4R 2013 Ramsey Vredendal 11.99
49STOK 2013 Richter '99 Malmesbury 27.12BJ3 2013 Richter '99 Stellenbosch 8.91BJ4 2013 Richter '99 Stellenbosch 22.76
Table S.4: Fraction of the reference covered for each virus determined per sample through read-mapping. Viruses illustrated in red had a greater than 80% reference coverage, viruses represented in green had less that 10% coverage of the reference.
!!!!!!!!!!!!!!!!!! !
Stellenbosch University https://scholar.sun.ac.za

! 96!
Table S.5: List of chemicals used for dsRNA and total RNA extractions with corresponding solution components, concentrations, pH, molecular formula, supplier and catalogue number.
!
Solution: Components: Concentration: pH: Molecular Formula: Molecular Weight (g/mol): Supplier: Catalogue Number:Sodium Chloride 100 mM NaCl 58.44 Merck (Saarchem) 1.06404.0500
Trizma Base 50 mM C4H11NO3 121.14 Sigma-Aldrich SLBB0099VDisodium Salt Dihydrate 1 mM C10H14N2Na2O8.2H2O/ Na2EDTA 372.24 Merck (Saarchem) SAAR2236020EM
CTAB 2% C19H42BrN 364.46 Merck (Saarchem) 1569500EMPolyvinylpyrrolidone (PVP-40) 2.5% C6H9NO 111.14 Sigma-Aldrich BCBD7485V
Trizma Base 100 mM C4H11NO3 121.14 Sigma-Aldrich SLBB0099VSodium Chloride 2 M NaCl 58.44 Merck (Saarchem) 1.06404.0500
Disodium Salt Dihydrate 25 mM C10H14N2Na2O8.2H2O/ Na2EDTA 372.24 Merck (Saarchem) SAAR2236020EMTrizma Base 1 M C4H11NO3 121.14 Sigma-Aldrich SLBB0099V
Disodium Salt Dihydrate 0.5 M C10H14N2Na2O8.2H2O/ Na2EDTA 372.24 Merck (Saarchem) SAAR2236020EMTrizma Base 2 M C4H11NO3 121.14 Sigma-Aldrich SLBB0099V
Disodium Salt Dihydrate 50 mM C10H14N2Na2O8.2H2O/ Na2EDTA 372.24 Merck (Saarchem) SAAR2236020EMSodium Lauryl Sulphate (SDS) 10% 7.2 (CH3(CH2)10CH2OSO3) 288.38 Merck (Saarchem) SAAR5823610EM
Bentonite Montmorillonile 40 mg/ml - Sigma-Aldrich MKBF9623V2-Mercaptoethanol - C2H6OS 78.13 Sigma-Aldrich BCBF9538V
Sodium Acetate (NaOAc) 3 M 5.5 CH3COONa.3H2O 136.08 Merck (Saarchem) SAAR5821010EMChloroform - CHCl3 119.38 Merck (Saarchem) SAAR1595040LC
Phenol - C6H6O 94.11 Merck (Saarchem) SAAR4971000EMAbsolute Ethanol 96% CH3CH2OH 46.07 Merck (Saarchem) SAAR2233540LP
Cellulose Cellulose Powder MN2100 - - Macherey-Nagel 512142911Agarose - - Sigma-Aldrich SLBD2504V
Lithium Chloride Anhydrous 8 M LiCl 42.39 Merck (Saarchem) SAAR3945320EMHydrochloric Acid 32% HCl 36.46 Merck (Saarchem) SAAR3063040LPSodium Hydroxide 10 M NaOH 40 Merck (Saarchem) 5823200EMEthidium Bromide
Absolute Ethanol 16% CH3CH2OH 46.07 Merck (Saarchem) SAAR2233540LP10 X STE 1 X
Trizma Base 400 mM C4H11NO3 121.14Magnesium Sulphate Heptahydrate 100 mM MgSO4.7H2O 246.48
Calcium Chloride Dihydrate 10 mM CaCl2.2H2O 147.02Dnase RQ1 1 U/µl Promega M610ARnase T1 100 000 U/ml Roche 10109193001
Acetic Acid Glacial Assay MIN. 99.8 % CH3COOH 60.05 Kimix 2789 1/46
Promega M198ADnase Buffer
16% EtOH 1 X STESee Above *
Chemicals Table:
10 X STE Buffer*
CTAB Buffer
1 X TE Buffer
8.050 X TAE Buffer
6.8
8.0
7.6
Stellenbosch University https://scholar.sun.ac.za

! 97!
Table S.6: GVF isolate representatives of the replicase gene with corresponding lengths and GenBank accession numbers. Used for multiple alignments with GVF isolate V5.
!
Sequence Description: Length (bp):
Accession Number:
Grapevine virus F isolate 90/0246 replicase gene, partial cds 288 KF892543.1 Grapevine virus F isolate ARM 12 V25 replicase gene, partial cds 313 KF719053.1 Grapevine virus F isolate K4-77 replicase gene, partial cds 313 KF719052.1 Grapevine virus F isolate K10-13 replicase gene, partial cds 313 KF719051.1 Grapevine virus F isolate K9-21 replicase gene, partial cds 313 KF719050.1 Grapevine virus F isolate ARM 13 V49 replicase gene, partial cds 313 KF719049.1 Grapevine virus F isolate ARM 12 V22 replicase gene, partial cds 313 KF719048.1 Grapevine virus F isolate ARM 14 V22 replicase gene, partial cds 313 KF719047.1 Grapevine virus F isolate GLRV1-GH7 replicase gene, partial cds 313 KF719046.1 Grapevine virus F isolate K1-2 replicase gene, partial cds 313 KF719045.1 Grapevine virus F isolate K3-76 replicase gene, partial cds 313 KF719044.1 Grapevine virus F isolate K9-17 replicase gene, partial cds 313 KF719043.1 Grapevine virus F isolate K1-11 replicase gene, partial cds 313 KF719042.1 Grapevine virus F isolate K1-10 replicase gene, partial cds 313 KF719041.1 Grapevine virus F isolate K3-21 replicase gene, partial cds 313 KF719040.1 Grapevine virus F isolate GLRV2RG-GH7 replicase gene, partial 313 KF719039.1 Grapevine virus F isolate K15-3 replicase gene, partial cds 313 KF719038.1 Grapevine virus F isolate K9-70 replicase gene, partial cds 313 KF719037.1 Grapevine virus F isolate K4-1 replicase gene, partial cds 313 KF719036.1 Grapevine virus F isolate K3-35 replicase gene, partial cds 313 KF719035.1 Grapevine virus F isolate ARM 9 V7 replicase gene, partial cds 313 KF719034.1 Grapevine virus F isolate K2-36 replicase gene, partial cds 313 KF719033.1 Grapevine virus F isolate K14-5 replicase gene, partial cds 313 KF719032.1 Grapevine virus F isolate ARM 8 V43 replicase gene, partial cds 313 KF719031.1 Grapevine virus F isolate K7-30 replicase gene, partial cds 313 KF719030.1 Grapevine virus F isolate K7-67 replicase gene, partial cds 313 KF719028.1 Grapevine virus F isolate K11-42 replicase gene, partial cds 313 KF719029.1 Grapevine virus F isolate K3-72 replicase gene, partial cds 313 F719027.1 Grapevine virus F isolate K5-56 replicase gene, partial cds 313 KF719026.1 Grapevine virus F isolate ARM 9 V13 replicase gene, partial cds 313 KF719025.1 Grapevine virus F isolate ARM 8 V13 replicase gene, partial cds 313 KF719024.1 Grapevine virus F isolate ARM 14 V4 replicase gene, partial cds 313 KF719023.1 Grapevine virus F isolate K10-68 replicase gene, partial cds 313 KF719022.1 Grapevine virus F isolate AUD46129, complete genome 7551 JX105428.1
Stellenbosch University https://scholar.sun.ac.za

!
! 98!
Table S.7: Oligonucleotide adaptors for Truseq RNA and DNA Sample Prep Kits.
!Protocol S.1: Illumina TruSeq RNA Sample Preparation (Adapted protocol, truncated for dsRNA as input RNA)
DAY 1
1) Fragment dsRNA
• Pellet dsRNA at 12 000g for 60’• Wash pellet with 70% EtOH (be careful not to loose the pellet, it will be very small
~invisible)• Air dry pellet for 20’ @ RT• Add 19.5ul of EPF and gently pipette up and down 6 times. (EPF contains random hexamers
for RT priming and serves as 1st strand cDNA synthesis rxn buffer). (*EPF back to -20C)• Transfer the entire rxn to a PCR tube (beads included, according to HT protocol). Tubes are
still labeled “RBP”.Incubate RFP
• Tube to PCR machine (program 94C for 8min, 4C hold).(*The use of a PCR machine is essential as the primers need to bind - flash freezing will not
work for this step)
• When it reaches 4C, give it a quick flick down and proceed immediately to 1st strand cDNAsynthesis.
2) Synthesize First Strand cDNA
Preparation
• Remove from -20C: FSM (thaw at RT and then keep at 4C)• Remove from -20C: SuperScript II Reverse Transcriptase (SRT) (keep at 4C)• Add 50ul of SuperScript II Reverse Transcriptase to the FSM (First Strand Master Mix) tube.
Mix gently, but thoroughly, centrifuge briefly. Aliquot into 50ul stocks (6 rxns aliquots) andkeep at -20C. In future will only need to work with the aliquots.
TruSeq Adapters: Sequence (5' - 3'):Universal AATGATACGGCGACCACCGAGATCTACACTCTTTCCCTACACGACGCTCTTCCGATCTIndex 1 GATCGGAAGAGCACACGTCTGAACTCCAGTCACATCACGATCTCGTATGCCGTCTTCTGCTTGIndex 2 GATCGGAAGAGCACACGTCTGAACTCCAGTCACCGATGTATCTCGTATGCCGTCTTCTGCTTGIndex 3 GATCGGAAGAGCACACGTCTGAACTCCAGTCACTTAGGCATCTCGTATGCCGTCTTCTGCTTGIndex 4 GATCGGAAGAGCACACGTCTGAACTCCAGTCACTGACCAATCTCGTATGCCGTCTTCTGCTTGIndex 5 GATCGGAAGAGCACACGTCTGAACTCCAGTCACACAGTGATCTCGTATGCCGTCTTCTGCTTGIndex 6 GATCGGAAGAGCACACGTCTGAACTCCAGTCACGCCAATATCTCGTATGCCGTCTTCTGCTTGIndex 7 GATCGGAAGAGCACACGTCTGAACTCCAGTCACCAGATCATCTCGTATGCCGTCTTCTGCTTGIndex 8 GATCGGAAGAGCACACGTCTGAACTCCAGTCACACTTGAATCTCGTATGCCGTCTTCTGCTTGIndex 9 GATCGGAAGAGCACACGTCTGAACTCCAGTCACGATCAGATCTCGTATGCCGTCTTCTGCTTGIndex 10 GATCGGAAGAGCACACGTCTGAACTCCAGTCACTAGCTTATCTCGTATGCCGTCTTCTGCTTGIndex 11 GATCGGAAGAGCACACGTCTGAACTCCAGTCACGGCTACATCTCGTATGCCGTCTTCTGCTTGIndex 12 GATCGGAAGAGCACACGTCTGAACTCCAGTCACCTTGTAATCTCGTATGCCGTCTTCTGCTTGIndex 13 GATCGGAAGAGCACACGTCTGAACTCCAGTCACAGTCAACAATCTCGTATGCCGTCTTCTGCTTGIndex 14 GATCGGAAGAGCACACGTCTGAACTCCAGTCACAGTTCCGTATCTCGTATGCCGTCTTCTGCTTGIndex 15 GATCGGAAGAGCACACGTCTGAACTCCAGTCACATGTCAGAATCTCGTATGCCGTCTTCTGCTTGIndex 16 GATCGGAAGAGCACACGTCTGAACTCCAGTCACCCGTCCCGATCTCGTATGCCGTCTTCTGCTTGIndex 18 GATCGGAAGAGCACACGTCTGAACTCCAGTCACGTCCGCACATCTCGTATGCCGTCTTCTGCTTGIndex 19 GATCGGAAGAGCACACGTCTGAACTCCAGTCACGTGAAACGATCTCGTATGCCGTCTTCTGCTTGIndex 20 GATCGGAAGAGCACACGTCTGAACTCCAGTCACGTGGCCTTATCTCGTATGCCGTCTTCTGCTTGIndex 21 GATCGGAAGAGCACACGTCTGAACTCCAGTCACGTTTCGGAATCTCGTATGCCGTCTTCTGCTTGIndex 22 GATCGGAAGAGCACACGTCTGAACTCCAGTCACCGTACGTAATCTCGTATGCCGTCTTCTGCTTGIndex 23 GATCGGAAGAGCACACGTCTGAACTCCAGTCACGAGTGGATATCTCGTATGCCGTCTTCTGCTTGIndex 25 GATCGGAAGAGCACACGTCTGAACTCCAGTCACACTGATATATCTCGTATGCCGTCTTCTGCTTGIndex 27 GATCGGAAGAGCACACGTCTGAACTCCAGTCACATTCCTTTATCTCGTATGCCGTCTTCTGCTTG
Stellenbosch University https://scholar.sun.ac.za

!
! 99!
• PCR machine pre-programmed:o 25C for 10mino 42C for 50mino 70C for 15mino 4C hold
Make CDP
• No plate magnet – so stick the “RBP” PCR tube to the magnet with a piece of tape. RT(laminar flow), 5min.
• Without removing the tube from the magnet, carefully transfer (2x) 8,5ul of the supernatant(fragmented and primed mRNA) to a new PCR tube. Tubes are labeled “CDP”.
• Add 8ul of FSM-SRT mix and gently pipette up and down 6 times.(*FSM-SRT back to -20C)
Incubate 1 CDP
• Tube to PCR machine (program 25C for 10min, 42C for 50min, 70C for 15min, 4C hold).• When it reaches 4C, give it a quick flick down and proceed immediately to 2nd strand cDNA
synthesis.
3) Synthesize Second Strand cDNA
Preparation
• Remove from -20C: SSM and RSB (thaw at RT and then keep at 4C).• Remove from 4C: AMPure XP beads and Absolute EtOH (in a box labeled TruSeq RNAseq
4C box). These reagents are used at RT.• Freshly prepare 80% EtOH.• PCR machine (programmed 16C for 1h, 25C hold).
Add SSM
• Add 25ul of SSM to the “CDP” PCR tube and gently pipette up and down 6 times. (*SSMback to -20C)
Incubate 2 CDP
• Tube to PCR machine (program 16C for 1h, 25C hold)Clean up CDP
• AMPure XP beads and RSB must be at RT. Vortex AMPure XP beads well before use.• Transfer the entire rxn to a 1.5ml tube. Tubes are still labeled “CDP”.• Add 90ul of AMPure XP beads and gently pipette up and down 10 times.• RT (Hybex 25C), 15min.• Tube to magnet RT (laminar flow), 5min.• Remove and discard 135ul of the supernatant. Do not disturb the pellet. Some liquid
(±2,5ul) will remain in the tube.• Leave the tube on the magnetic stand during the 80% EtOH washes.• 1) Add 200ul of freshly prepare 80% EtOH without disturbing the beads. • 1) Incubate at RT (laminar flow) for 30 sec. • 1) Remove and discard all of the supernatant. Do not disturb the pellet.
Stellenbosch University https://scholar.sun.ac.za

!
! 100!
• 2) Add 200ul of freshly prepare 80% EtOH without disturbing the beads. • 2) Incubate at RT (laminar flow) for 30 sec. • 2) Remove and discard all of the supernatant. Do not disturb the pellet. Try to remove all of
the residual EtOH from the bottom of the tube, as it will contain impurities. • Leaving the tube on the magnet, incubate at RT (laminar flow), 15min.• The beads must be dry before continuing.• Remove the tube from the magnet.• Add 52,5ul of RSB and gently pipette up and down 10 times.• RT (Hybex 25C), 2min.• Tube to magnet RT (laminar flow), 5min.• Transfer 50ul of the supernatant to a new 1.5ml tube. Tubes are labeled “IMP”.
*SAFE STOPPING POINT* Store at -20C for up to 7 days.
DAY 2
4) Perform End Repair
Preparation
• If decide to run controls in the sample, prepare all of them before starting. Dilute 1ul (CTE,CTA, CTL) in 99ul of RSB, mix well and spin down. Refer to manual for details on thisprocedure.
• If decide not to use controls, replace with the same volume of RSB. In the protocol denotedhere the controls were excluded.
• Remove from -20C: ERP and RSB (thaw at RT and then keep at 4C).• Remove from -20C: The “IMP” tube (thaw at RT and then keep at 4C).• Remove from 4C: AMPure XP beads and Absolute EtOH (in a box labeled TruSeq RNAseq
4C box). These reagents are used at RT.• Freshly prepare 80% EtOH.• Heating block to 30C.• Hybex microsample incubator to 25C.
Make IMP
• Add 10ul of RSB (or diluted CTE control) to the “IMP” tube.• Add 40ul of ERP and gently pipette up and down 10 times.
(*ERP back to -20C)
Incubate 1 IMP
• Tube to 30C heating block, 30min.(*Change the heating block temperature to 37C for next step)
Clean Up IMP
• AMPure XP beads and RSB must be at RT. Vortex AMPure XP beads well before use.• Add 160ul of AMPure XP beads and gently pipette up and down 10 times.• RT (Hybex 25C), 15min.• Tube to magnet RT (lab bench), 5min.• Remove and discard 127,5ul (x2) of the supernatant. Do not disturb the pellet. Some liquid
(±2,5ul) will remain in the tube.• Leave the tube on the magnetic stand during the 80% EtOH washes.
Stellenbosch University https://scholar.sun.ac.za

!
! 101!
• 1) Add 200ul of freshly prepare 80% EtOH without disturbing the beads. • 1) Incubate at RT (lab bench) for 30 sec. • 1) Remove and discard all of the supernatant. Do not disturb the pellet. • 2) Add 200ul of freshly prepare 80% EtOH without disturbing the beads. • 2) Incubate at RT (lab bench) for 30 sec. • 2) Remove and discard all of the supernatant. Do not disturb the pellet. Try to remove all of
the residual EtOH from the bottom of the tube, as it will contain impurities. • Leaving the tube on the magnet, incubate at RT (lab bench), 15min.• The beads must be dry before continuing.• Remove the tube from the magnet.• Add 17,5ul of RSB and gently pipette up and down 10 times.• RT (Hybex 25C), 2min.• Tube to magnet RT (lab bench), 5min.• Transfer 15ul of the supernatant to a new 1.5ml tube. Tubes are labeled “ALP”.
*SAFE STOPPING POINT* Store at -20C for up to 7 days.
5) Adenylate 3’ Ends
Preparation
• Remove from -20C: ATL and RSB (thaw at RT and then keep at 4C).• If stored, remove from -20C: The “ALP” tube (thaw at RT and keep at 4C).• Heating block to 37C.• Hybex microsample incubator to 25C.
Add ATL
• Add 2,5ul of RSB (or diluted CTA control) to the “ALP” tube.• Adjust pipette to 30ul and gently pipette up and down 10 times.• Add 12,5ul of ATL. Do not mix.
(*ATL back to -20C)
Incubate 1 ALP
• Tube to 37C heating block, 30min.(*Change the heating block temperature to 30C for next step. NB it will be difficult to reach 30C in such a short time!)
• Remove the tube and proceed immediately to Ligate Adapters.
6) Ligate Adapters
Preparation
• Remove from -20C: STL and RNA Adapter Index tubes (AR001-AR012, depending on therequired index) (thaw at RT and then keep at 4C).
• Remove from 4C: AMPure XP beads and Absolute EtOH (in a box labeled TruSeq RNAseq4C box). These reagents are used at RT.
• Freshly prepare 80% EtOH.• Heating block to 30C.• NB: Leave LIG at -20C until it is used and then return immediately to -20C.
Add LIG
Stellenbosch University https://scholar.sun.ac.za

!
! 102!
• Add 2,5ul of LIG to the “ALP” tube.(*LIG immediately back to -20C)
• Add 2,5ul of RSB (or diluted CTL control).• Add 2,5ul of RNA Adapter Index to each sample as required.
(*RNA Adapter Index back to -20C)
• Adjust the pipette to 40ul and gently pipette up and down 10 times.Incubate 2 ALP
• Tube to 30C heating block, 10min.(*After this step the heating block can be switched off)
• To RT (lab bench).Add STL
• Add 5ul of STL and gently pipette up and down 10 times.(*STL back to -20C)
Clean Up ALP 1
• AMPure XP beads and RSB must be at RT. Vortex AMPure XP beads well before use.• Add 42ul of AMPure XP beads and gently pipette up and down 10 times.• RT (Hybex 25C), 15min.• Tube to magnet RT (lab bench), 5min.• Remove and discard 79,5ul of the supernatant. Do not disturb the pellet. Some liquid
(±2,5ul) will remain in the tube.• Leave the tube on the magnetic stand during the 80% EtOH washes.• 1) Add 200ul of freshly prepare 80% EtOH without disturbing the beads. • 1) Incubate at RT (lab bench) for 30 sec. • 1) Remove and discard all of the supernatant. Do not disturb the pellet. • 2) Add 200ul of freshly prepare 80% EtOH without disturbing the beads. • 2) Incubate at RT (lab bench) for 30 sec. • 2) Remove and discard all of the supernatant. Do not disturb the pellet. Try to remove all of
the residual EtOH from the bottom of the tube, as it will contain impurities. • Leaving the tube on the magnet, incubate at RT (lab bench), 15min.• The beads must be dry before continuing.• Remove the tube from the magnet.• Add 52,5ul of RSB and gently pipette up and down 10 times.• RT (Hybex 25C), 2min.• Tube to magnet RT (lab bench), 5min.• Transfer 50ul of the supernatant to a new 1.5ml tube. Tubes are labeled “CAP”.
Clean Up ALP 2
• Vortex AMPure XP beads well before use. Then add 50ul of AMPure XP beads and gentlypipette up and down 10 times.
• RT (Hybex 25C), 15min.• Tube to magnet RT (lab bench), 5min.• Remove and discard 95ul of the supernatant. Do not disturb the pellet. Some liquid (±2,5ul)
will remain in the tube.• Leave the tube on the magnetic stand during the 80% EtOH washes.• 1) Add 200ul of freshly prepare 80% EtOH without disturbing the beads.
Stellenbosch University https://scholar.sun.ac.za

!
! 103!
• 1) Incubate at RT (lab bench) for 30 sec. • 1) Remove and discard all of the supernatant. Do not disturb the pellet. • 2) Add 200ul of freshly prepare 80% EtOH without disturbing the beads. • 2) Incubate at RT (lab bench) for 30 sec. • 2) Remove and discard all of the supernatant. Do not disturb the pellet. Try to remove all of
the residual EtOH from the bottom of the tube, as it will contain impurities. • Leaving the tube on the magnet, incubate at RT (lab bench), 15min.• The beads must be dry before continuing.• Remove the tube from the magnet.• Add 22,5ul of RSB and gently pipette up and down 10 times.• RT (Hybex 25C), 2min.• Tube to magnet RT (lab bench), 5min.• Transfer 20ul of the supernatant to a new 0,2ml PCR tube. Tubes are labeled “PCR”.
*SAFE STOPPING POINT* Store at -20C for up to 7 days.
7) Enrich DNA Fragments
Preparation
• Remove from -20C: PMM and PPC (thaw at RT and then keep at 4C).• Remove from -20C: The “PCR” tube (thaw at RT and then keep at 4C).• Remove from 4C: AMPure XP beads and Absolute EtOH (in a box labeled TruSeq RNAseq
4C box). These reagents are used at RT.• Freshly prepare 80% EtOH.• Hybex microsample incubator to 25C.• PCR machine pre-programmed:
o 98C for 30seco 15 cycles of:
! 98C for 10sec ! 60C for 30sec ! 72C for 30sec
o 72C for 5mino 4C hold
Make PCR
• Add 5ul of PPC to the “PCR” tube.• Add 25ul of PMM. Adjust the pipette to 40ul and gently pipette up and down 10 times.
(*PPC and PMM back to -20C)Amp PCR
• Tube to PCR machine. (Pre-programmed: 98C for 30sec; 15 cycles of 98C for 10sec, 60Cfor 30sec, 72C for 30sec; 72C for 5min; 4C hold).
Clean Up PCR
• AMPure XP beads and RSB must be at RT. Vortex AMPure XP beads well before use.• Transfer the entire reaction to a 1.5ml tube.• Add 50ul of AMPure XP beads and gently pipette up and down 10 times.• RT (Hybex 25C), 15min.• Tube to magnet RT (lab bench), 5min.• Remove and discard 95ul of the supernatant. Do not disturb the pellet. Some liquid (±2,5ul)
will remain in the tube.
Stellenbosch University https://scholar.sun.ac.za

!
! 104!
• Leave the tube on the magnetic stand during the 80% EtOH washes.• 1) Add 200ul of freshly prepare 80% EtOH without disturbing the beads. • 1) Incubate at RT (lab bench) for 30 sec. • 1) Remove and discard all of the supernatant. Do not disturb the pellet. • 2) Add 200ul of freshly prepare 80% EtOH without disturbing the beads. • 2) Incubate at RT (lab bench) for 30 sec. • 2) Remove and discard all of the supernatant. Do not disturb the pellet. Try to remove all of
the residual EtOH from the bottom of the tube, as it will contain impurities. • Leaving the tube on the magnet, incubate at RT (lab bench), 15min.• The beads must be dry before continuing.• Remove the tube from the magnet.• Add 32,5ul of RSB and gently pipette up and down 10 times.• RT (Hybex 25C), 2min.• Tube to magnet RT (lab bench), 5min.• Transfer 30ul of the supernatant to a new 1.5ml tube. Tubes are labeled “TSP1”.• This is the final prepared library.
*SAFE STOPPING POINT* Store at -20C for up to 7 days.
Stellenbosch University https://scholar.sun.ac.za