Determination of Molecular Weight Distribution and ... - Nature
12
Polymer Journal, Vol. 26, No. 3, pp 303-314 (1994) Determination of Molecular Weight Distribution and Spectroscopic and Viscometric Properties of Sonicated Triple- Stranded Polyribonucleotides t Noriyuki OJIMA, Kiyohiro FuKUDOME, and Kiwamu YAMAOKA* Department of Materials Science, Faculty.of Science, Hiroshima University, 1-3-1 Kagamiyama, Higashi-Hiroshima 724, Japan (Received August 6, 1993) ABSTRACT: Two triple-stranded helices, Poly(G) · Poly(C) · Poly(C+) I and Poly(G) · Poly(G) · Poly(C) II, were prepared from 1 : 2 and 2: l mixtures of Poly(G) and Poly(C) in 0.4 M NaCl- acetate buffer at pH 5.5 and at 40°C. Only one triple helix, Poly(A) · Poly(U) · Poly(U) III, could be prepared from the mixture of Poly(A) and Poly(U) in 0.225 M NaCl-phosphate buffer at pH 6.8 and at 40°C. The ultrasonic irradiation (20 kHz, 200 W, 20 min) of 1-111 was carried out at 0°C under helium gas atmosphere to reduce molecular weights. Each sonicated sample could be fractionated to several fractions, in large quantities, by successive precipitation with acetone. The weight-average molecular weight Mw and degree of polydispersity Mw/M. were determined for each fraction by the GPC/LALLS method. The molecular weight distribution profile of each sample could be fitted by the logarithmic-normal distribution function. The intactness of the secondary structure of sonicated triple helices 1-111 was confirmed by the spectrophotometrically- determined melting temperature of each fraction. From the intrinsic viscosity vs. Mw relation, [11] =KMw", the exponent et was evaluated for each helix. The chain stiffness of the helical backbone was concluded to decrease in the order of III, II, and I. KEY WORDS Triple-Stranded Polyribonucleotides / Sonication / Precipi- tational Fractionation / Molecular Weight / Weight Distribution / GPC/LALLS / Intrinsic Viscosity / The structure and functions of nucleic acid triple-stranded helices in vivo are of biological interest. The solution conformation and the spectroscopic and hydrodynamic properties of these helices have hardly been clarified. The triple-stranded polynucleotides are also in- teresting as polyelectrolytes because of the high negative charge density of phosphate groups. Tight packing should also be expected for the triple helix, as compared with the counterpart double helix. A major drawback is in that a number of well-defined samples is needed for such physico-chemical studies and they must be available in large quantities. The molecu- lar weight of each sample should also be characterized. In addition, the molecular weight distribution should be narrow, so that a simple theoretical expression can be used in analysis of the experimental data. 1 - 3 For this purpose, the sonication and precipitational fractionation procedure of high molecular weight samples has been developed in this se- ries of work and successfully applied to DNA and other double-stranded polyribonucleotide helices. 4 - 7 The objectives of the present work are (1) t This paper is Part VI of "Ultrasonic Scission of Deoxyribonucleic Acid in Aqueous Solution." Part Vis ref 7. Part of this work was presented at the 42nd annual meeting of the Polymer Society, Japan, held at Kyoto, May 31-June 2, 1993. See Polym. Prepr. Jpn., 42, 1031 (1993). * To whom correspondence should be addressed. 303
-
Upload
khangminh22 -
Category
Documents
-
view
0 -
download
0
Transcript of Determination of Molecular Weight Distribution and ... - Nature
Polymer Journal, Vol. 26, No. 3, pp 303-314 (1994)
Determination of Molecular Weight Distribution and Spectroscopic and Viscometric Properties of Sonicated Triple-
Stranded Polyribonucleotides t
Noriyuki OJIMA, Kiyohiro FuKUDOME, and Kiwamu YAMAOKA*
Department of Materials Science, Faculty.of Science, Hiroshima University, 1-3-1 Kagamiyama, Higashi-Hiroshima 724, Japan
(Received August 6, 1993)
ABSTRACT: Two triple-stranded helices, Poly(G) · Poly(C) · Poly(C+) I and Poly(G) · Poly(G) · Poly(C) II, were prepared from 1 : 2 and 2: l mixtures of Poly(G) and Poly(C) in 0.4 M NaClacetate buffer at pH 5.5 and at 40°C. Only one triple helix, Poly(A) · Poly(U) · Poly(U) III, could be prepared from the mixture of Poly(A) and Poly(U) in 0.225 M NaCl-phosphate buffer at pH 6.8 and at 40°C. The ultrasonic irradiation (20 kHz, 200 W, 20 min) of 1-111 was carried out at 0°C under helium gas atmosphere to reduce molecular weights. Each sonicated sample could be fractionated to several fractions, in large quantities, by successive precipitation with acetone. The weight-average molecular weight Mw and degree of polydispersity Mw/M. were determined for each fraction by the GPC/LALLS method. The molecular weight distribution profile of each sample could be fitted by the logarithmic-normal distribution function. The intactness of the secondary structure of sonicated triple helices 1-111 was confirmed by the spectrophotometricallydetermined melting temperature of each fraction. From the intrinsic viscosity vs. Mw relation, [11] =KMw", the exponent et was evaluated for each helix. The chain stiffness of the helical backbone was concluded to decrease in the order of III, II, and I.
KEY WORDS Triple-Stranded Polyribonucleotides / Sonication / Precipi-tational Fractionation / Molecular Weight / Weight Distribution / GPC/LALLS / Intrinsic Viscosity /
The structure and functions of nucleic acid triple-stranded helices in vivo are of biological interest. The solution conformation and the spectroscopic and hydrodynamic properties of these helices have hardly been clarified. The triple-stranded polynucleotides are also interesting as polyelectrolytes because of the high negative charge density of phosphate groups. Tight packing should also be expected for the triple helix, as compared with the counterpart double helix. A major drawback is in that a number of well-defined samples is needed for such physico-chemical studies and they must
be available in large quantities. The molecular weight of each sample should also be characterized. In addition, the molecular weight distribution should be narrow, so that a simple theoretical expression can be used in analysis of the experimental data. 1 - 3 For this purpose, the sonication and precipitational fractionation procedure of high molecular weight samples has been developed in this series of work and successfully applied to DNA and other double-stranded polyribonucleotide helices. 4 - 7
The objectives of the present work are (1)
t This paper is Part VI of "Ultrasonic Scission of Deoxyribonucleic Acid in Aqueous Solution." Part Vis ref 7. Part of this work was presented at the 42nd annual meeting of the Polymer Society, Japan, held at Kyoto, May 31-June 2, 1993. See Polym. Prepr. Jpn., 42, 1031 (1993).
* To whom correspondence should be addressed.
303
N. OJIMA, K. FUKUD0ME, and K. y AMA0KA
to clarify the conditions for formation of triple-stranded helices between poly(guanylic acid) and poly(cytidylic acid) and also between poly(adenylic acid) and poly(uridylic acid) by the spectroscopic method, and (2) to apply the previously established sonicationfractionation technique for preparing welldefined fractions by successive precipitation. The GPC/LALLS (Gel-Permeation-Chromatography /Low-Angle-Laser-Light-Scattering) method will be utilized extensively in this work for determining the weight-average molecular weight and weight distribution of each fraction. Finally, the chain flexibility of triple helices are discussed on the basis of the relationship between intrinsic viscosity and weight-average molecular weight, and will be compared with the result obtained for the double-stranded helices in the preceding paper. 7
EXPERIMENTAL
Materials Poly(adenylic acid) (abbreviated as Poly(A)),
lot no. 101077, with a sedimentation coefficient Sfo,w of 8.0, poly(uridinylic acid) (Poly(U)), lot no. 401055, with an Sf0 ,V{ of 9.2 and poly(cytidylic acid) (Poly(C)), lot no. 301457, with an Sf o, w of 8. 7 were purchased from Yamasa Shoyu Co., Ltd. (Choshi, Japan). Poly(guanylic acid) (Poly(G)), lot no. 18F-4026, was purchased from Sigma Chemical Co. (U.S.A.). Other chemicals were all of reagent
grade. Each polymer was dissolved in 0.1 M NaCl solution and used for triplex formation.
Preparation of Triple-Stranded Helices Mixing Profile. In order to determine the
molar ratios of complexes to be formed in the Poly(G)/Poly(C) mixed system, changes in absorption spectra of the mixtures were measured at 40°C. A 1.0 M NaCl-acetate buffer solution was added to' the mixture, and the whole solution was incubated at 40°C for six days to yield a constant absorbance prior to absorption measurements (the conditions are given in Table I). The same procedure was applied to the Poly(A)/Poly(U) mixed system, where one-day incubation was sufficient. According to Job's continuous variation method, 8 the mole fraction of a polymer concentration was varied, while the total concentrations of two polymer components were kept constant. The absorption spectrum of each mixture was measured at 40°C on a Shimadzu Model UV-250 spectrophotometer. By these mixing studies, three triple-stranded helices were found to exist; Poly(G) · Poly(C) · Poly(C+) (abbreviated as G·C·C+), Poly(G)· Poly(G)· Poly(C) (abbreviated as G·G·C), and Poly(A) · Poly(U) · Poly(U) (abbreviated as A· U · U), as detailed in REsuL TS AND D1scuss10N.
Thermal Melting Curve. The thermal melting or strand separation of each triple helix was measured under the conditions cited m
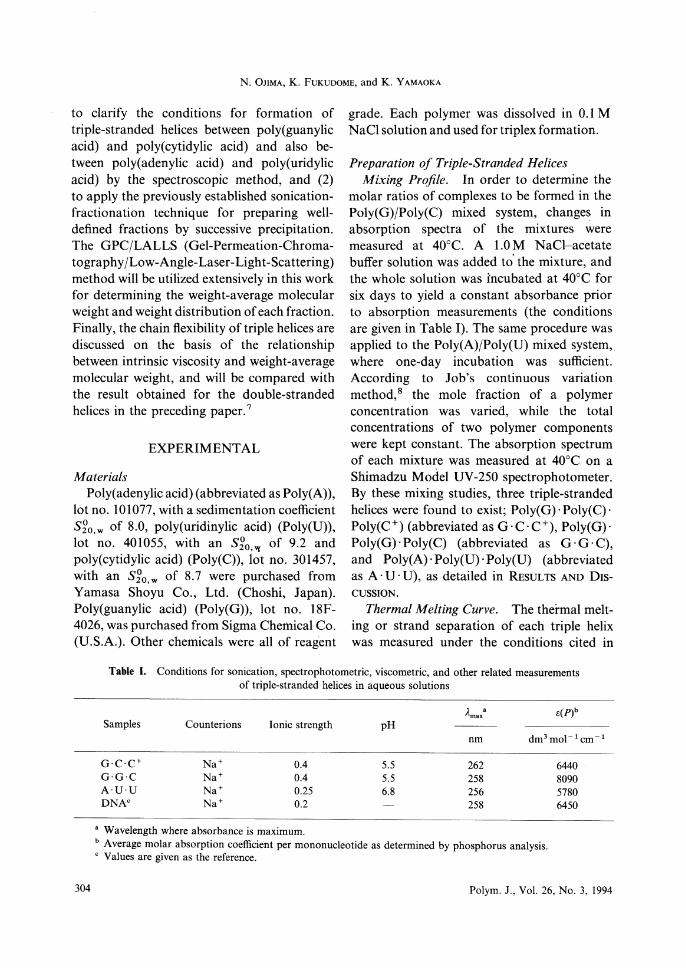
Table I. Conditions for sonication, spectrophotometric, viscometric, and other related measurements of triple-stranded helices in aqueous solutions
304
Amax a e(P)h Samples Counterions Ionic strength pH
nm dm3 mo1- 1 cm- 1
G·C·C+ Na+ 0.4 5.5 262 6440 G·G·C Na+ 0.4 5.5 258 8090 A·U·U Na+ 0.25 6.8 256 5780 DNAC Na+ 0.2 258 6450
• Wavelength where absorbance is maximum. b Average molar absorption coefficient per mononucleotide as determined by phosphorus analysis. c Values are given as the reference.
Polym. J., Vol. 26, No. 3, 1994
GPC/LALLS of Triple-Stranded Polyribonucleotides
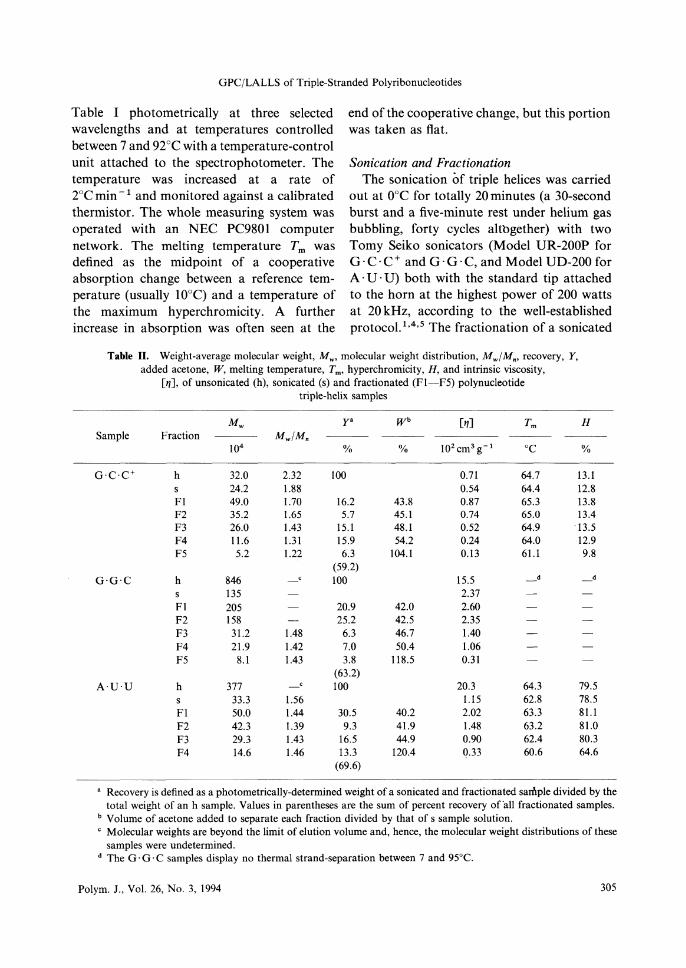
Table I photometrically at three selected wavelengths and at temperatures controlled between 7 and 92°C with a temperature-control unit attached to the spectrophotometer. The temperature was increased at a rate of 2°C min - 1 and monitored against a calibrated thermistor. The whole measuring system was operated with an NEC PC9801 computer network. The melting temperature Tm was defined as the midpoint of a cooperative absorption change between a reference temperature (usually 10°C) and a temperature of the maximum hyperchromicity. A further increase in absorption was often seen at the
end of the cooperative change, but this portion was taken as flat.
Sonication and Fractionation The sonication of triple helices was carried
out at 0°C for totally 20minutes (a 30-second burst and a five-minute rest under helium gas bubbling, forty cycles altbgether) with two Tomy Seiko sonicators (Model UR-200P for G·C-C+ and G·G·C, and Model UD-200 for A· U · U) both with the standard tip attached to the horn at the highest power of 200 watts at 20 kHz, according to the well-established protocol. 1 •4 •5 The fractionation of a sonicated
Table II. Weight-average molecular weight, Mw, molecular weight distribution, Mw/M., recovery, Y, added acetone, W, melting temperature, Tm, hyperchromicity, H, and intrinsic viscosity,
[17], ofunsonicated (h), sonicated (s) and fractionated (Fl-F5) polynucleotide triple-helix samples
MW y• wb [17] Tm H Sample Fraction Mw/M.
104 % % 102 cm3 g- 1 oc %
G-c-c+ h 32.0 2.32 100 0.71 64.7 13.1 s 24.2 1.88 0.54 64.4 12.8 Fl 49.0 1.70 16.2 43.8 0.87 65.3 13.8 F2 35.2 1.65 5.7 45.1 0.74 65.0 13.4 F3 26.0 1.43 15.1 48.1 0.52 64.9 13.5 F4 11.6 1.31 15.9 54.2 0.24 64.0 12.9 F5 5.2 1.22 6.3 104.1 0.13 61.1 9.8
(59.2) G·G·C h 846 C 100 15.5 _d _d
s 135 2.37 Fl 205 20.9 42.0 2.60 F2 158 25.2 42.5 2.35 F3 31.2 1.48 6.3 46.7 1.40 F4 21.9 1.42 7.0 50.4 1.06 F5 8.1 1.43 3.8 118.5 0.31
(63.2) A·U·U h 377 - C 100 20.3 64.3 79.5
s 33.3 1.56 1.15 62.8 78.5 Fl 50.0 1.44 30.5 40.2 2.02 63.3 81.1 F2 42.3 1.39 9.3 41.9 1.48 63.2 81.0 F3 29.3 1.43 16.5 44.9 0.90 62.4 80.3 F4 14.6 1.46 13.3 120.4 0.33 60.6 64.6
(69.6)
• Recovery is defined as a photometrically-determined weight of a sonicated and fractionated sample divided by the total weight of an h sample. Values in parentheses are the sum of percent recovery of'all fractionated samples.
b Volume of acetone added to separate each fraction divided by that of s sample solution. c Molecular weights are beyond the limit of elution volume and, hence, the molecular weight distributions of these
samples were undetermined. d The G · G · C samples display no thermal strand-separation between 7 and 95°C.
Polym. J., Vol. 26, No. 3, 1994 305
N. OJIMA, K. FUKUD0ME, and K. YAMAOKA
triplex sample was carried out at 20°C by the successive precipitational method with acetone as the precipitant. Each precipitate from the mother solution was gently warmed temporarily at 40°C to become clear, and this solution was kept overnight at 20°C, until the precipitate reappeared. It was then separated by centrifugation at 6000 rpm for 15 minutes. The conditions for sonication and fractionation are given in Table I. After excess acetone was removed, all fractions were frozen and stored in a freezer at - l 5°C. The recovery of these fractions from acetone precipitation is given in Table II. Determination of Absorption Coefficients of
Base-Triples In order to express the concentration of a
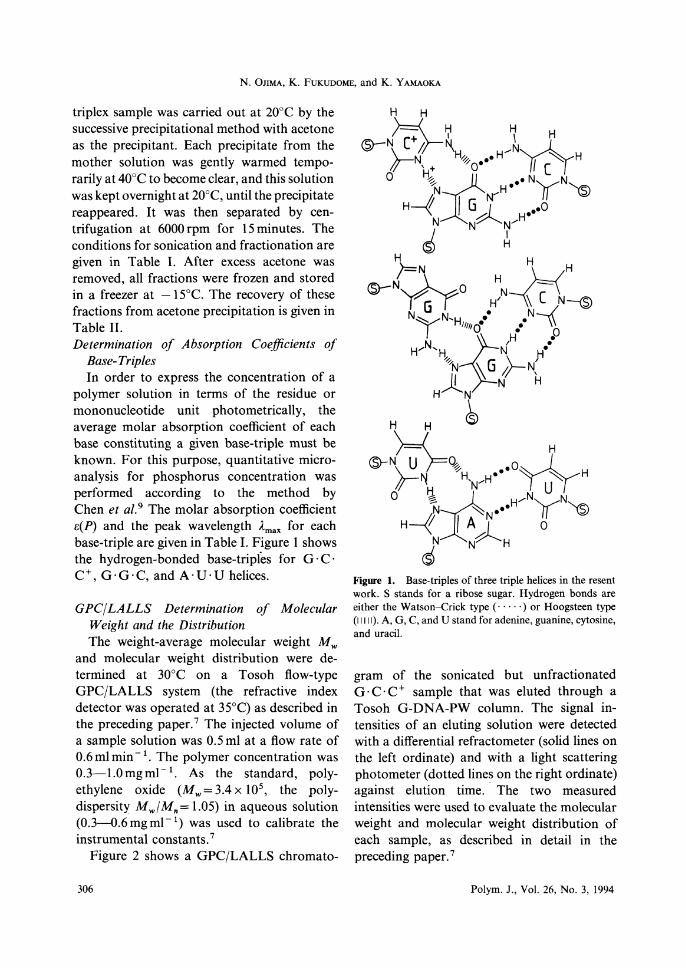
polymer solution in terms of the residue or mononucleotide unit photometrically, the average molar absorption coefficient of each base constituting a given base-triple must be known. For this purpose, quantitative microanalysis for phosphorus concentration was performed according to the method by Chen et al. 9 The molar absorption coefficient e(P) and the peak wavelength Amax for each base-triple are given in Table I. Figure 1 shows the hydrogen-bonded base-tripies for G · C · c+, G·G·C, and A·U·U helices.
GPC/LALLS Determination of Molecular Weight and the Distribution The weight-average molecular weight Mw
and molecular weight distribution were determined at 30°C on a Tosoh flow-type GPC/LALLS system (the refractive index detector was operated at 35°C) as described in the preceding paper. 7 The injected volume of a sample solution was 0.5 ml at a flow rate of 0.6 ml min - 1 . The polymer concentration was 0.3-1.0 mg ml - 1 . As the standard, polyethylene oxide (M w = 3.4 x 10⁵, the polydispersity Mw/Mn= 1.05) in aqueous solution (0.3-0.6 mg ml - 1) was used to calibrate the instrumental constants. 7
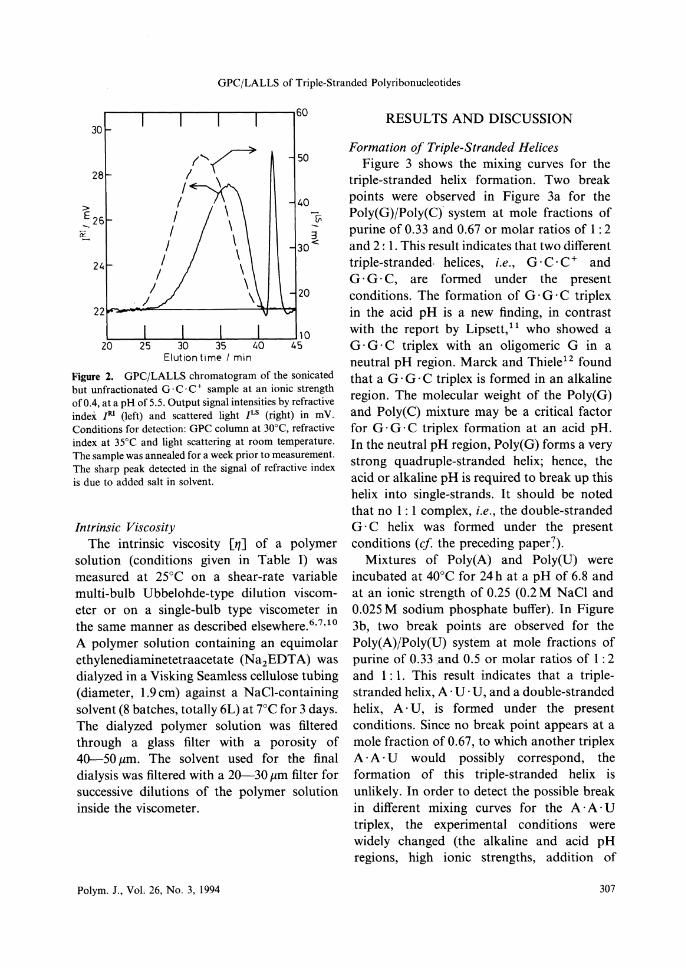
Figure 2 shows a GPC/LALLS chromato-
306
Figure 1. Base-triples of three triple helices in the resent work. S stands for a ribose sugar. Hydrogen bonds are either the Watson-Crick type ( · · · · ·) or Hoogsteen type (11111). A, G, C, and U stand for adenine, guanine, cytosine, and uracil.
gram of the sonicated but unfractionated G·C·C+ sample that was eluted through a Tosoh G-DNA-PW column. The signal intensities of an eluting solution were detected with a differential refractometer (solid lines on the left ordinate) and with a light scattering photometer (dotted lines on the right ordinate) against elution time. · The two measured intensities were used to evaluate the molecular weight and molecular weight distribution of each sample, as described in detail in the preceding paper. 7
Polym. J., Vol. 26, No. 3, 1994
GPC/LALLS of Triple-Stranded Polyribonucleotides
60
30
("< 50
28 I \ I
> I \
40
_: 26 I -[;;
I \ 3 ¥... \ I 30<
\ I 2L. I \
I \ 20
/ \
.__ _ _._ __ _.__ _ __.. __ _,_ _ __.10 20 25 30 35 L.O 45
Elution time / min
Figure 2. GPC/LALLS chromatogram of the sonicated but unfractionated G·C·C+ sample at an ionic strength of0.4, at a pH of 5.5. Output signal intensities by refractive index JR1 (left) and scattered light JLS (right) in mV. Conditions for detection: GPC column at 30°C, refractive index at 35°C and light scattering at room temperature. The sample was annealed for a week prior to measurement. The sharp peak detected in the signal of refractive index is due to added salt in solvent.
Intrinsic Viscosity The intrinsic viscosity [17] of a polymer
solution (conditions given in Table I) was measured at 25°C on a shear-rate variable multi-bulb Ubbelohde-type dilution viscometer or on a single-bulb type viscometer in the same manner as described elsewhere. 6 •7 •10
A polymer solution containing an equimolar ethylenediaminetetraacetate (Na2EDT A) was dialyzed in a Visking Seamless cellulose tubing (diameter, l.9 cm) against a NaCl-containing solvent (8 batches, totally 6L) at 7°C for 3 days. The dialyzed polymer solution was filtered through a glass filter with a porosity of 4(}-50 µm. The solvent used for the final dialysis was filtered with a 2(}-30 µm filter for successive dilutions of the polymer solution inside the viscometer.
Polym. J., Vol. 26, No. 3, 1994
RESULTS AND DISCUSSION
Formation of Triple-Stranded Helices Figure 3 shows the mixing curves for the
triple-stranded helix formation. Two break points were observed in Figure 3a for the Poly(G)/Poly(C) system at mole fractions of purine of 0.33 and 0.67 or molar ratios of l : 2 and 2: 1. This result indicates that two different triple-stranded- helices, i.e., G·C·C+ and G · G · C, are formed under the present conditions. The formation of G · G · C triplex in the acid pH is a new finding, in contrast with the report by Lipsett, 11 who showed a G · G · C triplex with an oligomeric G in a neutral pH region. Marek and Thiele12 found that a G · G · C triplex is formed in an alkaline region. The molecular weight of the Poly(G) and Poly(C) mixture may be a critical factor for G · G · C triplex formation at an acid pH. In the neutral pH region, Poly(G) forms a very strong quadruple-stranded helix; hence, the acid or alkaline pH is required to break up this helix into single-strands. It should be noted that no 1 : I complex, i.e., the double-stranded G · C helix was formed under the present conditions (cf the preceding paper;).
Mixtures of Poly(A) and Poly(U) were incubated at 40°C for 24 h at a pH of 6.8 and at an ionic strength of 0.25 (0.2 M NaCl and 0.025 M sodium phosphate buffer). In Figure 3b, two break points are observed for the Poly(A)/Poly(U) system at mole fractions of purine of 0.33 .and 0.5 or molar ratios of l : 2 and 1 : 1. This result indicates that a triplestranded helix, A· U · U, and a double-stranded helix, A· U, is formed under the present conditions. Since no break point appears at a mole fraction of 0.67, to which another triplex A· A· U would possibly correspond, the formation of this triple-stranded helix is unlikely. In order to detect the possible break in different mixing curves for the A ·A· U triplex, the experimental conditions were widely changed (the alkaline and acid pH regions, high ionic strengths, addition of
307
N. OJIMA, K. FUKUDOME, and K. YAMAOKA
I
4 -
)1-!.... 3 g
~'i (b) -9 "-"-"' wa
7
l t
6
1:: I I ±5
I r 0 0.2 0.4 0.6 0.8 1
X(purine)
Figure 3. Mixing curves of the Poly(G)/Poly(C) system (a) and Poly(A)/Poly(U) system (b) plotted against the mole fraction, X (purine), of Poly(G) or Poly(A). The ordinates are expressed by the apparent molar absorption coefficient c•PP defined as the observed absorbance A0b,d at 40°C divided by the total molar concentration c of two respective polynucleotides in mononucleotide unit and by the pathlength (1 cm) of a cell. (a): ( O) at 280 nm and (.A.) at 240nm. (b): (0) at 256nm and (.A.) at 280nm. Other details are given in EXPERIMENTAL.
magnesium ions, etc.), but no break was observed in any case for A· A· U (the purine/purine/pyrimidine triplex), contrary to the case of G · G · C in Figure 3a.
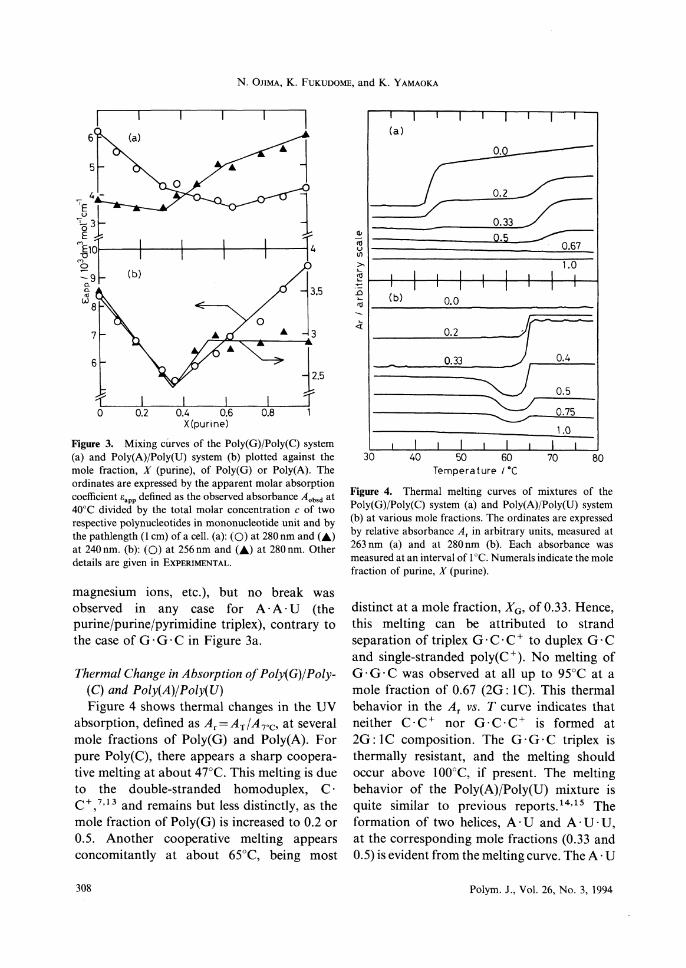
Thermal Change in Absorption of Poly(G)/Poly(C) and Poly(A)/Poly(U) Figure 4 shows thermal changes in the UV
absorption, defined as A,=AT/A7°c, at several mole fractions of Poly(G) and Poly(A). For pure Poly(C), there appears a sharp cooperative melting at about 47°C. This melting is due to the double-stranded homoduplex, C · C +, 7 • 13 and remains but less distinctly, as the mole fraction of Poly(G) is increased to 0.2 or 0.5. Another cooperative melting appears concomitantly at about 65°C, being most
308
(a)
C: <1l u (/)
>, 1.0 L
[tl ·-.D (bl L 0.0 <1l
<t 0.2 j 0.33 0.4
0.5
0.75
1.0
30 40 50 70 80 Temperature t 'C
Figure 4. Thermal melting curves of mixtures of the Poly(G)/Poly(C) system (a) and Poly(A)/Poly(U) system (b) at various mole fractions. The ordinates are expressed by relative absorbance A, in arbitrary units, measured at 263nm (a) and at 280nm (b). Each absorbance was measured at an interval of 1 °C. Numerals indicate the mole fraction of purine, X (purine).
distinct at a mole fraction, X0 , of 0.33. Hence, this melting can be attributed to strand separation of triplex G · C · C + to duplex G · C and single-stranded poly(C+). No melting of G·G·C was observed at all up to 95°C at a mole fraction of 0.67 (2G: 1 C). This thermal behavior in the A, vs. T curve indicates that neither C·C+ nor G·C·C+ is formed at 2G: 1 C composition. The G · G · C triplex is thermally resistant, and the melting should occur above I 00°C, if present. The melting behavior of the Poly(A)/Poly(U) mixture is quite similar to previous reports. 14•15 The formation of two helices, A· U and A· U · U, at the corresponding mole fractions (0.33 and 0.5) is evident from the melting curve. The A· U
Polym. J., Vol. 26, No. 3, 1994
GPC/LALLS of Triple-Stranded Polyribonucleotides
10r---r-----.-----~--~--~---,
8
6
4
w
220 240 260 280 300 320 Wavelength/ nm
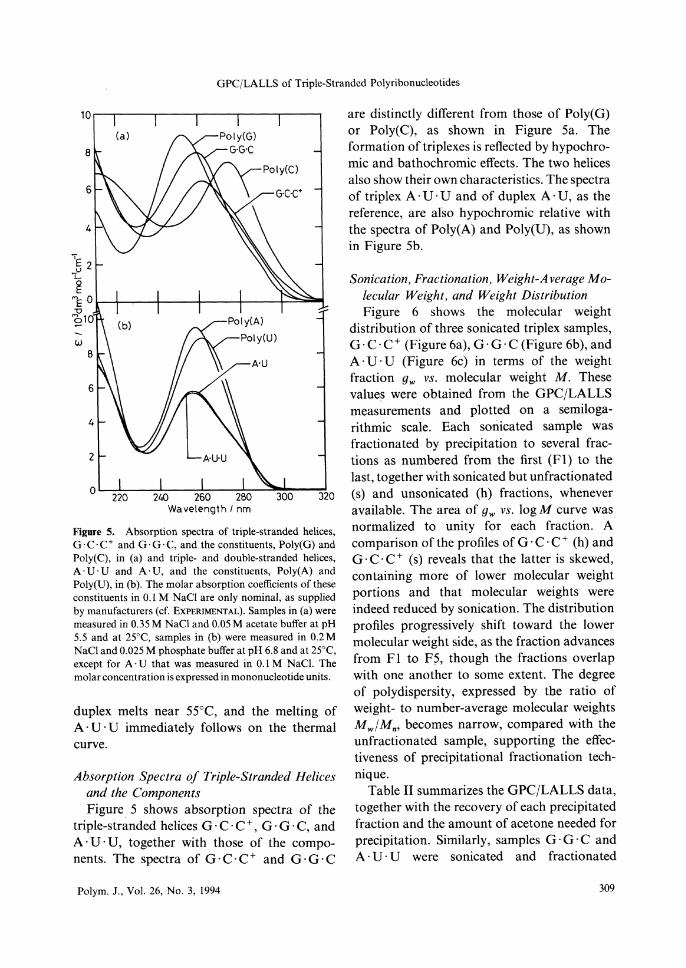
Figure 5. Absorption spectra of triple-stranded helices, G·c-c+ and G·G·C, and the constituents, Poly(G) and Poly(C), in (a) and triple- and double-stranded helices, A· U · U and A· U, and the constituents, Poly(A) and Poly(U), in (b ). The molar absorption coefficients of these constituents in 0.1 M NaCl are only nominal, as supplied by manufacturers (cf. EXPERIMENTAL). Samples in (a) were measured in 0.35 M NaCl and 0.05 M acetate buffer at pH 5.5 and at 25°C, samples in (b) were measured in 0.2 M NaCl and 0.025 M phosphate buffer at pH 6.8 and at 25°C, except for A· U that was measured in 0.1 M NaCl. The molar concentration is expressed in mononucleotide units.
duplex melts near 55°C, and the melting of A· U · U immediately follows on the thermal curve.
Absorption Spectra of Triple-Stranded Helices and the Components Figure 5 shows absorption spectra of the
triple-stranded helices G · C · C +, G · G · C, and A· U · U, together with those of the components. The spectra of G·C·C+ and G·G·C
Polym. J., Vol. 26, No. 3, 1994
are distinctly different from those of Poly(G) or Poly(C), as shown in Figure 5a. The formation of triplexes is reflected by hypochromic and bathochromic effects. The two helices also show their own characteristics. The spectra of triplex A· U · U and of duplex A· U, as the reference, are also hypochromic relative with the spectra of Poly(A) and Poly(U), as shown in Figure 5b.
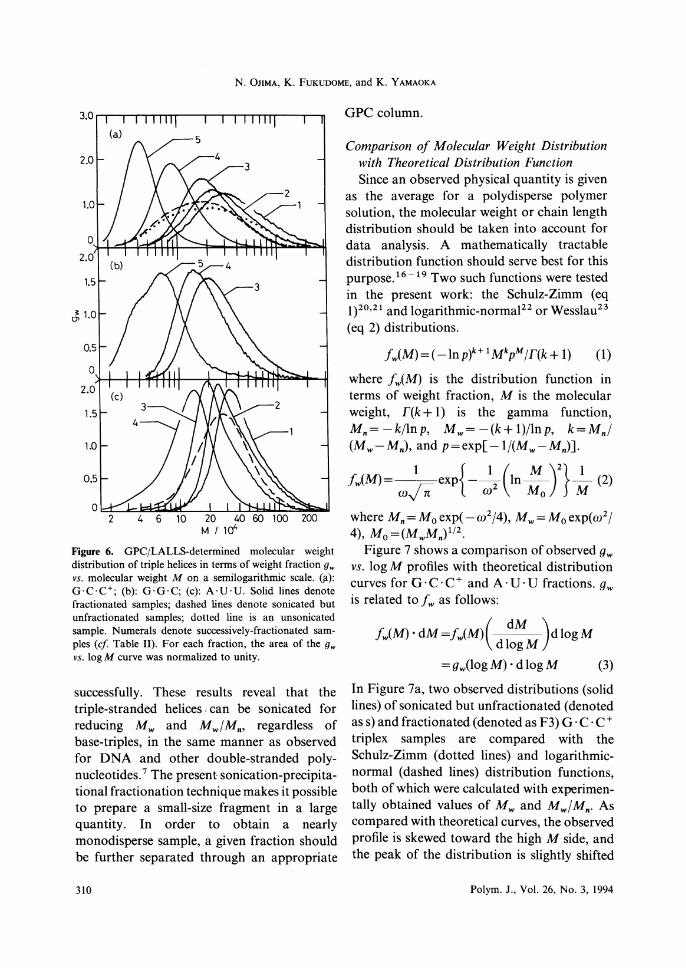
Sonication, Fractionation, Weight-Average Molecular Weight, and Weight Distribution Figure 6 shows the molecular weight
distribution of three sonicated triplex samples, G·C·C+ (Figure 6a), G·G·C (Figure 6b), and A· U · U (Figure 6c) in terms of the weight fraction gw vs. molecular weight M. These values were obtained from the GPC/LALLS measurements and plotted on a semilogarithmic scale. Each sonicated sample was fractionated by precipitation to several fractions as numbered from the first (Fl) to the last, together with sonicated but unfractionated (s) and unsonicated (h) fractions, whenever available. The area of gw vs. log M curve was normalized to unity for each fraction. A comparison of the profiles of G · C · C + (h) and G-c-c+ (s) reveals that the latter is skewed, containing more of lower molecular weight portions and that molecular weights were indeed reduced by sonication. The distribution profiles progressively shift toward the lower molecular weight side, as the fraction advances from Fl to F5, though the fractions overlap with one another to some extent. The degree of polydispersity, expressed by the ratio of weight- to number-average molecular weights Mw/Mm becomes narrow, compared with the unfractionated sample, supporting the effectiveness of precipitational fractionation technique.
Table II summarizes the GPC/LALLS data, together with the recovery of each precipitated fraction and the amount of acetone needed for precipitation. Similarly, samples G·G·C and A· U · U were sonicated and fractionated
309
N. OJIMA, K. FUKUD0ME, and K. YAMAOKA
2.0
1.0
1.5
J 1.0
1.5
1.0
0.5
2 4 6 10 20 40 60 100 200 M / 1cf
Figure 6. GPC/LALLS-determined molecular weight distribution of triple helices in terms of weight fraction 9w vs. molecular weight M on a semilogarithmic scale. (ii): G·C·C+; (b): G·G·C; (c): A·U·U. Solid lines denote fractionated samples; dashed lines denote sonicated but unfractionated samples; dotted line is an unsonicated sample. Numerals denote successively-fractionated samples (cf Table II). For each fraction, the area of the 9w vs. logM curve was normalized to unity.
successfully. These results reveal that the triple-stranded helices. can be sonicated for reducing Mw and Mwf Mn, regardless of base-triples, in the same manner as observed for DNA and other double-stranded polynucleotides. 7 The present sonication-precipitational fractionation technique makes it possible to prepare a small-size fragment in a large quantity. In order to obtain a nearly monodisperse sample, a given fraction should be further separated through an appropriate
310
GPC column.
Comparison of Molecular Weight Distribution with Theoretical Distribution Function Since an observed physical quantity is given
as the average for a polydisperse polymer solution, the molecular weight or chain length distribution should be taken into account for data analysis. A mathematically tractable distribution function should serve best for this purpose. 16 - 19 Two such functions were tested in the present work: the Schulz-Zimm (eq 1)20 •21 and logarithmic-normal22 or Wesslau23
(eq 2) distributions.
fw(M) = ( -lnp)k+ 1 MkpM/r(k + 1) (1)
where fw(M) is the distribution function in terms of weight fraction, M is the molecular weight, I'(k+ 1) is the gamma function, Mn= -k/lnp, Mw= -(k+ 1)/lnp, k=Mn/ (Mw-Mn), and p=exp[ -1/(Mw-Mn)J.
fw(M)= exp{-~(1n_!!__)2}_l (2)
w n w M0 M
where Mn=M0 exp(-w2/4), Mw=M0 exp(w2 /
4), M 0 =(MwMY12 •
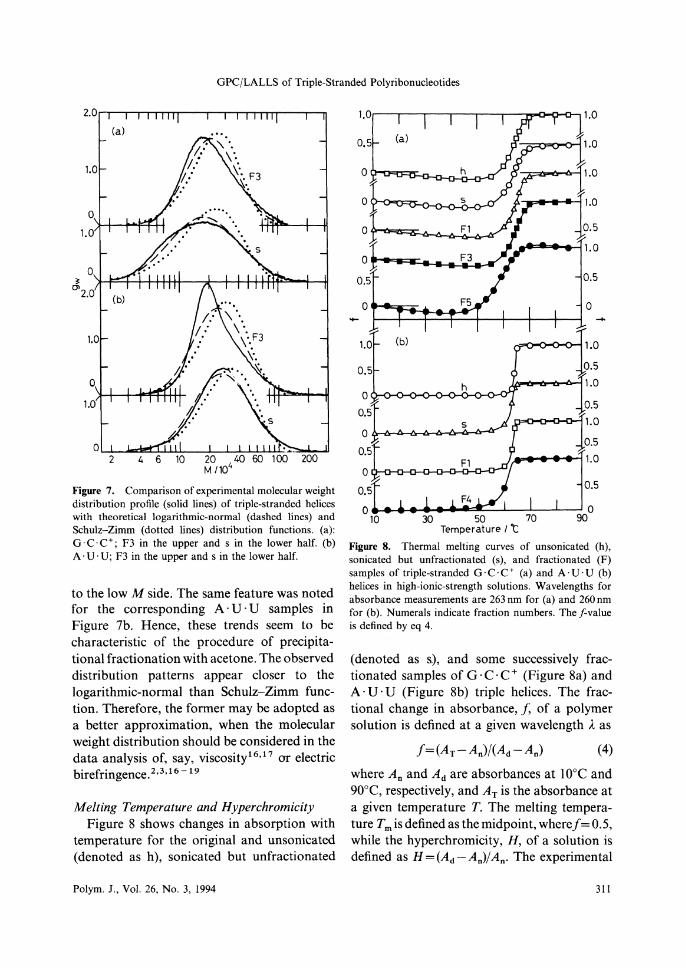
Figure 7 shows a comparison of observed gw vs. log M profiles with theoretical distribution curves for G · C · C + and A· U · U fractions. gw is related to fw as follows:
fw(M)·dM=fw(M)( dM )dlogM dlogM
= gw(log M) · d log M (3)
In Figure 7a, two observed distributions (solid lines) of sonicated but unfractionated ( denoted ass) and fractionated (denoted as F3) G · C · c+ triplex samples are compared with the Schulz-Zimm (dotted lines) and logarithmicnormal (dashed lines) distribution functions, both of which were calculated with experimentally obtained values of Mw and Mw/Mn. As compared with theoretical curves, the observed profile is skewed toward the high M side, and the peak of the distribution is slightly shifted
Polym. J., Vol. 26, No. 3, 1994
GPC/LALLS of Triple-Stranded Polyribonucleotides
0
" CJl2.0
(a)
2 4 6 10 20 4 40 60 100 200 M/10
Figure 7. Comparison of experimental molecular weight distribution profile (solid lines) of triple-stranded helices with theoretical logarithmic-normal (dashed lines) and Schulz-Zimm (dotted lines) distribution functions. (a): G · C · C +; F3 in the upper and s in the lower half. (b) A· U · U; F3 in the upper ands in the lower half.
to the low M side. The same feature was noted for the corresponding A· U · U samples in Figure 7b. Hence, these trends seem to be characteristic of the procedure of precipitational fractionation with acetone. The observed distribution patterns appear closer to the logarithmic-normal than Schulz-Zimm function. Therefore, the former may be adopted as a better approximation, when the molecular weight distribution should be considered in the data analysis of, say, viscosity16•17 or electric birefringence. 2 •3 • 16 - 19
Melting Temperature and Hyperchromicity Figure 8 shows changes in absorption with
temperature for the original and unsonicated (denoted as h), sonicated but unfractionated
Polym. J., Vol. 26, No. 3, 1994
o.s~1.o
1.0c=El.0 0 h 1.0
0
-~:.!!."" "1'' 0 0.5
0t • 1.0
• • • • 0.5 0.5
0 0 .,_ --+,
0 D-Q-iD--{l--[]-{:I--Cll--0-
o, 5 f ole • • 10 30 50
Temperature / 't Figure 8. Thermal melting curves of unsonicated (h), sonicated but unfractionated (s), and fractionated (F) samples of triple-stranded G·C·C+ (a) and A·U·U (b) helices in high-ionic-strength solutions. Wavelengths for absorbance measurements are 263nm for (a) and 260nm for (b ). Numerals indicate fraction numbers. The f-value is defined by eq 4.
( denoted as s), and some successively fractionated samples of G · C · C + (Figure 8a) and A· U · U (Figure 8b) triple helices. The fractional change in absorbance, f, of a polymer solution is defined at a given wavelength /4 as
where An and Act are absorbances at l0°C and 90°C, respectively, and AT is the absorbance at a given temperature T. The melting temperature Tm is defined as the midpoint, wheref =0.5, while the hyperchromicity, H, of a solution is defined as H =(Ad-An)! An. The experimental
311
N. OJIMA, K. FUKUD0ME, and K. YAMAOKA
values are given in Table II. Values of Tm remain nearly constant, regardless of molecular weights, while values of Hare slightly lowered as molecular weights decrease by sonication and subsequent fractionation. This lowering of hyperchromicity may be associated with smaller chain lengths, as observed previously for DNA. 5 •6 Considering the high · H and constant Tm values of the purified G · C · C + and A· U · U fractions, it may be concluded that the sonication-precipitation technique is useful for preparing a triple-stranded helix sample of different molecular weights in large quantities. It should finally be noted that, since the secondary structure of G · G · C triplex is stable in solution against heating, no thermal melting occurs up to about 100°C.
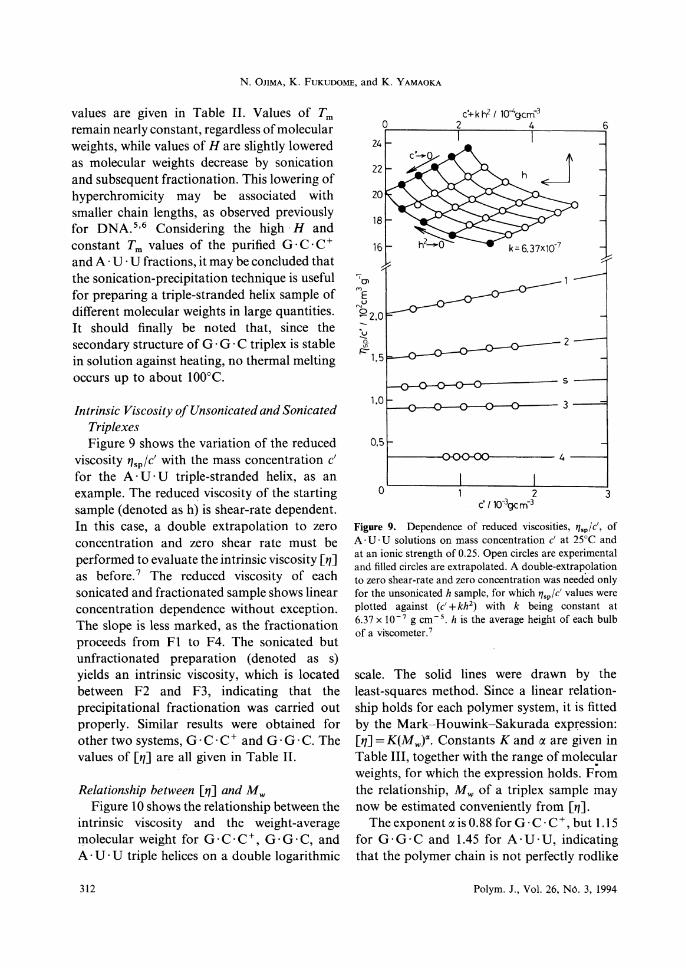
Intrinsic Viscosity of Unsonicated and Sonicated Triplexes Figure 9 shows the variation of the reduced
viscosity Y/sp/c' with the mass concentration c' for the A· U · U triple-stranded helix, as an example. The reduced viscosity of the starting sample (denoted ash) is shear-rate dependent. In this case, a double extrapolation to zero concentration and zero shear rate must be performed to evaluate the intrinsic viscosity [ r,] as before. 7 The reduced viscosity of each sonicated and fractionated sample shows linear concentration dependence without exception. The slope is less marked, as the fractionation proceeds from Fl to F4. The sonicated but unfractionated preparation (denoted as s) yields an intrinsic viscosity, which is located between F2 and F3, indicating that the precipitational fractionation was carried out properly. Similar results were obtained for other two systems, G · C · C + and G · G · C. The values of [Y/] are all given in Table II.
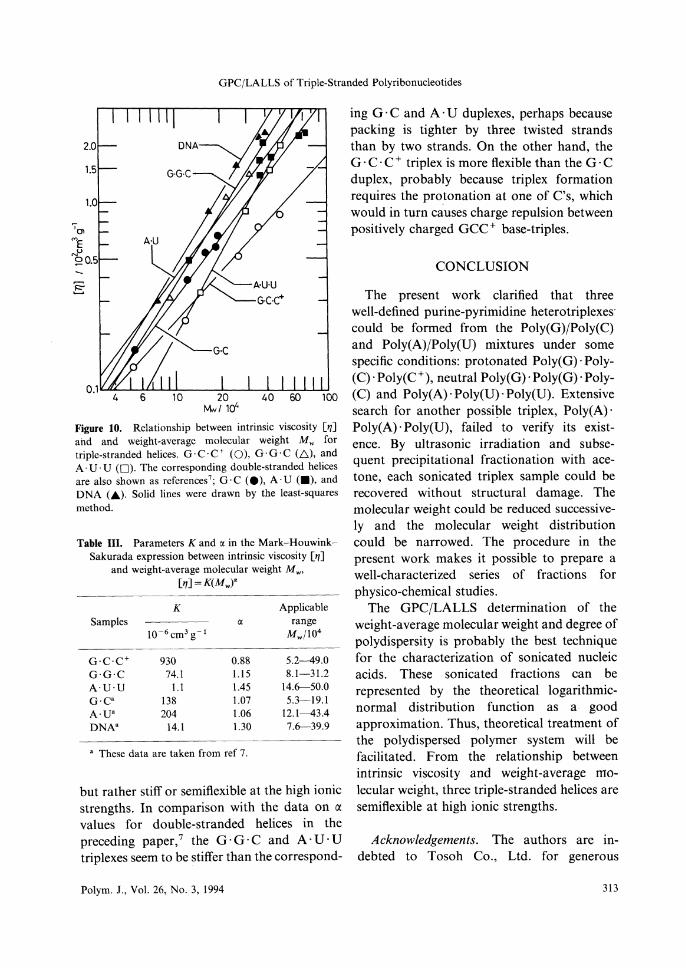
Relationship between [Y/] and Mw Figure 10 shows the relationship between the
intrinsic viscosity and the weight-average molecular weight for G·C·C+, G·G·C, and A· U · U triple helices on a double logarithmic
312
c'+ k h2 / 10-4gcm-3
2 4 6
1.0 l--<l>---0--0--<)---C>---- 3
0.5
0 3
Figure 9. Dependence of reduced viscosities, Y/,p/c', of A· U · U solutions on mass concentration c' at 25°C and at an ionic strength of 0.25. Open circles are experimental and filled circles are extrapolated. A double-extrapolation to zero shear-rate and zero concentration was needed only for the unsonicated h sample, for which Y/,p/c' values were plotted against (c' +kh2 ) with k being constant at 6.37 x 10- 7 g cm - 5 . h is the average height of each bulb of a viscometer. 7
scale. The solid lines were drawn by the least-squares method. Since a linear relationship holds for each polymer system, it is fitted by the Mark-Houwink-Sakurada expi;ession: [Y/] =K(MwY· Constants Kand a are given in Table III, together with the range of molec!1lar weights, for which the expression holds. From the relationship, M w of a triplex sample may now be estimated conveniently from [r,].
Theexponentais0.88forG·C·C+, but 1.15 for G · G · C and 1.45 for A· U · U, indicating that the polymer chain is not perfectly rodlike
Polym. J., Vol. 26, N6. 3, 1994
GPC/LALLS of Triple-Stranded Polyribonucleotides
2.0
1.5
1.0
G·C
o_, ....... .__..__,'-'-'-......,__.__ __ _.__.L...__..__,_...L.JL....J...J...J
4 6 10 20 40 60 M.v/ 104
Figure 10. Relationship between intrinsic viscosity [11] and and weight-average molecular weight Mw for triple-stranded helices. G · C · C + ( O ), G · G · C (6), and A· U · U (0). The corresponding double-stranded helices are also shown as references 7; G · C ( • ), A· U <•), and DNA (A). Solid lines were drawn by the least-squares
method.
Table III. Parameters K and Cl. in the Mark-HouwinkSakurada expression between intrinsic viscosity [I/]
and weight-average molecular weight Mw, [11]=K(Mw)"
K Applicable Samples Cl. range
10-6cm3g-1 Mw/104
G·C·C+ 930 0.88 5.2-49.0 G·G·C 74.1 1.15 8.1-31.2 A·U·U 1.1 1.45 14.6-50.0 G·C· 138 1.07 5.3-19.1 A-u• 204 1.06 12.1-43.4 DNA• 14.1 1.30 7.6-39.9
• These data are taken from ref 7.
but rather stiff or semiflexible at the high ionic strengths. In comparison with the data on a values for double-stranded helices in the preceding paper, 7 the G · G · C and A· U · U triplexes seem to be stiffer than the correspond-
Polym. J., Vol. 26, No. 3, 1994
ing G · C and A· U duplexes, perhaps because packing is tighter by three twisted strands than by two strands. On the other hand, the G · C · C + triplex is more flexible than the G · C duplex, probably because triplex formation requires the pro_tonation at one of C's, which would in turn causes charge repulsion between positively charged Gee+ base-triples.
CONCLUSION
The present work clarified that three well-defined purine-pyrimidine heterotriplexes· could be formed from the Poly(G)/Poly(C) and Poly(A)/Poly(U) mixtures under some specific conditions: protonated Poly(G) · Poly(C) · Poly(C+), neutral Poly(G) · Poly(G) · Poly(C) and Poly(A) · Poly(U) · Poly(U). Extensive search for another possible triplex, Poly(A) · Poly(A) · Poly(U), failed to verify its existence. By ultrasonic irradiation and subsequent precipitational fractionation with acetone, each sonicated triplex sample could be recovered without structural damage. The molecular weight could be reduced successively and the molecular weight distribution could be narrowed. The procedure in the present work makes it possible to prepare a well-characterized series of fractions for physico-chemical studies.
The GPC/LALLS determination of the weight-average molecular weight and degree of polydispersity is probably the best technique for the characterization of sonicated nucleic acids. These sonicated fractions can be represented by the theoretical logarithmicnormal distribution function as a good approximation. Thus, theoretical treatment of the polydispersed polymer system will be facilitated. From the relationship between intrinsic viscosity and weight-average molecular weight, three triple-stranded helices are semiflexible at high ionic strengths.
Acknowledgements. The authors are indebted to Tosoh Co., Ltd. for generous
313
N. OJIMA, K. FUKUD0ME, and K. YAMAOKA
permission to use a GPC/LALLS system, which was invaluable in pursuing the present work. This work was in part supported by a Grant-in-Aid for Scientific Research ((A) No. 02405008) from the Ministry of Education, Science, and Culture.
REFERENCES
l. E. Charney and K. Yamaoka, Biochemistry, 21, 834 (1982).
2. K. Matsuda and K. Yamaoka, Bull. Chem. Soc. Jpn., 55, 1727 (1982).
3. K. Yamaoka and K. Fukudome, Bull. Chem. Soc. Jpn., 56, 60 (1983).
4. K. Fukudome, K. Yamaoka, K. Nishikori, T. Takahashi, and 0. Yamamoto, Polym. J., 18, 71 (1986).
5. K. Fukudome, K. Yamaoka, K. Nishikori, H. Tatehata, and 0. Yamamoto, Polym. J., 18, 81 (1986).
6. K. Fukudome, K. Yamaoka, and H. Ochiai, Polym. J., 19, 1385 (1987).
7. M. Tanigawa, N. Mukaiyama, S. Shimokubo, K. Wakabayashi, Y. Fujita, K. Fukudome, and K.
314
Yamaoka, Polym. J., 26, 291 (1994). 8. P. Job, Anal. Chim. Acta, 9, 113 (1928). 9. P. S. Chen, Jr., T. Y. Toribara, and H. Warner, Anal.
Chem., 28, 1756 (1956). 10. J. EignerandP. Doty, J. Mo/. Biol., 12, 549(1965). 11. M. N. Lipsett, J. Biol. Chem., 239, 1256 (1964). 12. C. Marek and D. Thiele, Nucleic Acids Res., 5, 1017
(1978). 13. G. D. Fasman, C. Lindblow, and L. Grossman,
Biochemistry, 3, 1015 (1964). 14. C. L. Stevens and G. Felsenfeld, Biopolymers, 2, 293
(1964). 15. R. D. Blake, J. Massoulie, and J. R. Fresco, J. Mo/.
Biol., 30, 291 (1967). 16. K. Ueda, M. Nomura, and K. Yamaoka, Bio
polymers, 22, 2077 (1983). 17. K. Ueda, Bull. Chem. Soc. Jpn., 57, 2703 (1984). 18. K. Yamaoka and K. Ueda, J. Phys. Chem., 86, 406
(1982). 19. K. Matsuda and K. Yamaoka, Bull. Chem. Soc. Jpn.,
55, 69 (1982). 20. G. V. Schulz, Z. Phys. Chem., B43, 25 (1939). 21. B. H. Zimm, J. Chem. Phys., 16, 1099 (1948). 22. W. D. Lansing and E. 0. Kraemer, J. Am. Chem.
Soc., 57, 1369 (1935). 23. H. Wesslau, Makromol. Chem., 20, 111 (1956).
Polym. J., Vol. 26, No. 3, 1994