Firing Control Optimization of Impulse Thrusters for Trajectory ...
Upload
independentCategory
view
0download
0
Determinants of synaptic integration and heterogeneityin rebound firing explored with data-driven models of deepcerebellar nucleus cells
Volker Steuber & Nathan W. Schultheiss &
R. Angus Silver & Erik De Schutter & Dieter Jaeger
Received: 22 September 2009 /Revised: 7 September 2010 /Accepted: 21 September 2010 /Published online: 4 November 2010# Springer Science+Business Media, LLC 2010
Abstract Significant inroads have been made to under-stand cerebellar cortical processing but neural coding at theoutput stage of the cerebellum in the deep cerebellar nuclei(DCN) remains poorly understood. The DCN are unlikelyto just present a relay nucleus because Purkinje cellinhibition has to be turned into an excitatory output signal,and DCN neurons exhibit complex intrinsic properties. Inparticular, DCN neurons exhibit a range of rebound spikingproperties following hyperpolarizing current injection,raising the question how this could contribute to signal
processing in behaving animals. Computer modelingpresents an ideal tool to investigate how intrinsic voltage-gated conductances in DCN neurons could generate theheterogeneous firing behavior observed, and what inputconditions could result in rebound responses. To enablesuch an investigation we built a compartmental DCNneuron model with a full dendritic morphology andappropriate active conductances. We generated a goodmatch of our simulations with DCN current clamp datawe recorded in acute slices, including the heterogeneity inthe rebound responses. We then examined how inhibitoryand excitatory synaptic input interacted with these intrinsicconductances to control DCN firing. We found that theoutput spiking of the model reflected the ongoing balanceof excitatory and inhibitory input rates and that changingthe level of inhibition performed an additive operation.Rebound firing following strong Purkinje cell input burstswas also possible, but only if the chloride reversal potentialwas more negative than −70 mV to allow de-inactivation ofrebound currents. Fast rebound bursts due to T-type calciumcurrent and slow rebounds due to persistent sodium currentcould be differentially regulated by synaptic input, and thepattern of these rebounds was further influenced by HCNcurrent. Our findings suggest that active properties of DCNneurons could play a crucial role for signal processing inthe cerebellum.
Keywords Cerebellum . Ion channel . Excitability .
Simulation . Inhibition . Learning
1 Introduction
The deep cerebellar nuclei (DCN) perform an importantgateway function in the cerebellum, as they provide the sole
Action Editor: John Huguenard
Electronic supplementary material The online version of this article(doi:10.1007/s10827-010-0282-z) contains supplementary material,which is available to authorized users.
V. SteuberScience and Technology Research Institute,University of Hertfordshire,Hatfield Herts AL10 9AB, UK
V. Steuber : E. De SchutterTheoretical Neurobiology, University of Antwerp,2610 Antwerp, Belgium
N. W. Schultheiss :D. Jaeger (*)Department of Biology, Emory University,1510 Clifton Rd.,Atlanta, GA 30322, USAe-mail: [email protected]
R. A. SilverDepartment of Neuroscience, Physiology and Pharmacology,UCL,London WC1E 6BT, UK
E. De SchutterComputational Neuroscience Unit,Okinawa Institute of Science and Technology,Okinawa 904-0411, Japan
J Comput Neurosci (2011) 30:633–658DOI 10.1007/s10827-010-0282-z
source of cerebellar output to red nucleus, thalamus, andinferior olive after integrating inhibitory inputs fromcerebellar cortical Purkinje cells with excitatory input frombrain stem and cortical sources. DCN neurons projecting tothe inferior olive are GABAergic (Fredette and Mugnaini1991) while those projecting to red nucleus and thalamusare glutamatergic (Chan-Palay 1977; Daniel et al. 1987)and show a distinguishable morphology with a slightlylarger size (Sultan et al. 2003). Nevertheless, both types ofneurons have remarkably similar physiological propertiescharacterized by spontaneous spiking in vitro and a robustpostinhibitory rebound spike burst, but show a minordifference in the depth of fast spike afterhyperpolarization(Uusisaari et al. 2007). The hallmark behavior of strongpost-hyperpolarization rebound spiking was identifiedalready in early intracellular investigations of DCN intrinsicproperties (Gardette et al. 1985a, b; Jahnsen 1986a, b). AT-type calcium current and a sodium plateau current wereidentified as important contributors to fast and slowcomponents of depolarization underlying rebound spiking,respectively (Llinas and Muhlethaler 1988). The T-typecurrent dependent fast rebound burst is particularly strongin DCN neurons with a high CaV3.1 expression, while it ismuch weaker in DCN neurons with a predominantexpression of CaV3.3 channels (Molineux et al. 2006).Rebounds can also be elicited by strong inhibitory synapticinputs in vitro (Aizenman and Linden 1999), suggestingthat they may be triggered in vivo as well. A requirement ofhyperpolarization and rebound spiking to elicit potentiationof mossy fiber synapses onto DCN neurons (Pugh andRaman 2006, 2008) suggests that rebounds might bedirectly linked to mechanisms of learning. Nevertheless,due to the limited level of hyperpolarization that is reachedduring GABAA mediated IPSPs and due to shunting ofrebound currents in the presence of ongoing synapticinputs, it is possible that in vivo conditions may not favorrebound behavior (Alvina et al. 2008) unless the inhibitoryinputs are very intense (Tadayonnejad et al. 2009). Reboundbehavior is certainly not the only possibility of transmittinginformation through the cerebellar output stage, as dynamicclamp studies in brain slices have shown that the rate ofPurkinje cell inputs also results in a rate code of DCNoutput, and that very brief pauses in Purkinje cell input toDCN neurons reliably trigger individual DCN actionpotentials (Gauck and Jaeger 2000, 2003).
Computer modeling presents an ideal tool to determine theinvolvement of intrinsic cellular properties in controllingspike output during complex synaptic input patterns expectedin vivo because all system variables can be simultaneouslymeasured and because intrinsic properties can be preciselycontrolled and arbitrary input patterns can be constructed andrepeatedly applied. In the present study we obtained a largesample of whole cell recordings from DCN neurons to
characterize their behavior and to act as a template toconstruct a full morphological compartmental model of DCNprojection neurons. The model incorporated active conduc-tances previously established in DCN neurons (Jahnsen1986b; Raman et al. 2000), and was tuned to replicate ourcurrent clamp recordings in vitro. Variants of the model weredeveloped to reproduce the observed heterogeneity in therebound responses across cells and the multiphasic reboundbehavior. We then applied background synaptic input to themodel as expected to exist in the in vivo condition (Gauckand Jaeger 2000) to examine how spike rates were affectedby different balances of excitation and inhibition. Moreover,we determined how strong inhibitory bursts could engagerebound mechanisms in the presence of synaptic backgroundinput. We found that rebound currents can shape theresponse patterns following strong bursts of inhibition in arobust way, but only under conditions of a relativelyhyperpolarized chloride reversal potential. Our study gen-erates several predictions as to the possible role of DCNneuron properties in cerebellar coding.
2 Methods
2.1 Ethics statement
All animal procedures were conducted under an approvedEmory IACUC protocol and fully complied with the NIHguidelines on animal care and use.
2.2 Whole cell recordings from brain slices
Whole cell slice recordings from DCN neurons wereobtained following the protocol of our earlier dynamicclamp study (Gauck and Jaeger 2000). Here, we used asample of 129 recorded DCN neurons, which included theneurons reported in our earlier study in regard to responsesto dynamic clamp stimuli. We made use of additional tracesof spontaneous spiking activity and traces showingresponses to hyperpolarizing and depolarizing currentinjection pulses available for these neurons. Neuronsaccepted for analysis had spikes overshooting 0 mV andshowed stable spontaneous spiking behavior without theinjection of a bias current. Briefly, recordings wereobtained at 32°C from 13 to 19 day old male Sprague-Dawley rats. The slice medium contained (in mM): NaCl124, KCl 3, KH2PO4 1.2, NaHCO3 26, CaCl2 2, MgSO4 1.9,glucose 20. Electrodes were filled with: K-gluconate 140,HEPES 10, NaCl 10, EGTA 0.2, MgATP 4, NaGTP, 0.4,spermine 0.05, glutathione 5, 1% biocytin. Excitatory andinhibitory synapses were blocked with 100 μM AP-5, 10 μMCNQX and 40 μM picrotoxin. We calculated a junctionpotential of ~10 mV for our K-gluconate based intracellular
634 J Comput Neurosci (2011) 30:633–658

solution (Gauck and Jaeger 2000) and subtracted 10 mVfrom our recordings to correct for this depolarizing shift.
2.3 Construction of DCN model
Morphology and passive model properties The morpholog-ical reconstruction and fitting of passive parameters for thismodel were described in a previous publication (Steuber etal. 2004). Briefly, the DCN neuron on which the modelmorphology is based (Fig. 1(a)) was recorded for passiveresponses to positive and negative current injection pulsesin the presence of blockers for voltage-gated ion channels(in mM: TTX 0.001, TEA 10, 4-AP 2, Cd2+ 0.2, Ni2+ 2,Cs+ 5, amiloride 0.5) and synaptic inputs (in mM: CNQX0.01 and picrotoxin 0.02). After morphological reconstruc-tion of the recorded neuron and preparation of a GENESISmorphology file a genetic algorithm was used to find thepassive parameters of the model that provided an optimal fitto the voltage responses to current injection pulses injectedinto the original neuron. The passive parameter values weused for the present study were derived from this fittingprocedure, and are given by uniform specific RM of3.56 Ωm2 , RA of 2.35 Ωm, and CM of 0.0156 F/m2. Weapplied a small hyperpolarizing current pulse to the soma ofthis passive model to simulate the method by whichmembrane capacitance has been estimated for DCNneurons in slice experiments (Uusisaari et al. 2007). Fittingan exponential to the observed voltage decay and using therelationship that Cm=τm / RN, our model showed anapparent membrane capacitance (Cm) of 203 pF, which isin good agreement with the apparent Cm of glutamatedecarboxylase (GAD) negative DCN neurons (Uusisaari etal. 2007). While remaining errors in the morphologicalreconstruction and passive parameters can not be excluded,the performance of the active model to moderate variationsin passive parameters was quite stable, since the conduc-tance amplitudes of voltage-gated currents dominated overthe leak conductance. Using the parameters described hereour model (soma and 485 dendritic compartments) had atotal membrane resistance of 271 MΩ, a maximal electro-tonic length of 0.53 1 from the soma to the most distaldendritic tip, and a mean dendritic electrotonic distancefrom the soma of 0.2 1. Thus this model should beconsidered moderately electrotonically compact, as avoltage step applied to the soma will not decay much inthe dendrites (Rall 1959). The axon of the original neuronwas not reconstructed, but an artificial 30 compartmentaxon with nodal and internodal segments was pasted ontoour reconstructed cell following a published method (Shenet al. 1999) to allow for an axonal spike initiation zone.
Active conductances The kinetics of voltage-gated andcalcium-gated channels were modeled using the Hodgkin-
Huxley formalism as implemented by the GENESIStabchannel object (Bower and Beeman 1997). Channelschosen to be present were primarily based on publishedanalyses of DCN neuron conductances (Aizenman andLinden 1999; Jahnsen 1986a, b; Llinas and Muhlethaler1988; Raman et al. 2000). The model contained thefollowing six active currents to allow baseline spikingbehavior: A fast sodium current (INaF) based on DCNkinetics (Raman et al. 2000), a mixture of fast Kv3 family(IfKdr) and slow Kv2 (IsKdr) family delayed rectifiers(Baranauskas et al. 1999; 2003) which together form aTEA sensitive Kdr current that is present in DCN neurons(Raman et al. 2000), a tonic non-specific cation current(ITNC) providing inward current to allow baseline spiking(Raman et al. 2000), a high-voltage activated calciumcurrent (ICaHVA) identified in DCN neurons (Gauck et al.2001), a purely calcium-gated potassium current (ISK)present in DCN neurons (Aizenman and Linden 1999;Jahnsen 1986b; Raman et al. 2000) that creates a medium-duration spike-afterhyperpolarization (AHP) in DCN neu-rons (Jahnsen 1986b). The intracellular calcium concentra-tion was modeled as a diffusion shell with calcium inflowfrom ICaHVA and an exponential decay with a time constantof 70 ms. This extrusion time constant leads to a baselineaccumulation of calcium during fast spiking as observedexperimentally in DCN neurons (Muri and Knopfel 1994).All channel kinetics were adjusted to a temperature of 32°Cas used for our slice recordings by applying a Q10 value of3.0 for all Hodgkin-Huxley rate constants (Hille 2001).Generally, the kinetics of these channels available fromexperiments were partly incomplete, and also prone toexperimental errors due to space-clamp problems withvoltage-clamping in whole neurons (Castelfranco andHartline 2002). In addition ISK primarily depended on theconcentration of calcium, which was modeled in a simplifiedway. Thus, adjustments of channel kinetics within themargins of experimental uncertainty were undertaken anddeemed acceptable when the channel kinetics derived frompublished voltage-clamp data proved unsuitable to generategood matches with our DCN current clamp traces (seebelow). The full final parameters for all active conductancesare given in the “Supplemental material”.
While the model was able to match physiologicalspontaneous spiking and responses to depolarizing currentinjection pulses with this set of six active conductances (seebelow), it needed three additional conductances to replicatephysiological rebound behavior following periods of stronghyperpolarization. Unequivocal evidence exists for thepresence of an IHCN in most but not all DCN neuronsthrough the presence of a ‘sag’ in the response to hyper-polarizing stimuli (Aizenman and Linden 1999; Jahnsen1986a; Raman et al. 2000; Uusisaari et al. 2007). Thiscurrent has been linked to a depolarizing rebound current
J Comput Neurosci (2011) 30:633–658 635
following the offset of hyperpolarization (Aizenman andLinden 1999), however, it is not present to a noticeabledegree in some DCN neurons with considerable reboundbehavior (Jahnsen 1986a). We modeled IHCN with arelatively negative half-activation voltage as demonstratedin DCN recordings (Raman et al. 2000), which excluded aparticipation of IHCN in ongoing spontaneous spikingbehavior without strong hyperpolarizing stimuli. A second
rebound conductance present in DCN neurons is given bylow-voltage activated T-type calcium channels, whichproduce a fast spike burst in DCN neurons after stronghyperpolarization (Aizenman and Linden 1999; Llinas andMuhlethaler 1988). A recent study showed that the T-typecurrent (ICaT) underlying strong fast rebound behavior inDCN neurons is of the CaV3.1 subtype (Molineux et al.2006), for which a very thorough kinetic model was
100 200 300ms
-40
-20
0
20
mV
-40
-20
0
20m
V
1 2 3 4 5 6 7 8 9 10ms
-50
-30
-10
10
500 1000 1500 2000 2500mV
ms
-50
-30
-10
10
100 200 300 400ms
-50
-30
-10
10
1 2 3 4 5 6 7 8 9 10ms
-50
-30
-10
10
500 1000 1500 2000 2500ms
100
μm
(a)
(b)
(c)
Physiology Simulation
–50 0 50 100 150 200 250 300 350 400–20
0
20
40
60
80
100
120
140
Injected Current (pA)
spik
es /
s (
Hz)
s
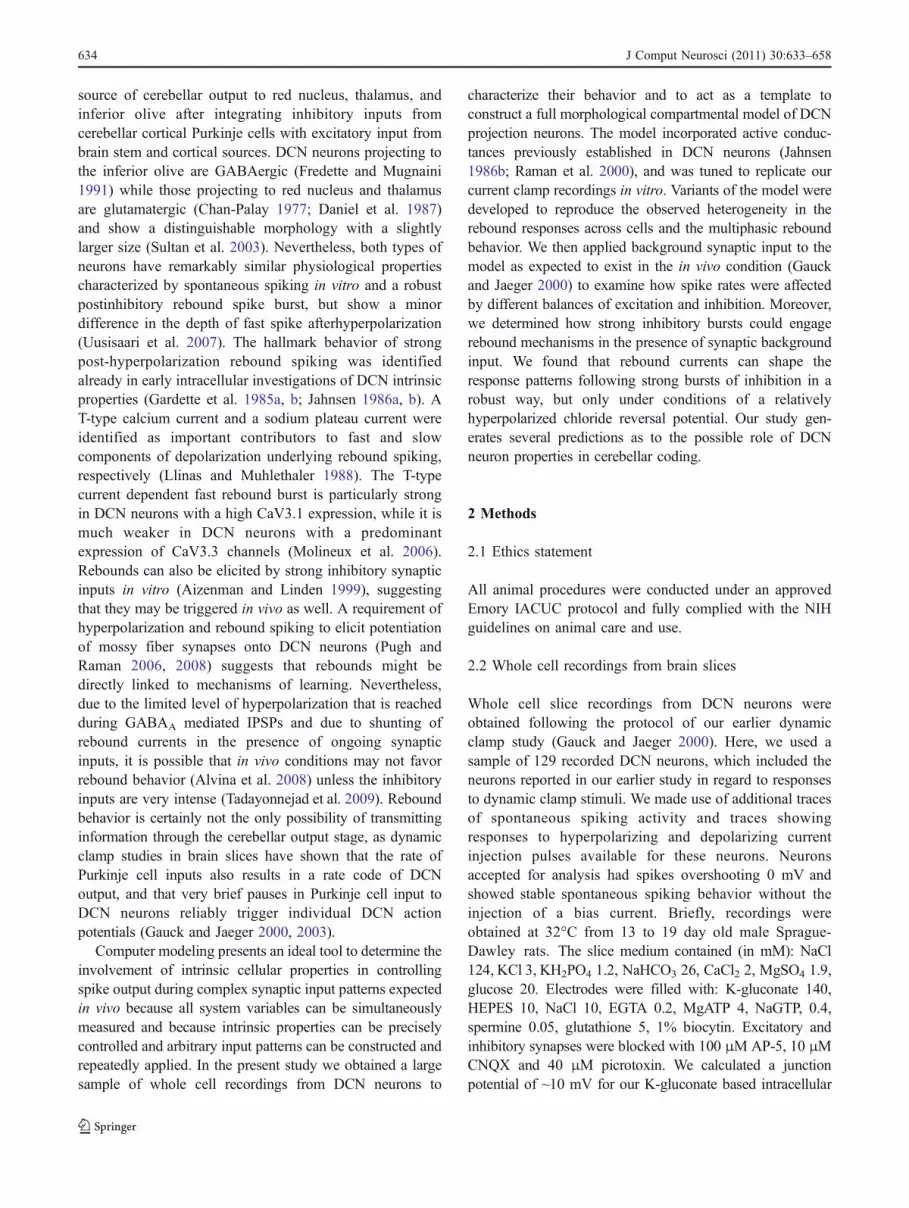
Fig. 1 Match of DCN model neuron to physiological properties. (a)Morphology of reconstructed neuron used for our model. Theartificially created axon attached to the soma is not shown. (b) (leftcolumn) Slice recording of typical DCN neuron. Voltages shown arejunction potential corrected (see Section 2). (right column) Samplesimulation traces show good match in spike shape and afterhyperpo-
larization properties with physiology. (c) Spike rates as a function ofinjected current for three recorded neurons (dotted lines), and themodel (solid line). The f-I curve for the model was obtained withrebound conductance densities GNaP of 8 S/m2, GHCN of 1 S/m2, andGGCaT of 2 S/m2. These conductances, however, had little influenceon spontaneous activity or on the f-I curve
636 J Comput Neurosci (2011) 30:633–658
developed for thalamocortical neurons (Destexhe et al.1998). We adopted these kinetics without further modifica-tion. Since CaV3.3 contributes only little to rebound behavior(Molineux et al. 2006) we omitted this channel type from oursimulations, and generated weak fast rebounds by lowdensities of CaV3.1 conductance. We did not connect theinflow of calcium through CaV3.1 channels to the intracel-lular calcium pool, as all test simulations coupling CaV3.1 tothis pool led to poor matches of rebound properties withphysiological data due to an excess of ISK activation. Thisprediction of the model that CaV3.1 should not contribute tothe calcium pool activating ISK was borne out in a recentexperimental study (Alvina and Khodakhah 2008). There-fore our calcium pool should be viewed as a calciumconcentration acting on ISK through a submembrane micro-domain coupling it exclusively to ICaHVA.
Finally, a sodium plateau current has been observed inDCN neurons (Jahnsen 1986b; Llinas and Muhlethaler1988), which in our recordings causes a prolonged (1–5 s)increase in spike rate following strong hyperpolarization(Sangrey and Jaeger 2005). This current is slowly inactivat-ing, characteristic of persistent sodium currents (INaP)(Magistretti and Alonso 1999). We adapted a previousmodel of INaP (Purvis and Butera 2005) by slowing theactivation and inactivation time constants so that currentclamp data of the model matched our experimentalprolonged rebound periods. In this Hodgkin-Huxley kineticmodel, INaP is treated as a separate current from INaF,although experimental findings point to INaP as a specialgating mode of the NaF channels (Alzheimer et al. 1993;Brown et al. 1994). There is no experimental support for aspecific Markov model of the combined Na channelkinetics, however, and to date no Markov formalism isknown that results in improved kinetics than can beobtained with two separate Hodgkin-Huxley formalisms.
The distribution of active conductances in the model wasgenerally not uniform, but changed between the followingmajor divisions of the neuron: axonal, somatic, proximaldendritic, and distal dendritic. Spike currents (INaF, IfKdr, IsKdr)were reduced in the proximal dendrite and absent in the distaldendrite as no experimental evidence points to dendritic spikecurrent. The SK current was also predominantly somatic togenerate a strong AHP local to the spike currents. Followingthe calcium imaging study by Gauck et al. (2001) we added agradient of T-type calcium conductance with higher density inthe dendrite than the soma (2-fold), and a similar gradient forHCN conductance, which is also likely to be predominantlydendritic in DCN neurons (Raman et al. 2000). The axonal,somatic, and dendritic densities for all active conductances inthe model are listed in Table 1. Details on the kinetics arefound in the supplemental on-line material as well as in thesimulation scripts publicly available in the ModelDB repos-itory (http://senselab.med.yale.edu/modeldb/).
Synaptic inputs Synapses were modeled as biexponentialpostsynaptic conductance changes, and the times ofsynaptic activation were controlled by GENESIS timetableobjects, which replace presynaptic neurons. Using thesynaptic conductance kinetics we have previouslyemployed in dynamic clamp studies of DCN neurons(Gauck and Jaeger 2000, 2003) excitatory (mossy fiber)input was modeled as a mixed AMPA and NMDAconductance while inhibitory (Purkinje cell) input wasmodeled as a pure GABAA conductance (see “Supplemen-tal material” for detailed equations and parameters). Weadded mossy fiber inputs to 100 and Purkinje cell inputs to400 randomly chosen dendritic compartments as well as thesoma to reflect the dominance of inhibition on DCNneurons (Palkovits et al. 1977). The total number ofsynapses is much smaller than found on biological DCNneurons, and each synapse in the model should beconsidered as representing a population of synapses inthe real neurons over a local area of membrane surface.To allow this computationally more efficient scheme,synapses in GENESIS (synchan elements) do not saturatewhen multiple input events overlap, so that a high rate ofinputs to a simulated synapse can stand for a lower rateat multiple synapses in the biological neuron (DeSchutter and Bower 1994). Given the larger number ofinhibitory inputs expected on the soma than on dendriticcompartments, the rate of inhibitory inputs to the somawas always multiplied by 50 with respect to each of the400 inhibitory dendritic synapses. Thus a rate of 20 Hzused for inhibitory synapses resulted in an average of8,000 dendritic and 1,000 somatic inhibitory inputs persecond. Random synaptic inter-event interval distributionsat the specified mean rates were drawn from a third degreeGamma distribution and obtained using the GENESIStimetable object. Control simulations were performed witha higher number of synapses (one excitatory and oneinhibitory synapse on each compartment) and proportion-ally reduced input rates for each synapse. These simu-lations showed nearly identical spike trains as those withreduced numbers of synapses (see supplemental Fig. 1),thus excluding the possibility that massive input toparticular compartments has a significant impact onsimulations through local dendritic voltage saturation.While the synaptic conductances we used allow a directcomparison of model performance with our dynamicclamp results (Gauck and Jaeger 2000, 2003) and arebased on an experimental study of DCN neurons (Anchisiet al. 2001), more recent publications describe fasterunitary EPSC and IPSC kinetics and larger conductanceamplitudes (Pugh and Raman 2006; Telgkamp et al. 2004).Thus we performed additional control simulations withsynaptic parameters adjusted to these new findings. Thesecontrol simulations revealed that the model predictions on
J Comput Neurosci (2011) 30:633–658 637

spike rate control and rebounds with inhibitory bursts(see Section 3) remained robust for changes in unitaryconductance parameters (supplemental Figs. 4 and 5).
2.4 Data analysis
To quantify different rebound behaviors after addingrebound currents, simulation data were analyzed usingMatlab (MathWorks, Inc., Natick, MA). Traces of instan-taneous spike rates were constructed by convolving actionpotentials (thresholded at −20 mV) with Gaussians toderive a local Gaussian rate code measure (Paulin 1995).In analogy to Paulin (1995), we used Gaussian kernels witha standard deviation inversely proportional to the neuronalfiring frequency. Given that the firing rate of DCN neuronsundergoes strong fluctuations, in particular during reboundresponses, we set the Gaussian standard deviation σk foreach spike k to sk ¼ minðISIbefore; ISIafterÞ=
ffiffiffiffiffi
2pp
, whereISIbefore and ISIafter are the inter-spike intervals (ISIs)directly before and after the spike. This ensured that theindividual contribution of each spike to the local Gaussianrate was limited to the maximum instantaneous rate justbefore or after it.
2.5 Model limitations
A model by nature presents a simplification of the realsystem, and thus will only replicate this system withinlimitations. To address specific questions, it is thusimportant to build a model that is adequate to match thelevel of complexity of the dynamics one intends toexamine. There are clearly many features of DCN neuronphysiology that we did not incorporate into the modeldescribed above, partly because they are not necessary atthe level of questions we pose, and partly because theexperimental literature has not yet adequately explored thenecessary parameters to simulate such features with anylevel of accuracy. For example, we omitted processes fromthe model that determine slow dynamics such as pumpcurrents, calcium release from stores, and channel phos-phorylation. On the other side of the spectrum we omitted
stochastic channel activation, full Markov descriptions ofion channels, ion channel subunit heterogeneity, etc. Thislevel of detail would likely add little to the questions weexamine and is problematic to model as the parametersspecifying these processes remain mostly unknown. Param-eters that we are uncertain about also include features thatmay have a significant impact on the questions we address,as for example the presence of spike currents in dendrites.In this and similar cases we applied the principle ofOccam’s razor, i.e. we did not incorporate dendritic INaFand IKdr as they were not required to replicate ourexperimental data. Overall, our model thus presents a‘working hypothesis’ of DCN neuron physiology at thetime scale appropriate to examine short-term responses tocurrent injection and synaptic input. It is intended to beupdated as more experimental results become available, anddifferent levels of dynamics are simulated. Nevertheless,this model presents to date the most complete replication ofDCN neuron dynamics available and, as we hope to showconvincingly in our results section, allows an exploration ofinteractions between synaptic and intrinsic conductancesthat leads to interesting insights about the possible role ofDCN neuron conductances in vivo. Most important, themodeling process reveals those gaps in knowledge that arecritical for a functional understanding of synaptic integra-tion in the DCN, and can guide future experiments to fill inthose gaps. The model will be made fully available onpublic databases such as ModelDB, including a simulator-independent version in NeuroML format (Gleeson et al.2010), and we hope it will be adapted to include moreprocesses and updated parameters as our understanding ofthe DCN improves.
3 Results
3.1 Spontaneous spiking properties of the fullmorphological DCN model and detailed comparisonto slice recordings
DCN neurons in brain slices typically are spontaneouslyspiking when excitatory and inhibitory inputs are blocked
Table 1 Channel conductance densities in S/m2 (and for CaHVA,permability in m/s) for the different compartment types. Theconductance densities of the rebound conductances GCaT, GNaP and
GHCN are given for model Neuron 3 (see Section 3). Axon refers to theconductance densities in the axon hillock and initial segment
NaF fKdr sKdr TNC Sk CaHVA CaT NaP HCN
Soma 250 150 125 0.3 2.2 7.5 10−8 1.5 8 2
Proximal dendrite 100 90 75 0.06 0.66 5 10−8 3 0 4
Distal dendrite 0 0 0 0 0.66 5 10−8 3 0 6
Axon 500 300 250 0.35 0 0 0 0 0
Table 1 Channel conductance densities in S/m2 (and for CaHVA,permability in m/s) for the different compartment types. Theconductance densities of the rebound conductances GCaT, GNaP and
GHCN are given for model Neuron 3 (see Section 3). Axon refers to theconductance densities in the axon hillock and initial segment
638 J Comput Neurosci (2011) 30:633–658
(Gauck and Jaeger 2000). Principal excitatory DCNprojection neurons exhibit characteristic features such asa spike waveform with a narrow half-width, distinctphases of fast and slow spike-afterhyperpolarization(AHP), and linear rate increases with current injection(Uusisaari et al. 2007). We acquired a sample of 36 slicerecordings of DCN neurons with a discernible fast AHPand thus likely representing glutamatergic projectionneurons (Uusisaari et al. 2007) to score the range ofdetailed spike properties found in this type of neuron(Fig. 1(b)). We found quite variable detailed spike wave-forms and frequencies, indicating that the biologicalneurons may vary substantially in their relative densitiesof ion channels: 1) spontaneous firing frequency: 0–40 Hz,mean 10.6±8.5 Hz; 2) spike rate during 100 pA currentinjection: 18–84 Hz, mean 38.4±15.7 Hz; 3) spikeamplitude (measured from spike peak to bottom of fastAHP): 54–85 mV, mean 66.4±8.4 mV; 4) spike width athalf amplitude: 0.4–1.35 ms, mean 0.74±0.25 ms; 5)depth of fast AHP relative to subsequent afterdepolariza-tion (ADP): 0–6.5 mV, mean 1.7±1.6 mV; 6) delay fromspike peak to ADP peak: 2.2–7.5 ms, mean 3.7±1.2 ms; 7)depth of slow AHP from peak of ADP: 4.1–14.7 mV,mean 8.6±2.9 mV.
The overall quality of the model match can beassessed by comparing the voltage traces and injectedcurrent—spike rate relationships from sample neuronsand the model (Fig. 1(b, c)). When we varied parameterssuch as GNaF density, GKV3 density, or GSK density insteps as big as 50% increases or decreases we generallyfound a smooth change in model behavior that reachedmany values found in the experimental distributions ofspike amplitude, spike width, slow AHP depth, etc. Thus,the solution space for this model with varied parametersettings contains a broadly distributed class of behaviorsmatching the physiological range, similar to observationsin other conductance based compartmental models(Achard and De Schutter 2006; Gunay et al. 2008; Prinzet al. 2003). Our final baseline model was within theexperimental range for each of the physiological measureslisted above. However, there was a noticeable overallhyperpolarized shift by about 10 mV in the modelmembrane potential trajectory compared to experimentaldata even after junction potential correction (Fig. 1). Thisshift was due to a lower Na spike threshold in the modelthan in the experiments, and could be compensated by a10 mV depolarizing shift in the activation and inactivationproperties of INaF and IKdr compared to the literaturevalues in dissociated neurons (supplemental Fig. 3). Thiscompensation had no significant impact on other aspectsof model behavior (supplemental Figs. 3, 4 and 5), againdemonstrating the robustness of model behavior againstsmall parameter variations.
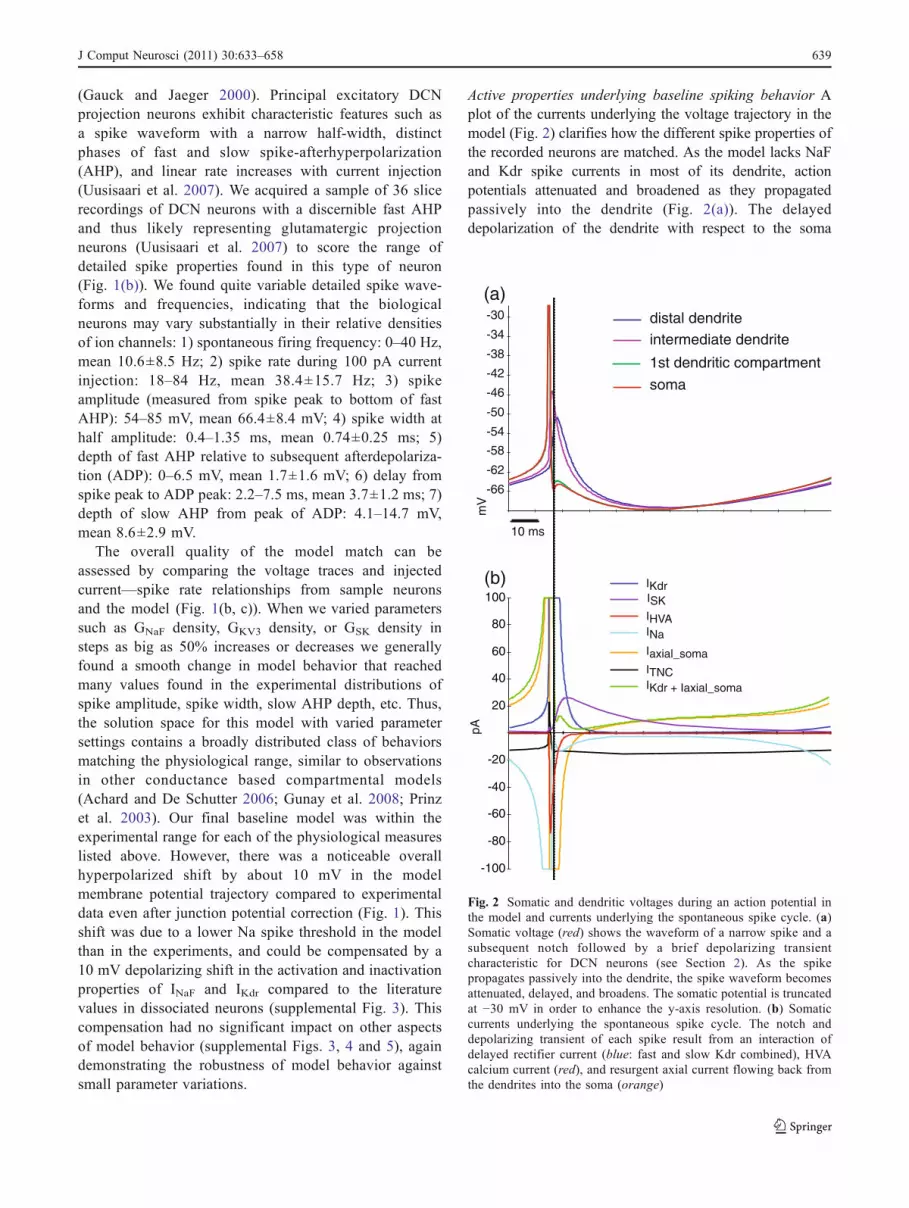
Active properties underlying baseline spiking behavior Aplot of the currents underlying the voltage trajectory in themodel (Fig. 2) clarifies how the different spike properties ofthe recorded neurons are matched. As the model lacks NaFand Kdr spike currents in most of its dendrite, actionpotentials attenuated and broadened as they propagatedpassively into the dendrite (Fig. 2(a)). The delayeddepolarization of the dendrite with respect to the soma
-66
-62
-58
-54
-50
-46
-42
-38
-34
-30
mV
10 ms
soma
1st dendritic compartment
intermediate dendritedistal dendrite
ITNC
Iaxial_soma
INa
ISK
IKdr
pA
-100
-80
-60
-40
-20
20
40
60
80
100
IKdr + Iaxial_soma
IHVA
(a)
(b)
Fig. 2 Somatic and dendritic voltages during an action potential inthe model and currents underlying the spontaneous spike cycle. (a)Somatic voltage (red) shows the waveform of a narrow spike and asubsequent notch followed by a brief depolarizing transientcharacteristic for DCN neurons (see Section 2). As the spikepropagates passively into the dendrite, the spike waveform becomesattenuated, delayed, and broadens. The somatic potential is truncatedat −30 mV in order to enhance the y-axis resolution. (b) Somaticcurrents underlying the spontaneous spike cycle. The notch anddepolarizing transient of each spike result from an interaction ofdelayed rectifier current (blue: fast and slow Kdr combined), HVAcalcium current (red), and resurgent axial current flowing back fromthe dendrites into the soma (orange)
J Comput Neurosci (2011) 30:633–658 639

resulted in a push–pull mechanism of axial current similarto Purkinje cells (Jaeger and Bower 1999), by which thesoma first pushes current into the dendrite during the actionpotential, but then a substantial current flows back duringthe AHP and creates the ADP following the fast AHP(Fig. 2(a, b)). These observations in the model lead to theprediction that a dissociated DCN neuron with predomi-nantly a soma remaining would not exhibit the ADPfollowing the AHP.
As previously observed in experimental studies (Ramanet al. 2000) the total membrane current in the middle of theinter-spike-interval (ISI) during spontaneous activity inthe model was quite small, and no single current exceeded20 pA (Fig. 2(b)). In fact, the repolarization allowingrhythmic pacemaking was generated by a persistentinward tonic non-specific cation (TNC) current of anamplitude of only 10–20 pA (Fig. 2(b)), which is muchsmaller than expected synaptic currents in vivo (Gauck andJaeger 2003) and thus is unlikely to dominate in vivo firingproperties of DCN neurons. This low-conductance state ofintrinsic channels therefore is likely to allow a highsensitivity to small synaptic steering conductances orapplied currents.
3.2 Match of model with a range of physiological reboundbehaviors by adjusting persistent sodium, T-type calcium,and HCN conductance densities
Physiological results Because rebound behavior is a prom-inent feature of DCN current clamp recordings in cerebellarslices, we placed a special emphasis on reproducingheterogeneous rebound dynamics in our model. To accu-rately determine the experimental range of rebound behav-iors, we acquired 129 recordings of DCN neurons in brainslices in the presence of the synaptic input blockerspicrotoxin and CNQX and analyzed the data for reboundresponses to negative current injection pulses. We foundthat rebound responses could be described by the combi-nation of two prominent components, which we termed fastrebound burst and prolonged rebound period (Fig. 3). Thefast burst consisted of two to six spikes with diminishingamplitude superposed on a depolarized plateau (Fig. 3,Neuron 1 and Neuron 2, blue inset). All fast bursts had aninitial ISI below 7 ms. We found a fast burst for 91 of the129 analyzed neurons (71%). The fast rebound burst wasfollowed by a pause of an average duration of 106±35.2 msin 53 of the 91 neurons (58%), after which spiking resumed
10 ms100 ms
1 s
20 m
V
10 ms 100 ms1 s
20 m
VPhysiology Simulation
Neuron 1
Neuron 2
Neuron 3 GNaP=8 S/m2 ; GHCN=2 S/m2 ; GCaT = 1.5 S/m2
GNaP=6 S/m2 ; GHCN=0.5 S/m2 ; GCaT = 4.5 S/m2
GNaP=2 S/m2 ; GHCN=0.5 S/m2 ; GCaT = 3.5 S/m2
-90 mV
-90 mV
-90 mV
Fig. 3 Different typical reboundpatterns of DCN neuronsrecorded in brain slices (Neurons1–3, left column) and matchingrebound types in the model(right column). Note that theHCN current activates wellabove −90 mV in our physio-logical data (dashed lines).Insets show an expanded wave-form of a single spontaneousspike (red) and the initial portionof rebounds (blue). A currentinjection of −150 pA for 1.5 selicited the hyperpolarization andfollowing rebound in both thephysiological traces and themodel. Models using thecombinations of reboundconductances replicating therebound patterns of Neurons1, 2 and 3 are referred to asmodels of these specific neuronsin the remainder of the paper
640 J Comput Neurosci (2011) 30:633–658

with an increased rate compared to baseline. The remaining38 neurons with a fast burst directly transitioned into aprolonged rebound period without an intervening intervalof increased duration. For these neurons the presence of adistinct fast burst was ascertained by the presence of aninitial ISI of less than 7 ms and a clear transition to slowerspiking after two to six spikes. In a large proportion ofrecorded neurons with a fast burst and a pause a seconddampened fast burst occurred before the onset of aprolonged rebound period (Fig. 3, Neuron 1). For 39neurons we quantified properties of the fast rebound furtherfor a 1.5 s stimulus of −150 pA amplitude. We found thatthe mean number of fast rebound spikes was 4.2±0.7, themean latency from the offset of the negative currentinjection pulses to the first rebound spike was 29.5±11 ms, and the peak rebound frequency (determined by theshortest ISI) was 274±67 Hz.
In all neurons, a prolonged rebound period was foundwhen a negative current that resulted in a strong hyperpo-larization was injected for 1 or 1.5 s (Fig. 3, all neurons).The duration of the prolonged rebound period (spike rateabove baseline) was always greater than 1 s and most oftenpersisted until the end of our data acquisition period, whichended 1.4 s after the offset of stimulation in most cases. Wequantified the spike rate increase for a 1.5 s currentinjection of −150 pA for 105 neurons with a non-zerobaseline frequency. For these neurons the mean baselinespike frequency was 11.3 Hz, while the mean frequency ofthe slow spike rate increase (scored by the average of thefirst two successive ISIs 300 ms after current injectionoffset) was 21.9 Hz, indicating an average spike rateincrease of 10.6 Hz over baseline in this time window.However, the magnitude of spike rate increase had a highstandard deviation of 8.4 Hz, and reached a maximum of48 Hz.
These data on fast bursts and prolonged rebound periodswere taken as the target of rebound behavior in ourcompartmental model. We accomplished this goal byadding a T-type calcium current ICaT and a slowlyinactivating persistent sodium current INaP to our model.These currents inactivate during baseline firing, butde-inactivate during a hyperpolarized period in membranepotential. Subsequent depolarization then leads to activationof these channels resulting in an inward rebound current. Athird current contributing to rebound behaviors is given bythe hyperpolarization-activated cyclic-nucleotide gated con-ductance IHCN, which activates during hyperpolarizationand remains active for a short period after the offset ofhyperpolarization. The densities of the three reboundconductances in the model were adjusted so that the rangeof rebound behaviors observed experimentally could bereproduced. We picked three specific neurons from ourphysiological recordings (Fig. 3), which showed represen-
tative examples of the rebound behaviors described in thepreceding text, to serve as templates to be matched by themodel. We refer to these ‘typical’ neurons as Neurons 1, 2,and 3 in the remainder of this study.
Matching the model to the heterogeneous physiologicalbehaviors Previous studies have shown that the fastrebound burst of DCN neurons is carried by a CaTconductance (Aizenman and Linden 1999; Molineux et al.2006). Adding a variable CaT conductance density (GCaT,see Section 2) to our baseline simulation could indeedreplicate the experimentally observed properties of the fastrebound burst of two to six spikes with a longer inter-spikeinterval between the second last and last spike in the burst(Fig. 3). The fastest spike rates (determined by the shortestISI) in the burst for simulated Neuron 1 and 2 were 291 Hzand 321 Hz, respectively, which is within one standarddeviation of the experimental data for the population mean.In fact, when the GCaT density in model Neuron 2 was
500 ms
100
pA
INaPICaTIHCN
0 pA
Neuron 3 model: GNaP=8 S/m2 ; GHCN=2 S/m2 ; GCaT = 1.5 S/m2(a)
0 pA
Neuron 1 model: GNaP=2 S/m2 ; GHCN=0.5 S/m2 ; GCaT = 3.5 S/m2
-150 pA for 1.5 s
(b)peak at -0.39 nA
peak at -1.85 nA
Fig. 4 Currents underlying rebound patterns in the model of Neuron 1and Neuron 3. The T-type calcium current (ICaT, green) underlies the fastburst after the offset of hyperpolarization, while the persistent sodiumcurrent (INaP, red) underlies the subsequent prolonged rebound period ofspiking. Depending on the relative density of GCaT and GNaP present,each component of the rebound can be more or less pronounced. Notethat IHCN (blue) only makes a minor contribution to the rebounddepolarization. This is due to the small driving force of IHCN (reversalpotential of −45 mV) during the rebound depolarization. (b) Apronounced fast spike burst is present with high GCaT density. Thepeak of ICaT reaches −1.85 nA, and is shown truncated to allowvisualization of smaller currents
J Comput Neurosci (2011) 30:633–658 641

varied from 2.5 to 5.5 S/m2, the number of fast reboundspikes increased from 3 to 5, and the fastest rate from 242to 346 Hz. Thus, by adjusting the GCaT density in this rangethe simulation replicates the heterogeneity in our experi-mental data, and the simulation of two separate CaV3.1 andCaV3.3 CaT channels was not necessary.
The prolonged rebound period was attributed to apersistent sodium conductance in an early study (Llinasand Muhlethaler 1988), but has not been studied in muchdetail since then. We added a persistent sodium conduc-tance GNaP to our model to determine whether it could
account for the timing and intensity of our experimentallyobserved slow spike rate increases (see Section 2).Simulations with varying densities of GNaP could matchthe range of experimentally observed prolonged reboundperiod profiles well (Fig. 3). However, an interdependenceof GNaP effects with other conductances was observed, asis typically seen when the effects of specific conductanceson neural dynamics are analyzed (Gunay et al. 2008;Taylor et al. 2009). Most notably, we obtained a largerprolonged rebound in simulated Neuron 2 than in Neuron3 despite a higher level of GNaP in the latter (Fig. 3). Upon
0.5 s
20 m
V
Neuron 1, varying gHCN
gHC
N =
0 S
/m2
gHC
N =
2 S
/m2
0 0.5 1 1.5 2 2.5
0
50
100
150
200
250re
boun
d sp
ike
rate
t(s)
gHCN = 0 S/m2
gHCN = 0.5 S/m2
gHCN = 2 S/m2
Neuron 3, varying gHCN
gHC
N =
0 S
/m2
gHC
N =
2 S
/m2
0 0.5 1 1.5 2 2.5
0
50
100
150
200
250
300
rebo
und
spik
e ra
te
t(s)
(a) (d)
50 ms
50 ms
(b) (e)
0.5
nA
I CaTI NaP
0.5
nA
I H
1 nA
1 nA
(c) (f)
0 0.5 1 1.5 20
10
20
30
40
50
60
gHCN (S/m )2
rebo
und
late
ncy
(ms)
0 0.5 1 1.5 20
10
20
30
40
50
60
gHCN (S/m )2
rebo
und
late
ncy
(ms)
642 J Comput Neurosci (2011) 30:633–658

inspection we found that this difference was due to a higherdensity of HCN conductance (GHCN) present in Neuron 3,which resulted in a diminished hyperpolarization anddiminished de-inactivation of GNaP during the negativecurrent injection. To match the overall rebound response ofNeuron 3 a higher GHCN density was required becauserecordings of this neuron did not show a pause in firing afterthe fast rebound burst carried by GCaT, and only GHCN wascapable of producing sufficient inward current at this timepoint to eliminate the pause in the simulations. Overall, thesesimulation results demonstrate that a combination of HCN,CaT and NaP conductances can replicate the physiologicallyobserved heterogeneous rebound patterns, and that reboundprofiles are shaped by interactions between these conduc-tances as well as by the temporal and amplitude profile ofpreceding hyperpolarizations. This allows for a large degreeof modulation of rebound properties by channel densityvariability and triggering conditions.
3.3 CaT and NaP conductances carry fast and slow reboundcurrents, respectively
The pronounced variability in rebounds between neuronscan be understood most easily by examining differencesin the strength of rebound currents for variable densities
of the underlying rebound conductances (Fig. 4). In allcases, during baseline firing, the CaT and NaP reboundconductances were predominantly inactivated and theyhad only a small influence on baseline firing rate.Following the de-inactivation of ICaT and INaP duringnegative current injection, they each activated with acharacteristic profile after the offset of hyperpolarization,and the strength of the respective rebound component wasdetermined by the amount of conductance present (Fig. 4).ICaT provided a fast current of substantial amplitude (peakcurrent of −1.85 nA for a GCaT density of 3.5 S/m2,Fig. 4b), which then rapidly inactivated and thus led to thetransient fast rebound spike burst. INaP activated moreslowly and gave rise to a much smaller peak current of190 pA for a conductance density of 8 S/m2 (Fig. 4a). Dueto its slow inactivation time constant this current persistedfor over 1 s. Despite its small amplitude it led to apronounced increase of spiking from the 11.9 Hz baselineto 32.1 Hz at 300 ms following the offset of the currentinjection (with 1.5 S/m2 GCaT and 2.0 S/m2 GHCN alsopresent, Fig. 4a). This is due to the fact that the spike rateof the model neuron is sensitive to small currents as notedabove.
3.4 The HCN current shortens rebound delaysand smoothes oscillations
The HCN conductance has been suggested as a maincontributing factor to rebound behavior in DCN neurons(Aizenman and Linden 1999) as it activates duringhyperpolarization and can provide a remaining inwardcurrent following it. However, our simulations showed thatthe contribution of the HCN current to rebound spiking waslimited by its small amplitude (Fig. 4) which was due to asmall driving force during the rebound period when themembrane potential was close to the IHCN reversal potentialof −45 mV. Nevertheless, IHCN had modulatory influenceson the rebound properties in addition to diminishinghyperpolarization during negative current injection. Toisolate effects of IHCN at a controlled level of hyperpolar-ization we simulated rebound responses induced bytransient voltage clamp pulses to −90 mV for the differentcombinations of GNaP and GCaT present in Neurons 1 and 3(Fig. 5). Using this protocol, we determined the effect ofGHCN without modulating the de-inactivation of GCaT andGNaP. We found that the presence of GHCN had twoadditional influences on the rebound.
First, GHCN reduced the onset latency of the fast reboundfor both NaP and CaT conductance combinations in Neuron1 and 3 (Fig. 5). This is because IHCN was already activatedduring the hyperpolarization and drove the initial depolar-ization following the offset of negative current injection orvoltage clamp. In contrast, ICaT and INaP are activated by
Fig. 5 The role of IHCN in controlling rebound spiking. (a) In thepresence of a high density of 8 S/m2 GNaP and a low density of1.5 S/m2 GCaT (Neuron 3) increasing the GHCN density from 0 to2 S/m2 resulted in an advance of the fast rebound by 50 ms whilehaving little influence on the rebound pattern. The stimulus here was a500 ms voltage clamp to −90 mV. The current plots show that IHCNactivated gradually over the course of the voltage-clamp hyperpolar-ization, and that following stimulus offset this led to a substantialinward current that sped up depolarization. Due to the reversalpotential of IHCN at −45 mV this current was much diminished duringrebound spiking and turned into a transient outward current duringeach spike. Using a voltage clamp stimulus isolated the effect of IHCNactivation on rebound rates, since a current injection stimulus withvarying GHCN densities would also lead to varying hyperpolarizationpotentials and thus would change the de-inactivation of GNaP andGCaT. (b) Rebound rate histograms show the graded dependence ofrebound delay on the level of GHCN present. These histograms areconstructed by calculating an instantaneous spiking rate trace for eachsimulation (see Section 2), and by subtracting the spike rate in asimulation without hyperpolarizing stimulus from the otherwiseidentical simulation containing this stimulus. Thus, the spike ratebefore the stimulus subtracts to 0, during the hyperpolarizing stimulusthe difference between background and stimulated trace drops to thenegative of the spontaneous firing rate, and after the stimulus therebound spike rate shows an increase in spiking above baseline. Insetsshow the graded delay of the fast rebound at a higher temporalresolution. (c) Dependence of rebound latency after stimulus offset onGHCN. (d–f) The same effects of GHCN were seen for a reduced GNaP
and increased GCaT (Neuron 1). Note that GHCN in this case alsosignificantly shaped the rebound pattern in that it suppresses theoscillatory nature of the ICaT rebound (see Section 3). A density of2 S/m2 GHCN led to a current of −220 pA at 150 ms following stimulusoffset, which presented the critical time window to prevent the ISKinduced pause
R
J Comput Neurosci (2011) 30:633–658 643

depolarization, and although they are de-inactivated duringhyperpolarization they required another current to depolar-ize the neuron before they could create a rebound followinghyperpolarization. This current was provided by IHCNactivation, which reduced the rebound latency by up to50 ms. Over a 4-fold range of GHCN levels from 0.5 to2.0 S/m2, which resulted in matches with experimentalvariability in sag amplitudes with hyperpolarizing currentinjection (range 3.6 to 29.7 mV, N=46 neurons analyzed),the difference in delay was about 15 ms (Fig. 5(c, f)). Thisdifference in rebound delay covers a behaviorally relevanttime scale; for example in the control of delay eye-blinkconditioning (Choi and Moore 2003) or throwing move-ments (Timmann et al. 2001) the cerebellum is believed tocontrol muscle coordination to a precision of only a fewms. Therefore, a modulation of IHCN in vivo, for exampledue to its modulation by cyclic nucleotides (Surges et al.2006), could lead to a functionally significant adaptation ofrebound timing.
A second modulation of rebounds by IHCN occurred byeliminating the pause between the fast rebound bursts andthe prolonged rebound period that was most pronouncedfor neurons with high GCaT and low GNaP densities(Neuron 1, Fig. 5(d)). This pause was triggered by anincreased activation of ISK during the initial spike burst,which could be counteracted by IHCN in the matching timewindow. In fact, IHCN could recover the early phase of theprolonged rebound period when INaP was otherwisedeactivated due to the hyperpolarization associated withthe pause (Fig. 5(d)). In the absence of any INaP and IHCNthe model generated repetitive fast rebound bursts due toICaT activation (supplemental Fig. 2), which we observedin two out of our 132 experimental recordings as well. Thepresence of IHCN suppressed such repetitive burstingfollowing negative current injection by limiting thehyperpolarization and thus de-inactivation of ICaT duringrepetitive post-burst pauses.
3.5 Rebounds depend on hyperpolarization durationand depth
In vivo one would expect hyperpolarization due to stronginhibitory input to be of varying depth and duration. Thisraises the question how rebounds can be shaped by theseparameters. In a first series of simulations, we investigatedthis by varying the duration and amplitude of currentinjection pulses.
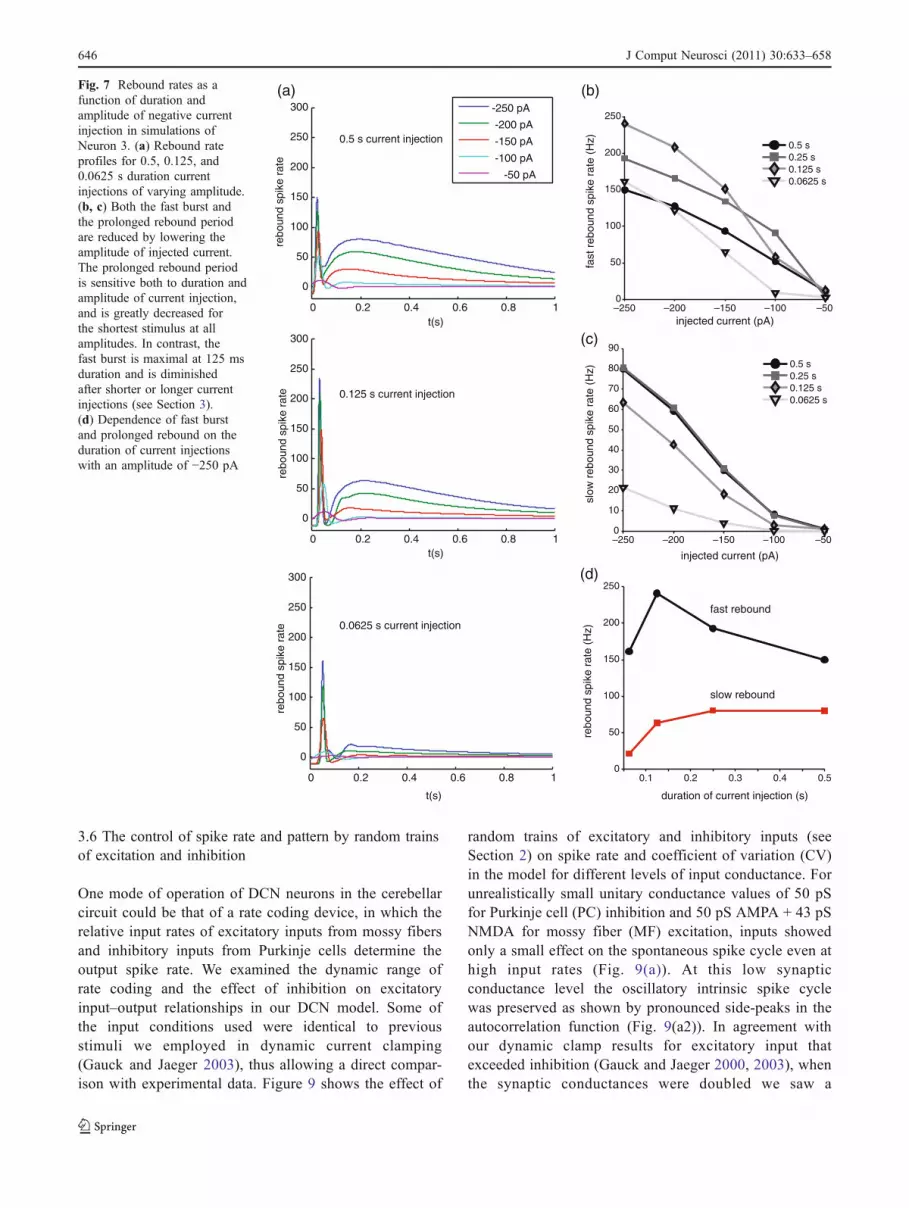
We found that for our default current injection period of250 ms the prolonged rebound increased gradually with theamount of negative current injected and the resulting level ofhyperpolarization (shown for Neuron 3 in Fig. 6(a, b)). Thefast burst was also much increased for −250 pA comparedto −100 pA current injection (Neuron 1, Fig. 6(c, d)), though
it was already more robustly expressed at lower injectionlevels than the prolonged rebound (Fig. 6(b)).
The effect of stimulus amplitude was preserved fordifferent stimulus durations, but stimulus duration hadimportant additional effects. Because the de-inactivationtime constant of ICaT was much shorter than that of INaP(101 vs 483 ms at −80 mV), a fast rebound could developalready after short hyperpolarizing stimuli of 62.5 ms,whereas it took stimuli of at least 125 ms duration to evokea strong prolonged rebound (Figs. 7, 8).
GHCN had a modulatory influence on the effects ofstimulus duration and amplitude on rebound expression.When the density of GHCN was high (Neuron 3, Fig. 7(a–c)), there was a pronounced reduction of fast and slowrebound rates when reducing the level of current injectionfrom −250 pA to −100 pA, with a decrease in fast and slowrebound rates from 193 Hz to 93 Hz and 80 Hz to 8 Hz,respectively. This result can be easily understood byconsidering the half-inactivation voltages of INaP and ICaT,which are −80 mV in both cases. This level of hyperpolar-ization was not reached for −100 pA current injection in thepresence of the high GHCN density in Neuron 3 due to thevoltage sag it introduced.
The effect of GHCN on fast and slow rebound compo-nents was strongly dependent on stimulus duration due tothe gradual activation of IHCN and ensuing voltage sag. Inparticular, for the high level of GHCN in Neuron 3 therelationship between fast rebound rate and current injectionduration showed a maximum at 125 ms (Fig. 7(d)), becausefor longer stimuli the voltage sag due to IHCN led to areduction in ICaT de-inactivation. In contrast, the depen-dence of slow rebound rate on current injection durationwas monotonically increasing. This was due to the slowtime course of INaP de-inactivation, which could not takeplace during short stimuli when IHCN did not dampenresponses.
The timing of the fast rebound burst also depended on theduration and depth of hyperpolarization (shown for Neuron 1in Fig. 8(a, c)). For short current injection pulses (62.5 ms),increasing the current amplitude from −100 pA to −250 pAincreased the delay in the fast rebound burst by 12 ms(Fig. 8(c)). In contrast, for long current injections (500ms), thefast rebound occurred 8 ms earlier when the current injectionamplitude was increased by the same amount (Fig. 8(c)). Thiscan be explained by the action of IHCN on shortening rebounddelays (Figs. 5, 6): due to the IHCN activation time constant of400 ms a current injection duration of 62.5 ms led to muchless IHCN activation than a current injection duration of500 ms. Thus, the timing of fast rebounds in response to longcurrent injection pulses is determined by the amount of IHCNactivation, while the latency of rebounds for short currentpulses is governed by the level of hyperpolarization and theresulting repolarization time.
644 J Comput Neurosci (2011) 30:633–658

Overall, these results predict that the fast and slowrebound components are controlled differentially by theduration of a strong inhibitory input burst from Purkinjecells, and that this effect is modulated by IHCN. Thiswould allow different time courses of PC input bursts toDCN neurons to trigger different patterns of post-inhibitory responses, with only long bursts resulting in aprolonged rebound period. Because of some uncertainty
as to the precise time constants and voltage-dependenceof the NaP and CaT rebound conductances in DCNneurons the detailed numbers for these relationshipsfound in the model are not likely to be fully accurate,however. Our results point out that the functionalsignificance of these parameters could be high andtherefore an accurate experimental determination will beimportant.
20 m
V
-250 pA -200 pA -150 pA -100 pA -50 pA
Neuron 3 model Neuron 1 model
-100 pA -100 pA
500 ms
-250 pA -250 pA
(a)
(b)
(c)
(d)
0 0.5 1 1.5 2−20
0
20
40
60
80
100
120
140
160
180
200
rebo
und
spik
e ra
te
t(s)
0 0.5 1 1.5 2
0
50
100
150
200
250
300
350
400
rebo
und
spik
e ra
te
t(s)
fast rebound(expanded)
fast rebound(expanded)
10 ms 10 ms
250
pA ICaTINaPIH
250
pA
250
pA25
0 pA
1.7 nΑ
5.7 nA
Fig. 6 Dependence of rebound strength on depth of precedinghyperpolarization. (a) The rebound for this combination of reboundconductances with a high GNaP density (simulating Neuron 3 in Fig. 3)shows a pronounced increase in firing rate during the prolongedrebound period when the negative current injection (250 ms duration)is increased from −100 pA to −250 pA. The fast rebound due to ICaT isalso increased by increasing the negative current injection, but not asmuch. The peak hyperpolarization during the 250 ms −100 nA cipwas −77 mV, whereas it was −97 mV for −250 pA. Note the increasein IHCN activation (blue current trace) with the −250 pA stimulus. (b)Rebound rate histograms show the graded dependence of reboundspiking on the preceding hyperpolarization. The peak rebound rateshown for the fast rebound depends on the shortest inter-spike interval(ISI) present, which lengthens for diminished stimulus amplitudes, butalso depends on the number of spikes in the fast rebound (three spikesfor −200 and −250 pA, 2 for −150 and −100 pA, 0 for −50 pA)
because several spikes at short intervals increase the instantaneousspike rate through local averaging by the addition of Gaussians (seeSection 2). (c) The same current injection stimuli as in (a) are shown forour simulation of Neuron 1 (Fig. 3). This simulation has a lower densityof GNaP and GHCN, but a higher density of GCaT. Due the presence ofless GHCN the hyperpolarization reached in this simulation is larger thanthat for Neuron 3 and reached −81 mV for −100 pA and −104 mV for−250 pA. (d) Rebound rate histograms showing a robust fast reboundfor most current injection levels. There is a small persistent spike rateincrease with large negative current injection, which amounts to anincrease in spike rate from 12.1 Hz spontaneous activity to 18.8 Hzduring the prolonged rebound period following −250 pA currentinjection (rate averaged over 500 ms). The fast rebound burst in thepresence of high GCaT density is robust from −150 to −250 pA currentinjections. The number of spikes in the fast rebound was 6 for −250 and−200 pA, 5 for −200 pA, 3 for −150 pA, and 0 for −50 pA
J Comput Neurosci (2011) 30:633–658 645
3.6 The control of spike rate and pattern by random trainsof excitation and inhibition
One mode of operation of DCN neurons in the cerebellarcircuit could be that of a rate coding device, in which therelative input rates of excitatory inputs from mossy fibersand inhibitory inputs from Purkinje cells determine theoutput spike rate. We examined the dynamic range ofrate coding and the effect of inhibition on excitatoryinput–output relationships in our DCN model. Some ofthe input conditions used were identical to previousstimuli we employed in dynamic current clamping(Gauck and Jaeger 2003), thus allowing a direct compar-ison with experimental data. Figure 9 shows the effect of
random trains of excitatory and inhibitory inputs (seeSection 2) on spike rate and coefficient of variation (CV)in the model for different levels of input conductance. Forunrealistically small unitary conductance values of 50 pSfor Purkinje cell (PC) inhibition and 50 pS AMPA + 43 pSNMDA for mossy fiber (MF) excitation, inputs showedonly a small effect on the spontaneous spike cycle even athigh input rates (Fig. 9(a)). At this low synapticconductance level the oscillatory intrinsic spike cyclewas preserved as shown by pronounced side-peaks in theautocorrelation function (Fig. 9(a2)). In agreement withour dynamic clamp results for excitatory input thatexceeded inhibition (Gauck and Jaeger 2000, 2003), whenthe synaptic conductances were doubled we saw a
0 0.2 0.4 0.6 0.8 1
0
50
100
150
200
250
300
rebo
und
spik
e ra
te
t(s)
0 0.2 0.4 0.6 0.8 1
0
50
100
150
200
250
300
rebo
und
spik
e ra
te
t(s)
0 0.2 0.4 0.6 0.8 1
0
50
100
150
200
250
300
rebo
und
spik
e ra
te
t(s)
-250 pA
-200 pA
-150 pA
-100 pA
-50 pA
0.5 s current injection
0.125 s current injection
0.0625 s current injection
(a) (b)
–250 –200 –150 –100 –500
50
100
150
200
250
injected current (pA)
fast
reb
ound
spi
ke r
ate
(Hz)
0.5 s0.25 s0.125 s0.0625 s
–250 –200 –150 –100 –500
10
20
30
40
50
60
70
80
90
injected current (pA)
slow
reb
ound
spi
ke r
ate
(Hz)
0.1 0.2 0.3 0.4 0.50
50
100
150
200
250
duration of current injection (s)
rebo
und
spik
e ra
te (
Hz)(d)
(c)
0.5 s0.25 s0.125 s0.0625 s
fast rebound
slow rebound
Fig. 7 Rebound rates as afunction of duration andamplitude of negative currentinjection in simulations ofNeuron 3. (a) Rebound rateprofiles for 0.5, 0.125, and0.0625 s duration currentinjections of varying amplitude.(b, c) Both the fast burst andthe prolonged rebound periodare reduced by lowering theamplitude of injected current.The prolonged rebound periodis sensitive both to duration andamplitude of current injection,and is greatly decreased forthe shortest stimulus at allamplitudes. In contrast, thefast burst is maximal at 125 msduration and is diminishedafter shorter or longer currentinjections (see Section 3).(d) Dependence of fast burstand prolonged rebound on theduration of current injectionswith an amplitude of −250 pA
646 J Comput Neurosci (2011) 30:633–658

reduction in regularity of spiking and an increase in spikerate (Fig. 9(b)). Finally, a further doubling of the synapticconductance led to a complete loss of autocorrelation side-peaks, a further decrease in regularity, and a further increase inspike rate (Fig. 9(c)). At this strength of input, the timing ofindividual spikes was determined by transients in the synapticconductance pattern, and the intrinsic oscillatory spike cyclewas overridden (Fig. 9(c2)). The four-fold increase ofsynaptic conductance levels from 50 pS to 200 pS resultedin a spike rate increase from 17.4 Hz to 37.1 Hz (Fig. 9(d))and an increase in CV from 0.12 to 0.39 (Fig. 9(e)).
We performed additional control simulations that incor-porated a different set of unitary synaptic kinetics suggestedby recent publications that most prominently include ashorter decay time constant and larger unitary amplitudesfor GABAA IPSCs (Pugh and Raman 2006; Telgkamp et al.2004). These larger but shorter unitary events led to spiketrain properties similar to those exhibited by the standardmodel for the highest unitary synaptic conductances,although the spike rate and the CV were slightly higher(46.2 Hz vs. 37.1 Hz and CV=0.46 vs. CV=0.39, seeFig. 9(d, e) and cf. Figure 9(c) with Supplemental Fig. 4).This insensitivity of the firing rate to EPSC and IPSCparameters is not surprising, since the neuron’s spike train iscontrolled by the total ensemble of thousands of inputs each
second, in which temporal conductance fluctuations aredominated by the population statistics of inputs, and not bythe size and shape of unitary events (Gauck and Jaeger 2003).
The spike trains and ISI histograms resulting from oursimulations with strong synaptic inputs are similar to invivo DCN recordings from anesthetized rats (Rowland andJaeger 2005). It is interesting that realistic spike rates muchexceeding the spontaneous spike frequency were obtainedwhen the model received 1,800 inhibitory inputs per secondcompared to 450 excitatory ones. This result can beexplained by the much smaller driving force of GABAA
than AMPA and NMDA conductance at the membranepotential between spikes and was also observed in ourprevious dynamic clamp experiments (Gauck and Jaeger2003). Therefore, the quantitative relationships betweensynaptic conductance levels and ensuing synaptic currentsdemonstrated in our simulations help explain the apparentparadox that DCN neurons show fast spike rates in vivodespite much higher inhibitory than excitatory input rates.
When the level of Purkinje cell inhibition was increased,the curves for output spiking vs. input excitation wereshifted to the right (Fig. 10(a1–c1)), suggesting thatinhibition performed an additive operation on the input–output curve. The additive input modulation performed byinhibitory input is reflected by the nearly perfect overlay of
0.5 s current injection
0.0625 s current injection
(a) (b)
0 0.2 0.4 0.6 0.8 1
0
50
100
150
200
250
300
350
400
rebo
und
spik
e ra
te
t(s)
0 0.2 0.4 0.6 0.8 1
0
50
100
150
200
250
300
350
400
rebo
und
spik
e ra
te
t(s)
fast rebound(expanded)
10 ms
10 ms
−250 −200 −150 −100
−250 −200 −150 −100
150
200
250
300
350
400
injected current (pA)
rebo
und
spik
e ra
te (
Hz)
0.02
0.025
0.03
0.035
0.04
0.045
0.05
0.055
0.06
injected current (pA)
rebo
und
late
ncy
(s)
(c)
0.5 s0.25 s0.125 s0.0625 s
-250 pA
-200 pA
-150 pA
-100 pA
-50 pA
Fig. 8 Rebound rates andlatencies for different currentinjection amplitudes anddurations in simulations ofNeuron 1. (a) Rebound rateprofiles for 0.5 and 0.0625 sduration current injections ofvarying amplitude. For thelongest current injection, eventhis low density of GNaP leadsto a prolonged rebound periodfrom 12.1 Hz baseline to23.2 Hz after −250 pA currentinjection (rate averaged over500 ms). (b) For all durationsof current injection, the reboundspike rate increases with theamplitude of injected current. (c)The relationship between currentamplitude and rebound latencyis more complex. Whilelowering the amplitude ofinjected current increases therebound latency for long currentinjections, the relationship isreversed for short currentinjections. This effect is due toIHCN (see Section 3 and Fig. 5)
J Comput Neurosci (2011) 30:633–658 647

input–output curves that have been shifted along the inputaxis (Fig. 10(a2–c2), shift=−6.5 n Hz where n = inhibitoryinput rate/10 Hz). However, the model does not includeshort-term synaptic plasticity, which can alter the type ofoperation performed by inhibition (Rothman et al. 2009).
When the CaTand NaP rebound conductances were halved(Fig. 10(d1–2)) the input–output relationships were virtuallyunchanged, indicating that the necessary depth of hyperpo-larization to de-inactivate ICaT and INaP was not reached. Thisindicated that rebound conductances played little role in ratecoding in the DCN unless their kinetics were modulated tode-inactivate at more depolarized potentials.
Overall, our results suggest that by adjusting the relativerates of excitatory and inhibitory input DCN neurons arecapable of performing approximately linear transformationsof the rate coded input–output relationship.
3.7 Rebounds in response to strong bursts of Purkinje cellinputs are strongly influenced by the chloride reversalpotential
The question of whether the pronounced rebound behaviorof DCN neurons plays a significant role for synaptic codingin vivo is currently under active debate (Alvina et al. 2008;
200 ms
20 m
V
1
2
3
even
ts/s
1
2
3
even
ts/s
1
2
3
20 40 60 80 100 120 140 160 180 200ms
20 40 60 80 100 120 140 160 180 200ms
20 40 60 80 100 120 140 160180 200ms
even
ts/s
(a1) (a2)
(b1) (b2)
(c1) (c2)
low Gsyn
high Gsyn
intermediate Gsyn
(d) (e)
0 200 400 600 800 100015
20
25
30
35
40
45
50
unitary Gsyn (pS)
Spi
ke r
ate
(Hz)
0 200 400 600 800 10000.1
0.15
0.2
0.25
0.3
0.35
0.4
0.45
0.5
unitary Gsyn (pS)
CV
Fig. 9 Control of spiking by abackground of randomly timedexcitatory and inhibitory inputs.a–c The pattern of synapticinput consists of the randomactivation of excitatory inputs at30 Hz and inhibitory inputs at40 Hz (see Section 2) and isidentical for all 3 simulationsshown. The amplitude of unitaryEPSC and IPSC is multiplied bya factor of 2 between low andintermediate and intermediateand high unitary synapticconductances (Gsyn). For thelowest Gsyn values the GABAA
peak conductance is 50 pS, theAMPA peak conductance is also50 pS, and the NMDA peakconductance (slow + fast, seeSection 2) is 43 pS. For this lowGsyn (a) spiking is nearly regularand only mildly increased infrequency (17.5 Hz) from thespontaneous firing at 12.3 Hz.As Gsyn increases (b, c) thespontaneous oscillatory cycle isdisrupted, and spiking becomesmore irregular (increasing CV).In addition, for this ratio ofinhibition and excitation spikingspeeds up with increasing Gsyn.The bar graphs in (a2–c2) showISI histograms, while the greyline shows the autocorrelationplot of the spike train. (d, e)Dependence of spike rate (d)and CV (e) of the simulatedspike trains on Gsyn. All plotsare constructed from a total datasegment of 3.2 s duration. Amodel with GNaP of 8, GHCN of0.8, and GCaT of 2 S/m2 wasused, however, theseconductances have littleinfluence on the response tobackground inputs (see Fig. 10)
648 J Comput Neurosci (2011) 30:633–658

Pedroarena 2010; Tadayonnejad et al. 2009). In sliceexperiments with intracellular current injection neuronsare easily driven to −100 mV or below. In contrast,inhibitory synaptic input bursts can only drive neuronsclose to the reversal potential of chloride (ECl), which canshow a wide range of values, but is generally more positivethan −90 mV in neurons. This could limit the expression ofrebound spiking in DCN neurons following inhibitory inputsince de-inactivation of rebound conductances might not
occur much at ECl. In addition, there is generally a highconductance baseline generated by background synapticinput in vivo (Destexhe et al. 2003; Stern et al. 1998),which could further diminish rebound firing throughsynaptic shunting of rebound responses. Such a baselineis certainly expected in DCN neurons, since Purkinje cellshave a high baseline of tonic activity, and it has beenestimated that each DCN neuron receives inputs from over800 Purkinje cells (Palkovits et al. 1977). Thus it is not at
(a1)
(b1)
(c1)
(a2)
(b2)
(c2)
low GsynGNaP = 8,GHCN = 0.8,GCaT = 2
high GsynGNaP = 8,GHCN = 0.8,GCaT = 2
intermediate GsynGNaP = 8,GHCN = 0.8,GCaT = 2
0 10 20 30 40 500
20
40
60
80
100
120
outp
ut r
ate
excitatory input rate
0
50
100
150
200
250
outp
ut r
ate
0 10 20 30 40 500
40
80
120
160
outp
ut r
ate
excitatory input rate
0 10 20 30 40 500
50
100
150
200
250
outp
ut r
ate
excitatory input rate
0 10 20 30 40 500
40
80
120
160
outp
ut r
ate
excitatory input rate
0
40
80
120
160
outp
ut r
ate
−40 −30 −20 −10 0 10 20 30 40 500
20
40
60
80
100
120
outp
ut r
ate
excitatory input rate
−40 −30 −20 −10 0 10 20 30 40 50excitatory input rate
−40 −30 −20 −10 0 10 20 30 40 50excitatory input rate
−40 −30 −20 −10 0 10 20 30 40 50excitatory input rate
0
40
80
120
160
outp
ut r
ate
(d1) (d2)intermediate GsynGNaP = 4,GHCN = 0.8,GCaT = 1
40 Hz
30 Hz
20 Hz
10 Hz
0 Hz
50 Hz
40 Hz
30 Hz
20 Hz
10 Hz
0 Hz
50 Hz
40 Hz30 Hz20 Hz10 Hz0 Hz
50 Hz
40 Hz
30 Hz
20 Hz
10 Hz
0 Hz
50 Hz
inhibition
Fig. 10 Control of spike rate byvarying mean rates of excitatoryand inhibitory inputs. (a1) TheDCN neuron shows a near-linearrelationship between excitatoryinput rate and output spikerate for a low value of Gsyn.(a2) Inhibitory synaptic inputperforms an additive operation.This is shown by a nearlyperfect overlay of input–outputcurves that have been shifted mymultiples of −6.5 Hz along theinput axis (shift=−6.5 n Hz,where n = inhibitory inputrate/10 Hz). (b1, c1) At highGsyn, the relationships betweenexcitatory input rate and outputrate become less linear. (b2, c2)Inhibition still performs anadditive operation for highervalues of Gsyn, but the additionis less clear than for low Gsyn
values (shown by the lowerquality of the overlay ofinput–output curves that havebeen shifted by multiplesof −6.5 Hz along the input axis).(d1–2) The control of spikingby intermediate values ofGsyn for a different combinationof rebound conductances.There is virtually no effectof rebound conductances onthe control of output spikingby random background input(see Section 3)
J Comput Neurosci (2011) 30:633–658 649
all clear whether the strong rebound behavior of DCNneurons elicited with current injection in slice recordingshas much relevance for the dynamics of these neurons withsynaptic input in vivo. As already described in the
preceding text, a background of randomly timed inputsmodulated spiking in our DCN neuron model without anydiscernible involvement of rebound conductances. Toexamine whether rebound spiking could be elicited with
500 ms
20 m
V
ECl-80 mV
ECl-90 mV
ECl-90 mV
ECl-80 mV
500
pA
IAMPAINMDAIGABA-A
INaP
ICaT
ECl-90 mV
ECl-90 mV
Neuron 3 model Neuron 2 model(a)
(b)
(e)
(g)
0 pA
20 m
V
(c)
(f)
ECl-75 mV
ECl-70 mV
ECl-75 mV
ECl-70 mV
−90 −80 −75 −700
50
100
150
200
250
ECl (mV)
rebo
und
spik
e ra
te (
Hz)
−90 −80 −75 −700
50
100
150
200
250
ECl (mV)
rebo
und
spik
e ra
te (
Hz)
(d) (h)
650 J Comput Neurosci (2011) 30:633–658

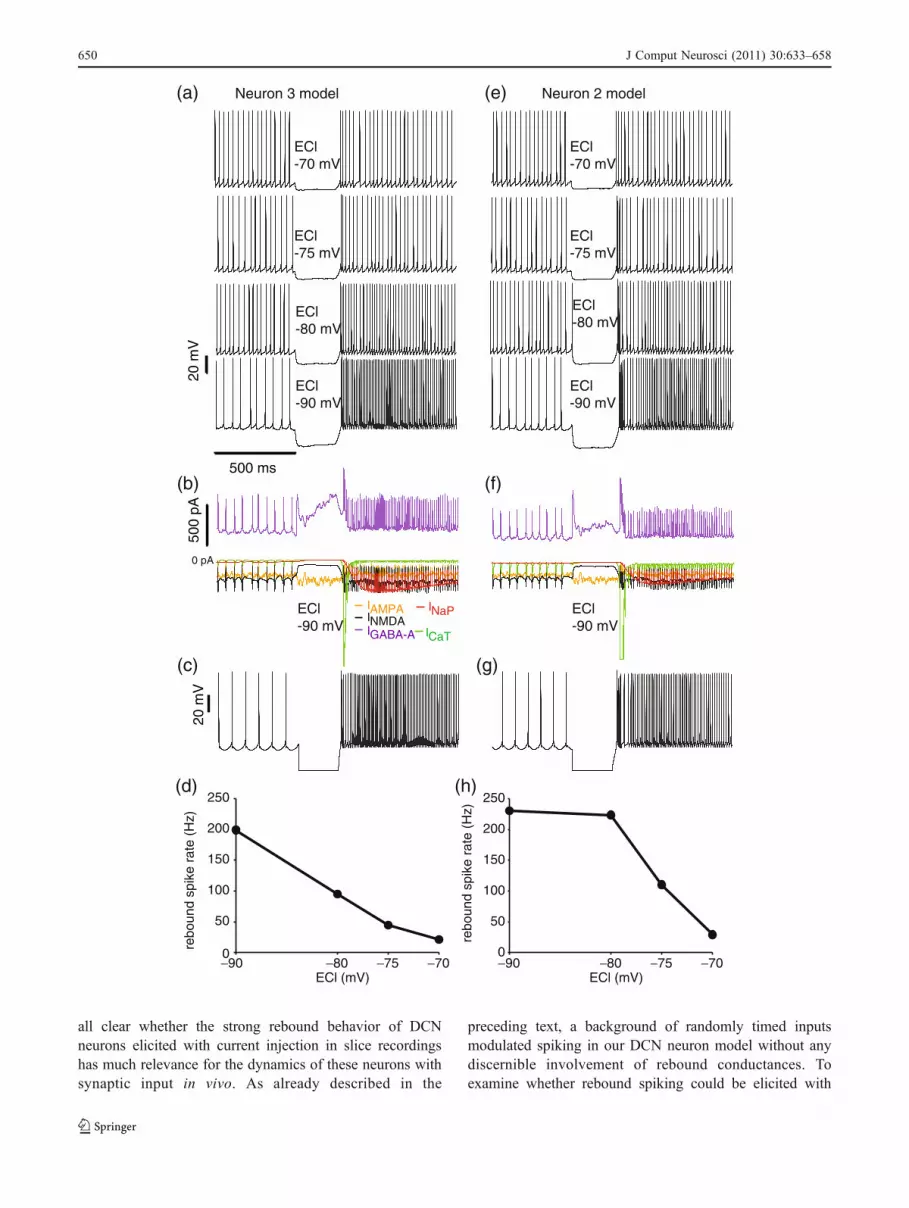
stronger bursts of inhibitory inputs we subjected our modelwith different combinations of realistic fast and slowrebound currents to strong increases in inhibitory input ratefor 250 ms in the presence of an ongoing background ofrandom input (Figs. 11, 12, and 13). First, we varied EClbetween −70 mV and −90 mV to determine its role ineliciting rebound spiking in the presence of synapticbackground inputs (Fig. 11(a, e)). We found that fast andprolonged rebound spiking could be generated in thepresence of background inputs, but only if ECl wassufficiently negative. The dependence of fast reboundspike rate on ECl in Neurons 2 and 3 is summarized inFig. 11(d, h). In both Neuron 2 and 3 models, raising EClfrom −90 mV to −70 mV led to a reduction of the fastrebound. However, the relationship between ECl and fastrebound spike rate was nearly linear for Neuron 3 with alow GCaT density (1.5 S/m2), while Neuron 2 with a higherGCaT density (4.5 S/m2) was much more robust againstraising ECl and showed fast rebound responses at more
than 100 Hz above baseline for ECl values of −75 mV andbelow.
The predicted dependence of rebound spike rate on ECl isclearly related to the half-inactivation voltage of our CaT andNaP conductances of −80 mV. As these half-inactivationvoltages are not well characterized for DCN neurons, thepotentials described above could well be shifted by values inthe order of 10 mV in actual DCN neurons. A recent studydetermining the activation of ICaT in DCN neurons (Zhengand Raman 2009) found that it activated only to a smalldegree at −75 mV, but activation rapidly increased afterhyperpolarization exceeding this value. The same study alsofound a modest 200–300 ms lasting spike rate increasefollowing hyperpolarization to −75 mV, suggesting a criticalthreshold for rebound expression around this level of averageECl. Together, these data and our simulations lead to theprediction that a modulation of ECl on the order of 5–10 mVwould have a strong effect on the expression of rebounds invivo, as would a shift in half-inactivation voltages of reboundconductances. Interestingly, recent work shows that all theseparameters are variable and subject to neuromodulation (seeSection 4), suggesting that the rebound behavior of DCNneurons could be regulated and/or subject to plasticitymechanisms in vivo.
3.8 Rebound responses are only mildly shunted by synapticinput conductances
When plotting the individual currents summed across allcompartments of our DCN model during a post-inhibitoryrebound with background synaptic input at intermediategain, we found that the synaptic and INaP rebound currentwere of nearly equal amplitudes (Fig. 11(b, e)). However,the inhibitory and excitatory synaptic currents nearlybalanced each other, leading to a small net synaptic inwardcurrent of −58 pA during baseline firing for the simulationshown in Fig. 11(a) (bottom). In contrast, the inward INaPplateau current during the rebound (300–500 ms afteroffset of inhibitory burst) had a much larger amplitudeof −303 pA. This current is counteracted by an increase insynaptic current to the degree that the depolarization causedby INaP shifts the synaptic driving forces. However, theaverage membrane potential only depolarized by 6.5 mVduring the INaP rebound compared to baseline, resulting in achange in synaptic current of 42 pA. This effect cancelledonly 14% of the −303 pA INaP plateau current, and stillallowed this current to cause a large increase in spike ratefrom 19.1 Hz during baseline to 100 Hz after the PC inputburst. Because the rebound-elicited shift in synaptic drivingforce was small, the rebound response observed with achloride reversal potential of −90 mV in the presence ofongoing synaptic background was very similar to therebound following a voltage clamp stimulus to −90 mV
Fig. 11 Rebound spiking following inhibitory input bursts duringrandom background inputs: Dependence on chloride reversal poten-tial. (a) Simulation of Neuron 3. A background of 20 Hz excitationand 30 Hz inhibition is present throughout the simulation with varyingunitary inhibitory conductances (see below) and unitary excitatoryconductances of 100 pS for GAMPA and 86 pS for GNMDA
(intermediate gain, see Figs. 9, 10). An intense inhibitory input burst(300 Hz) is added for a 250 ms period. This high-frequency inhibitoryinput suppresses spiking and pushes the neuron close to the chloridereversal potential. Rebound spiking occurs at the offset of theinhibitory input burst. When the chloride reversal is set to −90 mV,a pronounced rebound is observed. Increasing the chloride reversalpotential to −80 mV and −75 mV results in a gradual reduction of therebound rate. At −70 mV ECl there are no discernible rebounds. Thesize of the unitary inhibitory conductance was adjusted for differentvalues of ECl to allow comparable spike rates to result from the sameinput pattern (50 pS for ECl of −90 and −80 mV, 80 pS for EClof −75 mV, and 120 pS for ECl of −70 mV). (b) Inward and outwardcurrents controlling the rebound. The synaptic currents (IAMPA, INMDA,IGABA) shown present the summed current of all synapses. Similarly,the voltage-gated rebound currents shown (INaP, ICaT) present thesummed current over all compartments. Before the hyperpolarizationcaused by the inhibitory input burst the rebound currents areinsignificant compared to the synaptic currents. After the offset ofhyperpolarization, the de-inactivated INaP (red trace) now has anamplitude comparable to the synaptic currents and has a dramaticinfluence on spiking. The CaT current far exceeds synaptic inputcurrent during the fast rebound (peak current truncated). Note that dueto its voltage dependence the NMDA current is much reduced duringhyperpolarization but increased during the rebound depolarization(black trace), while GABA (purple) and AMPA (orange) currents onlyshift with driving forces. (c) Rebound triggered by a −90 mV voltageclamp stimulus in the absence of synaptic input for the samecombination of rebound conductances as used in (a). (d) Relationshipbetween ECl and rebound spike rate in Neuron 3. (e–h) Simulations ofNeuron 2 show a similar effect of chloride reversal potential onrebound strength. However, the fast rebound burst in this neuron ismore robust and emerges at an ECl of −75 mV. Note that compared tothe simulations of Neuron 2 with current injection (Fig. 3) the sag dueto IHCN is again largely reduced, as is the pause following the fastrebound burst
R
J Comput Neurosci (2011) 30:633–658 651
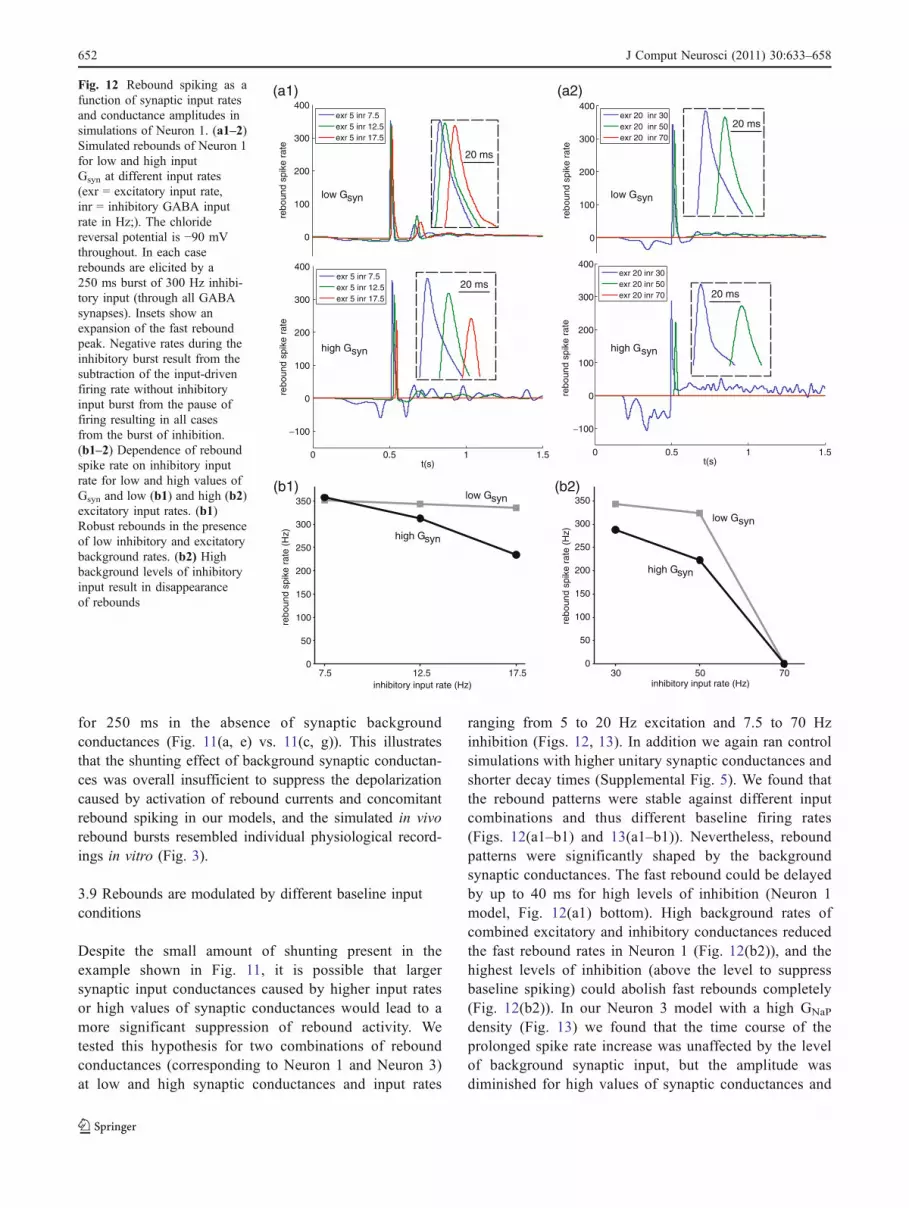
for 250 ms in the absence of synaptic backgroundconductances (Fig. 11(a, e) vs. 11(c, g)). This illustratesthat the shunting effect of background synaptic conductan-ces was overall insufficient to suppress the depolarizationcaused by activation of rebound currents and concomitantrebound spiking in our models, and the simulated in vivorebound bursts resembled individual physiological record-ings in vitro (Fig. 3).
3.9 Rebounds are modulated by different baseline inputconditions
Despite the small amount of shunting present in theexample shown in Fig. 11, it is possible that largersynaptic input conductances caused by higher input ratesor high values of synaptic conductances would lead to amore significant suppression of rebound activity. Wetested this hypothesis for two combinations of reboundconductances (corresponding to Neuron 1 and Neuron 3)at low and high synaptic conductances and input rates
ranging from 5 to 20 Hz excitation and 7.5 to 70 Hzinhibition (Figs. 12, 13). In addition we again ran controlsimulations with higher unitary synaptic conductances andshorter decay times (Supplemental Fig. 5). We found thatthe rebound patterns were stable against different inputcombinations and thus different baseline firing rates(Figs. 12(a1–b1) and 13(a1–b1)). Nevertheless, reboundpatterns were significantly shaped by the backgroundsynaptic conductances. The fast rebound could be delayedby up to 40 ms for high levels of inhibition (Neuron 1model, Fig. 12(a1) bottom). High background rates ofcombined excitatory and inhibitory conductances reducedthe fast rebound rates in Neuron 1 (Fig. 12(b2)), and thehighest levels of inhibition (above the level to suppressbaseline spiking) could abolish fast rebounds completely(Fig. 12(b2)). In our Neuron 3 model with a high GNaP
density (Fig. 13) we found that the time course of theprolonged spike rate increase was unaffected by the levelof background synaptic input, but the amplitude wasdiminished for high values of synaptic conductances and
low Gsyn low Gsyn
high Gsyn high Gsyn
(a1)
(b1)
0
100
200
300
400
rebo
und
spik
e ra
te
exr 5 inr 7.5exr 5 inr 12.5exr 5 inr 17.5
0 0.5 1 1.5
−100
0
100
200
300
400
rebo
und
spik
e ra
te
t(s)
0
100
200
300
400
rebo
und
spik
e ra
te
exr 20 inr 30exr 20 inr 50exr 20 inr 70
0 0.5 1 1.5
−100
0
100
200
300
400
rebo
und
spik
e ra
te
t(s)
20 ms
20 ms
20 ms20 ms
(a2)
(b2)
7.5 12.5 17.50
50
100
150
200
250
300
350
inhibitory input rate (Hz)
rebo
und
spik
e ra
te (
Hz)
30 50 700
50
100
150
200
250
300
350
inhibitory input rate (Hz)
rebo
und
spik
e ra
te (
Hz)
low Gsynhigh Gsyn
high Gsyn
low Gsyn
exr 20 inr 30exr 20 inr 50exr 20 inr 70
exr 5 inr 7.5exr 5 inr 12.5exr 5 inr 17.5
Fig. 12 Rebound spiking as afunction of synaptic input ratesand conductance amplitudes insimulations of Neuron 1. (a1–2)Simulated rebounds of Neuron 1for low and high inputGsyn at different input rates(exr = excitatory input rate,inr = inhibitory GABA inputrate in Hz;). The chloridereversal potential is −90 mVthroughout. In each caserebounds are elicited by a250 ms burst of 300 Hz inhibi-tory input (through all GABAsynapses). Insets show anexpansion of the fast reboundpeak. Negative rates during theinhibitory burst result from thesubtraction of the input-drivenfiring rate without inhibitoryinput burst from the pause offiring resulting in all casesfrom the burst of inhibition.(b1–2) Dependence of reboundspike rate on inhibitory inputrate for low and high values ofGsyn and low (b1) and high (b2)excitatory input rates. (b1)Robust rebounds in the presenceof low inhibitory and excitatorybackground rates. (b2) Highbackground levels of inhibitoryinput result in disappearanceof rebounds
652 J Comput Neurosci (2011) 30:633–658

abolished for combined high values of synaptic conduc-tance and high rates of excitatory and inhibitory input(Fig. 13(b2)). These results indicate that fast rebounds andprolonged spike rate increases can be modulated bysynaptic baseline conductances, but that the generaltemporal pattern of spike rate changes is independent ofthe level of background synaptic input.
4 Discussion
We have recorded and analyzed the firing properties ofan extensive set of DCN neurons and have constructedcomputer models of DCN neurons with properties thatmatch the spiking behavior including the heterogeneityof pronounced fast and slow post-hyperpolarizationrebound components. These models allowed us tocharacterize the main determinants of the reboundresponse. We have also used the model to explore theinput-output relationship of DCN neurons with complexsynaptic input patterns while manipulating and trackingthe effect of different active conductances in ways notaccessible to physiological recordings. We found thatDCN neurons have a large dynamic range of outputfiring rates and that inhibitory input performs an additive
input modulation. Moreover, following strong bursts ofinhibitory inputs, rebounds due to the de-inactivation ofCaT and NaP conductances could be elicited in thepresence of background rates of randomly timed inputsexpected in vivo (Destexhe et al. 2003; Gauck and Jaeger2003; Stern et al. 1998), but this rebound was highlydependent on the value of ECl. Our model suggests thatfast and slow components of DCN rebounds could beregulated differentially by the depth and duration ofpreceding hyperpolarization, and that neurons could beadapted to different rebound profiles by adjusting thedensity of HCN, CaT, and NaP conductances. Stronginhibitory input transients to DCN neurons could becaused in vivo by tightly correlated climbing fiber inputsto populations of Purkinje cells resulting in simultaneouscomplex spiking (Lang et al. 1999). Alternatively, corre-lated increases in Purkinje cell firing rate could be due tomossy fiber activation following sensory stimulation(Jaeger 2003; Shin et al. 2007). The ensuing intrinsicdynamics of rebound conductance activation could shapetemporal patterns of DCN neuron activation duringbehavior. Our results suggest that a fast burst and aprolonged rebound period represent two different phasesof such activity patterns that could be modulated by thedensity of these conductances.
low Gsyn low Gsyn
high Gsyn high Gsyn
(a1)
(b1)
0
100
200
rebo
und
spik
e ra
te
0
100
200
rebo
und
spik
e ra
te
0 0.5 1 1.5
−100
0
100
200
rebo
und
spik
e ra
te
t(s)0 0.5 1 1.5
−100
0
100
200
rebo
und
spik
e ra
te
t(s)
(a2)
(b2)
7.5 12.5 17.50
20
40
60
80
100
120
140
inhibitory input rate (Hz)
rebo
und
spik
e ra
te (
Hz)
30 50 700
20
40
60
80
100
120
140
inhibitory input rate (Hz)
rebo
und
spik
e ra
te (
Hz)
low Gsyn
low Gsyn
high Gsynhigh Gsyn
exr 5 inr 7.5exr 5 inr 12.5exr 5 inr 17.5
exr 20 inr 30exr 20 inr 50exr 20 inr 70
Fig. 13 Simulated reboundsfor Neuron 3 under the sameinput conditions as for Fig. 12(Neuron 1). (a1–2) Reboundrate profiles for two differentsets of synaptic conductancesand different background levelsof excitatory and inhibitoryinput. (b1–2) Rebounds arerobust in the presence oflow inhibitory and excitatorybackground levels, but disap-pear in the presence of highinhibitory levels with highGsyn values
J Comput Neurosci (2011) 30:633–658 653
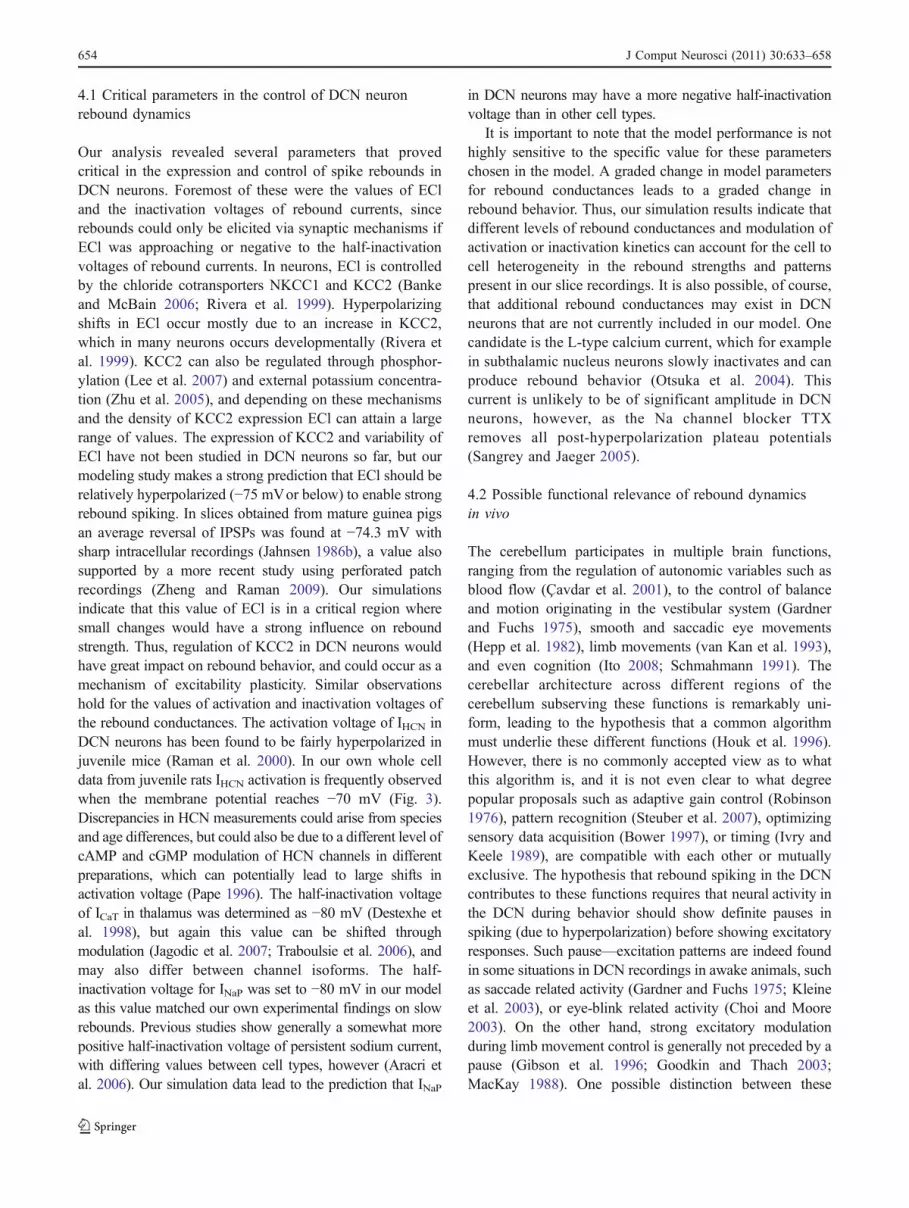
4.1 Critical parameters in the control of DCN neuronrebound dynamics
Our analysis revealed several parameters that provedcritical in the expression and control of spike rebounds inDCN neurons. Foremost of these were the values of ECland the inactivation voltages of rebound currents, sincerebounds could only be elicited via synaptic mechanisms ifECl was approaching or negative to the half-inactivationvoltages of rebound currents. In neurons, ECl is controlledby the chloride cotransporters NKCC1 and KCC2 (Bankeand McBain 2006; Rivera et al. 1999). Hyperpolarizingshifts in ECl occur mostly due to an increase in KCC2,which in many neurons occurs developmentally (Rivera etal. 1999). KCC2 can also be regulated through phosphor-ylation (Lee et al. 2007) and external potassium concentra-tion (Zhu et al. 2005), and depending on these mechanismsand the density of KCC2 expression ECl can attain a largerange of values. The expression of KCC2 and variability ofECl have not been studied in DCN neurons so far, but ourmodeling study makes a strong prediction that ECl should berelatively hyperpolarized (−75 mVor below) to enable strongrebound spiking. In slices obtained from mature guinea pigsan average reversal of IPSPs was found at −74.3 mV withsharp intracellular recordings (Jahnsen 1986b), a value alsosupported by a more recent study using perforated patchrecordings (Zheng and Raman 2009). Our simulationsindicate that this value of ECl is in a critical region wheresmall changes would have a strong influence on reboundstrength. Thus, regulation of KCC2 in DCN neurons wouldhave great impact on rebound behavior, and could occur as amechanism of excitability plasticity. Similar observationshold for the values of activation and inactivation voltages ofthe rebound conductances. The activation voltage of IHCN inDCN neurons has been found to be fairly hyperpolarized injuvenile mice (Raman et al. 2000). In our own whole celldata from juvenile rats IHCN activation is frequently observedwhen the membrane potential reaches −70 mV (Fig. 3).Discrepancies in HCN measurements could arise from speciesand age differences, but could also be due to a different level ofcAMP and cGMP modulation of HCN channels in differentpreparations, which can potentially lead to large shifts inactivation voltage (Pape 1996). The half-inactivation voltageof ICaT in thalamus was determined as −80 mV (Destexhe etal. 1998), but again this value can be shifted throughmodulation (Jagodic et al. 2007; Traboulsie et al. 2006), andmay also differ between channel isoforms. The half-inactivation voltage for INaP was set to −80 mV in our modelas this value matched our own experimental findings on slowrebounds. Previous studies show generally a somewhat morepositive half-inactivation voltage of persistent sodium current,with differing values between cell types, however (Aracri etal. 2006). Our simulation data lead to the prediction that INaP
in DCN neurons may have a more negative half-inactivationvoltage than in other cell types.
It is important to note that the model performance is nothighly sensitive to the specific value for these parameterschosen in the model. A graded change in model parametersfor rebound conductances leads to a graded change inrebound behavior. Thus, our simulation results indicate thatdifferent levels of rebound conductances and modulation ofactivation or inactivation kinetics can account for the cell tocell heterogeneity in the rebound strengths and patternspresent in our slice recordings. It is also possible, of course,that additional rebound conductances may exist in DCNneurons that are not currently included in our model. Onecandidate is the L-type calcium current, which for examplein subthalamic nucleus neurons slowly inactivates and canproduce rebound behavior (Otsuka et al. 2004). Thiscurrent is unlikely to be of significant amplitude in DCNneurons, however, as the Na channel blocker TTXremoves all post-hyperpolarization plateau potentials(Sangrey and Jaeger 2005).
4.2 Possible functional relevance of rebound dynamicsin vivo
The cerebellum participates in multiple brain functions,ranging from the regulation of autonomic variables such asblood flow (Çavdar et al. 2001), to the control of balanceand motion originating in the vestibular system (Gardnerand Fuchs 1975), smooth and saccadic eye movements(Hepp et al. 1982), limb movements (van Kan et al. 1993),and even cognition (Ito 2008; Schmahmann 1991). Thecerebellar architecture across different regions of thecerebellum subserving these functions is remarkably uni-form, leading to the hypothesis that a common algorithmmust underlie these different functions (Houk et al. 1996).However, there is no commonly accepted view as to whatthis algorithm is, and it is not even clear to what degreepopular proposals such as adaptive gain control (Robinson1976), pattern recognition (Steuber et al. 2007), optimizingsensory data acquisition (Bower 1997), or timing (Ivry andKeele 1989), are compatible with each other or mutuallyexclusive. The hypothesis that rebound spiking in the DCNcontributes to these functions requires that neural activity inthe DCN during behavior should show definite pauses inspiking (due to hyperpolarization) before showing excitatoryresponses. Such pause—excitation patterns are indeed foundin some situations in DCN recordings in awake animals, suchas saccade related activity (Gardner and Fuchs 1975; Kleineet al. 2003), or eye-blink related activity (Choi and Moore2003). On the other hand, strong excitatory modulationduring limb movement control is generally not preceded by apause (Gibson et al. 1996; Goodkin and Thach 2003;MacKay 1988). One possible distinction between these
654 J Comput Neurosci (2011) 30:633–658
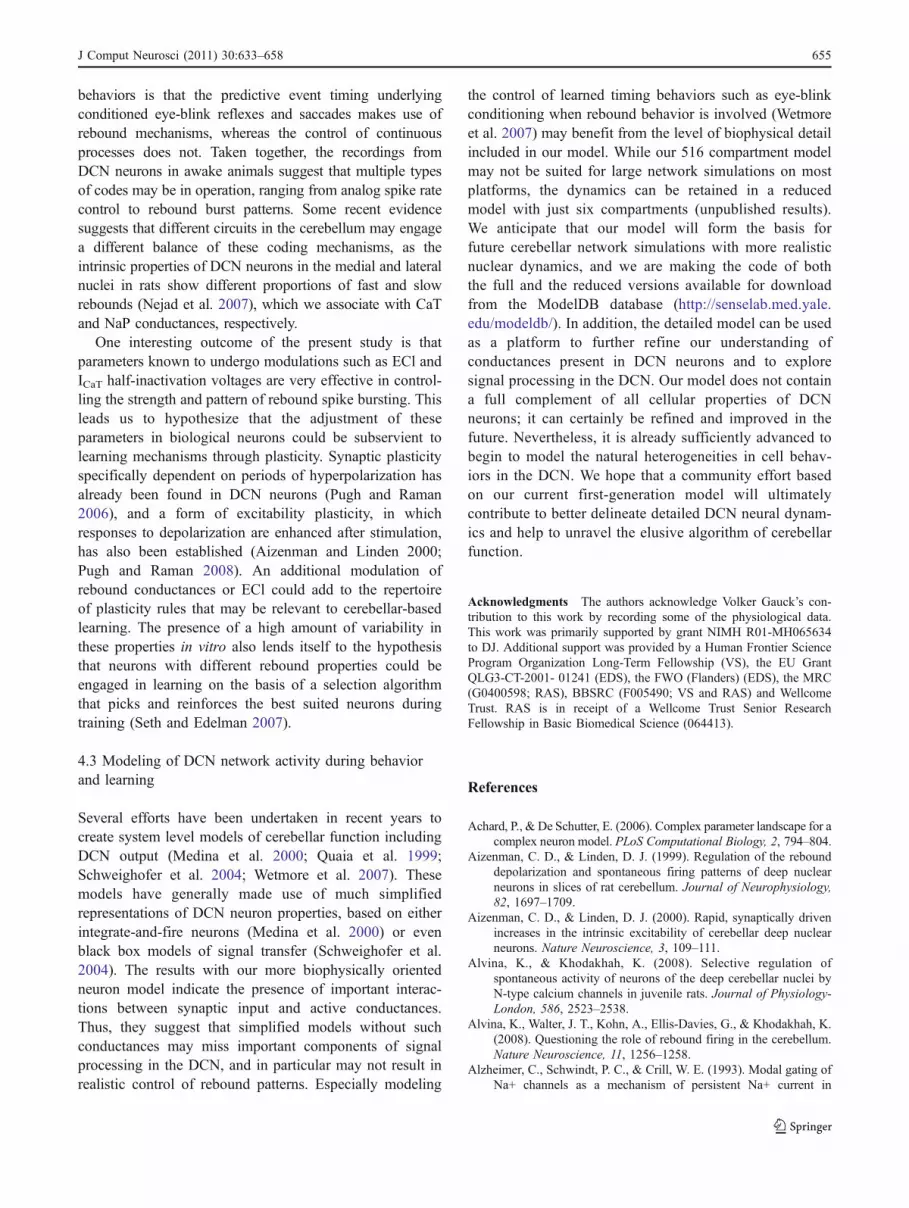
behaviors is that the predictive event timing underlyingconditioned eye-blink reflexes and saccades makes use ofrebound mechanisms, whereas the control of continuousprocesses does not. Taken together, the recordings fromDCN neurons in awake animals suggest that multiple typesof codes may be in operation, ranging from analog spike ratecontrol to rebound burst patterns. Some recent evidencesuggests that different circuits in the cerebellum may engagea different balance of these coding mechanisms, as theintrinsic properties of DCN neurons in the medial and lateralnuclei in rats show different proportions of fast and slowrebounds (Nejad et al. 2007), which we associate with CaTand NaP conductances, respectively.
One interesting outcome of the present study is thatparameters known to undergo modulations such as ECl andICaT half-inactivation voltages are very effective in control-ling the strength and pattern of rebound spike bursting. Thisleads us to hypothesize that the adjustment of theseparameters in biological neurons could be subservient tolearning mechanisms through plasticity. Synaptic plasticityspecifically dependent on periods of hyperpolarization hasalready been found in DCN neurons (Pugh and Raman2006), and a form of excitability plasticity, in whichresponses to depolarization are enhanced after stimulation,has also been established (Aizenman and Linden 2000;Pugh and Raman 2008). An additional modulation ofrebound conductances or ECl could add to the repertoireof plasticity rules that may be relevant to cerebellar-basedlearning. The presence of a high amount of variability inthese properties in vitro also lends itself to the hypothesisthat neurons with different rebound properties could beengaged in learning on the basis of a selection algorithmthat picks and reinforces the best suited neurons duringtraining (Seth and Edelman 2007).
4.3 Modeling of DCN network activity during behaviorand learning
Several efforts have been undertaken in recent years tocreate system level models of cerebellar function includingDCN output (Medina et al. 2000; Quaia et al. 1999;Schweighofer et al. 2004; Wetmore et al. 2007). Thesemodels have generally made use of much simplifiedrepresentations of DCN neuron properties, based on eitherintegrate-and-fire neurons (Medina et al. 2000) or evenblack box models of signal transfer (Schweighofer et al.2004). The results with our more biophysically orientedneuron model indicate the presence of important interac-tions between synaptic input and active conductances.Thus, they suggest that simplified models without suchconductances may miss important components of signalprocessing in the DCN, and in particular may not result inrealistic control of rebound patterns. Especially modeling
the control of learned timing behaviors such as eye-blinkconditioning when rebound behavior is involved (Wetmoreet al. 2007) may benefit from the level of biophysical detailincluded in our model. While our 516 compartment modelmay not be suited for large network simulations on mostplatforms, the dynamics can be retained in a reducedmodel with just six compartments (unpublished results).We anticipate that our model will form the basis forfuture cerebellar network simulations with more realisticnuclear dynamics, and we are making the code of boththe full and the reduced versions available for downloadfrom the ModelDB database (http://senselab.med.yale.edu/modeldb/). In addition, the detailed model can be usedas a platform to further refine our understanding ofconductances present in DCN neurons and to exploresignal processing in the DCN. Our model does not containa full complement of all cellular properties of DCNneurons; it can certainly be refined and improved in thefuture. Nevertheless, it is already sufficiently advanced tobegin to model the natural heterogeneities in cell behav-iors in the DCN. We hope that a community effort basedon our current first-generation model will ultimatelycontribute to better delineate detailed DCN neural dynam-ics and help to unravel the elusive algorithm of cerebellarfunction.
Acknowledgments The authors acknowledge Volker Gauck’s con-tribution to this work by recording some of the physiological data.This work was primarily supported by grant NIMH R01-MH065634to DJ. Additional support was provided by a Human Frontier ScienceProgram Organization Long-Term Fellowship (VS), the EU GrantQLG3-CT-2001- 01241 (EDS), the FWO (Flanders) (EDS), the MRC(G0400598; RAS), BBSRC (F005490; VS and RAS) and WellcomeTrust. RAS is in receipt of a Wellcome Trust Senior ResearchFellowship in Basic Biomedical Science (064413).
References
Achard, P., & De Schutter, E. (2006). Complex parameter landscape for acomplex neuron model. PLoS Computational Biology, 2, 794–804.
Aizenman, C. D., & Linden, D. J. (1999). Regulation of the rebounddepolarization and spontaneous firing patterns of deep nuclearneurons in slices of rat cerebellum. Journal of Neurophysiology,82, 1697–1709.
Aizenman, C. D., & Linden, D. J. (2000). Rapid, synaptically drivenincreases in the intrinsic excitability of cerebellar deep nuclearneurons. Nature Neuroscience, 3, 109–111.
Alvina, K., & Khodakhah, K. (2008). Selective regulation ofspontaneous activity of neurons of the deep cerebellar nuclei byN-type calcium channels in juvenile rats. Journal of Physiology-London, 586, 2523–2538.
Alvina, K., Walter, J. T., Kohn, A., Ellis-Davies, G., & Khodakhah, K.(2008). Questioning the role of rebound firing in the cerebellum.Nature Neuroscience, 11, 1256–1258.
Alzheimer, C., Schwindt, P. C., & Crill, W. E. (1993). Modal gating ofNa+ channels as a mechanism of persistent Na+ current in
J Comput Neurosci (2011) 30:633–658 655

pyramidal neurons from rat and cat sensorimotor cortex. TheJournal of Neuroscience, 13, 660–673.
Anchisi, D., Scelfo, B., & Tempia, F. (2001). Postsynaptic currentsin deep cerebellar nuclei. Journal of Neurophysiology, 85, 323–331.
Aracri, P., Colombo, E., Mantegazza, M., Scalmani, P., Curia, G.,Avanzini, G., et al. (2006). Layer-specific properties of thepersistent sodium current in sensorimotor cortex. Journal ofNeurophysiology, 95, 3460–3468.
Banke, T. G., & McBain, C. J. (2006). GABAergic input onto CA3hippocampal interneurons remains shunting throughout develop-ment. The Journal of Neuroscience, 26, 11720–11725.
Baranauskas, G., Tkatch, T., & Surmeier, D. J. (1999). Delayedrectifier currents in rat globus pallidus neurons are attributable toKv2.1 and Kv3.1/3.2K(+) channels. The Journal of Neurosci-ence, 19, 6394–6404.
Baranauskas, G., Tkatch, T., Nagata, K., Yeh, J. Z., & Surmeier, D. J.(2003). Kv3.4 subunits enhance the repolarizing efficiency of Kv3.1channels in fast-spiking neurons.Nature Neuroscience, 6, 258–266.
Bower, J. M. (1997). Is the cerebellum sensory for motor’s sake, ormotor for sensory’s sake: the view from the whiskers of a rat?Progress in Brain Research, 114, 483–516.
Bower, J. M., & Beeman, D. (1997). The book of Genesis (2nd ed.).New York: Springer.
Brown, A. M., Schwindt, P. C., & Crill, W. E. (1994). Differentvoltage-dependence of transient and persistent Na+ currents iscompatible with modal-gating hypothesis for sodium-channels.Journal of Neurophysiology, 71, 2562–2565.
Castelfranco, A. M., & Hartline, D. K. (2002). Simulations of space-clamp errors in estimating parameters of voltage-gated conduc-tances localized at different electrotonic distances. Neurocomput-ing, 44–46, 75–80.
Çavdar, S., San, T., Aker, R., Sehirli, Ü., & Onat, F. (2001). Cerebellarconnections to the dorsomedial and posterior nuclei of thehypothalamus in the rat. Journal of Anatomy, 198, 37–45.
Chan-Palay, V. (1977). Cerebellar dentate nucleus. Springer-Verlag.Choi, J. S., & Moore, J. W. (2003). Cerebellar neuronal activity
expresses the complex topography of conditioned eyeblinkresponses. Behavioral Neuroscience, 117, 1211–1219.
Daniel, H., Billard, J. M., Angaut, P., & Batini, C. (1987). Theinterposito-rubrospinal system. Anatomical tracing of a motorcontrol pathway in the rat. Neuroscience Research, 5, 87–112.
De Schutter, E., & Bower, J. M. (1994). An active membrane modelof the cerebellar Purkinje cell. II. Simulation of synapticresponses. Journal of Neurophysiology, 71, 401–419.
Destexhe, A., Neubig, M., Ulrich, D., & Huguenard, J. (1998).Dendritic low-threshold calcium currents in thalamic relay cells.The Journal of Neuroscience, 18, 3574–3588.
Destexhe, A., Rudolph, M., & Paré, D. (2003). The high-conductancestate of neocortical neurons in vivo. Nature Reviews Neurosci-ence, 4, 739–751.
Fredette, B. J., & Mugnaini, E. (1991). The GABAergic cerebello-olivary projection in the rat. Anatomy and Embryology (Berlin),184, 225–243.
Gardette, R., Debono, M., Dupont, J.-L., & Crepel, F. (1985a).Electrophysiological studies on the postnatal development ofintracerebellar nuclei neurons in rat cerebellar slices main-tained in vitro. I. Postsynaptic potentials. Developmental BrainResearch, 19, 47–55.
Gardette, R., Debono, M., Dupont, J.-L., & Crepel, F. (1985b).Electrophysiological studies on the postnatal development ofintracerebellar nuclei neurons in rat cerebellar slices maintainedin vitro. II. Membrane conductances. Developmental BrainResearch, 20, 97–106.
Gardner, E. P., & Fuchs, A. F. (1975). Single-unit responses to naturalvestibular stimuli and eye movements in deep cerebellar nuclei of
the alert rhesus monkey. Journal of Neurophysiology, 38, 627–649.
Gauck, V., & Jaeger, D. (2000). The control of rate and timing ofspikes in the deep cerebellar nuclei by inhibition. The Journal ofNeuroscience, 20, 3006–3016.
Gauck, V., & Jaeger, D. (2003). The contribution of NMDA andAMPA conductances to the control of spiking in neurons of thedeep cerebellar nuclei. The Journal of Neuroscience, 23, 8109–8118.
Gauck, V., Thomann, M., Jaeger, D., & Borst, A. (2001). Spatialdistribution of low- and high-voltage-activated calcium currentsin neurons of the deep cerebellar nuclei. The Journal ofNeuroscience, 21, RC158.
Gibson, A. R., Horn, K. M., Stein, J. F., & VanKan, P. L. E. (1996).Activity of interpositus neurons during a visually guided reach.Canadian Journal of Physiology and Pharmacology, 74, 499–512.
Gleeson, P., Crook, S., Cannon, R. C., Hines, M. L., Billings, G. O.,Farinella, M., Morse, T. M., Davison, A. P., Ray, S., Bhalla, U.S., Barnes, S. R., Dimitrova, Y. D., & Silver, R. A. (2010).NeuroML: a language for describing data driven models ofneurons and networks with a high degree of biological detail.PLoS Computational Biology 6, e1000815.
Goodkin, H. P., & Thach, W. T. (2003). Cerebellar control ofconstrained and unconstrained movements. II. EMG and nuclearactivity. Journal of Neurophysiology, 89, 896–908.
Gunay, C., Edgerton, J. R., & Jaeger, D. (2008). Channel densitydistributions explain spiking variability in the globus pal-lidus: a combined physiology and computer simulationdatabase approach. The Journal of Neuroscience, 28, 7476–7491.
Hepp, K., Henn, V., & Jaeger, J. (1982). Eye movement relatedneurons in the cerebellar nuclei of the alert monkey. Experimen-tal Brain Research, 45, 253–264.
Hille, B. (2001). Ion channels of excitable membranes (3rd ed.).Sunderland: Sinauer.
Houk, J. C., Buckingham, J. T., & Barto, A. G. (1996). Models of thecerebellum and motor learning. The Behavioral and BrainSciences, 19, 368–383.
Ito, M. (2008). Opinion—control of mental activities by internalmodels in the cerebellum. Nature Reviews. Neuroscience, 9, 304–313.
Ivry, R. B., & Keele, S. W. (1989). Timing functions of thecerebellum. Journal of Cognitive Neuroscience, 1, 136–152.
Jaeger, D. (2003). No parallel fiber volleys in the cerebellar cortex:evidence from cross-correlation analysis between Purkinje cellsin a computer model and in recordings from anesthetized rats.Journal of Computational Neuroscience, 14, 311–327.
Jaeger, D., & Bower, J. M. (1999). Synaptic control of spiking incerebellar Purkinje cells: dynamic current clamp based onmodel conductances. The Journal of Neuroscience, 19, 6090–6101.
Jagodic, M. M., Pathirathna, S., Nelson, M. T., Mancuso, S., Joksovic,P. M., Rosenberg, E. R., et al. (2007). Cell-specific alterations ofT-type calcium current in painful diabetic neuropathy enhanceexcitability of sensory neurons. The Journal of Neuroscience, 27,3305–3316.
Jahnsen, H. (1986a). Electrophysiological characteristics of neuronesin the guinea-pig deep cerebellar nuclei in vitro. Journal dePhysiologie, 372, 129–147.
Jahnsen, H. (1986b). Extracellular activation and membrane conduc-tances of neurones in the guinea-pig deep cerebellar nuclei invitro. Journal de Physiologie, 372, 149–168.
Kleine, J. F., Guan, Y., & Buttner, U. (2003). Saccade-related neuronsin the primate fastigial nucleus: what do they encode? Journal ofNeurophysiology, 90, 3137–3154.
656 J Comput Neurosci (2011) 30:633–658
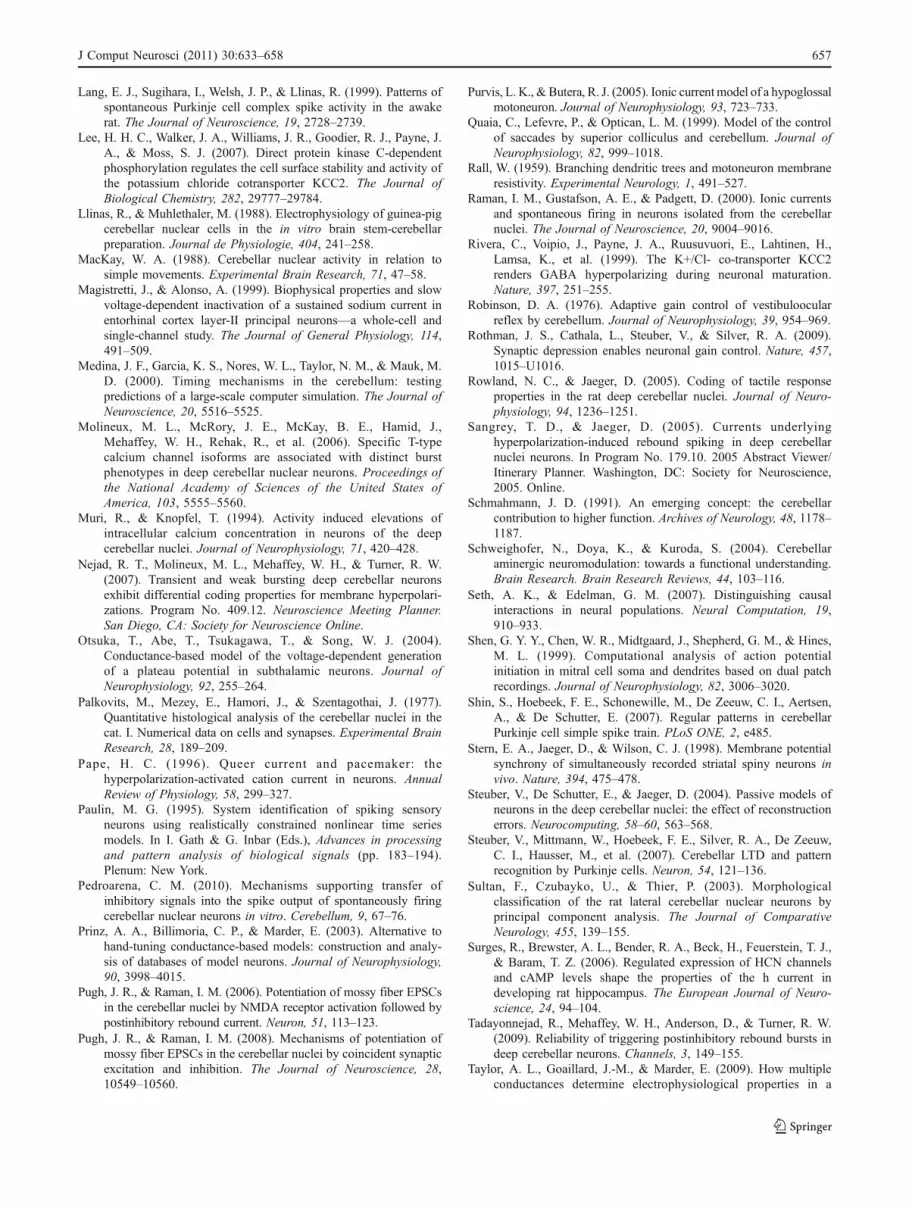
Lang, E. J., Sugihara, I., Welsh, J. P., & Llinas, R. (1999). Patterns ofspontaneous Purkinje cell complex spike activity in the awakerat. The Journal of Neuroscience, 19, 2728–2739.
Lee, H. H. C., Walker, J. A., Williams, J. R., Goodier, R. J., Payne, J.A., & Moss, S. J. (2007). Direct protein kinase C-dependentphosphorylation regulates the cell surface stability and activity ofthe potassium chloride cotransporter KCC2. The Journal ofBiological Chemistry, 282, 29777–29784.
Llinas, R., & Muhlethaler, M. (1988). Electrophysiology of guinea-pigcerebellar nuclear cells in the in vitro brain stem-cerebellarpreparation. Journal de Physiologie, 404, 241–258.
MacKay, W. A. (1988). Cerebellar nuclear activity in relation tosimple movements. Experimental Brain Research, 71, 47–58.
Magistretti, J., & Alonso, A. (1999). Biophysical properties and slowvoltage-dependent inactivation of a sustained sodium current inentorhinal cortex layer-II principal neurons—a whole-cell andsingle-channel study. The Journal of General Physiology, 114,491–509.
Medina, J. F., Garcia, K. S., Nores, W. L., Taylor, N. M., & Mauk, M.D. (2000). Timing mechanisms in the cerebellum: testingpredictions of a large-scale computer simulation. The Journal ofNeuroscience, 20, 5516–5525.
Molineux, M. L., McRory, J. E., McKay, B. E., Hamid, J.,Mehaffey, W. H., Rehak, R., et al. (2006). Specific T-typecalcium channel isoforms are associated with distinct burstphenotypes in deep cerebellar nuclear neurons. Proceedings ofthe National Academy of Sciences of the United States ofAmerica, 103, 5555–5560.
Muri, R., & Knopfel, T. (1994). Activity induced elevations ofintracellular calcium concentration in neurons of the deepcerebellar nuclei. Journal of Neurophysiology, 71, 420–428.
Nejad, R. T., Molineux, M. L., Mehaffey, W. H., & Turner, R. W.(2007). Transient and weak bursting deep cerebellar neuronsexhibit differential coding properties for membrane hyperpolari-zations. Program No. 409.12. Neuroscience Meeting Planner.San Diego, CA: Society for Neuroscience Online.
Otsuka, T., Abe, T., Tsukagawa, T., & Song, W. J. (2004).Conductance-based model of the voltage-dependent generationof a plateau potential in subthalamic neurons. Journal ofNeurophysiology, 92, 255–264.
Palkovits, M., Mezey, E., Hamori, J., & Szentagothai, J. (1977).Quantitative histological analysis of the cerebellar nuclei in thecat. I. Numerical data on cells and synapses. Experimental BrainResearch, 28, 189–209.
Pape, H. C. (1996). Queer current and pacemaker: thehyperpolarization-activated cation current in neurons. AnnualReview of Physiology, 58, 299–327.
Paulin, M. G. (1995). System identification of spiking sensoryneurons using realistically constrained nonlinear time seriesmodels. In I. Gath & G. Inbar (Eds.), Advances in processingand pattern analysis of biological signals (pp. 183–194).Plenum: New York.
Pedroarena, C. M. (2010). Mechanisms supporting transfer ofinhibitory signals into the spike output of spontaneously firingcerebellar nuclear neurons in vitro. Cerebellum, 9, 67–76.
Prinz, A. A., Billimoria, C. P., & Marder, E. (2003). Alternative tohand-tuning conductance-based models: construction and analy-sis of databases of model neurons. Journal of Neurophysiology,90, 3998–4015.
Pugh, J. R., & Raman, I. M. (2006). Potentiation of mossy fiber EPSCsin the cerebellar nuclei by NMDA receptor activation followed bypostinhibitory rebound current. Neuron, 51, 113–123.
Pugh, J. R., & Raman, I. M. (2008). Mechanisms of potentiation ofmossy fiber EPSCs in the cerebellar nuclei by coincident synapticexcitation and inhibition. The Journal of Neuroscience, 28,10549–10560.
Purvis, L. K., &Butera, R. J. (2005). Ionic currentmodel of a hypoglossalmotoneuron. Journal of Neurophysiology, 93, 723–733.
Quaia, C., Lefevre, P., & Optican, L. M. (1999). Model of the controlof saccades by superior colliculus and cerebellum. Journal ofNeurophysiology, 82, 999–1018.
Rall, W. (1959). Branching dendritic trees and motoneuron membraneresistivity. Experimental Neurology, 1, 491–527.
Raman, I. M., Gustafson, A. E., & Padgett, D. (2000). Ionic currentsand spontaneous firing in neurons isolated from the cerebellarnuclei. The Journal of Neuroscience, 20, 9004–9016.
Rivera, C., Voipio, J., Payne, J. A., Ruusuvuori, E., Lahtinen, H.,Lamsa, K., et al. (1999). The K+/Cl- co-transporter KCC2renders GABA hyperpolarizing during neuronal maturation.Nature, 397, 251–255.
Robinson, D. A. (1976). Adaptive gain control of vestibuloocularreflex by cerebellum. Journal of Neurophysiology, 39, 954–969.
Rothman, J. S., Cathala, L., Steuber, V., & Silver, R. A. (2009).Synaptic depression enables neuronal gain control. Nature, 457,1015–U1016.
Rowland, N. C., & Jaeger, D. (2005). Coding of tactile responseproperties in the rat deep cerebellar nuclei. Journal of Neuro-physiology, 94, 1236–1251.
Sangrey, T. D., & Jaeger, D. (2005). Currents underlyinghyperpolarization-induced rebound spiking in deep cerebellarnuclei neurons. In Program No. 179.10. 2005 Abstract Viewer/Itinerary Planner. Washington, DC: Society for Neuroscience,2005. Online.
Schmahmann, J. D. (1991). An emerging concept: the cerebellarcontribution to higher function. Archives of Neurology, 48, 1178–1187.
Schweighofer, N., Doya, K., & Kuroda, S. (2004). Cerebellaraminergic neuromodulation: towards a functional understanding.Brain Research. Brain Research Reviews, 44, 103–116.
Seth, A. K., & Edelman, G. M. (2007). Distinguishing causalinteractions in neural populations. Neural Computation, 19,910–933.
Shen, G. Y. Y., Chen, W. R., Midtgaard, J., Shepherd, G. M., & Hines,M. L. (1999). Computational analysis of action potentialinitiation in mitral cell soma and dendrites based on dual patchrecordings. Journal of Neurophysiology, 82, 3006–3020.
Shin, S., Hoebeek, F. E., Schonewille, M., De Zeeuw, C. I., Aertsen,A., & De Schutter, E. (2007). Regular patterns in cerebellarPurkinje cell simple spike train. PLoS ONE, 2, e485.
Stern, E. A., Jaeger, D., & Wilson, C. J. (1998). Membrane potentialsynchrony of simultaneously recorded striatal spiny neurons invivo. Nature, 394, 475–478.
Steuber, V., De Schutter, E., & Jaeger, D. (2004). Passive models ofneurons in the deep cerebellar nuclei: the effect of reconstructionerrors. Neurocomputing, 58–60, 563–568.
Steuber, V., Mittmann, W., Hoebeek, F. E., Silver, R. A., De Zeeuw,C. I., Hausser, M., et al. (2007). Cerebellar LTD and patternrecognition by Purkinje cells. Neuron, 54, 121–136.
Sultan, F., Czubayko, U., & Thier, P. (2003). Morphologicalclassification of the rat lateral cerebellar nuclear neurons byprincipal component analysis. The Journal of ComparativeNeurology, 455, 139–155.
Surges, R., Brewster, A. L., Bender, R. A., Beck, H., Feuerstein, T. J.,& Baram, T. Z. (2006). Regulated expression of HCN channelsand cAMP levels shape the properties of the h current indeveloping rat hippocampus. The European Journal of Neuro-science, 24, 94–104.
Tadayonnejad, R., Mehaffey, W. H., Anderson, D., & Turner, R. W.(2009). Reliability of triggering postinhibitory rebound bursts indeep cerebellar neurons. Channels, 3, 149–155.
Taylor, A. L., Goaillard, J.-M., & Marder, E. (2009). How multipleconductances determine electrophysiological properties in a
J Comput Neurosci (2011) 30:633–658 657

multicompartment model. The Journal of Neuroscience, 29,5573–5586.
Telgkamp, P., Padgett, D. E., Ledoux, V. A., Woolley, C. S., &Raman, I. M. (2004). Maintenance of high-frequency transmis-sion at purkinje to cerebellar nuclear synapses by spillover fromboutons with multiple release sites. Neuron, 41, 113–126.
Timmann, D., Citron, R., Watts, S., & Hore, J. (2001). Increasedvariability in finger position occurs throughout overarm throwsmade by cerebellar and unskilled subjects. Journal of Neuro-physiology, 86, 2690–2702.
Traboulsie, A., Chemin, J., Kupfer, E., Nargeot, J., & Lory, P. (2006). T-type calcium channels are inhibited by fluoxetine and its metabolitenorfluoxetine. Molecular Pharmacology, 69, 1963–1968.
Uusisaari, M., Obata, K., & Knopfel, T. (2007). Morphological andelectrophysiological properties of GABAergic and non-GABAergic
cells in the deep cerebellar nuclei. Journal of Neurophysiology, 97,901–911.
van Kan, P. L., Houk, J. C., & Gibson, A. R. (1993). Outputorganization of intermediate cerebellum of the monkey. Journalof Neurophysiology, 69, 57–73.
Wetmore, D. Z., Mukamel, E. A., & Schnitzer, M. (2007). Lock-and-key mechanisms of cerebellar memory recall based on reboundcurrents. J Neurophysiol. epub in press.
Zheng, N., & Raman, I. M. (2009). Ca currents activated byspontaneous firing and synaptic disinhibition in neurons ofthe cerebellar nuclei. Journal of Neuroscience, 29, 9826–9838.
Zhu, L., Lovinger, D., & Delpire, E. (2005). Cortical neurons lackingKCC2 expression show impaired regulation of intracellularchloride. Journal of Neurophysiology, 93, 1557–1568.
658 J Comput Neurosci (2011) 30:633–658
Copyright © 2022 FDOKUMEN