Determinants of Remittances: The Case of the South Asian Community in Manchester
37
Determinants of Remittances: The Case of the South Asian Community in Manchester* Thankom Arun † Lancashire Business School, University of Central Lancashire Hulya Ulku ‡ Institute for Development Policy and Management, University of Manchester Lancashire Business School Working Papers New Series, Vol 1, N o. 1 February 2009 ISSN 2040-1458 (online)
Transcript of Determinants of Remittances: The Case of the South Asian Community in Manchester

Determinants of Remittances:
The Case of the South Asian Community in Manchester*
Thankom Arun † Lancashire Business School, University of
Central Lancashire
Hulya Ulku ‡ Institute for Development Policy and Management,
University of Manchester
Lancashire Business School Working Papers New Series, Vol 1, No. 1
February 2009
ISSN 2040-1458 (online)
Lancashire Business School Working Paper Series
Editor Philip B. Whyman, Professor, Econmics
Board of Editors
Thankom Arun – Reader, Information and Finance Phil Baugh – Associate Director, Lancashire Business School Nigel Holden – Professor, Cross-Cultural Management Graham Kelly – Professor, Business and Management Andrei Kuznetsov – Professor, International Corporate Social Responsiblity Bob Richie – Professor, Strategy and Innovation Richard Saundry – Reader, International Human Resource Management Yahaya Yusuf - Professor, Operations and Logistics Management
The Lancashire Business School Working Paper Series is intended to make results of LBS research available to the academic community, in preliminary form, to stimulate discussion and critical comment.
Working Papers are offered by the author, in the interests of scholarship and, although mediated by the Board of Editors, the form and content of papers are the responsibility of individual authors.
Working Papers may be downloaded by individuals, for their own use, subject to the ordinary rules governing fair use of professional scholarship (see Copyright statement).
Comments on papers or questions about their content should be sent directly to the author, at his or her email address.
Working Papers may be cited without seeking prior permission from the author.
Copyright Statement Copyright to papers in the Lancashire Business School Working Paper Series remains with the authors. Papers may be downloaded for own personal use, but downloading of papers for any other activity may not be done without the written consent of the authors. Upon print publication, copyright will often be formally transferred to the publisher. It is therefore the author's responsibility to know if copyright has been transferred and to notify the Senior Administrative Officer (Research) to have it removed from the site, if necessary. In those cases where the author has retained copyright, it is the author's responsibility to notify the Senior Administrative Officer (Research) when and if they wish to have the paper removed.
For further information about the Lancashire Business School, its research and details of individuals and projects, please access: http://www.uclan.ac.uk/lbs/research/index.php
Abstract
This paper investigates the remitting behaviour of South Asian community using new data from 700 Indian, Pakistani and Bangladeshi households in Manchester. The findings show that the remittances of South Asian community in Manchester are determined by income, social and financial linkages to the home country, the recipient’s economic status, and the use of remittances for education and business. There is no tangible evidence that the use of remittances for basic needs and consumption has a significant impact on the size of remittances. In addition, while the remittances of permanent migrants are determined by the standard variables cited above, remittances of temporary migrants are primarily driven by their use for savings, education and loan payments.
*We would like to thank the Faculty of Humanities, University of Manchester for funding this research; and Masrur Reaz, Faizul Haque, Aamer Taj, Anuja Sanghavi, Leonith Hinojosa, Sharon Morgan and Joseph Adjei for their excellent work on interviews and data entry.
†Thankoom Arun is a Reader in International Finance in Lancashire Business School, University of Central Lancashire and Honorary Senior Fellow, School of Environment and Development, University of Manchester. Address: Lancashire Business School, The University of Central Lancashire, PR1 2HE, Email: [email protected]
‡ Hulya Ulku is a Lecturer in Development Economics at the Institute for Development Policy and Management (IDPM), University of Manchester. Address: IDPM, Arthur Lewis Building, Oxford Road, Manchester M13 9PL, UK. Email: [email protected]
1. Introduction
Recent debates on development finance draw attention to the role of remittances in
achieving the MDG’s (Millennium Development Goals) targets of fostering growth
and alleviating poverty in developing and less developed countries.1 In addition to
their role in development, remittances have become of concern since 9/11 because of
the possibility that, when sent through informal channels as they often are, they could
be used to finance terrorism and money laundering. According to Sander (2003), in
2002 the estimated amount of informal remittances to developing countries was
between 25% and 125% of official remittances. Although these developments have
prompted academic research on remittances, there is still a gap in our understanding
of the underlying causes of remittances from different migrant communities. As has
been cited in the literature, the ethnic identity of migrants as well as their country of
origin is an important determinant of their remitting behaviour (Vertovec 2006; Sana
2005). Thus this paper aims to contribute to the literature by examining the major
determinants of remittances of the South Asian community in Manchester both as one
large ethnic group and as a group of various different nationalities.2
The South Asian community are well established both professionally and politically
in the United States and Europe. The immigration of South Asian people to the United
Kingdom started in the colonial period and continued after independence. Because
many of these countries remained in the Commonwealth their citizens were able to
pursue their education and economic opportunities in the UK3. The expulsion of
Indian communities from East Africa also contributed to the strong presence of the
1.Remittances are a growing source of external finance in developing countries, which has exceeded official development assistance and is the second largest foreign financial flow to developing countries after FDI (Foreign Direct Investment). They constitute 42% of the total FDI flows and 260% of Overseas Development Assistance (ODA) in 2001 (World Bank, 2004). 2Manchester is a multi-cultural city in the UK which has a very long relationship with South Asia. The growth of the city of Manchester from the mid-18th century onwards went hand in hand with the arrival of people of many nationalities and ethnic groups. Many workers from South Asian countries (Bangladesh, Pakistan and India) came to Manchester from the 1950s to work in the mills. 3Until 1962 every Commonwealth citizen was entitled to enter the United Kingdom at will. Under the British Nationality Act 1948, citizens of British colonies could simply apply to the Home Office for registration of British nationality and were issued with certificates.
South Asian population in the UK.4 Official remittance inflows to South Asia have
increased continuously over the past decade from $5.6 billion (1.4% of GDP) in 1990
to $43.8 billion (3.2% of GDP) in 2007 (World Bank, 2008). In 2007, the top
recipient countries of recorded remittances in South Asia were India ($27.0 billion),
Bangladesh ($6.4 billion), and Pakistan ($6.1 billion), collectively making the South
Asia region the third largest regional recipient of remittances in the world after Latin
America and the Caribbean and East Asia and Pacific (World Bank, 2008).
Although there are various studies on remittances to South Asia such as Ballard
(2003), Clark and Drinkwater (2001) and Seddon (2004), there is no study providing
an economic analysis of remittances from the South Asian community. Thus this
study aims to fill this gap in the literature by of providing an in-depth statistical and
econometric analysis of remittances from the South Asian community using up to date
household data from Indian, Pakistani and Bangladeshi communities residing in
Manchester. While in our analysis we treat the South Asian community as one large
ethnic group, we also recognize the differences between different nationalities and
where possible provide a separate analysis of their social and economic
characteristics.
The rest of this paper is organized as follows. The next section reviews the theoretical
and empirical background of the determinants of remittances; section three provides
information on data and methodology; section four presents recent trends in social,
economic and demographic features of the South Asian community in Manchester;
section five reports the findings of econometric analysis and section six concludes.
2. Determinants of Remittances – Theory and Evidence
2.1. Theoretical Perspectives
4The presence of immigrants has been much debated in the media and by politicians. In 2006, immigrants contributed six billion pounds to the UK economy which should be seen in the context of net immigration figures of 1, 90,000 per year. EU citizens make up nearly 30 per cent of net immigration and asylum-seekers account for 50 per cent of Britain's annual immigration. Of the remainder, the majority are students who pay hefty tuition fees (The Economist, 2008).

Broadly, the main theories of remittances fall into three categories: altruism, self
interest, and intertemporal contractual agreement. The latter category includes any
kind of contractual arrangement between the migrant and the household left behind
such as insurance and risk sharing, exchange, and implicit loan agreements (i.e.
repayment of schooling and migration expenses). Self interested remittances generally
arise from the desire to secure an inheritance, fixed assets or income from one's
parents, or to obtain social or financial services from relatives. Purely altruistic
remittances involve transfers to the home country to aid the recipient without any
expectation of reciprocity. As Lucas and Stark (1985) point out, 'altruistic' remittances
often include an element of self interest and so may be better regarded as tempered
altruism or enlightened self interest. In other cases altruistic remittances may be
accompanied by an element of contractual agreement. Informal transnational
networks provide an effective means of facilitating the delivery of remittances, often
leading to the generation of institutional structures of considerable complexity, a
common phenomenon in South Asia.
Altruistic remitting behaviour, first identified by Johnson and Whitelaw (1974)
involves a set of factors which determines remitting behaviour irrespective of the
economic situation of the migrants. In many cultures and religions, selfless concern
for the welfare of others is paramount, which is different from moral obligations.
Specifically, migrants care about the well being of their family because their utility
function embodies the utility function of their family members (Agarwal and
Horowitz 2002). The main indicators of altruistic remittances cited in Funkhouser
(1995) are that remittances are inversely related to the recipient’s income; they tend to
decrease with the number of other migrants from the same family, and they decrease
with the time spent in the host country.
Contractual agreement basically refers to mutual agreement between migrant and
his/her family that they will help each other in difficult times (i.e. insurance and risk
sharing) and that the migrant will at some point pay back the costs of education and
migration incurred by his/her family (implicit loan agreement). Lucas and Stark
(1985) explain the implicit contractual arrangement between the migrant and the
home country household as being based on investment and risk. The notion of risk
sharing appears to be self enforcing and cooperative (Agarwal and Horowitz, 2002),
and arises from both self interest and mutually beneficial arrangements (Lianos 1997).
In the case of implicit loan agreement the migrant repays the family's human capital
investment either in cash or by financing other migrant family numbers (Poirine
1997).5 Self interested remitting is mainly associated with the exchange motive put
forward by Rapoport and Docquier (2005). This explains the remitting behaviour as
being driven by the migrants’ intention to return home (and therefore sending money
to take care of their assets and relatives). However, exchange motivation can also take
place within the mutual contractual agreement.
Although the motivational models provide a structured framework to explain the
remitting behaviour of migrants, they are unlikely to provide a holistic picture of this
complex issue since many other factors can influence migrants' decisions to transfer
remittances to their home country. For instance, Lianos (1997) argues that remitting
behaviour can be the result of a complex decision-making framework of a migrant
seeking to maximise his/her economic welfare through various rational behaviours.
The argument here is that migrants' savings and investment behaviours and the flow
of remittances are somewhat difficult to predict because of the many different
possible objectives of the migrant which might include permanent settlement in the
home country, minimising the time to be spent in the home country, or maximising
wealth within a specific period of time. Puri and Ritzema (1999) also refer to
alternative explanations for remitting behaviour which can be viewed as a household-
specific strategic decision made by the migrants, often with other family members,
which takes into account not only household consumption patterns but also the
personal as well as structural conditions of the migrants, the nature of private transfers
and the opportunities available for investment.
2.2. Determinants of Remitting Behaviour
5 Investment is defined as the costs associated with the creation of human capital through the education and other support of the migrant, while risk refers to the act of spreading or diversifying risks by determining member(s) of the family to migrate in urban areas or foreign countries.
The nature and patterns of various economic and social factors appear to play a
crucial role in determining the size of remittances. Sander (2003) specifies several
factors such as the migrant's profile and salary level, the cost of living in the host
country, political and economic volatility in the home country, the migration period,
and generational patterns. Based on a review of various empirical studies, Rapoport
and Docquier (2005) conclude that familial inter-temporal contracts appear to have
more explanatory power than individualistic considerations. Even though some
individualistic considerations such as altruism, an intention to return, and inheritance
prospects may explain remitting behaviour, their influence generally takes place
within a familial context.
In accordance with the theoretical predictions of altruism and mutual contractual
agreement, Clark and Drinkwater (2001) find that immigrant households are more
likely to remit than their native-born counterparts, implying that stronger family ties
and the repayment of contributions received earlier by the migrant are significant
drivers. It is also found that a higher number of foreign-born individuals in the
household increases the propensity to remit. Glytsos (1997) opines that some family
conditions and attitudes can have a positive or negative impact on remittance size.
The former include the migrant's ability to remit (e.g. his/her income and savings) and
the claim of his/her family on his income while the latter include the length of stay in
the host country. This study also argues that the remitting behaviour of temporary
migrants is driven by an obligation to meet the needs of close family back home
coupled with an endogenous decision making process by which the migrant's own
higher consumption is postponed for future comfort at home after an early return. On
the other hand, the permanent migrant’s behaviour prioritises improving his/her
standard of living and economic and social integration in the host country.
In the case of the UK, Clark and Drinkwater (2001) find that household income has
significant positive impact on remitting motivation while neither the length of
migration nor the education levels of the household appear to have any significant
effect. However, adults with foreign qualifications are more likely to remit. Contrary
to the belief that co-ethnic proximity with its consequent shared cultural norms is a
determining factor for remittance behaviour, they find no strong effect of ethnic
concentration on remittance propensity6. In the case of Latino immigrants in the UK,
Lowell and De la Garza (2000) find that the likelihood of remitting behaviour
declines with the tendency to acculturate, while the size of remittance is positively
associated with the migrant's earnings. They also found that poor households
receiving welfare benefits are less likely to remit.
In terms of the impact of macroeconomic determinants of remittances, Lianos (1997)
and Sander (2003) confirm the significant influence of the host country income,
exchange rate, and inflation and interest rate differentials. Puri and Ritzema (1999)
also show that political risk factors of the host country, the proportion of the female
population in the host country and the available facilities to transfer remittances have
an impact. Based on an empirical study on Cuba, Blue (2004) opines that economic
crisis in the home country in the form of macro-level financial instability (e.g. low
income, high inflation) and natural hazards positively influence remittance flows.
Vargas-Silva and Huang's (2006) study, based on remittance and macroeconomic data
from the U.S., Mexico, Brazil, Colombia, El Salvador and the Dominican Republic,
reveals that macroeconomic conditions in the host country have a significant
influence on the remitting decisions of migrants. Broadly, these studies have found
factors such as the economic situation in the home and host country and the nature or
duration of migrants' stay in the host country to be the main macro determinants of
remittances.
2.3. Informal Remittances among South Asian Communities
Many researchers consider the hawala or hundi operating system to be the most
common informal method used by migrants from South Asia (India, Pakistan and
Bangladesh), the Middle East and other parts of the world to transfer their
remittances, though it may be known by other names. In our data 65% of respondents
used only informal remittance channels providing evidence in support of previous
studies pointing out that informal channels are more common than formal channels
among the South Asian community. The emergence of informal transfer mechanisms
6 They also find that remittances of Indian households are mainly determined by income while remittances of Caribbean migrants are determined by their return intention. Furthermore, they find that Indian migrants are least likely to have parents abroad partly because the majority of the Asians who arrived in the UK from East Africa in the early 1970s were of Indian origin.

for remittances has become an important issue in recent times. People are increasingly
finding cheaper and easier ways to send remittances through a variety of unofficial or
informal service providers. Informal transfer mechanisms or ‘informal money transfer
systems’ (IMTS) appear to exist and operate outside of (or parallel to) conventional
regulated banking or other mainstream financial channels such as Western Union
(Buencamino and Gorbunov 2002; Blackwell and Seddon 2004).7
The term ‘hawala’ has emerged from Arabic banking jargon, meaning transfer or wire
(El-Qorchi 2002). Facilitated by ‘hawladars' (brokers), the hawala system involves the
hawladar of the home country delivering money to the recipient as per agreement with
the hawladar of the host country who is acting for the remitter (Buencamino and
Gorbunov 2002). There is apparently no difference between hawala and hundi apart
from the name: the term ‘hundi’ is mostly used in Pakistan and Bangladesh, whereas
‘hawala’ is the commonly used term in India and the Middle East. It is important to
note that the hawladar is part of an organised network of shop owners and travel
agents (Sander 2003), or owners of giro houses, money exchange operators, brokers,
wire services or other conventional money transmitters (Buencamino and Gorbunov
2002). The hawladars of both the sending and receiving countries appear to rely on
oral (or, less often, written) contractual business relationships: the system depends on
mutual trust and benefit.
The most common features of hawala are identified by Looney (2002) and Wilson
(2002) as follows: (i) the halawa system permeates international boundaries, (ii) it
usually involves more than one currency, and (iii) it usually entails principals
(hawladers and clients) and intermediaries (brokers or bankers or exchange houses).
Maimbo and Passas (2004) also opine that the element of trust is the primary defining
characteristic of informal systems such as hawala. Ballard (2005) opines that the
collection, transmission and delivery process of contemporary informal value transfer
systems such as hawala have three interconnected core elements - (i) information
processing (ii) value transmission and settlement and (iii) consolidation and delivery
7 This system has also been referred to as ‘informal value transfer systems (IVTS) or alternative remittance systems (ARS) (Blackwell and Seddon 2004), or ‘informal fund transfer (IFT)’ (El-Qorchi 2002), or ‘underground banking’ or ethnic banking (Maimbo 2004) in various literatures. In spite of the differences in terminology, all of these informal or unofficial mechanisms seem to be similar in terms of the way they operate.
of the remitted money in the local currency. Nevertheless, it is argued that the
settlement of transactions through the hawala system tends to be a complex process
involving many parties8.
3. Data
Data for this analysis was collected from 700 Indian, Pakistani and Bangladeshi
households residing in the districts of Greater Manchester that contain the largest
South Asian community in the UK. Most interviews were conducted with randomly
chosen South Asian individuals in ordinary public places such as offices, shops,
parks, community-based organizations, mosques, cafes, streets, and bus stops. When
it was not possible to employ random sampling, leads from other interviewees were
used to conduct the remaining interviews.9 In addition, given that the main focus of
the study is the remittances of the South Asian community, only those respondents
sending remittances were interviewed. Although a mixed sampling strategy was cost
effective, we are aware of its shortcomings, particularly in terms of its impact on the
statistical properties of the data and on the representativeness of the sample for the
whole South Asian community. The distributions of the South Asian population and
the data across the districts of the Manchester metropolitan area, and the descriptions
of the variables used in the analysis are reported in Tables 1, 2 and 3. This data set is
the first to provide methodical information on the remittances and socio-economic
backgrounds of the South Asian community in Manchester.
4. Socio-Economic Characteristics and Remittance Patterns of the South Asian
Community in Manchester
This section provides an overview of the social, economic and demographic
characteristics of the South Asian community in Manchester as well as their
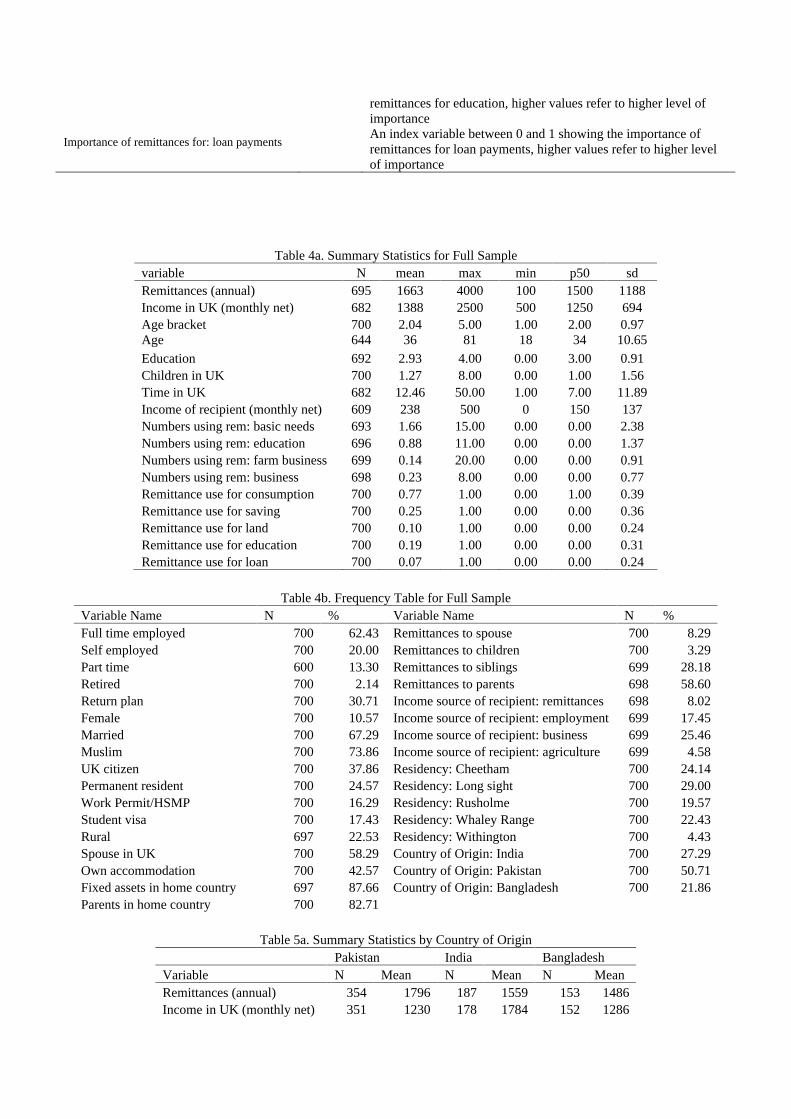
remittance patterns. The summary statistics and the frequencies of the main indicators
8The process of consolidation and settlement in the hawala system involves well designed coordination among three separate but closely interconnected patterns of communication that may engage three major parties such as UK based wholesale hawaldars, global hawaldars based in Dubai, and major banking institutions in New York together with several other parties including retail hawaldars and a network of agents and sub-agents in the sending country, and retail hawaldars in the receiving country (Ballard, 2005, 2006). 9Since the interviewers were not instructed to keep a record of their sampling strategy, we are not able to sort the data according to the sampling strategy used during its collection.

for the full sample are reported in Tables 4a and 4b. As seen from these tables, the
average age of a respondent is 36; 67% are married, and 84% of the married
respondents have their spouses in the UK.10 The proportion of respondents from
Pakistan, Bangladesh and India is 51%, 27% and 22%, respectively, reflecting their
relative representation in the Manchester South Asian community. Given that
Pakistani and Bangladeshi migrants are in the majority, it is not surprising that 73 %
of all respondents are Muslims, followed by Hindus (26%). 62% of all respondents
work full time, 13% part time and 20% are self employed, while 2% are retired.
Regarding the respondents' migration status, we find that 38% are UK citizens, 23%
are permanent residents, 26% are on a work permit, visa or highly skilled migration
program, and 27% are on a student visa. The average time of residency in the UK is
13 years and 31% intend to return to their home country.
On average, a South Asian individual in Manchester is a university graduate, earns
£1388 per month net, and remits £1663 a year.11 In addition, 43% of respondents own
their accommodation and 88% have fixed assets in their home country. Finally, 83%
of the respondents have parents living in the home country. In terms of the
characteristics of recipients, the statistics show that the average monthly net income
of the recipient is £238. The main recipient group are the parents of the remitters
(59% sent money to their parents) followed by siblings (28%), spouses (8%) and
children (3%), and their main income sources are business (26%) and employment
(18%) followed by remittances (8%) and agriculture (5%).12 Moreover, the average
number of people benefiting from each remittance for their basic needs is 1.66,
followed by an average of 0.88 people using it for education. The number of people
using remittances for farm and non-farm business seems to be the lowest, with an
average of 0.14 and 0.23, respectively. The most common use of remittances is to
finance consumption, followed by saving, education, and land acquisition.
10It should be noted that we only interviewed individuals of 18 years and over to ensure the inclusion of those who are economically active and send remittances to their home country. This naturally raises the average age in our data. 11Income and remittances refer to the respondent’s own individual income and remittances not the household’s income and remittances. 12These percentages include the recipients whose income source is exclusively one of the sources mentioned above. The remaining recipients’ main income sources include a combination of the cited sources.

To examine the differences across the key social, economic and demographic
indicators across Pakistani, Indian and Bangladeshi communities, we also report the
statistics separately for each group in Tables 5a and 5b. Although the average age and
education level of the respondents are very similar across these three communities,
Indian respondents earn the highest monthly net income (£1784) followed by
Bangladeshi and Pakistani migrants (both around £1200). Pakistani migrants sent the
largest remittances with an average annual amount of £1796 followed by Indian and
Bangladeshi migrants with an average yearly amount of £1559 and £1486
respectively. In terms of employment, the Bangladeshi community contains the
largest proportion of full time employees (76%), the Pakistani community contains
the largest proportion of self employed people (26%), and the Indian community
contains the largest proportion of part time employees (18%). In addition, even
though ownership of fixed assets in the home country is very similar across the three
communities (87%), the proportion of people owning a house in the UK varies from
60% of Bangladeshi respondents, through 46% of Indians to 34% of Pakistanis.
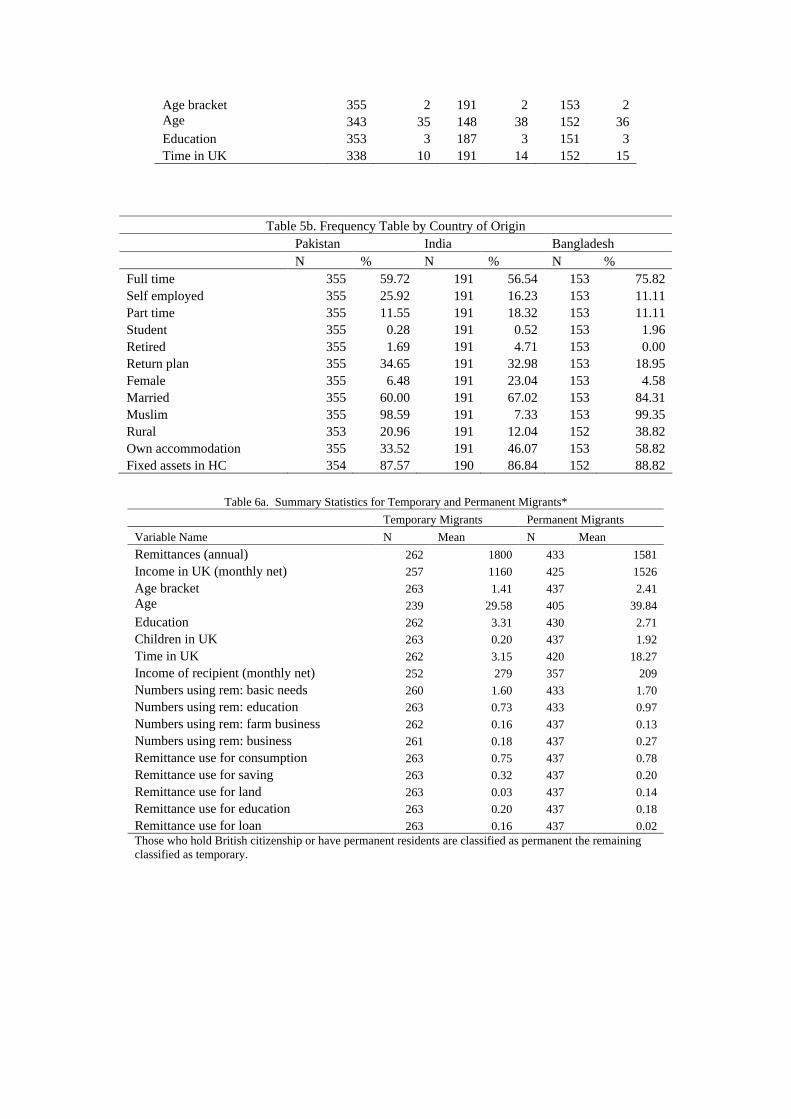
Since the remittances literature indicates differences between temporary and
permanent migrants’ remitting behaviour, in Tables 6a and 6b we present the data for
permanent and temporary migrants separately.13 As seen from the tables, there are
differences between these two groups in terms of their age, income, remittances, and
time spent in the UK. On average, temporary migrants seem to be 10 years younger,
send £391 more, earn £421 less, and have spent 15 years less in the UK than
permanent migrants. Unsurprisingly, more temporary migrants intend to return to
their home countries and fewer own their accommodation compared to permanent
migrants. They do not differ much in terms of what their remittances are used for or
their religious and social backgrounds (i.e. rural or urban origins). Most temporary
migrants seem to send remittances to their parents (83%) compared to 44% of
permanent migrants (similar proportions of both groups have parents living in the
home country).14
13Those who have UK citizenship or permanent residency are referred to as permanent migrants while those who are on work permit/HSMP, short term stay, students visa or asylum seekers are referred to as temporary migrants. 14We have also assessed the differences between informal and formal remitters The socio economic characteristics of these two groups are very similar with the only exception being that formal remitters earn more and remit less than informal remitters. In addition, it seems that a larger percentage of the
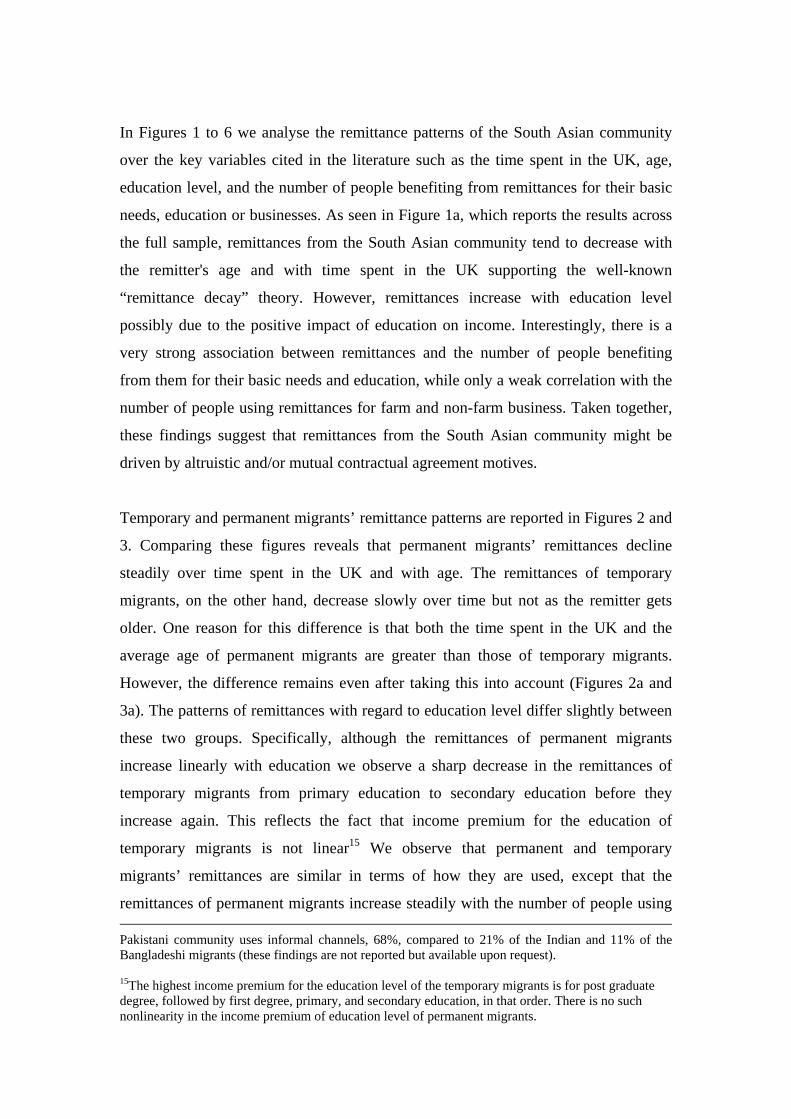
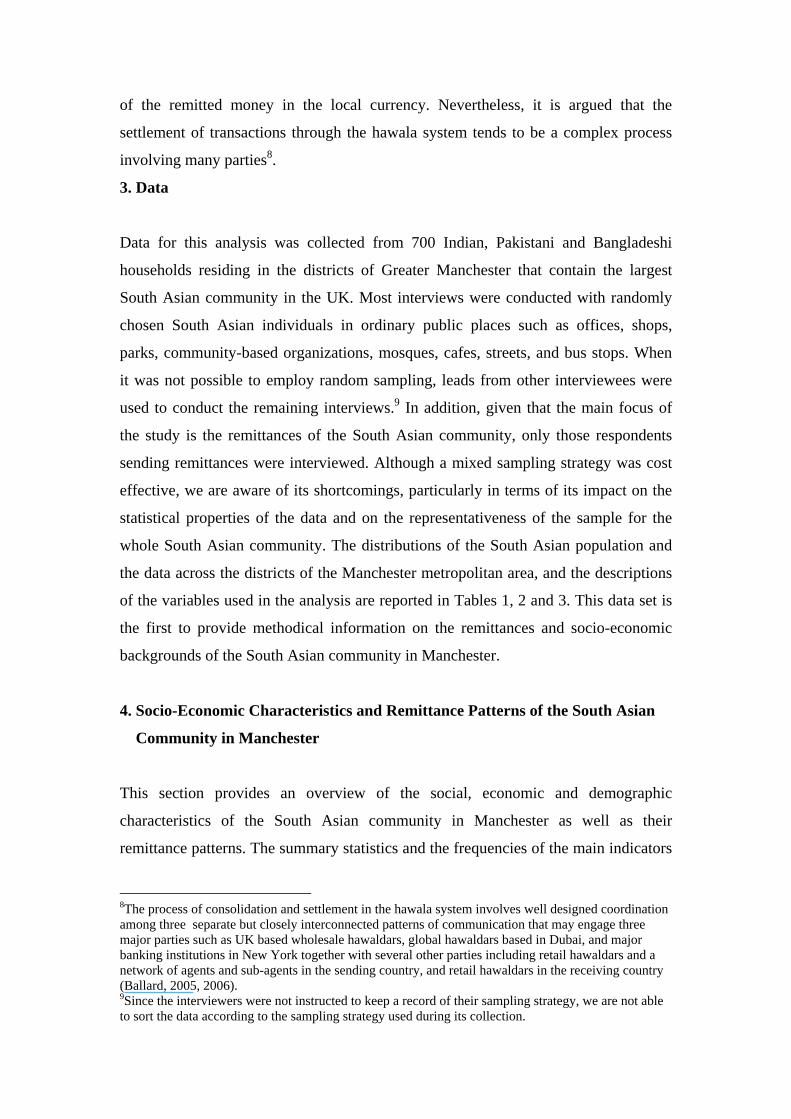
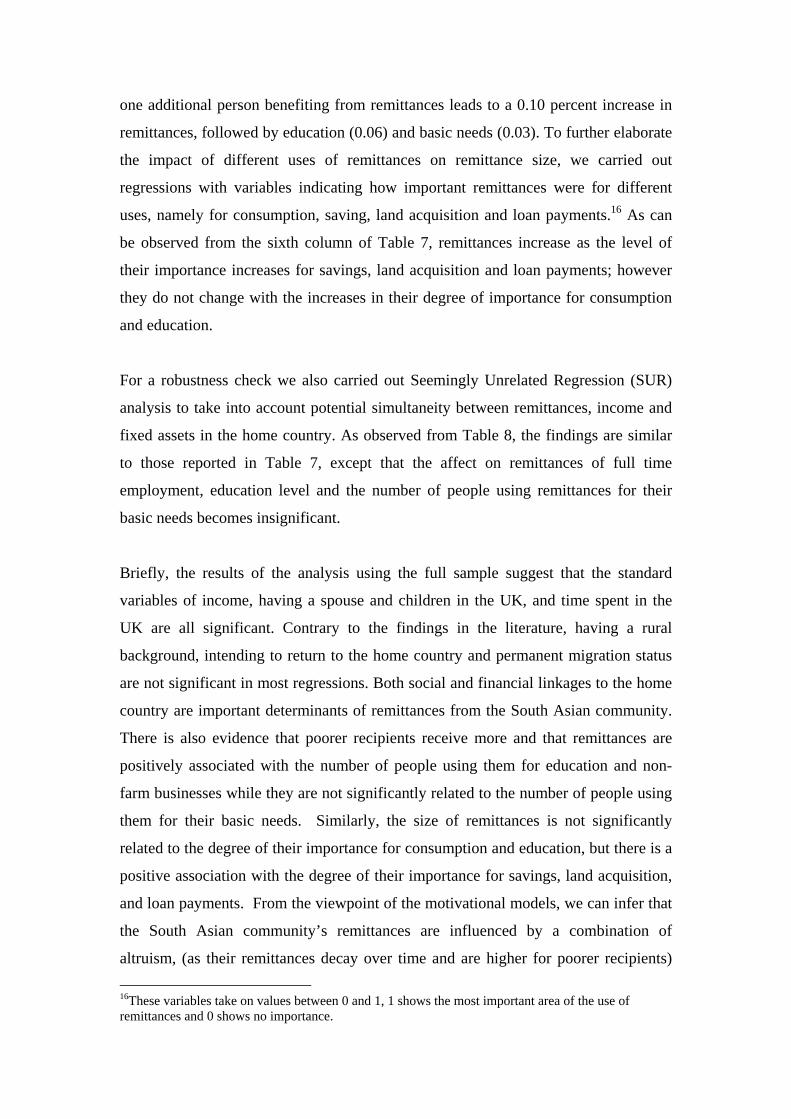
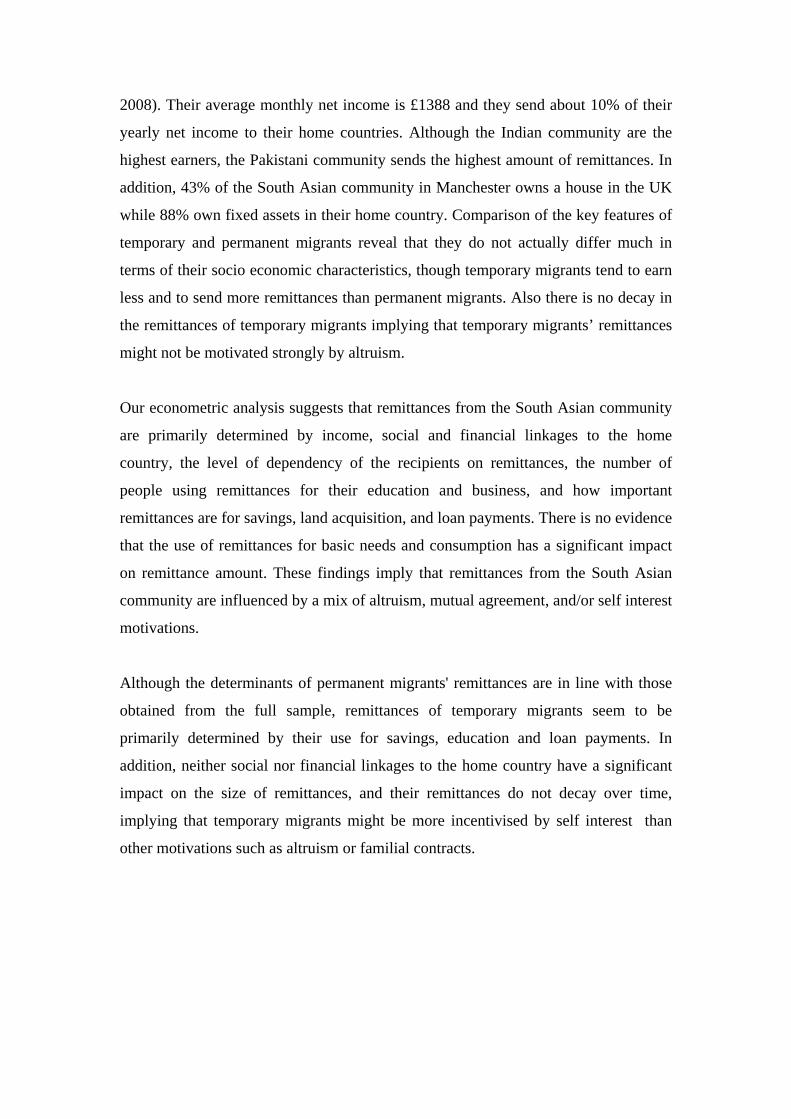
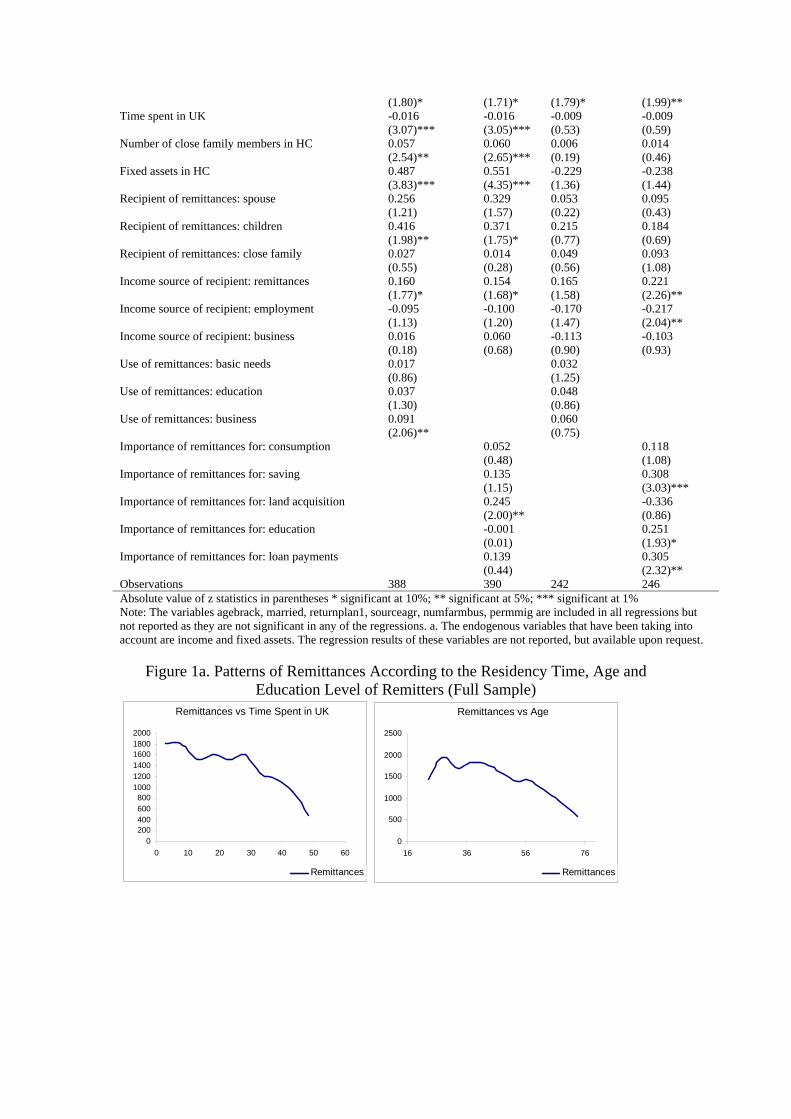
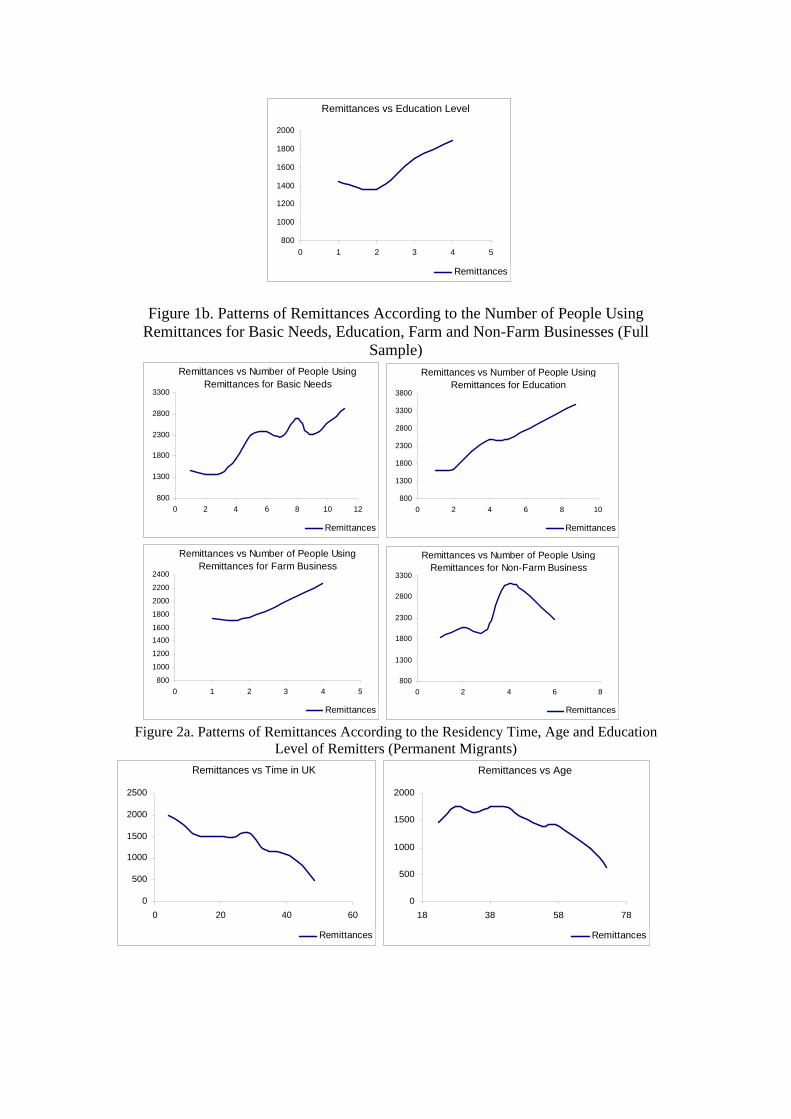
In Figures 1 to 6 we analyse the remittance patterns of the South Asian community
over the key variables cited in the literature such as the time spent in the UK, age,
education level, and the number of people benefiting from remittances for their basic
needs, education or businesses. As seen in Figure 1a, which reports the results across
the full sample, remittances from the South Asian community tend to decrease with
the remitter's age and with time spent in the UK supporting the well-known
“remittance decay” theory. However, remittances increase with education level
possibly due to the positive impact of education on income. Interestingly, there is a
very strong association between remittances and the number of people benefiting
from them for their basic needs and education, while only a weak correlation with the
number of people using remittances for farm and non-farm business. Taken together,
these findings suggest that remittances from the South Asian community might be
driven by altruistic and/or mutual contractual agreement motives.
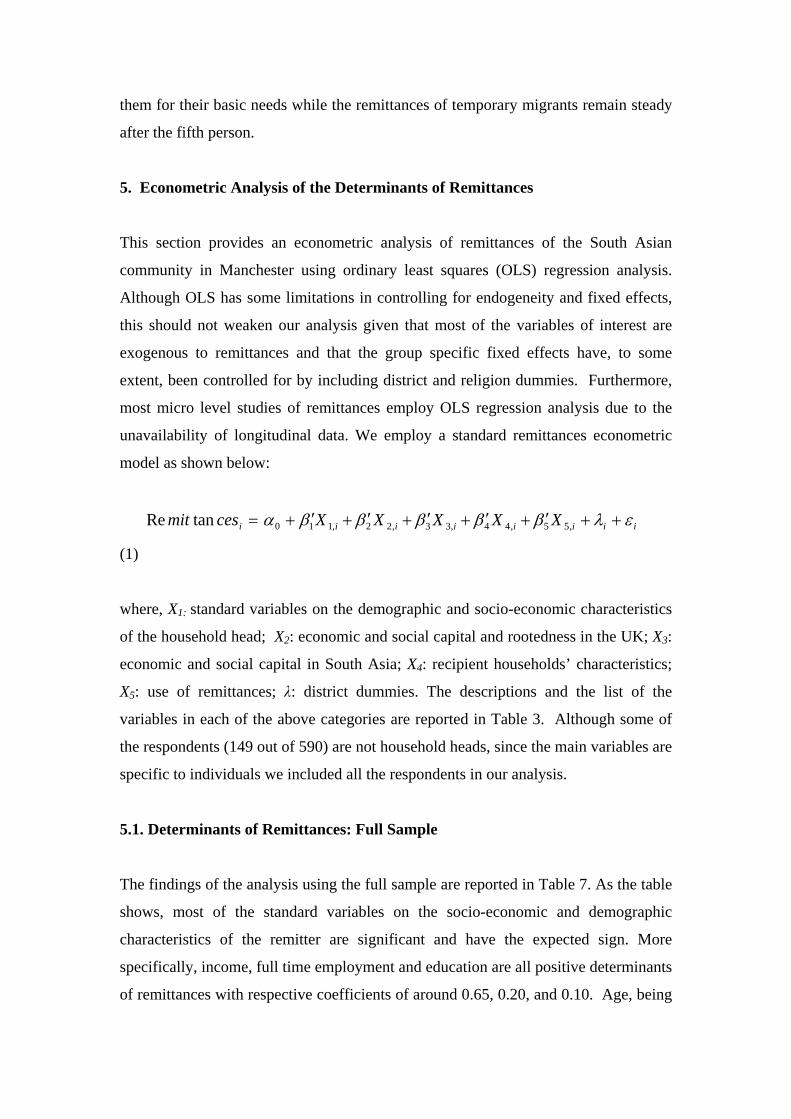
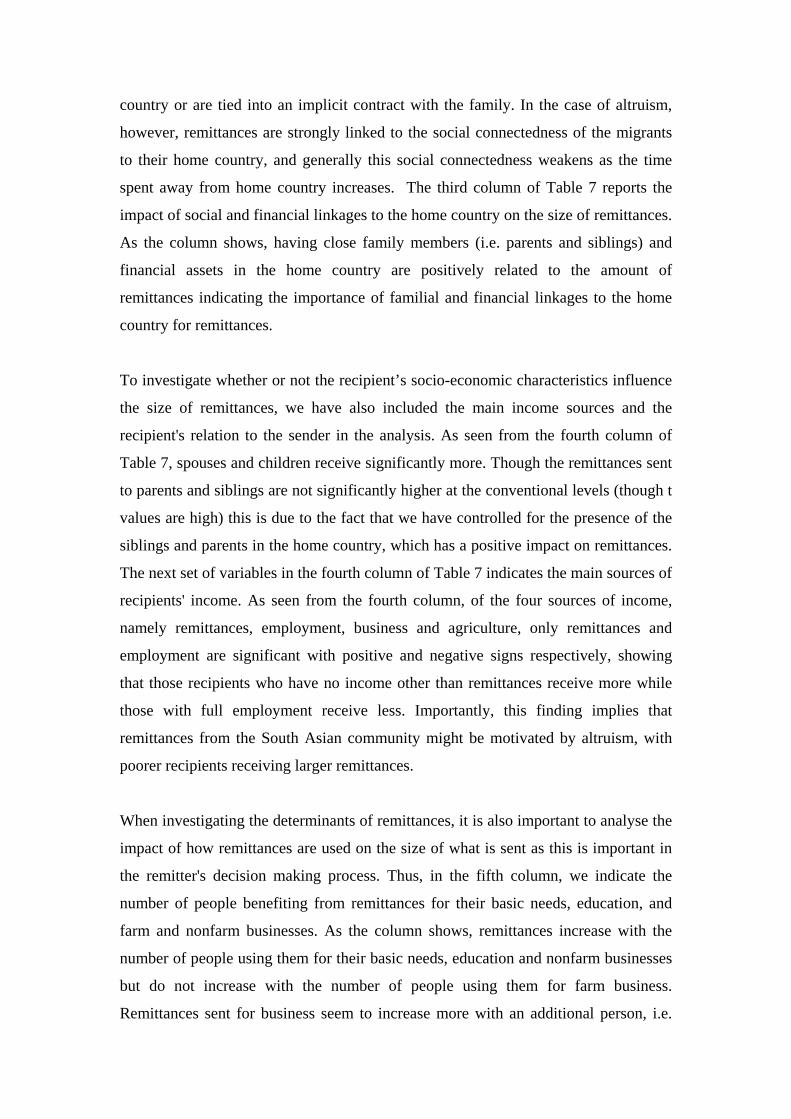
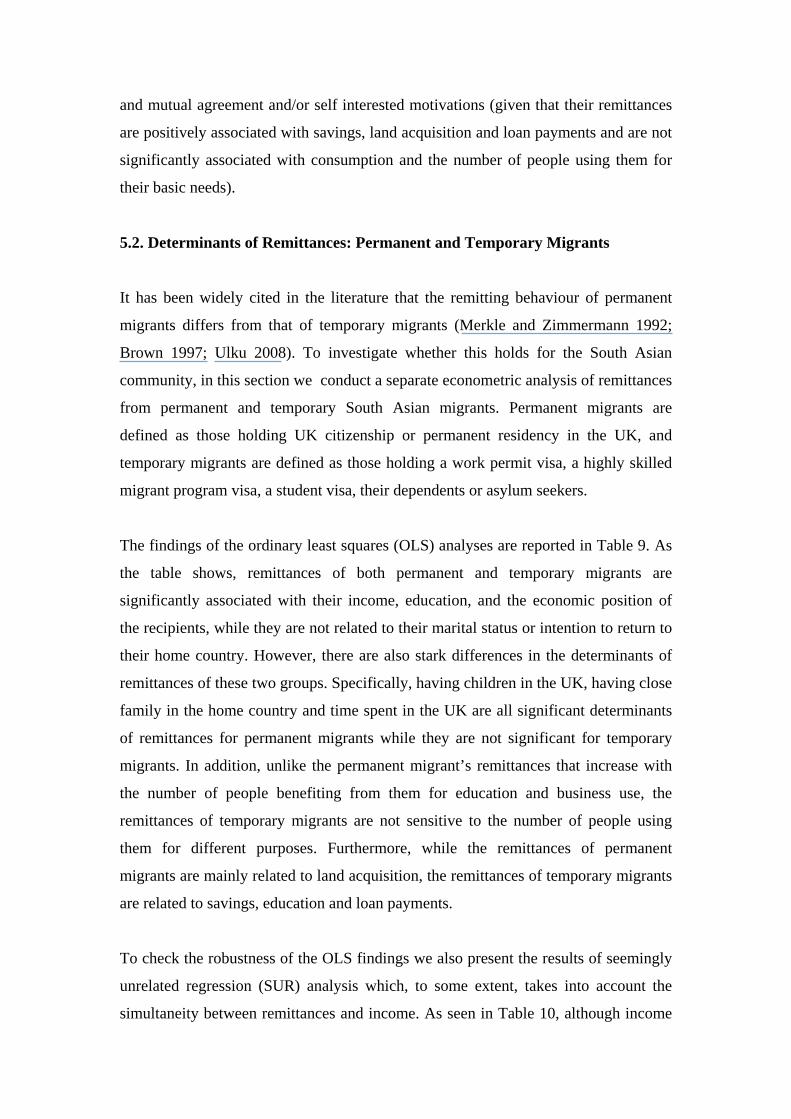
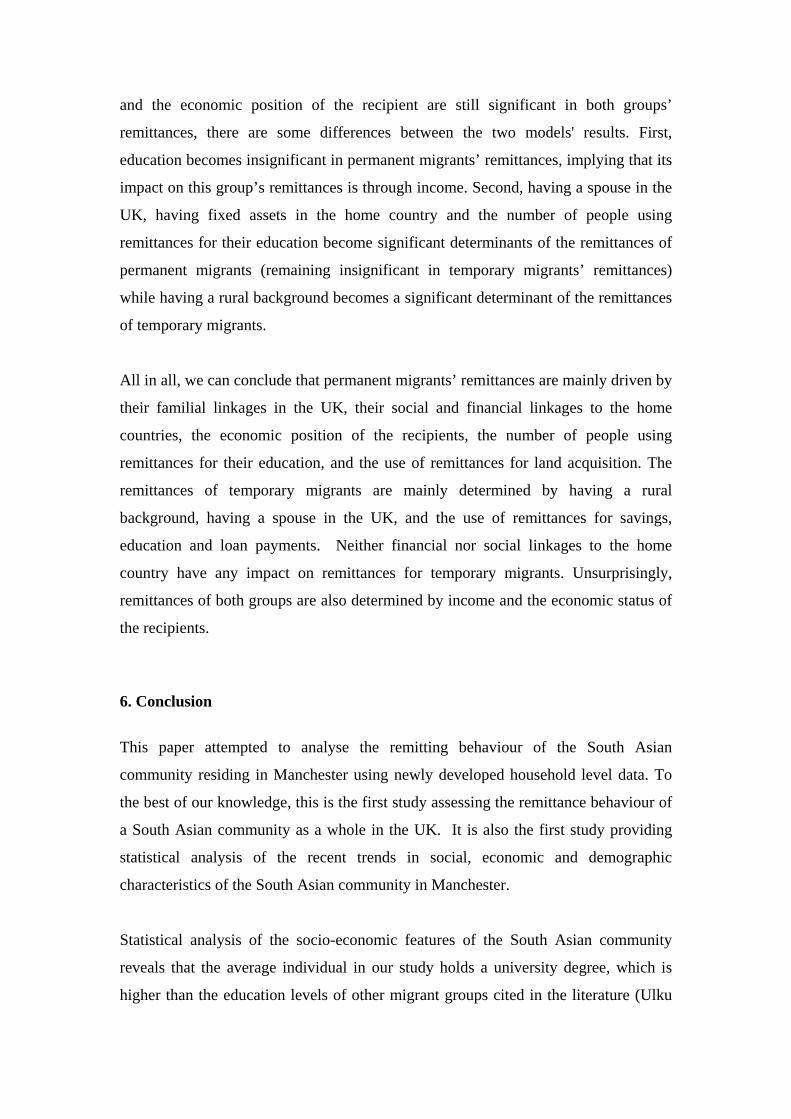
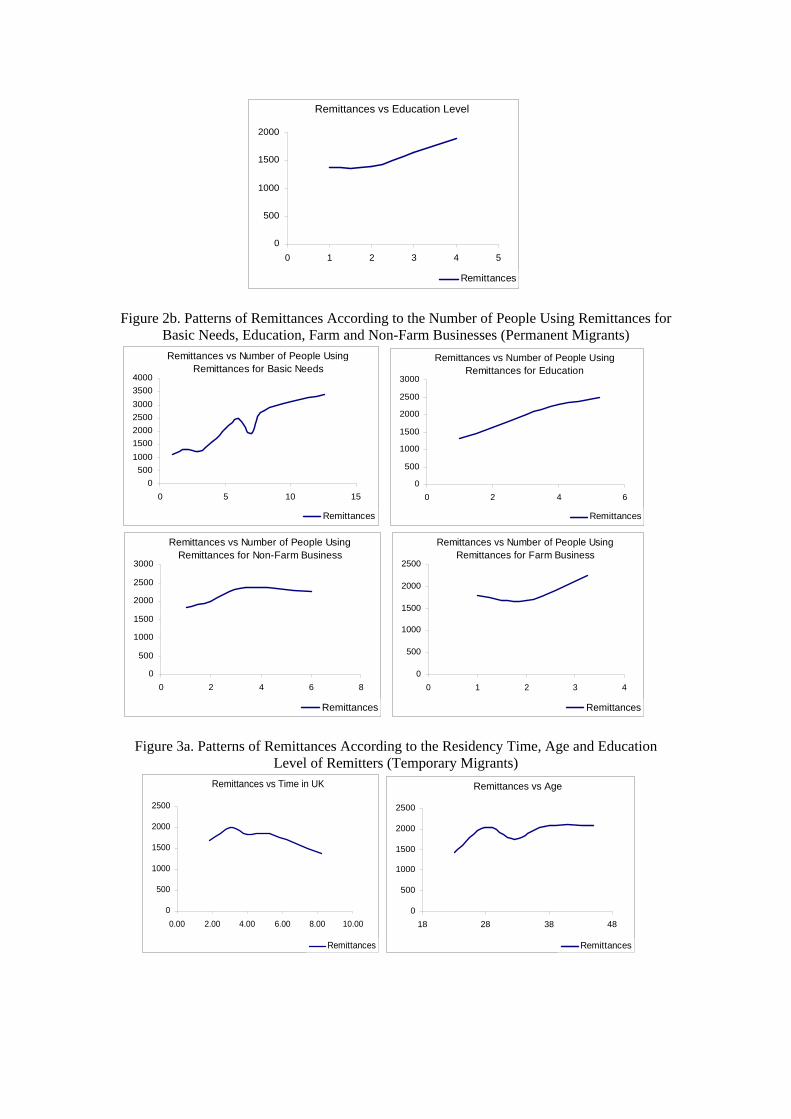
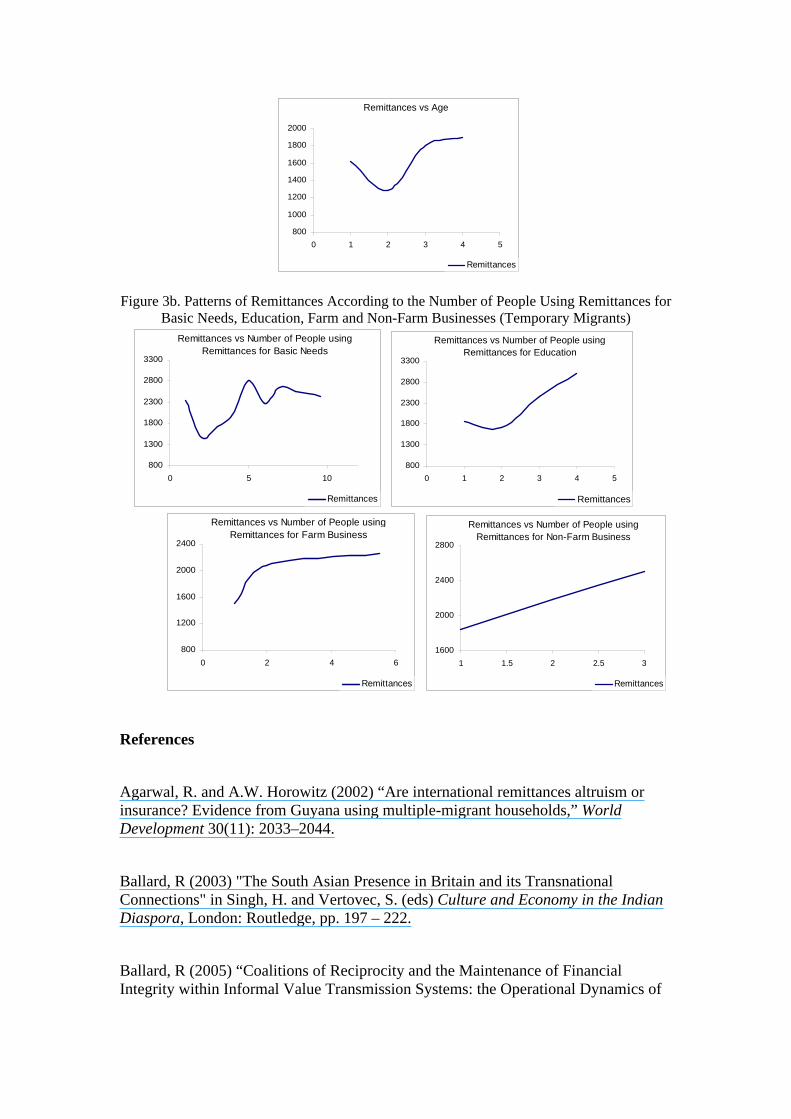
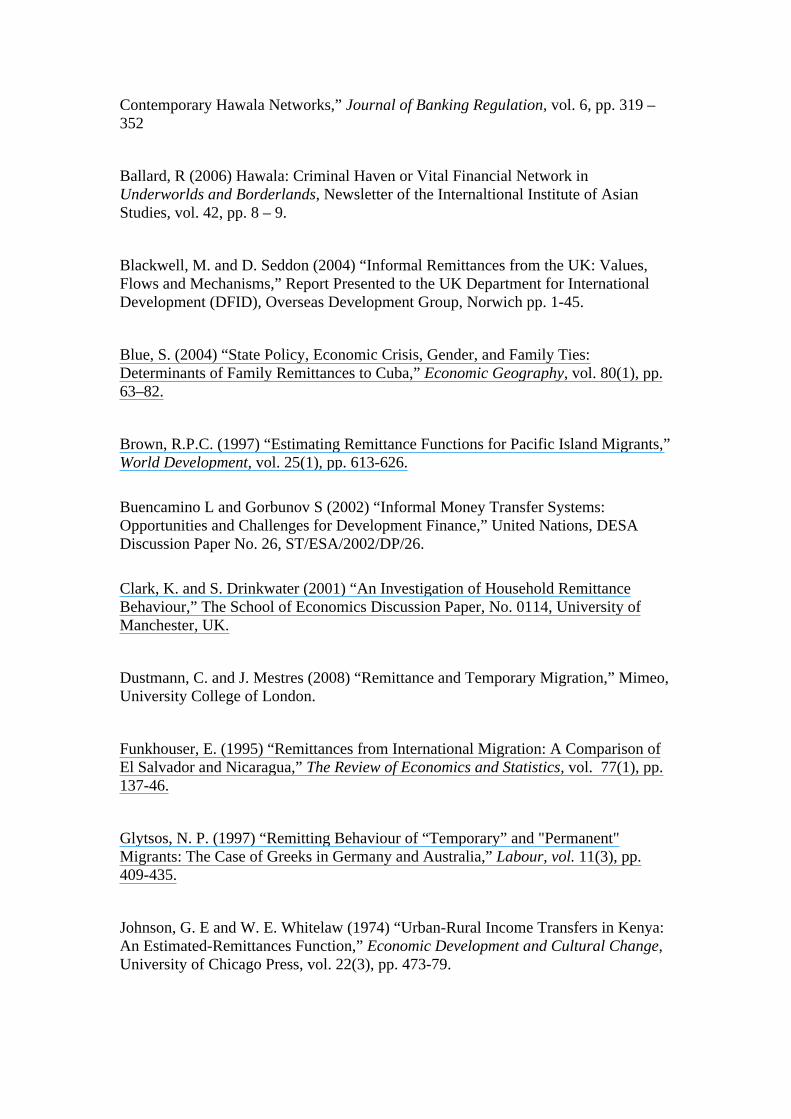
Temporary and permanent migrants’ remittance patterns are reported in Figures 2 and
3. Comparing these figures reveals that permanent migrants’ remittances decline
steadily over time spent in the UK and with age. The remittances of temporary
migrants, on the other hand, decrease slowly over time but not as the remitter gets
older. One reason for this difference is that both the time spent in the UK and the
average age of permanent migrants are greater than those of temporary migrants.
However, the difference remains even after taking this into account (Figures 2a and
3a). The patterns of remittances with regard to education level differ slightly between
these two groups. Specifically, although the remittances of permanent migrants
increase linearly with education we observe a sharp decrease in the remittances of
temporary migrants from primary education to secondary education before they
increase again. This reflects the fact that income premium for the education of
temporary migrants is not linear15 We observe that permanent and temporary
migrants’ remittances are similar in terms of how they are used, except that the
remittances of permanent migrants increase steadily with the number of people using
Pakistani community uses informal channels, 68%, compared to 21% of the Indian and 11% of the Bangladeshi migrants (these findings are not reported but available upon request).
15The highest income premium for the education level of the temporary migrants is for post graduate degree, followed by first degree, primary, and secondary education, in that order. There is no such nonlinearity in the income premium of education level of permanent migrants.
them for their basic needs while the remittances of temporary migrants remain steady
after the fifth person.
5. Econometric Analysis of the Determinants of Remittances
This section provides an econometric analysis of remittances of the South Asian
community in Manchester using ordinary least squares (OLS) regression analysis.
Although OLS has some limitations in controlling for endogeneity and fixed effects,
this should not weaken our analysis given that most of the variables of interest are
exogenous to remittances and that the group specific fixed effects have, to some
extent, been controlled for by including district and religion dummies. Furthermore,
most micro level studies of remittances employ OLS regression analysis due to the
unavailability of longitudinal data. We employ a standard remittances econometric
model as shown below:
iiiiiiii XXXXXcesmit ,55,44,33,22,110tanRe
(1)
where, X1: standard variables on the demographic and socio-economic characteristics
of the household head; X2: economic and social capital and rootedness in the UK; X3:
economic and social capital in South Asia; X4: recipient households’ characteristics;
X5: use of remittances; : district dummies. The descriptions and the list of the
variables in each of the above categories are reported in Table 3. Although some of
the respondents (149 out of 590) are not household heads, since the main variables are
specific to individuals we included all the respondents in our analysis.
5.1. Determinants of Remittances: Full Sample
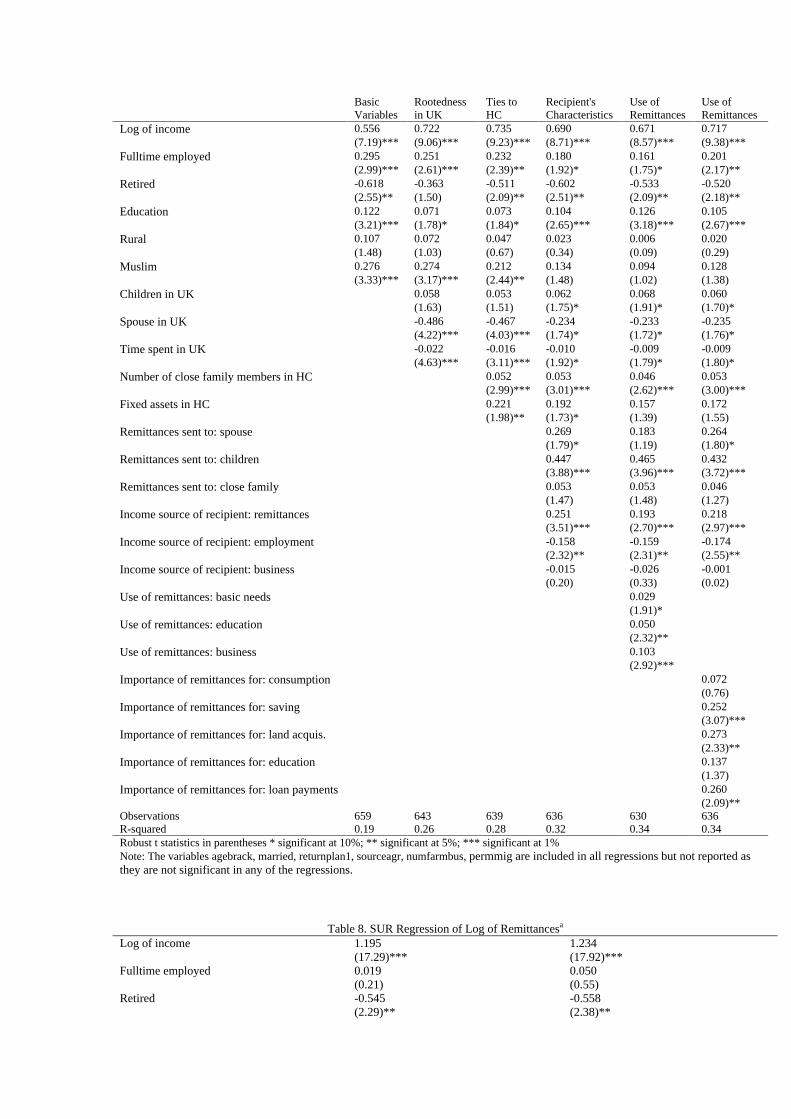
The findings of the analysis using the full sample are reported in Table 7. As the table
shows, most of the standard variables on the socio-economic and demographic
characteristics of the remitter are significant and have the expected sign. More
specifically, income, full time employment and education are all positive determinants
of remittances with respective coefficients of around 0.65, 0.20, and 0.10. Age, being

married and having a rural background are not significant in most regressions, which
is not unexpected given that their impact on remittances is shown to be ambiguous in
the literature. Surprisingly, an intention to return to the home country is not
significant either, suggesting that the amount of remittances sent by temporary
migrants is not different from that of permanent migrants. This is in contrast with the
evidence in the literature that temporary migrants tend to send more remittances than
permanent migrants (Merkle and Zimmerman 1992; Sinning 2007; Ulku 2008). Being
a Muslim is highly positive and significant in all regressions suggesting that Pakistani
and Bangladeshi communities send more remittances than the Indian community,
given that 99% of the former two communities is Muslim compared to the 2% of the
Indian community.
Among the variables included in the analysis to assess the impact of the rootedness of
the South Asian migrants in the UK on their remittances, only time spent in the UK
and having a spouse and children in the UK are significant. The remaining variables,
such as having permanent migrant status, are insignificant (column 2 of Table 1). As
expected, having a UK-based spouse and time spent in the UK have a negative impact
on remittances, which is consistent with the findings of earlier studies such as Masey
and Basem (1992) and Brown (1997). However, the result that having children in the
UK is positively related to the amount of remittances is unexpected as it should
increase the social and economic prospects of the migrant in the UK leading to lower
remittances. This finding thus suggests that those having children might tend to invest
more in their social and economic linkages in the home country probably to secure a
stable future for their children there and to ensure that their connection to the home
country remains strong over generations.
The evidence that the time spent in the UK is negatively related to remittances is
consistent with the remittance decay theory, which suggests that the longer the time
spent away from the home the weaker will become the social linkages of the migrants
to their home country leading to a decrease in remittances over time. Studies such as
Stark and Lucas (1985) assert a close relationship between remittance decay and
remittances motivated by altruism. According to these studies, if migrants are
motivated to remit by self interest or by mutual inter-temporal agreement, remittances
will not decrease over time because migrants have a future self interest in the home
country or are tied into an implicit contract with the family. In the case of altruism,
however, remittances are strongly linked to the social connectedness of the migrants
to their home country, and generally this social connectedness weakens as the time
spent away from home country increases. The third column of Table 7 reports the
impact of social and financial linkages to the home country on the size of remittances.
As the column shows, having close family members (i.e. parents and siblings) and
financial assets in the home country are positively related to the amount of
remittances indicating the importance of familial and financial linkages to the home
country for remittances.
To investigate whether or not the recipient’s socio-economic characteristics influence
the size of remittances, we have also included the main income sources and the
recipient's relation to the sender in the analysis. As seen from the fourth column of
Table 7, spouses and children receive significantly more. Though the remittances sent
to parents and siblings are not significantly higher at the conventional levels (though t
values are high) this is due to the fact that we have controlled for the presence of the
siblings and parents in the home country, which has a positive impact on remittances.
The next set of variables in the fourth column of Table 7 indicates the main sources of
recipients' income. As seen from the fourth column, of the four sources of income,
namely remittances, employment, business and agriculture, only remittances and
employment are significant with positive and negative signs respectively, showing
that those recipients who have no income other than remittances receive more while
those with full employment receive less. Importantly, this finding implies that
remittances from the South Asian community might be motivated by altruism, with
poorer recipients receiving larger remittances.
When investigating the determinants of remittances, it is also important to analyse the
impact of how remittances are used on the size of what is sent as this is important in
the remitter's decision making process. Thus, in the fifth column, we indicate the
number of people benefiting from remittances for their basic needs, education, and
farm and nonfarm businesses. As the column shows, remittances increase with the
number of people using them for their basic needs, education and nonfarm businesses
but do not increase with the number of people using them for farm business.
Remittances sent for business seem to increase more with an additional person, i.e.
one additional person benefiting from remittances leads to a 0.10 percent increase in
remittances, followed by education (0.06) and basic needs (0.03). To further elaborate
the impact of different uses of remittances on remittance size, we carried out
regressions with variables indicating how important remittances were for different
uses, namely for consumption, saving, land acquisition and loan payments.16 As can
be observed from the sixth column of Table 7, remittances increase as the level of
their importance increases for savings, land acquisition and loan payments; however
they do not change with the increases in their degree of importance for consumption
and education.
For a robustness check we also carried out Seemingly Unrelated Regression (SUR)
analysis to take into account potential simultaneity between remittances, income and
fixed assets in the home country. As observed from Table 8, the findings are similar
to those reported in Table 7, except that the affect on remittances of full time
employment, education level and the number of people using remittances for their
basic needs becomes insignificant.
Briefly, the results of the analysis using the full sample suggest that the standard
variables of income, having a spouse and children in the UK, and time spent in the
UK are all significant. Contrary to the findings in the literature, having a rural
background, intending to return to the home country and permanent migration status
are not significant in most regressions. Both social and financial linkages to the home
country are important determinants of remittances from the South Asian community.
There is also evidence that poorer recipients receive more and that remittances are
positively associated with the number of people using them for education and non-
farm businesses while they are not significantly related to the number of people using
them for their basic needs. Similarly, the size of remittances is not significantly
related to the degree of their importance for consumption and education, but there is a
positive association with the degree of their importance for savings, land acquisition,
and loan payments. From the viewpoint of the motivational models, we can infer that
the South Asian community’s remittances are influenced by a combination of
altruism, (as their remittances decay over time and are higher for poorer recipients)
16These variables take on values between 0 and 1, 1 shows the most important area of the use of remittances and 0 shows no importance.
and mutual agreement and/or self interested motivations (given that their remittances
are positively associated with savings, land acquisition and loan payments and are not
significantly associated with consumption and the number of people using them for
their basic needs).
5.2. Determinants of Remittances: Permanent and Temporary Migrants
It has been widely cited in the literature that the remitting behaviour of permanent
migrants differs from that of temporary migrants (Merkle and Zimmermann 1992;
Brown 1997; Ulku 2008). To investigate whether this holds for the South Asian
community, in this section we conduct a separate econometric analysis of remittances
from permanent and temporary South Asian migrants. Permanent migrants are
defined as those holding UK citizenship or permanent residency in the UK, and
temporary migrants are defined as those holding a work permit visa, a highly skilled
migrant program visa, a student visa, their dependents or asylum seekers.
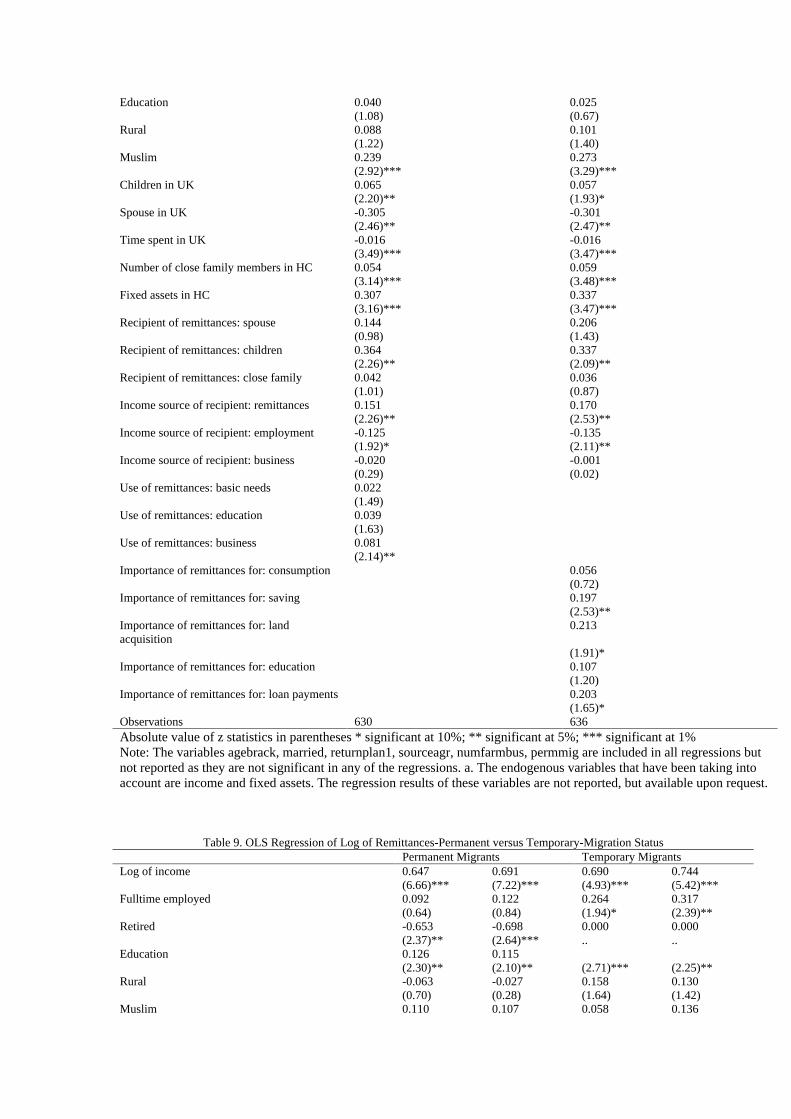
The findings of the ordinary least squares (OLS) analyses are reported in Table 9. As
the table shows, remittances of both permanent and temporary migrants are
significantly associated with their income, education, and the economic position of
the recipients, while they are not related to their marital status or intention to return to
their home country. However, there are also stark differences in the determinants of
remittances of these two groups. Specifically, having children in the UK, having close
family in the home country and time spent in the UK are all significant determinants
of remittances for permanent migrants while they are not significant for temporary
migrants. In addition, unlike the permanent migrant’s remittances that increase with
the number of people benefiting from them for education and business use, the
remittances of temporary migrants are not sensitive to the number of people using
them for different purposes. Furthermore, while the remittances of permanent
migrants are mainly related to land acquisition, the remittances of temporary migrants
are related to savings, education and loan payments.
To check the robustness of the OLS findings we also present the results of seemingly
unrelated regression (SUR) analysis which, to some extent, takes into account the
simultaneity between remittances and income. As seen in Table 10, although income
and the economic position of the recipient are still significant in both groups’
remittances, there are some differences between the two models' results. First,
education becomes insignificant in permanent migrants’ remittances, implying that its
impact on this group’s remittances is through income. Second, having a spouse in the
UK, having fixed assets in the home country and the number of people using
remittances for their education become significant determinants of the remittances of
permanent migrants (remaining insignificant in temporary migrants’ remittances)
while having a rural background becomes a significant determinant of the remittances
of temporary migrants.
All in all, we can conclude that permanent migrants’ remittances are mainly driven by
their familial linkages in the UK, their social and financial linkages to the home
countries, the economic position of the recipients, the number of people using
remittances for their education, and the use of remittances for land acquisition. The
remittances of temporary migrants are mainly determined by having a rural
background, having a spouse in the UK, and the use of remittances for savings,
education and loan payments. Neither financial nor social linkages to the home
country have any impact on remittances for temporary migrants. Unsurprisingly,
remittances of both groups are also determined by income and the economic status of
the recipients.
6. Conclusion
This paper attempted to analyse the remitting behaviour of the South Asian
community residing in Manchester using newly developed household level data. To
the best of our knowledge, this is the first study assessing the remittance behaviour of
a South Asian community as a whole in the UK. It is also the first study providing
statistical analysis of the recent trends in social, economic and demographic
characteristics of the South Asian community in Manchester.
Statistical analysis of the socio-economic features of the South Asian community
reveals that the average individual in our study holds a university degree, which is
higher than the education levels of other migrant groups cited in the literature (Ulku
2008). Their average monthly net income is £1388 and they send about 10% of their
yearly net income to their home countries. Although the Indian community are the
highest earners, the Pakistani community sends the highest amount of remittances. In
addition, 43% of the South Asian community in Manchester owns a house in the UK
while 88% own fixed assets in their home country. Comparison of the key features of
temporary and permanent migrants reveal that they do not actually differ much in
terms of their socio economic characteristics, though temporary migrants tend to earn
less and to send more remittances than permanent migrants. Also there is no decay in
the remittances of temporary migrants implying that temporary migrants’ remittances
might not be motivated strongly by altruism.
Our econometric analysis suggests that remittances from the South Asian community
are primarily determined by income, social and financial linkages to the home
country, the level of dependency of the recipients on remittances, the number of
people using remittances for their education and business, and how important
remittances are for savings, land acquisition, and loan payments. There is no evidence
that the use of remittances for basic needs and consumption has a significant impact
on remittance amount. These findings imply that remittances from the South Asian
community are influenced by a mix of altruism, mutual agreement, and/or self interest
motivations.
Although the determinants of permanent migrants' remittances are in line with those
obtained from the full sample, remittances of temporary migrants seem to be
primarily determined by their use for savings, education and loan payments. In
addition, neither social nor financial linkages to the home country have a significant
impact on the size of remittances, and their remittances do not decay over time,
implying that temporary migrants might be more incentivised by self interest than
other motivations such as altruism or familial contracts.
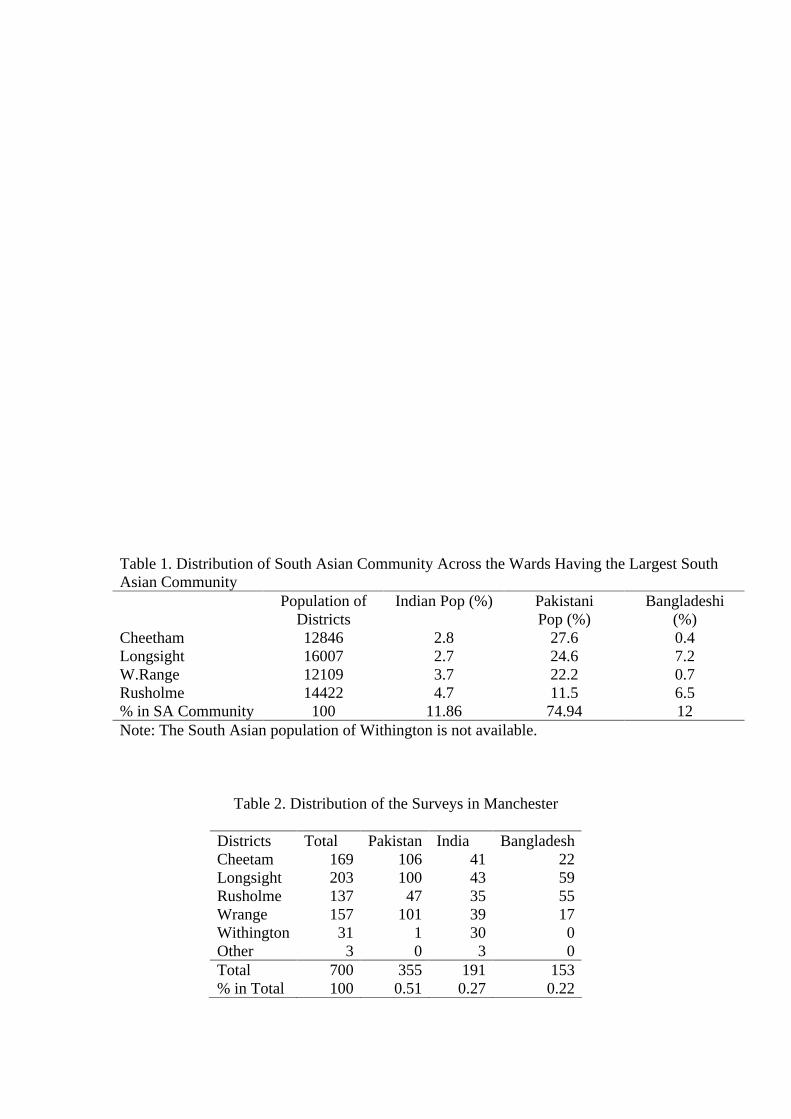
Table 1. Distribution of South Asian Community Across the Wards Having the Largest South Asian Community
Population of Districts
Indian Pop (%) Pakistani Pop (%)
Bangladeshi (%)
Cheetham 12846 2.8 27.6 0.4 Longsight 16007 2.7 24.6 7.2 W.Range 12109 3.7 22.2 0.7 Rusholme 14422 4.7 11.5 6.5 % in SA Community 100 11.86 74.94 12 Note: The South Asian population of Withington is not available.
Table 2. Distribution of the Surveys in Manchester
Districts Total Pakistan
India Bangladesh
Cheetam 169
106
41
22
Longsight 203
100
43
59
Rusholme 137
47
35
55
Wrange 157
101
39
17
Withington
31
1
30
0
Other 3
0
3
0
Total 700
355
191
153
% in Total 100
0.51
0.27
0.22
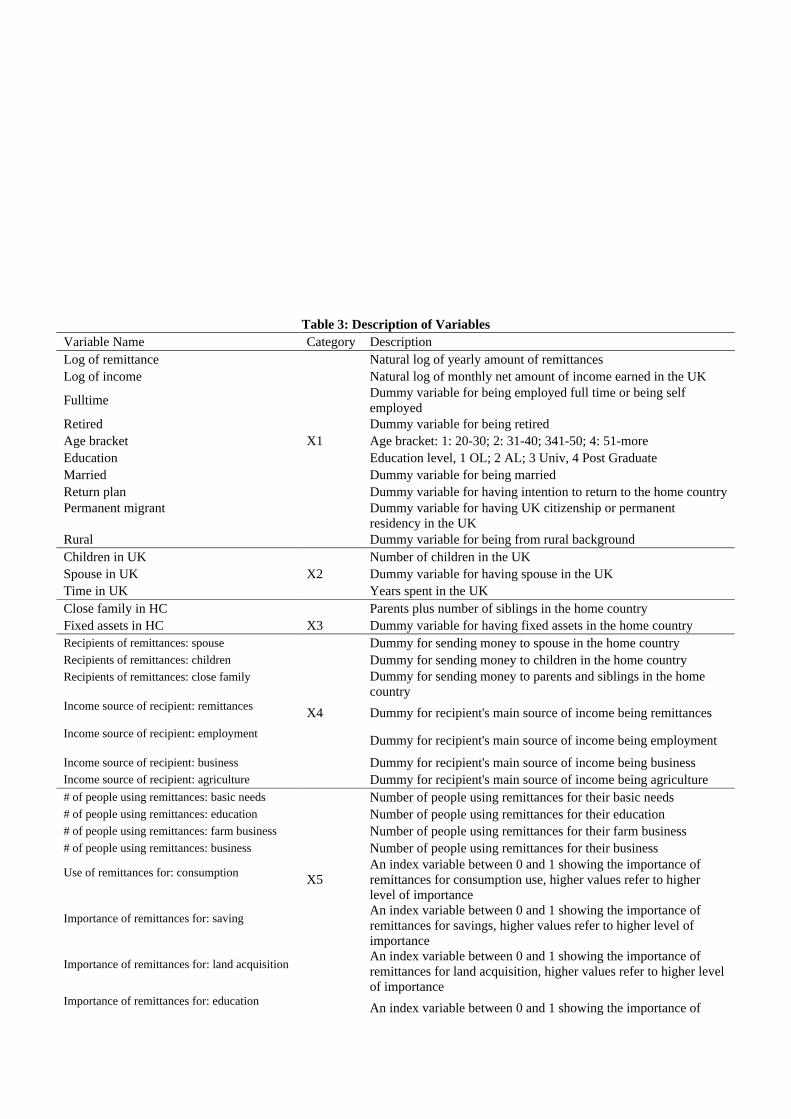
Table 3: Description of Variables Variable Name Category Description Log of remittance Natural log of yearly amount of remittances Log of income Natural log of monthly net amount of income earned in the UK
Fulltime Dummy variable for being employed full time or being self employed
Retired Dummy variable for being retired Age bracket X1 Age bracket: 1: 20-30; 2: 31-40; 341-50; 4: 51-more Education Education level, 1 OL; 2 AL; 3 Univ, 4 Post Graduate Married Dummy variable for being married Return plan Dummy variable for having intention to return to the home country Permanent migrant Dummy variable for having UK citizenship or permanent
residency in the UK Rural Dummy variable for being from rural background Children in UK Number of children in the UK Spouse in UK X2 Dummy variable for having spouse in the UK Time in UK Years spent in the UK Close family in HC Parents plus number of siblings in the home country Fixed assets in HC X3 Dummy variable for having fixed assets in the home country Recipients of remittances: spouse Dummy for sending money to spouse in the home country Recipients of remittances: children Dummy for sending money to children in the home country Recipients of remittances: close family Dummy for sending money to parents and siblings in the home
country Income source of recipient: remittances X4 Dummy for recipient's main source of income being remittances
Income source of recipient: employment Dummy for recipient's main source of income being employment
Income source of recipient: business Dummy for recipient's main source of income being business Income source of recipient: agriculture Dummy for recipient's main source of income being agriculture # of people using remittances: basic needs Number of people using remittances for their basic needs # of people using remittances: education Number of people using remittances for their education # of people using remittances: farm business Number of people using remittances for their farm business # of people using remittances: business Number of people using remittances for their business
Use of remittances for: consumption X5 An index variable between 0 and 1 showing the importance of remittances for consumption use, higher values refer to higher level of importance
Importance of remittances for: saving An index variable between 0 and 1 showing the importance of remittances for savings, higher values refer to higher level of importance
Importance of remittances for: land acquisition An index variable between 0 and 1 showing the importance of remittances for land acquisition, higher values refer to higher level of importance
Importance of remittances for: education An index variable between 0 and 1 showing the importance of
remittances for education, higher values refer to higher level of importance
Importance of remittances for: loan payments An index variable between 0 and 1 showing the importance of remittances for loan payments, higher values refer to higher level of importance
Table 4a. Summary Statistics for Full Sample variable N mean max min p50 sd Remittances (annual) 695 1663 4000 100 1500 1188 Income in UK (monthly net) 682 1388 2500 500 1250 694 Age bracket 700 2.04 5.00 1.00 2.00 0.97 Age 644 36 81 18 34 10.65
Education 692 2.93 4.00 0.00 3.00 0.91 Children in UK 700 1.27 8.00 0.00 1.00 1.56 Time in UK 682 12.46 50.00 1.00 7.00 11.89 Income of recipient (monthly net) 609 238 500 0 150 137 Numbers using rem: basic needs 693 1.66 15.00 0.00 0.00 2.38 Numbers using rem: education 696 0.88 11.00 0.00 0.00 1.37 Numbers using rem: farm business 699 0.14 20.00 0.00 0.00 0.91 Numbers using rem: business 698 0.23 8.00 0.00 0.00 0.77 Remittance use for consumption 700 0.77 1.00 0.00 1.00 0.39 Remittance use for saving 700 0.25 1.00 0.00 0.00 0.36 Remittance use for land 700 0.10 1.00 0.00 0.00 0.24 Remittance use for education 700 0.19 1.00 0.00 0.00 0.31 Remittance use for loan 700 0.07 1.00 0.00 0.00 0.24
Table 4b. Frequency Table for Full Sample Variable Name N % Variable Name N % Full time employed 700 62.43 Remittances to spouse 700 8.29 Self employed 700 20.00 Remittances to children 700 3.29 Part time 600 13.30 Remittances to siblings 699 28.18 Retired 700 2.14 Remittances to parents 698 58.60 Return plan 700 30.71 Income source of recipient: remittances 698 8.02 Female 700 10.57 Income source of recipient: employment 699 17.45 Married 700 67.29 Income source of recipient: business 699 25.46 Muslim 700 73.86 Income source of recipient: agriculture 699 4.58 UK citizen 700 37.86 Residency: Cheetham 700 24.14 Permanent resident 700 24.57 Residency: Long sight 700 29.00 Work Permit/HSMP 700 16.29 Residency: Rusholme 700 19.57 Student visa 700 17.43 Residency: Whaley Range 700 22.43 Rural 697 22.53 Residency: Withington 700 4.43 Spouse in UK 700 58.29 Country of Origin: India 700 27.29 Own accommodation 700 42.57 Country of Origin: Pakistan 700 50.71 Fixed assets in home country 697 87.66 Country of Origin: Bangladesh 700 21.86 Parents in home country 700 82.71
Table 5a. Summary Statistics by Country of Origin Pakistan India Bangladesh
Variable N Mean N Mean N Mean Remittances (annual) 354 1796 187 1559 153 1486 Income in UK (monthly net) 351 1230 178 1784 152 1286
Age bracket 355 2 191 2 153 2 Age 343 35 148 38 152 36 Education 353 3 187 3 151 3 Time in UK 338 10 191 14 152 15
Table 5b. Frequency Table by Country of Origin
Pakistan India Bangladesh
N % N % N % Full time 355 59.72 191 56.54 153 75.82 Self employed 355 25.92 191 16.23 153 11.11 Part time 355 11.55 191 18.32 153 11.11 Student 355 0.28 191 0.52 153 1.96 Retired 355 1.69 191 4.71 153 0.00 Return plan 355 34.65 191 32.98 153 18.95 Female 355 6.48 191 23.04 153 4.58 Married 355 60.00 191 67.02 153 84.31 Muslim 355 98.59 191 7.33 153 99.35 Rural 353 20.96 191 12.04 152 38.82 Own accommodation 355 33.52 191 46.07 153 58.82 Fixed assets in HC 354 87.57 190 86.84 152 88.82
Table 6a. Summary Statistics for Temporary and Permanent Migrants*
Temporary Migrants Permanent Migrants
Variable Name N Mean N Mean
Remittances (annual) 262 1800 433 1581
Income in UK (monthly net) 257 1160 425 1526
Age bracket 263 1.41 437 2.41 Age 239 29.58 405 39.84
Education 262 3.31 430 2.71
Children in UK 263 0.20 437 1.92
Time in UK 262 3.15 420 18.27
Income of recipient (monthly net) 252 279 357 209
Numbers using rem: basic needs 260 1.60 433 1.70
Numbers using rem: education 263 0.73 433 0.97
Numbers using rem: farm business 262 0.16 437 0.13
Numbers using rem: business 261 0.18 437 0.27
Remittance use for consumption 263 0.75 437 0.78
Remittance use for saving 263 0.32 437 0.20
Remittance use for land 263 0.03 437 0.14
Remittance use for education 263 0.20 437 0.18
Remittance use for loan 263 0.16 437 0.02 Those who hold British citizenship or have permanent residents are classified as permanent the remaining classified as temporary.
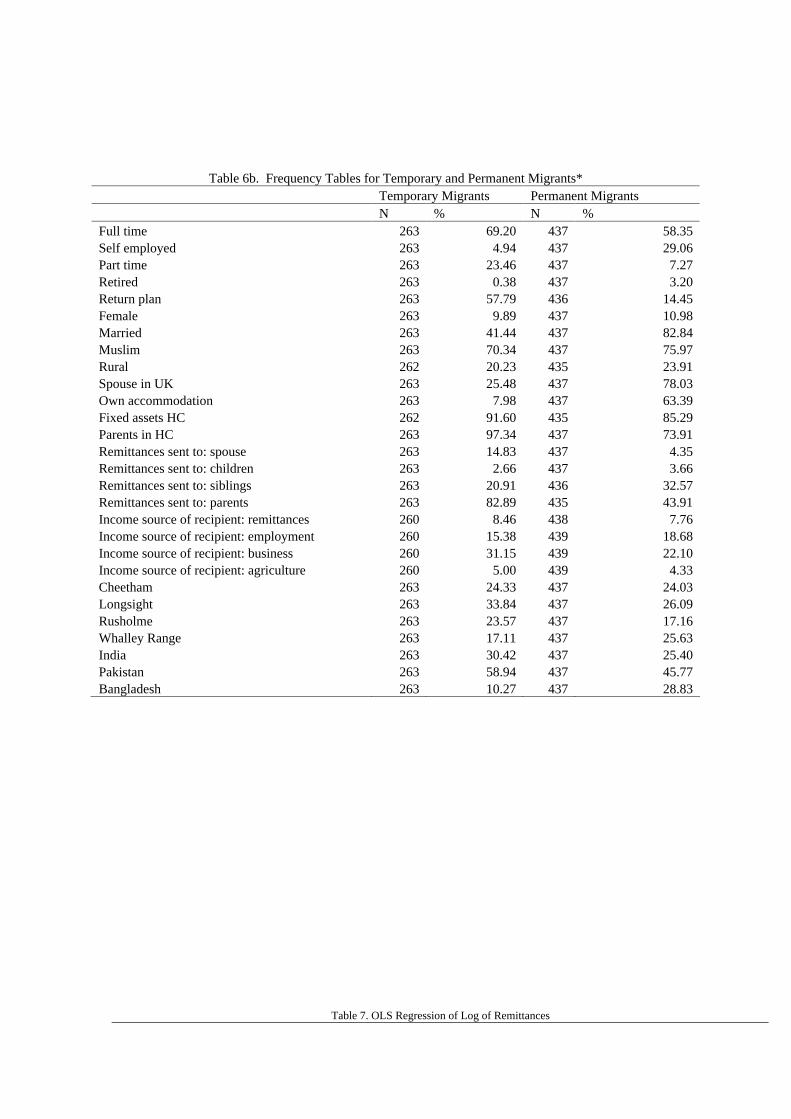
Table 6b. Frequency Tables for Temporary and Permanent Migrants*
Temporary Migrants Permanent Migrants
N % N %
Full time 263 69.20 437 58.35 Self employed 263 4.94 437 29.06 Part time 263 23.46 437 7.27 Retired 263 0.38 437 3.20 Return plan 263 57.79 436 14.45 Female 263 9.89 437 10.98 Married 263 41.44 437 82.84 Muslim 263 70.34 437 75.97 Rural 262 20.23 435 23.91 Spouse in UK 263 25.48 437 78.03 Own accommodation 263 7.98 437 63.39 Fixed assets HC 262 91.60 435 85.29 Parents in HC 263 97.34 437 73.91 Remittances sent to: spouse 263 14.83 437 4.35 Remittances sent to: children 263 2.66 437 3.66 Remittances sent to: siblings 263 20.91 436 32.57 Remittances sent to: parents 263 82.89 435 43.91 Income source of recipient: remittances 260 8.46 438 7.76 Income source of recipient: employment 260 15.38 439 18.68 Income source of recipient: business 260 31.15 439 22.10 Income source of recipient: agriculture 260 5.00 439 4.33 Cheetham 263 24.33 437 24.03 Longsight 263 33.84 437 26.09 Rusholme 263 23.57 437 17.16 Whalley Range 263 17.11 437 25.63 India 263 30.42 437 25.40 Pakistan 263 58.94 437 45.77 Bangladesh 263 10.27 437 28.83
Table 7. OLS Regression of Log of Remittances
Basic Variables
Rootedness in UK
Ties to HC
Recipient's Characteristics
Use of Remittances
Use of Remittances
Log of income 0.556 0.722 0.735 0.690 0.671 0.717
(7.19)*** (9.06)*** (9.23)*** (8.71)*** (8.57)*** (9.38)***
Fulltime employed 0.295 0.251 0.232 0.180 0.161 0.201 (2.99)*** (2.61)*** (2.39)** (1.92)* (1.75)* (2.17)**
Retired -0.618 -0.363 -0.511 -0.602 -0.533 -0.520 (2.55)** (1.50) (2.09)** (2.51)** (2.09)** (2.18)**
Education 0.122 0.071 0.073 0.104 0.126 0.105 (3.21)*** (1.78)* (1.84)* (2.65)*** (3.18)*** (2.67)***
Rural 0.107 0.072 0.047 0.023 0.006 0.020 (1.48) (1.03) (0.67) (0.34) (0.09) (0.29)
Muslim 0.276 0.274 0.212 0.134 0.094 0.128 (3.33)*** (3.17)*** (2.44)** (1.48) (1.02) (1.38)
Children in UK 0.058 0.053 0.062 0.068 0.060 (1.63) (1.51) (1.75)* (1.91)* (1.70)*
Spouse in UK -0.486 -0.467 -0.234 -0.233 -0.235 (4.22)*** (4.03)*** (1.74)* (1.72)* (1.76)*
Time spent in UK -0.022 -0.016 -0.010 -0.009 -0.009 (4.63)*** (3.11)*** (1.92)* (1.79)* (1.80)*
Number of close family members in HC 0.052 0.053 0.046 0.053 (2.99)*** (3.01)*** (2.62)*** (3.00)***
Fixed assets in HC 0.221 0.192 0.157 0.172 (1.98)** (1.73)* (1.39) (1.55)
Remittances sent to: spouse 0.269 0.183 0.264 (1.79)* (1.19) (1.80)*
Remittances sent to: children 0.447 0.465 0.432 (3.88)*** (3.96)*** (3.72)***
Remittances sent to: close family 0.053 0.053 0.046 (1.47) (1.48) (1.27)
Income source of recipient: remittances 0.251 0.193 0.218 (3.51)*** (2.70)*** (2.97)***
Income source of recipient: employment -0.158 -0.159 -0.174 (2.32)** (2.31)** (2.55)**
Income source of recipient: business -0.015 -0.026 -0.001 (0.20) (0.33) (0.02)
Use of remittances: basic needs 0.029 (1.91)*
Use of remittances: education 0.050 (2.32)**
Use of remittances: business 0.103 (2.92)***
Importance of remittances for: consumption 0.072 (0.76)
Importance of remittances for: saving 0.252 (3.07)***
Importance of remittances for: land acquis. 0.273 (2.33)**
Importance of remittances for: education 0.137 (1.37)
Importance of remittances for: loan payments 0.260 (2.09)**
Observations 659 643 639 636 630 636 R-squared 0.19 0.26 0.28 0.32 0.34 0.34 Robust t statistics in parentheses * significant at 10%; ** significant at 5%; *** significant at 1% Note: The variables agebrack, married, returnplan1, sourceagr, numfarmbus, permmig are included in all regressions but not reported as they are not significant in any of the regressions.
Table 8. SUR Regression of Log of Remittancesa
Log of income 1.195 1.234
(17.29)*** (17.92)*** Fulltime employed 0.019 0.050
(0.21) (0.55) Retired -0.545 -0.558
(2.29)** (2.38)**
Education 0.040 0.025 (1.08) (0.67)
Rural 0.088 0.101 (1.22) (1.40)
Muslim 0.239 0.273 (2.92)*** (3.29)***
Children in UK 0.065 0.057 (2.20)** (1.93)*
Spouse in UK -0.305 -0.301 (2.46)** (2.47)**
Time spent in UK -0.016 -0.016 (3.49)*** (3.47)***
Number of close family members in HC 0.054 0.059 (3.14)*** (3.48)***
Fixed assets in HC 0.307 0.337 (3.16)*** (3.47)***
Recipient of remittances: spouse 0.144 0.206 (0.98) (1.43)
Recipient of remittances: children 0.364 0.337 (2.26)** (2.09)**
Recipient of remittances: close family 0.042 0.036 (1.01) (0.87)
Income source of recipient: remittances 0.151 0.170 (2.26)** (2.53)**
Income source of recipient: employment -0.125 -0.135 (1.92)* (2.11)**
Income source of recipient: business -0.020 -0.001 (0.29) (0.02)
Use of remittances: basic needs 0.022 (1.49)
Use of remittances: education 0.039 (1.63)
Use of remittances: business 0.081 (2.14)**
Importance of remittances for: consumption 0.056 (0.72)
Importance of remittances for: saving 0.197 (2.53)**
Importance of remittances for: land acquisition
0.213
(1.91)* Importance of remittances for: education 0.107
(1.20) Importance of remittances for: loan payments 0.203
(1.65)* Observations 630 636 Absolute value of z statistics in parentheses * significant at 10%; ** significant at 5%; *** significant at 1% Note: The variables agebrack, married, returnplan1, sourceagr, numfarmbus, permmig are included in all regressions but not reported as they are not significant in any of the regressions. a. The endogenous variables that have been taking into account are income and fixed assets. The regression results of these variables are not reported, but available upon request.
Table 9. OLS Regression of Log of Remittances-Permanent versus Temporary-Migration Status Permanent Migrants Temporary Migrants
Log of income 0.647 0.691 0.690 0.744
(6.66)*** (7.22)*** (4.93)*** (5.42)*** Fulltime employed 0.092 0.122 0.264 0.317
(0.64) (0.84) (1.94)* (2.39)** Retired -0.653 -0.698 0.000 0.000
(2.37)** (2.64)*** .. .. Education 0.126 0.115
(2.30)** (2.10)** (2.71)*** (2.25)** Rural -0.063 -0.027 0.158 0.130
(0.70) (0.28) (1.64) (1.42) Muslim 0.110 0.107 0.058 0.136

(0.78) (0.76) (0.37) (0.92)
Children in UK 0.069 0.066 0.003 0.013 (1.69)* (1.64) (0.04) (0.16)
Spouse in UK -0.274 -0.256 -0.218 -0.232 (1.52) (1.37) (1.08) (1.35)
Time spent in UK -0.009 -0.009 0.002 0.001 (1.61) (1.60) (0.18) (0.09)
Number of close family members in HC 0.057 0.062 0.002 0.013 (2.55)** (2.78)*** (0.07) (0.34)
Fixed assets in HC 0.238 0.280 -0.056 -0.068 (1.51) (1.86)* (0.34) (0.43)
Recipient of remittances: spouse 0.329 0.426 0.065 0.117 (1.61) (2.17)** (0.26) (0.53)
Recipient of remittances: children 0.535 0.481 0.266 0.227 (3.30)*** (2.86)*** (1.58) (1.40)
Recipient of remittances: close family 0.035 0.018 0.061 0.115 (0.78) (0.39) (0.68) (1.27)
Income source of recipient: remittances 0.206 0.200 0.205 0.273 (2.11)** (2.01)** (1.63) (2.31)**
Income source of recipient: employment -0.122 -0.129 -0.210 -0.269 (1.35) (1.45) (1.89)* (2.38)**
Income source of recipient: business 0.021 0.078 -0.140 -0.127 (0.21) (0.82) (1.07) (1.08)
Use of remittances: basic needs 0.021 0.040 (1.09) (1.53)
Use of remittances: education 0.048 0.059 (1.87)* (1.12)
Use of remittances: business 0.117 0.074 (2.83)*** (1.00)
Importance of remittances for: consumption 0.067 0.146 (0.50) (1.03)
Importance of remittances for: saving 0.174 0.381 (1.44) (3.28)***
Importance of remittances for: land acquisition 0.317 -0.415 (2.50)** (0.75)
Importance of remittances for: education -0.002 0.311 (0.01) (2.21)**
Importance of remittances for: loan payments 0.180 0.377 (0.53) (2.35)**
Observations 388 390 242 246 R-squared 0.36 0.35 0.36 0.38 Robust t statistics in parentheses * significant at 10%; ** significant at 5%; *** significant at 1%
Table 10. Sur Regression of Log of Remittancesa
Permanent Migrants Temporary Migrants Log of income 1.163 1.199 1.214 1.248
(13.06)*** (13.47)*** (10.62)*** (11.24)*** Fulltime employed 0.012 0.033 0.078 0.126
(0.09) (0.22) (0.66) (1.10) Retired -0.573 -0.639 -0.573 -0.639
(2.11)** (2.37)** (2.11)** (2.37)** Education 0.039 0.032 0.111 0.089
(0.78) (0.63) (1.91)* (1.62) Rural 0.025 0.055 0.202 0.180
(0.26) (0.57) (1.80)* (1.66)* Muslim 0.225 0.226 0.219 0.290
(1.92)* (1.90)* (1.81)* (2.41)** Children in UK 0.066 0.064 0.009 0.011
(1.94)* (1.89)* (0.09) (0.12) Spouse in UK -0.293 -0.281 -0.388 -0.383
(1.80)* (1.71)* (1.79)* (1.99)**
Time spent in UK -0.016 -0.016 -0.009 -0.009 (3.07)*** (3.05)*** (0.53) (0.59)
Number of close family members in HC 0.057 0.060 0.006 0.014 (2.54)** (2.65)*** (0.19) (0.46)
Fixed assets in HC 0.487 0.551 -0.229 -0.238 (3.83)*** (4.35)*** (1.36) (1.44)
Recipient of remittances: spouse 0.256 0.329 0.053 0.095 (1.21) (1.57) (0.22) (0.43)
Recipient of remittances: children 0.416 0.371 0.215 0.184 (1.98)** (1.75)* (0.77) (0.69)
Recipient of remittances: close family 0.027 0.014 0.049 0.093 (0.55) (0.28) (0.56) (1.08)
Income source of recipient: remittances 0.160 0.154 0.165 0.221 (1.77)* (1.68)* (1.58) (2.26)**
Income source of recipient: employment -0.095 -0.100 -0.170 -0.217 (1.13) (1.20) (1.47) (2.04)**
Income source of recipient: business 0.016 0.060 -0.113 -0.103 (0.18) (0.68) (0.90) (0.93)
Use of remittances: basic needs 0.017 0.032 (0.86) (1.25)
Use of remittances: education 0.037 0.048 (1.30) (0.86)
Use of remittances: business 0.091 0.060 (2.06)** (0.75)
Importance of remittances for: consumption 0.052 0.118 (0.48) (1.08)
Importance of remittances for: saving 0.135 0.308 (1.15) (3.03)***
Importance of remittances for: land acquisition 0.245 -0.336 (2.00)** (0.86)
Importance of remittances for: education -0.001 0.251 (0.01) (1.93)*
Importance of remittances for: loan payments 0.139 0.305 (0.44) (2.32)**
Observations 388 390 242 246 Absolute value of z statistics in parentheses * significant at 10%; ** significant at 5%; *** significant at 1% Note: The variables agebrack, married, returnplan1, sourceagr, numfarmbus, permmig are included in all regressions but not reported as they are not significant in any of the regressions. a. The endogenous variables that have been taking into account are income and fixed assets. The regression results of these variables are not reported, but available upon request.
Figure 1a. Patterns of Remittances According to the Residency Time, Age and Education Level of Remitters (Full Sample)
Remittances vs Time Spent in UK
0200400600800
100012001400160018002000
0 10 20 30 40 50 60
Remittances
Remittances vs Age
0
500
1000
1500
2000
2500
16 36 56 76
Remittances
Remittances vs Education Level
800
1000
1200
1400
1600
1800
2000
0 1 2 3 4 5
Remittances
Figure 1b. Patterns of Remittances According to the Number of People Using Remittances for Basic Needs, Education, Farm and Non-Farm Businesses (Full
Sample)
Remittances vs Number of People Using Remittances for Basic Needs
800
1300
1800
2300
2800
3300
0 2 4 6 8 10 12
Remittances
Remittances vs Number of People Using Remittances for Education
800
1300
1800
2300
2800
3300
3800
0 2 4 6 8 10
Remittances
Remittances vs Number of People Using Remittances for Farm Business
800
1000
1200
1400
1600
1800
2000
2200
2400
0 1 2 3 4 5
Remittances
Remittances vs Number of People Using Remittances for Non-Farm Business
800
1300
1800
2300
2800
3300
0 2 4 6 8
Remittances
Figure 2a. Patterns of Remittances According to the Residency Time, Age and Education Level of Remitters (Permanent Migrants)
Remittances vs Time in UK
0
500
1000
1500
2000
2500
0 20 40 60
Remittances
Remittances vs Age
0
500
1000
1500
2000
18 38 58 78
Remittances
Remittances vs Education Level
0
500
1000
1500
2000
0 1 2 3 4 5
Remittances
Figure 2b. Patterns of Remittances According to the Number of People Using Remittances for Basic Needs, Education, Farm and Non-Farm Businesses (Permanent Migrants) Remittances vs Number of People Using
Remittances for Basic Needs
0
500
1000
1500
2000
2500
3000
3500
4000
0 5 10 15
Remittances
Remittances vs Number of People Using Remittances for Education
0
500
1000
1500
2000
2500
3000
0 2 4 6
Remittances
Remittances vs Number of People Using Remittances for Non-Farm Business
0
500
1000
1500
2000
2500
3000
0 2 4 6 8
Remittances
Remittances vs Number of People Using Remittances for Farm Business
0
500
1000
1500
2000
2500
0 1 2 3 4
Remittances
Figure 3a. Patterns of Remittances According to the Residency Time, Age and Education Level of Remitters (Temporary Migrants)
Remittances vs Time in UK
0
500
1000
1500
2000
2500
0.00 2.00 4.00 6.00 8.00 10.00
Remittances
Remittances vs Age
0
500
1000
1500
2000
2500
18 28 38 48
Remittances
Remittances vs Age
800
1000
1200
1400
1600
1800
2000
0 1 2 3 4 5
Remittances
Figure 3b. Patterns of Remittances According to the Number of People Using Remittances for Basic Needs, Education, Farm and Non-Farm Businesses (Temporary Migrants)
Remittances vs Number of People using Remittances for Basic Needs
800
1300
1800
2300
2800
3300
0 5 10
Remittances
Remittances vs Number of People using Remittances for Education
800
1300
1800
2300
2800
3300
0 1 2 3 4 5
Remittances
Remittances vs Number of People using Remittances for Farm Business
800
1200
1600
2000
2400
0 2 4 6
Remittances
Remittances vs Number of People using Remittances for Non-Farm Business
1600
2000
2400
2800
1 1.5 2 2.5 3
Remittances
References
Agarwal, R. and A.W. Horowitz (2002) “Are international remittances altruism or insurance? Evidence from Guyana using multiple-migrant households,” World Development 30(11): 2033–2044.
Ballard, R (2003) "The South Asian Presence in Britain and its Transnational Connections" in Singh, H. and Vertovec, S. (eds) Culture and Economy in the Indian Diaspora, London: Routledge, pp. 197 – 222.
Ballard, R (2005) “Coalitions of Reciprocity and the Maintenance of Financial Integrity within Informal Value Transmission Systems: the Operational Dynamics of
Contemporary Hawala Networks,” Journal of Banking Regulation, vol. 6, pp. 319 – 352
Ballard, R (2006) Hawala: Criminal Haven or Vital Financial Network in Underworlds and Borderlands, Newsletter of the Internaltional Institute of Asian Studies, vol. 42, pp. 8 – 9.
Blackwell, M. and D. Seddon (2004) “Informal Remittances from the UK: Values, Flows and Mechanisms,” Report Presented to the UK Department for International Development (DFID), Overseas Development Group, Norwich pp. 1-45.
Blue, S. (2004) “State Policy, Economic Crisis, Gender, and Family Ties: Determinants of Family Remittances to Cuba,” Economic Geography, vol. 80(1), pp. 63–82.
Brown, R.P.C. (1997) “Estimating Remittance Functions for Pacific Island Migrants,” World Development, vol. 25(1), pp. 613-626.
Buencamino L and Gorbunov S (2002) “Informal Money Transfer Systems: Opportunities and Challenges for Development Finance,” United Nations, DESA Discussion Paper No. 26, ST/ESA/2002/DP/26.
Clark, K. and S. Drinkwater (2001) “An Investigation of Household Remittance Behaviour,” The School of Economics Discussion Paper, No. 0114, University of Manchester, UK.
Dustmann, C. and J. Mestres (2008) “Remittance and Temporary Migration,” Mimeo, University College of London.
Funkhouser, E. (1995) “Remittances from International Migration: A Comparison of El Salvador and Nicaragua,” The Review of Economics and Statistics, vol. 77(1), pp. 137-46.
Glytsos, N. P. (1997) “Remitting Behaviour of “Temporary” and "Permanent" Migrants: The Case of Greeks in Germany and Australia,” Labour, vol. 11(3), pp. 409-435.
Johnson, G. E and W. E. Whitelaw (1974) “Urban-Rural Income Transfers in Kenya: An Estimated-Remittances Function,” Economic Development and Cultural Change, University of Chicago Press, vol. 22(3), pp. 473-79.
Lianos, Theoodre P. (1997), “Factors Determining Migrant Remittances: The Case of Greece International,” Migration Review, vol. 31, no.1, pp. 72-87.
Looney, R.E. (2002) “Following the Terrorist Informal Money Trail: The Hawala Financial Mechanism”, Strategic Insight, November 1, 2002.
Lowell, B.L. and R.O. De La Garza (2000), The Developmental Role of Remittances in US Latino Communities and in Latin American Countries, A Final Project Report, Inter-American Dialogue.
Lucas, R.E.B. and O. Stark (1985) “Motivations to Remit: Evidence from Botswana,” Journal of Political Economy, vol. 93(5), pp. 901-918.
Maimbo, S. M. and N. Passas (2004) “The Regulation and Supervision of Informal Remittance Systems,” Small Enterprise Development, vol. 15, pp. 53-61.
Massey, D. S. and L. Basem (1992) “Determinants of Savings, Remittances, and Spending Patterns among Mexican Migrants to the United States,” Sociological Inquiry, vol. 62, pp.186-207.
Merkle, L. and K. F. Zimmermann (1992) “Savings, Remittances, and Return Migration,” Economics Letters, 38, pp. 77-81.
Poirine, B. (1997) “A Theory of Remittances as an Implicit Family Loan Arrangement,” World Development, vol. 25 (4), pp. 589-612.
Puri, S. and T. Ritzema (1999) “Migrant Worker Remittances, Micro-finance and the Informal Economy: Prospects and Issues,” Working Paper, No. 21, Geneva, Social Finance Unit, International Labour Organisation, DC: World Bank, pp. 157-175.Rapoport, Hillel and Frédéric.
Rapoport, H. and F. Docquier (2005) “The Economics of Migrants’ Remittances,” IZA Discussion Papers 1531, Institute for the Study of Labour (IZA).
Sana, M (2005) “Buying Membership in the Transnational Community: Migrant Remittances, Social Status, and Assimilation”, Population Research and Policy Review, vol.2 4 (3), pp.231-61.
Sander, C. (2003) “Migrant Remittances to Developing Countries: A Scoping Study Overview and Introduction to Issues for Pro-Poor Financial Services”, Prepared for the UK Department of International Development (DFID), Bannock Consulting.
Seddon, D. (2004) “South Asian Remittances: Implications for Development,” Contemporary South Asia, vol. 13 (4), pp. 403-420(18).
Sinning, M. (2007) “Determinants of Savings and Remittances: Empirical Evidence from Immigrants to Germany,” RWI Essen and IZA Discussion Paper No. 2966, August 2007, IZA Discussion Papers 1632, Institute for the Study of Labour (IZA).
Stark, O. and D. Bloom (1985) “The New Economics of Labour Migration,” American Economic Review, vol. 75; pp. 173–8.
Ulku, H. (2008) “Remitting and Saving Behaviour of International Migrants: Evidence from Turkish Households in Germany” Brookings World Poverty Institute (BWPI) Working Paper No. 47, University of Manchester.
Vertovec, S (2006) “Migrant Transanationalism and Modes of Transformation”, International Migration Review, vol. 39(3), pp. 970-1001.
Vargas-Silva, C. and Peng, H. (2006) “Macroeconomic Determinants of Workers’ Remittances: Host versus Home Country’s Economic Conditions.” Journal of International Trade and Economic Development, vol. 15, no.1, pp.81-99.
Wilson, J. (2002) “Hawala and other Informal Payments Systems: An Economic Perspective”, Washington DC: International Monetary Fund, May 16, 2002, Seminar on Monetary and Financial Law. World Bank (2004) “Global Development Finance,” World Bank, Washington, DC.
World Bank (2008) “Migration and Remittances Fact Book,” World Bank: Washington, DC.

Lancashire Business School Working Papers: Publications
Volume 1. Paper 1 Determinants of Remittances: The Case of the South Asian Community in Manchester, Authors Thankom Arun, Hulya Ulku