determinants of nonperforming loans: empirical study in case ...
84
DETERMINANTS OF NONPERFORMING LOANS: EMPIRICAL STUDY IN CASE OF COMMERCIAL BANKS IN ETHIOPIA A THESIS SUBMITTED TO SCHOOL OF POSTGRADUATE IN PARTIAL FULFILLMENT OF THE REQUIREMENTS FOR THE DEGREE OF MASTERS OF SCIENCE (MSC) IN ACCOUNTING AND FINANCE BY: GADISE GEZU MAIN ADVISOR: WONDWESEN SIYUM (ASS. PROFESSOR) CO-ADVISOR: MUSE BEYENE (MSC) JIMMA UNIVERSITY BUSINESS AND ECONOMICS COLLEGE DEPARTMENT OF ACCOUNTING AND FINANCE JUNE, 2014 JIMMA, ETHIOPIA
-
Upload
khangminh22 -
Category
Documents
-
view
4 -
download
0
Transcript of determinants of nonperforming loans: empirical study in case ...

DETERMINANTS OF NONPERFORMING LOANS:
EMPIRICAL STUDY IN CASE OF COMMERCIAL
BANKS IN ETHIOPIA
A THESIS SUBMITTED TO
SCHOOL OF POSTGRADUATE IN PARTIAL FULFILLMENT OF THE
REQUIREMENTS FOR THE DEGREE OF MASTERS OF SCIENCE
(MSC) IN ACCOUNTING AND FINANCE
BY: GADISE GEZU
MAIN ADVISOR: WONDWESEN SIYUM (ASS. PROFESSOR)
CO-ADVISOR: MUSE BEYENE (MSC)
JIMMA UNIVERSITY
BUSINESS AND ECONOMICS COLLEGE
DEPARTMENT OF ACCOUNTING AND FINANCE
JUNE, 2014
JIMMA, ETHIOPIA

I
Abstract As noted by Sharon (2007), loans have a vital contribution towards development of economy.
However, its nonpayment also leads to incidence of huge loss on banks in particular and country
in general. Hence, this study was conducted to examine both bank specific (loan to deposit ratio,
capital adequacy ratio, return on asset and return on equity) and macroeconomic (lending rate,
inflation and effective tax rate) determinants of NPLs of commercial banks in Ethiopia. To this
end, the researcher has selected eight senior commercial banks in Ethiopia judgmentally. This
study used secondary sources of data, which is panel data in nature, over the period 2002-2013
These data were collected from NBE and CSA. Furthermore, fixed effect model was used to
examine the determinants of NPLs. This research is an explanatory research design that
identifies the cause and effect relationships between the NPLs and its determinants.
The study shows a down ward sloping of nonperforming loans for commercial banks in Ethiopia.
The finding also revealed as LTD ratio had positive whereas INFR had negative, but
insignificant effect on NPLs of commercial banks in Ethiopia. However, bank profitability
measured in terms of ROE, banks capital adequacy ratio and lending rate had negative and
statistically significant effect whereas bank profitability measured in terms of ROA and effective
tax rate had positive and statistically significant effect on NPLs of commercial banks in Ethiopia.
The finding of this study is significant since once identifying the determinants of NPLs might
enable management body to make appropriate lending policies that prevent the occurrence of
NPLs. Furthermore, the study recommended as bank managers should emphasize the
management of current assets and loans than fixed assets in order to reduce the level of
nonperforming loans. Besides, it is better for the loan officers to provide financial counseling to
the borrowers on the wise use of loan and also to make decision on timely fashion to meet their
need.
Key words: Nonperforming loans, bank specific factors, macroeconomic factors

II
Acknowledgement
First of all, I would like to greatly express my utmost gratitude to my main advisor Wondwesen
Siyum (Ass. professor) and co-advisor Muse Beyene (MSc) for their invaluable comments,
encouragements and guidance in accomplishing this thesis and make it successful. Besides, I
extend my gratitude to the staff members and management body of Commercial Banks’ head
office, National Bank of Ethiopia and Center of Statistical Agency for their cooperation with me
via providing necessarily data. My immense gratitude also go to my staff members for their
immeasurable assistance while doing this thesis.
Furthermore, my indebted gratitude expressed to all of my families for their encouragement in
completing this research paper, especially for my mother Belaynesh Mamo.

III
Table of Contents Abstract .................................................................................................................................................... I
Acknowledgement ................................................................................................................................... II
Table of Contents ................................................................................................................................... III
List of Figures ........................................................................................................................................ VI
List of Tables ........................................................................................................................................ VII
Acronym .............................................................................................................................................. VIII
CHAPTER ONE ..................................................................................................................................... 1
INTRODUCTION ................................................................................................................................... 1
1.1 Background of the Study ................................................................................................................ 1
1.2 Statement of the Problem ............................................................................................................... 4
1.3 Objective of the Study.................................................................................................................... 7
1.3.1 General objectives ................................................................................................................... 7
1.3.2 Specific objectives .................................................................................................................. 7
1.4 Research Hypothesis ...................................................................................................................... 7
1.5 Scope and Limitation of the Study ................................................................................................. 8
1.6 Significance of the study ................................................................................................................ 9
1.7 Operational Definition ................................................................................................................... 9
1.8 Ethical Issues ............................................................................................................................... 10
1.9 Organization of the paper ............................................................................................................. 10
CHAPTER TWO .................................................................................................................................. 11
REVIEW of RELATED LITERATURE ................................................................................................ 11
2.1 Theoretical Literature ................................................................................................................... 11
2.1.1 Overview of Banking System in Ethiopia .............................................................................. 11
2.1.2 Definition and Concepts ........................................................................................................ 13
2.2 Empirical Literature ..................................................................................................................... 18
2.2.1. Across Countries Studies ...................................................................................................... 19
2.2.2. Single Country Studies ......................................................................................................... 21
2.3Conceptual Frame Work ............................................................................................................... 26
2.4. Summary and Knowledge Gap .................................................................................................... 27
CHAPTER THREE ............................................................................................................................... 30

IV
RESEARCH METHODOLOGY ........................................................................................................... 30
3.1 Research Design and Approach .................................................................................................... 30
3.2 Nature of Data and Instruments of Data collection........................................................................ 31
3.3 Sampling Design.......................................................................................................................... 31
3.4 Data Analysis and Presentation .................................................................................................... 33
3.5 Study Variables ............................................................................................................................... 34
3.5.1 Dependent variable ................................................................................................................... 34
3.5.2 Independent Variables ............................................................................................................... 35
3.6 Model Specification ......................................................................................................................... 40
CHAPTER FOUR ................................................................................................................................. 41
FINDING and DISCUSSIONS .............................................................................................................. 41
4.1 Introduction ................................................................................................................................. 41
4.2 Study Variables ........................................................................................................................... 41
4.3 Descriptive Statistics .................................................................................................................... 42
4.4 Analysis for Nonperforming Loans Trend Form 2002-2013 ......................................................... 44
4.5 Test for the Classical Linear Regression Model (CLRM) Assumptions ......................................... 45
4.5.1 Normality Test ............................................................................................................... 46
4.5.2 Heteroscedasticity Test ................................................................................................... 46
4.5.3 Autocorrelation Test ....................................................................................................... 47
4.5.4 Multicolinearity Test ...................................................................................................... 47
4.6 Model Selection ........................................................................................................................... 49
4.6.1 Random Effect versus Fixed Effect Models ........................................................................... 49
4.7 Result of Regression Analysis ...................................................................................................... 50
4.8 Discussion ................................................................................................................................... 54
4.8.1 Determinants of Nonperforming Loans.................................................................................. 54
4.9 Summary ..................................................................................................................................... 57
CHAPTER FIVE ................................................................................................................................... 60
CONCLUSION and RECOMMENDATION ......................................................................................... 60
5.1 Conclusion................................................................................................................................... 60
5.2 Recommendation ......................................................................................................................... 61
Direction for Further Research............................................................................................................... 62
REFERENCES......................................................................................................................................... I

V
APPENDICES ...................................................................................................................................... VII
Appendix1: Model Selection and Basic Tests for CLRM Assumptions............................................... VII
Appendix 2: Raw Data ....................................................................................................................... IX

VI
List of Figures
Figure 2.1 Conceptual Frame works…………………………………………………..…………27
Figure 4.1 Moving Trend Analysis of Nonperforming Loans…………………………………...45

VII
List of Tables
Table 2.1 Banking sectors in Ethiopia…………………………………………………………13
Table 3.1 Expected sign of Variables……………………………………………………………39
Table 4.1 Explanation of Study Variables……………………………………………………….42
Table 4.2 Summary of Descriptive statistics…………………………………………………….43
Table 4.3 Results of Fixed effect regression Model…………………………..............................52
Table 4.4 Comparison of Finding on Determinants of NPLs from Previous Studies……...59

VIII
Acronym
AIB: - Awash International Bank
ALR: Average lending rate
ARDL: - Autoregressive Distributed Lag
ATM: - Automated Teller machine
BOA: - Bank of Abyssinia
CAR: - Capital Adequacy Ratio
CBB: - Construction and Business Bank
CBE: - Commercial Bank of Ethiopia
CBE- Commercial Bank of Ethiopia
CEMAC: - Central African Economic and Monetary Community
CEEC: - Central Eastern European Countries
CESEE: - Central, Eastern and south eastern European
CIT: - Corporate Income Tax
CPI: - Consumer Price Index
CSA: - Center of Statistical Agency
DB: - Dashen Bank
ETR: - Effective Tax Rate
GDP: - Gross Domestic Product
GMM: - Generalized Methods of Moments
IMF: - International Monetary Fund

IX
INFR: - Inflation Rate
LTD: Loan to deposit
MENA: - Middle East and North Africa
NBE: - National Bank of Ethiopia
NIB: - Nib International Bank
NPL: -Nonperforming Loan
OLS: - Ordinary Least square
ROA: -Returns on Asset
ROE: -Return on Equity
SPSS: -Statistical Package for Social Sciences
UB: - United Bank
US: - United States
VIF: - Variance Inflation Factors
WB: - Wegagen Bank

1
CHAPTER ONE
INTRODUCTION
This chapter begins with discussing background of the study that gives some insight on the
issues of nonperforming loans (NPLs). After giving some insight on the issues of NPLs,
statement of the problem part that shows the direction of the study, justifies the reason to
carry out this study. Following this, both general and specific objectives of the study, the
research hypothesis those tested against the econometric results are presented. Lastly, the
subsequent section presents significance of the study, scope and limitation of the study, and
organization of the paper, ethical issues and operational definitions respectively.
1.1 Background of the Study
Banking sectors play a key role in the development of an economy. The development role
undertaken by banking sector determines the step for development of economy. Hence the
stability of banking sector is a key for the development of an economy. The primary function of
bank is mobilizing deposits from surplus units to deficit units in the form of loan and advances to
various sectors such as agricultural, industry, personal and governments. However, in recent
times, the banks have become very cautious in extending loans due to non-performing assets
(Sontakke and Tiwari, 2013).
Therefore, commercial banks are one of the banking sectors which are the main source of
funding to business activities as well as other projects throughout the country. They play a key
role in the economy by mobilizing deposits from surplus units to deficit units in the form of loan
and advances. As noted by Daniel and Wandera (2013) they play a vital role to emerging
economies where most borrowers have no access to capital markets. Thus, they are considered
as an intermediary between the depositors and borrowers.
According to Rawlin et al.(2012), the principal aim of any business is to make profits. That is
why any asset created in conduction of business should generate income for the business. Since
this issue is applicable for the banking sector business, banks should give due consideration on

2
the management of loans because lending is the main business of commercial banks and loan is
normally the main assets and vital source of revenue for the commercial banks (Daniel and
Wandera, 2013). Therefore, banks do grant loans and advances to individuals, business
organizations as well as government in order to enable them operates on investment and
development activities as a mean of contributing toward the economic development of a country
in general and aiding their growth in particular.
Deposits in banks are offset by higher margins from creation of credits as loans. However, if
such assets do not generate any income, the banks` ability to repay the deposit amount on the due
date would be in question. Therefore, the banks with such asset would become weak and such
weak banks will lose the faith and confidence of the customers. Ultimately, unrecoverable
amounts of loans are written off as Nonperforming loan (Mallick et al., 2010) as cited in Rawlin
et al.(2012).
As many literatures shows, there have been an increased number of significant bank problems
both at matured and emerging economies (Tendia et al. 2012). Banking sectors can perform
worst as a result of inefficient management, low capital adequacy and poor assets quality. Non-
performing assets is also the single largest cause of irritation of the banking sectors (Sontakke
and Tiwari, 2013).
Deterioration in asset quality is much more serious problem of bank unless the mechanism exists
to ensure the timely recognition of the problem. It is a common cause of bank failure. Poor asset
quality leads nonperforming loan that can seriously damage a banks’ financial position having an
adverse effect on banks operation (Lafuente, 2012).
A lot of studies were conducted on the difficulty of nonperforming loans for banking sectors. For
instance, the study of Calice (2012) for the Tunisian banking sectors found as banking sector
suffer from decline in asset quality. In addition, Blanco and Gimeno (2010) for South African
banks and Kolapo (2012) for the Nigerian banks, NPLs have an adverse effect on banking
sectors survival. Thus, since nonperforming loans had an adverse effect on the banking sectors’
survival, the cause for NPLs should be given due consideration. Its causes are different in
different countries that might be due to situational factors such as the level of economic
condition in which the banking sectors are operating and also bank level factors. Accordingly,

3
this issue attracted the interest of different researchers in different countries. That means a lot of
studies are performed on the determinants of NPLs of financial sectors worldwide. For instance:-
Saba et al.(2012) made study on the determinants of NPLs on US Banking sector and found as
lending rate had negative while inflation and Real GDP per capital had positive and significant
effect on NPLs. Besides, Louzis et al.(2010) examined the determinants of NPLs in the Greek
financial sector using dynamic panel data model and found as real GDP growth rate, ROA and
ROE had negative whereas lending, unemployment and inflation rate had positive significant
while loan to deposit ratio and capital adequacy ratio had insignificant effect on NPLs.
The study of Skarica (2013) on the determinants of NPLs in Central and Eastern European
countries through fixed effect model was also found as GDP growth rate, unemployment rate
and inflation had negative and significant impact on NPLs. Similarly, Carlos (2012) based on
OLS model estimators found as NPLs have negative association with GDP growth rate whereas a
positive association with unemployment rate. Besides, Moti et al. (2012), made study on the
effectiveness of credit management system on loan performance and found as credit quality,
interest rates charged, credit risk control and collection policies had an effect on loan
performance in Kenya.
Similar to the Western and other African countries, in Ethiopia also Wondimagegnehu (2012)
conducted a study on determinants of nonperforming loans and found as poor credit assessment,
failed loan monitoring, underdeveloped credit culture, lenient credit terms and conditions,
aggressive lending, compromised integrity, weak institutional capacity, unfair competition
among banks, and fund diversion for un expected purposes and overdue financing had an effect
on the occurrence of NPLs. Even though as to the knowledge of the researcher, there is only a
single study made by Wondimagegnehu (2012) in Ethiopia which is related with this title
without considering macroeconomic factors except for bank specific factors.
Thus, given the unique features of banking sector and environment in which they operate and
also rapid expansion of banking institutions in Ethiopia, there are strong wishes to conduct a
separate study on the determinants of NPLs of banking sector in Ethiopia. Besides, inconsistent
results in different studies among researchers are also another motive to conduct this study. To
this end, the main objective of this study was to examine the bank specific and macroeconomic
4
determinants of NPLs of commercial banks in Ethiopia. This initiates the bank management and
executives with applied knowledge on the management of identified variables and provides them
with understanding of activities that will enhance their loan quality and play a vital role in filling
gap in understanding the determinants of NPLs.
1.2 Statement of the Problem
Issues of Nonperforming Loans (NPLs) gained increasing attentions in the past few decades.
Poor loan management will contribute to NPLs. It is critical issue for every bank to manage bad
loans. Many countries are suffering from Nonperforming Loans (NPLs) in which banks are
unable to get profit out of loans (Petersson and Wadman, 2004).If the loan is well managed; it
will increase the bank’s profitability and sustainability in the future. However, if failed to do so,
it will be the major threat to their survival (MacDonald, 2006).
NPLs affect the bank`s liquidity and profitability which are the main components for the overall
efficiency of the bank. An increase in NPLs provision diminishes income. Again, mismatch of
maturities between asset and liability create liquidity risk for the banks that deteriorate bank`s
overall credit rating including its image (Badar and Yasmin, 2013).Therefore, the determinants
of NPLs should be given a due consideration because of its adverse effect on survival of banks.
The adverse effect of NPLs is attributable to bank managers’ adverse selection of its borrowers
(Brownbridge, 1998). NPLs are determined by different factors such as level of GDP, inflation ,
unemployment, volume of deposit, return on equity, return on asset, capital adequacy, total
loan, liquidity, bank size, excessive lending, interest rate and credit growth. These factors are
studied by different researchers in different countries (Mileris(2012), Tomak(2013), Ahmad and
Bashir(2013), Shingjerji(2013) and etc.).
Though, there are a number of studies that are conducted at a global level to examine the
determinants of NPLs, most of the studies were made with reference to developed countries like
Italy, Spain, Greece, Europe and USA and the like. This means, they do not explain the issues for
emerging market particularly for Ethiopian case.

5
The operation of modern and organized financial institution is the most crucial part for any
country to ensure the economic growth and development. In case, financial sector of Ethiopian
economy is dominated by banking sectors. So, it is important to examine their asset quality.
Further, by having a lot of literature on the determinants of NPLs of banks across worldwide, it
is important to examine in Ethiopia case. This is due to the fact that, it is difficult to make
generalization about the NPLs for the developing economy based on the result of developed
economy without making any research. Besides, since the majority of bank assets are hold by
loans, unless the determinants of NPLs are visualized to enhance the quality of asset, it is hard
for the survival the banking sectors.
Generally, the basic motive for this study is that, different studies were done in Western Europe
and East African countries (Saba et al. (2012), Louzis et al. (2010), Badar and Yasmin (2013)
and Moti et al. (2012). However, the results of those studies were inconsistent. This
inconsistency of results might be attributable to the method of data analysis used by different
researchers and difference in the economic condition of the countries in which banking sectors
are operating. For instance;
The study of Saba et al. (2012) on the title of “Determinants of Nonperforming Loan on US
Banking sector” found negative significant effect of lending rate and positive significant effect of
real GDP per capital and inflation rate on NPL via OLS regression model. Similarly, the study of
Louzis et al.(2010) examined the determinants of NPLs in the Greek financial sector using
dynamic panel data model and found as real GDP growth rate, ROA and ROE had negative
whereas lending, unemployment and inflation rate had positive significant while loan to deposit
ratio and capital adequacy ratio had insignificant effect on NPLs. However, Swamy (2012)
examined the determinants of NPLs in the Indian banking sector using panel data and found as
GDP growth rate, inflation, capital adequacy and bank lending rate have insignificant effect on
NPLs.
Shingjergji (2013) who conducted study on “the impact of bank specific factors on NPLs in
Albanian banks system” utilized OLS estimation model and found as ROE have significant
negative on NPLs. However, Ahmad and Bashir (2013) conducted a study on the “Bank

6
Specific Determinants of Nonperforming Loan” by static panel data model and found as ROE
has insignificant negative association with NPLs.
Makri et al.(2014) identify the factors affecting NPLs of Eurozone’s banking systems through
difference Generalized Method of the Moments (GMM) estimation. Accordingly, they found as
ROA did not show any significant impact on NPL ratio. However, Selma and Jouini (2013)
conducted a study on Italy, Greece and Spain for the period of 2004-2008 via panel data model
and found a significant negative effect of ROA on NPLs. similarly, Boudriga et al. (2009)
conducted a study on the title “Problem loans in the MENA countries via random-effects panel
regression model and found as ROA has significant negative effect on NPLs.
In addition to the above facts, there has not been much research which is conducted to date on
the determinants of NPLs in countries with emerging economy like Ethiopia except the study
made by Wondimagegnehu(2012).The study of Wondimagegnehu (2012) was assessed the bank
specific factors affecting NPLs via OLS estimation model by the help of SPSS software.
However, this study considers both macroeconomic factors such as inflation rate, tax rate and
lending rate and, bank specific factors like loan to deposit ratio, ROE, ROA and capital adequacy
ratio as determinant factors of NPLs. Besides, fixed effect model and version 12 Stata software
was used in this study to examine the determinants of NPLs of commercial bank in Ethiopia.
Accordingly, banking industry in Ethiopian has its own unique features that distinguish them
from other countries financial market. One of the feature is the regulation of the country is not
allowed foreign nations or organization to fully or partially acquire share of Ethiopian banks.
Besides, there is no secondary market. Moreover, in the country, a rapidly growing industry is
the banking sector. As a result, it is visible to conduct a study on the determinants of NPLs of
commercial banks in Ethiopia which is crucial.
In light of the above facts and research gaps, the purpose of this study is to examine the
determinants of NPLs of commercial banks in Ethiopia. To this end, this study tried to provide
real information about the determinant factors affecting NPLs of commercial banks and feasible
recommendation for the impact of identified variables on the levels of NPLs. Therefore, the
researcher used panel data for the period 2002 to 2013 that obtained from NBE and CSA.

7
1.3 Objective of the Study
1.3.1 General objectives The main objective of this study was to examine the determinants of nonperforming loan of
commercial banks in Ethiopian.
1.3.2 Specific objectives Specific objectives of the study were;
1. To examine the bank specific determinants of nonperforming loans (NPLs) of
commercial banks in Ethiopia
2. To examine macroeconomic determinants of nonperforming loans (NPLs) of commercial
banks in Ethiopia
3. To examine the trends of nonperforming loans (NPLs) of commercial banks in Ethiopia
1.4 Research Hypothesis
The purpose of this study is to examine the determinants of nonperforming loans (NPLs) of
commercial banks in Ethiopia. The empirical studies made around the world demonstrate various
outcomes on determinants of nonperforming loans of the financial sectors. From the review of
empirical literature, the researcher perceived as there is no consistency in the results for the
determinants of nonperforming loans. For instance,
From Ethiopian context, Wondimagegnehu (2012) on the title of “Determinants of
Nonperforming Loans of Banking sector in Ethiopia” found as interest rate has no impact on the
levels of NPLs via OLS regression model. However, the study of Saba et al. (2012) on the title
of “Determinants of Nonperforming Loan on US Banking sector” found negative significant
effect of lending rate and positive significant effect of real GDP per capital and inflation rate on
NPL via OLS regression model. Similarly, the study of Louzis et al.(2010) examined the
determinants of NPLs in the Greek financial sector using dynamic panel data model and found as
real GDP growth rate, ROA and ROE had negative whereas lending, unemployment and
inflation rate had positive significant while loan to deposit ratio and capital adequacy ratio had
insignificant effect on NPLs. However, Swamy (2012) examined the determinants of NPLs in
the Indian banking sector using panel data and found as GDP growth rate, inflation, capital

8
adequacy and bank lending rate have insignificant effect on NPLs. According to Shingjergji
(2013) and Boudriga et al. (2009) ROA has significant negative effect on NPLs whereas Makri
et al.(2014) found as ROA did not show any significant impact on NPL ratio.
In this section the researcher developed testable hypotheses to examine the relationship between
bank specific and macroeconomic determinants nonperforming loans of commercial banks in
Ethiopia. Thus, based on reviewed related literatures, the researcher developed the following null
hypotheses to estimate the sign relationship of bank specific and macroeconomic determinants
with nonperforming loans of commercial banks in Ethiopia based on empirical evidence
reviewed in the literature parts. Since, the null hypothesis is the statement or the statistical
hypothesis that is actually being tested (Brooks, 2008 p. 52), the following hypotheses are null
hypotheses. Accordingly, the following hypotheses are tested.
H1. Loan to deposit ratio (LTD) has positive relation with Nonperforming loans banks.
H2.Return on asset (ROA) has negative relation with Nonperforming loans (NPLs) of banks.
H3.Return on equity (ROE) has negative relation with Nonperforming loans of commercial
banks in Ethiopia.
H4.Capital adequacy ratio (CAR) has negative relation with Nonperforming loans (NPLs) of
banks.
H5.Inflation rate (INF) has negative relation with Nonperforming loans (NPLs) banks.
H6. Lending rate (LR) has positive relation with Nonperforming loans (NPLs) of banks.
H7.Effective tax rate (ETR) has positive relation with Nonperforming loans (NPLs) banks.
1.5 Scope and Limitation of the Study
This thesis is adjusted to fit its objectives of examining the determinants of NPLs of commercial
banks in Ethiopia within the limits of specified time and possibility. The researcher decided to
limit this study to the commercial banks found in Ethiopia namely commercial bank of Ethiopia,
Construction and business bank, Awash international bank, bank of Abyssinia, Wegagen bank,
United bank, Nib International bank and Dashen bank that were registered by NBE before
2007/08. These banks were selected since they are senior banks and are expected to have more
experience on the lending activities. Besides, this study considers bank profitability (ROA, and
ROE), loan to deposit ratio, and capital adequacy ratio, lending rate, inflation rate, and effective

9
tax rate for the decision and analysis of data. To this end, this study covers a panel data of these
banks over the period 2002 to 2013. Thus, this study is limited to both bank specific and
macroeconomic determinants of NPLs of Commercial banks in Ethiopia between the above
mentioned periods.
1.6 Significance of the study
The finding of this study which details with the determinants of nonperforming loan of
commercial bank in Ethiopia is beneficial for different stakeholders such as Banking
sectors(commercial Banks and National bank of Ethiopia),researcher and for other researchers as
follows.
For National bank of Ethiopia, since such investigation has policy implication, the finding of this
study might be used as a directive input in developing regulatory standards regarding the lending
policies of commercial banks of Ethiopia. In addition, this study will initiate the commercial
Bank management to give due emphasis on the management of these identified variables and
provides them with understanding of activities that will enhance their loan performance. This is
due to the fact that knowing the variables that determine the nonperforming loan will help the
bank manager to concentrate on the quality of loan rather than its quantity. Thus, this study made
the management body to visualize the determinants of NPLs.
Furthermore, the finding of this study initiates the researcher for further studies. Last but not
least, this study serves as a reference for other researchers in related area. Thus, it can minimize
the literature gap in the area of study particularly in Ethiopia.
1.7 Operational Definition
Loan and advances: any financial asset granted by banks to borrower on a contract of an
obligation to repay the principal amount with usually its interest either on due date or demand
Nonperforming loans - a loan whose credit quality has deteriorated and the full collection of
principal and/or interest as per the contractual repayment terms of the loan/advances is in
question and delayed for more than 90 days(NBE, 2008).
Credit risk – the risk arise as result when the borrower fail to conclude its financial contract
according to the agreement with lender. It is an asset default by counter party.

10
Borrower: - the one who borrows money from the lender (Bank).
Lending: - provision of loan by one party (lender) to another party (Borrower)
Bank specific factors: - are variables that are under the control of bank management. They can
be directly/ indirectly stated in the financial statements of banks.
Macroeconomic factors: - are variables in which the bank management has no power to control
them. Rather, these variables are related with the fiscal and monetary policies of the country.
1.8 Ethical Issues
Almost all the financial institutions have strict policy implications on the confidentiality of their
data. They can pay the ultimate price for the breach of this duty of confidentiality. Disclosing of
information by employees to a third party can expose the institution to potential legal conflict.
Due to this ethical issue, they are fearful in disclosure of such information. However, this fear
was addressed by explaining the core of the study to the information providing agents with the
assurance that the data will be handled professionally through formal letter. Therefore, before
data collection, permission is obtained from the management body of all the selected commercial
banks through formal letter. The formal letter was taken from Jimma University specifically
from the research and graduate studies office of business and economics collage and then given
to those bank managements and all other concerned office to undertake the tasks freely and
confidentially.
1.9 Organization of the paper
This thesis is organized into five chapters. The first chapter starts with presenting background of
the study, statement of the problem, objective of the study, significance of the study, scope and
limitation of the study. The second chapter focuses on both theoretical and empirical review of
related literature. The third chapter deals with the research methodology. Chapter four deals with
the data analysis and presentation and the fifth chapter contain the conclusion and
recommendation of the study including the direction for further study

11
CHAPTER TWO
REVIEW of RELATED LITERATURE
This chapter starts with presenting the overview of banking system in Ethiopia. Besides, bank
loans including it determinant factors were presented. Furthermore, concepts relating to
nonperforming loans are discussed. Following this, empirical studies (cross countries and single
country) are reviewed by focusing on determinants of NPLs are presented. Then after, the
knowledge gaps from the reviewed literatures are outlined.
2.1 Theoretical Literature
This part of literatures has three sections. The first section discusses overview of banking system
in Ethiopia. The second section presents bank lending by focusing on its definition, source and
factors. Lastly, the issue of nonperforming loan is overviewed.
2.1.1 Overview of Banking System in Ethiopia
Bank of Abyssinia was the first bank established in Ethiopia based on the agreement between
Ethiopian government and National bank of Egypt in 1905 with a capital of 1 million shillings.
However, bank of Abyssinia was closed at in 1932 by Ethiopian government under Emperor
Haile Selassie and replaced by Bank of Ethiopia with a capital of pound sterling 750,000.
Following the Italian occupation between1936-1941, the operation of bank of Ethiopia ceased
whereas the departure of Italian and restoration of Emperor Haile Selassie’s government
established the state bank of Ethiopia in 1943.However, State bank of Ethiopia was separated
into National bank of Ethiopia and commercial bank of Ethiopia S.C. to separate the
responsibility of national bank from commercial banks in 1963. Then, on December 16, 1963 as
per proclamation No.207/1955 of October 1963 commercial bank of Ethiopia control all
commercial banking activities (Fasil and Merhatbeb, 2009).
Following the declaration of socialism in 1974, the government extends the extent of its control
over the whole economy and nationalized all large corporations. Accordingly, Addis bank and
commercial bank of Ethiopia share company were merged by proclamation No.84 0f August 2,
12
1980 to form single commercial bank in the country until the establishment of private
commercial banks in 1994.To this end, financial sector were left with three major banks namely;
National bank of Ethiopia, commercial bank of Ethiopia and Agricultural and development bank
during the socialist government. However, following the departure of Dergue regime, Monetary
and Banking proclamation of 1994 established the National bank of Ethiopia as a legal entity.
Following this, Monetary and Banking proclamation No.84/1994 and the Licensing and
supervision of banking business proclamation No.84/1994 laid down the legal basis for
investment in banking sectors (Habtamu, 2012).
Currently, banking sectors in Ethiopia are showing progressive developments in terms of number
of branches, total assets, human resource utilization and the like relative to other African
developing countries. This indicates as Ethiopia categorized under banked country with limited
outreach(Tseganesh, 2012).Thus, currently number of banking sectors in Ethiopia were reached
nineteen as shown it the following tables.
13
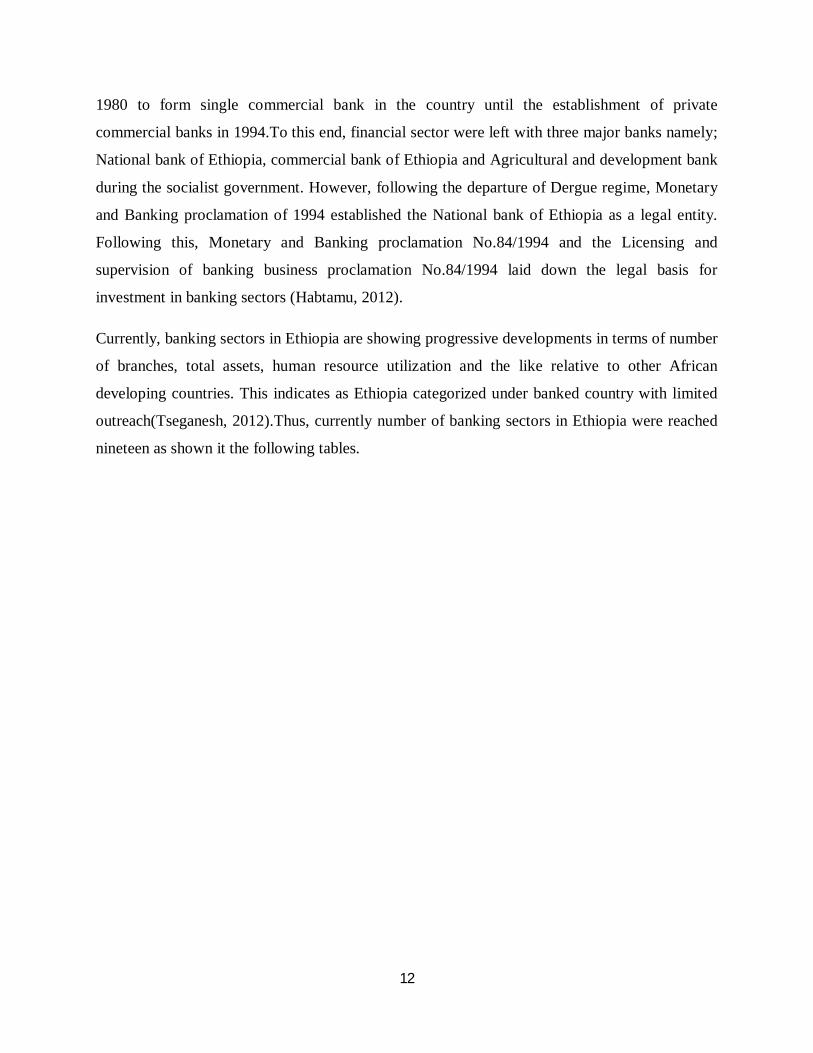
Table 2.1 Banking sectors in Ethiopia
Source: www.nbe.et
2.1.2 Definition and Concepts
2.1.2.1Overview of Bank Loans and Lending
Commercial bank is a depository institution that is relatively unrestricted in its ability to make
commercial loan and that is largely permitted to issue checking accounts. Commercial banks are
the most important of all depository institution (Leroy and Vanhoos, 2006).They creates money
No Name of Banks Year of Establishment
1 Awash International Bank 1994 E.C
2 Commercial Bank of Ethiopia 1963 E.C.
3 Development Bank of Ethiopia 1901 E.C.
4 Construction and Business Bank 1975 E.C.
5 Dashen Bank 1995 E.C.
6 Wegagen Bank 1997 E.C.
7 Bank of Abyssinia 1996 E.C.
8 United Bank 1998 E.C
9 Nib International bank 1999 E.C.
10 Cooperative Bank of Oromia 2004 G.C.
11 Lion International Bank 2006 G.C.
12 Zemen Bank 2008 G.C
13 Oromia International Bank 2008 G.C.
14 Buna International Bank 2009 G.C.
15 Berhan International Bank
2009 G.C
16 Abay Bank S.C 2010 G.C
17 Addis International Bank S.C 2011 G.C
18 Debub Global Bank S.C 2012 G.C
19 Enat bank 2012 G.c

14
by through lending and purchasing securities (Thomas, 2006). Commercial banks extend credit
to different types of borrowers for many different purposes.
One of the major functions of any commercial bank is providing loan to the business society.
Banks collect money from those who have excess money and lend it to others who need money
for different purpose. Therefore, banks’ intermediary function plays a vital role in the economic
activity. Banks accept customer deposits and use those funds to give loans to other customers or
invest in other assets that will yield a return higher than the amount bank pays the depositor
(McCarthy et al., 2010) cited in Zewdu (2010). It follows that customers’ deposit is the primary
source of bank loan and hence, increasing or guaranteeing deposits directly has a positive effect
on lending. Therefore, bank credit is the primary source of available debt financing for most
customers whereas good loans are the most profitable assets for banks.
The principal profit making activity of commercial banks is making loans to its customers. In the
allocation of funds to earn the loan portfolio, the primary objective of bank management is to
earn income while serving the credit needs of its community (Reed and Gill, 1989) cited in
Zewdu (2010).Therefore, like all debt instruments, a loan entails the redistribution of financial
assets over time, between the lender and the borrower. The borrower initially receives an amount
of money from the lender to pays back, but sometimes not always in regular installments, to the
lender. This service is generally provided at a cost, known as interest on the debt. As one of the
principal duties of financial institutions is to provide loans, it is typically the main source of
income to banks. Besides, bank loans and credit also constitute one of the ways of increasing
money supply in the economy (Felix and Claudine, 2008).
Loans are the largest single source of income for banks. Bank loan involves personal
relationships between the bankers and borrowers. It has a highest degree of default risk than
other bank assets. Loans yield the higher rate of return among bank assets in compensation for
lower liquidity and higher risk (Thomas, 2006). A loan composition greatly varies among banks
based on their size, location, trade area and lending experts (MacDonald, 2006).
According to Zewdu (2010), lending is the provision of resources (granting loan) by one party to
another. The second party doesn’t reimburse the first party immediately there by generating a
debt, and instead arranges either to repay or return those resources at a later date. Banks function
15
as financial intermediaries, collecting funds from savers in the form of deposit and then
supplying to borrowers as loans. Those functions benefit both the banks and the borrowers.
Lending represents the heart of the industry and Loans are the dominant asset and represent 50-
75 percent to total amount at most banks, generate the largest share of operating income and
represents the bank`s greatest risk exposure (MacDonald, 2006).
2.1.2.2 Factors Affecting Bank Loan
According to Zewdu (2010), the sources of fund for lending are reserve, deposits and capital. All
these sources may be affected by different factors and would have a direct influence on lending.
Since lending is the principal function of banking industry, the management of banks should give
due attention, analyze and take the necessary measures on time on internal and external factors
that affect or limit lending. Without lending, banks’ incomes especially interest income would
highly deteriorate and affect bank survival. In case, since nonperforming loans (NPLs) has a
direct reflection of poor asset quality, the factors that influence banks loans have their own
impact on NPLs (Rawlin et al. 2012).
According to Reed and Gill (1989) cited in Zewdu (2010) therefore, the factors that influence
bank loans, that might have their own impact on NPLs are:
Capital position: The capital of banks serves as a custom for protection of depositors’ funds.
The size of capital in relation to deposits influences the amount of risk that a bank can afford.
Relatively large capital structure can make loans of longer maturities and greater credit risk.
Profitability: Some banks may emphasize earning more than others. Banks with greater need of
earning might adapt more aggressive lending policies. An aggressive policy might call consumer
loans, which normally are made at higher rates of interest than short-term loans.
Stability of deposits: - The fluctuation and type of deposit must be considered. After adequate
provisions have been made for reserves, bank can then engage in lending. Even though, these
reserves designed to take care of predictable deposit fluctuations and loan demands since
unpredictable demand force banks to give consideration to the stability of deposits in formulating
loan policy.

16
Economic conditions: - Stable economy is more conducive to a liberal loan policy than the one
that is subject to seasonal and cyclical movements. Deposit of famine economies fluctuate more
violently than deposit in an economy noted for its stability. Consideration must be given to the
national economy. Factors adversely affect the nation as a whole may, if they are of serious
magnitude, eventually affect local conditions.
Influence of monetary and fiscal policies: - If monetary and fiscal policies are expansive and
additional, reserves are made available to the commercial banking system; the lending ability of
banks is increased. Under these policies banks can have a more liberal loan policy.
Ability and experience of bank personnel:-The expertise of lending personnel is not
insignificant in the establishment of bank loan policy. One of the probable reasons that banks
were slow in entering the consumer lending field was the lack of skilled personnel.
Credit needs of the area served:- banks specialized experience on different types of loans e.g.
Mortgage real-estate. The major reasons banks are chartered is to serve the credit needs of their
communities. Banks are morally bound to extend credit to borrowers who present logical and
economically sound loan requests.
According to Black and Daniel (1989) cited in Zewdu (2010) there are also other factors that
affect bank lending and investing activities. These factors include:
The interest rate: represents rate of returns available from the various alternative lending and
investing activities. Fundamental problem of bank management is achieving the proper balance
between return and risk.
The liquidity of fund: - it is the amount of liquid funs tied up in varies lending and investing
activities. To maintain adequate liquidity, bank must constantly guard against excessive losses
from lending and investing activities. If bank made too many bad loans, the value of its asset
could fall below the amount of its liabilities.
Tax: corporate income tax rate affect the bank loans in different aspects: one is that high tax
burden enable the banks to shift the tax burden either by increasing lending rate and fees or
paying low interest rate on deposits. The second aspect is that, corporate income tax rate has
output and input substitution effect. The output substitution effect states that increased CIT rate
represents a decrease in production in the incorporated sectors. In this case, the demand for loan
gets lower whereas input substitution effect represents the substitution of equity with other inputs
for instance; debt (Albertazzi and Gambacorta, 2006). Taxation in banking sectors represents the

17
ability of banks to allocate its portfolios reduces its taxes. Bank is capable of transferring the tax
costs to its customers by raising fees and interest spreads. The shifting of tax burden to
customers through higher lending rate on loan and lowering interest rate on the deposit has a
direct impact on the level of NPLs (Khan et al.2011). Besides, corporate entities shift their tax
burden to other tax payers due to the existence of double taxation (Kaplow, 2008).
2.1.2.3Nonperforming Loans (NPLs)
There is no common definition of nonperforming loans (NPLs) in the whole country since it is
recognized that it is possible that what is appropriate in one country may not be so in another.
There is, however, some common opinion on this issue. Accordingly the IMF’s Compilation
Guide on Financial Soundness Indicators, NPLs is defined as:
“A loan is nonperforming when payments of interest and/or principal are past due by 90
days or more, or interest payments equal to 90 days or more have been capitalized,
refinanced, or delayed by agreement, or payments are less than 90 days overdue, but
there are other good reasons such as a debtor filing for bankruptcy to doubt that
payments will be made in full" (IMF, 2005).
Besides, the Ethiopian banking regulation also defines NPL as follows:
“Nonperforming loan and advances are a loan whose credit quality has deteriorated and
the full collection of principal and/or interest as per the contractual repayment terms of
the loan and advances are in question” (NBE, 2008).
Generally, NPLs are loans that are outstanding both in its principal and interest for a long period
of time contrary to the terms and conditions under the loan contract. Any loan facility that is not
up to date in terms of payment of principal and interest contrary to the terms of the loan
agreement is NPLs. Thus, the amount of nonperforming loan measures the quality of bank assets
(Tseganesh, 2012).
2.1.2.3.1 Five Cs of Nonperforming/Bad loans
As noted by MacDonald (2006), there are five Cs of bad credits that represent the issues used to
guard against/prevent bad loans). These are:

18
Complacency: refers the tendency to assume that because of the things were good in the past,
they will be good in the future. For instance, Assuming the past loan repayment success since
things have always worked out in the past.
Carelessness: indicates the poor underwriting typically evidenced by inadequate loan
documentation, lack of current financial information or other pertinent information in the credit
files, and lack of protective covenants in the loan agreement. each of these makes it difficult to
monitor a borrower`s progress and identify problems before they are unmanageable.
Communication ineffectiveness: inability to clearly communicate the bank`s objectives and
policies. This is when loan problem can arise. Therefore, the bank management must clearly and
effectively communicate and enforce the loan policies and loan officers should make the
management aware of specific problems with existing loans as soon as they appear.
Contingencies: refers the lenders` tendency to play down/ignore circumstances in which a loan
might in default. It focuses on trying to make a deal work rather than identifying down side risk.
Competition: involves following the competitors` action rather than monitoring the bank`s own
credit standards.
Banks, however, still have required expertise, experiences, and customer focus to make them the
preferred lender for many types of loan. Lending is not just a matter of making loan and waiting
for repayment. Loan must be monitored and closely supervised to prevent loan losses
(MacDonald, 2006).
2.2 Empirical Literature
This chapter provides so many evidences which identify the major determinants of bank loans,
particularly, nonperforming loans. In case, some studies are conducted on particular country and
the others on panel of countries. Hence many researchers have conducted a lot of study on
determinants nonperforming loans (NPLs), due to its significance for the bank’s failure. In case,
the researcher starts reviewing empirical related literatures from the study made across country
and then single country studies.
There are a plenty of variables that affect the NPLs of banking sectors. In this study, the
researcher focused on both bank specific and macroeconomic determinants of NPLs of
commercial bank in Ethiopia. Internal factors are caused by internal functions and activities of

19
bank, and are due to decisions and practices of officials and staff’s functions. These factors are
controllable in which the manager can prevents them through using suitable method,
determination and elimination of weakness and improvement of process. Whereas, external
factors can`t be controlled by bank managers and are caused by external environment including
effect on implementation of decisions and also government policies. For instance; unexpected
events, changing in rules and obligations, political and economic changes (inflation and slump)
are external factors (Biabani et al., 2012).
However, a variety of variables that got more attention and included in this thesis are loan to
deposit ratio, capital adequacy/solvency ratio, profitability (ROA & ROE), lending rate and
effective tax rate.
2.2.1. Across Countries Studies
Boudriga et al.(2009) conducted a study on the title “bank specific determinants and the role of
the business and the institutional environment on Problem loans in the MENA countries” for
2002-2006 periods. They employed random-effects panel regression model for 46 countries. The
variables included were credit growth rate, Capital adequacy ratio, real GDP growth rate, ROA,
the loan loss reserve to total loan ratio, diversification, private monitoring and independence of
supervision authority on nonperforming loans. The finding revealed that credit growth rate is
negatively related to problem loans. Capital adequacy ratio is positively significant justifying
that highly capitalized banks are not under regulatory pressures to reduce their credit risk and
take more risks. Also ROA has negative and statistically significant effect on NPLs. This result
supports as greater performance measured in terms of ROA reduces nonperforming loans since
reduced risk taking in banks exhibiting high levels of performance.
Skarica (2013) also conducted a study on the determinants of NPLs in Central and Eastern
European countries. In the study, Fixed Effect Model and seven Central and Eastern European
countries for 2007-2012 periods was used. The study utilized loan growth, real GDP growth rate,
market interest rate, Unemployment and inflation rate as determinants of NPLs. The finding
reveals as GDP growth rate and unemployment rate has statistically significant negative
association with NPLs with justification of rising recession and falling during expansions and
growth has an impact on the levels of NPLs. This shows as economic developments have a

20
strong impact on the financial stability. The finding also reveals as inflation has positive impact
with justification as inflation might affect borrowers’ debt servicing capacities.
Makri et al.(2014) identify the factors affecting NPLs of Euro zone’s banking systems for 2000-
2008 periods before the beginning of the recession exclusively pre-crisis period. The study
includes 14 countries as a sample out of 17 total Euro zone countries. The variables included
were growth rate of GDP, budget deficit (FISCAL), public debt, unemployment, loans to
deposits ratio, return on assets, and return on equity and capital adequacy ratio. The study
utilized difference Generalized Method of the Moments (GMM) estimation and found as real
GDP growth rate, ROA and ROE had negative whereas lending, unemployment and inflation
rate had positive significant effect on NPLs. However, ROA & loan to deposit ratio, inflation,
and budget deficit did not show any significant impact on NPL ratio. Similarly, Carlos (2012) on
macroeconomic determinants of the Non-Performing Loans in Spain and Italy found as inflation
rate has insignificant effect on NPLs.
Selma and Jouini (2013) conducted a study on three countries namely Italy, Greece and Spain for
the period of 2004-2008 to identify the determinants of non-performing loans for a sample of 85
banks. The variables included both macroeconomic variables (GDP growth rate, unemployment
rate and real interest rate) and bank specific variables (return on assets, loan growth and the loan
loss reserves to total loans). They apply Fixed Effect model and found a significant negative
relationship of ROA & GDP growth rate, and also positive relationships of unemployment rate,
the loan loss reserves to total loans and the real interest rate with NPLs. For a significant positive
association between NPLs and real interest rate, they justify that when a rise in real interest rates
can immediately leads to an increase in non-performing loans especially for loans with floating
rate since it decrease the ability of borrowers to meet their debt obligations. In addition, a
significant negative relationship between ROA and the amount of NPLs justify that a bank with
strong profitability has less incentive to generate income and less forced to engage in risky
activities such as granting risky loans.
Klein (2013) investigates the determinants and macroeconomic performance of NPLs in Central,
Eastern, and South Eastern Europe (CESEE) for 1998 to 2011 period data for ten banks of each
16 countries. The study includes loan growth rate, inflation, unemployment rate and GDP growth
rate as explanatory variables of the study. The study was used fixed effect/ dynamic model and

21
found as inflation has positive whereas loan growth rate, GDP growth rate have negative
significant effect on the occurrences of NPLs. However, the study found as unemployment rate
has no significant effect on NPLs.
Djiogap and Ngomsi (2012) were investigates the determinants of bank long-term loan in the
Central African Economic and Monetary Community (CEMAC). They used the panel data of 35
commercial banks from six African countries over the period 2001-2010. They used fixed effect
model to examine impact of bank size, GDP growth and capital adequacy ratio on NPLs. The
study found negative significant impact of CAR on the level of NPLs. Their finding justifies as
more diversified banks and well capitalized banks are better able to withstand potential credit.
However, inflation variable is statistically insignificant in explaining the total business loans
ratios of banks.
2.2.2. Single Country Studies
One of the studies in this regard is that of Sakiru et al.(2011) on macroeconomic determinants of
nonperforming loan on banking system in Malaysia. Their study was covered bank`s data for
monthly time series of 2007:1 to 2009: 12 period. In the study, lending rate, producer price and
industrial production index were used as macroeconomic variables that affect the NPLs. The
study utilized ARDL approach and the finding reveals that lending rate has a significant positive
effect on NPLs and justifies that, during the period of high lending rate, NPLs is anticipated to
increase causing a rise in the rate of default by borrowers.
Hyun and Zhang (2012) investigated the impact of macroeconomic and bank-specific factors of
nonperforming loans in US for two distinct sub-sample periods that is from 2002-2006 (pre
financial crisis) and 2007-2010(during financial crisis).The variables included both
macroeconomic factors namely GDP growth rate, unemployment rate and lending rate, and bank
specific variables such as Return on Equity (ROE), solvency ratio, inefficiency, bank size and
non-interest income. In pre financial crisis period, the study found as solvency ratio, ROE,
lending rate, GDP growth rate and unemployment rate negatively affect NPLs. Negative effect of
lending rate on NPLs implies that an increase in lending rate curtail peoples’ /business entity’s’
ability to borrow, which decreases the amount of loan and then reduce NPLs. Beside, statistically
significant and negative solvency ratio effect on NPLs, implies that the higher the Solvency ratio,

22
the lower the incentives to take riskier loan policies, and consequently, reduce the amount of
problem loans. However, bank size has no effect. During financial crisis also solvency ratio,
GDP growth rate, unemployment rate and ROE all have a negative impact on NPLs while
lending rate has no significant effect on NPLs. Size allows for more diversification opportunities
as larger banks can compose less concentrated portfolios that include borrowers from different
industries, geographical Locations, capital size and other customer segments.
Tomak (2013) conducted study on the “Determinants of Bank’s Lending Behavior of
commercial banks in Turkish” for a sample of eighteen from 25 banks. The main objective of the
study was to identify the determinants of bank`s lending behavior. The data was covered2003 to
2012 periods. The variables used were size, access to long term funds, interest rates, GDP
growth rate and inflation rate. The finding reveals that bank size, access to long term loan and
inflation rate have significant positive impact on the bank`s lending behavior but, interest rates
and GDP are insignificant.
Besides, Ahmed and Bashir (2013) conducted a study on the “Macroeconomic Determinants of
Nonperforming Loan of Banking Sectors in Pakistan”: The study was conducted on 30
commercial banks from total of 34 banks in 1990-2011periods. The main aim of the study was to
investigate impact of inflation, credit growth, GDP growth rate, Unemployment rate, consumer
price index and lending/interest rate, on nonperforming loan. They found negative effect of
lending rate and GDP growth rate on NPLs. Their justification for negative association between
lending rate and NPLs implies that as lending rate increase, individuals with funds starts saving
with the banks to earn on their funds but investors with the profitable projects feel reluctant to
borrow and invest. Besides, existing borrowers pay back their loans to keep their credit rating
good as to get loans in the future at discount rates. Similarly, on their study of banks specific
factor of NPLs of banking sectors in Pakistan from2006-2011in 2013, they found positive
significant effect of ROA but insignificant effect of ROE on NPLs. Their justification for
positive significant association between ROA and NPLs implies that in order to increase the
short term earnings, banks management portray wrong picture to the investors relating the future
profitability and positive return prospects. Consequently, investors start borrowing from the
banks and invest in the less profitable projects. This results in the current good performance and
profitability of the banks but because of the wrong forecasting, returns on the investments are not

23
according to the investors’ expectation, resulting in the inability of the investors in repayment of
loans thus leading to the growth in NPLs.
The study of Saba et al.(2012) on the title of “Determinants of Nonperforming Loan on US
banking sector” also investigate the bank specific and macroeconomic variables of
nonperforming loans from 1985 to 2010 period using OLS regression model. They considered
total loans, lending rate and Real GDP per capital as independent variables. The finding reveals
as real total loans have positive significant effect whereas interest rate and GDP per capital has
negative significant association with NPLs.
Louzis et al. (2010) conduct study to examine the determinants of NPLs in the Greek financial
sector using fixed effect model from 2003-2009 periods. The variables included were ROA,
ROE, solvency ratio, loan to deposit ratio, inefficiency, credit growth, lending rate and size, GDP
growth rate, unemployment rate and lending rates. The finding reveals that loan to deposit ratio,
solvency ratio and credit growth has no significant effect on NPLs. However, ROA and ROE has
negative significant effect whereas inflation and lending rate has positive significant effect on
NPLs. It justifies that performance and inefficiency measures may serve as proxies of
management quality.
Ali and Iva (2013) who conducted study on “the impact of bank specific factors on NPLs in
Albanian banking system” considered Interest rate in total loan, credit growth, inflation rate, real
exchange rate and GDP growth rate as determinant factors. They utilized OLS regression model
for panel data from 2002 to 2012 period. The finding reveals a positive association of loan
growth and real exchange rate, and negative association of GDP growth rate with NPLs.
However, the association between interest rate and NPL is negative but week. And also inflation
rate has insignificant effect on NPLs.
Similarly, Shingjergji (2013) conducted study on the “impact of bank specific factors on NPLs in
Albanian banking system”. In the study, capital adequacy ratio, loan to asset ratio, net interest
margin, and return on equity were considered as a determinant factors of NPLs. The study
utilized simple regression model for the panel data from 2002 to 2012 period and found as
capital adequacy ratio has negative but insignificant whereas ROE and loan to asset ratio has
negative significant effect on NPLs. Besides, total loan and net interest margin has positive

24
significant relation with NPLs. The study justifies that an increase of the CAR will cause a
reduction of the NPLs ratio. Besides, an increase of ROE will determine a reduction of NPLs
ratio. Besides, Mileris (2012) on the title of “macroeconomic determinants of loan portfolio
credit risk in banks” was used multiple and polynomial regression model with cluster analysis,
logistic regression, and factor analysis for the prediction. The finding indicates that NPLs are
highly dependent of macroeconomic factors.
However, Swamy (2012) conduct study to examine the macroeconomic and indigenous
determinants of NPLs in the Indian banking sector using panel data a period from 1997 to 2009.
The variables included were GDP growth, inflation rate, per capital income, saving growth rate,
bank size, loan to deposit ratio, bank lending rate, operating expense to total assets, ratio of
priority sector`s loan to total loan and ROA. The study found that real GDP growth rate,
inflation, capital adequacy, bank lending rate and saving growth rate had insignificant effect;
whereas loan to deposit ratio and ROA has strong positive effect but bank size has strong
negative effect on the level of NPLs.
Similarly, Farhan et al.(2012) on the title of “Economic Determinants of Non-Performing Loans:
Perception of Pakistani Bankers” utilized both primary and secondary data in 2006 years. The
data was collected from 201 bankers who are involved in the lending decisions or handling non-
performing loans portfolio. Correlation and regression analysis was carried out to analyze the
impact of selected independent variables. The variables included were interest rate, energy crisis,
unemployment, inflation, GDP growth, and exchange rate. The study found that, interest rate,
energy crisis, unemployment, inflation and exchange rate has a significant positive relationship
whereas GDP growth has insignificant negative relationship with the non-performing loans.
According to an Empirical Study made on Commercial Banks in Pakistan by Badar &
Yasmin(2013) on the title of “Impact of Macroeconomic Forces on Nonperforming Loans” the
long and short run dynamics between nonperforming loans and macroeconomic variables
covering the period from 2002 -2011 of 36 commercial banks in Pakistan were assessed. In the
stud, inflation, exchange rate, interest rate, gross domestic product and money supply were
included as macroeconomic variables. They applied vector error correction model. The study
found that as there is strong negative long run relationships exist of inflation, exchange rate,
interest rate, gross domestic product and money supply with NPls.

25
Ranjan and Chandra (2003) analyze the determinants of NPLs of commercial banks’ in Indian in
2002. The objective of the study was to evaluate how NPLs influenced by financial and
economic factors and macroeconomic shocks. In the study, they utilized panel regression model
and found that lending rate also have positive impact on the NPLs justifying that the expectation
of higher interest rate induced the changes in cost conditions to fuel and further increase in
NPLs. Besides, loan to deposit ratio had negative significant effect on NPls justifying that
relatively more customer friendly bank is most likely face lower defaults as the borrower will
have the expectation of turning to bank for the financial requirements.
Besides, Daniel and Wandera (2013) conducted the study on the effects of credit information
sharing on the nonperforming loan of commercial banks in Kenya. The objectives of the study
was to assess the impact of credit information sharing on nonperforming loans, to identify the
factors that account for bad loans and to determine the economic sector that records higher bad
loans and the efforts taken to reduce the risk in this sector. Data was collected from primary
sources and secondary data between 2007 to 2012 period. The variables included in the study
were Information Asymmetry; Interest/lending rates, Management of loans and legal framework
and Credit Criteria. The study found as lending rates has positive significant effect on NPLs. It
justifies as these causes make many borrowers not to pay their loans hence leading to many bad
loans.
Similarly, Joseph (2011) who conducted study on the title of effects of interest rate spread on the
level of non-performing assets of commercial banks in Kenya was considered interest rate
spread/cost of loan as independent and NPLs ratio as dependent variables. The study applied
descriptive research design. Both primary and secondary data were considered from 43
commercial banks in 2010. It was analyzed by the help of SPSS software. The finding indicates
that cost of loan/lending rate has a positive significant effect on the occurrences of NPLs.
However, Konfi (2012) who conducted study on the determinants of nonperforming loans on the
operations of SINAPI ABA TRUST microfinance institutions in Ghana found as high interest
rate was not significant factors causing the incidence of NPLs. This study justifies as interest rate
is only applicable to loan defaulters who have managed to pay off outstanding principal and are
in default in only interest payment. If a borrower is in default of both principal and interest, then
one cannot assert that high interest rate is the actually the cause of the loan default.

26
Besides, the study conducted in Ethiopia by Wondimagegnehu(2012) on “the determinants of
Nonperforming loan on commercial banks of Ethiopia” also found as poor credit assessment,
failed loan monitoring, underdeveloped credit culture, lenient credit terms and conditions,
aggressive lending, compromised integrity, weak institutional capacity, unfair competition
among banks, willful defaults by borrower and their knowledge limitation, fund diversion for un
expected purposes and overdue financing has significant effect on NPLs. Besides, the study of
Wondimagegnehu (2012) considers interest rate as bank specific factors and revealed as interest
rate has no impact on the level of NPLs of commercial banks in Ethiopia.
2.3Conceptual Frame Work
The main objective of this study is to examine the determinants o NPLs of commercial banks in
Ethiopia. Based on the objective of the study, the following conceptual model is framed. As
previously discussed in the related literature review parts, nonperforming loans are affected by
both bank specific and macroeconomic factors. Bank specific factors are profitability, capital
adequacy ratio, liquidity, diversification, bank size, poor credit assessment, failed loan
monitoring, underdeveloped credit culture, lenient credit terms and conditions, aggressive
lending, compromised integrity, weak institutional capacity, unfair competition among banks,
willful defaults by borrower and their knowledge limitation, and overdue financing deposit rate,
and capital structure; whereas macroeconomic factors are interest/lending rate, inflation rate,
public debt, exchange rate, money supply ( Farhan et al.(2012), Shingjergji(2013), Sakiru et al.
(2011), Ahmad &Bashir (2013), Saba et al. (2012), Louzis et al. (2010), Shingjergji (2013),
Swamy (2012), Badar & Yasmin(2013), Ranjan & Chandra(2003) and Wondimagegnehu
(2012)).
Thus, the following conceptual model is framed to summarize the main focus and scope of this
study in terms of variables included. The blue color part represents the dependent variables used
in this study.

27
Figure 2.1 Conceptual framework
Source: extracted by the researcher (2014)
2.4. Summary and Knowledge Gap
This chapter was presented the theoretical foundation on bank loan and the banking industry in
Ethiopia. In case, Ethiopian current banking system is dominated by the private banks that are
entering to the industry in recent years. The other issues discussed in this chapter is bank
definition and concepts of loan and lending, factors affecting bank loan and sources and
allocations of funds in the banking industry. Further, factors that limit lending such as capital
position, profitability, stability of deposits, economic condition, monetary and fiscal policies that
have their own impact on NPLs were discussed in detail. Lastly, Nonperforming loan issues
including its five Cs were discussed. Besides, Empirical studies regarding the determinants of
nonperforming loan were also discussed. Then, the Knowledge gap is identified and conceptual
frame work is developed by the researcher.
There are a plenty of variables that affect the NPLs of banking sectors. In this study, the
researcher focused on both bank specific and macroeconomic determinants of NPLs of
commercial bank in Ethiopia. Internal factors are caused by internal functions and activities of
bank due to decisions and practices of officials and staff functions. These factors are controllable
in which the manager can prevents them through using suitable method, determination and
elimination of weakness and improvement of process. Whereas, external factors can`t be
Loan to Deposit
Capital Adequacy
Return on Asset
Return on Equity
Inflation
Lending rate
Effective Tax rate
Bank Specific Factors
Nonperforming Loan
Macroeconomic Factors

28
controlled by bank managers and are caused by external environment including effect on
implementation of decisions and also government policies. These factors are policy (monetary
and fiscal) related factors. For instance; unexpected events, changing in rules and obligations,
political and economic changes (inflation and collapse) are external factors (Biabani et al.
2012).However, the variables that got more attention and included in this thesis were loan to
deposit ratio, capital adequacy/solvency ratio, profitability (ROA & ROE), lending rate and
effective tax rate.
A plenty of studies were done on determinants of NPLs in different countries. Even though, the
determinants of NPLs are still debatable among different researchers that might be due to
situational factors like country level factors, bank level factors and the condition of legal and
regulatory framework of the country. Thus, these debates can only be resolved through
quantitative analysis on the determinants of NPLs.
Besides, most of the related literatures reviewed cover different studies made both in developing
and developed countries’ banking industries. Even if quite numbers of studies have investigated
on the determinants of NPLs, most of these studies have been done in developed countries with
few being done in developing countries. Thus, as to the knowledge of the researcher, there is still
limited number of literatures in Ethiopian banking industry, with the exception of a single study
made by Wondimagegnehu (2012) on the determinants of NPLs of banking industry in Ethiopia.
Hence, this previously done study by Wondimagegnehu (2012) utilized only bank specific
factors. Wondimagegnehu (2012) considers interest rate as bank specific factors and revealed as
interest rate has no influence on the level of NPLs.
Furthermore, bank profitability and capital adequacy ratio that considered as basic determinants
of NPLs were not included in his study since these variables are widely used by different
researchers. Besides, even if taxation is not used in further study before, the researcher add as
one of the determinant factors of NPLs in this study based on theoretical literatures and its
sensitivity in the country specifically in Ethiopia. Likewise due to rapid expansion of banking
institution in Ethiopia, it is better to conduct this investigation to ensure their continuous
operation.

29
This study therefore, seeks to fill this gap by establishing the link between nonperforming loans
and its determinants (bank specific and macroeconomic factors) in case of commercial banks in
Ethiopia.

30
CHAPTER THREE
RESEARCH METHODOLOGY
This study aims to examine the determinants of NPLs in the commercial banks found in Ethiopia.
Accordingly, this chapter discussed the research procedure that is used to carry out this study. In
case, it starts by discussing research design followed by the nature and instruments of data
collection and sampling design. The subsequent section presents and discusses method of data
process and analysis. Finally, definition of study variables with their measurement and model
specifications are presented.
3.1 Research Design and Approach
Research design is a master plan specifying the methods and procedures for collecting and
analyzing the required data. The choice of research design depends on objectives that the
researchers want to achieve (John, 2007). Since this study was designed to examine the
relationships between NPLs and its determinants, a logical reasoning either deductive or
inductive is required. Deductive reasoning starts from laws or principles and generalizes to
particular instance whereas inductive reasoning starts from observed data and develops a
generalization from facts to theory. Besides, deductive reasoning is applicable for quantitative
research whereas inductive reasoning is for qualitative research. Thus, due to quantitative nature
of data, the researcher used deductive reasoning to examine the cause and effect relationships
between NPLs and its determinants in this study.
As noted by Kothari (2004), explanatory research design examines the cause and effect
relationships between dependent and independent variables Therefore, since this study was
examined the cause and effect relationships between nonperforming loans and its determinant, it
is an explanatory research.
The objective to be achieved in the study is a base for determining the research approach for the
study. In case, if the problem identified is factors affecting the outcome having numeric value, it
is quantitative approach (Creswell, 2003). Therefore, the researcher employed quantitative

31
research approach to see the regression result analysis with respective empirical literatures on the
determinants of Nonperforming loans. Thus, the researcher was used a panel data from 2002 to
2013 period.
3.2 Nature of Data and Instruments of Data collection
This study used panel data. The researcher prefers to use panel data since panel data can take
heterogeneity among different units into account over time by allowing for individual-specific
variables. Besides, by combining time series and cross-section observations, it gives more
informative data. Furthermore, panel data can better detect and measure effects that simply
cannot be observed in pure cross-section or pure time series data (Gujarati, 2004).
Accordingly, the researcher used secondary sources of data that is panel in nature. A secondary
source of data was preferred by the researcher since it is less expensive in terms of time and
money while collecting. And also, it affords an opportunity to collect high quality data (Saunders
et al (2007) cited in Belay (2012). Secondary data may either be published or unpublished data
(Kothari, 2004). Accordingly, secondary data was obtained from the audited annual financial
statements of the concerned commercial banks in Ethiopia. These data includes both bank
specific and macroeconomic factors. The bank specific which was obtained from the country’s
central bank, National bank of Ethiopia, which regulates the banking sector of the country and
the head office of each selected commercial banks whereas one of macroeconomic variable was
collected from the central statistical agency (CSA).
3.3 Sampling Design
Sample design deals with sample frame, sample size and sampling technique. Sampling is a
technique of selecting a suitable sample for the purpose determining parameters of the whole
population. Population is the list of elements from which the sample may be drawn (John, 2007).
A sample is drawn to overcome the constraints of covering the entire population with the intent
of generalizing the findings to the entire population.
As to June of 2013, there are nineteen banks in Ethiopia. These are commercial bank of
Ethiopia(CBE), Construction and Business bank(CBB), Awash international bank(AIB), bank of
Abyssinia(BOA), Wegagen bank(WB), United bank(UB), Nib international bank(NIB), Dashen
32
bank(DB), Development bank of Ehtiopia, Cooperative bank of Oromia, Lion international bank,
Zemen bank, Oromia international bank, Buna international bank, Berhan international bank,
Abay bank S.C, Addis international bank S.C, Debub global bank,S.C and Enat banks. However,
from all the above listed banks, Development bank of Ethiopia is not Commercial bank
(www.nbe.et).
As noted by Kothari (2004), good sample design must be viable in the context of time and funds
available for the research study. Besides, judgmental sampling offers the researcher to
deliberately select items for the sample concerning the choice of items as supreme based on the
selection criteria set by the researcher. Accordingly, this study employed purposive sampling
technique to select the required sample of banks from the above listed banks since it is viable in
line with time and funds available for this study. The selection criteria set by the researcher was
first, the required banks are only Commercial banks in Ethiopia. Second, those commercial
banks should operate before 2007/08 having financial statements for consecutive twelve years.
Therefore, the data for this study was collected from eight commercial banks in the country. Out
of the eight commercial banks, commercial bank of Ethiopia(CBE) and Construction and
business bank(CBB) are state owned banks whereas the remaining six banks:-Awash
international bank(AIB), bank of Abyssinia(BOA), Wegagen bank(WB), United bank(UB), Nib
International bank(NIB) and Dashen bank(DB) are private banks that were registered before
2007/08 by NBE.
This is due to the fact that since the primary aim of this study is to examine the determinants of
nonperforming loans of commercial banks in Ethiopia, it is better to make generalization for the
banking sector of the country based on data drawn from sample bank which is much more
experienced in the industry. Further, lending is not a one night process rather it comes by
making operation for some consecutive years since the bank should have to accept deposit to
grant loans to reach stage of suffering from poor asset quality.
Thus, as one can understand from objective of the study, the researcher aimed to examine the
determinants of nonperforming loans of commercial banks in Ethiopia. In order to achieve the
stated objective, the researcher classified banks based on years of their operation into those
operated before 2007/08 and after2007/08 year. And also based on whether they are commercial

33
banks or not. Accordingly, this study focused on all banks that were established to give
commercial banking services only and those operate before 2007/08. Thus, the researcher used
12 years data of selected commercial banks that provide financial statements consecutively from
2002-2013periods.
To this end, the sample size of this study is not less than specified sample size required for ones’
study since the accuracy and validity of the works never guaranteed by increasing the sample
size beyond specified limit. This is due to the fact that increasing the number of sample size
beyond the specified sample size required for ones’ study never add value to the accuracy of the
study rather it made information unmanageable due to redundancy(Ayalew, 2011).That is why
this study used eight experienced commercial bank in Ethiopia from nineteen banks in the
country.
3.4 Data Analysis and Presentation
As noted by Kothari (2004), data has to be analyzed in line with the purpose of the research plan
after data collection. Accordingly, secondary data collected from NBE, CSA and head office of
each respective bank were analyzed to determine its suitability, reliability, adequacy and
accuracy. Thus, this study utilized both descriptive and econometric analysis based on a panel
data from 2002-2013 to examine the relationship between the NPLs and its determinant factors
in commercial banks found in Ethiopia. The data collected from different sources were coded,
checked and entered to simple excel program to make the data ready for analysis. Then the
collected data was processed and analyzed through STATA version 12 software packages.
For descriptive analysis; table and percentage were used to analyze the data. Besides, results of
the descriptive statistics such as mean, standard deviation, minimum and maximum values were
reported to describe the characteristics of variables under investigation. Furthermore, various
diagnostic tests such as normality, heteroscedasticity, autocorrelation and multicolinearity test
were conducted to decide whether the model used in the study is appropriate and to fulfill the
assumption of classical linear regression model. Thus, in order to examine the possible degree of
Multicolinearity among variables, correlation matrixes and variance inflation factor were used.

34
To this end, the researcher used fixed effect regression model analysis to examine the effect of
each explanatory variable on nonperforming loans of commercial bank in Ethiopia. Thus,
regression results were presented in a tabular form with the appropriate test statistics and then an
explanation of each parameter were given in line with the evidence in the literature.
3.5 Study Variables
Nonperforming loan ratio is dependent variables used in this study. It is measured in terms of
Nonperforming loans to gross loan. Besides, explanatory variables included in this study are loan
to deposit ratio, capital adequacy ratio, profit, lending rata and effective tax rate. As noted by
Brooks (2008) including more than one explanatory variable in the model never indicates the
absence of missed variables from the model. Thus, to minimize the effect of missed variables
from the model, the researcher was included disturbance term in this study.
3.5.1 Dependent variable
Nonperforming Loan
Nonperforming loans (NPLs) are loans that are outstanding both in its principal and interest for a
long period of time contrary to the terms and conditions under the loan contract. Any loan
facility that is not up to date in terms of payment of principal and interest contrary to the terms of
the loan agreement is NPLs. Thus, the amount of nonperforming loan represents the quality of
bank assets (Tseganesh, 2012).
According to the Ethiopian banking regulation, “Nonperforming loan and advances are a loan
whose credit quality has deteriorated and the full collection of principal and/or interest as per the
contractual repayment terms of the loan and advances are in question” (NBE, 2008). NPL is a
loan that delays for the payment of principal and interest for more than 90 days. Deterioration in
asset quality is much more serious problem of bank unless the mechanism exists to ensure the
timely recognition of the problem. It is a common cause of bank failure. Poor asset quality leads
nonperforming loan that can seriously damage a banks’ financial position having an adverse
effect on banks operation (Lafunte, 2012).It distresses the performance and survival of banks
(Mileris, 2012).It is measured or indicated by the amount of NPLs to gross loans.

35
NPL ratio= NPLs Gross loan
3.5.2 Independent Variables
Independent variables are explanatory variables that explain the dependent variables. In case,
independent variable included in this study are indictors of bank profitability (ROA and ROE),
solvency/capital adequacy ratio (CAR), loan to deposit ratio (LTD), lending rate(LR),inflation
rate(IFR), and effective tax rate(ETR). Majority of these variables are modified and adopted
from previously done studies based on the extent of their effect on nonperforming loan whereas
one of these variable, that is effective tax rate is added from the researcher’s own perception.
Bank Profitability
Bank profitability may reflect the risk taking behavior of bank managements. Banks with high
profitability are less over stressed for revenue creation and thus less forced to engage risk credit
offering. However, inefficient banks are more likely to experience high level of problem loans
since they are tempted to grant and to engage in more uncertain credits to defend their
profitability and meet the prudential rules imposed by monetary authorities (Boudriga et al.
2009). Poor management can imply week monitoring for both operating cost and credit quality
of customers, which will include high levels of capital losses (Haneef et al. 2012).Thus, both
ROA and ROE are considered as profitability indicators of bank in this study.
Return on Asset (ROA): represents efficiency in asset utilization and shows how much net
income is generated out of assets. It indicates the ability of bank management to generate profits
by utilizing the available assets of the bank. Thus, if the ratio of ROA is high, it indicates that it
is better performance in order to generate profit. Strong bank profitability measured in terms of
ROA might result from high lending rate, fees and commission that lead bank growth in size and
profitability. Thus, ROA gives an idea as to how efficient management is at using its assets to
generate earnings.
Different researchers found different results regarding the relationship between ROA and NPLs.
For instance: - Ahmed and Bashir (2013) and Makri et al.(2014),) were examined positive
significant relationships between ROA and NPLs. However, Boudriga et a., (2009) and Selma

36
and Jouini (2013) found negative association between NPLs and ROA by supporting the
arguments that states deterioration of profitability ratio measured in terms of ROA leads to
riskier activities of banks and then raise the level of NPLs. They justified that since ROA
represents efficiency in asset utilization, poor utilization of assets leads higher NPLs for the
banks. Thus, this ratio is expected to have negative relationships with NPLs in this study. It is
measured by the ratio of net profit to total asset as follows;
ROA= Net profit
Total asset
Return on Equity (ROE): represents the rate of return received from equity invested in banks.
It is the amount of net income returned as a percentage of shareholders equity. Return on equity
measures profitability by revealing how much profit a bank can generates with the money
shareholders have invested. Thus, ROE measures how much the bank is earning on their equity
investment. Many researchers were found different results between NPLs and bank profitability
measured in terms of ROE. For instance:-Shigjerji(2013) and Ahmed and Bashir (2013) and
Makri et al.(2014)found negative relationships between ROE and NPLs. Therefore, this ratio is
expected to have negative relationships with NPLs. It is measured by the ratio of net profit to
total equity.
ROE = Net profit
Total equity
Capital Adequacy Ratio (CAR)
Capital adequacy is a measure of bank`s financial strength since it shows the ability to
withstand/tolerate with operational and abnormal losses. It also represents the ability to
undertake additional business (Habtamu, 2012). As noted by Makri et al.(2014), CAR
determines risk behavior of banks. It is a measure of banks solvency and ability to absorb risk.
Thus, this ratio is used to protect depositors and promote stability and efficiency of financial
systems. According to Makri et al.(2014), there is negative relationship with NPLs indicating a
risky loan portfolio is marked by a high NPL (equivalent to high credit risk). However, Djiogap
and Ngomsi (2012) found positive association between NPLs and capital adequacy ratio. It is

37
measured by total Equity to total asset ratio. However, it is expected to have negative association
with NPLs in this study. This implies that well capitalized banks are less incentive to take risk.
CAR= Total Equity
Total Asset
Loan to deposit (LTD) Ratio
Loan to deposit (LTD) ratio examines bank liquidity by measuring the funds that a banks has
utilized into loans from the collected deposits. It demonstrates the association between loans and
deposits. Besides, it provides a measure of income source and also measures the liquidity of bank
asset tied to loan (Makri et al.2014)). This ratio also measures customer friendliness of banks
implies that relatively more customer friendly bank is most likely face lower defaults as the
borrower will have the expectation of turning to bank for the financial requirements (Ranjan and
Chandra, 2003). Thus, it represents a bank’s preference for credit. It is credit culture that
represents a bank’s preference for credit. It is measured in terms of loan to deposit ratio. There is
empirical evidence that shows as LTD ratio has significant effect on the level of NPLs of
banking sectors in different aspects. In this study, this ratio is expected to have positive relation
with NPLs.
LTD = Total Credit Deposit
Lending Rate/Interest Rate
Lending rates are one of the primary economic determinants of NPLs. It is the cost of borrowed
funds. Interest rate spread is a measure of profitability between the cost of short term borrowing
and the return on long term lending. Interest rate spread affect performing assets in banks as it
increases the cost of loans charged on the borrowers (Joseph, 2011). Interest rate is the price a
borrower pays for the use of money they borrowed from the lenders. Interest can be thought of as
rent of money.
Thus, lending rate is a rate of return usually remains in admittance of monetary regulators (NBE)
to manipulate the pursuance of monetary objectives. In case, maximum and minimum lending
rate is set by NBE.

38
There is empirical evidence showing a positive and negative association between lending rate
and NPLs. For instance: - Saba et al.(2012) found negative association between lending rate and
NPLs whereas Farhan et al.(2012) and Ranjan and Chandra (2003)found as there is a positive
relationship with NPLs and lending rate since an increase in interest rate curtails the paying
capacity of the borrowers. Thus, lending rate is expected to have positive association with NPLs
in this study. Accordingly, this study considers average lending rate (average of Minimum and
Maximum Lending Rate) as proxy of lending rate as being commonly used by commercial banks
for pricing loans.
Inflation Rate
It is a situation in which the economies overall price level is rising. It represents sustained and
pervasive increament in aggregate price of goods and services resulting decline in purchasing
power of money. Accordingly, when inflation is high and unexpected, it can be very costly to an
economy. At the same time, inflation generally transfers resources from lender and savers to
borrowers since borrowers can repay their loans with birr that are worthless. It is determined as
the general consumer price index. This indicates that, as inflation increase, the cost of borrowing
gets more expensive and deteriorates the quality of loan portfolio.
There are ambiguous results regarding the relationship between NPLs and inflation rate.
According to Farhan et al.(2012), Skarica(2013), Klein(2013) and Tomak(2013) found as there
is a positive relationship between NPLs and Inflation rate.Theoretically, inflation should reduce
the real value of debt and hence make lending easier. However, high inflation may pass through
to nominal interest rates, reducing borrowers’ capacity to repay their debt. Through its attraction
with the tax system, it can increase tax burden by artificially increasing income and profits.
Besides, inflation cause firms to increase their costs of changing prices. Finally, it made
individuals to hold less cash and make more trips to banks since inflation lowers the real value of
money holdings. It can negatively affect the borrowers’ real income when wages are stick.
Besides, price stability is considered as prerequisites for ones’ countries economic growth
(Skarica, 2013).
Thus, Consumer price index is used in this study as the proxy of inflation since most ample
measure of inflation defines a change in the price of consumer goods and services purchased by

39
households. Increase in CPI requires monetary regulators to use contractionary measures by
increasing the interest rate to control inflation which later increase the cost of borrowing and
ultimately cause NPLs. Keeping this information in mind, the relationship between NPLs and
inflation is expected to be negative for this study. In case, the figure amount of CPI was taken
from CSA.
Effective Tax Rate
Taxation in banking sectors represents the ability of banks to allocate its portfolios for its taxes.
Corporate income tax rate affect the bank loans in different aspects. High tax burden enable the
banks to shift the tax burden either by increasing lending rate and fees or paying low interest rate
on deposits (Albertazzi and Gambacorta, 2006). Thus, bank is capable of transferring the tax
costs to its customers by raising fees and interest spreads ( Khan et al.2011). Bank with high debt
pay less taxes due to higher interest expense. Accordingly, even if there is no specific study
conducted using taxation as a determinant factor of NPLs, this study expects positive
relationships between tax rate and NPLs. Generally, expected Sign of Variables are presented in
table 3.1 as follows.
Table 3.1: Expected Sign (+/-) of Explanatory Variables in this Study
Explanatory Variables Expected Sign Some empirical evidence
Loan to Deposit Ratio + Swamy (2012) Capital Adequacy Ratio - Shingjerji(2013),Hyun&Zhang(2013),
Makri et al.(2014), Klein(2013)
Return on Asset - Swamy(2012), Selma and Jouini(2013), Bougriga et al. (2009)
Return on Equity - Makri et al.(2014), Klein(2013), Shingjerji(2013) Lending Rate + Farhan et al.(2012), Sakiru et al(2011)
Inflation Rate - Farhan et al.(2012), Skarica(2013), Klein(2013), Tomak(2013)
Effective Tax Rate + - sources: Swamy (2012), Shingjerji(2013), Hyun&Zhang(2013), Makri et al.(2014), Klein(2013), Selma and
Jouini(2013), Makri et al.(2014), Klein(2013), Farhan et al.(2012), Sakiru et al(2011) and other studies included in
the study.
Notes: A positive sign “+” indicates direct impact; whereas a negative sign “–” indicates an
inverse impact of explanatory variables on dependent variable.

40
3.6 Model Specification
The aim of this study is to examine the determinants of NPLs of commercial banks in Ethiopia.
Similar to the most noticeable previous research works conducted on the nonperforming loans of
financial sectors, this study used nonperforming loans ratio as dependent variables whereas Loan
to deposit ratio, capital adequacy ratio, return on asset, return on equity, Average lending rate,
inflation rate and effective tax rate as explanatory variables. These variables were chosen since
they are widely existent for the commercial bank in Ethiopia. Accordingly, this study examined
the determinants of NPLs of commercial banks in Ethiopia by adopting a model that is existed in
most literature. The regression model which is existed in most literature has the following
general form;
Yit= βo + βXit + εit
Where: - Yit is the dependent variable for firm ‘i’ in year ‘t’, β0 is the constant term, β is the
coefficient of the independent variables of the study, X it is the independent variable for firm ‘i’
in year ‘t’ and εit the normal error term.
Thus, this study is based on the conceptual model adopted from Fawad and Taqadus (2013).
Accordingly, the estimated models used in this study are modified and presented as follow;
NPLit= β0 +β1(LTD)it + β2(CAR)it+ β3(ROA)it+β4(ROE)t+ β5(ALR)it+ β6(INFR) it+ β7(ETR)it+εit
Where;
β0 is an intercept
β1, β2, β3, β4, β5, β6, and β7represent estimated coefficient for specific bank i at time t ,
LTD,CAR, ROA, ROE, ALR, INF and ETR represent Loan to deposit ratio, capital
adequacy/Solvency ratio, return on asset, return on equity, Average lending rate, inflation
rate and effective tax rate respectively
εit represents error terms for intentionally/unintentionally omitted or added variables. It
has zero mean, constant variance and non- auto correlated. The coefficients of
explanatory variable were estimated by the use of ordinary least square (OLS) technique.

41
CHAPTER FOUR
FINDING and DISCUSSIONS
Summary: this chapter deals with analysis of the finding and discussion of the result in order to
achieve research objectives and set a base for conclusion. The data was analyzed in terms fixed
effect model of via Stata 12 version. The first section of this chapter was mainly start with the
explanation for study variables and discussion for the result of descriptive statistics including
trend analysis for nonperforming loans (NPLs) of commercial bank in Ethiopia. Furthermore,
the second section presents the basic tests for the assumptions of classical liner regression
model. Next to this, model selection and regression result were presented. Lastly, the result of
the regression analysis was discussed in detail.
4.1 Introduction
The determinants of NPLs of banking sectors have been studied by many researchers across the
world. However, the literature lacks more evidence regarding Ethiopian context. Thus, this study
was conducted to examine the determinants of NPLs of commercial banks in Ethiopian context
to contribute its own effort for the empirical evidence. The banks that are included in this study
were all senior commercial banks those operate before 2007/08. In case, the data for this study
was drawn from eight commercial banks for 2002 to 2013 periods. To this end, 96 observations
were analyzed to examine the determinants of NPLs of Commercial banks in Ethiopia.
4.2 Study Variables
This study was examined both macro and bank specific determinants of NPLs. Bank specific
variables were drawn from financial statement of banks that are taken from the NBE and head
office of each commercial bank whereas macroeconomic factors were taken from CSA except
Effective tax rate that calculated from banks’ financial statements. As stated in previous
chapters, NPL is dependent variables whereas loan to deposit ratio, return on equity, return on
asset, capital adequacy ratio, lending rate, inflation and effective tax rate are an explanatory in
this study. In case, measurements and explanations of the above mentioned variables are
presented in the following table 4.1 as follows:

42
Table 4.1 Explanation of Study Variables
Variables Explanations
Nonperforming loan ratio(NPLs) ratio
Calculated as nonperforming loan to gross loan
Loan to deposit (LTD) Calculated as total loan to total deposits
Capital adequacy ratio(CAR) Calculated as total Owner’s equity to total asset
Return on equity(ROE) Calculated as net profit to owner’s equity
Return on asset (ROA) Calculated as net profit to total asset Average lending rate(ALR) Calculated as the summation of minimum and maximum
lending rate divided by two
Inflation(INF) Calculated as consumers price index
Effective Tax Rate (ETR) Calculated as Tax to net income before tax
Source: own computation from the financial statements (NBE) and CSA.
4.3 Descriptive Statistics
This section presents the descriptive statistics of dependent and explanatory variables used in this
study. The dependent variable used in this study was NPLs ratio while explanatory variables are
LTD, ROE, ROA, CAR, ALR, INF and ETR. Accordingly, the following table 4.2 reports
mean, maximum, minimum, standard deviation and number of observation for each variables
used in this study. In case, the following table 4.2 shows that all variables except for NPLs ratio
have 96 observations. As noted by Yuqi Li (2006), the presences of missing value for some
variables reduce the total observations for that variable. Thus, due to the missing value of NPLs
for one year, NPLs have 95 observations implying missing reported figure. That means, NPLs
missed one observation. Thus, mean, standard deviation, minimum and maximum values of both
dependent and explanatory variables for Commercial Banks in Ethiopia from 2002-2013 were
demonstrated as follows:

43
Table 4.2 Summary of Descriptive Statistics
Variables Observation Mean Standard Deviation
Minimum
Maximum
NPL 95 11.82821 12.25082 0.3 60.04 LTD 96 69.92695 19.9799 21.23 121.17 ROE 96 22.64032 14.3512 -57 70 ROA 96 2.519219 1.397962 -2.13 11.62 CAR 96 11.29685 4.008946 4 28.03 ALR 96 10.98385 1.502616 7 12.3 INF 96 14.16667 12.65086 -10.6 36.4 ETR 96 29.93375 11.49718 -7 125 Source: own computation from NBE and CSA via Stata 12
NPLs ratio measured by Nonperforming loans divided by total loan ranges from 0.3- 60.04
percent. It has a mean of 11.82% showing the lowest deviation (-0.43%) from its mean value.
This indicates that Commercial banks in Ethiopia incurred 11.82%NPLs on averages from its
total loan. According to Ethiopian context, the banking sectors are required to maintain the ratio
of NPLs at least below 5% (NBE, 2008). However, as indicated above in table 4.2, the NPLs of
commercial banks in Ethiopia are more than the required threshold. Thus, NPLs problem are still
serious for commercial banks in Ethiopia.
Regarding LTD ratio that measured by total loans divided by total deposits, it ranges from a
minimum of 21.23% to a maximum of 121.17%. It has a mean of 69.93% with highest deviation
(49.95%) from its mean value. As far as profitability ratios concerned, ROA records a minimum
of -2.13 and maximum of 11.62% with a mean value of 2.52%.In case, even if high ROA
indicates better performance in the management of available assets, commercial banks in
Ethiopia shows low performance with regard to ROA during the study period as compared to
ROE.
On the other hand, ROE measured by the net profit divided by total equity of the bank measures
how much the banks are efficiently earning from funds invested by its shareholders. As shown in
the above table 4.2, ROE records a minimum of -57% and maximum of 70% with a mean of
value of 22.64%.This implies that commercial banks in Ethiopia have relatively a good

44
performance in terms of ROE as compared to ROA during the study period. Thus, commercial
banks in Ethiopia earned high return from its own equity than assets.
CAR also measured by total equity divided by total assets presents a minimum of 4 and
maximum of 28.03% with a mean value and standard deviation of 11.29% and 4.009%
respectively. This indicates that CAR for the sample commercial banks in Ethiopia during study
period was above the minimum requirement, which is 8%. Furthermore, ALR demonstrates a
minimum of 7 and maximum of 12.3% with a mean value 10.99% showing 1.5% deviations
from its mean. Finally, INF ranges from minimum values of -10.6% to a maximum of 36.4% and
effective tax rate ranges from a minimum of -7% to maximum of 125%.
To sum up, LTD ratio had the highest deviation (49.95%) whereas NPLs had the lowest
deviation (-0.43 %.) from its mean Value. Besides, commercial banks in Ethiopia earned high
return from its own equity than assets. Furthermore, average value of NPLs of commercial banks
in Ethiopia are above the required threshold (<5%) showing a serious loss from loans whereas
CAR are more than the minimum requirement (8%) showing better risk withholding ability of
banks as per the National bank of Ethiopia.
4.4 Analysis for Nonperforming Loans Trend Form 2002-2013
This analysis establishes a pattern for nonperforming loans (NPLs) of commercial banks
operating in Ethiopia during the period under consideration, which is from 2002-2013.
Accordingly, the following figure 4.1 provides a respective pictorial presentation for NPLs figure
from 2002-2013. In the following figure 4.1; x-axis represents the years whereas y-axis
represents the level of NPLs of commercial banks in Ethiopia.

45
Fig 4.1 Moving Trend analysis of Nonperforming Loans
Source: Own computation from NBE via Stata version 12
As it can been seen from the above fig 4.1, the trends of nonperforming loans of commercial
banks in Ethiopia for the period from 2002 to 2013 are decreasing. This significant decline of
NPLs might imply either improvement in the levels of loan quality or being escaping of banks
from providing loan and advances. Even if, there is a decreasing trend in the level of NPLs ratio
from 2002-2013, descriptive result shows that NPLs problem is still above the industry average
for commercial banks in Ethiopia. Thus, this result suggests the downward sloping trend of
NPLs.
4.5 Test for the Classical Linear Regression Model (CLRM) Assumptions
In the descriptive statistics part, the study shows the mean, standard deviation, minimum and
maximum values of the dependent and explanatory variables including the number of
observation for each variable during the period under consideration, that is from 2002-2013.

46
However, this section provide test for the classical linear regression model (CLRM) assumptions
such as normality, heteroscedasticity, autocorrelation and multicolinearity tests.
The linearity of the parameter is assumed since the model applies linear ordinary least square
(OLS). The objective of the model is to predict the strength and direction of association among
the dependent and independent variables. Thus, in order to maintain the validity and robustness
of the regression result of the research in CLRM, it is better to satisfy basic assumption CLRM.
As noted by Brooks (2008), when these assumptions are satisfied, it is considered as all available
information is used in the model. However, if these assumptions are violated, there will be data
that left out of the model. Accordingly, before applying the model for testing the significance of
the slopes and analyzing the regressed result, normality, multicolinearity, autocorrelation and
heteroscedasticity tests are made for identifying misspecification of data if any so as to fulfill
research quality.
4.5.1 Normality Test
One assumption of classical linear regression model (CLRM) is the normal distribution of the
residual part of the model. As noted by Gujarati (2004), OLS estimators are BLUE regardless of
whether the ui are normally distributed or not. If the disturbances (ui) are independently and
identically distributed with zero mean and constant variance and if the explanatory variables are
constant in repeated samples, the OLS coefficient estimators are asymptotically normally
distributed with means equal to the corresponding β’s.
However, as per the central limit theorem, if the disturbances are not normally distributed, the
OLS estimators are still normally distributed approximately if there are large-sample data. Thus,
since the sample size for this study is large enough, it is approximately considered as normally
distributed. This implies that residuals are asymptotically normal in this study.
4.5.2 Heteroscedasticity Test
In the classical linear regression model, one of the basic assumptions is Homoskedasticity
assumption that states as the probability distribution of the disturbance term remains same for all
observations. That is the variance of each iu is the same for all values of the explanatory

47
variable. However, if the disturbance terms do not have the same variance, this condition of non-
constant variance or non-homogeneity of variance is known as heteroscedasticity (Bedru and
Seid, 2005).
Accordingly, in order to detect the heteroscedasticity problems, Breusch-Pagan or Cook-
Weisberg test was utilized in this study. This test states that if the p-value is significant at 95
confidence interval, the data has heteroscedasticity problem, whereas if the value is insignificant
(greater than 0.05), the data has no heteroscedasticity problem. Thus, as shown in appendix1A,
there is no heteroscedasticity problem for this study hence the p value is 23.76% showing
insignificant value.
4.5.3 Autocorrelation Test
Furthermore, the researcher tested the autocorrelation assumptions that imply zero covariance of
error terms over time. That means errors associated with one observation are uncorrelated with
the errors of any other observation. As noted by Gujarati (2004), the best renowned test for
detecting serial correlation is Durbin Watson test. Accordingly, if the d computed nearest to 2in
application, it is assumed that there is no autocorrelation problem. Thus, as shown in appendix
1A the computed “d” in this study was 1.875 which is nearest to 2 implying the absence of
autocorrelation problem. Thus, this implies that error terms are not correlated with one another
for different observation in this study.
4.5.4 Multicolinearity Test
The term Multicolinearity indicates the existence of exact linear association among some or all
explanatory variables in the regression model. When independent variables are multi collinear,
there is overlapping or sharing of predictive power. Thus, if multicolinearity is perfect, the
regression coefficients of the independent variables are undetermined and their standard errors
are immeasurable (Gujarati, 2004). The multicolinearity makes significant variables insignificant
by increasing p-value since increased p-value lowers the t-statistics value. Thus, the panel
regression results with multicolinearity will shows significant variables as insignificant variables.
The multicolinearity problem is solved by dropping highly correlated variables (Ahmad and
Bashir, 2013).Then, the result provide more significant variables than before.

48
This is due to the fact that when explanatory variables are highly correlated with one another,
they share the same information. Thus, the multicolinearity problem reduces the individual
explanatory variables’ predictive power. That is none of the predictor variables may contribute
uniquely and significantly to the prediction model after the other independent variables is
included (Theodros, 2011).
In case, Pearson correlation matrix and Variance inflation factor (VIF) are used for testing
multicolinearity in this study. Pearson correlation matrix is a technique used for testing
multicolinearity of explanatory variables by investigating their relationship and also useful to
measure the propensity of how much the independent variables influence the dependent variable
wooldridge (2005) cited in Theodros (2005).
As noted by Gujarati (2004), the correlation analysis is made to describe the strength of
relationship or degree of linear association between two or more variables. In Pearson correlation
matrix, the values of the correlation coefficient range between -1 and +1. A correlation
coefficient of +1 indicates that the two variables have perfect positive relation; while a
correlation coefficient of -1 indicates as two or more variables have perfect negative relation. A
correlation coefficient of 0, on the other hand indicates that there is no linear relationship
between two variables (Bedru and Seid, 2005).Besides, as noted by Brooks (2008), zero
correlation among explanatory variables is not occurring in any practical work. Thus, even if
there is some indication for the existence of zero correlation among the explanatory variables, it
does not have a great effect on the accuracy.
Accordingly, Pearson correlation matrix is applied to examine the association between NPLs
ratio, loan to deposit, capital adequacy ratio, return on equity, and return on asset, average
lending rate, inflation and effective tax rate where nonperforming loans are considered as
dependent variable whereas loan to deposit ratio, return on equity, return on asset, capital
adequacy ratio, average lending rate, inflation and effective tax rate are explanatory variables
used in this study.
Thus, as it can be seen from appendix1B, the result of Pearson correlation matrix indicates that
NPLs has positive correlation with loan to deposit ratio. While the correlation between NPLs
ratio with capital adequacy ratio, return on equity, and return on asset, average lending rate,

49
inflation and effective tax rate is negative. Besides, the result of correlation analysis made in the
above table clearly indicates that there is no significant multicolinearity problems among
explanatory variables since each of them are not above 0.8 thresholds. As noted by in Gujarati
(2004), a serious problem for Multicolinearity is occurred if the correlation is about 0.8 or larger.
However, multicolinearity between explanatory variables may result wrong sign in the estimated
coefficients and bias the standard errors of coefficients (Theodros, 2011). To overcome this
problem, VIF test was conducted. That means, the larger the value of VIF indicates the more
collinearity of the variables with each other. According to the rule of thumb, if VIF of a variable
exceeds 10, the variable is said to be highly collinear (Bedru and Seid, 2005). Accordingly, the
variance inflation factor test as indicated in appendix1C.
Based on the result indicated in appendix1C, there is no multicolinearity problem in this study.
This is due to the fact that the mean of VIF of variables is 1.52 which is much lower than the
threshold of 10.The VIF for each variable also very low. This indicates that the explanatory
variables included in the model were not correlated with each other.
To sum up, beside the descriptive statistics, correlation analysis is made for explanatory variable
to detect the multicolinearity problem in the regression model. In case, there is no
multicolinearity problem between variables. Thus, the explanatory variables are the basic
determinants of NPLs of commercial banks in Ethiopia. This of course enhanced the reliability
of regression analysis. However, to reach such conclusion, this has to be supported by regression
result after the appropriate model is applied as discussed in the upcoming sections.
4.6 Model Selection
4.6.1 Random Effect versus Fixed Effect Models
Econometrics model used to examine the impact of loan to deposit ratio, capital adequacy ratio,
return on equity, return on asset, and lending rate, inflation and effective tax rate on
nonperforming loans of commercial banks in Ethiopia was panel data regression model which is
either fixed-effects or random-effect model. The appropriate test used to decide whether fixed
effect or random effect model is appropriate was Hausman Specification Test. Thus, Hausman
Specification Test identifies whether fixed-effects or random-effect model is most appropriate
50
under the null hypothesis that unobservable individual effects ( iu ) are uncorrelated with one or
more of explanatory variables (Xi).As noted by Gujarati (2004), fixed effect model is most
appropriate when null hypothesis is rejected whereas random effect is appropriate when null
hypothesis is not rejected.
For Hausman test, the null and alternative hypotheses are as follows:
Ho: iu is not correlated with Xi (random- effects model appropriate)
H1: iu is correlated with Xi (fixed-effects model appropriate)
Thus, to test the null hypothesis, it requires comparing the estimates from the random-effects and
the fixed-effects estimator. Random-effect estimator is consistent under the null hypothesis, but
inconsistent under the alternative hypothesis whereas fixed-effect estimator is consistent under
both the null and alternative hypothesis. If the estimates for the random-effects estimators are not
significantly different from the estimates for the fixed-effects estimator, then the null hypothesis
is accepted and conclude that iu is not correlated with Xi, and therefore the random-effect model is
the appropriate model. If the estimates for the random effect estimator are significantly differ
from the estimates for the fixed-effect estimator, the null is rejected and conclude that iu is
correlated with Xi, and therefore the fixed-effect model is the appropriate model for the study.
Besides, if the number of year is exceeds number of cross section, fixed effect model is
appropriate which is true for this study (ibid).
Accordingly, appendix1D demonstrates the Hausman Specification Test that used to decide the
best model for this study. The decision rule, for Hausman Specification test is rejecting the null
hypothesis when the p-value is significant. Thus, as shown in Appendix1D, the Hausman
specification test for this study has a p-value of 0.0397 for the regression models. This indicates
that p-value is significant and then the null hypothesis is rejected justifying as fixed effect model
is appropriate for the given data set in this study.
4.7 Result of Regression Analysis
This section presents the regression result of fixed effect model that made to examine the
determinant of NPLs of commercial banks in Ethiopia. Accordingly, the regression result was
made and coefficients of the variables were estimated via STATA version 12 software. As stated

51
earlier in model selection part, fixed effect regression model is an appropriate model used in this
study. Thus, the model used to examine the determinants of NPLs of commercial banks in
Ethiopia in this study was:
NPLit= β0 + β1(LTD)it + β2(CAR)it + β3(ROA)it + β4(ROE)t + β5(ALR)it+ β6(INFR) it+ β7(ETR)it+
εit………………………………...(2)
Where;
NPL= nonperforming loan ratio of bank 'i’ in year t
LTD= represent Loan to deposit ratio of bank 'i’ in year t
CAR= capital adequacy ratio of bank 'i’ in year t
ROA= return on asset of bank 'i’ in year t
ROE=return on equity of bank 'i’ in year t
ALR= Average lending rate of bank 'i’ in year t
INFR=inflation rate of bank 'i’ in year t
ETR = effective tax rate of bank 'i’ in year t
β0= an intercept,
β1, β2, β3, β4, β5, β6, and β7, = estimated coefficient of explanatory variables for bank 'i’ in year t
εit= the error term for error terms for intentionally/unintentionally omitted or added variables. It
has zero mean, constant variance and non- auto correlated.
This study used panel data models that comprises of both random and fixed effect model to
examine the relationship between NPLs and explanatory variables. To select either Random or
Fixed Effect Model, the character of individual effects was tested through the Hausman
specification test. Based on comparison result between random and fixed effect model through
Hausman test, an appropriate model for this study was fixed effect model. Thus, the cause and
effect relationship between NPLs and explanatory variables was examined by fixed effect model.
Accordingly, table 4.3 below presents the result of Fixed Effect regression model made to
examine the impact of explanatory variables on NPLs. Hence, NPLs ratio is dependent variable
whereas loan to deposit ratio, capital adequacy ratio, return on asset, return on equity, average
lending rate, inflation rate and effective tax rate are explanatory variables. Thus, the regression

52
result in the following table 4.3 demonstrates both coefficients of explanatory variables and
corresponding p-values as follows.
Table 4.3 Results of fixed effect regression model
Explanatory Variables Coefficient Std. Error P>|t| Loan to Deposit Ratio(H1*) 0.0061738 0.0593928 0.917***
Capital Adequacy Ratio(H2*) -0.559224 0.0697555 0.000*
Return on Asset (H3**) 3.832226 0.7330695 0.000*
Return on Equity (H4*) -1.046489 0.3070609 0.001*
Average Lending Rate (H5**) -2.953288 0.6861642 0.000*
Inflation Rate (H6*) -0.065195 0.0717177 0.366***
Effective Tax Rate (H7*) 0.1681874 0. 0715277 0.021**
Constant 54.49 9.94697 0.000*
R2 0.6426 rho .41139 Prob>F=0.0001
Source: own computations Via Stata 12 from NBE and CSA
Note: *significant at 1%, **significant at 5%, and ***insignificant
H* accept null and H** reject null hypothesis
Thus, based on the above table 4.3, the following model was developed to examine the
determinants of NPLs in this study.
NPL = 54.49+0.0062LTD -0.56CAR+3.83ROA-1.05ROE-2.95ALR-0.065INFR+0.67ETR+ε
As shown in the above table 4.3, coefficient of determination was 64.26% revealing that 64.26%
of variation in NPLs ratio is explained by the selected explanatory variables (loan to deposit
ratio, profitability, capital adequacy ratio, average lending rate, inflation rate and effective tax
rate). Besides, Rho displays that 41.14% variation in NPLs is due to entity specific
characteristics of the selected cross sectional entities i.e. commercial bank in Ethiopia.
Furthermore, Since F- statistics is designed to jointly test the impact of explanatory variables on
dependent variables; F-statistics of this model has a p-value of 0.0001 indicating rejecting of the

53
null hypothesis. This implies that all selected explanatory variables can affect the level of NPLs
in common.
Furthermore, the researcher examined the impact of both bank specific and macroeconomic
factor on the level of NPLs based on regression result of fixed Effect Model in the above table
4.3 in terms of examination of coefficients of explanatory variables and significance level.
Through the examination of coefficients for bank specific factors, ROE and CAR had negative
impact on NPLs having a coefficient of -0.56 and -1.05 respectively. This indicates that one unit
change in ROE and CAR can result a change on NPLs rate by 0.56 and 1.05units in opposite
direction respectively. However, ROA had positive impact on NPLs having a coefficient of 3.83
which implies one unit change in ROA can result a change on NPLs rate by 3.83units in the
same direction. LTD also had positive impact on NPLs. Besides, from macroeconomic factors,
average lending rate had negative impact on the level of NPLs having a coefficient of-2.95 which
indicates a one unit change (increase/decrease) in average lending rate can result a change on
NPLs by 2.95 units in opposite direction. Besides, INFR had negative impact on NPLs. Whereas
effective tax rate had positive impact on the level of NPLs having a coefficient of 0.17 which
indicates one unit change in tax rate can result a change on NPLs by 0.17units.
In terms of significance level (corresponding p-value), all explanatory variables had p-values of
less than the selected significance levels (5%) except for LTD and INF. As shown in the above
table 4.3, ROA, CAR and ALR had strong and statistically significant (p-value = 0.000) impact
on the level of NPLs even at 1%. Besides, ROE and ETR had statistically significant (p-value =
0.021and 0.001 respectively) impact on the level of NPLs at 5%. However, LTD and INF had no
statistically significant impact on the level of NPLs with a p-value of 0.917* and 0.366*
respectively.
Thus, contrary to the researcher`s expectation, LTD ratio from bank specific factor and inflation
rate from macroeconomic factors did not show any significant impact on the level of NPLs of
commercial banks in Ethiopia. Furthermore, the above table 4.3 shows rejection of null
hypothesis for ROA and ALR.

54
4.8 Discussion
Based on previous studies and the finding of this study, this section discussed the general result
obtained via Fixed Effect regression Model as shown in the above table 4.3. Referring the
literature, the result of each explanatory variable including their impact on the level of NPLs of
commercial banks in Ethiopia was discussed. Thus, result of the finding was discussed in relation
to the previous empirical and theoretical evidences.
4.8.1 Determinants of Nonperforming Loans
Thus, taking into consideration that the basic aim of this study was to examine the determinants
of NPLs of commercial banks in Ethiopia, the estimation results of Fixed Effect Model that
presents the impact of explanatory variables on NPLs were discussed as follows:
Return on Equity (ROE)
The results of fixed effect model in the above table 4.3 indicate that there is a negative and
statistically significant impact of ROE on the level of NPls. The result shows strong effect of
bank profitability measured in terms of ROE on NPLs with a coefficient of -0.56 and a p-value
of 0.000 at 1% and 5% significance level. This implies that for one unit change in ROE, keeping
the other things constant had resulted 0.56 unit change on the level of NPLs in opposite
direction. This result confirms the finding of Makri et al.(2014) and Boudriga et al.(2009) where
aggregate country data was used, Klein (2013), Shingjerji(2013), Ahmad and Bashir(2013) and
Hyun and Zhang(2012) where particular country data was used.
Contrary to the finding of Louzis et al.(2012) where particular country data was used, this result,
as expected, indicates a negative significant effect of ROE on the levels of NPLs of commercial
banks in Ethiopia. This implies that deterioration of profitability ratio in terms of ROE leads to
higher NPLs. This negative significant impact of ROE on the levels of NPLs indicates the
existence of better management of funds invested by shareholders via good agency relationships
in commercial banks in Ethiopia.

55
Return on Asset (ROA)
The regression result of fixed effect model in the above table 4.3 is inconsistent with the
hypothesis developed by the researcher. The study hypothesized that there is a negative
association between ROA and NPLs of banks. Contrary to the hypothesis, the estimated
coefficients and test statistics of ROA was 3.83 and 0.000 respectively. This reveals positive and
statistically significant impact of ROA on the levels of NPLs and implies that for one unit change
in bank profitability measured in terms of ROA, keeping the other thing constant had resulted
3.83unitchange on the level of NPLs in the same direction.
Unlike the study made by Boudriga et al.(2009) and Makri et al.(2014) where aggregate country
data was used, and Selma and Jouini(2013) where particular country data was used, the results of
this study confirms the finding of Swamy(2012) and, Ahmad and Bashir(2013)where single
country data was considered. Thus, results of this study examined positive significant effect of
bank profitability measured in terms of ROA on the levels of NPLs of commercial banks in
Ethiopia.
The main reason for this positive impact of ROA on the levels of NPLs resulted from bank
managements’ inefficiency on asset utilization and also poor loan quality in the Ethiopia. Thus,
the finding implies that commercial banks in Ethiopia are less incentive for return gained from
assets and also to provide loans.
Capital Adequacy Ratio (CAR)
Regarding capital adequacy ratio that determines the risk taking behavior of banks, this study
identifies statistically significant and negative impact of capital adequacy ratio on NPLs. Thus,
regression result of fixed effect model in the above table 4.3 is consistent with the hypothesis
developed in this study. The study hypothesized that there is a negative association between
CAR and NPLs of banks. This negative sign indicates an inverse relationship between capital
adequacy ratio and NPLs. Thus, it implies that for one unit change in the banks’ capital adequacy
ratio, keeping other thing constant had resulted 0.56 unit changes on the levels of NPLs in
opposite direction.

56
The result of this finding is consistent with the study of Hyun and Zhang (2012) where particular
country data was used and Makri et al. (2014) where aggregate country data was used. Unlike
the study made by Boudriga et al.(2009), and Djiogap and Ngomsi (2012) where aggregate
country data was used and , Shingjerji(2013) and Swamy(2012) where particular country data
was used, the result of this finding confirms significant negative effect of CAR on the levels of
NPLs of commercial banks in Ethiopia by supporting the arguments that state well capitalized
banks are better able to resist the levels of risk. This implies commercial banks in Ethiopia are
less the incentives to take riskier loan activities due to highly regulated nature of the institution in
the country. Thus, negative impact of CAR on NPLs is due to effective regulatory pressures by
NBE on capital adequacy ratio of banks and also bank managements’ efficient utilization of its
capital to absorb NPLs.
Lending Rate
The regression result of fixed effect model in the above table 4.3 is inconsistent with the
hypothesis developed in this study. The study hypothesized that there is a positive association
between lending rate and NPLs of banks. Unlike the findings of Ranjan and Chandra (2003) and
Farhan et al.(2012), Louzis et al.(2010), Sakiru et al.(2011), Tomak(2012), Konfi (2012), and
Daniel and Wandera(2013) where aggregate country data was used, the result of Fixed Effect
Model in the above table 4.3 indicates statistically significant negative impact of lending rate on
NPLs in Ethiopia. This negative sign indicates an inverse relationship between lending rate and
NPLs. It implies that for one unit change in the banks’ lending rate, keeping other thing constant
had resulted 2.95 units change on the levels of NPLs in opposite direction.
The finding of this study confirms the finding of Joseph(2011), Saba et al. (2012), Ahmad and
Bashir(2013), Hyun and Zhang (2012) and Ali and Eva (2013) that argues negative effect of
lending rate on the NPLs of banks. Thus, according to commercial banks in Ethiopia, change in
lending rate had no direct impact on NPLs since change in lending rate has a limit by regulatory
authorities.
The main reason for this negative association between lending rate and NPLs for Commercial
bank in Ethiopia is: First, higher lending rate curtail ability to borrow, which decreases the
amount of loan and then reduce NPLs. In case, higher lending rate enable individuals with funds
57
to start saving with the banks to earn on their funds but investors with the profitable projects feel
unwilling to borrow and invest. Second, increasing the level of lending rate has maximum and
minimum limit by itself. That means degree of increase in lending rate and amount of NPLs may
not be equal. Rather, ability to repay debt depends on other factors like borrowers’ source of
income. That is due to mismatch between the time they got return from their investment and the
time they repay their debts. In case, when lending rate increases at the time they got return on
their investment, the borrowers’ ability to repay their debt increase resulting reduction in NPLs.
Effective Tax Rate (ETR)
The regression result of fixed effect model in the above table 4.3 is consistent with the
hypothesis developed in this study. The study hypothesized that there is positive association
between effective tax rate and NPLs of banks. Thus, consistent with the hypothesis, the
estimated coefficients and test statistics of effective tax rate was 0.17 and 0.021 respectively
showing statistically significant positive impact of effective tax rate on the level of NPLs
commercial banks in Ethiopia. This implies that every one unit change in effective tax rate,
keeping other thing constant had resulted 0.17 units change on the levels of NPLs in the same
direction. The result of this study indicates that commercial banks in Ethiopia incur high NPLs at
the time of high corporate income tax payment. The result of this study confirms the arguments
of Albertazzi and Gambacorta (2006), Kaplow (2008) and Khan et al.(2011). Thus, this result
implies as NPLs of commercial banks in Ethiopia gets higher during high income tax rate in the
country.
This positive and statistically significant impact of effective tax rate on NPLs of commercial
banks in Ethiopia result as bank shift its tax burden to borrowers via increasing fees and other
commission, and also lending rate on loans, the borrowers pay this tax burden for the banks as
compensation and also their own tax to the government as an obligation. Thus, borrowers who
faced this double burden are unable to pay their debt.
4.9 Summary
This chapter discussed the results of documentary analysis regarding the determinant factors of
nonperforming loans of commercial bank in Ethiopia. In case, trends of NPLs of commercial

58
banks, descriptive statistics, and some diagnostic tests for classical linear regression model
assumptions was presented. Regarding the trend analysis of NPLs, commercial banks in Ethiopia
had downward sloping of NPLs for the period under consideration. i.e. from 2002-20013
periods. From descriptive statistics, the levels of NPLs of commercial banks in Ethiopia are still
above the threshold. i.e more than 5 %. Besides, Commercial banks in Ethiopia earn high return
from funds invested by the shareholders rather than from its assets. Furthermore, Capital
adequacy ratio is above the minimum requirements on average. To this end, normality,
heteroscedasticity, multicolinearity and autocorrelation problem was checked. Eventually, the
result shows that capital adequacy/solvency ratio, bank profitability measured in terms of ROA
and ROE, lending rate and effective tax rate were statistically significant factors that determine
the NPLs of commercial banks in Ethiopia. However, the result did not support the significant
effect of Loan to deposit ratio and inflation rate. In case, the result of this finding is compared
with the other researchers finding in the following table 4.4. The next chapter comes with
conclusion and recommendation for this study including the direction for further study.

59
Table 4.4 Comparison of Finding on Determinants of Nonperforming Loans from Previous Studies
Author Year country Model
Finding on Variables Used (Sign and Significance)
Boudruga et al.(2009)
2002-2006
Africa
RE
V1
V2 V3 V4 V5 V6 V7
-** +**
Skarica(2013) 2007-2012 Europe FE +* Makri et al.(2014) 2000-2008 Europe RE -* -* +* +* Selma and Jouini(2013)
2004-2008 Italy, Greece& Spain
FE
-*
Klein(2013) 1998-2011 Europe FE +* Djiogap and Ngomsi(2012)
2001-2010 Malaysia FE -* +**
Sakiru et al.(2011) 2007-2009 Africa ADRL
+*
Hyun and Zhang (2012) 2002-2006 US OLS -* -* -* Tomak (2013) 2003-2012 Turkey OLS +*
* +*
Ahmad and Bashir(2013)
1990-2011 Pakistan OLS +* -* -*
Saba et al. (2012) 1985-2010 US OLS -* Louzis et al.(2010) 2003-2009 Greece FE +
** -* -* -** +* +*
Ali and Iva(2013) 2002-2012 Albanian OLS -* -** +** Swamy(2012) 1997-2009 Indian FE ** +* ** ** Farhan et al.(2012) 2006 Pakistan OLS +* +* Badar and Yasmin(2013)
2002-2011 Pakistan EC * *
Ranjan and Chandra(2003)
2002 Indian Descriptive
-* +*
Daniel and Wandera(2013)
2007-2012 Kenya >> +*
Joseph(2011) 2010 Kenya >> +* Konfi(2012) 2006-2010 Ghana OLS -* Gadise(2014) 2002-2013 Ethiopia FE +
** +* -* -* -* -** +
* Source: researchers own computation
Note:-*negative and significant, -** negative but insignificant, +* positive and significant, +**positive but insignificant.V1,V2,V3,V4,V5,V6 and V7 represents Loan To Deposit, Return on Asset, Return on Equity, Lending Rate, Inflation Rate and Effective Tax Rate respectively. EC represent error correction methods
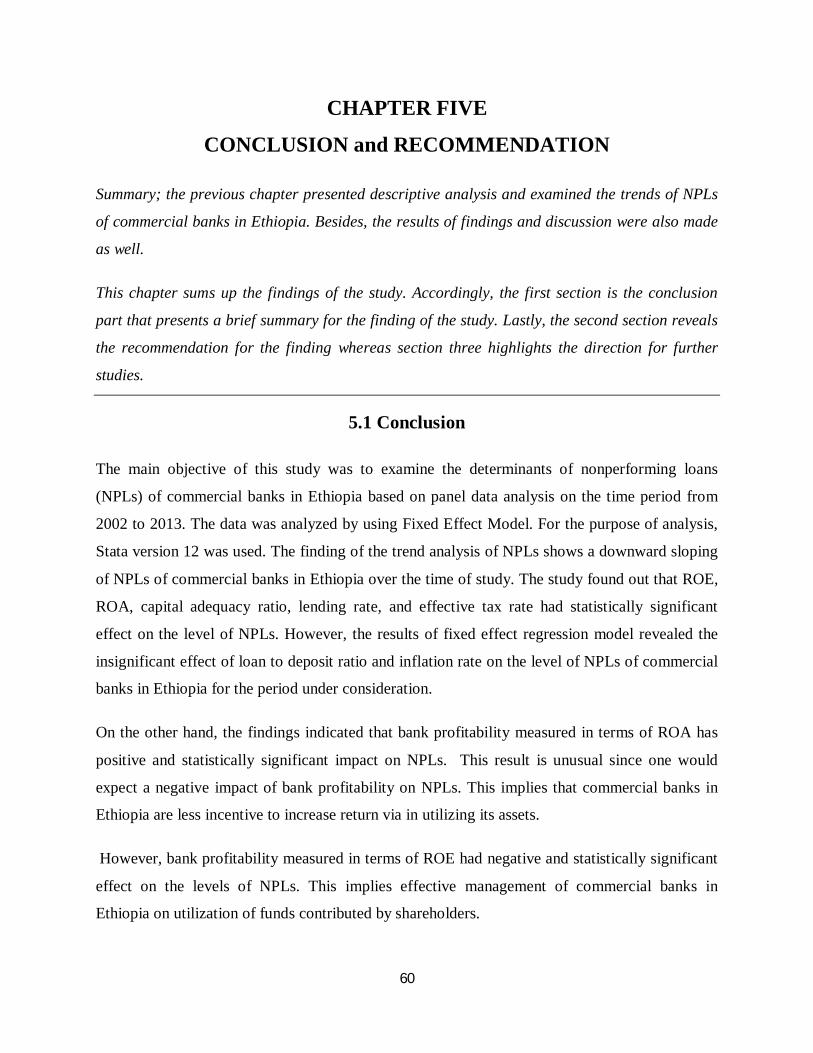
60
CHAPTER FIVE
CONCLUSION and RECOMMENDATION
Summary; the previous chapter presented descriptive analysis and examined the trends of NPLs
of commercial banks in Ethiopia. Besides, the results of findings and discussion were also made
as well.
This chapter sums up the findings of the study. Accordingly, the first section is the conclusion
part that presents a brief summary for the finding of the study. Lastly, the second section reveals
the recommendation for the finding whereas section three highlights the direction for further
studies.
5.1 Conclusion
The main objective of this study was to examine the determinants of nonperforming loans
(NPLs) of commercial banks in Ethiopia based on panel data analysis on the time period from
2002 to 2013. The data was analyzed by using Fixed Effect Model. For the purpose of analysis,
Stata version 12 was used. The finding of the trend analysis of NPLs shows a downward sloping
of NPLs of commercial banks in Ethiopia over the time of study. The study found out that ROE,
ROA, capital adequacy ratio, lending rate, and effective tax rate had statistically significant
effect on the level of NPLs. However, the results of fixed effect regression model revealed the
insignificant effect of loan to deposit ratio and inflation rate on the level of NPLs of commercial
banks in Ethiopia for the period under consideration.
On the other hand, the findings indicated that bank profitability measured in terms of ROA has
positive and statistically significant impact on NPLs. This result is unusual since one would
expect a negative impact of bank profitability on NPLs. This implies that commercial banks in
Ethiopia are less incentive to increase return via in utilizing its assets.
However, bank profitability measured in terms of ROE had negative and statistically significant
effect on the levels of NPLs. This implies effective management of commercial banks in
Ethiopia on utilization of funds contributed by shareholders.

61
Similarly, the study also found out that capital adequacy ratio has negative and statistically
significant impact on NPLs of commercial banks in Ethiopia. This indicates banks with strong
capital adequacy have a tendency to absorb possible loan losses and thus, reduce the level of
NPLs due to efficient utilization of its capital.
The finding of the lending rate is also surprising. It showed negative and statistically significant
impact of lending rate on the level of NPLs. This implies due to other extraneous factors,
increase in lending rate reduces the levels of NPLs for commercial banks in Ethiopia.
Furthermore, Effective tax rate is a factor that has positive impact on the levels of NPLs of
commercial banks in Ethiopia as per the regression result in this study. Thus, the presence to
shift tax burden to borrowers resulted in the occurrence of NPLs for commercial banks in the
country.
5.2 Recommendation
Based on the findings of the regression analysis and conclusion, the following recommendations
were forwarded.
In order to improve asset quality, specifically loans, it is strongly recommended that bank
management and loan officers should always give a serious attention to the health of asset
quality of banks specifically loan performance for prevention of loans loss. In order to curtail the
chance of occurrence of NPLs; it is better for the bank managers to give due emphasis on the
asset management decision. Once assets are considered as appropriate sources of financing, these
assets must be managed efficiently. Thus, it is better for the bank managers to efficiently utilize
its current assets and loans than fixed assets in order to reduce the level of nonperforming loans.
Besides, loan officers should provide financial counseling to the borrowers on the wise use of
loan and should make decision on timely fashion to meet their needs. If so, the banks
management on asset utilization is improved and then reduces the level of NPLs commercial
banks in the country.
Lending rate has an influential impact on the level of NPLs. The degree of increasing and
decreasing the level of lending rate has its own limit as per the regulatory authorities of the
country set by the NBE. It is imposed to overcome different costs. In case, it is better for the

62
bank management to use moderate lending rate and overcome its costs via increasing fees and
commission charges on current account and ATM withdrawal charges which are very important
to reduce NPLs level as per the result of this study. Thus, since the maximum and minimum
lending rate is fixed by the NBE, bank management has to impose moderate lending rate in
between and compensate its costs through increasing fees and other commission charges like for
current account and ATM withdrawal charges. Besides, it is strongly recommendable for the
loan officers to communicate with the borrowers on timely basis regarding their investments to
ensure their loan repayment ability.
As banking sectors shift their tax burden to their borrowers, borrowers’ ability to repay their debt
would be curtailed and then results in the occurrence of NPLs. Thus, in order to reduce the level
of NPLs, it is better for the bank management either to avoid or substitute shifting of its tax
burden via rearranging its financial affairs like reinvesting dividend payment (making cash
payments to shareholders via repurchasing their own shares) and increasing deduction like
interest expense. In case, if bank management substitute or avoid its tax burden, capital gains tax
rate is reduced making banks less incentive to spread/shift its tax burden to its borrowers that
would result in the occurrence of nonperforming loans.
Direction for Further Research
This study examined both bank specific and macroeconomic determinants of nonperforming
loans of senior commercial banks in Ethiopia using selected variables. However, there are so
many variables that were not included in this study. Thus, future researchers may be interested in
validating the consistency of the result and provide supplementary results for this study by
including other variables like GDP growth rate, size, ownership, unemployment rate and the like
on the same banks. Furthermore, the same study may be required on newly emerging banks.

I
REFERENCES
Admas John, T.A. Khan Hafiz, Raeside Robert and White David (2007): Research Methods for
Graduate Business and Social Science Students.
Ahmed Fawad and BashirTaqadus (2013): Explanatory Power of Macroeconomic Variables as
Determinants of Non-Performing Loans: Evidence Form Pakistan, World Applied Sciences
Journal 22 (2): 243-255, ISSN 1818-4952
Albertazzi Ugo and Gambacorta Leonardo (2006): Bank Profitability and Taxation Banca d’Italia,
Economic Research Department
Ali S. and Iva S. (2013): Impact of Bank Specific Variables on the Nonperforming loans ratio in
Albanian Banking System, Journal of Finance and Accounting: Vol.4, No.7.
Andres O.B. Carlos (2012): Macroeconomic Determinants of the Non-Performing Loans in Spain
and Italy: Published thesis (Msc), University Of Leicester.
Ayalew Eshetie (2011): The Application of Management Control System in Ethiopian Commercial
Bank. Addis Ababa, Published Thesis (MSc), Addis Ababa University
Badar Munib and Yasmin Atiya(2013): Impact of Macroeconomic Forces on Nonperforming Loans:
an Empirical Study of Commercial Banks in Pakistan; Journal of Transactions on Business
and Economics: Issue 1, Volume 10.
Bedru Babulo and Seid Hassen (2005): Econometrics Module as Teaching Material for Distance
Students Majoring In Economics; Mekelle University
Biabani Shaer, Glaninia Shahram and Mohabatkhah Hossein (2012): Assessment of Effective Factors
on Nonperforming Loans Creation: Empirical Evidence from Iran, Journal of Basic and
Applied Scientific Research, 2(10)10589-10597, ISSN 2090-4304
Blanco Roberto and Gimeno Ricardo (2012): Determinants of Default Ratios in the Segment of
Loans to Households in Spain
II
Boudriga Abdelkader , Boulila T. Neila and JellouliSana (2009): Bank Specific, Business and
Institutional, Environment Determinants of Nonperforming Loans: Evidence from MENA
Countries, Journal of Financial Economic Policy, Vol. 1 No. 4, Pp. 286-318
Brownbridge Martin, (1998): Implications for Prudential Policy: Discussion Paper, in Local Banks
in Africa No. 132
C. Joseph Ng’etich (2011): The Effects of Interest Rate Spread on the Level of Non-Performing
Assets: A Case of Commercial Banks in Kenya. International Journal of Business and Public
Management (ISSN: 2223-6244) Vol. 1(1): 58-65
C.R. Kothari (2004): Research Methodology, Methods and Techniques, Second Revised Edition,
India, University Of Rajasthan.
Calice Pietro (2012): Resolving Nonperforming Loans in Tunisia: Coordinated Private Sector
Approach; Journal of African Economic Brief Volume 3,
Chris Brooks (2008): Introductory Econometrics for Finance; Second Edition, New York,
University of Reading.
D.N Gujarati, (2004): Basic Econometrics, 4th Ed., Mcgraw-Hill Companies,
Djiogap Fouopi and Ngomsi Augustin(2012): Determinants of Bank Long-Term Lending Behavior
in the Central African Economic and Monetary Community (CEMAC), Review of
Economics &Finance; 1923-7529-2012-02-107-08,
Farhan Muhammad, Sattar Ammara, C. Hussain Abrar, Khalil Fareeha (2012): Economic
Determinants of Non-Performing Loans: Perception of Pakistani Bankers European;
Journal of Business and Management, Vol4, No.19,
Fasil Alemayehu and Mehretab Teklemedhin (2009): Law of Banking, Negotiable Instruments and
Insurance, Teaching Material; Addis Ababa, Justice and Legal System Research Institute,
Felix A. Takang and T.Cloudine Ntui (2008): Bank Performance and credit Risk Management;
published thesis (MSc), University of Skovde

III
Habtamu Negussie (2012): Determinants of Bank Profitability: An Empirical Study on Ethiopian
Private Commercial Banks: Published thesis (MSC), Addis Ababa University
Haneef Shahbaz , Riasz Tabassum, Razman Muhammad, R.Ali Mansoor A. R., I. Muhammed Hafiz
and Karim Yasir (2012): Impact of Risk Management on Nonperforming Loans and
Profitability of Banking Sector of Pakistan; International Journal Of Business And Social
Science Vol. 3 No. 7;
IMF, Annual report 2005
K. Daniel Kipyego and Wandera Moses (2013): Effects of Credit Information Sharing on
Nonperforming Loans. European Scientific Journal, Vol.9, No.13 ISSN: 1857 – 7881
Kaplow Lousis (2008): Theory of Taxation and Public Economics, second edition, United Kingdom
KhanFaisal, Ahmed Anuar Melati., C.Guan Lim and Khan Hashim (2011): Determinants of Bank
Profitability in Pakistan; Case Study of Pakistani Banking Sector; World Applied Sciences
Journal 15 (10): 1484-1493, ISSN 1818-4952.
Klein Nir (2013) Nonperforming loan in CESEE: Determinants and Impact on Macroeconomic
Performance, IMF working Papers 13(72)
Kolapo, T. Funso, Ayeni, R. Kolade and Oke M. (2012): Credit Risk and Commercial Banks’
Performance in Nigeria: Journal of Business and Management Research Vol.2 No.02 Pp31-
38
Konfi Samuel (2012): Determining Causes and Impact of Nonperforming Loans on the Operations
of Microfinance Institutions: A Case of Sinapi Aba Trust In Ghana. Published thesis (MBA),
Kwame Nkrumah University
Lafunte Esteban (2012): Monitoring Bank Performance in the Presence of Risk Mirceaepure:
Working Papers Barcelona, Spain
M. Leroy Roger and D.Vanhoos David (2006): Modern Money and Banking, 3rd edition.
IV
Makri Vasiliki, Tsagkanos Athanasios and Bellas Athanasios(2014): Determinants of
Nonperforming Loans: The Case of Eurozone” Panoeconomicus, Volume 2, Pp. 193-206
Mileris Ricardas(2012): Macroeconomic Determinants of Loan Portfolio Credit Risk in Banks,
Inzinerineekonomika- Journal of Engineering Economics, 23(5), 496-504
N. Sontakke Ravindra and Tiwari Chandan (2013): Trend Analysis of Nonperforming Asset in
Scheduled Commercial Banks in India; International Journal of Application or Innovation in
Engineering &Management (IJAIEM); ISSN 2319 – 4847
NBE (2008): Asset Classification and Provisioning Directive No. SBB/43/2008. National Bank of
Ethiopia, Addis Ababa
NBE (2009/10): Conference Proceedings on National Payment System
Netsanet Belay (2012): Determinants of Capital Structure Decisions of the Construction Companies
in Addis Ababa: Published thesis (MSc), Addis Ababa University
O. Moti Haron, Nelimasindani Mary, Galomugenda Nebat and Simiyumasinde Justo(2012):
Effectiveness of Credit Management System on Loan Performance: Empirical Evidence
From Micro Finance Sector in Kenya, International Journal of Business, Humanities and
Technology Vol. 2 No.6.
P. Hyun Jung and Zhang Lei (2012): Macroeconomic and Bank-Specific Determinants of the U.S.
Non-Performing Loans. Before and during the Recent Crisis; Published thesis (MSc),
Simon Fraser University
P. Loizis Dimintrious, T.Vouldis Angelos, Metaxas Vasilios (2010): The Determinants of Non-
Performing Mortgage, Business and Consumer Loans in Greece: Athens, Published thesis
(MSc), Athens University.
Petersson Jessica and Wadman Isac (2004): Non Performing Loans - The Markets of Italy and
Sweden, Published Thesis (MSc)

V
Rajveer R., Shwetha M., Sharan and Pradeep B. L. (2012): Modeling the NPA of Midsized Indian
Nationalized Bank as Function of Advances; European Journal of Business and
Management, Vol4, No.5,
Ranjan Rajiv and D. Chandra Sarat(2003): Non-Performing Loans and Terms of Credit of Public
Sector Banks in India: An Empirical Assessment; India, Reserve Bank of India Occasional
Papers Vol. 24, No. 3,
Rawlin Rajveer , M. Shwetha M., Sharan and Pradeep B. L. (2012): Modeling the NPA of Midsized
Indian Nationalized Bank as Function of Advances; European Journal of Business and
Management, Vol 4, No.5,
S.S. Macdonald/Timothy W. (2006): Management of Banking; 6th edition
Saba Irum, Kouser Rehana and Azeem Muhammad (2012): Determinants of nonperforming Loans:
Case of US Banking Sector. International Journal of Banking and Finance; No. 44 Pp 479-
88
Sakiru A. Solarin, Sulaiman Wan., Yussof Wan, Muamalat Kulliyah, Dahalance Jauhari (2011)
ARDL Approach to the Determinants of Nonperforming Loans in Islamic Banking System
in Malaysia; Journal Of Business And Management Review Vol. 1, No.2
Selma.M. Ahlem and Jouini Fathi (2013): Micro and Micro determinants of Nonperforming;
Tunisia, International Journal of Economics and Financial Issues. Vol.3, No.4, pp 852-860,
Sharon G. (2007): Monetary And Financial Stability: Issues For Caricom Economies in the
Domestic Sector, Business, Finance &Economics In Emerging Economies Vol. 2, No. 1,
Shingjerji Ali (2013): Impact of Bank Specific Variables on the Nonperforming loans ratio in
Albanian Banking System, Journal of Finance and Accounting: Vol.4, No.7.
Skarica Bruna (2013): Determinants of Non-Performing Loans In Central And Eastern European
Countries: Financial Theory and Practice. 38 (1) 37-59

VI
Skarica Bruna (2013): Determinants of Non-Performing Loans in Central and Eastern European
Countries: Working Paper. No 13-07.
Swamy Vighneswara (2012): Impact of Macroeconomic and Endogenous Factors on
Nonperforming Bank Assets: International Journal of Banking and Finance, Vol. 9.
Tendia Mabvure Joseph, Edson Gwangwava, Manuere Faitira, Clifford Mutibvu and Michael
Kamoyo (2012: Nonperforming loans in commercial banks A case of commercial banks in
Zimbabwe; Interdisciplinary Journal of Contemporary Research in Business, Vol.4
Theodros Kinfe (2011) Determinants of Dividend Payout: an Empirical Study on Bank Industry in
Ethiopia; Published thesis (MSc), Addis Ababa University
Thomas Lloyd B. (2006): Money Banking and Financial Markets.pp211.
Tomak Serpil(2013) Determinants of Commercial Banks ‘lending Behavior: Evidence From Turkey:
Journal Of Empirical Research, 3(8):933-943.
Tseganesh Tesyaye (2012) Determinants of Banks Liquidity and Their Impact on Financial
Performance: Published thesis (MSc), University Addis Ababa, Ethiopia
W. Creswell John (2003) Qualitative, Quantitative, and Mixed Methods Approaches, Second Edition
www.nbe.gov.et, Searched On September, 1, 2013
Yuqi Li (2006): Determinants of Banks Profitability and its Implication on Risk Management
Practices: Panel Evidence from the UK in the Period: published thesis (MA), University of
Nottingham.
Zewdu Seyoum(2010): Impact of reducing loan by Ethiopian banks on their own performance;
published thesis(MSc), University of South Africa

VII
APPENDICES
Appendix1: Model Selection and Basic Tests for CLRM Assumptions
Appendix.1A:- Heteroscedasticity and autocorrelations test
Breusch-Pagan / Cook-Weisberg test 0.2376
Durbin-Watson stat 1.875856 ≈2)
Note: Breusch-Pagan / Cook-Weisberg test for heteroscedasticity whereas Durbin-Watson stat
for autocorrelation
Appendix.1B:- Pearson Correlation Matrix
NPL LTD ROE ROA CAR ALR INF ETR
NPL 1.0000 LTD 0.0444 1.0000 ROE -0.4595 -0.2434 1.0000 ROA -0.2149 -0.2719 0.4000 1.0000 CAR -0.3340 0.2673 -0.2759 0.2100 1.0000 ALR -0.4361 -0.4346 0.3727 0.4958 0.0157 1.0000 INF -0.3908 -0.2306 0.3433 0.3461 0.0478 0.5179 1.0000 ETR 0.1458 0.1522 -0.0401 -0.1919 0.0953 -0.2052 -0.2728 1.0000
Note: NPL stands for Nonperforming loan ratio, LTD for Loan to deposit, CAR for Capital
adequacy ratio, ROE for Return on equity, ROA for Return on asset, ALR for Average lending
rate, INF for Inflation rate and ETR is for Effective Tax Rate.
Source: NBE and CSA via Stata 12

VIII
Appendix.1C:- summary of VIF Variable VIF 1/VIF(Tolerance)
LTD 1.84 0.542937
ROE 1.71 0.584794 ROA 1.58 0.632050 CAR 1.51 0.660930 ALR 1.46 0.686811 INF 1.40 0.715914 ETR 1.15 0.868705
Mean VIF 1.52 Source: NBE and CSA via Stata 12
Note: LTD for Loan to deposit ratio, CAR for Capital adequacy ratio, ROE for Return on equity, ROA for Return on asset, ALR for Average lending rate, INF for Inflation rate and ETR is for Effective Tax Rate.
Appendix 1 D: Hausman specification Test
---- Coefficients ---- Variables (b) (B) (b-B) sqrt(diag(V_b-V_B)) Fixed Random Difference S.E ltd | .0061738 -.0207366 .0269104 .0325664 roe | -.559224 -.5311307 -.0280933 . roa | 3.832226 3.145826 .6863999 . car | -1.046489 -1.762226 .715737 .1762966 avlr | -2.953288 -2.574673 -.3786152 . infl | -.065195 -.0701667 .0049717 . taxrate | .1681874 .1756848 -.0074975 .
b = consistent under Ho and Ha; B = inconsistent under Ha, efficient under Ho; Test: Ho: difference in coefficients not systematic chi2 (7) = (b-B)'[(V_b-V_B)^(-1)](b-B) = 14.73 Prob>chi2 = 0.0397 (V_b-V_B is not positive definite)
Source: NBE and CSA via Stata 12

IX
Appendix 2: Raw Data
Bank year NPL LTD ROE ROA CAR Av.LR INFL
tax
rate
CBE 2002 52.09 53 -57 -2.13 4 10.5 -10.6 -7
CBE 2003 53.5 43 43 2.25 5 10.5 10.9 24
CBE 2004 37.68 37 22 1.19 5 10.5 7.3 31
CBE 2005 27.52 38 40 1.72 4 10.5 6.1 28
CBE 2006 22.45 33 53 2.24 4 10.5 10.6 28
CBE 2007 14.52 30 20 1.99 10 11.5 15.8 26
CBE 2008 5.33 46 30 2.7 9 12.25 25.3 27
CBE 2009 3.66 48 38 3.23 8 12.25 36.4 29
CBE 2010 1.88 44 35 2.65 7 11.875 2.8 30
CBE 2011 0.86 42 46 2.51 5 11.875 18.1 32
CBE 2012 2 53 70 3.42 5 11.90 33.8 31
CBE 2013 0.99 48 68 3.5 6 11.90 13.5 32
CBB 2002 41.55 119.57 5.19 0.42 8.04 8.70 -10.6 50
CBB 2003 40.09 114.96 13.92 1.17 8.4 7.00 10.9 21
CBB 2004 35.47 107.16 4.82 0.38 7.85 10.50 7.3 43
CBB 2005 27.76 81.16 16.04 0.93 5.79 10.50 6.1 35
CBB 2006 19.42 121.17 35.67 3.12 8.74 10.50 10.6 29
CBB 2007 17.06 116.99 26.42 2.96 11.22 11.50 15.8 31
CBB 2008 15.56 93.13 32.5 3.52 10.83 12.30 25.3 27
CBB 2009 11.45 85.77 27.32 2.84 10.38 11.9 36.4 30
CBB 2010 6.56 74.28 28.61 2.9 10.13 12.25 2.8 30
CBB 2011 6.81 68.88 23.65 2.45 10.36 12.25 18.1 30
CBB 2012 9.7 51.27 24.22 1.95 8.05 11.90 33.8 29
CBB 2013 10 53 25 2 8 11.90 13.5 30
DB 2002 14.22 73.22 19.67 1.62 8.21 8.70 -10.6 38.5
DB 2003 8.89 78.16 20.93 1.36 6.48 7.00 10.9 27.03

X
DB 2004 7.44 77.59 32.56 2.09 6.43 10.50 7.3 28.21
DB 2005 6.72 78.79 29.22 2.07 7.11 10.50 6.1 26.8
DB 2006 6.21 85.7 34.46 2.93 8.49 10.50 10.6 28.11
DB 2007 5.95 82.04 34.34 3.09 9.01 11.50 15.8 27.52
DB 2008 5.89 71.23 32.72 3.05 9.33 12.30 25.3 28.12
DB 2009 7.39 56.17 27.5 2.57 9.33 11.9 36.4 29.11
DB 2010 3 49.77 28.85 2.62 9.09 12.25 2.8 29.29
DB 2011 3.38 52.51 32.27 3.07 9.52 12.25 18.1 28.45
DB 2012 2.15 57.76 35.67 3.72 10.43 11.90 33.8 27.01
DB 2013 2.25 55.91 29.66 3.07 10.36 11.90 13.5 25.36
AIB 2002 34.02 68.49 9.16 1.08 11.78 8.70 -10.6 36.84
AIB 2003 25.13 68.73 10.22 0.99 9.78 7.00 10.9 22.22
AIB 2004 18.39 63.36 16.77 1.47 8.75 10.50 7.3 25.71
AIB 2005 12.02 66.49 16.67 1.7 10.24 10.50 6.1 30.91
AIB 2006 9.56 72.93 25.66 2.64 10.29 10.50 10.6 29.73
AIB 2007 7.36 80.72 32.99 3.73 11.32 11.50 15.8 29.9
AIB 2008 8.66 70.75 23.91 2.96 12.39 12.30 25.3 30
AIB 2009 5.78 54.67 19.07 2.23 11.68 11.9 36.4 29.38
AIB 2010 5.47 51.52 26.33 3.12 11.84 12.25 2.8 29.44
AIB 2011 3.81 51.48 27.57 3.56 12.93 12.25 18.1 28.6
AIB 2012 2.7 59.8 24.49 3.3 13.49 11.90 33.8 25.66
AIB 2013 60.04 21.23 2.47 11.62 10 11.90 13.5 24.77
BOA 2002 37.95 73.6 -1.42 -0.18 12.35 8.70 -10.6 125
BOA 2003 28.43 75.19 4.02 0.45 11.18 7.00 10.9 25
BOA 2004 17.51 74.45 19.69 2.39 12.18 10.50 7.3 29.63
BOA 2005 12.4 75.85 24.01 2.97 12.35 10.50 6.1 25.61
BOA 2006 4.94 90.17 21.14 2.99 14.19 10.50 10.6 30.33
BOA 2007 10.54 84.71 16.63 1.97 11.87 11.50 15.8 29.47
BOA 2008 12.87 81 3.47 0.34 9.83 12.30 25.3 33.47

XI
BOA 2009 14.75 60.28 19.35 1.83 9.48 11.9 36.4 30.95
BOA 2010 6.98 61.36 24.01 2.24 9.32 12.25 2.8 28.4
BOA 2011 3.97 54.58 27.38 2.49 9.08 12.25 18.1 29.98
BOA 2012 2.6 57.56 23.86 2.63 11 11.90 33.8 25.04
BOA 2013 54.24 17.92 1.95 10.9 11.90 13.5 24.67
WB 2002 12.94 78.83 9.38 0.93 9.91 8.70 -10.6 50
WB 2003 10.86 81.11 11.83 1.24 10.46 7.00 10.9 26.67
WB 2004 12.24 84.25 24.81 2.81 11.32 10.50 7.3 28.89
WB 2005 8.41 77.8 26.67 2.97 11.14 10.50 6.1 23.81
WB 2006 4.85 89.6 27.84 3.14 11.29 10.50 10.6 24.47
WB 2007 5.25 79.13 27.79 3.22 11.58 11.50 15.8 26.8
WB 2008 8.39 79.11 22.93 3.37 14.68 12.30 25.3 26.92
WB 2009 7.7 56.66 21.59 3.53 16.34 11.9 36.4 29.48
WB 2010 3.47 63.06 21.24 3.89 18.32 12.25 2.8 29.66
WB 2011 3.51 48.85 24.17 4.01 16.59 12.25 18.1 29.44
WB 2012 2.4 61.92 20.96 4.028 19.22 11.90 33.8 26.62
WB 2013 0.41 64.14 18.58 3.27 17.61 11.90 13.5 24.38
UB 2002 15.95 86.24 4.55 1.27 28.03 8.70 -10.6 43
UB 2003 9.93 101.05 4.49 1.067 19.4 7.00 10.9 29
UB 2004 9.9 72.18 7.29 1.04 14.24 10.50 7.3 30
UB 2005 8.45 68.55 24.8 2.89 11.65 10.50 6.1 28
UB 2006 4.18 82.3 23.04 2.75 11.94 10.50 10.6 27
UB 2007 4.59 91.5 17.78 2.93 16.49 11.50 15.8 26
UB 2008 3.98 76.11 19.46 2.8 14.39 12.30 25.3 28
UB 2009 4.62 59.52 19.99 2.01 11.18 11.9 36.4 30
UB 2010 3.76 55.32 27.36 2.96 10.81 12.25 2.8 30
UB 2011 3.35 54.02 25.72 3 11.67 12.25 18.1 28
UB 2012 2.33 60.46 27.04 3.39 12.54 11.90 33.8 27
UB 2013 0.33 60.05 23.47 2.82 12.038 11.90 13.5 24.64

XII
NIB 2002 8.64 93.91 13.13 2.43 18.54 8.70 -10.6 40.9
NIB 2003 12.34 93.54 10.4 1.47 14.12 7.00 10.9 31.58
NIB 2004 8.77 94.47 20.23 2.81 13.87 10.50 7.3 28.57
NIB 2005 11.22 92.64 20.54 2.66 12.93 10.50 6.1 30.3
NIB 2006 8.47 101.58 20.35 2.86 14.06 10.50 10.6 28.4
NIB 2007 5.56 96.7 17.88 2.92 16.3 11.50 15.8 28.3
NIB 2008 6.73 85.58 18.9 3.1 16.39 12.30 25.3 28.8
NIB 2009 11.16 67.36 21.08 3.2 15.16 11.9 36.4 29.95
NIB 2010 7.37 61.69 21.92 3.36 15.35 12.25 2.8 29.57
NIB 2011 5.04 53.64 21.05 3.47 16.46 12.25 18.1 28.38
NIB 2012 3 63.53 18.73 3.46 18.46 11.90 33.8 26.51
NIB 2013 0.3 66.55 17.18 3.13 18.22 11.90 13.5 24.38
Source: NBE and CSA via simple excel