DETERMINANTS OF NON-PERFORMING LOANS IN BHUTANESE ...
44
DETERMINANTS OF NON-PERFORMING LOANS IN BHUTANESE FINANCIAL SECTOR By Ugyen Tshering THESIS Submitted to KDI School of Public Policy and Management in partial fulfillment of the requirements for the degree of MASTER OF PUBLIC POLICY 2016
-
Upload
khangminh22 -
Category
Documents
-
view
0 -
download
0
Transcript of DETERMINANTS OF NON-PERFORMING LOANS IN BHUTANESE ...
DETERMINANTS OF NON-PERFORMING LOANS IN BHUTANESE FINANCIAL
SECTOR
By
Ugyen Tshering
THESIS
Submitted to
KDI School of Public Policy and Management
in partial fulfillment of the requirements
for the degree of
MASTER OF PUBLIC POLICY
2016
DETERMINANTS OF NON-PERFORMING LOANS IN BHUTANESE FINANCIAL
SECTOR
By
Ugyen Tshering
THESIS
Submitted to
KDI School of Public Policy and Management
in partial fulfillment of the requirements
for the degree of
MASTER OF PUBLIC POLICY
2016
Professor Lee, Jinsoo
DETERMINANTS OF NON-PERFORMING LOANS IN BHUTANESE FINANCIAL
SECTOR
By
Ugyen Tshering
THESIS
Submitted to
KDI School of Public Policy and Management
in partial fulfillment of the requirements
for the degree of
MASTER OF PUBLIC POLICY
Committee in charge:
Supervisor Lee, Jinsoo, supervisor ___________________
Professor Kim, Ji-Ho ___________________
Professor Choi, Changyong ___________________
2016
ABSTRACT
DETERMINANTS OF NON-PERFORMING LOANS IN BHUTANESE FINANCIAL
SECTOR
By
Ugyen Tshering
This paper attempts to study the internal (bank specific) and external (macroeconomic)
determinants of non-performing loans (NPLs) in Bhutanese financial sector using a panel data
and random effect model. This study uses the data from a panel of 4 financial institutions (3
banks and 1 insurance company) engaged in lending activities and macroeconomic data covering
for period from 2005 to 2014. Of the macroeconomic variables used (GDP, Unemployment rate,
Inflation rate), the empirical result indicates that only GDP significantly affect the NPLs and is
negatively related with the NPLs. However, contrary to most of the previous studies, the
empirical analysis do not support the view that higher unemployment in the economy will lead to
higher NPLs. Inflation rate is also not statistically significant and does not affect NPLs in
Bhutanese financial sector. Regarding the bank specific variables, the results indicate that all
variables are statistically significant in explaining the variation of NPLs. The bank specific
variables used for this study are ROA, ROE, CAR, Bank Size and Loans to Asset ratio. The
result indicates a negative relationship of NPLs to ROE and CAR while indicating positive
relationship to ROA, Bank Size and Loans to Asset ratio.

ACKNOWLEDGEMENT
I would like to thank Professor Lee, Jinsoo and Kim, Ji-Hong for their heartfelt guidance and
continued support throughout my research paper. It was a great honor for me to work under these
experienced and outstanding professors.
TABLE OF CONTENTS
1. Introduction……………………………………………………………………………1
2. Bhutanese Financial Sector…………………………………………………………….2
3. Literature Review……………………………………………………………………....7
3.1 Macroeconomic factors…………………………………………………………….7
3.2 Bank-specific factors……………………………………………………………....10
4. Data and Methodology…………………………………………………………………13
4.1 Sample and Data……………………………………………………………………13
4.2 Study Variables……………………………………………………………………...14
4.3 Model Specification…………………………………………………………………18
4.4 Research Hypothesis………………………………………………………………..19
5. Data Analysis and Findings……………………………………………………………..20
5.1 Descriptive Data……………………………………………………………………..20
5.2 Multicollinearity Test………………………………………………………………..21
5.3 Model Selection……………………………………………………………………...22
5.4 Findings……………………………………………………………………………...24
6. Discussion and Analysis………………………………………………………………....25
7. Conclusion and Recommendation……………………………………………………….29
7.1 Conclusion…………………………………………………………………………...29
7.2 Recommendation…………………………………………………………………….31
References………………………………………………………………………………...33

ABBREVIATIONS
NPLs: Non-Performing Loans
RMA: Royal Monetary Authority
GDP: Gross Domestic Product
ROE: Return on Equity
CAR: Capital Adequacy Ratio
ROA: Return on Assets
CD: Credit to Deposit
MENA: Morocco, Egypt, Tunisia, Algeria and United Arab Emirates
RICBL: Royal Insurance Corporation of Bhutan Limited
1
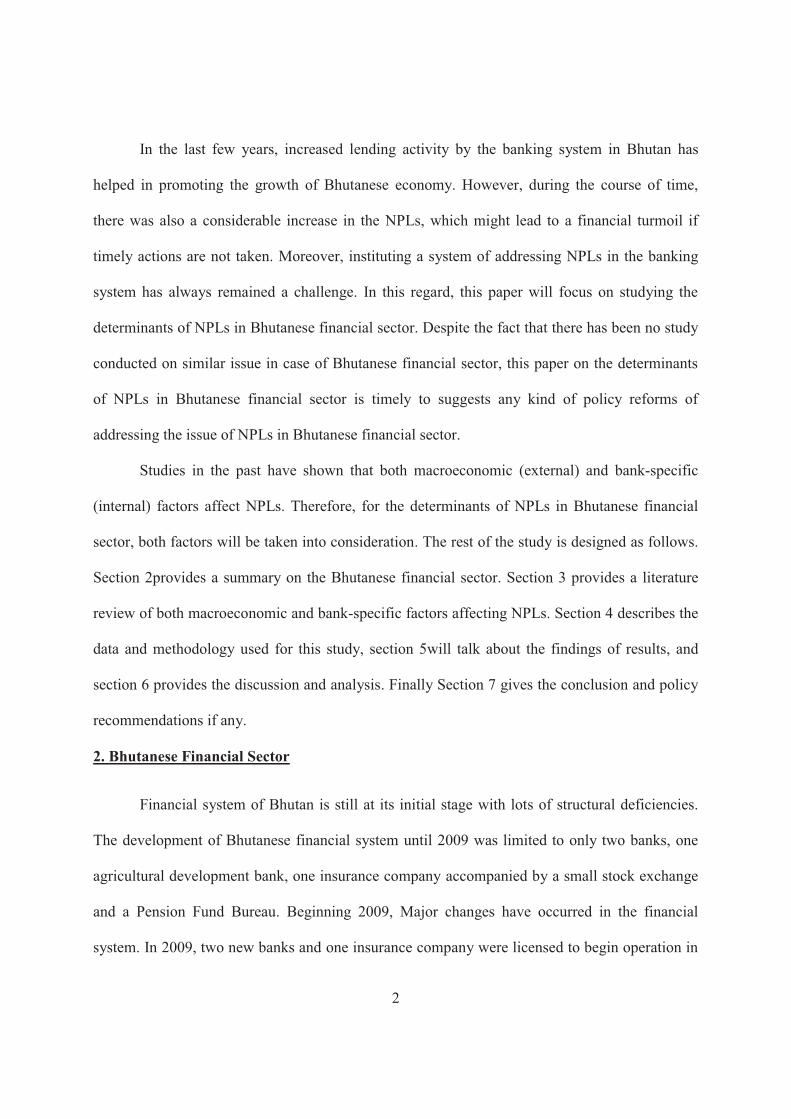
1. Introduction
Financial system is the most important parameter for the growth of any economy. Since
then, it has become imperative to ensure a stable financial system in the economy. Stable
financial system has always supported the growth of economy (Rajaraman and Visistha 2002).
One of the main players in the financial sector is the banking sector, thus ensuring sound banking
system and practices is very crucial for country’s economic development. In the past, the causes
of failure of most of the banks are attributed to Non-Performing Loans (NPLs) in the banking
sector, thereby indicating a strong association between NPLs and financial crises. Banking crisis
in the economy is mainly due to the NPLs of banks (Brownbridge 1998;Hou 2007), and thus
adversely affecting the growth in the economy as a result of reduced bank lending (Chijoriga
1997; Brownbridge1998).The NPLs are the most common risk that the banks are exposed to,
affecting their profitability and solvency (Michael, Vasanthi and Selvaraju 2006). Therefore,
taking all these into consideration, the eradication of NPLs has become important in order to
prevent financial instability and boost the economic status (Hou 2007).
Since NPLs are used to measure the quality of loans in the banking sector, all banks have
the system of classifying and defining NPLs as a part of their credit risk management (Guy
2011).NPLs are commonly described as loans which remain unpaid for 90 days or more (Guy
2011;Joseph et al. 2012). The NPLs are also those loans which do not generate any income
(Greuning and Bratanovic 2003). The definition given by the Basel Committee (2001) is that
NPLs are defined as loans which are not paid and their overdue time period is 90 days after
maturity date. The definition given by the Basel Committee is being adopted by most of the
financial regulators in defining NPLs in their respective jurisdiction.
2
In the last few years, increased lending activity by the banking system in Bhutan has
helped in promoting the growth of Bhutanese economy. However, during the course of time,
there was also a considerable increase in the NPLs, which might lead to a financial turmoil if
timely actions are not taken. Moreover, instituting a system of addressing NPLs in the banking
system has always remained a challenge. In this regard, this paper will focus on studying the
determinants of NPLs in Bhutanese financial sector. Despite the fact that there has been no study
conducted on similar issue in case of Bhutanese financial sector, this paper on the determinants
of NPLs in Bhutanese financial sector is timely to suggests any kind of policy reforms of
addressing the issue of NPLs in Bhutanese financial sector.
Studies in the past have shown that both macroeconomic (external) and bank-specific
(internal) factors affect NPLs. Therefore, for the determinants of NPLs in Bhutanese financial
sector, both factors will be taken into consideration. The rest of the study is designed as follows.
Section 2provides a summary on the Bhutanese financial sector. Section 3 provides a literature
review of both macroeconomic and bank-specific factors affecting NPLs. Section 4 describes the
data and methodology used for this study, section 5will talk about the findings of results, and
section 6 provides the discussion and analysis. Finally Section 7 gives the conclusion and policy
recommendations if any.
2. Bhutanese Financial Sector
Financial system of Bhutan is still at its initial stage with lots of structural deficiencies.
The development of Bhutanese financial system until 2009 was limited to only two banks, one
agricultural development bank, one insurance company accompanied by a small stock exchange
and a Pension Fund Bureau. Beginning 2009, Major changes have occurred in the financial
system. In 2009, two new banks and one insurance company were licensed to begin operation in
3
2010. Further, the agricultural development bank was granted a specialized deposit-taking bank
license in 2010 to expand its business to the urban areas. The Royal Monetary Authority (RMA)
is the central bank of Bhutan and is also responsible for supervision of financial institutions in
Bhutan. There are eight financial institutions that are currently authorized by the RMA to
perform lending operations. These include five banks, two insurance companies, and a pension
fund. Of the banks, two are government owned, Bank of Bhutan Limited and Bhutan
Development Bank Limited and three are private, Bhutan National Bank Limited, T-Bank
Limited and Druk Punjab National Bank Limited. The two insurance companies are Royal
Insurance Corporation of Bhutan Limited (RICBL) and Bhutan Insurance Limited. These two
insurance companies compete with banks in terms of rendering their services of lending to the
people. The National Pension and Provident Fund (NPPF) Bureau responsible for managing the
retirement plans of civil servants, employees of government owned corporations, joint sector
companies, and armed forces is also allowed to perform limited lending to their members. In
2013, RMA granted license to first reinsurance company, GIC-Bhutan Re to undertake
reinsurance business in Bhutan.
Given that the RMA made its transition to a full-fledged central bank (new central bank
act was endorsed in 2010), it is currently undergoing major institutional changes in line with its
mandate to meet the requirements of a growing financial sector and economy. 2012 was a
difficult year for Bhutan as it faced its first major economic hurdle as external imbalances
threatened the precarious level of the nation’s limited reserves. The central bank was compelled
to sell huge chunk of US dollars from its reserves to meet immediate payments, following which
the financial sector faced huge liquidity constraints and were not able to provide credit in an
economy. This was further aggravated by the increase of NPLs in the financial sector. As a result,

4
there was a slowdown in economic growth of the country, bringing down the real GDP as low as
2.1 percent in 2013. Since then RMA took several unconventional measures to address the
pressure from growing external imbalances, particularly the issue of severe shortages of Indian
currency Rupees. One of those measures taken by the RMA was the temporary restrictions
placed on Construction and Vehicle loans during the period 2012 to 2014, which was driving out,
most of the country’s foreign reserve (Indian Rupees in particular).Therefore, given the fact that
financial sector is at heart of Bhutanese economic development, it is very important to promote
sound financial system.
Despite the fact that Bhutanese financial sector is still at its initial stage, it is however,
experiencing a steady growth as financial institutions develop to provide financial services to
more people, thereby, registering an increase in asset size, expressed as a proportion of GDP.
Financial sector’s assets as a proportion of GDP have increased from 69.1 percent at the end of
2005 to 82.7 percent in 2013. In terms of the total assets, the financial sector’s total assets stood
at Bhutanese currency Ngultrum (Nu) 109.72 billion (approximately 1.82 billion US dollars)as of
December 2014.Out of these assets, more than 70 percent are comprised of loans and advances.
Banking sector still continues to dominate the financial sector, though its share of assets has been
falling over the years. In terms of loan growth within the financial sector, it grew at CAGR
(compounded annual growth rate) of 24 percent from 2005 to 2014, indicating that financial
sector in Bhutan is playing important role in providing the necessary stimulus to the country’s
economic growth. However, there is some degree of sectoral credit concentration present
indicating that banks are overexposed to certain sectors.
5
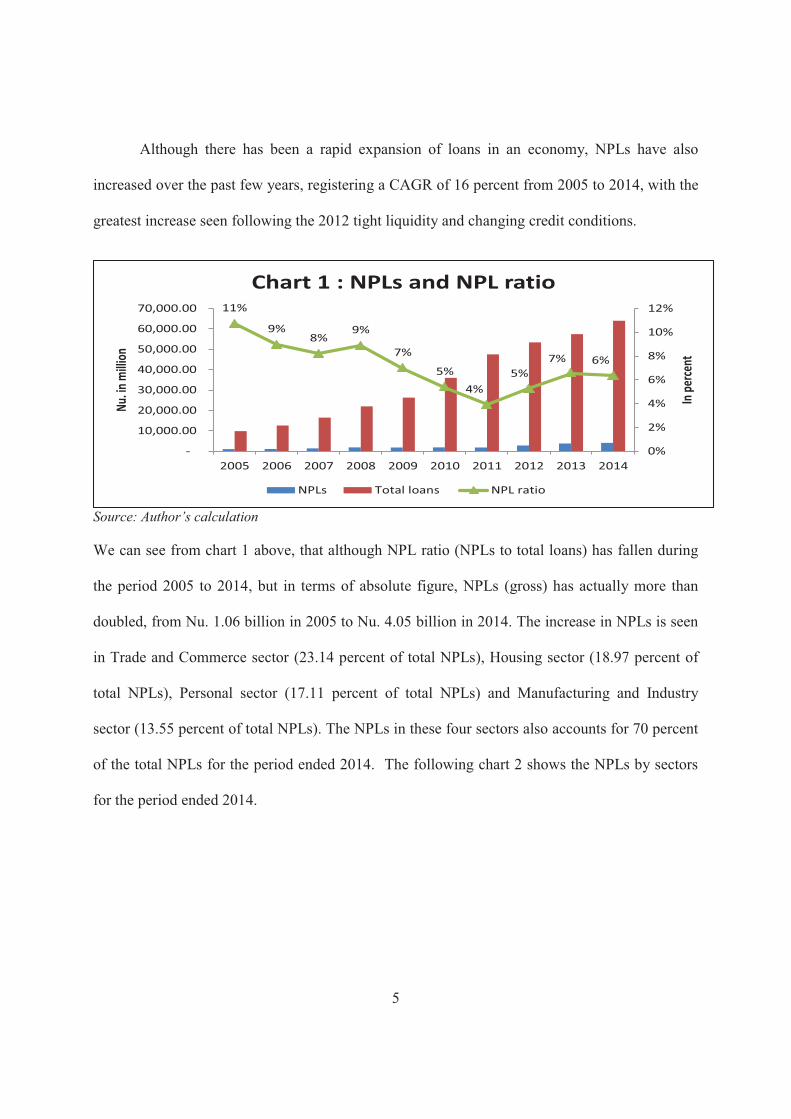
Although there has been a rapid expansion of loans in an economy, NPLs have also
increased over the past few years, registering a CAGR of 16 percent from 2005 to 2014, with the
greatest increase seen following the 2012 tight liquidity and changing credit conditions.
Source: Author’s calculation
We can see from chart 1 above, that although NPL ratio (NPLs to total loans) has fallen during
the period 2005 to 2014, but in terms of absolute figure, NPLs (gross) has actually more than
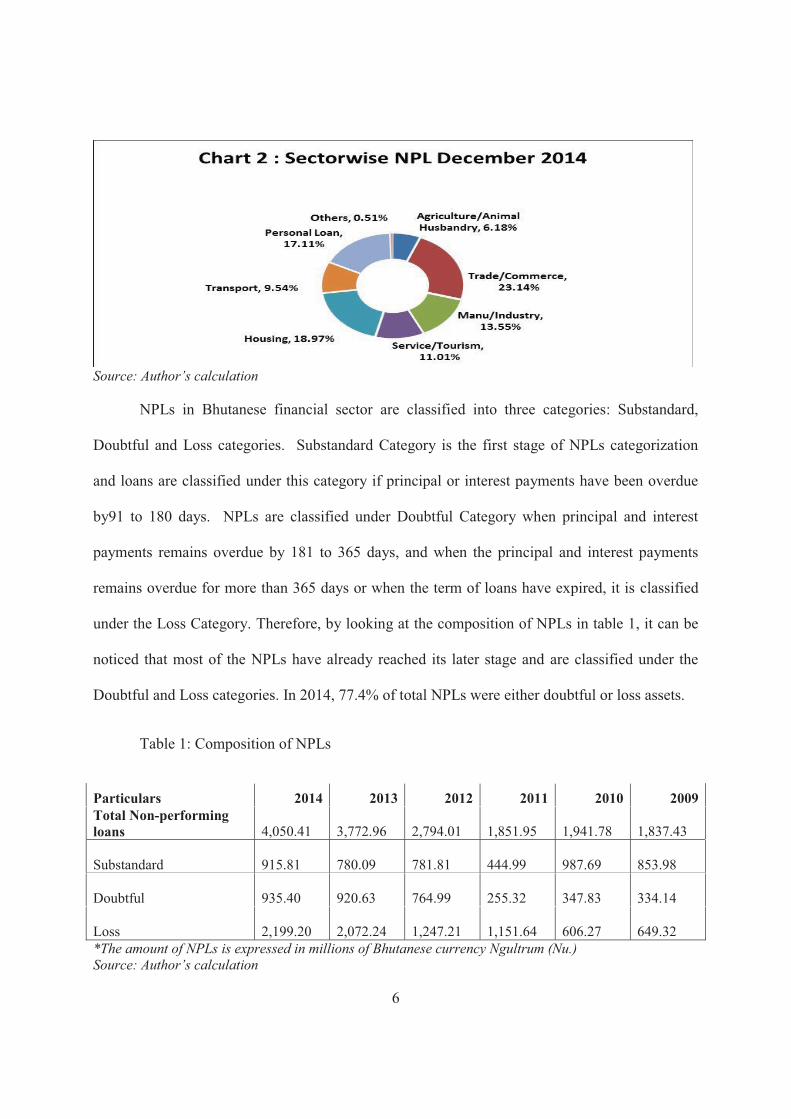
doubled, from Nu. 1.06 billion in 2005 to Nu. 4.05 billion in 2014. The increase in NPLs is seen
in Trade and Commerce sector (23.14 percent of total NPLs), Housing sector (18.97 percent of
total NPLs), Personal sector (17.11 percent of total NPLs) and Manufacturing and Industry
sector (13.55 percent of total NPLs). The NPLs in these four sectors also accounts for 70 percent
of the total NPLs for the period ended 2014. The following chart 2 shows the NPLs by sectors
for the period ended 2014.
11%
9%8%
9%
7%
5%4%
5%7% 6%
0%
2%
4%
6%
8%
10%
12%
-
10,000.00
20,000.00
30,000.00
40,000.00
50,000.00
60,000.00
70,000.00
2005 2006 2007 2008 2009 2010 2011 2012 2013 2014
In pe
rcent
Nu. in
milli
on
Chart 1 : NPLs and NPL ratio
NPLs Total loans NPL ratio
6
Source: Author’s calculation
NPLs in Bhutanese financial sector are classified into three categories: Substandard,
Doubtful and Loss categories. Substandard Category is the first stage of NPLs categorization
and loans are classified under this category if principal or interest payments have been overdue
by91 to 180 days. NPLs are classified under Doubtful Category when principal and interest
payments remains overdue by 181 to 365 days, and when the principal and interest payments
remains overdue for more than 365 days or when the term of loans have expired, it is classified
under the Loss Category. Therefore, by looking at the composition of NPLs in table 1, it can be
noticed that most of the NPLs have already reached its later stage and are classified under the
Doubtful and Loss categories. In 2014, 77.4% of total NPLs were either doubtful or loss assets.
Table 1: Composition of NPLs
Particulars 2014 2013 2012 2011 2010 2009 Total Non-performing loans
4,050.41
3,772.96
2,794.01
1,851.95
1,941.78
1,837.43
Substandard 915.81
780.09
781.81
444.99
987.69
853.98
Doubtful 935.40
920.63
764.99
255.32
347.83
334.14
Loss 2,199.20
2,072.24
1,247.21
1,151.64
606.27
649.32
*The amount of NPLs is expressed in millions of Bhutanese currency Ngultrum (Nu.) Source: Author’s calculation
7
In this regard, identifying the determinants of NPLs and monitoring them has become
important in Bhutanese financial sector to maintain financial stability and enable financial sector
to continuously support the economy and government’s vision.
3. Literature Review
Many studies have been undertaken in the past in different jurisdiction to study the causes
of NPLs. The findings from the past studies have helped in formulating appropriate policies for
averting financial crisis. NPLs besides affecting a single country would lead to a serious trouble
across the global economy (Adebola, Yousaff and Dahalan 2011). NPLs are main cause of
trouble, thereby affecting all the credit institutions to function properly (Pesola 2007). Therefore,
it is very imperative to understand the phenomena of NPLs in the banking literature.
Based on the past studies carried out for determining the causes of NPLs, there are two
main causes of NPLs within the banking sector. The first factor pertains to macroeconomic
conditions of a country which could affect borrowers’ capacity in repaying back their loans. The
second factor which affects NPLs is with regard to the bank-specific factors such as Loan
Growth, Return on Equity (ROE) etc. However, the findings of past studies supports for both
factors (Salas and Saurina 2002; Joseph and et al. 2012;Louzis, Vouldis, and Metaxas 2010). The
following section reviews the existing literature on the determinants of NPLs which will create a
basis to design a model to study the variables affecting NPLs in Bhutanese financial sector.
3.1 Macroeconomic factors
Some of the macroeconomic variables used in the past studies are Gross Domestic
Product (GDP), inflation, unemployment, exchange rate etc. The study carried out by Pasha and
Khamraj (2009) found out that for Guyanese banking sector, (i) GDP has a negative relationship

8
with NPLs indicating that deterioration of GDP would lead to increase in NPLs and vice-versa (ii)
the change in the exchange rate caused by the declining share in the international market leads to
increase in NPLs and (iii) banks that charge high interest rates also leads to increase in the NPLs.
However, this study revealed that inflation rate does not have any relationship with the NPLs in
case of Guyanese banking sector. Panel data model was used for this study. Saba, Kouser and
Azeem (2012) using regression analysis finds a negative relationship between GDP and NPLs in
case of US banking sector. For banks in Sub-Saharan African countries, macroeconomic factors
such as GDP, real effective exchange rate and real interest rate are also important determinants
of NPLs (Fofack 2005).This study finds that GDP has a negative relationship with NPLs
indicating that economic recession and downturns coupled with falling of GDP per capita is
likely to increase the NPLs. Any appreciation in real exchange rate could weaken the export of
the economy and thus exacerbate the banking crisis (increase in NPLs). Interest rate has positive
relationship with NPLs. A causality and pseudo-panel model was used for this study.
In case of Greek banking sector, macroeconomic factors specifically real GDP,
unemployment, and lending rates affects NPLs (Louzis, Vouldis, and Metaxas 2010). This study
employs panel data method for three different types of loans namely Consumer Loans, Business
Loans and Mortgages Loans. This study found out that GDP has negative association with NPLs
conforming that slowdown in economic growth will lead to higher NPLs while unemployment
has positive association to NPLs, indicating that rise in unemployment affects the repayment
capacity of borrowers. High lending rate also led to higher NPLs for Greek banking sector.
Makri, Tsagkanos and Bellas (2013) studied the causes of NPLs in Euro zone banking system
from of 2000 to 2008 using dynamic regression, just before the recession and finds that
macroeconomic factors such as public debt and unemployment positively affects the NPLs,
9
indicating that fiscal problems and lack of employment opportunities in Euro zone may lead to
higher NPLs, while GDP negatively affects NPLs indicating that during boom period, NPLs are
improved and vice-versa. However, this study reveals that inflation and budget deficit or surplus
does not affect NPLs.
Klein (2013) also studied NPLs for CESEE (Central, Eastern and South Eastern Europe)
using dynamic panel regression for the period 1998 to 2011. This study finds that besides GDP
negatively affecting NPLs and unemployment positively affecting NPLs, it also tends to increase
with a rise in inflation rate and with depreciation of exchange rate. The NPL ratio in Gulf
Cooperation Council region increases with low economic growth and high interest rates and risk
aversion (Espinoza and Prasad 2010). In both Spain and Italy, unemployment has a direct
relationship with NPLs while wage has an inverse relationship with NPLs (Bonilla
2012).However; this study revealed that GDP is affecting NPLs in an inverse direction in Spain
while it is affecting NPLs directly in Italy. Although there was no proper explanation for positive
relationship between NPLs and GDP in Italy, findings revealed that it may be due to the
recession which took place in Italy during the period under review. On the other hand, this study
also revealed that inflation rate is not explanatory variable of NPLs both in Spain and Italy
The study on banking sector in Pakistan revealed that GDP is inversely affecting the
NPLs while the inflation, exchange rate, interest rate and unemployment all directly affects the
NPLs (Farhan and et al. 2012). The correlation and regression analysis was used for this study.
However, the same study by Ahmad and Bashir (2013) using time series data, finds that
unemployment rate, real effective exchange rate and foreign direct investment are insignificant
to explain NPLs in Pakistani banking sector. As per this study, GDP, interest rate and inflation
are negatively related to NPLs while consumer price index is positively related with NPLs of

10
banks in Pakistan. The macroeconomic determinants of NPLs for Indian banks are savings
growth, GDP, interest rate and inflation (Prasanna 2014). Using panel data method, this study
finds that high GDP growth rate and high savings rate is associated with lower NPLs while the
high inflation and interest rates leads to higher NPLs.
GDP and unemployment rate have an inverse relationship with the NPLs of personal
loans of the banks in Kenya (Jerotich, Irene and Renny 2014). The main reason for negative
relationship between NPLs of personal loans and unemployment rate is that most of the personal
loans are only given to employed people and is collateralized against the pay slip resulting in
lesser chance of default. However, this study also revealed that inflation rate and interest rate
does not have any relationship with the NPLs. The regression analysis was used for this study.
3.2 Bank-specific factors
Besides the macroeconomic factors affecting the NPLs, past studies have also revealed
that bank-specific factors affects the NPLs in the banking sector. In case of public sector banks
in India, variables such as size of the bank, loan maturity and terms of credit like interest rate
significantly affect NPLs (Rajan and Dhal 2003). This study employs a panel regression for
empirical analysis and finds that interest rate have positive impact on NPLs while bank size and
loan maturity has negative impact on NPLs. However, Misra and Dhal (2010) in their study
found out that bank size is positively associated with NPLs for public sector banks in India. This
was mainly due to the balance sheet constraints. Small banks were able to manage it more
efficiently than large banks in terms of loan monitoring and recovery processes. The bank-
specific variables such as credit growth, capital ratio and bank size are affecting the NPLs in
Spanish banking sector (Salas and Saurina2002). This study uses panel data method covering for

11
a period of 4 years. Size of the bank is negatively related to NPLs in case of banks in Taiwan
(Hu and et al. 2004).
For banks in Ethiopia, Gezu (2014) carried out a study using the panel data from 2002 to
2013 and found out that Capital Adequacy Ratio (CAR) and Return on Equity (ROE) are
negatively related with NPLs, while Return on Assets (ROA) and lending rate is positively
affecting NPLs. However, this paper revealed that Credit to Deposit (CD) ratio and inflation does
not have any relationship with the NPLs of banks in Ethiopia. The quality of performance
indicators has impact on NPLs in Greek banking sector (Louzis, Vouldis, and Metaxas 2010).
This study found that ROA and ROE is significant and has negative relationship with NPLs for
mortgages and consumer loans in Greek banking sector. In addition, it was found that size of
banks is positively associated with NPLs indicating that smaller banks have low NPLs.
The study on NPLs of banking sector in Italy, Greece and Spain was carried out after the
subprime crisis in 2008 (Messai and Jouini 2013). This study used the panel data method and
revealed that return on assets (ROA) has a negative relationship with NPLs while interest rate
and unemployment has a positive relationship with NPLs. Godlewski (2004) studied credit risk
in emerging market economies (Central and Eastern Europe, Asia and South America) and finds
that ROA (profitability) and size has negative relationship with NPLs of banks in emerging
market economies. The author argues that high profitability seems to be refraining banks from
lending to more risky business. Cotugno, Stefanelli and Torluccio (2010) using panel data model
studied Italian banks and found out that default rates for Italian banks has a positive relationship
with the size of the banks (total assets) and negative relationship with ROA. However, this study
reveals that loan to asset ratio do not affect the NPLs. Study of NPLs in Euro zone banking
system by Makri, Tsagkanos and Bellas (2013) found out that Capital Adequacy Ratio (CAR)
12
and Return on Equity (ROE) are negatively related to NPLs, indicating that deterioration in
profitability ratio lead to higher NPLs, while the rate of NPLs of the previous year is positively
related to NPLs. However, this study revealed that ROA and Loan to Deposit ratio do not affect
the NPLs. For Southeastern European banks, size of the bank and ROA has negative relationship
with NPLs while solvency has positive relationship with NPLs (Curak, Pepur and Poposki 2013).
The finding of this study is indicating that big banks as compared to small banks are better in
handling the NPLs. In other words, large banks have in place robust credit appraisal and
monitoring (risk management) system. On the other hand, banks with high profits makes the
bank managers less involved in risky credit activities, thus less exposure to credit risk (low
NPLs).
In case of Albanian Banking System, NPLs are affected by bank-specific factors such as
(a) loan to asset ratio (b) loan level (c) net interest margin and (d) return on equity (Shingjergji
2013). This study revealed that Loan to Asset ratio is inversely related to NPLs, indicating that
majority of bank’s assets in the form of loans will lead to low NPL ratio. While, the loan level
and NPL ratio are positively related to each other, indicating that excessive lending or higher
level of loans will increase the NPL ratio. The net interest margin also affects NPL ratio
positively. However, Return on Equity (ROE) has a negative relationship with NPLs, indicating
that high profit will result in lower NPL ratio. Panel data regression model was used for this
study covering a period from 2002 to 2012. Pasha and Khamraj (2009) found that loan to asset
ratio is positively affecting NPLs in Guyanese banking sector. However, size of the bank was
found to be insignificant in explaining the variation of NPLs in Guyanese banking sector
indicating that big banks does not necessarily mean more effective in loan screening process as
compared to the small banks.

13
For banks in MENA (Morocco, Egypt, Tunisia, Algeria and United Arab Emirates)
region, high credit growth and provision for NPLs reduces NPLs (Boudriga, Taktak and Jellouli
2009).This study also reveals that ROA is negatively associated with NPLs indicating that
greater and efficient performance of banks reduces NPLs. However, the size (total assets) is not a
statistically significant in explaining NPLs in MENA region. Panel data regression method was
used for this study.
Although past studies indicated that both macroeconomic and bank-specific variables
affect NPLs, no literature is available for Bhutanese banks. Therefore, this paper intends to use
both factors to study the determinants of NPLs in Bhutanese financial sector.
4. Data and Methodology
4.1 Sample and Data
Sample data consists of three banks and one insurance company which has been involved
in lending activities since the time of its establishment and has been functioning like any other
banks in Bhutan. The three banks are (i) Bhutan National Bank Limited, (ii) Bank of Bhutan
Limited (iii) Bhutan Development Bank Limited and insurance company is the Royal Insurance
Corporation of Bhutan Limited (RICBL). This insurance company has been considered for this
study since it has a significant market share of total loans and competes with the banks in terms
of lending activities (loans). Majority of assets of this insurance company is also comprised of
loans (approximately 60 percent). Moreover, the Prudential Regulation (2002) of banks is also
applicable to insurance companies in Bhutan. Therefore, for the purpose of this study, hereafter
this insurance company (RICBL) shall be referred as banks in general. The period covered for
this study is ten years, from 2005 until 2014. The choice of the above mentioned four financial
institutions was not random since these four financial institutions are the oldest financial
14
institutions (for lending operation) in Bhutan with significant NPLs during the period under
review.
There are two sources of data used for this research. With regard to the bank-specific
factors, data was collected from Royal Monetary Authority of Bhutan (central bank) from 2005
till 2014. For macroeconomic factors, data was collected from National Statistical Bureau of
Bhutan’s data base covering a period of 2005 until 2014.The study uses both descriptive and
econometric analysis based on panel data approach to identify the causes of NPLs of financial
sector in Bhutan. This model is a balanced panel data and the software used is STATA version.
4.2 Study Variables
For the purpose of this study, dependent variable is NPLs. Macroeconomic independent
variables are GDP, unemployment rate and inflation rate. The bank-specific independent
variables in determining NPLs are ROA, ROE, CAR, Size (total assets) and Loan to Asset ratio.
These are explained below.
4.2.1 NPLs
NPLs for the purpose of this study shall be computed as follows;
NPL (ratio) = NPLs / Gross loans
As per the Prudential Regulation of Bhutan (2002), NPLs are defined as loans and advances
which remains unpaid for more than 90 days from the very first day of default.
4.2.2 Gross Domestic Product (GDP)
As revealed in most of the previous literature, GDP is expected to be inversely related to
NPLs (Pasha and Khamraj 2009; Saba, Kouser and Azeem 2012; Fofack 2005; Bonilla 2012),
indicating that a positive growth in a country will improve the standard of living of people with
better income that would also improve their debt repayment capacity. As a result, NPLs in the
15
banking sector would reduce to certain extent. For the purpose of this study, GDP is calculated as
the LN (natural log) of yearly nominal GDP.
4.2.3 Unemployment Rate
Unemployment is generally expected to have a direct relationship with the NPLs (Louzis,
Vouldis, and Metaxas 2010; Makri, Tsagkanos and Bellas 2013; Klein 2013; Bonilla 2012).
Higher unemployment affects the repayment abilities of the borrowers thereby increasing the
NPLs. On the other hand, if the economy is doing well with good rate of employment (low
unemployment), it is expected that NPLs of banks will decrease, as there will be increase in
individuals earning income, which will further increase their ability to repay back the loans to the
banks. For the purpose of this empirical study, yearly unemployment rate will be used.
4.2.4 Inflation Rate
Inflation is expected to have positive relationship with NPLs. In situation where inflation
rate exceeds the interest rate, individuals would be unlikely to save, investors would be unlikely
to invest or lenders to lend. This lack of credit in an economy could hamper economic activities
that would translate into increasing NPLs and financial instability. When there is an increase in
inflation, the borrowing cost becomes expensive which results in the increase of NPLs (Klein
2013; Curak, Pepur and Poposki 2013; Farhan and et al. 2012). However, some studies have also
found negative relationship between inflation and NPLs (Ahmad and Bashir 2013). Annual
inflation rate will be used for this study.
4.2.6 Profitability
Profitability may reflect the level of risk that banks are undertaking. Most of the previous
literature argues that banks with already high profits are usually less risk taker. Since their profits
are already high, banks are reluctant to lend to more risky businesses to generate further earnings.
16
As a result, those banks are exposed to less credit risk resulting in lower NPLs. On the other
hand, those banks struggling to make profits are tempted to lend to more risky and uncertain
businesses. This usually occurs when bank management is inefficient. Thus, higher bank
inefficiency leads to lower profitability and since they engage in more risky businesses, NPLs
are usually expected to rise. For the purpose of this paper, the following profitability ratios will
be used;
(a) Return on Asset (ROA)
ROA measures the efficiency of the bank management while using the bank assets to
make profits. Higher ROA indicates that assets of banks are being used efficiently for generating
earnings. Efficient banks will have robust risk management framework such as good credit
policy, proper evaluation and monitoring process, and efficient NPLs management framework
which will enable bank to generate more and stable earnings. Therefore, efficient bank will have
high profitability (ROA) with lower credit risk, thus with low NPLs(Messai and Jouini
2013;Godlewski2004;Curak, Pepur and Poposki 2013). However, Gezu (2011) found a positive
relationship between the ROA and the NPLs. ROA is computed as follows;
ROA= Profit after Tax / Average Total Assets
(b) Return on Equity (ROE)
ROE measures how much profit a bank is making with the money shareholders’ have
invested. It measures how efficient a bank can use the shareholders money to make profits and
grow the bank. High ROE is indicating that bank is using the shareholders’ money efficiently as
a result of robust risk management framework, which will result in low credit risk and hence low
NPLs. It is generally expected that there will be negative relationship between ROE and NPLs
(Makri, Tsagkanos and Bellas 2013;Gezu 2011;Shingjergji 2013). ROE is calculated as follows;

17
ROE= Profit after Tax/Average Capital Fund
4.2.7 Capital Adequacy Ratio (CAR)
CAR reflects the capital strength of banks and acts as a buffer to meet any unexpected
losses in the banking sector. In other words, banks must set apart capital according to their risk
profile. This ensures that the absolute measure of capital kept by banks is sufficient under all
conditions. The implication of CAR on NPLs is ambiguous. Some studies has shown a CAR
having an inverse relationship with the NPLs (Gezu 2011; Makri, Tsagkanos and Bellas 2013),
while some studies revealed a positive relationship with the NPLs (Djiogap and Ngomsi 2012).
In some jurisdiction, CAR is also not a significant variable in determining the NPLs (Shingjergji
2013). CAR is calculated as follows;
CAR= Capital Fund/Total Risk-Weighted Assets
4.2.8 Size (Total Assets)
The effect of the size of the bank on NPLs is also ambiguous. Some studies has shown
that there exist a negative relationship with NPLs (Rajan and Dhal 2003; Hu and et al.
2004;Godlewski2004;Curak, Pepur and Poposki 2013) indicating that large banks will have the
ability to deal with NPLs in terms of its risk management practices as compared to the small
banks. However, some past studies has also shown that bank size is positively associated with
NPLs (Misra and Dhal 2010; Louzis, Vouldis, and Metaxas 2010; Cotugno, Stefanelli and
Torluccio2010) indicating that large banks are inefficient in managing NPLs than small banks.
Therefore, large banks will have more NPLs and vice-versa. For the purpose of this study, the
assets of a bank (balance sheet) shall be considered as the size of the banks.

18
4.2.9 Loan to Asset Ratio
Loan to Asset ratio is the composition of total loans from total assets. It is generally
expected that if most of the assets are comprised of loans, NPLs will rise. In other words, NPLs
and loan to asset ratio are positively associated to each other (Pasha and Khamraj 2009).
However, some studies have shown Loan to Asset ratio having a negative relationship with
NPLs (Shingjergji 2013), while some studies revealed that Loan to Asset ratio is not statistically
significant (Cotugno, Stefanelli and Torluccio2010). For the purpose of this study, Loan to
Asset ratio is computed as follows;
Loan to Asset ratio= Total Loans/Total Assets
The table 2 below shows the summary of expected sign for the following macroeconomic and
bank-specific factors of NPLs.
Table 2: Summary of expected signs for macroeconomic and bank-specific factors
Variables Expected sign Nominal GDP (-)
Unemployment rate (+)
Inflation rate (+) / (-) Return on Asset Ratio (-)
Return on Equity Ratio (-)
Capital Adequacy Ratio (+) / (-)
Size (+) / (-)
Loan to Asset Ratio (+)
4.3 Model Specification
Panel data regression model will be applied to study the determinants of NPLs in
Bhutanese financial sector (Pasha and Khamraj 2009; Louzis, Vouldis, and Metaxas 2010; Klein
19
2013; Curak, Pepur and Poposki 2013; Prasanna 2014; Gezu 2011; Messai and Jouini 2013;
Cotugno, Stefanelli and Torluccio 2010; Shingjergji 2013). Model estimated for this study is as
follows:
t= 0 + 1GDPt + 2UNEMPt + 3INFLNt+ 4ROAt+ 5ROEt 6CARt 7SIZEt +
8LOANTOASTt+ μ
NPLt denotes NPL ratio in time period “t”. 0is an intercept. 1GDPtis nominal GDP in time “t”
and its coefficient, 2UNEMPtis the unemployment rate in time “t” and its coefficient, 3INFLNt
is inflation rate in time “t” and its coefficient, 4ROAt is return on assets ratio in time “t” and its
coefficient, 5ROEt is return on equity ratio in time “t” and its coefficient, 6CARtis the capital
adequacy ratio in time “t” and its coefficient, 7SIZEt is bank size (total assets) in time “t” and
its coefficient and 8LOANTOASTt stands for loan to asset ratio in time “t” and its coefficient. μ
is the error term.
4.4 Research Hypothesis
The following hypotheses are formulated for the purpose of this study;
H1: GDP has a negative relationship with NPLs
H2: Unemployment rate has a positive relationship with NPLs
H3: Inflation rate has a positive relationship with NPLs
H4: ROA has a negative relationship with NPLs
H5: ROE has a negative relationship with NPLs
H6: CAR has a negative relationship with NPLs
H7: Bank size a has positive relationship with NPLs
H8: Loan to Asset ratio has a positive relationship with NPLs
20
5. Data Analysis and Findings
5.1 Descriptive data
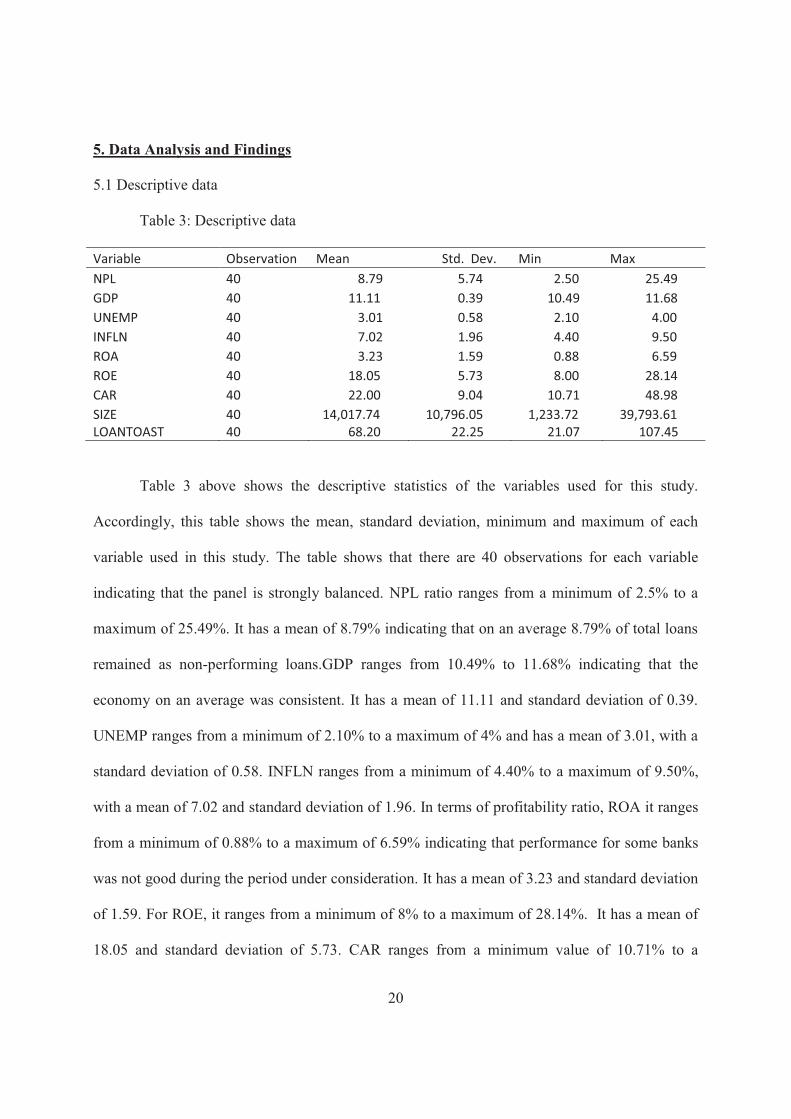
Table 3: Descriptive data
Variable Observation Mean Std. Dev. Min Max NPL 40 8.79 5.74 2.50 25.49 GDP 40 11.11 0.39 10.49 11.68 UNEMP 40 3.01 0.58 2.10 4.00 INFLN 40 7.02 1.96 4.40 9.50 ROA 40 3.23 1.59 0.88 6.59 ROE 40 18.05 5.73 8.00 28.14 CAR 40 22.00 9.04 10.71 48.98 SIZE 40 14,017.74 10,796.05 1,233.72 39,793.61 LOANTOAST 40 68.20 22.25 21.07 107.45
Table 3 above shows the descriptive statistics of the variables used for this study.
Accordingly, this table shows the mean, standard deviation, minimum and maximum of each
variable used in this study. The table shows that there are 40 observations for each variable
indicating that the panel is strongly balanced. NPL ratio ranges from a minimum of 2.5% to a
maximum of 25.49%. It has a mean of 8.79% indicating that on an average 8.79% of total loans
remained as non-performing loans.GDP ranges from 10.49% to 11.68% indicating that the
economy on an average was consistent. It has a mean of 11.11 and standard deviation of 0.39.
UNEMP ranges from a minimum of 2.10% to a maximum of 4% and has a mean of 3.01, with a
standard deviation of 0.58. INFLN ranges from a minimum of 4.40% to a maximum of 9.50%,
with a mean of 7.02 and standard deviation of 1.96. In terms of profitability ratio, ROA it ranges
from a minimum of 0.88% to a maximum of 6.59% indicating that performance for some banks
was not good during the period under consideration. It has a mean of 3.23 and standard deviation
of 1.59. For ROE, it ranges from a minimum of 8% to a maximum of 28.14%. It has a mean of
18.05 and standard deviation of 5.73. CAR ranges from a minimum value of 10.71% to a
21
maximum of 48.98% with a mean of 22 and standard deviation of 9.04. SIZE ranges from a
minimum of 1233.72 to a maximum of 39793.61. It has a mean of 14017.74 and standard
deviation of 10796.05. With regard to LOANSTOAST, it ranges from a minimum value of
21.07% to 107.45% with its mean of 68.2 and standard deviation of 22.25.
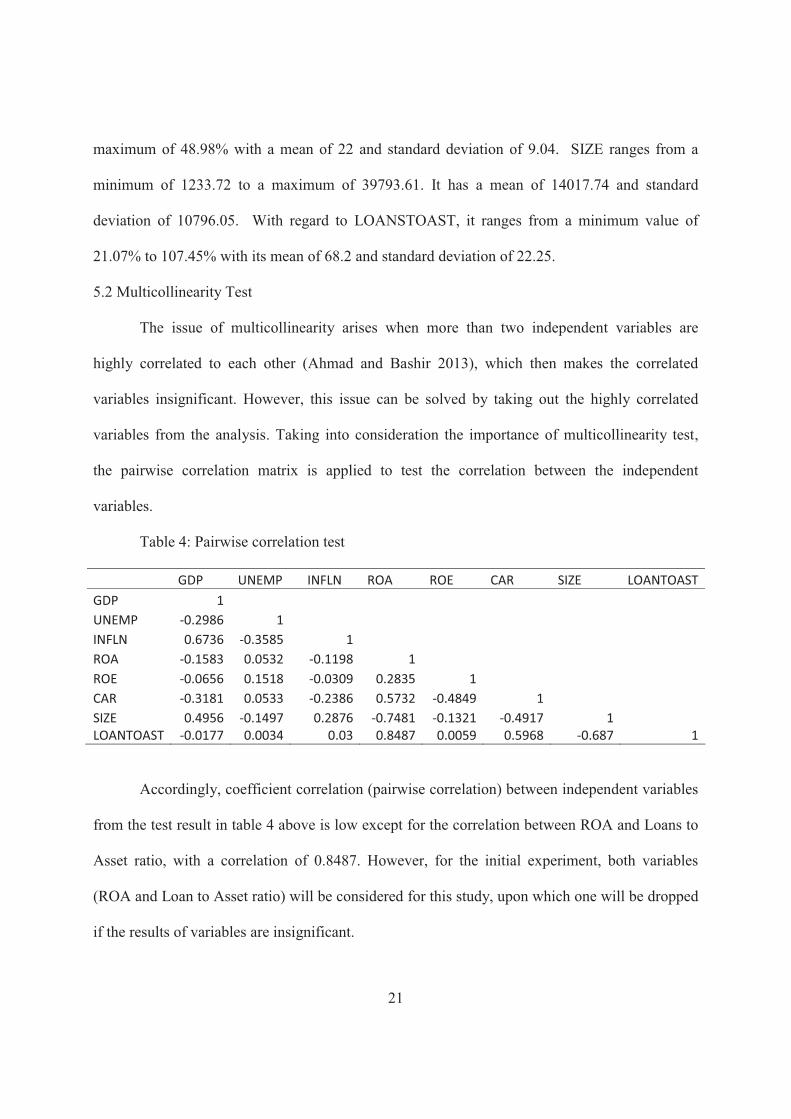
5.2 Multicollinearity Test
The issue of multicollinearity arises when more than two independent variables are
highly correlated to each other (Ahmad and Bashir 2013), which then makes the correlated
variables insignificant. However, this issue can be solved by taking out the highly correlated
variables from the analysis. Taking into consideration the importance of multicollinearity test,
the pairwise correlation matrix is applied to test the correlation between the independent
variables.
Table 4: Pairwise correlation test
GDP UNEMP INFLN ROA ROE CAR SIZE LOANTOAST GDP 1 UNEMP -0.2986 1 INFLN 0.6736 -0.3585 1 ROA -0.1583 0.0532 -0.1198 1 ROE -0.0656 0.1518 -0.0309 0.2835 1 CAR -0.3181 0.0533 -0.2386 0.5732 -0.4849 1 SIZE 0.4956 -0.1497 0.2876 -0.7481 -0.1321 -0.4917 1 LOANTOAST -0.0177 0.0034 0.03 0.8487 0.0059 0.5968 -0.687 1
Accordingly, coefficient correlation (pairwise correlation) between independent variables
from the test result in table 4 above is low except for the correlation between ROA and Loans to
Asset ratio, with a correlation of 0.8487. However, for the initial experiment, both variables
(ROA and Loan to Asset ratio) will be considered for this study, upon which one will be dropped
if the results of variables are insignificant.
22
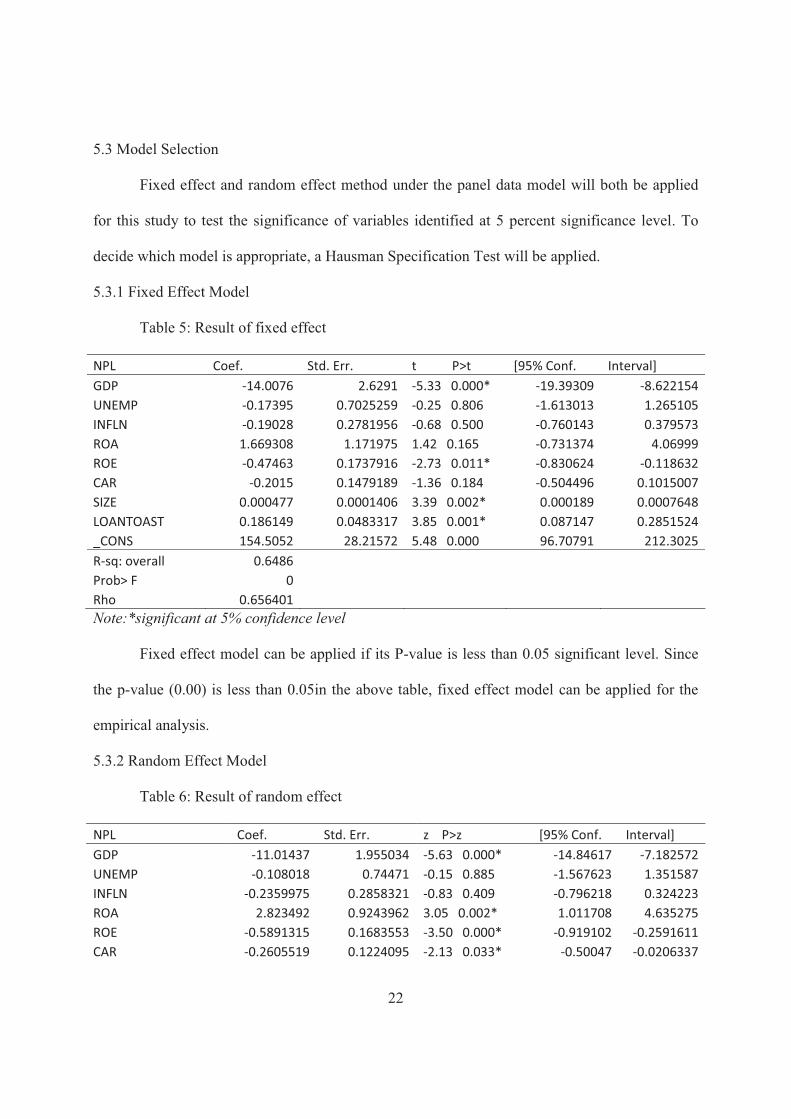
5.3 Model Selection
Fixed effect and random effect method under the panel data model will both be applied
for this study to test the significance of variables identified at 5 percent significance level. To
decide which model is appropriate, a Hausman Specification Test will be applied.
5.3.1 Fixed Effect Model
Table 5: Result of fixed effect
NPL Coef. Std. Err. t P>t [95% Conf. Interval] GDP -14.0076 2.6291 -5.33 0.000* -19.39309 -8.622154 UNEMP -0.17395 0.7025259 -0.25 0.806 -1.613013 1.265105 INFLN -0.19028 0.2781956 -0.68 0.500 -0.760143 0.379573 ROA 1.669308 1.171975 1.42 0.165 -0.731374 4.06999 ROE -0.47463 0.1737916 -2.73 0.011* -0.830624 -0.118632 CAR -0.2015 0.1479189 -1.36 0.184 -0.504496 0.1015007 SIZE 0.000477 0.0001406 3.39 0.002* 0.000189 0.0007648 LOANTOAST 0.186149 0.0483317 3.85 0.001* 0.087147 0.2851524 _CONS 154.5052 28.21572 5.48 0.000 96.70791 212.3025 R-sq: overall 0.6486 Prob> F 0 Rho 0.656401 Note:*significant at 5% confidence level
Fixed effect model can be applied if its P-value is less than 0.05 significant level. Since
the p-value (0.00) is less than 0.05in the above table, fixed effect model can be applied for the
empirical analysis.
5.3.2 Random Effect Model
Table 6: Result of random effect
NPL Coef. Std. Err. z P>z [95% Conf. Interval] GDP -11.01437 1.955034 -5.63 0.000* -14.84617 -7.182572 UNEMP -0.108018 0.74471 -0.15 0.885 -1.567623 1.351587 INFLN -0.2359975 0.2858321 -0.83 0.409 -0.796218 0.324223 ROA 2.823492 0.9243962 3.05 0.002* 1.011708 4.635275 ROE -0.5891315 0.1683553 -3.50 0.000* -0.919102 -0.2591611 CAR -0.2605519 0.1224095 -2.13 0.033* -0.50047 -0.0206337
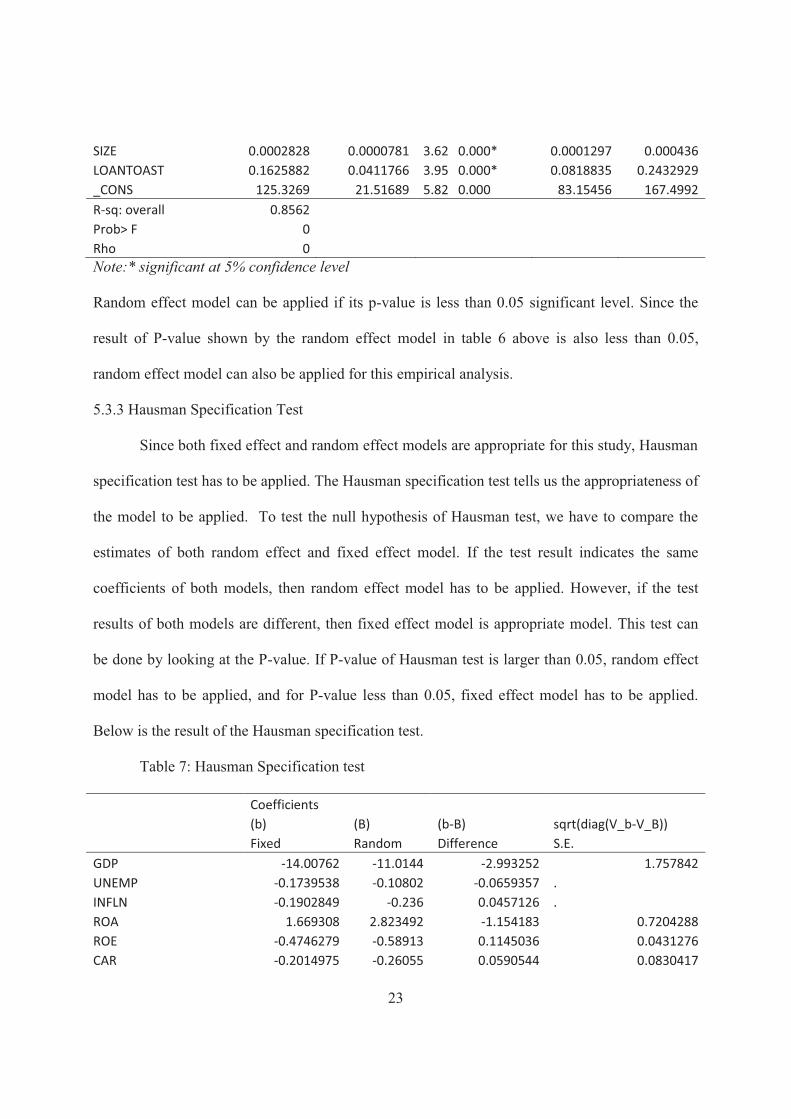
23
SIZE 0.0002828 0.0000781 3.62 0.000* 0.0001297 0.000436 LOANTOAST 0.1625882 0.0411766 3.95 0.000* 0.0818835 0.2432929 _CONS 125.3269 21.51689 5.82 0.000 83.15456 167.4992 R-sq: overall 0.8562 Prob> F 0 Rho 0 Note:* significant at 5% confidence level
Random effect model can be applied if its p-value is less than 0.05 significant level. Since the
result of P-value shown by the random effect model in table 6 above is also less than 0.05,
random effect model can also be applied for this empirical analysis.
5.3.3 Hausman Specification Test
Since both fixed effect and random effect models are appropriate for this study, Hausman
specification test has to be applied. The Hausman specification test tells us the appropriateness of
the model to be applied. To test the null hypothesis of Hausman test, we have to compare the
estimates of both random effect and fixed effect model. If the test result indicates the same
coefficients of both models, then random effect model has to be applied. However, if the test
results of both models are different, then fixed effect model is appropriate model. This test can
be done by looking at the P-value. If P-value of Hausman test is larger than 0.05, random effect
model has to be applied, and for P-value less than 0.05, fixed effect model has to be applied.
Below is the result of the Hausman specification test.
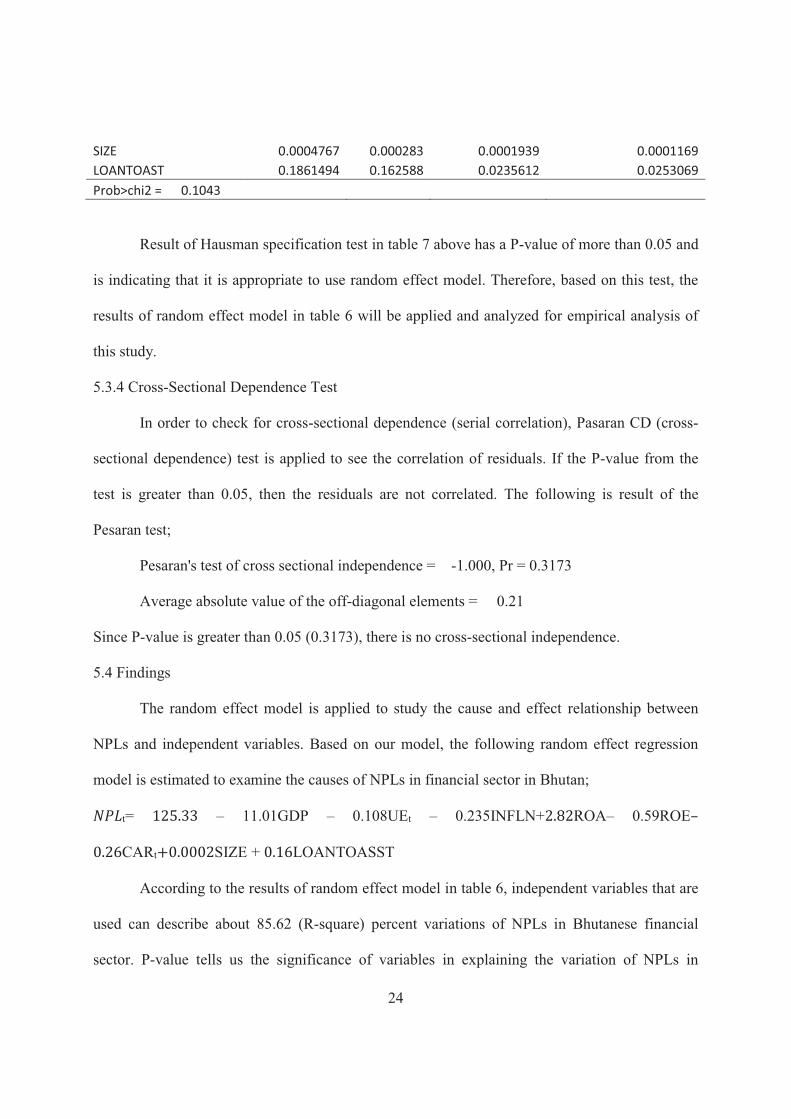
Table 7: Hausman Specification test
Coefficients (b) (B) (b-B) sqrt(diag(V_b-V_B))
Fixed Random Difference S.E. GDP -14.00762 -11.0144 -2.993252 1.757842 UNEMP -0.1739538 -0.10802 -0.0659357 . INFLN -0.1902849 -0.236 0.0457126 . ROA 1.669308 2.823492 -1.154183 0.7204288 ROE -0.4746279 -0.58913 0.1145036 0.0431276 CAR -0.2014975 -0.26055 0.0590544 0.0830417
24
SIZE 0.0004767 0.000283 0.0001939 0.0001169 LOANTOAST 0.1861494 0.162588 0.0235612 0.0253069 Prob>chi2 = 0.1043
Result of Hausman specification test in table 7 above has a P-value of more than 0.05 and
is indicating that it is appropriate to use random effect model. Therefore, based on this test, the
results of random effect model in table 6 will be applied and analyzed for empirical analysis of
this study.
5.3.4 Cross-Sectional Dependence Test
In order to check for cross-sectional dependence (serial correlation), Pasaran CD (cross-
sectional dependence) test is applied to see the correlation of residuals. If the P-value from the
test is greater than 0.05, then the residuals are not correlated. The following is result of the
Pesaran test;
Pesaran's test of cross sectional independence = -1.000, Pr = 0.3173
Average absolute value of the off-diagonal elements = 0.21
Since P-value is greater than 0.05 (0.3173), there is no cross-sectional independence.
5.4 Findings
The random effect model is applied to study the cause and effect relationship between
NPLs and independent variables. Based on our model, the following random effect regression
model is estimated to examine the causes of NPLs in financial sector in Bhutan;
t= – 11.01GDP – 0.108UEt – 0.235INFLN+ ROA– 0.59ROE
CARt SIZE + LOANTOASST
According to the results of random effect model in table 6, independent variables that are
used can describe about 85.62 (R-square) percent variations of NPLs in Bhutanese financial
sector. P-value tells us the significance of variables in explaining the variation of NPLs in
25
Bhutanese financial sector. Each variable is significant if the P-value indicated by random effect
model in table 6 is less than 0.05 significant levels. A random effect model result indicates that
except for unemployment and inflation rate, all remaining variables are significant at 0.05
significant level and it affects NPLs of Bhutanese financial sector. For unemployment and
inflation rate, their P-value is more than 0.05 significant level and cannot explain the variation of
NPLs in Bhutanese financial sector. From the eight independent variables that were used GDP,
unemployment rate, inflation rate, ROE and CAR has negative coefficients indicating negative
relationship with NPLs although inflation and unemployment rate are insignificant. Variables
such as ROA, size and loan to asset ratio has positive coefficients indicating a positive
relationship with NPLs.
6. Discussion and Analysis
Most observation in this paper agrees with past studies carried out on the causes of NPLs.
The relationship of NPLs to independent variables with regard to the research hypothesis is as
follows;
H1: GDP with a P-value of 0.00 (0.05 significant level) as indicated by random effect
model in table 6 is significant and has a negative coefficient of 11.01. Thus, the hypothesis of
GDP having a negative relationship with NPLs is accepted. The negative coefficient of 11.01
shows strong effect of GDP on NPLs, indicating that for 1 unit change in GDP other things
remaining same will result in 11.01 unit changes in NPLs in the opposite direction. It is
indicating that during the booming period with high GDP, everyone (individuals as well as firms)
in an economy will be better off with increase in income that will also help in repaying their debt.
As a result, NPLs of banks will decrease with increase in GDP. However, the decline in GDP
during recession will affect the income of every individual and firms, thus distorting their debt
26
repayment capacity. This results in increase in NPLs of banks. This research hypothesis is in
consistent with the findings of past literature on determinants of NPLs such as Pasha and
Khamraj (2009), Saba, Kouser and Azeem (2012), Fofack (2005) and Bonilla (2012).
H2: Macroeconomic variable, unemployment rate is insignificant (P-value of 0.88) and
does not affect NPLs of Bhutanese financial sector. This result is in contradiction with most of
the previous studies since different countries have its own variable which affects the NPLs.
Therefore, this research paper fails to accept the hypothesis of NPLs having positive relationship
with unemployment rate. This is because; (i) Banks in Bhutan do not give loans to the people
who are unemployed and (ii) most of the current loans in Bhutan are well collateralized,
therefore, the loans can be easily recovered from the collateral in case of the borrowers becoming
unemployed.
H3: Inflation rate which is also macroeconomic variable is insignificant with a P-value of
0.41and does not affect the NPLs in Bhutanese financial sector. Therefore, hypothesis of having
positive relationship between NPLs and inflation rate cannot be accepted. However, the studies
of Pasha and Khamraj (2009), Makri, Tsagkanos and Bellas (2013) and Jerotich, Irene and
Renny (2014) also revealed that the inflation is insignificant in explaining NPLs.
H4: Although ROA is significant with its P-value of 0.002, it contradicted with the
hypothesis of NPLs having a negative relationship with ROA. The result of random effect model
in table 6 shows a positive relationship between ROA and NPLs with a coefficient of 2.82. It is
indicating that for every 1 unit change in ROA, NPLs will also change in a same direction
(positively related) by 2.82 units. In general, it is expected that when ROA (profitability) of
banks is high, they are usually less pressurized in generating earnings by engaging in more risky
businesses as a result of which NPLs will decrease and vice-versa. However, the situation is

27
different in case of Bhutanese financial sector. The bank profitability measured in terms of ROA
may result from high lending rates, fees, commission and charges that will lead bank grow in
terms of its size and profitability. This growth in profitability (ROA) may encourage banks to
engage in all sorts of credit activities including credit to risky businesses as a result of which
NPLs is also expected to increase. In this regard, the result indicated that ROA is directly related
to NPLs, and is in consistent with the study conducted by Gezu (2011) for Ethiopian banking
sector.
H5: ROE has a P-value of 0.00 and a negative coefficient of 0.58. It is therefore,
significant as indicated by table 6, thus accepting the hypothesis of NPLs having a negative
relationship with ROE. It is indicating that 1 unit change in ROE with other things remaining
constant will result in change in NPLs by 0.58 units in opposite direction. In other words, if there
is 1 unit positive increase in ROE, NPLs will decrease by 0.58 units. It implies that when
profitability is measured in terms of ROE, deterioration of ROE leads to higher NPLs and
improvement of ROE leads to lower NPLs. This result is indicating about the bank behavior. Bad
management of banks will engage shareholders money into risky businesses as a result of which
there will be an increase in NPLs. This result of negative relationship between ROE and NPLs is
in consistent with Makri, Tsagkanos and Bellas (2013), Gezu (2011), Shingjergji (2013) and
Louzis, Vouldis and Metaxas (2010).
H6: The random effect result of CAR in table 6 with its P-value of 0.033 is significant in
explaining NPLs in Bhutanese financial sector. It has a negative coefficient of 0.26 which is in
consistent with the hypothesis of NPLs having a negative relationship with CAR. It is indicating
for every 1 unit change in CAR, NPLs will also change by 0.26 units but in an opposite direction.
Generally, the CAR of banks changes when there is a change in capital fund or in total risk-
28
weighted assets of banks. In other words, CAR increases when either capital fund of banks
increases (through injecting new capital or through increasing retained earnings) or when total
risk-weighted assets of banks decreases. In case of Bhutanese financial sector, risk-weight is
assigned to each category of assets based on their level of riskiness. For loans, the risk-weight is
assigned based on the riskiness by sector. Therefore, this result of negative relationship is
indicating that banks that diversify their risks or banks which have robust risk management
framework will result in lower NPLs. This result is in consistent with Gezu (2011),Makri,
Tsagkanos and Bellas(2013).
H7: The random effect result of variable Size in table 6 is significant with its P-value of
0.00 and a positive coefficient of 0.00028. This result of positive coefficient is corroborating
with the hypothesis of NPLs having a positive relationship with Size. It is indicating that for 1
unit change in Size, NPLs will also change in a same direction by 0.00028 units. This implies
that when banks grows in terms of its size, they tend to engage (provide loans) in more risky and
sophisticated businesses which becomes very difficult for banks to monitor loans both in terms
of addressing and preventing NPLs. It becomes difficult for large banks to transfer their
customers’ information (financial statements, business progress, skills and management
capabilities) to its lending mechanism and risk management framework as a result of which
NPLs increases. Therefore, there is more probability for large banks to have more NPLs. This
hypothesis is in consistent with the studies conducted by Misra and Dhal (2010), Louzis, Vouldis,
and Metaxas (2010), Cotugno, Stefanelli and Torluccio (2010).
H8: The variable Loan to Asset ratio as indicated by random effect model in table 6 has a
P-value of 0.00 and is therefore significant in explaining the variation of NPLs in Bhutanese
financial sector. Its positive coefficient of 0.162 is in consistent with the hypothesis of NPLs
29
having a positive relationship with Loan to Asset Ratio. It is indicating that when majority of
bank’s assets are comprised of loans, NPLs tends to rise. As of December 2014, approximately
75 percent of total assets within the Bhutanese financial sector are comprised of loans, as a result
of which the Loan to Asset ratio remains high and probability of increase in the NPLs is also
high. Accordingly, when there is 1 unit change in Loan to Asset Ratio, NPLs also change by 0.16
units in a same direction. Therefore, hypothesis of NPLs having a positive relationship to Loan
to Asset Ratio is in consistent with the study conducted by Pasha and Khamraj (2009).
7. Conclusion and Recommendation
7.1 Conclusion
This paper intended to study the causes of NPLs of financial sector in Bhutan for the
period of 10 years from 2005 to 2014 by using a panel dataset and random effect model.
Although research findings indicated that NPLs in Bhutanese financial sector are caused both by
external (macroeconomic variables) and internal (bank-specific variables) factors, most of the
NPLs is attributed to internal factors. With regard to the macroeconomic variables, the finding of
this study indicated that only GDP affects the NPLs of Bhutanese financial sector. The result has
shown a negative relationship between GDP and NPLs. An economic recession can lead to
financial instability by reducing the borrowers’ income and impairing the ability to repay the
loans. In other words, strong positive growth in the economy results in lower NPLs. The other
two variables namely Unemployment rate and Inflation rate have revealed insignificant effect
and thus cannot be considered for studying the causes of NPLs of financial sector in Bhutan.
With regard to the bank-specific variables, ROA, ROE, CAR, Size and Loan to Asset
Ratio all affects NPLs of Bhutanese financial sector. Profitability ratios measured in terms of
ROA and ROE yielded different results. The random effect model revealed that profit when
30
measured in terms of ROA has a positive relationship with NPLs indicating that banks in Bhutan
are less incentive to increase their earnings through effective utilization of assets. This indicates
the inefficiency measures of banks in terms of asset utilization, thereby emphasizing on robust
risk management systems and procedures for effective utilization of its assets to generate stable
earnings without any risk or losses. However, profitability when measured in terms of ROE
revealed an inverse relationship with NPLs, indicating that banks in Bhutan are at least
effectively managing the funds of shareholders. The study also found out that CAR is negatively
associated with NPLs in Bhutanese financial sector indicating that well capitalized banks will
have a capacity to absorb potential loan losses through effective utilization of its capital thereby
reducing NPLs. The RMA requires all banks (including insurance companies) in Bhutan to
maintain a minimum CAR of 10 percent at all times.
Impact of Size on NPLs of Bhutanese financial sector has been analyzed. The random
effect model revealed that Size of banks is positively associated with NPLs indicating that larger
banks in Bhutan appear to be more inefficient in terms of monitoring and recovery processes of
NPLs. This situation can be attributed to a greater organizational complexity of large banks as
compared to small banks and as a result it leads to higher NPLs. With regard to Loans to Asset
ratio, the random effect model indicated that NPLs has a positive relationship to Loans to Asset
ratio. The high proportion of total assets in the form of loans is mainly due to lack of investment
avenues for banks and financial institutions in Bhutan except for the investment in loans. At
present, the financial markets including debt and equity markets have limited scope in Bhutan.
As a result, excessive lending by banks especially to risky (sub-prime) borrowers can lead to
higher NPLs, deleveraging and market illiquidity, and thus a credit crunch.
31
The results indicate that banks in Bhutan should take into consideration many factors
while approving the loans in order to control the level of NPLs. The banks should take into
account the performance of an economy while sanctioning loans since the flow of credit is
related to business cycles. During economic boom, credit tends to grow very rapidly while it
decelerates during economic slowdown. In particular, periods of economic boom witness
excessive credit growth, generally associated with irrational exuberance and dilution of lending
standards. The realistic risk position becomes evident with deterioration of asset quality during
economic slowdown. To this end, banks are required to maintain high CAR to cushion against
any unexpected losses. This requirement may lead the banks to decrease their lending (assets)
instead of increasing the magnitude of capital. This decrease in lending and the resultant
stagnation in economic activities exacerbate the economic crisis, in turn worsening the financial
crisis.
7.2 Recommendation
With steady growth of the financial system and innovations in the financial sector, the
dynamics of financial risks and vulnerabilities also changes. Banking sector in Bhutan is
continually devising new forms of activity that create new risk. Central bank is therefore
challenged to develop robust and effective means to address these challenges. Since central bank
still practices Basel I accord for Bhutanese bank supervision that sets out minimum capital
requirement to minimize credit risk, it has become apparent that this approach of banking
supervision is becoming inadequate both in context and focus. Therefore, it is recommended to
the central bank to revisit its current supervision approach and put in effort towards the
development of risk-based supervision/management framework under the Basel II and III
Accords. Basel Accords issued by the Basel Committee on Banking Supervision sets out the

32
international standards on capital requirements to safeguard the banks from financial risks.
Targeting key risks in a bank under the Basel II Accord and thus customizing the supervisory
stance to the nature of the bank also means that we are not only better placed to manage
individual bank but also to tackle systemic issues that could threaten financial stability in a more
effective manner. Financial institutions that fail to assess risk and do not install risk management
system in their products would increase the NPLs and can put many financial institutions into
problems. Credit concentration can also cause problems to most of the banks affecting their
capital fund (CAR) and assets. Although, banks are aware of their credit concentrations, however,
due to robust competition, such caution may reduce. Therefore, proper risk management
supervision framework is essential for the survival of banking sector in Bhutan.
Risk management framework is a structured approach to manage uncertainty regarding
business operations so as to minimize losses, through a sequence of logical steps including: risk
identification, assessment of risk, monitoring and strategies to manage risk using various
techniques with the help of managerial and technology resources. Therefore, robust risk
management framework in place will enable banks to measure, monitor and control the total risk
on their balance sheet to minimize losses as well as to enable bank to use effectively the
recourses/capital. The adoption of risk-based supervision framework would strengthen financial
stability of banking industry as well as support a modern economy that will boost public
confidence and financial sector resilience.
33
References
Adebola, S. S., Wan Yusoff, S. b., &Dahalan, D. J. 2011. An ARDL approach to the
determinants of nonperforming loans. Kuwait Chapter of Arabian Journal of Business
and Management Review, Vol. 1, No.2;
Ahmad, Fawad and Bashir, Taqadus. 2013. Explanatory power of macroeconomic variables as
determinants of non-performing loans; evidence form Pakistan. World Applied Sciences
Journal 22 (2): 243-255.
Bank for International Settlement.Basel II Revised international capital framework.On Bank for
International Settlement, Accessed on 31/11/2015.http://www.bis.org/publ/bcbsca.htm
Bank for International Settlement.International regulatory framework for banks (Basel III).
OnBank for International Settlement, Accessed on: 31/11/2015.
http://www.bis.org/bcbs/basel3.htm
Bhutan at glance. Assessed from http://www.nsb.gov.bt/publication/publications.php?id=5
Bonilla, Carlos A.O. 2012. Macroeconomic determinants of the non-performing loans in Spain
and Italy.
Boudriga, Abdelkader, Taktak, Neila B. and Jellouli, Sana. 2009. Bank specific, business and
institutional environment determinants of nonperforming loans: evidence from MENA
countries.
Brownbridge, Martin. 1998. The causes of financial distress in local banks in Africa and
implications for prudential policy. UNCTAD/OSG/DP/132
34
Chijoriga M. M. 1997. An application of credit scoring and financial distress prediction models
to commercial Bank Lending: The case of Tanzania. Ph.D Dissertation
Wirtschaftsuniversitatwien (WU) Vienna.
Cotugno, Matteo, Stefanelli, Valeria and Torluccio, Guiseppe. 2010. Bank intermediation models
and portfolio default rates: What’s the relation? SSRN Electronic Journal 08/2010;
DOI: 10.2139/ssrn.1662888
Curak, Marijana, Pepur, Sandra and Poposki, Klime. 2013. Determinants of non-performing
loans – evidence from southeastern European banking systems. Banks and Bank Systems,
Volume 8, Issue 1
DjiogapFouopi and NgomsiAugustin. 2012. Determinants of Bank Long-Term Lending
Behaviorin the Central African Economic and Monetary Community (CEMAC), Review
ofEconomics&Finance; 1923-7529-2012-02-107-08,
Espinoza, Raphael and Prasad, Ananthakrishnan. 2010. Nonperforming loans in the GCC
banking system and their macroeconomic effects. WP/10/224
Fargan, Muhammad, Sattar, Ammara, Chaudhry, Abrar H. and Khalil, Fareeha. 2012
Economic determinants of non-performing loans: Perception of Pakistani bankers.
European Journal of Business and Management.ISSN 2222-1905. Volume 4, No.19,
2012
Fofack, Hippolyte. 2005. Nonperforming loans in sub-Saharan Africa: causal analysis and
macroeconomic implications. World Bank Policy Research Working Paper 3769.
Gezu, Gadise. 2014. Determinants of nonperforming loans: Empirical study in case of
commercial banks in Ethiopia. Jimma University
Godlewski, C. (2004), Capital Regulation and Credit Risk Taking: Empirical Evidence from

35
Banks in Emerging Market Economies.Finance 0409030, EconWPA.
Greuning, Hennie van and Bratanovic, Sonja B. 2003. Analyzing and managing banking risk.
Framework for assessing corporate governance and financial risk.
Guy, Kester. 2011. Economic Review Volume XXXVII, Number 1. February 2011. Central Bank
of Barbados.Page:10-18
Hou, Dickinson. 2007. Research conference on safety and efficiency of the financial system.
Euro-Philippines Network in Banking & Finance Enhancing Teaching and
Research.Asianlink/ASIE/B7-3010/2005/105-139
Hu, J.L., Li, Y., Chiu, Y.H. (2004), Ownership and nonperforming loans: Evidence from
Taiwan’s banks. The Developing Economies, 42(3), 405-420.
Jerotich, Kangogo N, Irene, Asienga and Renny, Mutai. 2014. Determinants of non-performing
personal loans in Kenya’s banking industry: An econometric case study of tier one banks.
Journal of Emerging Issues in Economics, Finance and Banking (JEIEFB). An Online
International Research Journal (ISSN: 2306-367X) 2014 Vol: 3 Issue 6.
Joseph, Mabvure T., Edson, G., Manuere, F., Clifford, M. and Michaels, K. 2012.Non
performing loans in commercial banks: A case of CBZ bank limited in Zimbabwe.
Interdisciplinary Journal of Contemporary Research in Business 2012 Vol 4, No 7.
Klein, Nir. 2013. Non-performing loans in CESEE: determinants and impact on macroeconomic
performance. IMF Working Paper WP/13/72.
Louzis, D. P., Vouldis, A. T., & Metaxas, V. L. 2010. Macroeconomic and bank-specific
determinants of non-performing loans in Greece: A comparative study of mortgage,
business and consumer loan portfolios.
36
Makri, Vasiliki, Tsagkanos, Athanasios and Bellas, Athanasios. 2013. Determinants of non-
performing loans: the case of Eurozone.
Messai, Ahlem S. and Jouini, Fathi. 2013. Micro and macro determinants of non-performing
loans. International Journal of Economics and Financial Issues. Vol. 3, No. 4, 2013, pp.
852-860, ISSN:2146-4138
Michael, Justin N., Vasanthi G. and Selvaraju R. 2006.Effect of non-performing assets on
operation efficiency of central co-operative banks.Indian Economic Panorama, Vol. 16,
No. 3, pp. 33-34 & 39.
Misra, B.M and Dhal, Sarat. 2010. Pro-cyclical management of banks’ non-performing loans by
the Indian public sector banks.
Pasha, Sukrishnalalland Khamraj,Tarron. 2009. The determinants of non-performing loans: an
econometric case study of Guyana. Bank of Guyana.
Pesola, J. 2007. Financial fragility, macroeconomic shocks and banks' loan losses: evidence
from Europe. Bank of Finland Research Discussion Papers.
Prasanna, Krishna P. 2014. Determinants of non-performing loans in Indian banking system.
Prudential Regulation 2002. Assessed from www.rma.org.bt
Ranjan, Rajiv and Dhal, Sarat C. 2003. Non-performing loans and terms of credit of public
sector banks in India: an empirical assessment. Reserve bank of India Occasional papers
Vol. 24, No. 3
Rajaraman, I and Vasishtha, G (2002).Non performing loans of PSU Banks: Some panel results.
Economic and Political Weekly, 429 – 435.
37
Saba Irum, Kouser, Rehana and Azeem, Muhammad. 2012. Determinants of nonperforming
loans: Case of US banking sector. The Romanian Economic Journal.XV no. 44, June
2012.
Salas, V. and Saurina, J. 2002. Credit risk in two institutional regimes: Spanish commercial and
savings banks. Journal of Financial Services Research, 22(3), 203-224.
Shingjergji, Ali. 2013. The impact of bank specific variables on the non-performing loans ratio
in the Albanian banking system.