Determinants of compatibility between Arabidopsis and the ...
177
Determinants of compatibility between Arabidopsis and the hemibiotroph Colletotrichum higginsianum Inaugural-Dissertation Zur Erlangung des Doktorgrades der Mathematisch-Naturwissenschaftlichen Fakultät der Universität zu Köln vorgelegt von Doris H. Birker aus Mönchengladbach Köln, August 2008
-
Upload
khangminh22 -
Category
Documents
-
view
0 -
download
0
Transcript of Determinants of compatibility between Arabidopsis and the ...

Determinants of compatibility between Arabidopsis
and the hemibiotroph Colletotrichum higginsianum
Inaugural-Dissertation
Zur Erlangung des Doktorgrades der Mathematisch-Naturwissenschaftlichen Fakultät der
Universität zu Köln
vorgelegt von
Doris H. Birker
aus Mönchengladbach
Köln, August 2008

Die vorliegende Arbeit wurde am Max-Planck-Institut für Züchtungsforschung in Köln in
der Abteilung für Molekulare Phytopathologie (Direktor: Prof. Dr. P. Schulze-Lefert)
angefertigt.
Berichterstatter:
Prof. Dr. Paul Schulze-Lefert
Prof. Dr. Martin Hülskamp
Prüfungsvorsitzender: Prof. Dr. Ulf-Ingo Flügge
Prüfungstermin am 20. Oktober 2008


Table of contents
I Table of contents
I Table of contents ........................................................................................................5
II Abbreviations..............................................................................................................9
III Summary...................................................................................................................11
IV Zusammenfassung ....................................................................................................13
1. Introduction ..............................................................................................................15 1.1 Arabidopsis, the model host for studying plant-microbe interactions.............................. 15 1.2 Colletotrichum higginsianum ........................................................................................... 16 1.3 Plant defense mechanisms................................................................................................ 18
1.3.1 PAMP-triggered immunity (PTI) ..................................................................................18 1.3.2 Effector-triggered immunity (ETI)................................................................................19
1.4 Recessive resistance ......................................................................................................... 22 1.4.1 Recessive resistance in plant-virus interactions ............................................................23 1.4.2 Recessive resistance in plant-bacteria interactions........................................................24 1.4.3 Recessive resistance in plant-fungal interactions ..........................................................25 1.4.4 Recessive resistance in plant-oomycete interactions.....................................................25
1.5 Natural variation of Arabidopsis accessions .................................................................... 26 1.6 Quantitative trait loci (QTL) analysis and RIL populations............................................. 28 1.7 Thesis aims....................................................................................................................... 31
2 Materials and Methods .............................................................................................33 2.1 Materials........................................................................................................................... 33
2.1.1 Chemicals and general equipment suppliers .................................................................33 2.1.2 Antibiotics.....................................................................................................................33 2.1.3 Media ............................................................................................................................33 2.1.4 Buffers and solutions.....................................................................................................34 2.1.5 Organisms .....................................................................................................................36
2.1.5.1 Pathogens..........................................................................................................36
2.1.5.2 Plant material ....................................................................................................36
2.1.6 Oligonucleotides ...........................................................................................................37 2.1.7 Enzymes ........................................................................................................................37
2.1.7.1 Restriction endonucleases ...................................................................................37
2.1.7.2 Nucleic acid modifying enzymes .........................................................................37
2.1.8 Software, databases and other internet resources ..........................................................37
5

Table of contents
2.2 Methods ............................................................................................................................ 39
2.2.1 Growth and culturing of Arabidopsis............................................................................ 39 2.2.2 Generation of Arabidopsis F1 and F2 progeny .............................................................. 39 2.2.3 EMS mutagenesis ......................................................................................................... 39 2.2.4 Growth and sub-culturing of pathogens........................................................................ 40
2.2.4.1 Colletotrichum higginsianum .............................................................................. 40
2.2.4.2 Escherichia coli................................................................................................. 40
2.2.4.3 Hyaloperonospora parasitica.............................................................................. 40
2.2.5 Glycerol stock preparation............................................................................................ 40 2.2.6 Inoculation of Arabidopsis with pathogens................................................................... 41
2.2.6.1 Inoculation of the plants with C. higginsianum isolates.......................................... 41
2.2.6.2 Inoculation of the plants with H. parasitica .......................................................... 41
2.2.7 Arabidopsis mutant screen (EMS and γ-radiation mutated M2 seeds) .......................... 41 2.2.8 Determination of infection phenotypes......................................................................... 41 2.2.9 Nucleic acid extraction ................................................................................................. 42
2.2.9.1 RNA extraction from Arabidopsis ....................................................................... 42
2.2.9.2 DNA extraction from Arabidopsis ....................................................................... 43
2.2.9.3 Plasmid preparation ........................................................................................... 43
2.2.10 Reverse transcription-polymerase chain reaction (RT-PCR)........................................ 43 2.2.11 Polymerase chain reaction (PCR) ................................................................................. 44 2.2.12 Restriction endonuclease digestion of DNA................................................................. 44 2.2.13 Agarose gel electrophoresis .......................................................................................... 45 2.2.14 DNA sequencing........................................................................................................... 45 2.2.15 Sequence alignment and analysis.................................................................................. 45 2.2.16 Microscopical analysis.................................................................................................. 45
2.2.16.1 Determination of penetration efficiency ............................................................... 45
2.2.16.2 3-3’Diaminobenzidine (DAB) staining for hydrogen peroxide accumulation............ 45
2.2.16.3 Aniline Blue staining of callose deposition ........................................................... 46
2.2.16.4 Quantification of C. higginsianum sporulation ...................................................... 46
2.2.17 Quantification of hyphal growth by enzyme-linked immunosorbent analysis (ELISA)47 2.2.18 Mapping........................................................................................................................ 47
2.2.18.1 Positional cloning with PCR-based molecular markers .......................................... 47
2.2.18.2 QTL mapping and analysis ................................................................................. 47
3 Results ...................................................................................................................... 49
3.1 Analysis of Arabidopsis loss-of-susceptibility mutants.................................................... 49 3.1.1 Screen of Arabidopsis mutant pools for loss of susceptibility ...................................... 49 3.1.2 Phenotypic analysis of dmr Arabidopsis mutants ......................................................... 54 3.1.3 Phenotypic analysis of pmr mutants ............................................................................. 56
3.2 Natural variation in Arabidopsis response to C. higginsianum......................................... 58
6

Table of contents
3.2.1 Identification of natural variation of Arabidopsis accessions in response to C.
higginsianum infection..................................................................................................58 3.2.2 Genetic analysis of the inheritance of C. higginsianum resistance ...............................64
3.3 Genetic analysis of recessive resistance of Arabidopsis to C. higginsianum ................... 70 3.3.1 Mapping populations.....................................................................................................70 3.3.2 First-pass mapping ........................................................................................................71 3.3.3 Fine-mapping of recessive resistance locus Ws-0.........................................................72 3.3.4 Targeted mapping of recessive resistance loci in Gifu-2 and Can-0 accessions ...........75 3.3.5 Identification of resistance loci by analysis of Quantitative Trait Loci (QTL) .............79 3.3.6 Allelism Tests ...............................................................................................................83 3.3.7 Summary of genetic analysis of recessive resistance of Arabidopsis to
C. higginsianum ............................................................................................................86 3.4 Candidate genes and expression analysis ......................................................................... 87 3.5 Analysis of Arabidopsis T-DNA insertion mutants ......................................................... 90 3.6 Screening of an Arabidopsis Ler-0 BIBAC-library.......................................................... 92 3.7 Cytological analysis of fungal pathogenesis and host responses in resistant and susceptible
Arabidopsis accessions..................................................................................................... 94 3.7.1 Analysis of appressorial penetration efficiency ............................................................95 3.7.2 Quantification of hyphal growth ...................................................................................99 3.7.3 Quantification of spore production..............................................................................103 3.7.4 Histochemical characterisation of host defence responses to C. higginsianum
infection ......................................................................................................................104 3.7.4.1 Accumulation of hydrogen peroxide ..................................................................105
3.7.4.2 Callose production ...........................................................................................110
3.7.5 Summary of comparative analysis of fungal pathogenesis and host defence responses in
selected Arabidopsis accessions..................................................................................116
4 Discussion...............................................................................................................117
4.1 Arabidopsis accessions vary in their resistance to C. higginsianum .............................. 117 4.2 Arabidopsis infection phenotypes do not correlate with geographic origins.................. 119 4.3 Resistance of Arabidopsis to C. higginsianum is conferred by dominant, recessive and
polygenic resistance ....................................................................................................... 122 4.4 Cytological analyses of recessive resistance .................................................................. 125
4.4.1 Recessive resistance affects fungal penetration of epidermal cells .............................125 4.4.2 Accumulation of hydrogen peroxide does not confer resistance to C. higginsianum .131 4.4.3 Reduced penetration efficiency is not directly related to callose deposition...............133
4.5 Recessive resistance –recessive R gene or true susceptibility factor?............................ 135 4.5.1 Potential role of candidate genes in Arabidopsis- C. higginsianum interactions ........136
4.5.1.1 Candidate R genes............................................................................................137
4.5.1.2 Plant susceptibility factors ................................................................................139
7

Table of contents
4.6 Why was only a single recessive resistance locus identified in this study?.................... 143 4.7 Why did the mutant screen not identify true loss-of-susceptibility mutants? ................. 144 4.8 The role of dmr and pmr mutations in Arabidopsis susceptibility to C. higginsianum .. 146 4.9 Why have dmr1, dmr6, pmr4-6 not been identified in the analysis of natural variation?151 4.10 Summary......................................................................................................................... 152 4.11 Outlook ........................................................................................................................... 152 4.12 General perspectives ....................................................................................................... 153
V Supplementary Data ............................................................................................... 155
VI References .............................................................................................................. 163
VII Acknowledgements ................................................................................................ 173
VIII Erkärung ................................................................................................................. 175
Curriculum Vitae............................................................................................................. 177
8

Abbreviations
II Abbreviations
ABA abscisic acid ABRC Arabidopsis Biological Resource Center AFLP amplified fragment length polymorphism A. thaliana Arabidopsis thaliana Avr avirulence gene BAC bacterial artificial chromosome BIBAC binary bacterial artificial chromosome Bp base pairs °C degree Celsius CAPS cleaved amplified polymorphic sequence CC coiled-coil cDNA complementary DNA C. higginsianum Colletotrichum higginsianum cM centi Morgan DAB diaminobenzidine dCAPs derived cleaved amplified polymorphic sequence dmr downy mildew resistance DNA desoxy-ribonucleic acid dNTP desoxy-nucleotide-triphosphate dpi days post inoculation E. coli Escherichia coli ELISA enyme-linked immunosorbent assay EMS ethylmethane sulfonate ET ethylene ETI effector triggered immunity ETS effector triggered susceptibility F1 first filial generation F2 second filial generation F3 third filial generation g gram G. cichoracearum Golovinomyces cichoracearum G. orontii Golovinomyces orontii HIF heterogeneous inbred family H. parasitica Hyaloperonospora parasitica HR hypersensitive response HSK homoserine kinase IL introgression line JA jasmonic acid kb kilobase L litre LOD logarithm of the odds LRR leucine-rich repeat m milli M molar MAP mitogen activated protein Mb megabase µ micro
9

Abbreviations
µm micrometer min minute MLO mildew-resistance locus o NASC Nottingham Arabidopsis Stock Centre NBS nucleotide binding site NIL near isogenic line NO nitric oxide OG oligogalacturonide PAMP pathogen associated molecular pattern PCR polymerase chain reaction PGIP polygalacturonase-inhibiting protein pmr powdery mildew resistance PR pathogenesis related PRR pattern recognition receptor PTI PAMP triggered immunity QTL quantitative trait locus R resistance (gene) RFLP restriction fragment length polymorphism RIL recombinant inbred line RLK receptor like kinase RLP receptor like protein RNA ribonucleic acid ROS reactive oxygen species rpm rounds per minute SA salicylic acid SAR systemic acquired resistance sec second SNP single nucleotide polymorphism SSLP short sequence length polymorphism TAIR The Arabidopsis Information Resource T-DNA transfer DNA TIR Toll-interleukine-1 receptor TLR Toll-like receptor TM transmembrane TTSS type III secretion system UV ultra violet V Volt wt wild type Zn zinc
10

Summary
III Summary
Plant disease susceptibility is determined by complex interactions between plant and
pathogen factors, resulting in co-evolution of a host plant species and its adapted
pathogen. Previously, there has been major scientific interest in plant resistance that
counteracts pathogen attack. In contrast, mechanisms of plant susceptibility are poorly
understood. The aim of this study was to identify genetic determinants of dominant
susceptibility of Arabidopsis thaliana to the hemibiotrophic ascomycete Colletotrichum
higginsianum. Two different approaches were used, both based on the hypothesis that if an
essential host susceptibility factor is not present or not functional, the plant will not
support infection by the fungus. In the first approach, a forward genetics screen was
conducted to identify mutants that had lost susceptibility due to chemically induced
mutations in essential host susceptibility factors. Screening of 207,000 EMS Arabidopsis
mutants in highly susceptible genetic backgrounds identified 35 candidates with reduced
susceptibility to C. higginsianum. However, the reduction was not sufficiently clear-cut to
allow identification of the mutated locus through positional cloning. The C. higginsianum
infection phenotypes of available downy mildew resistant (dmr) and powdery mildew
resistant (pmr) mutants were also analysed. Loss of susceptibility to C. higginsianum by
specific dmr and pmr mutant lines indicated that pathogens share some common
mechanisms of disease development. In the second approach, analysis of 116 Arabidopsis
accessions from diverse geographic origins revealed considerable natural variation in
response to C. higginsianum inoculation. Different modes of inheritance of resistance
were identified by crossing resistant accessions to the highly susceptible Ler-0 accession
and following segregation, and by quantitative trait loci (QTL) analysis of recombinant
inbred line (RIL) populations. It was assumed that accessions lacking an essential
dominant susceptibility factor would show monogenic recessively inherited resistance.
Alternatively, recessive resistance could be due to the presence of a recessive resistance
(R) gene. To select for recessive resistance, accessions that had susceptible F1 progenies
and F2 progenies segregating 3:1 (susceptible : resistant) were characterised further. A
single recessive locus was shown to confer resistance in the accessions Ws-0, Gifu-2 and
Can-0. The same locus was identified by QTL analysis in the Ler-0 x Kondara RIL
population. Positional cloning in a Ler-0 x Ws-0 F2 mapping population located this
recessive resistance locus to the lower arm of chromosome V between the molecular
11

Summary
markers “236” (18,307,842 bp) and “312” (18,407,860 bp). Twenty candidate genes
within the mapping interval, including six TIR (Toll-Interleukin 1 receptor) type NBS-LRR
(Nucleotide Binding Site–Leucine Rich Repeats) genes, were analysed to determine whether
this locus encodes a dominant susceptibility factor, or alternatively, a recessive R gene.
Natural variation was also characterised cytologically. This revealed differences between
resistant and susceptible accessions at an early stage in the penetration efficiency of the
pathogen, or in the establishment of biotrophic primary hyphae, with no indications of
involvement of host callose deposition or accumulation of reactive oxygen species in
recessive resistance mechanisms.
12

Zusammenfassung
IV Zusammenfassung
Krankheiten von Pflanzen werden durch komplexe Interaktionen zwischen
Kompatibilitätsfaktoren von Pathogenen und deren Wirten bestimmt, wodurch es zur
Koevolution zwischen einer Pflanzenart und einem adaptierten Pathogen kommt. In
früheren Studien lag der Fokus auf der Erforschung von Abwehrmechanismen gegen
Pathogenbefall. Nur wenig ist bisher über Suszeptibilität von Pflanzen bekannt.
Thema dieser Arbeit war die Identifizierung von genetischen Komponenten für dominante
Suszeptibilität von Arabidopsis thaliana gegenüber dem hemibiotrophen Ascomyceten
Colletotrichum higginsianum. Dafür wurden zwei verschiedene experimentelle Ansätze
durchgeführt, die beide auf der Hypothese basierten, dass die Pflanze gegenüber dem Pilz
resistent ist, wenn ein essentieller pflanzlicher Suszeptibilitätsfaktor entweder nicht
vorhanden, oder nicht funktionell ist. Der erste Ansatz zielte auf die Identifizierung von
Arabidopsis Mutanten deren Suszeptibilität durch chemisch induzierte Mutationen in
Suszeptibiliätsfaktoren reduziert wurde. Bei einer Musterung von 207.000 Mutanten
wurden 35 Kandidatenpflanzen mit verringerter Suszeptibilität gegenüber C. higginsianum
identifiziert. Diese Reduktion war jedoch nicht eindeutig genug für eine positionelle
Klonierung des mutierten Genlokus. Des Weiteren wurden die Phänotypen von „downy
mildew resistant“ (pmr) und „powdery mildew resistant“ (dmr) Mutanten nach
Inokulierung mit C. higginsianum analysiert. Die dabei identifizierte Reduktion der
Suszeptibilität bestimmter dmr und pmr Mutantenlinien weisten auf gemeinsame
Mechanismen der Pathogenese zwischen C. higginsianum und Hyaloperonospora
parasitica bzw. Golovinomyces cichoracearum hin.
In einem zweiten experimentellen Ansatz wurde durch die Analyse von 116 Arabidopsis
Ökotypen verschiedenen geographischen Ursprungs natürliche Variation in der Resistenz
gegenüber C. higginsianum identifiziert. Mit Hilfe von Kreuzungen von resistenten
Ökotypen mit dem suszeptiblen Ökotyp Ler-0, und der Analyse von Genloci für
quantitativ vererbten Merkmalen (quantitative trait loci, QTL) in rekombinanten
Inzuchtlinien (RIL) konnte monogene dominante, monogene rezessive und polygene
Vererbung der Resistenz ermittelt werden. Dabei wurde von der Arbeitshypothese
ausgegangen, dass Ökotypen, denen ein essentieller und dominanter Suszeptibilitätsfaktor
durch natürliche Variation fehlt, monogene rezessive Vererbung der Resistenz aufweisen.
Alternativ könnte rezessive Resistenz auch durch ein rezessives Resistenzgen (R-Gen)
13

Zusammenfassung
vermittelt werden. In dieser Arbeit wurde ein Genlokus identifiziert, der rezessive
Resistenz in den Ökotypen Ws-0, Gifu-2 und Can-0 vermittelt. Dieser Genlokus wurde
auch durch QTL-Analyse einer Ler-0 x Kondara RIL-Population ermittelt. Positionelle
Klonierung in einer Ler-0 x Ws-0 F2 Kartierungs-Population lokalisierte die Position
dieses rezessiven Resistenz-vermittelnden Genokus auf dem unteren Arm des
Chromosoms V zwischen der Position der molekularen Marker „236“ (18.307.842 Bp)
und „312“ (18.407.860 Bp). Zwanzig Kandidatengene, einschließlich sechs TIR (Toll-
Interleukin 1) Typ NBS-LRR (Nucleotide Binding Site-Leucine Rich Repeats) Gene,
wurden analysiert, um zu bestimmen, ob dieser Genlokus einen dominanten
Suszeptibilitätsfaktor, oder alternativ ein rezessives R-Gen kodiert. Weiterhin wurde die
natürliche Variation in der Resistenz gegenüber C. higginsianum zytologisch
charakterisiert. Es wurden Unterschiede zwischen resistenten und suszeptiblen Ökotypen
beobachtet, die dafür sprechen, dass für Resistenz entweder eine verringerte Invasionsrate,
oder ein inhibiertes biotrophes Hyphenwachstum von C. higginsianum verantwortlich ist.
Dabei gab es keine Hinweise auf eine Beteilung von Kalloseeinlagerung und Ansammlung
von Wasserstoffperoxid an rezessiven Resistenzmechanismen.
14

Introduction
1.Introduction
Plants have evolved a sophisticated multi-layered immune system in response to the
constant challenge by disease-causing pathogens they are exposed to. Evolution of plant
resistance mechanisms, in turn resulted in the co-evolution of pathogens that have adapted
to infect and reproduce in a narrow range of host species, causing thereby enormous food
losses. It is therefore an important challenge to unravel the mechanisms underlying the
complex interactions between plants and their pathogens to identify new ways to control
plant diseases.
1.1 Arabidopsis, the model host for studying plant-microbe interactions
Arabidopsis thaliana, called Arabidopsis hereafter, belongs to the mustard family
(Brassicaceae). It is a widespread annual weed, native to Europe and central Asia and
naturalised in North America, Australia and Japan (Mitchell-Olds and Schmitt, 2006).
Arabidopsis has proven to offer several advantages for laboratory use: a small plant size, a
short life-cycle, a high fertility and a large seed production. This makes it possible to grow
Arabidopsis in a rapid manner in limited space. Because of its relatively small genome
size it was the first plant to have its genome fully sequenced. For these reasons,
Arabidopsis has emerged as a leading model plant, in particular suitable for genetic and
molecular research, which has led to the establishment of a large research community with
important biological and molecular resources available (Koornneef et al., 2004) such as a
multitude of well-characterised mutants and microarray chips. Arabidopsis also serves as
an invaluable model system in plant pathology. It is host to a large number of microbes
belonging to different taxonomic classes, including oomycetes, fungi, viruses and bacteria.
Depending on their mode of infection, they are classified as necrotrophs (derive energy
from killed cells), obligate biotrophs (derive energy from living cells) or hemibiotrophs
(initially biotrophic but later switching to necrotrophy). Arabidopsis therefore allows
insights into very diverse mechanisms of plant disease and resistance.
15

Introduction
1.2 Colletotrichum higginsianum
Colletotrichum is a large genus of Ascomycete fungi, containing many species which
cause anthracnose on an extremely wide range of temperate and tropical crops and
ornamental plants (Bailey et al., 1992). The brassica pathogen Colletotrichum
higginsianum has a wide host range, attacking many cultivated forms of Brassica and
Raphanus as well as the wild Brassicaceae Arabidopsis (Narusaka et al., 2004; O'Connell
et al., 2004). Like many other Colletotrichum species, C. higginsianum invades host plants
by a two-step hemibiotrophic infection process, which starts with the germination of
spores on the plant surface to form fungal penetration organs, termed appressoria (Fig.
1.1a). Melanisation of the mature appressorium cell wall and accumulation of osmotically
active solutes in the cytoplasm leads to the generation of an enormous turgor pressure by
osmosis. This mechanical force, in combination with enzymatic activity, enables the
fungus to directly penetrate plant epidermal cells. Thin penetrations pegs develop from the
base of the appressoria and penetrate the plant cuticle and cell wall and give rise to
primary hyphae (Fig. 1.1b). During the initial biotrophic phase, the primary hyphae grow
intracellularly between the plant cell wall and the plant plasma membrane and are
functionally equivalent to haustoria, the feeding structures of biotrophic pathogens
(Shimada et al., 2006). Eventually, C. higginsianum switches to a necrotrophic mode of
growth, which is associated with a change in fungal morphology; narrow secondary
hyphae are generated that kill the plant cells and dissolve cell walls ahead of infection to
extensively colonise the host tissue (Fig. 1.1c). At this stage, the fungus feeds on the dead
host cells to generate the sporulating structures, the acervuli, in which the spores are
produced to complete the fungal asexual life-cycle.
16

Introduction
Figure 1.1: The asexual infection cycle of Colletotrichum higginsianum
a) Spores (S) adhere to the host cuticle and produce a germtube (GT). The appressorium (A) is formed to
penetrate plant epidermal cells directly.
b) A penetration peg (PP) develops from the base of the appressorium and penetrates the host cuticle and
cell wall. Primary hyphae develop inside the epidermal cell and invaginate the plant plasma membrane. The
host protoplast remains alive during this biotrophic stage of the interaction.
The Arabidopsis-C. higginsianum pathosystem is an attractive model system for the study
of plant-pathogen interactions as it not only offers the genetic resources available for the
host (see 1.1), but also the experimental advantages of the pathogen. C. higginsianum is a
haploid organism for most of its life cycle. It can be cultured axenically in contrast to
obligate biotrophic pathogens and is therefore easy to handle. Furthermore, it can be
transformed for mutational analysis and critical assessment of gene function by targeted
gene disruption. The complete genome sequence for Colletotrichum graminicola, a
closely-related maize anthracnose pathogen, will be available in the near future. Due to its
hemibiotrophic infection strategy, C. higginsianum possesses features of obligate
biotrophic pathogens, as well as characteristics of necrotrophic pathogens. Thus, the
17

Introduction
Arabidopsis-C. higginsianum model system offers insights into general aspects of
different fungal life-styles and the switch from a biotrophic to a necrotrophic life-style.
1.3 Plant defense mechanisms
Plants are under attack above- and below-ground by a host of resourceful microbes,
including viruses, bacteria, fungi, oomycetes and nematodes (Dangl and Jones, 2001). To
combat this plethora of pathogens, plants have evolved a robust innate immune system
that exhibits striking similarities as well as significant differences with various metazoan
innate immune systems (McDowell and Simon, 2008). The plant immune system consists
of both preformed physical and chemical barriers, e.g. waxy cuticular layers and anti-
microbial compounds, and a barrage of induced defences (Dangl and Jones, 2001). Recent
work has shown that the inducible component of the plant immune system can be
generally divided into two main branches; the pathogen associated molecular patterns
(PAMP)-triggered immunity (PTI) and the effector-triggered immunity (ETI) (Jones and
Dangl, 2006).
1.3.1 Pathogen associated molecular patterns (PAMP)-triggered immunity
(PTI)
Pathogen associated molecular patterns (PAMPs) are highly conserved molecules and
widely distributed among microbial species, where they play an essential role in the
microbial lifestyle, but are absent in the potential host (Medzhitov and Janeway, 2002;
Nürnberger et al., 2004). Well-characterised examples for PAMPs are bacterial flagellin
(Gomez-Gomez and Boller, 2002), the bacterial elongation factor EF-Tu (Zipfel et al.,
2006), lipopolysaccharides from bacteria, chitin and ergosterol from true fungi, and
heptaglucoside and transglutaminase from oomycetes (Zipfel and Felix, 2005). Once the
pathogen has overcome the preformed barriers and has gained access to the plant’s interior
by either direct penetration or by entering through wounds or natural openings, highly
sensitive and specific pattern recognition receptors (PRRs) in the plant can detect PAMPs
as “non-self” molecules. These plant plasma membrane-spanning PRRs can be grouped
into 2 classes: the receptor-like kinases (RLKs) that carry a serine/threonine kinase
domain, and the receptor-like proteins (RLPs) that have a short cytoplasmic tail at the
18

Introduction
intracellular side and extracellular domains that can contain leucine-rich repeats (LRRs) or
LysM motifs (Göhre and Robatzek, 2008). Recognition of PAMPs by PRRs leads to the
activation of PAMP-triggered immunity (PTI) (Chisholm et al., 2006). PTI comprises pre-
invasive defence such as stomatal closure, as well as post-invasive defences, e.g. mitogen-
activated protein kinase (MAPK) signalling, transcriptional activation of pathogen-
responsive (PR) genes, production of reactive oxygen species (ROS), deposition of callose
to reinforce the cell wall at sites of infection, and ethylene production (Asai et al., 2002;
Gomez-Gomez and Boller, 2002). In most cases, PTI is sufficient to avoid microbial
growth while ensuring host cell survival (Nürnberger et al., 2004). Through these general
defence mechanisms, entire plant species can be resistant to all genetic variants of a
specific pathogen and are therefore also referred to as non-host resistance (Thordal-
Christensen et al., 2000; Nürnberger et al., 2004). One of the best-studied examples of
PAMP recognition by PRRs is the perception of a synthetic 22-amino-acid peptide (flg22)
from a conserved flagellin domain. Flagellin is a subunit of flagella, which are
indispensable for bacterial motility (Macnab, 1992). A genetic screen using flg22
identified the Arabidopsis LRR-receptor kinase FLS2 (Chinchilla et al., 2006), which is
internalised upon flagellin perception by receptor-mediated endocytosis (Robatzek et al.,
2006). Recently, the bacterial EF-Tu has been shown to be recognised by the Arabidopsis
LRR-kinase EFR and thereby limiting Agrobacterium pathogenicity (Zipfel et al., 2006).
The RLK LysM has been identified to recognise fungal chitin (Wan et al., 2008), the RLP
LeEix recognises the fungal xylanase EIX (Ron and Avni, 2004) and CEBiP was
demonstrated to recognise fungal chitin (Kaku et al., 2006). Treatment with a conserved
EF-Tu peptide has been shown to induce expression of a gene set nearly identical to that
induced by flg22 and vice versa (Zipfel et al., 2006). This indicates that PAMPs converge
on a limited number of signalling pathways and lead to a common set of outputs that
require PTI (Jones and Dangl, 2006).
1.3.2 Effector-triggered immunity (ETI)
Plant pathogens can overcome PTI by developing effectors that interfere with PTI
mechanisms (da Cunha et al., 2007). For this, pathogens inject a range of effectors during
infection that suppress PTI responses at the level of perception, signalling or defense
action, which leads to host colonisation (Grant et al., 2006; Göhre and Robatzek) and was
therefore recently termed effector triggered susceptibility (ETS) (Chisholm et al., 2006;
19

Introduction
Jones and Dangl, 2006). Although it is likely that all pathogenic microbes encode
effectors, the best characterised effectors so far come from phytopathogenic bacteria. The
bacterial pathogen Pseudomonas syringae injects its effectors via the type III secretion
system (TTSS) (Espinosa and Alfano, 2004; Galan and Wolf-Watz, 2006; Lindeberg et
al., 2006; Brutinel and Yahr, 2008) into the cytosol of plant cells where they contribute to
virulence. The P. syringae effectors AvrPto and AvrPtoB have been shown to block PTI
before the MAPK cascade activation (He et al., 2006; Jones and Dangl, 2006). AvrRpm1
and AvrB bind to RIN4, which might act as an adaptor protein that holds multiple PRR
signalling pathways under negative regulation (Kim et al., 2005). Phytopathogenic fungi
and oomycetes do not possess a TTSS. However, oomycetes and fungi have also been
shown to secrete effector proteins into both the extracellular space and the host cytoplasm
where they can play diverse roles in pathogenicity and interactions with host cells (Dean
et al., 2005; Kämper et al., 2006). An RxLR amino acid motif that targets the effector
proteins for host cells has been shown to be highly conserved among three different
oomycete effectors and additional oomycete proteins predicted to be secreted (Kamoun,
2006) and is similar to the RxLx motif of malaria parasites, suggesting a conserved role in
pathogenicity (Birch et al., 2006). Enzyme activity has been demonstrated for a few
fungal effectors (Jia et al., 2000; Orbach et al., 2000; El Gueddari et al., 2002; van den
Burg et al., 2006) and the CgDN3 secreted protein appears to suppress host-cell death
during the initial biotrophic phase of Colletotrichum gloeosporioides after infection of
Stylosanthes (Stephenson et al., 2000).
The evolution of secreted effector proteins by plant pathogens led to the acquisition of
plant proteins that specifically recognise these effectors, thereby providing effector-
triggered immunity (ETI) (Chisholm et al., 2006). This specific recognition of pathogen
effectors, termed avirulence (AVR) factors, by cognate plant resistance (R) gene products
has been characterised genetically as gene-for-gene resistance (Flor, 1971) and is race-
specific. AVR protein recognition initiates a cascade of downstream events, such as an
increase in cytosolic calcium depolarisation of the plasma membrane, a localised ROS
burst, nitric oxide (NO) production and MAPK cascade activation (Dangl and Jones,
2001). ETI responses therefore show a significant overlap with PTI responses (Nimchuk et
al., 2003; Nürnberger et al., 2004; Göhre and Robatzek, 2008). Furthermore, ETI is
typically associated with a localised programmed cell death, the hypersensitive response
(HR) (Jones and Dangl, 2006), which is correlated with restricting biotrophic pathogens to
the infection site.
20

Introduction
To date, numerous R genes have been cloned from a wide range of plant species and most
of them can be classified into two main classes according to their domain organisation: the
nucleotide binding leucine-rich repeat (NB-LRR) genes and the extracellular LRR genes
(Jones and Dangl, 2006). The NB-LRR genes represent the largest class of R genes and
can be further subdivided into coiled-coil (CC)-NB-LRR and Toll-interleukin-1 receptor
(TIR)-NB-LRR genes according to their N-terminal domain. More than 150 proteins have
been predicted to be NB-LRR proteins in Arabidopsis alone (Chisholm et al., 2006). The
second major class of R genes, encoding extracellular LRR proteins, is subdivided into
three subclasses. These include RLPs with an extracellular LRR and a transmembrane
domain, the RLKs with an extracellular LRR and a transmembrane domain, and the
polygalacturonase-inhibiting protein (PGIP) with a cell wall LRR (Chisholm et al., 2006).
Although many R genes and their corresponding pathogen effectors have been cloned in
the past, direct binding between them has rarely been demonstrated. Therefore, in addition
to the original model of a direct recognition of the Avr protein and its cognate R protein,
several NB-LRR proteins have been identified to recognise effectors indirectly by
detecting the products of their action on host targets (Van der Biezen and Jones, 1998).
This mode of indirect interaction is formulated in the “guard hypothesis”, describing the R
protein keeping the host target protein, the guardee, under surveillance. The most
extensively studied guardee is Arabidopsis RIN4, which constitutively associates with the
CC-NB-LRR R protein RPM1. In the presence of the P. syringae effectors AvrB or
AvrRpm1, RIN4 is hyper-phosphorylated, which has been shown to suppress PTI (Kim et
al., 2005). RPM1, in turn, is activated following this phosphorylation (Bisgrove et al.,
1994; Mackey et al., 2002) and thereby activating ETI. Thus, as a consequence of the
indirect recognition, a limited number of receptors guarding key host targets is sufficient
to monitor the presence of multiple effectors having the same target (Jones and Dangl,
2006).
In response to ETI, pathogens have evolved further effectors that specifically interfere
with ETI mechanisms in plants, either by shedding or diversifying the recognised effector,
or by acquiring additional effectors that suppress ETI (Jones and Dangl, 2006). One
example is the P. syringae effector AvrRpt2, a cysteine protease, which may have evolved
as a mechanism to interfere with the RPM1 disease resistance pathway and which restores
pathogen virulence by cleavage of RIN4. However, RPS2 evolved which recognises the
activity of AvrRpt2 and triggers ETI again (Axtell and Staskawicz, 2003; Caplan et al.,
2008).
21

Introduction
Many recent studies have focused on the signal transduction pathway downstream of
activated plant immunity receptors. Interestingly, different classes of NB-LRR proteins
require different signalling components. The TIR-NB-LRR proteins have been shown to
require EDS1 and its interacting partners PAD4 and SAG101 (Glazebrook et al., 1996;
Parker et al., 1996; Aarts et al., 1998; Falk et al., 1999; Feys and Parker, 2000; Feys,
2001). In contrast to this, signal transduction by the CC-NB-LRR proteins seems to be
generally dependent on NDR1 (Aarts et al., 1998; Coppinger et al., 2004). In the TIR-NB-
LRR protein triggered response, EDS1 and its interacting partners are needed for the
expression of HR and the accumulation of salicylic acid (SA) (Wiermer et al., 2005).
Furthermore, they are involved in the generation of a signal potentiation loop that involves
the processing of ROS- and SA-derived signals (Feys, 2001; Rustérucci et al., 2001). SA
accumulation primes a mechanism of systemic immunity in which local defences establish
a state of heightened resistance throughout the plant against subsequent pathogen attack,
known as systemic acquired resistance (SAR) (Durrant and Dong, 2004). The EDS1
pathway is further regulated by LSD1 and ACD11, negative regulators of a cell death
pathway that depends on EDS1 and PAD4 activities (Brodersen et al., 2002; Mateo et al.,
2004). The MAP kinase MPK4 has been identified to be required for both repression of
the SA pathway and activation of the ethylene (ET)/ jasmonic acid (JA) pathway (Petersen
et al., 2000; Mateo et al., 2004). SA-dependent defence responses have been shown to be
particularly effective against biotrophic and hemibiotrophic pathogens, probably due to
the fact that cell death deprives these pathogens of nutrients (Thomma et al., 2001;
Glazebrook, 2005). In contrast, necrotrophs commonly take advantage of dead cells and
JA and ET seem to be alternative signals in resistance to necrotrophs and generally act
synergistically (Glazebrook, 2005).
1.4 Recessive resistance
ETI is conferred by R genes that induce an active resistance response after perception of
cognate Avr genes (see 1.3). As this resistance is typically inherited dominantly
(Hammond-Kosack and Jones, 1997), this mode of resistance can also be termed dominant
resistance. To date, less attention has been paid to incompatible plant-pathogen
interactions controlled by recessive resistance genes. Recessive resistance can, as with
dominant resistance, be the result of active resistance mechanisms induced by the plant
22

Introduction
recognition of the invading pathogen by an R gene that is recessively inherited.
Alternatively, recessive resistance might underlie a passive resistance mechanism due to
the lack or a mutated version of a specific host factor required by the pathogen to
complete its life-cycle. Although knowledge about this aspect of resistance is still limited
for bacterial and fungal systems, recessive forms of resistance are fairly common in viral
systems, accounting for almost half of all known viral R genes (Kang et al., 2005b). Work
carried out to characterise loss-of-susceptibility mutants, mainly obtained through
chemical mutagenesis of susceptible hosts, together with work on natural recessive
resistance in crop species, offers insights into the very diverse mechanisms of recessive
resistance.
1.4.1 Recessive resistance in plant-virus interactions
Viruses depend on the host biochemical machinery to complete their biological cycle. The
successful infection of a plant by a virus requires a series of compatible interactions
between host and viral factors, including the expression and replication of the viral
genome, cell-to-cell movement and long distance translocation through the plant vascular
system (Carrington et al., 1996; Maule et al., 2002). Recessive resistance seems to be
more frequent for potyviruses than for viruses of other families (Diaz-Pendon et al., 2004)
and was found to disturb mainly viral replication or movement (Kang et al., 2005b). The
recessive resistance genes TOM1 and TOM2A encode integral membrane proteins that are
localised in the tonoplast (Ishikawa et al., 1993). The TOM1 protein has been shown to
interact with the helicase domain of replication proteins encoded by Tobacco mosaic virus
(Ishikawa et al., 1991; Ishikawa et al., 1993; Yamanaka et al., 2000; Yamanaka et al.,
2002; Hagiwara et al., 2003). It is postulated that the interaction of TOM2A with TOM1
constitutes a component of the tobamoviral replication complex (Tsujimoto et al., 2003)
that is essential for successful viral growth. The translation initiation factor eIF4E has
been identified to be a major determinant of recessive resistance to the family of
potyviruses (Robaglia and Caranta, 2006). eIF4E binds to the 5´ cap structure of mRNA
and is a key player in the initiation of plant protein synthesis. The binding of the viral
protein VPg to eIF4E has been shown to be required for successful infection of the plant.
The key role played by eIF4E in recessive resistance has been revealed by the discovery
that the lsp1 gene for resistance to Tobacco etch virus (Lellis et al., 2002), the mo1 gene
for lettuce resistance to lettuce mosaic virus (Nicaise et al., 2003), the sbm1 gene for pea
23

Introduction
resistance to Pea seed-borne mosaic virus (Gao et al., 2004) and the pot-1 gene for tomato
resistance to Potato virus Y and Tobacco etch virus (Ruffel et al., 2004) all correspond to
mutations in eIF4E homologs, affecting virus cell-to-cell movement and viral
accumulation. Moreover, recessive resistance to viral infection has also been shown to be
caused by mutations in eIF4G, a further component of the eukaryotic translation initiation
complex (Yoshii et al., 2004).
1.4.2 Recessive resistance in plant-bacteria interactions
Although recessive resistance is well-studied in viral systems, little is understood
regarding this phenomenon in plant-bacterial interactions. However, recent research on the
Oryza sativa–Xanthomonas oryzae pv. oryzae (Xoo) pathosystem has shown that nine of
the 30 documented R genes are recessively inherited (Iyer-Pascuzzi and McCouch,
2007b). Two of them, xa5 and xa13, have recently been cloned. Amino acid substitutions
in the γ-subunit of the transcription factor IIA, the xa5 protein, prevent the interaction with
bacterial proteins which normally promote disease possibly by the activation of genes that
might be involved in nutrient, sugar or iron metabolism (Iyer and McCouch, 2004).
Xa13/Os8N3 encodes a plasma membrane-localised protein which is involved in pollen
development of rice (Chu et al., 2006). Mutations in the promoter region of xa13 seem to
eliminate the bacterial induced upregulation of Xa13 by the Xoo race 6, PXO99A, which
leads to resistance, probably by abolishing the interaction of the PthXo1 bacterial type III
effector with its target (Chu et al., 2006; Yang et al., 2006). The recessive RRS1-R allele
has been identified to provide resistance of Arabidopsis to the bacterial wilt pathogen
Ralstonia solanacearum (Deslandes et al., 2002). RRS1 encodes a new class of TIR-NB-
LRR proteins (see 1.3.2) with a nuclear localisation signal and a WRKY domain.
Although RRS1-R has been identified to confer resistance recessively, it acts as a
dominant gene in transgenic plants. Its structure, which is typical for an R gene, together
with the identification of its corresponding Avr gene PopP2 (Deslandes et al., 2003)
strongly suggest that RRS1 acts in a similar way to dominant TIR-NB-LRR proteins.
24

Introduction
1.4.3 Recessive resistance in plant-fungal interactions
One of the best-studied examples of recessive resistance of plants to fungal pathogens is
recessive resistance to powdery mildew mediated by the loss of the barley mildew
resistance locus o (Mlo). Barley Mlo encodes an integral membrane protein with seven
transmembrane domains (Bueschges et al., 1997). mlo-based resistance is not restricted to
the monocot barley - several mutants with enhanced resistance to powdery mildew were
identified in Arabidopsis to confer resistance, indicating that this mechanism of resistance
may be inducible in any higher plant species (Consonni et al., 2006). Recent work has
postulated that MLO proteins function as regulatory components of plant secretory
processes involving SNARE domain proteins, and the powdery mildew fungi appear to
specifically corrupt MLO for successful pathogenesis (Panstruga, 2005; Humphry et al.,
2006). Similarly, the powdery mildew resistance (pmr) mutants do not support growth of
the pathogen and were suggested to represent true compatibility factors (Vogel and
Somerville, 2000). Four of the corresponding PMR genes have been cloned. PMR2 has
been shown to be allelic to AtMLO2 (Consonni et al., 2006). PMR4 encodes GSL5, a
callose synthase that is essential for callose deposition at wound and biotic stress sites
(Jacobs et al., 2003; Nishimura et al., 2003). The mutation in pmr4 results in the loss of
callose accumulation and the enhanced activation of SA and pathogen-responsive genes.
PMR5 and PMR6 encode a protein of unknown function and a pectate lyase, respectively
(Vogel et al., 2002; Vogel et al., 2004). Both mutants show similar phenotypes, resulting
in increased cell wall pectin content, a reduced pectin esterification and a suggested
change in the hydrogen-bonding environment of cellulose, leading to reduced powdery
mildew growth. Since pmr5 and pmr6 confer resistance to G. orontii and G.
cichoracearum, but not to virulent strains of P. syringae and Hyaloperonospora
parasitica, it was proposed that the according proteins are true compatibility factors that
are generally specific for single pathogen species.
1.4.4 Recessive resistance in plant-oomycete interactions
Recently, more insights could be gained into recessive resistance to the downy mildew H.
parasitica. A screen of EMS induced Arabidopsis mutants has identified eight downy
mildew-resistant (dmr) mutants, corresponding to six different loci (Van Damme et al.,
2005). The mutants dmr3, dmr4 and dmr5 are associated with constitutive expressions of
the defense-related PR-1 gene, indicating that these mutants are affected in defence
25

Introduction
pathways instead of mechanisms of recessive resistance. The mutants dmr1 and dmr6 have
been cloned and further characterised. DMR1 encodes a homoserine kinase (HSK) (Van
Damme, 2007) and the mutation in dmr1 results in elevated homoserine levels. Although
homoserine was shown not to have a direct effect on pathogen growth, treatment of
Arabidopsis with the amino acid results in complete protection from the fungal infection,
possibly due to a role in a so far undefined mechanism resulting in plant disease resistance
via the modulation of host amino acid metabolism. The mutant dmr6 carries a mutation in
the gene that encodes a 2-oxoglutarate (2OG)-Fe(II) oxygenase of unknown function,
resulting in the enhanced expression of a subset of defence-associated genes, including
DMR6 itself (van Damme et al., 2008). It was suggested that the mutation activates either
a novel plant defence, or could cause the accumulation of a toxic DMR6 substrate.
Alternatively, the DMR6 metabolic product might be required for successful infection by
the oomycete.
1.5 Natural variation of Arabidopsis accessions
Natural variation between and within species is considered to be the main resource for
evolutionary changes. Only a species that has the potential to adapt to changes in the
environment by genetic variation within the species can survive and produce successors.
Genetic variation is influenced by evolutionary processes that can affect the whole
genome, e.g. the demographic history and the type of breeding system, or by evolutionary
processes that are variable across the genome, e.g. the recombination rate, the mutation
rate and selection (Schmid et al., 2006). Therefore, at any given locus genetic variation is
the result of a combination of genome-wide and locus-specific factors. Analysis of natural
variation can provide insights beyond knowledge based on a mutagenised genome and
aims to focus on physiological, ecological and evolutionary questions.
The model plant Arabidopsis occurs throughout the Northern hemisphere in Europe, Asia
and Africa, from the latitude range of 68°N to 0°, and has also been naturalised in North
America, Australia and Japan (Koornneef et al., 2004). It has been found from sea level up
to 4250 m (Al-Shehbaz and O'Kane Jr, 2002), and occupies very diverse habitats (Shindo
et al., 2007). This broad distribution requires a level of genetic variation to adapt to the
specific conditions of these diverse environments. The extraordinarily wide phenotypic
variation described for Arabidopsis, not only in visually obvious phenotypes, but also in
26

Introduction
genetic mechanisms, reflects this natural variation. Recent genome-wide studies show that
in Arabidopsis an average pair of alleles differs at about seven nucleotides per kilobase
(Mitchell-Olds and Schmitt, 2006). Hundreds of accessions from natural populations that
have been collected from diverse worldwide locations are available from international
stock centres, e.g. NASC and ABRC (Scholl et al., 2000; Koornneef et al., 2004), offering
an immense source of genetic variation. Therefore, natural variation in Arabidopsis, a
species that offers a large number of genomic tools and resources (see 1.1), allows
analysis of three complementary areas: (1) genomic studies of molecular variation and its
population structure, (2) identification of genetic polymorphisms underlying natural
variation in complex traits, and (3) ecological and evolutionary studies of natural selection
and adaptation. In the recent past, analysis of natural variation has proven to be a powerful
alternative to mutant-based functional analyses for the identification of single genes and
their functions. Natural variation is often more subtle than laboratory generated knock-out
mutants and might therefore allow identification of mechanisms of pathway control and
cross-pathway linkages that may not be detectable with knock-out mutants, in particular
when these are lethal (Tonsor et al., 2005). Furthermore, null or weak wild-type alleles
cannot be detected by the mutant-approach, and some phenotypes appear only in certain
genetic backgrounds due to epistatic interactions (Koornneef et al., 2004). Furthermore,
natural variation can make an important contribution to the understanding of complex
traits. Mutagenic knock-outs of single genes cannot elucidate the function of all genes
involved in a trait that is determined by several loci. Lastly, natural variation-based
analysis allows the elucidation of the mechanisms generating and maintaining the
variation. There has been a recent focus on how genetic variation affects phenotypic traits
and its ecological aspects, i.e. to determine the molecular mechanisms that maintain
phenotypic variation in the wild. Genetic polymorphisms might be evolving neutrally, or
could be transient variants on their way to being eliminated because they are deleterious,
or on their way to fixation because they are beneficial (Mitchell-Olds et al., 2007). Further
studies have begun to elucidate the genome-wide evolutionary processes that shape natural
variation (Nordborg et al., 2005; Schmid et al., 2006; Clark et al., 2007). In contrast to
artificially induced mutations, the mutations underlying natural variation were maintained
by natural selection. Hence, genetic variation that exists in high frequency in nature is
more likely to be adaptive than artificially induced mutations (Shindo et al., 2007). In
conclusion, analysis of genetic variation in natural genomes gives a more complete picture
27

Introduction
to understand plant function in an evolutionary context and will therefore be an important
complement to mutant analyses in the future.
1.6 Quantitative trait loci (QTL) analysis and Recombinant Inbred
Line (RIL) populations
Part of the natural variation is of a qualitative nature, i.e. phenotypes in the progeny of
crosses exhibit only a limited number of discrete classes, determined by single segregating
loci. Positional cloning (mapping), also termed Mendelian genetic analysis, is generally
applied to identify the location of the genes responsible for these monogenic traits. This
strategy relies on the fact that as physical distance between a gene of interest and a
molecular marker decreases, so does the genetic recombination frequency (Jander et al.,
2002). In the course of mapping, progressively closer flanking markers on either side of
the locus of interest determine recombination events, until a region of 10-20 candidate
genes is identified. The genetic basis of the natural variation can then be identified by
several approaches, e.g. phenotypical analysis of T-DNA insertion lines, sequencing the
genetic variation between different accessions, or complementation analysis.
Nevertheless, most variation between accessions is of a quantitative nature due to the
effects of allelic variation at several loci. Combined with environmental effects, these
quantitative trait loci (QTL) determine a continuous phenotypic distribution of the trait in
a segregating population (Koornneef et al., 2004). Therefore, the genotypes at these loci
cannot be directly inferred from the phenotype of a plant, which has historically hampered
genetic analysis (Alonso-Blanco and Koornneef, 2000). Instead, during a QTL analysis,
phenotypic values of the trait are associated with genotypic classes of polymorphic
molecular markers to identify the number and the genetic position of loci that control the
trait variation and their contribution to the total variance of the trait in that experiment. In
principle, QTL detection can be done in the F2 generation (Alonso-Blanco and Koornneef,
2000), as commonly used for Mendelian genetic analysis. However, for QTL analysis the
recombinant inbred line (RIL) populations have proven to be useful. RIL populations are
derived by successively selfing single plants from the progeny of individual F2 plants until
homozygousity is achieved at the F8 generation (Alonso-Blanco and Koornneef, 2000) and
therefore RILs represent individual homozygous mosaics of the original parental genomes
28

Introduction
(Fig. 1.2a). Despite the time that is required to produce them, they offer major advantages
over F2 populations; once homozygousity has been attained, the lines can be propagated
indefinitely without further segregation. Therefore, genotyping of the individual lines only
needs to be done once. Moreover, a trait can be measured in the same population that is
grown in different environments and it can be analysed on several sister plants per line,
which minimises the environmental variation and therefore improves accuracy of QTL
mapping. Furthermore, RIL populations, in contrast to F2 populations, undergo multiple
rounds of meiosis before homozygousity is reached. Therefore, linked genes have a
greater probability of recombination, which results in the greater chance of detecting
recombination events between two linked markers (Burr and Burr, 1991). Currently more
than 60 RIL populations are available that have been produced in different laboratories
and some of them are publicly available (http://www.inra.fr/internet/Produits/vast/). To
allow a proper comparison of the location of genes, it is important to use the same marker
framework for their genotyping, and the markers should be preferentially anchored to the
physical map of the species. Various molecular marker systems have been used for the
genotyping the RIL populations, e.g. SSLPs and AFLP markers. In particular the
development of a high number of SNP markers has offered a useful tool not only for QTL
mapping, but also for Mendelian genetic analysis (Schmid et al., 2003; Schmid et al.,
2006), and these are available via TAIR (http://arabidopsis.org), the Cereon database
(http://www.arabidopsis.org/Cereon/index.jsp) and (http://walnut.usc.edu/2010/an-
arabidopsis-polymorphism-database). By means of QTL mapping, the position of each
QTL is assigned to a genetic interval of 5-50 cM, corresponding, on average, to 1.2-12 Mb
(Koornneef et al., 2004). Therefore, further fine-mapping and validation of the effects of a
QTL requires the generation and analysis of near isogenic lines (NILs) (Fig. 1.2b). In
these lines, the allele of interest from one accession has been introduced only in the
vicinity of the QTL into the genetic background of the other accession (Alonso-Blanco
and Koornneef, 2000; Maloof, 2003).
29

Introduction
Figure 1.2: The generation of RIL and NIL populations and their application in QTL analysis and
validation.
Image modified from: Alonso-Blanco et al., (2000). The graphical genotype of individual plants is depicted
for a representative single pair of chromosomes.
a) To detect and locate quantitative trait loci (QTL), F2 and recombinant inbred lines (RIL) populations can
be used. In both cases, genotyping and phenotyping of each individual line is necessary for the QTL
mapping. RILs are derived by crossing parental accession 1 (PA1) to parental accession 2 (PA2) and
successively selfing single plants from the progeny of individual F2 plants until homozygosity is achieved at
the F8 generation.
b) Near isogenic lines (NILs) differ in the alleles around a single QTL and can be obtained by either the
generation of introgression lines (IL) or by the generation of heterogenous inbred families (HIFs). For the
generation of ILs, a suitable RIL line is recurrently backcrossed to one of the parental accessions. HIFs can
be obtained by continuous selfing of RILs that are not entirely homozygous until the F5 generation.
Genotyping and phenotyping of both types of NILs facilitates the fine mapping of single QTLs and its
phenotypic characterisation to validate the effect of the QTL on the variation of a trait.
30

Introduction
1.7 Thesis aims
The overall aim of this study was to identify genetic determinants of the interaction
between Arabidopsis and the hemibiotrophic ascomycete C. higginsianum. For this, I used
two different approaches, both based on the hypothesis that if an essential susceptibility
factor is not present or not functional, the plant will not support infection by the fungus.
In the first approach, I conducted a forward genetic screen for isolation of EMS- and γ-
radiation-induced Arabidopsis mutants that had lost susceptibility to C. higginsianum to
identify potential host susceptibility factors. In addition, I analysed the C. higginsianum
infection phenotypes of available downy mildew resistant (dmr) (Van Damme et al.,
2005) and powdery mildew resistant (pmr) (Vogel and Somerville, 2000) mutants to test
whether C. higginsianum shares common susceptibility factors with these obligate
biotrophs.
The second approach of my study exploited natural variation in susceptibility to C.
higginsianum between Arabidopsis accessions. It was assumed that accessions lacking an
essential susceptibility factor would show monogenic recessively inherited resistance.
Alternatively, recessive resistance could be due to the presence of a recessive R gene. A
total of 116 accessions were tested for their infection phenotypes after inoculation with C.
higginsianum and the mode of inheritance of resistance was analysed by crossing resistant
accessions to the highly susceptible Ler-0 accession and following segregation. To
identify putative host susceptibility factors, accessions that were recessively resistant, i.e.
having susceptible F1 progenies and F2 progenies segregating 3:1 (susceptible : resistant),
were chosen. In parallel, QTL analysis was carried out for two RIL populations
originating from crosses of resistant accessions to Ler-0. To identify the genetic basis of
the identified natural variation, resistance in these accessions was mapped and candidate
genes were analysed according to their possible function in recessive resistance. In
addition, the cytological phenotypes of resistant accessions were characterised in detail to
obtain clues to the mechanism of resistance.
31

32

Materials and Methods
2 Materials and Methods
2.1 Materials
2.1.1 Chemicals and general equipment suppliers
ADGEN (Auchincruive, UK)
Boehringer Mannheim GmbH (Mannheim, Germany)
Carl Roth GmbH + Co. KG (Karlsruhe, Germany)
Invitrogen (Karlsruhe, Germany)
Merck (Darmstadt, Germany)
New England BioLabs (NEB) (Ipswich, MA, USA)
Operon Biotechnologies GmbH (Cologne, Germany)
Oxoid GmbH (Wesel, Germany)
QIAGEN GmbH (Hilden, Germany)
Sigma-Aldrich Chemie GmbH (Deisenhofen, Germany)
2.1.2 Antibiotics
Hygromycin 100 µg/mL
Kanamycin 50 µg/ml
Stock solutions stored at -20°C.
2.1.3 Media
Unless otherwise indicated, all media were sterilised by autoclaving at 121°C for 20
minutes. Heat sensitive solutions were sterilised using filter sterilisation units prior to
addition of autoclaved components. For the addition of antibiotics and other heat liable
components the solution or media were cooled down to 55°C.
33

Materials and Methods
E. coli Media:
LB (Lauria Bertani) Broth
Tryptone peptone 1 %
Yeast extract 0.5 %
NaCl 0.5 %
In H2O
For selection Kanamycin 50 µg/mL
Agar plates
1.5-2 % agar was added to the LB broth
For selection Kanamycin 50 µg/mL
Colletotrichum media:
Mathur’s medium
Glucose 2.8 g
MgSo4·7H20 1.22 g
KH2PO4 2.72 g
Oxoid Mycological peptone 2.8 g
Add to 1L with dH20
Agar plates or conical flasks
1.5-2% agar was added to the Mathur’s medium
2.1.4 Buffers and solutions
Agarose gel (1 and 4%)
Agarose 1 g/ 4 g
TAE buffer (10x) 100 mL
Ethidium bromide stock (10 mg/ml) 2 µL
Aniline Blue staining solution
Aniline Blue (water soluble) 0.01% (w/v)
K2HPO4 0.07 M
In H2O
34

Materials and Methods
DAB (3,3’Diaminobenzidine) staining solution
DAB 1 mg/mL
In H2O, pH was adjusted to 3.8 with HCL
Edwards buffer
Tris-HCl pH 7.5 200 mM
NaCl 250 mM
EDTA 25 mM
SDS 0.5%
In H2O
Loading buffer (Orange G Dye 6x)
Sucrose 40%
Orange G (Merck) 0.5%
In TE buffer
PCR buffer
Tris-HCL pH 9 100 mM
KCL 500 mM
MgCl2 15 mM
TritonX-100 1%
In H2O
TAE (Tris/acetate/EDTA) buffer (10x)
Tris base 24.2 g
Glacial acetic acid 5.71 mL
Na2EDTA·2H2 3.72 mL
H2O to 1L
35

Materials and Methods
TE (Tris/EDTA) buffer
Tris/HCL (pH 8.0) 10 mM
EDTA (pH 8.0) 1 mM
Tris/HCL 1 M
Tris-Base 121 g
H2O to 1 L
121 g Tris base was dissolved in 800 mL, adjusted to the desired pH with
concentrated HCL, and then adjusted to the volume of 1 L with H2O.
2.1.5 Organisms
2.1.5.1 Pathogens
C. higginsianum strains (IMI 349061-2, IMI 349061-GFP)
E. coli DH10B (BIBAC-library)
H. parasitica (isolate Cala2)
2.1.5.2 Plant material
Seeds of Arabidopsis accessions were obtained from NASC (http://arabidopsis.info/) and
SASSC (http://www.brc.riken.jp/lab/epd/SASSC/index.html). Arabidopsis accessions
used in this study are listed in Table 3.2.
Seeds of the Ler-0 x Kas-2 and the Ler-0 x Kondara RIL populations were kindly
provided by Dr. M. Reymond, Cologne, Germany.
Re-mutagenised EMS Ler-0 rar1-13 seeds were kindly provided by Dr. P. Muskett and
Dr. J. Parker, Cologne, Germany.
EMS mutagenised Ler-0 seeds were obtained by Lehle Seeds, USA
γ-radiation mutagenised Ler-0 seeds were kindly provided by Dr. E. van der Vossen,
Wageningen, Netherlands.
Seeds of the dmr mutants were kindly provided by Dr. G. Van den Ackerveken, Utrecht,
Netherlands.
36

Materials and Methods
2.1.6 Oligonucleotides
Primers used in the study were synthesized by Operon. Sequence and length are listed in
the Table SD 2, supplementary Data. Primers were stored in 100 µM stock solution in
water at -20°C.
2.1.7 Enzymes
2.1.7.1 Restriction endonucleases
Restriction enzymes were purchased from NEB and used following the manufacture’s
instructions.
2.1.7.2 Nucleic acid modifying enzymes
Standard PCR reactions were performed using homemade Taq DNA polymerase.
SuperScript™ II RNase H Reverse Transcriptase (Invitrogen)
2.1.8 Software, databases and other internet resources
Analysis and alignment of sequencing chromatograms
SeqMan (Lasergene)
Sequence analysis and comparison
http://www.ncbi.nlm.nih.gov/BLAST/
Databases for genomic sequences of Arabidopsis
http://www.arabidopsis.org
http://www.tigr.org/tdb/e2k1/ath1/ath1.shtml
Searching for SSLP and CAPs markers
http://www.arabidopsis.org
http://msqt.weigelworld.org/
http://www.inra.fr/internet/Produits/vast/
Primer design
http://biotools.umassmed.edu/bioapps/primer3_www.cgi
CAPs marker design
http://helix.wustl.edu/dcaps/dcaps.html
Leica Confocal Imaging Software
37

Materials and Methods
Leica Confocal Software, Version 2.61, Leica Microsystems Heidelberg
GmbH, Germany
Software for RIL mapping
Van Ooijen, J.W., 2004. MapQTL® 5, Software for the mapping of the
quantitative trait loci in experimental populations. Kyazma B.V., Wageningen,
Netherlands
38

Materials and Methods
2.2 Methods
2.2.1 Growth and culturing of Arabidopsis
Plants were sown on soil substrate and stratified for two days at 4°C in darkness to allow
an even germination. Germination was induced by transfer of the plants to a light chamber
with 21°C during the day, 21°C during the night and a relative humidity of 50%. All
plants were grown for three weeks at a day/night cycle of 10 and 14 hours, respectively.
For inoculation with C. higginsianum, plants were transferred to another light chamber
(see 2.2.6.1).
For mapping experiments, F2 plants of the respective mapping population were grown in
96-well trays on soil together with the respective parents as control and inoculated at an
age of three weeks.
2.2.2 Generation of Arabidopsis F1 and F2 progeny
Fine tweezers and a magnifying-glass were used to emasculate an individual flower. To
prevent self-pollination, only flowers that had a well-developed stigma but immature
stamen were used for crossing. Fresh pollen from three to four independent donor stamens
was dabbed onto each single stigma. Mature siliques containing F1 seed were harvested
and allowed to dry. Approximately five F1 seeds per cross were grown as described above
and allowed to self pollinate. Produced F2 seeds were collected and stored.
2.2.3 EMS mutagenesis
About 10,000 seeds of Ler eds1-2 were imbibed in a humid chamber for 2 days at 4°C.
The seeds were then transferred to a Falcon tube which was filled with 50 mL deionised
water and 0.15 mL of 0.3 % methanesulfonic acid ethyl ester (EMS) solution and
incubated for 9 hours on a shaker. Eventually, seeds were extensively washed with 2 L of
sterile water. For planting the seeds were transferred to 1 L of 0.08% agarose solution and
5 mL of this solution was pipetted per TEKU tray, filled with soil (approx. 50 seeds per
TEKU tray). In about 10% of the M2 families albino mutants were detected. 773
independent M2 families were created.
39

Materials and Methods
2.2.4 Growth and sub-culturing of pathogens
2.2.4.1 Colletotrichum higginsianum
3 mL of spore suspension were dispersed over Mathur’s agar medium (Mathur et al.,
1950), dispensed in 250 ml Ehrlenmeyer flasks and cultured at 20-25°C (Sherriff et al.,
1994). Conidia could be harvested at any time from 6-30 days, but 9-14 days was
optimum for sub-culturing. For the harvest of conidia, 5 mL of sterile water was added to
each flask and the flasks were vigorously shaken to suspend the conidia.
2.2.4.2 Escherichia coli
For sub-culturing of bacterial cultures, colonies were streaked on LB medium,
supplemented with Kanamycin for selection and cultured at 37°C.
2.2.4.3 Hyaloperonospora parasitica
H. parasitica isolate Noco2 was maintained as mass conidiosporangia cultures on leaves
of the susceptible Arabidopsis accession Ler-0 for 7 days. Leaf tissue from infected
seedlings was harvested into a 50 mL Falcon tube 7 d after inoculation. Conidiospores
were collected by vigorously vortexing harvested leaf material in sterile dH2O for 15 sec
and after the leaf material was removed by filtering through miracloth the spore
suspension was adjusted to a concentration of 4x10⁴ spores/mL dH2O using a Neubauer
counting cell chamber. Plants to be inoculated had been grown under short day conditions
as described above. H. parasitica conidiospores were applied onto two-week-old seedlings
by spraying until imminent run-off using an aerosol-spray-gun. Inoculated seedlings were
kept under a propagator lid to create a high humidity atmosphere and incubated in a
growth chamber at 18°C and a 10 h light period.
2.2.5 Glycerol stock preparation
To maintain the properties of a fungal or bacterial culture, a stock of frozen fungal
conidia, respectively of frozen bacteria was maintained.
To prepare a glycerol stock, a concentrated aqueous fungal spore, respectively bacterial
suspension was mixed with an equal volume of sterile 30% glycerol, aliquoted in 1 mol
volumes into cryo-tubes and snap-frozen in liquid nitrogen for storage at -80°C.
40

Materials and Methods
2.2.6 Inoculation of Arabidopsis with pathogens
2.2.6.1 Inoculation of the plants with C. higginsianum isolates
A fungal spore suspension was prepared in 15 mL sterile water by vigorous shaking of the
Erlenmeyer flask. Spore concentrations were determined by use of a haemocytometer and
spore-suspensions were adjusted to the desired concentrations (5x10⁵ spores/mL for
microscopical analysis and 2x10⁶ spores/ mL for phenotyping of the F2, F3 progenies,
allelism tests and tests of T-DNA insertion mutant lines) by adding sterile water.
Plants were spray-inoculated by use of an atomiser and sprayed plants were sealed inside a
plastic propagator. The lid of the propagator was sprayed with sterile water to provide
100% relative humidity. The propagators were incubated at 25°C in a growth chamber
with a 16 h photoperiod and a PPFR of 80 µmol m-2 s-1 and 81% relative humidity.
2.2.6.2 Inoculation of the plants with H. parasitica
Inoculation procedure of H. parasitica was identical to procedure of sub-culturing of (see
2.2.4.3)
2.2.7 Arabidopsis mutant screen (EMS and γ-radiation mutated M2 seeds)
For screening EMS Ler-0 (Lehle) and Ler eds1-2 M2 mutant pools, approx. 20 mg of
seeds were grown on soil in a tray (45 x 30 cm). Plants were inoculated after two weeks.
For Ler rar1-13 EMS mutants and γ-radiation mutated Ler-0 seeds, individual M2 lines
were grown separately (approx. 10-20 plants per line). Growth and fungal treatment of
plants was carried out as described in section 2.2.1 and section 2.2.6.1.
2.2.8 Determination of infection phenotypes
For determination of phenotypes, a disease score (DS) was applied, based on numerical
rating of the extent of pathogen colonisation of the host and the severity of host
symptoms. DS 0 describes an intact plant with no symptoms or small pin-point brown
flecks. Fungal growth was restricted to the penetration attempt of appressoria or to the
production of primary biotrophic hyphae. Plants of the DS 1 were mostly intact with
necrotic flecks or limited lesions. Secondary necrotrophic hyphae were either absent or
very restricted in extent. DS 2 referred to plants with partially collapsed leaves and with
41

Materials and Methods
large brown necrotic lesions and some tissue maceration and water-soaked regions on the
leaf surface. Partially, the plants collapsed. In limited regions of the plant secondary
mycelium could be observed with few acervuli. Plants of the category DS 3 were
completely collapsed and the tissue was extensively macerated and water-soaked.
Eventually, the plants disintegrated. The plant material got replaced by fungal secondary
hyphae that produced acervuli.
For the screening of Arabidopsis accessions and their according F1 progenies, at least five
plants per line were inoculated with C. higginsianum. Infection phenotypes of resistant
accessions and of RIL lines were confirmed by a second, respectively a third independent
test with parental accessions as control. Analysis of RIL populations was carried out
without microscopical determination of fungal growth.
2.2.9 Nucleic acid extraction
2.2.9.1 RNA extraction from Arabidopsis
Total RNA was prepared from three-week-old plant material. Liquid nitrogen frozen
samples (approximately 50 mg) were homogenised 2x15 sec to a fine powder using a
Mini-Bead-Beater-8TM (Biospec Products) and 1.2 mm stainless steel beads (Roth) in 2
mL centrifuge tubes. After the first 15 sec of homogenisation, samples were transferred
back to liquid nitrogen and the procedure was repeated. 1 mL of TRI® Reagent (Sigma)
was added and samples were homogenised by vortexing for 1 min. For dissociation of
nucleoprotein complexes the homogenised sample was incubated for 5 min at room
temperature. 0.2 mL of chloroform was added and samples were shaken vigorously for 15
sec. After incubation for 3 min at room temperature samples were centrifuged for 15 min
at 12000g and 4°C. 0.5 mL of the upper aqueous, RNA containing phase were transferred
to a new microcentrifuge tube and RNA was precipitated by adding 0.5 volumes of
isopropanol and incubation for 10 min at room temperature. Subsequently, samples were
centrifuged for 10 min at 12000g and 4°C. The supernatant was removed and the pellet
was washed by vortexing in 1 mL of 75% ethanol. Samples were again centrifuged for 5
min at 7500g and 4°C, pellets were air dried for 10 min and dissolved in 50 µL DEPC-
H2O. All RNA extracts were adjusted to the same concentration with DEPC-H2O.
Samples were stored at -80°C.
42

Materials and Methods
2.2.9.2 DNA extraction from Arabidopsis
The extraction of DNA from Arabidopsis leaf material was performed after the method of
(Edwards et al., 1991), modified.
Arabidopsis leaf material (at least 10x10mm2 leaf surface) was harvested and the samples
were frozen immediately in liquid nitrogen until further processing, or kept cool on ice for
direct processing. The samples were ground and immediately 400 µL of Edwards buffer
was added and incubated for 10-60 min at room temperature. The samples were then
centrifuged for 5 min at 13000rpm and the supernatant was transferred into a new 1.5 mL
reaction tube and 300 µL of cold (-20°C) 2-Propanol was added and incubated for 2 min at
room temperature. This followed centrifugation for 5 min at 13000rpm and the
supernatant was discarded. To wash the pellet 300 µL of 70% Ethanol was added and
carefully mixed and the samples were then centrifuged for 5 minutes at 13000rpm. The
supernatant was discarded and the pellet was dried and then resuspended in 100 µL sterile
water.
2.2.9.3 Plasmid preparation
High quality plasmid DNA was isolated using the QIAGEN Midi prep kit, following the
manufacture’s manual.
2.2.10 Reverse transcription-polymerase chain reaction (RT-PCR)
RT-PCR was carried out in two steps. SuperScript™ II RNase H- Reverse Transcriptase
(Invitrogen) was used for first strand cDNA synthesis by combining 1-1.5 µg template
total RNA, 1 µL oligo dT18V (0.5 µg/ µL, V standing for an variable nucleotide), 5 µL
dNTP mix (each dNTP 2.5 mM) in a volume of 13.5 µL (deficit made up with DEPC-
H2O). The sample was incubated at 65°C for 10 min to destroy secondary structures
before cooling on ice. Subsequently the reaction was filled up to a total volume of 20 µL
by adding 4 µL of 5x reaction buffer (supplied with the enzyme), 2 µL of 0.1M DTT and
0.5 µL reverse transcriptase. The reaction was incubated at 42°C for 60 min before the
enzyme was heat inactivated at 70°C for 10 min. For subsequent normal PCR, 1 µL of the
above RT-reaction was used as cDNA template. As template, total RNA for the reverse
transcription reaction was not DNase treated, a control reaction for each RNA preparation
was performed in which the reverse transcription reaction was incubated without reverse
43

Materials and Methods
transcriptase enzyme (enzyme replaced by equal volume of DEPC-H2O) to check in the
following PCR for contamination by genomic DNA.
2.2.11 Polymerase chain reaction (PCR)
Amplification of specific DNA fragments was carried out by PCR. Template DNA from a
variety of sources was used. The amount of the template DNA was dependent on the
reaction. The reaction was repeated for the appropriate number of cycles using the
following conditions.
Reaction mix:
10x PCR buffer 2 µL
2.5 mM dNTPs 2 µL
1 mM primer forward 1 µL
1 mM primer reverse 1 µL
Taq-DNA-Polymerase 0.5 µL
DNA template 1 µL
Added to 20 µL with sterile H20
PCR-cycler conditions:
94 °C 3 min
(94 °C 15 sec, 56 °C 30 sec, 72 °C 30 sec) 10x
(94 °C 30 sec, 53 °C 30 sec, 72 °C 30 sec) 27x
72 °C 10 min
15 °C 5 min
2.2.12 Restriction endonuclease digestion of DNA
Restriction digests were carried out using the manufacture´s recommended conditions.
Typically, reactions were carried out in 0.5 mL tubes, using 1 µL of restriction enzyme per
10 µL reaction. All digests were carried out at the appropriate temperature for a minimum
of 1 h.
44

Materials and Methods
2.2.13 Agarose gel electrophoresis
Agarose gel electrophoresis was used to separate DNA fragments according to their size.
12 µL of PCR products were loaded in 6x loading dye on a 4% agarose gel for mapping
with PCR markers, otherwise on a 1% agarose gel. Electrophoresis was performed in 1x
TAE buffer at 130 V depending on the fragment size and the separation needed. DNA
fragments were visualised by staining with Ethidium bromide and could be detected in a
transilluminator.
2.2.14 DNA sequencing
DNA sequences were determined by the Automatisches DNA-Isolierung und
Sequenzierung (ADIS-Unit) at the MPIZ on Applied Biosystems (Weiterstadt, Germany)
Abi Prism 377 and 3700 sequences usig Big Dye-terminator chemistry (Sanger et al.,
1977).
2.2.15 Sequence alignment and analysis
Trace files of sequence chromatograms obtained with forward and reverse primers were
aligned for each accession and analysed with DNASTAR program of the Lasergene
software (see 2.1.8).
2.2.16 Microscopical analysis
2.2.16.1 Determination of penetration efficiency
At least four leaves of three-week-old plants per genotype were inoculated with a 5x10⁵
spores/ mL concentrated spore suspension of C. higginsianum and harvested at 2 and 3
days after inoculation. Leaves were destained in ethanol:chloroform (3:1) and solution and
mounted on slides in lactophenol. Between 200-600 appressoria, equally distributed
between the sampled leaves, were counted per genotype and analysed for a successful
hyphae production.
2.2.16.2 3-3’Diaminobenzidine (DAB) staining for hydrogen peroxide accumulation
At least four leaves of three-week-old plants per genotype were inoculated with a 5x10⁵
spores/ mL concentrated spore suspension of C. higginsianum and harvested at 2 and 3
45
Materials and Methods
days after inoculation. Leaf-stems were immersed in DAB-staining solution and allowed
to take up DAB solution through their petiole under high humidity conditions in darkness
overnight. Then the leaves were transferred into glass vials and destained in methanol
overnight, followed by an overnight incubation in chloral hydrate. Chloral hydrate was
replaced with 70% glycerol and the leaves were mounted in 70% glycerol solution.
Between 200-600 appressoria, equally distributed between the sampled leaves, were
counted per genotype and analysed for a successful hyphae production and presence of a
DAB staining.
2.2.16.3 Aniline Blue staining of callose deposition
At least four leaves of three-week-old plants per line were inoculated with a 5x10⁵ spores/
mL concentrated spore suspension of C. higginsianum and harvested at 2 and 3 days after
inoculation. After harvest, the leaves were decolourised in ethanol:chloroform (3:1)
overnight, followed by lactophenol incubation overnight. Leave samples were re-hydrated
by transfer to 75%, then 50% and 25% lactophenol in water, each incubation step for 15
minutes, and was then followed by two changes of pure sterilised water. Samples were
stained with Aniline Blue solution for 24-72 h at 4°C and mounted in Aniline Blue
solution. The samples were analysed microscopically under UV-light excitation. Between
200-600 appressoria, equally distributed between the sampled leaves, were counted per
genotype and analysed for a successful hyphae production and presence of Aniline Blue
staining.
2.2.16.4 Quantification of C. higginsianum sporulation
To determine sporulation levels, plants were harvested 4 and 5 days after inoculation in a
50 ml Falcon tube and vortexed vigorously in 10 ml water for 15 sec. 10 µl of this spore
suspension were removed twice and spores were counted under a light microscope using a
Neubauer counting cell chamber. For each tested Arabidopsis genotype, three pots, each
containing 9 plants, were inoculated per experiment and harvested spores from all plants
of each pot were counted with sporulation levels expressed as the number of spores per
gram fresh weight.
46
Materials and Methods
2.2.17 Quantification of hyphal growth by enzyme-linked immunosorbent
analysis (ELISA)
For each tested Arabidopsis genotype, 1 g of inoculated plant tissue was harvested for
three replicates per genotype per experiment. ELISA was conducted following
manufacturer’s manual (ADGEN).
2.2.18 Mapping
2.2.18.1 Positional cloning with PCR-based molecular markers
F2 plants were grown, inoculated and phenotyped as described in section 2.2.1, 2.2.6.1 and
2.2.8. For a first localisation of the target gene in the genome, DNA of 26 resistant and 10
susceptible plants of a Ler-0 x Ws-0 F2 mapping population was analysed with 27 PCR-
based molecular markers, distributed throughout the whole genome, of the marker set
published at http://www.inra.fr/internet/Produits/vast/msat.php and the SSLP marker set
described by Lukowitz et al. (2000). Following a detection of a putative association with
markers to one arm of one chromosome, additional F2 plants were phenotyped, and plants
exhibiting a resistant infection phenotype were genotyped with PCR-markers located on
the identified arm of the chromosome to identify recombinants. For this, additional
molecular markers (SSLP, CAPs and dCAPs) were designed (see 2.1.8), utilised for
genotyping with progressively closer markers until no further recombinants were found.
The F3 progeny (15-20 plants per line) originating from F2 plants that are showing a
recombination event for one of the markers flanking the region of interest, were
phenotyped to confirm the targeted gene region.
2.2.18.2 QTL mapping and analysis
The RIL populations and their respective parental accessions were grown in 96-well trays
as described in section 2.2.1. At an age of three weeks, the plants were inoculated with C.
higginsianum (see 2.2.6.1) to determine infection phenotypes and to assign them disease
scores (DS) (see 2.2.8). Each RIL line was tested in two independent experiments, three
plants per experiment. Broad sense heritability (h2) was estimated for each trait by using
the following equation:
h2 = VG/(VG + VE)
47

Materials and Methods
where VG is the variance between RILs and VE is the variance within RILs. QTL
detections were performed by using the software package MapQTL 5® (Kyazma B.V.,
Wageningen, Netherlands) (see 2.1.8) as described in its reference manual
(http://kyazma.nl). In a first step, QTL were detected by interval mapping to determine the
putative QTL involved in the variation of the considered trait. Thereafter, the closest
marker to each local logarithm-of-odds (LOD) score peak was determined as a cofactor
(Van Ooijen and Maliepaard, 1996; Van Ooijen et al., 2000). LOD threshold values
applied to declare the presence of QTL were estimated by performing permutation tests
implemented in MapQTL version 5.0. On average, the threshold obtained (α = 5%)
corresponds to a 2.5 LOD. The additive effects of the detected QTL were estimated from
composite interval mapping results. The contribution of each detected QTL to the total
variance (R2) was estimated by variance component analyses.
48

Results
3 Results
3.1 Analysis of Arabidopsis loss-of-susceptibility mutants
3.1.1 Screen of Arabidopsis mutant pools for loss of susceptibility
To identify host genes involved in the establishment of a successful C. higginsianum
infection, Arabidopsis mutants were screened for loss of susceptibility to the fungus. I
hypothesised that a mutation in a plant susceptibility factor which is essential for the
support of pathogenesis of C. higginsianum in Arabidopsis should result in loss of
susceptibility, i.e. gain of resistance. Therefore, different lines of a susceptible genetic
backgrounds, i.e. Ler rar1-13, Ler eds1-2 mutants and Ler-0 wild type, were chemically
mutagenised with EMS treatment. Seeds of Ler-0 wild type mutated by γ-radiation
treatment were kindly provided by Dr. E. van der Vossen (Wageningen, NL).
Due to the stringent conditions of the inoculation process, i.e. young developmental stage
of plants and high inoculum concentration, only plants showing a gain of resistance had
survived seven days after spray-inoculation with C. higginsianum (Fig. 3.1). The mutant
plants with a susceptible infection phenotype were strongly macerated or completely
collapsed. This allowed a rapid screen of a large number of plants.
Figure 3.1: Forward genetic screen of EMS mutagenised Arabidopsis M2 plants seven days after
inoculation with Colletotrichum higginsianum.
Arabidopsis Ler-0 was mutagenised by ethylmethane sulfonate (EMS) treatment. Presented are the infection
phenotypes of three-week-old M2 plants, seven days after inoculation with C. higginsianum.
49

Results
Approx. 65,500 ethylmethane sulfonate (EMS) -mutagenised Ler-0 M2 plants obtained
commercially from Lehle seeds (USA), were screened by spray-inoculation of two-week-
old plants with C. higginsianum spore suspension. Forty-five plants were found to exhibit
reduced susceptibility at five days after inoculation. However, subsequently these were
identified not to be Ler-0 genetic background, probably due to seed contamination while
generation. Their intermediate susceptible phenotypes were in accordance with the
infection phenotype identified for the Col-0 accession (Fig. 3.7). In addition, 22,000 EMS
mutants, generated in a Ler rar1-13 mutant background by Dr. P. Muskett (Cologne,
Germany), were tested for their infection phenotypes. The rar1-13 mutation did not affect
susceptibility to C. higginsianum (data not shown). I also generated an EMS mutant pool
in the Ler eds1-2 mutant background. The mutation in the EDS1 gene rendered the plants
more susceptible to C. higginsianum than the Ler-0 wild type (Fig. 3.2) (Liu et al., 2007a).
Figure 3.2: Macroscopic infection phenotype of Arabidopsis Ler-0 wild-type and Ler eds1-2 mutant
plants six days after inoculation with Colletotrichum higginsianum.
Three-week-old Arabidopsis Ler-0 wild-type and Ler eds1-2 mutant plants were spray-inoculated with C.
higginsianum. Presented is the macroscopic infection phenotype at 6 dpi. Bar, 2 cm.
Therefore, this mutant background was chosen for re-mutagenesis in order to facilitate a
clear distinction between susceptible and resistant phenotypes in the mutant screen, and
96,000 plants of this mutant pool were screened. A further 24,000 plants of the Ler-0 γ-
radiation mutant pool were tested for a loss of susceptibility. Hence, a total number of ~
207,500 mutagenised M2 plants were screened (Tab. 3.1) from different genetic
backgrounds that were all highly susceptible to C. higginsianum. Of these, 309 lines were
identified in the primary screen as having reduced susceptibility compared to wild type.
These plants were grown on for seed production and their phenotypes were retested in the
50
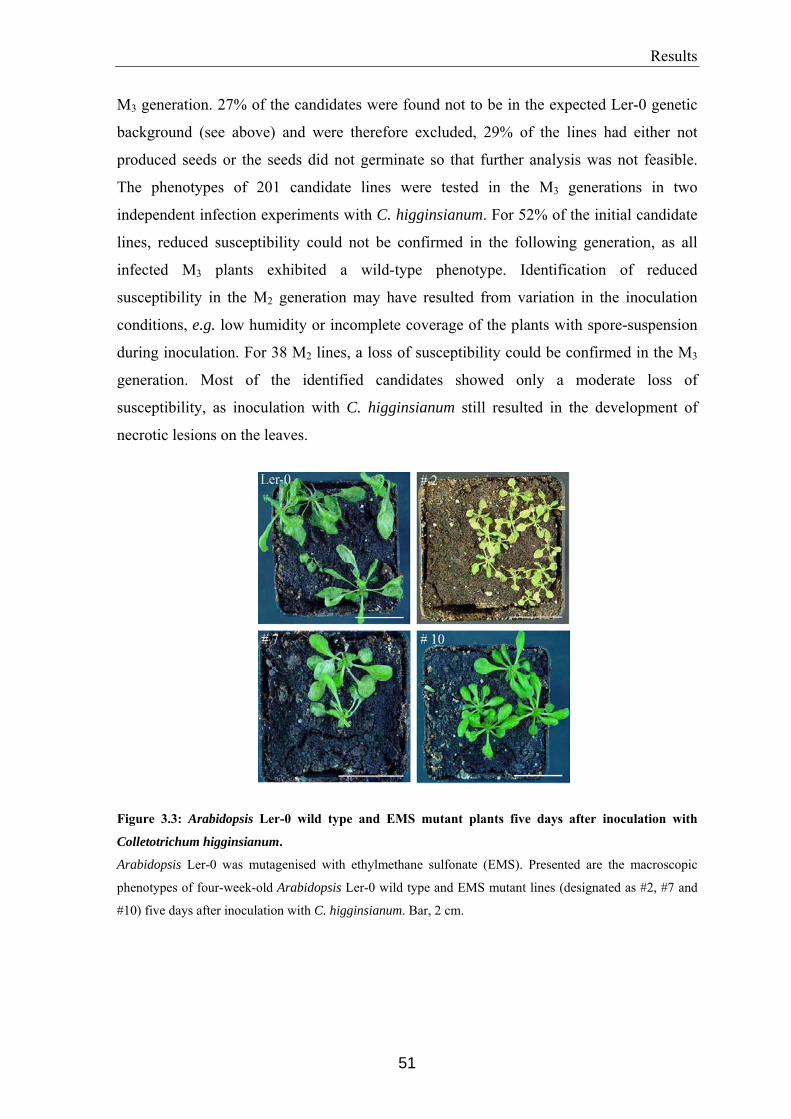
Results
M3 generation. 27% of the candidates were found not to be in the expected Ler-0 genetic
background (see above) and were therefore excluded, 29% of the lines had either not
produced seeds or the seeds did not germinate so that further analysis was not feasible.
The phenotypes of 201 candidate lines were tested in the M3 generations in two
independent infection experiments with C. higginsianum. For 52% of the initial candidate
lines, reduced susceptibility could not be confirmed in the following generation, as all
infected M3 plants exhibited a wild-type phenotype. Identification of reduced
susceptibility in the M2 generation may have resulted from variation in the inoculation
conditions, e.g. low humidity or incomplete coverage of the plants with spore-suspension
during inoculation. For 38 M2 lines, a loss of susceptibility could be confirmed in the M3
generation. Most of the identified candidates showed only a moderate loss of
susceptibility, as inoculation with C. higginsianum still resulted in the development of
necrotic lesions on the leaves.
Figure 3.3: Arabidopsis Ler-0 wild type and EMS mutant plants five days after inoculation with
Colletotrichum higginsianum.
Arabidopsis Ler-0 was mutagenised with ethylmethane sulfonate (EMS). Presented are the macroscopic
phenotypes of four-week-old Arabidopsis Ler-0 wild type and EMS mutant lines (designated as #2, #7 and
#10) five days after inoculation with C. higginsianum. Bar, 2 cm.
51

Results
Figure 3.4: Expression analysis of PR-1 and PDF1.2 in uninoculated Arabidopsis Ler-0 wild-type,
EMS mutants and the cpr5 mutant.
Total RNA was extracted from three-week-old, uninoculated Arabidopsis Ler-0 wild-type plants, EMS
mutant plants (designated as #2, #7 and #10) and cpr5 mutant plants and the expression of the marker genes
PR-1 and PDF1.2 was analysed by semi-quantitative RT-PCR. Equal application of template RNA for the
reverse transcription reaction was shown by a control PCR reaction detecting plant actin. Numbers of cycles
for each PCR reaction are indicated below.
In contrast, plants of the mutant lines designated #2 and #10 in a Ler-0 background
exhibited much less severe disease symptoms than the other candidate mutants (Fig. 3.3).
The observed loss of susceptibility of the putative mutants was expected to result from
either loss of a susceptibility factor or from constitutive or enhanced expression of plant-
defence resistance mechanisms, as found for the cpr, edr and acd mutants (Glazebrook,
2001). To test whether plant defence pathways were constitutively activated, the
expression levels of marker genes for the SA and the JA/ET defence pathways, namely
PR-1 (Santamaria et al., 2001) and PDF1.2 (Penninckx et al., 1996), were determined in
uninoculated plants of the mutant lines #2 and #10. In addition, mutant #7 was analysed,
which showed reduced susceptibility, but to a lesser extent than lines #2 and #10 (Fig.
3.3). The PR-1 and PDF1.2 expression levels of uninoculated mutant plants was compared
to the expression in uninoculated wild type Ler-0 plants and the cpr5 mutant, for which a
constitutively increased PR-1 level had been demonstrated (Bowling et al., 1997) (Fig.
3.4). cpr5 also exhibited an unexpected but faint increase of PDF1.2 expression. The level
of PR-1 expression in the mutant line #10 was similar to that of the cpr5 mutant. The
increased PR-1 expression suggests identification of a mutant with a constitutive
52

Results
activation of defence pathways. In accordance with this finding, mutant #10 also exhibited
increased resistance to the oomycete pathogen H. parasitica (virulent isolate Cala2), as
determined by reduced sporulation of the pathogen and increased plant hypersensitive cell
death responses (data not shown). However, these results need to be confirmed due to
increased PDF1.2 expression in cpr5 that is in contrast to previous studies. An elevated
level of PR-1 expression was also detected for the mutant #2, hinting to effects of the
mutation on the SA defence pathway rather than a host susceptibility factor. In contrast,
the mutant #7 did not exhibit an increased expression of either PR-1 or PDF1.2,
suggesting that the gain of resistance may be the result of a mutation in a bona fide
susceptibility factor. The expression of PR-1 and PDF1.2 was in fact lower than the
expression level of these genes in the unchallenged wild type Ler-0 plants. Therefore,
repression of one defence pathway due to a mutual antagonism between the SA and JA/ET
defence pathways can probably be excluded. The reduction of susceptibility to C.
higginsianum in mutant #7 (Fig. 3.4), as well as for the additional 35 candidates that have
been identified in the initial screen of the M2 populations, was not sufficiently clear-cut to
allow a reliable identification of the mutant phenotype during a mapping process. As this
was a prerequisite for the identification of the mutated locus, mapping could not be carried
out for any of these initial candidates. Therefore, the screen of EMS and γ-radiation
induced mutant lines did not result in the identification of loss-of-susceptibility mutants
that allowed a subsequent identification of putative susceptibility factors.
Table 3.1: Screen of Arabidopsis plants mutagenised with EMS and γ-
radiation treatment for reduced susceptibility to C. higginsianum
Total number of tested M2 plants 207,000
Number of initial candidates in M2 generation 309
No germination/ no seeds of M3 generation 90
Wild-type phenotype in M3 generation 163
Reduced susceptibility in M3 generation 38
Increased PR-1 expression 2
M2 plants of mutagenised pools were sprayed with C. higginsianum spore suspension and
screened for reduced fungal susceptibility at five days after inoculation. The phenotype of
each M2 line was then tested by two independent infection assays in the M3 generation.
53

Results
3.1.2 Phenotypic analysis of dmr Arabidopsis mutants
In a forward genetics approach, the Arabidopsis downy mildew resistant (dmr) mutants
were isolated by van Damme et al. (2005) (see 1.4.4). As in the present study, the authors
aimed to identify plant genes required for disease susceptibility, but to the obligate
biotrophic pathogen, the oomycete H. parasitica. Similarly to the screen described in
section 3.1.1, seeds of the susceptible genotype Ler eds1-2 were re-mutagenised to induce
mutations in potential susceptibility factors that were expected to result in reduced or
complete loss of susceptibility to H. peronospora. The mutants dmr1–dmr6 were found to
exhibit a significantly reduced susceptibility to H. parasitica (Van Damme et al., 2005)
(see 1.4.4). It was of interest to determine whether other pathogen species that exhibit an
intracellular biotrophic lifestyle similar to H. parasitica, require at least some of the
specific plant-pathogen interaction mechanisms identified for Arabidopsis and H.
parasitica (Van Damme et al., 2005; Van Damme, 2007; van Damme et al., 2008). As the
infection strategy of the hemibiotrophic ascomycete C. higginsianum includes an
intracellular biotrophic phase, mutations in the DMR genes might cause at least a partial
loss of susceptibility to C. higginsianum. In order to test this, the infection phenotypes of
the mutants dmr1-1, dmr1-2, dmr1-3, dmr1-4, dmr2, dmr5 and dmr6 were analysed
macroscopically and microscopically following C. higginsianum inoculation (Fig. 3.5).
The mutants dmr1-1, dmr1-2, dmr1-3, dmr2 and dmr5 showed an infection phenotype that
was indistinguishable from that of the genetic background line Ler eds1-2. For all these
mutant lines the plants were strongly affected by the fungal growth, as shown by a partial
or complete collapse of the plants at 8 dpi (Fig. 3.5 a). Fungal growth, visible by the
constitutive expression of the Green Fluorescence Protein (GFP) in the mycelium of C.
higginsianum, has a similar extent in these genotypes at three days after inoculation with
C. higginsianum (Fig. 3.5 b). In contrast, the mutant lines dmr1-4 and dmr6 exhibited a
clearly reduced susceptibility to C. higginsianum infection. Fungal colonies observed in
the leaves of both mutant lines were few and restricted in size and the extent and number
of water-soaked lesions produced were similarly reduced compared to Ler eds1-2 plants
infected by C. higginsianum. Therefore, I concluded that the plant factors affected in
dmr1-4 and dmr6 are not exclusively required for the infection of Arabidopsis by H.
parasitica, but also for the pathogenesis of C. higginsianum in its host. Interestingly,
dmr1-4 was the only allele of four dmr1 mutant alleles that showed loss of susceptibility.
54

Results
55

Results
Figure 3.5: Macroscopic and microscopic infection phenotypes of Arabidopsis Ler eds1-2 and dmr
mutant plants after inoculation with Colletotrichum higginsianum.
(a) Column shows four-week-old Arabidopsis Ler eds1-2 and dmr mutant plants eight days after inoculation
with C. higginsianum. Bar, 3 cm.
(b) The images show the overlay of a projection of 15-20 confocal micrographs taken in the green and red
fluorescence channel. Leaf samples of three-week-old Arabidopsis mutant plants were taken three days after
inoculation with a C. higginsianum strain that constitutively expresses GFP. Fungal colonies are visible by
the green fluorescence of the GFP expressed in the cytoplasm of fungal hyphae. Intact chlorophyll of living
plant cells is visible by its red autofluorescence. Bar, 300 µm.
3.1.3 Phenotypic analysis of pmr mutants
The Arabidopsis powdery mildew resistant (pmr) mutants exhibit enhanced resistance to
G. cichoracearum, the powdery mildew of cruciferous plants that also colonises
Arabidopsis. Six pmr loci (pmr1-pmr6) have been identified in an EMS-mutant screen for
loss of fungal sporulation (Vogel and Somerville, 2000) (see 1.4.3).
As with the analysis of response of the dmr mutants to C. higginsianum infection, my aim
was to test whether the susceptibility factors affected in the pmr mutants are specific for
the interaction of G. cichoracearum with Arabidopsis, or whether susceptibility to
powdery mildew shares some features with susceptibility to C. higginsianum. Therefore,
the mutant lines pmr2-pmr6 were inoculated with C. higginsianum and their macroscopic
infection phenotypes were compared with the infection phenotype of wild type Col-0 (Fig.
3.6). Plants of the mutant lines pmr5 and pmr6 exhibited a reduced extent of necrotic
lesions eight days after inoculation with C. higginsianum in comparison to Col-0. Fungal
growth in plants of the pmr4 lines was slightly, reduced, however a precise evaluation of a
possible reduction of susceptibility needs further careful analysis. The infection phenotype
of pmr2 mutant plants was not distinguishable from that of Col-0 wild type. Plants of the
pmr3 mutant lines exhibited a slight increase in susceptibility compared to Col-0 plants.
In conclusion, the plant factors affected in the pmr4, pmr5 and pmr6 lines are not specific
for the interaction of Arabidopsis with powdery mildews but appear to be similarly
important for the interaction with C. higginsianum. The mutation in pmr3 supported
stronger C. higginsianum growth. The plant factor affected in pmr2 was shown not to be
essential for host infection by C. higginsianum.
56

Results
Figure 3.6: Macroscopic
with Colletotrichum higg
Column shows four-week
with C. higginsianum. Bar
infection phenotypes of the Arabidopsis pmr mutant plants after inoculation
insianum.
-old Col-0 wild type and pmr1-pmr6 mutant plants seven days after inoculation
, 3 cm.
57
Results
3.2 Natural variation in Arabidopsis response to C. higginsianum
The initial forward genetic screen of EMS and γ-radiation induced mutant lines did not
result in the identification of loss-of-susceptibility mutants with a marked reduction of
susceptibility that allowed a subsequent localisation of susceptibility factors. Therefore,
the second approach of this study, likewise aiming to identify determinants of
compatibility between Arabidopsis and C. higginsianum, was based on natural variation of
Arabidopsis accessions in response to C. higginsianum inoculation.
3.2.1 Identification of natural variation of Arabidopsis accessions in response
to C. higginsianum infection
C. higginsianum was described to infect and complete its asexual life cycle on
Arabidopsis (Narusaka et al., 2004; O'Connell et al., 2004). The infection strategy follows
the two-stage, hemibiotrophic pattern with a brief initial biotrophic phase associated with
primary hyphae, eventually followed by a switch to the necrotrophic stage, associated with
the production of secondary hyphae and formation of necrotic lesions. However, within
the scope of this study, I observed that Arabidopsis accessions showed wide variation in
the interaction phenotypes upon C. higginsianum infection (Fig. 3.7). While plants of
some accessions remained mostly intact, with only a few necrotic flecks or no visible
symptoms and almost no production of secondary necrotrophic hyphae, plants of other
accessions collapsed totally five to six days after inoculation and the tissue contained
extensive secondary mycelium growth. In other accessions, an intermediate infection
phenotype could be observed.
58

Results
59

Results
Figure 3.7: Macroscopic and microscopic infection phenotypes of selected Arabidopsis accessions after
inoculation with Colletotrichum higginsianum and their classification into disease scores (DS) 1-3.
(a) Column shows four-week-old Arabidopsis plants nine days after inoculation with C. higginsianum. Bar,
4.5 cm.
(b) The images show the overlay of a projection of 15-20 confocal micrographs taken in the green and red
fluorescence channel. Leaf samples of three-week-old Arabidopsis plants were taken three days after
infection with a C. higginsianum strain that constitutively expresses GFP. Fungal colonies are visible by the
green fluorescence of the GFP expressed in the cytoplasm of fungal hyphae. Intact chlorophyll of living
plant cells is visible by its red autofluorescence. Bar, 300 µm.
The six presented Arabidopsis accessions were allocated a disease score (DS), based on the combined
macroscopical and microscopical observations of the plant response to fungal infection as follows:
DS 1, resistant - plants mostly intact with only limited lesions, necrotrophic secondary hyphae are mostly
absent or very restricted in extent.
DS 2, intermediate - plants partially collapsed with necrotic lesions and some tissue maceration and water-
soaking, extensive necrotrophic mycelium.
DS 3, fully susceptible - plants completely collapsed and tissue extensively macerated and water-soaked,
extensive necrotrophic mycelium.
To survey the extent of natural variation among Arabidopsis accessions in detail and to
eventually identify the molecular components conferring resistance or susceptibility to C.
higginsianum, the first step was to determine the infection phenotypes of a large number
of accessions from different geographical regions and ecological habitats.
A numerical disease score (DS) was applied (see 2.2.8 and Fig. 3.7), based on the extent
of pathogen colonisation of the host and the severity of host symptoms in order to analyse
116 Arabidopsis accessions (Tab. 3.2). This compilation includes accessions of the
Nordborg collection (Nordborg et al., 2005) and the nested core collection (McKhann et
al., 2004). The Nordborg collection of accessions was compiled to investigate patterns of
polymorphism of Arabidopsis accessions and includes frequently used stock centre
accessions as well as samples from natural populations. The core collection designed by
McKhann et al. (2004) was generated based on the results of a polymorphism survey of a
worldwide collection of accessions that cover the range of known ecological and
geographical habitats. It also contains accessions such as CVI and Shah that have been
collected at the edge of the natural distribution of this species and have been shown to be
distantly related to other accessions (McKhann et al., 2004). This collection was designed
to offer in a minimum of accessions the maximum possible genetic diversity within the
60

Results
species. The present study furthermore included lines from international stock centres, i.e.
NASC and SASSC (see 2.1.5.2).
Table 3.2: Arabidopsis accessions, their origin and infection phenotypes
Accession Origin Disease Score (DS) Ag-0 Argentat/France 0 An-1 Antwerp/Belgium 1-2 Bay-0 Bayreuth/Germany 3 Bil-5 Billaberget/Sweden 0-1 Bl-1 Bologna/Italy 0-1 Bla-1 Blanes/Spain 2 Bor-1 Borky/Czech Republic 2 Bor-4 Borky/Czech Republic 2 Bur-0 Burren/Eire 3 C24 Coimbra/Portugal 2-3 Can-0 Canary Islands 0-1 Col-0 Columbia/USA 2-3 Ct-1 Catania/Italy 2 CVI Cape Verdi Islands 3 Eden-1 Eden/Sweden 1 Eden-2 Eden/Sweden 1-2 Edi-0 Edinburgh/UK 2 Ei-2 Eifel/Germany 1-2 Eil-0 Eilenburg/Germany 0-1 En-T Usmanov Lab/Tajikistan 1-2 Est-1 Estland/Russia 2 Fab-2 Faberget/Sweden 1 Fab-4 Faberget/Sweden 1-2 Fei-0 St. Maria d. Feiria/Portugal 0-1 Ga-0 Gabelstein/Germany 1 Gifu-2 Gifu/Japan 0-1 Gre-0 Greenville, MI/USA 2 Gy-0 La Minière/ France 2 HR-5 Ascot/UK 2 HR-10 Ascot/UK 1 In-0 Innsbruck/Austria 1-2 Jm-0 Jamolice/Czech Republic 2 Kas-2 Kashmir/India 1-2 Kn-0 Kaunas/Lithuania 2 Knox-10 Knox, IN/USA 2 Knox-18 Knox, IN/USA 2 Kondara Khurmatov/Tajikistan 0-1 Kyoto Kyoto/Japan 2 Kz-1 Kazakhstan 1 Kz-9 Kazakhstan 1-2 Ler-0 Landsberg, Warthe/Poland 3 Ler-1 Landsberg, Warthe/Poland 3
61

Results
Table 3.2: continuation Accession Accession Accession
Lip-0 Lipowiec/Poland 2-3 Lov-1 Lovvik/Sweden 2-3 Lov-5 Lovvik/Sweden 1 Lp2-2 Lipovec/Czech Republic 2-3 Lp2-6 Lipovec/Czech Republic 1-2 Lz-0 Lezoux/France 1-2 Mrk-0 Markt/Germany 2-3 Ms-0 Moscow/Russia 2 Mt-0 Martuba//Libya 2-3 Mz-0 Merzhausen/Germany 1 N6 Karelian Karelian region/Russia 0-1 N7 Pinguba Pinguba/Russia 0-1 Nd-1 Niederzenz/Germany 1 NFA-8 Ascot/UK 2 NFA-10 Ascot/UK 3 Nok-1 Noordwijk/Netherlands 2 Omo2-1 Ostra Mocklo/Sweden 0-1 Omo2-3 Ostra Mocklo/Sweden 0-1 Oy-0 Oystese/Norway 1 Pa-1 Palermo/Italy 2 Pi-0 Pitztal/Austria 2 Pna-10 Benton Harbor/USA 1-2 Pna-17 Benton Harbor/USA 0 Pro-0 Proaza/Spain 1 Pu2-7 Prudka/Czech Republic 1 Pu2-23 Prudka/Czech Republic 1 PYL-1 Le Pyla/France 1-2 Ra-0 Randan/France 2 RAN Cale de Mordeuc/France 2-3 Ren-1 Rennes/France 0-1 Ren-11 Rennes/France 1 Ri-0 Richmond B.C./Canada 2-3 Rld-2 Rschew/Russia 2 Rmx-A02 St. Joseph/USA 1 Rmx-A180 St. Joseph/USA 1 RRS-7 North Liberty/USA 0-1 RRS-10 North Liberty/USA 0-1 Rubezhnoe-1 Rubezhnoe/Ukraine 1-2 Sakata Sakata/Japan 2-3 Sap-0 Sapporo/Japan 2 Se-0 San Eleno/Spain 3 Sendai-1 Sendai/Japan 0-1 Sendai-3 Sendai/Japan 0-1 Sendai-4 Aoba-Ku/Japa 0-1 Shah Palmiro-Alay/Tajikistan 2 Sorbo Tadjikistan 1-2 Sp-0 Berlin/Germany 0-1 Spr1-2 Spratteboda/Sweden 2
62
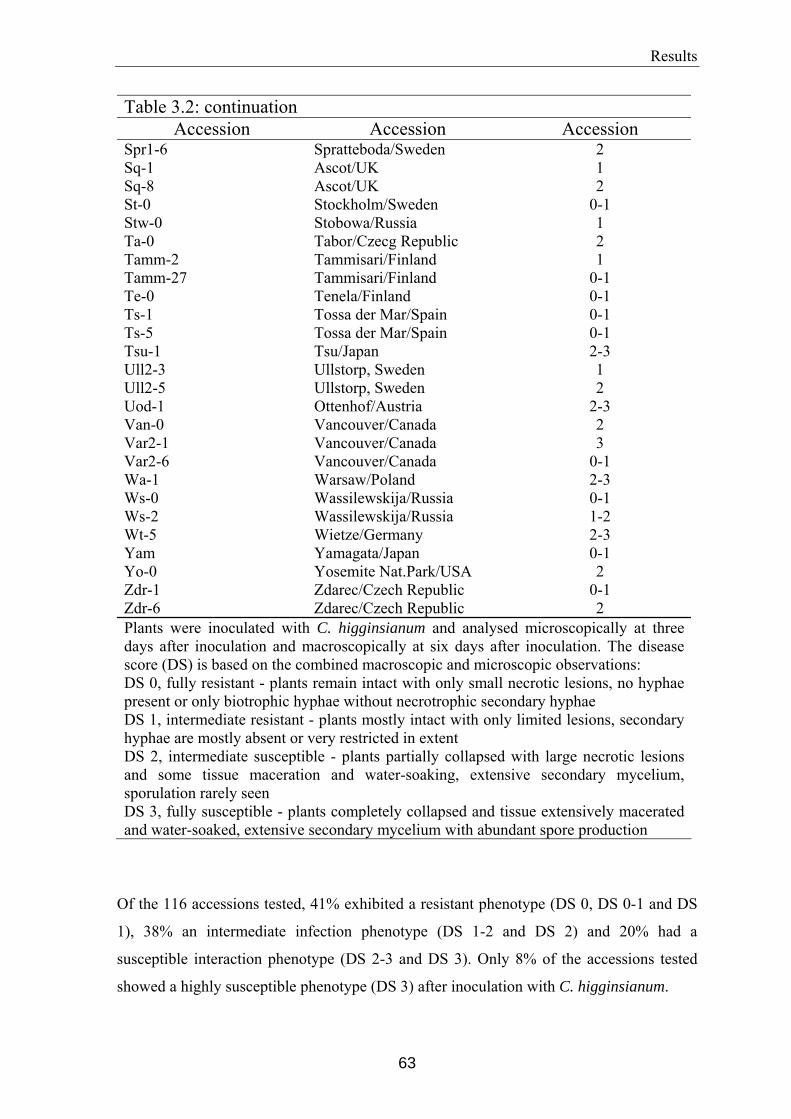
Results
Table 3.2: continuation Accession Accession Accession
Spr1-6 Spratteboda/Sweden 2 Sq-1 Ascot/UK 1 Sq-8 Ascot/UK 2 St-0 Stockholm/Sweden 0-1 Stw-0 Stobowa/Russia 1 Ta-0 Tabor/Czecg Republic 2 Tamm-2 Tammisari/Finland 1 Tamm-27 Tammisari/Finland 0-1 Te-0 Tenela/Finland 0-1 Ts-1 Tossa der Mar/Spain 0-1 Ts-5 Tossa der Mar/Spain 0-1 Tsu-1 Tsu/Japan 2-3 Ull2-3 Ullstorp, Sweden 1 Ull2-5 Ullstorp, Sweden 2 Uod-1 Ottenhof/Austria 2-3 Van-0 Vancouver/Canada 2 Var2-1 Vancouver/Canada 3 Var2-6 Vancouver/Canada 0-1 Wa-1 Warsaw/Poland 2-3 Ws-0 Wassilewskija/Russia 0-1 Ws-2 Wassilewskija/Russia 1-2 Wt-5 Wietze/Germany 2-3 Yam Yamagata/Japan 0-1 Yo-0 Yosemite Nat.Park/USA 2 Zdr-1 Zdarec/Czech Republic 0-1 Zdr-6 Zdarec/Czech Republic 2 Plants were inoculated with C. higginsianum and analysed microscopically at three days after inoculation and macroscopically at six days after inoculation. The disease score (DS) is based on the combined macroscopic and microscopic observations: DS 0, fully resistant - plants remain intact with only small necrotic lesions, no hyphae present or only biotrophic hyphae without necrotrophic secondary hyphae DS 1, intermediate resistant - plants mostly intact with only limited lesions, secondary hyphae are mostly absent or very restricted in extent DS 2, intermediate susceptible - plants partially collapsed with large necrotic lesions and some tissue maceration and water-soaking, extensive secondary mycelium, sporulation rarely seen DS 3, fully susceptible - plants completely collapsed and tissue extensively macerated and water-soaked, extensive secondary mycelium with abundant spore production
Of the 116 accessions tested, 41% exhibited a resistant phenotype (DS 0, DS 0-1 and DS
1), 38% an intermediate infection phenotype (DS 1-2 and DS 2) and 20% had a
susceptible interaction phenotype (DS 2-3 and DS 3). Only 8% of the accessions tested
showed a highly susceptible phenotype (DS 3) after inoculation with C. higginsianum.
63

Results
Due to the missing information about exact geographical origins, i.e. coordinates or
habitats, for many of the accessions tested, analysis of a correlation between infection
phenotypes and geographical origin was based on classification of accessions to countries
of origin (Tab. SD.1). However, a more precise analysis for detection of possible
correlation remains to be carried out in the future when the missing information will be
available. Based on the present data, there was no correlation between infection
phenotypes and geographical origins of the accessions identified.
3.2.2 Genetic analysis of the inheritance of C. higginsianum resistance
In order to identify the mode of inheritance of resistance in selected Arabidopsis
accessions, resistant accessions were crossed to the highly susceptible accession Ler-0
(Tab. 3.3). This accession was selected as the susceptible parent, because it has been
investigated in genetic analyses and sequencing projects. The focus of this study was on
the identification of recessive resistance, conferred by the lack of a functional copy of a
host susceptibility factor (see 1.4). I hypothised that the introgression of a dominant
susceptibility factor by crossing a susceptible accession to a resistant one, which
presumably lacks a functional copy of this factor, should result in gain of full or partial
susceptibility in the F1 generation. The subsequent F2 generation was expected to
segregate 3:1 (susceptible : resistant). Recessive resistance conferred by the presence of a
recessive R gene (see 1.4), should exhibit the same inheritance features in the F1 and F2
generations. In contrast, monogenic, dominant resistance conferred by a dominant R gene
(see 1.3) would be expected to result in a fully resistant F1 generation and the subsequent
F2 generation should segregate 1:3 (susceptible : resistant).
Seventeen accessions that had previously been identified to have a DS 0, DS 0-1 or DS 1
were crossed to Ler-0 and the infection phenotypes of their corresponding F1 generations
was determined (Tab. 3.3).
64

Results
Table 3.3: Disease Score of F1 generations of Arabidopsis derived from
crossing resistant accessions with the susceptible Ler-0
accession
Resistant parent
F1 Disease Score
Eil-0 1 Fei-0 1 St-0 1 Ts-1 1 Sendai-1 1-2 Ws-2 1-2 Sendai-3 2 Sendai-4 2 N6 2 Can-0 2-3 Enheim-T 2-3 Gifu-2 2-3 N7 2-3 Ren-1 2-3 Ws-0 2-3 Oy-0 3 Sp-0 3 At least 10 plants per F1 line were inoculated with C. higginsianum and macroscopic phenotypes were determined at six days after inoculation. Disease score (DS): DS 0, fully resistant - plants remain intact with only small necrotic lesions DS 1, intermediate resistant - plants remain mostly intact with only limited lesions DS 2, intermediate susceptible - plants partially collapsed with necrotic lesions and some tissue maceration and water-soaking DS 3, fully susceptible - plants completely collapsed and tissue extensively macerated and water-soaked
Six of the F1 lines originating from crossing a resistant parent to the susceptible parent
Ler-0 exhibited a resistant phenotype (DS 1 and DS 1-2). Eleven of the 17 F1 lines tested
exhibited susceptibility, however in varying extents. Three F1 lines showed an
intermediate infection phenotype (DS 2) and were therefore more susceptible than the
resistant parent, but more resistant than Ler-0. Six of the F1 lines showed a phenotype (DS
2-3) that was slightly less susceptible than Ler-0 while the crosses of Oy-0 and Sp-0 to
Ler-0 resulted in F1 phenotypes that were indistinguishable from that of the susceptible
parent. Eight F1 lines were analysed further in the F2 generation. With this selection it was
intended to include examples of different modes of resistance inheritance. Furthermore,
65

Results
these lines were selected due to the origin of the parental accessions from different
geographic regions (Fig. 3.8).
Figure 3.8: Geographical origin of six selected Arabidopsis accessions and their macroscopic infection
phenotypes after inoculation with Colletotrichum higginsianum.
(a) The worldwide natural habitats of Arabidopsis are highlighted in green. Red dots indicate the
geographical origins of accessions that are publicly available through international stock centres. Black lines
point to the geographical origin of the accessions depicted in (b). Image (a) modified from Koornneef et al.,
2004.
(b) Macroscopic infection phenotypes of four-week-old Arabidopsis plants nine days after inoculation with
C. higginsianum are shown. Bar, 4.5 cm.
The eight selected F2 generations were tested for their segregation in response to C.
higginsianum inoculation (Tab. 3.4). However, because large numbers of F2 plants had to
be screened in a high-throughput manner, intermediate phenotypes could not be reliably
distinguished from fully susceptible phenotypes. Therefore, numerical disease scoring was
not applied and the F2 plants were simply categorised as either susceptible or resistant
(Fig. 3.9).
66

Results
67
Infection phenotype of four Arabdidopsis Ler-0 x Ws-0 F2 generation plants six days after inoculation with
C. higginsianum. While one F2 plant (left bottom corner) exhibits a resistant phenotype and has clearly
survived the infection, the other plants are strongly affected with extensive necrotic lesions and tissue
maceration, and are partially or fully collapsed.
Figure 3.9: Representative example of Arabidopsis F2 population plants inoculated with Colletotrichum
higginsianum showing segregation of resistance phenotype.
Due to the stringent conditions of the infection assay, i.e. high inoculum concentrations,
resistant plants generally showed some necrotic lesions and water-soaked symptoms, but
nonetheless survived infection. Susceptible plants, however, exhibited a strongly affected
phenotype at six to seven days after inoculation and eventually collapsed. Intermediary
phenotypes could not be easily distinguished with this screen. For each F2 line, at least 90
plants were scored for their infection phenotypes. For many lines it was possible to test a
larger number of F2 and analysis was carried out in several independent tests (Tab. 3.4).

cros
s of a
cces
sions
Analysis of F2 generations
expected for 3 : 1 (S : R) segregation
expected for 1 : 3 (S : R) segregation
F 1 D
iseas
e Sco
re
No. o
f te
stsTo
tal n
umbe
r of F
2 p
lant
s
Susc
eptib
le (o
bser
ved)
Resis
tant
(obs
erve
d)
Susc
eptib
le (e
xpec
ted)
Resis
tant
(exp
ecte
d)2 te
st)
susc
eptib
le (e
xpec
ted)
resis
tant
(exp
ecte
d)
Orig
in of
re
sista
nt p
aren
t
cros
s of a
cces
sions
Ler-0 x Can-0 2-3 (S) 2 186 139 47 139 46,5 0.93 46,5 139,5 2,69E-55 Canary Islands2-3 (S) 4 352 252 100 264 88 0.13 88 264 1,27E-90 Japan2-3 (S) 21 1792 1329 463 1344 448 0.41 448 1344 0 Russia1-2 (R) 1 100 20 80 75 25 5,79E-23 25 75 0,24 Germany1-2 (R) 1 97 21 76 72,75 24,25 6,92E-34 24,25 72,75 0,44 Japan
2 (I) 1 77 23 54 57,75 19,25 5,93E-20 19,25 57,75 0,32 Japan2 (I) 1 86 26 60 64,5 21,5 9,01E-22 21,5 64,5 0,26 Japan
1-2 (R) 2 115 79 45 86,25 28,75 0 28,75 86,25 3,36E-25 Russia
Ler-0 x Can-0Ler-0 x Gifu-2Ler-0 x Ws-0
Ler-0 x Ws-2
Ler-0 x Eil-0Ler-0 x Sendai-1Ler-0 x Sendai-3Ler-0 x Sendai-4
Table 3.4: Analysis of segregation in response to Colletotrichum higginsianum in F2 generations derived from crosses between eight resistant accessions
and the susceptible Ler-0 accession.
Disease scores of F1 generations were determined as follows. Disease score (DS): 0, fully resistant; 1, intermediate resistant, 2, intermediate susceptible; 3, fully
susceptible.
F2 generations were inoculated with C. higginsianum and classified as susceptible or resistant. Expected F2 segregation ratios refer to either a 3:1 (susceptible :
resistant), or 1:3 (susceptible : resistant) F2 segregation, respectively, and were compared to the observed segregation by a χ2 test (P = 0,05). S, susceptible
infection phenotype, R, resistant phenotype, I, intermediate phenotype.

69
expected for 9:7 (S : R) segregationAnalysis of F2 generation
cros
s of a
cces
sions
cross of accessions
F 1 D
iseas
e Sco
re
Num
ber o
f ind
epen
dent
tests
Tota
l num
ber
Susc
epbt
ible
(obs
erve
d)Re
sista
nt (o
bser
ved)
Susc
eptib
le (e
xpec
ted)
Resis
tant
(exp
ecte
d)
P
2 test)
cros
s of a
cces
sions
Ler-0 x Ws-2 1-2 2 115 79 45 64,68 50,31 0.05 0,05Ler-0 x Ws-2
According F2 generation was inoculated with C. higginsianum and classified into susceptible and resistant plants. Observed segregation ratios and expected
segregation ratios for a 9:7 (susceptible : resistant), was analysed by a χ2 test (P = 0,05).
Disease score of the F1 generation, originating from a cross of the susceptible accession Ler-0 to resistant accession Ws-2 was determined. Disease score 1-2,
intermediate resistant.
Table 3.5: Analysis of segregation in response to Colletotrichum higginsianum in the F2 generation derived from crosses between the resistant accession
Ws-2 and the susceptible Ler-0 accession.

Results
For the three F2 lines derived from crosses with the resistant parents Can-0, Gifu-2 and
Ws-0, a 3:1 (susceptible : resistant) segregation could be identified, based on χ2 analysis
with P > 0.05. The F2 lines derived from crosses with the resistant parents Eil-0, Sendai-1,
Sendai-3 and Sendai-4 exhibited a 1:3 (susceptible : resistant) segregation pattern with P >
0.05. The χ2 analysis of the F2 lines derived from the resistant parent Ws-2 was not
compatible with either of the two segregation patterns, indicating that resistance is not
inherited by a monogenic trait. However, the segregation of resistance in the F2 generation
was in agreement with a digenic genetic model. Digenic inheritance of a trait results in F2
segregation ratios that are variations of the classical 9:3:3:1 ratio for two genetically
independent genes, depending on the epistatic relations of the two genes. As the screen of
F2 generation does not facilitate a differentiation between the intermediate susceptible
infection phenotype of heterozygotes and a full susceptible infection phenotype of
homozygous plants (see above), a 9:7 (susceptible : resistant) segregation of resistance,
i.e. both genes are dominantly involved in the trait value, was expected and could be
confirmed for the Ler-0 x Ws-2 F2 generation (Tab 3.5).
In summary, the natural variation in response to C. higginsianum of various Arabidopsis
accessions, originating from very different geographical regions, was evaluated. The full
spectrum of responses between strong resistance to fungal attack through to full
susceptibility to fungal infection could be observed in this collection of 116 accessions.
This natural variation can be explained by different scenarios of dominant or recessive
monogenic resistance or polygenic resistance.
3.3 Genetic analysis of recessive resistance of Arabidopsis to C.
higginsianum
3.3.1 Mapping populations
To identify the region containing a recessive resistance locus, several resistant accessions
had been crossed to the susceptible accession Ler-0 (see 3.2.2). For positional cloning of
the responsible loci, the corresponding F2 generations were selected that exhibited the
expected 3:1 (susceptible : resistant) segregation and a susceptible F1 phenotype, hence
accessions Ws-0, Can-0 and Gifu-2. Positional cloning was initially concentrated on the F2
mapping population derived from the Ler-0 x Ws-0 cross, since this resistant accession
70

Results
had been the subject of previous genetical analyses and more sequence information was
available than for the relatively unexplored accessions Can-0 and Gifu-2. In the course of
mapping the resistance loci in the Ler-0 x Gifu-2 and the Ler-0 x Can-0 F2 populations, I
hypothised that the resistance loci might be identical in all three F2 populations (see 3.3.4).
This was subsequently tested by allelism analysis (see 3.3.6).
3.3.2 First-pass mapping
A first-pass mapping strategy (Jander et al., 2002) was used to identify the approximate
region containing the locus responsible for recessive resistance. For this “rough mapping”
procedure, 26 F2 plants, exhibiting a resistant phenotype, and 10 susceptible F2 plants
were analysed by PCR with a set of 27 SSLP markers (Lukowitz et al., 2000; Jander et al.,
2002; Loudet et al., 2002). These codominant PCR-based molecular markers had been
confirmed to exhibit sequence polymorphisms between Ler-0 and Ws-0 and were evenly
distributed throughout the five chromosomes. By genotyping this small F2 mapping
population, reduced recombination frequencies were identified with molecular markers on
the lower arm of chromosome V (Fig. 3.10). This suggested genetic linkage of these
markers to the recessive resistance locus. Since the resistance phenotype is expected to be
inherited recessively, the region of interest in resistant plants should genotypically
resemble the Ws-0 parent. In accordance with this, resistant plants were either
homozygous Ws-0 in this region or less often heterozygous on chromosome V, whereas
susceptible plants were heterozygous or resembled the Ler-0 genotype. In contrast, the
genotypes identified for marker positions on the other four chromosomes resembled a
random distribution.
71

Results
Figure 3.10: First-pass mapping of a locus conferring resistance to Colletotrichum higginsianum in an
Arabidopsis Ler-0 x Ws-0 F2 mapping population.
Schematic representation of SSLP markers and their positions on the five chromosomes of the Arabidopsis
genome. A Ler-0 x Ws-0 F2 mapping population was screened for resistance after C. higginsianum infection
and for the resistant plants the recombination frequencies were determined at the indicated marker positions.
The reduced recombination frequencies on the lower arm of chromosome V (DFR1 and NGA129) indicated
a possible linkage of the resistance locus to this region. Centromers are indicated by white dots.
3.3.3 Fine-mapping of recessive resistance locus Ws-0
In the first-pass mapping, linkage to markers on the lower arm of chromosome V was
identified. To define the region of interest more accurately, a fine-scale mapping had to be
carried out with a larger number of Ler-0 x Ws-0 F2 progenies. In the following fine-
mapping process, a total number of approximately 3,000 plants were phenotyped and 740
of these, exhibiting a resistant phenotype, were then genotyped with various molecular
markers.
By the first pass mapping I had identified a recombination frequency of 41% at the
molecular marker position SO191, and at the position of marker DFR.1 a recombination
frequency of 15%. At the telomeric side, I observed a recombination frequency of 38% at
the position of the molecular marker MSAT5.18, and a recombination frequency of 23%
at the position of the marker NGA129. F2 plants were identified that showed a
recombination event at the positions of one of the molecular markers DFR.1 or NGA129,
72

Results
73
and therefore these markers were determined as the initial “flanking” markers of the
region of interest. To reduce the size of this region, the mapping population was screened
for plants that exhibited further recombination events for one of two additional markers
located between the initial flanking markers DFR.1 and NGA129. Following this strategy,
the mapping population was genotyped with progressively closer markers until no further
recombinants were found (Tab. 3.6). For this approach, suitable SSLP, CAPs and dCAPs
markers were identified from available databases (TAIR, Monsanto, see 2.1.8), or were
designed on the basis of detected DNA sequence polymorphisms between Ler-0 and Ws-
0. Two plants (F2 lines 51F5 and 54F9) were found that exhibited a recombination event at
the position of the centromeric final flanking marker 236 (18,307,842 bp), and two plants
(F2 lines 15D1 and 52H3) with a recombination event at the position of the telomeric final
flanking marker 312 (18,407,860 bp) and the target locus was delineated to a region of ~
100 kb, based on the Col-0 reference sequence information (Tab. 3.6). However, I could
not exclude that the target region might be smaller or larger in the parental accessions Ler-
0 or Ws-0 than the Col-0 reference genome. To validate the mapped region, I determined
the infection phenotypes of F3 families derived from F2 lines that exhibited a single
recombination event for one of the flanking markers. Given that the identified region
contains a locus conferring recessive resistance, it was expected that F3 plants, originating
from resistant F2 plants, should not segregate in their infection phenotypes, and should all
be resistant after C. higginsianum inoculation. F2 plants exhibiting a heterozygous
genotype for both flanking markers 236 and 312, however, were expected to result in an
F3 generation that was segregating 3:1 (susceptible : resistant). The infection phenotypes
of all F3 lines were in accordance with these expectations (Tab. 3.6) and therefore
confirmed the accuracy of the region of interest.

74
F2 lines, and their corresponding F3 lines, derived from crosses between the Arabidopsis accessions Ler-0 and Ws-0, were phenotyped at seven days after
inoculation with C. higginsianum. The genotypes of the F2 lines at indicated SSLP marker positions on chromosome V were determined on the basis of the Col-0
reference accession. Flanking markers “236” and “312” delineating the locus are highlighted in red. R, resistant phenotype; S, susceptible phenotype; n.d., not
determined; Ws, genotype resembling Ws-0 parent: het, heterozygous genotype.
PCR - markers and their position on chromosome V (based on Col-0 reference sequence)
F 2 li
ne
phen
otyp
e of F
2 li
ne
DFR.1
(17.1
81.59
2 bp)
MBD
2-1
(17,2
22,07
1 bp)
MSA
T5.9
(17,2
52,30
9 bp)
17,57
Mb
(17,5
70,00
0 bp)
MRH
10-2
(17
,719,0
14 bp
)
MSA
T5.4
(17,8
44,44
1 bp)
78 (1
7,923
,131 b
p)64
(18,0
39,56
0 bp)
66 (1
8,050
,701 b
p)68
(18,0
89,56
3 bp)
72 (1
8,262
,458 b
p)13
4 (1
8,272
,105 b
p)
146
(18,3
04,97
1 bp
)
236
(18,3
07,84
2 bp)
312
(18,4
07,86
0 bp)
82 (1
8,338
,008 b
p)RP
S4-N
T (1
8,342
,772 b
p)
332
(18,3
63,16
3 bp)
338
(18,3
79,03
1 bp)
364
(18,3
83,70
1 bp)
252
(18,4
10,14
5 bp)
276
(18,4
648,0
51 bp
)
MRA
19-1
(18,5
97,04
4 bp)
NGA1
29 (1
9,007
,000 b
p)
F 3 p
heno
tpye
17H2 R het n.d. n.d. het Ws Ws n.d. n.d. n.d. n.d. n.d. n.d. n.d. Ws n.d. Ws n.d. n.d. n.d. Ws Ws n.d. Ws n.d. R15F9 R het n.d. n.d. het het Ws n.d. n.d. n.d. n.d. n.d. n.d. n.d. Ws n.d. Ws n.d. n.d. n.d. n.d. Ws n.d. Ws Ws R31A12 R n.d. n.d. n.d. n.d. n.d. het het het Ws Ws Ws n.d. n.d. n.d. n.d. Ws n.d. n.d. n.d. n.d. n.d. n.d. n.d. n.d. R30C6 R n.d. n.d. n.d. n.d. n.d. het het het het het Ws n.d. n.d. n.d. Ws Ws n.d. n.d. n.d. n.d. n.d. n.d. n.d. n.d. n.d.21G10 R n.d. het n.d. het het het n.d. het het n.d. Ws n.d. n.d. Ws Ws Ws n.d. n.d. n.d. Ws Ws n.d. Ws n.d. R13E6 R n.d. het n.d. het het het het het het het Ws n.d. n.d. Ws Ws Ws n.d. n.d. n.d. Ws Ws n.d. Ws Ws R51F5 R n.d. n.d. n.d. n.d. n.d. n.d. n.d. n.d. n.d. het het het het het Ws Ws n.d. n.d. n.d. Ws Ws n.d. Ws n.d. R54F9 R n.d. n.d. n.d. n.d. n.d. n.d. n.d. n.d. n.d. het het het het het Ws Ws n.d. n.d. n.d. Ws Ws n.d. Ws n.d. R15B9 R Ws n.d. n.d. Ws Ws n.d. n.d. n.d. n.d. n.d. n.d. n.d. n.d. n.d. n.d. Ws n.d. n.d. n.d. n.d. n.d. n.d. Ws het R15E8 R Ws n.d. n.d. Ws Ws Ws n.d. n.d. n.d. n.d. n.d. n.d. n.d. n.d. n.d. Ws n.d. n.d. n.d. n.d. n.d. n.d. Ws het R55A2 R n.d. n.d. n.d. n.d. n.d. n.d. n.d. n.d. n.d. Ws Ws n.d. n.d. Ws Ws n.d. Ws Ws Ws Ws Ws n.d. het n.d. R14D7 R Ws n.d. n.d. Ws Ws Ws n.d. Ws Ws n.d. Ws n.d. n.d. Ws n.d. Ws n.d. n.d. n.d. n.d. Ws n.d. het het R15F1 R Ws n.d. n.d. Ws Ws n.d. n.d. n.d. n.d. n.d. n.d. n.d. Ws n.d. Ws Ws Ws Ws Ws Ws n.d. het het R13B11 R Ws Ws n.d. Ws Ws Ws Ws n.d. Ws Ws Ws n.d. n.d. Ws n.d. Ws Ws Ws n.d. Ws het n.d. het het R14E11 R Ws n.d. n.d. n.d. Ws Ws n.d. n.d. n.d. n.d. n.d. n.d. n.d. Ws n.d. Ws n.d. n.d. n.d. Ws het n.d. Ws het R52H3 R n.d. n.d. n.d. n.d. n.d. n.d. n.d. n.d. n.d. Ws Ws n.d. n.d. Ws Ws Ws Ws Ws Ws het het het het n.d. R15D1 R Ws n.d. n.d. Ws Ws Ws n.d. n.d. n.d. n.d. n.d. n.d. n.d. Ws n.d. Ws Ws Ws Ws het het n.d. het het R31D10 S n.d. n.d. n.d. n.d. n.d. Ws Ws Ws Ws Ws Ws Ws het het het het het het n.d. het het n.d. het n.d. segregating45D6 S n.d. n.d. n.d. n.d. n.d. Ws n.d. Ws Ws Ws het n.d. n.d. het het het n.d. n.d. n.d. n.d. het n.d. het n.d. segregating49E4 R n.d. n.d. n.d. n.d. n.d. n.d. n.d. n.d. n.d. n.d. n.d. het het het het het het het het het het het Ws n.d. segregating
Table 3.6: Fine mapping of recessive resistance to Colletotrichum higginsianum in Arabidopsis Ler-0 x Ws-0 F2 plants.

Results
3.3.4 Targeted mapping of recessive resistance loci in Gifu-2 and Can-0
accessions
It was possible that recessive resistance in the Arabidopsis accessions Gifu-2 and Can-0 is
conferred by different loci than in Ws-0. As the following comparative cytological
analyses (see 3.7) indicated a similar infection phenotype in all three resistant accessions,
it was however conceivable that the recessive resistance loci might be identical. In order to
test this hypothesis, a small number of plants from F2 mapping populations originating
from crosses between Ler-0 and Gifu-2, and Ler-0 and Can-0 were tested with a limited
number of molecular markers (Tab. 3.7 and Tab. 3.8) that had previously been identified
as flanking markers for the region of interest in the Ler-0 x Ws-0 F2 mapping population
(Tab 3.6).
Similar to the target region identified in the Ler-0 x Ws-0 F2 mapping population, Gifu-2
and Can-0 F2 mapping populations indicated an association of resistance with the lower
arm of chromosome V, as shown by recombination frequencies of 7-25%. In accordance
with results from the Ler-0 x Ws-0 F2 mapping population, resistance was associated with
a genotype that in most cases corresponded to the homozygous resistant parent, or, less
frequently, a heterozygous state. In no case did resistant F2 plants exhibit a Ler-0 genotype
for the tested molecular markers. Susceptible F2 plants in contrast, corresponded to the
homozygous Ler-0 parent genotype or were heterozygous at the tested marker positions.
Hence, the observed phenotypes and genotypes were consistent with an expected recessive
inheritance of resistance. On the basis of these findings, it was likely that resistance loci in
the accessions Ws-0, Gifu-2 and Can-0 might be identical. An allelism test (see 3.3.6) was
required to confirm this assumption.
75

Results
22% 20% 18% 25% 22%Recombination frequency
PCR-markers and their position on chromosome VF 2
line
phen
otyp
e of F
2 li
neM
RH10
-2
(17,
719,0
14 b
p)68
(1
8,08
9,563
bp)
72
(18,
262,4
58 b
p)
82
(18,
338,0
08 b
p)
MRA
19-1
(1
8,59
7,044
bp)
26A1 R Can n.d. n.d. Can Can26A2 R Can Can Can Can Can26A3 R Can Can Can Can Can26A4 R Can Can Can Can Can26A9 R Can Can Can Can Can26A10 R Can Can Can Can Can26B4 R Can Can Can Can Can26B5 R Can Can Can Can Can26B12 R Can Can Can Can Can26C3 R het het het het Ler26D5 R Can Can Can Can Can26D6 R Can Can Can Can Can26D10 R Can Can Can Can Can26E2 R Can Can Can Can Can26E3 R Can Can Can Can het26E8 R Can Can Can Can Can26E12 R Can Can Can Can Can26G2 R Can Can Can Can Can26G3 R Can Can Can Can Can26G5 R Can Can Can Can Can26H1 R het Can Can Can Can26H10 R Can Can Can Can Can25A5 R Can Can n.d. n.d. Can25A11 R Can Can n.d. Can Can25B1 R Can Can Can n.d. Can25B2 R Can Can Can Can Can25B6 R Can Can Can Can Can25B7 R Can Can Can Can Can25B11 R Can Can Can Can Can25C2 R Can Can Can Can Can25C5 R het Can Can n.d. Can25C9 R Can Can Can Can Can25C11 R Can Can Can n.d. Can25D7 R Can Can Can Can Can25D8 R Can Can Can Can Can25E6 R Can Can Can Can Can25E7 R Can Can Can n.d. Can
Table 3.7 Mapping of locus conferring recessive resistance to Colletotrichum higginsianum in an
Arabidopsis Ler-0 x Can-0 F2 population. Genotypes were identified at the indicated molecular marker
positions on chromosome V and infection phenotypes were determined at seven days after C. higginsianum
inoculation. Can, Can-0-like genotype; Ler, Ler-0-like genotype; het, heterozygous genotype; R, resistant
phenotype; S, susceptible phenotype; n.d., not determined.
76

Results
Table 3.7: Continued
PCR-markers and their position on chromosome V
F 2 li
ne
phen
otyp
e F2 li
neM
RH10
-2
(17,
719,
014 b
p)68
(1
8,08
9,56
3 bp)
72 (18,
262,
458 b
p)
82
(18,3
38,0
08 b
p)
MRA
19-1
(1
8,59
7,04
4 bp)
25F3 R Can Can Can Can Can25F6 R Can Can Can Can Can25G6 R Can Can Can Can Can25G8 R Can Can Can Can n.d.25G10 R Can Can Can Can Can25H4 R Can Can Can Can Can25H6 R Can Can Can Can Can25H8 R Can Can Can n.d. Can25H12 R Can Can Can Can Can26C4 S Ler Ler Ler Ler Ler26D1 S Ler Ler Ler Ler Ler26D8 S het het het het het26D12 S het het het het het26F6 S het het het het het26G8 S het het n.d. het het25C6 S het het het het het25D1 S Ler Ler Ler Ler Ler 25D2 S Ler Ler Ler Ler Ler25D3 S het het het het Ler25D5 S het het het het Ler25E3 S Ler Ler Ler Ler het25F9 S het het het het het25G1 S Ler Ler Ler Ler het25H3 S Ler Ler Ler Ler Ler25H10 S het het het het het
77

Results
18% 13% 14% 7%
Recombination frequency
PCR-markers and their position on chromosome VF 2
line
phen
otyp
e F2 li
neM
BD2-
1 (1
7,22
2,07
1 bp
)68 (1
8,08
9,56
3 bp
)
72
(18,
262,
458
bp)
MRA
19-1
(1
8,59
7,04
4 bp
)
23A3 R Gifu Gifu Gifu Gifu23A4 R Gifu Gifu Gifu Gifu23B1 R Gifu Gifu Gifu Gifu23B3 R Gifu Gifu Gifu Gifu23B4 R Gifu Gifu Gifu Gifu23B6 R n.d Gifu Gifu Gifu23C2 R Gifu Gifu Gifu Gifu23C4 R Gifu Gifu Gifu Gifu23C5 R Gifu Gifu Gifu Gifu23D1 R Gifu Gifu Gifu Gifu23D5 R Gifu Gifu Gifu Gifu23D10 R het Gifu Gifu Gifu23E2 R Gifu Gifu Gifu Gifu23E8 R Gifu Gifu Gifu Gifu23E11 R het Gifu Gifu Gifu23F7 R n.d Gifu Gifu Gifu23H1 R Gifu Gifu Gifu Gifu23H6 R n.d n.d Gifu Gifu23H8 R Gifu Gifu Gifu Gifu23H10 R Gifu Gifu Gifu Gifu23H12 R Gifu Gifu Gifu Gifu24A8 R n.d Gifu Gifu Gifu24A11 R Gifu Gifu Gifu Gifu24B1 R n.d Gifu Gifu Gifu24B4 R n.d Gifu Gifu Gifu24B11 R n.d Gifu Gifu Gifu24C3 R Gifu Gifu Gifu Gifu24D2 R Gifu Gifu Gifu Gifu24E1 R Gifu Gifu Gifu Gifu24E2 R Gifu Gifu Gifu Gifu24E6 R Gifu Gifu Gifu Gifu24E10 R Gifu Gifu Gifu Gifu24E11 R Gifu Gifu Gifu Gifu24F1 R Gifu Gifu Gifu Gifu24F5 R Gifu Gifu Gifu Gifu24G6 R n.d Gifu Gifu Gifu24G11 R het Gifu Gifu Gifu
Table 3.8: Mapping of locus conferring recessive resistance to Colletotrichum higginsianum resistance
in an Arabidopsis Ler-0 x Gifu-2 F2 population. Genotypes were identified at the indicated molecular
marker positions on chromosome V and infection phenotypes were determined at seven days after C.
78

Results
higginsianum inoculation. Gifu, Gifu-2-like genotype; Ler, Ler-0-like genotype; het, heterozygous genotype;
R, resistant phenotype; S, susceptible phenotype; n.d., not determined.
Table 3.8.: Continued
PCR-markers and their position on chromosome V
F 2 li
ne
phen
otyp
e F2 li
neM
BD2-
1 (1
7,22
2,07
1 bp)
68 (18,
089,
563 b
p)
72
(18,
262,
458 b
p)
MRA
19-1
(1
8,59
7,04
4 bp)
24G12 R Gifu Gifu Gifu Gifu24H1 R Gifu Gifu Gifu Gifu24H5 R Gifu Gifu Gifu Gifu24H6 R het het het Gifu24H7 R n.d Gifu Gifu Gifu24H8 R Gifu Gifu Gifu Gifu24H9 R het het het het24A1 S Ler Ler Ler Ler24A4 S het het het het24B3 S het het het het24B7 S Ler Ler Ler Ler24C2 S Ler Ler Ler Ler24C12 S Ler Ler Ler Ler24D6 S het het het het24D8 S Ler Ler Ler Ler24F10 S Ler Ler Ler Ler24G2 S Ler Ler Ler Ler24G8? S Ler Ler Ler Ler24H3 S Ler Ler Ler Ler23A1 S Ler Ler Ler Ler23A2 S Ler het het Ler23D6 S het het het Ler
3.3.5 Identification of resistance loci by analysis of Quantitative Trait Loci
(QTL)
Scoring phenotypes in RIL populations has been proven to be particularly useful for the
detection and localisation of quantitative trait loci (QTL), as many traits can be identified
that are under control of multiple loci and therefore exhibit a continuous rather than
qualitative variation (see 1.6).
Since the accessions Ler-0, Kas-2 and Kondara had been shown to exhibit significantly
different resistance responses to C. higginsianum (Tab. 3.2), I examined RIL populations
derived from the crosses between Ler-0 x Kas-2 and Ler-0 x Kondara for additional
sources of potential susceptibility factors. Both RIL populations had already been
genotyped with common molecular markers (El-Lithy et al., 2006) to anchor their genetic
maps, thereby facilitating comparison of QTL positions between the populations. 164
79

Results
individual lines of the Ler-0 x Kas-2 RIL population and 131 lines of the Ler-0 x Kondara
population were grown in three replicate experiments and three-week old plants were
inoculated with C. higginsianum. For the Ler-0 x Kas-2 RIL population, disease scores
(DS) (Fig. 3.7) of each RIL, determined at four and five days after inoculation, were
analysed for QTLs as a combined data set derived from both time points (with the kind
help by Dr. M. Reymond, Cologne, Germany). Two major QTLs (at 18.4-23.8 cM on
chromosome I and at 12.7-21.1 cM on chromosome V) with LOD scores of 3 and 5,
respectively, were mapped (Fig. 3.11, Tab. 3.9). QTL detection with integration of the two
cofactors, the molecular markers SNP107 and SNP193, could explain less than 20% of the
variance, therefore indicating only small-to-medium effects of these QTLs on the C.
higginsianum infection phenotype and suggesting the existence of several additional
epistatic effects.
Table 3.9: QTL analysis results in Ler-0 x Kas-2 RIL population
chromosome marker position
(cM)
allelic
effect
(2a)
LOD
score r2 heritability
(h2)
1 SNP107 10 0.27 3.5 8.5
2 SNP193 36.8 0.32 4.8 12.2 0.658
Marker, the closest left marker flanking the LOD score peak.
Position, the position of the QTL is expressed in cM from the first marker of the
chromosome.
2a, the mean effect of the replacement of both Kas-2 alleles by Ler-0 alleles at the
QTL.
r2, Percentage of variance explained by the sum of the QTL.
h2, heritability of the trait (see 2.2.18.2).
For the Ler-0 x Kondara RIL population, disease scores were determined at six days after
inoculation. In contrast to the small to medium QTL effects on resistance identified in the
Ler-0 x Kas-2 RIL population, QTL mapping for the Ler-0 x Kondara RIL population
resulted in the identification of a region on the lower arm of chromosome V (44.8-62.9
cM) with a LOD score > 20, governing a significant major QTL controlling C.
higginsianum resistance. Interval mapping with integration of cofactors (SNP81, SNP334,
M4-9 and SNP97) estimated an r2 value (phenotypic variances explained by the QTL) of
80

Results
0.57. The major QTL on chromosome V alone explained more than 4/5 of the phenotypic
variance (48%), indicating its major effect on resistance to C. higginsianum in contrast to
the additional minor QTLs detected on chromosome III (r2 = 4.9%) and chromosome IV
(r2 = 7.7% and 4.1%). The allelic effect of 0.77 (Tab. 3.10) indicates that the Ler-0 alleles
at marker position of the major QTL on chromosome V increase the susceptibility.
Figure 3.11: Detected QTLs explaining resistance to Colletotrichum higginsianum infection in the
Arabidopsis Ler-0 x Kondara and Ler-0 x Kas-2 recombinant inbred line (RIL) populations.
A total of 131 independent lines of the Arabidopsis Ler-0 x Kondara and 164 independent lines of the Ler-0
x Kas-2 RIL populations were inoculated with C. higginsianum and infection phenotypes were determined at
6 dpi (Ler-0 x Kondara RIL population), or at 4 and 5 dpi (Ler-0 x Kas-2 RIL population). Interval mapping
was performed with MapQTL5. The LOD score was estimated at every marker position and between
markers, resulting in the presented LOD profile.
Of particular note was the finding that the map position of the major QTL in the Ler-0 x
Kondara RIL population corresponds to that identified by linkage analysis in the Ler-0 x
Ws-0 F2 mapping population (Fig. 3.12), as well as the map positions identified in the Ler-
0 x Gifu-2 and Ler-0 x Can-0 F2 mapping populations. Although it cannot be excluded
that different loci in the same region are responsible for resistance in the selected
accessions, it seems probable that Mendelian linkage analysis combined with QTL
detection in the Ler-0 x Kondara RIL population, have identified a single common locus
governing resistance to C. higginsianum in multiple accessions.
81

Results
Table 3.10: QTL analysis results in Ler-0 x Kondara RIL population
chromosome marker position
(cM)
allelic
effect
(2a)
LOD
score r2 heritability
(h2)
3 SNP81 14.14 0.26 3.21 4.9
4 SNP334 38.38 0.42 4.51 7.7
4 M4-9 45.8 -0.31 2.47 4.1
5 SNP97 57.75 0.77 20.39 47.8
0.72
Marker, the closest left marker flanking the LOD score peak.
Position, the position of the QTL is expressed in cM from the first marker of the
chromosome.
2a, the mean effect of the replacement of both Kondara alleles by Ler-0 alleles at the
QTL.
r2, Percentage of variance explained by the sum of the QTL.
h2, heritability of the trait (see 2.2.18.2).
In summary, QTL analysis of the Ler-0 x Kas-2 RIL population detected two QTLs on the
upper arms of chromosomes I and V. However, they had only minor to medium effects on
the resistance to C. higginsianum and additional loci are likely to influence the resistant
phenotype. These QTLs were therefore not investigated further in the course of this study.
In contrast, a major QTL could be identified in the Ler-0 x Kondara RIL population which
had a major effect on resistance to C. higginsianum. Strikingly, the map position of the
QTL on the lower arm of chromosome V is in accordance with the map positions
identified for resistance loci in Ws-0, Gifu-2 and Can-0, and was shown to be allelic as
discussed in section 3.3.6. Therefore, fine-mapping of the identified QTL was not
continued in RIL lines.
82

Results
Figure 3.12: Location on Arabidopsis chromosome V of loci conferring resistance to Colletotrichum
higginsianum in the Ler-0 x Kondara recombinant inbred line (RIL) population and Ler-0 x Ws-0,
Ler-0 x Can-0 and Ler-0 x Gifu-2 F2 populations.
The major quantitative trait locus (QTL) controlling resistance to C. higginsianum in the Ler-0 x Kondara
RIL population, and the recessive resistance loci detected in the Ler-0 x Ws-0, Ler-0 x Can-0 and Ler-0 x
Gifu-2 F2 mapping populations are represented by the light blue, red and grey bars, respectively. The closest
molecular markers on chromosome V (blue bar) of Arabidopsis are indicated by arrowheads. The resistance
loci of the F2 populations are contained within the QTL region. The centromere of chromosome V is
indicated by the blue ellipse.
3.3.6 Allelism Tests
Accessions Ws-0, Gifu-2 and Can-0 had been shown to exhibit a resistant infection
phenotype (see 3.2.1) in response to C. higginsianum inoculation. All three accessions
have a recessive inheritance of the resistance locus (see 3.2.2). For Ws-0, the genomic
region harbouring the recessive resistance locus was located in a ~ 100 kb region between
the molecular markers 236 and 312 (see 3.3.3) on the lower arm of chromosome V.
Likewise, genetic linkage analysis, carried out with small Ler-0 x Gifu-2 and Ler-0 x Can-
0 F2 mapping populations (see 3.3.4) indicated potential linkage of resistance to molecular
markers located on the lower arm of chromosome V, including the 100 kb region
previously identified for the Ler-0 x Ws-0 F2 population. Furthermore, a QTL analysis
with the Ler-0 x Kondara RIL population identified a major QTL governing resistance to
C. higginsianum (see 3.5). The location of this QTL was in accordance with the location
of the region of interest determined by Mendelian genetic analysis (Fig 3.12). It cannot be
ruled out that resistance in Ws-0, Can-0, Gifu-2 and Kondara is conferred by different loci
positioned within the detected region on the lower arm of chromosome V. However
83

Results
instead, resistance is likely due to the effect of the same locus. In order to test this
hypothesis, allelism crosses were generated and the infection phenotypes of the
subsequent generations were analysed in response to C. higginsianum inoculation. For
this, allelism crosses were generated between all four selected resistant accessions and the
resulting F1 and according F2 generations were tested for their macroscopic infection
phenotypes at seven days after inoculation with C. higginsianum (Fig. 3.13, Tab. 3.11). If
resistance was conferred by different recessive resistance loci in the resistant accessions,
the F1 generations were expected to exhibit a susceptible phenotype and the F2 lines
should segregate 3:1 (susceptible : resistant). However, if resistance was conferred by the
identical recessive resistance locus, then F1 plants were expected to resemble the resistant
parental phenotypes and the F2 progeny should be uniformly resistant.
84

Results
Figure 3.13 Macroscopic infection phenotypes of Arabidopsis accessions and F2 plants of allelism-
crosses six days after inoculation with Colletotrichum higginsianum.
Presented are infection phenotypes of three-week-old plants of resistant and susceptible Arabidopsis
accessions (left column) and F2 generations (right column) derived from crosses of Ws-0 (as female or as
male parent) to Gifu-2, Can-0 and Kondara, inoculated with C. higginsianum at 6 dpi.
Plants of the F1 generations from all allelism crosses exhibited a uniform resistant
phenotype at seven days after inoculation with C. higginsianum (data not shown), and
were therefore not markedly different from the resistant phenotypes of their parents.
Likewise, in the F2 generations, no segregation of infection phenotypes could be identified
for at least 100 F2 plants per allelism cross (Tab. 3.11). All inoculated F2 plants exhibited
resistance resembling that of the parental accessions (Fig. 3.13).
Table 3.11: Infection phenotypes of F2 generations from reciprocal
allelism crosses between resistant Arabidopsis accessions Parental accession 1 Parental accession 2
Gifu-2 Can-0 Kondara
Ws-0 resistant resistant resistant
Parental accession 1 was crossed to parental accession 2 and three-week-old plants of
the resulting F2 lines (at least 100 plants per line) were inoculated with C.
higginsianum. Macroscopic infection phenotypes were determined at seven days after
inoculation.
In conclusion, resistance in F1 plants and a uniform resistance in F2 progeny was obtained
for all tested allelism crosses in response to C. higginsianum inoculation. This observation
indicates the presence of a single recessive resistance locus that is identical in the resistant
accessions Ws-0, Gifu-2, Can-0 and Kondara.
85

Results
3.3.7 Summary of genetic analysis of recessive resistance of Arabidopsis to C.
higginsianum
Positional cloning in a Ler-0 x Ws-0 F2 mapping population was utilised to identify the
molecular mechanisms responsible for the observed natural variation in recessive
resistance to C. higginsianum (see 3.3.3). In addition to identification of recessive
resistance loci by classical Mendelian mapping, QTL analysis of a Ler-0 x Kondara RIL
populations identified a resistance locus on the lower arm of chromosome V (see 3.3.5).
The identified recessive resistance locus could be confirmed to be allelic between Ws-0,
Gifu-2, Can-0 and Kondara (see 3.3.6, Fig. 3.12 and Fig. 3.13).
Table 3.12: Inheritance of resistance in F1 and F2 generations from
crosses of selected Arabidopsis accessions and methods
used for mapping Susceptible
parent Resistant
parent DS of
F1 plants Segregation in F2 generation
(S:R)
Mapping method and position of resistance locus
Ler-0 Eil-0 1 (R) 1:3 positional cloning (RCH1) (Narusaka
et al., 2004) Ler-0 Ws-0 2-3 (S) 3:1 positional cloning,
chromosome V Ler-0 Can-0 2-3 (S) 3:1 positional cloning,
allelism tests, chromosome V
Ler-0 Gifu-2 2-3 (S) 3:1 positional cloning, allelism tests,
chromosome V Ler-0 Kondara n.d. n.d. QTL-mapping
chromosome V Disease score (DS): 0, fully resistant; 1, intermediate resistant, 2, intermediate
susceptible; 3 fully susceptible.
n.d., not determined; S, susceptible phenotype; R, resistant phenotype.
86

Results
3.4 Candidate genes and expression analysis
The identified ~100 kb region located between the flanking markers 236 (18,307,842 bp),
and 312 (18,407,860 bp) in the Ler-0 x Ws-0 F2 mapping population harbours a locus
conferring recessive resistance to C. higginsianum. Based on sequence analysis of the Col-
0 accession, this region contains 20 candidate genes (Tab. 3.13).
Table 3.13: Candidate genes within the region identified to contain a
locus conferring recessive resistance to C. higginsianum Gene ID Description
At5g45210 Putative disease resistance protein (TIR-NB-LRR)
At5g45220 Putative disease resistance protein (TIR-NB-LRR)
At5g45230 Putative disease resistance protein (TIR-NB-LRR)
At5g45240 Putative disease resistance protein (TIR-NB-LRR)
At5g45250 RPS4, Pseudomonas syringae disease resistance protein (TIR-NB-LRR)
At5g45260 RRS1, recessive resistance to Ralstonia solanecearum (TIR-NB-LRR with
WRKY52 motif)
At5g45275 Similar to nodulin-related gene NFD4, (Nuclear Fusion Defective 4)
At5g45276 Unknown pseudogene
At5g45280 Putative pectinacetylesterase
At5g45290 Zinc finger (C3HC4-type RING finger) family protein
At5g45300 BAM8/BMY2, beta-amylase 8
At5g45307 MicroRNA targeting AGO1
At5g45310 Similar to rice gene Os01g0962100
At5g45320 Unknown protein
At5g45330 Unknown protein
At5g45340 Putative ABA 8'-hydroxylase; involved in ABA catabolism
At5g45350 Non-secreted proline-rich protein
At5g45360 F-box family protein
At5g45370 Nodulin-related integral membrane protein
At5g45380 Sodium symporter protein
87

Results
Since the resistance locus was identified in the Ler-0 x Ws-0 F2 mapping population, I
cannot rule out that additional genes are present in the region of interest which are absent
from Col-0 in this region. Conversely, genes identified in the region of interest in the Col-
0 genetic background might not be present in Ler-0 or Ws-0.
The database “Genevestigator” (www.genevestigator.com) is a reference expression
database which allows the expression and regulation of genes to be studied by compiling
information from hundreds of microarray experiments. For 15 of the 20 candidate genes,
expression patterns had been assigned to certain plant organs in uninfected Arabidopsis
plants of the accession Col-0 by microarray analyses (Fig. 3.14). This organic-specific
assignment was analysed in an attempt to exclude genes from the list of candidates, based
on their localisation of expression. Plant factors conferring resistance/susceptibility are
expected to be localised at sites of interaction with the pathogen and its host, i.e. leaves
and stems, so that the corresponding gene expression should occur in the appropriate plant
organ. Genes whose expression was presumably restricted to root tissue were not expected
to be involved in the plant-fungal interaction, and therefore not considered likely
candidates for the resistance locus. Enhanced expression in root tissue was identified for
genes At5g45210, At5g45230, At5g45240 and At5g45380 (Fig. 3.14). However,
At5g45230 and At5gG45240 exhibited expression throughout the plant and therefore
cannot be excluded from functioning in aerial tissues interacting with C. higginsianum.
The exclusive expression of At5g45210 in roots is in accordance with the observations in
a comprehensive study by Tan et al. (2007). The differential expression of NBS-LRR
genes may function in resistance to a variety of pathogens that attack different parts of the
plants. The exclusive expression of At5g45210 in the root endodermis and cortex could
therefore hint to a function in resistance to root pathogens, e.g. nematodes. Expression of
At5g45380 has previously been shown to be involved in the uptake of urea in plant roots
(Kojima et al., 2007), in accordance with its enhanced expression in root tissue.
Constitutive expression in root tissue was not identified for any other genes in the mapped
region, but expression in the parental accessions Ler-0 and Ws-0 might be different from
the expression profile in Col-0. Furthermore, inoculation of the plants with the fungus
could change the expression of candidate genes in unpredictable ways.
A targeted expression analysis in the Ler-0 genetical background before and after C.
higginsianum inoculation was not available due to missing information of the Ler-0
sequence in this region (see 3.6). Narusaka et a.l (2004) performed a microarray analysis
using arrays consisting of approximately 7,000 Arabidopsis full-length cDNAs to compare
88

Results
gene expression of uninoculated Col-0 plants versus plants inoculated with C.
higginsianum. Their expression profile of 120 Arabidopsis genes which were significantly
induced by inoculation did not include the candidate genes I identified in the present
study.
Figure 3.14: Heat map of expression values of 15 Arabidopsis genes on chromosome V, according to
microarray analysis of plant organs in unchallenged plants.
Varying numbers of microarray analyses (right column) identified the specific expression of Arabidopsis
(Col-0) genes in individual plant organs and their corresponding cell tissues. The expression potential (EP)
of a given gene is defined here as the average of the top 1% signal values of a probe set across all arrays in
the database. The darkest colour corresponds to the EP value. Image modified from the genevestigator
database (www.genevestigator.com).
89

Results
3.5 Analysis of Arabidopsis T-DNA insertion mutants
A large collection of Agrobacterium tumefaciens transferred DNA (T-DNA) insertion
transformants of Arabidopsis has been generated through gene disruption by the random
integration of Agrobacterium T-DNA vectors into the plant genome (Alonso et al., 2003).
The locations of the insertions were subsequently determined by sequencing of the
genomic DNA flanking the T-DNA and are publicly available (http://signal.salk.edu/cgi-
bin/tdnaexpress). The generation of mutations due to the gene disruption can result in an
altered phenotype compared to the wild type which might reveal the function of the
affected gene. Due to the random insertion of the T-DNA, it can be located in promoter
regions or exons, but also in an intron and intergenic region, and therefore may not always
result in gene disruption.
In order to identify the recessive resistance locus among the 20 identified candidate genes,
several Arabidopsis mutants with insertions in the candidate genes were analysed for their
infection phenotypes after C. higginsianum inoculation (Tab. 3.14). For each line, at least
20 individual plants were tested, as most T-DNA insertion mutant lines consist of a
mixture of homozygous and heterozygous plants. I expected that only mutants affected in
the recessive resistance locus would exhibit a different infection phenotype compared to
the corresponding wild type. Several different collections of T-DNA insertion mutants are
available (Sundaresan et al., 1995; Tissier et al., 1999; Samson et al., 2002; Alonso et al.,
2003). These mutant collections were generated in the genetic backgrounds Col-0, Ws-2
and Ler-0, two of which differ from the parental accessions used for the present mapping
analysis. Thus, a screen of the candidate genes in these mutant collections harboured the
problem that the gene of interest may not be present in the mutant collection or, due to
natural variation between Arabidopsis accessions, could have varying effects on the
infection phenotype. Furthermore, for many of the selected mutant lines in the Ws-2 and
Ler-0 genetic backgrounds, the insertion constructs were predicted not to be located in the
coding regions of the genes, based on the Col-0 reference sequence, and are therefore
listed according to the gene with the closest proximity.
90

Results
Table 3.14: List of tested Arabidopsis T-DNA insertion mutants and their
response to Colletotrichum higginsianum inoculation Affected
gene Seed-stock
identification Genetic
background Seed-stock
centre Macroscopical
phenotype At5g45200 EOTTV19T3 Ws-2 INRA wild-type At5g45210 DYHTV92T3 Ws-2 INRA wild-type At5g45210 N564468 Col-0 NASC wild-type At5g45220 N140586 Ler-0 NASC wild-type At5g45220 N620694 Col-0 NASC wild-type At5g45230 N514813 Col-0 NASC wild-type At5g45240 ESYTV2T3 Ws-2 INRA wild-type At5g45240 N568070 Col-0 NASC wild-type At5g45240 N521539 Col-0 NASC wild-type At5g45240 N524831 Col-0 NASC wild-type At5g45250 N565748 Col-0 NASC wild-type At5g45250 GT6567 Ler-0 CSH wild-type At5g45260 N561602 Col-0 NASC wild-type At5g45260 N599734 Col-0 NASC wild-type At5g45275 N663173 Col-0 NASC wild-type At5g45275 N607262 Col-0 NASC wild-type At5g45275 N662744 Col-0 NASC wild-type At5g45276 EYKTV172T3 Ws-2 INRA wild-type At5g45276 CVGTV3T3 Ws-2 INRA wild-type At5g45280 EXZTV192T3 Ws-2 INRA wild-type At5g45280 DXMTV35T3 Ws-2 INRA wild-type At5g45280 DYHTV11T3 Ws-2 INRA wild-type At5g45280 EXJTV48T3 Ws-2 INRA wild-type At5g45280 N524444 Col-0 NASC wild-type At5g45290 N604509 Col-0 NASC wild-type At5g45290 N625067 Col-0 NASC wild-type At5g45290 EAQTV54T3 Ws-2 INRA wild-type At5g45290 N660962 Col-0 NASC wild-type At5g45300 N661204 Col-0 NASC wild-type At5g45307 N594145 Col-0 NASC wild-type At5g45310 FBOTV28T3 Ws-2 INRA wild-type At5g45330 EEUTV145T3 Ws-2 INRA wild-type At5g45340 N601566 Col-0 NASC wild-type At5g45340 N578170 Col-0 NASC wild-type At5g45340 FCATV57T3 Ws-2 INRA wild-type At5g45350 N579478 Col-0 NASC wild-type At5g45360 ABWTV8T3 Ws-2 INRA wild-type At5g45360 CRCTV7T3 Ws-2 INRA wild-type At5g45360 EQMTV47T3 Ws-2 INRA wild-type At5g45360 N514089 Col-0 NASC wild-type At5g45360 N164485 Col-0 NASC wild-type At5g45380 ACCTV4T3 Ws-2 INRA wild-type
91

Results
Table 3.14: continuation
Three-week-old plants (at least 20 plants of each mutant line) were inoculated with
C. higginsianum and at 7 dpi scored for their macroscopic infection phenotypes. The
localisation of the insertion constructs in the Arabidopsis genome
(http://signal.salk.edu/cgi-bin/tdnaexpress) was based on the Col-0 reference
sequence. Insertion constructs in the Ws-2 and Ler-0 background might not be
localised in the coding region of the indicated genes and are therefore listed
according to the gene with the closest proximity.
Wild-type-like, macroscopic phenotype of mutant plants was indistinguishable from
that of the wild-type genetic background.
None of the listed 42 mutant lines affected in the coding or intergenic regions of 20 genes
(based on the Col-0 reference sequence), showed and altered infection phenotype
compared to the corresponding wild-type genetic background. Therefore the phenotypes
of the tested T-DNA mutants did not provide any hint to the possible identity of the
resistance locus.
3.6 Screening of an Arabidopsis Ler-0 binary bacterial artificial
chromosome (BIBAC)-library
In the course of developing molecular markers for positional cloning (see 3.3.2), I found
that the Col-0 sequence in the region of interest is highly polymorphic to the sequence of
the parental accessions Ler-0 and Ws-0. Several of the PCR-based markers that were
designed based on the Col-0 sequence were functional in a PCR reaction with Col-0
genomic DNA as template (data not shown). However, use of the same markers in a PCR
reaction with template DNA from accessions Ler-0 and Ws-0 did not result in a PCR
product. This was especially noticeable for the region ~ 18,300,000-18,330,000 bp, a
region containing predicted or verified TIR-NB-LRR genes (see 3.4). This suggests the
existence of major sequence divergence between Col-0 and Ler-0/Ws-0 in this region.
Sequencing of the entire region of interest in Ler-0 was therefore expected to reveal both
major and minor sequence polymorphisms between Col-0 and Ler-0 including possible
absence of genes identified in Col-0, or presence of additional genes in this region in Ler-
0 that had not been identified for Col-0. Polymorphisms could also be due to gene
92

Results
duplications, deletions, inversions and truncations (Clark et al., 2007). However, even
single nucleotide polymorphisms between the two accessions could result in natural
variation in their response to C. higginsianum infection (Chu et al., 2006; Clark et al.,
2007). To draw conclusions about the nature of polymorphisms responsible for the
observed natural variation in resistance to C. higginsianum, the Ler-0 sequence of the
recessive resistance locus would have to be compared to that of resistant accessions.
A Bacterial Artificial Chromosome (BAC) library, containing large-inserts of Ler-0
genomic DNA, constructed in a plant-transformation-competent binary BAC vector
(BIBAC2), was available (Chang et al., 2003). The library contains 11,520 clones with an
estimated average insert size of 162 kb and ~ 11.5 coverage of the genome. This Ler-0
BIBAC library (kindly provided by Dr. W. Soppe, Cologne, Germany) was screened (with
the kind help of C. Philipp, Cologne, Germany) with the two radioactively labelled probes
176 (18,306,114-18,306,878 bp) and 205 (18,337,817-18,338,557 bp) (Tab. SD2) in a
single screening experiment. Hybridisation of at least one of these probes to the insert
nucleotide sequences of 10 BACs was identified. Therefore these BACs were expected to
contain parts of or the entire region of interest within their inserts. The approximate insert
size of the 10 BACs could be identified by digestion with the endonuclease enzyme BamH
I to vary between 75,300 bp and 150,000 bp (data not shown) and was therefore in
accordance with an expected average insert size of 160 kb (Chang et al., 2003).
BIBAC transformation of Ws-0 plants could test the hypothesis that resistance of Ws-0 is
due to natural variation in a true susceptibility factor. Transformation of a functional
susceptibility factor into a resistant genetic background, such as Ws-0, would be expected
to result in gain of susceptibility. However, previous attempts of BIBAC transformation
into Arabidopsis plants were not successful, possibly due to the large insert size of the
BACs (Prof. B. Weisshaar, Bielefeld, Germany, personal communication), and therefore
this strategy was not pursued further in the present study.
To identify the precise insert size and its position within the Arabidopsis genome (based to
the Col-0 reference sequence), vector end sequencing was carried out by QIAGEN
(Hilden) for eight of the 10 BACs. For this purpose, BAC end sequencing reactions were
conducted, aiming to determine 800-1200 bp of the insert sequence starting from both
ends of the insert. The insert end sequences could then be subjected to homology searches
using the Basic Local Alignment Search Tool (BLAST) megablast algorithm (Altschul et
al., 1997) against the Col-0 reference sequence to identify putative matches to the
sequences. A precise location of the insert sequence (18,308,223-18,377,702 bp) could be
93

Results
determined for only one BAC clone (designated BAC #8). For the other seven BACs, a
genomic location could not be established for at least one insert end due to poor sequence
homology, which was consistent with the previously identified major polymorphisms
between the Col-0 and Ler-0 sequences in this region.
Assembly of sequencing data of the entire insert of BAC #8 by QIAGEN resulted in the
generation of five contigs. Analysis of these contigs identified the presence of the TIR-
NB-LRR genes At5g45210, At5g45250 and At5g45260 and presence of the genes
At5g45275, At5g45276, At5g45280, At5g45290, At5g45300 and At5g45310 (see 3.4)
with varying degrees of polymorphisms to the Col-0 reference sequence. Presence of the
genes At5g45220, At5g45230 and At5g45240 as identified in the Col-0 reference
accession could not be confirmed. When the sequence of contig #2 was subjected to
homology searches using BLASTN, significant alignments to At5g45220 (92% identity)
could be identified, indicating the presence of TIR-NB-LRR genes in Ler-0 with
polymorphic sequences compared to the TIR-NB-LRR genes identified for Col-0. The
high degree of the overall Ler-0 DNA sequence variation to the Col-0 reference sequence
in the region containing the cluster of TIR-NB-LRR genes confirms previous findings (see
above).
Further analysis of the insert sequence identified the presence of a ~ 5000 bp region
located between At5g45290 and At5g45300 in Ler-0 that could not be identified at this
position for the Col-0 reference sequence. Homology analysis for this sequence identified
the presence of a sequence of a 600 bp-length with a 99% homology to the reverse
transcriptase Ta24 gene, which could indicate an insertion of a non-LTR retrotransposon
into the Ler-0 sequence (Wright et al., 1996).
Analysis of the genes At5g45320 – At5g45380 was not possible as their DNA sequence
was not included in the insert of BAC #8.
3.7 Cytological analysis of fungal pathogenesis and host responses in
resistant and susceptible Arabidopsis accessions
Natural variation in responses to C. higginsianum inoculation between the resistant
Arabidopsis accessions Ws-0, Gifu-2, Can-0, Kondara and the susceptible accession Ler-0
had been identified to be caused by a single recessive resistance locus. It was therefore of
interest to characterise the cytological basis of recessive resistance. The comparative
94

Results
cytological analysis aimed to determine whether all resistant accessions show resistance at
the same stage of fungal pathogenesis as expected for resistance due to the effect of a
single recessive resistance locus. I also attempted to quantify the extent of resistance in the
different accessions.
Two additional accessions, Eil-0 and Col-0, were included in this cytological analysis. Eil-
0 has been described previously by Narusaka et al. (2004) as a resistant accession in
which resistance to C. higginsianum was conferred by the single dominant resistance locus
RCH1. The accession was included in several comparative tests to identify whether the
dominant resistance in Eil-0 is associated with a different infection phenotype or defence
responses compared to the recessive resistance identified in Ws-0, Gifu-2 and Can-0 and
Kondara. The accession Col-0 had been shown to exhibit an intermediate susceptible
phenotype (DS 2-3) (Tab. 3.2) and the analysis of symptoms and microscopical tests
indicated that fungal pathogenesis is more restricted compared to fully susceptible Ler-0
(Fig. 3.7). Therefore, Col-0 was an interesting accession which may offer additional
natural variation in response to C. higginsianum infection.
Resistance could conceivably occur at different stages of fungal pathogenesis. It could
manifest at early stages of infection, e.g. with appressorium formation and penetration of
epidermal cells. Therefore, the presence of biotrophic primary hyphae beneath appressoria
was quantified (see 3.7.1) in order to estimate the efficiency of appressorial penetration.
Resistance could also occur at later stages of pathogenesis by restriction of the
development of biotrophic primary hyphae and of necrotrophic secondary hyphae.
Therefore, the extent of hyphal colonisation was quantified by ELISA (enzyme-linked
immunosorbent assay) (see 3.7.2). In addition, restriction of fungal spread within the plant
might limit fungal asexual reproduction. Fungal spore-production in planta was therefore
also quantified (see 3.7.3). Moreover, typical active plant resistance mechanisms, e.g.
production of reactive oxygen species (ROS) and callose deposition at pathogen entry
sites, were analysed histochemically and quantified to assess their possible contribution to
the observed resistance of selected accessions (see 3.7.4).
3.7.1 Analysis of appressorial penetration efficiency
Following the germination of spores on the plant surface, C. higginsianum invades the
host tissue by the development of a series of specialised infection structures, including
germ-tubes, appressoria, penetration pegs, biotrophic primary hyphae and necrotrophic
95
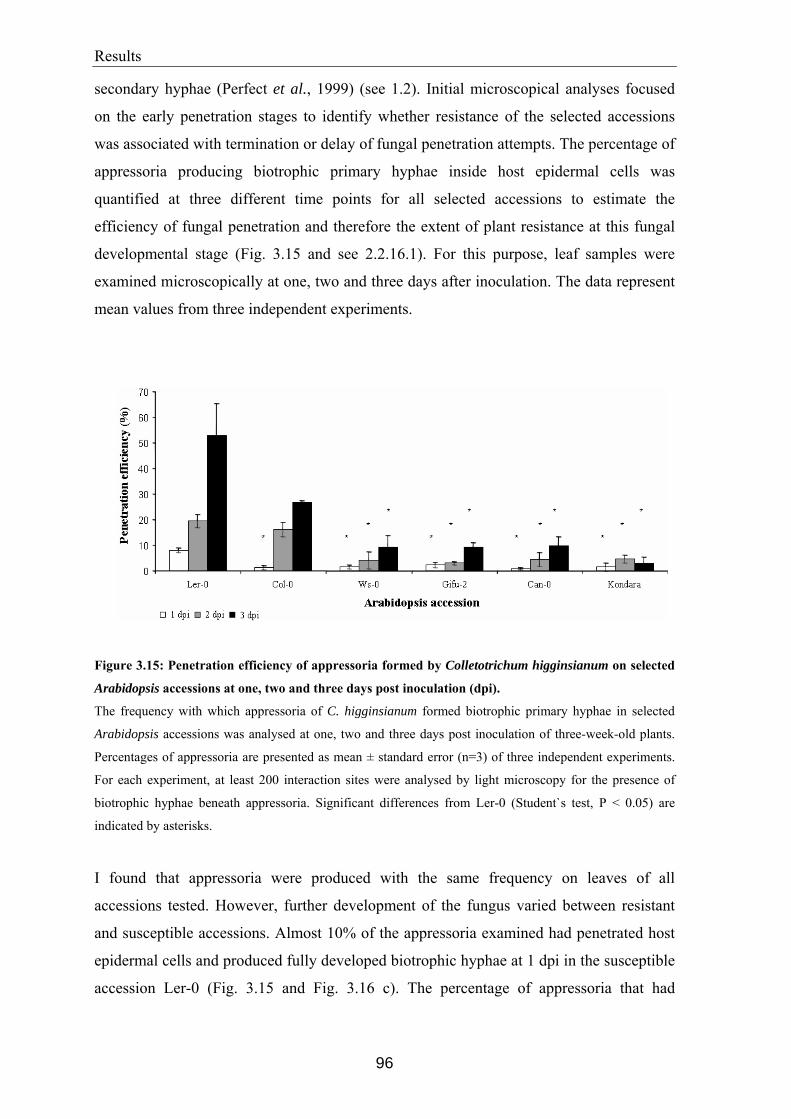
Results
secondary hyphae (Perfect et al., 1999) (see 1.2). Initial microscopical analyses focused
on the early penetration stages to identify whether resistance of the selected accessions
was associated with termination or delay of fungal penetration attempts. The percentage of
appressoria producing biotrophic primary hyphae inside host epidermal cells was
quantified at three different time points for all selected accessions to estimate the
efficiency of fungal penetration and therefore the extent of plant resistance at this fungal
developmental stage (Fig. 3.15 and see 2.2.16.1). For this purpose, leaf samples were
examined microscopically at one, two and three days after inoculation. The data represent
mean values from three independent experiments.
Figure 3.15: Penetration efficiency of appressoria formed by Colletotrichum higginsianum on selected
Arabidopsis accessions at one, two and three days post inoculation (dpi).
The frequency with which appressoria of C. higginsianum formed biotrophic primary hyphae in selected
Arabidopsis accessions was analysed at one, two and three days post inoculation of three-week-old plants.
Percentages of appressoria are presented as mean ± standard error (n=3) of three independent experiments.
For each experiment, at least 200 interaction sites were analysed by light microscopy for the presence of
biotrophic hyphae beneath appressoria. Significant differences from Ler-0 (Student`s test, P < 0.05) are
indicated by asterisks.
I found that appressoria were produced with the same frequency on leaves of all
accessions tested. However, further development of the fungus varied between resistant
and susceptible accessions. Almost 10% of the appressoria examined had penetrated host
epidermal cells and produced fully developed biotrophic hyphae at 1 dpi in the susceptible
accession Ler-0 (Fig. 3.15 and Fig. 3.16 c). The percentage of appressoria that had
96

Results
successfully penetrated, increased at 2 dpi to 20%, and at 3 dpi, more than 50% of the
appressoria examined had penetrated host epidermal cells.
In accordance with previous observations, Col-0 presented an intermediate susceptible
phenotype (DS 2). Absolute fungal penetration efficiency on this accession was only
slightly reduced in comparison to Ler-0, but the timing of penetration was delayed. Hence,
at 1 dpi the percentage of appressoria producing biotrophic hyphae was significantly lower
than for Ler-0, but percent penetration had increased to almost 30% at 3 dpi (Fig. 3.15).
Therefore, penetration was not significantly different to Ler-0 at later time points.
Figure 3.16: Differing outcomes of attempted penetration by Colletotrichum higginsianum appressoria
into Arabidopsis leaf epidermal cells.
Arabidopsis leaves were harvested three days after inoculation with C. higginsianum, cleared and analysed
by light microscopy without staining. Upon germination, C. higginsianum spores produced a specialised
infection structure, the melanised appressorium (A), which generates enormous turgor pressure to penetrate
host epidermal cells.
(a) Penetration attempt of C. higginsianum appressorium (A) into an epidermal cell of the resistant
Arabidopsis accession Ws-0. Note basal penetration pore (arrow). Bar, 8 µm.
(b) Penetration by an appressorium into an epidermal cell of resistant Arabidopsis accession Gifu-2 resulted
in the production of a small penetration peg (asterisk), but fungal development did not progress further. Bar,
15 µm.
(c) Penetration by an appressorium into an epidermal cell of susceptible Arabidopsis accession Ler-0
resulted in the production of biotrophic primary hyphae (arrowhead). Bar, 15 µm.
In contrast to these findings, penetration efficiency of the fungus in all the resistant
accessions (Ws-0, Gifu-2, Can-0 and Kondara) was significantly lower than in Ler-0 and
Col-0. Fully developed melanised appressoria of normal appearance could be observed in
these resistant accessions and the detection of appressorial penetration pores and short
penetration pegs (Fig. 3.16a and b) suggests that these appressoria attempted to penetrate
97

Results
the underlying plant epidermal cells. However, successful penetration occurred with a
significantly lower frequency than in Ler-0. Less than 2% of appressoria formed in the
resistant accessions had produced fully developed biotrophic hyphae at 1 dpi, and this did
not increase beyond 10% at 3 dpi. Thus, penetration efficiency was significantly lower
than on Ler-0 at all three time points, and overall penetration efficiency on all accessions
was less than 20% of the efficiency on Ler-0 at 3 dpi (Fig. 3.15).
Although the level of biotrophic hyphae production in resistant accessions at 3 dpi was
similar to that in Ler-0 at 1 dpi, it could be demonstrated that the reduced penetration
efficiency was not simply due to a delay in fungal penetration. Quantification of
appressoria forming biotrophic hyphae at the later time point of 7 dpi (Fig. 3.17) when
Ler-0 plants had already fully collapsed, showed that in resistant accessions only ~3.6% of
appressoria had successfully penetrated. Therefore, even four days later, penetration
efficiency was markedly reduced compared to that on susceptible Ler-0 plants at 3 dpi.
This indicates that fungal development is terminated at the penetration stage in all the
resistant accessions examined. This result was in accordance with the macroscopic
phenotypes at 9 dpi (Fig. 3.7), where the resistant accessions showed few symptoms,
whereas Ler-0 plants died as early as 5-6 dpi.
Recapitulating the findings, I could establish that in all Arabidopsis accessions tested the
fungus produced normal fully developed appressoria at a high frequency. Furthermore,
penetration attempts could be observed in all accessions by the formation of penetration
pores and penetration pegs at the base of appressoria. However, the production of
biotrophic hyphae reflecting the efficiency of penetration was significantly reduced in the
resistant accessions Ws-0, Gifu-2, Can-0 and Kondara compared to the susceptible
accession Ler-0. Col-0 exhibited an intermediate efficiency of penetration. On the
susceptible Ler-0 accession, appressorial penetration efficiency was not only higher than
on resistant accessions, but also occurred more rapidly, with an earlier development of
biotrophic hyphae. It can be concluded that active or passive resistance mechanisms
responsible for the reduced fungal growth during penetration of the plant cuticle or cell
wall must act at a very early stage of fungal development seen in tested resistant
accessions.
98

Results
Figure 3.17: Penetration efficiency of Colletotrichum higginsianum appressoria on five resistant
Arabidopsis accessions at seven days post inoculation (dpi).
The proportions of appressoria which had penetrated (visible biotrophic hyphae) or not penetrated (no
visible hyphae) epidermal cells of five resistant Arabidopsis accessions were analysed by light microscopy
after inoculation of three-week-old plants with C. higginsianum. Percentages of appressoria are presented as
means from three independent experiments and error bars show the standard deviation. For each experiment,
at least 300 interaction sites were analysed for the presence of biotrophic hyphae beneath appressoria.
3.7.2 Quantification of hyphal growth
In a susceptible plant, after successful penetration by the appressorium, the fungus invades
a single epidermal cell by the production of biotrophic primary hyphae (see 1.2). This
initial stage, in which the plant cell remains alive, is eventually followed by a switch to a
necrotrophic mode of infection. It is plausible to expect that in resistant accessions the
extent of fungal colonisation of host tissue would be limited, as I had previously shown
that a low percentage of appressoria successfully penetrate the epidermis (Fig. 3.15).
Thus, it was expected that a reduced number of biotrophic hyphae would result in a
reduced number of necrotrophic hyphae, and therefore in a reduced size and number of
fungal colonies. In accordance with this, following inoculation of the resistant accessions
Ws-0, Gifu-2, Can-0 and Kondara with a transgenic C. higginsianum strain that
constitutively expresses GFP in the cytoplasm (Fig. 3.7b), fungal colonies were indeed
reduced in size and number. The red autofluorescence of plant chlorophyll indicated that
the plant tissue adjacent to fungal colonies remained intact at this time point in the
resistant accessions (3 dpi). This observation was in a clear contrast to the much larger
99

Results
size and number of fungal colonies identified after inoculation of Ler-0 plants.
Presumably, the higher proportion of appressoria that had successfully penetrated resulted
in more extensive fungal growth and colonisation. Furthermore, I could identify by the
lack of red autofluorescence of the invaded plant cells that these were no longer intact and
destroyed by fungal growth. This effect was also visible in directly adjacent cells not yet
invaded by fungal hyphae, demonstrating that the fungus seems to be able to disrupt cells
ahead of infection, possibly by the secretion of diffusible cell wall degrading enzymes or
fungal toxins. However, it remains unclear whether the reduced size and number of fungal
colonies on the resistant accessions is solely due to the reduced penetration efficiency of
the appressoria, or whether growth of the hyphae themselves is also inhibited.
Consistently, in the intermediate infection phenotype of Col-0, the size and number of
fungal colonies was less than in susceptible Ler-0 plants, but more than in any of the
resistant accessions.
To quantify hyphal growth in different accessions, an enzyme-linked immunosorbent
analysis (ELISA) was conducted (Fig 3.18 and see 2.2.17). Fungal mycelium could be
detected and therefore quantified by the binding of a Colletotrichum genus specific
antibody MAFF27 (Cook et al., 1995). Using immunofluorescence microscopy, this
commercially available monoclonal antibody MAFF27 was shown to bind specifically to
the biotrophic primary hyphae and secondary, necrotrophic hyphae of C. higginsianum,
but not to spores or appressoria (Fig. 3.19). For use in ELISA, a secondary antibody
conjugated to alkaline phosphatase was used together with the substrate P-nitrophenyl
phosphate. The colour of the reaction product was quantified in a plate reader by
measuring the specific absorbance of the samples at 405 nm (A405). Three samples of each
accession, each consisting of 1g plant material, were estimated.
100

Results
Figure 3.18: Quantification of Colletotrichum higginsianum hyphal growth in selected Arabidopsis
accessions four days post inoculation (dpi).
The extent of hyphal growth of C. higginsianum in leaf tissue of selected Arabidopsis accessions was
quantified four days after spray-inoculation of three-week-old plants by ELISA using a genus-specific
monoclonal antibody. Results are presented as mean absorption units in 1g of plant fresh-weight and error
bars show the standard deviation of three replicate samples. Independent repetitions of the experiment
showed similar results (data not shown).
The ELISA confirmed that more extensive hyphal growth occurred in Ler-0 plants
compared to all other accessions tested (Fig. 3.18). In accordance with the microscopical
analysis, the extent of hyphal growth in Col-0 was intermediate and lower in all of the
resistant accessions. Thus, the detected A405 for the resistant accessions were at least 50%
lower than the absorbance value for Ler-0. However, these findings must be interpreted
with care since the ELISA experiment exhibited several technical problems that prevented
an exact quantification of fungal growth to be made in planta. Samples from plants were
harvested at four days after inoculation which was the earliest time point a clear difference
in fungal hyphal growth could be detected by ELISA. At this time point, the integrity of
the plant tissue is already affected by fungal infection. The susceptible accessions Ler-0
and Col-0 exhibited water soaked lesions which affected the overall fresh weight of the
plants. However, fresh weight was the most suitable measure to standardise the amount of
plant material analysed in these experiments. Therefore, the influence of infection on
tissue fresh weight is likely to bias the amount of fungal growth. Moreover, due to
variation between the three independent samples of each accession originating from the
same batch of infected plants, the standard deviations obtained were high. I concluded that
a precise quantification of hyphal growth in different accessions is not possible by ELISA.
In order to develop a more accurate estimation of hyphal growth in planta, an analysis by
semi-quantitative PCR was attempted. The aim was to quantify hyphal growth by PCR-
based detection of the expression of the transgene hygromycin B phosphotransferase (hph)
in plant samples after inoculation with a C. higginsianum strain which expresses hph
under control of a strong constitutive promoter from the Apergillus nidulans GPDA gene
(O'Connell et al., 2004). However, it was not possible to compare hyphal growth in planta
reliably between different plant genotypes due to problems with normalising the amount
of sample analysed. As with the ELISA test (see above), significant differences in hyphal
growth could only be detected when plants already exhibited strong symptoms of fungal
infection. Therefore, both the fresh-weight and size (area) of plant tissue samples were
101

Results
strongly affected by presence of the water-soaked and necrotic lesions, leading to
inaccurate equalisation between the samples and to a misleading estimation of pathogen
growth. Degradation of plant genomic DNA at this stage of fungal infection prevented a
normalisation by plant internal standards, such as Rubisco (data not shown). Furthermore,
the same number of plants or leaves could not be analysed because the tested genotypes
had significantly different sizes of plants and leaves. Hence, aberrant PCR kinetics
associated with sampling heavily necrotised tissues cannot easily be avoided.
Nevertheless, the microscopical observations of GFP-tagged mycelia, in combination with
the quantification of hyphal growth by ELISA, even though inaccurate, convincingly
demonstrated a strong reduction in hyphal growth in the resistant accessions Ws-0, Gifu-2,
Can-0 and Kondara compared to the intermediate susceptible Col-0 and the susceptible
accession Ler-0. This is consistent with the previous findings of a reduced appressorial
penetration efficiency which resulted in reduced production of biotrophic and necrotrophic
hyphae. However, it remains unclear whether this difference in hyphal growth also results
from post-penetration defence responses or deficiency in a plant factor required for post-
penetration development of the fungus.
Figure 3.19: Immunofluorescencelabelling of Colletotrichum higginsianum biotrophic and
necrotrophic hyphae isolated from infected leaves of Arabidopsis.
A method for isolating C. higginsianum fungal structures from infected leaves of Arabidopsis was adapted
from (Pain et al., 1994). Inoculated Arabidopsis leaves were homogenised filtered to remove plant debris
and the fungal structures collected by isopycnic centrifugation on Percoll. After drying onto microscope
slides, the fungal structures were then incubated in undiluted monoclonal antibody, raised in rats, which is
highly specific for Colletotrichum (Cook et al., 1995), followed by incubation with a secondary goat
monoclonal anti-rat-antibody, which was fluorescein (FITC) conjugated. Specific binding of the monoclonal
antibody to primary, biotrophic hyphae (PH) and secondary, necrotrophic hyphae (SH) was identified by
confocal microscopy. No binding of the monoclonal antibody to fungal appressoria (A) and conidia (C) or
plant chloroplasts could be detected.
102
Results
3.7.3 Quantification of spore production
Sporulation of the fungus indicates completion of the pathogenic life-cycle. Only if the
fungus passes through all developmental stages can the necrotrophic hyphae produce
sporangiophores with spore acervuli. This, in turn enables the fungus to disperse its
propagules to other areas of the same leaf, further leaves of the same plant or adjacent
plants. Hence, this final stage of the fungal infection cycle can also be considered an
indicator of host resistance or susceptibility.
As spores can be produced only after successful penetration of the plant and production of
necrotrophic hyphae, it was expected that the selected resistant accessions should exhibit a
reduced production of spores compared to the susceptible accessions. Therefore, the
number of fungal spores washed from 1g fresh weight of plant material and was quantified
at four and five days after inoculation (Fig. 3.20 and see 2.2.16.4). Three replicate samples
(nine plants per sample), prepared from the same inoculation experiment, were evaluated
and the mean and standard deviation was calculated. Independent repetitions of this
experiment showed similar results (data not shown). At 4 dpi, the sporulation of C.
higginsianum on Ler-0 was significantly greater than in Col-0 and the resistant accessions.
This is in accordance with microscopical observations, suggesting earlier penetration and
colonisation of Ler-0 than other accessions. The lower sporulation in all other investigated
accessions was highly significant and in agreement with the more limited production of
necrotrophic hyphae in these accessions as shown by ELISA and confocal microscopy.
Differences in sporulation became more evident at 5 dpi. In the resistant accessions
sporulation remained at a very low level comparable to that at 4 dpi, while in Col-0 a clear
increase in spore production was detectable at 5 dpi. However, this increase is
significantly different (P < 0.02) from the enormous increase in sporulation detected in
Ler-0 at 5 dpi. This confirms microscopical observations of abundant acervuli on Ler-0
leaves at 5 dpi.
In conclusion, quantitative analysis of fungal spore production in planta revealed a highly
significant difference in sporulation at 4, and particularly at 5 dpi, between susceptible,
intermediate susceptible and resistant accessions. This seems likely to be a consequence of
fungal development being affected at the early stage of penetration and biotrophic hyphae
production. Reduced production of biotrophic and necrotrophic hyphae would be expected
to result in fewer specialised fruiting structures essential for the generation of spores and
completion of its life cycle. The results are consistent with an early expression of
103

Results
penetration resistance in the resistant accessions, but do not exclude that the recessively
resistant plants lack additional factors required by the fungus for generation of spores.
Figure 3.20: Quantitative analysis of Colletotrichum higginsianum sporulation on selected Arabidopsis
accessions at four and five days post inoculation (dpi).
Sporulation of C. higginsianum on selected Arabidopsis accessions was quantified at four and five days after
spray-inoculation of three-week-old plants. For each accession, sporulation was analysed in plant material
from three pots (nine plants per pot), each pot was analysed individually. The average number of spores per
gram plant tissue is presented. Error bars show standard deviations. Highly significant differences from Ler-
0 (Student’s test, P < 0.02) are indicated by two asterisks. Independent repetitions of the experiment showed
similar results (data not shown).
3.7.4 Histochemical characterisation of host defence responses to C.
higginsianum infection
Active plant resistance is correlated with the activation of defence responses. The
perception of the pathogenic invader by the plant induces a series of defence reactions
such as a hypersensitive response (HR), defence gene expression and cell wall
strengthening (see 1.3).
Local generation of ROS is a frequent plant response to attack by many microbial
pathogens (Apel and Hirt, 2004; O'Connell and Panstruga, 2006) and is often linked to the
HR and to cell wall-based defence responses such as papilla deposition. However, recent
reports suggest that successful pathogenesis by some necrotrophic or hemibiotrophic
104

Results
fungal pathogens relies on, or is at least supported by, a high concentration of H2O2
(Hückelhoven and Kogel, 2003).
During fungal infection, callose has been shown to be deposited in localised cell wall
appositions, termed papillae, that form beneath infection sites and are thought to function
as both physical and chemical barriers to pathogen penetration (Zeyen et al., 2002;
Hückelhoven, 2007) (see 4.4.3). Therefore, papilla production was commonly assumed to
be an active resistance response to invading pathogens. Surprisingly, in contrast to this
assumption, the pmr4 mutant which lacks pathogen-induced callose synthase had reduced
susceptibility to virulent powdery mildew fungi and to H. parasitica (Jacobs et al., 2003;
Nishimura et al., 2003). It has therefore been postulated that PMR4 is important for
successful infection by these pathogens.
Recessive resistance mediated by the lack of a functional host susceptibility factor is
expected to not induce active defence responses (O'Connell and Panstruga, 2006; Iyer-
Pascuzzi and McCouch, 2007a). Thus, the mechanisms mediating dominant resistance,
e.g. resistance conferred by the dominant RCH1 gene in Eil-0, may differ from those
mediating recessive resistance in Ws-0, Gifu-2, Can-0 and Kondara. On the other hand, if
recessive resistance in these accessions is conferred by the presence of a recessive R gene,
active defence responses, possibly similar in nature to those triggered by the RCH1 gene,
can be expected.
As ROS production and callose deposition are common active plant responses that can be
induced early after pathogen challenge, I studied their involvement in resistance to C.
higginsianum.
3.7.4.1 Accumulation of hydrogen peroxide
The accumulation of H2O2 as a predominant ROS in plant cells after infection with C.
higginsianum was determined by staining with 3’-3’-diaminobenzidine (DAB) (Thordal-
Christensen et al., 1997) (see 2.2.16.2). DAB polymerises locally at sites of H2O2 activity
into a reddish-brown polymer which is stable in most solvents and therefore
microscopically detectable.
Plants were stained with DAB at two and three days after C. higginsianum inoculation. To
test whether ROS production is associated with resistance responses to C. higginsianum,
the presence of H2O2 in epidermal cells beneath fungal appressoria was quantified (Fig.
3.21). Thus, for at least 600 appressoria per tested accession I determined (i) whether the
105

Results
appressoria had penetrated, microscopically visible by the production of biotrophic
hyphae, and (ii) if the penetration attempt was associated with DAB staining of the
penetrated plant cell; i.e. each appressorium was classified into one of four possible
categories as shown in Fig. 3.21a. Average values from three independent experiments are
presented (Fig. 3.21b), Tab. SD4 and Tab. SD5). Consistent with previous microscopical
analyses, ~ 20% of the appressoria had successfully penetrated Ler-0 at two days after
inoculation with C. higginsianum. Penetration was observed for < 10% of appressoria in
the intermediate susceptible accession Col-0, and for < 5% of appressoria in the resistant
accessions. It was therefore possible that the plants had already perceived and responded
to the fungal attack at this early time point. However, for all tested accessions < 1% of the
penetrated appressoria had induced H2O2 accumulation as shown by DAB staining of the
penetrated cell. Likewise, < 1% of the appressoria which had not penetrated were
associated with H2O2 accumulation in the underlying plant epidermal cell.
At three days after inoculation with C. higginsianum, 60% of the appressoria examined in
Ler-0 had penetrated to produce primary hyphae (Fig. 3.21 and 3.22). 14% of penetrated
appressoria were associated with DAB staining in the penetrated plant cell and 10% of
appressoria which had not penetrated were associated with a DAB staining in the
underlying plant cell. Similarly, for appressoria in the Col-0 accession, 10% of the
penetrated appressoria were associated with DAB staining of the penetrated cell.
However, the DAB staining observed in Ler-0 (Fig. 3.22, right panel) and Col-0 plants at
3 dpi was mostly diffuse and not confined to a single epidermal cell, but was rather
distributed in patches of multiple epidermal and mesophyll cells. Since penetrated cells
stained in this way generally contained necrotrophic secondary hyphae, the staining may
reflect plant cell death caused by the activities of the fungus rather than a localised
defence response to pathogen attack. Consistent with previous findings, in all the selected
resistant accessions, including Eil-0, < 10% of the penetration attempts by appressoria
resulted in the development of biotrophic hyphae by 3 dpi (Fig. 3.21 and Fig. 3.22).
However, in clear contrast to the susceptible Ler-0 accessions and intermediate susceptible
Col-0 accessions, a negligible percentage (~ 1%) of both penetrated and non-penetrated
appressoria were associated with DAB staining of the underlying plant epidermal cell.
This finding differs from observations by Narusaka et al. (2004), who reported a high
frequency of H2O2 production in Eil-0 plants between two and three days after infection
by C. higginsianum. Furthermore, the frequency of penetration attempts associated with
DAB staining did not increase at 5 dpi (data not shown). Therefore, no detection of H2O2
106

Results
production in Eil-0 plants, in contrast to observations by Narusaka et al. (2004), is not just
due to a delayed plant response.
(a)
(b)
107

Results
Figure 3.21: Quantitative analysis of the accumulation of reactive oxygen species (ROS) in epidermal
cells of selected Arabidopsis accessions in response to Colletotrichum higginsianum appressoria.
Arabidopsis leaves were harvested two and three days after inoculation with C. higginsianum and stained
with 3,3’-diaminobenzidine (DAB) for visualisation of H2O2 accumulation in plant epidermal cells. The
DAB staining was viewed by light microscopy and host cells were scored according to whether they were
penetrated (visible biotrophic hyphae) or not penetrated (no visible hyphae).
(a) Examples of categories defined for quantitative analysis of DAB staining. Bar, 15 µm. Biotrophic hyphae
are indicated by arrowheads.
Category I: “penetrated, stained”. Successful penetration of the appressorium resulted in the production
of biotrophic hyphae. The epidermal cell attacked by the appressorium is DAB stained.
Category II “penetrated, unstained”. Successful penetration of the appressorium, visible by the presence
of biotrophic hyphae. The penetrated host cell shows no DAB staining.
Category III: “not penetrated, stained”. Appressorium did not produce visible biotrophic hyphae, but the
underlying epidermal cell is DAB stained.
Category IV: “not penetrated, unstained”. The appressorium did not produce biotrophic hyphae. No
DAB staining of the underlying epidermal cell.
(b) DAB staining in relation to penetration of host cells by biotrophic hyphae was scored according to the
categories defined in (a). The percentages of appressoria represent the mean and standard error (n=3) of at
least 600 interaction sites distributed over 12 leaves, determined in 3 independent experiments (4 leaves per
experiment).
108

Results
109

Results
Figure 3.22: Localisation of reactive oxygen species (ROS) in epidermal cells of selected Arabidopsis
accessions in response to Colletotrichum higginsianum inoculation.
Leaves of three-week-old Arabidopsis plants were harvested three days after inoculation with C.
higginsianum, stained with 3-3’ diaminobenzidine (DAB) to visualise H2O2 accumulation and analysed by
light microscopy. Bar, 2.5 µm. A, appressoria; arrowhead, biotrophic hyphae; bold arrow, necrotrophic
hyphae; asterisk, penetration peg. Representative micrographs are shown.
(Ler-0, left panel) The appressorium successfully penetrated Ler-0 plants and large biotrophic primary
hyphae developed in the epidermal cell. At this biotrophic stage of fungal development no DAB staining
was detectable in penetrated epidermal cells.
(Ler-0, right panel) Thin necrotrophic secondary hyphae of C. higginsianum colonising Ler-0 plants. At the
necrotrophic stage, H2O2 accumulation was visible by DAB staining. This diffuse staining was not confined
to a single epidermal cell.
(Ws-0), (Kondara), (Gifu-2), (Can-0) and (Eil-0) Appressoria were formed and penetration attempts were
clearly visible by the production of penetration pores and penetraton pegs, but no generation of biotrophic
hyphae were formed and no H2O2 accumulation was detected.
(H2O2 accumulation in single cell) H2O2 accumulation in a single epidermal cell beneath a successfully
penetrated appressorium in Ler-0. This response was rarely seen in Ler-0 and contrasts with the diffuse
staining observed in the necrotrophic stage (Ler-0, right panel)
In summary, ROS production was not associated with a rapid localised response to
attempted fungal invasion in either resistant or susceptible interactions. Instead, ROS
production occurred during the necrotrophic phase of susceptible interactions, affecting
large conglomerations of host cells and may therefore be a consequence of host cell death
caused by fungal activities, which also affects the adjacent cells not yet been penetrated by
the fungus. Furthermore, the results suggest that ROS production is not a significant
component of the resistance conferred by either a dominant R gene in Eil-0, or putative
recessive resistance genes in Ws-0, Gifu-2, Can-0 and Kondara.
3.7.4.2 Callose production
To address the question whether callose production is a plant response associated with
resistance to C. higginsianum, Aniline Blue staining was performed (Dietrich et al., 1994)
(see 2.2.16.3) on inoculated plants to visualise the callose, which produces an intense UV
light-induced fluorescence with the Aniline Blue fluorochrome Siroflour. To test whether
callose production was associated with attempted penetration by fungal appressoria (Fig.
3.23) at least 600 appressoria per accession were classified into one of four possible
110

Results
categories, shown in Fig. 3.23a and average values from three independent repetitions are
presented (Fig. 3.23b), Tab. SD6 and Tab. SD7).
As expected, at two days after inoculation with C. higginsianum a higher percentage of
appressoria had successfully penetrated plant cells in Ler-0 (16%) and Col-0 (13%) than in
all the resistant accessions (~ 4%). In Ler-0, 7% of the penetrated appressoria were
associated with callose deposition in the cell beneath the appressorium while in Col-0 10%
of the penetrated appressoria were associated with callose deposits. For all tested
accessions at 2 dpi, > 80% of the appressoria had not penetrated and were not associated
with callose production. In contrast, only 0-4% of appressoria on resistant plants had
successfully penetrated, but all of these exhibited a callose production in the penetrated
plant cell.
At 3 dpi, fungal penetration had increased to 53.7% in Ler-0 plants but only reached
14.6% of appressoria in Col-0 plants. In Ler-0 plants only a small proportion of the
successfully penetrated appressoria was associated with callose deposits (16%) (Fig. 3.23
and Fig. 3.24). However, in Col-0, 10% of the total 14.6% of successfully penetrated
appressoria were associated with callose production beneath the appressorium. Frequently,
biotrophic hyphae were seen to penetrate through the callose deposit both in Ler-0 and
Col-0. In the resistant accessions Ws-0, Gifu-2 and Kondara, an increase of callose
production was detectable from 2 to 3 dpi (Fig. 3.23). In Kondara and Gifu-2, the
percentage of unpenetrated appressoria associated with callose deposits (74%) was even
higher than the percentage of unpenetrated appressoria not associated with callose
production (50%). In contrast, no clear increase of unpenetrated appressoria associated
with callose production occurred at 3 dpi in Can-0 and Eil-0. Furthermore, in all
susceptible and resistant accessions, specific staining of callose at plant-pathogen
interaction sites sometimes occurred along the entire cell wall at 3 dpi (Fig. 3.24), which
may indicate an active response to pathogen attack by adjacent living plant cells.
111

Results
(a)
(b)
112

Results
Figure 3.23: Quantitative analysis of callose production in epidermal cells of selected Arabidopsis
accessions in response to Colletotrichum higginsianum appressoria.
Arabidopsis leaves were harvested two and three days after inoculation with C. higginsianum and stained
with Aniline Blue to visualise callose deposition by fluorescence microscopy in relation to whether the cells
were penetrated (visible biotrophic hyphae) or not penetrated (no visible hyphae).
(a) Examples of categories defined for quantitative analysis of callose production. Bar, 15 µm. Callose
depositions are indicated by arrows, biotrophic hyphae by arrowheads. The fungal cell wall was weakly
stained by Aniline Blue due to the presence of β1,3 glucans.
Category I: “penetrated, stained”. Successful penetration by the appressorium resulted in the production
of biotrophic hyphae. A callose papilla has been deposited beneath the appressorium, but has been
penetrated by the hypha.
Category II: “penetrated, unstained”. Successful penetration by the appressorium has resulted in the
production of biotrophic hyphae. There is no detectable callose deposited beneath the appressorium.
Category III: “not penetrated, stained”. Appressorium has not produced visible biotrophic hyphae. A
callose papilla is present beneath the appressorium.
Category IV: “not penetrated, unstained”. No biotrophic hyphae and no papillae are visible beneath the
appressorium.
(b) Callose production in relation to penetration of host cells by biotrophic hyphae was scored according to
the categories defined in (a). Percentages of appressoria represent the mean and standard error (n=3) of at
least 600 interaction sites distributed over 12 leaves, determined in three independent experiments (four
leaves per experiment).
113

Results
114

Results
Figure 3.24: Detection of callose production in epidermal cells of selected Arabidopsis accessions after
Colletotrichum higginsianum inoculation.
Leaves from three-week-old plants of selected Arabidopsis accessions were harvested three days after
inoculation with C. higginsianum and stained with Aniline Blue to visualise callose deposition. The Aniline
Blue staining was viewed by fluorescence microscopy. Bar, 2.5 µm. A, appressoria; arrowheads, biotrophic
hyphae; bold arrows, necrotrophic hyphae; arrows, papillae.
(Ler-0, left panel) Callose production could be detected beneath two of the appressoria. Biotrophic hyphae
penetrated through the callose deposit to give rise to necrotrophic hyphae.
(Ler-0, right panel) Callose deposition is not visible beneath any appressoria. Biotrophic and necrotrophic
hyphae developed from the appressoria.
(Ws-0) For one of four appressoria, callose production could be detected by Aniline Blue staining. No
biotrophic developed from any of the appressoria.
(Kondara) For two appressoria papillae were visible in association with a callose thickening of the cell walls
of affected epidermal cells. No biotrophic hyphae emerged from any of the appressoria.
(Gifu-2) No biotrophic hyphae developed from any of the appressoria. A callose deposition was present
beneath one appressorium.
(Can-0) For one of three appressoria weak Aniline Blue fluorescence was visible, indicating callose
production. No biotrophic hyphae emerged from any of the appressoria.
(Eil-0) No biotrophic hyphae or callose production were visible beneath any of the appressoria.
In summary, callose production was found to be a response to attempted fungal entry in
susceptible as well as resistant accessions and occurred as early as 2 dpi. While there was
a clear difference in penetration efficiency between susceptible (Ler-0 and Col-0) and
resistant accessions, the percentage of unpenetrated appressoria associated with callose
deposits and unpenetrated appressoria without callose deposits were similar for all tested
accessions. This suggests that failure to penetrate is not directly related to callose
deposition. At 3 dpi, biotrophic hypha production had increased in susceptible Ler-0
plants and these hyphae successfully penetrated through callose deposits in most cases
where callose was present. In contrast, Ws-0, Gifu-2 and Kondara showed a large increase
in the proportion of unpenetrated appressoria associated with callose staining which was
not observed for the accessions Col-0, Can-0 and Eil-0. Notably, the dominant resistance
of Eil-0 plants was not associated with abundant callose deposition.
115

Results
3.7.5 Summary of comparative analysis of fungal pathogenesis and host
defence responses in selected Arabidopsis accessions
A detailed cytological analysis of selected susceptible, intermediate susceptible and
resistant Arabidopsis accessions was carried out to determine at what stage of fungal
development resistance is expressed and which defence mechanisms might underlie this
resistance. Also, the cytology of resistance in a dominant resistant accession was directly
compared with that of accessions exhibiting recessive resistance.
The stage of fungal development reached by C. higginsianum in different host accessions
was studied and the extent of fungal colonisation quantified. I showed that the early fungal
developmental stage of appressorial penetration and biotrophic hyphae formation was
arrested in resistant accessions. Progress to subsequent developmental stages, analysed by
ELISA (biotrophic and necrotrophic hyphae production) and spore quantification (asexual
reproduction) clearly differed in resistant accessions compared to the susceptible ones. To
identify possible plant defence mechanisms that might contribute to resistance, H2O2
accumulation and callose deposition were evaluated histochemically. This identified
differences in plant defence responses between the resistant accessions and susceptible
Ler-0. However, neither H2O2, nor callose deposition were clearly linked to the resistance
phenotype, i.e. failure to penetrate. Furthermore, no significant differences in defence
responses were found between Eil-0 in which resistance is conferred by the dominant
RCH1 gene, and accessions exhibiting recessively inherited resistance.
116

Discussion
4 Discussion
In the present study, genetic determinants of the interaction between Arabidopsis and the
hemibiotrophic ascomycete C. higginsianum were analysed, with the emphasis on the
identification of plant susceptibility factors. This was expected to provide important new
insights into the plant contribution to the interaction between the fungus and its host.
Two different approaches were used to identify potential Arabidopsis susceptibility factors
in the interaction with C. higginsianum. The first approach was a forward genetic screen
based on the identification of ethylmethane sulfonate (EMS) and γ-radiation-induced
mutants (in Ler-0 wild type, Ler eds1-2 and Ler rar1-13 genetic backgrounds) that had
lost susceptibility to C. higginsianum. A screen of 207,000 mutant lines identified 38
mutants that exhibited a loss-of-susceptibility phenotype, but since the reduction of
susceptibility was not sufficiently clear, positional cloning of these loci was not possible.
Analysis of available induced mutants exhibiting reduced susceptibility to H. parasitica
(dmr1-4 and dmr6) (Van Damme et al., 2005), and to G. cichoracearum (pmr4-pmr6)
(Vogel and Somerville, 2000), revealed that these loci also play a role in the compatible
interaction with C. higginsianum.
The second approach was based on natural variation between accessions of Arabidopsis in
response to challenge by C. higginsianum. Recessive resistance factors were sought by
crossing resistant accessions to the susceptible accession Ler-0 and following segregation
in the F1 and F2 progeny. Furthermore, QTL analysis was utilised for the identification of
molecular determinants of resistance to C. higginsianum. A single recessive resistance
locus, conferring recessive resistance in at least four resistant Arabidopsis accessions
originating from different geographic regions, was identified by positional cloning and
QTL mapping on the lower arm of chromosome V. The cellular basis of this recessive
resistance and its effects on fungal pathogenesis were investigated microscopically.
4.1 Arabidopsis accessions vary in their resistance to C. higginsianum
In the present study, I identified natural variation of Arabidopsis accessions in resistance
to C. higginsianum inoculation (see 3.2.1). A total of 116 Arabidopsis accessions,
originating from various geographic origins and reflecting a maximum possible genetic
diversity of the species in a minimum of accessions (McKhann et al., 2004), were
117

Discussion
classified according to their disease scores after C. higginsianum inoculation. The
accessions showed a complete spectrum of responses from extreme resistance to extreme
susceptibility. The assignment of disease scores to accessions was in overall accordance
with a similar study by Narusaka et al. (2004), except for one accession. While in the
present study Oy-0 showed a resistant phenotype with only a limited number of lesions
and restricted fungal growth, Narusaka et al. (2004) identified Oy-0 as a highly
susceptible accession. Nevertheless, the overall good agreement between the results of
these two independent infection studies indicates that C. higginsianum infection
phenotypes are robust and reproducible, being relatively independent of laboratorial
conditions, fungal isolates and infection procedures.
The broad range of infection phenotypes indicated the existence of genetic variation in
response to C. higginsianum inoculation within and between populations. Natural
variation within populations was exemplified by accessions originating from the same
geographical region, which showed varying responses to C. higginsianum infection.
Among these, in particular noticeable are the infection phenotypes of Ws-0 and Ws-2.
Although originating from the same geographic region in Russia, they displayed differing
infection phenotypes in response to C. higginsianum. A different F1 generation infection
phenotype and contrasting segregation patterns in the F2 generation after crossing to the
susceptible accession Ler-0 (Tab. 3.3, Tab. 3.4 and Tab 3.5) suggest that different
mechanisms are responsible for resistance in Ws-0 and Ws-2 as discussed in section 4.3.
Identification of a range of resistance responses, indicating allelic variation between and
within populations, was in accordance with studies that aimed to determine the
relationship between genome-wide genetic diversity and biogeography. Positive
correlation between genetic variation and the geographical origin of accessions, i.e.
isolation by distance, has been reported, suggesting the existence of population structures
at a global geographical scale (Nordborg et al., 2005; Shindo et al., 2007). Population
structures were further analysed by the use of a large number of accessions that were
collected not to represent a well-designed hierarchical sampling scheme (Schmid et al.,
2006). Accessions from central Asia were shown to have a low level of genome-wide
polymorphisms relative to accessions from the Iberian Peninsula and Central Europe.
Accessions from the Iberian Peninsula and from Central Asia constitute distinct
populations, whereas Central and Eastern European accessions represent admixed
populations in which genomes had been reshuffled by historical recombination events.
These patterns were suggested by Schmid et al. (2006) to result from the rapid post-glacial
118

Discussion
recolonisation of Eurasia from glacial refuge populations. It was shown that individuals
from the same local populations can be genetically different, indicating that they
originated from multiple source populations, whereas geographically distant accessions
can be highly similar. These findings were in agreement with the observations that, despite
the occurrence of local inbreeding, a large proportion of the global variation reported was
segregating within and between local populations within major geographical regions
(Bakker et al., 2006a). A more recent study confirmed a clear east-west genetic structure
both with proposed Pleistocene refugia and post-Pleistocene colonised regions (Beck et
al., 2008). The refugia themselves are genetically differentiated from one another and
displayed elevated levels of within-population genetic diversity relative to recolonised
areas.
A high-density array resequencing 20 diverse accessions identified many SNPs between
the tested accessions with large effects on gene integrity, including premature stop codons,
alteration of methionine residues and removal of annotated stop codons (Clark et al.,
2007) indicating the possible effects of polymorphisms within and between accessions.
4.2 Arabidopsis infection phenotypes do not correlate with geographic
origins
In the present study, analysis of natural variation did not identify a correlation between
infection phenotype and distinct geographic origin of the accessions (see 3.2.1, Tab. SD1),
although this requires confirmation by more precise analyses, e.g. analysis according to
habitats or analysis according to coordinates of accession origins (see 3.2.1). The lack of a
correlation of infection phenotypes with geographic origins raises the question whether
resistance or susceptibility to C. higginsianum is a trait that is under any evolutionary
pressure to maintain genetic diversity.
If resistance to C. higginsianum offers a fitness advantage, it was reasonable to expect a
correlation between the occurrence of resistant accessions and the geographical
distribution of C. higginsianum, caused by adaptive evolution. In this way, variation in
traits such as timing of flowering and germination, reflect adaptations to specific
environments and bear ecological significance (Koornneef et al., 2004). However, few
119

Discussion
studies have documented the distribution of C. higginsianum (Tab. 4.1) (O'Connell et al.,
2004).
Table 4.1: Documented distribution of Colletotrichum higginsianum continent countries
Asia Brunei, China (South), Honk Kong, Japan, New Guinea, Sabah,
Sarawak, South Korea, Taiwan
Africa South Africa
Europe Italy, Netherlands
North-America USA
South America Argentina, French Antilles, Jamaica, Trinidad
Countries (ordered according to their continents) for that distribution of C. higginsianum
was documented (personal communication, Dr. R. O’Connell, Cologne, Germany)
C. higginsianum has been shown to favour high temperatures with a high humidity.
Although Arabidopsis has a worldwide distribution and can be found in diverse habitats, it
was shown for Arabidopsis that high temperature above 22°C in summer is one factor
limiting its distribution (Hoffmann, 2002). Therefore, as Arabidopsis prefers lower
temperatures than the fungus, environmental conditions favourable to both C.
higginsianum and Arabidopsis might not be widespread under natural conditions. Hence,
it remains unclear whether C. higginsianum is a natural pathogen of Arabidopsis. Due to
the lack of selection pressure represented by C. higginsianum, alleles conferring resistance
to this pathogen might not have been selected in distinct geographic regions, explaining
the lack of correlation between resistant accessions and geographic origins. This is further
supported by the finding that the dominant R gene RCH1, the first resistance locus
identified in Arabidopsis to C. higginsianum, was only present in Eil-0 among 37
accessions collected from around the world (Narusaka et al., 2004). Natural variation in
response to C. higginsianum might therefore represent a neutral distribution of
polymorphisms resulting from the lack of selection pressure applied by the fungus.
However, a striking observation was that alleles conferring full susceptibility to C.
higginsianum were relatively rare in the collection of accessions. I identified that just 7%
of the accessions showed a highly susceptible phenotype (DS 3), whereas 41% exhibited
resistant phenotypes (DS 0-DS 1). Therefore, alternatively to a neutral distribution of
120

Discussion
resistance, C. higginsianum might represent a selection pressure driving the evolution of
resistance among populations. Intensive studies on selection mechanisms in adaptive
evolution have revealed that R genes show stronger patterns of selection than sets of non-
R genes or random sequences in the genome (Bakker et al., 2006b; Clark et al., 2007;
Salvaudon et al., 2008). Although all R genes do not show the same clear evidence of
selection, balancing selection to maintain polymorphism has been suggested for a fair
number of R genes (Salvaudon et al., 2008), resulting in the existence of both resistance
and susceptibility alleles that frequently occur together within natural populations and are
thus common across the Arabidopsis range. For the R genes RPM1 (Stahl et al., 1999),
RPS2 (Caicedo et al., 1999) and RPS5 (Tian et al., 2002) balancing selection has been
suggested, explaining a trade-off between the benefits and costs of resistance, e.g. lower
reproductive efficiency, which thereby contributes to the maintenance of polymorphisms
in R genes (Tian et al., 2003; Korves and Bergelson, 2004; Clark et al., 2007) and the
maintenance of susceptibility, respectively. Therefore, although C. higginsianum might be
a driving force of adaptation, balancing selection could have maintained susceptibility
alleles.
The low frequency of susceptible alleles of Arabidopsis to C. higginsianum raises the
question whether selection pressures other than the fungus might have maintained allelic
variation despite the ostensible fitness disadvantage of susceptibility to C. higginsianum.
If population differentiation in a trait is adaptive, the degree of quantitative genetic
differentiation in the trait among populations is expected to be greater than the genetic
differentiation among populations in neutral molecular markers (Mitchell-Olds and
Schmitt, 2006). Understanding this aspect of natural variation requires the complex
determination of genetic and physiological trade-offs between different traits in a distinct
environment; thus, any positive trait might involve a cost for the individual to maintain the
trait under specific environmental conditions. Therefore, to understand why susceptible
alleles might have been maintained by balanced polymorphism in some Arabidopsis
accessions, it is necessary to understand whether the susceptibility alleles impact up on
other traits that might be under the selection pressure of distinct environmental factors.
For example, it is possible that the susceptible alleles might encode proteins with
fundamental functions for the plant only under specific environmental conditions, thereby
conferring a fitness advantage to the plant. Therefore, selection pressure might be higher
on this trait than on resistance to C. higginsianum.
121

Discussion
It is furthermore possible that the absence of correlation between phenotypes and
geographic regions was due to the small sample size of accessions analysed in this study
and a strong bias towards accessions from Central Europe. Therefore, regions where C.
higginsianum is mainly expected to occur might not be well represented. However, recent
studies have demonstrated that sampling bias due to over-representation of accessions
from Central Europe relative to other geographical regions of similar size does not
confound estimates of genetic variation (Schmid et al., 2006).
Admixture of local populations, especially in Central Europe, resulting from human
disturbance, might further complicate our ability to understand the evolutionary forces
shaping genetic variation within Arabdidopsis populations (Mitchell-Olds and Schmitt,
2006). It therefore cannot be excluded that the distribution of susceptible alleles in the
susceptible accessions, originating from Central Europe, Cape Verde Islands and North
America, may have been affected by human-induced migration and disturbances, so that
occurrence of resistance and susceptibility to C. higginsianum might not have been shaped
exclusively by environmental selection pressures.
A further consideration is that the standard growth conditions in growth chambers and
greenhouses used in the present study might fall outside the natural range of the tested
accessions. The identification of natural variation in resistance to C. higginsianum in this
study must therefore be interpreted with care, as the laboratory conditions might influence
the infection phenotypes. The artificial growth conditions may provide unfavourable
environments for some accessions which might skew the results of this study of
evolutionary relatedness.
4.3 Resistance of Arabidopsis to C. higginsianum is conferred by
dominant, recessive and polygenic resistance
In the present study I aimed to exploit natural variation in Arabidopsis to identify
determinants of the interaction with C. higginsianum. To determine the genetic basis of
resistance and susceptibility to C. higginsianum, I crossed resistant accessions to the
susceptible Ler-0 accession and the inheritance of resistance was analysed in F2
generations.
122

Discussion
Extensive work in recent decades on race-specific resistance has elucidated the role of R
genes in the sophisticated plant defence mechanisms against potential pathogens. Most R
genes in bacterial and fungal systems have been identified to show dominant or semi-
dominant inheritance (Hammond-Kosack and Jones, 1996; Iyer-Pascuzzi and McCouch,
2007a). Also for the Arabidopsis–C. higginsianum interaction, a dominant resistance locus
(RCH1) was shown to confer the highly resistant phenotype of Eil-0 (Narusaka et al.,
2004). Although RCH1 is so far the only identified dominant resistance locus to C.
higginsianum, and was not detected in 36 other accessions, it is reasonable to expect that R
genes other than RCH1 may confer resistance in some of the Arabidopsis accessions tested
in the present study. In contrast to Narusaka et al. (2004), who used Col-0 as susceptible
parent in dominance tests, Ler-0 was chosen as susceptible parent in this present study. In
addition, most of the resistant accessions I tested were not examined by Narusaka et al.
(2004). The dominant effect of the resistance locus RCH1 was confirmed in this study by
identification of a fully resistant F1 generation resulting from crossing Eil-0 to Ler-0.
Furthermore, the segregation of the corresponding F2 generation (Tab. 3.4) was in
accordance with the expected 1:3 (susceptible : resistant) segregation for dominant R
genes. Similarly, the F1 generations I generated from crosses with the resistant accessions
Fei-0, St-0 and Ts-1 also exhibited highly resistant infection phenotypes, hinting to the
presence of a dominant R gene. Since Fei-0 and Ts-1 were not included in the study by
Narusaka et al. (2004), it is possible that the resistance of these two accessions is
conferred by RCH1. However, as the focus of the present study was on the identification
of susceptibility factors, and therefore on the identification of recessive resistance (see
4.3), I did not study further corresponding F2 generations. The F1 generation derived from
crossing accessions Sendai-1, Sendai-3 and Sendai-4 to Ler-0 were assigned intermediate
disease scores (DS) 1-2 and 2, which was therefore not in accordance with the effect of a
dominant R gene. Nevertheless, analysis of the corresponding F2 generations revealed
statistically significant 1:3 (susceptible : resistant) segregation patterns for all three Sendai
accessions. Therefore, although this was not consistent with observations of the F1
generations, these data suggest the action of a dominant R gene. Since these three
accessions were also not included in the previous study by Narusaka et al. (2004), their
resistance might possibly be conferred by RCH1. It is noticeable that Sendai-1, Sendai-3
and Sendai-4 originate from the same geographic region in Japan. As accessions from
Asia had been shown to exhibit a low level of genome-wide polymorphisms (see 4.1), it is
possible that resistance of these three accessions might be due to the same R gene. A more
123

Discussion
detailed study of the molecular components conferring resistance in these accessions
might be interesting from an evolutionary point of view, because C. higginsianum occurs
naturally in Japan (Tab. 4.1) (O'Connell et al., 2004). It remains to be elucidated whether
this Japanese population of Arabidopsis accessions has adapted to selection pressure from
C. higginsianum.
The molecular basis of recessive resistance, in contrast to the resistance conferred by
dominant R genes, has not attracted much attention until recently (O'Connell and
Panstruga, 2006) and was the main focus of the present study. Recessive resistance was
expected to result in a susceptible F1 generation after crossing a resistant accession to the
susceptible accession Ler-0. Furthermore, the subsequent F2 generation was expected to
exhibit a 3:1 (susceptible : resistant) segregation. It was shown that 47% of the generated
F1 lines exhibited fully susceptible phenotypes after C. higginsianum inoculation (Tab.
3.3). Three of the corresponding F2 lines were tested and their infection phenotypes were
in accordance with the segregation pattern expected for recessive resistance. Further five
F1 generations also hinted to a possible recessive inheritance of resistance in the parental
accession, but it remains to be confirmed by analysis of infection phenotypes in the
corresponding F2 generations.
Crossing the moderately resistant accession Ws-2 (DS 1-2) to Ler-0 did not result in a
susceptible infection phenotype in the F1 generation, and the segregation of the F2
generation did not point to the effect of either a dominant or recessive resistance locus
(Tab 3.4). However, the segregation analysis indicated a digenic inheritance of the trait,
because I detected a statistically significant variation from the expected classical
segregation of 9:3:3:1 (Tab. 3.5). This finding is particularly interesting, as it suggests that
a different mechanism for resistance operates in the accession Ws-0 (see 4.1).
In addition to the digenic/polygenic inheritance of resistance in Ws-2, QTL analysis of the
Ler-0 x Kas-2 RIL population also pointed to a quantitative resistance in the accession
Kas-2 resulting from the effects of allelic variation of several loci. Two major QTLs on
chromosome I and chromosome V, having small-to-medium phenotypic effects on
resistance, and several minor QTLs, were shown to control the resistance trait (see 3.3.5).
Only a few studies have focused on the genetic basis of quantitative variation in
Arabidopsis resistance to pathogens (Buell and Somerville, 1997; Wilson et al., 2001;
Kliebenstein et al., 2002; Godiard et al., 2003; Denby et al., 2004; Kover et al., 2005;
Perchepied et al., 2006). However, the polygenic resistance of accessions Ws-2 and Kas-2
is in agreement with recent observations that most physiological or morphological traits
124
Discussion
exhibit a continuous phenotypic distribution within or between populations and are thus
quantitative (Shindo et al., 2007). In fact, the presence of QTLs for many different traits
appears to be the norm rather than the exception, as shown by many loci mapped in RIL
populations (Loudet et al., 2002; Koornneef et al., 2004). It was therefore interesting that
QTL analysis of the Ler-0 x Kondara RIL population (see 3.3.5) detected a single major
QTL exerting a major effect on resistance, with negligible minor effect QTLs, indicating a
monogenic inheritance of resistance to C. higginsianum in Kondara.
In summary, the analysis of resistance responses of 116 Arabidopsis accessions identified
a high level of natural variation in response to C. higginsianum as shown by the broad
spectrum of resistance. I could not identify obvious correlation between the infection
phenotypes and geographic origins. Strong susceptibility to C. higginsianum was found to
be the exception in Arabidopsis. Crosses of resistant accessions to the fully susceptible
accession Ler-0, and the analysis of the resulting F1 and F2 generations identified different
modes of inheritance of resistance among the tested accessions. Besides the identification
of monogenic recessive resistance, monogenic dominant resistance could also be found,
confirming the results of a previous study. Furthermore, polygenic resistance, conferred
by two or more loci, respectively, was also identified.
4.4 Cytological analyses of recessive resistance
4.4.1 Recessive resistance affects fungal penetration of epidermal cells
Successful pathogenesis of C. higginsianum in Arabidopsis includes three distinct steps
each of which require close interaction of the fungus with its host:
• Initial penetration of host cells by fungal appressoria
• Production of specialised feeding structures - the biotrophic primary hyphae in
living host cells
• Host-cell killing and cell wall dissolution by necrotrophic secondary hyphae
At all infection stages, modulation of host cell processes by the fungus is probably critical
for successful pathogenesis. Only if the fungus successfully interacts with its host at all
three steps of fungal pathogenesis it can complete its life-cycle by asexual reproduction,
i.e. the sporulation. Therefore, in the present study, cytological analyses aimed to
determine which stage of fungal development is affected during recessive resistance. This
125

Discussion
was expected to give indications about the functions and effects of recessive resistance
loci. Furthermore, it aimed to determine whether the mechanisms of recessive resistance
varied between the accessions, and if the mechanisms of recessive resistance differed from
those of dominant resistance.
Since I found appressoria of normal appearance on all accessions tested (see 3.7.1), it can
be concluded that host resistance mechanisms did not affect events up to this stage of
fungal development, including initial spore adhesion and germ-tube formation. A normal
morphogenesis and maturation of appressoria, including the formation of a penetration
pore and melanin deposition in the appressorial cell wall was observed on all Arabidopsis
accessions tested. Also I could identify penetration attempts by appressoria by the
formation of penetration pegs on all accessions tested (Fig. 3.16). However, the successful
penetration of the plant cell wall, a process which requires a combination of mechanical
force and enzymatic degradation (Perfect et al., 1999), differed markedly between Ler-0
and the resistant accessions. In the susceptible accession Ler-0, > 50% of the penetration
attempts resulted in the formation of biotrophic primary hyphae. In contrast, in the
resistant accessions only ~ 10% of penetration attempts resulted in the formation of
biotrophic primary hyphae. Besides this difference in penetration frequency, the timing of
penetration was also different in Ler-0 compared to the resistant accessions, as appressoria
penetrated Ler-0 cell walls more rapidly than cell walls of resistant accessions.
Furthermore, analysis of penetration efficiency at a later time point confirmed that
pathogenesis was not just delayed, but effectively reduced in all resistant accessions
tested. These observations pinpoint the effects of recessive resistance to the stage of
penetration of the cuticle and cell wall, or alternatively, to the initial establishment of
biotrophic hyphae in host epidermal cells.
The plant cuticle and cell wall are important barriers that shield the plant cell membrane
and cytoplasm from invasion by potential pathogens. It is therefore plausible that minor
differences in the composition or structure of the cell wall could result in major effects on
disease resistance. Natural variation for cell wall composition between and within species,
shaped by environmental factors, has been documented (Hazen et al., 2003). For initial
penetration of the cell wall rupture of the cuticle is required. The cuticle covers the
epidermal cell wall layer of aerial plant tissues and although the primary role of the cuticle
is probably to reduce water loss, it has also been shown to be involved in the generation
and distribution of signals in development and in plant-pathogen interactions (Nawrath,
2006). Evidence from various experimental approaches has indicated a possible sensing of
126

Discussion
cuticular degradation products by plants which probably activates defence responses
(Chassot and Métraux, 2005). Furthermore, the Arabidopsis att1 mutant was isolated in an
attempt to identify host factors involved in type III gene induction in P. syringae pv.
phaseolicola (Xiao et al., 2004). Att1 encodes CYP86A2, a cytochrome P450
monooxygenase which was shown to be involved in cuticle formation because the cutin
content was reduced to 30% in the att1 mutant. Interestingly, the mutation also greatly
enhanced the expression of the bacterial type III genes avrPt and hrpL, suggesting a role
of CYP86A2 in disease resistance. Closer analysis of the mutant indicated that alteration
of the cuticle membrane structure by itself activated the type III gene expression. It was
suggested that the cuticle membrane inside the substomatal chamber may repress bacterial
type III gene expression, either by blocking access to a positive host factor or by active
repression of bacterial gene expression. The less compact structure of the substomatal
chamber cuticle membrane in mutant plants may lead to leakage of this host factor, or
facilitates the attachment of bacteria to the host cell within intercellular spaces.
Alternatively, lipids synthesised by CYP86A2 may repress type III gene expression. The
LACS2 gene is also involved in cuticle formation in Arabidopsis (Schnurr and Shockey,
2004). It was suggested that LACS2 is essential for activation of cutin monomers for their
assembly into cutin domains that are then transported across the membrane to the
outermost layer of the cell wall for final polymerisation (Bessire et al., 2007). It was
therefore surprising that the lac2-3 mutant, exhibiting increased cuticle permeability, was
strongly resistant to Botrytis cinerea. However, it was found that the increase of cuticle
permeability directly correlates with the amount of antifungal compounds released to the
plant surface, resulting in resistance to Botrytis. Thus, the increased resistance to Botrytis
was explained by an increased diffusion of fungal signals, e.g. the effector molecules,
across the more permeable cuticle of the mutant resulting in the release of antifungal
compounds that arrest fungal invasion.
Impairment of pathogen attachment can be caused by alterations in the composition of not
only the cutin layer, but also the polysaccharide component of the cell wall. The
Arabidopsis rat4 mutation, which confers resistance to Agrobacterium tumefaciens (Zhu
et al., 2003b), corresponds to the CSLA9 gene, a putative processing glycosyltransferase
that is believed to participate in the synthesis of an unknown cell wall polysaccharide (Zhu
et al., 2003a). The rat4 mutants had a decreased number of lateral roots and the lateral
roots also grew more slowly. The mutant was shown to be blocked in an early step in
Agrobacterium-mediated transformation, possibly due to an altered ability to secrete
127

Discussion
particular cell wall polysaccharides that are essential for the Agrobacterium tumefaciens
recognition and subsequent attachment. The Arabidopsis cev1 mutant was recovered by
screening for constitutive activation of JA (Ellis and Turner, 2001) and was found to have
enhanced resistance to powdery mildew. This mutation in CESA3, which encodes a
cellulose synthase involved in primary cell wall synthesis, leads to a decrease in the
amount of cellulose, which was found to trigger JA and ET production (Ellis et al.,
2002b). Although it remains to be determined whether the cell wall alteration causes
pathogen defence directly or indirectly through activation of the JA pathway, it was shown
to confer resistance to G. cichoracearum, P. syringae and the aphid Myzus persicae (Ellis
et al., 2002a). The Arabidopsis pmr5 and pmr6 mutants were found to be highly resistant
to powdery mildew (Vogel et al., 2002; Vogel et al., 2004). This resistance was not
dependent on constitutively activated SA or ET and JA signal transduction pathways.
PMR5 and PMR6 encode a protein of unknown function and a pectate lyase, respectively.
For both mutants, alterations in cell wall composition were detected, indicated by
increased pectin content, reduced pectin esterification and a suggested change in the
hydrogen-bonding environment of cellulose. Although the powdery mildew pathogen is
still able to penetrate, at 2 dpi the fungal colonies consist only of shrivelled hyphae that
are loosely attached to the leaf surface. It cannot be excluded that the mutations activate a
novel defence pathway. Alternatively, it was suggested that the changes in the cell wall
architecture are associated with powdery mildew resistance. Hypothetically, the pathogen
may have a limited ability to digest the outer epidermal cell wall of the mutants or the
mutated cell wall might carry latent signalling molecules to activate novel defences
(Vorwerk et al., 2004). Alternatively, the mutants are less hospitable hosts, offering only a
decreased nutrient availability to the pathogen.
In the light of the above findings, it is possible that in the interaction of Arabidopsis with
C. higginsianum, alterations in cuticular or polysaccharide components of the cell wall, or
in pathways leading to their biosynthesis, might result in major effects on fungal
pathogenesis. An aberrant cell wall composition could affect the structure of the plant
surface, which in turn could impair attachment of fungal appressoria. Such appressoria
would be unable to exert the mechanical pressure required for successful penetration of
the cuticle cell wall. Likewise, a cell wall containing increased amounts of cutin or
epicuticular waxes or a less permeable polysaccharide composition may be more resistant
to mechanical penetration by appressoria. Alternatively, the altered composition of a
putative target for a fungal enzyme, such as a cutinase or pectinase, could impair
128

Discussion
enzymatic penetration of the cell wall. Furthermore, aberrant permeability of the cell wall
might affect the transport diffusion of fungal elicitors or, plant antimicrobial compounds
across the cell wall.
Due to the intimate and complex interaction between C. higginsianum and living host cells
during the biotrophic stage of intracellular hyphal growth, variation in a plant factor could
significantly affect fungal development after penetration. A plant signal that might be
required for the induction of hyphal growth after penetration may be affected in resistant
accessions, resulting in failure of fungal differentiation of specialised biotrophic hyphae.
Alternatively, in accordance with the genetic evidence from the pmr5 and pmr6 mutants
(see above), variations in plant cell wall composition might result in a physiological state
of the apoplast that is less favourable for fungal growth. The switch from penetration of
the plant cell wall to intracellular hyphal growth is also associated with the modulation of
host cell processes by the fungus for fungal nutrition. Therefore, aberrations in plant
factors might affect nutrient, sugar or iron metabolism or transporters. Alternatively, plant
factors that are required for generation of the interfacial matrix, which separates the fungal
cell wall from the invaginated plant plasma membrane, may compromise nutrient
availability for the fungus.
Plant factors exploited for pathogen growth have been identified in other pathosystems.
For example the xa5 and xa13 genes were shown to be involved in recessive resistance of
rice to the bacterial pathogen Xanthomonas oryzae pv. oryzae (Iyer and McCouch, 2004).
Xa5 encodes a small subunit of the transcription factor IIA, one of several general
transcription factors that work with RNA polymerase II to transcribe DNA (Iyer and
McCouch, 2004). It was suggested that a single amino acid substitution might prevent the
interaction of xa5 with a bacterial protein, possibly a transcriptional activator of
eukaryotic genes, and this might prevent disease. Xa13 encodes a unique plasma
membrane-localised protein with a predicted role in pollen development (Chu et al.,
2006). Mutations in the promoter region of Xa13 blocked induction of Xa13 during
pathogen inoculation, which seems to be the key to resistance in this case (Iyer-Pascuzzi
and McCouch, 2007a). It was suggested that the promoter of the Xa13 gene is targeted by
the bacterial type III effector PthXo1 (Yang et al., 2006). However, it remains unclear
how the developmental and disease-resistance pathways are related.
Resistance to several species of the family of Potyviridae was shown to result from
mutations in the translation initiation factors eIF4E and eIF(iso)4E (Diaz-Pendon et al.,
129

Discussion
2004; Kang et al., 2005b). The eIF4E protein is involved in the expression of eukaryotic
mRNA. Although the exact mechanisms by which eIF4E mutations control resistance
remain to be elucidated, it could be shown that a small number of amino acid changes in
the protein prevent interaction with a small viral protein known as VPg (viral protein
genome-linked) during the virus infection (Ruffel et al., 2002; Gao et al., 2004; Kang et
al., 2005a; Yeam et al., 2007). As a result the virus is unable to complete its life cycle and
successfully infect the plant.
Host-specific toxins (HSTs) constitute a special class of pathogen effectors. HSTs are
secondary metabolites that are toxic only to the specific host of the pathogen and are
innocuous to the great majority of other plants (Friesen et al., 2008). HSTs are required
for the virulence of necrotrophic fungi by reducing or eliminating disease responses in the
host (Toyoda et al., 2002). However, only specific genotypes of the host are sensitive to
the toxin and sensitivity could be shown to be a dominant trait, i.e. absence of the toxin
target results in recessive resistance. This is implying that perception of the toxin is
conferred by the direct or indirect interaction with a toxin receptor and this perception can
be expected to be affected by alterations in the structure of the receptor, resulting in a
decreased growth ability of the fungus.
Natural variation in plant factors exploited by pathogens for host susceptibility could
result in reduced fungal penetration or development of biotrophic primary hyphae growth
as discussed above. Alternatively, reduced fungal growth could be caused by active
resistance mechanisms that are either not present or not induced in susceptible accessions.
Thus, the resistance of accessions exhibiting reduced fungal growth could be due to the
presence of R genes that are activated by the perception of fungal penetration attempts.
Their activation, in turn, induces a complex signalling cascade leading to expression of
plant defence reactions (Dangl and Jones, 2001). Narusaka et al. (2004) previously
identified the presence of a dominant, monogenic R gene in the Arabidopsis accession Eil-
0, conferring resistance to C. higginsianum. Although resistance in the other resistant
accessions tested in this study was inherited in a recessive manner, the presence of active,
but recessive R genes cannot be excluded and is discussed in section 4.3. Interestingly,
cytological analysis did not identify cellular defence responses to C. higginsianum such as
H2O2 accumulation (see 4.4.2) or callose deposition (see 4.4.3) in any of the resistant
accessions. This is consistent with the finding that recessive resistance in the four
accessions Ws-0, Gifu-2, Can-0 and Kondara is conferred by the same resistance locus
130

Discussion
(see 3.3.6). However, it also raises the question why recessively resistant accessions are
indistinguishable from the dominant resistance identified in Eil-0. This could indicate that
the mechanisms underlying recessive resistance and dominant resistance are similar as
discussed in section 4.3, although those resistance mechanisms remain elusive.
A further possibility is that plant antimicrobial compounds could differ in composition
between resistant and susceptible accessions so that the compounds in susceptible
accessions such as Ler-0 are less effective in restricting C. higginsianum, allowing more
extensive colonisation by biotrophic primary hyphae.
4.4.2 Accumulation of hydrogen peroxide does not confer resistance to C.
higginsianum
Recessive resistance, due to alterations in susceptibility factors, can be considered to be a
passive response, defined more by the lack of susceptibility than the activation of defence
signalling pathways (O'Connell and Panstruga, 2006; Iyer-Pascuzzi and McCouch,
2007a). Alternatively, recessive resistance might be conferred by the presence of a
recessive R gene, which would be expected to activate a cascade of defence reactions
leading to containment of the pathogen. Accumulation of ROS such as H2O2 is closely
associated with plant defence reactions against many pathogens, e.g. the hypersensitive
reaction (HR), expression of defence genes and cell wall strengthening by oxidative cross-
linking reactions (Levine et al., 1994; Lamb and Dixon, 1997; Thordal-Christensen et al.,
1997; Grant and Loake, 2000; Hückelhoven and Kogel, 2003; Apel and Hirt, 2004).
Additionally, H2O2 might be fungitoxic and hence provide a direct penetration resistance
mechanism (Hückelhoven, 2005). In the interaction of the barley powdery mildew fungus
Blumeria graminis f.sp. hordei (Bgh) with its host, H2O2 accumulation has been shown to
occur in three phases: while in the first phase the germ tube tip appearance is linked to
H2O2 accumulation, in the second phase H2O2 accumulation is subcellularly confined to
the cytoplasm close to the site of attack. In the third phase, H2O2 accumulation spreads
over the whole cell, meaning that it is not restricted to subcellular sites (Hückelhoven and
Kogel, 2003). H2O2 starts to accumulate either at the mesophyll-epidermis interface or
near penetration sites depending on the type of R gene that mediates the defence response
(Hückelhoven and Kogel, 2003). In any case, phase three was shown to be closely linked
to subsequent cell death and arrest of the pathogen (Thordal-Christensen et al., 1997;
Vanacker et al., 2000; Hückelhoven and Kogel, 2003). Thus, the detection of H2O2
131

Discussion
accumulation might indicate active resistance responses of the plant. In the present study, I
analysed H2O2 accumulation to determine (i) whether recessive resistance to C.
higginsianum was based on active or passive resistance mechanisms and (ii) if resistance
mechanisms differed between recessive and dominant resistant accessions.
ROS production occurred predominantly during the necrotrophic phase of susceptible
interactions in Ler-0 and Col-0 plants, affecting large conglomerations of host cells
instead of single epidermal cells. At this late stage of infection, H2O2 production was
considered to be a consequence of extensive host cell death caused by fungal activities
rather than specific defence responses of a single cell to confine pathogen growth.
Occurrence of highly localised ROS production at penetration sites, suggesting R gene-
mediated defence responses, could not be detected for resistant accessions. This suggests
that cellular processes other than ROS production are varying between resistant and
susceptible accessions. However, H. parasitica growth was inhibited in the dmr mutants
without accumulation of ROS or visible cell death (Van Damme et al., 2005), but most of
the mutants could be identified not to be true loss-of-susceptibility mutants (see 4.8).
Therefore, recessive resistance could involve active defence responses other than ROS
production. Furthermore, although ROS production has been proposed to play a central
role in the process of host cell death during HR, recent studies have supported earlier
suspicions that ROS may not be sufficient for the complete host cell death response during
HR (Grant and Loake, 2000). Mechanisms other than ROS production might contribute to
active cell death responses and therefore active resistance responses cannot definitely be
ruled out in response to C. higginsianum inoculation.
Interestingly, observations in the present study are not in accordance with the findings of
Narusaka et al. (2004). Although both studies confirmed that ROS production was not a
rapid response to fungal invasion, Narusaka et al. (2004) had observed an accumulation of
H2O2 exclusively in plants of the Eil-0 accession between two to three days after
inoculation with C. higginsianum. The H2O2 accumulation was reported to be in
agreement with the detection of infection hyphae within epidermal cells, which were,
however, collapsed and highly vacuolated and did not affect adjacent mesophyll cells. It
was therefore suggested that resistance in Eil-0 may be mediated through a process of
hypersensitive cell death in the epidermal cells which limit subsequent invasion of
mesophyll cells by C. higginsianum. DAB staining in the present study however
confirmed that there was no detectable H2O2 generation in any resistant accessions even at
5 dpi, which excluded the possibility that ROS accumulation was delayed in comparison
132

Discussion
to studies by Narusaka et al. (2004). However, infection assays conducted by Narusaka et
al. (2004), utilised a different fungal culture (MAFF305635) and different plant growth
and inoculation conditions than in the present study. It is possible that these variables
explain the contrasting observations of ROS production in Eil-0 plants.
4.4.3 Reduced penetration efficiency is not directly related to callose
deposition
Newly synthesised depositions of callose between the plasma membrane and the cell wall
in the paramural space typically occur in plants in response to various abiotic and biotic
stresses (Stone and Clarke, 1992). These cell wall appositions, termed papillae, are
composed of altered cell wall material and, among other constituents, contain callose (β-
1,3-glucans) and phenolics. Other constituents of papillae can be lignin, cellulose, pectin,
suberin, chitin, lipids, silicon and diverse cell wall proteins (Schmelzer, 2002). During
fungal infections, papilla formation occurs in a localised area beneath infection sites and is
thought to hamper hydrolytic and osmotic pressure from fungal appressoria (Aist, 1976;
Hückelhoven, 2005). The formation of papillae is typically rapid and occurs before the
integrity of host cells has been damaged. It was observed that papillae are deposited
regardless of a plant’s eventual resistance or susceptibility to penetration (Zeyen et al.,
2002). Papillae are sites of induced protein cross-linking for structural reinforcement of
the plant cell wall, thereby presenting a physical barrier to the invading pathogen. They
are furthermore thought to be sites of localised accumulation of induced antimicrobial or
microbial-static compounds, such as phenolics, reactive oxygen species, thionins or
peroxidases (Aist, 1976; Thordal-Christensen et al., 1997; Zeyen et al., 2002), and are
providing an additional chemical barrier to pathogens.
Although it has long been believed that callose papillae impede pathogen entry into plant
cells, recent work contradicts these observations. Analysis of plants lacking PMR4/GSL5,
a callose synthase which is required for wound and papillary callose formation, showed
reduced susceptibility to virulent powdery mildew fungi and to the oomycete H. parasitica
(Jacobs et al., 2003; Nishimura et al., 2003). However, although papillary callose was not
detectable in pmr4/gsl5 plants, typical papillae formed beneath fungal appressoria that
were microscopically indistinguishable from those in wild-type plants (Jacobs et al.,
2003). It therefore seems unlikely that callose serves as an essential component in
papillae. Mutations in the SA pathway in the pmr4/gsl5 mutant restored susceptibility of
133

Discussion
pmr4 (Nishimura et al., 2003), suggesting that PMR4/GSL5 or its product negatively
regulate the SA signalling pathway. It was therefore postulated that the SA pathway acts
as a mechanism of pmr4/gsl5-based resistance (Nishimura et al., 2003). Alternatively, it is
possible, because the papilla response is so widespread in plants, that some fungi might
have evolved to depend on the presence of a papilla. Pathogens may have exploited
components of this wound response for successful pathogenesis, e.g. as a structural
scaffold to accommodate fungal complexes, or callose might serve as a pathogen-induced
protection barrier that prevents recognition of pathogen-derived molecules by the host
(Jacobs et al., 2003).
To test whether callose deposition is an Arabidopsis response associated with resistance or
susceptibility to C. higginsianum, I quantified its association with attempted penetration
by appressoria at two and three days after inoculation (see 3.7.4.2). I found that callose
deposition is an active plant response to attempted fungal entry in susceptible as well as
resistant accessions, and there was no significant correlation between the presence of
callose and failure of appressoria to penetrate. Callose deposition did not occur earlier in
resistant than in susceptible accessions and callose was deposited before the majority of
appressoria had penetrated susceptible Ler-0 and Col-0 plants. Hence, natural variation in
resistance to C. higginsianum did not appear to be related to the timing of the callose
deposition.
In Ler-0 and Col-0 plants primary hyphae had successfully penetrated through the callose
deposits at 3 dpi, suggesting that callose does not effectively terminate hyphal growth.
However, as callose is just one component of the papilla, components other than callose
might be responsible for the reduced penetration efficiency in resistant accessions. They
may generate a localised microenvironment at the penetration site with physical or
chemical conditions unfavourable for appressorial penetration or initial growth of C.
higginsianum primary hyphae in resistant accessions. Nevertheless, this cannot be the only
mechanism of resistance to the fungus, because a large number of unsuccessful
appressorial penetration attempts were not associated with callose papilla production. This
clearly suggests that factors other than callose deposition and papilla production must
account for natural variation in resistance to C. higginsianum. This is supported by the
observation that increased callose deposition was shown for Ws-0, Gifu-2 and Kondara,
but not for the accessions Can-0 and Eil-0, even though all of them are resistant to C.
higginsianum. It therefore seems likely that callose deposition is an active plant response
to challenge by C. higginsianum in both susceptible and resistant accessions, and that the
134

Discussion
occurrence of callose deposits does not correlate with the resistance of distinct accessions
to fungal infection. In agreement with previous studies which had observed that the fungus
penetrated through the papilla into the host epidermal cell (Wharton and Julian, 1996;
Mims and Vaillancourt, 2002; Narusaka et al., 2004), and the observation that plants
harbouring the pmr4/gsl5 mutation do not show strong resistance to C. higginsianum (see
3.1.3 and 4.8), callose deposition does not appear to be the primary mechanism for
resistance. This probably explains why callose deposition in recessively resistant
accessions does not markedly differ from callose deposition in Eil-0 harbouring a
dominant resistance locus.
4.5 Recessive resistance –recessive R gene or true susceptibility factor?
Positional cloning of a recessive resistance locus responsible for the resistance of
Arabidopsis to C. higginsianum in the Ler-0 x Ws-0 F2 generation (see 3.3.3) identified a
~ 100 kb region on the lower arm of chromosome V. However, it was hindered by a high
frequency of polymorphisms between the Col-0 reference sequence and the Ler-0
accession. Positional cloning is dependent on the use of molecular markers and attempts to
design these markers were based on the Col-0 reference sequence. Although I could
identify these markers to be functional in PCR reactions with Col-0 genomic DNA as
template, PCR reactions with template DNA from the Ler-0 and Ws-0 accessions did not
result in PCR products. This strongly suggests that sequences are highly divergent, in
particular in the region of 18,300,000-18,330,00 bp. This problem impeded further
reduction of the region of interest by genetic linkage analysis. Furthermore, the missing
sequence information for the two parental accessions did not facilitate the design of
primers required for expression analysis of candidate genes before and after inoculation
with C. higginsianum, which could help to detect possible differential expression between
resistant and susceptible accessions. Previous microarray analysis (Narusaka et al., 2004),
comparing gene expression of uninoculated Col-0 plants to Col-0 plants inoculated with
C. higginsianum, did not identify significantly increased expression of any of the
candidate genes of the present study. This could indicate that the intermediate
susceptibility of the Col-0 expression is determined by loci other than those identified by
the analysis of natural variation between Ler-0 and Ws-0. Alternatively, although essential
135

Discussion
for successful pathogenesis or resistance, the expression of particular candidate genes
might not be significantly induced upon inoculation with C. higginsianum.
Analysis of T-DNA insertion mutants (see 3.5) did not identify mutant lines with aberrant
infection phenotypes after C. higginsianum inoculation. However, most of the available T-
DNA insertion mutant lines had a different genetic background to the accessions for that
the natural variation in response to C. higginsianum was identified. Therefore it cannot be
excluded that, despite no effect on the infection phenotype could be identified, one of the
genes affected in the T-DNA insertion mutant lines is nevertheless the recessive resistance
locus.
The identified recombination frequency was in accordance with an expected average of
1% per 250 kb (Lukowitz et al., 2000; Jander et al., 2002; Peters et al., 2003). This
suggests that genotyping of further F2 plants might indicate additional recombinants to
further reduce the region of interest to allow the identification of the recessive resistance
locus.
4.5.1 Potential role of candidate genes in Arabidopsis- C. higginsianum
interactions
There are two possible scenarios to explain the mechanisms of recessive resistance
(Fraser, 1999). The first scenario proposes that resistance is the result of an active
mechanism, in which the resistant plant interferes with some stage of the pathogen;
susceptibility would therefore be due to the lack, or a non-functional copy, of such a factor
involved in resistance. According to the second scenario, resistance might be the result of
a passive mechanism whereby a plant is resistant due to the lack of a functional host factor
required by the pathogen to complete is life-cycle. In the present study, neither a detailed
cytological analysis (see 3.7 and 4.4) did provide convincing evidence for either of the
possible scenarios, nor the positional cloning, the T-DNA insertion mutants and
expression analysis allowed the identification of the recessive resistance mechanism yet.
Therefore, the possible involvement of candidate genes and their corresponding gene
products was considered on the basis of their predicted biological function in recessive
resistance. The region identified to contain the recessive resistance locus comprises 20
genes, based on the Col-0 reference sequence, although it cannot be excluded that Ler-0 or
the resistant accessions tested in the present study lack genes identified for Col-0, or
contain additional genes not present in Col-0.
136
Discussion
4.5.1.1 Candidate R genes
The region of interest contains six genes with a TIR-NB-LRR sequence; therefore they are
predicted or confirmed to encode R proteins responsible for active disease resistance. One
of them, RPS4 (At5g45250) is a TIR-NB-LRR gene that confers resistance to the bacterial
pathogen P. syringae pv. tomato strain DC3000 expressing avrRPS4 (Hinsch, 1996;
Gassmann et al., 1999). It has been shown in earlier studies that this gene confers
dominant resistance. As T-DNA insertion mutant lines in a Ler-0 genetic background did
not alter the susceptible phenotype of the wild type in response to C. higginsianum (see
3.5), presumably RPS4 is not responsible for the recessive resistance observed in the
present study. At5g45210-At5g45240 have not been characterised yet and the function of
their gene products as disease resistance proteins is only predicted based on their DNA
sequence. However, the constitutive expression of At5g45210 exclusively in roots (see
3.4) (Tan et al., 2007) hints to a function in resistance to root pathogens, suggesting that
At5g45210 is probably not involved in interactions of Arabidopsis with C. higginsianum.
Nevertheless, I cannot rule out that inoculation with the fungus induces gene expression in
aerial tissues of the plant.
Although most TIR-NB-LRR genes in bacterial and fungal systems show dominant
inheritance, the RRS1 gene has been shown to confer recessive resistance of Arabidopsis
to Ralstonia solanecearum (Deslandes et al., 2002). Interestingly, RRS1-R was shown to
be a new member of the TIR-NB-LRR protein family with a C-terminal extension
including a putative nuclear localisation signal and a WRKY domain. Although
genetically defined as a recessive allele, RRS1-R acts as a dominant gene when delivered
as a transgene into RRS1-S genotype plants (Lahaye, 2002). Furthermore, transgenic
plants of the resistant accession Nd-1 carrying the RRS1-S gene failed to develop wilt
disease, strongly suggesting that RRS1-S is not a host susceptibility protein required by
the pathogen for disease development. In addition, structural similarities between RRS1
genes and other cloned R genes, and a requirement for SA and NDR1, make the
hypothesis that RRS1 functions as host susceptibility protein rather unlikely. Indeed, more
recent studies have shown that RRS1-R recognises the avirulence protein PopP2, an R.
solanecearum type III effector. The two genes, RRS1-R and RRS1-S differ in the position
of a stop codon that leads in RRS1-S to the formation of a protein truncated by 90 amino
acids. However, an interaction between PopP2 and both RRS1-R and RRS1-S was
identified in resistant and susceptible accessions (Deslandes et al., 2003). It was therefore
137

Discussion
proposed that RRS-R and RRS1-S might compete for bacterial or plant components
essential for pathogen perception and/or signalling. Since the RRS1 proteins differ mainly
in their C-terminal transcription factor, they may give distinct transcriptional read-outs,
resulting in plant resistance only in the case of RRS1-R. Hence, similar to the
identification of RRS1, it cannot be excluded that natural variation in the genes
At5g45210-At5G45240 and At5g45260 leads to the identification of active, but recessive
resistance and that the resistance mechanism may differ from that of most cloned R genes.
Interestingly, RRS1-R mediated resistance does not involve hypersensitive responses upon
inoculation which typifies many R genes. This would be consistent with the absence of
active defence responses in the cytological analysis.
Although most of the identified TIR-NB-LRR R genes have been identified to confer
dominant resistance, a semi-dominant mode of inheritance has been observed for some R
genes (Xiao et al., 2005; Göllner et al., 2008). Although resistance in Ws-0, Gifu-2 and
Can-0 was consistent with a recessive inheritance mode, intermediate phenotypes could
not be reliably distinguished from fully susceptible phenotypes due to the constraints of
high-throughput screening of F2 plants (see 3.2.2). Therefore, it was not feasible to
identify possible semi-dominant effects of a resistance locus. Although the infection
phenotypes of the F1 generations derived from crossing these resistant accessions to Ler-0
were strongly susceptible (DS 2-3), therefore suggesting a recessive inheritance of
resistance, the F1 generations were not as fully susceptible as Ler-0 plants (DS 3). I
therefore cannot exclude that resistance is due to an R gene that is acting in a gene-dosage
dependent manner, or alternatively, the different genetic backgrounds used in the present
analysis affect the penetrance of a possible R gene.
Recent studies have identified natural variation in the response of Arabidopsis to Victoria
blight, caused by the fungus Cochliobolus victoriae (Lorang et al., 2007). Pathogenicity of
C. victoriae depends on the production of a toxin called victorin, and mapping of an F2
population resulting from crossing the victorin-sensitive accession Cl-0 to the victorin-
insensitive accession Col-4, identified the locus LOV1 as conferring susceptibility to the
fungus. Interestingly, LOV1 encodes a CC-NB-LRR protein and is a member of the RPP8
disease resistance gene family. Lorang et al. (2007) could show that LOV1 mediates
typical disease resistance responses, e.g. SA-dependent induction of PR-1, production of
the phytoalexin camalexin and HR-like cell death. These findings strongly suggest that
LOV1 functions in a manner analogous to resistance proteins. It was therefore proposed
that LOV1 might be required as a resistance gene to a naturally-occurring pathogen of
138

Discussion
Arabidopsis, and this mechanism is exploited for susceptibility by C. victoriae. Since
LOV1 function requires ATTRX5, a cytosolic thioredoxin that may play a role in
protecting plant cells from oxidative stress (Reichheld et al., 2002; Laloi et al., 2004), it
was suggested that ATTRX5 could be a target of pathogen virulence effectors and be
guarded by a NB-LRR protein (Sweat et al., 2008). In this case, it is possible that
ATTRX5 is targeted both by victorin and by an avirulence effector of the putative
pathogen for which LOV1 may act as a resistance gene. It is conceivable that similar
mechanisms could operate resistance to C. higginsianum involving one of the identified
TIR-NB-LRR genes. Therefore, the function of a gene product in disease resistance to one
pathogen might not rule out an alternative function of the same gene product in
susceptibility to C. higginsianum. However, the cytological analysis by DAB staining did
suggest that resistance was associated with typical disease resistance responses such as
ROS accumulation.
4.5.1.2 Plant susceptibility factors
In addition to six candidate genes with a TIR-NB-LRR structure, and therefore with a
putative function in disease resistance, 14 further genes are included in the region of
interest identified by positional cloning. At5g45310-At5g45330 are genes encoding
proteins with unknown function and therefore their possible involvement in interactions
with C. higginsianum cannot be concluded. At5g45380, a sodium symporter protein, is
known from previous microarrays studies to be constitutively expressed in root tissue (see
3.4). In agreement with this differential expression in roots, previous studies have revealed
an involvement in the uptake of urea in plant roots (Kojima et al., 2007). It is therefore
reasonable to exclude At5g45380 from the list of candidate genes. Furthermore,
At5g45275 and At5g45370, encoding nodulin-related integral membrane proteins, are
likely involved in the establishment of symbiotic interactions of Arabidopsis with rhizobia
for nitrogen fixation. Therefore, it is reasonable to assume that these genes are not
essential for the interaction of a pathogen with a hemibiotrophic lifestyle with its host.
Nevertheless, different ways of endosymbioses, both mutualistic and parasitic, probably
have evolved by exploiting some common core components (Parniske, 2000). Hence, an
involvement of these two genes cannot completely be ruled out.
Microarray expression analysis did not give any reasons to exclude the remaining seven
candidate genes. The putative or confirmed functions of the corresponding gene products
139

Discussion
suggest a function in metabolism or development and may impact pathogen virulence
invasion ways in similar ways as discussed in section 4.4.1.
Particularly interesting is At5g45280, coding for a putative pectin acetylesterase. Pectins
are one of the major components of the middle lamella of plant cells and are composed of
D-galacturonic acid polymers with interspersed methylgalacturonic acid residues which
can be esterified by acetyl or methyl groups. The presence of acetyl esterification is
known to modify the properties of the pectin molecules and contributes to the structural
complexity of the pectin network (Vercauteren et al., 2002). Pectin acetylesterases
catalyse the deacetylation of esterified pectin. The removal of acetyl esters from the pectin
backbone makes the polysaccharide more accessible to pectin-degrading enzymes, such as
polygalacturonase and pectate lyases. A study has identified that Erwinia sp. cleaves only
galacturonic acid residues that are not acetyl–esterified (Davis et al., 1984). It is
conceivable that natural variation in this gene might provide cell wall microenvironments
in susceptible accessions that are more accessible to fungal penetration or for nutrition
than in resistant accessions. In a recent differential proteomic analysis expression of
At5g45280 was shown to be induced by oligogalacturonides (OGs) in Col-0 Arabidopsis
seedlings (Casasoli et al., 2008). OGs are elicitors of plant defence responses released
from the homogalaturonan of the plant cell wall during the attack by pathogenic
microorganisms. Therefore, this finding suggests a possible role of the pectin
acetylesterase in the perception of pathogens.
At5g45290 encodes a zinc finger (C3HC4-type RING finger) family protein. The zinc
finger is a structural feature shared by various proteins that bind to DNA and act as
transcriptional regulators. Zinc finger proteins are among the most abundant proteins in
eukaryotes and have been shown to play important roles in various cellular functions
including transcriptional activation, regulation of apoptosis and protein folding and
assembly (Yang et al., 2008). The RING finger protein is a specialised type of zinc finger
and consists of 40-60 residues that bind two atoms of zinc. The specific function of RING
fingers, however, is still poorly understood. Studies have shown that many RING finger
proteins have E3 ubiquitin ligase activities and can specifically interact with E2 ubiquitin-
conjugating enzymes and can thereby promote ubiquitination. COP1 is one of the best
characterised proteins with a RING-finger domain and has been shown to be a repressor of
photomorphogenesis development and a light-regulated developmental molecular switch
(McNellis et al., 1994; McNellis et al., 1996). HOS1 functions in low temperature signal
transduction (Lee et al., 2001). HUB2, also a C3HC4 Zn RING finger, is implicated in
140

Discussion
chromatin remodelling during seed dormancy (Liu et al., 2007b). RING-finger proteins
have been identified to function in plant defense responses (Hong et al., 2007). A recent
study identified that the overexpression of the pepper CaRFP1 encoding the C3HC4 type
RING finger protein that physically interacts with the basic PR-1 protein CABPR1 to
confer disease susceptibility to P. syringae pv tomato (Hong et al., 2007). It was
suggested that CaRPF1 acts as an E3 ligase for polyubiquitination of target PR proteins. It
is therefore conceivable that C3HC4 Zn RING finger are involved in the interaction of C.
higginsianum with its host.
Starch is synthesized in many organs of Arabidopsis, including leaves, flowers,
developing seeds and root caps. During starch breakdown, β-amylase hydrolyses α-1,4
glycosidic linkages of polyglucan chains at the non-reducing end to produce maltose,
which is thought to be metabolised in the cytosol following hydrolytic cleavage. β-
amylase was suggested to regulate maltose accumulation and thereby contributes to
protection of proteins and membranes during temperature shocks (Kaplan and Guy, 2005).
Although cytological analysis of fungal pathogenesis hinted to an effect at the initial
penetration stage, it cannot be excluded that a β-amylase encoded by At5g45300, might be
involved in nutrition of the fungus at a very early stage of hyphal growth. Natural
variation in activity of the gene activity could therefore result in decreased biotrophic
growth of primary hyphae.
The gene product of At5g45307 is a microRNA (miRNA) that targets AGO. miRNAs
constitute a class of endogenous single-stranded small RNAs (21-23 nt) that exists in
animals and plants. miRNAs derive from long ssRNAs that fold and form imperfect
hairpin dsRNAs. The Dicer-Like1 (DCL1) cuts the fold-back stem loop of the miRNA
precursors, resulting in a miRNA duplex. The 3´ends of miRNA duplex are methylated
and loaded onto AGO1, where the mature single-stranded miRNA guides the RNA slicing
activity of AGO1 to partially complementary mRNAs. The miRNA-guided cleavage of
mature mRNAs occurs in the cytoplasm and is thought to be the predominant mechanism
of miRNA-guided regulation in plants (Mallory and Vaucheret, 2006). The negative
regulation of gene expression by mRNA cleavage controls many fundamental biological
processes, e.g. induction of cell differentiation in response to an endogenous stimulus and
activation of adaptive responses to particular exogenous stresses. Natural variation in
At5g45307 could therefore cause differences in susceptibility by regulating RNA
interference (gene silencing).
141

Discussion
The phytohormone abscisic acid (ABA) is involved in stress tolerance, stomata closure,
flowering, seed dormancy and further physiological events (Nambara and Marion-Poll,
2005). ABA is also involved in regulation of shoot elongation and root growth.
Endogenous levels of ABA in plants are properly and cooperatively controlled by
synthesis, transport, and catabolic inactivation in response to environmental changes
(Ueno et al., 2007). Catabolic inactivation of ABA is mainly mediated by ABA 8´-
hydroxylases (CYP707A1-4), which catalyse the 8´hydroxylation of ABA into 8´-
hydroxy-ABA and its more stable tautomer phaseic acid. The transcript levels of all four
CYP707As have been shown to be induced by abiotic stress and dehydration. At5g45340,
a putative ABA 8´hydroxylase, might be similarly involved in ABA catabolism. A direct
role of ABA in resistance has been observed for various plant-pathogen interactions,
including virus and fungal infections (Dunn et al., 1990). It was observed that the severity
of symptoms which developed on hypocotyls of Phaseolus vulgaris after inoculation with
Colletotrichum lindemuthanium was inversely related to the ABA content in the
hypocotyls. Since ABA had no significant effect on the growth of C. lindemuthanium in
vitro, it was proposed that resistance might be due to ABA-induced changes in the host
tissues, such as mechanical properties of the tissue, or alterations in the host plasmalemma
which could disturb the biotrophic interphase (Dunn et al., 1990) and therefore result in
susceptibility. It is plausible to expect that natural variation in regulation of ABA can
affect susceptibility to C. higginsianum.
At5g45350 belongs to one of the largest plant superfamilies encoding F-box proteins
(Kuroda et al., 2002). They are part of SCF complexes that function as ubiquitin E3
ligases and are responsible for substrate recognition and substrate recruitment to the SCF
complex. F-box proteins of Arabidopsis have been shown to be essential for auxin, methyl
jasmonate, gibberellin and ethylene signalling (van den Burg et al., 2008). Furthermore,
they regulate the circadian clock, senescence photomorphogenesis, floral development,
self-incompatibility and responses to biotic and abiotic stresses. An important role in the
interaction of C. higginsianum with its host is therefore possible. A polymorphism in an F-
box gene having a major impact on the interaction with C. higginsianum would be in
accordance with earlier observations that F-box genes harbour the second-highest
occurrence of major-effect changes (Clark et al., 2007).
In summary, the region I identified to harbour the recessive resistance locus comprises 20
candidate genes. Further restriction of the region of interest was not feasible by genetic
linkage analysis. Microarray expression analysis suggests that At5g45210 and At5g45380
142

Discussion
are not likely to be involved in the interaction between C. higginsianum and its host.
Furthermore, the genes At5g45275 and At5g45370 can possibly be excluded due to their
predicted function in symbiotic interaction with rhizobial bacteria. Gene products of
At5g45220-At5g45260 are putative disease resistance proteins. Therefore they constitute
candidate genes for a resistance locus that functions in an active defence response to C.
higginsianum in a recessive or possibly semidominant manner, although cytological
analysis did not identify typical features of an active resistance response. Alternatively,
disease resistance responses conferred by an R gene might be exploited by the fungus to
mediate susceptibility to C. higginsianum. Gene products of At5g45275-At5g45370 are
expected to be involved in fundamental plant processes that might be essential for the
plant-pathogen interaction mechanisms and are therefore possible candidates for dominant
susceptibility factors to C. higginsianum, resulting in recessive resistance when aberrant in
their structure and function.
4.6 Why was only a single recessive resistance locus identified in this
study?
Four resistant accessions (Ws-0, Gifu-2, Can-0 and Kondara) and one susceptible
accession Ler-0 were selected to identify the molecular basis of their natural variation in
response to C. higginsianum inoculation (see 3.2). Due to their origin from very different
geographic regions (Tab. 3.2), it was expected that analysis of the natural variation would
reveal more than one recessive resistance locus conferring resistance by different
molecular mechanisms. However, interestingly, the present analysis identified only a
single recessive resistance locus in all four resistant accessions (see 3.3.6). This raises the
question why no evidence was found for the contribution of further recessive resistance
loci.
A striking finding of the present study was that only a minority of accessions showed
strong susceptibility to fungal infection. This observation that susceptibility is a rare trait
among Arabidopsis accessions (see 4.1) suggests that the identification of only one
recessive resistance locus varying between the resistant accessions and Ler-0, is not due to
the small number of resistant accessions tested, but rather might reflect the natural
frequency of susceptibility to C. higginsianum. It seems unlikely that this finding of a
143

Discussion
limited number of recessive resistance loci present in accessions from very different
geographic regions may indicate that the identified resistance is conferred by a recessive R
gene. As it is expected that there is a limited overlap of natural habitats of Arabidopsis and
C. higginsianum (see 4.2), it is unlikely that selection pressure applied by the fungus
would have resulted in many Arabidopsis accessions carrying the same resistance allele. It
seems more plausible to argue that the identified recessive resistance is determined by
natural variation in a dominant host susceptibility factor. This factor might have
fundamental functions for the plant, e.g. in metabolism or development. As discussed in
section 4.1, occurrence of a polymorphism in this gene could be beneficial only under
distinct environmental conditions in only some habitats, as a result of a trade-off between
fundamental functions and selection advantages under these conditions. This allele might
therefore have been established in only a rare number of accessions, such as Ler-0. It is
possible that the variation in this plant factor coincidentally confers susceptibility to C.
higginsianum and functions therefore as a host susceptibility factor. In conclusion, due to
the expected limited overlap of host and pathogen distribution, the fungus might not have
evolved different mechanisms of interactions independently in different geographic
regions, leading therefore to only a limited number of recessive resistance factors as
observed in the present study. Nevertheless, including more susceptible Arabidopsis
accessions in further studies of natural variation to C. higginsianum inoculation might
possibly reveal recessive resistance loci other than the single one identified in this study.
4.7 Why did the mutant screen not identify true loss-of-susceptibility
mutants?
In the course of the present study, I screened 207,000 EMS and γ-radiation mutated
Arabidopsis M2 generation plants in several susceptible genetic backgrounds (Ler-0, Ler
eds1-2 and Ler rar1-13), aiming to identify mutations affecting susceptibility factors and
therefore resulting in loss of susceptibility. Two mutants, designated #2 and #10 (see
3.1.1) were shown to be affected in disease resistance, identified by constitutive
expression of the defence associated genes PR-1 and PDF1.2, instead of loss of
susceptibility (see 3.1.1). A total of 309 M2 mutant lines exhibited a reduced susceptibility
to C. higginsianum in a primary screen. However, for 163 of the corresponding M3 lines,
144

Discussion
the loss of susceptibility was not confirmed since the plants showed a wild-type infection
phenotype in two independent infection experiments. For further 90 M3 lines, either seed
production was not successful, or the M3 seeds did not germinate, which might be a result
of the inoculation process with the fungus as the plant development was heavily affected
by the infection, and therefore confirmation of the infection phenotype was not feasible.
For 38 M3 lines, reduced susceptibility to C. higginsianum could be confirmed. However,
this reduced susceptibility was not sufficiently clear to allow a reliable identification of the
mutant phenotype, which is essential for mapping the affected locus. It is possible that
genes mediating susceptibility belong to a gene family. Hence, the effects of mutations in
one member of this family would be masked by the functional redundancy or
compensatory effects of other family members, resulting in only a moderate loss of
susceptibility. Furthermore, disease susceptibility might be determined by multiple genes,
each one making only a partial contribution to the trait. As with redundancy, the effects of
mutations in only one of these genes might not lead to a sufficiently large phenotypic
change in disease susceptibility. To enable the identification of mutants with less strong
phenotypes, the mutant screen would have to be performed in less stringent inoculation
conditions, i.e. lower inoculum concentrations, or a less susceptible genetic background,
such as the accession Col-0 (DS 2-3). However, Col-0 already exhibits a certain degree of
resistance. Therefore, this would lead to the identification of a large number of false
positives, thereby reducing the efficiency of the mutant screen.
In addition, mutations in genes required for disease susceptibility might be essential for
growth and development of the plant. Hence, mutations in these genes may result in
lethality in an embryonic or juvenile stage of plant development and therefore such
mutants would not have been identified in the screen.
It was surprising that the mutant screen did not identify alleles of the downy mildew
resistant dmr1-4 and dmr6 mutants. These EMS mutants, identified in a similar screen for
loss of susceptibility to H. parasitica (Van Damme et al., 2005) were found to be strongly
resistant to C. higginsianum (see 3.1.2). The fact that mutations in these genes were not
identified in the present analysis suggests that the mutant screen might have been not fully
saturated and screening a larger number of mutants may be required to detect true loss-of-
susceptibility mutants.
145

Discussion
4.8 The role of dmr and pmr mutations in Arabidopsis susceptibility to
C. higginsianum
To gain insight into the molecular basis of susceptibility of Arabidopsis to H. parasitica,
van Damme et al. (2005) generated EMS mutants in the highly susceptible Ler eds1-2
background. In a forward genetic approach, these mutants were screened for loss of
susceptibility to H. parasitica. Twenty dmr mutants were identified; eight of these
correspond to six different loci (dmr1-dmr6) (Van Damme et al., 2005). Resistance of
dmr3, dmr4 and dmr5 was associated with constitutive expression of PR-1, indicating that
these mutants are probably not affected in susceptibility factors, but in resistance. In
contrast dmr1, dmr2 and dmr6 mutants were initially suggested to be affected in true host
susceptibility factors (Van Damme et al., 2005) although recently a possible involvement
in novel defence pathways was proposed (Van Damme, 2007; van Damme et al., 2008).
Although host susceptibility factors are generally expected to be involved in highly
specific plant-pathogen interactions (O'Connell and Panstruga, 2006), it was of interest to
determine whether H. parasitica and C. higginsianum, both exhibiting an intracellular
biotrophic lifestyle, share requirement for at least some of these plant susceptibility
factors. Therefore, I tested mutants harbouring four alleles of dmr1, dmr2 and dmr6 for
their response to C. higginsianum inoculation (see 3.1.2). The infection phenotypes of
dmr1-1, dmr1-2, dmr1-3 and dmr2 were microscopically and macroscopically
indistinguishable from that of the genetic background line Ler eds1-2, indicating that
mutations in these loci do not play a role in the interaction of C. higginsianum with its
host. Interestingly, dmr1-4 and dmr6 exhibited a highly resistant infection in response to
C. higginsianum inoculation.
The four different alleles of dmr1 mutants were shown to carry different amino acid
substitutions in a plant homoserine kinase (HSK) (At2g17265) (Van Damme, 2007). HSK
is a key enzyme in the aspartate metabolic pathway for the biosynthesis of the essential
amino acids methionine, threonine and isoleucine in plants. It could be shown that
although the dmr1 mutants have a reduced HSK activity, and therefore the substrate
homoserine accumulates, the levels of methionine, threonine and isoleucine were
increased rather than decreased in the dmr1 mutants. This was suggested to be caused by a
possible feedback mechanism that shuttles sufficient aspartate into the pathway so that
homoserine accumulates to high levels and residual HSK activity, in the presence of high
substrate concentrations, is sufficient to produce equal amounts of methionine, threonine
146

Discussion
and isoleucine. Alternatively, the three amino acids might be synthesised by an alternative
pathway independent of homoserine. Exogenous application of homoserine did not
indicate effects on spore germination, suggesting that homoserine itself is not toxic for H.
parasitica. However, exogenous application of L-homoserine mimicked the dmr1 mutant
phenotype, i.e. the haustoria appeared to be encased by papillae and growth of H.
parasitica was arrested after formation of the first haustorium. Callose deposition was
shown to be a secondary response which is not responsible for the arrest of pathogen
growth (Van Damme, 2007). Therefore it was postulated that homoserine itself plays a
role in a novel mechanism of plant disease resistance via modulation of the host amino
acid metabolism and is therefore not a true susceptibility factor (Van Damme, 2007).
However, it remains unclear why only dmr1-4, and not the other dmr1 alleles, results in
loss of susceptibility to C. higginsianum. Levels of homoserine in Arabidopsis seedlings
were shown to be higher in dmr1-4 than in dmr1-1 and dmr1-3, but slightly lower than in
dmr1-2, indicating that the loss of susceptibility in dmr1-4 is not due to a higher
homoserine concentration in this mutant line. It might be possible that the dmr1-4 line,
although having been back-crossed twice, contains additional EMS-induced mutations,
that are responsible for the resistant infection phenotype to C. higginsianum rather than
the mutation in DMR1. This possibility could be an interesting focus for future studies.
DMR6 (At5g24530) encodes a 2OG-Fe(II) oxygenase, a member of the superfamily of
oxygenases that catalyses different hydroxylation and desaturation steps in plants (van
Damme et al., 2008). Transcription of DMR6 was shown to be strongly induced during the
interaction with both compatible and incompatible isolates of H. parasitica. Moreover, the
activation of DMR6 was locally induced within cells that are in direct contact with the
pathogen, suggesting a role during plant defense. As the mutation in DMR6 was shown to
result in constitutive activation of defence-associated genes, e.g. ACD6, PR-1, PR-2, PR-4
and PR-5, it was postulated that DMR6 might negatively affect the expression of these
genes. Possibly, in the dmr6 mutants the substrate of the DMR6 encoded 2OG-Fe(II)
oxygenase is accumulated, which could have a direct toxic effect on the pathogen, or
indirectly stimulate the expression of defence-associated genes. Alternatively, the product
of DMR6 is either negatively regulating defense-associated genes or positively affecting
susceptibility to H. parasitica. If dmr6 affects, directly or indirectly, the activation of
defence-associated genes, it would raise the question why this does not result in a broader
range of resistance, since the dmr6-1 mutant is resistant to H. parasitica and C.
higginsianum, but remains susceptible to P. syringae and the obligate biotrophs G. orontii
147

Discussion
and Albugo candida. Specific loss of susceptibility to only H. parasitica and C.
higginsianum might therefore suggest that DMR6 functions as a plant susceptibility factor
and is essential for the interaction of both these pathogens with Arabidopsis. This
however, raises the question why the plant maintained DMR6 despite the apparent fitness
disadvantage. It is possible that negative regulation of defence-associated genes is
required for the control of defence responses by negative feedback loops, because
constitutive activation of these responses would be too metabolically expensive for the
plant. Alternatively, susceptibility to H. parasitica and C. higginsianum does not represent
a selection pressure driving the loss of DMR6 in a trade-off between the advantageous
effects of DMR6 and susceptibility to these pathogens, as similarly discussed in section
4.1. A further possibility is that DMR6 is involved in fundamental metabolic or
development plant processes. The intracellular lifestyle of H. parasitica and C.
higginsianum might be dependent on these processes during a specific step of their
pathogenesis (see 4.2). Nevertheless, it is an interesting observation that pathogens with an
obligate biotrophic life-style can differ more in their requirement for susceptibility
mechanisms than two pathogens with different life-styles, i.e. an obligate biotroph and a
hemibiotroph.
In a similar forward genetic approach, Arabidopsis mutants in a Col-0 background were
identified that did not support normal growth of the powdery mildew pathogen, G.
cichoracearum, without constitutive accumulation of PR1 and PDF1.2. Four pmr loci,
pmr2, pmr4, pmr5 and pmr6 have been cloned and characterised (Vogel and Somerville,
2000; Vogel et al., 2002; Jacobs et al., 2003; Nishimura et al., 2003; Vogel et al., 2004;
Consonni et al., 2006). As with the dmr mutants, the pmr mutants were tested for reduced
susceptibility to C. higginsianum (see 3.1.3), aiming to identify common mechanisms of
host-pathogen interactions between pathogens with an intracellular biotrophic lifestyle.
While pmr2, pmr3 and pmr4 did not show a marked difference in their infection
phenotype after inoculation with C. higginsianum, pmr5 and pmr6 plants exhibited a
significant reduction in their susceptibility in comparison to Col-0 wild-type plants.
PMR2 has been shown to be allelic to AtMLO2 (Consonni et al., 2006) and mlo-mediated
resistance was identified to be effective against the adapted powdery mildew species G.
orontii and G. cichoracearum without requirement of SA-, JA- or ET- mediated signalling
pathways (Panstruga, 2005). In contrast, Atmlo2 plants were fully susceptible to P.
syringae and to H. parasitica. MLO is an integral plasma membrane-localised protein,
148

Discussion
possessing seven hydrophobic membrane-spanning helices with a C-terminus that
harbours an amphiphilic α-helix that serves as a calmodulin binding domain. AtMLO2
belongs to a phylogenetic clade of three Arabidopsis genes (MLO2, MLO6 and MLO12)
which represent co-orthologs of the barley Mlo (Consonni et al., 2006). Recent studies
have shown that host cell entry, but not conidiophore formation (asexual sporulation) is
restored in Atmlo2 pen1 double mutants. Atmlo2 pen2 and Atmlo2 pen3 double mutants
did not only exhibit restored pathogen entry rates, but also wild-type-like conidiation. This
was an intriguing observation, since PEN1, PEN2 and PEN3 are required for powdery
mildew non-host resistance (Collins et al., 2003; Lipka et al., 2005; Stein et al., 2006).
Furthermore, the SNARE domain protein HvSNAP34 was shown to be a contributor of
mlo-based and non-host resistance (Collins et al., 2003; Douchkov et al., 2005). The fact
that both mlo-resistance and powdery mildew non-host resistance are largely independent
of common defence signalling pathways such as SA and JA/ET, and that both require
PEN1/PEN2/PEN3 and further factors, strongly suggests that these two modes of
resistance are mechanistically identical (Humphry et al., 2006). It is currently thought that
MLO proteins function as regulatory components of plant secretory processes involving
SNARE domain proteins such as PEN1 (Panstruga, 2005). Therefore, it has been
postulated that adapted powdery mildew species might have evolved to circumvent these
defence mechanisms by specifically corrupting MLO activity for successful pathogenesis.
In contrast to adapted powdery mildew species, AtMLO2/PMR2 seems not to be required
for successful entry of C. higginsianum, as shown by the comparable susceptibility of
pmr2 and wild-type plants.
Interestingly, a mutation in PMR3 did not cause increased resistance to C. higginsianum,
as observed in response to inoculation with G. cichoracearum and H. parasitica, but pmr3
plants were even more susceptible to C. higginsianum than Col-0 wild-type plants (see
3.1.3). Therefore, cloning of the pmr3 locus in the future might reveal a mechanism that
confers susceptibility to G. cichoracearum, but inhibits growth of C. higginsianum.
For pmr4 plants, I observed a slight reduction of susceptibility to C. higginsianum (see
3.1.3). However, this needs more detailed analysis of the level of reduced of susceptibility
since the Col-0 genetic background already confers a certain degree of resistance to C.
higginsianum. The reduced susceptibility of pmr4 plants would be in agreement with a
mutation in GSL5, a callose synthase isoform, which is suggested to negatively regulate
the SA pathway, as discussed in section 4.4.3 (Nishimura et al., 2003). Reduced
susceptibility to C. higginsianum, possibly due to the loss of negative regulation of the SA
149

Discussion
pathway, supports previous findings that the SA signalling pathway contributes to
resistance of Col-0 to C. higginsianum (O'Connell et al., 2004; Liu et al., 2007a).
Alternatively, it has been suggested that biotrophic pathogens such as H. parasitica and G.
cichoracearum might have evolved to exploit components of the plant wound response for
successful pathogenesis, whereby GSL5 callose synthase may facilitate nutrient uptake or
serve as a pathogen-induced protection barrier preventing recognition by the plant (Jacobs
et al., 2003). In the present study, I found callose deposition not to affect growth of C.
higginsianum in the tested Arabidopsis accessions (see 4.4.3) and therefore callose
deposition does not seem to be a component required to support successful pathogenesis.
This raises the question of how the loss of pmr4, and therewith loss of callose deposits,
might result in slightly reduced C. higginsianum growth, if pmr4-based resistance
mechanisms should not involve effects by the regulation of the SA signalling pathway as
proposed by Nishimura et al. (2003).
The PMR5 and PMR6 loci encode a protein of unknown function and a pectate lyase,
respectively, as discussed in detail in section 4.4.1. Both mutants exhibit alterations in cell
wall composition, notably an increased pectin content, reduced pectin esterification and a
change in the hydrogen-bonding environment of cellulose (Vogel et al., 2002; Vogel et
al., 2004), suggesting that changes in the cell wall architecture are associated with
powdery mildew resistance. Although a conclusive model for susceptibility to powdery
mildews remains elusive, it was hypothesised that effects on the cell wall might alter
nutrient availability for the fungus, or result in reduced penetration efficiency.
Susceptibility to C. higginsianum was also decreased in pmr5 and pmr6 compared to Col-
0 (Fig. 3.6), strongly suggesting that the mutations affect plant-pathogen interaction
mechanisms that are common between two different species of powdery mildew, i.e. G.
cichoracearum and G. orontii, and also C. higginsianum. This is particularly interesting,
as plants challenged with the oomycete H. parasitica were equally susceptible as Col-0
wild-type plants. As with the observations on dmr6, this suggests that pathogens with an
obligate biotrophic life-style can differ more in their requirement for susceptibility
mechanisms than an obligate biotroph and a hemibiotroph.
150

Discussion
4.9 Why have dmr1, dmr6, pmr4-6 not been identified in the analysis of
natural variation?
The present study identified dmr and pmr loci contributing to susceptibility to C.
higginsianum that had previously been found in mutant screens. However, none of these
loci were detected by analysis of natural variation between Ler-0 and the resistant
accessions Ws-0, Gifu-2, Can-0 and Kondara. It is possible that the dmr and pmr
mutations, induced by chemical treatment, have not occurred in nature. This is most likely
for loci that are involved in fundamental plant processes, e.g. growth or development.
Naturally occurring mutations in these genes would result in high fitness costs or even
lethality which would therefore not drive the fixation of these alleles in the population.
Furthermore, many of these chemically induced mutations have been shown to have
pleiotropic effects, resulting in microlesions, altered leaf morphology and decreased plant
size (Vogel and Somerville, 2000; Vogel et al., 2002; Vogel et al., 2004; Van Damme et
al., 2005), indicating additional effects on the plant that may reduce fitness. Likewise, the
mutation in barley MLO is known to be associated with the spontaneous deposition of
callose and premature onset of leaf senescence (Panstruga, 2005). This impaired leaf
physiology has been shown to result in reduced grain yield of mlo mutants compared with
wild-type plants. Moreover, as previously discussed, it is likely that susceptibility to C.
higginsianum might not be strongly disadvantageous under natural conditions. Therefore,
C. higginsianum might not represent a selection pressure driving the fixation of any of the
identified dmr or pmr alleles. Similarly, mlo resistance does not seem to be required in
wild populations to keep the spread of powdery mildew pathogens in check (Panstruga,
2005).
The pmr mutants were generated in a Col-0 genetic background and therefore differ from
the genetic background analysed in the present study of natural variation in response to C.
higginsianum. The genetic background might have effects on the loci identified, and
thereby on the extent of susceptibility. It is therefore possible that naturally occurring
pmr5 and pmr6 mutations would not be detectable in the resistant accessions of this study.
Furthermore, the analysis was based on natural variation between Ler-0 and the tested
resistant accessions. It therefore cannot be excluded that fixation of the pmr5 and pmr6
alleles has occurred, but in all accessions tested, and therefore identification of the loci
was not feasible by analysis of natural variation.
151

Discussion
4.10 Summary
The focus of the present study was on the identification of determinants of the interaction
between Arabidopsis and the ascomycete pathogen C. higginsianum, based on a forward
genetics screen for mutants that exhibit a loss of susceptibility to C. higginsianum, and on
the analysis of natural variation in resistance.
A high-throughput screen of 207,000 chemically or γ-radiation induced Arabidopsis
mutants of susceptible genetic backgrounds did not lead to the identification of mutant
lines with a reduction of susceptibility to C. higginsianum that was significant enough for
the localisation of the responsible susceptibility loci. However, infection assays of
previously identified mutants with loss-of-susceptibility infection phenotypes to H.
parasitica (dmr mutants) and G. cichoracearum (pmr mutants) revealed some mutant lines
that also showed a loss of susceptibility to C. higginsianum, suggesting the existence of
mechanisms of plant-pathogen interactions that are common between the hemibiotrophic
pathogen C. higginsianum and two obligate biotrophic pathogens.
In the second approach I identified a single recessive resistance locus to C. higginsianum
by crossing the resistant accessions Ws-0, Gifu-2 and Can-0 to the susceptible Ler-0
accession and following segregation in the F1 and F2 progeny, and parallely by QTL
analysis of the Ler-0 x Kondara RIL population. By positional cloning in a Ler-0 x Ws-0
F2 population, this recessive resistance locus could be located on the lower arm of
chromosome V between the molecular markers 236 (18,307,842 bp) and 312 (18,407,860
bp).
A cytological analysis demonstrated that in the resistant accessions, C. higginsianum
growth was arrested either at the stage of appressorial penetration or at the initial stage of
biotrophic primary hyphal growth. Recessive resistance mechanisms were shown not to
involve either reactive oxygen species accumulation or callose deposition.
4.11 Outlook
A chromosomal region harbouring a recessive resistance locus, involved in the interaction
of Arabidopsis with C. higginsianum, was identified in this study. The next challenge will
be to isolate the plant gene conferring recessive resistance and to determine the nature of
152

Discussion
the sequence polymorphism responsible for the natural variation between Ler-0 and
resistant accessions.
Positional cloning of an enlarged Ler-0 x Ws-0 F2 mapping population might reduce
further the size of the region harbouring the recessive resistance factor. Targeted
expression analysis of candidate genes that has become feasible for some genes by the
DNA sequence analysis of the Ler-0 BIBAC insert might indicate a function of one of
these genes in recessive resistance. Eventually, a comparative DNA sequence analysis of
the identified recessive resistance locus in Ler-0 and in resistant accessions will elucidate
the character of the natural variation. Analysis of the gene structure, biological function,
and eventually the transformation of the recessive resistance locus of the susceptible Ler-0
accession into one of the four resistant accessions and vice versa will help to identify
whether the recessive resistance locus acts as either a dominant susceptibility factor or as a
recessive R gene.
A detailed study of polymorphisms of the recessive resistance locus in additional
accessions, including in particular highly susceptible and distantly related accessions, e.g.
CVI, will shed light on intraspecific variability and might indicate mechanisms of
evolutionary adaptation.
The Arabidopsis-Colletotrichum interaction might be model pathosystem that is not of
relevance in nature. It will therefore be important to analyse homologues of the identified
recessive resistance factor in natural hosts, e.g. Brassica campestris and Raphanus.
The involvement of the recessive resistance locus in interactions with other
hemibiotrophic, obligate biotrophic and necrotrophic pathogens should also be examined
to learn us about the general relevance of this determinant of the interaction between
Arabidopsis and C. higginsianum to elucidate whether it is uniquely required for
susceptibility to C. higginsianum.
4.12 General perspectives
Plants are continuously the target of attacks by disease-causing organisms, including
bacteria, fungi, viruses and nematodes. The economic and social impact of food losses due
to plant diseases is enormous for a constantly growing world population with decreasing
areas of cultivable land. Therefore, understanding the molecular mechanisms of resistance
and susceptibility of plants to pathogens will help to identify new ways to control through
153

Discussion
plant breeding diseases providing environmentally friendly ways to improve food
production. Unravelling the mechanisms of susceptibility and resistance of Arabidopsis to
C. higginsianum should increase our understanding of the molecular basis of plant
susceptibility to other Colletotrichum species which cause devastating diseases, an
important pathogen on numerous crop and ornamental plants around the world. Ultimately
this will improve our understanding of general mechanisms of plant-pathogen interactions
to create durable resistance in the field, similar to the successful deployment of mlo alleles
in European agriculture in elite barley lines.
154

Supplementary Data
V Supplementary Data
Table SD1: Geographic origin of Arabidopsis accessions, and infection phenotypes
Origin Accession Disease Score (DS) Austria In-0 1-2 Austria Pi-0 2 Austria Uod-1 2-3 Belgium An-1 1-2 Canada Ri-0 2-3 Canada Van-0 2 Canada Var2-1 3 Canada Var2-6 2-3 Canary Islands Can-0 0-1 Cape Verdi Islands CVI 3 Czecg Republic Ta-0 2 Czech Republic Bor-1 2 Czech Republic Bor-4 2 Czech Republic Jm-0 2 Czech Republic Lp2-2 2-3 Czech Republic Lp2-6 1-2 Czech Republic Pu2-23 1 Czech Republic Pu2-7 1 Czech Republic Zdr-1 0-1 Czech Republic Zdr-6 2 Eire Bur-0 3 Finland Tamm-2 1 Finland Tamm-27 0-1 Finland Te-0 0-1 France Ag-0 0 France Gy-0 2 France Lz-0 1-2 France PYL-1 1-2 France Ra-0 2 France RAN 2-3 France Ren-1 0-1 France Ren-11 1 Germany Bay-0 3 Germany Ei-2 1-2 Germany Eil-0 0-1 Germany Ga-0 1 Germany Mrk-0 2-3 Germany Mz-0 1 Germany Nd-1 1 Germany Sp-0 0-1 Germany Wt-5 2-3 India Kas-2 1-2 Italy Bl-1 0-1 Italy Ct-1 2 Italy Pa-1 2 Japan Gifu-2 0-1 Japan Kyoto 2 Japan Sakata 2-3 Japan Sap-0 2 Japan Sendai-1 0-1 Japan Sendai-3 0-1 Japan Sendai-4 0-1
155

Supplementary data
Table SD1: continuation Origin Accession Disease Score (DS)
Japan Tsu-1 2-3 Japan Yam 0-1 Kazakhstan Kz-1 1 Kazakhstan Kz-9 1-2 Libya Mt-0 2-3 Lithuania Kn-0 2 Netherlands Nok-1 2 Norway Oy-0 1 Poland Ler-0 3 Poland Ler-1 3 Poland Lip-0 2-3 Poland Wa-1 2-3 Portugal C24 2-3 Portugal Fei-0 0-1 Russia Est-1 2 Russia Ms-0 2 Russia N6 Karelian 0-1 Russia N7 Pinguba 0-1 Russia Rld-2 2 Russia Stw-0 1 Russia Ws-0 0-1 Russia Ws-2 1-2 Spain Bla-1 2 Spain Pro-0 1 Spain Se-0 3 Spain Ts-1 0-1 Spain Ts-5 0-1 Sweden Bil-5 0-1 Sweden Eden-1 1 Sweden Eden-2 1-2 Sweden Fab-2 1 Sweden Fab-4 1-2 Sweden Lov-1 2-3 Sweden Lov-5 1 Sweden Omo2-1 0-1 Sweden Omo2-3 0-1 Sweden Spr1-2 2 Sweden Spr1-6 2 Sweden St-0 0-1 Sweden Ull2-3 1 Sweden Ull2-5 2 Tadjikistan Sorbo 1-2 Tajikistan En-T 1-2 Tajikistan Kondara 0-1 Tajikistan Shah 2 UK Edi-0 2 UK HR-5 1 UK HR-10 2 UK NFA-8 2 UK NFA-10 3 UK Sq-1 1 UK Sq-8 2 Ukraine Rubezhnoe-1 1-2 USA Col-0 2-3 USA Gre-0 2 USA Knox-10 2 USA Knox-18 2 USA Pna-10 1-2
156

Supplementary Data
Table SD1: continuation Origin Accession Disease Score (DS)
USA Pna-17 0 USA Rmx-A02 1 USA Rmx-A180 1 USA RRS-7 0-1 USA RRS-10 0-1 USA Yo-0 2 Plants were inoculated with Colletotrichum higginsianum and analysed microscopically at three days after inoculation and macroscopically at six days after inoculation. The disease score (DS) is based on the combined macroscopic and microscopic observations: DS 0, fully resistant - plants remain intact with only small necrotic lesions, no hyphae present or only biotrophic hyphae without necrotrophic secondary hyphae DS 1, intermediate resistant - plants mostly intact with only limited lesions, secondary hyphae are mostly absent or very restricted in extent DS 2, intermediate susceptible - plants partially collapsed with large necrotic lesions and some tissue maceration and water-soaking, extensive secondary mycelium, sporulation rarely seen DS 3, fully susceptible - plants completely collapsed and tissue extensively macerated and water-soaked, extensive secondary mycelium with abundant spore production
157

Supplementary data
Table SD2: Geographic origin of Arabidopsis accessions, and infection phenotypes
Marker Primer Sequence 5`-3` Position Descrip. Ch NGA225F GAAATCCAAATCCCAGAGAGG 1507104 5 NGA225 NGA225R TCTCCCCACTAGTTTTGTGTCC 1507224 SSLP 5 NGA151F GTTTTGGGAAGTTTTGCTGG 4669932 5 NGA151 NGA151R CAGTCTAAAAGCGAGAGTATGATG 4670082 SSLP 5 SO191F CTCCACCAATCATGCAAATG 15021915 5 SO191 SO191R TGATGTTGATGGAGATGGTCA 15022062 SSLP 5 DFR.1F TGTTACATGGCTTCATACCA 17181581 5 DFR.1 DFR.1R AGATCCTGAGGTGAGTTTTTC 17182723
CAP (Bsa AI) 5
MBD2-1F ACAATTCGTTGACAAAAAGC 17222001 5 MBD2-1 MBD2-1R TCAACCTCCATAGTTTGAGC 17222608 SSLP 5 17,57Mb-F CGTCATTTTTCGCCGCTCT 17252309 5 MSAT5.9 17,57Mb-R CATGGTGGCGCGTAGCTTA 17253907 SSLP 5 17,57Mb-F GGTCTCTTCTCCACTGTTTG 17569614 5 17,57Mb 17,57Mb-R GAACAAGAAGTCCTTGGAGA 17570096 SSLP 5 MRH10-2F TTTTGTTGTGAATGAATTGG 17719014 5 MRH10-2 MRH10-2R AGCCGTTAGAACCAAAATTA 17719212 SSLP 5 MSAT5.4F TCAACCCTAGATGGTGTCGAT 17844441 5 MSAT5.4 MSAT5.4R TTCAATCATTTTTGCCGTGA 17844702 SSLP 5 MFC16-2F AATCTGCCACTGTGCTTAAT 17923050 5 78 MFC16-2R ACTAATGCTTGGGCAATCTA 17923280 SSLP 5 K23L20-F TTTTAAAACGACTCATGCTTT 18039450 5 64 K23L20-R ACCGTTTGCTATGCTTCTAA 18039640 SSLP 5 K23L20-2F AAACATCGCTCTTCTCAGTC 18050610 5 66 K23L20-2R GGGAATTATGACACCAACAC 18050801 SSLP 5 K23L20-3F GGTGAGATCGTCTTAGTCGT 18089460 5 68 K23L20-3R TCTCAATCCAATGTTCAGGT 18089670 SSLP 5 K17O22-1F GCGACTGTGAAGTTTGAGAT 18262301 5 72 K17O22-1R GAGCCTTAAACTGCCACTAA 18262501 SSLP 5 18272105F CAGCACCGAAATGACAAAAA 18272105 5 134 18272105R AGCCGAAAATGTTTTGAAATAA 18273001
CAPs (HphI) 5
18304971F ATGCAGAAAATTTTACGTACC 18304971 5 146 18304971R TTGGGTTAACTTTTTGTTAA 18305240 CAPs (HpaI) 5
18307842F TAACTCCAACACGTCACTCA 18307842 5 236 18307842R TCATCGGGAGTGTTGCTAA 18308089 CAPs (MseI) 5
K9E15-1F AGCCCAAAACTGAAAAACTC 18337817 5 82 K9E15-1R ATCTGTGGGTCAGAAATCCT 18338088 SSLP 5 RPS4-NTF TCATCAATTTCCGTGGGGCA 18342772 5 RPS4-NT RPS4-NTR GGTACCTTTTCTTGTCAATG 18343194
CAPs (XhoI) 5
18363163F GTCATATAATCGTGATGGAAGA 18363163 5 332 18363163R AAAATGTGAGTGTATCCGAAA 18363459 CAPs (EcoRV) 5
18379031F CATTTTGATCAATGAATTACACATTG 18379031 5 338 18379031R GAGGGAATGAATGAAATTGA 18379231 CAPs (RsaI) 5
18383701F GACGGAGAAGGTACAGATGA 18383701 5 364 18383701R AAGAAGAACATGGGCCTAAT 18384001 CAPs (XhoI) 5
18407860F ATGTTACATACTTACATGTCAGTCTGA 18407860 5 312 18407860R TTCCACTTGGACAATGATG 18408204 CAPs (DdeI) 5
MFC19F CTTTGGCTGGAGGACTTAAA 18410145 5 252 MFC19R TAGAGCCACGTGAACTGAAG 18410422 SSLP 5 18464805F AGTTTGAAGCCCTTGTCAGA 18464805 5 276 18464805R TCTCAAATGATCCCTCAATC 18465025
CAPs (SacI) 5
MRA19-1F CGGTACTTTTTATTTTTCTTTTG 18597044 5 MRA19-1 MRA19-1R TCAATTATCCGAATCACTAAAA 18597265 SSLP 5 NGA129-F CACACTGAAGATGGTCTTGAGG 19007000 5 NGA129 NGA129-R TCAGGAGGAACTAAAGTGAGGG 19008000 SSLP 5 MSAT5.18F GATTATAGGTTATTTTCGTT 26321176 5 MSAT5.1
8 MSAT5.18R ACAGAAGAACCGATTC 26321467 SSLP 5 MSAT1.4F CTAAACTAGAACCAGGGGTAA 14160180 1 MSAT1.4 MSAT1.4R CTAAACTAGAACCAGGGGTAA 14160420 SSLP 1 NGA128-F ATCTTGAAACCTTTAGGGAGGG 20225000 1 NGA128 NGA128-R GGTCTGTTGATGTCGTAAGTCG 20226000 SSLP 1
158

Supplementary Data
159
Table SD2: continuation Marker Primer Sequence 5`-3` Position Descrip. Ch.
MSAT1.2F TTGAGTGGTGCCGCTTG 28894896 1 MSAT1.2 MSAT1.2R ATATCTCCATCGCTGCAACC 28895060 SSLP 1 MSAT2.18F TAGTCTCTTTTGGTGCGCATA 2799644 2 MSAT2.1
8 MSAT2.18R AGCCTCTCCAAGCTTAGGTCT 2799849 SSLP 2 MSAT2.41F GACTGTTTCATCGGATCCAT 11095452 2 MSAT2.4
1 MSAT2.41R ACAAACCATTGTTGGTCGTG 11095596 SSLP 2 MSAT2.4F TGGGTTTTTGTGGGTC 13831870 2 MSAT2.4 MSAT2.4R GTATTATTGTGCTGCCTTTT 13832158 SSLP 2 MSAT2.22F CGATCCAATCGGTCTCTCT 19632943 2 MSAT2.2
2 MSAT2.22R TGGTAACATCCCGAACTTC 19633191 SSLP 2 MSAT3.2F AAGGTACGGCGGTGGATATTG 9055511 3 MSAT3.2 MSAT3.2R CGGGGATTTCTTCTTCCTGTG 9055722 SSLP 3 MSAT3.29F CGGATGAGATCCAA 20486867 3 MSAT3.2
9 MSAT3.29R GACAGAGGTTTACTAATGT 20487105 SSLP 3 MSAT3.19F TTGTGTGTTTGCGATC 21377089 3 MSAT3.1
3 MSAT3.19R CATATCCGTTTTTATGTTTT 21377370 SSLP 3 MSAT4.39F GTTATCACATTAAAATCACC 89498 4 MSAT4.3
9 MSAT4.39R CCAATTGTAATATATGAACA 89659 SSLP 4 NGA8F GAGGGCAAATCTTTATTTCGG 5628810 4 NGA8 NGA8R TGGCTTTCGTTTATAAACATCC 5628967 SSLP 4 MSAT4.35F CCCATGTCTCCGATGA 7549254 4 MSAT4.3
5 MSAT4.35R GGCGTTTAATTTGCATTCT 7549471 SSLP 4 MSAT4.13F GGAACAAGAACACAGTGAA 15297044 4 MSAT4.1
3 MSAT4.13R ATAAATCTAGGCAGGACAAG 15297270 SSLP 4 MSAT4.38F GCCTTATAGTACACCCAAA 18412248 4 MSAT4.3
8 MSAT4.38R CCACTCCACTCTCGAA 18412437 SSLP 4
Table SD3: Quantitative analysis of penetration efficiency of appressoria formed by C. higginsianum on selected Arabidopsis accessions at 1, 2 and 3 dpi
1 dpi 2 dpi 3 dpi penetrated penetrated penetrated
accession mean (%) st. error mean (%) st. error mean (%) st. error Ler-0 8,003048 0,947387 19,49267 2,676852 52,82208 12,45068Col-0 1,229047 0,84419 9,729622 2,87824 26,57381 0,895933Ws-0 1,443968 0,751967 4,087382 3,375533 9,232545 4,648783Gifu-2 2,328511 1,08488 2,982167 0,665575 9,186286 1,931711Can-0 0,822644 0,434752 4,478539 2,748108 9,775386 3,477102Kondara 1,587302 1,587302 4,605132 1,63019 2,801478 2,641318Results are presented as mean values st. error, standard error (n=1,73)

Table SD4: Quantitative analysis of DAB production in epidermal cells of selected Arabidopsis accessions in response
to C. higginsianum appressoria at 2 dpi penetrated unpenetrated stained unstained stained unstained
accession mean (%) st. error mean (%) st. error mean (%) st. error mean (%) st. error Ler-0 0,740741 0,740741 18,75193 2,011531 0,493827 0,493827 80,0135 3,139223Col-0
0,124378 0,124378 9,605244 2,960968 0,248756 0,248756 90,02162 2,722306Ws-0 0 0 4,087382 3,375533 0,68522 0,343703 95,2274 3,497983Gifu-2 0 0 2,982167 0,665575 0,104822 0,104822 96,91301 0,610017Can-0 0,254453 0,254453 4,224087 2,847623 0,254453 0,254453 95,26701 2,669219Kondara 0 0 4,605132 1,63019 0,11554 0,11554 95,27933 1,56178Eil-0 0,093458 0,093458 3,774612 1,832865 0,859269 0,111605 95,27266 1,814717Results are presented as mean values st. error, standard error (n=1,73) Table SD5: Quantitative analysis of DAB production in epidermal cells of selected Arabidopsis accessions in response
to C. higginsianum appressoria at 3 dpi penetrated unpenetrated stained unstained stained unstained
accession mean (%) st. error mean (%) st. error mean (%) st. error mean (%) st. error Ler-0 13,59944 7,236545 39,22264 19,07147 9,688254 4,424604 37,48967 10,73623Col-0
9,830549 3,34798 16,74327 4,239602 3,081642 2,451681 70,34454 19,71863Ws-0 0,458716 0,458716 8,773829 4,299023 0,45942 0,264841 90,30803 28,6653Gifu-2 0,104167 0,104167 9,08212 2,020092 0,104167 0,104167 90,70955 28,0727Can-0 0,477193 0,271166 9,298193 3,206357 0,328407 0,328407 89,89621 28,15771Kondara 0,16835 0,16835 2,633127 2,47308 0,869407 0,470994 96,32912 30,29149Eil-0 0,218341 0,218341 10,52871 8,248581 0,218341 0,218341 89,03461 8,685262Results are presented as mean values st. error, standard error (n=1,73)
160

161
Table SD6: Quantitative analysis of Aniline Blue staining in epidermal cells of selected Arabidopsis accessions in
response to C. higginsianum appressoria at 2 dpi penetrated unpenetrated stained unstained stained unstained
accession mean (%) st. error mean (%) st. error mean (%) st. error mean (%) st. error Ler-0 7,274786 2,22665 7,851656 5,38974 18,34639 4,982756 66,52717 10,42815Col-0
10,17515 5,236578 2,857201 1,812342 25,61929 8,674553 61,34836 13,94272Ws-0 0,865801 0,865801 1,064812 0,559607 35,2113 6,519941 62,85809 6,492815Gifu-2 0,735083 0,385553 3,629717 2,276893 24,85119 5,209125 70,78401 2,658556Can-0 1,116519 0,535917 1,910793 1,207463 23,44178 6,339483 73,53091 4,939302Kondara 0,510204 0,510204 0,621035 0,314727 14,64302 2,87685 84,22575 2,359469Eil-0 1,060071 0,865544 0 0 30,85813 2,790371 68,0818 3,655915Results are presented as mean values st. error, standard error (n=1,73) Table SD7: Quantitative analysis of Aniline Blue staining in epidermal cells of selected Arabidopsis accessions in
response to C. higginsianum appressoria at 3 dpi penetrated unpenetrated stained unstained stained unstained
accession mean (%) st. error mean (%) st. error mean (%) st. error mean (%) st. error Ler-0 16,71604 5,468463 37,51628 4,910676 16,25404 7,305748 47,99785 9,244826Col-0
10,86843 5,598676 3,846771 2,89036 28,44883 12,11563 56,83597 16,34168Ws-0 6,263065 0,967 3,59999 3,170849 49,15812 23,78832 62,97604 1,432375Gifu-2 2,38774 1,533766 1,512849 0,783761 58,12444 20,43512 37,97497 21,33765Can-0 0,751614 0,55863 2,101231 1,526143 26,84135 6,584865 70,30581 6,552888Kondara 0,459559 0,375228 0,919118 0,750456 74,85666 7,837798 50,98344 15,51192Eil-0 1,642906 0,931128 0,125628 0,102575 32,29542 5,429131 65,93604 4,600578Results are presented as mean values st. error, standard error (n=1,73)

162

References
VI References Aarts, N., Metz, M., Holub, E., Staskawicz, B.J., Daniels, M.J. and Parker, J.E. (1998). "Different requirements for
EDS1 and NDR1 by disease resistance genes define at least two R gene-mediated signaling pathways in Arabidopsis". Proceedings of the National Academy of Sciences of the United States of America 95 (17), 10306.
Aist, J.R. (1976). "Papillae and Related Wound Plugs of Plant Cells". Annual Review of Phytopathology 14 (1), 145-163.
Al-Shehbaz, I.A. and O'Kane Jr, S.L. (2002). "Taxonomy and Phylogeny of Arabidopsis (Brassicaceae)". The Arabidopsis Book (1), 1-22.
Alonso-Blanco, C. and Koornneef, M. (2000). "Naturally occurring variation in Arabidopsis: an underexploited resource for plant genetics". Trends in Plant Science 5 (1), 22-29.
Alonso, J.M., Stepanova, A.N., Leisse, T.J., Kim, C.J., Chen, H., Shinn, P., Stevenson, D.K., Zimmerman, J., Barajas, P., Cheuk, R., Gadrinab, C., Heller, C., Jeske, A., Koesema, E., Meyers, C.C., Parker, H., Prednis, L., Ansari, Y., Choy, N., Deen, H., Geralt, M., Hazari, N., Hom, E., Karnes, M., Mulholland, C., Ndubaku, R., Schmidt, I., Guzman, P., Aguilar-Henonin, L., Schmid, M., Weigel, D., Carter, D.E., Marchand, T., Risseeuw, E., Brogden, D., Zeko, A., Crosby, W.L., Berry, C.C. and Ecker, J.R. (2003). "Genome-Wide Insertional Mutagenesis of Arabidopsis thaliana". Science 301 (5633), 653-657.
Altschul, S.F., Madden, T.L., Schaffer, A.A., Zhang, J., Zhang, Z., Miller, W. and Lipman, D.J. (1997). "Gapped BLASTand PSI-BLAST: a new generation of protein database search programs". Nucleic Acids Res 25 (17), 3389-3402.
Apel, K. and Hirt, H. (2004). "REACTIVE OXYGEN SPECIES: Metabolism, Oxidative Stress, and Signal Transduction". Annual Review of Plant Biology 55 (1), 373-399.
Asai, T., Tena, G., Plotnikova, J., Willmann, M.R., Chiu, W.L., Gomez-Gomez, L., Boller, T., Ausubel, F.M. and Sheen, J. (2002). "MAP kinase signalling cascade in Arabidopsis innate immunity". Nature 415 (6875), 977-983.
Axtell, M.J. and Staskawicz, B.J. (2003). "Initiation of RPS2-Specified Disease Resistance in Arabidopsis Is Coupled to the AvrRpt2-Directed Elimination of RIN4". Cell 112 (3), 369-377.
Bailey, J.A., O'Connell, R.J., Pring, R.J., Nash, C., Bailey, J.A. and Jeger, M.J. (1992). Colletotrichum: Biology, Pathology and Control, CAB International. Wallingford, Oxon. GB.
Bakker, E.G., Stahl, E.A., Toomajian, C., Nordborg, M., Kreitman, M. and Bergelson, J. (2006a). "Distribution of genetic variation within and among local populations of Arabidopsis thaliana over its species range". Molecular Ecology 15 (5), 1405-1418.
Bakker, E.G., Toomajian, C., Kreitman, M. and Bergelson, J. (2006b). "A Genome-Wide Survey of R Gene Polymorphisms in Arabidopsis". The Plant Cell Online 18 (8), 1803-1818.
Beck, J.B., Schmuths, H. and Schaal, B.A. (2008). "Native range genetic variation in <i>Arabidopsis thaliana</i> is strongly geographically structured and reflects Pleistocene glacial dynamics". Molecular Ecology 17 (3), 902-915.
Bessire, M., Chassot, C., Jacquat, A.C., Humphry, M., Borel, S., Petétot, J., Métraux, J.P. and Nawrath, C. (2007). "A permeable cuticle in Arabidopsis leads to a strong resistance to Botrytis cinerea". The EMBO Journal 26 2158-2168.
Birch, P.R.J., Rehmany, A.P., Pritchard, L., Kamoun, S. and Beynon, J.L. (2006). "Trafficking arms: oomycete effectors enter host plant cells". Trends in Microbiology 14 (1), 8-11.
Bisgrove, S.R., Simonich, M.T., Smith, N.M., Sattler, A. and Innes, R.W. (1994). "A disease resistance gene in Arabidopsis with specificity for two different pathogen avirulence genes". Plant Cell 6 (7), 927-933.
Bowling, S.A., Clarke, J.D., Liu, Y., Klessig, D.F. and Dong, X. (1997). "The cpr5 mutant of Arabidopsis expresses both NPR1-dependent and NPR1-independent resistance". The Plant Cell 9 (9), 1573.
Brodersen, P., Petersen, M., Pike, H.M., Olszak, B., Skov, S., Odum, N., Jorgensen, L.B., Brown, R.E. and Mundy, J. (2002). "Knockout of Arabidopsis ACCELERATED-CELL-DEATH11 encoding a sphingosine transfer protein causes activation of programmed cell death and defense". Genes & Development 16 (4), 490.
Brutinel, E.D. and Yahr, T.L. (2008). "Control of gene expression by type III secretory activity". Current Opinion in Microbiology 11 (2), 128-133.
Buell, C.R. and Somerville, S.C. (1997). "Use of Arabidopsis recombinant inbred lines reveals a monogenic and a novel digenic resistance mechanism to Xanthomonas campestris pv campestris". The Plant Journal 12 (1), 21-29.
Bueschges, R., Hollricher, K., Panstruga, R., Simons, G., Wolter, M., Frijters, A., Van Daelen, R., Van der Lee, T., Diergaarde, P. and Groenendijk, J. (1997). "The barley Mlo gene: A novel control element of plant pathogen resistance". Cell 88 (5), 695-705.
Burr, B. and Burr, F.A. (1991). "Recombinant inbreds for molecular mapping in maize: theoretical and practical considerations". Trends Genet 7 (2), 55-60.
Caicedo, A.L., Schaal, B.A. and Kunkel, B.N. (1999). "Diversity and molecular evolution of the RPS2 resistance gene in Arabidopsis thaliana". Proceedings of the National Academy of Sciences 96 (1), 302.
Caplan, J., Padmanabhan, M. and Dinesh-Kumar, S.P. (2008). "Plant NB-LRR Immune Receptors: From Recognition to Transcriptional Reprogramming". Cell Host & Microbe 3 (3), 126-135.
163

References
Carrington, J.C., Kasschau, K.D., Mahajan, S.K. and Schaad, M.C. (1996). "Cell-to-Cell and Long-Distance Transport of Viruses in Plants". The Plant Cell 8 (10), 1669.
Casasoli, M., Spadoni, S., Lilley, K.S., Cervone, F., De Lorenzo, G. and Mattei, B. (2008). "Identification by 2-D DIGE of apoplastic proteins regulated by oligogalacturonides in Arabidopsis thaliana". Proteomics 8 (5), 1042-1054.
Chang, Y.L., Henriquez, X., Preuss, D., Copenhaver, G.P. and Zhang, H.B. (2003). "A plant-transformation-competent BIBAC library from the Arabidopsis thaliana Landsberg ecotype for functional and comparative genomics". Theoretical and Applied Genetics 106 (2), 269-276.
Chassot, C. and Métraux, J.P. (2005). "The cuticle as source of signals for plant defense". Plant Biosystems-An International Journal Dealing with all Aspects of Plant Biology 139 (1), 28-31.
Chinchilla, D., Bauer, Z., Regenass, M., Boller, T. and Felix, G. (2006). "The Arabidopsis Receptor Kinase FLS2 Binds flg22 and Determines the Specificity of Flagellin Perception". The Plant Cell 18 (2), 465.
Chisholm, S.T., Coaker, G., Day, B. and Staskawicz, B.J. (2006). "Host-microbe interactions: Shaping the evolution of the plant immune response". Cell 124 (4), 803-814.
Chu, Z., Yuan, M., Yao, J., Ge, X., Yuan, B., Xu, C., Li, X., Fu, B., Li, Z., Bennetzen, J.L., Zhang, Q. and Wang, S. (2006). "Promoter mutations of an essential gene for pollen development result in disease resistance in rice". Genes Dev. 20 (10), 1250-1255.
Clark, R.M., Schweikert, G., Toomajian, C., Ossowski, S., Zeller, G., Shinn, P., Warthmann, N., Hu, T.T., Fu, G. and Hinds, D.A. (2007). "Common Sequence Polymorphisms Shaping Genetic Diversity in Arabidopsis thaliana". Science 317 (5836), 338-342.
Collins, N.C., Thordal-Christensen, H., Lipka, V., Bau, S., Kombrink, E., Qiu, J.L., Hueckelhoven, R., Stein, M., Freialdenhoven, A. and Somerville, S.C. (2003). "SNARE-protein-mediated disease resistance at the plant cell wall". Nature 425 (6961), 973-977.
Consonni, C., Humphry, M.E., Hartmann, H.A., Livaja, M., Durner, J., Westphal, L., Vogel, J., Lipka, V., Kemmerling, B. and Schulze-Lefert, P. (2006). "Conserved requirement for a plant host cell protein in powdery mildew pathogenesis". Nature Genetics 38 716-720.
Cook, R.T.A., Barker, I., Brewer, G. and Crossley, S. (1995). "Detection of strawberry black spot (Colletotrichum acutatum) with monoclonal antibodies". EPPO BULLETIN 25 57-57.
Coppinger, P., Repetti, P.P., Day, B., Dahlbeck, D., Mehlert, A. and Staskawicz, B.J. (2004). "Overexpression of the plasma membrane-localized NDR1 protein results in enhanced bacterial disease resistance in". The Plant Journal 40 225-237.
da Cunha, L., Sreerekha, M.V. and Mackey, D. (2007). "Defense suppression by virulence effectors of bacterial phytopathogens". Curr Opin Plant Biol 10 (4), 349-357.
Dangl, J.L. and Jones, J.D.G. (2001). "Plant pathogens and integrated defence responses to infection". Nature 411 (6839), 826-833.
Davis, K.R., Lyon, G.D., Darvill, A.G. and Albersheim, P. (1984). "Host-Pathogen Interactions: XXV. Endopolygalacturonic Acid Lyase from Erwinia carotovora Elicits Phytoalexin Accumulation by Releasing Plant Cell Wall Fragments". Plant Physiology 74 (1), 52.
Dean, R.A., Talbot, N.J., Ebbole, D.J., Farman, M.L., Mitchell, T.K., Orbach, M.J., Thon, M., Kulkarni, R., Xu, J.R. and Pan, H. (2005). "The genome sequence of the rice blast fungus Magnaporthe grisea". Nature 434 980-986.
Denby, K.J., Kumar, P. and Kliebenstein, D.J. (2004). "Identification of Botrytis cinerea susceptibility loci in Arabidopsis thaliana". The Plant Journal 38 (3), 473-486.
Deslandes, L., Olivier, J., Theulieres, F., Hirsch, J., Feng, D.X., Bittner-Eddy, P., Beynon, J. and Marco, Y. (2002). "Resistance to Ralstonia solanacearum in Arabidopsis thaliana is conferred by the recessive RRS1-R gene, a member of a novel family of resistance genes". Proceedings of the National Academy of Sciences 99 (4), 2404.
Deslandes, L., Olivier, J., Peeters, N., Feng, D.X., Khounlotham, M., Boucher, C., Somssich, I., Genin, S. and Marco, Y. (2003). "Physical interaction between RRS1-R, a protein conferring resistance to bacterial wilt, and PopP2, a type III effector targeted to the plant nucleus". Proceedings of the National Academy of Sciences 100 (13), 8024.
Diaz-Pendon, J.A., Truniger, V., Nieto, C., Garcia-Mas, J., Bendahmane, A. and Aranda, M.A. (2004). "Advances in understanding recessive resistance to plant viruses". Molecular Plant Pathology 5 (3), 223-233.
Dietrich, R.A., Delaney, T.P., Uknes, S.J., Ward, E.R., Ryals, J.A. and Dangl, J.L. (1994). "Arabidopsis mutants simulating disease resistance response". Cell 77 (4), 565-577.
Douchkov, D., Nowara, D., Zierold, U. and Schweizer, P. (2005). "A High-Throughput Gene-Silencing System for the Functional Assessment of Defense-Related Genes in Barley Epidermal Cells". Molecular Plant-Microbe Interactions 18 (8), 755-761.
Dunn, R.M., Hedden, P. and Bailey, J.A. (1990). "A physiologically-induced resistance of Phaseolus vulgaris to a compatible race of Colletotrichum lindemuthianum is associated with increases in ABA content". Physiological and Molecular Plant Pathology 36 (4), 339-349.
Durrant, W.E. and Dong, X.I. (2004). "Systemic acquired resistance". Annual Review of Phytopathology 42 185-209. Edwards, K., Johnstone, C. and Thompson, C. (1991). "A simple and rapid method for the preparation of plant
genomic DNA for PCR analysis". Nucleic Acids Res 19 (6), 1349. El-Lithy, M.E., Bentsink, L., Hanhart, C.J., Ruys, G.J., Rovito, D., Broekhof, J.L.M., van der Poel, H.J.A., van
Eijk, M.J.T., Vreugdenhil, D. and Koornneef, M. (2006). "New Arabidopsis Recombinant Inbred Line
164

References
Populations Genotyped Using SNPWave and Their Use for Mapping Flowering-Time Quantitative Trait Loci". Genetics 172 (3), 1867-1876.
El Gueddari, N.E., Rauchhaus, U., Moerschbacher, B.M. and Deising, H.B. (2002). "Developmentally regulated conversion of surface-exposed chitin to chitosan in cell walls of plant pathogenic fungi". New Phytologist 156 (1), 103-112.
Ellis, C. and Turner, J.G. (2001). "The Arabidopsis Mutant cev1 Has Constitutively Active Jasmonate and Ethylene Signal Pathways and Enhanced Resistance to Pathogens". The Plant Cell Online 13 (5), 1025.
Ellis, C., Karafyllidis, I. and Turner, J.G. (2002a). "Constitutive Activation of Jasmonate Signaling in an Arabidopsis Mutant Correlates with Enhanced Resistance to Erysiphe cichoracearum, Pseudomonas syringae, and Myzus persicae". Molecular Plant-Microbe Interactions 15 (10), 1025-1030.
Ellis, C., Karafyllidis, I., Wasternack, C. and Turner, J.G. (2002b). "The Arabidopsis Mutant cev1 Links Cell Wall Signaling to Jasmonate and Ethylene Responses". The Plant Cell Online 14 (7), 1557.
Espinosa, A. and Alfano, J.R. (2004). "Disabling surveillance: bacterial type III secretion system effectors that suppress innate immunity". Cell Microbiol 6 (11), 1027-1040.
Falk, A., Feys, B.J., Frost, L.N., Jones, J.D.G., Daniels, M.J. and Parker, J.E. (1999). "EDS1, an essential component of R gene-mediated disease resistance in Arabidopsis has homology to eukaryotic lipases". Proceedings of the National Academy of Sciences of the United States of America 96 (6), 3292.
Feys, B.J. and Parker, J.E. (2000). "Interplay of signaling pathways in plant disease resistance". Trends in Genetics 16 (10), 449-455.
Feys, B.J., Moisan, L.J., Newman, M.A., Parker J.E. (2001). "Direct interaction between the Arabidopsis disease resistance signaling proteins, EDS1 and PAD4". EMBO 20 (19), 5400-5411.
Flor, H. (1971). "Current status of the gene-for-gene concept". Annual Review Phytopathology 9 275-296. Fraser, R.S.S. (1999). "Plant resistance to viruses". Encyclopedia of Virology 1300-1307. Friesen, T.L., Faris, J.D., Solomon, P.S. and Oliver, R.P. (2008). "Host specific toxins; effectors of necrotrophic
pathogenicity". Cellular Microbiology. Galan, J.E. and Wolf-Watz, H. (2006). "Protein delivery into eukaryotic cells by type III secretion machines". Nature
444 (7119), 567-573. Gao, Z., Johansen, E., Eyers, S., Thomas, C.L., Noel Ellis, T.H. and Maule, A.J. (2004). "The potyvirus recessive
resistance gene, sbm1, identifies a novel role for translation initiation factor eIF4E in cell-to-cell trafficking". The Plant Journal 40 (3), 376-385.
Gassmann, W., Hinsch, M.E. and Staskawicz, B.J. (1999). "The Arabidopsis RPS4 bacterial-resistance gene is a member of the TIR-NBS-LRR family of disease-resistance genes". Plant J 20 (3), 265-277.
Glazebrook, J., Rogers, E.E. and Ausubel, F.M. (1996). "Isolation of Arabidopsis Mutants With Enhanced Disease Susceptibility by Direct Screening". Genetics 143 (2), 973-982.
Glazebrook, J. (2005). "Contrasting mechanisms of defense against biotrophic and necrotrophic pathogens". Annual Review of Phytopathology 43 205-227.
Glazebrook, J.I. (2001). "Genes controlling expression of defense responses in Arabidopsis - 2001 status". Current Opinion in Plant Biology 4 (4), 301-308.
Godiard, L., Sauviac, L., Torii, K.U., Grenon, O., Mangin, B., Grimsley, N.H. and Marco, Y. (2003). "ERECTA, an LRR receptor-like kinase protein controlling development pleiotropically affects resistance to bacterial wilt". The Plant Journal 36 (3), 353-365.
Göhre, V. and Robatzek, S. (2008). "Breaking the Barriers: Microbial Effector Molecules Subvert Plant Immunity". Annual Review of Phytopathology (0).
Göllner, K., Schweizer, P., Bai, Y. and Panstruga, R. (2008). "Natural genetic resources of Arabidopsis thaliana reveal a high prevalence and unexpected phenotypic plasticity of RPW8-mediated powdery mildew resistance". New Phytologist 177 (3), 725-742.
Gomez-Gomez, L. and Boller, T.I. (2002). "Flagellin perception: a paradigm for innate immunity". Trends in Plant Science 7 (6), 251-256.
Grant, J.J. and Loake, G.J. (2000). "Role of reactive oxygen intermediates and cognate redox signaling in disease resistance". Plant Physiol 124 (1), 21-29.
Grant, S.R., Fisher, E.J., Chang, J.H., Mole, B.M. and Dangl, J.L. (2006). "Subterfuge and Manipulation: Type III Effector Proteins of Phytopathogenic Bacteria". Annu. Rev. Microbiol 60 425-449.
Hagiwara, Y., Komoda, K., Yamanaka, T., Tamai, A., Meshi, T., Funada, R., Tsuchiya, T., Naito, S. and Ishikawa, M. (2003). "Subcellular localization of host and viral proteins associated with tobamovirus RNA replication". The EMBO Journal 22 344-353.
Hammond-Kosack, K.E. and Jones, J. (1996). "Resistance Gene-Dependent Plant Defense Responses". Plant Cell 8 (10), 1773-1791.
Hammond-Kosack, K.E. and Jones, J.D.G. (1997). "PANT DISEASE RESISTANCE GENES". Annual Review of Plant Physiology and Plant Molecular Biology 48 (1), 575-607.
Hazen, S.P., Hawley, R.M., Davis, G.L., Henrissat, B. and Walton, J.D. (2003). "Quantitative Trait Loci and Comparative Genomics of Cereal Cell Wall Composition". Plant Physiology 132 (1), 263.
He, P., Shan, L., Lin, N.C., Martin, G.B., Kemmerling, B., Nürnberger, T. and Sheen, J. (2006). "Specific Bacterial Suppressors of MAMP Signaling Upstream of MAPKKK in Arabidopsis Innate Immunity". Cell 125 (3), 563-575.
Hinsch, M., Staskawicz, B. (1996). "Identification of a New Arabidopsis Disease Resistance Locus, RPS4, and Cloning of the Corresponding Avirulence Gene, avrRps4, from Pseudomonas syringae pv. pisi". MPMI 9 (1), 55-61.
165

References
Hoffmann, M.H. (2002). "Biogeography of Arabidopsis thaliana (L.) Heynh.(Brassicaceae)". Journal of Biogeography 29 (1), 125-134.
Hong, J.K., Choi, H.W., Hwang, I.S. and Hwang, B.K. (2007). "Role of a novel pathogen-induced pepper C3–H–C4 type RING-finger protein gene, CaRFP1, in disease susceptibility and osmotic stress tolerance". Plant Molecular Biology 63 (4), 571-588.
Hückelhoven, R. (2005). "Powdery mildew susceptibility and biotrophic infection strategies". Fems Microbiology Letters 245 (1), 9-17.
Hückelhoven, R. (2007). "Cell Wall-Associated Mechanisms of Disease Resistance and Susceptibility". Annu Rev Phytopathol.
Hückelhoven, R. and Kogel, K.H. (2003). "Reactive oxygen intermediates in plant-microbe interactions: Who is who in powdery mildew resistance?" Planta 216 (6), 891-902.
Humphry, M., Consonni, C. and Panstruga, R. (2006). "mlo-based powdery mildew immunity: silver bullet or simply non-host resistance?" Molecular Plant Pathology 7 (6), 605-610.
Ishikawa, M., Obata, F., Kumagai, T. and Ohno, T. (1991). "Isolation of mutants of Arabidopsis thaliana in which accumulation of tobacco mosaic virus coat protein is reduced to low levels". Molecular Genetics and Genomics 230 (1), 33-38.
Ishikawa, M., Naito, S. and Ohno, T. (1993). "Effects of the tom1 mutation of Arabidopsis thaliana on the multiplication of tobacco mosaic virus RNA in protoplasts". J. Virol 67 5328-5338.
Iyer-Pascuzzi, A.S. and McCouch, S.R. (2007a). "Recessive Resistance Genes and the Oryza sativa-Xanthomonas oryzae pv. oryzae Pathosystem". Molecular Plant-Microbe Interactions 20 (7), 731-739.
Iyer-Pascuzzi, A.S. and McCouch, S.R. (2007b). "Functional markers for xa5-mediated resistance in rice (Oryza sativa, L.)". Molecular Breeding 19 (4), 291-296.
Iyer, A.S. and McCouch, S.R. (2004). "The Rice Bacterial Blight Resistance Gene xa5 Encodes a Novel Form of Disease Resistance". Molecular Plant-Microbe Interactions 17 (12), 1348-1354.
Jacobs, A.K., Lipka, V., Burton, R.A., Panstruga, R., Strizhov, N., Schulze-Lefert, P. and Fincher, G.B. (2003). "An Arabidopsis callose synthase, GSL5, is required for wound and papillary callose formation". Plant Cell 15 (11), 2503-2513.
Jander, G., Norris, S.R., Rounsley, S.D., Bush, D.F., Levin, I.M. and Last, R.L. (2002). "Arabidopsis map-based cloning in the post-genome era". Plant Physiology 129 (2), 440-450.
Jia, Y., McAdams, S.A., Bryan, G.T., Hershey, H.P. and Valent, B. (2000). "Direct interaction of resistance gene and avirulence gene products confers rice blast resistance". The EMBO Journal 19 4004-4014.
Jones, J.D.G. and Dangl, J.L. (2006). "The plant immune system". Nature 444 (7117), 323-329. Kaku, H., Nishizawa, Y., Ishii-Minami, N., Akimoto-Tomiyama, C., Dohmae, N., Takio, K., Minami, E. and
Shibuya, N. (2006). "Plant cells recognize chitin fragments for defense signaling through a plasma membrane receptor". Proceedings of the National Academy of Sciences 103 (29), 11086.
Kamoun, S. (2006). "A catalogue of the effector secretome of plant pathogenic oomycetes". Annual Review of Phytopathology 44 41-60.
Kämper, J., Kahmann, R., Bölker, M., Ma, L.J., Brefort, T., Saville, B.J., Banuett, F., Kronstad, J.W., Gold, S.E. and Müller, O. (2006). "Insights from the genome of the biotrophic fungal plant pathogen Ustilago maydis". Nature 444 (7115), 97-101.
Kang, B.C., Yeam, I., Frantz, J.D., Murphy, J.F. and Jahn, M.M. (2005a). "The pvr1 locus in Capsicum encodes a translation initiation factor eIF4E that interacts with Tobacco etch virus VPg". The Plant Journal 42 (3), 392-405.
Kang, B.C., Yeam, I. and Jahn, M.M.I. (2005b). "Genetics of plant virus resistance". Annual Review of Phytopathology 43 581-621.
Kaplan, F. and Guy, C.L. (2005). "RNA interference of Arabidopsis beta-amylase8 prevents maltose accumulation upon cold shock and increases sensitivity of PSII photochemical efficiency to freezing stress". Plant J 44 (5), 730-743.
Kim, M.G., da Cunha, L., McFall, A.J., Belkhadir, Y., DebRoy, S., Dangl, J.L. and Mackey, D. (2005). "Two Pseudomonas syringae Type III Effectors Inhibit RIN4-Regulated Basal Defense in Arabidopsis". Cell 121 (5), 749-759.
Kliebenstein, D., Pedersen, D., Barker, B. and Mitchell-Olds, T. (2002). "Comparative Analysis of Quantitative Trait Loci Controlling Glucosinolates, Myrosinase and Insect Resistance in Arabidopsis thaliana". Genetics 161 (1), 325-332.
Kojima, I., Tanaka, T., Inagi, R., Kato, H., Yamashita, T., Sakiyama, A., Ohneda, O., Takeda, N., Sata, M. and Miyata, T. (2007). "Protective Role of Hypoxia-Inducible Factor-2 {alpha} against Ischemic Damage and Oxidative Stress in the Kidney". Journal of the American Society of Nephrology 18 (4), 1218.
Koornneef, M., Alonso-Blanco, C. and Vreugdenhil, D. (2004). "Naturally occurring genetic variation in Arabidopsis thaliana". Annual Review of Plant Biology 55 141-172.
Korves, T. and Bergelson, J. (2004). "A novel cost of R gene resistance in the presence of disease". Am Nat 163 (4), 489-504.
Kover, P.X., Wolf, J.B., Kunkel, B.N. and Cheverud, J.M. (2005). "Genetic architecture of Arabidopsis thaliana response to infection by Pseudomonas syringae". Heredity 94 507-517.
Kuroda, H., Takahashi, N., Shimada, H., Seki, M., Shinozaki, K. and Matsui, M. (2002). "Classification and Expression Analysis of Arabidopsis F-Box-Containing Protein Genes". Plant Cell Physiol. 43 (10), 1073-1085.
Lahaye, T. (2002). "The Arabidopsis RRS1-R disease resistance gene - uncovering the plant's nucleus as the new battlefield of plant defense?" Trends in Plant Science 7 (10), 425-427.
166

References
Laloi, C., Mestres-Ortega, D., Marco, Y., Meyer, Y. and Reichheld, J.P. (2004). "The Arabidopsis Cytosolic Thioredoxin h5 Gene Induction by Oxidative Stress and Its W-Box-Mediated Response to Pathogen Elicitor". Plant Physiology 134 (3), 1006.
Lamb, C. and Dixon, R.A. (1997). "THE OXIDATIVE BURST IN PLANT DISEASE RESISTANCE". Annual Reviews in Plant Physiology and Plant Molecular Biology 48 (1), 251-275.
Lee, H., Xiong, L., Gong, Z., Ishitani, M., Stevenson, B. and Zhu, J.K. (2001). "The Arabidopsis HOS1 gene negatively regulates cold signal transduction and encodes a RING finger protein that displays cold-regulated nucleo-cytoplasmic partitioning". Genes & Development 15 (7), 912.
Lellis, A.D., Kasschau, K.D., Whitham, S.A. and Carrington, J.C. (2002). "Loss-of-Susceptibility Mutants of Arabidopsis thaliana Reveal an Essential Role for eIF (iso) 4E during Potyvirus Infection". Current Biology 12 (12), 1046-1051.
Levine, A., Tenhaken, R., Dixon, R. and Lamb, C. (1994). "H2O2 FROM THE OXIDATIVE BURST ORCHESTRATES THE PLANT HYPERSENSITIVE DISEASE RESISTANCE RESPONSE". Cell(Cambridge) 79 (4), 583-593.
Lindeberg, M., Cartinhour, S., Myers, C.R., Schechter, L.M., Schneider, D.J. and Collmer, A. (2006). "Closing the Circle on the Discovery of Genes Encoding Hrp Regulon Members and Type III Secretion System Effectors in the Genomes of Three Model Pseudomonas syringae Strains". Molecular Plant-Microbe Interactions 19 (11), 1151-1158.
Lipka, V., Dittgen, J., Bednarek, P., Bhat, R., Wiermer, M., Stein, M., Landtag, J., Brandt, W., Rosahl, S., Scheel, D., Llorente, F., Molina, A., Parker, J., Somerville, S. and Schulze-Lefert, P. (2005). "Pre- and Postinvasion Defenses Both Contribute to Nonhost Resistance in Arabidopsis". Science 310 (5751), 1180-1183.
Liu, G., Kennedy, R., Greenshields, D.L., Peng, G., Forseille, L., Selvaraj, G. and Wei, Y. (2007a). "Detached and Attached Arabidopsis Leaf Assays Reveal Distinctive Defense Responses Against Hemibiotrophic Colletotrichum spp". Molecular Plant-Microbe Interactions 20 (10), 1308-1319.
Liu, Y., Koornneef, M. and Soppe, W.J.J. (2007b). "The Absence of Histone H2B Monoubiquitination in the Arabidopsis hub1 (rdo4) Mutant Reveals a Role for Chromatin Remodeling in Seed Dormancy". The Plant Cell Online 19 (2), 433.
Lorang, J.M., Sweat, T.A. and Wolpert, T.J. (2007). "Plant disease susceptibility conferred by a "resistance" gene". Proceedings of the National Academy of Sciences 104 (37), 14861-14866.
Loudet, O., Chaillou, S., Camilleri, C., Bouchez, D. and Daniel-Vedele, F. (2002). "Bay-0× Shahdara recombinant inbred line population: a powerful tool for the genetic dissection of complex traits in Arabidopsis". TAG Theoretical and Applied Genetics 104 (6), 1173-1184.
Lukowitz, W., Gillmor, C.S. and Scheible, W.R. (2000). "Positional cloning in arabidopsis. Why it feels good to have a genome initiative working for you". Plant Physiology 123 (3), 795-805.
Mackey, D., Holt, B.F., Wiig, A. and Dangl, J.L. (2002). "RIN4 Interacts with Pseudomonas syringae Type III Effector Molecules and Is Required for RPM1-Mediated Resistance in Arabidopsis". Cell 108 (6), 743-754.
Macnab, R.M. (1992). "Genetics and Biogenesis of Bacterial Flagella". Annual Reviews in Genetics 26 (1), 131-158. Mallory, A.C. and Vaucheret, H. (2006). "Functions of microRNAs and related small RNAs in plants". Nat. Genet 38
(Suppl 1), S31-S36. Maloof, J.N. (2003). "Genomic approaches to analyzing natural variation in Arabidopsis thaliana". Current Opinion in
Genetics & Development 13 (6), 576-582. Mateo, A., Muhlenbock, P., Rusterucci, C., Chang, C.C.C., Miszalski, Z., Karpinska, B., Parker, J.E.,
Mullineaux, P.M. and Karpinski, S. (2004). "Lesion simulating disease 1 - Is required for acclimation to conditions that promote excess excitation energy". Plant Physiology 136 (1), 2818-2830.
Mathur, R.S., Barnett, H.L. and Lilly, V.G. (1950). "Sporulation of Colletotrichum-Lindemuthianum in Culture". Phytopathology 40 (1), 104-114.
Maule, A., Leh, V. and Lederer, C. (2002). "The dialogue between viruses and hosts in compatible interactions". Current Opinion in Plant Biology 5 (4), 279-284.
McDowell, J.M. and Simon, S.A. (2008). "Molecular diversity at the plant–pathogen interface". Developmental and Comparative Immunology 32 (7), 736-744.
McKhann, H.I., Camilleri, C., Berard, A., Bataillon, T., David, J.L., Reboud, X., Le Corre, V., Caloustian, C., Gut, I.G. and Brunel, D. (2004). "Nested core collections maximizing genetic diversity in Arabidopsis thaliana". The Plant Journal 38 (1), 193-202.
McNellis, T.W., von Arnim, A.G. and Deng, X.W. (1994). "Overexpression of Arabidopsis COP1 results in partial suppression of light-mediated development: evidence for a light-inactivable repressor of photomorphogenesis". Plant Cell 6 (10), 1391-1400.
McNellis, T.W., Torii, K.U. and Deng, X.W. (1996). "Expression of an N-terminal fragment of COP1 confers a dominant-negative effect on light-regulated seedling development in Arabidopsis". The Plant Cell 8 (9), 1491.
Medzhitov, R. and Janeway, C.A. (2002). "Decoding the Patterns of Self and Nonself by the Innate Immune System". Science 296 (5566), 298-301.
Mims, C.W. and Vaillancourt, L.J. (2002). "Ultrastructural Characterization of Infection and Colonization of Maize Leaves by Colletotrichum graminicola, and by a C. graminicola Pathogenicity Mutant". Phytopathology 92 (7), 803-812.
Mitchell-Olds, T. and Schmitt, J. (2006). "Genetic mechanisms and evolutionary significance of natural variation in Arabidopsis". Nature 441 (7096), 947-952.
167

References
Mitchell-Olds, T., Willis, J.H. and Goldstein, D.B. (2007). "Which evolutionary processes influence natural genetic variation for phenotypic traits". Nat Rev Genet 8 845-856.
Nambara, E. and Marion-Poll, A. (2005). "ABSCISIC ACID BIOSYNTHESIS AND CATABOLISM". Annual Review of Plant Biology 56 (1), 165-185.
Narusaka, Y., Narusaka, M., Park, P., Kubo, Y., Hirayama, T., Seki, M., Shiraishi, T., Ishida, J., Nakashima, M., Enju, A., Sakurai, T., Satou, M., Kobayashi, M. and Shinozaki, K. (2004). "RCH1, a locus in Arabidopsis That confers resistance to the hemibiotrophic fungal pathogen Colletotrichum higginsianum". Molecular Plant-Microbe Interactions 17 (7), 749-762.
Nawrath, C. (2006). "Unraveling the complex network of cuticular structure and function". Current Opinion in Plant Biology 9 (3), 281-287.
Nicaise, V., German-Retana, S., Sanjuan, R., Dubrana, M.P., Mazier, M., Maisonneuve, B., Candresse, T., Caranta, C. and LeGall, O. (2003). "The Eukaryotic Translation Initiation Factor 4E Controls Lettuce Susceptibility to the Potyvirus Lettuce mosaic virus". Plant Physiology 132 (3), 1272.
Nimchuk, Z., Eulgem, T., Holt, B.E. and Dangl, J.L. (2003). "Recognition and response in the plant immune system". Annual Review of Genetics 37 579-609.
Nishimura, M.T., Stein, M., Hou, B.H., Vogel, J.P., Edwards, H. and Somerville, S.C. (2003). "Loss of a callose synthase results in salicylic acid-dependent disease resistance". Science 301 (5635), 969-972.
Nordborg, M., Hu, T.T., Ishino, Y., Jhaveri, J., Toomajian, C., Zheng, H., Bakker, E., Calabrese, P., Gladstone, J., Goyal, R., Jakobsson, M., Kim, S., Morozov, Y., Padhukasahasram, B., Plagnol, V., Rosenberg, N.A., Shah, C., Wall, J.D., Wang, J., Zhao, K., Kalbfleisch, T., Schulz, V., Kreitman, M. and Bergelson, J. (2005). "The Pattern of Polymorphism in Arabidopsis thaliana". PLoS Biology 3 (7), 1289-1299.
Nürnberger, T., Brunner, F., Kemmerling, B. and Piater, L. (2004). "Innate immunity in plants and animals: striking similarities and obvious differences". Immunological Reviews 198 (1), 249.
O'Connell, R., Herbert, C., Sreenivasaprasad, S., Khatib, M., Esquerre-Tugaye, M.T. and Dumas, B. (2004). "A novel Arabidopsis-Colletotrichum pathosystem for the molecular dissection of plant-fungal interactions". Molecular Plant-Microbe Interactions 17 (3), 272-282.
O'Connell, R.J. and Panstruga, R. (2006). "Tansley review Tête à tête inside a plant cell: establishing compatibility between plants and biotrophic fungi and oomycetes". New Phytologist 171 699-718.
Orbach, M.J., Farrall, L., Sweigard, J.A., Chumley, F.G. and Valent, B. (2000). "A Telomeric Avirulence Gene Determines Efficacy for the Rice Blast Resistance Gene Pi-ta". Plant Cell 12 (11), 2019-2032.
Pain, N.A., Green, J.R., Gammie, F. and O'Connell, R.J. (1994). "Immunomagnetic isolation of viable intracellular hyphae of Colletotrichum lindemuthianum (Sacc. & Magn.) Briosi & Cav. from infected bean leaves using a monoclonal antibody". New Phytologist 127 (2), 223-332.
Panstruga, R. (2005). "Serpentine plant MLO proteins as entry portals for powdery mildew fungi". Biochem. Soc. Trans. 33 (Pt 2), 389-392.
Parker, J.E., Holub, E.B., Frost, L.N., Falk, A., Gunn, N.D. and Daniels, M.J. (1996). "Characterization of eds1, a mutation in Arabidopsis suppressing resistance to Peronospora parasitica specified by several different RPP genes". Plant Cell 8 (11), 2033-2046.
Parniske, M. (2000). "Intracellular accommodation of microbes by plants: a common developmental program for symbiosis and disease?" Current Opinion in Plant Biology 3 (4), 320-328.
Penninckx, I.A.M.A., Eggermont, K., Terras, F.R.G., Thomma, B.P.H.J., DeSamblanx, G.W., Buchala, A., Metraux, J.P., Manners, J.M. and Broekaert, W.F. (1996). "Pathogen-induced systemic activation of a plant defensin gene in Arabidopsis follows a salicylic acid-independent pathway". Plant Cell 8 (12), 2309-2323.
Perchepied, L., Kroj, T., Tronchet, M., Loudet, O. and Roby, D. (2006). "Natural Variation in Partial Resistance to Pseudomonas syringae Is Controlled by Two Major QTLs in Arabidopsis thaliana". PLoS ONE 1 (1).
Perfect, S.E., Hughes, H.B., O'Connell, R.J. and Green, J.R. (1999). "Colletotrichum - A model genus for studies on pathology and fungal-plant interactions". Fungal Genetics and Biology 27 (2-3), 186-198.
Peters, J.L., Cnudde, F. and Gerats, T. (2003). "Forward genetics and map-based cloning approaches". Trends in Plant Science 8 (10), 484-491.
Petersen, M., Brodersen, P., Naested, H., Andreasson, E., Lindhart, U., Johansen, B., Nielsen, H.B., Lacy, M., Austin, M.J. and Parker, J.E. (2000). "Arabidopsis MAP Kinase 4 Negatively Regulates Systemic Acquired Resistance". Cell 103 (7), 1111-1120.
Reichheld, J.P., Mestres-Ortega, D., Laloi, C. and Meyer, Y. (2002). "The multigenic family of thioredoxin h in Arabidopsis thaliana: specific expression and stress response". Plant Physiology et Biochemistry 40 (6-8), 685-690.
Robaglia, C. and Caranta, C. (2006). "Translation initiation factors: a weak link in plant RNA virus infection". Trends in Plant Science 11 (1), 40-45.
Robatzek, S., Chinchilla, D. and Boller, T. (2006). "Ligand-induced endocytosis of the pattern recognition receptor FLS2 in Arabidopsis". Genes & Development 20 (5), 537-542.
Ron, M. and Avni, A. (2004). "The Receptor for the Fungal Elicitor Ethylene-Inducing Xylanase Is a Member of a Resistance-Like Gene Family in Tomato". The Plant Cell Online 16 (6), 1604.
Ruffel, S., Dussault, M.H., Palloix, A., Moury, B., Bendahmane, A., Robaglia, C. and Caranta, C. (2002). "A natural recessive resistance gene against potato virus Y in pepper corresponds to the eukaryotic initiation factor 4E (eIF4E)". The Plant Journal 32 (6), 1067-1075.
168

References
Ruffel, S., Dussault, M.H., Duprat, A., Palloix, A., Moury, B., Revers, F., Bendahmane, A., Robaglia, C. and Caranta, C. (2004). "The key role of the eukaryotic initiation factor 4E (eIF4E) in plant-potyvirus interactions". Biology of Plant–Microbe Interactions 4 81–83.
Rustérucci, C., Aviv, D.H., Holt Iii, B.F., Dangl, J.L. and Parker, J.E. (2001). "The Disease Resistance Signaling Components EDS1 and PAD4 Are Essential Regulators of the Cell Death Pathway Controlled by LSD1 in Arabidopsis". The Plant Cell Online 13 2211-2224.
Salvaudon, L., Giraud, T. and Shykoff, J.A. (2008). "Genetic diversity in natural populations: a fundamental component of plant–microbe interactions". Current Opinion in Plant Biology 11 (2), 135-143.
Samson, F., Brunaud, V., Balzergue, S., Dubreucq, B., Lepiniec, L., Pelletier, G., Caboche, M. and Lecharny, A. (2002). "FLAGdb/FST: a database of mapped flanking insertion sites (FSTs) of Arabidopsis thaliana T-DNA transformants". Nucleic Acids Research 30 (1), 94.
Sanger, F., Nicklen, S. and Coulson, A.R. (1977). "DNA Sequencing with Chain-Terminating Inhibitors". Proceedings of the National Academy of Sciences of the United States of America 74 (12), 5463-5467.
Santamaria, M., Thomson, C.J., Read, N.D. and Loake, G.J. (2001). "The promoter of a basic PR1-like gene, AtPRB1, from Arabidopsis establishes an organ-specific expression pattern and responsiveness to ethylene and methyl jasmonate". Plant Molecular Biology 47 (5), 641-652.
Schmelzer, E. (2002). "Cell polarization, a crucial process in fungal defence". Trends in Plant Science 7 (9), 411-415. Schmid, K.J., Sorensen, T.R., Stracke, R., Torjek, O., Altmann, T., Mitchell-Olds, T. and Weisshaar, B. (2003).
"Large-Scale Identification and Analysis of Genome-Wide Single-Nucleotide Polymorphisms for Mapping in Arabidopsis thaliana". Genome Research 13 (6), 1250.
Schmid, K.J., Törjék, O., Meyer, R., Schmuths, H., Hoffmann, M.H. and Altmann, T. (2006). "Evidence for a large-scale population structure of Arabidopsis thaliana from genome-wide single nucleotide polymorphism markers". TAG Theoretical and Applied Genetics 112 (6), 1104-1114.
Schnurr, J. and Shockey, J. (2004). "The Acyl-CoA Synthetase Encoded by LACS2 Is Essential for Normal Cuticle Development in Arabidopsis". The Plant Cell Online 16 (3), 629.
Scholl, R.L., May, S.T. and Ware, D.H. (2000). "Seed and molecular resources for Arabidopsis". Plant Physiol 124 (4), 1477-1480.
Sherriff, C., Whelan, M.J., Arnold, G.M., Lafay, J.F., Brygoo, Y. and Bailey, J.A. (1994). "Ribosomal DNA-Sequence Analysis Reveals New Species Groupings in the Genus Colletotrichum". Experimental Mycology 18 (2), 121-138.
Shimada, C., Lipka, V., O'Connell, R., Okuno, T., Schulze-Lefert, P. and Takano, Y. (2006). "Nonhost Resistance in Arabidopsis-Colletotrichum Interactions Acts at the Cell Periphery and Requires Actin Filament Function". Molecular Plant-Microbe Interactions 19 (3), 270-279.
Shindo, C., Bernasconi, G. and Hardtke, C.S. (2007). "Natural Genetic Variation in Arabidopsis: Tools, Traits and Prospects for Evolutionary Ecology". Annals of Botany 99 (6), 1043-1054.
Stahl, E.A., Dwyer, G., Mauricio, R., Kreitman, M. and Bergelson, J. (1999). "Dynamics of disease resistance polymorphism at the Rpm1 locus of Arabidopsis". Nature 400 (6745), 667-671.
Stein, M., Dittgen, J., Sanchez-Rodriguez, C., Hou, B.H., Molina, A., Schulze-Lefert, P., Lipka, V. and Somerville, S. (2006). "Arabidopsis PEN3/PDR8, an ATP binding cassette transporter, contributes to nonhost resistance to inappropriate pathogens that enter by direct penetration". Plant Cell 18 (3), 731-746.
Stephenson, S.A., Hatfield, J., Rusu, A.G., Maclean, D.J. and Manners, J.M. (2000). "CgDN3: An essential pathogenicity gene of Colletotrichum gloeosporioides necessary to avert a hypersensitive-like response in the host Stylosanthes guianensis". Molecular Plant-Microbe Interactions 13 (9), 929-941.
Stone, B.A. and Clarke, A.E. (1992). Chemistry and Biology of (1-3)-Glucans, Journal of the science of food and agriculture. 15: 33-36.
Sundaresan, V., Springer, P., Volpe, T., Haward, S., Jones, J.D., Dean, C., Ma, H. and Martienssen, R. (1995). "Patterns of gene action in plant development revealed by enhancer trap and gene trap transposable elements". Genes & Development 9 (14), 1797.
Sweat, T.A., Lorang, J.M., Bakker, E.G. and Wolpert, T.J. (2008). "Characterization of Natural and Induced Variation in the LOV1 Gene, a CC-NB-LRR Gene Conferring Victorin Sensitivity and Disease Susceptibility in Arabidopsis". Molecular Plant-Microbe Interactions 21 (1), 7-19.
Tan, X., Meyers, B.C., Kozik, A., West, M.A., Morgante, M., StClair, D.A., Bent, A.F. and Michelmore, R.W. (2007). "Global expression analysis of nucleotide binding site-leucine rich repeat-encoding and related genes in Arabidopsis". BMC Plant Biology 7 56.
Thomma, B.P.H.J., Penninckx, I.A.M.A., Broekaert, W.F. and Cammue, B.P.A. (2001). "The complexity of disease signaling in Arabidopsis". Current Opinion in Immunology 13 (1), 63-68.
Thordal-Christensen, H., Zhang, Z., Wei, Y. and Collinge, D.B. (1997). "Subcellular localization of H2O2 in plants. H 2 O 2 accumulation in papillae and hypersensitive response during the barley-powdery mildew interaction". The Plant Journal 11 (6), 1187-1194.
Thordal-Christensen, H., Gregersen, P.L., Collinge, D.B., Slusarenko, A.J., Fraser, R.S.S. and van Loon, L.C. (2000). "Mechanisms of Resistance to Plant Diseases". Kluwer Academic Publishers.
Tian, D., Araki, H., Stahl, E., Bergelson, J. and Kreitman, M. (2002). "Signature of balancing selection in Arabidopsis". Proceedings of the National Academy of Sciences 99 (17), 11525.
Tian, D., Traw, M.B., Chen, J.Q., Kreitman, M. and Bergelson, J. (2003). "Fitness costs of R-gene-mediated resistance in Arabidopsis thaliana". Nature 423 (6935), 74-77.
169

References
Tissier, A.F., Marillonnet, S., Klimyuk, V., Patel, K., Torres, M.A., Murphy, G. and Jones, J.D.G. (1999). "Multiple Independent Defective Suppressor-mutator Transposon Insertions in Arabidopsis: A Tool for Functional Genomics". The Plant Cell Online 11 (10), 1841.
Tonsor, S.J., Alonso-Blanco, C. and Koornneef, M. (2005). "Gene function beyond the single trait: natural variation, gene effects, and evolutionary ecology in Arabidopsis thaliana". Plant, cell and environment(Print) 28 (1), 2-20.
Toyoda, K., Collins, N.C., Takahashi, A. and Shirasu, K. (2002). "Resistance and Susceptibility of Plants to Fungal Pathogens". Transgenic Research 11 (6), 567-582.
Tsujimoto, Y., Numaga, T., Ohshima, K., Yano, M., Ohsawa, R., Goto, D.B., Naito, S. and Ishikawa, M. (2003). "Arabidopsis TOBAMOVIRUS MULTIPLICATION (TOM) 2 locus encodes a transmembrane protein that interacts with TOM1". The EMBO Journal 22 335-343.
Ueno, K., Yoneyama, H., Mizutani, M., Hirai, N. and Todoroki, Y. (2007). "Asymmetrical ligand binding by abscisic acid 8'-hydroxylase". Bioorganic & Medicinal Chemistry 15 (18), 6311-6322.
Van Damme, M., Andel, A., Huibers, R.P., Panstruga, R., Weisbeek, P.J. and Van den Ackerveken, G. (2005). "Identification of Arabidopsis Loci Required for Susceptibility to the Downy Mildew Pathogen Hyaloperonospora parasitica". Molecular Plant-Microbe Interactions 18 (6), 583-592.
Van Damme, M. (2007). Genetic analysis of disease susceptibility in the Arabidopsis-Hyaloperonospora parasitica interaction. Department of Biology. Utrecht, University of Utrecht. PhD: 125.
van Damme, M., Huibers, R.P., Elberse, J. and Van den Ackerveken, G. (2008). "Arabidopsis DMR6 encodes a putative 2OG-Fe(II) oxygenase that is defense-associated but required for susceptibility to downy mildew". The Plant Journal 0 (0), ???-???
van den Burg, H.A., Harrison, S.J., Joosten, M., Vervoort, J. and de Wit, P. (2006). "Cladosporium fulvum Avr4 Protects Fungal Cell Walls Against Hydrolysis by Plant Chitinases Accumulating During Infection". Molecular Plant-Microbe Interactions 19 (12), 1420-1430.
van den Burg, H.A., Tsitsigiannis, D.I., Rowland, O., Lo, J., Rallapalli, G., MacLean, D., Takken, F.L.W. and Jones, J.D.G. (2008). "The F-Box Protein ACRE189/ACIF1 Regulates Cell Death and Defense Responses Activated during Pathogen Recognition in Tobacco and Tomato". THE PLANT CELL 20 (3), 697.
Van der Biezen, E.A. and Jones, J.D. (1998). "Plant disease-resistance proteins and the gene-for-gene concept". Trends Biochem Sci 23 (12), 454-456.
Van Ooijen, J.W. and Maliepaard, C. (1996). "MapQTL™ version 3.0: Software for the calculation of QTL positions on genetic maps. Plant Genome IV abstracts". World Wide Web http://probe. nalusda. gov 8000 921–935.
Van Ooijen, J.W., Boer, M.P., Jansen, R.C. and Maliepaard, C. (2000). MAPQTL, Version 4. 0: software for the calculation of QTL positions on genetic maps, Plant Research International.
Vanacker, H., Carver, T.L.W. and Foyer, C.H. (2000). "Early H2O2 Accumulation in Mesophyll Cells Leads to Induction of Glutathione during the Hyper-Sensitive Response in the Barley-Powdery Mildew Interaction". Plant Physiology 123 (4), 1289.
Vercauteren, I., de Almeida Engler, J., De Groodt, R. and Gheysen, G. (2002). "An Arabidopsis thaliana Pectin Acetylesterase Gene Is Upregulated in Nematode Feeding Sites Induced by Root-knot and Cyst Nematodes". Molecular Plant-Microbe Interactions 15 (4), 404-407.
Vogel, J. and Somerville, S.I. (2000). "Isolation and characterization of powdery mildew-resistant Arabidopsis mutants". Proceedings of the National Academy of Sciences of the United States of America 97 (4), 1897-1902.
Vogel, J.P., Raab, T.K., Schiff, C. and Somerville, S.C.I. (2002). "PMR6, a pectate lyase-like gene required for powdery mildew susceptibility in Arabidopsis". Plant Cell 14 (9), 2095-2106.
Vogel, J.P., Raab, T.K., Somerville, C.R. and Somerville, S.C.I. (2004). "Mutations in PMR5 result in powdery mildew resistance and altered cell wall composition". Plant Journal 40 (6), 968-978.
Vorwerk, S., Somerville, S. and Somerville, C. (2004). "The role of plant cell wall polysaccharide composition in disease resistance". Trends in Plant Science 9 (4), 203-209.
Wan, J., Zhang, X.C., Neece, D., Ramonell, K.M., Clough, S., Kim, S., Stacey, M.G. and Stacey, G. (2008). "A LysM Receptor-Like Kinase Plays a Critical Role in Chitin Signaling and Fungal Resistance in Arabidopsis". The Plant Cell Online 20 (2), 471.
Wharton, P.S. and Julian, A.M. (1996). "A cytological study of compatible and incompatible interactions between Sorghum bicolor and Colletotrichum sublineolum". New Phytologist 134 (1), 25-34.
Wiermer, M., Feys, B.J. and Parker, J.E.I. (2005). "Plant immunity: the EDS1 regulatory node". Current Opinion in Plant Biology 8 (4), 383-389.
Wilson, I.W., Schiff, C.L., Hughes, D.E. and Somerville, S.C. (2001). "Quantitative Trait Loci Analysis of Powdery Mildew Disease Resistance in the Arabidopsis thaliana Accession Kashmir-1". Genetics 158 (3), 1301-1309.
Wright, D.A., Ke, N., Smalle, J., Hauge, B.M., Goodman, H.M. and Voytas, D.F. (1996). "Multiple Non-LTR Retrotransposons in the Genome of Arabidopsis thaliana". Genetics 142 (2), 569-578.
Xiao, F., Goodwin, S.M., Xiao, Y., Sun, Z., Baker, D., Tang, X., Jenks, M.A. and Zhou, J.M. (2004). "Arabidopsis CYP86A2 represses Pseudomonas syringae type III genes and is required for cuticle development". The EMBO Journal 23 2903-2913.
Xiao, S., Calis, O., Patrick, E., Zhang, G., Charoenwattana, P., Muskett, P., Parker, J.E. and Turner, J.G. (2005). "The atypical resistance gene, RPW8, recruits components of basal defence for powdery mildew resistance in Arabidopsis". The Plant Journal 42 (1), 95-110.
Yamanaka, T., Ohta, T., Takahashi, M., Meshi, T., Schmidt, R., Dean, C., Naito, S. and Ishikawa, M. (2000). "TOM1, an Arabidopsis gene required for efficient multiplication of a tobamovirus, encodes a putative
170
References
transmembrane protein". Proceedings of the National Academy of Sciences of the United States of America 97 (18), 10107-10112.
Yamanaka, T., Imai, T., Satoh, R., Kawashima, A., Takahashi, M., Tomita, K., Kubota, K., Meshi, T., Naito, S. and Ishikawa, M. (2002). "Complete inhibition of tobamovirus multiplication by simultaneous mutations in two homologous host genes". J. Virol 76 (5), 2491-2497.
Yang, B., Sugio, A. and White, F.F. (2006). "Os8N3 is a host disease-susceptibility gene for bacterial blight of rice". Proceedings of the National Academy of Sciences 103 (27), 10503-10508.
Yang, X., Sun, C., Hu, Y. and Lin, Z. (2008). "Molecular cloning and characterization of a gene encoding RING zinc finger ankyrin protein from drought-tolerant Artemisia desertorum". J. Biosci 33 (1), 103-112.
Yeam, I., Cavatorta, J.R., Ripoll, D.R., Kang, B.C. and Jahn, M.M. (2007). "Functional Dissection of Naturally Occurring Amino Acid Substitutions in eIF4E That Confers Recessive Potyvirus Resistance in Plants". The Plant Cell Online 19 (9), 2913.
Yoshii, M., Nishikiori, M., Tomita, K., Yoshioka, N., Kozuka, R., Naito, S. and Ishikawa, M. (2004). "The Arabidopsis Cucumovirus Multiplication 1 and 2 Loci Encode Translation Initiation Factors 4E and 4G". Journal of Virology 78 (12), 6102.
Zeyen, R.J., Carver, T.L.W. and Lyngkjaer, M.F. (2002). "Epidermal cell papillae". The Powdery Mildews. A Comprehensive Treatise. RR Bélanger, WR Bushnell, AJ Dik, and TLW Carver, eds. American Phytopathological Society Press, St. Paul, MN, USA 107-125.
Zhu, Y., Nam, J., Carpita, N.C., Matthysse, A.G. and Gelvin, S.B. (2003a). "Agrobacterium-Mediated Root Transformation Is Inhibited by Mutation of an Arabidopsis Cellulose Synthase-Like Gene". Plant Physiology 133 (3), 1000.
Zhu, Y., Nam, J., Humara, J.M., Mysore, K.S., Lee, L.Y., Cao, H., Valentine, L., Li, J., Kaiser, A.D. and Kopecky, A.L. (2003b). "Identification of Arabidopsis rat mutants". Plant Physiol 132 (2), 494-505.
Zipfel, C. and Felix, G. (2005). "Plants and animals: a different taste for microbes?" Curr Opin Plant Biol 8 (4), 353-360.
Zipfel, C., Kunze, G., Chinchilla, D., Caniard, A., Jones, J.D.G., Boller, T. and Felix, G. (2006). "Perception of the Bacterial PAMP EF-Tu by the Receptor EFR Restricts Agrobacterium-Mediated Transformation". Cell 125 (4), 749-760.
171

172

Acknowledgements
VII Acknowledgements
Ich möchte mich bei allen herzlich bedanken, die mich während der Anfertigung dieser Doktorarbeit unterstützt haben, insbesondere bei: …Prof. Paul Schulze-Lefert für die Möglichkeit zur Promotion in seiner Abteilung und für die hilfreichen Ideen und Ratschläge während meiner Arbeit. …Prof. Dr. Martin Hülskamp für die Übernahme des Koreferats, …Prof. Dr. Ulf-Ingo Flügge für die Übernahme des Prüfungsvorsitzes und …Dr. Heiko Schoof für die Übernahme des Beisitzes. …Dr. Richard O’Connell for his supervision, motivating and helpful discussions, microscopy sessions and always and open door for questions. Thank you very much. …Dr. Jane Parker for her supervision, constructive discussions and for giving me the chance to do the PhD in her and Richard’s group. I enjoyed a lot seeing one project always from two perspectives. …Dr. Matthieu Reymond for helping me with the QTL analysis, for plenty critical discussions and for showing me aspects of Plant Biology beyond Plant Pathology. …Dr. Jagreet Kaur for teaching me the principles of mapping and Indian cooking. …den unzähligen Leuten, die mir beim Zusammenschreiben dieser Arbeit geholfen haben: Dorit, Aurélie, Ana, Matt, Matthieu, Ruben, Jochen, Katharina G., Katharina H. und viele mehr. … meinen beiden Arbeitsgruppen und der gesamten Abteilung für eine sehr angenehme Arbeitsatmosphäre. …der Lunch-Group, mit der man auch mal das Labor vergessen hat; und den vielen weiteren die immer ein offenes Ohr und viel Zeit für fachliche, aber auch andere Probleme hatten: Aurélie, Ana, Corina, Dieter, Dorit, Enrico, Jaqueline, Jagreet, Jochen, Katharina G., Katharina H., Marco und Matthieu. … meiner „Leidensgenossin“ Aurélie für tatkräftige Unterstützung inner- und außerhalb des Labors. …bei Dorit, die mir gezeigt hat, wie man es schafft. …meiner Familie, vor allem bei meinen Eltern, ohne die diese Arbeit erst gar nicht möglich gewesen wäre. …Christian für Rücksichtnahme, Unterstützung, Aufmunterung und unglaublich viel Geduld.
173

174

Erklärung
VIII Erkärung
„Ich versichere, dass ich die von mir vorgelegte Dissertation selbständig angefertigt, die
benutzten Quellen und Hilfsmittel vollständig angegeben und die Stellen der Arbeit ‐
einschließlich Tabellen, Karten und Abbildungen ‐, die anderen Werken im Wortlaut oder
dem Sinn nach entnommen sind, in jedem Einzelfall als Entlehnung kenntlich gemacht
habe; dass diese Dissertation noch keiner anderen Fakultät oder Universität zur Prüfung
vorgelegen hat; dass sie ‐ abgesehen von unten angegebenen Teilpublikationen ‐ noch
nicht veröffentlicht worden ist sowie, dass ich eine solche Veröffentlichung vor Abschluss
des Promotionsverfahrens nicht vornehmen werde. Die Bestimmungen dieser
Promotionsordnung sind mir bekannt. Die von mir vorgelegte Dissertation ist von Prof.
Dr. Paul Schulze‐Lefert betreut worden.“
Köln, im August 2008 _______________________
Doris Birker
175

176

Curriculum vitae
Doris H. Birker
Persönliche Informationen:
Geburtsdatum: 25.02.1979
Geburtsort: Mönchengladbach
Nationalität: Deutsch
Ausbildung: Seit März 2005: Promotionsarbeit am Max-Planck Institut für
Züchtungsforschung, Köln, AG Dr. J. Parker/AG Dr. R. O’Connell, Leitung Prof. Dr. P. Schulze-Lefert. Thema: “Determinants of compatibility between Arabidopsis and the hemibiotroph Colletotrichum higginsianum”
Dezember 2004: Studienabschluß als Diplombiologin and der RWTH
Aachen März-Dezember 2004: Diplomarbeit an der RWTH Aachen, Leitung Prof. Dr. A.
Slusarenko, ausgeführt im Sainsbury Laboratory, UK, Leitung Prof. Dr. J. Jones. Thema: “Structure/function analysis of Arabidopsis RPS4, a TIR-NB-LRR protein that confers AvrRps4-dependendent resistance to Pseudomonas syringae”
Oktober 2002-März 2003: Studiums-Auslandsaufenthalt am Imperial College,
London, UK (Erasmus-Stipendium) Oktober 1998-Dezember 2004: Studium der Biologie (Diplom) an der RWTH Aachen Juni 1998: Abitur an der Bischöflichen Marienschule
Mönchengladbach Köln, 18. August 2008, ________________________
177


![Dr T Malakoutian.ppt [Compatibility Mode]](https://static.fdokumen.com/doc/165x107/63364bfed2b7284203084459/dr-t-malakoutianppt-compatibility-mode.jpg)


![3 Karakteristik Sensor [Compatibility Mode]](https://static.fdokumen.com/doc/165x107/6323c3a44d8439cb620d1070/3-karakteristik-sensor-compatibility-mode.jpg)
![0. Otwarcie Konferencji_[Compatibility Mode] - DAFA](https://static.fdokumen.com/doc/165x107/6326d44d6d480576770cfa67/0-otwarcie-konferencjicompatibility-mode-dafa.jpg)


![BEE.ppt [Compatibility Mode] - Knowledge Exchange Platform](https://static.fdokumen.com/doc/165x107/631cba156c6907d368016fa0/beeppt-compatibility-mode-knowledge-exchange-platform.jpg)