Automated Vehicle Anti-Theft Security System - Department of ...
Upload
independentCategory
view
3download
0
IJREAS VOLUME 5, ISSUE 7 (July, 2015) (ISSN 2249-3905) International Journal of Research in Engineering and Applied Sciences (IMPACT FACTOR – 5.981)
International Journal of Research in Engineering & Applied Sciences Email:- [email protected], http://www.euroasiapub.org
1
Detection of Power Theft in HT Consumer Using SCADA Interfacing withGIS System
Mathankumar.S1
Loganathan.P2
Department of Electrical & Electronics Engineering,
VMKV Engineering College,
Vinayaka Missions University, Salem,
Tamilnadu, India
ABSTRACT:
The proposed solution is interface of SCADA with GIS system. The SCADA system will continuously get the real time readings of all electrical parameters at monitored points on feeders. These parameters include Voltage, Angle, Power Factor, Active Power, Reactive Power and Energy. The system shall also get the status of various switching devices like circuit breakers, switches and isolators. It will also get the transformer parameters like tap position, etc. Electronic meters will be installed at HT consumers. These meters will be equipped with the interface for communications with the SCADA system. SCADA system will becommunicating with the meters using an industry standard protocol. Meter readings shall be used to monitor the load and for detection of attempts to tamper with the meter. As soon as a tamper is detected the meter/consumer shall be tagged on the GIS system. Keywords: GIS, Electrical System, SCADA, DISCOMs, HT Network
Introduction Power is the most critical infrastructure for the progress of any country. The facilitating
policy framework, the regulatory mechanism for investment in generation, transmission, distribution and other associated activities have already been put in place by the government. The need of the hour is for efficient management and optimum utilization of installed capacity to meet the demand Sub- Transmission and Distribution systems constitute the link between electricity utilities and consumers, for extending supply and revenue realization segment. Therefore for consumers, these systems represent the face of the utility. Efficient functioning of this segment of the utility is essential to sustain the growth of power sector and the economy.
Technologicaladvancements particularly in IT are taking place much faster in generation and transmission sectors. With the radical changes that the electric utility industry is facing, customer choice has become the buzzword for the entire country. Nearly every state is implementing limited choice programs, choice pilots or at least debating choice. Sadly several power utilities are continuing with old conventional manual systems in distribution sector. The network maps are not updated, the customer data is inaccurate and the details of assets and facilities are unavailable.
Energy accounting are done manually assessment of reading in the input side and output side at different times leading to inaccurate. The planning and the design of the electrical supply system are everyday tasks for engineers in the DISCOMs. The goal of power distribution system planning is to satisfy the growing and changing system load demand during the planning period within operational constraints and with minimal costs. The planning process comprises several phases, and one of the most important is the optimization of the electric distribution network. The network optimization is considered a hard combinatorial optimization problem

IJREAS VOLUME 5, ISSUE 7 (July, 2015) (ISSN 2249-3905) International Journal of Research in Engineering and Applied Sciences (IMPACT FACTOR – 5.981)
International Journal of Research in Engineering & Applied Sciences Email:- [email protected], http://www.euroasiapub.org
2
due to a number of limitations (network voltage level, network structure, quantum and locations of loads, routes and types of feeders, voltage drops, etc.). An additional complexity is imposed by the geographically referenced data. In this process it is important to have on time accurate relevant (related) data and information on the electric distribution system and its assets, and possibly to have data from other utilities. Computerization and development of various geographic information systems have opened new horizons for all decision-making processes as well as for manipulation and dissemination of information. Identifying the individual subscribers and locations where thefts take place:
It is also possible to detect theft of energy by an individual consumer, from his bills. Whenever there is a drastic reduction in the number of units he/she consumed, from the previous bill to present bill, he/she can be tagged in the network as suspected. The tag can be removed or retained after a physical check at the consumer premises. Role of SCADA interfaced GIS system in identifying potential thefts in H.T. distributions:
The SCADA system will continuously get the real time readings of all electrical parameters at monitored points on feeders. These parameters include Voltage, Angle, Power Factor, Active Power, Reactive Power and Energy. The system shall also get the status of various switching devices like circuit breakers, switches and isolators. It will also get the transformer parameters like tap position, etc.
Fig. 1: Block diagram of SCADA interfacingwith GIS system
Use of GIS will facilitate easily updatable and accessible database to cater to the needs of
monitoring and maintaining reliable quality power supply, efficient MBC (metering, billing and collections), comprehensive energy audit, theft detection and reduction of T&D losses. All these measures will ultimately improve the overall internal efficiency of the DISCOMs and help accelerate achieving commercial viability.
A new period of higher significance has arrived for the GPS/GIS function at electric utilities. To a degree never equaled before, utility managers are looking to their GIS programs, filled with increasingly accurate data collected by GPS technology, before making decisions. With this capability comes an expectation for GIS/GPS professionals to provide levels of planning and management of their data collection process. The technology has to be imported to the working staff to understand the concept and method of capturing the data using GIS. This
GIS
SC
AD
A
BA
SE
D
ST
AT
I
ON
RT
U
OF
SC
A
DA
ME
T
ER

IJREAS VOLUME 5, ISSUE 7 (July, 2015) (ISSN 2249-3905) International Journal of Research in Engineering and Applied Sciences (IMPACT FACTOR – 5.981)
International Journal of Research in Engineering & Applied Sciences Email:- [email protected], http://www.euroasiapub.org
3
being the first step , the further implementation of the GIS system requires a dedicated team of skilled people , to effectively leverage the GIS data for Energy accounting / auditing , Network analysis , planning , outdate management , Asset management etc., The third step is to generate reports and assess the improvement reaped by the GIS based system and further enrich the same to make the power distribution industry more efficient and viable.
Network Planning GIS which is an important tool in this area is used as follows:-Geographic Information Systems is a system of mapping of complete electrical network including low voltage system and customer supply points with latitude and longitudes overload on satellite imaging and/or survey of India maps. Layers of information are contained in these map representations. The first layer corresponds to the distribution network coverage. The second layer corresponds to the land background containing roads, landmarks, buildings, rivers, railway crossings etc. The next layer could contain information on the equipment viz poles, conductors transformers etc. Most of the electrical network/equipment has a geographical location and the full benefit of any network improvement can be had only if the work is carried out in the geographical context. Business processes such as network planning, repair operations and maintenance connection and reconnection has also to be based around the network model. Even while doing something as relatively simple as adding a new service connection; it is vital to know that users of the system are not affected by this addition. GIS in conjunction with system analysis tools helps to do just this. For efficient and reliable operation of a distribution system, a reliable and well-knit communication network is required to facilitate project coordination of the maintenance and fault activities of the distribution system. GIS when integrated with real time SCADA can help in sending the right signals to the communication network. Outages can be isolated faster than even before and maintenance crews dispatched with critical information including location of the fault. GIS can be used in distribution systems management for: • Handling customer inquiries • Fault Management • Routine maintenance can be planned. • Network extensions and optimization • Network reconfiguration • Improved revenue management • SCADA can be integrated with GIS • Rights of way and compensation
GIS environment hosts a wealth of presentation techniques that enable fast and accurate
interpretation of results from power flow results to short circuit analysis.

IJREAS VOLUME 5, ISSUE 7 (July, 2015) (ISSN 2249-3905) International Journal of Research in Engineering and Applied Sciences (IMPACT FACTOR – 5.981)
International Journal of Research in Engineering & Applied Sciences Email:- [email protected], http://www.euroasiapub.org
4
Fig. 2: Interfaced GIS System
Network Analysis for technical loss reductions: Once the Electrical database of the network is imported from the GIS/AM/FM into an Electrical Engineering Analysis platform, the resulting network model can be subjected to various analysis runs for carrying out studies that will be of interest to a distribution engineer. These will include the following but not limited to,
• Modeling Load for different consumer categories.
• Modeling unbalanced Load.
• Voltage drop/ Load flow Analysis.
• Fault current & Fault flow analysis.
• Automatic capacitor Placement.
• Load Balancing
• Contingency analysis etc.,
Fig. 3: Typical capacitor placement in representative network
Real time and historical demand and energy data at source and also at consumer end
are enabled in GIS based data to simulate the network loading conditions. The source for the historical data will usually be the log registers maintained at the distribution sub-stations. Some data augmentation are be done by installing logging type DLMS meters at strategic points in the network and transmitting the data to Data Centre [8].
In the short term, the results of the analysis would be used for estimation of base level
technical losses, and for segregating the total unaccounted losses of the system, available from
Real Time data
Call
Centre Billing
Offline data G
I
S
DA
TA
ACQUI
SI
TI
ON
IN
TEGRA
TI
ON
BUS
Base Line
Data
Acquisition /
AMR/Data
loggers
SCADA
GPS
Based
Sensors
Load
Centre
Data
Inventory
IJREAS VOLUME 5, ISSUE 7 (July, 2015) (ISSN 2249-3905) International Journal of Research in Engineering and Applied Sciences (IMPACT FACTOR – 5.981)
International Journal of Research in Engineering & Applied Sciences Email:- [email protected], http://www.euroasiapub.org
5
the energy balance into technical losses and the non-technical i.e. commercial losses (occurring mainly due to faulty /tampered metered supplies, due to the illegal connections, due to power delivery at flat rate to the subsidized category of consumers). Besides, extrapolation of the results of the analysis of a sample low voltage (0.4 kV) network for the complete low voltage network will also be done. The technical power loss reduction will be accomplished by the following measures:
• Network reconfiguration including installation of new Primary and secondary sub-stations/up-gradation of existing sub-stations
• New distribution transformer sub-stations/up-gradation of distribution sub-stations. • Re-conductoring • Capacitor placement • Load balancing in the three-phase system • Refurbishment/replacement of old and obsolete equipment.
The measures will follow certain system design philosophy that would be decided in
consultation with the customer e.g., priority levels of consumer in terms of service availability, requirement of short-circuit levels, level of redundancy required etc. The system improvement measures will be applied to meet the specified common requirements, which would generally be followed viz., loading limits of conductors and transformers, supply voltage variations within the limits specified by the Indian Electricity rules, targets for economic loss levels as per CEA norms etc.
In the long-term, due to the need to identify and predict the customer demands that will
decide the system loading conditions prevailing in future, use of other techniques like the trend analysis of load growth and load forecasting will be required. The process of load forecasting based on the trend analysis of past load growth, though complex, is invaluable in optimizing the planning approach for the network expansion on a long-term basis. As stated above, having a geographical reference for the network will provide necessary information on land use pattern for planning optimum expansion of network and for setting up of new facilities. The spatial load forecast method, which divides the total area into number of small areas, with the specific growth rates and the load characteristics applied to each small area, is the ideal method for optimal planning of the distribution system of the area. For optimal location of new sub-stations and augmentation of the existing facilities, several alternatives, subject to their meeting the agreed planning criteria, will be evaluated on basis of the capital cost of equipment and work and net worth present worth of the energy losses over the total horizon period. The plan objective will be the minimization of losses while maximizing the net benefit i.e., the present worth of loss reduction less the annual cost of capital investment. The cost estimates will be based on the prevailing market rates for each item of equipment and work.
The load flow analysis study would provide a graphical display of the results of the network strengthening measures described above in meeting the specified requirements, as well as the losses for the various alternatives. The user can take decision, looking at the graphical display provided by the analysis software, for utilizing the different network strengthening measures at his disposal, available as ‘edit’, ‘network sketching’ and specific ‘network optimization’ features in the software.
Analytical functions and optimizations
The load flow (power flow) is the most basic of all analytical calculations performed on an electric distribution network. The load flow provides a snapshot of a network operating state. Given a set of loads, the load flow calculation determines voltage at all points of a network and current, power and loss for each branch in the network. In GIS based analysis instances of high or low voltage and/or equipment overloading can be readily determined from load flow results, as can losses in the network.

IJREAS VOLUME 5, ISSUE 7 (July, 2015) (ISSN 2249-3905) International Journal of Research in Engineering and Applied Sciences (IMPACT FACTOR – 5.981)
International Journal of Research in Engineering & Applied Sciences Email:- [email protected], http://www.euroasiapub.org
6
A state-of-the-art load flow algorithm must accommodate a variety of load types including constant power, constant current and constant impedance loads in addition to induction and synchronous machines. The ability to handle looped, or even meshed, networks is important since sub transmission (looped) and/or urban secondary systems (meshed) are often modeled. While distribution networks are typically operated in a radial configuration with a single source of power at the substation, the ability to include multiple sources is important as distributed generation plays an ever-increasing role in the distribution system. Finally, the load flow algorithm must faithfully handle unbalanced systems, that is, unbalanced loads, unbalanced topology, and unbalanced devices such as open-delta auto regulators.
An additional set of analysis functions with geographical data deals with various optimizations of the network. Most of the optimization functions in turn make use of the load flow algorithm. Optimizations include:
• How best to operate transformers, regulators and capacitors • Where best to install new capacitors • Where best to install new regulators • How best to configure or reconfigure the network
Voltage: Its must be maintained within limits, usually within five percent of nominal. Regardless of how uniform the voltage at the source (substation) may be throughout the day, the voltage at any point in the feeder will change as load on the feeder increases and decreases from hour to hour. Voltage drop from the substation usually increases as feeder loading increases. Usually there is little information about the loads on a feeder. The magnitude of demand under high and low load scenarios must be estimated from measurement made at the substation. Once loads are determined, voltage regulators, and sometimes capacitors, are applied to correct voltage that has drifted too far from nominal. Capacitor Placement: The capacitor placement engine is used to find the best sites in a network to place capacitors. Here "best" refers to the locations with the highest financial return considering the initial cost of the capacitor, annual maintenance cost of the capacitor, and cost of real and reactive power losses. Several load levels can be considered at the same time. Result of the optimization is the set of locations where capacitors should be placed; which capacitor(s) should be placed at each site; and whether or not a switched capacitor is needed at the site because of voltage constraints. Where switched capacitors are required, a switching schedule is produced. Loss, cost of loss, and information that quantifies financial return is also calculated. Regulator Placement: The regulator placement engine is used to find the best sites in a radial network to place voltage regulators. Regulators are sometimes used to maintain voltage within acceptable limits. In addition to finding sites for new regulators, the regulator placement engine can find better sites for existing regulators. Several load levels can be considered at the same time. Result of the optimization is the set of locations where regulators should be placed; regulator size; and whether or not automatic tap control is needed. Outage management: In a GIS based network the failed Transformer and the area of outage are instantaneously
indicated in the computer screen with a popup message. The geo data base gives a visualized representation of outage area and number of consumers
affected. When a particular feeder breaks down, the geo base system prompts, recoloring of the feeder
alerting the operator as well as sending SMS to the filled engineers in charge of the feeder. The data is simultaneously transferred to the outage staffs from the data centre. The possible back feeding arrangements, alternate feedings are notified.

IJREAS VOLUME 5, ISSUE 7 (July, 2015) (ISSN 2249-3905) International Journal of Research in Engineering and Applied Sciences (IMPACT FACTOR – 5.981)
International Journal of Research in Engineering & Applied Sciences Email:- [email protected], http://www.euroasiapub.org
7
Normalization of outage area, rectification of fault etc., are updated in the GIS based module and report generated.
Individual FOC from the customers are received at customer care centre. At the same moment the call is landed in the staff concerned of the area. The staffs are expected to attend the call and report to the centre within a stipulated time to close the call. Such automated system reduces the outage system and enhances consumers satisfaction.
GIS Based Consumer Indexing -- Database for Electric Network: i. The database of the Network should be made in suitable software so that the changes in the
network can be updated and queries may be used to find out the Network details, like the details of the equipment at the substations, the length of lines, number of transformers and breakers etc. in any part of the Network.
ii. The same should be possible to update and maintain on periodic basis iii. The following data in respect of 33/11 kV SS equipment installed on the substations, 33kV
Lines, 11kV Feeders, 11/0.4 kV Distribution Transformers and consumers of all categories is to be collected and documented in the Database.
Data of 33 kV Feeder • Name of the feeder • Code No. of the feeder • Name of the feeding EHT SS • Length of the line • Details of meter installed at EHT SS: Type /Make /S. No /Multiplying factor
Data of 33kV/11 KV SS • Name of the Division • Name of the Sub Division • Name of the Section • Name of the Substation • Code No. of the Substation • Capacity of the substation with particulars of Power transformers (No. Of Power
transformers installed, capacity and voltage ratio wise) • Name of the feeding primary EHT substation • Name and length of 33kV Line feeding the substation from the primary substation
Date of commissioning of substation • Total No. Of 33 KV or 11 KV Circuit Breakers installed • Incoming (33 KV) -- Nos. • LV control (11 KV) -- Nos. • Feeders (11 KV) -- Nos. • Total No. of feeders connected
Data of each Power Transformer in the Substation • Maker’s Sl. No of the transformer • Make of the transformer • Capacity • Date of commissioning • Voltage ratio • Current rating • No. of Taps on the transformer • % Impedance • Date of last overhaul

IJREAS VOLUME 5, ISSUE 7 (July, 2015) (ISSN 2249-3905) International Journal of Research in Engineering and Applied Sciences (IMPACT FACTOR – 5.981)
International Journal of Research in Engineering & Applied Sciences Email:- [email protected], http://www.euroasiapub.org
8
Data of 33 KV and 11 KV Circuit Breakers in the substation • Details of each Circuit Breaker • Make of the Circuit Breaker • Maker’s Sl. No • Name of the connected 33 KV or 11 kV feeder • Code of the feeder • Date of commissioning • Current rating • Rupturing capacity • Maximum load recorded with date and year
Data of 33 KV and 11 KV Circuit Breakers in the substation
• Type of protection provided • Details of relay installed • Details of C.T installed: Make /C.T Ratio Available /Connected CT. Ratio /Class of Accuracy
/V.A. Burden Data of 33 KV and 11 KV Circuit Breakers in the substation • Details of P.T installed • Make of P.T. • Voltage Ratio • V.A. Burden • Details of meter installed: Type / Make /Sl. No. /Multiplying factor • Availability of data logging facility
Data of each consumer connected at 33 KV or 11kV
• Sl. No. • Name of 11kV feeder and code • Pole No • Name and Address of the consumer • S.C. No • Contracted Load
Replacement of Asset • Replacement of an asset may become necessary when the asset become sick or taken out for
any purpose like refurbishment, repairs, enhancement etc. • GIS should facilitate history of replacements at a given location. • Replaced assets should be traced in its new position. • History of repairs and replacement with expenditure so far incurred in an individual asset
with its life cycle should be available.
GIS based Asset management should provide a systematic process of cost-effectively, operating, maintaining and upgrading of electrical assets by combining engineering practices and economic analysis.GIS based Asset management should build a timely response mechanism on the visual platform providing for an uninterrupted and reliable supply.Using the attributes of the asset, the cost factor, and discounting for age using depreciation factor, financial reports should be produced for validation.
Energy Accounting and Auditing: The GIS based energy accounting system mandated AMR (Automated Meter Reading) meter with DLMS (Device Language Massage Specification) protocol to install in every feeders, Distribution Transformers, and consumer services. The meter data from the feeder (Input

IJREAS VOLUME 5, ISSUE 7 (July, 2015) (ISSN 2249-3905) International Journal of Research in Engineering and Applied Sciences (IMPACT FACTOR – 5.981)
International Journal of Research in Engineering & Applied Sciences Email:- [email protected], http://www.euroasiapub.org
9
energy), Distribution meters (Intermediate point between HT feeder and LT feeders) and consumer services (output energy) are digitally transmitted to the data centre through Modem / Antenna / GPRS network. The data centre located at Head Quarters of the power utility received the data transmitted from the feeder, Distribution Transformers and consumer services, through a MDAS software (Meter Data Acquisition System) installed in the Main server. The MDAS server which received the above real time input and output data of a feeder calculate the AT&C loss of the feeder and generates report automatically. The MDAS server also generates AT&C loss report Distribution Transformer wise by comparing the input energy to the particular transformer and the total energy consumed by the all consumers fed by the said transformer. The GIS software and MDAS software are integrated to enable the MDAS software to identify the feeder wise DTs and DT wise services connections. As the whole process are system automated without human intervention and the data recorded , transmitted and collected are on real time basis , all kinds of in accuracies , lapses , malfunctions that are inherent in the conventional manual method is completely eliminated. From the above GIS based , technically assisted , energy accounting system , we can perform energy audit by analyzing the losses feeder wise and DT wise , service wise and pin pointedly identify the loss pockets that may be due to either system constraints on power pilferage. • Estimate the total energy losses from the above. Segregate the technical and commercial losses
by computing the technical losses from the results of the network analysis. Once feeder-wise energy losses are established, feeders having high-energy losses should be further investigated for localizing pockets of high-energy losses by installing energy meters after distribution transformers.
• After performing spatial analysis of the commercial losses to identify high loss areas or consumer category responsible for the loss, implement appropriate energy metering and billing in these areas. In some cases, use of certain technological measures like aerial bunched cables LT lines in theft prone areas and conversion of LT into HT lines i.e. less LT are suggested for reduction of the commercial losses.
• Computerized billing of energy sales in a pilot area could be taken up to investigate the scope of loss reduction. o Simultaneously to the above, prepare a plan for liquidation of revenue arrears from the
data/information collected during the energy audit and study of the Billed-energy data and the accounting information. The existing billing and revenue realization system should be also evaluated for improvement of revenue collection efficiency. Implementation of on-line payment system in a pilot area in the short term could pave the way for offering the system to a larger number of consumers.
The medium and long-term plan would introduce higher levels of automation and remote-monitoring systems, as by then the utility could have started benefiting from the short-term plans in controlling the energy losses and increasing revenues. Gradual introduction of electronic energy meters to replace the outdated electro-mechanical energy meters will be inevitable as then it would permit monitoring. Installation of Computerized customer billing, payment collection, customer complaint registering system and continuous loss monitoring are the key to efficient and financially strong utility.
The above approach is by no means sufficient to eliminate the commercial losses totally [11]. As long as the energy consumed is not being charged to the consumer in accordance with the actual cost of energy being delivered the losses will remain. Issues of tariff cross-subsidization and rationalization of the tariff, legislative and legal issues and issues relating to the surveillance and vigilance for revenue protection still remain inadequately addressed.The distribution system accounts for highest technical and non-technical losses in the power sector. The endeavour of a power distribution utility should be to reduce revenue leakages by

IJREAS VOLUME 5, ISSUE 7 (July, 2015) (ISSN 2249-3905) International Journal of Research in Engineering and Applied Sciences (IMPACT FACTOR – 5.981)
International Journal of Research in Engineering & Applied Sciences Email:- [email protected], http://www.euroasiapub.org
10
eliminating causes of non-technical losses and by minimizing Aggregate Technical and Commercial (AT&C) Losses.
Hardware—GIS Infrastructure Hardware is really a simplistic term used to describe the technology infrastructure
needed to support your GIS implementation. The infrastructure developed depends on the system requirements determined as needed during that phase of implementation planning. Using Web services for GIS needs minimal investment for infrastructure, while an enterprise GIS implementation requires careful planning and a fairly significant investment for computerization, networking, database connectivity etc.,
Fig. 4: Block diagram of GIS in DISCOM
Every DISCOM has to aim at the application of GIS for load research, where the GIS can assist in determining the sample Selection and in refining load shapes by associating customers with other demographic characteristics that would include assessed value of homes, building footprint, heating type and weather patterns. In the Boston area, for example, during a typical summer day, temperatures can vary 15 degrees depending on the distance from the ocean. Wind speeds in the downtown area are different than those in the suburbs. Because GIS can plot temperature and wind speed gradients geographically for each hour, it is possible to enhance load shapes by analyzing the data spatially. Even with load profiling, it would seem likely that automated meter reading (AMR) systems will continue to penetrate the market, encouraging the industry to adopt GIS to build out and manage the AMR and associated communications infrastructure
The most common problem about having multiple systems in any organization is duplication of data and the updation philosophy necessary to keep the data updated. It is the primary requirement of the utility that all systems work in an integrated manner. For this purpose it is required that GIS system be integrated with SCADA system. SCADA system would export required data like the equipment status, the topology of data to all other system like GIS and customer care system. Similarly billing system would act as the main database for consumer addition. GIS system would automatically update the consumer data based on some triggers in the billing database.
The customer care system would analyze the feasibility of the new connection based on
location data and availability of poles and DTs from the GIS and then analyze the present capacity before determining the feasibility of the same. Besides it would also get the latest status data from the SCADA system thus helping in customer resolution for outage management
GIS
SCADA
Customer
Care
Billing
System
Equipment Status,
Topology
Existing Consumer
connection number, Trigger
new consumer addition
Consumer location
details and address,
nearest poles and DT
with capacity
Location data of consumer
Consumer
connection
number
Equipment Status, Outage information
IJREAS VOLUME 5, ISSUE 7 (July, 2015) (ISSN 2249-3905) International Journal of Research in Engineering and Applied Sciences (IMPACT FACTOR – 5.981)
International Journal of Research in Engineering & Applied Sciences Email:- [email protected], http://www.euroasiapub.org
11
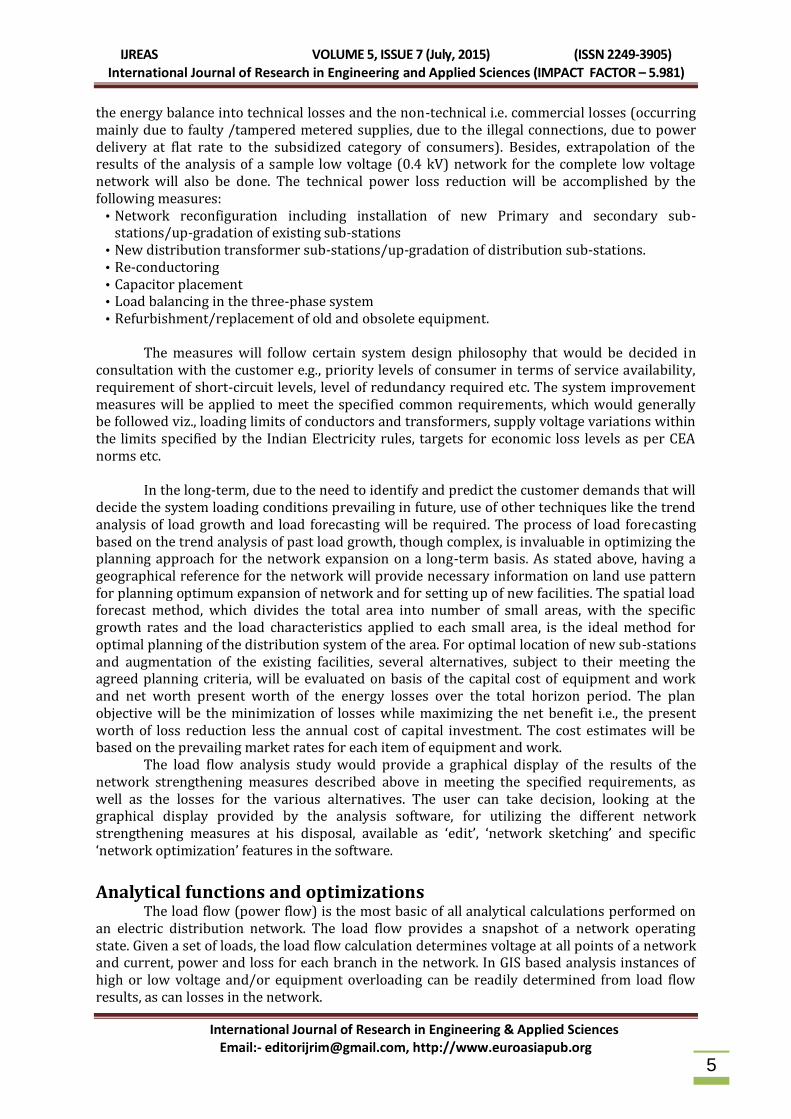
Integration of GIS with SCADA, Trouble Call Management, MBC (Metering, Billing & Collections) etc., to serve as an effective tool towards improving internal efficiency of DISCOMs and to earn total consumer satisfaction sample figure on the electrical utility network formed in Quantum- GIS is provided below
Fig. 5: GIS Mapped HT Network
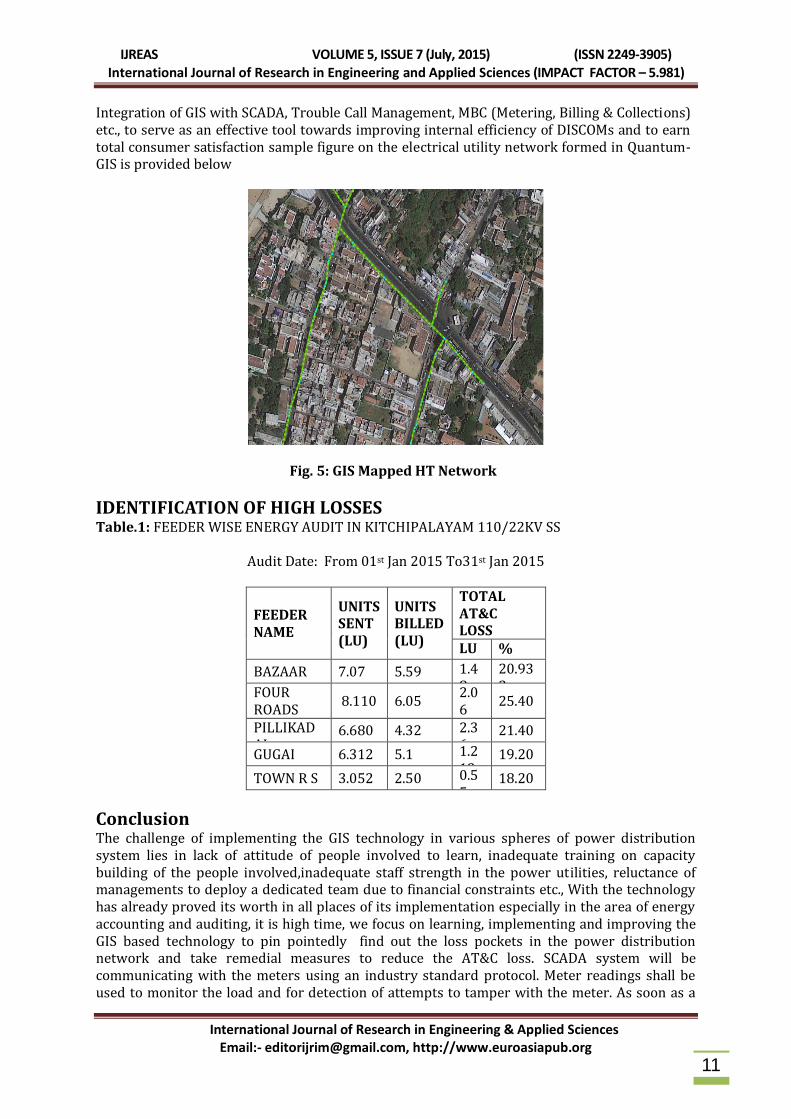
IDENTIFICATION OF HIGH LOSSES Table.1: FEEDER WISE ENERGY AUDIT IN KITCHIPALAYAM 110/22KV SS
Audit Date: From 01st Jan 2015 To31st Jan 2015
FEEDER NAME
UNITS SENT (LU)
UNITS BILLED (LU)
TOTAL AT&C LOSS LU %
BAZAAR 7.07 5.59 1.48
20.933 FOUR
ROADS 8.110 6.05
2.06
25.40
PILLIKADAI
6.680 4.32 2.36
21.40
GUGAI 6.312 5.1 1.212
19.20
TOWN R S 3.052 2.50 0.55
18.20
Conclusion The challenge of implementing the GIS technology in various spheres of power distribution system lies in lack of attitude of people involved to learn, inadequate training on capacity building of the people involved,inadequate staff strength in the power utilities, reluctance of managements to deploy a dedicated team due to financial constraints etc., With the technology has already proved its worth in all places of its implementation especially in the area of energy accounting and auditing, it is high time, we focus on learning, implementing and improving the GIS based technology to pin pointedly find out the loss pockets in the power distribution network and take remedial measures to reduce the AT&C loss. SCADA system will be communicating with the meters using an industry standard protocol. Meter readings shall be used to monitor the load and for detection of attempts to tamper with the meter. As soon as a

IJREAS VOLUME 5, ISSUE 7 (July, 2015) (ISSN 2249-3905) International Journal of Research in Engineering and Applied Sciences (IMPACT FACTOR – 5.981)
International Journal of Research in Engineering & Applied Sciences Email:- [email protected], http://www.euroasiapub.org
12
tamper is detected the meter/consumer shall be tagged on the GIS system. The information shall be passed on to the vigilance groups for physical check, to take further action.
References 1. Skrlec, D., et al., 1994. Application of GIS Technology in Electrical Distribution Network
Optimization. Proceedings, Fifth European Conference and Exhibition on Geographical Information Systems (EGIS/MARI '94), Paris, France.
2. Steede-Terry K,. 2000. Integrating GIS and the Global Positioning System. ESRI, Redlands, CA.
3. Strickland T, 2001. AM/FM v. GIS: Which is Right for You? Byers Engineering Company (online white paper).
4. Gipson T, 1998. Integrated AM/FM and GIS for an Electric Distribution System. Proceedings, 1998 ESRI International User Conference, San Diego, CA.
5. Goodchild M F, 1997. Unit 002 - What is Geographic Information Science?, National Center for Geographic Information and Analysis (NCGIA) Core Curriculum in GIScience (online resource). Accessed On: August 18, 2001.
6. Harder C, 1999. Enterprise GIS for Energy Companies. ESRI Press, Redlands, CA.
7. Monemi, S., et al., 2000. An Outage Restoration Management System for Power Distribution Network. Proceedings, 2000 ESRI International User Conference.
8. Pearson, M. and P. Johnson, 1995. Real Time Electrical Outage Management with ARC/INFO: An Incremental Victory. Proceedings, 1995 ESRI International User Conference, Palm Springs, CA.
9. Allen, E. and R. Goers, 2002. Beyond Maps: The Next Generation of GIS. Planning, 68(9): pp: 26-29.
10. M. Kashem, G. Jasmon, A. Mohamed and M. Moghavvemi, 1998. Artificial Neural Network Approach to Network Reconfiguration for Loss Minimization in Distribution Networks, Electrical Power and Energy Systems, 20(4), pp: 247-258.
11. R. Reta, A. Vargas, 2001. Electricity Tracing and Loss Allocation Methods Based on Electric Concepts, lEEEProceeding -Generation Transmission and Distribution, 148(6).
Copyright © 2022 FDOKUMEN