Seasonal and interannual variability of currents and temperature off central Chile
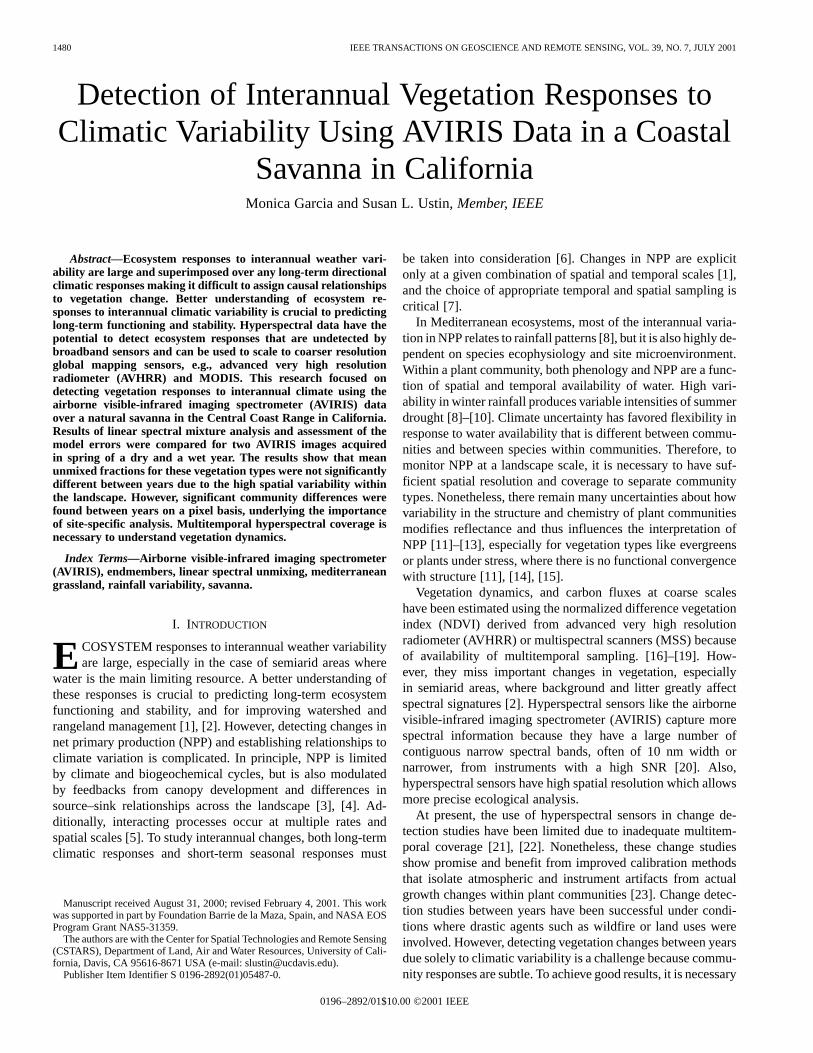
1480 IEEE TRANSACTIONS ON GEOSCIENCE AND REMOTE SENSING, VOL. 39, NO. 7, JULY 2001
Detection of Interannual Vegetation Responses toClimatic Variability Using AVIRIS Data in a Coastal
Savanna in CaliforniaMonica Garcia and Susan L. Ustin, Member, IEEE
Abstract—Ecosystem responses to interannual weather vari-ability are large and superimposed over any long-term directionalclimatic responses making it difficult to assign causal relationshipsto vegetation change. Better understanding of ecosystem re-sponses to interannual climatic variability is crucial to predictinglong-term functioning and stability. Hyperspectral data have thepotential to detect ecosystem responses that are undetected bybroadband sensors and can be used to scale to coarser resolutionglobal mapping sensors, e.g., advanced very high resolutionradiometer (AVHRR) and MODIS. This research focused ondetecting vegetation responses to interannual climate using theairborne visible-infrared imaging spectrometer (AVIRIS) dataover a natural savanna in the Central Coast Range in California.Results of linear spectral mixture analysis and assessment of themodel errors were compared for two AVIRIS images acquiredin spring of a dry and a wet year. The results show that meanunmixed fractions for these vegetation types were not significantlydifferent between years due to the high spatial variability withinthe landscape. However, significant community differences werefound between years on a pixel basis, underlying the importanceof site-specific analysis. Multitemporal hyperspectral coverage isnecessary to understand vegetation dynamics.
Index Terms—Airborne visible-infrared imaging spectrometer(AVIRIS), endmembers, linear spectral unmixing, mediterraneangrassland, rainfall variability, savanna.
I. INTRODUCTION
ECOSYSTEM responses to interannual weather variabilityare large, especially in the case of semiarid areas where
water is the main limiting resource. A better understanding ofthese responses is crucial to predicting long-term ecosystemfunctioning and stability, and for improving watershed andrangeland management [1], [2]. However, detecting changes innet primary production (NPP) and establishing relationships toclimate variation is complicated. In principle, NPP is limitedby climate and biogeochemical cycles, but is also modulatedby feedbacks from canopy development and differences insource–sink relationships across the landscape [3], [4]. Ad-ditionally, interacting processes occur at multiple rates andspatial scales [5]. To study interannual changes, both long-termclimatic responses and short-term seasonal responses must
Manuscript received August 31, 2000; revised February 4, 2001. This workwas supported in part by Foundation Barrie de la Maza, Spain, and NASA EOSProgram Grant NAS5-31359.
The authors are with the Center for Spatial Technologies and Remote Sensing(CSTARS), Department of Land, Air and Water Resources, University of Cali-fornia, Davis, CA 95616-8671 USA (e-mail: [email protected]).
Publisher Item Identifier S 0196-2892(01)05487-0.
be taken into consideration [6]. Changes in NPP are explicitonly at a given combination of spatial and temporal scales [1],and the choice of appropriate temporal and spatial sampling iscritical [7].
In Mediterranean ecosystems, most of the interannual varia-tion in NPP relates to rainfall patterns [8], but it is also highly de-pendent on species ecophysiology and site microenvironment.Within a plant community, both phenology and NPP are a func-tion of spatial and temporal availability of water. High vari-ability in winter rainfall produces variable intensities of summerdrought [8]–[10]. Climate uncertainty has favored flexibility inresponse to water availability that is different between commu-nities and between species within communities. Therefore, tomonitor NPP at a landscape scale, it is necessary to have suf-ficient spatial resolution and coverage to separate communitytypes. Nonetheless, there remain many uncertainties about howvariability in the structure and chemistry of plant communitiesmodifies reflectance and thus influences the interpretation ofNPP [11]–[13], especially for vegetation types like evergreensor plants under stress, where there is no functional convergencewith structure [11], [14], [15].
Vegetation dynamics, and carbon fluxes at coarse scaleshave been estimated using the normalized difference vegetationindex (NDVI) derived from advanced very high resolutionradiometer (AVHRR) or multispectral scanners (MSS) becauseof availability of multitemporal sampling. [16]–[19]. How-ever, they miss important changes in vegetation, especiallyin semiarid areas, where background and litter greatly affectspectral signatures [2]. Hyperspectral sensors like the airbornevisible-infrared imaging spectrometer (AVIRIS) capture morespectral information because they have a large number ofcontiguous narrow spectral bands, often of 10 nm width ornarrower, from instruments with a high SNR [20]. Also,hyperspectral sensors have high spatial resolution which allowsmore precise ecological analysis.
At present, the use of hyperspectral sensors in change de-tection studies have been limited due to inadequate multitem-poral coverage [21], [22]. Nonetheless, these change studiesshow promise and benefit from improved calibration methodsthat isolate atmospheric and instrument artifacts from actualgrowth changes within plant communities [23]. Change detec-tion studies between years have been successful under condi-tions where drastic agents such as wildfire or land uses wereinvolved. However, detecting vegetation changes between yearsdue solely to climatic variability is a challenge because commu-nity responses are subtle. To achieve good results, it is necessary
0196–2892/01$10.00 ©2001 IEEE

GARCIA AND USTIN: DETECTION OF INTERANNUAL VEGETATION RESPONSES 1481
to minimize all sources of reflectance variability other than veg-etation, such as misregistration, atmospheric calibration, illumi-nation, detectors, sun angles, and plant phenological differences[24], [25].
The purpose of this research was to identify interannual-termresponses in NPP due to climate variability, observed duringthe period of peak spring growth, using hyperspectral data fromAVIRIS collected over a natural savanna in California. Hyper-spectral data have potential to improve NPP estimates by im-proving the accuracy of leaf area index measurements, better es-timates of turnover of foliage and woody stems, and estimates ofplant stresses that reduce GPP below maximum values. At thistime, phenological differences between plant communities areminimal and differentatiation is least distinct. The study com-pares a strong wet El Niño year and a dry (below normal precip-itation) year at the end of a weak cold El Niño Southern Oscilla-tion (ENSO) event (La Niña) (http://www.cpc.ncep.noaa.gov).The years differ in the magnitude and distribution of rainfallover the year. The study site is Stanford University’s JasperRidge Biological Preserve (JRBP), Palo Alto, CA, in the cen-tral California Coast Range. There is a long history of ecolog-ical and remote sensing research at this site with higher tem-poral coverage of AVIRIS imagery than for any other place [22].The JRBP has significant biodiversity over a relatively small ex-tent (482 ha). Hyperspectral data has been shown to correlatewith vegetation structure at JRBP and in other semi-arid areas[26]–[28] and is assumed to be a measure of net ecosystem pro-duction (NEP) occurring over the landscape [29]–[32]. Modelapproaches have used vegetation indices and spectral mixtureanalysis (SMA).
In late spring, all vegetation types are at or near the peak oftheir annual productivity and spectral differences between vege-tation types are less than other seasons when deciduous trees andgrasses are dormant. SMA [34] has been one of the most suc-cessful techniques to quantify vegetation abundance and showseasonal trends consistent with field data [22], [28], [30], [31].The types of canopy changes that can be detected in the springare related to NPP and the abundance of plant litter and stems,i.e., the nonphotosynthetic components of plant canopies. Be-cause measurements of green foliage or biomass in late springare at or near the peak of the phenological cycle they should becorrelated with NPP. Spring measurements have greater func-tional convergence between biomass and carbon fixation forall vegetation types including evergreen trees [35], therefore,linking structure and function becomes more direct than at othertimes of the year.
II. DESCRIPTION OFDATA
A. JRBP Study Site
JRBP is located in the eastern foothills of the Santa Cruzmountains, at 37 24’N latitude and 122 13’30”W longitude. Avegetation map was available, which was produced from aerialphotographs and field observations by Chiarello (1989) [36].The 500 ha of JRBP are composed of five main vegetation types:evergreen forest, deciduous forest, chaparral shrublands, herba-ceous perennial wetlands, and annual grasslands. Topographyand soil patterns create relatively high spatial heterogeneity
(http://jasper1.stanford.edu) [22], [35]. The serpentine soils (15ha) support endemic grasses and forbs tolerant to low calciumsoils that have lower growth potential than grasses growingon the greenstone Franciscan soil. The greenstone grasses aremainly introduced European annuals which support less biodi-versity than serpentine grasslands. The mixed evergreen forestis composed of 150 ha of California bay, live oak, madrone,and some stands of redwood and Douglas fir. There are 15 ha ofblue oak savanna, which is considered winter-deciduous exceptin extremely dry years when it is drought-deciduous [37], and140 ha of chaparral communities composed of several types ofshrubs. The remaining 150 ha include the lake, wetland, andriparian corridors (http://jasper1.stanford.edu).
B. AVIRIS Data
Two AVIRIS images of JRBP were acquired on May 3,1996, and April 29, 1998, following northeast and northwestflight lines, respectively (Figs. 1 and 2). Datasets had a nominalground resolution of 20 m, spectral resolution of 10 nm, and16-bit radiometric resolution. The choice of these images wasdriven by the significant difference in rainfall between the twoyears and the similar dates of the images. The 1995/1996 and1997/1998 spring climates were within a weak “La Niña” anda strong “El Niño” event, respectively, which in California areexpressed as dry and wet years. In the 1995/1996 season, totalrainfall was 794 mm and in the 1997/1998 season it was 1333mm.
Percent surface reflectance was calculated using a modifiedMODTRAN model [23], [38] using standard atmospheric con-ditions. To ensure that reflectance levels were equivalent, theimages were radiometrically aligned to an April 1997 JasperRidge image by regression using pseudo-invariant features (PIF)corresponding to road pixels. The 1997 image was aligned withfield spectra obtained that year (D. Roberts, personal commu-nication). It is remarkable that SNR levels improved in 1998 byalmost a factor of two in most spectral regions due to improve-ments in the AVIRIS spectrometers. Thus, in 1998, the highestS/N levels calculated for a 50% reflectance target at sea leveland 23.5 zenith angle corresponds in the A spectrometer (0.7
m) to levels of 1000:1, and the lowest were measured in theSWIR region (2.2 m) with maximum levels of 400:1 [23].
C. Georeferencing
A digital orthophoto quad (DOQ) from United States Geo-logical Survey (USGS) corresponding to Palo Alto South West(PASW) quadrangle in UTM coordinates with 1 m pixel resolu-tion was used to georeference the 1998 scene using 43 points.The root mean square error (RMSE) using a first-order polyno-mial warp was less than 0.05 pixels or 1 m. The study area of 500ha is without large topographic gradients therefore, using a poly-nomial function was appropriate. The 1996 image was coregis-tered to the 1998 image to ensure that registration for changedetection was accurate. The error was less than 0.4 pixels or 8m, also using a first-order degree polynomial and 44 points. Inorder to avoid spectral resampling after warping, the derived im-ages were warped instead of the original spectral bands. How-ever, in some areas of the scene, it was necessary to use the vege-

1482 IEEE TRANSACTIONS ON GEOSCIENCE AND REMOTE SENSING, VOL. 39, NO. 7, JULY 2001
Fig. 1. True color composite in RGB from May, 3 1996, AVIRIS reflectanceimage of Jasper Ridge Biological Preserve, delineated by white line.
Fig. 2. True color composite in RGB from April 29, 1998, AVIRIS reflectanceimage in Jasper Ridge Biological Preserve, delineated white line.
tation map and apply a different endmember set and in this case,all spectral bands were warped.
III. M ETHODS
The method used to detect and quantify changes betweenyears was linear SMA [34]. The advantages of using linearspectral unmixing from hyperspectral data apply especially tosemi-arid areas where green cover is low and soil and litter
greatly affect pixel reflectance [2], [11], [28]. In these, theproblem of nonlinear mixing is secondary as the thick leaves ofxerophytic vegetation and sparse canopy cover decrease mul-tiple scattering of photons [39]. In fact, linear SMA has beenwidely used for hyperspectral and TM data at Jasper Ridge andother semi-arid sites with even lower primary productivity. Inthose studies, characterization and quantification of vegetationstructure and functioning using unmixing was consistent withthe ecological trends and field measurements [2], [14], [24],[39], [42]. The SMA equations are solved through linear leastsquares fitting. The maximum RMSE between the observedand the predicted image reflectance is minimized. Negativefractions are an indication that the endmember selection wasnot appropriate. RMSE is a measure of the amount of spectralreflectance not accounted by the model, and therefore can beused to estimate the goodness of fit in the model, which shouldbe at a level similar to instrument noise [2].
A. Endmember Selection
Finding appropriate endmembers is a critical step and spectraof various plant canopies, litter, shadow, and soil were used [15],[27], [41], [43]. A unique solution may not be best, particularlyfor extending a model to a wider region, and a subjective deci-sion must be made based on the purpose of the research and theoutputs of the SMA process. High RMSE or high band resid-uals and negative or unrealistic fractions indicate a bad fitof the model and reveals inappropriate endmember selections[41]. Basically, there are two ways to select endmembers: ref-erence endmembers in spectral libraries come from field datathat are used to represent landscape components, and imageendmembers, which represent “pure” pixels in the image. Oneof the main difficulties in the first method is that the librarymight not match the phenology at the time of the image, or thatthere is miscalibration between field spectra and image spectra,or because it is complicated to decide which endmembers arethe most “representative.” In contrast, image endmembers mayclosely match pixel spectra in the image but may be mixturesthemselves and make identification of the materials uncertain.Both methods share calibration requirements, which is essentialfor atmospheric retrieval and extension of the methods to othersites [24], [35], [44].
A hybrid method combining automatic and supervised end-member selections was performed on the 1998 image followingmethodology proposed by Boardman in 1993 [44]. Water vaporbands and noisy bands were removed to reduce noise and datadimensionality. The minimum noise fraction (MNF) algorithmwas applied to the reflectance image and the pixel purity index(PPI), as implemented in the Environmental Visualizing Imagessoftware package (RSI, Boulder, CO) was calculated in regionsof interest at Jasper Ridge (selected following decreasing vari-ance) within MNF dimensional space. The minimum noise frac-tion transform is essentially two cascaded principal componentstransformations that first computes the estimated noise covari-ance matrix to decorrelate and rescale the noise in the data andthen performs a standard principal components transform of thenoise-whitened data. PPI is a search routine for the most spec-trally pure (extreme) pixels (i.e., candidate endmembers) in theimage. The pixels with the highest PPI values were selected, as

GARCIA AND USTIN: DETECTION OF INTERANNUAL VEGETATION RESPONSES 1483
they are linearly independent in most dimensions. The same pro-cedure was followed on the 1996 image. Endmembers used inthe SMA came from the 1998 image as vegetation was greenerand because signal-to-noise levels were improved with respectto 1996.
B. Error Analysis
Accurate change detection requires minimizing other sourcesof reflectance variation between dates [24], [25]. One source oferror is misregistration between images, but differences in phe-nological stage, sensor angle, zenith angle, and solar azimuth,clouds, and atmospheric effects must be accounted for. Illumi-nation differences between years were minimal as image acqui-sition was only one week apart. Comparison of biweekly NDVIcomposites of the study area from AVHRR between 1994 and1998 show that peak greenness occurs at these dates, ensuringcomparability of phenological stage (Fig. 3).
RMSE for the JRBP area was used as a criterion for good-ness-of-fit for endmember selection. RMSE is defined for eachpixel as
wherepixel reflectance;modeled pixel spectral reflectance;number of bands.
Analysis of residuals between observed AVIRIS reflectanceand modeled SMA reflectance corresponding to each spectralband has been used to identify materials poorly fit by the refer-ence endmembers [21]. In this study, an analysis of the specificcontribution from each spectral band to total error and spatialvariation in the error was used to assess model results. Residualswere calculated per band and per pixel. Additional error sourcesstem from the spectral and radiometric calibration procedure,in-flight system changes, solar irradiance model errors, and in-accuracy in parameter estimation [46]. In our case, the thresholdlevel chosen to assess the goodness-of-fit in the model was 3%of maximum reflectance in each band. Because error is corre-lated with magnitude of reflectance, the areal extent for whichthe maximum error was calculated was restricted to the JRBPwhere the preexisting vegetation map could be used to mask theresults and analyze error(s) for each vegetation type.
Interpreting the cause(s) of high residuals is not easy. A com-bination of factors decreases the fitness of the model. One typeincludes spectral features not accounted for by the selected end-members. Thus, heterogeneous biochemical and structural char-acteristics or gradual changes in soil and vegetation propertiescontribute to this error. Another source of error is caused by non-linear effects associated with multiple scattering of photons, es-pecially in the NIR and SWIR bands. Vegetation structure andleaf optical properties or high background reflectance contributeto nonlinear scattering. Finally, systematic errors from illumi-nation and atmospheric conditions, sensor effects, and calibra-tion procedures increase error in the model [11], [22]. Effects ofnonlinear spectral mixing are most evident in the NIR as little
Fig. 3. Temporal NDVI series derived from bimonthly composite AVHRRdata. The mean NDVI was calculated for the Santa Cruz Mountains extentbetween 1994 and 1998.
leaf absorption occurs at these wavelengths. The degree of non-linearity caused by multiple scattering of photons depends onleaf transmittance, which is lower in xerophytic vegetation likechaparral and evergreen conifers and higher in grasses and somedeciduous shrubs and trees [21], [22], [27]. Nonlinear mixingincreases with canopy cover and with background reflectancefor brighter soils and standing litter [11]–[13], [41].
IV. RESULTS AND DISCUSSION
Linear SMA using three endmembers, soil (Franciscan green-stone), green vegetation (evergreen forest), and shade was ap-plied to 1996 and 1998 images. Residual analysis of each spec-tral band showed high error for areas of JRBP that were com-posed of dry grass and litter, justifying the addition of a dry grassendmember. Based on this analysis, a new set of four endmem-bers: soil, green vegetation, shade, and dry grass, was appliedto the grassland areas where RMSE was high. The grasslandboundaries were defined in the image using the Greenstone andSerpentine vegetation boundaries in the Jasper Ridge VegetationMap [36].
A. Endmember Selection
Automatic endmember selection was determined using theMNF bands. MNF transformed spectra were related to spec-

1484 IEEE TRANSACTIONS ON GEOSCIENCE AND REMOTE SENSING, VOL. 39, NO. 7, JULY 2001
Fig. 4. Set of endmembers used for unmixing. Green vegetation and dry grasswere selected automatically based on PPI, soil by visual inspection, and shadeby minimum albedo levels in the image, corresponding to a lake.
tral properties of different vegetation types, dry grass, and soils.Pixels with the highest PPI in MNF space corresponded to soil,vegetation and water spectra. However, because vegetation atJasper Ridge is patchy and spring grasses grow almost every-where, no pure soil pixels were found. Instead, soil from a barefield east of JRBP was used after evaluating different soil spectraand unmixing results. The water endmember used to model theshade component was also from a lake outside JRBP. It waschosen because its albedo was the lowest in the entire scene.(Fig. 4).
Linear SMA was performed after applying several combi-nations and numbers of endmembers. Selection criteria wererealistic fraction distributions (i.e., between 0–100%) and lowRMSE. The best fit endmembers for JRBP corresponded to acombination of evergreen vegetation, soil and shade spectra.Adding an additional endmember, plant litter, did not improvethe general fit, because 1) at this time of the year, all vegeta-tion except grasses are green and have little canopy litter, and 2)the litter endmember was confounded with the soil endmember.Fig. 5 shows a red, green, blue (RGB) composite of soil, greenvegetation, and shade fractions. Specific combinations of end-member fractions (as observed by the color variation) are con-sistent for specific vegetation types. These results demonstratevegetation patterns described for JRBP and for other sites [22],[39].
B. Error Analysis
Mean RMSE at Jasper Ridge, for SMA with three endmem-bers, was 0.84% in 1996 and 0.64% in 1998, with standard devi-ations of 0.43% and 0.21%, respectively. Lower error occurredin 1998 compared to 1996, which is related to improvementsin the A and D spectrometers in 1998. However, spatial distri-bution of RMSE shows speckled areas with high RMSE in thepartially senesced grasslands. In addition, green canopy cover islower, and soil background effects are higher in this type com-pared to other vegetation types.
The per band residuals analyzed over the entire image were inthe worst case, less than 4% reflectance (Fig. 6). However, thespatial and spectral analysis of residuals shows that the errorcontribution of each band is different and varies depending onvegetation type. It also highlights spectral differences betweenyears. Fig. 6 shows that almost all vegetation types fit within
error threshold levels, except the grasslands. Both serpentineand greenstone grasslands had high residuals in the visible, NIR,and SWIR bands in 1996 and in 1998. When residuals are highand positive in the visible range, the model overestimates veg-etation or underestimates soil, as vegetation reflectance is verylow in this range. In the same way, high negative residuals inthe NIR reflect an overestimation of vegetation as observed re-flectance is less than modeled and vegetation reflectance domi-nates in the NIR wavelengths. In senescent plants, these errorscan be related to low chlorophyll concentrations and high pos-itive residuals in the red spectral region, low leaf water contentand high positive residuals in the SWIR, and lower NIR-plateaureflectance, and high negative residuals in the NIR. As a con-sequence, senescent or stressed vegetation has a red edge thatis shifted toward the blue region, decreasing the fitness of theselected green endmember. All of these RMS characteristicsare associated with JRBP areas of senescent grasses and plantlitter. This effect on RMS band residuals is stronger in 1996than in 1998, corresponding to the more droughty conditionin 1996. The error attributable to extrapolation of endmembersfrom 1998 to 1996 does not produce changes in residuals inother vegetation types, such as evergreen forest and chaparral,which are on the same order in both years. The high negativeresiduals in SWIR bands in 1996 may also be responding to in-creased cellulose and lignin absorptions due to the presence ofmore canopy litter.
The effect of enhanced multiple scattering with greatercanopy cover is observed in Fig. 7 for deciduous forest pixelsthat have high leaf transmittance. In this vegetation type, soilfractions are low and SMA adjustments come from changes invegetation and shade fractions. The observed spectra had thesame spectral features in both years but different albedo, whichis related to greater canopy cover in the wetter 1998.
In Fig. 6, residuals are shown for grasslands from differentsoil backgrounds: serpentine and greenstone soils. When greencanopy cover is high, reflectance residuals are low. However,with lower canopy cover, spikes in the red-edge region are largefor greenstone and serpentine grasslands, suggesting that the re-flectance model for either plant litter or soil could be improved.In the NIR, negative residuals indicate overestimation of vege-tation abundance. At this time in spring, serpentine grasslandsare drier than greenstone grasslands, which explains their lowernegative residuals in the NIR. However, in the red-edge wave-length region, residuals are higher for greenstone grasses wherethe background soil is brighter, which enhances nonlinear scat-tering more than the darker serpentine soils. This suggests thatthe effect of plant litter is greatest in the NIR and the effect ofthe soil background is more important near the red-edge.
Standing litter increases reflectance at 680 nm, reduces NIRreflectance, increases the slope of NIR between 800 and 1000nm, and increases SWIR reflectance, similar to the effects ob-served for woody stems in trees and shrubs [11], [13]. However,small increases in standing litter cause more than a proportionalincrease in canopy reflectance because of its impact on non-linear mixing, especially in NIR and SWIR regions [11]. Fig. 8shows residual trends for chaparral canopies, serpentine andgreenstone grasses. The RMSE by wavelength is similar forchaparral and grasses but the magnitude is greater in grasses,

GARCIA AND USTIN: DETECTION OF INTERANNUAL VEGETATION RESPONSES 1485
Fig. 5. Unmixing results using three endmembers: soil (red), green vegetation (green), and shade (blue) in spring at Jasper Ridge. Areas with higher proportionof red correspond to the grasslands.
Fig. 6. Comparison of residuals across spectral bands between observed AVIRIS reflectance and modeled with unmixing in 1996 and 1998 for different vegetationtypes. Grasses present higher residuals as a consequence of senescence.
despite similar cover fractions. Also, serpentine grasses show ared-edge shift with respect to greenstone grasses due to lesser
chlorophyll absorption, since they are more senescent thangreenstone grasses.

1486 IEEE TRANSACTIONS ON GEOSCIENCE AND REMOTE SENSING, VOL. 39, NO. 7, JULY 2001
Fig. 7. Residuals between observed and predicted reflectance suggesting nonlinear scattering effects due to increasing canopy levels in high transmitting foliageand background effects from soil and litter in the grasses.
C. Unmixing with Four Endmembers in Grassland Areas
Nonlinear mixing effects can lead to overestimation of greenvegetation fractions making change detection unreliable. Tominimize this problem, based on the error analysis above, anadditional endmember was added to pixels in the grasslandsto account for the unexplained reflectance. The fourth end-member was a senescing but not totally dry greenstone grass,based on its PPI ranking (Fig. 4). Unmixed fractions in thegrasslands were consistent with expected values at the lateApril phenological stage. RMSE decreased to the magnitudeof the mean RMSE for the three endmember model used inthe other vegetation types. Trials using a dry litter endmember,without any red edge, yielded negative and unrealistic fractionswith high RMSE.
In conclusion, the final SMA results consisted of soil, ever-green vegetation, and shade fractions for all of JRBP except forserpentine and greenstone grasslands where an additional senes-
cent grass endmember was included. Grassland boundaries weredelimited using the JRBP vegetation map. Soil, litter, and vege-tation fractions were rescaled to sum to 100% after removing theshade fraction. It was assumed that shade fractions were equallydistributed between soil and vegetation components. However,if shade fractions are contributed by shadows in addition to pho-tometric shade, subpixel topography could affect landscape ma-terials differently and cause rescaled fractions to be inaccurate[2]. Comparison of shade fractions against a DEM did not re-veal a vegetation dependent residual shade.
D. Differences in Mean Unmixed Fractions
Mean fractions of green vegetation (GV), soil, and plantlitter/dry grass (i.e., nonphotosynthetic vegetation or NPV)were calculated for both years for each vegetation polygon(Fig. 9). Chaparral, deciduous forest, and evergreen forestshow less plasticity in growth response to rainfall. Comparisonof wet and dry years shows that herbaceous annuals are most

GARCIA AND USTIN: DETECTION OF INTERANNUAL VEGETATION RESPONSES 1487
Fig. 8. Differences in residuals between grasslands and chaparral areas showing nonmodeled reflectance from dry grass and litter at the red-edge andin the SWIRregions.
Fig. 9. Differences between mean unmixing fractions in 1996 and 1998calculated for each vegetation community. Error bars represent one standarddeviation for the fraction distribution within each vegetation polygon and year.
affected by the increased rainfall in the wet year. Dry grassfractions were lower in the wet year than in the dry year.However, the sum of green and dry vegetation fractions in bothyears remained constant. This could indicate that changes incommunity composition between dry and wet years is greater
than effects on primary productivity. Landscape scale pheno-logical changes in grasslands arise mainly through changes inspecies composition [36]. Differences in structure and canopygeometry among vegetation types can produce different greenvegetation fractions for the same biomass, limiting the value ofcomparisons between vegetation types [14]. In any case, thehigh spatial variability of fractions within a year makes meandifferences insignificant as is shown in Fig. 9.
E. Change Detection Using Unmixed Fractions
The percentage change between 1996 and 1998 was calcu-lated for normalized fractions for all vegetation types. To eval-uate significant changes in unmixed fractions, a threshold ofone standard deviation was set. Mapped significant changes be-tween years are shown in Fig. 10. Increases mean higher frac-tions occurred in 1996 compared to 1998. In general, significantchanges in plant communities (other than grasslands) are fromeither increases in green vegetation fractions and corresponding

1488 IEEE TRANSACTIONS ON GEOSCIENCE AND REMOTE SENSING, VOL. 39, NO. 7, JULY 2001
Fig. 10. Significant changes in green vegetation (GV), dry grass, and soil fractions between 1996 and 1998. Black areas correspond to decreases and gray areasto increases in the wet year (1998) relative to the dry year (1996).
decreases in soil fractions or vice versa. Evergreen forest com-munities did not show any change between years. In some areasof the deciduous forest, green vegetation fractions decreasedand soil fractions increased in the wet year. One explanationfor this contra-intuitive result might be due to delays in the phe-nological cycle of this vegetation type, leading to later peaks inbiomass [36]. Chaparral vegetation shows the greatest interan-nual change after the grasslands, and shows both increases anddecreases in different pixels. This irregular pattern may be a re-sponse to variable grass abundance within the mapped chaparralareas.
Grasslands show the most significant changes in green veg-etation and soil fractions between years. The patterns are com-plex and spatial trends are not always correlated. Thus, in thewet year, green vegetation fractions increase in most pixels butdecreases in other pixels are common. Soil fractions mainlydecreased between 1996 and 1998. However, in the wet year,dry grass fractions never increased but either decreased or re-main unchanged. When NPV fractions decreased, soil fractions,in general, tend to decrease too and green vegetation fractionsshowed a corresponding increase.
V. CONCLUSIONS
Linear SMA of AVIRIS data is appropriate to capture some ofthe complexity of ecosystem interrelations and landscape spatialheterogeneity in a semiarid grassland. Subtle changes in vege-tation structure between dry and wet years can be detected. Be-cause pixel heterogeneity within vegetation types is high, meandifferences between years for a vegetation type are not signif-icantly different. However on a pixel basis, significant differ-ences in fractional abundances are detected between coregis-tered images.
From among these vegetation communities, grasslands arethe most plastic in their response to climatic variability, andspectral changes might be responding to changes in grasslandstructure as well as abundance. LAI and growth plasticity in ev-ergreen and deciduous forests are less responsive than grass-lands to differences in interannual rainfall as they have accessto water layers at deeper soil depths. In chaparral communities,most changes are explained by annual grasses growing withinthe shrub communities.
Improvements in the performance of the AVIRIS instrumentonly partially explain the better fitness of the SMA modelin 1998 with respect to 1996. Nonlinear scattering due tosenescing vegetation and high green cover of highly transmit-ting foliage also affected the results. Including an additionalendmember in the grasslands improved the fit of the SMAmodel. The results from the change detection analysis ofvegetation at JRBP demonstrate the importance of performingsite-specific and community-specific analyses to characterizevegetation structure. Although linear SMA provides relativelygood characterization of the general landscape conditions,the model is not flexible enough to accommodate the rangeof natural vegetation variability throughout the landscape.To fully characterize ecosystem structure, it is necessary toaccount for changes in bidirectional reflectance (BDRF) in thesubpixel components since multiple scattering overestimatesthe results from a linear scattering model. Addressing thisresearch direction will require the use of radiative transfermodels that are based on parameterizing leaf optical properties,and vegetation structure and are used to invert hyperspectralimages. In addition, an increase in the temporal coverageof hyperspectral data is needed to track phenological eventsin different vegetation communities and will provide betterunderstanding of vegetation dynamics.
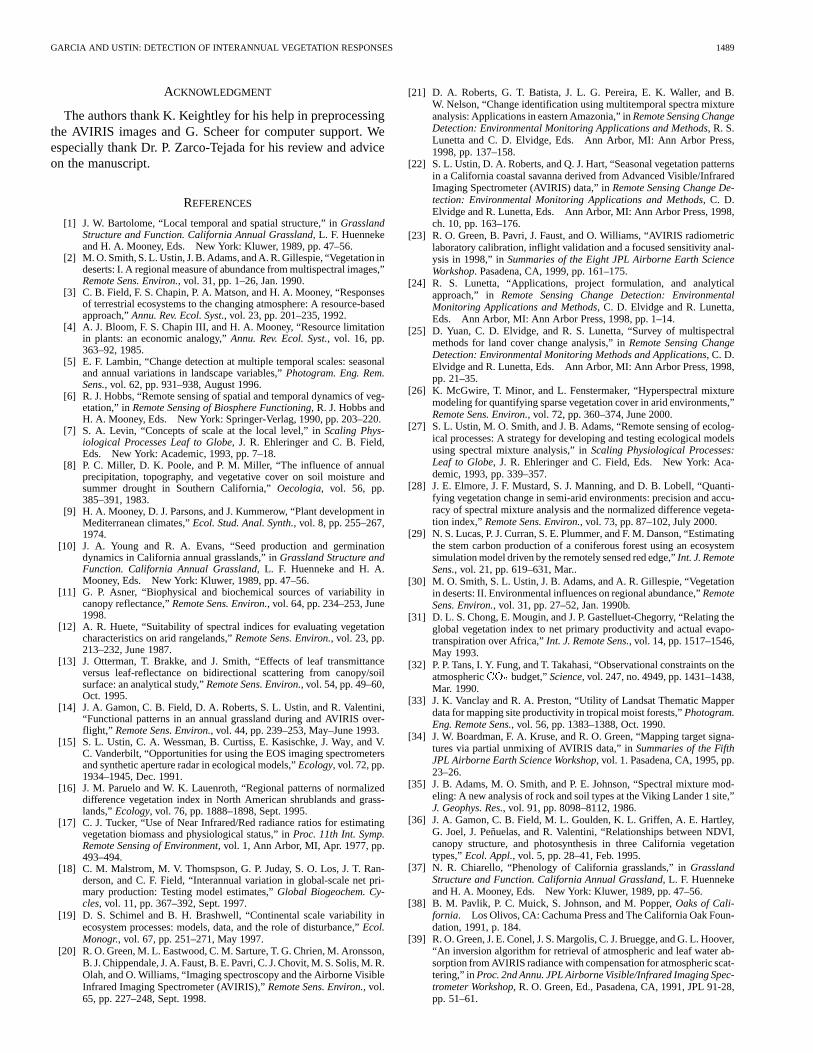
GARCIA AND USTIN: DETECTION OF INTERANNUAL VEGETATION RESPONSES 1489
ACKNOWLEDGMENT
The authors thank K. Keightley for his help in preprocessingthe AVIRIS images and G. Scheer for computer support. Weespecially thank Dr. P. Zarco-Tejada for his review and adviceon the manuscript.
REFERENCES
[1] J. W. Bartolome, “Local temporal and spatial structure,” inGrasslandStructure and Function. California Annual Grassland, L. F. Huennekeand H. A. Mooney, Eds. New York: Kluwer, 1989, pp. 47–56.
[2] M. O. Smith, S. L. Ustin, J. B. Adams, and A. R. Gillespie, “Vegetation indeserts: I. A regional measure of abundance from multispectral images,”Remote Sens. Environ., vol. 31, pp. 1–26, Jan. 1990.
[3] C. B. Field, F. S. Chapin, P. A. Matson, and H. A. Mooney, “Responsesof terrestrial ecosystems to the changing atmosphere: A resource-basedapproach,”Annu. Rev. Ecol. Syst., vol. 23, pp. 201–235, 1992.
[4] A. J. Bloom, F. S. Chapin III, and H. A. Mooney, “Resource limitationin plants: an economic analogy,”Annu. Rev. Ecol. Syst., vol. 16, pp.363–92, 1985.
[5] E. F. Lambin, “Change detection at multiple temporal scales: seasonaland annual variations in landscape variables,”Photogram. Eng. Rem.Sens., vol. 62, pp. 931–938, August 1996.
[6] R. J. Hobbs, “Remote sensing of spatial and temporal dynamics of veg-etation,” inRemote Sensing of Biosphere Functioning, R. J. Hobbs andH. A. Mooney, Eds. New York: Springer-Verlag, 1990, pp. 203–220.
[7] S. A. Levin, “Concepts of scale at the local level,” inScaling Phys-iological Processes Leaf to Globe, J. R. Ehleringer and C. B. Field,Eds. New York: Academic, 1993, pp. 7–18.
[8] P. C. Miller, D. K. Poole, and P. M. Miller, “The influence of annualprecipitation, topography, and vegetative cover on soil moisture andsummer drought in Southern California,”Oecologia, vol. 56, pp.385–391, 1983.
[9] H. A. Mooney, D. J. Parsons, and J. Kummerow, “Plant development inMediterranean climates,”Ecol. Stud. Anal. Synth., vol. 8, pp. 255–267,1974.
[10] J. A. Young and R. A. Evans, “Seed production and germinationdynamics in California annual grasslands,” inGrassland Structure andFunction. California Annual Grassland, L. F. Huenneke and H. A.Mooney, Eds. New York: Kluwer, 1989, pp. 47–56.
[11] G. P. Asner, “Biophysical and biochemical sources of variability incanopy reflectance,”Remote Sens. Environ., vol. 64, pp. 234–253, June1998.
[12] A. R. Huete, “Suitability of spectral indices for evaluating vegetationcharacteristics on arid rangelands,”Remote Sens. Environ., vol. 23, pp.213–232, June 1987.
[13] J. Otterman, T. Brakke, and J. Smith, “Effects of leaf transmittanceversus leaf-reflectance on bidirectional scattering from canopy/soilsurface: an analytical study,”Remote Sens. Environ., vol. 54, pp. 49–60,Oct. 1995.
[14] J. A. Gamon, C. B. Field, D. A. Roberts, S. L. Ustin, and R. Valentini,“Functional patterns in an annual grassland during and AVIRIS over-flight,” Remote Sens. Environ., vol. 44, pp. 239–253, May–June 1993.
[15] S. L. Ustin, C. A. Wessman, B. Curtiss, E. Kasischke, J. Way, and V.C. Vanderbilt, “Opportunities for using the EOS imaging spectrometersand synthetic aperture radar in ecological models,”Ecology, vol. 72, pp.1934–1945, Dec. 1991.
[16] J. M. Paruelo and W. K. Lauenroth, “Regional patterns of normalizeddifference vegetation index in North American shrublands and grass-lands,”Ecology, vol. 76, pp. 1888–1898, Sept. 1995.
[17] C. J. Tucker, “Use of Near Infrared/Red radiance ratios for estimatingvegetation biomass and physiological status,” inProc. 11th Int. Symp.Remote Sensing of Environment, vol. 1, Ann Arbor, MI, Apr. 1977, pp.493–494.
[18] C. M. Malstrom, M. V. Thomspson, G. P. Juday, S. O. Los, J. T. Ran-derson, and C. F. Field, “Interannual variation in global-scale net pri-mary production: Testing model estimates,”Global Biogeochem. Cy-cles, vol. 11, pp. 367–392, Sept. 1997.
[19] D. S. Schimel and B. H. Brashwell, “Continental scale variability inecosystem processes: models, data, and the role of disturbance,”Ecol.Monogr., vol. 67, pp. 251–271, May 1997.
[20] R. O. Green, M. L. Eastwood, C. M. Sarture, T. G. Chrien, M. Aronsson,B. J. Chippendale, J. A. Faust, B. E. Pavri, C. J. Chovit, M. S. Solis, M. R.Olah, and O. Williams, “Imaging spectroscopy and the Airborne VisibleInfrared Imaging Spectrometer (AVIRIS),”Remote Sens. Environ., vol.65, pp. 227–248, Sept. 1998.
[21] D. A. Roberts, G. T. Batista, J. L. G. Pereira, E. K. Waller, and B.W. Nelson, “Change identification using multitemporal spectra mixtureanalysis: Applications in eastern Amazonia,” inRemote Sensing ChangeDetection: Environmental Monitoring Applications and Methods, R. S.Lunetta and C. D. Elvidge, Eds. Ann Arbor, MI: Ann Arbor Press,1998, pp. 137–158.
[22] S. L. Ustin, D. A. Roberts, and Q. J. Hart, “Seasonal vegetation patternsin a California coastal savanna derived from Advanced Visible/InfraredImaging Spectrometer (AVIRIS) data,” inRemote Sensing Change De-tection: Environmental Monitoring Applications and Methods, C. D.Elvidge and R. Lunetta, Eds. Ann Arbor, MI: Ann Arbor Press, 1998,ch. 10, pp. 163–176.
[23] R. O. Green, B. Pavri, J. Faust, and O. Williams, “AVIRIS radiometriclaboratory calibration, inflight validation and a focused sensitivity anal-ysis in 1998,” inSummaries of the Eight JPL Airborne Earth ScienceWorkshop. Pasadena, CA, 1999, pp. 161–175.
[24] R. S. Lunetta, “Applications, project formulation, and analyticalapproach,” in Remote Sensing Change Detection: EnvironmentalMonitoring Applications and Methods, C. D. Elvidge and R. Lunetta,Eds. Ann Arbor, MI: Ann Arbor Press, 1998, pp. 1–14.
[25] D. Yuan, C. D. Elvidge, and R. S. Lunetta, “Survey of multispectralmethods for land cover change analysis,” inRemote Sensing ChangeDetection: Environmental Monitoring Methods and Applications, C. D.Elvidge and R. Lunetta, Eds. Ann Arbor, MI: Ann Arbor Press, 1998,pp. 21–35.
[26] K. McGwire, T. Minor, and L. Fenstermaker, “Hyperspectral mixturemodeling for quantifying sparse vegetation cover in arid environments,”Remote Sens. Environ., vol. 72, pp. 360–374, June 2000.
[27] S. L. Ustin, M. O. Smith, and J. B. Adams, “Remote sensing of ecolog-ical processes: A strategy for developing and testing ecological modelsusing spectral mixture analysis,” inScaling Physiological Processes:Leaf to Globe, J. R. Ehleringer and C. Field, Eds. New York: Aca-demic, 1993, pp. 339–357.
[28] J. E. Elmore, J. F. Mustard, S. J. Manning, and D. B. Lobell, “Quanti-fying vegetation change in semi-arid environments: precision and accu-racy of spectral mixture analysis and the normalized difference vegeta-tion index,”Remote Sens. Environ., vol. 73, pp. 87–102, July 2000.
[29] N. S. Lucas, P. J. Curran, S. E. Plummer, and F. M. Danson, “Estimatingthe stem carbon production of a coniferous forest using an ecosystemsimulation model driven by the remotely sensed red edge,”Int. J. RemoteSens., vol. 21, pp. 619–631, Mar..
[30] M. O. Smith, S. L. Ustin, J. B. Adams, and A. R. Gillespie, “Vegetationin deserts: II. Environmental influences on regional abundance,”RemoteSens. Environ., vol. 31, pp. 27–52, Jan. 1990b.
[31] D. L. S. Chong, E. Mougin, and J. P. Gastelluet-Chegorry, “Relating theglobal vegetation index to net primary productivity and actual evapo-transpiration over Africa,”Int. J. Remote Sens., vol. 14, pp. 1517–1546,May 1993.
[32] P. P. Tans, I. Y. Fung, and T. Takahasi, “Observational constraints on theatmosphericCO budget,”Science, vol. 247, no. 4949, pp. 1431–1438,Mar. 1990.
[33] J. K. Vanclay and R. A. Preston, “Utility of Landsat Thematic Mapperdata for mapping site productivity in tropical moist forests,”Photogram.Eng. Remote Sens., vol. 56, pp. 1383–1388, Oct. 1990.
[34] J. W. Boardman, F. A. Kruse, and R. O. Green, “Mapping target signa-tures via partial unmixing of AVIRIS data,” inSummaries of the FifthJPL Airborne Earth Science Workshop, vol. 1. Pasadena, CA, 1995, pp.23–26.
[35] J. B. Adams, M. O. Smith, and P. E. Johnson, “Spectral mixture mod-eling: A new analysis of rock and soil types at the Viking Lander 1 site,”J. Geophys. Res., vol. 91, pp. 8098–8112, 1986.
[36] J. A. Gamon, C. B. Field, M. L. Goulden, K. L. Griffen, A. E. Hartley,G. Joel, J. Peñuelas, and R. Valentini, “Relationships between NDVI,canopy structure, and photosynthesis in three California vegetationtypes,”Ecol. Appl., vol. 5, pp. 28–41, Feb. 1995.
[37] N. R. Chiarello, “Phenology of California grasslands,” inGrasslandStructure and Function. California Annual Grassland, L. F. Huennekeand H. A. Mooney, Eds. New York: Kluwer, 1989, pp. 47–56.
[38] B. M. Pavlik, P. C. Muick, S. Johnson, and M. Popper,Oaks of Cali-fornia. Los Olivos, CA: Cachuma Press and The California Oak Foun-dation, 1991, p. 184.
[39] R. O. Green, J. E. Conel, J. S. Margolis, C. J. Bruegge, and G. L. Hoover,“An inversion algorithm for retrieval of atmospheric and leaf water ab-sorption from AVIRIS radiance with compensation for atmospheric scat-tering,” inProc. 2nd Annu. JPL Airborne Visible/Infrared Imaging Spec-trometer Workshop, R. O. Green, Ed., Pasadena, CA, 1991, JPL 91-28,pp. 51–61.

1490 IEEE TRANSACTIONS ON GEOSCIENCE AND REMOTE SENSING, VOL. 39, NO. 7, JULY 2001
[40] S. L. Ustin, Q. J. Hart, L. Duan, and G. Scheer, “Vegetation mapping onhardwood rangelands in California,”Int. J. Remote Sensing, vol. 17, pp.3015–3036, 1996.
[41] S. L. Ustin, M. O. Smith, S. Jacquemoud, M. M. Verstraete, and Y. Go-vaerts, “Geobotany: vegetation mapping for Earth sciences,” inRemoteSensing for the Earth Sciences, Manual of Remote Sensing, 3 ed, A.Rencz, Ed. New York: Wiley, 1999, vol. 3, pp. 189–248.
[42] D. A. Roberts, M. O. Smith, and J. B. Adams, “Green vegetation, non-photosynthetic vegetation, and soils in AVIRIS data,”Remote Sens. En-viron., vol. 44, pp. 255–269, May–June 1993.
[43] M. O. Smith, S. L. Ustin, J. B. Adams, and A. R. Gillespie, “Vegetationin deserts II. Environmental influences on regional abundance,”RemoteSens. Environ., vol. 29, pp. 27–52, 1990b.
[44] S. L. Ustin, J. B. Adams, C. D. Elvidge, M. Rejmanek, B. N. Rock,M. O. Smith, R. W. Thomas, and R. A. Woodward, “Thematic mapperstudies of semiarid shrub communities,”BioScience, vol. 36, no. 7, pp.446–452, 1986.
[45] J. W. Boardman, “Automating spectral unmixing of AVIRIS data usingconvex geometry concepts,” inSummaries 4th Annu. JPL Airborne Geo-science Workshop, vol. 1, Pasadena, CA, 1993, JPL Pub. 93-26, pp.11–14.
[46] S. L. Ustin and Q.-F. Xiao, “Mapping of forested ecosystems in interiorcentral Alaska,”Int. J. Remote Sens..
[47] J. W. Boardman, “Post-ATREM polishing of AVIRIS apparent re-flectance data using EFFORT: a lesson in accuracy versus precision,”in Summaries 7th JPL Airborne Earth Science Workshop, vol. 1,Pasadena, CA, 1998, JPL Pub. 97-21, p. 21.
Monica Garcia received the B.S. degree in agricultural engineering and ar-gonomy from the Polytechnique University of Madrid, Madrid, Spain, in 1996,and the M.S. degree from the University of California, Davis, in 1998, special-izing in the use of GIS and remote sensing in natural resources management.She is currently pursuing the Ph.D. degree at the Polytechnique University ofMadrid.
She was with the Department of Rural Engineering, Polytechnique Universityof Madrid, working on spectroscopy applications in agriculture and food quality,until Fall 1997. Her research interests are in hyperspectral remote sensing tostudy land use change and vegetation climate relationships.
Susan L. Ustin (M’90) received the B.S. degree in biology from CaliforniaState University, Hayward, in 1974, and the Ph.D. degree in botany from theUniversity of California, Davis, in 1983. Her dissertation research involved thephysiological ecology of halophytic plants.
She began working on imaging spectrometery data as a Postdoctoral Fellowat the beginning of the Airborne Imaging Spectrometery Program. Her currentinterests are in uses of hyperspectral data for detection of ecological processes.She joined the Faculty, University of California, Davis, in 1991, and is currentlyProfessor of resource science and Director of the Center for Spatial Technolo-gies and Remote Sensing.
Copyright © 2022 FDOKUMEN