Detection of ground motions using high-rate GPS time-series
45
Detection of ground motions using high-rate GPS time-series Panos A. Psimoulis 1* , Nicolas Houlié 2,3,4 , Mohammed Habboub 1 , Clotaire Michel 4 , Markus Rothacher 2 1 Nottingham Geospatial Institute, University of Nottingham, Nottingham, UK 2 Mathematical and Physical Geodesy (MPG), Institute of Geodesy and Photogrammetry, ETH Zurich, Switzerland, [email protected] 3 Seismology and Geodynamics (SEG), Institute of Geophysics, ETH Zurich, Switzerland 4 Swiss Seismological Service (SED), Institute of Geophysics, ETH Zurich, Switzerland * Corresponding author: Assistant Professor in Geospatial Eng., Tel: +44 (0) 115 951 4287, E-mail: [email protected] Downloaded from https://academic.oup.com/gji/advance-article-abstract/doi/10.1093/gji/ggy198/4999902 by Nottingham University user on 21 May 2018
-
Upload
khangminh22 -
Category
Documents
-
view
2 -
download
0
Transcript of Detection of ground motions using high-rate GPS time-series
Detection of ground motions using high-rate GPS time-series
Panos A. Psimoulis1*
, Nicolas Houlié2,3,4
, Mohammed Habboub1, Clotaire Michel
4,
Markus Rothacher2
1 Nottingham Geospatial Institute, University of Nottingham, Nottingham, UK
2 Mathematical and Physical Geodesy (MPG), Institute of Geodesy and Photogrammetry,
ETH Zurich, Switzerland, [email protected]
3 Seismology and Geodynamics (SEG), Institute of Geophysics, ETH Zurich,
Switzerland
4 Swiss Seismological Service (SED), Institute of Geophysics, ETH Zurich, Switzerland
*Corresponding author: Assistant Professor in Geospatial Eng., Tel: +44 (0) 115 951 4287, E-mail:
Downloaded from https://academic.oup.com/gji/advance-article-abstract/doi/10.1093/gji/ggy198/4999902by Nottingham University useron 21 May 2018
Abstract
Monitoring surface deformation in real-time help at planning and protecting
infrastructures and populations, manage sensitive production (i.e. SEVESO-type) and
mitigate long-term consequences of modifications implemented. We present RT-
SHAKE, an algorithm developed to detect ground motions associated with landslides,
sub-surface collapses, subsidences, earthquakes or rock falls. RT-SHAKE detects first
transient changes in individual GPS time series before investigating for spatial
correlation(s) of observations made at neighbouring GPS sites and eventually issue a
motion warning. In order to assess our algorithm on fast (seconds to minute), large
(from 1cm to meters) and spatially consistent surface motions, we use the 1Hz
GEONET GNSS network data of the Tohoku-Oki MW9.0 2011 as a test scenario. We
show the delay of detection of seismic wave arrival by GPS records is of ~10 seconds
with respect to an identical analysis based on strong-motion data and this time delay
depends on the level of the time-variable noise. Nevertheless, based on the analysis of
the GPS network noise level and ground motion stochastic model, we show that RT-
SHAKE can narrow the range of earthquake magnitude, by setting a lower threshold
of detected earthquakes to MW6.5-7, if associated with a real-time automatic
earthquake location system.
Keywords: Earthquake Early Warning, GPS, detection, seismic signal, 2011 Tohoku-
Oki, RT-SHAKE
1. Introduction
Detecting and characterising surface motion in real-time enable the protection of
infrastructures, populations, manage sensitive production (i.e. SEVESO-type) and mitigate
Downloaded from https://academic.oup.com/gji/advance-article-abstract/doi/10.1093/gji/ggy198/4999902by Nottingham University useron 21 May 2018
long-term consequences (Bertazzi et al., 1989; Ferreira and Karali, 2015; Tan et al., 2009;
Ying et al., 2014). Earthquakes, along with landslides, are the most challenging processes to
monitor in real-time because 1) they unexpectedly develop in a very-short lapse of time (from
seconds to few minutes) and 2) the maximum displacement (from zero to several meters) is
unknown until the end of the event. Other processes are either of smaller amplitudes and/or
require longer periods to develop (e.g. volcanic inflation, geothermal activities, etc.; Figure
1).
Nowadays Earthquake Early Warning (EEW) systems enable to quantify magnitudes
of earthquakes before the end of the rupture during ongoing seismic wave propagation (Allen
and Kanamori 2003; Olson and Allen, 2005; Lewis and Ben-Zion, 2008; Allen et al., 2009;
Edwards et al., 2010; Espinosa et al., 2011; Doi, 2011; Colombelli et al., 2013; Kawamoto et
al., 2017; Psimoulis et al., 2018). Those systems required the installation of dense seismic
network to minimise the detection delays and of geodetic systems to minimise the risk of
magnitude underestimation. Likewise, geodetic systems, and mainly GPS networks (Michoud
et al., 2013), have been developed as part of landslide warning system, for real-time
landslides monitoring focusing on the detection of motion (Lienhart, 2014; Benoit et al.,
2015; Zhou et al., 2018) and its correlation with soil moisture, groundwater pressures and
ground displacement, which could lead to landslide triggering (Kristensen and Blikra, 2011;
Wang et al., 2011). Furthermore, GPS records have been proved capable for the monitoring,
of short-period dynamic motion (Psimoulis et al., 2008; Moschas et al., 2014; Haberling et al.,
2015), of the slow static ground deformation, associated to volcanic (Trota et al., 2006;
Houlié al., 2006; Newman et al., 2012; Tu et al., 2013), of geothermal activities (Fournier and
Jolly, 2014; Heimlich et al., 2015) and of seismological applications related to earthquake
response activities (Bock et al., 2004; Ohta et al., 2006; Yokota et al., 2009; Wright et al.,
2012; Newman et al., 2012; Melgar et al., 2013; Larson et al., 2013; Kelevitz et al., 2017;
Downloaded from https://academic.oup.com/gji/advance-article-abstract/doi/10.1093/gji/ggy198/4999902by Nottingham University useron 21 May 2018
Michel et al., 2017).
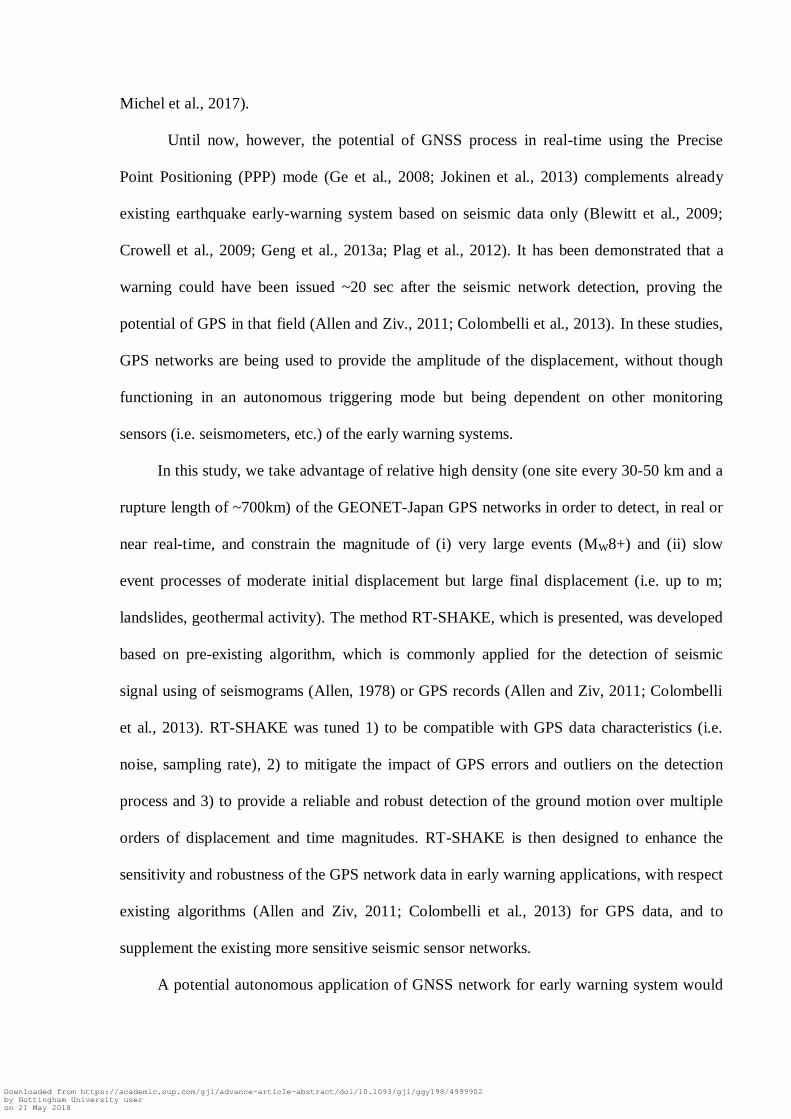
Until now, however, the potential of GNSS process in real-time using the Precise
Point Positioning (PPP) mode (Ge et al., 2008; Jokinen et al., 2013) complements already
existing earthquake early-warning system based on seismic data only (Blewitt et al., 2009;
Crowell et al., 2009; Geng et al., 2013a; Plag et al., 2012). It has been demonstrated that a
warning could have been issued ~20 sec after the seismic network detection, proving the
potential of GPS in that field (Allen and Ziv., 2011; Colombelli et al., 2013). In these studies,
GPS networks are being used to provide the amplitude of the displacement, without though
functioning in an autonomous triggering mode but being dependent on other monitoring
sensors (i.e. seismometers, etc.) of the early warning systems.
In this study, we take advantage of relative high density (one site every 30-50 km and a
rupture length of ~700km) of the GEONET-Japan GPS networks in order to detect, in real or
near real-time, and constrain the magnitude of (i) very large events (MW8+) and (ii) slow
event processes of moderate initial displacement but large final displacement (i.e. up to m;
landslides, geothermal activity). The method RT-SHAKE, which is presented, was developed
based on pre-existing algorithm, which is commonly applied for the detection of seismic
signal using of seismograms (Allen, 1978) or GPS records (Allen and Ziv, 2011; Colombelli
et al., 2013). RT-SHAKE was tuned 1) to be compatible with GPS data characteristics (i.e.
noise, sampling rate), 2) to mitigate the impact of GPS errors and outliers on the detection
process and 3) to provide a reliable and robust detection of the ground motion over multiple
orders of displacement and time magnitudes. RT-SHAKE is then designed to enhance the
sensitivity and robustness of the GPS network data in early warning applications, with respect
existing algorithms (Allen and Ziv, 2011; Colombelli et al., 2013) for GPS data, and to
supplement the existing more sensitive seismic sensor networks.
A potential autonomous application of GNSS network for early warning system would
Downloaded from https://academic.oup.com/gji/advance-article-abstract/doi/10.1093/gji/ggy198/4999902by Nottingham University useron 21 May 2018
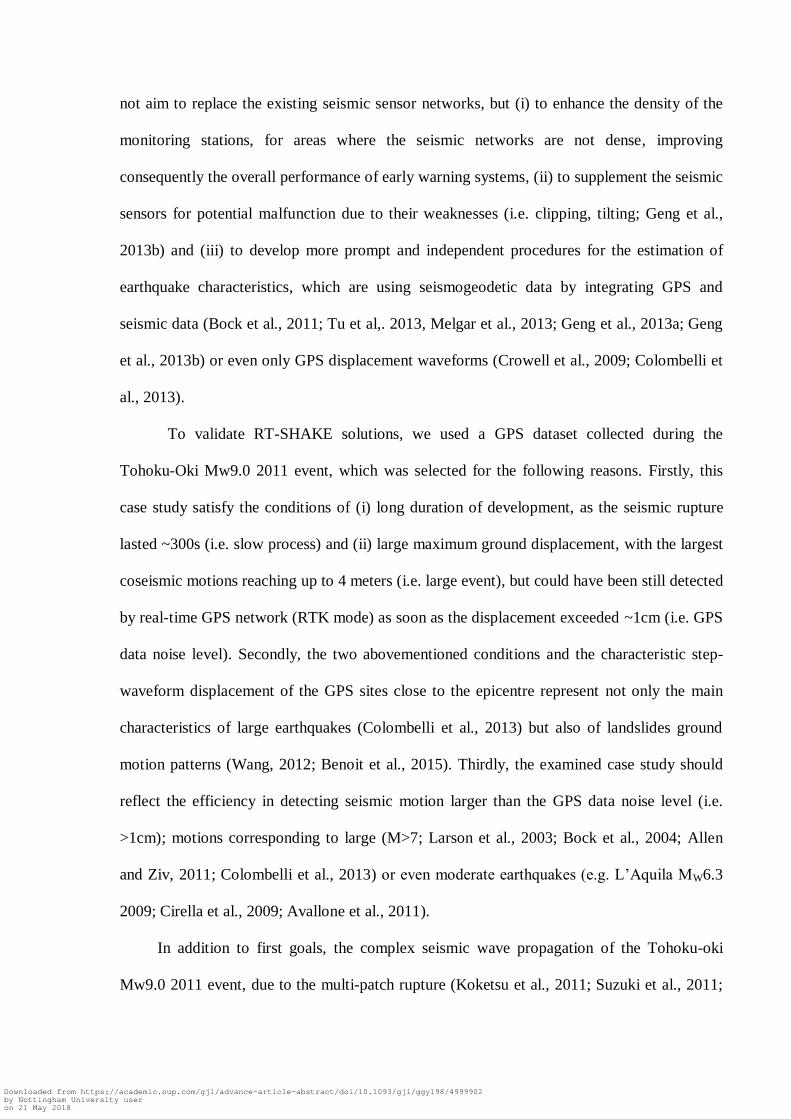
not aim to replace the existing seismic sensor networks, but (i) to enhance the density of the
monitoring stations, for areas where the seismic networks are not dense, improving
consequently the overall performance of early warning systems, (ii) to supplement the seismic
sensors for potential malfunction due to their weaknesses (i.e. clipping, tilting; Geng et al.,
2013b) and (iii) to develop more prompt and independent procedures for the estimation of
earthquake characteristics, which are using seismogeodetic data by integrating GPS and
seismic data (Bock et al., 2011; Tu et al,. 2013, Melgar et al., 2013; Geng et al., 2013a; Geng
et al., 2013b) or even only GPS displacement waveforms (Crowell et al., 2009; Colombelli et
al., 2013).
To validate RT-SHAKE solutions, we used a GPS dataset collected during the
Tohoku-Oki Mw9.0 2011 event, which was selected for the following reasons. Firstly, this
case study satisfy the conditions of (i) long duration of development, as the seismic rupture
lasted ~300s (i.e. slow process) and (ii) large maximum ground displacement, with the largest
coseismic motions reaching up to 4 meters (i.e. large event), but could have been still detected
by real-time GPS network (RTK mode) as soon as the displacement exceeded ~1cm (i.e. GPS
data noise level). Secondly, the two abovementioned conditions and the characteristic step-
waveform displacement of the GPS sites close to the epicentre represent not only the main
characteristics of large earthquakes (Colombelli et al., 2013) but also of landslides ground
motion patterns (Wang, 2012; Benoit et al., 2015). Thirdly, the examined case study should
reflect the efficiency in detecting seismic motion larger than the GPS data noise level (i.e.
>1cm); motions corresponding to large (M>7; Larson et al., 2003; Bock et al., 2004; Allen
and Ziv, 2011; Colombelli et al., 2013) or even moderate earthquakes (e.g. L‟Aquila MW6.3
2009; Cirella et al., 2009; Avallone et al., 2011).
In addition to first goals, the complex seismic wave propagation of the Tohoku-oki
Mw9.0 2011 event, due to the multi-patch rupture (Koketsu et al., 2011; Suzuki et al., 2011;
Downloaded from https://academic.oup.com/gji/advance-article-abstract/doi/10.1093/gji/ggy198/4999902by Nottingham University useron 21 May 2018
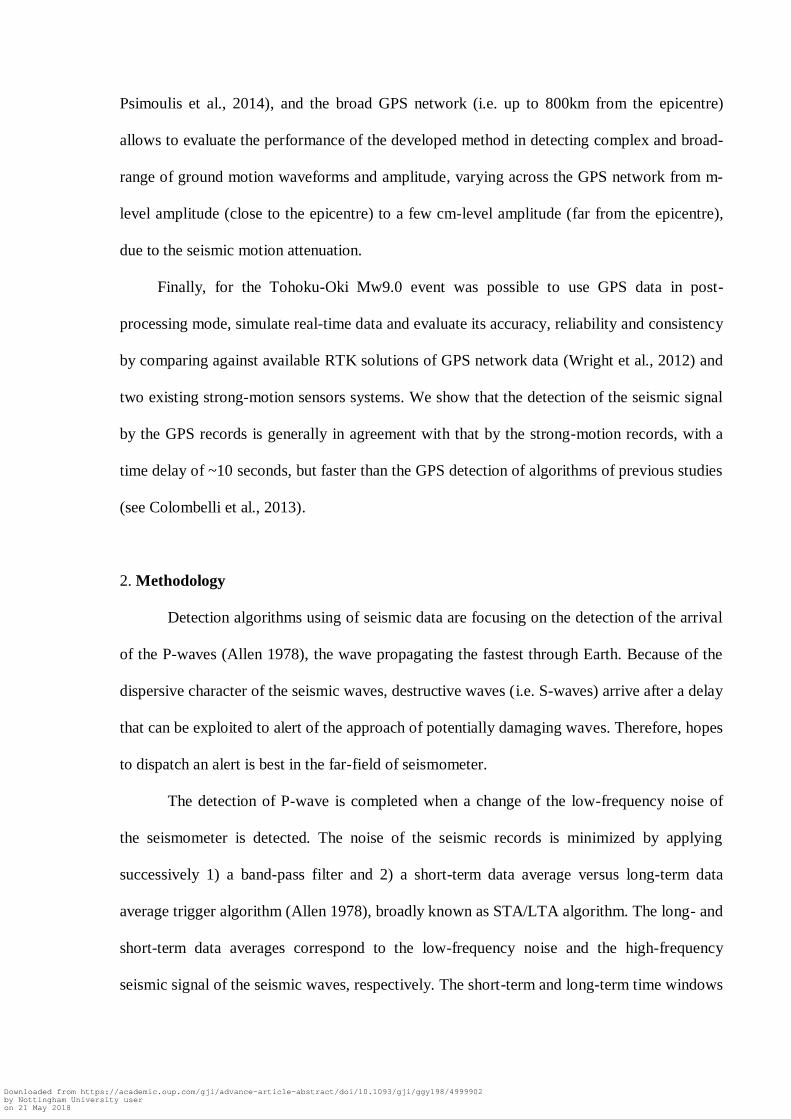
Psimoulis et al., 2014), and the broad GPS network (i.e. up to 800km from the epicentre)
allows to evaluate the performance of the developed method in detecting complex and broad-
range of ground motion waveforms and amplitude, varying across the GPS network from m-
level amplitude (close to the epicentre) to a few cm-level amplitude (far from the epicentre),
due to the seismic motion attenuation.
Finally, for the Tohoku-Oki Mw9.0 event was possible to use GPS data in post-
processing mode, simulate real-time data and evaluate its accuracy, reliability and consistency
by comparing against available RTK solutions of GPS network data (Wright et al., 2012) and
two existing strong-motion sensors systems. We show that the detection of the seismic signal
by the GPS records is generally in agreement with that by the strong-motion records, with a
time delay of ~10 seconds, but faster than the GPS detection of algorithms of previous studies
(see Colombelli et al., 2013).
2. Methodology
Detection algorithms using of seismic data are focusing on the detection of the arrival
of the P-waves (Allen 1978), the wave propagating the fastest through Earth. Because of the
dispersive character of the seismic waves, destructive waves (i.e. S-waves) arrive after a delay
that can be exploited to alert of the approach of potentially damaging waves. Therefore, hopes
to dispatch an alert is best in the far-field of seismometer.
The detection of P-wave is completed when a change of the low-frequency noise of
the seismometer is detected. The noise of the seismic records is minimized by applying
successively 1) a band-pass filter and 2) a short-term data average versus long-term data
average trigger algorithm (Allen 1978), broadly known as STA/LTA algorithm. The long- and
short-term data averages correspond to the low-frequency noise and the high-frequency
seismic signal of the seismic waves, respectively. The short-term and long-term time windows
Downloaded from https://academic.oup.com/gji/advance-article-abstract/doi/10.1093/gji/ggy198/4999902by Nottingham University useron 21 May 2018
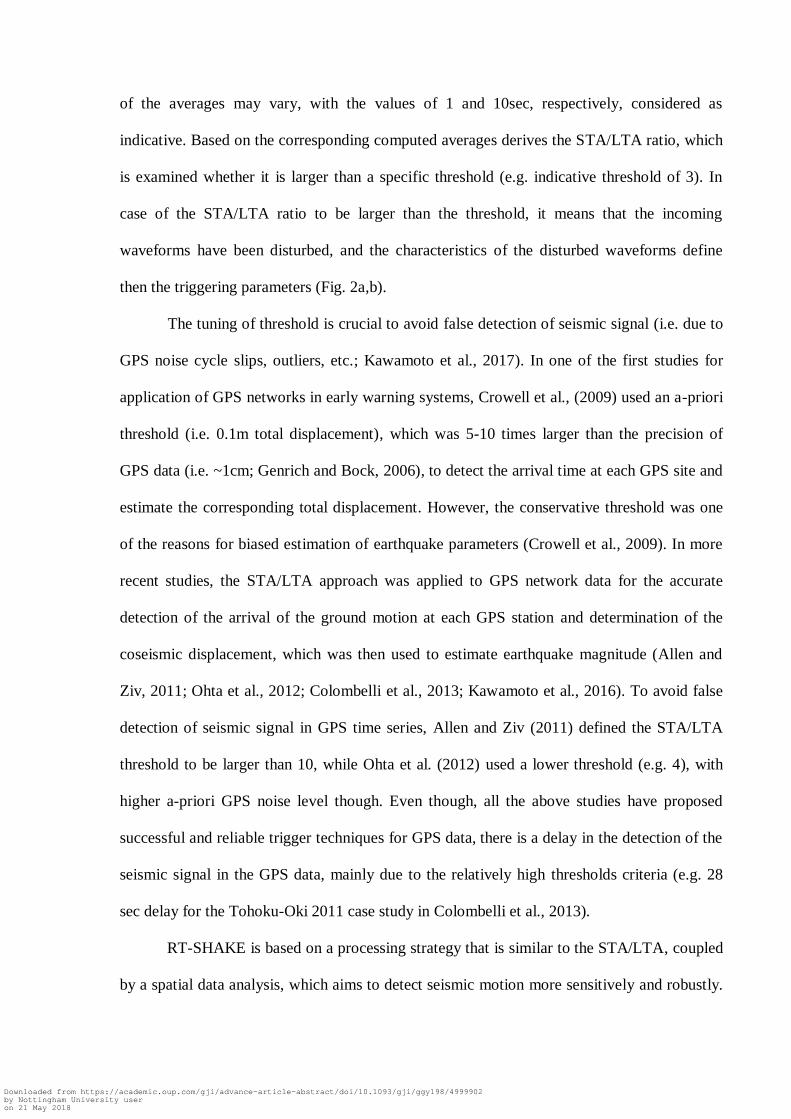
of the averages may vary, with the values of 1 and 10sec, respectively, considered as
indicative. Based on the corresponding computed averages derives the STA/LTA ratio, which
is examined whether it is larger than a specific threshold (e.g. indicative threshold of 3). In
case of the STA/LTA ratio to be larger than the threshold, it means that the incoming
waveforms have been disturbed, and the characteristics of the disturbed waveforms define
then the triggering parameters (Fig. 2a,b).
The tuning of threshold is crucial to avoid false detection of seismic signal (i.e. due to
GPS noise cycle slips, outliers, etc.; Kawamoto et al., 2017). In one of the first studies for
application of GPS networks in early warning systems, Crowell et al., (2009) used an a-priori
threshold (i.e. 0.1m total displacement), which was 5-10 times larger than the precision of
GPS data (i.e. ~1cm; Genrich and Bock, 2006), to detect the arrival time at each GPS site and
estimate the corresponding total displacement. However, the conservative threshold was one
of the reasons for biased estimation of earthquake parameters (Crowell et al., 2009). In more
recent studies, the STA/LTA approach was applied to GPS network data for the accurate
detection of the arrival of the ground motion at each GPS station and determination of the
coseismic displacement, which was then used to estimate earthquake magnitude (Allen and
Ziv, 2011; Ohta et al., 2012; Colombelli et al., 2013; Kawamoto et al., 2016). To avoid false
detection of seismic signal in GPS time series, Allen and Ziv (2011) defined the STA/LTA
threshold to be larger than 10, while Ohta et al. (2012) used a lower threshold (e.g. 4), with
higher a-priori GPS noise level though. Even though, all the above studies have proposed
successful and reliable trigger techniques for GPS data, there is a delay in the detection of the
seismic signal in the GPS data, mainly due to the relatively high thresholds criteria (e.g. 28
sec delay for the Tohoku-Oki 2011 case study in Colombelli et al., 2013).
RT-SHAKE is based on a processing strategy that is similar to the STA/LTA, coupled
by a spatial data analysis, which aims to detect seismic motion more sensitively and robustly.
Downloaded from https://academic.oup.com/gji/advance-article-abstract/doi/10.1093/gji/ggy198/4999902by Nottingham University useron 21 May 2018
More specifically, contrary to other existing detection algorithms (Allen and and Ziv, 2011;
Ohta et al., 2012), once RT-SHAKE detected a seismic signal, it assesses the reliability of the
detected seismic signal, by checking for detections of consistent seismic signal at surrounding
stations in a short time interval. The spatial check is used to eliminate the impact of site-
specific GPS errors, such as outliers, multipath, cycle slips, etc. which could not be filtered by
the STA/LTA algorithm but should not also characterise the GPS displacement time-series of
surrounding stations (Ohta et al., 2012). The detection algorithm runs separately on all local
reference frame components (East, North and Up) at each GPS site in order to make more
sensitive the procedure to the detection of small displacement which can appear initially only
to one of the three components, depending on the seismic waves directivity and considering
also the different noise level between the horizontal and the vertical component (Psimoulis et
al., 2015). The algorithm is applied epoch by epoch, considering that the GPS records are
sampled at 1Hz.
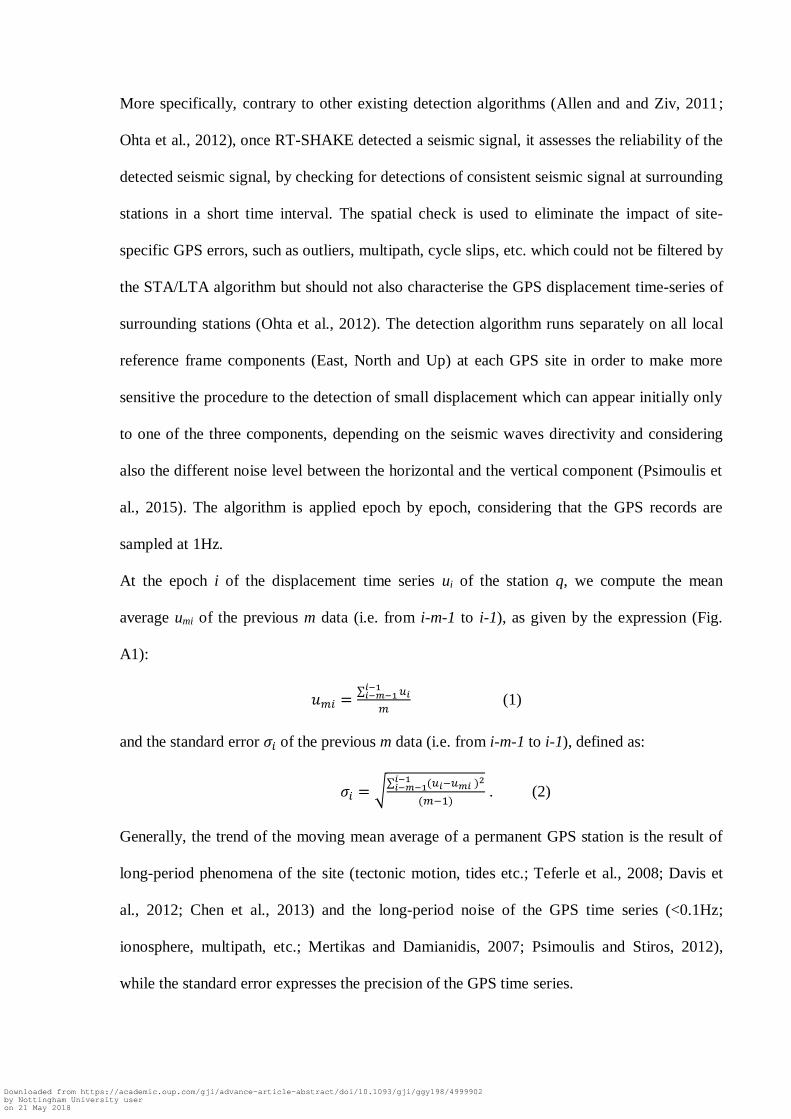
At the epoch i of the displacement time series ui of the station q, we compute the mean
average umi of the previous m data (i.e. from i-m-1 to i-1), as given by the expression (Fig.
A1):
∑
(1)
and the standard error of the previous m data (i.e. from i-m-1 to i-1), defined as:
√∑
. (2)
Generally, the trend of the moving mean average of a permanent GPS station is the result of
long-period phenomena of the site (tectonic motion, tides etc.; Teferle et al., 2008; Davis et
al., 2012; Chen et al., 2013) and the long-period noise of the GPS time series (<0.1Hz;
ionosphere, multipath, etc.; Mertikas and Damianidis, 2007; Psimoulis and Stiros, 2012),
while the standard error expresses the precision of the GPS time series.
Downloaded from https://academic.oup.com/gji/advance-article-abstract/doi/10.1093/gji/ggy198/4999902by Nottingham University useron 21 May 2018

The instantaneous displacement di of the epoch i is computed with respect to the mean
average umi :
. (3)
The noise level of the GPS time series is a function of the standard error and of parameter
k, which defines the amplitude of the threshold, given by the expression (Fig.2c):
(4)
We compare the noise of the time series ni against the displacement di (Fig. 2c). If the norm of
the instantaneous displacement is larger than the noise level ni, it means that the short-
period displacement di is larger than the corresponding long-period noise level and di can be
flagged as “potential displacement”, otherwise the algorithm initialise for the next epoch i+1.
However, in case of “potential displacement” at epoch i, which might be the result of
site-specific anomaly, due to GPS error (i.e. cycle slip, multipath, interference, etc.) or local
ground instability (i.e. unstable foundation, etc.), the algorithm searches for consistent
detection of “potential displacement” at other GPS stations, which are lying in a distance less
than R from the station q of the detected “potential displacement” within the next T seconds
(Fig. 2d). The time interval of T seconds is given by the equation:
(6)
where V corresponds to the velocity of the seismic surface waves (i.e. Rayleigh, Love).
Practically, the time interval T expresses the needed travel time of the seismic surface waves
to spread to the entire examined neighbouring GPS station area. Since the surface waves are
assumed as the relative slowest seismic waves (Shearer, 1999) this time period corresponds to
the maximum period in which the seismic signal should be detected at neighbouring stations.
To avoid potential inconsistencies in the detection due to GPS site-specific
dependencies and local effects (e.g. GPS signal outliers, local skyview masks, bedrock
instability), the algorithm computes the ratio of the number of the GPS sites, in which
Downloaded from https://academic.oup.com/gji/advance-article-abstract/doi/10.1093/gji/ggy198/4999902by Nottingham University useron 21 May 2018
consistent “potential displacement” is detected, to the total number of the neighbouring GPS
stations. If this ratio is higher than a pre-defined threshold w, which ranges between 0 and 1,
then the “potential displacement” corresponds to real seismic displacement, otherwise the
algorithm initialise from the beginning for the next epoch i+1. However, if there is continuous
result of „potential displacement‟ from a specific GPS site or a group of GPS sites, but still the
ratio is lower than the threshold, this would be the result of real displacement due to local
ground displacement or foundation instability or result of artefact of the GPS solution due to
weak satellite constellation (Mao et al., 1999; Williams et al., 2004; Msaewe et al., 2017),
signal interference (Williams et al., 2004; Wu et al., 2015) or cycle slip and re-convergence of
the PPP solution (in case of one GPS-site only; Li et al., 2011). In the above cases, the local or
site-specific anomaly observed in the GPS solution will be flagged but not as seismic motion.
Furthermore, during the spatial search there is no correlation between the direction of
the detected displacement of the GPS sites. Hence, there is no evaluation whether the detected
displacement follow a specific patter, which would reflect the ground deformation due to a
specific fault type (normal, strike-slip, etc.). Potentially, for specific GPS networks in an area
of well-known and studied seismic faults, this correlation could be applied, limiting even
further the false alarms.
In this study, the performance of RT-SHAKE is evaluated in detecting the arrival of
the seismic waves using only the GPS network records of the Mw9.0 Tohoku-Oki 2011
earthquake, producing ground motion of various amplitude (from few cm up to m) along the
GPS network. The performance of RT-SHAKE is assessed against the corresponding
estimated time arrival from the strong motion networks of Japan, KiK-net and K- NET.
Downloaded from https://academic.oup.com/gji/advance-article-abstract/doi/10.1093/gji/ggy198/4999902by Nottingham University useron 21 May 2018
3. Data
3.1 Strong-motion data
The strong-motion networks K-NET (Kyoshin network) and KiK-net (KIBAN
kyoshin network), both operated by the National Research Institute for Earth Science and
Disaster Prevention (NIED), consist of 1034 and 669 seismometers, respectively (Aoi et al.,
2011). The K-NET stations are installed on thick sediments, while the KiK-net stations are
located on rock or thin sediments, as they are designed for highly sensitive seismic
observation (Aoi et al., 2004). Furthermore the K-NET stations are installed at the ground
surface, while the KiK-net stations are consisted of two sensors, one installed on ground
surface and on at the bottom of the boreholes of 100-200m depth.
Both networks consist of the same instrumentation, using V403 or V404 tri-axial
force-balance accelerometer (450 Hz frequency and 0.707 damping factor). The recording
frequency of the sensors is 100 Hz, with pre-set triggering threshold of 2gals and 0.2gals for
the K-NET and KiK-net sensors, respectively (Aoi et al., 2004). The minimum and maximum
duration is 120 and 300 seconds, respectively, including 15 seconds of pre-triggering data.
The earthquake of MW9.0 Tohoku 2011 was successfully recorded by both networks,
with available strong-motion records from 700 KiK-net sites and 525 K-NET sites. The
records, consisted of north, east and vertical component for each site, were of 100 Hz
recording frequency and duration up to 300 seconds. The acceleration of the each site derived
by correcting the raw data from the gain and transforming the recording time, which was
initially given in UTC time (i.e. time difference of 15 leap seconds) into GPS time. Only the
ground surface sensors of the KiK-net were used for the analysis, in order to be consistent
with the records of the K-NET and GPS.
Downloaded from https://academic.oup.com/gji/advance-article-abstract/doi/10.1093/gji/ggy198/4999902by Nottingham University useron 21 May 2018
3.2 GPS Data
The GNSS network of Japan, which is known as GNSS Earth Observation Network
System (GEONET-Japan) and operated by the Geospatial Information Authority of Japan
(GSI), consists of more than 1200 continuously observing GNSS stations, covering the
Japanese land area with 20km average distance between neighboring GNSS sites (Sagiya,
2004).
The MW9.0 earthquake of Tohoku on March 11, 2011 was fully recorded by
GEONET. GPS records from 847 GEONET stations of 15-hour duration and 1Hz sampling
rate, covering the period of the earthquake, were available. The GPS records have been
processed using the scientific Bernese GPS Software 5.2 (Dach et al., 2007). The data were
post-processed in a Precise Point Positioning (PPP) mode using a-priori information of
highest quality from the Center for Orbit Determination in Europe (Dach et al., 2009; Bock et
al., 2009) resulting to the displacement time series in North, East, and Up component of 1Hz
sampling rate. The minimum elevation angle of the processing was 15o to avoid the impact of
the low satellites (i.e multipath, troposphere, etc.) which could limit the GPS data quality
(Kawamoto et al., 2016)
4. Results
4.1 Noise level and ground response based on the GPS data
A preliminary analysis of the GPS time series was conducted to estimate the noise
level of the GPS records, which were then used to define the thresholds for the detection
algorithm. More specifically, the GPS time series of the Tohoku-Oki Mw9.0 2011 earthquake
were analysed to estimate the noise level of each GPS component (North, East, vertical),
computed as the standard deviation of 10-minute period prior to the time of the earthquake. In
Figure 3a are presented the histograms of the noise level of each component of the GPS sites,
Downloaded from https://academic.oup.com/gji/advance-article-abstract/doi/10.1093/gji/ggy198/4999902by Nottingham University useron 21 May 2018
where for their majority the noise level of east and north component does not exceed the 3-
4mm, while for the vertical component does not exceed 7-8mm. The analysis of the RTK
solutions of the same GPS records, which are in real-time and used in Wright et al (2012),
resulted to similar noise level for all the components (Fig 3b), indicating that both GPS
solutions (real-time and simulated PPP near real-time) achieved similar accuracy expressed by
the same noise level.
Furthermore, the analysis of the GPS PPP and RTK solutions for 10s and 50s after the
time of the earthquake (t0) indicates that (i) for t0+10s there is no evidence of ground
response in the GPS data, as the seismic waves had not reached the locations of the GPS sites
at that moment, reflecting that the GPS data are in the corresponding noise level and (ii) for
t0+50s there is strong ground response above the noise level for ~70 GPS sites of the GPS
network, which cover the area up to 250 km from the epicentre, which are expected to be
affected for the given time-period from the propagation of the seismic waves. Thus, it seems
that the GPS time series can express reliably the ground response, exceeding the noise level in
case of strong ground motion, and reflect the impact of the propagation of the seismic motion
through the GPS network. Also, the agreement between the amplitude of the ground response
for the two different GPS solutions (i.e. simulated Bernese-PPP near real-time and RTK
solution) reveals the reliability of the GPS estimation for the strong ground motion, regardless
the processing mode (i.e. PPP near real-time, real-time).
4.2 Detection by strong-motion networks
From the application of the STA/LTA algorithm to the strong-motion records derived
the triggering time and the corresponding acceleration time series. By analysing and plotting
the triggering time of the strong-motion sensors versus their corresponding distance from the
epicentre, where as positive and negative distance is expressed the distance of the sites
Downloaded from https://academic.oup.com/gji/advance-article-abstract/doi/10.1093/gji/ggy198/4999902by Nottingham University useron 21 May 2018

northern and southern from the epicentre respectively, we find that (Fig. 4):
i) linear trend of the detection of the seismic wave is observed both for the K-NET and
KiK-net network, but is more uncertain with the increase of the distance from the
epicentre.
ii) The linear trends of the two networks slightly deviate, indicating difference in the
detection of the seismic wave propagation. Specifically, the detection of the KiK-net
network seems to be slightly faster and more sensitive, due to the different triggering
mechanism of the KiK-net sensors (Fig. 4a, 4b).
iii) There are sites where the strong-motion sensors appear delayed triggering (Fig. 4a and
4b; symbolised by triangles). The delayed triggering could be due to malfunction of the
corresponding sensors, attenuated seismic signal or even local effect. The majority of the
delayed-triggered strong-motion sensors corresponded to records of duration less than
250 seconds.
For the current study were used only the strong-motion sensors with duration of 300sec and
consistent triggering following the linear trend, in order to make objective comparison with
the GPS network detection.
4.3 Detection of spatially consistent motion by a GPS network
The RT-SHAKE algorithm was developed in the framework of Bernese GPS Software
5.2 and was applied separately to each component (North, East, Up) of the 847 available GPS
sites time series. The method was specified for the detection of the seismic motion of Tohoku
Mw9.0 earthquake using the Japan GEONET data. Five parameters of the algorithm were
defined based on previous studies and the characteristics of the GPS network of the case
study. More specifically, the parameters which were defined are:
1) the number of epochs m=80. The parameter m was used to limit low-frequency noise (i.e.
Downloaded from https://academic.oup.com/gji/advance-article-abstract/doi/10.1093/gji/ggy198/4999902by Nottingham University useron 21 May 2018
<0.1Hz) of the GPS time series and was based on models of GPS noise (Teferle et al.,
2008; Psimoulis and Stiros, 2012; Moschas and Stiros, 2013) and the corresponding
parameter of similar studies (Allen and Ziv, 2011; Colombelli et al., 2013).
2) The threshold k=3, which defines the threshold for the motion detection. The defined
values k corresponds to the 3σ-zone which expresses a conservative noise zone of the
GPS time series defined by the 99% data of for the given interval (Psimoulis and Stiros,
2012); value exceeding this zone is not considered as regular time series noise, but as
outlier or potential displacement signal. The noise zone of the GPS time series did not
exceed the limit of 1.5cm, suggested as threshold of the early-warning system by
Colombelli et al. (2013).
3) The radius of the searching area R=30km. The radius selection is consistent with the 20km-
station-distance design of the GPS network in Japan (Sagiya, 2004) and limit the cases
where the searching area consists of less than three stations, in order to avoid false alarms
(Kawamoto et al., 2017) and retain also the fast performance of the detection.
4) The seismic velocity V=3km/s. This parameter is based on the typical low limit of the
velocities of the surface waves (Shearer, 1999), as observed for the 2011 Tohoku-oki
event.
5) The threshold w=0.8 for the first GPS station detection, which is relative high in order to
make the algorithm robust, and w=0.6 for the rest GPS stations, to enhance the sensitivity
the detection for the GPS-sites far from the epicentre where the seismic signal is attenuated
and local-site effects may influence the GPS records. The threshold w was defined based
on the geometry and density of the GPS network and after several tests.
From the kinematic time series of the 847 GPS stations derived the detection of the seismic
signal, expressed in time with reference the official USGS earthquake time. The first detection
of seismic signal is completed using the data collected by the GPS station 0550 (Fig. A2), the
Downloaded from https://academic.oup.com/gji/advance-article-abstract/doi/10.1093/gji/ggy198/4999902by Nottingham University useron 21 May 2018
closest GPS site to the epicentre, 23 seconds after the official USGS earthquake origin time
(05:46:24 UTC, http://earthquake.usgs.gov/earthquakes/eqinthenews/2011/usc0001xgp/) and
about 7 seconds after the detection of the collocated strong-motion K-NET site MYG011
(Lat: 38.30119, Long: 141.50069). The seismic displacement was firstly detected at the east
component of the GPS time series with amplitude 1.1cm (di), while the corresponding noise
level (ni) was of ~0.9cm (σi ~0.3cm).
The performance of the detection algorithm for various values of the parameters m
(10-150), k (2.5-4), R (20-40) and w (0.4-1) was also examined. The detection results were not
significantly affected by the variation of the parameters k and R, apart from some GPS sites
mainly far from the epicenter and/or isolated GPS-sites. The reduction of the parameter w to
values below 0.5 led to partly unreliable seismic signal detection especially for the regions of
the network far from the epicentre (R>400-500km), where the seismic signal is attenuated.
Regarding the parameter m, it was observed that for values lower than 30 (i.e. 30sec window)
or higher than 120 (i.e. 2min window), the low-frequency noise of the GPS time series was
not modelled effectively, leading to overestimation of the low-frequency noise and delays in
motion detections (for low m) or underestimation of the low-frequency noise, which was not
filtered properly causing false detection, respectively.
Generally, from the five parameters of the RT-SHAKE algorithm, parameters w and R
are network-specific, parameter m depends on the GPS noise characteristics, which can be
GPS site-specific and parameters k and V follow commonly applied techniques and
assumptions. Thus, mainly the parameters (w, m, R) should be adjusted based on GPS time
series and the GPS network of the monitoring application, in order to limit the impact of the
GPS noise and have adequate number of GPS sites (three based on this case study) on the
spatial search to avoid the false detections.
Downloaded from https://academic.oup.com/gji/advance-article-abstract/doi/10.1093/gji/ggy198/4999902by Nottingham University useron 21 May 2018

5. Analysis and comparison of GPS with strong-motion data
The comparison of the detection times of ground motion by the two strong-motion
networks (KiK-net and K-NET) and the GPS network shows similar pattern of propagation of
the seismic signal through the networks (Fig. 4a-c) with clear differences though between the
detection times of the three networks, reflected also in the corresponding linear trends.
Specifically, the linear trends of the southern and northern KiK-net network of the epicentre
correspond to velocity of 6.15km/s and 6.08km/s, respectively, while the corresponding
velocities for the K-NET network are 5.93km/s and 5.85km/s, respectively. For the GPS
network, the corresponding apparent velocities of the linear trends are 5.81m/s and 5.70km/s,
respectively. The difference of the velocity between KiK-net and K-NET networks is due to
the lower triggering mechanism and higher sensitivity of KiK-net sensors. As expected, the
GPS detection proves to be less sensitive but still consistent with the detection of the strong-
motion networks.
The main difference between the GPS and the strong-motion network-based detections
resides in the presence of a second linear trend which appears in the southern GPS sites for
>600km distance from the epicentre (Fig. 4c). This linear trend-cluster is parallel to the linear
trend-cluster of the rest of the southern GPS sites, corresponding to velocity 5.8km/s,
appearing though a time delay of ~35sec. The same estimated velocity of the two clusters
means that these GPS sites detect seismic wave of the same type. The relative large time
difference of 35sec excludes the possibility of detecting reflective or refracted seismic waves
by the second cluster sites (Shearer, 1999), reinforcing the possibility of detecting a second
seismic event, which triggered the south-eastern GPS sites of the network (Fig. 4f; GPS sites
in the ellipse).
The later is consistent with the suggestion that the Tohoku 2011 earthquake consisted
of more than one rupture events (Suzuki et al., 2011; Maercklin et al., 2012, Koketsu et al.,
Downloaded from https://academic.oup.com/gji/advance-article-abstract/doi/10.1093/gji/ggy198/4999902by Nottingham University useron 21 May 2018
2011). The common conclusion of the studies of Suzuki et al., (2011) and Koketsu et al.,
(2011) is the existence of three ruptures, with the first two of them close to the epicentre of
the mainshock and the third one south-southwest from the initial epicentre in a distance of
~150-180km (Koketsu et al., 2011). More specifically, Suzuki et al. (2011) proposed that the
Tohoku-oki rupture was composed of three slip patches, as they observed two distinct wave
groups with 40 sec relative time difference and a third distinct wave group propagating from
Fukushima prefecture, about 50sec after the first rupture, in a longitudinal section parallel to
the fault rupture (see Figure 2 in Suzuki et al., 2011).
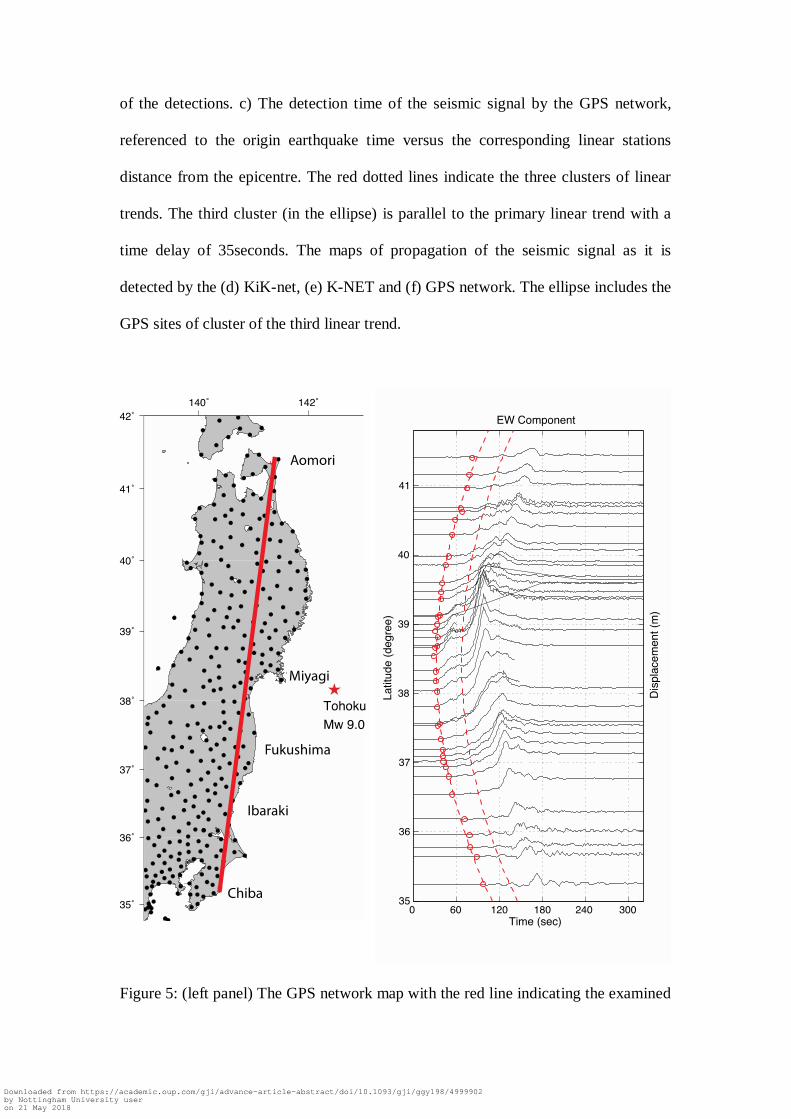
Following the same approach with Suzuki et al., (2011) and making the corresponding
section at the GPS network, the displacement waveforms of the EW component were formed,
ordered by station latitude (Fig. 5a). Based on the detection time and the GPS displacement
waveform is observed:
i) a parabolic pattern of detection, reflecting the parabolic propagation of the seismic signal
along latitude similarly with that derived from Suzuki et al., (2011) and
ii) a two step responses pattern at the stations of the Miyagi prefecture (Fig. 5b), expressing
the response of the sites caused by the two successive ruptures.
The time difference of the two-steps responses is approximately ~40 sec, as they defined by
the two parabolic curves (Fig. 5b), which is more evident for the GPS sites close to the
Miyagi prefecture (GPS site 0550; Fig.A2), which again confirms that the second step-
response is not seismic wave reflection. Additionally the relative displacement of the two
responses reveal that the second rupture was dominant to the east direction and decreases
drastically as moving away from Miyagi prefecture, satisfying the propagation of the model
of the second rupture by Koketsu et al. (2011).
For more direct and objective comparison of the detection of the three networks, the reduced
travel time of the seismic signal was computed. More specifically, the reduced time travel for
Downloaded from https://academic.oup.com/gji/advance-article-abstract/doi/10.1093/gji/ggy198/4999902by Nottingham University useron 21 May 2018
each site of every network is given by the expression:
(7)
where t is the detection time with reference the origin earthquake time, d the distance of the
site from the epicentre and vref the reference velocity of the seismic signal propagation.
Practically, the reduced travel time expresses the relative delay of the detection having as
reference the required travel time of a seismic wave. In our analysis the reference velocity
was 6.15km/s corresponding to the highest velocity of the linear trends, detected by the KiK-
net network. By plotting the reduced travel time versus epicentre distances for the three
networks (Fig 6a) and the corresponding time detection of the networks map (Fig. 6b) is clear
that:
i) the time delay between the GPS and the strong-motion networks KiK-net and K-NET is
~10 and ~5 seconds, respectively. The time delay remains constant for distance up to
300km from the epicentre.
ii) The GPS detection delay increase with the distance from the epicentre (>400km), due to
the attenuated displacement seismic signal for sites far from the epicentre.
iii) The seismic signal detections become more scatter with the increase of the distance. The
latter is more evident for the northern sites and distances >400km from the epicentre.
iv) There are strong-motion sites corresponding to higher velocity than the reference,
especially northward from the epicentre (black dots in Fig. 6b).
6. False alarms
To evaluate the robustness of the RT-SHAKE algorithm and its effectiveness in
avoiding false alarms, the algorithm was applied in the ~4-hour period before the earthquake,
corresponding to 15000 GPS samples (i.e. 1sps). For the given period, potential flagged alarm
could be considered as false alarm, since there was no documented ground motion. Using the
Downloaded from https://academic.oup.com/gji/advance-article-abstract/doi/10.1093/gji/ggy198/4999902by Nottingham University useron 21 May 2018

same parameters as for the detection of the seismic motion propagation, there were nine
events of false alarms in the ~4-hour period. The nine false alarms occurred totally in 17 GPS
sites (Table 1; Fig. 7), with six false alarms occurring in four GPS sites (GPS sites 0582,
0583, 0627, 2110). Furthermore, in all cases of false alarms there were at least two GPS
stations, which fulfilled the two conditions of the algorithm (di>ni and w>0.8 or 0.6), with
apparent displacement ranging between 1-2cm. The GPS stations of the false alarms were at
the south-eastern part of the GPS network (i.e. close to Tokyo) , where the density of the GPS
network is significantly high.
The false alarms seemed to be the result of local effects, which had impact in
relatively closely-spaced GPS sites and led to poor quality of GPS solution, producing
anomalies in the time series, which cannot be modelled and are identified as potential ground
motion (Msaewe et al., 2017). More specifically, in most false alarm events, which were
triggered systematically by specific GPS sites (i.e. 0582, 0583, 0627, 2110), the azimuth of
the detection motion was continuously decreasing with time, indicating that the shift of the
detected motion can be related to the satellite constellation (Houlié et al., 2011). Hence, the
apparent detected motion could be the result of the impact of a satellite signal and/or potential
local interference in the GPS solution, as the azimuth of the detected motion-anomaly on the
GPS solution follows the movement of the problematic satellite on its orbit. For instance, for
the GPS sites 0583, 0582, 0627 and 2110 which are closely-spaced (in-between-distance less
than 30kn), the azimuth of the falsely detected ground motion decreases constantly about 10o-
13o (azimuth ranges between 108
o and 123
o for the four GPS sites), indicating that both GPS
sites are apparently affected by the same problem of the satellite constellation.
To enhance the performance of the RT-SHAKE algorithm and make it more robust, an
additional (third) check could be to correlate the detected motion with the time series of the
dilution-of-precision (DOP) values of the satellite constellation and the signal-to-noise (SNR)
Downloaded from https://academic.oup.com/gji/advance-article-abstract/doi/10.1093/gji/ggy198/4999902by Nottingham University useron 21 May 2018
of the satellite signals. More specifically, the DOP values and the SNR, which express the
quality of the satellite constellation and the satellite signal, respectively, indicate potential
sudden changes which could affect the GPS solution. In case the detected motion coincides
with the sudden change of DOP and/or SNR values, then this would indicate that the detected
motion is the artefact of poor GPS solution.
7. Discussion
It is shown that the RT-Shake time delays are the result of: i) the time required (15s)
for the seismic waves to reach the GPS antenna's location and ii) the required time for the
accumulation of the displacement above the noise level of the GPS data, which depends on
the distance from the epicenter and the strength of the seismic event, as the displacement is
associated mainly with S and surface waves. However, both limitations could be addressed by
densification of the GPS networks. The high GPS noise level relatively to the low strong-
motion sensor noise level results to the time delay of the seismic signal detection by the GPS
relatively to that of the strong-motion detection. Indicative is the case of the GPS site 0550
(Fig. A2), which is issuing a motion warning ~7 seconds after the detection of collocated
strong-motion sensor (MYG011), due to the accumulated displacement above the noise level
(~1cm). However, the current time delay of the GPS detection is consistent and even slightly
smaller than that of other studies (Colombelli et al., 2013), mainly due to the second spatial
check, which allows to lower of the noise level of the GPS time series by retaining
simultaneously the robustness of the algorithm.
Largest time delays are observed in the northern GPS network (Fig. 6b), which
reaches up to 50sec far from the epicentre (800km; Fig 6a) can be explained by the strong
directivity of the source pulse propagation in the east direction (Koketsu et al., 2011). The
directivity made less effective the detection by the GPS network relative to the more sensitive
Downloaded from https://academic.oup.com/gji/advance-article-abstract/doi/10.1093/gji/ggy198/4999902by Nottingham University useron 21 May 2018
KiK-net and K-NET. Furthermore, the propagation of the rupture toward the east and the
location of the third rupture southward from the first two (Suzuki et al., 2011; Koketsu et al.,
2011) explain the slightly smaller propagation velocities of the northern network than the
southern. The few KiK-net sites, illustrated as black dots in Fig. 6b, correspond to detection of
seismic wave of higher velocity than the reference; the latter is probably the result of the
faster propagation of the first rupture northward (Koketsu et al., 2011), which is detected.
The time delay between the GPS and the strong-motion network detection times
confirms the higher noise level of PPP GPS (~1cm) than the seismic sensors for real-time
detection. Potentially, a smaller magnitude (i.e. Mw7.0) occurred at the location of the
Tohoku 2011 earthquake could have been detected with greater delay, as more time would be
required for the accumulation of ground motion to exceed the threshold of the GPS noise
level; this was the case for the study of Allen and Ziv (2011) for the El-Mayor Cucapah
Mw7.2 2010 earthquake case study.
Regarding the seismic wave propagation velocities, the highest one derived by the
KiK-net network (6.15km/s), corresponding to typical velocity of P-wave of earthquake
(Shearer, 1999), and indicates that the KiK-net network detected the P-wave of the seismic
signal. The group velocities of the GPS network linear trend (Fig. 6a) is slightly lower
(5.8km/s), suggesting though that the GPS network detects the accumulated displacement
which corresponds to the P-wave signal.
By plotting the GPS detection at the time-history of the radial displacement of the
GPS sites versus epicentre distance (Fig. A3) derives the consistent detection of the seismic
wave for <400km distance from epicentre, while for larger distances the detection pattern
keeps following the seismic waves propagation and becomes more complicated mainly due to
the several ruptures and the mixture of several seismic signals. More specifically, in northern
GPS network, where there is strong attenuation of the seismic signal due to the directivity of
Downloaded from https://academic.oup.com/gji/advance-article-abstract/doi/10.1093/gji/ggy198/4999902by Nottingham University useron 21 May 2018
the rupture, the GPS network detects, for distance larger than 400km from the epicentre,
seismic signal of lower velocity than P-waves, as soon as the displacement exceeds the noise
level. On the contrary, the southern GPS network detected reliably the seismic signal, which
corresponds to the P-waves of the first rupture even for GPS sites (south-western end of the
GPS network) >600km far from the epicentre, where the static displacement signal was rather
low (<5-10cm) and close to the noise level. The developed detection algorithm, using the
noise level and spatial checks, allowed the consistent and coherent detection of the seismic
displacement through the GPS network, indicating also through the detection the spatial
characteristics of the seismic waves propagation.
Finally, by using the ground motion prediction model (GMPE; stochastic model) for
Japan (Poggi et al., 2013) it can be determined the root-mean-square (RMS) displacement,
using the static motion above 20s where the displacement spectrum is flat, and how the RMS
displacement varies with the distance from the epicenter (Figure 8). Based on the GMPE, the
average noise level (~1cm) of the GPS sites and the density (~20km) of the current GPS
network, the GPS network could detect seismic motion for earthquakes >MW6.0. By
considering though, the false detections of the GPS network (Table 1) and based on the
assumption that the potential earthquake indicated by the false alarms are located in the
middle of the triggered GPS sites, the lowest threshold of the earthquake magnitude where the
RT-SHAKE algorithm can be used reliably, is for magnitude >MW6.5. However, the
performance of the RT-SHAKE algorithm and the lowest threshold of the earthquake
magnitude, where the algorithm can be used, depend on the GPS network geometry and the
quality of the GPS solutions.
8. Conclusion
We successfully present RT-SHAKE, an algorithm designed to detect surface motions
Downloaded from https://academic.oup.com/gji/advance-article-abstract/doi/10.1093/gji/ggy198/4999902by Nottingham University useron 21 May 2018

using GNSS real-time data streams. The testing and calibration of RT-SHAKE using Tohoku
MW9.0 2011 earthquake dataset revealed that the GPS network data can be used to detect
ground motion larger than 1-2cm with great robustness; the displacements of the ground
motion may correspond to a wide range of geohazards (e.g. large earthquakes, landslides, cliff
collapses). RT-SHAKE based on GPS data proved to be consistent with results derived by the
KiK-net and K-NET strong motion networks and due to the exceptional dimensions of the
Tohoku-oki 2011 earthquake, the GPS network detected displacements corresponding to P-
waves. The delay of ~5-10s in the detection of the ground motion relatively to the strong
motion networks due to the higher noise level of the GPS time series.
The two-stage checks of the RT-SHAKE algorithm aim to eliminate the false alarms by
resolving problems of outliers or GPS site-specific effect. The checks of the RT-SHAKE
algorithm manage to limit the false alarms to nine for the period prior to the earthquake,
corresponding to GPS time series of ~15000 samples. The false alarms still occur, due to
triggering by GPS-sites, which are affected by poor satellite constellation or problematic
satellite(s) (Msaewe et al., 2017). However, this weakness can be resolved by using additional
parameters, such as the DOP values or the SNR of the satellite signals, to evaluate whether a
potential detected motion is real or an artefact of the GPS solution due to the satellite
constellation, the satellite signal and/or local interference (Msaewe et al., 2017, Peppa et al.,
2018). Additional techniques for the long-term analysis of the GPS time series, such as neural
networks, may be used to enhance the modelling of the GPS time series and limit number of
false alarms (Kaloop and Hu, 2015). Since the algorithm is developed to be able for
application also in other sensors (i.e. seismic sensors, tiltmeters, etc.), potential triggered GPS
sites could be spatially checked with additional sensors of other monitoring networks, to limit
even further the false alarms.
The developed algorithm can be used not only for the detection of the ground
Downloaded from https://academic.oup.com/gji/advance-article-abstract/doi/10.1093/gji/ggy198/4999902by Nottingham University useron 21 May 2018
deformation due to earthquakes, but also for the direct monitoring of other types of
geohazards related to motion (e.g. landslides, tsunamis, volcanoes), through the detection of
the propagated motion. The GPS detection may be delayed with respect other sensors (i.e.
seismic sensors, accelerometers, etc.), but still provide prompt information about the severity
and the spatial characteristics of a given event. Following appropriate modifications the same
code may be applied to real-time data from seismic data and/or other sensors to monitor
geohazards,
The developed method and its parameters were adjusted for the GEONET-Japan
network dense network and this mega-earthquake. Further improvements and adjustments
may be required for its application in case of different GPS networks and earthquakes of
smaller magnitude or for monitoring other types of ground deformation (i.e. landslides,
geothermal activities, etc.).
In the future, the GPS ground motion detection could be further enhanced by using
higher sampling rate (i.e. 5Hz), which will refine the precision of the GPS detection, thanks to
the enhanced time resolution, and allow more accurate estimations of ground motion and of
the earthquake characteristics (Michel et al., 2017). For earthquakes close to the lowest
threshold of 6.5 < MW < 7, the detection will be still achieved with similar coherency and
consistency, with potential detection delay for the relatively small seismic ground motion.
Thus, even though the relatively delay, the GPS network can perform coherently with the
seismic network in early warning systems, and can supplement the existing seismic networks
and contribute towards efficient EEW systems.
Acknowledgements
This study has been supported by Swiss National Fund grants in the framework of the projects
“High-rate GNSS for Seismology” project (200021/130061) and “Seismology with GPS:
Downloaded from https://academic.oup.com/gji/advance-article-abstract/doi/10.1093/gji/ggy198/4999902by Nottingham University useron 21 May 2018
Mapping the Earth‟s interiors with geodetic observations” (200021/143605). This work has
been supported by Prof. Dr. Giardini (ETH-Z). The manuscript was benefited by the
comments of three anonymous reviewers.
References
Allen, R.V., 1978. Automatic earthquake recognition and timing from single traces,
Bull. Seism. Soc. Amer., 68(5), 1521-1532.
Allen, R.M., Kanamori, H., 2003. The potential for earthquake early warning in
Southern California, Science, 300, 786-789.
Allen, R.M., Gasparini, P., Kamigaichi, O., Böse, M., 2009. The status of earthquake
early warning aroung the world: An introductory overview, Seism. Res. Lett., 80(5),
682-693.
Allen, R.M., Ziv, A., 2011. Application of real-time GPS to earthquake early warning,
Geoph. Res. Let., 38, L16310.
Aoi, S., Kunugi, T., Fujiwara, H., 2004. Strong-motion seismograph network operated
by NIED: K-NET and KiK-net, J Jap. Ass. Earthq. Eng., 4(3), 65-74.
Aoi, S., Kunugi, T., Nakamura, H., Fujiwara, H., 2011. Deployment of new strong
motion seismographs of K-NET and KiK-net, in Earthquake Data in Engineering
Seismology, Geotech. Geol. Earthquake Eng., 14, 167-186.
Avallone, A., Marzario, M., Cirella, A., Piatanesi, A., Rovelli, A., Di Alessandro, C.,
D‟Anastasio, E., D‟Agostino, N., Giuliani, R., Mattone, N. 2011. Very high rate
(10Hz) GPS seismology for moderate magnitude earthquakes: The case of Mw 6.3
L‟Aquila (central Italy) event, J. Geophys. Res., 116, B02305, doi:
10.1029/2010JB007834
Benoit, L., Briole, P., Martin, O., Thom, C., Malet, J.P., Ulrich, P., 2015. Monitoring
Downloaded from https://academic.oup.com/gji/advance-article-abstract/doi/10.1093/gji/ggy198/4999902by Nottingham University useron 21 May 2018
landslide displacements with the Geocube wireless network of low-cost GPS, Eng.
Geol. 195(1), 111-121
Bertazzi, P.A., Zoccheti, C., Pesatori, A.C., Guercilena, S., Sanarico, M., Radice, L.,
1989. Ten-year mortality study of the population involved in the Seveso incident in
1976. Am J Epidemiol 129, 1187-1200.
Blewitt, G., Hammond, W.C., Kreemer, C., Plag, H.-P., Stein, S., Okal, E., 2009. GPS
for real-time earthquake source determination and tsunami warning systems, J
Geod., 83(3-4), 335-343.
Blum, P.A., Jobert, G., Jobert, N., 1959. Premiers résultats obtenus à l'aide
d'inclinomètres. Comptes Rendus Hebdomadaires Des Séances De L'Académie Des
Sciences 248, 1551-1554.
Bock, Y., Prawirodirdjo, L., and Melbourne, T., 2004. Detection of arbitrary large
dynamic ground motions with a dense high-rate GPS network. Geophys. Res. Lett.,
31, L06604.
Bock, H., Dach, R., Jäggi, A., Beutler, G., 2009. High-rate GPS clock corrections
from CODE: Support of 1Hz applications, J. Geod., 83(11), 1083-1094.
Bock, Y., Melgar, D., Crowell, W. 2011. Real-time strong-motion broadband
displacement from collocated GPS and accelerometers, Bull Seism. Soc. Am.,
101(6), 2904-2925. Doi: 10.1785/0120110007.
Bondarescu, R., Bondarescu, M., Hetenyi, G., Boschi, L., Jetzer, P., Balakrishna, J.,
2012. Geophysical applicability of atomic clocks: direct continental geoid mapping.
Geophys J Int 191, 78-82.
Bondarescu, R., Schärer, A., Lundgren, A., Hetényi, G., Houlié, N., Jetzer, P.,
Bondarescu, M., 2015. Ground-based optical atomic clocks as a tool to monitor
vertical surface motion. Geophys J Int 202, 1770-1774.
Downloaded from https://academic.oup.com/gji/advance-article-abstract/doi/10.1093/gji/ggy198/4999902by Nottingham University useron 21 May 2018
Branzanti, M., Colosimo, G., Crespi, M., Mazzoni, A., 2013. GPS near-real-time
coseismic displacement for the great Tohoku-oki earthquake, IEEE Geosc. Rem Sen
Lett, 10(2), 372-376.
Chen, Q., van Dam, T., Sneeuw, N., Collilieux, X., Weigelt, M., Rebischung, P.,
(2013). Singular spectral analysis for modeling signals from GPS time series, J
Geod, 72, 25-35.
Cirella, A., Piatanesi, A., Cocco, M., Tinti, E., Scognamiglio, L., Michelini, A.,
Lomax, A., Boschi, E., 2009. Rupture historiy of the 2009 L‟Aquila (Italy)
earthquake from non-linear joint inversion of strong motion and GPS data, Gephys.
Res. Lett., 36, L19304, doi:10.1019/2009GL039795. Colombelli, S., Allen, R.,
Zollo, A., 2013. Application of real-time GPS to earthquake early-warning in
subduction and strike-slips enviroments, J. Geoph. Res., 118, 3448-3461.
Crowell, B.W., Bock, Y., Squibb, M.B., 2009. Earthquake early-warning using total
displacement waveforms from real-time GPS networks, Seism. Res. Lett., 80(5):
772-782.
Dach, R., Hugentobler, U., Meindl, M., Fridez, P. 2007. The Bernese GPS Software
Version 5.0, Astronomical Institute, University of Bern, Switzerland.
Dach, R., Brockmann, E., Schaer, S., Beutler, G., Meindl, M., Prange, L., Bock, H.,
Jäggi, A., Ostini, L., 2009. GNSS processing at CODE: status report, J. Geod., 83(3-
4): 353-366.
Davis, J.L., Wernicke, B.P., Tamisiea, M.E. (2012). On seasonal signals in geodetic
time series, J Geoph. Res, 117, B01403.
Doi, K., 2011. The operation and performance of earthquake early warnings by the
Japan Meteorological Agency, Soil. Dyn. Earthquake Eng., 31, 154-162.
Edwards, B., Allmann, B., Fäh, D., Clinton, J., 2010. Automatic computation of
Downloaded from https://academic.oup.com/gji/advance-article-abstract/doi/10.1093/gji/ggy198/4999902by Nottingham University useron 21 May 2018
moment magnitudes for small earthquakes and the scaling of local to moment
magnitude, Geoph J. Inter., 183(1), 407-420.
Espinosa, J.M., Aranda, A., Cuéllar, Rodriguez, F.H., Frontana, B., Ibarrola, G., Islas,
R., Garcia, A., 2011. The seismic alert system of Mexico (SASMEX): Progress and
its current applications, Soil Dyn. Earthq. Eng, 31, 154-162.
Ferreira, S., Karali, B., 2015. Do Earthquakes Shake Stock Markets? PLOS ONE 10,
e0133319.
Fournier, N., Jolly, A.D. 2014. Detecting complex eruption sequence and
directionality from high-rate geodetic observations: The August 6, 2012 Te Maari
eruption, Togariro, New Zealand, J Volc Geoth Res, 286, 387-396
Ge, M., Gendt, G., Rothacher, M., Shi, C., Liu, J., 2008. Resolution of GPS carrier-
phase ambiguities in Precise Point Positioning (PPP) with daily observations, J.
Geod., 82(7): 389-399.
Geng, J., Bock, Y., Melgar, D., Crowell, B.W., and Haase, J.S., 2013a. A new
seismogeodetic approach applied to GPS and accelerometer observations of the
2012 Brawley seismic swarn: Implications for earthquake early warning, Geoch.
Geoph. GeosysT., 14(7), 2124-2142.
Geng, J., Melgar, D., Bock, Y., Pantoli, E., Restrepo, J., 2013b. Recovering coseismic
point ground tilts from collocated high-rate GPS and accelerometers, Geoph. Res.
Lett., 40 (19), 4095-4100.
Genrich, J.F., Bock, Y., 2006. Instantaneous geodetic positioning with 10-50 Hz GPS
measurements: Noise characteristics and implications for monitoring networks. J.
Geoph. Res., 111, B03403, doi: 10.1029.2005JB003617
Haberling, S., Rothacher, M., Zhang, Y., Clinton, J.F., Geiger, A. 2015. Assessment
of high-rate GPS using a single axis shake table, Journal of Geodesy, 89(7), 697-
Downloaded from https://academic.oup.com/gji/advance-article-abstract/doi/10.1093/gji/ggy198/4999902by Nottingham University useron 21 May 2018
709.
Heimlich, C., Gourmelen, N., Masson, F., Schmittbuhl, J., Kim, S.-W., Axxola, J.,
2015. Uplift around the geothermal power plant of Landau (Germany) as observed
by InSAR monitoring, Geoth. En., 3(1), 2
Houlié, N., Briole, P., Bonforte, A., Puglisi, G., 2006. Large scale ground deformation
of Etna observed by GPS between 1994 and 2001. Geophys Res Lett 33.
Houlié, N., Occhipinti, G., Blanchard, T., Shapiro, N., Lognonné, P., and Murakami,
M., 2011. New approach to detect seismic surface waves in 1Hz-sampled GPS time
series. Sci. Rep. 1(44).
Houlié, N. Dreger, D. and Kim, A., 2014. GPS source solution of the 2004 Parkfield
earthquake, Sci. Rep, 4, 3646.
Houlié, N., Woessner, J., Giardini, D. and M. Rothacher, (2018) Lithosphere strain
rate and stress field orientations across the Alpine arc in Switzerland,
accepted, Scientific Reports, 10.1038/s41598-018-20253-z.
Jokinen, A., Feng, S., Schuster, W., Ochieng, W., Hide, C., Moore, T., Hill, C., 2013.
Integrity monitoring of fixed ambiguity Precise Point Positioning (PPP) solutions,
Geo-spatial Information Science, 16(3), 141-148.
Kaloop, M.R., Hu, J.W., 2015. Optimizing the de-noise neural network model for
GPS time-series monitoring of structures, Sensors, 15(9), 24428-24444.
Kawamoto, S., Hiyama, Y., Ohta, Y., Mishimura, T., 2016. First result from the
GEONET real-time analysis system (REGARD): The case of the 2016 Kunamoto
earthquakes, Earth, Plantes and Space, 68(1), 190.
Kawamoto, S., Ohta, Y., Hiyama, Y., Todoriki, M., Nishimura, T., Furuya, T., Sato,
Y., Yahagi, T., Miyagawa, K., 2017. REGARD: A new GNSS-based real-time finite
fault modeling system for GEONET, Journal of Geophysical Research: Solid Earth,
Downloaded from https://academic.oup.com/gji/advance-article-abstract/doi/10.1093/gji/ggy198/4999902by Nottingham University useron 21 May 2018
122, 1324-1349, doi: 10.1002/2016JB013485
Kelevitz, K., Houlié, N., Giardini, D., Rothacher, M., 2017. Performance of high-rate
GPS waveforms at long periods: Moment tensor inversion of the 2003 M8.3
Tokachi-Oki earthquake, Bull. Seism. Soc. Am., doi:10.1785/0120160338
Koketsu, K., Yokota, Y., Nishimura, N., Yagi, Y., Miyazaki, S., Satake, K., Fujii, Y.,
Miyake, H., Sakai, S., Yamanaka, Y., Okada, T., 2011. A unified source model for
the 2011 Tohoku earthquake, Earth Planetary Science Letters, 310, 480-487.
Kristensen, L., Blikra, L. H., 2011. Monitoring displacement of the Mannen rockslide
in Western Norway, Proc. 2nd
World Landslide Forum, Rome, 3-7 October, 2015.
Larson, J.M., Bodin, P., Gomberg (2003). Using 1-Hz GPS data to measure
deformation caused by the Denali Fault Earthquake, Science, 300, 1421-1424.
Larson, K.M., 2013. A new way to detect volcanic plumes. Geoph Res Lett., 40 (11),
2657-2660
Lewis, M.A., Ben-Zion, Y., 2008. Examination of scaling between earthquake
magnitude and proposed early signals in P waveforms from very near source stations
in a South African gold mine, J. Geophys. Res., 113: B09305.
Li, X., Zhang, X., Ge, M. 2011. Regional reference network for augmented precise
point positioning for instantaneous ambiguity resolution, J Geod, 85(3), 151-158
Lienhart, W., 2015. Case studies of high-sensitivity monitoring of natural and
engineered slopes, J. Rock Mech and Geotech. Eng., 7, 379-384.
Llubes, M., Florsch, N., Boy, J.-P., Amalvict, M., Bonnefond, P., Bouin, M.-N.,
Durand, S., Esnoult, M.-F., Exertier, P., Hinderer, J., Lalancette, M.-F., Masson, F.,
Morel, L., Nicolas, J., Vergnolle, M., Wöppelmann, G., 2008. Multi-technique
monitoring of ocean tide loading in northern France. Comptes Rendus
Geoscience 340, 379-389.
Downloaded from https://academic.oup.com/gji/advance-article-abstract/doi/10.1093/gji/ggy198/4999902by Nottingham University useron 21 May 2018

Maercklin, N., Festa, G., Colombelli, S., Zollo, A., 2012. Twin ruptures grew to built
up the giant 2011 Tohoku, Japan, earthquake, Scientific Reports, 709(2), 1-7.
Mao, A., Harrison, C.G.A., Dixon, H.A. 1999. Noise in GPS time series, J Geoph
Res, 104, B2, 2797-2816.
Melgar, D., Crowell, B., Bock, Y., Haase, J. 2013. Rapid modeling of the 2011 Mw
9.0 Tohoku-oki earthquake with seismogeodesy. Geophys. Res. Lett. 40, 2963–
2968.
Mertikas, S. P., Damianidis, K.I. (2007). Monitoring the quality of GPS station
coordinates in real time, GPS Sol, 11, 119-128.
Michel C., Kelevitz K., Houlié N., Edwards B., Psimoulis P., Su Z., Clinton J.,
Giardini D., 2017. The potential of high-rate GPS for strong fround motion
assessment, Bull. Seism. Soc. Am., 107(3), doi:10.1785/0120160296
Michoud, C., Bazin, S., Blikra, L.H., Derron, M.-H., Jaboyedoff, M. 2013.
Experiences from site-specific landslide early warning systems, Nat. Haz. Ear. Syst.
Sci, 13, 2659-2673. Doi:10.5194/nhess-13-2659-2013.
Moschas, F., Stiros, S., (2013). Noise characteristics of high-frequency, short-duration
GPS records from analysis of identical, collocated instruments, Measurement, 46(4),
1488-1506
Moschas, F., Avallone, A., Saltogianni, V., Stiros, S.C. (2014). Strong motion
displacement waveforms using 10-Hz precise point positioning GPS: An assessment
based on free oscillation experiments, Earthquake Engineering and Structural
Dynamics, 43(12), 1853-1866.
Msaewe, H.A., Hancock, C.M., Psimoulis, P. A., Roberts, G.W., Bonenberg, L., de
Ligt, H. (2017). Investigating multi-GNSS performance in the UK and China based
on zero-baseline measurement approach, Measurement, 102, 186-199.
Downloaded from https://academic.oup.com/gji/advance-article-abstract/doi/10.1093/gji/ggy198/4999902by Nottingham University useron 21 May 2018
Newman, A.V., Stiros, S., Feng, L., Psimoulis, P., Moschas, F., Saltogianni, V., Jiang,
Y., Papazachos, C., Panagiotopoulos, D., Karagianni, E., Vamvakaris, D., 2012.
Recent geodetic unrest at Santorini Caldera, Greece, Geoph. Res. Lett., Vol. 39(6),
L06309
Ohta, Y., Meiano, I., Sagiya, T., Kimata, F., and Hirahara, K. 2006. Large surface
wave of the 2004 Sumatra-Andaman earthquake captured by the very long baseline
kinematic analysis of 1-Hz GPS data. Earth Planets Space 58, 153–157.
Ohta, Y., Kobayashi, T., Tsushima, H., Miura, S., Hino, R., Takasu, T., Fujimoto, H.,
Iinuma, T., Tachibana, K., Demachi, T., Sato, T., Ohzono, M., Umino, N., 2012.
Quasi real-time fault model estimation for near-field tsunami forecasting based on
RTK-GPS analysis: Application to the 2011 Tohoku-Oki earthquake (MW9.0),
Journal of Geophysical Research, 117, B02311, doi: 10.1029/2011JB008750
Olson, E.L., Allen, R.M., 2005. The deterministic nature of earthquake rupture,
Nature, 438: 212-215.
Peppa, I., Psimoulis, P., Meng, X. 2018. Using the signal-to-noise ratio of GPS
records to detect motion of structures, Structural Control and Health Monitoring,
25(2), e2080.
Plag, H.-P., Blewitt, G., Bar-Sever, Y., 2012. Rapid determination of earthquake
magnitude and displacement field from GPS-observed coseismic offsets for tsunami
warning, (2012), International Geoscience and Remote Sensing Symposium
(IGARSS), 6351337, 1182-1185
Psimoulis, P., Pytharouli, S., Karabalis, D., Stiros, S., 2008. Potential of Global
Positioning System (GPS) to measure frequencies of oscillations of engineering
structures, Journal of Sound and Vibration, 318(3), 606-623
Psimoulis, P., Stiros, S., 2012. A supervised learning computer-based algorithm to
Downloaded from https://academic.oup.com/gji/advance-article-abstract/doi/10.1093/gji/ggy198/4999902by Nottingham University useron 21 May 2018

derive the algorithm of oscillations of structures using noisy GPS and Robotic
Theodolites (RTS) records, Comp. Str., 92-93, 337-348.
Psimoulis, P, Houlié, N., Meindl, M., Rothacher, M., 2014. Long-period surface
motion of the multipatch Mw9.0 Tohoku-Oki earthquake, Geoph. J. Inter., 199, 968-
980.
Psimoulis, P., Houlié, N., Meindl, M., Rothacher, M., 2015. Consistency of PPP GPS
and strong-motion records: case study of Mw9.0 Tohoku-Oki 2011 earthquake,
Smart Structures and Systems, 16(2), 347-366.
Psimoulis, P., Houlié, N.,Behr, Y., 2018. Real-time magnitude characterization of
large earthquakes using the predominant period derived from 1Hz GPS data, Geoph.
Res. Lett., 45(2), 517-526
Sagiya, T., 2004. A decade of GEONET: 1994--2003---The continuous GPS
observation in Japan and its impact on earthquake studies, Earth Planets Space, 56,
xxix-xli.
Saleh, B., Blum, P.A., Delorme, H., 1991. New silica compact tiltmeter for
deformations measurement. Journal of Surveying Engineering-Asce 117, 27-35.
Shearer, P.M., 1999. Introduction to Seismology, Cambridge Press.
Suzuki, W., Aoi, S., Sekiguchi, H., Kunugi, T., 2011. Rupture process of the 2011
Tohoku-Oki megathrust earthquake (M9.0) inverted from strong-motion data,
Geoph. Res. Let., 38: L00G16.
Teferle, N., William, S.D.P., Kierulf, H.P., Bingley, R.M., Plag, H.P., 2008. A
continuous GPS coordinate time series analysis strategy for high-accuracy vertical
land movements, Physics and Chemistry of the Earth, 33 (3-4), 205-216.
Trota, A., Houlié, N., Briole , P., Gaspar , J. L., Sigmundsson, F. 2006. Deformations
of the Furnas and Sete Cidade Volcanoes. Velocities and further investigations,
Downloaded from https://academic.oup.com/gji/advance-article-abstract/doi/10.1093/gji/ggy198/4999902by Nottingham University useron 21 May 2018
Geoph J Int, 166, 952-956, doi: 10.1111/j.1365-246X.2006.03039.x .
Tu, R., Wang, R., Ge, M., Walter, T.R., Ramatschi, M., Milkereit, C., Bindi, D.,
Dahm, T. 2013. Cost-effective monitoring of ground motion related to earthquakes,
landslides, or volcanic activity by joint use of a single-frequency GPS and a MEMS
accelerometer, 40, 3825-3829, doi: 10.1002/grl.50653.
Wang, G., Phillips, D., Joyce, J., Rivera, F.O. 2011. The integration of TLS and
continuous GPS to study landslide deformation: a case study in Puerto Rico. J Geod
Sc, 1(3), 25-34.
Wang, G.-Q. 2012. Kinematics of the Cerca del Cielo, Puerto Rico landslide derived
from GPS observations, Landslides, 9, 117-130.
Williams, S.D.P., Bock, Y., Fang, P., Jamason, P., Nikolaidis, R.M., Prawirodirdjo,
L., Miller, M., Johnson, D.J. 2004. Error analysis of continuous GPS position time
series, J Geoph Res B: Solid Earth, 109 (3), B03412 1-19.
Wright, T., Houlié, N., Hildyard, M., Iwabuchi, T., 2012. Real-time, reliable
magnitude for large earthquakes from 1Hz GPS precise point positioning: The 2011
Tohoku-Oki (Japan) earthquake, Geoph. Res. Let., 39, L12302.
Wu, H., Li, K., Shi, W., Clarke, K.C., Zhang, J., Li, H., 2015. A wavelet hybrid
approach to remove the flicker noise and the white noise from GPS coordinate time
series, GPS Sol, 19(4), 511-523.
Ying, L., Wu, X., Lin, C., Jiang, L., 2014. Traumatic Severity and Trait Resilience as
Predictors of Posttraumatic Stress Disorder and Depressive Symptoms among
Adolescent Survivors of the Wenchuan Earthquake. PLOS ONE 9, e89401.
Zhou, C., Yin, K., Cao, Y., Ahmed, B., Fu, X., 2018. A novel method for landslide
displacement prediction by integrating advanced computational intelligence
algorithms, Scientific Reports, 8, 7287
Downloaded from https://academic.oup.com/gji/advance-article-abstract/doi/10.1093/gji/ggy198/4999902by Nottingham University useron 21 May 2018
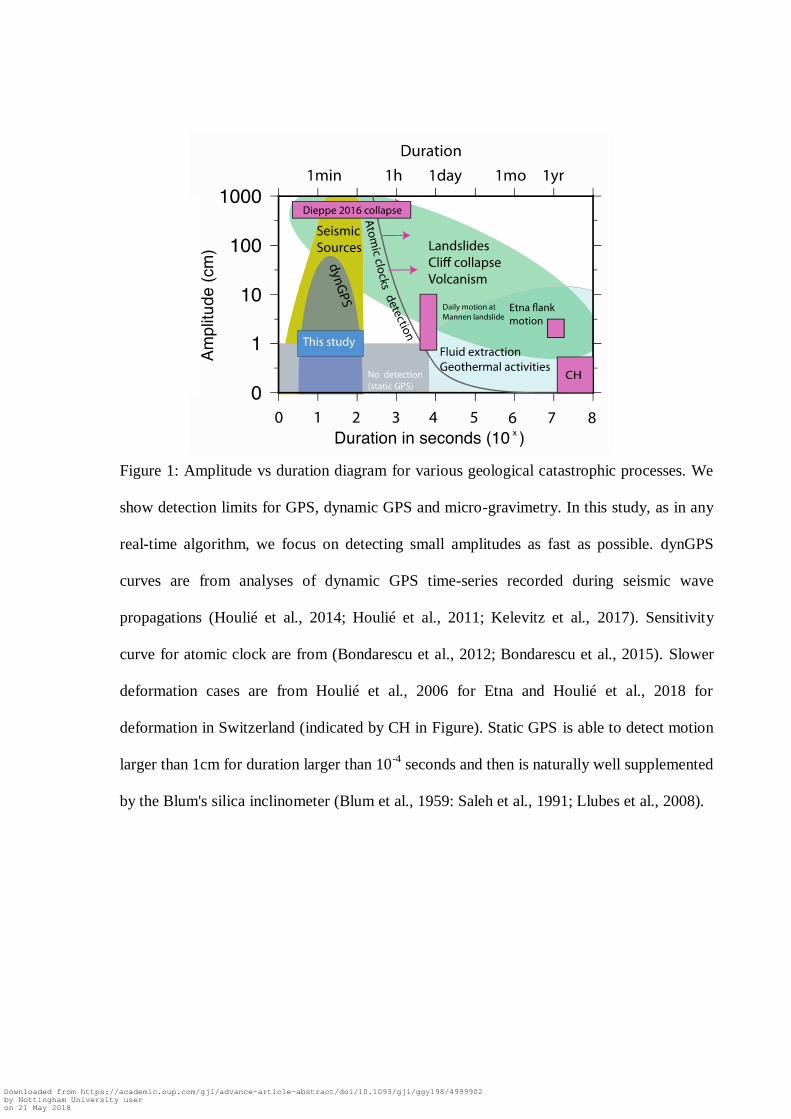
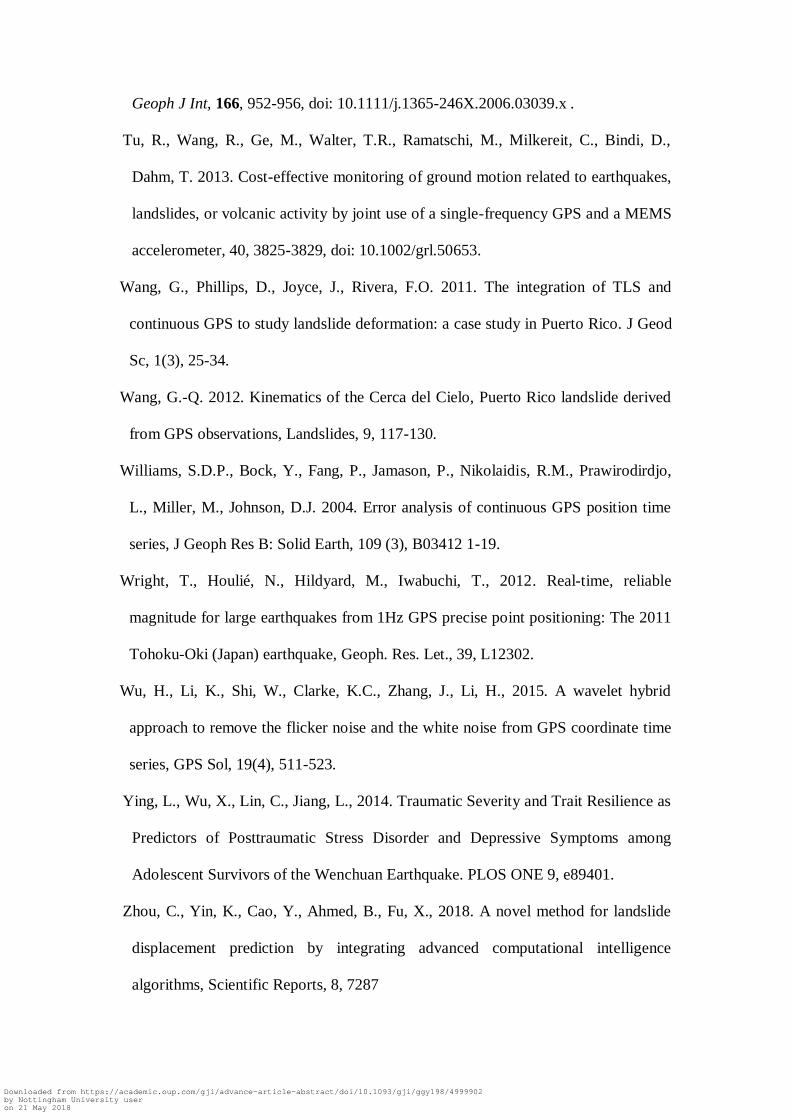
Figure 1: Amplitude vs duration diagram for various geological catastrophic processes. We
show detection limits for GPS, dynamic GPS and micro-gravimetry. In this study, as in any
real-time algorithm, we focus on detecting small amplitudes as fast as possible. dynGPS
curves are from analyses of dynamic GPS time-series recorded during seismic wave
propagations (Houlié et al., 2014; Houlié et al., 2011; Kelevitz et al., 2017). Sensitivity
curve for atomic clock are from (Bondarescu et al., 2012; Bondarescu et al., 2015). Slower
deformation cases are from Houlié et al., 2006 for Etna and Houlié et al., 2018 for
deformation in Switzerland (indicated by CH in Figure). Static GPS is able to detect motion
larger than 1cm for duration larger than 10-4
seconds and then is naturally well supplemented
by the Blum's silica inclinometer (Blum et al., 1959: Saleh et al., 1991; Llubes et al., 2008).
Downloaded from https://academic.oup.com/gji/advance-article-abstract/doi/10.1093/gji/ggy198/4999902by Nottingham University useron 21 May 2018
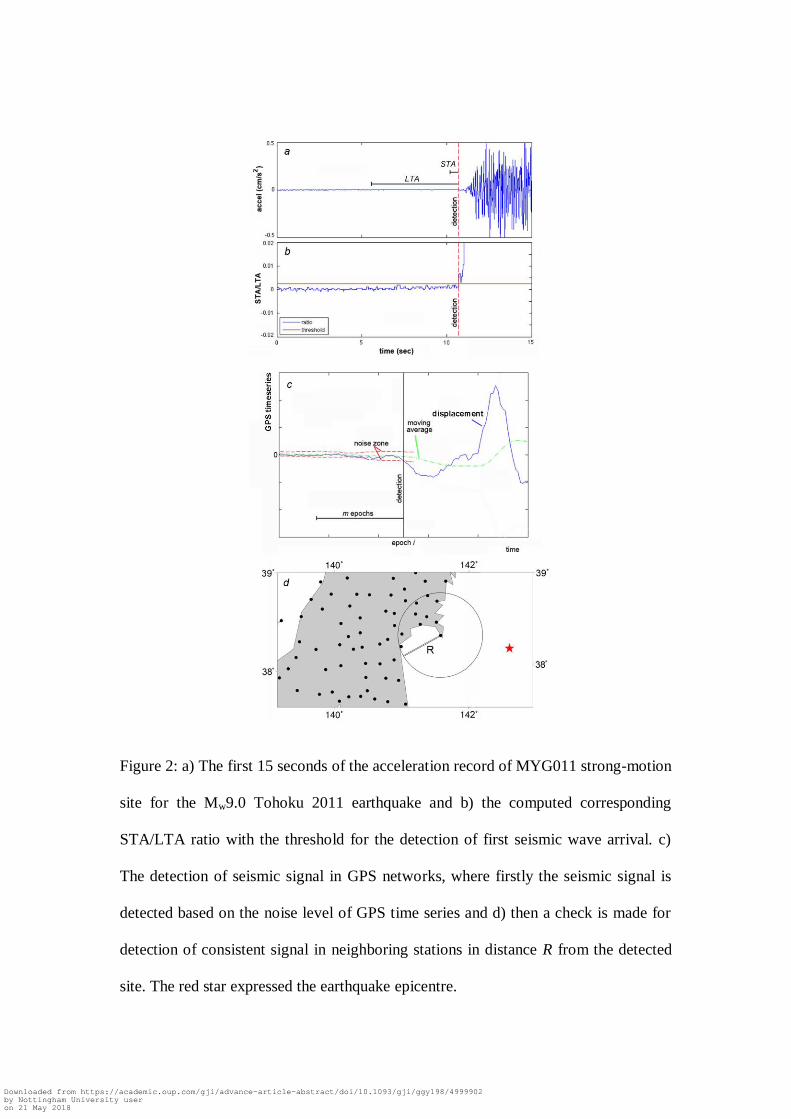
Figure 2: a) The first 15 seconds of the acceleration record of MYG011 strong-motion
site for the Mw9.0 Tohoku 2011 earthquake and b) the computed corresponding
STA/LTA ratio with the threshold for the detection of first seismic wave arrival. c)
The detection of seismic signal in GPS networks, where firstly the seismic signal is
detected based on the noise level of GPS time series and d) then a check is made for
detection of consistent signal in neighboring stations in distance R from the detected
site. The red star expressed the earthquake epicentre.
Downloaded from https://academic.oup.com/gji/advance-article-abstract/doi/10.1093/gji/ggy198/4999902by Nottingham University useron 21 May 2018
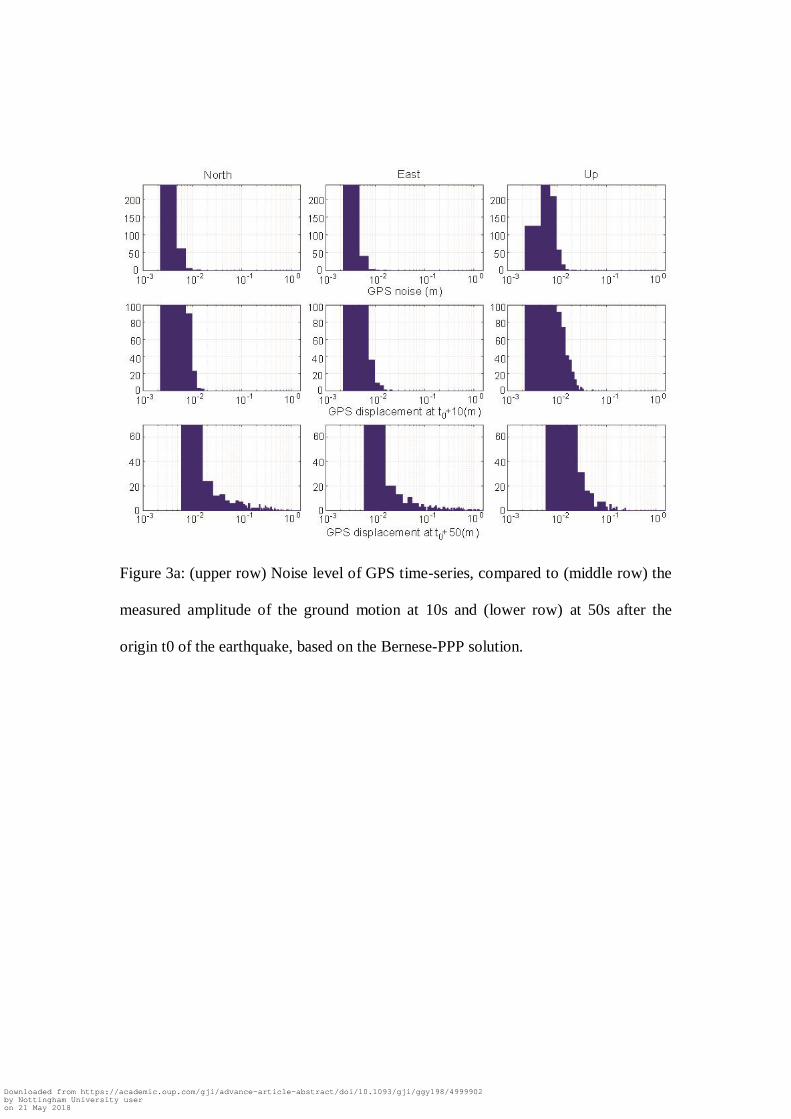
Figure 3a: (upper row) Noise level of GPS time-series, compared to (middle row) the
measured amplitude of the ground motion at 10s and (lower row) at 50s after the
origin t0 of the earthquake, based on the Bernese-PPP solution.
Downloaded from https://academic.oup.com/gji/advance-article-abstract/doi/10.1093/gji/ggy198/4999902by Nottingham University useron 21 May 2018
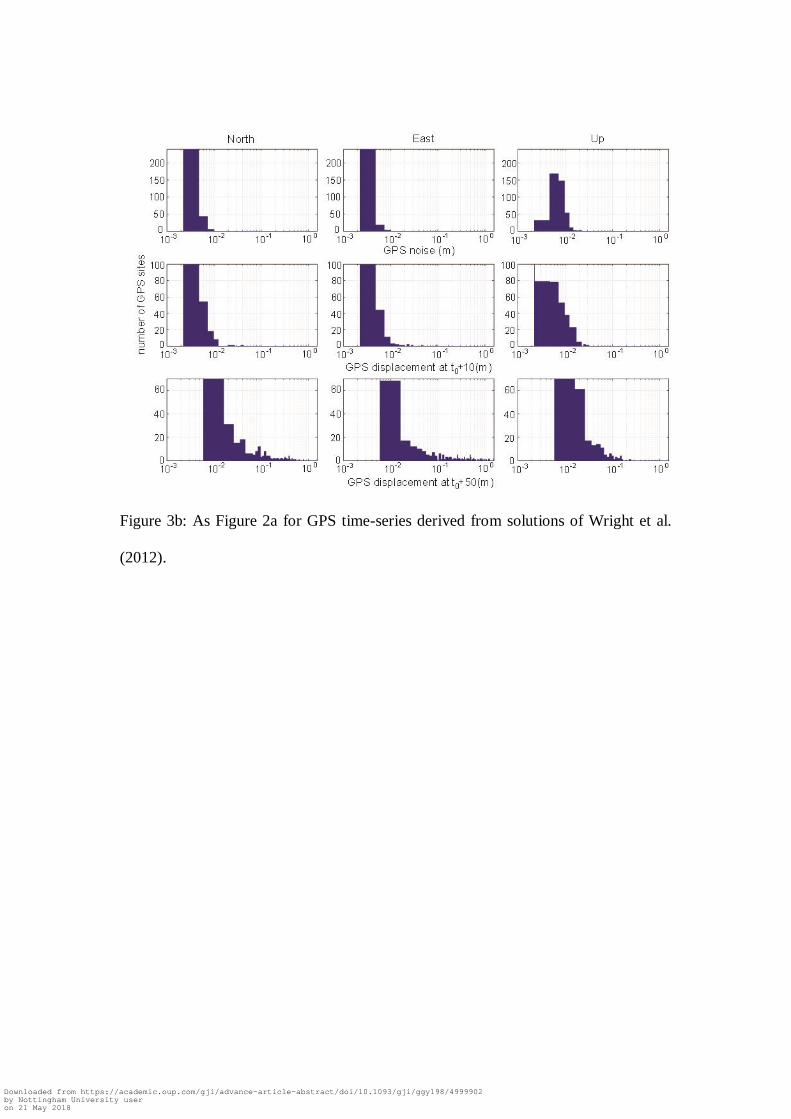
Figure 3b: As Figure 2a for GPS time-series derived from solutions of Wright et al.
(2012).
Downloaded from https://academic.oup.com/gji/advance-article-abstract/doi/10.1093/gji/ggy198/4999902by Nottingham University useron 21 May 2018
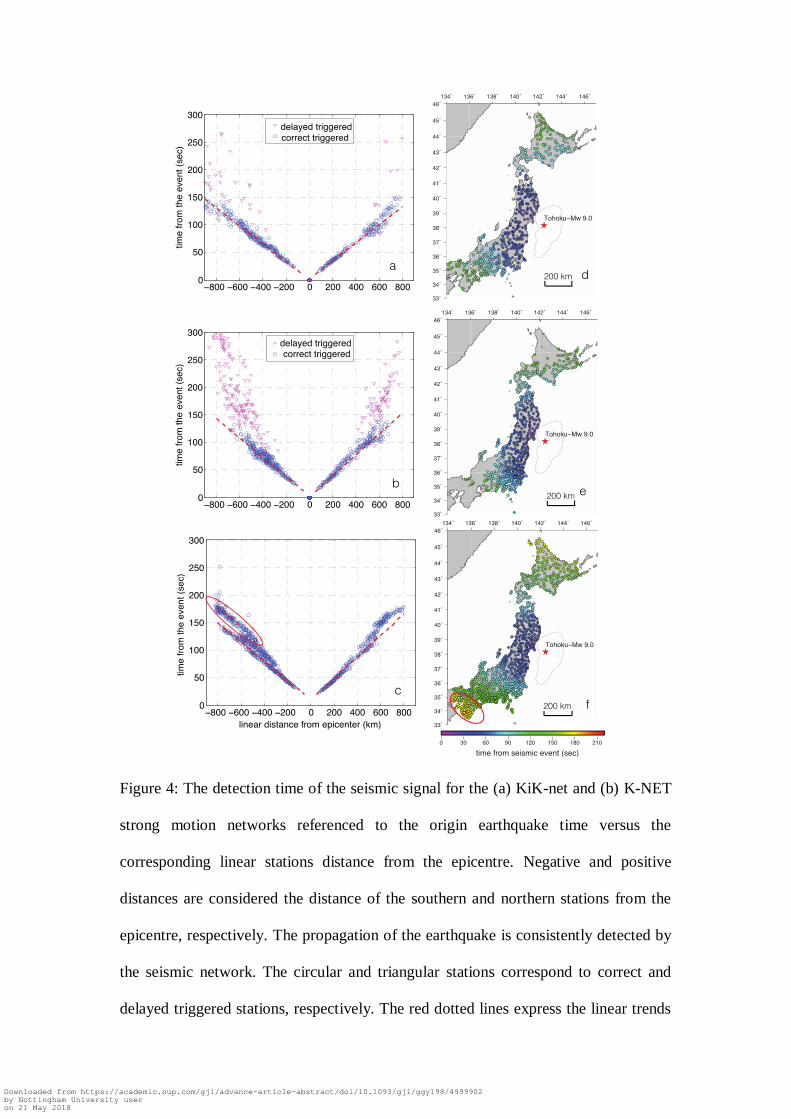
Figure 4: The detection time of the seismic signal for the (a) KiK-net and (b) K-NET
strong motion networks referenced to the origin earthquake time versus the
corresponding linear stations distance from the epicentre. Negative and positive
distances are considered the distance of the southern and northern stations from the
epicentre, respectively. The propagation of the earthquake is consistently detected by
the seismic network. The circular and triangular stations correspond to correct and
delayed triggered stations, respectively. The red dotted lines express the linear trends
Downloaded from https://academic.oup.com/gji/advance-article-abstract/doi/10.1093/gji/ggy198/4999902by Nottingham University useron 21 May 2018
of the detections. c) The detection time of the seismic signal by the GPS network,
referenced to the origin earthquake time versus the corresponding linear stations
distance from the epicentre. The red dotted lines indicate the three clusters of linear
trends. The third cluster (in the ellipse) is parallel to the primary linear trend with a
time delay of 35seconds. The maps of propagation of the seismic signal as it is
detected by the (d) KiK-net, (e) K-NET and (f) GPS network. The ellipse includes the
GPS sites of cluster of the third linear trend.
Figure 5: (left panel) The GPS network map with the red line indicating the examined
Downloaded from https://academic.oup.com/gji/advance-article-abstract/doi/10.1093/gji/ggy198/4999902by Nottingham University useron 21 May 2018
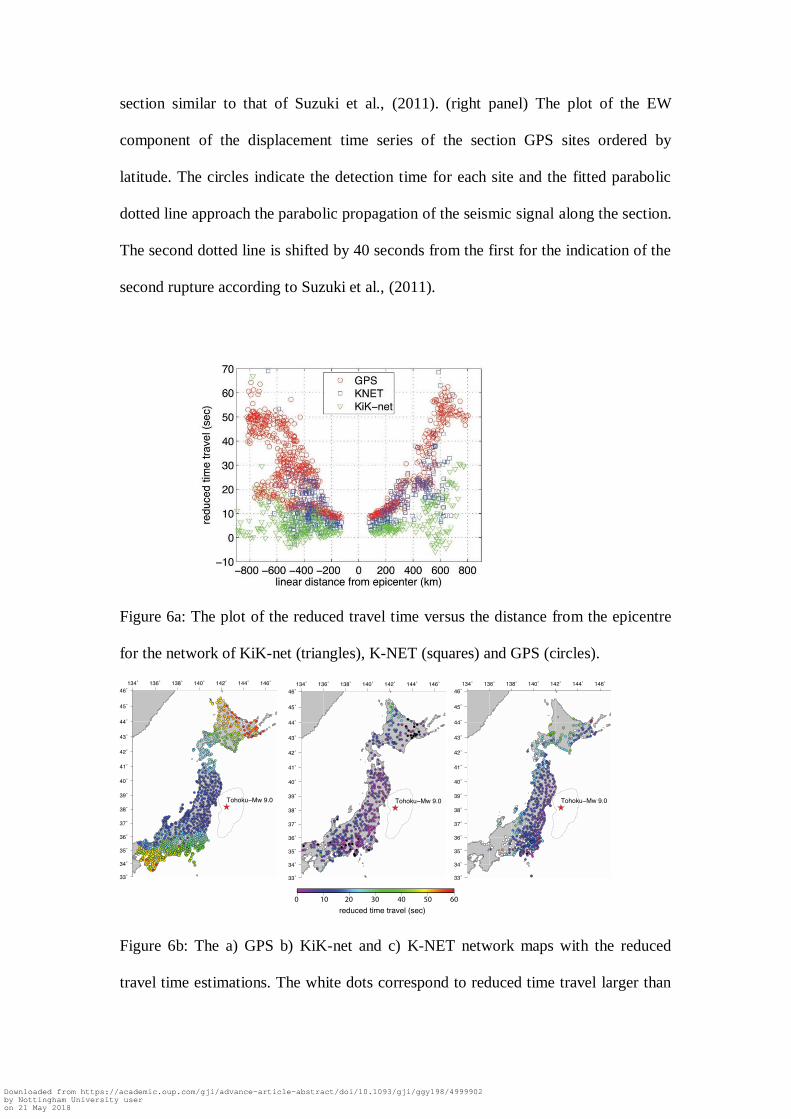
section similar to that of Suzuki et al., (2011). (right panel) The plot of the EW
component of the displacement time series of the section GPS sites ordered by
latitude. The circles indicate the detection time for each site and the fitted parabolic
dotted line approach the parabolic propagation of the seismic signal along the section.
The second dotted line is shifted by 40 seconds from the first for the indication of the
second rupture according to Suzuki et al., (2011).
Figure 6a: The plot of the reduced travel time versus the distance from the epicentre
for the network of KiK-net (triangles), K-NET (squares) and GPS (circles).
Figure 6b: The a) GPS b) KiK-net and c) K-NET network maps with the reduced
travel time estimations. The white dots correspond to reduced time travel larger than
Downloaded from https://academic.oup.com/gji/advance-article-abstract/doi/10.1093/gji/ggy198/4999902by Nottingham University useron 21 May 2018
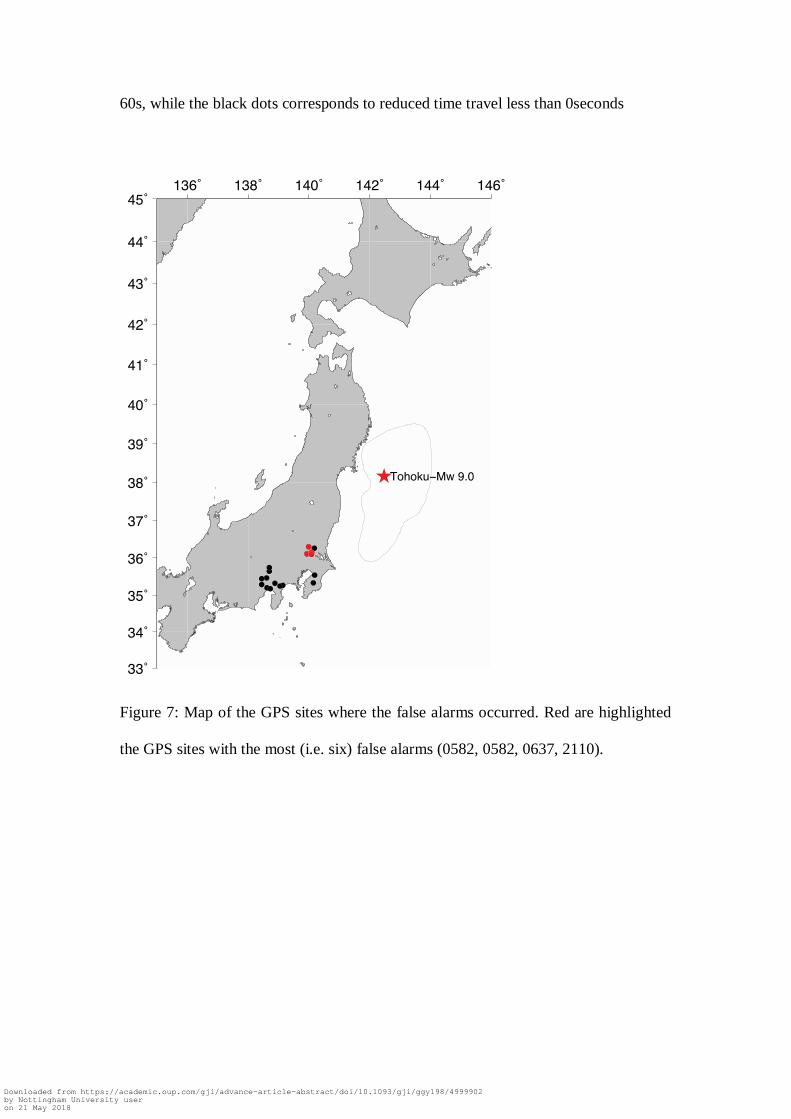
60s, while the black dots corresponds to reduced time travel less than 0seconds
Figure 7: Map of the GPS sites where the false alarms occurred. Red are highlighted
the GPS sites with the most (i.e. six) false alarms (0582, 0582, 0637, 2110).
Downloaded from https://academic.oup.com/gji/advance-article-abstract/doi/10.1093/gji/ggy198/4999902by Nottingham University useron 21 May 2018
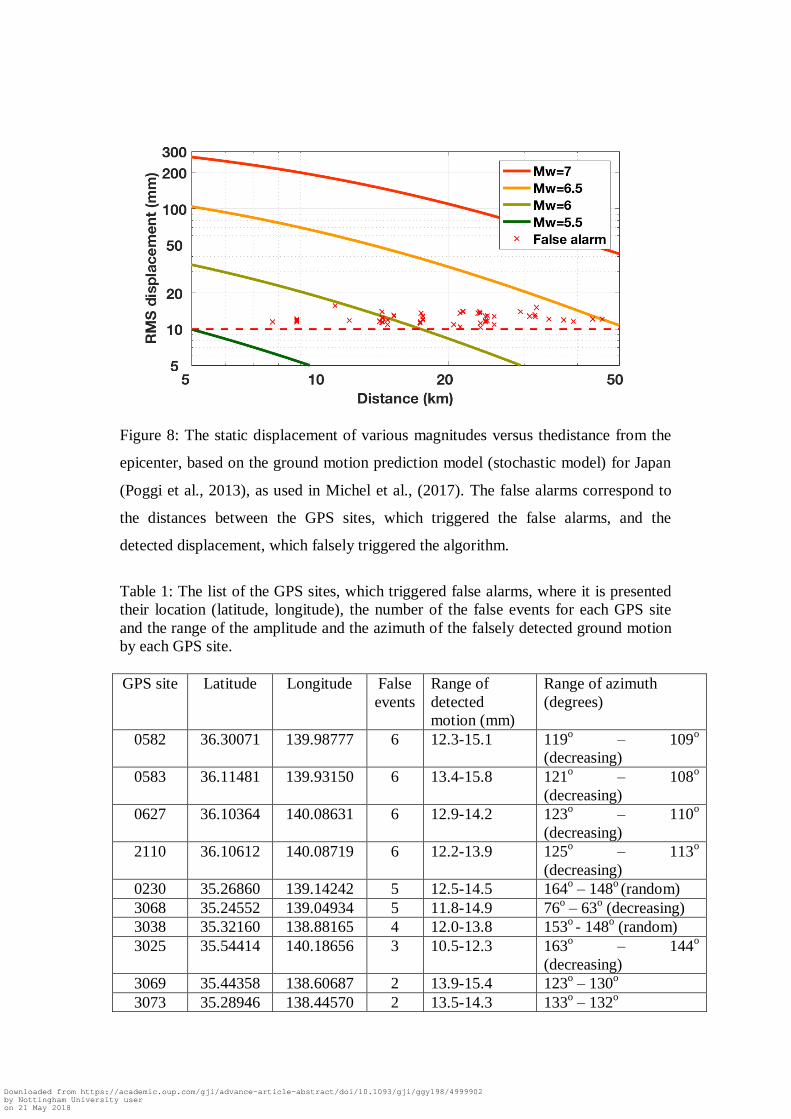
Figure 8: The static displacement of various magnitudes versus thedistance from the
epicenter, based on the ground motion prediction model (stochastic model) for Japan
(Poggi et al., 2013), as used in Michel et al., (2017). The false alarms correspond to
the distances between the GPS sites, which triggered the false alarms, and the
detected displacement, which falsely triggered the algorithm.
Table 1: The list of the GPS sites, which triggered false alarms, where it is presented
their location (latitude, longitude), the number of the false events for each GPS site
and the range of the amplitude and the azimuth of the falsely detected ground motion
by each GPS site.
GPS site Latitude Longitude False
events
Range of
detected
motion (mm)
Range of azimuth
(degrees)
0582 36.30071 139.98777 6 12.3-15.1 119o – 109
o
(decreasing)
0583 36.11481 139.93150 6 13.4-15.8 121o – 108
o
(decreasing)
0627 36.10364 140.08631 6 12.9-14.2 123o – 110
o
(decreasing)
2110 36.10612 140.08719 6 12.2-13.9 125o – 113
o
(decreasing)
0230 35.26860 139.14242 5 12.5-14.5 164o – 148
o (random)
3068 35.24552 139.04934 5 11.8-14.9 76o – 63
o (decreasing)
3038 35.32160 138.88165 4 12.0-13.8 153o - 148
o (random)
3025 35.54414 140.18656 3 10.5-12.3 163o – 144
o
(decreasing)
3069 35.44358 138.60687 2 13.9-15.4 123o – 130
o
3073 35.28946 138.44570 2 13.5-14.3 133o – 132
o
Downloaded from https://academic.oup.com/gji/advance-article-abstract/doi/10.1093/gji/ggy198/4999902by Nottingham University useron 21 May 2018
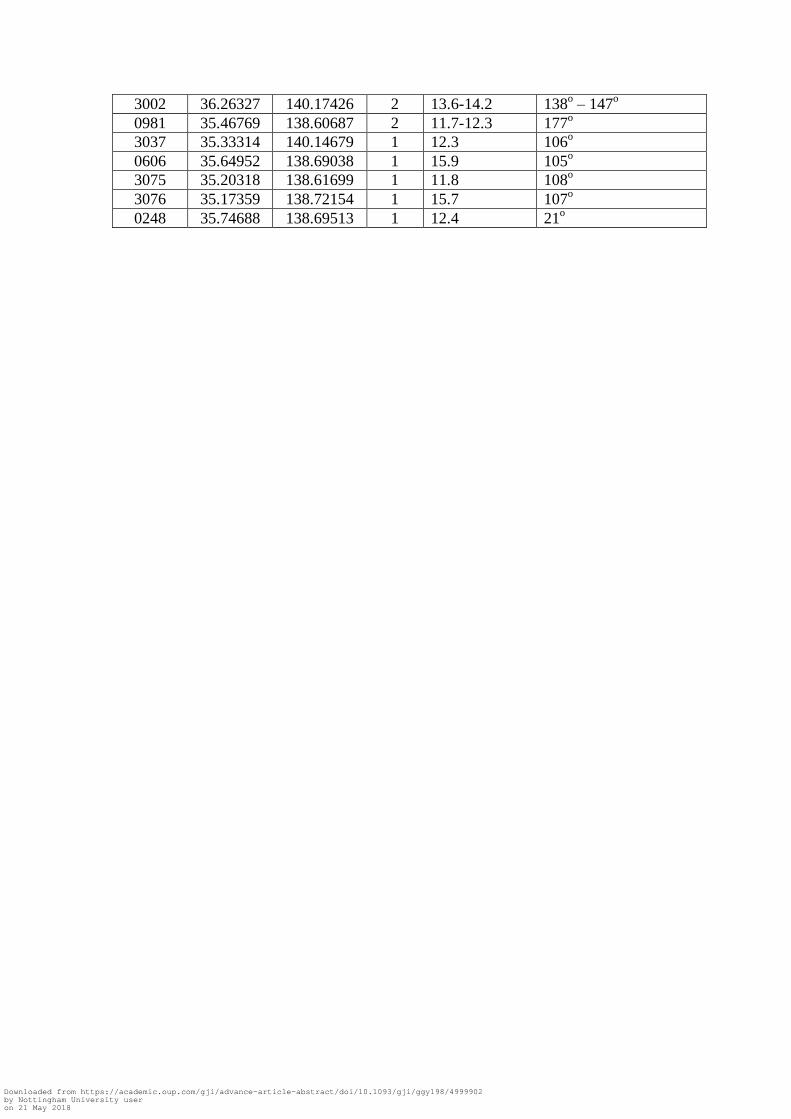
3002 36.26327 140.17426 2 13.6-14.2 138o – 147
o
0981 35.46769 138.60687 2 11.7-12.3 177o
3037 35.33314 140.14679 1 12.3 106o
0606 35.64952 138.69038 1 15.9 105o
3075 35.20318 138.61699 1 11.8 108o
3076 35.17359 138.72154 1 15.7 107o
0248 35.74688 138.69513 1 12.4 21o
Downloaded from https://academic.oup.com/gji/advance-article-abstract/doi/10.1093/gji/ggy198/4999902by Nottingham University useron 21 May 2018