Detection of Adulterations in Fruit Juices Using Machine ...
14
Citation: Calle, J.L.P.; Ferreiro-González, M.; Ruiz-Rodríguez, A.; Fernández, D.; Palma, M. Detection of Adulterations in Fruit Juices Using Machine Learning Methods over FT-IR Spectroscopic Data. Agronomy 2022, 12, 683. https://doi.org/10.3390/ agronomy12030683 Academic Editor: Pedro Javier Zapata Received: 20 February 2022 Accepted: 8 March 2022 Published: 11 March 2022 Publisher’s Note: MDPI stays neutral with regard to jurisdictional claims in published maps and institutional affil- iations. Copyright: © 2022 by the authors. Licensee MDPI, Basel, Switzerland. This article is an open access article distributed under the terms and conditions of the Creative Commons Attribution (CC BY) license (https:// creativecommons.org/licenses/by/ 4.0/). agronomy Article Detection of Adulterations in Fruit Juices Using Machine Learning Methods over FT-IR Spectroscopic Data José Luis P. Calle 1 , Marta Ferreiro-González 1, * , Ana Ruiz-Rodríguez 1, * , Daniel Fernández 2,3,4 and Miguel Palma 1 1 Department of Analytical Chemistry, Faculty of Sciences Agrifood Campus of International Excellence (ceiA3), IVAGRO, University of Cadiz, 11510 Puerto Real, Spain; [email protected] (J.L.P.C.);[email protected] (M.P.) 2 Department of Statistics and Operations Research (DEIO), Universitat Politècnica de Catalunya—BarcelonaTech (UPC), 08028 Barcelona, Spain; [email protected] 3 Centro de Investigación Biomédica en Red de Salud Mental (CIBERSAM), Instituto de Salud Carlos III, 28029 Madrid, Spain 4 Institute of Mathematics of UPC (IMTech), Universitat Politècnica de Catalunya—Barcelona Tech, 08028 Barcelona, Spain * Correspondence: [email protected] (M.F.-G.); [email protected] (A.R.-R.); Tel.: +34-956-016-359 (M.F.-G.); +34-956-016-363 (A.R.-R.) Abstract: Fruit juices are one of the most adulterated beverages, usually because of the addition of water, sugars, or less expensive fruit juices. This study presents a method based on Fourier transform infrared spectroscopy (FT-IR), in combination with machine learning methods, for the correct identification and quantification of adulterants in juices. Thus, three types of 100% squeezed juices (pineapple, orange, and apple) were evaluated and adulterated with grape juice at different percentages (5%, 10%, 15%, 20%, 30%, 40%, and 50%). The results of the exploratory data analysis revealed a clear clustering trend of the samples according to the type of juice analyzed. The supervised learning analysis, based on the development of models for the detection of adulteration, obtained significant results for all tested methods (i.e., support-vector machines or SVM), random forest or RF, and linear discriminant analysis or LDA) with an accuracy above 97% on the test set. Regarding quantification, the best results are obtained with the support vector regression and with partial least square regression showing an R 2 greater than 0.99 and a root mean square error (RMSE) less than 1.4 for the test set. Keywords: FT-IR; fruit juices; food control; machine learning; spectroscopy; regression; authentication; classification 1. Introduction One of the largest sectors in the beverage industry is the production of fruit juices. In fact, 9067 million liters were consumed in Europe during 2018 according to the Association of the Juice and Nectar Industry of the European Union (AIJN) [1]. Additionally, the interest in fruit juices is increasing, as these drinks provide nutritional and dietary benefits, being an excellent source of vitamin and key nutrients such as potassium, folate, magnesium, among others [2,3]. In Europe, there is strict regulation to guarantee the quality and origin in the manufac- ture of juices established by the 2012/12 EU directive [4]. Moreover, this directive describes that fruit juices must be 100% squeezed from healthy and ripe fruits where the addition of sugars is not allowed. Despite the regulations, these products have always been subjected to adulteration in the market, being reported as one of the seven most common foods for adulteration between 1980 and 2010 [5]. Among the most frequent adulterations is the dilution with water, the addition of artificial sweeteners, or less expensive fruit juices [6]. The latter is very popular due to its greater difficulty to be detected [7]. It is important to be Agronomy 2022, 12, 683. https://doi.org/10.3390/agronomy12030683 https://www.mdpi.com/journal/agronomy
-
Upload
khangminh22 -
Category
Documents
-
view
0 -
download
0
Transcript of Detection of Adulterations in Fruit Juices Using Machine ...

�����������������
Citation: Calle, J.L.P.;
Ferreiro-González, M.;
Ruiz-Rodríguez, A.; Fernández, D.;
Palma, M. Detection of Adulterations
in Fruit Juices Using Machine
Learning Methods over FT-IR
Spectroscopic Data. Agronomy 2022,
12, 683. https://doi.org/10.3390/
agronomy12030683
Academic Editor: Pedro Javier
Zapata
Received: 20 February 2022
Accepted: 8 March 2022
Published: 11 March 2022
Publisher’s Note: MDPI stays neutral
with regard to jurisdictional claims in
published maps and institutional affil-
iations.
Copyright: © 2022 by the authors.
Licensee MDPI, Basel, Switzerland.
This article is an open access article
distributed under the terms and
conditions of the Creative Commons
Attribution (CC BY) license (https://
creativecommons.org/licenses/by/
4.0/).
agronomy
Article
Detection of Adulterations in Fruit Juices Using MachineLearning Methods over FT-IR Spectroscopic DataJosé Luis P. Calle 1, Marta Ferreiro-González 1,* , Ana Ruiz-Rodríguez 1,* , Daniel Fernández 2,3,4
and Miguel Palma 1
1 Department of Analytical Chemistry, Faculty of Sciences Agrifood Campus of InternationalExcellence (ceiA3), IVAGRO, University of Cadiz, 11510 Puerto Real, Spain;[email protected] (J.L.P.C.); [email protected] (M.P.)
2 Department of Statistics and Operations Research (DEIO), Universitat Politècnica deCatalunya—BarcelonaTech (UPC), 08028 Barcelona, Spain; [email protected]
3 Centro de Investigación Biomédica en Red de Salud Mental (CIBERSAM), Instituto de Salud Carlos III,28029 Madrid, Spain
4 Institute of Mathematics of UPC (IMTech), Universitat Politècnica de Catalunya—Barcelona Tech,08028 Barcelona, Spain
* Correspondence: [email protected] (M.F.-G.); [email protected] (A.R.-R.);Tel.: +34-956-016-359 (M.F.-G.); +34-956-016-363 (A.R.-R.)
Abstract: Fruit juices are one of the most adulterated beverages, usually because of the additionof water, sugars, or less expensive fruit juices. This study presents a method based on Fouriertransform infrared spectroscopy (FT-IR), in combination with machine learning methods, for thecorrect identification and quantification of adulterants in juices. Thus, three types of 100% squeezedjuices (pineapple, orange, and apple) were evaluated and adulterated with grape juice at differentpercentages (5%, 10%, 15%, 20%, 30%, 40%, and 50%). The results of the exploratory data analysisrevealed a clear clustering trend of the samples according to the type of juice analyzed. The supervisedlearning analysis, based on the development of models for the detection of adulteration, obtainedsignificant results for all tested methods (i.e., support-vector machines or SVM), random forest orRF, and linear discriminant analysis or LDA) with an accuracy above 97% on the test set. Regardingquantification, the best results are obtained with the support vector regression and with partial leastsquare regression showing an R2 greater than 0.99 and a root mean square error (RMSE) less than 1.4for the test set.
Keywords: FT-IR; fruit juices; food control; machine learning; spectroscopy; regression; authentication;classification
1. Introduction
One of the largest sectors in the beverage industry is the production of fruit juices. Infact, 9067 million liters were consumed in Europe during 2018 according to the Associationof the Juice and Nectar Industry of the European Union (AIJN) [1]. Additionally, the interestin fruit juices is increasing, as these drinks provide nutritional and dietary benefits, beingan excellent source of vitamin and key nutrients such as potassium, folate, magnesium,among others [2,3].
In Europe, there is strict regulation to guarantee the quality and origin in the manufac-ture of juices established by the 2012/12 EU directive [4]. Moreover, this directive describesthat fruit juices must be 100% squeezed from healthy and ripe fruits where the addition ofsugars is not allowed. Despite the regulations, these products have always been subjectedto adulteration in the market, being reported as one of the seven most common foods foradulteration between 1980 and 2010 [5]. Among the most frequent adulterations is thedilution with water, the addition of artificial sweeteners, or less expensive fruit juices [6].The latter is very popular due to its greater difficulty to be detected [7]. It is important to be
Agronomy 2022, 12, 683. https://doi.org/10.3390/agronomy12030683 https://www.mdpi.com/journal/agronomy
Agronomy 2022, 12, 683 2 of 14
aware that adding other fruit juices and not informing the consumer entails an additionalrisk of allergic reactions [8]. Therefore, it is food fraud for economic benefits, which couldalso affect the health of the consumer [9].
Currently, analytical separation techniques, including both liquid and gas chromatog-raphy, are the most widely used methodologies for the detection of adulterants injuices [6,8,10–13]. However, other techniques such as isotope-based techniques and elemen-tal techniques [14–16], physicochemical analysis [17,18], DNA-based techniques [19,20], andspectroscopic techniques [6,8,12,13,21] have been employed. Among them, spectroscopictechniques are becoming more and more important due to their numerous advantages suchas low analysis time and costs, ease of use, high reproducibility, and greater portability,allowing in situ analysis. In this context, Fourier transform infrared spectroscopy (FT-IR)has been one of the most extensive techniques to successfully detect adulterations in juices.It has been employed for the detection of sugar addition in apple [22–24], mango [25], andorange [12] juices, the authentication of different commercial juices [26], the detection ofgrape juice in pomegranate juice [27], the discrimination of lime juice adulterated withisocitric and/or citric acid [21], as well as the authentication of Concord grape juice ingrape blends [10].
Most of these FT-IR methods are based on the identification of one or a few individualcompounds that are used as biomarkers to detect the adulterant or the authenticity ofthe juice. Therefore, these methods have some limitations, as they are easy to elude and,consequently, less and less successful. An alternative to developing more robust methodscould be focusing on the whole or a wide spectral range that can be used as a pattern, orusing spectralprint techniques characteristic of each type of sample [28]. In that manner, FT-IR spectroscopy, used as a global profiling or screening technique, generates a large amountof information in a few seconds. With the aim of handling and extracting useful informationfrom these data matrices, the application of data analysis methods (including machinelearning methods) is crucial. Thus, both the transformation of data into interpretableinformation and the fitting of predictive models with interactive applications to automatequality control processes are possible by employing languages of coding, so these globalprofiling methods are becoming increasingly popular [9] and have been used in variousfields such as forensic chemistry [29,30], agri-food [31,32], pharmacological industry [33,34],among others. It is worth it since juices are complex matrices and the differences betweenspectra are sometimes very substantial, thus identifying a small number of markers canbe difficult and unsuccessful. However, holistic methods consider small differences thatmay be important in many cases and consequently offer better results than individualidentification. In addition, the process can be automated which requires less time for thecorrect characterization of the sample.
Multivariate parametric analysis methods such as principal component analysis (PCA)for dimensionality reduction, linear discriminant analysis (LDA) for classification, andpartial least squares regression (PLS) for adulterant quantification stand out among themost commonly employed machine learning methods in juice characterization studies.However, non-parametric methods such as random forests (RF) or support-vector machines(SVM) have been less widely used, even though they have reported better results for similarpurposes [35,36]. Both SVM and RF have been used in combination with NIRS spectroscopydata for the purity assessment of lime juice, with optimal results [37]. Additionally, anotherstudy assessed the quality change of tomato juice using near-infrared spectroscopy coupledto global profiling methods, obtaining better results with support vector machines thanwith partial least squares [38]. This highlights the superiority of non-parametric techniquesin some situations, especially when the matrices analyzed are complex and the relationshipbetween the spectrum and the response variable is not linear.
This research study focuses on the development of a novel method based on machinelearning models (parametric and non-parametric) for the detection and quantificationof juices-to-juices adulterations in several fruit juices through the spectral information

Agronomy 2022, 12, 683 3 of 14
generated by FT-IR spectroscopy as an objective, robust, fast, and automatic method for thedetection of this illegal practice.
2. Materials and Methods2.1. Samples
Four types of 100% fruit juices (apple, pineapple, orange, and grape) from differentsuppliers in Spain were selected. A minimum of three different brands were chosen and,from each of them, several batches to increase heterogeneity within each type of juice. Inthat manner, the samples were labeled according to the following character code: “A_BB_C”where “A” stands for the type of juice, i.e., A (apple), P (pineapple), O (orange), and G(grape). “BB” indicates the brand and “C” the lot number (1, 2, or 3). Additionally, eachof them was analyzed twice, being labeled “R1” or “R2”. Thus, the label correspondingto the second batch of an “HC” brand apple juice would be “A_HC_2_R1” for the firstreplica and “A_HC_2_R2” for the second one. The overall number of unadulterated juicesamples reaches up to 76 with a minimum of 18 samples for each type of juice, which weresubsequently analyzed by FT-IR.
2.2. Adulteration
Grape juice was selected as an adulterant since this juice is commonly used for itslow cost compared to other types of juices [15]. Thus, two samples of each type of juicewere created by mixing the different brands of juice, i.e., the 4 brands for orange juice and3 brands for all other juices from a randomly selected batch were proportionally mixed inorder to cover the widest heterogeneity. Those two samples of each type of juice (orange,pineapple, and apple) were those adulterated with grape juice at the following ratios: 5%,10%, 15%, 20%, 30%, 40%, and 50%. Non-adulterated fruit juices samples (0%) and grapejuices (100%) were also analyzed. In addition, the grape juice was diluted with the sugarconcentration of the juice (orange, pineapple, or apple) for the adulteration process. Thisstep was necessary because it is well known that FT-IR is sensitive to the number of sugars,allowing even the quantification of sugars in juices [39–41]. Therefore, the dilution ofthe juices was necessary to prevent the fraud from being easily eluted and to get a morerobust model, independent of the sugar content. A final set of 108 adulterated samples wasobtained: 3 types of juices × 2 different samples × 9 adulteration ratios (from 0 to 50% and100%) × 2 replicates. The samples were labeled according to the following character code:“AB_C” where “A” stands for the type of juice, “B” indicates the sample used (1 or 2), and“C” the ratio of adulteration (0, 5, 10, 15, 20, 30, 40, 50, and 100). In addition, each of themwas analyzed twice, being labeled “R1” or “R2”.
2.3. Fourier Transform Infrared Spectroscopy (FT-IR)
Infrared spectra were measured by Fourier transform for all samples using a MultiSpec(TDI, Barcelona, Spain). Previously, the samples had to be centrifuged and filtered with0.45 µm filters to reduce turbidity and eliminate impurities. The sample volume analyzedwas 7 mL (standard setting) and was pumped through the system. Spectra were recordedin the range of 952–3070 cm−1 with a resolution of 3.86 cm−1 and an optical path length of20 µm. The region from 1610 to 1670 cm−1 was eliminated for presenting a high variabilitysince it is the characteristic signal of water. The working temperature was set at 25 ◦C andthe total analysis time per sample was 1 min.
2.4. Data Analysis
The raw spectral data were acquired for the region previously described and wereplaced into Dn×p matrix where n denotes the number of samples and p denotes the num-ber of variables. Thus, the complete total matrix (D184×540) consisted of 540 variables(wavenumbers) and 184 samples. The entire computer analysis necessary to carry outthis study was performed with the statistical software RStudio v.4.0.2 (Rstudio Team 2021,Boston, MA, USA). All visualizations were performed with the ggplot2 package [42]. The
Agronomy 2022, 12, 683 4 of 14
unsupervised learning analysis, including principal component analysis (PCA) and hier-archical cluster analysis (HCA), was performed with the stats package [43]. In the HCAanalysis, the Manhattan distance was used and the linkage method was chosen basedon the highest value of the correlation coefficient between the cophenetic distance of thedendrogram and the original distance matrix. The methods tested were: single, average,complete, ward, and centroid, obtaining the best result for the average method.
The supervised learning analysis, which includes regression models: partial leastsquares and shrinkage methods (lasso, ridge, and elastic net), and classification models:linear discriminant analysis, support-vector machine, and random forest, was performedwith the caret package [44]. The performance metrics for the classification models measuredthe accuracy and for the regression models, the root mean square error (RMSE) and thecoefficient of determination (R2). Finally, the development of the application was carriedout using the shiny package [45].
3. Results and Discussion3.1. Exploratory Data Analysis (EDA)
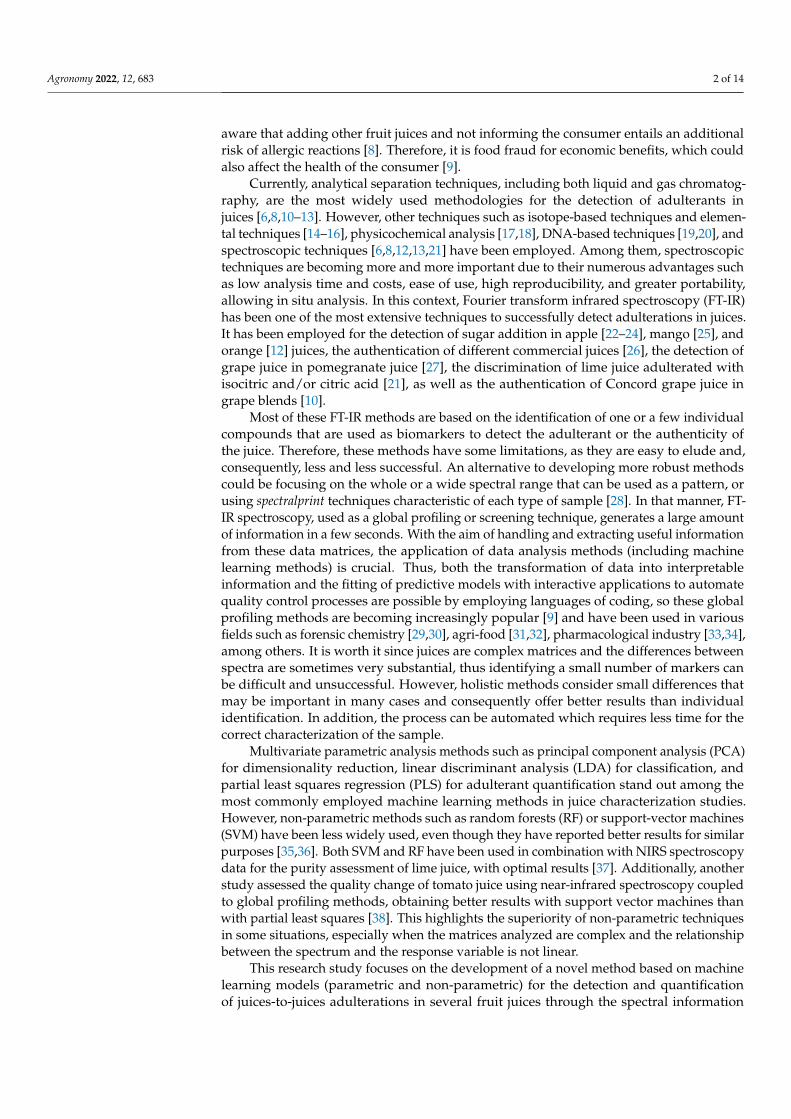
Initially, the goal was to observe whether there is a spectral difference between thedifferent types of fruit juices. For this purpose, we used the 76 unadulterated juice samplesand the resulting 540 spectral variables (wavenumbers). Therefore, a data matrix D76×540was subjected to HCA, which was performed using both the Manhattan distance andthe average method. It should be noted that the choice of method was based on thecorrelation coefficient between the cophenetic distance of the dendrogram (height of thenodes) and the original distance matrix. Therefore, different common methods wereassessed: single, complete, average, ward, and centroid, which values are shown in Table 1.In general, high values are obtained for all of them, but the best result is obtained throughthe average method (0.9848), which indicates that the resulting dendrogram (depicted inFigure 1) reflects very well the true similarity between the observations. This dendrogram isrepresented circularly and the samples are colored according to the type of juice to facilitatethe interpretation of the dendrogram.
Table 1. Correlation between the cophenetic distance and the distance matrix for the differentclustering methods using the FT-IR (Fourier transform infrared spectroscopy) spectrum of all thepure juice samples (D76×540).
Method Cophenetic Distance
Single 0.9835
Complete 0.9835
Average 0.9848
Ward 0.9836
Centroid 0.9791
The dendrogram shows that there are four perfectly differentiated groups and eachof them corresponds to a type of juice. Furthermore, the grape juice is the one that seemsto differentiate itself the most from the rest. Moreover, all the pineapple samples (coloredyellow) fall into an independent cluster, which is joined to the cluster containing all theorange samples (colored orange). Finally, this cluster merges with the one containing allthe apple samples (colored red). In this case, it seems that there is a perfect clustering of thesamples according to the brand within each type of juice, i.e., all the samples fall into thesame subcluster. Therefore, the FT-IR spectra are clearly influenced firstly by the type ofjuice and secondly by the brand used. In general, HCA allowed perfect distinction of thetype of juice analyzed regardless of the brand or sample used. However, it is important toensure that this differentiation is not exclusively due to the sugar content present in the

Agronomy 2022, 12, 683 5 of 14
sample (Average values of the sugar content of each type of fruit juice can be found in TableS1 of Supplementary Materials).
Figure 1. Dendrogram from HCA (hierarchical cluster analysis) using the Manhattan distance andaverage method for all FT-IR spectra of pure juices (D76×540). Samples are colored according to juicetype: P for pineapple (yellow), G for grape (dark green), A for apple (red), and O for orange (orange).
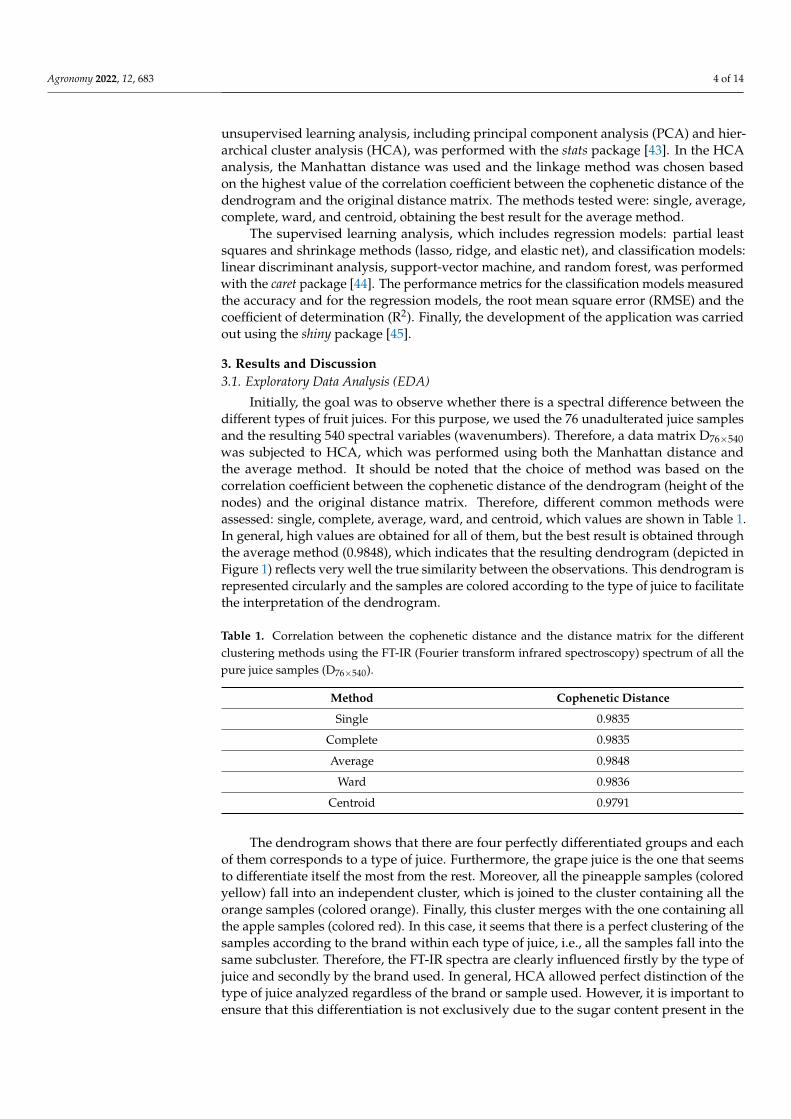
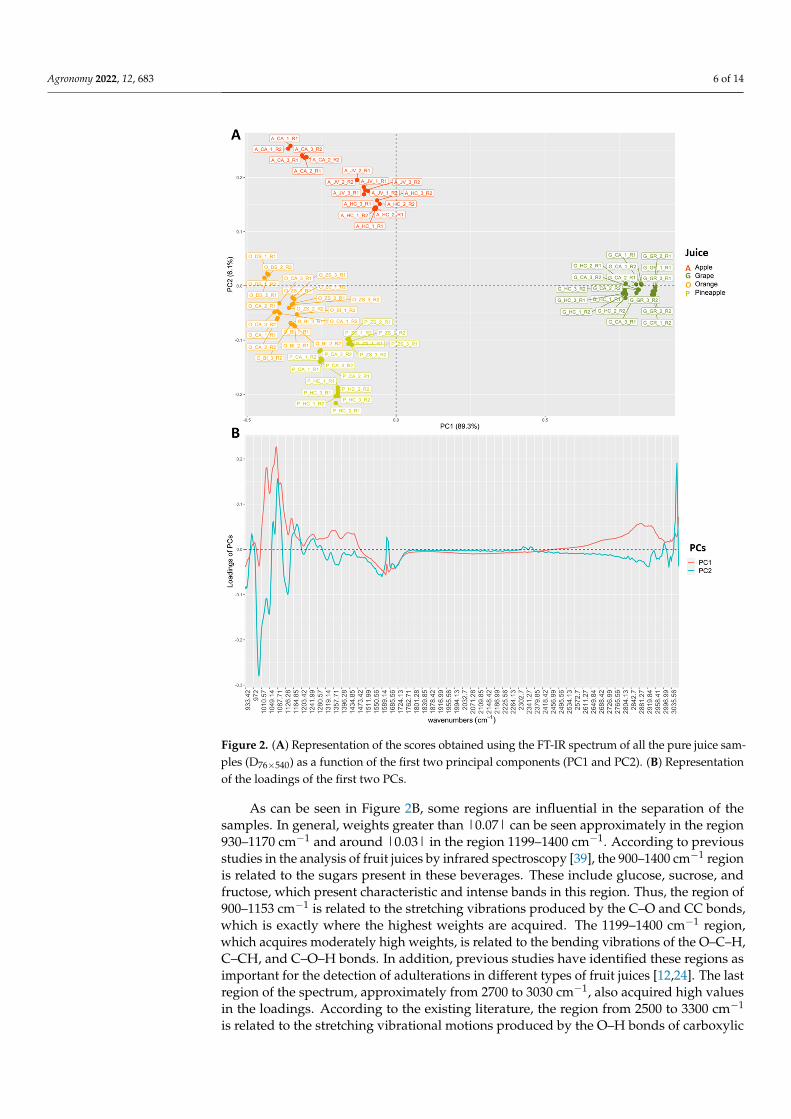
We perform a PCA to identify regions and, consequently, to determine the mostinfluential functional groups in the juice classification. Figure 2A shows the scores obtainedby the samples for the first two principal components (PC1 & PC2) and Figure 2B showsthe loadings of these components. As can be seen in Figure 2A, PC1 explains 87.8% of thevariability of the data, which allows to distinguish between the grape juice samples and theother juices. Thus, positive loadings of PC1 are associated with grape juices while negativeloadings correspond to apple, pineapple, and orange juices. This is quite relevant becausegrape juice is the one used as an adulterant and, therefore, the greater the separation, theeasier it will be to detect it. Besides, PC2 explains 6.1% of the total variability and allowsto distinguish mainly pineapple from apple. In this case, positive loadings are associatedwith apple, more negative loadings represent pineapple, and loadings around 0 would bemost associated with orange. It can also be observed that juices of the same brand and typetend to appear closer together, indicating a tendency for grouping according to brand.
Agronomy 2022, 12, 683 6 of 14
Figure 2. (A) Representation of the scores obtained using the FT-IR spectrum of all the pure juice sam-ples (D76×540) as a function of the first two principal components (PC1 and PC2). (B) Representationof the loadings of the first two PCs.
As can be seen in Figure 2B, some regions are influential in the separation of thesamples. In general, weights greater than |0.07| can be seen approximately in the region930–1170 cm−1 and around |0.03| in the region 1199–1400 cm−1. According to previousstudies in the analysis of fruit juices by infrared spectroscopy [39], the 900–1400 cm−1 regionis related to the sugars present in these beverages. These include glucose, sucrose, andfructose, which present characteristic and intense bands in this region. Thus, the region of900–1153 cm−1 is related to the stretching vibrations produced by the C–O and CC bonds,which is exactly where the highest weights are acquired. The 1199–1400 cm−1 region,which acquires moderately high weights, is related to the bending vibrations of the O–C–H,C–CH, and C–O–H bonds. In addition, previous studies have identified these regions asimportant for the detection of adulterations in different types of fruit juices [12,24]. The lastregion of the spectrum, approximately from 2700 to 3030 cm−1, also acquired high valuesin the loadings. According to the existing literature, the region from 2500 to 3300 cm−1
is related to the stretching vibrational motions produced by the O–H bonds of carboxylic
Agronomy 2022, 12, 683 7 of 14
acids [46]. These higher weights may be due to the multitude of acids naturally present infruit such as malic acid, which is found in high concentration in apples, citric acid, which isscarce in grapes and abundant in pineapple and orange, and tartaric acid, which is verycharacteristic of grapes, among others [47–49].
To sum up, this classification trend could be due to the difference in the number ofinitial sugars since, according to the data provided by the manufacturer and checked bydensimeter, grape juice is the one with the highest amount (≈15.8 g/100 mL). For thisreason, to prevent the applied supervised learning models from discriminating betweenthe different types of juice based on sugars, the samples of the adulteration process werediluted according to the sugar concentration. Additionally, PCA allowed a good separationof the juices according to their type as well as the selection of the wavenumbers responsiblefor this separation.
3.2. Classification Methods for Adulterant Detection
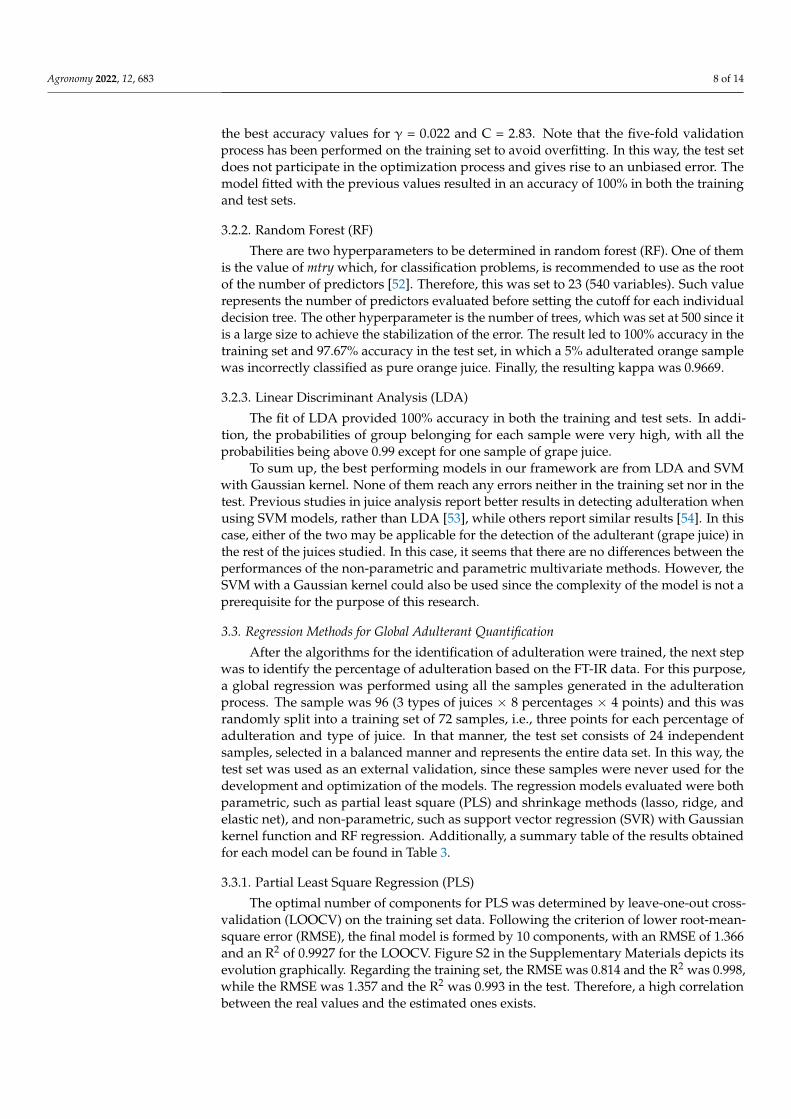
Once the ability of FT-IR to group juices according to the type of fruit has been checked,an evaluation of the feasibility of the technique to identify and quantify adulteration in thedifferent fruit juices was carried out. For this purpose, the whole data matrix was used,which is composed by the 184 samples from the different types of juices (orange, pineapple,apple, and grape) and the unadulterated and adulterated samples at different ratios (5%,10%, 15%, 20%, 30%, 40%, and 50%). Therefore, the resulting matrix has 540 wavenumbersand 184 samples (D184×540).
For the supervised learning methods, a total of four groups were established a prioriaccording to the type of juice used (“Pineapple”, “Apple”, and “Orange”) and the presenceof adulteration (“Adulterated”). The latter includes adulterated samples of all juices atdifferent percentages with the grape juice, and also samples of pure grape juice. Thecomplete data set was randomly split up on 75% of the samples for the training set andthe remaining 25% for the test set. Additionally, it was ensured that they were balanced,and the test contained at least one sample of each type of juice at each of its percentages ofadulteration. Thus, the test set contains 46 independent samples that are never part of themodel and is used as external validation of all trained models, leading to an unbiased error.It is important to remark that both the undiluted grape samples used in the exploratoryanalysis and the diluted ones used in the adulterations are adjusted on the models. Thus,the models do not depend on sugar content as seen in the applied PCA and, therefore, agreater robustness of the models is achieved. The classification models evaluated wereSVM with Gaussian kernel function, RF, and, LDA. A summary of the accuracy obtainedby the fitting of the different models is shown in Table 2.
Table 2. Summary of the accuracy obtained by the classification models tested.
Model Hyperparameter Training Set Accuracy Test Set Accuracy
lda - 100% 100%
SVmC = 2.83
100% 100%Y = 0.022
RFmtry = 23
100% 97.67%ntree = 500
3.2.1. Support Vector Machines (SVM) with Gaussian Kernel Function
Gaussian kernel SVM models contain two hyperparameters (γ and C) that must beselected by the analyst. Thus, γ controls the behavior of the kernel and therefore, increasingits value increases the flexibility of the model. C controls the penalty, i.e., the bias-variancetrade-off [50]. Optimization was performed by five-fold cross-validation with a grid searchmethod with exponentially growing C and γ sequences [51]. Specifically, the values of γand C ranged from log2γ, log2C in the range of [−10, 10] taking values every 0.5. The resultof this optimization is represented in Figure S1 of the Supplementary Materials, showing
Agronomy 2022, 12, 683 8 of 14
the best accuracy values for γ = 0.022 and C = 2.83. Note that the five-fold validationprocess has been performed on the training set to avoid overfitting. In this way, the test setdoes not participate in the optimization process and gives rise to an unbiased error. Themodel fitted with the previous values resulted in an accuracy of 100% in both the trainingand test sets.
3.2.2. Random Forest (RF)
There are two hyperparameters to be determined in random forest (RF). One of themis the value of mtry which, for classification problems, is recommended to use as the rootof the number of predictors [52]. Therefore, this was set to 23 (540 variables). Such valuerepresents the number of predictors evaluated before setting the cutoff for each individualdecision tree. The other hyperparameter is the number of trees, which was set at 500 since itis a large size to achieve the stabilization of the error. The result led to 100% accuracy in thetraining set and 97.67% accuracy in the test set, in which a 5% adulterated orange samplewas incorrectly classified as pure orange juice. Finally, the resulting kappa was 0.9669.
3.2.3. Linear Discriminant Analysis (LDA)
The fit of LDA provided 100% accuracy in both the training and test sets. In addi-tion, the probabilities of group belonging for each sample were very high, with all theprobabilities being above 0.99 except for one sample of grape juice.
To sum up, the best performing models in our framework are from LDA and SVMwith Gaussian kernel. None of them reach any errors neither in the training set nor in thetest. Previous studies in juice analysis report better results in detecting adulteration whenusing SVM models, rather than LDA [53], while others report similar results [54]. In thiscase, either of the two may be applicable for the detection of the adulterant (grape juice) inthe rest of the juices studied. In this case, it seems that there are no differences between theperformances of the non-parametric and parametric multivariate methods. However, theSVM with a Gaussian kernel could also be used since the complexity of the model is not aprerequisite for the purpose of this research.
3.3. Regression Methods for Global Adulterant Quantification
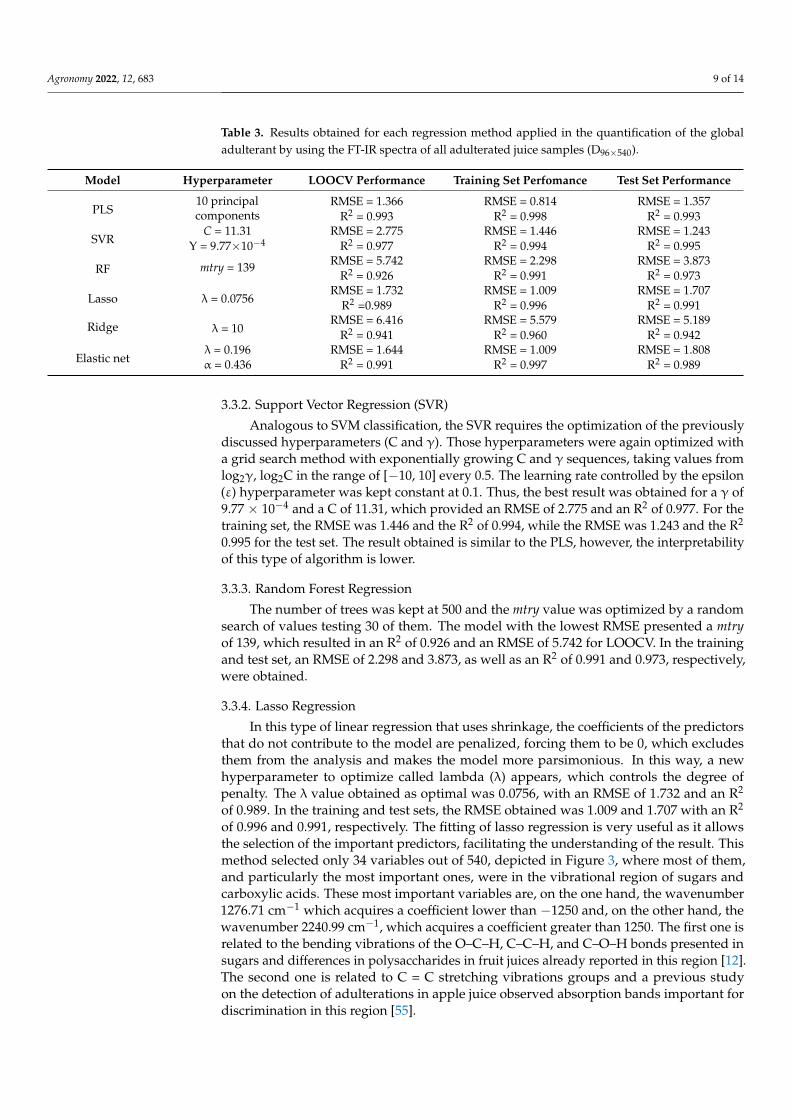
After the algorithms for the identification of adulteration were trained, the next stepwas to identify the percentage of adulteration based on the FT-IR data. For this purpose,a global regression was performed using all the samples generated in the adulterationprocess. The sample was 96 (3 types of juices × 8 percentages × 4 points) and this wasrandomly split into a training set of 72 samples, i.e., three points for each percentage ofadulteration and type of juice. In that manner, the test set consists of 24 independentsamples, selected in a balanced manner and represents the entire data set. In this way, thetest set was used as an external validation, since these samples were never used for thedevelopment and optimization of the models. The regression models evaluated were bothparametric, such as partial least square (PLS) and shrinkage methods (lasso, ridge, andelastic net), and non-parametric, such as support vector regression (SVR) with Gaussiankernel function and RF regression. Additionally, a summary table of the results obtainedfor each model can be found in Table 3.
3.3.1. Partial Least Square Regression (PLS)
The optimal number of components for PLS was determined by leave-one-out cross-validation (LOOCV) on the training set data. Following the criterion of lower root-mean-square error (RMSE), the final model is formed by 10 components, with an RMSE of 1.366and an R2 of 0.9927 for the LOOCV. Figure S2 in the Supplementary Materials depicts itsevolution graphically. Regarding the training set, the RMSE was 0.814 and the R2 was 0.998,while the RMSE was 1.357 and the R2 was 0.993 in the test. Therefore, a high correlationbetween the real values and the estimated ones exists.
Agronomy 2022, 12, 683 9 of 14
Table 3. Results obtained for each regression method applied in the quantification of the globaladulterant by using the FT-IR spectra of all adulterated juice samples (D96×540).
Model Hyperparameter LOOCV Performance Training Set Perfomance Test Set Performance
PLS10 principalcomponents
RMSE = 1.366 RMSE = 0.814 RMSE = 1.357R2 = 0.993 R2 = 0.998 R2 = 0.993
SVRC = 11.31 RMSE = 2.775 RMSE = 1.446 RMSE = 1.243
Y = 9.77×10⁻⁴ R2 = 0.977 R2 = 0.994 R2 = 0.995
RF mtry = 139 RMSE = 5.742 RMSE = 2.298 RMSE = 3.873R2 = 0.926 R2 = 0.991 R2 = 0.973
Lasso λ = 0.0756RMSE = 1.732 RMSE = 1.009 RMSE = 1.707
R2 =0.989 R2 = 0.996 R2 = 0.991
Ridge λ = 10RMSE = 6.416 RMSE = 5.579 RMSE = 5.189
R2 = 0.941 R2 = 0.960 R2 = 0.942
Elastic netλ = 0.196 RMSE = 1.644 RMSE = 1.009 RMSE = 1.808α = 0.436 R2 = 0.991 R2 = 0.997 R2 = 0.989
3.3.2. Support Vector Regression (SVR)
Analogous to SVM classification, the SVR requires the optimization of the previouslydiscussed hyperparameters (C and γ). Those hyperparameters were again optimized witha grid search method with exponentially growing C and γ sequences, taking values fromlog2γ, log2C in the range of [−10, 10] every 0.5. The learning rate controlled by the epsilon(ε) hyperparameter was kept constant at 0.1. Thus, the best result was obtained for a γ of9.77 × 10−4 and a C of 11.31, which provided an RMSE of 2.775 and an R2 of 0.977. For thetraining set, the RMSE was 1.446 and the R2 of 0.994, while the RMSE was 1.243 and the R2
0.995 for the test set. The result obtained is similar to the PLS, however, the interpretabilityof this type of algorithm is lower.
3.3.3. Random Forest Regression
The number of trees was kept at 500 and the mtry value was optimized by a randomsearch of values testing 30 of them. The model with the lowest RMSE presented a mtryof 139, which resulted in an R2 of 0.926 and an RMSE of 5.742 for LOOCV. In the trainingand test set, an RMSE of 2.298 and 3.873, as well as an R2 of 0.991 and 0.973, respectively,were obtained.
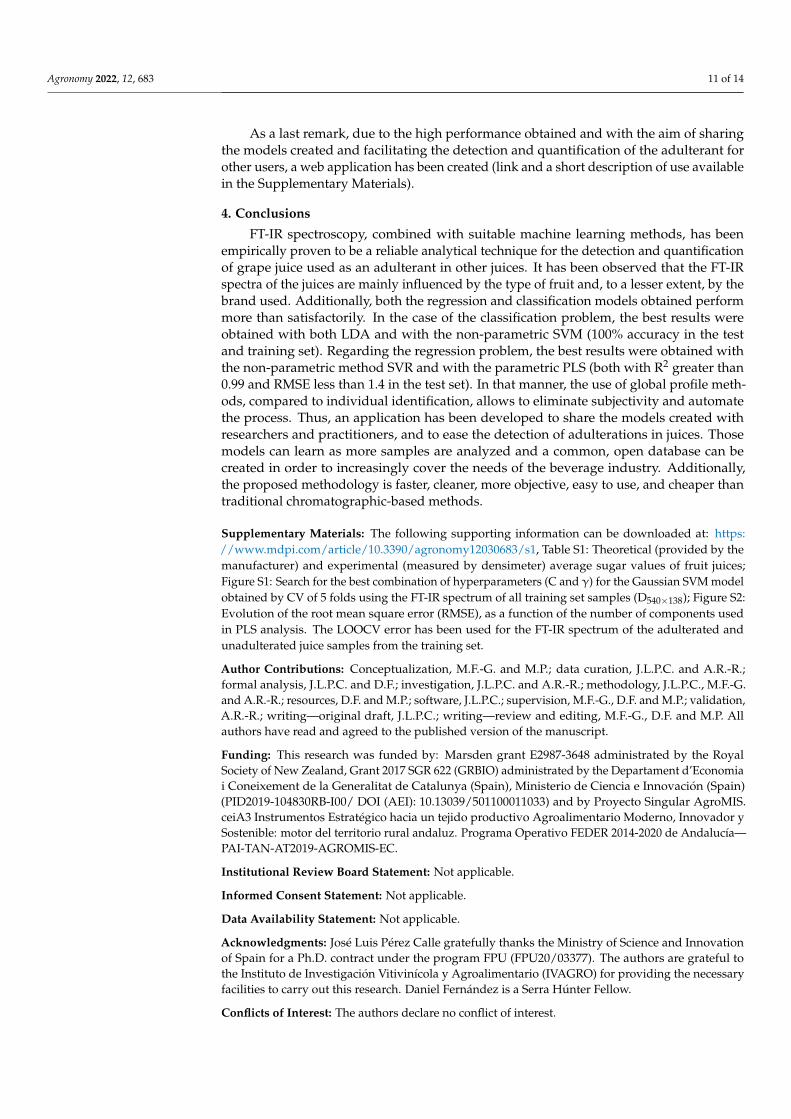
3.3.4. Lasso Regression
In this type of linear regression that uses shrinkage, the coefficients of the predictorsthat do not contribute to the model are penalized, forcing them to be 0, which excludesthem from the analysis and makes the model more parsimonious. In this way, a newhyperparameter to optimize called lambda (λ) appears, which controls the degree ofpenalty. The λ value obtained as optimal was 0.0756, with an RMSE of 1.732 and an R2
of 0.989. In the training and test sets, the RMSE obtained was 1.009 and 1.707 with an R2
of 0.996 and 0.991, respectively. The fitting of lasso regression is very useful as it allowsthe selection of the important predictors, facilitating the understanding of the result. Thismethod selected only 34 variables out of 540, depicted in Figure 3, where most of them,and particularly the most important ones, were in the vibrational region of sugars andcarboxylic acids. These most important variables are, on the one hand, the wavenumber1276.71 cm−1 which acquires a coefficient lower than −1250 and, on the other hand, thewavenumber 2240.99 cm−1, which acquires a coefficient greater than 1250. The first one isrelated to the bending vibrations of the O–C–H, C–C–H, and C–O–H bonds presented insugars and differences in polysaccharides in fruit juices already reported in this region [12].The second one is related to C = C stretching vibrations groups and a previous studyon the detection of adulterations in apple juice observed absorption bands important fordiscrimination in this region [55].

Agronomy 2022, 12, 683 10 of 14
Figure 3. Coefficients selected by the lasso method for the quantification of the adulterant using theFT-IR spectrum of the adulterated juice samples.
3.3.5. Ridge Regression
Similarly to the previous analysis, the coefficients of variables that are not importantare penalized so their values are reduced but without reaching 0 and, therefore, predictorsare not excluded. In this shrinkage regression, the value of the lambda hyperparameterhad to be specified using the same search method as the one employed in lasso regression.The value of λ selected as optimal was 10, achieving an RMSE of 6.416 and an R2 of 0.941for LOOCV. For the training and test sets, the RMSE values were 5.579 and 5.189 with an R2
of 0.960 and 0.972, respectively. These results are considerably lower than the equivalentsobtained with the other methods.
3.3.6. Elastic Net
In elastic net, a balance is sought between the exclusion of predictors (lasso) and thereduction of coefficients (ridge). Therefore, there are two hyperparameters to optimize:lambda, which controls the degree of penalty, and a new hyperparameter called alpha(α), which controls the degree of influence of each of the penalties (ridge and lasso). Theiroptimization was performed by testing 60 random combinations of values, and the bestmodel will be decided based on the one that achieves a lower RMSE. In this case, thecombination taken as optimal is a value of λ of 0.196 and an α of 0.436, which indicatesthat it is more similar to the ridge regression. For that combination, an RMSE of 1.644 andan R2 of 0.991 were achieved for LOOCV while in the training set an RMSE of 1.009 andR2 of 0.997 were obtained. Finally, for the test set, an R2 of 0.989 and an RMSE of 1.808were obtained.
For the global quantification of the adulterant, the results were more than satisfactoryfor all the methods applied (Table 3). The result obtained indicates a slightly higherpotential for the use of the non-parametric method (SVR) in the test set (RMSE = 1.243),although, the second-best result (RMSE = 1.357) is obtained with a parametric approach(PLS). These results suggest that in the FT-IR spectroscopic data of juice samples none of thestrategies is superior to the other. It should be noted that there are studies based on infraredspectroscopy data where better results are obtained with PLS than with SVR [56,57], whilein other cases practically identical performance is reported [58] or even better with SVR [59].Based on the previous literature and the results obtained in this study, the use of one orother methods may be of interest depending on the objective.
Agronomy 2022, 12, 683 11 of 14
As a last remark, due to the high performance obtained and with the aim of sharingthe models created and facilitating the detection and quantification of the adulterant forother users, a web application has been created (link and a short description of use availablein the Supplementary Materials).
4. Conclusions
FT-IR spectroscopy, combined with suitable machine learning methods, has beenempirically proven to be a reliable analytical technique for the detection and quantificationof grape juice used as an adulterant in other juices. It has been observed that the FT-IRspectra of the juices are mainly influenced by the type of fruit and, to a lesser extent, by thebrand used. Additionally, both the regression and classification models obtained performmore than satisfactorily. In the case of the classification problem, the best results wereobtained with both LDA and with the non-parametric SVM (100% accuracy in the testand training set). Regarding the regression problem, the best results were obtained withthe non-parametric method SVR and with the parametric PLS (both with R2 greater than0.99 and RMSE less than 1.4 in the test set). In that manner, the use of global profile meth-ods, compared to individual identification, allows to eliminate subjectivity and automatethe process. Thus, an application has been developed to share the models created withresearchers and practitioners, and to ease the detection of adulterations in juices. Thosemodels can learn as more samples are analyzed and a common, open database can becreated in order to increasingly cover the needs of the beverage industry. Additionally,the proposed methodology is faster, cleaner, more objective, easy to use, and cheaper thantraditional chromatographic-based methods.
Supplementary Materials: The following supporting information can be downloaded at: https://www.mdpi.com/article/10.3390/agronomy12030683/s1, Table S1: Theoretical (provided by themanufacturer) and experimental (measured by densimeter) average sugar values of fruit juices;Figure S1: Search for the best combination of hyperparameters (C and γ) for the Gaussian SVM modelobtained by CV of 5 folds using the FT-IR spectrum of all training set samples (D540×138); Figure S2:Evolution of the root mean square error (RMSE), as a function of the number of components usedin PLS analysis. The LOOCV error has been used for the FT-IR spectrum of the adulterated andunadulterated juice samples from the training set.
Author Contributions: Conceptualization, M.F.-G. and M.P.; data curation, J.L.P.C. and A.R.-R.;formal analysis, J.L.P.C. and D.F.; investigation, J.L.P.C. and A.R.-R.; methodology, J.L.P.C., M.F.-G.and A.R.-R.; resources, D.F. and M.P.; software, J.L.P.C.; supervision, M.F.-G., D.F. and M.P.; validation,A.R.-R.; writing—original draft, J.L.P.C.; writing—review and editing, M.F.-G., D.F. and M.P. Allauthors have read and agreed to the published version of the manuscript.
Funding: This research was funded by: Marsden grant E2987-3648 administrated by the RoyalSociety of New Zealand, Grant 2017 SGR 622 (GRBIO) administrated by the Departament d’Economiai Coneixement de la Generalitat de Catalunya (Spain), Ministerio de Ciencia e Innovación (Spain)(PID2019-104830RB-I00/ DOI (AEI): 10.13039/501100011033) and by Proyecto Singular AgroMIS.ceiA3 Instrumentos Estratégico hacia un tejido productivo Agroalimentario Moderno, Innovador ySostenible: motor del territorio rural andaluz. Programa Operativo FEDER 2014-2020 de Andalucía—PAI-TAN-AT2019-AGROMIS-EC.
Institutional Review Board Statement: Not applicable.
Informed Consent Statement: Not applicable.
Data Availability Statement: Not applicable.
Acknowledgments: José Luis Pérez Calle gratefully thanks the Ministry of Science and Innovationof Spain for a Ph.D. contract under the program FPU (FPU20/03377). The authors are grateful tothe Instituto de Investigación Vitivinícola y Agroalimentario (IVAGRO) for providing the necessaryfacilities to carry out this research. Daniel Fernández is a Serra Húnter Fellow.
Conflicts of Interest: The authors declare no conflict of interest.

Agronomy 2022, 12, 683 12 of 14
References1. AIJN. Liquid Fruit Market Report|AIJN—PlEuropean Fruit Juice Association. Available online: https://aijn.eu/en/publications/
market-reports-1 (accessed on 19 February 2021).2. Rampersaud, G.C.; Valim, M.F. 100% citrus juice: Nutritional contribution, dietary benefits, and association with anthropometric
measures. Crit. Rev. Food Sci. Nutr. 2017, 57, 129–140. [CrossRef] [PubMed]3. Rajauria, G.; Tiwari, B.K. Fruit Juices: An Overview. In Fruit Juices: Extraction, Composition, Quality and Analysis; Elsevier Inc.:
Amsterdam, The Netherlands, 2018; pp. 3–13, ISBN 9780128024911.4. European Parliament, European Parliament Directive 2012/12/EU of the European Parliament and of the Council of 19 April 2012
amending Council Directive 2001/112/EC relating to fruit juices and certain similar products intended for human consumption; EuropeanParliament: Luxembourg, 2012; pp. 1–11.
5. Moore, J.C.; Spink, J.; Lipp, M. Development and Application of a Database of Food Ingredient Fraud and Economically MotivatedAdulteration from 1980 to 2010. J. Food Sci. 2012, 77, R118–R126. [CrossRef] [PubMed]
6. Ammari, F.; Redjdal, L.; Rutledge, D.N. Detection of orange juice frauds using front-face fluorescence spectroscopy andIndependent Components Analysis. Food Chem. 2015, 168, 211–217. [CrossRef] [PubMed]
7. Rózanska, A.; Dymerski, T.; Namiesnik, J. Novel analytical method for detection of orange juice adulteration based on ultra-fastgas chromatography. Mon. Fur Chem. 2018, 149, 1615. [CrossRef] [PubMed]
8. Boggia, R.; Casolino, M.C.; Hysenaj, V.; Oliveri, P.; Zunin, P. A screening method based on UV-Visible spectroscopy andmultivariate analysis to assess addition of filler juices and water to pomegranate juices. Food Chem. 2013, 140, 735–741. [CrossRef]
9. Dasenaki, M.E.; Thomaidis, N.S. Quality and authenticity control of fruit juices-a review. Molecules 2019, 24, 1014. [CrossRef]10. Snyder, A.B.; Sweeney, C.F.; Rodriguez-Saona, L.E.; Giusti, M.M. Rapid authentication of concord juice concentration in a grape
juice blend using Fourier-Transform infrared spectroscopy and chemometric analysis. Food Chem. 2014, 147, 295–301. [CrossRef]11. Shojaee AliAbadi, M.H.; Karami-Osboo, R.; Kobarfard, F.; Jahani, R.; Nabi, M.; Yazdanpanah, H.; Mahboubi, A.; Nasiri, A.;
Faizi, M. Detection of lime juice adulteration by simultaneous determination of main organic acids using liquid chromatography-tandem mass spectrometry. J. Food Compos. Anal. 2022, 105, 104223. [CrossRef]
12. Ellis, D.I.; Ellis, J.; Muhamadali, H.; Xu, Y.; Horn, A.B.; Goodacre, R. Rapid, high-throughput, and quantitative determination oforange juice adulteration by Fourier-transform infrared spectroscopy. Anal. Methods 2016, 8, 5581–5586. [CrossRef]
13. Chang, J.-D.; Zheng, H.; Mantri, N.; Xu, L.; Jiang, Z.; Zhang, J.; Song, Z.; Lu, H. Chemometrics coupled with ultravioletspectroscopy: A tool for the analysis of variety, adulteration, quality and ageing of apple juices. Int. J. Food Sci. Technol. 2016, 51,2474–2484. [CrossRef]
14. Bononi, M.; Quaglia, G.; Tateo, F. Preliminary LC-IRMS Characterization of Italian Pure Lemon Juices and Evaluation ofCommercial Juices Distributed in the Italian Market. Food Anal. Methods 2016, 9, 2824–2831. [CrossRef]
15. Nuncio-Jáuregui, N.; Calín-Sánchez, Á.; Hernández, F.; Carbonell-Barrachina, Á.A. Pomegranate juice adulteration by addition ofgrape or peach juices. J. Sci. Food Agric. 2014, 94, 646–655. [CrossRef] [PubMed]
16. Cristea, G.; Dehelean, A.; Voica, C.; Feher, I.; Puscas, R.; Magdas, D.A. Isotopic and Elemental Analysis of Apple and Orange Juiceby Isotope Ratio Mass Spectrometry (IRMS) and Inductively Coupled Plasma–Mass Spectrometry (ICP-MS). Anal. Lett. 2021, 54,212–226. [CrossRef]
17. Lorente, J.; Vegara, S.; Martí, N.; Ibarz, A.; Coll, L.; Hernández, J.; Valero, M.; Saura, D. Chemical guide parameters for Spanishlemon (Citrus limon (L.) Burm.) juices. Food Chem. 2014, 162, 186–191. [CrossRef]
18. Dzugan, M.; Wesołowska, M.; Zaguła, G.; Puchalski, C. The comparison of the physicochemical parameters and antioxidantactivity of homemade and commercial pomegranate juices. Acta Sci. Pol. Technol. Aliment. 2018, 17, 59–68. [CrossRef]
19. Liang, Y.L.; Ding, Y.J.; Liu, X.; Zhou, P.F.; Ding, M.X.; Yin, J.J.; Song, Q. hou A duplex PCR–RFLP–CE for simultaneous detectionof mandarin and grapefruit in orange juice. Eur. Food Res. Technol. 2021, 247, 1–7. [CrossRef]
20. Pardo, M.A. Evaluation of a dual-probe real time PCR system for detection of mandarin in commercial orange juice. Food Chem.2015, 172, 377–384. [CrossRef]
21. Jahani, R.; Yazdanpanah, H.; van Ruth, S.M.; Kobarfard, F.; Alewijn, M.; Mahboubi, A.; Faizi, M.; Aliabadi, M.H.S.; Salamzadeh,J. Novel application of near-infrared spectroscopy and chemometrics approach for detection of lime juice adulteration. Iran. J.Pharm. Res. 2020, 19, 34–44. [CrossRef]
22. Dhaulaniya, A.S.; Balan, B.; Yadav, A.; Jamwal, R.; Kelly, S.; Cannavan, A.; Singh, D.K. Development of an FTIR based chemometricmodel for the qualitative and quantitative evaluation of cane sugar as an added sugar adulterant in apple fruit juices. Food Addit.Contam. Part A Chem. Anal. Control. Expo. Risk Assess. 2020, 37, 539–551. [CrossRef]
23. Sivakesava, S.; Irudayaraj, J.M.K.; Korach, R.L. Detection of Adulteration in Apple Juice Using Mid Infrared Spectroscopy. Appl.Eng. Agric. 2001, 17, 815–820. [CrossRef]
24. Kelly, J.F.D.; Downey, G. Detection of sugar adulterants in apple juice using fourier transform infrared spectroscopy andchemometrics. J. Agric. Food Chem. 2005, 53, 3281–3286. [CrossRef] [PubMed]
25. Jha, S.N.; Gunasekaran, S. Authentication of sweetness of mango juice using Fourier transform infrared-attenuated total reflectionspectroscopy. J. Food Eng. 2010, 101, 337–342. [CrossRef]
26. He, J.; Rodriguez-Saona, L.E.; Giusti, M.M. Midinfrared spectroscopy for juice authentication-rapid differentiation of commercialjuices. J. Agric. Food Chem. 2007, 55, 4443–4452. [CrossRef] [PubMed]
Agronomy 2022, 12, 683 13 of 14
27. Vardin, H.; Tay, A.; Ozen, B.; Mauer, L. Authentication of pomegranate juice concentrate using FTIR spectroscopy and chemomet-rics. Food Chem. 2008, 108, 742–748. [CrossRef] [PubMed]
28. Ríos-Reina, R.; Camiña, J.M.; Callejón, R.M.; Azcarate, S.M. Spectralprint techniques for wine and vinegar characterization,authentication and quality control: Advances and projections. TrAC-Trends Anal. Chem. 2021, 134, 116121. [CrossRef]
29. Martín-Alberca, C.; Ortega-Ojeda, F.E.; García-Ruiz, C. Analytical tools for the analysis of fire debris. A review: 2008–2015. Anal.Chim. Acta 2016, 928, 1–19. [CrossRef]
30. Falatová, B.; Ferreiro-González, M.; Luis, J.; Calle, P.; Ángel Álvarez, J.; Palma, M. Discrimination of Ignitable Liquid Residues inBurned Petroleum-Derived Substrates by Using HS-MS eNose and Chemometrics. Sensors 2021, 21, 801. [CrossRef]
31. Lachenmeier, D.W. Rapid quality control of spirit drinks and beer using multivariate data analysis of Fourier transform infraredspectra. Food Chem. 2007, 101, 825–832. [CrossRef]
32. Pérez Calle, J.L.; Ferreiro González, M.; Ruiz Rodríguez, A.; Fernández Barbero, G.; Álvarez Saura, J.Á.; Palma Lovillo, M.;Ayuso Vilacides, J. A Methodology Based on FT-IR Data Combined with Random Forest Model to Generate Spectralprints for theCharacterization of High-Quality Vinegars. Foods 2021, 10, 1411. [CrossRef]
33. Tôrres, A.R.; de Oliveira, A.D.P.; Grangeiro, S.; Fragoso, W.D. Multivariate statistical process control in annual pharmaceuticalproduct review. J. Process Control 2018, 69, 97–102. [CrossRef]
34. Tiwari, P.K.; Awasthi, S.; Kumar, R.; Anand, R.K.; Rai, P.K.; Rai, A.K. Rapid analysis of pharmaceutical drugs using LIBS coupledwith multivariate analysis. Lasers Med. Sci. 2017, 33, 263–270. [CrossRef] [PubMed]
35. Dankowska, A.; Kowalewski, W. Tea types classification with data fusion of UV–Vis, synchronous fluorescence and NIRspectroscopies and chemometric analysis. Spectrochim. Acta-Part A Mol. Biomol. Spectrosc. 2019, 211, 195–202. [CrossRef][PubMed]
36. Jia, W.; Liang, G.; Tian, H.; Sun, J.; Wan, C. Electronic Nose-Based Technique for Rapid Detection and Recognition of MoldyApples. Sensors 2019, 19, 1526. [CrossRef] [PubMed]
37. Shafiee, S.; Minaei, S. Combined data mining/NIR spectroscopy for purity assessment of lime juice. Infrared Phys. Technol. 2018,91, 193–199. [CrossRef]
38. Xie, L.J.; Ying, Y. Bin Use of near-infrared spectroscopy and least-squares support vector machine to determine quality change oftomato juice. J. Zhejiang Univ. Sci. B 2009, 10, 465–471. [CrossRef] [PubMed]
39. Leopold, L.F.; Leopold, N.; Diehl, H.A.; Socaciu, C. Quantification of carbohydrates in fruit juices using FTIR spectroscopy andmultivariate analysis. Spectroscopy 2011, 26, 93–104. [CrossRef]
40. Duarte, I.F.; Barros, A.; Delgadillo, I.; Almeida, C.; Gil, A.M. Application of FTIR spectroscopy for the quantification of sugars inmango juice as a function of ripening. J. Agric. Food Chem. 2002, 50, 3104–3111. [CrossRef]
41. Bureau, S.; Ruiz, D.; Reich, M.; Gouble, B.; Bertrand, D.; Audergon, J.M.; Renard, C.M.G.C. Application of ATR-FTIR for a rapidand simultaneous determination of sugars and organic acids in apricot fruit. Food Chem. 2009, 115, 1133–1140. [CrossRef]
42. Wickham, H. ggplot2: Elegant Graphics for Data Analysis; Springer-Verlag: Berlin, Germany, 2016; ISBN 978-3-319-24277-4.43. R Core Team. R: A Language and Environment for Statistical Computing; R Core Team: Vienna, Austria, 2020.44. Kuhn, M. Caret: Classification and Regression Training. 2020. Available online: https://cran.r-project.org/web/packages/caret/
caret.pdf (accessed on 18 December 2021).45. Chang, W.; Cheng, J.; Allaire, J.J.; Xie, Y.; McPherson, J. Shiny: Web Application Framework for R. 2020; Available online:
https://cran.r-project.org/web/packages/shiny/index.html (accessed on 19 February 2021).46. IR Spectrum Table & Chart|Sigma-Aldrich. Available online: https://www.sigmaaldrich.com/technical-documents/articles/
biology/ir-spectrum-table.html (accessed on 16 May 2021).47. Li, J.; Zhang, C.; Liu, H.; Liu, J.; Jiao, Z. Profiles of Sugar and Organic Acid of Fruit Juices: A Comparative Study and Implication
for Authentication. J. Food Qual. 2020, 2020, 7236534. [CrossRef]48. Zhang, H.; Xie, Y.; Liu, C.; Chen, S.; Hu, S.; Xie, Z.; Deng, X.; Xu, J. Comprehensive comparative analysis of volatile compounds in
citrus fruits of different species. Food Chem. 2017, 230, 316–326. [CrossRef] [PubMed]49. Amakura, Y.; Okada, M.; Tsuji, S.; Tonogai, Y. Determination of phenolic acids in fruit juices by isocratic column liquid
chromatography. J. Chromatogr. A 2000, 891, 183–188. [CrossRef]50. Géron, A. Hands-On Machine Learning with Scikit-Learn and TensorFlow, 2nd ed.; Roumeliotis, R.N.T., Ed.; O’Reilly Media, Inc.:
Newton, MA, USA, 2019.51. Hastie, T.; Tibshirani, R.; Friedman, J.H. The Elements of Statistical Learning: Data Mining, Inference, and Prediction, 2nd ed.; Springer:
New York, NY, USA, 2009; ISBN 0387848576.52. Rodriguez-Galiano, V.F.; Ghimire, B.; Rogan, J.; Chica-Olmo, M.; Rigol-Sanchez, J.P. An assessment of the effectiveness of a
random forest classifier for land-cover classification. ISPRS J. Photogramm. Remote Sens. 2012, 67, 93–104. [CrossRef]53. Rasekh, M.; Karami, H. Application of electronic nose with chemometrics methods to the detection of juices fraud. J. Food Process.
Preserv. 2021, 45, e15432. [CrossRef]54. Qiu, S.; Wang, J.; Gao, L. Discrimination and characterization of strawberry juice based on electronic nose and tongue: Comparison
of different juice processing approaches by LDA, PLSR, RF, and SVM. J. Agric. Food Chem. 2014, 62, 6426–6434. [CrossRef][PubMed]
55. Downey, G.; Kelly, J.D.; León, L. Detection of Apple Juice Adulteration Using Near-Infrared Transflectance Spectroscopy. Appl.Spectrosc. 2005, 59, 593–599.

Agronomy 2022, 12, 683 14 of 14
56. Moura, H.O.M.A.; Câmara, A.B.F.; Santos, M.C.D.; Morais, C.L.M.; de Lima, L.A.S.; Lima, K.M.G.; de Carvalho, L.S. Advancesin chemometric control of commercial diesel adulteration by kerosene using IR spectroscopy. Anal. Bioanal. Chem. 2019, 411,2301–2315. [CrossRef]
57. Leng, T.; Li, F.; Chen, Y.; Tang, L.; Xie, J.; Yu, Q. Fast quantification of total volatile basic nitrogen (TVB-N) content in beef andpork by near-infrared spectroscopy: Comparison of SVR and PLS model. Meat Sci. 2021, 180, 108559. [CrossRef]
58. Sugami, Y.; Minami, E.; Saka, S. Renewable diesel production from rapeseed oil with hydrothermal hydrogenation and subsequentdecarboxylation. Fuel 2016, 166, 376–381. [CrossRef]
59. Borin, A.; Ferrão, M.F.; Mello, C.; Maretto, D.A.; Poppi, R.J. Least-squares support vector machines and near infrared spectroscopyfor quantification of common adulterants in powdered milk. Anal. Chim. Acta 2006, 579, 25–32. [CrossRef] [PubMed]