Detection of a White Dwarf in a Visual Binary System Erika ...
14
NASA-C_-_ 90_5o Detection of a White Dwarf in a Visual Binary System Erika B6hm-Vitense 1 University of Washington, Seattle, WA 98195 (NASA-CR-190856) OETECTION OF A WHITE DWARF IN A VISUAL BINARY SYSTEM (Washington Univ.) 14 p Nq3-II075 Unclas G3/89 0121130 1 Guest Observer at the IUE Observatory.
-
Upload
khangminh22 -
Category
Documents
-
view
1 -
download
0
Transcript of Detection of a White Dwarf in a Visual Binary System Erika ...
NASA-C_-_ 90_5o
Detection of a White Dwarf in a Visual Binary System
Erika B6hm-Vitense 1
University of Washington, Seattle, WA 98195
(NASA-CR-190856) OETECTION OF A
WHITE DWARF IN A VISUAL BINARY
SYSTEM (Washington Univ.) 14 p
Nq3-II075
Unclas
G3/89 0121130
1 Guest Observer at the IUE Observatory.
Abstract
The F6 giant HD 160365 was detected to have a white dwarf companion about 8 arcsec
south of the star. The UV energy distribution observed with IUE shows that the white dwarf
has an effective temperature of 23,000 4- 2,000 K. If log g = 8 the Lya profile indicates an
effective temperature around 24,500 K. Using the theoretical models by Wesemael et al. one
finds a visual magnitude of my ,-_ 16.5. For Tea = 24,500 K one expects for a white dwarf
a luminosity of log L/L® ,,_ -1.3 and Mv "_ 10.67. This gives a distance modulus for the
system of my - Mv = 5.83 and an absolute magnitude My = 0.3 for the giant.
PRECC_D!NG PAGE BLANK NOT FILMED2
I. Observations
When observing the F6III giant HD 160365 with IUE it was discovered that the star has
a hot companion roughly 8" south of the giant. A slight apparent wavelength shift of Lya
may show that the companion is also displaced by a few arcsec in the east-west direction.
The spectra of the two stars are reasonably well separated.
In Figure 1 we show the energy distribution for the combined spectrum. The visibility
of flux shortward of Lya shows that the companion is a B star.
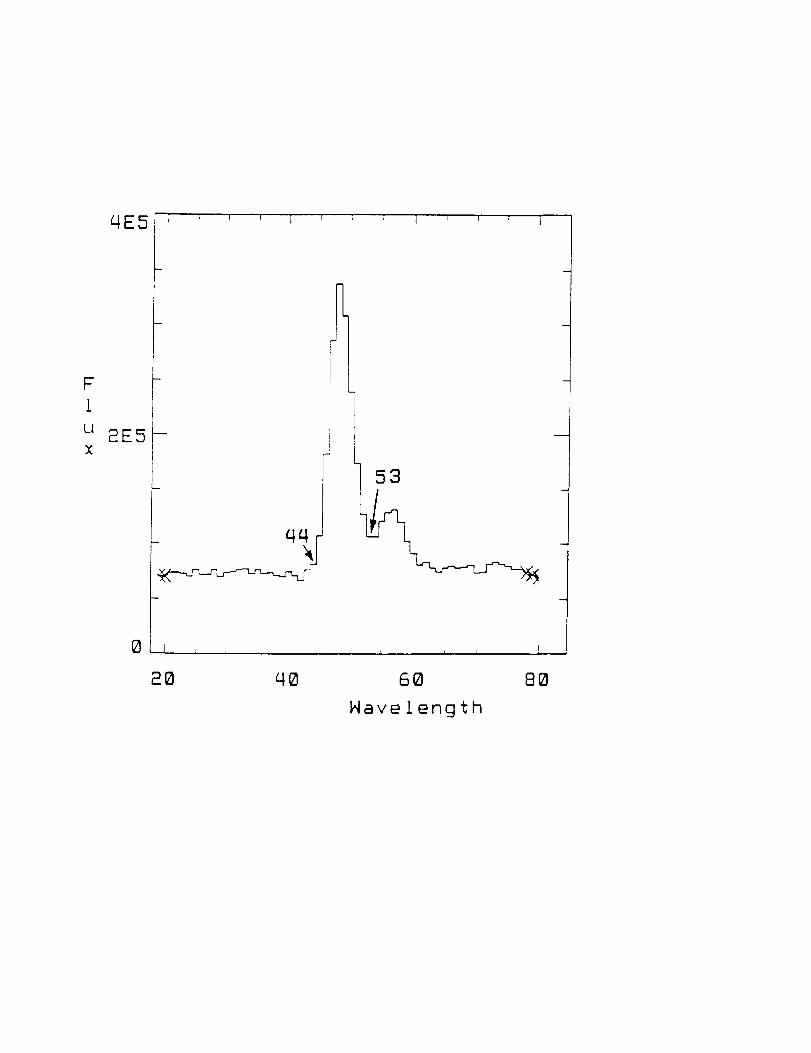
In Figure 2 we show the cross-section through the spectra perpendicular to the direction
of dispersion for a 100 ,_ wavelength band 1400 /_ < )_ < 1500 ,_. The abscissa gives the
"line" number showing the position along the long axis of the entrance aperture to the
IUE spectrograph. The ordinate gives again the flux numbers which can be transformed
into actual fluxes by means of the sensitivity curve. The main peak shows the flux of the
companion, the smaller peak the one for the giant. The two spectra are separated by 8 "lines"
corresponding to about 8 arcsec. The point spread functions slightly overlap at "line" 53.
It is obvious, however, that at these wavelengths the influence of the giant spectrum on
the companion spectrum is minimal if we use the lines no 44 to 53 for the extraction of the
companion spectrum. For ,_ > 1500 _ the contribution of the giant relative to the companion
increases. We may expect corrections of up to 10% 4- 5% for the longest wavelengths shown.
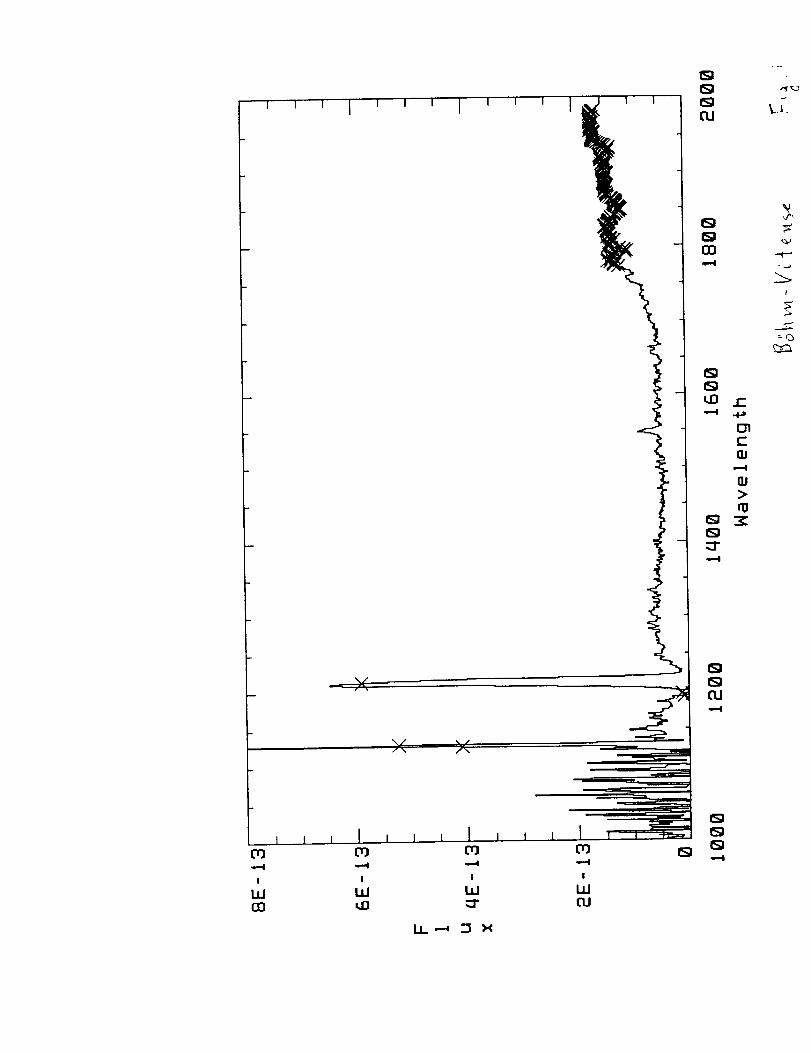
In Figure 3 we show the spectral energy distribution derived from summing up the fluxes
for "lines" 44 to 53. The fluxes over the whole wavelength band may be somewhat too low
because the image of the companion was close to the edge of the entrance aperture and some
light may have been lost. A wavelength shift observed for the stellar Lyc_ may indicate that
also in the east-west direction the companion was not centered in the entrance aperture.
This could also cause loss of some light. We do, however, not think that a major fraction
of the light was lost. The maximum of the point spread function was certainly within the
entrance aperture, because the spectrum is well defined. A light loss of up to about 30% can
3

probably not be excluded.
II. The Continuous Energy Distribution
In Figure 2 we have drawn two straight lines representing the theoretical energy
distributions for hydrogen white dwarfs with log g = 8 and with Tefl_ = 22,500 K and
25,000 K, according to Wesemael et al. 1980. Within the limits of error of our observations
both values are possible.
As plotted the observed flux at 1526 _ is 3.25 10 -16 erg cm -2 sec -1 A -1. According to
Wesemael et al. we then expect a visual flux at 5500 A of fv = 8.4.10 -16 erg cm -2 sec -1 A -1
if Te_ = 25,000 K. According to Code, Holm and Bottemiller (1980) we have fv =
3.6 • 10 -9 erg cm -2 sec -1 A -1 for mv = 0. We then derive an apparent visual magnitude of
my = 16.6 for 25,000K. For Tefl_ = 22500 K we find my = 16.3. If 30% of the light was lost
at the edge of the entrance aperture the m_ has to be changed by Amy = -0.28.
According to Weidemann 1975 we expect for a white dwarf with Te_ = 24,500 K a
luminosity of log L/L® = -1.3 leading to Mbo! = 8.00 and Mv "_ 10.67. We have adopted
the bolometric correction given by Wesemael et al. With my _< 16.5 for the white dwarf this
gives a distance modulus of my - Mv _< 5.83. If the stars are at the same distance we find
for the F6 III star with my = 6.12 that My _< 0.29 and d ,_ 146 pc.
The angular separation of the stars of about 8" then implies a distance of 1172 au for
the companions if they belong together. Since the radial velocity for the giant is known this
pair offers another possibility to determine the relativistic red shift for the white dwarf and
thereby determine its mass directly.
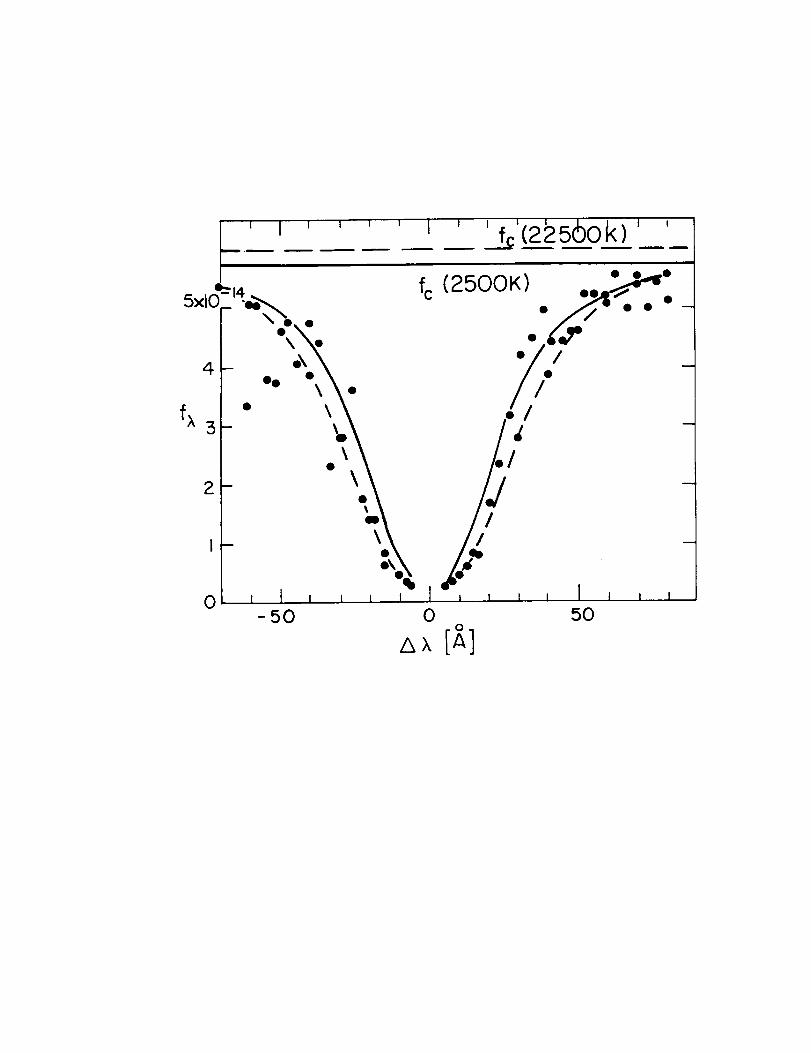
III. The Hydrogen Lya Line
On our spectra we can measure the Lya line profile and compare it with theoretical
line profiles. We assume log g = 8 as is appropriate for most white dwarfs. In Figure 4
4

we show the observed energy distribution (averaged over 3 measuring points as provided by
the IUE observatory) around Lya and compare it with theoretical line profiles as given by
Wesemael et al. for Te_ = 25,000 and 22,500K. The comparison indicates a Te_" of slightly
less than 25,000 K. We adopt Te_ = 24,500K 4- 500 K. (We have to remember that the
IUE spectrograph in its low resolution mode provides only a resolution of 6 A. We may
therefore expect some instrumental broadening.) Larger gravities than log g = 8 would
require somewhat higher temperatures. The continuum energy distribution does, however,
not permit higher temperatures. There is not enough energy shortward of 1200 A. Somewhat
• smaller g and smaller T are possible.
IV. Absorption Lines of Heavy Elements
Several weak dips are seen in the companion spectrum for A < 1500/_. The signal to noise
ratio is very low so we cannot be sure of the reality of these dips. Nevertheless we list the
approximate wavelengths of the dips in Table 1 and also possible identifications. Since the
stellar Lyc_ line appears to be shifted by -4.5 A supposedly because of the incorrect centering
in the entrance aperture, the same shift is expected for other lines. For identification we
should therefore add 4.5 A to the measured wavelength. With this in mind most of the
dips occur at wavelength were several CI lines are observed in the lab. A few other dips
might perhaps be identified with Silicon lines. From our low signal to noise spectra we can
certainly not claim that we have identified CI and CII lines but Table 1 looks suggestive.
High resolution spectra need to be taken to confirm or reject this suspicion. The star is,
however, too faint to be observed with IUE in the high resolution mode.
Using the Saha equation for a rough estimate we find that about 0.1% of the carbon
may still be neutral at this temperature.
V. Summary
From the observed energy distribution of the hot visual companion to the F6 III star
5
HD 160365 we determine a Teff of 22500 < Te_ < 25,000 K. From the Lya line profile we
determine Tell" = 24,500 _+5o°°0 K.
With the observed flux at 1526 A namely f,x = 3.25 10 -14 erg cm -2 sec -1 A -1 and the
theoretical ratio _ = 38.65 for Tetr = 25,000 K according to Wesemael et al. (1980) we find
a visual flux fv = 1.08 10 -15 erg cm -2 sec -1 A -1. According to Code, Holm and Bottemiller
(1980) this leads to my = 16.6 for 25,000 K. For 22,500 K an apparent visual magnitude of
mv = 16.3 is derived assuming that no reddening correction is required.
If the white dwarf has a mass of 0.6 M® (corresponding to log g = 8) it is expected to
have a luminosity of log L/L® = -1.3 and an absolute magnitude of Mv = 10.67. This
gives a distance modulus of 5.8 if Tear = 24,500 K as adopted, and a distance d = 144.5 pc
= 4.46 102o cm. Using this also for the giant we derive for this star My = 0.3. This appears
to be a reasonable value making it highly probable that the stars do indeed belong together.
If we lost about 30% of the light because the image of the white dwarf was close to the edges
of the entrance aperture then the real distance modulus would be 5.52.
From the ratio of the observed flux at 1526 _t to the theoretically expected flux we
can determine the angular radius for the white dwarf. For Tdr = 25,000K we find R/d =
1.78.10 -12 and for 22,500K a ratio R/d = 2.2.10 -12, from which we interpolate for Tdr =
24,500 that R/d = 1.86 10 -12. Here R is the radius of the star. With the distance of 144.5
pc we then derive R _ 8300 km. If we have lost 30% of the light the actual flux at 1526
A is a factor of 1.3 larger, the visual magnitude is less, the distance becomes smaller but
the radius comes out to be the same. According to Hamada and Salpeter (1961) a He white
dwarf with 0.6 M® is expected to have R/R® = 1.19 10 -2 leading to R = 8282 kin. The
agreement with the value derived above is surprisingly good, showing that our derivations
are consistent.
According to Weidemann (1968) a 0.6 M® white dwarf with T_tr = 24,500 K has been a
white dwarf since about 3 107 years. An F6 III giant with Mv = 0.3 probably started out on
6
the main sequence as an early A or late B star with a mass around 2.5 M® and a lifetime of
about 109 years. The white dwarf is then only slightly ahead in its evolution. The original
mass difference must have been very small.
With the present separation of about 1000 au mass transfer by Roche lobe overflow at
the time when the white dwarf progenitor was a luminous red giant seems to be excluded
even though the two stars were probably much closer at that time. If there was any mass
transfer it could have been only by means of a strong stellar wind. It would be interesting
to check whether any signs of this can be seen in the surface abundances of the F6 giant
whose convection zone is still shallow.
From the strengths of the transition layer emission lines in the F6 III star we estimate
an overabundance of carbon relative to nitrogen by a factor of Alog N/C ,-- 0.35 -t- 0.05, but
the N V line is in the Lya wing of the white dwarf and is therefore hard to measure. The
overabundance of carbon relative to silicon is only about 0.1 dex.
If CI lines are indeed seen in the white dwarf spectrum they might be due to some
circumstellar material kept in the system due to the giant.
The radial velocity of the F6III star is known and the orbital velocity has to be
extremely small. The white dwarf is therefore another candidate to determine the relativistic
redshift and check whether it is consistent with a mass of 0.6 M® and the derived radius.
Unfortunately the orbital period is too long to be useful for a binary mass determination.
Acknowledgement
This study was supported by NASA grant NSG 5398, which is gratefully acknowledged.
I am also very much indebted to the staff of the IUE Observatory without whose continuous
help and support this study would not have been possible.
7
_efePellce$
Code, A. D., Holm, A. V., and Bottemiller, R. L. 1980, ApJS, 43,501
Hamada, T. and Salpeter, E. E. 1961, ApJ, 134, 683
Weidemann, V. 1968, Ann. Rev. Astr. Astrophys. 6, 351
Weidemann, V. 1975, In "Problems in Stellar Atmospheres and Envelopes" ed. Baschek, B.,
Kegel, W. H., and Traving, G., Springer Berlin, p. 173
Wesemael, F., Auer, L. H., van Horn, H. M. and Savedoff, M. P. 1980, ApJS, 43, 159
8

Table 1
Possible dips in the white dwarf spectrum
and possible identifications
A measured element _ lab.
1244
1255 (broad)
1278
1285
1295
1311
1325
1340
1412
1465 (broad)
1555
Si II
CI
CI
CI
Si III
CI
CI
C II
Si III
CI
CI
1246.7 - 1251.2
1260.5 - 1261.1
1279.3 - 1280.9
1288.1 - 1288.6
1296.7 - 1301.1
1311.4 - 1315.9 (SiIII 1312.6)
1328.9 - 1329.6
1334.5 - 1335.7 (?)
1417.2
1459.1 - 1470.2
1560.3 - 1561.4
Figure Captions
Figure 1. The energy distribution for the combined spectrum of the F6 giant and the white
dwarf companion is shown as a function af wavelength.
Figure 2. For the wavelength band 1400 _ < )_ < 1500 /_ we show a cross section through
the spectrum perpendicular to the direction of dispersion, i.e., parallel to the long axis
of the entrance aperture. The spectra of the two stars are well separated. The main
maximum is due to the companion, the smaller maximum to the F6 III star. Only at
position 53 do the two spectra overlap.
Figure 3. We show the spectral energy distribution of the white dwarf, obtained by summing
the "lines" 44 to 53. For )_ >1500 A some contamination from the cool star is seen.
Figure 4. The observed Lya line profile is shown and compared with theoretical profiles for
log g = 8 and Teff = 22,500 K as well as T¢_ = 25,000K, according to Wesemael et al.
(1980). The Tear of the star appears to be slightly cooler than 25,000 K.
10
F
1
U
X
qE5
eE5
I i i I
20 qo
tL
i
L
I I
60
Havelength
80

r---
.=.li
lJ-} r-
c-l]J
..--4
cO
.=-.-4
C_
I
IJJOJ
OJ
' I l i IOil
i
' I'''' t, 'fc'(2_'56ok)' '
5xlO'e-,_ fc (2500K) "_°'°" _..l_:
fx 5 • ko,__ ./'°J
2 - \o_
I- \&
1I
n I 1 , , i J I _ , i , i l , iv
- 50 0 50
Ax [_,]