detailed design study on the bago river bridge construction ...
180
DETAILED DESIGN STUDY ON THE BAGO RIVER BRIDGE CONSTRUCTION PROJECT REPUBLIC OF THE UNION OF MYANMAR MINISTRY OF CONSTRUCTION DEPARTMENT OF BRIDGE FINAL REPORT DECEMBER 2017 JAPAN INTERNATIONAL COOPERATION AGENCY (JICA) NIPPON KOEI CO., LTD. ORIENTAL CONSULTANTS GLOBAL CO., LTD. METROPOLITAN EXPRESSWAY COMPANY LIMITED. CHODAI CO., LTD. NIPPON ENGINEERING CONSULTANTS CO., LTD. EI CR(3) 17-136
-
Upload
khangminh22 -
Category
Documents
-
view
1 -
download
0
Transcript of detailed design study on the bago river bridge construction ...
DETAILED DESIGN STUDY ONTHE BAGO RIVER BRIDGECONSTRUCTION PROJECT
REPUBLIC OF THE UNION OF MYANMARMINISTRY OF CONSTRUCTIONDEPARTMENT OF BRIDGE
FINAL REPORT
DECEMBER 2017
JAPAN INTERNATIONAL COOPERATION AGENCY (JICA)
NIPPON KOEI CO., LTD.ORIENTAL CONSULTANTS GLOBAL CO., LTD.
METROPOLITAN EXPRESSWAY COMPANY LIMITED.CHODAI CO., LTD.
NIPPON ENGINEERING CONSULTANTS CO., LTD.
EICR(3)17-136
DETAILED DESIGN STUDY ONTHE BAGO RIVER BRIDGECONSTRUCTION PROJECT
REPUBLIC OF THE UNION OF MYANMARMINISTRY OF CONSTRUCTIONDEPARTMENT OF BRIDGE
FINAL REPORT
DECEMBER 2017
JAPAN INTERNATIONAL COOPERATION AGENCY (JICA)
NIPPON KOEI CO., LTD.ORIENTAL CONSULTANTS GLOBAL CO., LTD.
METROPOLITAN EXPRESSWAY COMPANY LIMITED.CHODAI CO., LTD.
NIPPON ENGINEERING CONSULTANTS CO., LTD.
ダゴン橋
BM
BM
BM
Dock yard
Survey Dept.
Yangon Central RS
National Stadium No.1
Dala
Bahan
Dagon
Pabedan
Latha
Kyauktada
Seikkan
Pazundaung
Botataung
Thaketa
Dawbon
Thingangyun
South Okkalapa
Yankin
Mingalataungnyunt
Tarmway
Dagonmyothit (South)
Dagonmyothit(Seikkan)
Dagonmyothit(Seikkan)
INYA LAKE
KAN DAW GYI LAKE
Kyaik ka san C
Bogyok C
Ya baukkyi C
PAZUNDAUNG C
YANGON RIVER
Ta da C
Seik gyi C
Ayun
zok
C
Pa ya gyi C
Kyon
da ye C
Ano gyaung C
Tha kut pin (B assein)
Creek
K a ma aung
Pya w bwe C
Kha ya C
Nyan gyaung C
YANG
ON
RIVER
Nga pa C
Myoyo C
Be in daw C
Towthur C
Kondan C
La ha
yet C
Ba yet C
Pa gan daung C
Baw C
BAGO RIVER
Kan byaung C
Kayat C
Pa lan C
Shwe byauk C
Seikgyi C
Myoyo C
Thon
gw
a Y
Pa-aung gyi Y
Da min zeik C
Baw ka lut C
Ka lauk swe C
San di C
Be in daw C
Pa da gy i C
Ayun zok C
SIN KAN LAKE
Za Ma Ni Dam
Thi la wa Dam
Ban bwe gon Dam
3.0
6.4
1.3
4.1
3.3
2.0
5.3
3.1
5.5
3.8
2.9
3.5
3.2
6.5
4.7
4.2
4.7
2.1
3.3
3.8
4.0
3.2
5.4
4.54.83.4
2.8
2.9
2.1
1.1
2.5
2.4
3.9
4.5
21.2
8.0
3.0
1.6
2.9
5.7
5.03.5
5.9
5.2
5.3
4.1
5.0
4.6
4.8
5.4
10.3
3.2
3.7
4.0
4.6
4.6
4.6
6.9
4.9
8.3
5.5
4.33.7
4.03.0
3.6
3.8
3.96.3
4.4
6.1
4.2
2.2
14.7
22.4
20.7
29.2
14.5
7.4
2.3
1.6
1.5
1.3
1.7
1.2
2.2
2.3
2.4
3.4
2.0
2.2
1.9
2.6
2.5
2.7
3.5
3.3
3.1
2.9
2.7
3.7
4.1
4.2
3.7
3.6
4.1
1.6
1.0
1.4
1.1
1.6
1.2
1.8
1.7
1.7
2.4
2.0
2.9
2.8
3.2
3.4
2.9
3.1
3.2
3.0
2.5
2.3
2.9
3.3
3.3
3.6
3.7
3.8
4.5
4.9
4.4
4.8
4.3
4.4
5.4
5.4
16.1
4.8
3.5
4.7
4.2
3.7
2.9
3.5
3.6
1.50.4
0.7
4.5 3.4
4.2
5.3
4.4
4.9
2.0
2.8
2.2
2.8
3.3
3.85.7
5.8
4.8
3.7
2.4
2.7
4.2
5.0
24.3
23.3
3.7
2.1
3.8
4.0
2.8
4.0
3.7
3.9
3.7
24.6
1.5 2.5
1.3
1.4
1.1
13.7
22.5
25.6
9.2
6.0
6.0
1.9
3.8
2.3
1.9
3.9
3.8
8.012.8
21.9
12.7
2.6
4.5
5.3
2.8
6.5
1.99.9
22.9
16.7
25.9
3.3
1.1
2.4
4.2
6.2
4.6
6.6
3.3
3.6
4.7
10.28.15.4
1.5 5.0
4.5
4.7
4.5
3.44.4
3.6
4.4
4.6
3.3
3.1
2.6
2.8
4.9
3.2
3.7
2.8
4.3
1.9
2.2
KYUN GYAKYUN GYA
Creek Point
Rattery Point
Than lyin Point
Bago Point
Monkey Point
Thi la wa Jetty
Ferry
Ferry
Ferry
Ferry
Ferry
10
5
5
5
10
10
10
5
5
52020
10
20
20
5
10
5
5
5
5
55
5
25
25
15
15
5
5
5
5
55
10
5
5
5
5
5
5
10 10
10
10
10
5
5
5
5
5
5
10
Yangon-Thanlyin Bridge
Kha ma kha ni
Da not
Tha kut pin
Nyaung gyaung
Ya kaing gyaung
Ton tin kan taung
Kha naung
Kha naung shan su
Ta da chaung
Nuaung ngok to
Ye gyaung gyiYe gyaung wa
Pyaw bwe gyi
Shwe hle gyaung
Nyaung bin
Myat san ni
Pha yon chaung Kyon da ye
Bo gyoke
Baw tha bye gan
Ka dat pya
Ka la we
Nga bye ma
Tha nat pin
Ba yet Sit pin kwin
Nyaung thon bin
Nyaung le bin
Tha bye gan
Tha htay gwin
Pa ya gonKyaung gon seik gyi
Let yet san
Ayun zok
Nyaung waing
Pa da gyi
Shwe pyi tha ya
Se lon gyi
Baw ka lut
Chaung wa
Ye gyaw
Pan daw
Aye mya thi da
Pyin ma gon
Kwin waing
Kon dan
That kai kwin
Shan gan
Sat chaung
Gat ywa
Leik kon
Ano gyaung ga le
Shwe ga byan
Ano gyaung gyiNga phaw
Da ni daw
Gwa Seik gyi
Chaung oo
Set su
Kha naung chaung wa
Min su
Hle seik
Ale ywa
Ma ke
Ya khaing chaung wa
Chaung wa
Let pan
Kywe gu zeik
Nga pa
Pyi taw tha
Htaw thun
Kan tha myint
Pa don gyaung
The byu gyaung
Nat sin gon
Kan nyin bin gyaung
Kyauk ye dwin
Kun gyan gonKyaik ain
Pyin daung gyaung
Ale ywa
Kyaung kan
Shan zu
Shwe byauk
A dut taw
Kya gan deikKyaik ka maw
Pa da wa
Kyauk ma ye
A ngu
Tha nat pin gyin
Ka me
Min ya za
Htan pin zeik
Hta ma lon
Myaing tha ya
Thi da myaing
ThanlyinThanlyin
Thanlyin
Kyauktan
YANGON CITY
ThilawaSEZ
ThilawaPort
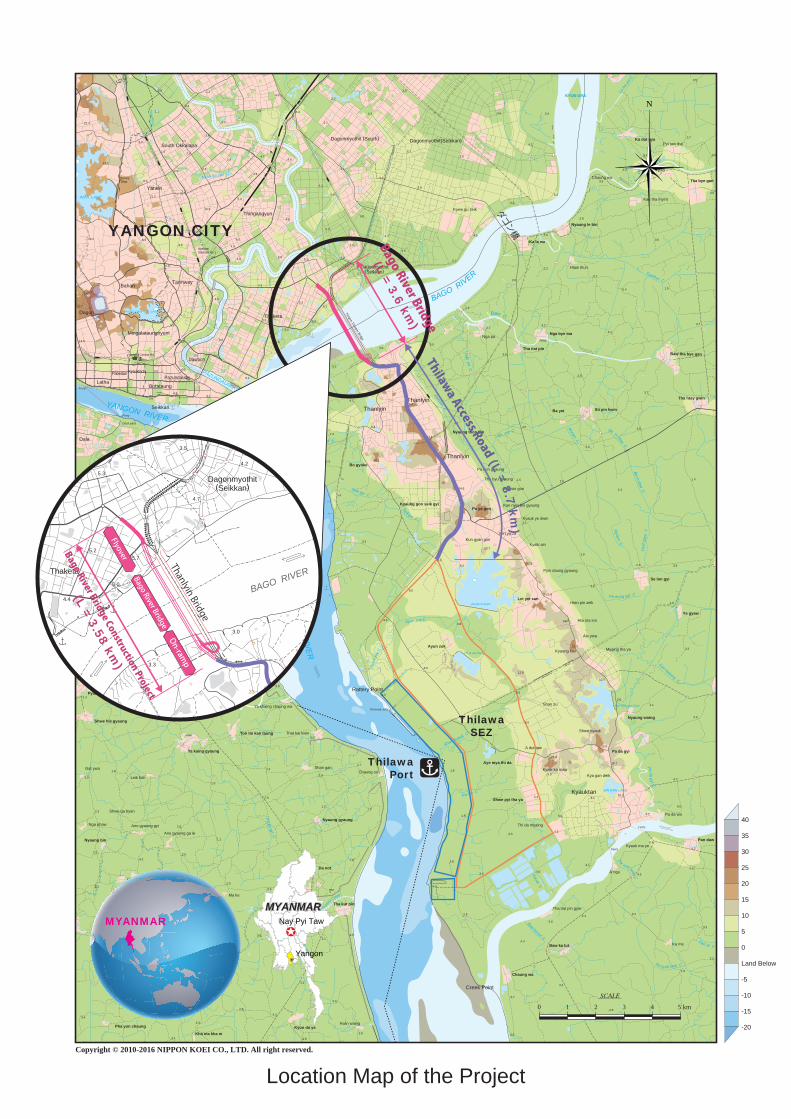
Bago River Bridge
(L = 3.6 km)
Thilawa Access Road (L = 8.7 km)
Nay Pyi Taw
Yangon
MYANMARMYANMAR
40
35
30
25
20
15
10
5
0
Land Below
-5
-10
-15
-20
0 1 5 km2 3 4
SCALE
N
Copyright © 2010-2016 NIPPON KOEI CO., LTD. All right reserved.
Location Map of the Project
3.2
Dagonmyothit(Seikkan)
3.5
4.2
4.7
5.3
5.7
5.0
5.2
3.0
3.3
4.4
5
5
20
5
5
Thanlyin BridgeThaketa
BAGO RIVER
Bago River Bridge Construction Project
(L = 3.58 km)
Flyover
On-ramp
Bago River Bridge

Perspective of the Project (Bago River Bridge)
Perspective of the Project (Bago River Bridge)

Perspective of Cable-stayed Bridge
Perspective of Cable-stayed Bridge

Perspective of On-ramp (Thanlyin Side)
Perspective of Steel Box Girder Bridge
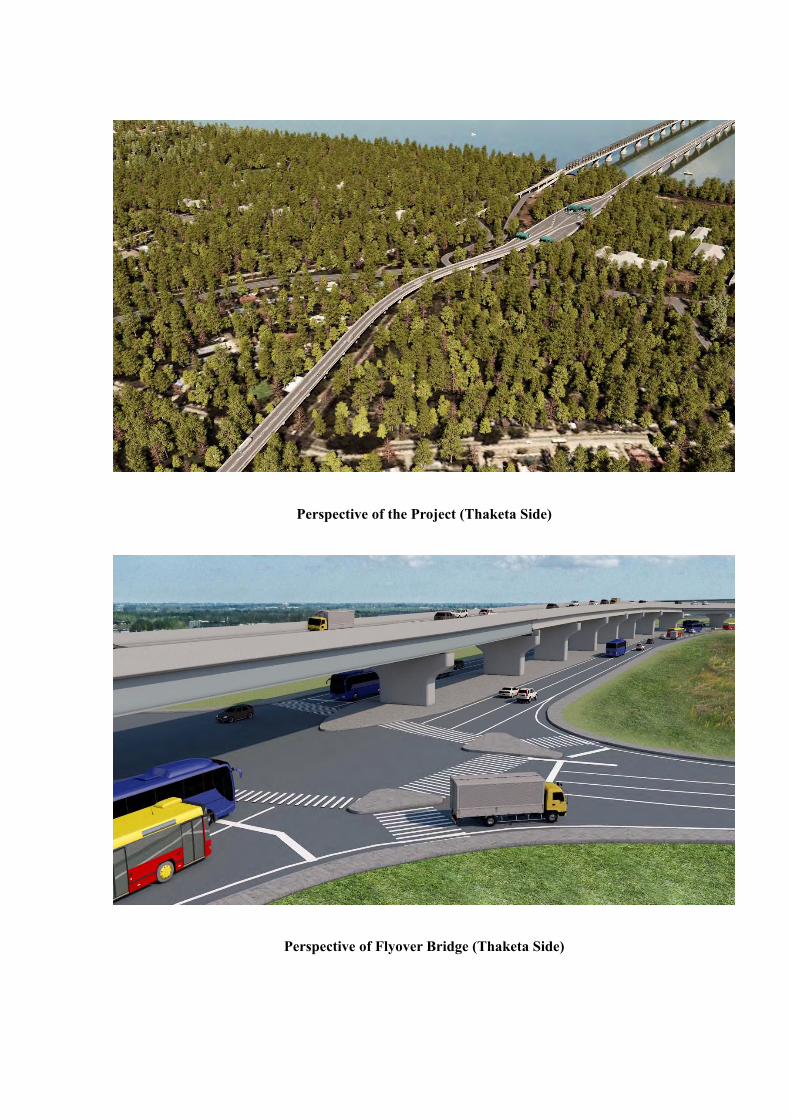
Perspective of the Project (Thaketa Side)
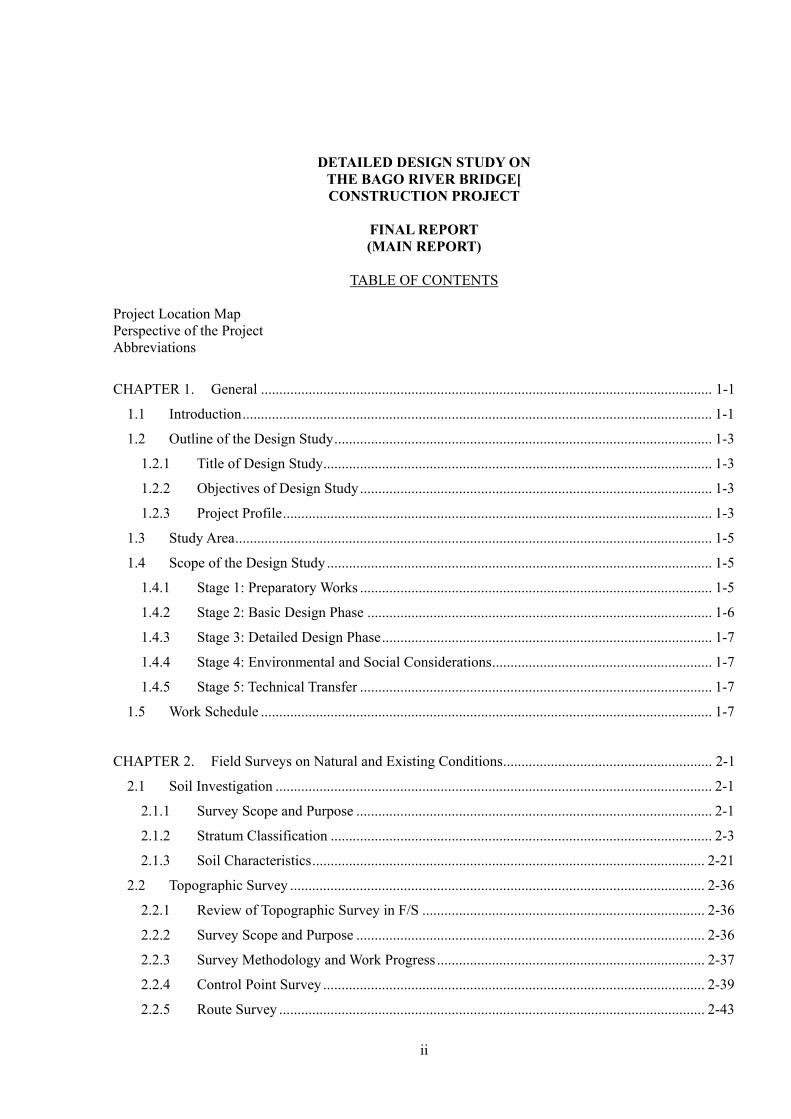
Perspective of Flyover Bridge (Thaketa Side)

i
The Final Report of the “Detailed Design Study on The Bago River Bridge Construction Project ”, consists the following reports and documents. FINAL REPORT FINAL REPORT ATTACHMENTS
VOLUME I DRAWINGS Part I Package 1 Part II Package 2 Part III Package 3 Part IV MOC Portion
VOLUME II DESIGN REPORT
Part I Road Design Part II Steel Cable Stayed Bridge Part III Steel Box Girder Bridge Part IV PC Box Girder Bridge & On-ramp Bridge Part V Flyover Bridge Part VI Toll Collection Facility
VOLUME III QUANTITY CALCULATION REPORT
Part I Road Design Part II Steel Cable Stayed Bridge Part III Steel Box Girder Bridge Part IV PC Box Girder Bridge & On-ramp Bridge Part V Flyover Bridge Part VI Toll Collection Facility
VOLUME IV COST ESTIMATE REPORT
VOLUME V DRAFT TENDER DOCUMENT
PACKAGE 1 PACKAGE 2 PACKAGE 3
VOLUME VI WIND TUNNEL REPORT
ii
DETAILED DESIGN STUDY ON THE BAGO RIVER BRIDGE[ CONSTRUCTION PROJECT
FINAL REPORT (MAIN REPORT)
TABLE OF CONTENTS
Project Location Map Perspective of the Project Abbreviations
CHAPTER 1. General ........................................................................................................................... 1-1
1.1 Introduction ................................................................................................................................ 1-1
1.2 Outline of the Design Study ....................................................................................................... 1-3
1.2.1 Title of Design Study .......................................................................................................... 1-3
1.2.2 Objectives of Design Study ................................................................................................ 1-3
1.2.3 Project Profile ..................................................................................................................... 1-3
1.3 Study Area .................................................................................................................................. 1-5
1.4 Scope of the Design Study ......................................................................................................... 1-5
1.4.1 Stage 1: Preparatory Works ................................................................................................ 1-5
1.4.2 Stage 2: Basic Design Phase .............................................................................................. 1-6
1.4.3 Stage 3: Detailed Design Phase .......................................................................................... 1-7
1.4.4 Stage 4: Environmental and Social Considerations ............................................................ 1-7
1.4.5 Stage 5: Technical Transfer ................................................................................................ 1-7
1.5 Work Schedule ........................................................................................................................... 1-7
CHAPTER 2. Field Surveys on Natural and Existing Conditions ......................................................... 2-1
2.1 Soil Investigation ....................................................................................................................... 2-1
2.1.1 Survey Scope and Purpose ................................................................................................. 2-1
2.1.2 Stratum Classification ........................................................................................................ 2-3
2.1.3 Soil Characteristics ........................................................................................................... 2-21
2.2 Topographic Survey ................................................................................................................. 2-36
2.2.1 Review of Topographic Survey in F/S ............................................................................. 2-36
2.2.2 Survey Scope and Purpose ............................................................................................... 2-36
2.2.3 Survey Methodology and Work Progress ......................................................................... 2-37
2.2.4 Control Point Survey ........................................................................................................ 2-39
2.2.5 Route Survey .................................................................................................................... 2-43
iii
2.2.6 Advanced GPS Survey for Basic Design .......................................................................... 2-43
2.2.7 Level of Girder Soffit of Existing Thanlyin Bridge .......................................................... 2-44
2.2.8 Topographic Survey .......................................................................................................... 2-45
2.2.9 Bathymetric Survey .......................................................................................................... 2-46
2.3 Material Survey ........................................................................................................................ 2-47
2.3.1 Survey Scope and Purpose ................................................................................................ 2-47
2.3.2 Material Source’s List ....................................................................................................... 2-48
2.3.3 Survey Results .................................................................................................................. 2-49
2.3.4 Conclusion ...................................................................................................................... 2-101
2.4 River and Hydrological Survey .............................................................................................. 2-102
2.4.1 Review of Hydrological Survey from F/S ...................................................................... 2-102
2.4.2 Outline of Hydrological Survey at D/D stage ................................................................. 2-102
2.4.3 Hydrological Data Collection Survey ............................................................................. 2-103
2.4.4 River Section and Bathymetric Survey ........................................................................... 2-104
2.4.5 Meteorological Condition ............................................................................................... 2-105
2.4.6 Hydrological Conditions for Road and Bridge Design ................................................... 2-110
2.5 Public Utilities Survey ............................................................................................................ 2-138
2.5.1 Survey Scope and Purpose .............................................................................................. 2-138
2.5.2 Survey Result .................................................................................................................. 2-139
2.5.3 Existing Utilities Layout ................................................................................................. 2-143
2.5.4 Procedure of Public Utilities Relocation......................................................................... 2-144
2.5.5 Conceptual Plan for Utility Relocation ........................................................................... 2-145
2.5.6 Preparation of Utility Relocation Plan ............................................................................ 2-148
CHAPTER 3. Road Design .................................................................................................................... 3-1 3.1 Geometric Design ....................................................................................................................... 3-1
3.1.1 Design Standard .................................................................................................................. 3-1 3.1.2 Typical Cross Section ......................................................................................................... 3-3 3.1.3 Road Alignment of Main Route .......................................................................................... 3-6 3.1.4 Road Alignment of On-ramp .............................................................................................. 3-7 3.1.5 Road Alignment of Local Approach ................................................................................... 3-7
3.2 Pavement Design ........................................................................................................................ 3-9 3.2.1 Design Condition ................................................................................................................ 3-9 3.2.2 Design of Embankment Section ....................................................................................... 3-10 3.2.3 Bridge Section .................................................................................................................. 3-18 3.2.4 Effect of Overloaded Vehicles .......................................................................................... 3-20
iv
3.3 Soft Soil Treatment .................................................................................................................. 3-22 3.3.1 Design Standard ............................................................................................................... 3-22 3.3.2 Engineering Analysis ........................................................................................................ 3-48 3.3.3 Comparison of Countermeasures ..................................................................................... 3-73 3.3.4 Selection of Countermeasures .......................................................................................... 3-78 3.3.5 Ground Analysis after Countermeasure ............................................................................ 3-79 3.3.6 Embankment Construction Plan ....................................................................................... 3-88
3.4 Road Structure Design ............................................................................................................. 3-95 3.4.1 Location of Road Structures ............................................................................................. 3-95 3.4.2 Design Conditions ............................................................................................................ 3-96 3.4.3 Design of Mechanically-Stabilized Earth Wall ................................................................ 3-97
3.5 Flyover and Widening of Thanlyin Chin Kat Road ............................................................... 3-106 3.5.1 Design Conditions .......................................................................................................... 3-106 3.5.2 Alignment of the Flyover ............................................................................................... 3-112 3.5.3 Intersection Design ......................................................................................................... 3-115 3.5.4 Earthwork ....................................................................................................................... 3-121 3.5.5 Embankment Design behind Abutment .......................................................................... 3-122 3.5.6 Detailed Design of Retaining Wall ................................................................................. 3-132 3.5.7 Road Surface Drainage ................................................................................................... 3-142 3.5.8 Design of Ancillary Works ............................................................................................. 3-143 3.5.9 Demarcation between Yen Loan and Myanmar for Package 3 ....................................... 3-144
3.6 Star City Intersection ............................................................................................................. 3-149 3.6.1 Background of intersection plan and Additional F / S plan, Thilawa Access road plan . 3-149 3.6.2 Proposed Solution on Newly-built Intersection ............................................................. 3-152 3.6.3 Design Conditions .......................................................................................................... 3-156 3.6.4 Alignment of the Intersection ......................................................................................... 3-164 3.6.5 Storage length of Intersection ......................................................................................... 3-172 3.6.6 Intersection Design ......................................................................................................... 3-173
3.7 Traffic Signs and Road Markings .......................................................................................... 3-179 3.7.1 Design Conditions .......................................................................................................... 3-179 3.7.2 Traffic Signs ................................................................................................................... 3-179 3.7.3 Road Marking ................................................................................................................. 3-180
3.8 Drainage Design ..................................................................................................................... 3-182 3.8.1 General ........................................................................................................................... 3-182 3.8.2 Flow of Hydrological Analysis and Drainage Design .................................................... 3-182 3.8.3 Return Period and Rainfall Intensity .............................................................................. 3-183
v
3.8.4 Drainage System and Outlets .......................................................................................... 3-184 3.8.5 Catchment Area and Runoff (Discharge) Estimation ...................................................... 3-185 3.8.6 Type of Drainage Structures and Drainage Capacity Design ......................................... 3-194 3.8.7 New Drainage Outlets ..................................................................................................... 3-199
CHAPTER 4. Bridge Design ................................................................................................................. 4-1
4.1 Design Conditions ...................................................................................................................... 4-1
4.1.1 Design Standard .................................................................................................................. 4-1
4.1.2 Materials to be Used ........................................................................................................... 4-8
4.1.3 Conditions of Design Load and Load Combination ........................................................... 4-9
4.1.4 Concept of Comparative Study for Structure Optimization ................................................ 4-9
4.1.5 Span Arrangement in River Bridge Section ........................................................................ 4-9
4.1.6 Design Conditions for the Bridge Design ......................................................................... 4-10
4.2 Study on Cable-Stayed Bridge ................................................................................................. 4-84
[Basic Design Stage] ........................................................................................................................ 4-84
4.2.1 Selection of Type of Cable-stayed Bridge ........................................................................ 4-84
4.2.2 Superstructure of Cable-stayed Bridge ............................................................................. 4-86
4.2.3 Substructure of Cable-stayed Bridge .............................................................................. 4-110
4.2.4 Foundation of Cable-stayed Bridge ................................................................................ 4-116
4.2.5 Bridge Accessories .......................................................................................................... 4-124
4.2.6 Basic Design Results ...................................................................................................... 4-127
[Detailed Design Stage] ................................................................................................................. 4-132
4.2.7 Summary of Detailed Design .......................................................................................... 4-132
4.2.8 Alignment Calculation .................................................................................................... 4-138
4.2.9 Summary of Superstructure Design ................................................................................ 4-139
4.2.10 Summary of Substructure Design ................................................................................... 4-223
4.2.11 Summary of Bridge Accessories Design......................................................................... 4-307
4.2.12 Summary of Seismic Analysis ........................................................................................ 4-363
4.2.13 Superstructure Construction Stage Analysis ................................................................... 4-388
4.2.14 Revised Design of Side Pier (P10, P13) [Change from PC Box Girder to Steel Box Girder] 4-406
4.2.15 Summary of Wind Tunnel Test ....................................................................................... 4-420
4.2.16 Summary of Quantities ................................................................................................... 4-438
4.3 Study on Steel Box Girder Bridge .......................................................................................... 4-446
4.3.1 Basic Design for Superstructure of Steel Box Girder Bridge ......................................... 4-446
4.3.2 Basic Design for Substructure of Steel Box Girder Bridge ............................................ 4-460

vi
4.3.3 Detailed Design for Superstructure of the Steel Box Girder Bridge (7-Span Bridge) ... 4-471
4.3.4 Detailed Design for Superstructure of the Steel Box Girder Bridge (3-Span Bridge) ... 4-497
4.3.5 Detailed Design for Substructure of Steel Box Girder Bridge (7-Span Bridge) ............ 4-520
4.3.6 Detailed Design for Substructure of Steel Box Girder Bridge (3-Span Bridge) ............ 4-547
4.3.7 Detailed Design of Bridge Accessories .......................................................................... 4-570
4.4 Study on PC Box Girder Bridge ............................................................................................. 4-561
4.4.1 General ........................................................................................................................... 4-561
4.4.2 Study on Bridge Length of PC Box Girder Bridge ........................................................ 4-561
4.4.3 Study on Span Length .................................................................................................... 4-567
4.4.4 Study on Superstructure of PC Box Girder Bridge ........................................................ 4-571
4.4.5 Summary of the Detailed Design Result for Superstructure .......................................... 4-583
4.4.6 Substructure of PC Box Girder Bridge ........................................................................... 4-586
4.4.7 Foundation of PC Box Girder Bridge ............................................................................. 4-598
4.4.8 Summary of Detailed Design Results for Substructure and Foundation ........................ 4-614
4.4.9 Bridge Accessories ......................................................................................................... 4-641
4.5 Study on On-ramp Bridge ...................................................................................................... 4-645
4.5.1 Study on Bridge Length of On-ramp Bridge .................................................................. 4-645
4.5.2 Study on Superstructure of On-ramp Bridge .................................................................. 4-648
4.5.3 Substructure of On-ramp Bridge .................................................................................... 4-655
4.5.4 Foundation of On-ramp Bridge ...................................................................................... 4-661
4.5.5 Summary of Detailed Design Results for Substructure and Foundations ...................... 4-672
4.5.6 Bridge Accessories ......................................................................................................... 4-680
4.6 Study on Flyover Bridge ........................................................................................................ 4-682
4.6.1 Study on Flyover Bridge ................................................................................................ 4-682
4.6.2 Basic Design Results ...................................................................................................... 4-695
4.6.3 Major Updates in the Detailed Design from the Basic Design ....................................... 4-702
4.6.4 Detailed Design Results ................................................................................................. 4-708
CHAPTER 5. Toll Collection Facility ................................................................................................... 5-1
5.1 Scope of Works .......................................................................................................................... 5-1
5.2 Design Condition ....................................................................................................................... 5-1
5.2.1 Design Standard ................................................................................................................. 5-1
5.2.2 Traffic Condition ................................................................................................................ 5-2
5.3 Tollgate Works ........................................................................................................................... 5-2
5.3.1 Plan of Tollgate Facility ..................................................................................................... 5-2
5.3.2 Materials to Be Used ........................................................................................................ 5-10
vii
5.4 Administrative Office Works .................................................................................................... 5-11
5.4.1 Plan of Administrative Office Facility .............................................................................. 5-11
5.4.2 Equipment and Materials .................................................................................................. 5-14
5.5 Safety Measure ......................................................................................................................... 5-14
5.6 Future Upgrade Plan ................................................................................................................. 5-14
5.6.1 Electronic Toll Collection System (ETC) ......................................................................... 5-14
5.6.2 Layout Consideration ........................................................................................................ 5-20
5.6.3 Items for Consideration .................................................................................................... 5-28
CHAPTER 6. Electric Wiring and Lighting Facility ............................................................................. 6-1
6.1 General ....................................................................................................................................... 6-1
6.2 Scope of Work ............................................................................................................................ 6-1
6.3 Design Condition ........................................................................................................................ 6-1
6.3.1 Design Standards ................................................................................................................ 6-1
6.3.2 Design Condition ................................................................................................................ 6-2
6.4 Road Lighting ............................................................................................................................. 6-4
6.4.1 Introduction ......................................................................................................................... 6-4
6.4.2 Selection of Equipment and Material ................................................................................. 6-4
6.4.3 Calculation of Average Road Surface Luminance .............................................................. 6-9
6.4.5 Light Distribution Curve in Lux ....................................................................................... 6-10
6.4.6 Intersection Lighting ......................................................................................................... 6-11
6.4.7 Tollgates Lighting ............................................................................................................. 6-13
6.4.8 Traffic Signal Systems ...................................................................................................... 6-15
6.5 Obstruction lights ..................................................................................................................... 6-23
6.5.1 Aviation Obstruction Lights .............................................................................................. 6-23
6.5.2 Navigation Lateral Marks and Obstruction Lights ........................................................... 6-24
6.6 Bridge Nightscape Lighting ..................................................................................................... 6-26
6.6.1 Purpose of Nightscape Lighting ....................................................................................... 6-26
6.6.2 Effect of Nightscape Illuminance ..................................................................................... 6-26
6.6.3 Elements of Nightscape Illumination ............................................................................... 6-27
6.6.4 Equipment to be Installed ................................................................................................. 6-29
6.7 Lighting Protection System (LPS) ............................................................................................ 6-29
6.8 Wiring Planning ........................................................................................................................ 6-30
6.9 Factory Inspection, Site Tests and Maintenance Requirements ............................................... 6-36
CHAPTER 7. Construction Planning ..................................................................................................... 7-1
viii
7.1 Construction Planning of the River Bridge Section ................................................................... 7-1
7.1.1 Project Outline .................................................................................................................... 7-1
7.1.2 Temporary Facilities ........................................................................................................... 7-7
7.1.3 Road Works ...................................................................................................................... 7-16
7.1.4 Cable-stayed Bridge ......................................................................................................... 7-19
7.1.5 Steel Box Girder Bridge ................................................................................................... 7-29
7.1.6 PC Box Girder Bridge ...................................................................................................... 7-34
7.1.7 On-ramp Bridge ................................................................................................................ 7-42
7.2 Construction Planning of Flyover Bridge ................................................................................ 7-43
7.2.1 Project Outline .................................................................................................................. 7-43
7.2.2 Civil Works Scope ............................................................................................................ 7-45
7.2.3 Main Material Procurement Plan ..................................................................................... 7-45
7.2.4 Temporary Installations .................................................................................................... 7-46
7.2.5 Construction Site .............................................................................................................. 7-47
7.2.6 Outline of Construction Sequence .................................................................................... 7-48
7.2.7 Road Works ...................................................................................................................... 7-52
7.2.8 Bridge Works .................................................................................................................... 7-54
7.2.9 Traffic Diversion Plan ...................................................................................................... 7-65
7.2.10 Construction Schedule ...................................................................................................... 7-66
7.3 Tax and Customs Clearance ..................................................................................................... 7-68
7.3.1 Taxation (Non-eligible Portion) ....................................................................................... 7-68
7.3.2 Customs Clearance ........................................................................................................... 7-68
CHAPTER 8. Study on Safety Measures During Construction ............................................................ 8-1
8.1 Significance of Safety Measures and Purposes For Safety Plan ................................................ 8-1
8.1.1 Significance of Safety Measures ........................................................................................ 8-1
8.1.2 Purposes of Safety Plan ...................................................................................................... 8-1
8.2 Government Agencies for Construction Safety .......................................................................... 8-1
8.3 Construction Safety Laws and Standards in Myanmar .............................................................. 8-3
8.4 Procedures of permission and approval for safety ..................................................................... 8-4
8.5 Composition of Safety Plan ....................................................................................................... 8-5
8.6 General Safety Plan .................................................................................................................... 8-5
8.6.1 Preliminary Site Investigation (Environment Safety Conditions on Site) .......................... 8-5
8.6.2 Basis Policies for Safety Management ............................................................................... 8-6
8.7 General Rules of Risk Assessment (Proposal) ........................................................................... 8-7
8.7.1 Purpose of Risk Assessment ............................................................................................... 8-7

ix
8.7.2 Implementation for Risk Assessment.................................................................................. 8-7
8.7.3 Execution System and Persons in Charge ........................................................................... 8-7
8.7.4 Practice of Risk Mitigation Measures (Plan) ...................................................................... 8-8
8.8 Traffic Control Plan .................................................................................................................... 8-9
8.9 Safety Plan for Works Over the River ........................................................................................ 8-9
8.9.1 Composition of Safety Plan for Works over the River ..................................................... 8-10
8.9.2 Establish Temporary Fairway ........................................................................................... 8-10
8.9.3 Cautious System and Arrangement of Guard Ships (Navigation Control Station) ........... 8-11
8.10 Measures For Prevention of Public Accidents .......................................................................... 8-12
8.11 Method Statement on Safety Plan ............................................................................................ 8-12
8.12 Key Points of Construction Safety Plan (Required Attention Matters) .................................... 8-13
8.12.1 Construction of Bago River Bridge .................................................................................. 8-13
8.12.2 Construction of Thaketa Flyover ...................................................................................... 8-14
8.12.3 Approach Road and Tollgates ........................................................................................... 8-14
CHAPTER 9. Environmental and Social Considerations ...................................................................... 9-1
9.1 Objectives of the Tasks on Environmental and Social Considerations ...................................... 9-1
9.2 Environmental Considerations ................................................................................................... 9-1
9.2.1 Review IEE Report and Approval by MONREC ............................................................... 9-1
9.2.2 Environmental Survey ........................................................................................................ 9-2
9.2.3 Update of IEE Report to EIA Report ................................................................................ 9-10
9.3 Social Considerations ............................................................................................................... 9-28
9.3.1 Review of A-RAP ............................................................................................................. 9-28
9.3.2 Regulations related to Relocation and Gap Analysis ........................................................ 9-28
9.3.3 Procedure of Updating A-RAP and Relocation ................................................................ 9-29
9.3.4 Updating A-RAP ............................................................................................................... 9-30
CHAPTER 10. HIV/AIDS Prevention program .................................................................................... 10-1
10.1 Introduction .............................................................................................................................. 10-1
10.2 Situation in myanmar ............................................................................................................... 10-1
10.2.1 Laws Related to HIV/AIDS Epidemic Diseases in Myanmar .......................................... 10-1
10.2.2 Approach in Myanmar ...................................................................................................... 10-1
10.2.3 Responsible Agencies ....................................................................................................... 10-2
10.2.4 Donor Policy ..................................................................................................................... 10-2
10.2.5 Issues of HIV/AIDS Prevention Program at the Construction Sector in Myanmar .......... 10-3
10.3 Situation in the project site ....................................................................................................... 10-3

x
10.3.1 HIV/AIDS Situation in Thanlyin Township ..................................................................... 10-3
10.3.2 HIV/AIDS Situation in Thaketa Township ....................................................................... 10-4
10.4 Scope and Implementation Strategy ........................................................................................ 10-4
10.4.1 Objective .......................................................................................................................... 10-4
10.4.2 Components of HIV/AIDS Prevention Program of the Project ....................................... 10-4
10.4.3 Implementation Structure ................................................................................................. 10-5
10.4.4 Implementation Schedule ................................................................................................. 10-7
10.5 Cost Estimation ........................................................................................................................ 10-8
CHAPTER 11. Operation and Maintenance ........................................................................................... 11-1
11.1 Introduction .............................................................................................................................. 11-1
11.2 Toll Collection Plan ................................................................................................................. 11-1
11.2.1 Toll Type ........................................................................................................................... 11-1
11.2.2 Toll Collection Method .................................................................................................... 11-1
11.2.3 Extent of Toll Charging .................................................................................................... 11-1
11.2.4 Tollgate Allocation ........................................................................................................... 11-1
11.2.5 Organization for Toll Collection ....................................................................................... 11-2
11.3 Traffic Management Plan ......................................................................................................... 11-2
11.4 Maintenance Plan ..................................................................................................................... 11-3
11.4.1 Basic Concept ................................................................................................................... 11-3
11.4.2 Considerations in Maintenance Works ............................................................................. 11-4
11.4.3 Inspections ........................................................................................................................ 11-5
11.4.4 Simplified Monitoring ..................................................................................................... 11-11
11.4.5 Measurement with Laser Profiler ................................................................................... 11-16
11.4.6 Repair and Reinforcement Works ................................................................................... 11-16
11.4.7 Personnel Organization for Implementation ................................................................... 11-17
11.5 Proposed O&M Structure....................................................................................................... 11-18
CHAPTER 12. Cost Estimate and Procurement .................................................................................... 12-1
12.1 Policy of Cost Estimate ............................................................................................................ 12-1
12.1.1 Guidelines ......................................................................................................................... 12-1
12.1.2 Cost Estimate Base Time .................................................................................................. 12-1
12.1.3 Currency Exchange Rate .................................................................................................. 12-1
12.1.4 Direct Construction Cost Factor ....................................................................................... 12-1
12.1.5 Construction Schedule Conditions ................................................................................... 12-2
12.1.6 Indirect Construction Cost Factor .................................................................................... 12-2
xi
12.1.7 Price Escalation ................................................................................................................ 12-3
12.1.8 Physical Contingency ....................................................................................................... 12-4
12.1.9 Consultant Service ............................................................................................................ 12-4
12.1.10 Dispute Board Cost (Eligible and Non-Eligible Portion) ............................................. 12-4
12.1.11 Tax (Non-eligible Portion) ............................................................................................ 12-4
12.1.12 Interest During Construction (Non-eligible Portion) .................................................... 12-4
12.2 Update of Project Cost ............................................................................................................. 12-5
12.3 Annual Fund Requirement ....................................................................................................... 12-6
12.4 Update of Construction Cost .................................................................................................... 12-7
12.4.1 River Bridge Section (Packages 1 and 2) ......................................................................... 12-7
12.4.2 Flyover Section (Package 3) ........................................................................................... 12-11
12.5 Procurement Plan ................................................................................................................... 12-12
CHAPTER 13. Construction Technology Transfer ................................................................................ 13-1
13.1 Construction of River Bridges in Myanmar ............................................................................. 13-1
13.1.1 Construction Records of River Bridges ............................................................................ 13-1
13.1.2 Organization of MOC’s Construction Units ..................................................................... 13-3
13.2 Proposal on Construction Technology Transfer ....................................................................... 13-4
13.2.1 Participation of MOC Construction Unit .......................................................................... 13-4
13.2.2 Issues on Participation of MOC in Construction .............................................................. 13-6
CHAPTER 14. Project Implementation Plan ......................................................................................... 14-1
14.1 Loan Agreement ....................................................................................................................... 14-1
14.2 Implementation Structure ......................................................................................................... 14-1
14.2.1 Implementation Agency .................................................................................................... 14-1
14.2.2 Project Management Unit ................................................................................................. 14-3
14.2.3 Demarcation among JICA, MOC, and YCDC .................................................................. 14-4
14.3 Implementation Program .......................................................................................................... 14-6
CHAPTER 15. Project Promotion ......................................................................................................... 15-1
15.1 General ..................................................................................................................................... 15-1
15.2 Promotion Video ....................................................................................................................... 15-1
15.3 CG Perspectives ....................................................................................................................... 15-1
15.4 Promotion Plan ......................................................................................................................... 15-2
15.4.1 Promotion Plan in Myanmar ............................................................................................. 15-2
15.4.2 Promotion Plan in Japan ................................................................................................... 15-2

xii
FINAL REPORT (APPENDIX)
LIST OF APPENDIX
Topographic Survey Appendix-1 Description of Existing Control Point Appendix-2 Primary Control Point Result Appendix-3 GPS Loop Closure Appendix-4 GPS Net Adjustment Result Appendix-5 Secondary Control Point Result Appendix-6 Leveling Route Map Appendix-7 Leveling Quality Control Appendix-8 Leveling Observation Data Appendix-9 Map Symbol and its application manner Appendix-10 Certificate Survey Instruments River and Hydrological Survey Appendix-11 Hydrological Data Collection Result Appendix-12 Drawings of River Section Public Utility Survey Appendix-13 Underground Utility Survey Result Environmental and Social Considerations Appendix-14 Laboratory Analysis Results Appendix-15 List of Flora and Fauna in the Project Area Appendix-16 Provisional Environmental and Social Monitoring Forms Appendix-17 Gap Analysis on Environmental Regulations and Check List for Environmental and Social Considerations Appendix-18 Addition Consultation Meeting Minutes and Materials Project Promotion Appendix-19 Detailed Storyboard in English

Detailed Design Study on The Bago River Bridge Construction Project Final Report
1
Abbreviations
AASHTO American Association of State Highway and Transportation Officials
ADB Asian Development Bank
AfDB African Development Bank
AIDS Acquired Immune Deficiency Syndrome
ARP Airport Reference Point
A-RAP Abbreviated Resettlement Action Plan
ART Antiretroviral Therapy
ASEAN Association of Southeast Asian Nations
B/D Basic Design
BD/R Basic Design Report
BRT Bus Rapid Transit
CBD Central Business District
CNG Compressed Natural Gus
COD Cut-off Date
CPLAD City Planning and Land Administration Department
CS Construction Supervision
CT Contractor
D/D Detailed Design
DF/R Draft Final Report
DFID UP Department for International Development
DHSHD Department of Human Settlement and Housing Development
DMH Department of Meteorology and Hydrology
DMS Detailed Measurement Survey
DO Dissolved Oxygen
DOB Department of Bridge
DOF Degree of Freedom
DOH Department of Highway
DOI Department of Immigration
DOL Department of Labor
DUHD Department of Urban Housing Development
DWIR Directorate of Water Resources and Improvement of River Systems
ECC Environmental Compliance Certificate
ECD Environmental Conservation Department
EHS Environmental, Health, and Safety
EIA Environmental Impact Assessment
EMoP Environmental Monitoring Plan
EMP Environmental Management Plan
E/N Exchange of Notes
EQG National Environmental Quality (Emission) Guidelines

Detailed Design Study on The Bago River Bridge Construction Project Final Report
2
ERL Effect Range Law
ERM Effect Range Median
FD Forest Department
F/R Final Report
F/S Feasibility Study
FS Fire Station (Relevant Office)
GAD General Administration Department
GOM Government of Myanmar
GOJ Government of Japan
GPS Global Positioning System
HIV Human Immunodeficiency Virus
HSE Health and Safety Engineer
IC/R Inception Report
IEE Initial Environmental Examination
IFC International Finance Corporation
I/P Implementation Program
IUCN International Union for Conservation of Nature
IWT Inland Water Transport
JICA Japan International Cooperation Agency
JPY Japanese Yen
JSHB Japanese Specifications for Highway Bridge
L/A Loan Agreement
MFSD Myanmar Fire Services Department
MITT Myanmar International Thilawa Terminal
MMK Myanmar Kyat
MMPS Myanmar Maritime Police Station
MOC Ministry of Construction
MOEE Ministry of Electricity Power and Energy
MONREC Ministry of Natural Resources and Environmental Conservation
MOGE Myanmar Oil and Gas Enterprise
MOHS Ministry of Health and Sports
MOI Ministry of Industry
MOL Ministry of Labor, Immigration and Population
MOTC Ministry of Transport and Communications
MPA Myanma Port Authority
MPPE Myanmar Petroleum Products Enterprise
MPT Myanmar Port and Telecommunication
MR Myanmar Railways
MSD Myanmar Survey Department
MTP Myanmar Traffic Police
NAP National Aid Program

Detailed Design Study on The Bago River Bridge Construction Project Final Report
3
NEXCO Nippon Expressway Company
NGO Non-Governmental Organization
NO2 Nitrogen Dioxide
ODA Official Development Assistance
OP Operational Policy
O&M Operation and Maintenance
PAHs Project Affected Households
PAPs Project Affected Persons
PC Prestressed Concrete
PCD Pollution and Cleansing Department
PC-T Prestressed Concrete T-shaped
PCU Passenger Car Unit
PM2.5 Fine particulate matter 2.5
PM10 Suspended particulate matter 10
PMU Project Management Unit
PPGD Playgrounds, Parks and Gardening Department
PS Police Station (Relevant Office)
ROW Right of Way
RTAD Road Transport Administration Department
Rd Road
R&BD Roads and Bridge Departments in YCDC
SEZ Special Economic Zone
SO2 Sulphur Dioxide
SPSP Steel Pipe Sheet Pile
SPT Standard Penetration Test
SS Suspended Solids
STDs Sexually Transmitted Diseases
SUDP The Strategic Urban Development Plan of the Greater Yangon, JICA (2013)
Supplemental F/S Supplemental Feasibility Study
SV Supervision
TN Total Nitrogen
TOC Total Organic Carbon
TOR Terms of References
TP Total Phosphorus
TRESC Traffic Rules Enforcement Supervisory Committee
TS Total Station
USD US Dollar
V/C Volume to Capacity
WB World Bank
WSSD Water Supply and Sanitation Department
YCDC Yangon City Development Committee
Detailed Design Study on The Bago River Bridge Construction Project Final Report
4
YESC Yangon Electricity Supply Corporation
YRDC Yangon Region Development Committee
YRG Yangon Region Government
YUTRA Project for Comprehensive Urban Transport Plan of the Greater Yangon
Detailed Design Study on The Bago River Bridge Construction Project Final Report
1-1
CHAPTER 1. GENERAL
1.1 INTRODUCTION
The Greater Yangon, which consists of Yangon City and its surrounding townships, has a population of 7.3 million (2014) and is the economic center of the growing Myanmar. Being the center of the economic activities in Myanmar, Yangon City faces excessive centralization accelerated by recent rapid economic growth, generating transport demand larger than ever. The present transport infrastructure is not enough to sustain the rapid development of the economy.
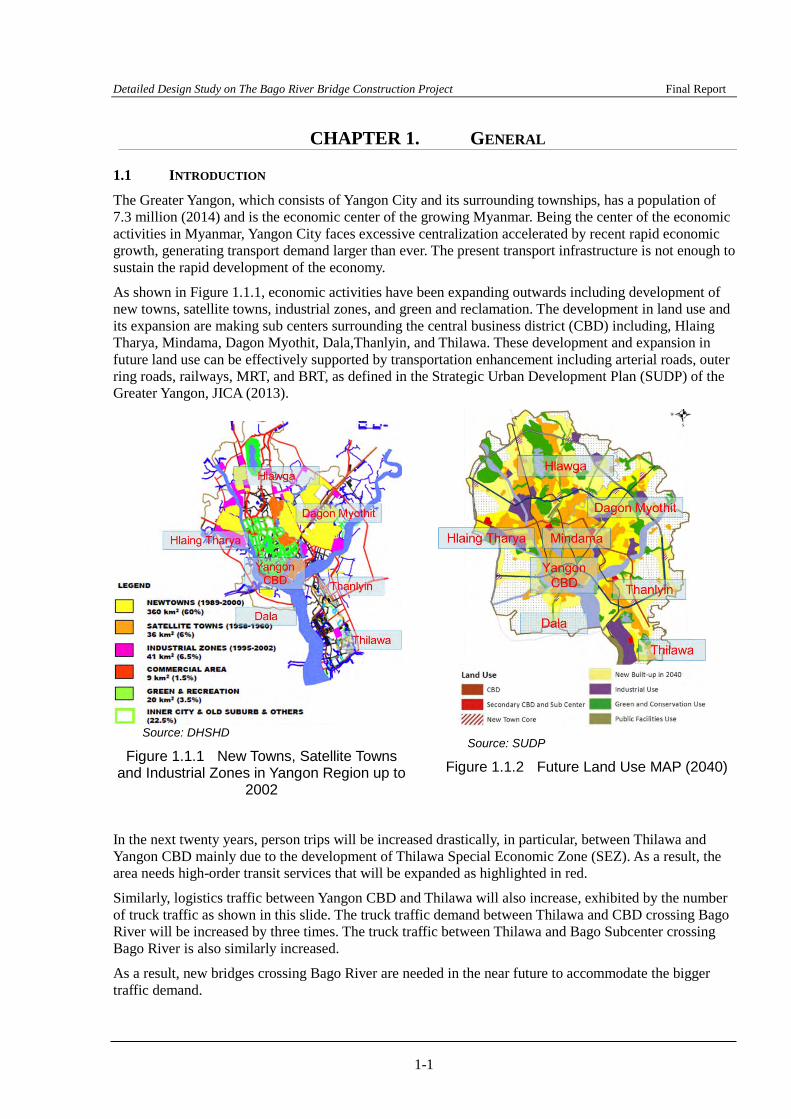
As shown in Figure 1.1.1, economic activities have been expanding outwards including development of new towns, satellite towns, industrial zones, and green and reclamation. The development in land use and its expansion are making sub centers surrounding the central business district (CBD) including, Hlaing Tharya, Mindama, Dagon Myothit, Dala,Thanlyin, and Thilawa. These development and expansion in future land use can be effectively supported by transportation enhancement including arterial roads, outer ring roads, railways, MRT, and BRT, as defined in the Strategic Urban Development Plan (SUDP) of the Greater Yangon, JICA (2013).
Source: DHSHD
Figure 1.1.1 New Towns, Satellite Towns and Industrial Zones in Yangon Region up to
2002
Source: SUDP
Figure 1.1.2 Future Land Use MAP (2040)
In the next twenty years, person trips will be increased drastically, in particular, between Thilawa and Yangon CBD mainly due to the development of Thilawa Special Economic Zone (SEZ). As a result, the area needs high-order transit services that will be expanded as highlighted in red.
Similarly, logistics traffic between Yangon CBD and Thilawa will also increase, exhibited by the number of truck traffic as shown in this slide. The truck traffic demand between Thilawa and CBD crossing Bago River will be increased by three times. The truck traffic between Thilawa and Bago Subcenter crossing Bago River is also similarly increased.
As a result, new bridges crossing Bago River are needed in the near future to accommodate the bigger traffic demand.

Detailed Design Study on The Bago River Bridge Construction Project Final Report
1-2
Source: JICA Study Team
Figure 1.1.3 Photos of Thanlyin Bridge
Currently, there are two existing bridges connecting Yangon CBD and Thilawa crossing Bago River, which are Thanlyin Bridge and Dagon Bridge. Comparing the two bridges on current traffic volume, the traffic volume on the Thanlyin Bridge route is much more because the Dagon Bridge route has a longer distance and narrower access roads. Similarly, majority of traffic between Bago Subcenter and Thilawa passes Thanlyin Bridge and the Thanlyin Bridge route is the access between Thilawa and CBD or Bago Subcenter.
Thanlyin Bridge has two major problems for accommodating such big traffic demand in the near future: the number of lanes and weight limitation. The bridge has only one lane on each direction which is vulnerable to terrible congestion by only a small incident like a tiny trouble of a vehicle. The bridge has weight limitation of 32 tons, which cannot accommodate heavier trucks like large trailers.
Table 1.1.1 shows the estimated traffic volume in 2025 represented by the ratio of traffic volume and capacity of the roads. In ten years, the traffic volume along Thanlyin Bridge will increase up to nearly twice its capacity and it is estimated that travel time on the bridge is 88 minutes and jam length is more than 6 km. With a new bridge with four lanes, the travel time is going to be reduced to six minutes and jam length to 150 m. Consequently, the construction of a new bridge is very effective for accommodating the bigger traffic demand on Thanlyin Bridge.
Table 1.1.1 Estimated Travel Time and Jam Length of based on V/C at Thanliyn Bridge (2025)
Volume / Capacity
Travel Time (min.)
Jam Length* (km)
Without New Bridge 1.8 88 6.37
With New Bridge 1.0 6 0.15
Note(*): (peak volume - capacity)*(vehicle distance) / (number of lanes)
Source: extracted from YUTRA by JICA Study Team
Therefore, the necessity of constructing a new bridge over the Bago River is one of the high priorities in Myanmar’s development agenda. The Strategic Urban Development Plan of the Greater Yangon (SUDP) (2013) and the Comprehensive Urban Transport Plan of the Greater Yangon (YUTRA) (2014) have been published under Japanese assistance. These master plans clearly pointed out the inadequate transport infrastructure between Yangon City and Thanlyin Township. The construction of Bago River Bridge will surely guarantee the expected economic growth in Thanlyin Township, with acceleration of Thilawa SEZ development, and thus contribute to the economic development of the whole of Myanmar. Furthermore,
Detailed Design Study on The Bago River Bridge Construction Project Final Report
1-3
in the SUDP, traffic flows from/to sub-centers are induced by ring roads and thus, congestion in Yangon CBD will be mitigated.
Therefore, the construction of a new bridge, i.e., Bago River Bridge (hereinafter referred to as “the Project”), is urgently required.
As stated in the minutes of the meeting between the Ministry of Construction (hereinafter “MOC”) and the Japan International Cooperation Agency (hereinafter “JICA”), signed on May 15, 2013, a preparatory survey was conducted for the feasibility study on the new construction of Bago River Bridge and approach road to the bridge and the final report was submitted on August 31, 2014, which was accepted by MOC. The preparatory survey was followed by a supplemental survey conducted in February 2016 for studying improvement of the adjacent intersections and connecting roads, and updating the traffic demand forecast, cost estimate, environmental and social considerations, and project evaluation.
Based on the results of the preparatory surveys, the Government of Myanmar secured a loan from JICA for the Project.
1.2 OUTLINE OF THE DESIGN STUDY
1.2.1 Title of Design Study
Detailed Design Study on Bago River Bridge Construction Project
1.2.2 Objectives of Design Study
The objective of the Design Study is to prepare the detailed design and draft tender documents for the Project. The Department of Bridge (DOB) of MOC and JICA confirmed that the drawings and documents formulated by the Design Study (hereinafter referred to as “the Design Documents”) shall be fully utilized for the procurement procedure of the Project.
1.2.3 Project Profile
(1) Name of the Project: Bago River Construction Project
(2) Signing L/A: March 1, 2017 (MY-P16)
(3) Proposed Facilities of the Project
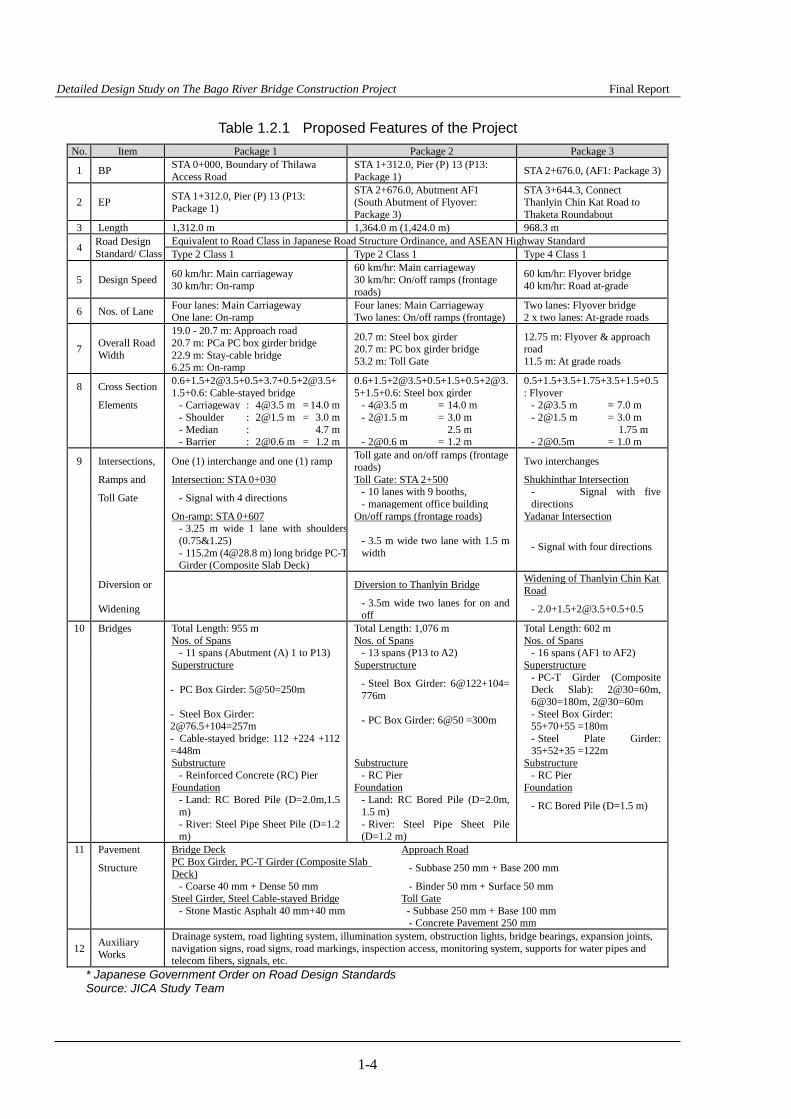
The proposed facilities of the Project are shown in Table 1.2.1
Detailed Design Study on The Bago River Bridge Construction Project Final Report
1-4
Table 1.2.1 Proposed Features of the Project No. Item Package 1 Package 2 Package 3
1 BP STA 0+000, Boundary of Thilawa Access Road
STA 1+312.0, Pier (P) 13 (P13: Package 1) STA 2+676.0, (AF1: Package 3)
2 EP STA 1+312.0, Pier (P) 13 (P13: Package 1)
STA 2+676.0, Abutment AF1 (South Abutment of Flyover: Package 3)
STA 3+644.3, Connect Thanlyin Chin Kat Road to Thaketa Roundabout
3 Length 1,312.0 m 1,364.0 m (1,424.0 m) 968.3 m
4 Road Design Standard/ Class
Equivalent to Road Class in Japanese Road Structure Ordinance, and ASEAN Highway Standard Type 2 Class 1 Type 2 Class 1 Type 4 Class 1
5 Design Speed 60 km/hr: Main carriageway 30 km/hr: On-ramp
60 km/hr: Main carriageway 30 km/hr: On/off ramps (frontage roads)
60 km/hr: Flyover bridge 40 km/hr: Road at-grade
6 Nos. of Lane Four lanes: Main Carriageway One lane: On-ramp
Four lanes: Main Carriageway Two lanes: On/off ramps (frontage)
Two lanes: Flyover bridge 2 x two lanes: At-grade roads
7 Overall Road Width
19.0 - 20.7 m: Approach road 20.7 m: PCa PC box girder bridge 22.9 m: Stay-cable bridge 6.25 m: On-ramp
20.7 m: Steel box girder 20.7 m: PC box girder bridge 53.2 m: Toll Gate
12.75 m: Flyover & approach road 11.5 m: At grade roads
8 Cross Section [email protected][email protected]+1.5+0.6: Cable-stayed bridge
[email protected][email protected]+1.5+0.6: Steel box girder
0.5+1.5+3.5+1.75+3.5+1.5+0.5: Flyover
Elements - Carriageway : [email protected] m = 14.0 m - [email protected] m = 14.0 m - [email protected] m = 7.0 m - Shoulder : [email protected] m = 3.0 m - [email protected] m = 3.0 m - [email protected] m = 3.0 m - Median : 4.7 m 2.5 m 1.75 m - Barrier : [email protected] m = 1.2 m - [email protected] m = 1.2 m - [email protected] = 1.0 m
9 Intersections, One (1) interchange and one (1) ramp Toll gate and on/off ramps (frontage roads) Two interchanges
Ramps and Intersection: STA 0+030 Toll Gate: STA 2+500 Shukhinthar Intersection
Toll Gate - Signal with 4 directions - 10 lanes with 9 booths, - management office building
- Signal with five directions
On-ramp: STA 0+607 On/off ramps (frontage roads) Yadanar Intersection
- 3.25 m wide 1 lane with shoulders (0.75&1.25) - 115.2m ([email protected] m) long bridge PC-T Girder (Composite Slab Deck)
- 3.5 m wide two lane with 1.5 m width - Signal with four directions
Diversion or Diversion to Thanlyin Bridge Widening of Thanlyin Chin Kat Road
Widening - 3.5m wide two lanes for on and off - [email protected]+0.5+0.5
10 Bridges Total Length: 955 m Total Length: 1,076 m Total Length: 602 m Nos. of Spans Nos. of Spans Nos. of Spans - 11 spans (Abutment (A) 1 to P13) - 13 spans (P13 to A2) - 16 spans (AF1 to AF2) Superstructure Superstructure Superstructure
- PC Box Girder: 5@50=250m - Steel Box Girder: 6@122+104= 776m
- PC-T Girder (Composite Deck Slab): 2@30=60m, 6@30=180m, 2@30=60m
- Steel Box Girder: [email protected]+104=257m - PC Box Girder: 6@50 =300m - Steel Box Girder:
55+70+55 =180m
- Cable-stayed bridge: 112 +224 +112 =448m - Steel Plate Girder:
35+52+35 =122m Substructure Substructure Substructure - Reinforced Concrete (RC) Pier - RC Pier - RC Pier Foundation Foundation Foundation
- Land: RC Bored Pile (D=2.0m,1.5 m)
- Land: RC Bored Pile (D=2.0m, 1.5 m) - RC Bored Pile (D=1.5 m)
- River: Steel Pipe Sheet Pile (D=1.2 m)
- River: Steel Pipe Sheet Pile (D=1.2 m)
11 Pavement Bridge Deck Approach Road
Structure PC Box Girder, PC-T Girder (Composite Slab Deck) - Subbase 250 mm + Base 200 mm
- Coarse 40 mm + Dense 50 mm - Binder 50 mm + Surface 50 mm Steel Girder, Steel Cable-stayed Bridge Toll Gate - Stone Mastic Asphalt 40 mm+40 mm - Subbase 250 mm + Base 100 mm - Concrete Pavement 250 mm
12 Auxiliary Works
Drainage system, road lighting system, illumination system, obstruction lights, bridge bearings, expansion joints, navigation signs, road signs, road markings, inspection access, monitoring system, supports for water pipes and telecom fibers, signals, etc.
* Japanese Government Order on Road Design Standards Source: JICA Study Team
Detailed Design Study on The Bago River Bridge Construction Project Final Report
1-5
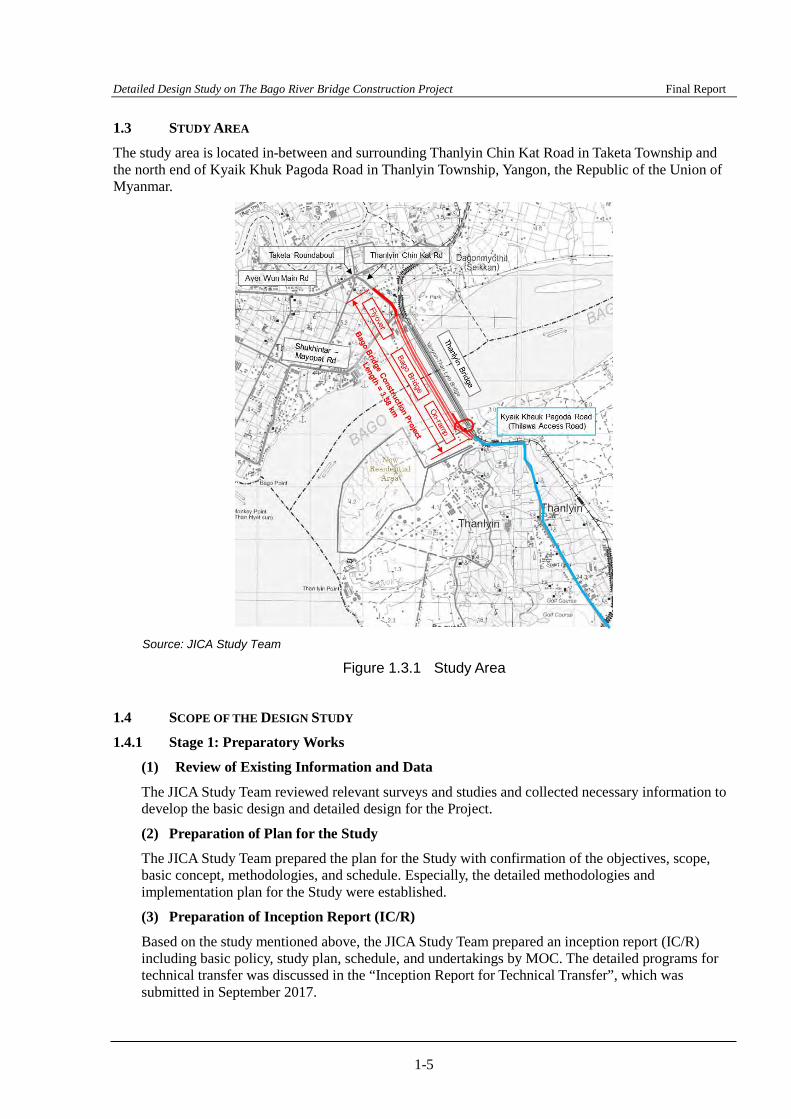
1.3 STUDY AREA
The study area is located in-between and surrounding Thanlyin Chin Kat Road in Taketa Township and the north end of Kyaik Khuk Pagoda Road in Thanlyin Township, Yangon, the Republic of the Union of Myanmar.
Source: JICA Study Team
Figure 1.3.1 Study Area
1.4 SCOPE OF THE DESIGN STUDY
1.4.1 Stage 1: Preparatory Works
(1) Review of Existing Information and Data
The JICA Study Team reviewed relevant surveys and studies and collected necessary information to develop the basic design and detailed design for the Project.
(2) Preparation of Plan for the Study
The JICA Study Team prepared the plan for the Study with confirmation of the objectives, scope, basic concept, methodologies, and schedule. Especially, the detailed methodologies and implementation plan for the Study were established.
(3) Preparation of Inception Report (IC/R)
Based on the study mentioned above, the JICA Study Team prepared an inception report (IC/R) including basic policy, study plan, schedule, and undertakings by MOC. The detailed programs for technical transfer was discussed in the “Inception Report for Technical Transfer”, which was submitted in September 2017.

Detailed Design Study on The Bago River Bridge Construction Project Final Report
1-6
(4) Explanation of IC/R
The JICA Study Team explained and confirmed contents of the IC/R. Especially, scope and methodologies of study and survey, schedule and implementation structure of the Study, and the entire schedule of the Project were confirmed with MOC and JICA.
(5) Review of Previous Studies Based on Site Reconnaissance
Additionally, for the review of previous studies mentioned in (1), the JICA Study Team reviewed information and data that were newly obtained in Myanmar and updated the plan of the Study as required.
1.4.2 Stage 2: Basic Design Phase
(1) Field Surveys
The JICA Study Team conducted field surveys to obtain the data including natural conditions, utility facility conditions, environmental and social conditions using sub-contractors as shown below.
Table 1.4.1 Field Surveys Surveys Schedule Sub-Contractor Position in
JICA Study Team
Boring Survey End of September 2016~ Middle of January 2016
Fukken Co., Ltd.
Geotechnical Engineer
Topographic Survey
End of September ~ Middle of December 2016
Saramar Fuji Construction Co., Ltd.
Topographical Engineer
Material Survey
End of September ~ Middle of December 2016
- Fukken Co., Ltd. Material Engineer
Hydrological Survey
End of September ~ Middle of December 2016
Asia Air Survey Myanmar Co., Ltd.
Hydrological Engineer
Utility Facility Survey
End of September ~ Middle of December 2016
Asia Air Survey Myanmar Co., Ltd.
Utility Engineer
Environmental Survey
Beginning of October 2016 ~ End of March 2017
- Environ Myanmar Co., Ltd. Environmental Consideration
Social Survey December 2016 ~ End of May 2017
- E Guard Environmental Services Co., Ltd.
Social Consideration
Source: JICA Study Team
(2) Basic Design
The JICA Study Team carried out basic design for confirmation of the design policy, design criteria, structure types, and the rough sizes so as not to cause any changes of design policy and criteria in the detailed design phase.
(3) Preparation and Explanation of Basic Design Report (BD/R)
The JICA Study Team prepared the basic design report (BD/R) based on the results of site reconnaissance, review on previous studies, field surveys, study on basic design, construction plan, implementation schedule, and updated preliminary project cost including issue in detailed design phase. The JICA Study Team also explained the BD/R to MOC and TAC, and confirm the scope and structures for the detailed design.

Detailed Design Study on The Bago River Bridge Construction Project Final Report
1-7
1.4.3 Stage 3: Detailed Design Phase
(1) Detailed Design
The JICA Study Team carried out detailed design for the scope and structures that were confirmed in the basic design phase.
(2) Verification of Design
The JICA Study Team has been carrying out verification of design so as not to cause any error on the process and technical details of the design study.
(3) Operation and Maintenance Planning
The JICA Study Team prepared operation and maintenance plan for the Project.
(4) Preparation of Tender Documents
The JICA Study Team prepared tender documents based on the technical specifications and the bill of quantities.
(5) Preparation of HIV/AIDS Prevention Program
The JICA Study Team prepared HIV/AIDS prevention program for construction workers with the Yangon Regional Government.
(6) Preparation and Explanation of Draft Final Report (DF/R)
The JICA Study Team prepared the draft final report (DF/R) including the results on the study of basic and detailed design. The JICA Study Team will also explain and confirm DF/R with MOC and TAC. MOC and TAC shall prepare comments on DF/R and submit to the JICA Study Team within four weeks after submission of DF/R.
(7) Support on Promotion
The JICA Study Team updated the image perspectives based on the results of design and prepares a project movie (approximately 7 min.).
(8) Preparation and Submission of Final Report (F/R)
The JICA Study Team prepared final report (F/R) based on the comments on DF/R that MOC and TAC submitted.
1.4.4 Stage 4: Environmental and Social Considerations
The initial environmental examination (IEE) report was updated and baseline survey was conducted. For social considerations, ARAP was also updated and detailed measurement survey was conducted.
1.4.5 Stage 5: Technical Transfer
The details of the technical transfer program were submitted in September 2017 as the “Inception Report for Technical Transfer”.
1.5 WORK SCHEDULE
The entire work period of this detailed design study is approximately 17 months, including technical transportation program. The preparatory works were carried out from the middle of September 2016, the final report for the detailed design study will be submitted in early December 2017, and the main technical transportation program will be carried out from the middle of October 2017 up to the end of February 2018, as shown in Table 1- 3. The time schedule for design change due to the revision in span arrangement is shown in red in the table.

Detailed Design Study on The Bago River Bridge Construction Project Final Report
1-8
Table 1.5.1 Work Schedule
Source: JICA Study Team
Month
Works
Legend: In Myanmar In Japan Design Change(In Japan)
⑫Promotion MovieBidding Documents: ④Floyver Section (Draft) ⑤River Bridge Section (Draft)
Technology Transfer(TT) ⑧IC/R for TT ⑨IT/R for TT ⑩F/R for TT
【9-10】 Cost Estimate
【12-1】 Preparation of Technical Specifications and BOQ【12-2】 Preparation of Draft Bidding Documents【12-3】 Explanation of Draft Bidding Documents
Reports: ①IC/R ②BD/R ③DF/R ⑪F/R
Technical Advisory CommitteeTender/Construction
【19】 Support on Social ConsiderationsStage 5:Technology Transfer【20】 Technical Transfer on Bridge Design
【15】 Explanation of DF/R【16】 Support on Project Promotion
【6-1】 Geological Survey【6-2】 Topobraphic Survey【6-3】 Material Source Survey【6-4】 Hydrological Survey【6-5】 Utility Survey
2016 2017 2018
Rainy Season34 5 61 2 3
【7-1】 Establishment of Design Concept and Design Criteria【7-2】 Basic Design【7-3】 Preparation of Outline of Construction Plan and Schedule【7-4】 Study and Preparation of Procurmeent Plan
210 11 12 17 8 9
【4】 Explanation of IC/R
10 11 12
【13】 Preparation of HIV/AIDS Prevention Program【14】 Preparation of Draft Final Report (DF/R)
9
【7-5】 Update of Preliminary Project Cost
【9-1】 Road Deisign【9-2】 River Bridge Deisgn
【8】 Preparation and Explanation of Basic Design Report (BD/R)Stage 3:Detaield Desgin Phase【9】 Detailed Design
【7】 Basic Design
Stage 2:Basic Design Phase
Stage 1:Preparatory Works
【6】 Field Surveys
【1】 Review of Existing Information and Data【2】 Preparation of Plan of Study【3】 Preparation of Inception Report (IC/R)
【5】 Review of Previous Studies based on Site Reconnaissance
Environmental and Social Considerations: ⑥EIA Report ⑦A-RAP Report
【9-6】 Lighting and Wiring Design【9-7】 Construction Planning【9-8】 Study on Safety in Construction【9-9】 Prepalation of Material Procurement Plan
【9-3】 Flyover Design【9-4】 Soft Soil Treatment Design【9-5】 Toll Collection Facility Design
【17】 Preparation and Submission of Final Report (F/R)Stage 4:Environmental and Social Considerations【18】 Support on Environmental Considerations
【10】 Design Verification【11】 Operation and Maintenance Planning【12】 Preparation of Draft Bidding Docurments
111 2
4 5
3
8 9 10
12
6
7
Bidding

Detailed Design Study on The Bago River Bridge Construction Project Final Report
2-1
CHAPTER 2. FIELD SURVEYS ON NATURAL AND EXISTING CONDITIONS
2.1 SOIL INVESTIGATION
2.1.1 Survey Scope and Purpose
(1) Survey Purpose
Soil investigation was conducted in obtaining the geological and geotechnical information required for the detailed design of roads and bridges construction.
The main purposes of this survey are as follows:
1) To clarify the geological conditions, geological strata and their characteristics, of the construction site for detailed design; and
2) To determine geotechnical properties of the strata at the project site.
(2) Survey Scope
Soil survey is divided into six subcomponents:
1) Mobilization and demobilization,
2) Borehole drilling on land and in the river,
3) Standard Penetration Test (SPT),
4) Pressure meter Test,
5) Laboratory test, and
6) Reporting.
The contents of the laboratory test are the following:
- Natural moisture content test, - Specific gravity test, - Particle size analysis, - Atterberg limit test, - Unconfined compression test, and - Consolidation test.
All field investigation works and laboratory tests were carried out in accordance with the American Society of Testing and Materials (ASTM), and the International Systems of Units (SI Units) are applied.
The termination criteria of the depth of each borehole was based on layer that can be confirmed as stable soil condition as a bearing layer (N- value is more than 50, and its thickness is not less than 5 m continuously).
For construction planning of the bridge, approach road section, and viaduct, information on the groundwater level obtained by the boring surveys should be determined.

Detailed Design Study on The Bago River Bridge Construction Project Final Report
2-2
(3) Project Location (Locations of the Boring Survey)
The soil investigation survey was conducted from the Thanlyin side of the left bank to the Thaketa side of the right bank of the Project. In this survey, the JICA Survey Team used the soil investigation results of not only the feasibility study (F/S) survey in 2013 but also the supplemental F/S survey for the flyover section at Thaketa side which was conducted in September 2016.
The locations of where the survey was conducted are shown in Figure 2.1.1.
Source: JICA Study Team
Figure 2.1.1 Locations of Boring Survey
Table 2.1.1 shows the details of the soil investigation.
Table 2.1.1 Details of Soil Investigation
Survey Contents Unit Volume
Plan Actual (1) Boring Survey set 1 1 1-1 Bridge section in the river area (1.58 km)
1 location/pier hole 13 13 m 780 737
1-2 Approach road section, left bank (0.40 km)
1 location/at intervals of 50-100 m
hole 3 3 m 180 174
1-2 Land bridge section, left bank (0.25 km)
1 location/pier or abutment
hole 5 5 m 300 309
1-3 Land bridge section, right bank (0.14 km)
1 location/pier or abutment
hole 4 4 m 200 203
Total
hole 25 25 m 1460 1423
(2) Standard Penetration Test At intervals of 1 m of boring depth
nos. 1460 1365
(3) Pressure Meter Test nos. 18 18 (4) Undisturbed Sampling nos. 50 61 (5) Laboratory Test set 1 1
Physical Property Test
Specific gravity, particle size, natural moisture content
nos. 125 643
Atterberg limit nos. 125 315 Strength Test (Unconfined Compression Test) nos. 50 59 Consolidation Test nos. 50 47
Source: JICA Study Team
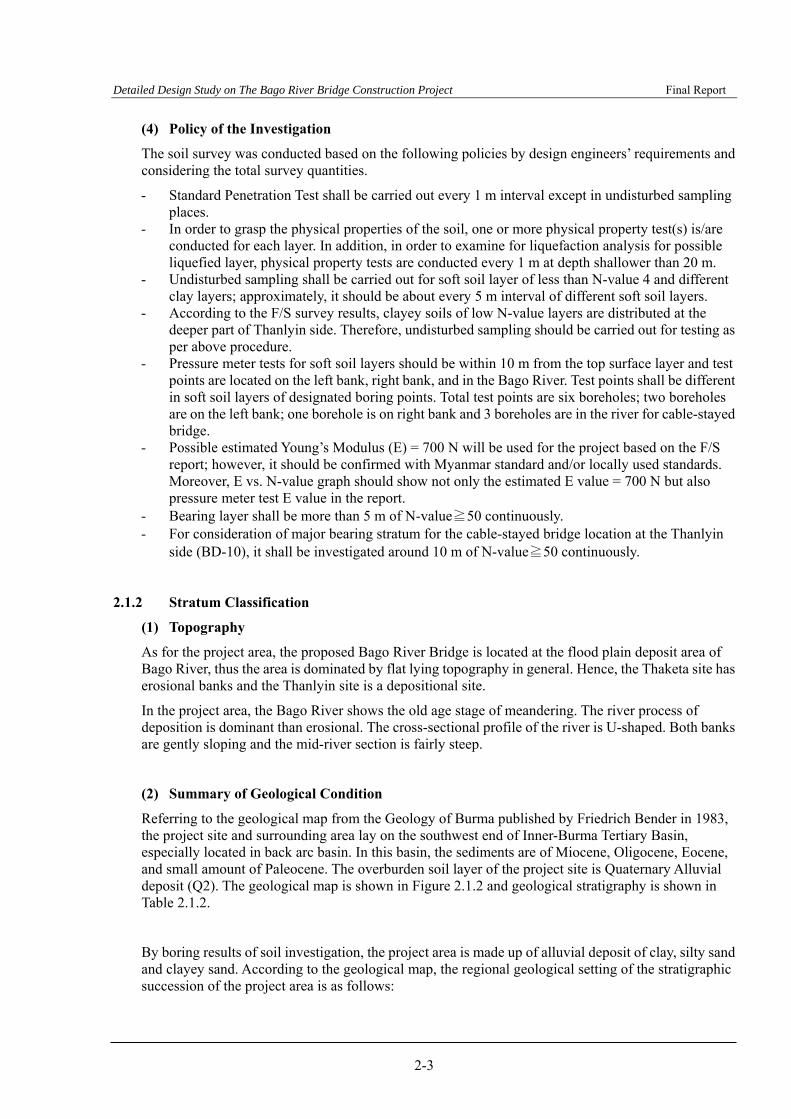
Detailed Design Study on The Bago River Bridge Construction Project Final Report
2-3
(4) Policy of the Investigation
The soil survey was conducted based on the following policies by design engineers’ requirements and considering the total survey quantities.
- Standard Penetration Test shall be carried out every 1 m interval except in undisturbed sampling places.
- In order to grasp the physical properties of the soil, one or more physical property test(s) is/are conducted for each layer. In addition, in order to examine for liquefaction analysis for possible liquefied layer, physical property tests are conducted every 1 m at depth shallower than 20 m.
- Undisturbed sampling shall be carried out for soft soil layer of less than N-value 4 and different clay layers; approximately, it should be about every 5 m interval of different soft soil layers.
- According to the F/S survey results, clayey soils of low N-value layers are distributed at the deeper part of Thanlyin side. Therefore, undisturbed sampling should be carried out for testing as per above procedure.
- Pressure meter tests for soft soil layers should be within 10 m from the top surface layer and test points are located on the left bank, right bank, and in the Bago River. Test points shall be different in soft soil layers of designated boring points. Total test points are six boreholes; two boreholes are on the left bank; one borehole is on right bank and 3 boreholes are in the river for cable-stayed bridge.
- Possible estimated Young’s Modulus (E) = 700 N will be used for the project based on the F/S report; however, it should be confirmed with Myanmar standard and/or locally used standards. Moreover, E vs. N-value graph should show not only the estimated E value = 700 N but also pressure meter test E value in the report.
- Bearing layer shall be more than 5 m of N-value≧50 continuously. - For consideration of major bearing stratum for the cable-stayed bridge location at the Thanlyin
side (BD-10), it shall be investigated around 10 m of N-value≧50 continuously.
2.1.2 Stratum Classification
(1) Topography
As for the project area, the proposed Bago River Bridge is located at the flood plain deposit area of Bago River, thus the area is dominated by flat lying topography in general. Hence, the Thaketa site has erosional banks and the Thanlyin site is a depositional site.
In the project area, the Bago River shows the old age stage of meandering. The river process of deposition is dominant than erosional. The cross-sectional profile of the river is U-shaped. Both banks are gently sloping and the mid-river section is fairly steep.
(2) Summary of Geological Condition
Referring to the geological map from the Geology of Burma published by Friedrich Bender in 1983, the project site and surrounding area lay on the southwest end of Inner-Burma Tertiary Basin, especially located in back arc basin. In this basin, the sediments are of Miocene, Oligocene, Eocene, and small amount of Paleocene. The overburden soil layer of the project site is Quaternary Alluvial deposit (Q2). The geological map is shown in Figure 2.1.2 and geological stratigraphy is shown in Table 2.1.2.
By boring results of soil investigation, the project area is made up of alluvial deposit of clay, silty sand and clayey sand. According to the geological map, the regional geological setting of the stratigraphic succession of the project area is as follows:

Detailed Design Study on The Bago River Bridge Construction Project Final Report
2-4
Description Symbols Age
Alluvium Q2 Quaternary
Irrawaddy Formation Tm-Tp Miocene – Pliocene
Upper Pegu Group Tm Miocene
Generally, the Yangon area is covered by alluvium. The Irrawaddy Formation comprises the bedrock along the Bago Yoma, the Arzanigone Sandstone in the north of the Shwedagon Pagoda, and Danyingone Clay in the east of the Arzanigone Sandstone. The Pegu Group comprises the Besapet Alternation, Thadugan Sandstone, and Hlawga Shale distributed in the north of the Yangon area.
Table 2.1.2 Geological Stratigraphy of the Survey Area
Age Symbols Formation Description
Quarter- nary
Q2 Alluvium
- This top soil was deposited in recent time as river deposits and it is blanketing over the project area.
- This formation has brown to gray in color and the main constituent is clay and silty sand with clay patches. These deposits are built by the effect of flood action.
- This formation yields medium to high in water content.
Miocene-Pliocene
Tm-Tp
Irrawaddy Formation
and its relevant
- This formation is composed of yellowish fines and of the Irrawaddian Group.
- The outcropping areas can be seen in Danyingone, Arzarnigone, Southern Twin Te, and the left bank ofYangon-Thanlyin across the Pegu (Bago) River.
Miocene Tm
Upper Pegu Group and its
equivalent
- This formation is mainly composed of sand and shale interbeds. - The outcropping areas are found along the anticlinal ridges of
the Danyingone and Thanlyin areas. Most of them are composed of reddish brown oxidized lateritic soil.
Source: JICA Study Team
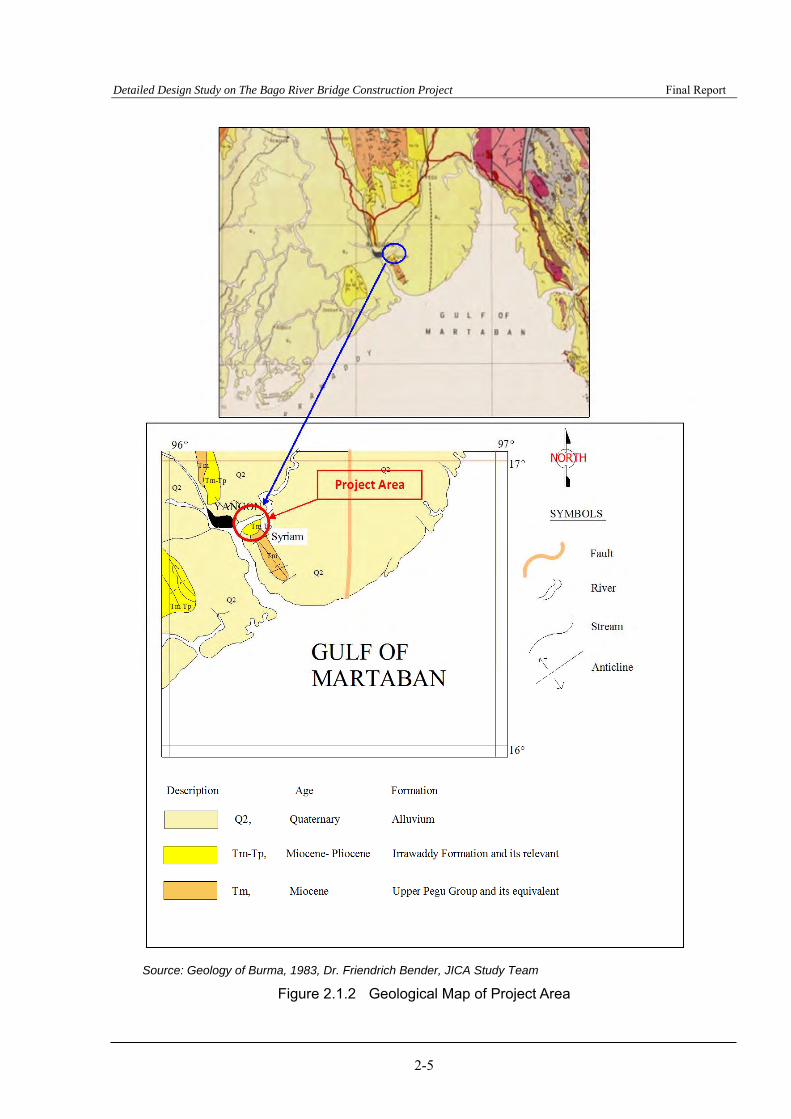
Detailed Design Study on The Bago River Bridge Construction Project Final Report
2-5
Source: Geology of Burma, 1983, Dr. Friendrich Bender, JICA Study Team
Figure 2.1.2 Geological Map of Project Area
Detailed Design Study on The Bago River Bridge Construction Project Final Report
2-6
(3) Stratum Classification
The soil survey commenced on October 8, 2016 and was completed on January 20, 2017.
1) Design section and survey distinction
The design section of this project is about 3.7 km, starting from the Thanlyin side passing through the Bago River and ending with the Flyover section at the Thaketa side. Topographically, it is divided into the left bank corresponding to Thanlyin side and the right bank of Thaketa side with Bago River as the border.
For the Thaketa side, the soil survey for the Flyover section has been completed. For this reason, the right bank of Bago River was divided into Approach Bridge section (right bank section: Thaketa side) and Flyover section.
The relation between the design section and the geological survey section will be summarized as follows with reference to the boring survey position.
① Left bank, Thanlyin side (from BD-25 to BH-2 of 2013 report)
② River section, (from BH-2 of 2013 report to BD-17)
③ Right bank, Thaketa side (from BD-17 to BH-5 of 2013 report)
④ Flyover section, Thaketa side (from BH-5 of 2013 report to BH-1 of 9.2016 report of supplemental F/S report)
There are twenty-five boreholes in total that were carried out in this investigation work and five boreholes in the F/S stage survey and fourteen boreholes in the supplemental F/S stage survey.
Boring points and coordinates are shown in Table 2.1.3.
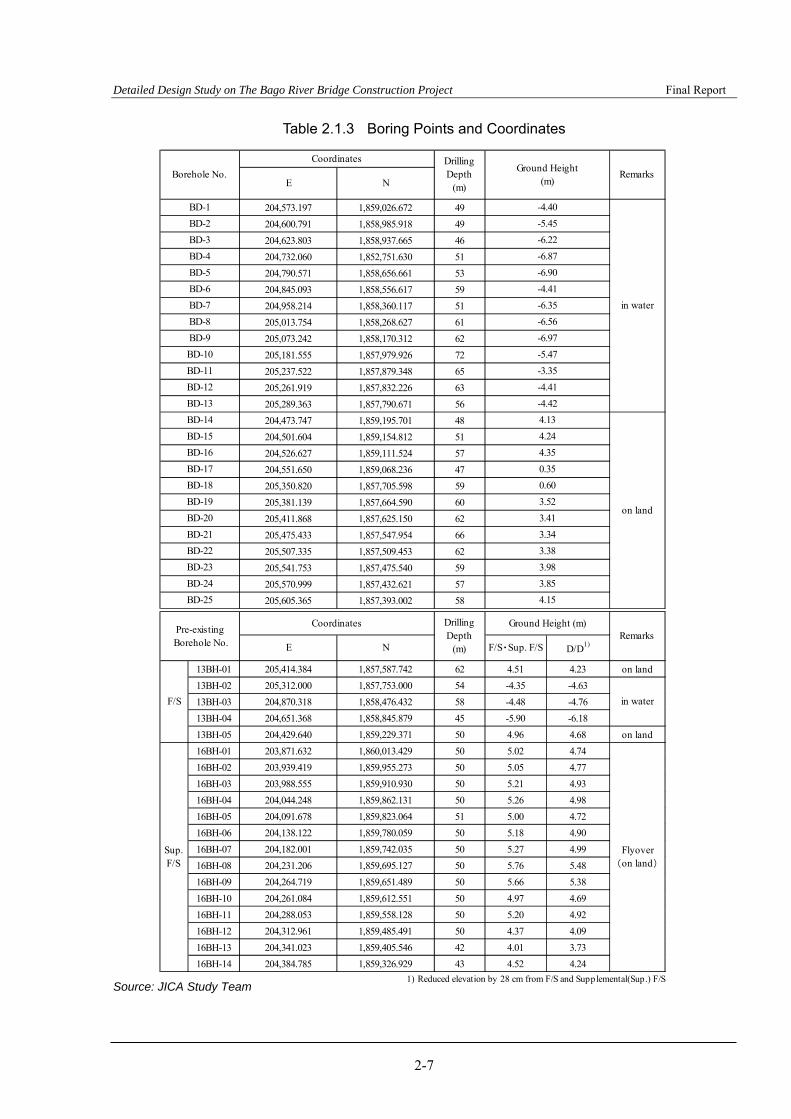
Detailed Design Study on The Bago River Bridge Construction Project Final Report
2-7
204,573.197 1,859,026.672 49
204,600.791 1,858,985.918 49
204,623.803 1,858,937.665 46
204,732.060 1,852,751.630 51
204,790.571 1,858,656.661 53
204,845.093 1,858,556.617 59
204,958.214 1,858,360.117 51
205,013.754 1,858,268.627 61
205,073.242 1,858,170.312 62
205,181.555 1,857,979.926 72
205,237.522 1,857,879.348 65
205,261.919 1,857,832.226 63
205,289.363 1,857,790.671 56
204,473.747 1,859,195.701 48
204,501.604 1,859,154.812 51
204,526.627 1,859,111.524 57
204,551.650 1,859,068.236 47
205,350.820 1,857,705.598 59
205,381.139 1,857,664.590 60
205,411.868 1,857,625.150 62
205,475.433 1,857,547.954 66
205,507.335 1,857,509.453 62
205,541.753 1,857,475.540 59
205,570.999 1,857,432.621 57
205,605.365 1,857,393.002 58
13BH-01 205,414.384 1,857,587.742 62 4.51 4.23 on land
13BH-02 205,312.000 1,857,753.000 54 -4.35 -4.63
13BH-03 204,870.318 1,858,476.432 58 -4.48 -4.76
13BH-04 204,651.368 1,858,845.879 45 -5.90 -6.18
13BH-05 204,429.640 1,859,229.371 50 4.96 4.68 on land
16BH-01 203,871.632 1,860,013.429 50 5.02 4.74
16BH-02 203,939.419 1,859,955.273 50 5.05 4.77
16BH-03 203,988.555 1,859,910.930 50 5.21 4.93
16BH-04 204,044.248 1,859,862.131 50 5.26 4.98
16BH-05 204,091.678 1,859,823.064 51 5.00 4.72
16BH-06 204,138.122 1,859,780.059 50 5.18 4.90
16BH-07 204,182.001 1,859,742.035 50 5.27 4.99
16BH-08 204,231.206 1,859,695.127 50 5.76 5.48
16BH-09 204,264.719 1,859,651.489 50 5.66 5.38
16BH-10 204,261.084 1,859,612.551 50 4.97 4.69
16BH-11 204,288.053 1,859,558.128 50 5.20 4.92
16BH-12 204,312.961 1,859,485.491 50 4.37 4.09
16BH-13 204,341.023 1,859,405.546 42 4.01 3.73
16BH-14 204,384.785 1,859,326.929 43 4.52 4.24
1) Reduced elevation by 28 cm from F/S and Supplemental(Sup.) F/S
BD-23
BD-24
BD-25
E N D/D1)
Ground Height (m)
BD-16
F/S・Sup. F/S
BD-10
BD-11
BD-12
BD-20
BD-13
BD-14
4.15
Flyover(on land)
Coordinates DrillingDepth
(m)
Sup.F/S
4.13
4.24
in water
BD-18
BD-19
0.60
BD-9
Remarks
Coordinates DrillingDepth
(m)
Remarks
in water
on land
Ground Height(m)E
BD-15
N
-4.40
Borehole No.
BD-1
BD-2 -5.45
-6.22
F/S
Pre-existing Borehole No.
BD-21
BD-22
BD-3
BD-4
BD-5
BD-17
BD-6
BD-7
-6.87
-6.90
-4.41
-6.35
-6.56BD-8
-6.97
-5.47
-3.35
-4.41
-4.42
0.35
4.35
3.52
3.41
3.34
3.38
3.98
3.85
Table 2.1.3 Boring Points and Coordinates
Source: JICA Study Team
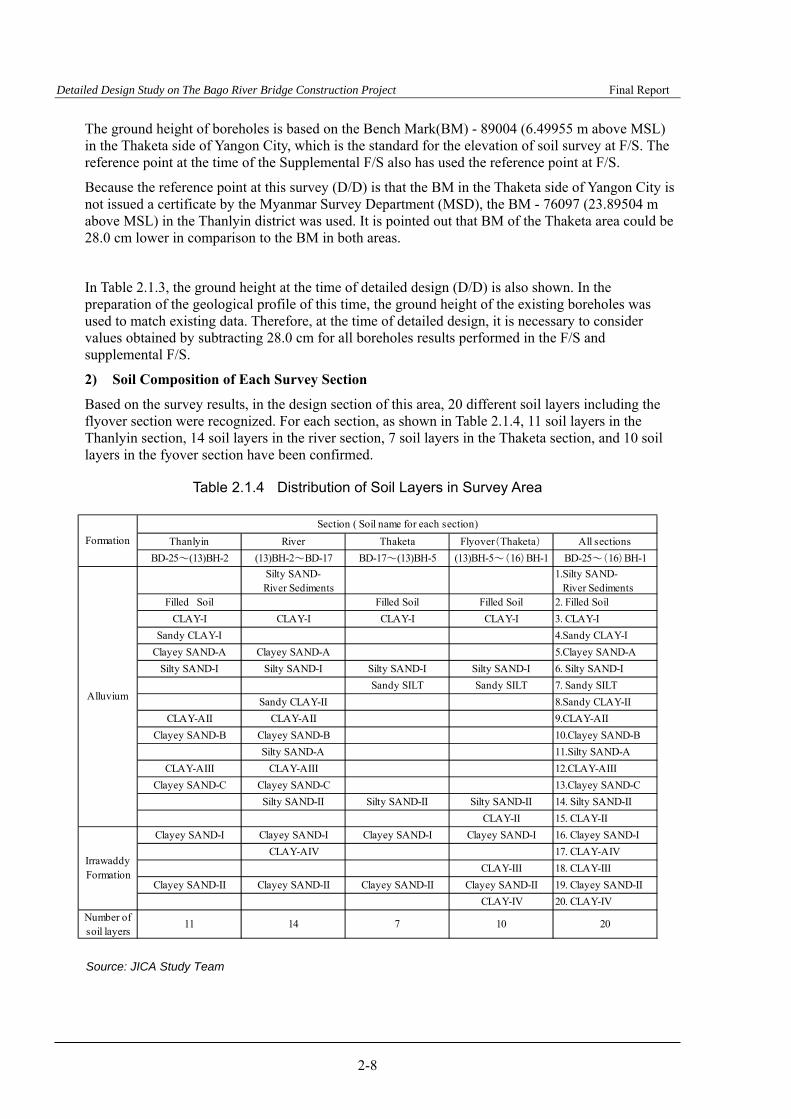
Detailed Design Study on The Bago River Bridge Construction Project Final Report
2-8
The ground height of boreholes is based on the Bench Mark(BM) - 89004 (6.49955 m above MSL) in the Thaketa side of Yangon City, which is the standard for the elevation of soil survey at F/S. The reference point at the time of the Supplemental F/S also has used the reference point at F/S.
Because the reference point at this survey (D/D) is that the BM in the Thaketa side of Yangon City is not issued a certificate by the Myanmar Survey Department (MSD), the BM - 76097 (23.89504 m above MSL) in the Thanlyin district was used. It is pointed out that BM of the Thaketa area could be 28.0 cm lower in comparison to the BM in both areas.
In Table 2.1.3, the ground height at the time of detailed design (D/D) is also shown. In the preparation of the geological profile of this time, the ground height of the existing boreholes was used to match existing data. Therefore, at the time of detailed design, it is necessary to consider values obtained by subtracting 28.0 cm for all boreholes results performed in the F/S and supplemental F/S.
2) Soil Composition of Each Survey Section
Based on the survey results, in the design section of this area, 20 different soil layers including the flyover section were recognized. For each section, as shown in Table 2.1.4, 11 soil layers in the Thanlyin section, 14 soil layers in the river section, 7 soil layers in the Thaketa section, and 10 soil layers in the fyover section have been confirmed.
Table 2.1.4 Distribution of Soil Layers in Survey Area
Source: JICA Study Team
Thanlyin River Thaketa Flyover(Thaketa) All sections
BD-25~(13)BH-2 (13)BH-2~BD-17 BD-17~(13)BH-5 (13)BH-5~(16)BH-1 BD-25~(16)BH-1
Silty SAND- River Sediments
1.Silty SAND- River Sediments
Filled Soil Filled Soil Filled Soil 2. Filled Soil
CLAY-I CLAY-I CLAY-I CLAY-I 3. CLAY-I
Sandy CLAY-I 4.Sandy CLAY-I
Clayey SAND-A Clayey SAND-A 5.Clayey SAND-A
Silty SAND-I Silty SAND-I Silty SAND-I Silty SAND-I 6. Silty SAND-I
Sandy SILT Sandy SILT 7. Sandy SILT
Sandy CLAY-II 8.Sandy CLAY-II
CLAY-AII CLAY-AII 9.CLAY-AII
Clayey SAND-B Clayey SAND-B 10.Clayey SAND-B
Silty SAND-A 11.Silty SAND-A
CLAY-AIII CLAY-AIII 12.CLAY-AIII
Clayey SAND-C Clayey SAND-C 13.Clayey SAND-C
Silty SAND-II Silty SAND-II Silty SAND-II 14. Silty SAND-II
CLAY-II 15. CLAY-II
Clayey SAND-I Clayey SAND-I Clayey SAND-I Clayey SAND-I 16. Clayey SAND-I
CLAY-AIV 17. CLAY-AIV
CLAY-III 18. CLAY-III
Clayey SAND-II Clayey SAND-II Clayey SAND-II Clayey SAND-II 19. Clayey SAND-II
CLAY-IV 20. CLAY-IV
Number of soil layers
11 14 7 10 20
Formation
Section ( Soil name for each section)
Alluvium
Irrawaddy Formation
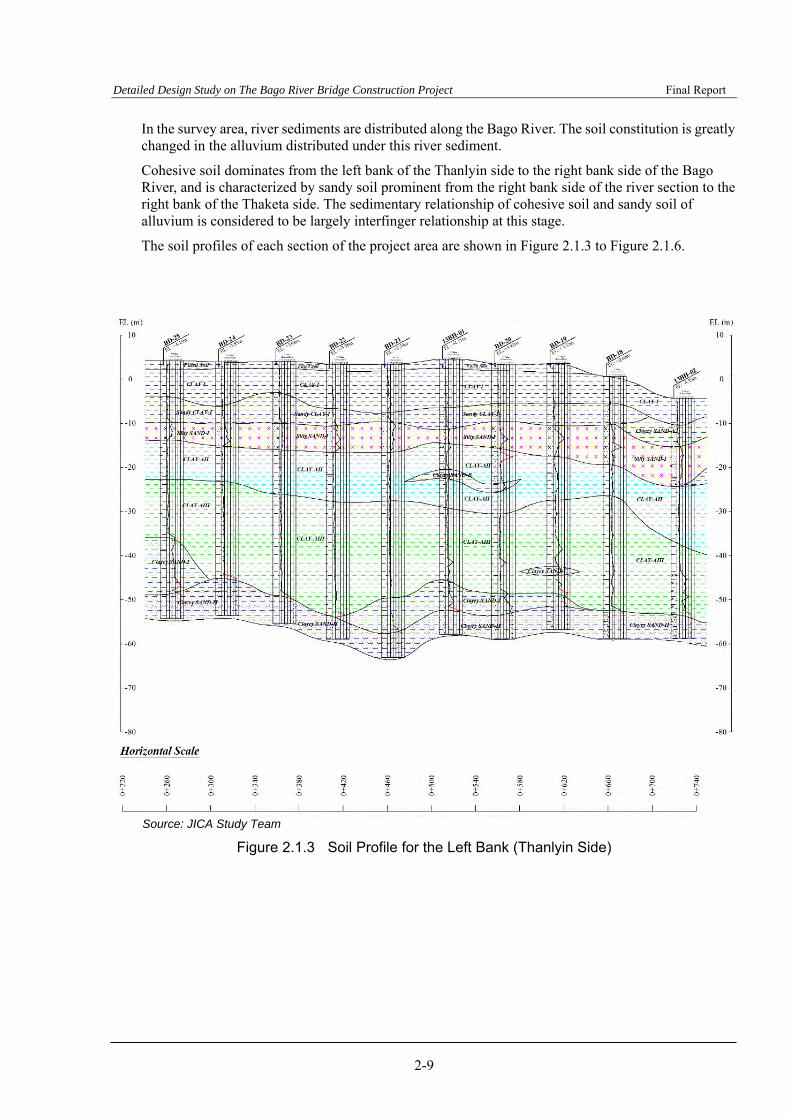
Detailed Design Study on The Bago River Bridge Construction Project Final Report
2-9
In the survey area, river sediments are distributed along the Bago River. The soil constitution is greatly changed in the alluvium distributed under this river sediment.
Cohesive soil dominates from the left bank of the Thanlyin side to the right bank side of the Bago River, and is characterized by sandy soil prominent from the right bank side of the river section to the right bank of the Thaketa side. The sedimentary relationship of cohesive soil and sandy soil of alluvium is considered to be largely interfinger relationship at this stage.
The soil profiles of each section of the project area are shown in Figure 2.1.3 to Figure 2.1.6.
Source: JICA Study Team
Figure 2.1.3 Soil Profile for the Left Bank (Thanlyin Side)
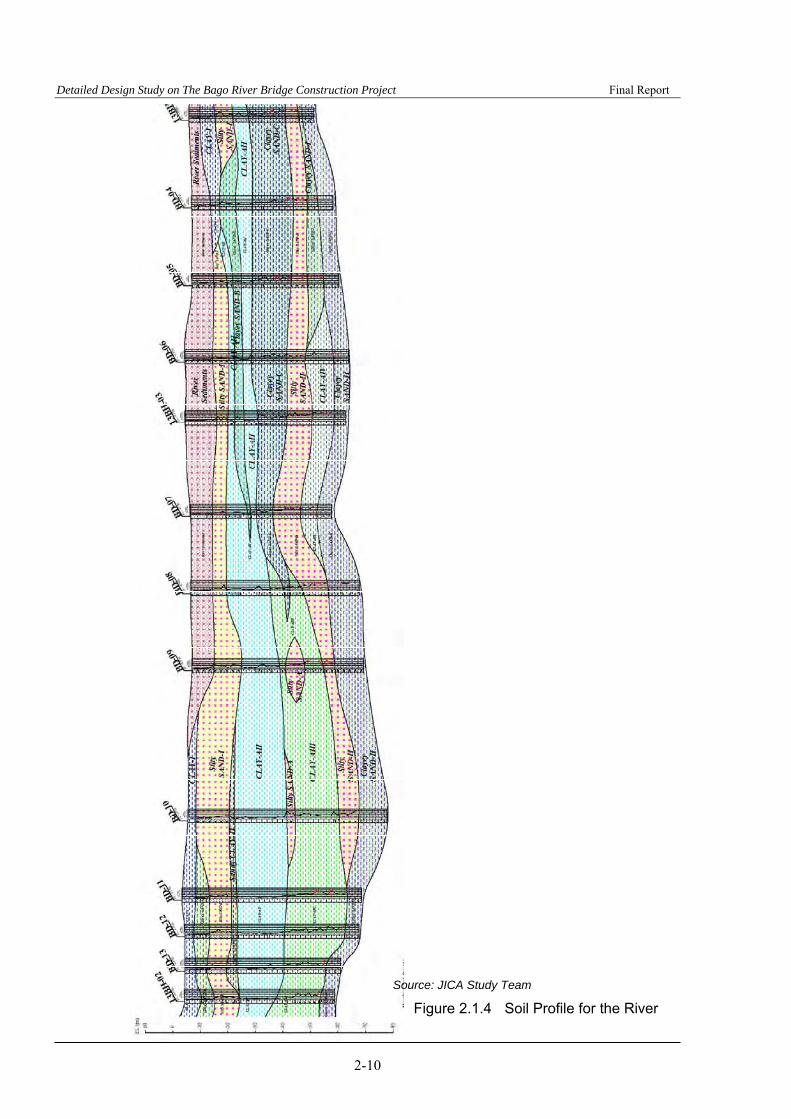
Detailed Design Study on The Bago River Bridge Construction Project Final Report
2-10
Source: JICA Study Team
Figure 2.1.4 Soil Profile for the River

Detailed Design Study on The Bago River Bridge Construction Project Final Report
2-11
Section
Source: JICA Study Team
Figure 2.1.5 Soil Profile for the Right Bank (Thaketa Side)

Detailed Design Study on The Bago River Bridge Construction Project Final Report
2-12

Detailed Design Study on The Bago River Bridge Construction Project Final Report
2-13
Source: JICA Study Team
Figure 2.1.6 Soil Profile for the Flyover Section
The stratum structure of each section will be explained below.
① Left bank, Thanlyin side (from BD-25 to BH-2 of 2013 report)-5)
Eleven different soil layers are confirmed in this area. Table 2.1.5 shows the soil stratigraphy.
Table 2.1.5 Soil Stratigraphy of the Survey Area (Thanlyin Side)
Formation Soil Type N-Value
(Representative -Value)
Description
Alluvium
1. Filled Soil 0~3 (1)
The thickness is about 1.0 m to 2.0 m. The color is brown. The plasticity is low to medium and the water content is moist. The consistency is very soft to soft.
2. CLAY-I 0~4 (1)
The thickness is about 3.0 m to 11.0 m. The color is gray. The water content is moist to wet and the plasticity is low to high. The consistency is very soft to soft.
3. Sandy CLAY-I 2~10 (3)
The thickness is about 2.0 m and 7.0 m. The color is gray and the water content is moist. The plasticity is low to medium. The consistency is soft to stiff.
4. Clayey SAND-A 2~15 (3)
The thickness is about 4.0 m to 6.0 m. The color is brownish gray and the water content is moist to wet. The plasticity of clay is low. The grain size of sand is fine to medium.
5. Silty SAND-I 5~29 (15)
The thickness is about 3.0 m to 9.0 m. The color is gray and the water content is moist. The grained size is fine to medium. The relative density is loose to medium dense.
6. CLAY-AII 2~19 (5)
The thickness is about 7.0 m to 13.0 m. The color is gray and the water content is moist. The plasticity is low to medium. The consistency is soft to very stiff.
7. Clayey SAND-B 15~27 (17)
The thickness is about 2.0 m. The color is gray and the water content is moist. The plasticity of clay is low and the grain size of sand is fine. The relative density is medium dense.
8. CLAY-AIII 3~33 (7)
The thickness is about 14.0 m to 26.0 m. The color is gray and the water content is moist to wet. The plasticity is low to medium. The consistency is soft to hard.
9. Clayey SAND-C 20~32 (20)
The thickness is about 2.0 m. The color is gray and the water content is moist. The plasticity of clay is low to medium. The grain size of sand is fine to medium.
Irrawaddy Formation
10. Clayey SAND-I 10~≧50
(23)
The thickness is about 3.0 m to 12.0 m. The color is greenish gray to yellowish brown and the water content is moist. The grain size of sand is fine to medium.
11. Clayey SAND-II ≧50 (50)
The thickness of this layer is more than 9.0 m. The color is yellowish brown and the water content is moist. The grain size of sand is fine to medium.
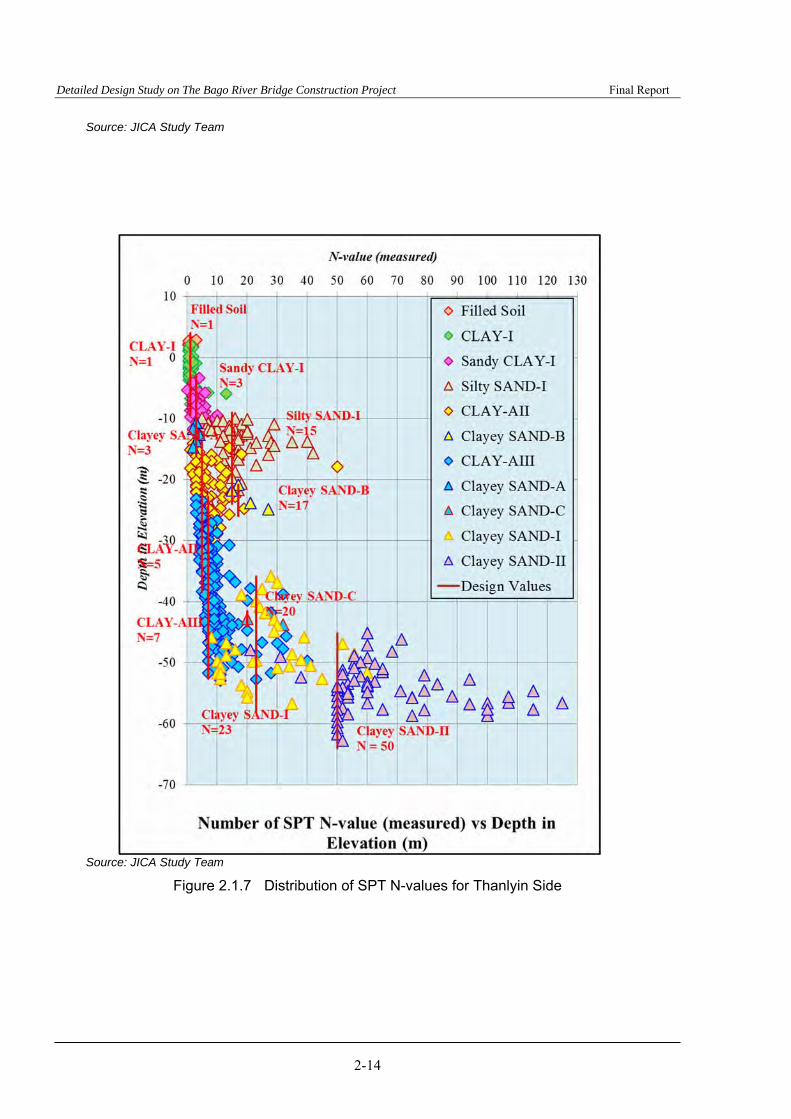
Detailed Design Study on The Bago River Bridge Construction Project Final Report
2-14
Source: JICA Study Team
Source: JICA Study Team
Figure 2.1.7 Distribution of SPT N-values for Thanlyin Side
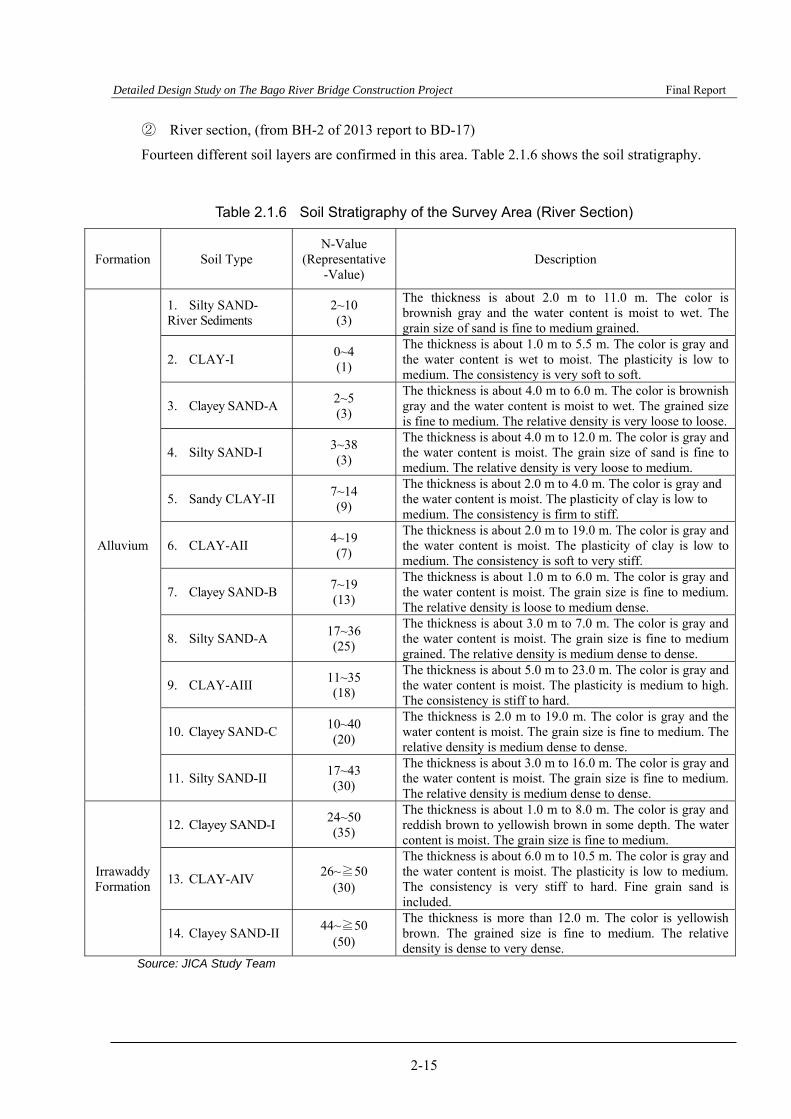
Detailed Design Study on The Bago River Bridge Construction Project Final Report
2-15
② River section, (from BH-2 of 2013 report to BD-17)
Fourteen different soil layers are confirmed in this area. Table 2.1.6 shows the soil stratigraphy.
Table 2.1.6 Soil Stratigraphy of the Survey Area (River Section)
Formation Soil Type N-Value
(Representative -Value)
Description
Alluvium
1. Silty SAND- River Sediments
2~10 (3)
The thickness is about 2.0 m to 11.0 m. The color is brownish gray and the water content is moist to wet. The grain size of sand is fine to medium grained.
2. CLAY-I 0~4 (1)
The thickness is about 1.0 m to 5.5 m. The color is gray and the water content is wet to moist. The plasticity is low to medium. The consistency is very soft to soft.
3. Clayey SAND-A 2~5 (3)
The thickness is about 4.0 m to 6.0 m. The color is brownish gray and the water content is moist to wet. The grained size is fine to medium. The relative density is very loose to loose.
4. Silty SAND-I 3~38 (3)
The thickness is about 4.0 m to 12.0 m. The color is gray and the water content is moist. The grain size of sand is fine to medium. The relative density is very loose to medium.
5. Sandy CLAY-II 7~14 (9)
The thickness is about 2.0 m to 4.0 m. The color is gray and the water content is moist. The plasticity of clay is low to medium. The consistency is firm to stiff.
6. CLAY-AII 4~19 (7)
The thickness is about 2.0 m to 19.0 m. The color is gray and the water content is moist. The plasticity of clay is low to medium. The consistency is soft to very stiff.
7. Clayey SAND-B 7~19 (13)
The thickness is about 1.0 m to 6.0 m. The color is gray and the water content is moist. The grain size is fine to medium. The relative density is loose to medium dense.
8. Silty SAND-A 17~36 (25)
The thickness is about 3.0 m to 7.0 m. The color is gray and the water content is moist. The grain size is fine to medium grained. The relative density is medium dense to dense.
9. CLAY-AIII 11~35 (18)
The thickness is about 5.0 m to 23.0 m. The color is gray and the water content is moist. The plasticity is medium to high. The consistency is stiff to hard.
10. Clayey SAND-C 10~40 (20)
The thickness is 2.0 m to 19.0 m. The color is gray and the water content is moist. The grain size is fine to medium. The relative density is medium dense to dense.
11. Silty SAND-II 17~43 (30)
The thickness is about 3.0 m to 16.0 m. The color is gray and the water content is moist. The grain size is fine to medium. The relative density is medium dense to dense.
Irrawaddy Formation
12. Clayey SAND-I 24~50 (35)
The thickness is about 1.0 m to 8.0 m. The color is gray and reddish brown to yellowish brown in some depth. The water content is moist. The grain size is fine to medium.
13. CLAY-AIV 26~≧50
(30)
The thickness is about 6.0 m to 10.5 m. The color is gray and the water content is moist. The plasticity is low to medium. The consistency is very stiff to hard. Fine grain sand is included.
14. Clayey SAND-II 44~≧50
(50)
The thickness is more than 12.0 m. The color is yellowish brown. The grained size is fine to medium. The relative density is dense to very dense.
Source: JICA Study Team

Detailed Design Study on The Bago River Bridge Construction Project Final Report
2-16
Source: JICA Study Team
Figure 2.1.8 Distribution of SPT N-values for River Section

Detailed Design Study on The Bago River Bridge Construction Project Final Report
2-17
③ Right bank, Thaketa side (from BD-17 to BH-5 of 2013 report)
Seven different soil layers are confirmed in this area. Table 2.1.7 shows the soil stratigraphy.
Table 2.1.7 Soil Stratigraphy of the Survey Area (Thaketa Side)
Formation Soil Type N-Value
(Representative -Value)
Description
Alluvium
1. Filled Soil 3
(3)
The thickness is about 3.0 m. The color is brown, and the water content is low to moist. The plasticity is low to medium. The consistency is soft.
2. CLAY-I 0~5 (1)
The thickness is about 6.0 m to 10.0 m. The color is gray. The water content is moist to wet and the plasticity of low to high. The consistency is very soft to firm.
3. Silty SAND-I 4~30 (13)
The thickness is about 3.0 m to 9.0 m. The color is gray and the water content is moist to wet. The grain size is fine. The relative density is loose to medium dense.
4. Sandy SILT 5~7 (7)
The thickness is about 3.0 m. The water content is moist to wet, the plasticity is low to medium plasticity. The consistency is firm.
5. Silty SAND-II 13~47 (25)
The thickness is about 14.0 m to 19.0 m. The color is gray and the water content is moist. The grain size is fine to medium grained. The relative density is medium dense to dense.
Irrawaddy Formation
6. Clayey SAND-I 14~50 (35)
The thickness is about 7.0 m to 15.0 m. The color is gray and the water content is moist. The grain size is fine to medium grained. The relative density is medium dense to dense.
7. Clayey SAND-II ≧50 (50)
The thickness is more than 8.0 m. The color is yellowish brown to reddish brown and the water content is moist. The relative density is dense to very dense.
Source: JICA Study Team

Detailed Design Study on The Bago River Bridge Construction Project Final Report
2-18
Source: JICA Study Team
Figure 2.1.9 Distribution of SPT N-values for Thaketa Side
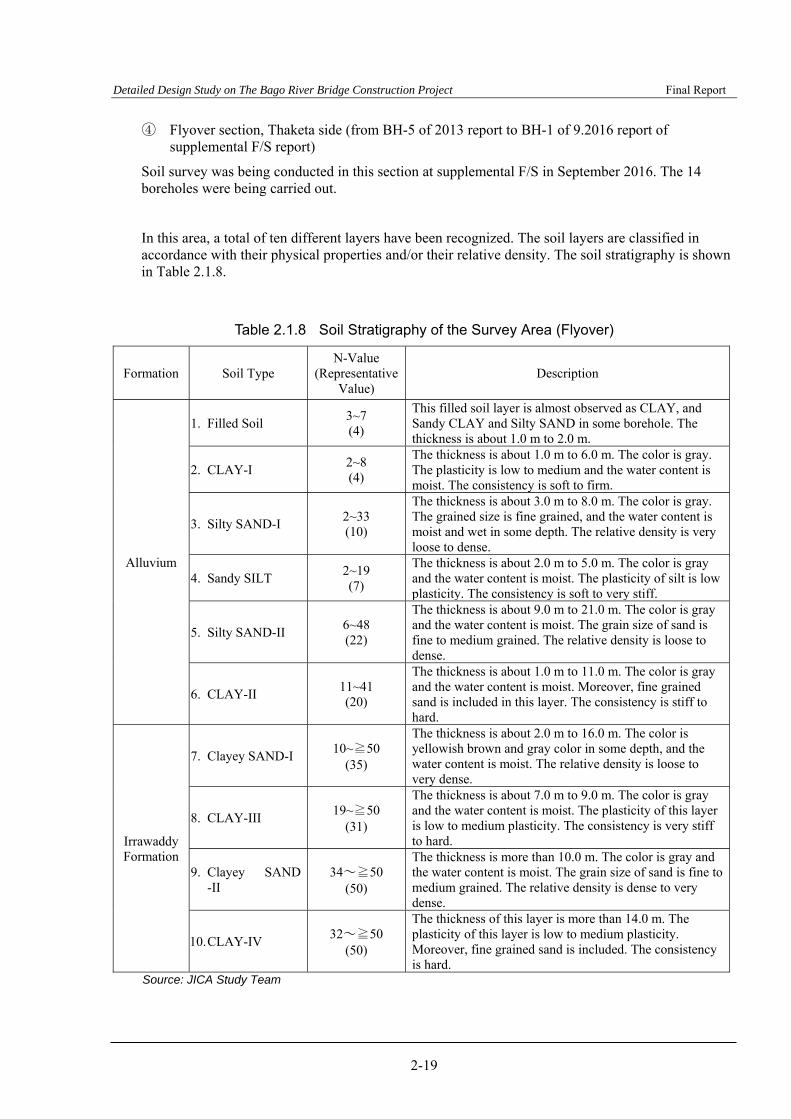
Detailed Design Study on The Bago River Bridge Construction Project Final Report
2-19
④ Flyover section, Thaketa side (from BH-5 of 2013 report to BH-1 of 9.2016 report of supplemental F/S report)
Soil survey was being conducted in this section at supplemental F/S in September 2016. The 14 boreholes were being carried out.
In this area, a total of ten different layers have been recognized. The soil layers are classified in accordance with their physical properties and/or their relative density. The soil stratigraphy is shown in Table 2.1.8.
Table 2.1.8 Soil Stratigraphy of the Survey Area (Flyover)
Formation Soil Type N-Value
(Representative Value)
Description
Alluvium
1. Filled Soil 3~7 (4)
This filled soil layer is almost observed as CLAY, and Sandy CLAY and Silty SAND in some borehole. The thickness is about 1.0 m to 2.0 m.
2. CLAY-I 2~8 (4)
The thickness is about 1.0 m to 6.0 m. The color is gray. The plasticity is low to medium and the water content is moist. The consistency is soft to firm.
3. Silty SAND-I 2~33 (10)
The thickness is about 3.0 m to 8.0 m. The color is gray. The grained size is fine grained, and the water content is moist and wet in some depth. The relative density is very loose to dense.
4. Sandy SILT 2~19 (7)
The thickness is about 2.0 m to 5.0 m. The color is gray and the water content is moist. The plasticity of silt is low plasticity. The consistency is soft to very stiff.
5. Silty SAND-II 6~48 (22)
The thickness is about 9.0 m to 21.0 m. The color is gray and the water content is moist. The grain size of sand is fine to medium grained. The relative density is loose to dense.
6. CLAY-II 11~41 (20)
The thickness is about 1.0 m to 11.0 m. The color is gray and the water content is moist. Moreover, fine grained sand is included in this layer. The consistency is stiff to hard.
Irrawaddy Formation
7. Clayey SAND-I 10~≧50
(35)
The thickness is about 2.0 m to 16.0 m. The color is yellowish brown and gray color in some depth, and the water content is moist. The relative density is loose to very dense.
8. CLAY-III 19~≧50
(31)
The thickness is about 7.0 m to 9.0 m. The color is gray and the water content is moist. The plasticity of this layer is low to medium plasticity. The consistency is very stiff to hard.
9. Clayey SAND -II
34~≧50 (50)
The thickness is more than 10.0 m. The color is gray and the water content is moist. The grain size of sand is fine to medium grained. The relative density is dense to very dense.
10. CLAY-IV 32~≧50
(50)
The thickness of this layer is more than 14.0 m. The plasticity of this layer is low to medium plasticity. Moreover, fine grained sand is included. The consistency is hard.
Source: JICA Study Team
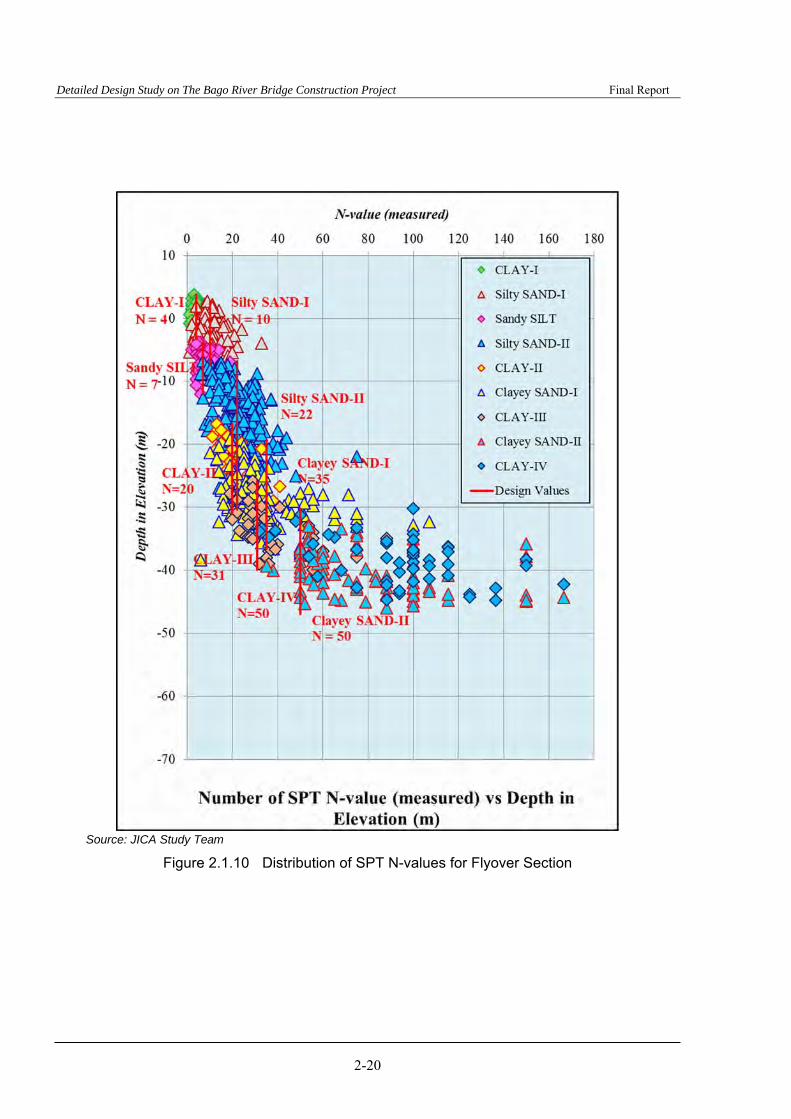
Detailed Design Study on The Bago River Bridge Construction Project Final Report
2-20
Source: JICA Study Team
Figure 2.1.10 Distribution of SPT N-values for Flyover Section
Detailed Design Study on The Bago River Bridge Construction Project Final Report
2-21
2.1.3 Soil Characteristics
(1) Policy of Geotechnical Design Parameter
Geotechnical parameters can be directly evaluated in many ways such as in situ and laboratory tests. Some of the design parameters could not be evaluated directly from field tests or laboratory tests due to the unfavorable nature of deposits or investigation methods. However, some parameters would be derived from other instrumental testing of past events and some mechanical and physical properties obtained from field and laboratory tests. In evaluating ground stability, shear strength parameters are significant.
The following is a basic policy for finding the ground design constants in the project.
However, ultimately, each design engineer of bridges and earthworks judges appropriate soil parameters in each field and applies it to the design.
- In principle, the geotechnical design parameters shall utilize the results of in situ testing and laboratory soil tests.
- As an empirical method, regarding the unit weight etc. refer to the geotechnical parameter of earthwork guidelines by Nippon Expressway Company (NEXCO) (08.2016). (Table 2.1.9).
- When obtaining the internal friction angle from the N value, use the effective overburden pressure shown in Japanese Specifications for Highway Bridge (JSHB) (2012 in Japanese version) and The Earthwork Guidelines (2012 in Japanese version). In the investigation stage, the internal friction angle is indicated in units of 1° and it is a policy to round down the decimal point.
- In the case of obtaining cohesion strength (Cu) from N value, qu = 12.3 N to 13.1 N ≈ 12.5 N (kN / m2) obtained from Terzaghi and Peck's method. (Geotechnical Society of Japan: Geological Survey Method and Commentary p 308, 3.2013). In addition, there is a relation of C = 6 to 10 N (kN / m2) of the Earthwork Guidelines (2012 edition, p 64, in Japanese version). For this time, we adopt the safety side from these relationships and set C = 6 N (kN / m2). In the investigation stage, cohesion strength is indicated in units of 1 kN, and it is a policy to devalue decimal places.
- Deformation modulus is set to Ep = 700 N (kN / m2) in Yoshinaka as a value corresponding to the loading test in the hole. (Geotechnical Society of Japan: Geological Survey Method and Commentary p 309, 3.2013). Deformation modulus shall be displayed in units of 100 kN and the policy is to devalue numbers less than 100.
- The value of pressure meter test should be corrected if it should be corrected with reference to the in-hole loading test result at the original position.
In the evaluation of the N value, when the N value is 50 or more, the converted N value is adopted. For the setting of the geotechnical parameter for each stratum, with regard to the average N value of 50 or more, consider the in homogeneity of the soil ground and set the N value = 50 as a guide for the upper limit.

Detailed Design Study on The Bago River Bridge Construction Project Final Report
2-22
Table 2.1.9 Recommended Soil Parameters by NEXCO
Source: JICA Study Team
Gravel Gravelly Sand
20 40 0{G}
(GW),(GP)
Well gradedone
20 35 0
Poor Gradedone
19 30 0
Silty SandClayed Sand
19 25 Less than 30{SF}
(SM)(SC)
SiltClay
18 15 Less than 50{M},{C}
(ML),(CL),(MH),(CH)
Kanto Loam 14 20 Less than 10{V}
20 40 0
18 35 0
21 40 0
19 35 0
20 35 0
18 30 0
19 30 Less than 30
17 25 0
18 25 Less than 50
17 20 Less than 30
16 15 Less than 15
17 20 Less than 50
16 15 Less than 30
14 10 Less than 15
Kanto Loam 14 5(φu) Less than 30{V}
Note *1): The standard of the N value ( Stiff one(N=8~15)、Firm one(N=4~8)、Soft one(N=2~4))
Note *2): The symbols of JGS and ASTM are approximate guidelines.
ASTM: American Society for Testing and Materials JGS: Japanese Geotechnical Society
---
Earthwork P1-52, First volume, Design Procedure by NEXCO (8.2016), NEXCO: (East, Central, West) Nippon Expressway Company Limited
SiltyClay
Stiff one *1)
{M},{C}(CH),(MH),(ML)
Firm one *1)
Soft one *1)
Sandy SiltSandy Clay
Stiff one *1)
{M},{C}(SM),(SC)
Firm one *1)
Soft one *1)
Not dense one
Silty SandClayed Sand
Dense one{SF}
(ML),(CL)
Not dens andPoor graded one
Sand
Dense orWell graded one {S}
(SM),(SC)
Not dense one
Gravelly Sand
Dense one{G}
(GW),(GP)
Not dens andPoor graded one
Compacted one
NaturalGround
Gravel
Dense orWell graded one {G}
(GW),(GP)
Compacted one
SandCompacted
one
{S}(SW)(SP)
FillMaterial
Compacted one
Compacted one
Soil Type Condition of Soil
Unitweight
γt
(kN/m3)
InternalFrictionAngle φ (°)
CohesionCu
(kN/m2)
Remarks *2)Symbol
of JGS{ }
and ASTM( )

Detailed Design Study on The Bago River Bridge Construction Project Final Report
2-23
(2) Geotechnical Design Parameters
Geological investigation section shall be separated into three parts such as left bank (Thanlyin side), in the river and right bank (Thaketa side) for consideration of geological design parameters. Existing soil profile from BH-5 of the 2013 report to BH-1 of the 2016 report of the supplemental F/S report will be used for reference at the flyover construction location at Thaketa side.
The geotechnical design parameters are compiled for each section.
In this project, pressure meter tests (PMT) were carried out at the project area. The correlation of PMT results and standard penetration test (SPT) N values are shown in Table 2.1.10.
Table 2.1.10 Correlation of SPT N-values and Pressure Meter Test Results
Side BH No. Layer Name
Depth(m)
NValue
Earth Pressure at Rest
Yield Pressure
Failure Pressure
Modulus of Elasticity
Em/N Value
Po (kN/m2)
Py (kN/m2)
Pf (kN/m2)
Em(kN/m2)
Borehole Persection
All
River
BD-03 Silty SAND 3 5 123.16 259.63 356.8 1955.44 391.09
397
672
BD-03 Silty SAND 6 3 103.28 140.27 261.34 882.76 294.25
BD-03 Silty SAND 10 2 154.8 290.04 363.08 901.66 450.83
BD-09 Silty SAND 3 4 73.84 197.82 344.59 1566.52 391.63
BD-09 Silty SAND 6 3 127.75 238.6 336.37 1017.73 339.24
BD-09 Silty SAND 10 18 179.19 752.74 378.82 6190.78 343.93
BD-10 Silty SAND 3 1 85.28 146.35 206.69 695.43 695.43
BD-10 Silty SAND 6 5 152.35 350.85 473.78 2103.07 420.61
BD-10 Silty SAND 10 10 166.66 290.91 437.95 2449.94 244.99
Right Bank
BD-14 CLAY 3 2 123.48 222.01 369.33 967.94 483.97 714
BD-14 CLAY 6 1 127.78 226.23 298.91 944.87 944.87
BD-14 Silty SAND 10 15 265.87 689.91 1013.04 7518.11 501.21 501
Left Bank
BD-20 CLAY 3 0(0.5) 85.26 146.42 219.26 734.67 1,469.34
1,099
BD-20 CLAY 6 1 114.53 212.85 273.62 993.08 993.08
BD-20 CLAY 10 2 154.81 416.27 588.08 3372.86 1,686.43
BD-23 CLAY 3 2 85.39 196.44 319.26 1225.4 612.70
BD-23 CLAY 6 0(0.5) 101.82 162.53 198.65 604.85 1,209.70
BD-23 CLAY 10 2 130.17 216.82 325.36 1244.05 622.03
Source: JICA Study Team
Remarks;
- In this calculation, SPT N-values were changed from 0 to 0.5 at 3.0 m at BD-14 and 6.0 m at BD-23.
- According to the testing results, the relationship between N value and pressure meter test satisfied Em = 672N ≒700N in Yoshinaka as a whole.
- Clay has confirmed Em = 700N or more on both banks. - Right Bank; Em = 714N ≈ (approximately equal to) 710N - Left Bank; Em = 1099N ≈ (approximately equal to) 1100N
Sandy soil has confirmed Em = 397 ~ 501 ≈ (approximately equal to) 400 ~ 500N - River Section

Detailed Design Study on The Bago River Bridge Construction Project Final Report
2-24
For geotechnical design parameters selection, Em = 397N ≈ (approximately equal to) 400N is used for the silty sand-river sediments layer. Similarly, clayey SAND-A and Silty SAND-I layer are used same as Em = 400N for this project. Another Soils are used Em = 700N Right Bank
For geotechnical design parameters selection, Em = 501N ≈ (approximately equal to) 500N is used for Silty SAND-I layer for this project. Another Soils are used Em= 700N for safety side.
Left Bank
For geotechnical design parameters selection, Em = 1099N ≈ (approximately equal to) 1100N for CLAY-I layer. However, the range is largely varying from 612N ~1686N. Therefore, Em = 700N is used for safety side.
Em values were selected from unconfined compression test results for some clay layers.

Detailed Design Study on The Bago River Bridge Construction Project Final Report
2-25
The following shows the geotechnical design parameters proposed by the soil survey.
① Left bank, Thanlyin side (from BD-25 to BH-2 of 2013 report)
Table 2.1.11 shows the proposed geotechnical design parameters for Thanlyin side.
Table 2.1.11 Proposed Geotechnical Design Parameters for Thanlyin Side
No. Soil Name Representative
N Value
Unit Weight Internal Friction Angle
Cohesive Strength
Deformation Modulus
γt
(kN/m3)
γsat
(kN/m3)
γ'
(kN/m3)
φ (°)
c
(kN/m2)
E50
(kN/m2)
1 Filled Soil 11) 18.02) 18.0 8.0 - 63) 7003)
2 CLAY-I 11) 17.51) 17.5 7.5 - 151) 9001)
3 Sandy CLAY-I 31) 17.51) 17.5 7.5 - 151) 20001)
4 Silty SAND-I 151) 16.51) 17.5 7.5 333) - 60003)
5 Clayey SAND-A 31) 17.02) 18.0 8.0 283) - 12003)
6 CLAY-AII 51) 17.51) 17.5 7.5 - 301) 32001)
7 Clayey SAND-B 171) 17.02) 18.0 8.0 333) - 119003)
8 CLAY-AIII 71) 17.61) 17.6 7.6 - 423) 49001)
9 Clayey SAND-C 201) 17.02) 18.0 8.0 323) - 140003)
10 Clayey SAND-I 231) 17.02) 18.0 8.0 313) - 161003)
11 Clayey SAND-II 501) 19.02) 20.0 10.0 353) - 350003)
1) These values were set up by field test or soil laboratory test result. 2) These values were set up by the reference value shown in NEXCO. 3) These values were set up by formula of SPTN-value. 4) These values were set up by formula.
Source: JICA Study Team
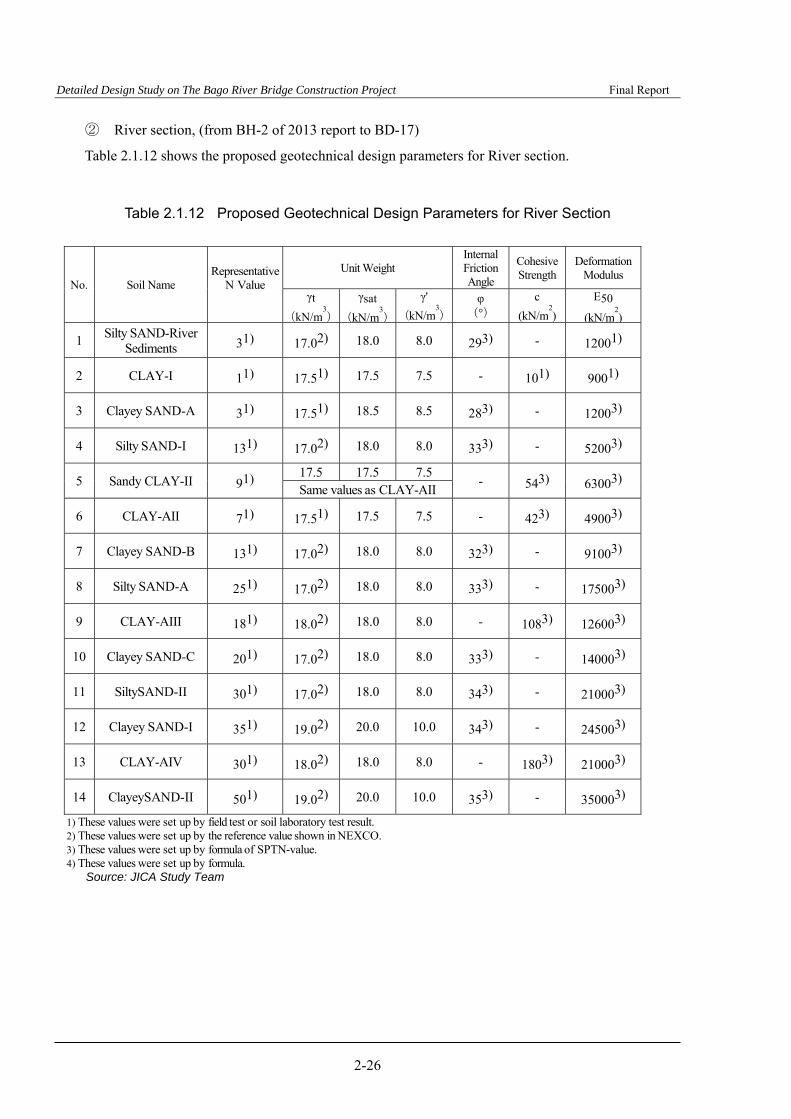
Detailed Design Study on The Bago River Bridge Construction Project Final Report
2-26
② River section, (from BH-2 of 2013 report to BD-17)
Table 2.1.12 shows the proposed geotechnical design parameters for River section.
Table 2.1.12 Proposed Geotechnical Design Parameters for River Section
No. Soil Name Representative
N Value
Unit Weight Internal Friction Angle
Cohesive Strength
Deformation Modulus
γt
(kN/m3)
γsat
(kN/m3)
γ'
(kN/m3)
φ (°)
c
(kN/m2)
E50
(kN/m2)
1 Silty SAND-River
Sediments 31) 17.02) 18.0 8.0 293) - 12001)
2 CLAY-I 11) 17.51) 17.5 7.5 - 101) 9001)
3 Clayey SAND-A 31) 17.51) 18.5 8.5 283) - 12003)
4 Silty SAND-I 131) 17.02) 18.0 8.0 333) - 52003)
5 Sandy CLAY-II 91) 17.5 17.5 7.5 - 543) 63003) Same values as CLAY-AII
6 CLAY-AII 71) 17.51) 17.5 7.5 - 423) 49003)
7 Clayey SAND-B 131) 17.02) 18.0 8.0 323) - 91003)
8 Silty SAND-A 251) 17.02) 18.0 8.0 333) - 175003)
9 CLAY-AIII 181) 18.02) 18.0 8.0 - 1083) 126003)
10 Clayey SAND-C 201) 17.02) 18.0 8.0 333) - 140003)
11 SiltySAND-II 301) 17.02) 18.0 8.0 343) - 210003)
12 Clayey SAND-I 351) 19.02) 20.0 10.0 343) - 245003)
13 CLAY-AIV 301) 18.02) 18.0 8.0 - 1803) 210003)
14 ClayeySAND-II 501) 19.02) 20.0 10.0 353) - 350003)
1) These values were set up by field test or soil laboratory test result. 2) These values were set up by the reference value shown in NEXCO. 3) These values were set up by formula of SPTN-value. 4) These values were set up by formula.
Source: JICA Study Team

Detailed Design Study on The Bago River Bridge Construction Project Final Report
2-27
③ Right bank, Thaketa side (from BD-17 to BH-5 of 2013 report)
Table 2.1.13 shows the proposed geotechnical design parameters for Thaketa aide.
Table 2.1.13 Proposed Geotechnical Design Parameters for Thaketa Side
No. Soil Name Representative
N Value
Unit Weight Internal Friction Angle
Cohesive Strength
Deformation Modulus
γt
(kN/m3)
γsat
(kN/m3)
γ'
(kN/m3)
φ (°)
c
(kN/m2)
E50
(kN/m2)
1 Filled Soil 31) 19.02) 20.0 10.0 - 183) 21003)
2 CLAY-I 11) 17.51) 17.5 7.5 - 151) 9001)
3 Silty SAND-I 131) 17.02) 18.0 8.0 323) - 65003)
4 Sandy SILT 71) 17.02) 17.0 7.0 - 423) 49003)
5 Silty SAND-II 251) 17.02) 18.0 8.0 343) - 175003)
6 Clayey SAND-I 351) 19.02) 20.0 10.0 343) - 245003)
7 Clayey SAND-II 501) 19.02) 20.0 10.0 353) - 350003)
1) These values were set up by field test or soil laboratory test result. 2) These values were set up by the reference value shown in NEXCO. 3) These values were set up by formula of SPTN-value. 4) These values were set up by formula.
Source: JICA Study Team
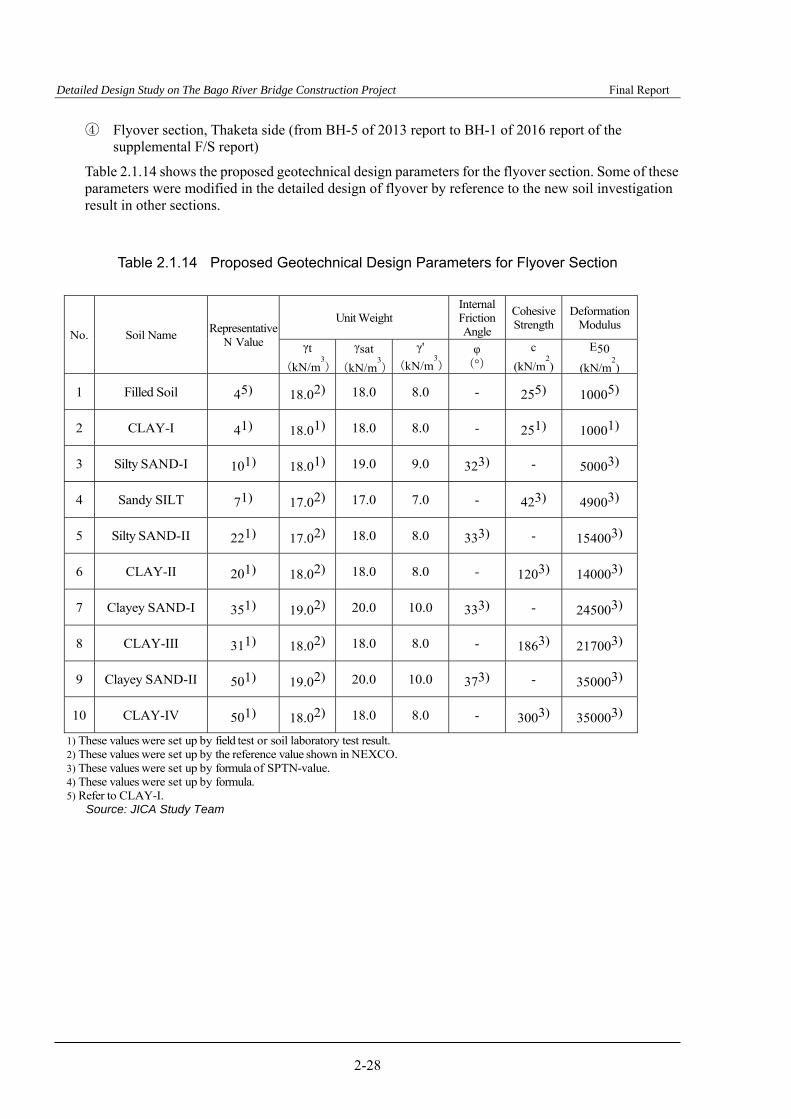
Detailed Design Study on The Bago River Bridge Construction Project Final Report
2-28
④ Flyover section, Thaketa side (from BH-5 of 2013 report to BH-1 of 2016 report of the supplemental F/S report)
Table 2.1.14 shows the proposed geotechnical design parameters for the flyover section. Some of these parameters were modified in the detailed design of flyover by reference to the new soil investigation result in other sections.
Table 2.1.14 Proposed Geotechnical Design Parameters for Flyover Section
No. Soil Name Representative
N Value
Unit Weight Internal Friction Angle
Cohesive Strength
Deformation Modulus
γt
(kN/m3)
γsat
(kN/m3)
γ'
(kN/m3)
φ (°)
c
(kN/m2)
E50
(kN/m2)
1 Filled Soil 45) 18.02) 18.0 8.0 - 255) 10005)
2 CLAY-I 41) 18.01) 18.0 8.0 - 251) 10001)
3 Silty SAND-I 101) 18.01) 19.0 9.0 323) - 50003)
4 Sandy SILT 71) 17.02) 17.0 7.0 - 423) 49003)
5 Silty SAND-II 221) 17.02) 18.0 8.0 333) - 154003)
6 CLAY-II 201) 18.02) 18.0 8.0 - 1203) 140003)
7 Clayey SAND-I 351) 19.02) 20.0 10.0 333) - 245003)
8 CLAY-III 311) 18.02) 18.0 8.0 - 1863) 217003)
9 Clayey SAND-II 501) 19.02) 20.0 10.0 373) - 350003)
10 CLAY-IV 501) 18.02) 18.0 8.0 - 3003) 350003)
1) These values were set up by field test or soil laboratory test result. 2) These values were set up by the reference value shown in NEXCO. 3) These values were set up by formula of SPTN-value. 4) These values were set up by formula. 5) Refer to CLAY-I.
Source: JICA Study Team

Detailed Design Study on The Bago River Bridge Construction Project Final Report
2-29
(3) Summary of Soil Survey Results
1) Ground Conditions and Bearing Layer
Based on the survey results, 20 different soil layers including the flyover section were recognized in the design section of this area. For each section, 11 soil layers in the Thanlyin section, 14 soil layers in the river section, 7 soil layers in the Taketa section, and 10 soil layers in the flyover section have been confirmed, as shown in Table 2.1.15.
In the survey area, river sediments are distributed along the Bago River. The soil constitution is greatly changed in the alluvium distributed under this river sediment.
Cohesive soil dominates from the left bank of Thanlyin side to the right bank side of the Bago River, and is characterized by sandy soil prominent from the right bank side of the river section to the right bank of Thaketa side. The sedimentary relationship of cohesive soil and sandy soil of alluvium is considered to be largely interfinger relationship at this stage.
As the proposed bridge is designed with heavy and dynamic load and large spans, the pier foundation is designed generally as pile foundation according to soil conditions at site.
According to the survey results, the soil layers with N values of 50 or more correspond roughly to the distribution range of the Clayey SAND - II layer of the surveyed area and the CLAY - IV layer of the flyover area.
As bearing layer for the design of this project, we propose the following values according to JSHB (Substructure Edition, Japan Road Association, 2012, pp.278-279). Figures 2.1.11 to 2.1.13 show the soil profiles including the bearing layer line.
<Bearing Layer>
Sand Layer: N value of 30 or more (Clayey SAND-II) Cohesive Soil Layer: N value of 20 or more (CLAY-AIV, CLAY-III, CLAY-IV)
In addition, Clayey SAND – I distributed from the right bank of the river bed to the Taketa area was evaluated as a provisional bearing layer, since N values of 30 or more were continuously confirmed.
As the foundation surface for earthquake-resistant design, N value of 25 or more in the cohesive soil layer is required and N value of 50 or more in the sandy soil layer, so the bearing line shown in Figure 2.1.11 ~ Figure 2.1.13 roughly coincides with the foundation surface line. (“JSHB” - Earthquake Resistant Edition, Japan Road Association, 2012, p.33)

Detailed Design Study on The Bago River Bridge Construction Project Final Report
2-30
Table 2.1.15 Different Soil Layers of Each Section
Source: JICA Study Team
Thanlyin River Thaketa Flyover(Thaketa)
BD-25~(13)BH-2 (13)BH-2~BD-17 BD-17~(13)BH-5 (13)BH-5~(16)BH-1
Silty SAND- River Sediments
Filled Soil Filled Soil Filled Soil
CLAY-I CLAY-I CLAY-I CLAY-I
Sandy CLAY-I
Clayey SAND-A Clayey SAND-A
Silty SAND-I Silty SAND-I Silty SAND-I Silty SAND-I
Sandy SILT Sandy SILT
Sandy CLAY-II
CLAY-AII CLAY-AII
Clayey SAND-B Clayey SAND-B
Silty SAND-A
CLAY-AIII CLAY-AIII
Clayey SAND-C Clayey SAND-C
Silty SAND-II Silty SAND-II Silty SAND-II
CLAY-II
Clayey SAND-I Clayey SAND-I Clayey SAND-I Clayey SAND-I
CLAY-AIV
CLAY-III
Clayey SAND-II Clayey SAND-II Clayey SAND-II Clayey SAND-II
CLAY-IV
Formation
Section ( Soil name for each section)
Alluvium
Irrawaddy Formation

Detailed Design Study on The Bago River Bridge Construction Project Final Report
2-31
Source: JICA Study Team
Figure 2.1.11 Soil Profile with Bearing Layer (1/3)
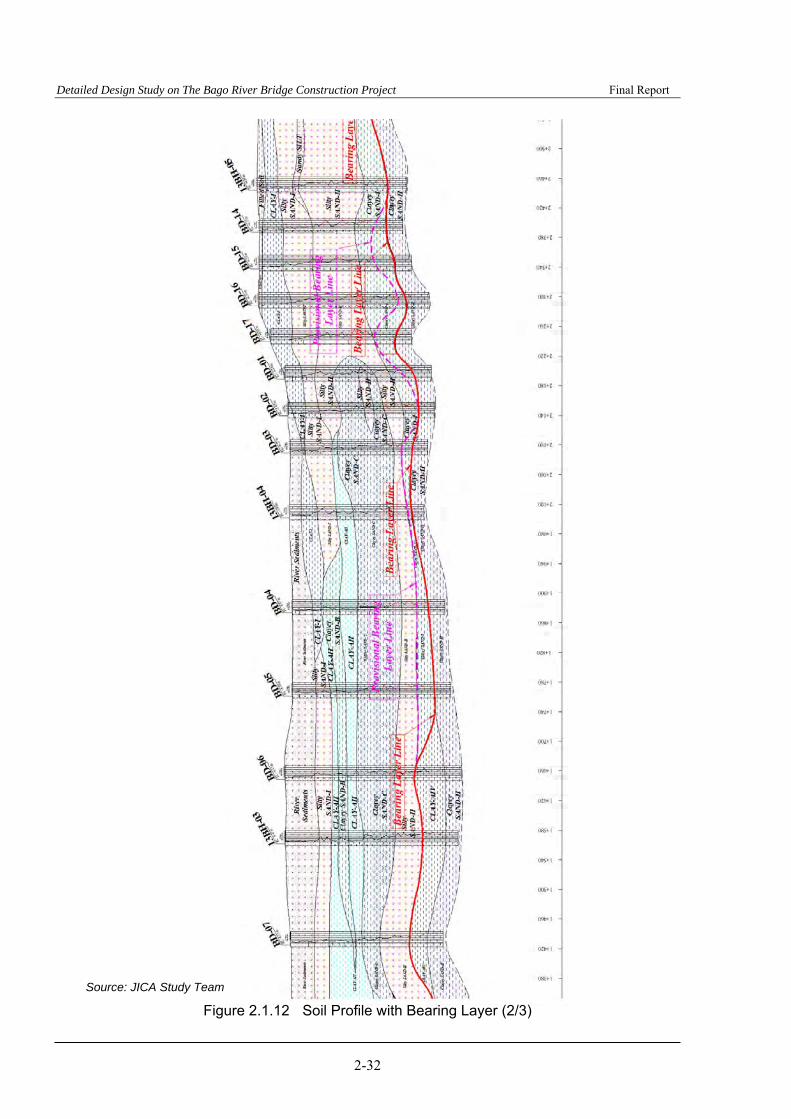
Detailed Design Study on The Bago River Bridge Construction Project Final Report
2-32
Source: JICA Study Team
Figure 2.1.12 Soil Profile with Bearing Layer (2/3)
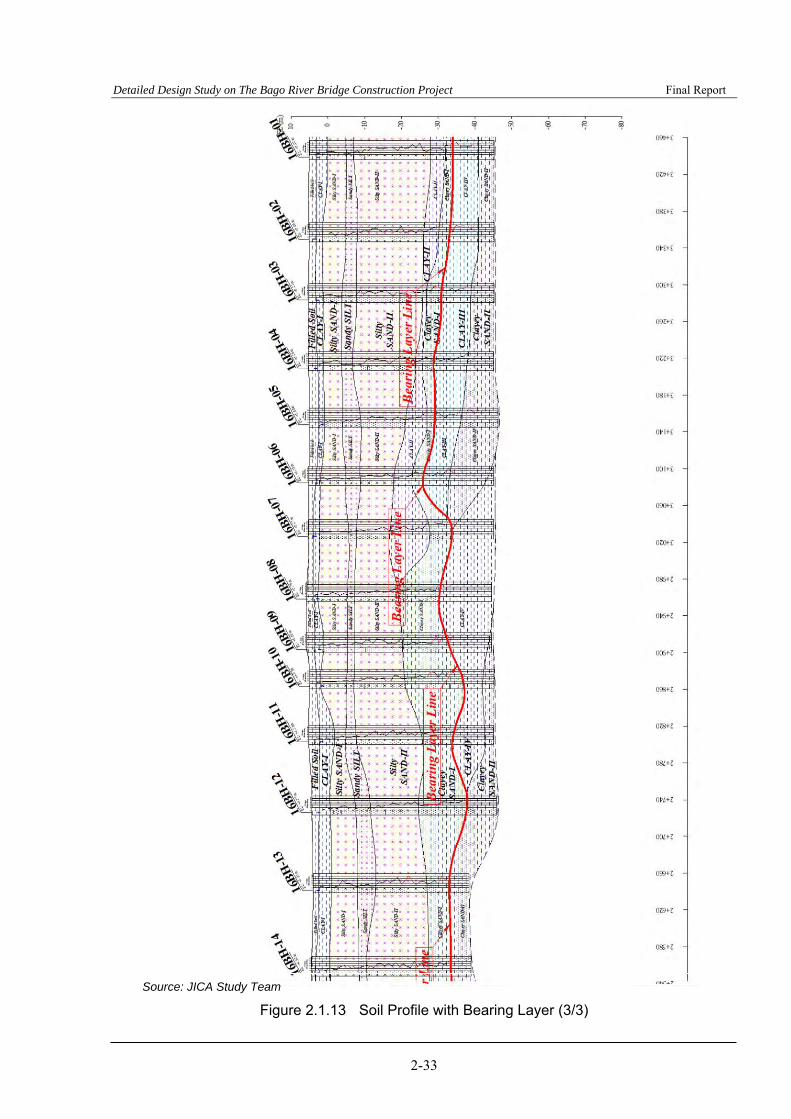
Detailed Design Study on The Bago River Bridge Construction Project Final Report
2-33
Source: JICA Study Team
Figure 2.1.13 Soil Profile with Bearing Layer (3/3)
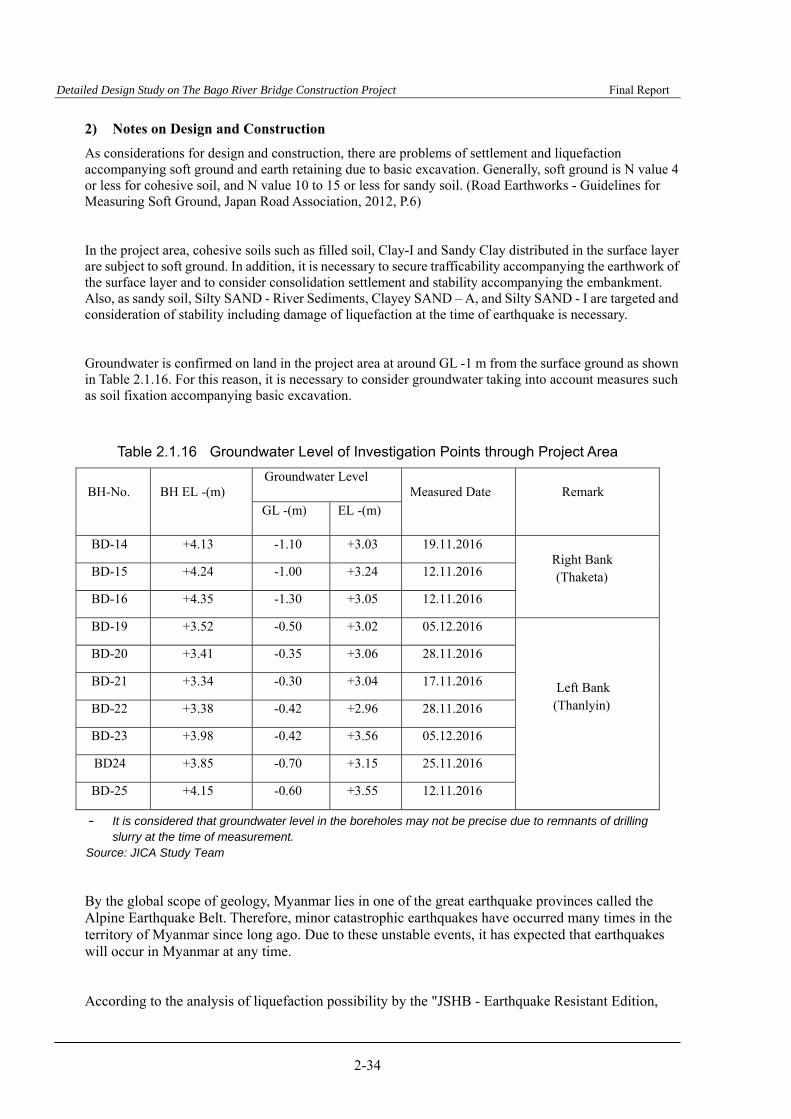
Detailed Design Study on The Bago River Bridge Construction Project Final Report
2-34
2) Notes on Design and Construction
As considerations for design and construction, there are problems of settlement and liquefaction accompanying soft ground and earth retaining due to basic excavation. Generally, soft ground is N value 4 or less for cohesive soil, and N value 10 to 15 or less for sandy soil. (Road Earthworks - Guidelines for Measuring Soft Ground, Japan Road Association, 2012, P.6)
In the project area, cohesive soils such as filled soil, Clay-I and Sandy Clay distributed in the surface layer are subject to soft ground. In addition, it is necessary to secure trafficability accompanying the earthwork of the surface layer and to consider consolidation settlement and stability accompanying the embankment. Also, as sandy soil, Silty SAND - River Sediments, Clayey SAND – A, and Silty SAND - I are targeted and consideration of stability including damage of liquefaction at the time of earthquake is necessary.
Groundwater is confirmed on land in the project area at around GL -1 m from the surface ground as shown in Table 2.1.16. For this reason, it is necessary to consider groundwater taking into account measures such as soil fixation accompanying basic excavation.
Table 2.1.16 Groundwater Level of Investigation Points through Project Area
BH-No.
BH EL -(m)
Groundwater Level Measured Date
Remark
GL -(m) EL -(m)
BD-14 +4.13 -1.10 +3.03 19.11.2016 Right Bank (Thaketa) BD-15 +4.24 -1.00 +3.24 12.11.2016
BD-16 +4.35 -1.30 +3.05 12.11.2016
BD-19 +3.52 -0.50 +3.02 05.12.2016
Left Bank (Thanlyin)
BD-20 +3.41 -0.35 +3.06 28.11.2016
BD-21 +3.34 -0.30 +3.04 17.11.2016
BD-22 +3.38 -0.42 +2.96 28.11.2016
BD-23 +3.98 -0.42 +3.56 05.12.2016
BD24 +3.85 -0.70 +3.15 25.11.2016
BD-25 +4.15 -0.60 +3.55 12.11.2016
- It is considered that groundwater level in the boreholes may not be precise due to remnants of drilling slurry at the time of measurement.
Source: JICA Study Team
By the global scope of geology, Myanmar lies in one of the great earthquake provinces called the Alpine Earthquake Belt. Therefore, minor catastrophic earthquakes have occurred many times in the territory of Myanmar since long ago. Due to these unstable events, it has expected that earthquakes will occur in Myanmar at any time.
According to the analysis of liquefaction possibility by the "JSHB - Earthquake Resistant Edition,
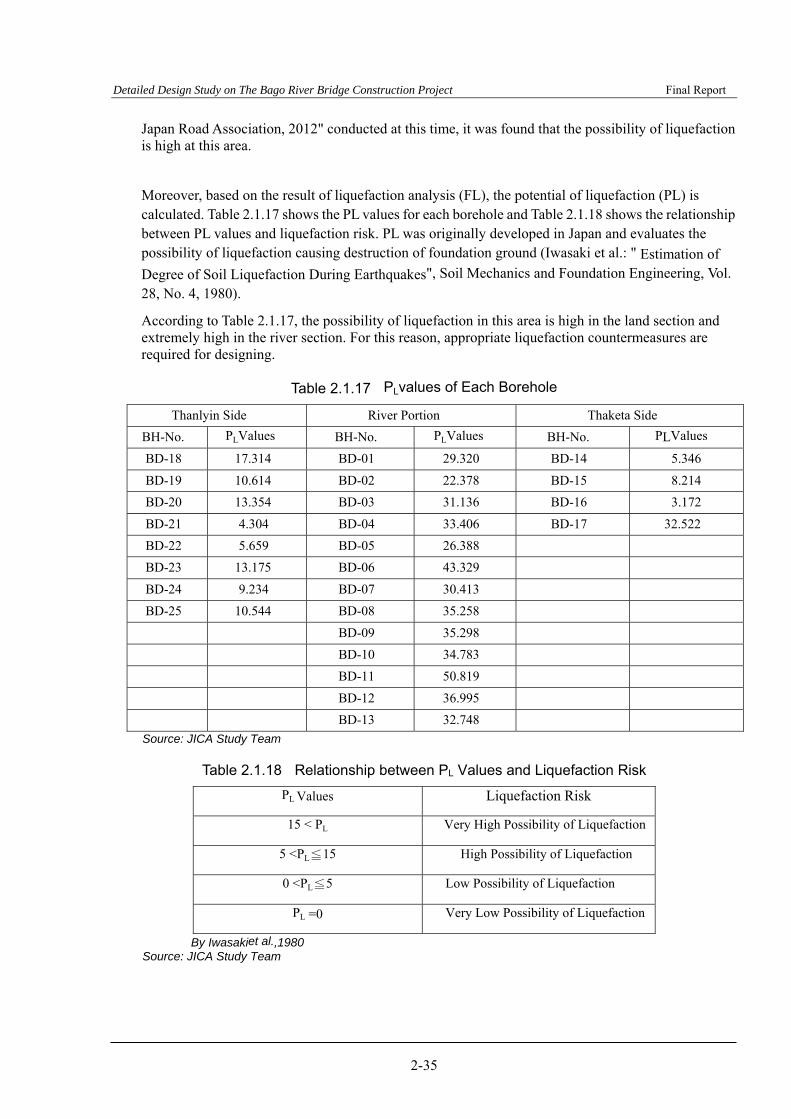
Detailed Design Study on The Bago River Bridge Construction Project Final Report
2-35
Japan Road Association, 2012" conducted at this time, it was found that the possibility of liquefaction is high at this area.
Moreover, based on the result of liquefaction analysis (FL), the potential of liquefaction (PL) is calculated. Table 2.1.17 shows the PL values for each borehole and Table 2.1.18 shows the relationship between PL values and liquefaction risk. PL was originally developed in Japan and evaluates the possibility of liquefaction causing destruction of foundation ground (Iwasaki et al.: " Estimation of
Degree of Soil Liquefaction During Earthquakes", Soil Mechanics and Foundation Engineering, Vol.
28, No. 4, 1980).
According to Table 2.1.17, the possibility of liquefaction in this area is high in the land section and extremely high in the river section. For this reason, appropriate liquefaction countermeasures are required for designing.
Table 2.1.17 PLvalues of Each Borehole
Thanlyin Side River Portion Thaketa Side
BH-No. PLValues BH-No. PLValues BH-No. PLValues
BD-18 17.314 BD-01 29.320 BD-14 5.346
BD-19 10.614 BD-02 22.378 BD-15 8.214
BD-20 13.354 BD-03 31.136 BD-16 3.172
BD-21 4.304 BD-04 33.406 BD-17 32.522
BD-22 5.659 BD-05 26.388
BD-23 13.175 BD-06 43.329
BD-24 9.234 BD-07 30.413
BD-25 10.544 BD-08 35.258
BD-09 35.298
BD-10 34.783
BD-11 50.819
BD-12 36.995
BD-13 32.748
Source: JICA Study Team
Table 2.1.18 Relationship between PL Values and Liquefaction Risk
PL Values Liquefaction Risk
15 < PL Very High Possibility of Liquefaction
5 <PL≦15 High Possibility of Liquefaction
0 <PL≦5 Low Possibility of Liquefaction
PL =0 Very Low Possibility of Liquefaction
By Iwasakiet al.,1980 Source: JICA Study Team
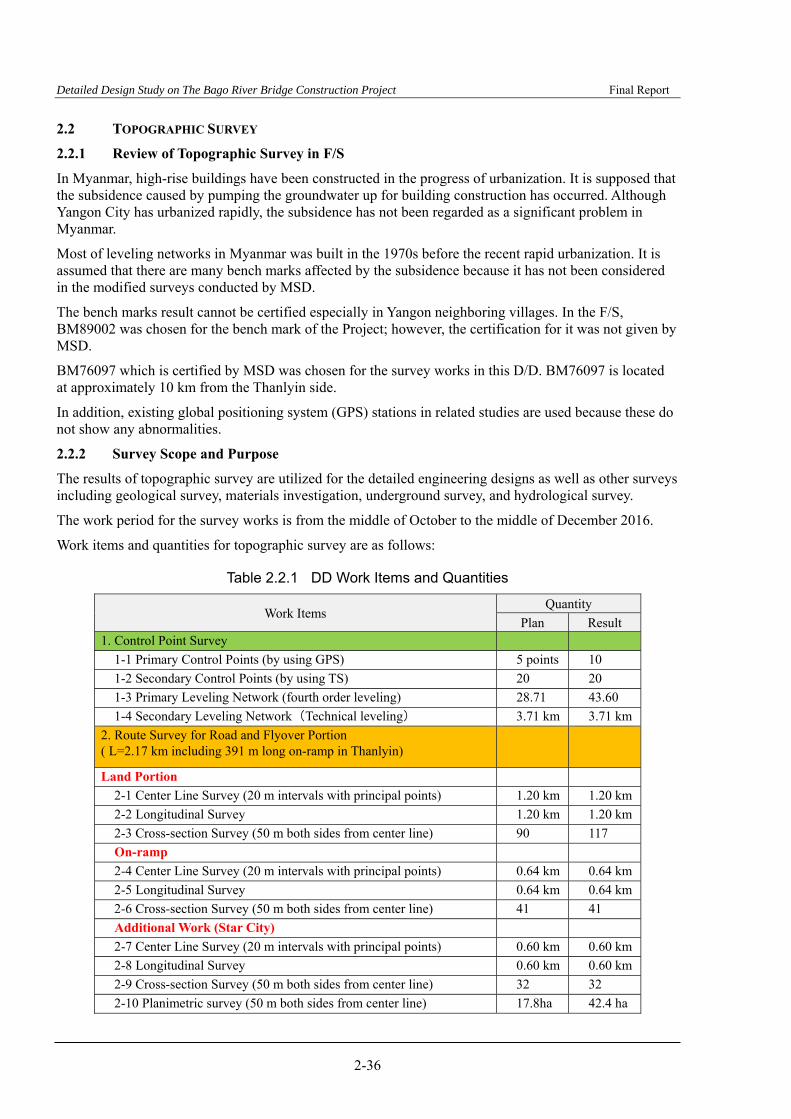
Detailed Design Study on The Bago River Bridge Construction Project Final Report
2-36
2.2 TOPOGRAPHIC SURVEY
2.2.1 Review of Topographic Survey in F/S
In Myanmar, high-rise buildings have been constructed in the progress of urbanization. It is supposed that the subsidence caused by pumping the groundwater up for building construction has occurred. Although Yangon City has urbanized rapidly, the subsidence has not been regarded as a significant problem in Myanmar.
Most of leveling networks in Myanmar was built in the 1970s before the recent rapid urbanization. It is assumed that there are many bench marks affected by the subsidence because it has not been considered in the modified surveys conducted by MSD.
The bench marks result cannot be certified especially in Yangon neighboring villages. In the F/S, BM89002 was chosen for the bench mark of the Project; however, the certification for it was not given by MSD.
BM76097 which is certified by MSD was chosen for the survey works in this D/D. BM76097 is located at approximately 10 km from the Thanlyin side.
In addition, existing global positioning system (GPS) stations in related studies are used because these do not show any abnormalities.
2.2.2 Survey Scope and Purpose
The results of topographic survey are utilized for the detailed engineering designs as well as other surveys including geological survey, materials investigation, underground survey, and hydrological survey.
The work period for the survey works is from the middle of October to the middle of December 2016.
Work items and quantities for topographic survey are as follows:
Table 2.2.1 DD Work Items and Quantities
Work Items Quantity
Plan Result 1. Control Point Survey
1-1 Primary Control Points (by using GPS) 5 points 10
1-2 Secondary Control Points (by using TS) 20 20
1-3 Primary Leveling Network (fourth order leveling) 28.71 43.60
1-4 Secondary Leveling Network (Technical leveling) 3.71 km 3.71 km
2. Route Survey for Road and Flyover Portion ( L=2.17 km including 391 m long on-ramp in Thanlyin)
Land Portion
2-1 Center Line Survey (20 m intervals with principal points) 1.20 km 1.20 km
2-2 Longitudinal Survey 1.20 km 1.20 km
2-3 Cross-section Survey (50 m both sides from center line) 90 117
On-ramp
2-4 Center Line Survey (20 m intervals with principal points) 0.64 km 0.64 km
2-5 Longitudinal Survey 0.64 km 0.64 km
2-6 Cross-section Survey (50 m both sides from center line) 41 41
Additional Work (Star City)
2-7 Center Line Survey (20 m intervals with principal points) 0.60 km 0.60 km
2-8 Longitudinal Survey 0.60 km 0.60 km
2-9 Cross-section Survey (50 m both sides from center line) 32 32
2-10 Planimetric survey (50 m both sides from center line) 17.8ha 42.4 ha
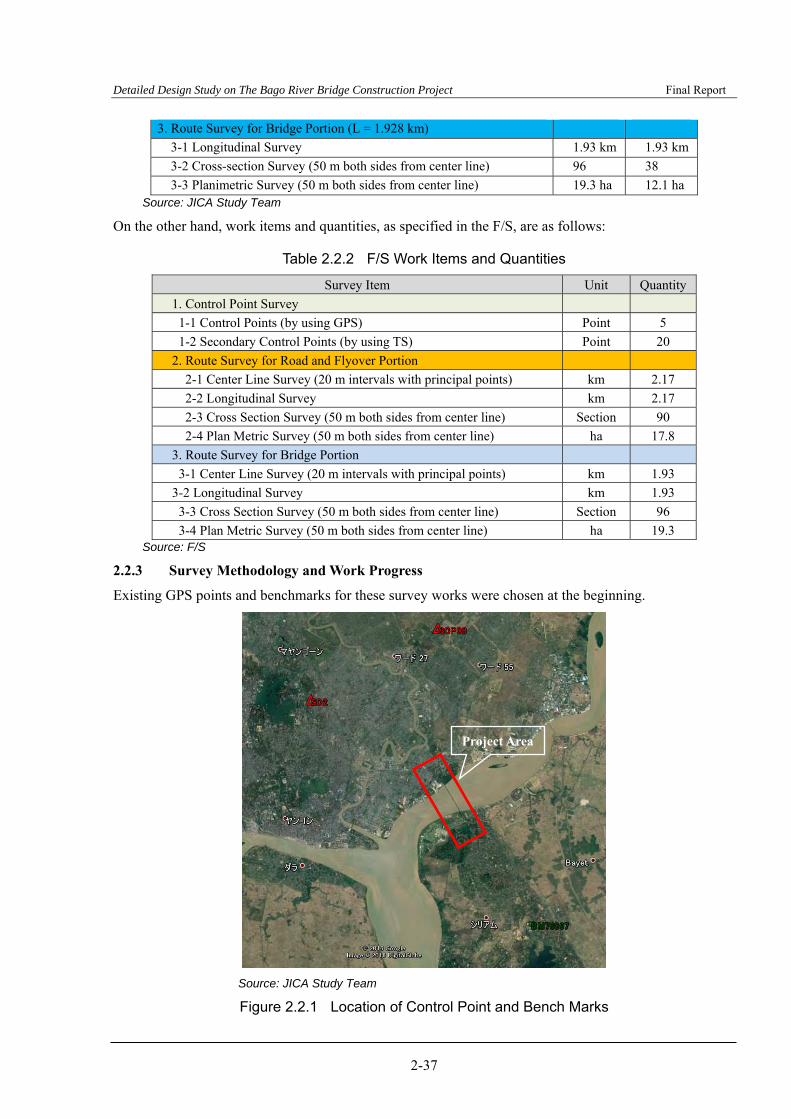
Detailed Design Study on The Bago River Bridge Construction Project Final Report
2-37
3. Route Survey for Bridge Portion (L = 1.928 km)
3-1 Longitudinal Survey 1.93 km 1.93 km
3-2 Cross-section Survey (50 m both sides from center line) 96 38
3-3 Planimetric Survey (50 m both sides from center line) 19.3 ha 12.1 ha Source: JICA Study Team
On the other hand, work items and quantities, as specified in the F/S, are as follows:
Table 2.2.2 F/S Work Items and Quantities
Survey Item Unit Quantity
1. Control Point Survey
1-1 Control Points (by using GPS) Point 5
1-2 Secondary Control Points (by using TS) Point 20
2. Route Survey for Road and Flyover Portion
2-1 Center Line Survey (20 m intervals with principal points) km 2.17
2-2 Longitudinal Survey km 2.17
2-3 Cross Section Survey (50 m both sides from center line) Section 90
2-4 Plan Metric Survey (50 m both sides from center line) ha 17.8
3. Route Survey for Bridge Portion
3-1 Center Line Survey (20 m intervals with principal points) km 1.93
3-2 Longitudinal Survey km 1.93
3-3 Cross Section Survey (50 m both sides from center line) Section 96
3-4 Plan Metric Survey (50 m both sides from center line) ha 19.3 Source: F/S
2.2.3 Survey Methodology and Work Progress
Existing GPS points and benchmarks for these survey works were chosen at the beginning.
Source: JICA Study Team
Figure 2.2.1 Location of Control Point and Bench Marks
Project Area

Detailed Design Study on The Bago River Bridge Construction Project Final Report
2-38
Coordinate systems generally adopted in Myanmar at present are as follows:
Table 2.2.3 Coordinate Reference Systems
Ellipsoid WGS84 (World Geodetic System 1984)
Projection Universal Transverse Mercator (UTM) Projection
UTM Zone Zone number 47N
Central of Meridian Origin 99 degrees east of Meridian International
Latitude of Origin Equator
Scale Factor at Origin 0.9996
False Easting (0,500,000) at the Equator
Vertical Datum BM height adopted by Myanmar Survey Department
Unit of Measurement meter
EPSG 3247(WGS84 UTM coordinates. 47)
Source: JICA Study Team
The tolerance of primary control point survey, secondary control point survey, primary leveling, and the secondary leveling in the survey are as follows:
- Primary control point survey Third order control points or higher
Residual of Base line 20 mm
Circuit closure error of horizontal position 100 mm + 40 mm√N
:N Number of minimum sides to Existing point
Standard deviation of horizontal position 100 mm
- Secondary control points Fourth order control points
Circuit closure error of horizontal position 150 mm + 100 mm√NΣS
:N Number of sides
:ΣS Total distance of route ( )km
- Primary leveling 20√S mm
:S ( )Total distance of route km
- Secondary leveling 30√S mm
:S ( )Total distance of route km
Existing control points and bench marks used for the survey are as follows: (see Appendix-1)
- Control Point:GPS08 and SD2 - Bench mark:BM7609
A control point survey was carried out by the following technique:

Detailed Design Study on The Bago River Bridge Construction Project Final Report
2-39
- Ten primary control points in the horizontal position were observed by GPS and the elevation by direct leveling.
- Twenty secondary control points in the horizontal position were observed by using the Total Station (TS) and elevation by direct leveling.
2.2.4 Control Point Survey
Five primary control points as well as a supplementary control point in each were installed to average out in the survey area. The total number of primary control points is ten.
The secondary control point was measured based on the primary control point and placed at 20 points in the whole area.
The locations and results of the primary and secondary control points are as follows:
Source: JICA Study Team
Figure 2.2.2 Location of Primary Control Points
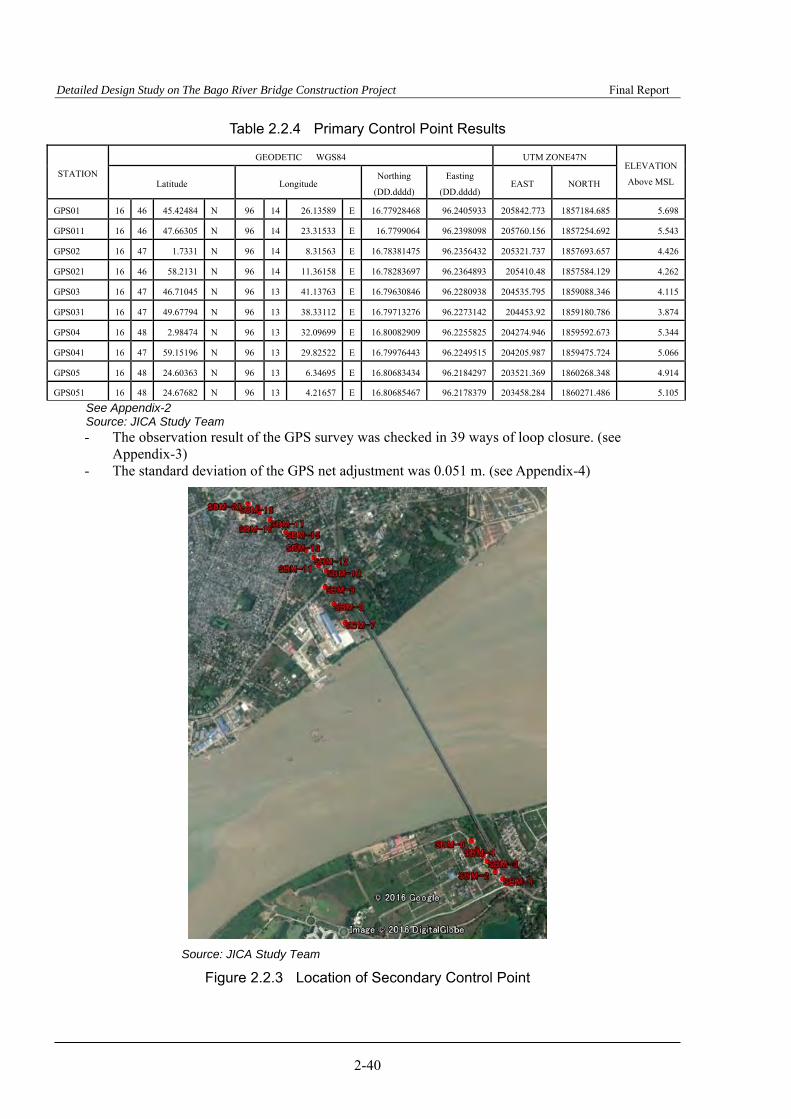
Detailed Design Study on The Bago River Bridge Construction Project Final Report
2-40
Table 2.2.4 Primary Control Point Results
STATION
GEODETIC WGS84 UTM ZONE47N ELEVATION
Above MSL Latitude Longitude Northing
(DD.dddd)
Easting (DD.dddd)
EAST NORTH
GPS01 16 46 45.42484 N 96 14 26.13589 E 16.77928468 96.2405933 205842.773 1857184.685 5.698
GPS011 16 46 47.66305 N 96 14 23.31533 E 16.7799064 96.2398098 205760.156 1857254.692 5.543
GPS02 16 47 1.7331 N 96 14 8.31563 E 16.78381475 96.2356432 205321.737 1857693.657 4.426
GPS021 16 46 58.2131 N 96 14 11.36158 E 16.78283697 96.2364893 205410.48 1857584.129 4.262
GPS03 16 47 46.71045 N 96 13 41.13763 E 16.79630846 96.2280938 204535.795 1859088.346 4.115
GPS031 16 47 49.67794 N 96 13 38.33112 E 16.79713276 96.2273142 204453.92 1859180.786 3.874
GPS04 16 48 2.98474 N 96 13 32.09699 E 16.80082909 96.2255825 204274.946 1859592.673 5.344
GPS041 16 47 59.15196 N 96 13 29.82522 E 16.79976443 96.2249515 204205.987 1859475.724 5.066
GPS05 16 48 24.60363 N 96 13 6.34695 E 16.80683434 96.2184297 203521.369 1860268.348 4.914
GPS051 16 48 24.67682 N 96 13 4.21657 E 16.80685467 96.2178379 203458.284 1860271.486 5.105
See Appendix-2 Source: JICA Study Team - The observation result of the GPS survey was checked in 39 ways of loop closure. (see
Appendix-3) - The standard deviation of the GPS net adjustment was 0.051 m. (see Appendix-4)
Source: JICA Study Team
Figure 2.2.3 Location of Secondary Control Point
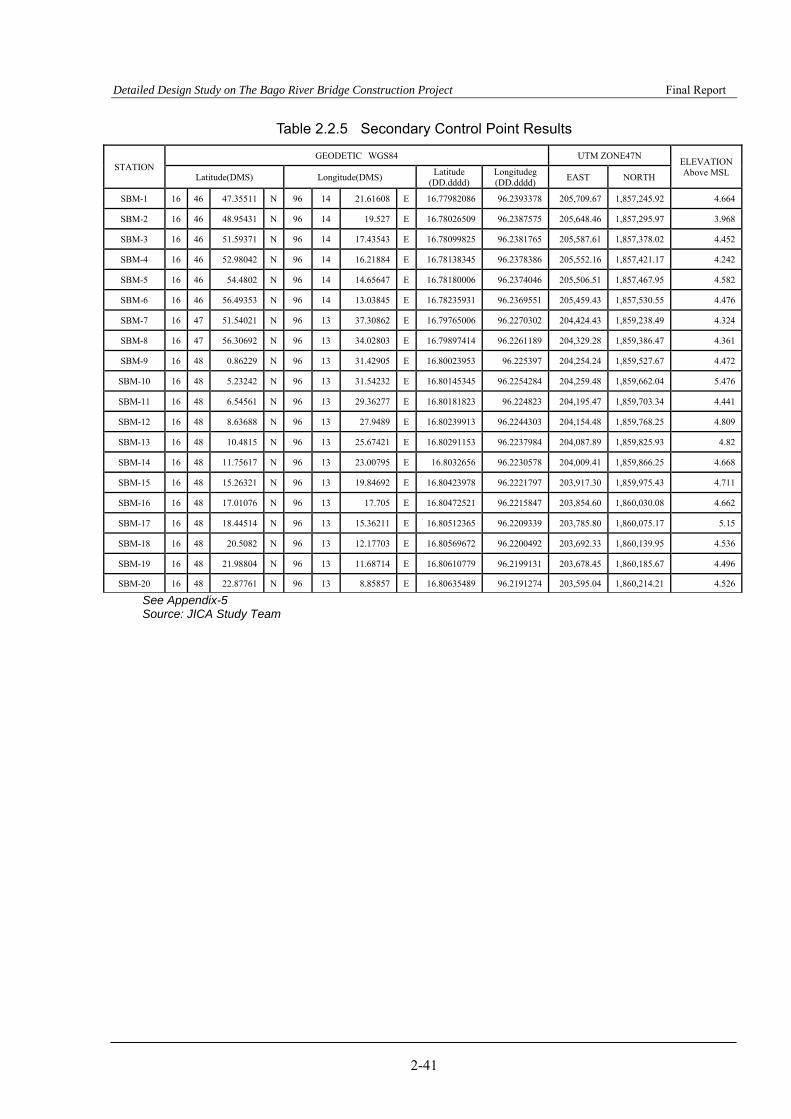
Detailed Design Study on The Bago River Bridge Construction Project Final Report
2-41
Table 2.2.5 Secondary Control Point Results
STATION GEODETIC WGS84 UTM ZONE47N
ELEVATION Above MSL Latitude(DMS) Longitude(DMS)
Latitude (DD.dddd)
Longitudeg (DD.dddd)
EAST NORTH
SBM-1 16 46 47.35511 N 96 14 21.61608 E 16.77982086 96.2393378 205,709.67 1,857,245.92 4.664
SBM-2 16 46 48.95431 N 96 14 19.527 E 16.78026509 96.2387575 205,648.46 1,857,295.97 3.968
SBM-3 16 46 51.59371 N 96 14 17.43543 E 16.78099825 96.2381765 205,587.61 1,857,378.02 4.452
SBM-4 16 46 52.98042 N 96 14 16.21884 E 16.78138345 96.2378386 205,552.16 1,857,421.17 4.242
SBM-5 16 46 54.4802 N 96 14 14.65647 E 16.78180006 96.2374046 205,506.51 1,857,467.95 4.582
SBM-6 16 46 56.49353 N 96 14 13.03845 E 16.78235931 96.2369551 205,459.43 1,857,530.55 4.476
SBM-7 16 47 51.54021 N 96 13 37.30862 E 16.79765006 96.2270302 204,424.43 1,859,238.49 4.324
SBM-8 16 47 56.30692 N 96 13 34.02803 E 16.79897414 96.2261189 204,329.28 1,859,386.47 4.361
SBM-9 16 48 0.86229 N 96 13 31.42905 E 16.80023953 96.225397 204,254.24 1,859,527.67 4.472
SBM-10 16 48 5.23242 N 96 13 31.54232 E 16.80145345 96.2254284 204,259.48 1,859,662.04 5.476
SBM-11 16 48 6.54561 N 96 13 29.36277 E 16.80181823 96.224823 204,195.47 1,859,703.34 4.441
SBM-12 16 48 8.63688 N 96 13 27.9489 E 16.80239913 96.2244303 204,154.48 1,859,768.25 4.809
SBM-13 16 48 10.4815 N 96 13 25.67421 E 16.80291153 96.2237984 204,087.89 1,859,825.93 4.82
SBM-14 16 48 11.75617 N 96 13 23.00795 E 16.8032656 96.2230578 204,009.41 1,859,866.25 4.668
SBM-15 16 48 15.26321 N 96 13 19.84692 E 16.80423978 96.2221797 203,917.30 1,859,975.43 4.711
SBM-16 16 48 17.01076 N 96 13 17.705 E 16.80472521 96.2215847 203,854.60 1,860,030.08 4.662
SBM-17 16 48 18.44514 N 96 13 15.36211 E 16.80512365 96.2209339 203,785.80 1,860,075.17 5.15
SBM-18 16 48 20.5082 N 96 13 12.17703 E 16.80569672 96.2200492 203,692.33 1,860,139.95 4.536
SBM-19 16 48 21.98804 N 96 13 11.68714 E 16.80610779 96.2199131 203,678.45 1,860,185.67 4.496
SBM-20 16 48 22.87761 N 96 13 8.85857 E 16.80635489 96.2191274 203,595.04 1,860,214.21 4.526
See Appendix-5 Source: JICA Study Team
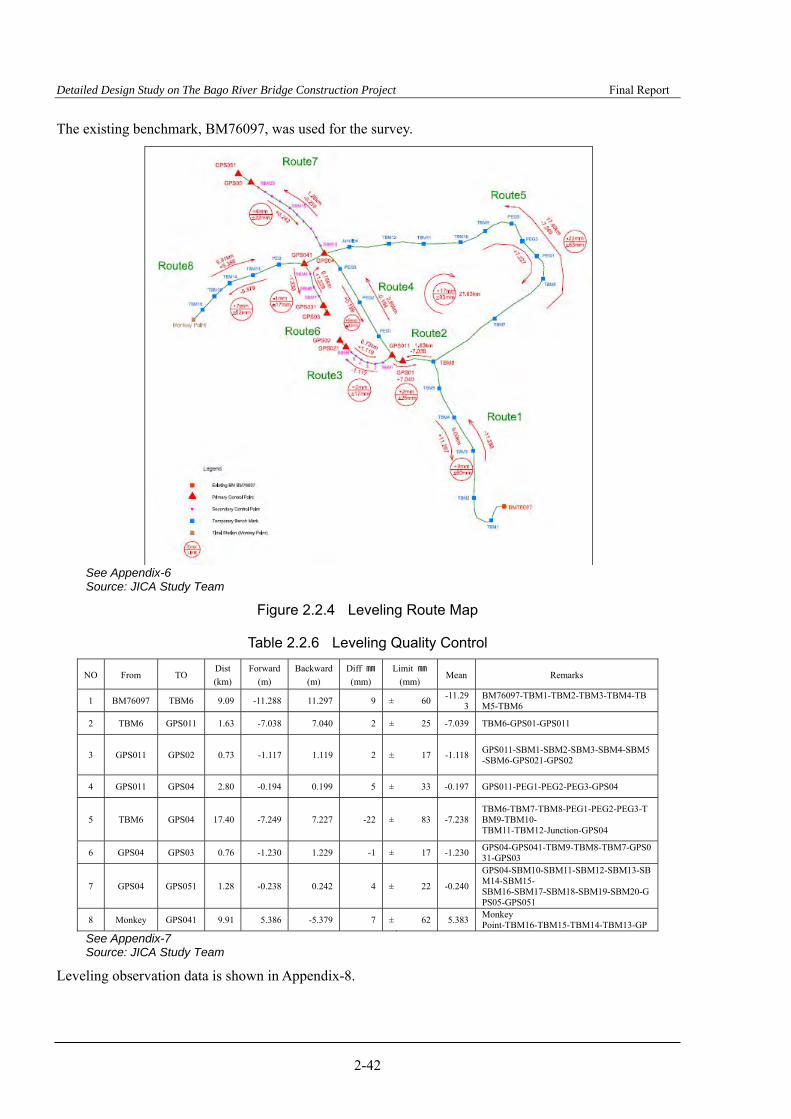
Detailed Design Study on The Bago River Bridge Construction Project Final Report
2-42
The existing benchmark, BM76097, was used for the survey.
See Appendix-6 Source: JICA Study Team
Figure 2.2.4 Leveling Route Map
Table 2.2.6 Leveling Quality Control
NO From TO Dist
(km)
Forward
(m)
Backward
(m)
Diff ㎜
(mm)
Limit ㎜
(mm) Mean Remarks
1 BM76097 TBM6 9.09 -11.288 11.297 9 ± 60 -11.29
3 BM76097-TBM1-TBM2-TBM3-TBM4-TBM5-TBM6
2 TBM6 GPS011 1.63 -7.038 7.040 2 ± 25 -7.039 TBM6-GPS01-GPS011
3 GPS011 GPS02 0.73 -1.117 1.119 2 ± 17 -1.118 GPS011-SBM1-SBM2-SBM3-SBM4-SBM5-SBM6-GPS021-GPS02
4 GPS011 GPS04 2.80 -0.194 0.199 5 ± 33 -0.197 GPS011-PEG1-PEG2-PEG3-GPS04
5 TBM6 GPS04 17.40 -7.249 7.227 -22 ± 83 -7.238 TBM6-TBM7-TBM8-PEG1-PEG2-PEG3-TBM9-TBM10- TBM11-TBM12-Junction-GPS04
6 GPS04 GPS03 0.76 -1.230 1.229 -1 ± 17 -1.230 GPS04-GPS041-TBM9-TBM8-TBM7-GPS031-GPS03
7 GPS04 GPS051 1.28 -0.238 0.242 4 ± 22 -0.240
GPS04-SBM10-SBM11-SBM12-SBM13-SBM14-SBM15- SBM16-SBM17-SBM18-SBM19-SBM20-GPS05-GPS051
8 Monkey GPS041 9.91 5.386 -5.379 7 ± 62 5.383 Monkey Point-TBM16-TBM15-TBM14-TBM13-GP
See Appendix-7 Source: JICA Study Team
Leveling observation data is shown in Appendix-8.

Detailed Design Study on The Bago River Bridge Construction Project Final Report
2-43
2.2.5 Route Survey
The route survey (4.37 km) is comprised of the following:
- Main route:On-ramp 1.20 km, the bridge section at Bago River 1.93 km - Access road to the main route:0.64 km - Access road to Star City:0.60 km
All center line points were staked out by TS. In addition, cross-section survey and longitudinal profile survey were conducted.
The elevation of the center line points were surveyed by direct leveling. Some points located in a bush at the Thanlyin side, on the other hand, were surveyed by TS.
2.2.6 Advanced GPS Survey for Basic Design
For the D/D of the flyover section, six points of the road center on the existing road were surveyed by GPS at first so that the B/D can be commenced without waiting for the completion of the survey by TS.
Source: JICA Study Team
Figure 2.2.5 Location of Advanced GPS Survey
GCP1009 and BM89004 were chosen as existing control points for this survey. Elevation of this benchmark was checked by using BM76097, whether the elevation of BM89004, which was installed 40 years ago, is the same as that of BM76097.
As shown in the following list, approximately 28 cm of gap was observed in this survey compared to the F/S results. Therefore, as described above, the occurrence of subsidence was confirmed.
BM76097 certificated by MSD was used as the standard of elevation for this project and the elevation in the case of the F/S was reviewed.

Detailed Design Study on The Bago River Bridge Construction Project Final Report
2-44
Table 2.2.7 Check of Elevation
STA Nov. 2016 FS 2013 Geo-Sara Remarks
GPS 1 5.026 5.312 -0.286
Thaketa side -0.281
GPS 2 5.023 5.306 -0.283
GPS 3 5.137 5.421 -0.284
GPS 4 5.115 5.402 -0.287
GPS 5 4.838 5.116 -0.278
GPS 6 4.855 5.134 -0.279
CP1 4.039 4.311 -0.272
CP2 4.499 4.774 -0.275
CP4 4.244 4.528 -0.284
Average -0.281
Source: JICA Study Team
2.2.7 Level of Girder Soffit of Existing Thanlyin Bridge
In order to clarify the clearance of the Thanlyin Bridge, leveling survey was conducted at six points. Survey works were conducted twice and the levels of the girder soffit were confirmed as shown in Table 2.2.8.
Source: JICA Study Team
Figure 2.2.6 Location of Six Survey Points for Thanlyin Bridge Girder Soffit

Detailed Design Study on The Bago River Bridge Construction Project Final Report
2-45
Table 2.2.8 Elevation of Thanlyin Bridge Girder Soffit
NO FIRST SECOND
EAST NORTH ELEVATION EAST NORTH ELEVATION Difference
1 205372.930 1857890.014 13.232 205368.877 1857897.094 13.225 0.007
2 205316.840 1857987.121 13.150 205316.873 1857987.106 13.198 -0.048
3 205260.784 1858084.086 13.174 205260.871 1858084.133 13.254 -0.080
4 205203.776 1858182.774 13.174 205203.862 1858182.793 13.259 -0.085
5 205147.730 1858279.760 13.152 205147.840 1858279.818 13.254 -0.102
6 205091.693 1858376.789 13.164 205091.760 1858376.830 13.209 -0.045
7 204708.346 1859040.738 11.338
8 204749.172 1858970.059 11.659
Source: JICA Study Team
Figure 2.2.7 shows the basic longitudinal section of Thanlyin Bridge. Heavy freight ships mainly pass near the left bank because the clearance gradually gets lower from the center span to the right bank.
Source: JICA Study Team
Figure 2.2.7 Basic Longitudinal Section of Thanlyin Bridge
2.2.8 Topographic Survey
In the computer-aided design (CAD) data of topographic map made in the F/S, many initials are used for a layer name, and there were many things which were difficult to read and understand.
Layer name should be easy to know as much as possible. Layer name was newly provided in this topographic survey for the D/D. (see Appendix-9)
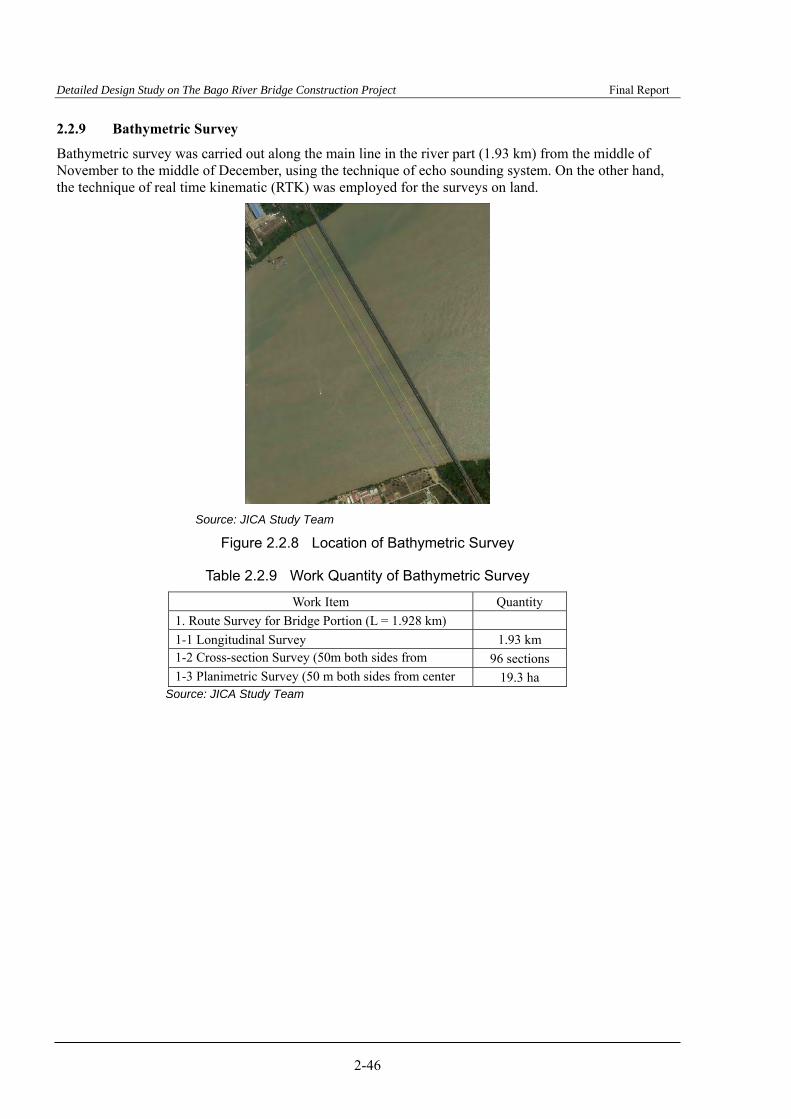
Detailed Design Study on The Bago River Bridge Construction Project Final Report
2-46
2.2.9 Bathymetric Survey
Bathymetric survey was carried out along the main line in the river part (1.93 km) from the middle of November to the middle of December, using the technique of echo sounding system. On the other hand, the technique of real time kinematic (RTK) was employed for the surveys on land.
Source: JICA Study Team
Figure 2.2.8 Location of Bathymetric Survey
Table 2.2.9 Work Quantity of Bathymetric Survey
Work Item Quantity
1. Route Survey for Bridge Portion (L = 1.928 km)
1-1 Longitudinal Survey 1.93 km 1-2 Cross-section Survey (50m both sides from 96 sections 1-3 Planimetric Survey (50 m both sides from center 19.3 ha
Source: JICA Study Team

Detailed Design Study on The Bago River Bridge Construction Project Final Report
2-47
2.3 MATERIAL SURVEY
2.3.1 Survey Scope and Purpose
Material survey will be conducted with pits and quarries for gravel and crushed stone to get information required for construction concerning matters related to transporting capacity such as route, method of transportation from points of material supply to the site, as well as price, quality, and supply capacity. The survey will also be conducted with the suppliers of the materials (e.g. reinforcing bars, steel materials, cement, asphalt, and building equipment). Table 2.3.1 shows the details of the material survey.
(1) Location of Material Survey
The locations of the material survey are shown in Figure 2.3.1.
Source: JICA Study Team
Figure 2.3.1 Locations of Material Survey

Detailed Design Study on The Bago River Bridge Construction Project Final Report
2-48
(2) Testing Items and Applied Standards System
Testing items and applied standards for material source survey are shown in Table 2.3.1
Table 2.3.1 Standards for Laboratory Testing on Materials
Testing Items Unit Qty. Applied Standards Material Test for Roadbed 1)Natural Moisture Content nos. 12 ASTM D 2216 2)Specific gravity nos. 12 ASTM D 854 3)Plastic limit nos. 12 ASTM D 4318 4)Liquid limit nos. 12 ASTM D 4318 5)Sieve analysis nos. 12 ASTM D 422 6)Hydrometer test nos. 12 ASTM D 422 7)Design CBR test nos. 12 ASTM D 1883 Material Test for Filling 1)Natural Moisture Content nos. 15 ASTM D 2216 2)Specific Gravity nos. 15 ASTM D 854 3)Plastic Limit nos. 15 ASTM D 4318 4)Liquid Limit nos. 15 ASTM D 4318 5)Sieve analysis nos. 15 ASTM D 422 6)Hydrometer test nos. 15 ASTM D 422 7)Compaction test nos. 15 ASTM D 698 8)Design CBR test nos. 15 ASTM D 1883 Material Test for Subgrade 1)Natural Moisture Content nos. 15 ASTM D 2216 2)Specific Gravity nos. 15 ASTM D 854 3)Plastic Limit nos. 15 ASTM D 4318 4)Liquid Limit nos. 15 ASTM D 4318 5)Sieve analysis nos. 15 ASTM D 422 6)Hydrometer test nos. 15 ASTM D 422 7)Compaction test nos. 15 ASTM D 1557 8)Modified CBR test nos. 15 ASTM D 1883 Material Test for Aggregate 1)Grain Size Analysis nos. 15 ASTM C 136 2)Specific Gravity nos. 15 ASTM C 127 3)Water Absorption nos. 15 ASTM C 127 4)Abrasion nos. 15 ASTM C 535
Source: JICA Study Team
2.3.2 Material Source’s List
(1) List of Material Sources and Prices
The lists of material sources and prices are shown from Table 2.3.2 to Table 2.3.7.
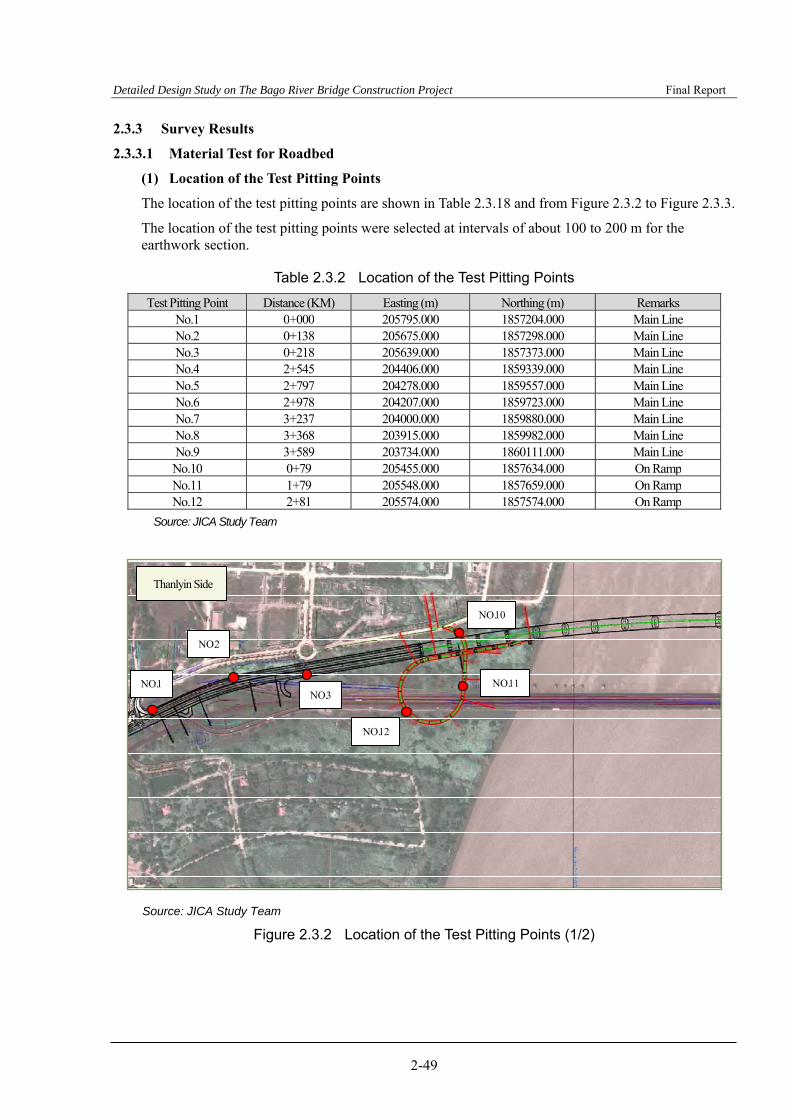
Detailed Design Study on The Bago River Bridge Construction Project Final Report
2-49
2.3.3 Survey Results
2.3.3.1 Material Test for Roadbed
(1) Location of the Test Pitting Points
The location of the test pitting points are shown in Table 2.3.18 and from Figure 2.3.2 to Figure 2.3.3.
The location of the test pitting points were selected at intervals of about 100 to 200 m for the earthwork section.
Table 2.3.2 Location of the Test Pitting Points
Test Pitting Point Distance (KM) Easting (m) Northing (m) Remarks No.1 0+000 205795.000 1857204.000 Main Line No.2 0+138 205675.000 1857298.000 Main Line No.3 0+218 205639.000 1857373.000 Main Line No.4 2+545 204406.000 1859339.000 Main Line No.5 2+797 204278.000 1859557.000 Main Line No.6 2+978 204207.000 1859723.000 Main Line No.7 3+237 204000.000 1859880.000 Main Line No.8 3+368 203915.000 1859982.000 Main Line No.9 3+589 203734.000 1860111.000 Main Line No.10 0+79 205455.000 1857634.000 On Ramp No.11 1+79 205548.000 1857659.000 On Ramp No.12 2+81 205574.000 1857574.000 On Ramp
Source: JICA Study Team
NO.1
NO.2
NO.3
NO.12
NO.11
NO.10
Thanlyin Side
Source: JICA Study Team
Figure 2.3.2 Location of the Test Pitting Points (1/2)
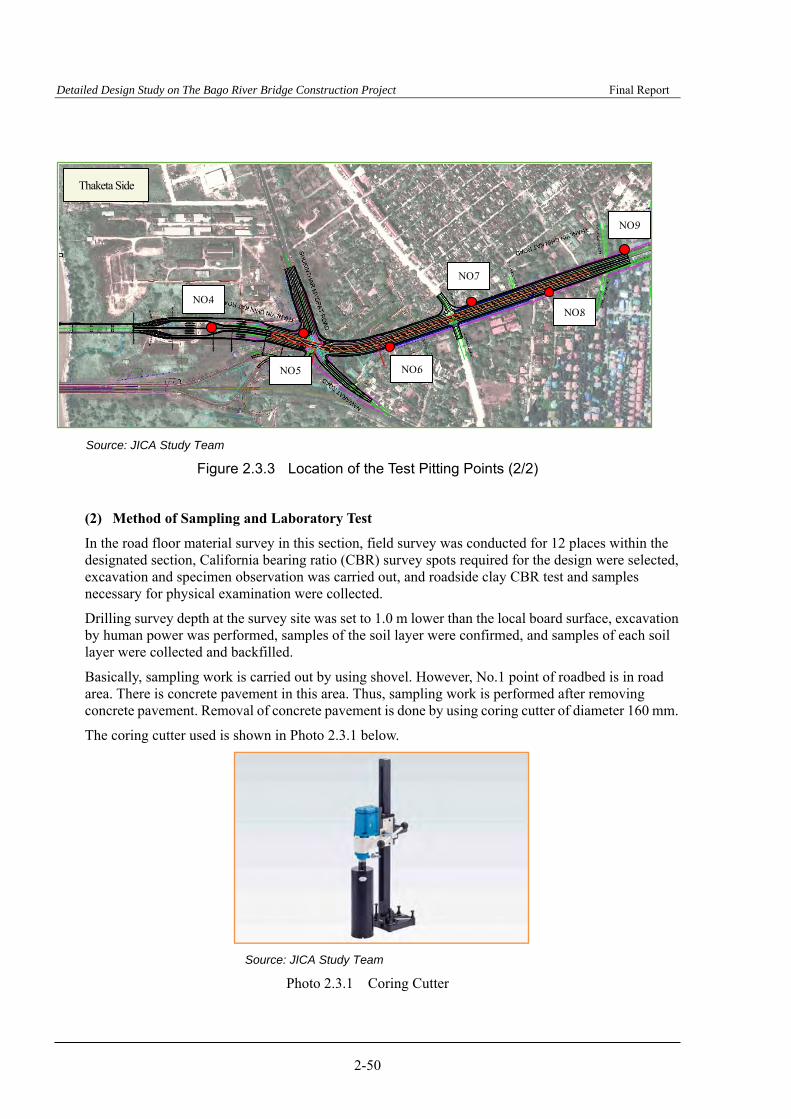
Detailed Design Study on The Bago River Bridge Construction Project Final Report
2-50
NO.4
NO.5 NO.6
NO.7
NO.8
NO.9
Thaketa Side
Source: JICA Study Team
Figure 2.3.3 Location of the Test Pitting Points (2/2)
(2) Method of Sampling and Laboratory Test
In the road floor material survey in this section, field survey was conducted for 12 places within the designated section, California bearing ratio (CBR) survey spots required for the design were selected, excavation and specimen observation was carried out, and roadside clay CBR test and samples necessary for physical examination were collected.
Drilling survey depth at the survey site was set to 1.0 m lower than the local board surface, excavation by human power was performed, samples of the soil layer were confirmed, and samples of each soil layer were collected and backfilled.
Basically, sampling work is carried out by using shovel. However, No.1 point of roadbed is in road area. There is concrete pavement in this area. Thus, sampling work is performed after removing concrete pavement. Removal of concrete pavement is done by using coring cutter of diameter 160 mm.
The coring cutter used is shown in Photo 2.3.1 below.
Source: JICA Study Team
Photo 2.3.1 Coring Cutter
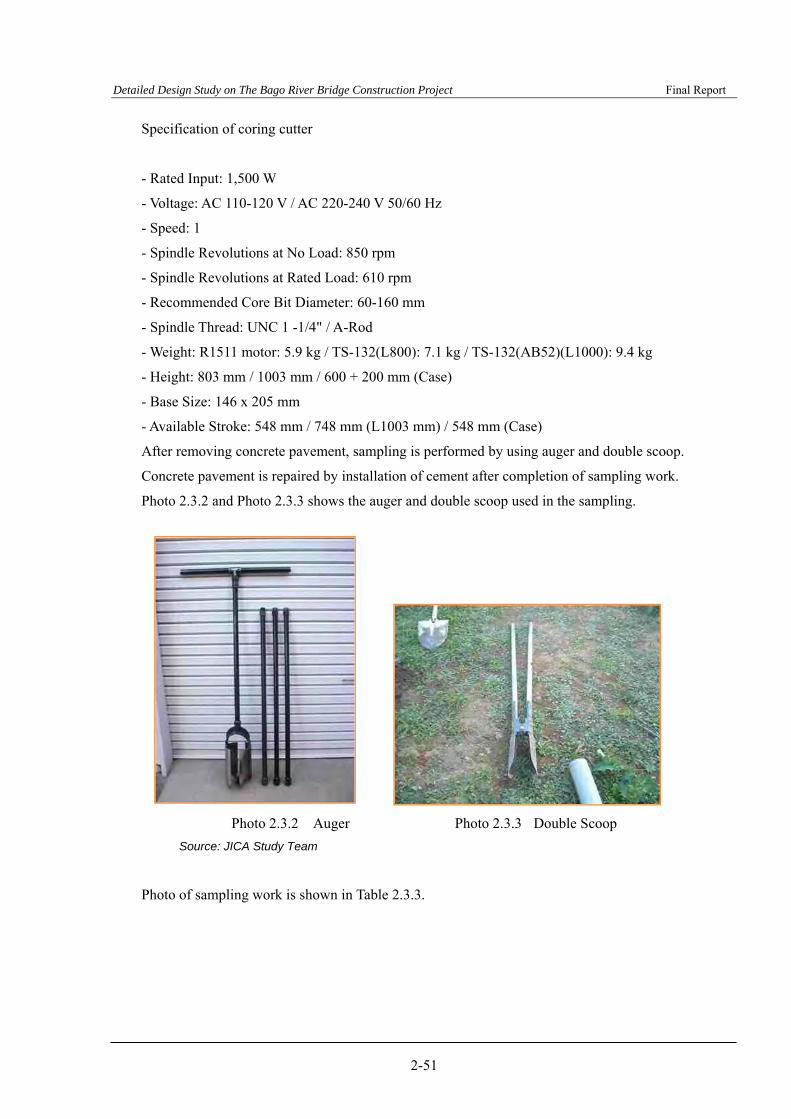
Detailed Design Study on The Bago River Bridge Construction Project Final Report
2-51
Specification of coring cutter
- Rated Input: 1,500 W
- Voltage: AC 110-120 V / AC 220-240 V 50/60 Hz
- Speed: 1
- Spindle Revolutions at No Load: 850 rpm
- Spindle Revolutions at Rated Load: 610 rpm
- Recommended Core Bit Diameter: 60-160 mm
- Spindle Thread: UNC 1 -1/4" / A-Rod
- Weight: R1511 motor: 5.9 kg / TS-132(L800): 7.1 kg / TS-132(AB52)(L1000): 9.4 kg
- Height: 803 mm / 1003 mm / 600 + 200 mm (Case)
- Base Size: 146 x 205 mm
- Available Stroke: 548 mm / 748 mm (L1003 mm) / 548 mm (Case)
After removing concrete pavement, sampling is performed by using auger and double scoop.
Concrete pavement is repaired by installation of cement after completion of sampling work.
Photo 2.3.2 and Photo 2.3.3 shows the auger and double scoop used in the sampling.
Photo 2.3.2 Auger Photo 2.3.3 Double Scoop
Source: JICA Study Team
Photo of sampling work is shown in Table 2.3.3.
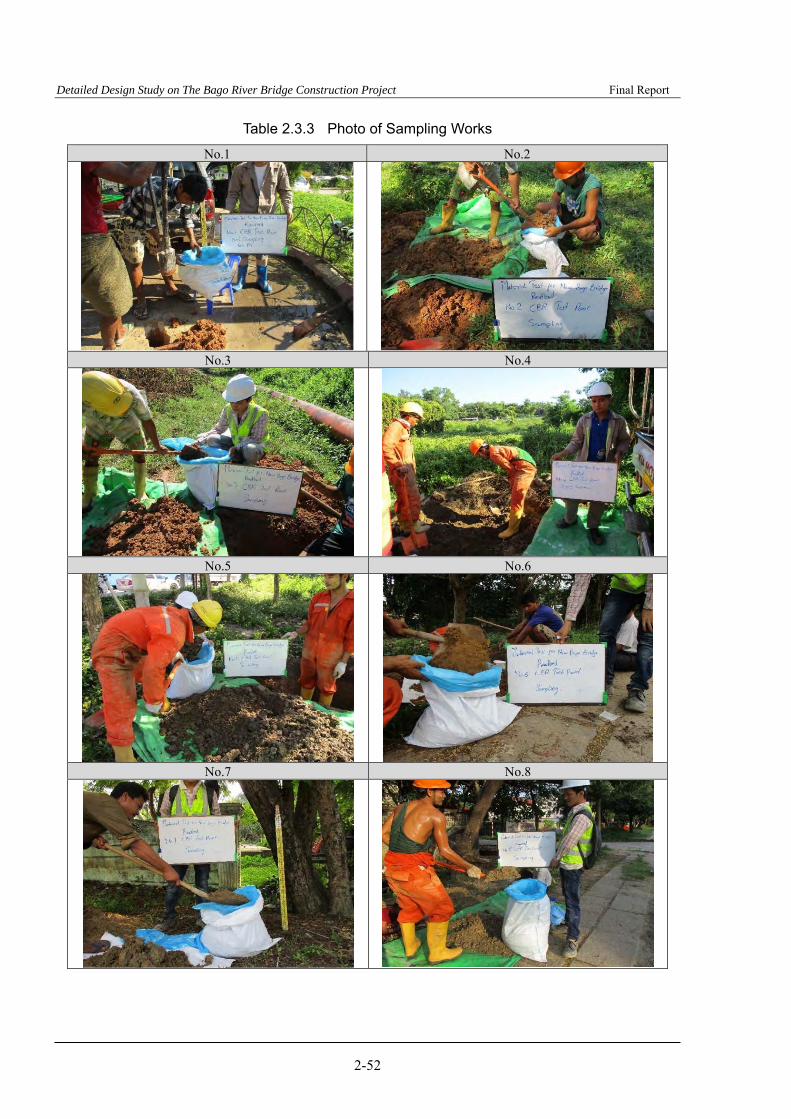
Detailed Design Study on The Bago River Bridge Construction Project Final Report
2-52
Table 2.3.3 Photo of Sampling Works
No.1 No.2
No.3 No.4
No.5 No.6
No.7 No.8
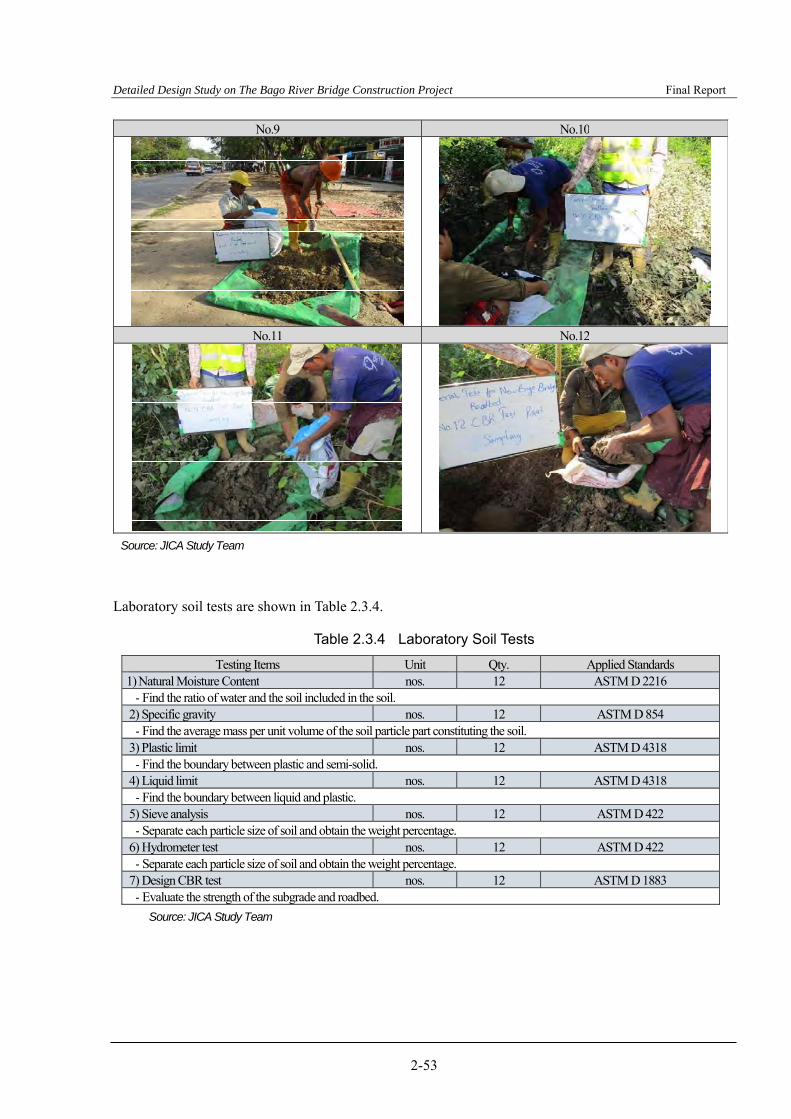
Detailed Design Study on The Bago River Bridge Construction Project Final Report
2-53
No.9 No.10
No.11 No.12
Source: JICA Study Team
Laboratory soil tests are shown in Table 2.3.4.
Table 2.3.4 Laboratory Soil Tests
Testing Items Unit Qty. Applied Standards 1) Natural Moisture Content nos. 12 ASTM D 2216
- Find the ratio of water and the soil included in the soil. 2) Specific gravity nos. 12 ASTM D 854 - Find the average mass per unit volume of the soil particle part constituting the soil.
3) Plastic limit nos. 12 ASTM D 4318 - Find the boundary between plastic and semi-solid.
4) Liquid limit nos. 12 ASTM D 4318 - Find the boundary between liquid and plastic.
5) Sieve analysis nos. 12 ASTM D 422 - Separate each particle size of soil and obtain the weight percentage.
6) Hydrometer test nos. 12 ASTM D 422 - Separate each particle size of soil and obtain the weight percentage.
7) Design CBR test nos. 12 ASTM D 1883 - Evaluate the strength of the subgrade and roadbed.
Source: JICA Study Team
Detailed Design Study on The Bago River Bridge Construction Project Final Report
2-54
(3) Survey Results
The laboratory test results are shown in Table 2.3.5 to Table 2.3.8.
According to the laboratory test results, low plasticity to medium plasticity clay layer is well observed in the Thaketa side. Moreover, design CBR value is eight in average.
In the Thanlyin side, percentage of sand is more than the Thaketa side. Moreover, design CBR values are also less than in the Thaketa side, although for some places, value is more than eight.

Detailed Design Study on The Bago River Bridge Construction Project Final Report
2-55
Table 2.3.5 Summary of Soil Test Results (1/4)
Source: JICA Study Team
No-1 No-2 No-3 No-10 No-11
~ ~ ~ ~ ~
Moisture Content w % 23.54 24.25 23.26 62.57 33.69
- - - - -
- - - - -
Atterberg's Liquid Limit WL % 35.75 28.45 33.50 65.08 44.20
Limit Plastic Limit WP % 17.58 15.24 17.94 30.27 24.10
Plasticity Index IP 18.17 13.21 15.56 34.81 20.10
Grain Gravel, (76.20 ~ 4.75) mm % 15.15 14.64 22.17 - -
Size Sand, (4.75 ~ 0.075) mm % 38.15 45.49 41.53 0.72 20.80
Analysis Silt, (0.075 ~ 0.005) mm % 31.70 29.87 26.80 61.78 47.00
Clay, (< 0.005 mm) % 15.00 10.00 9.50 37.50 32.20
Specific Gravity of Soil Gs (20˚C) 2.624 2.645 2.647 2.657 2.659
- - - - -
- - - - -
Unconfined - - - - -
Compression - - - - -
- - - - -
- - - - -
Sensitivity Ratio - - - - -
Design CBR % 9 4 13 3 4
Cohesion CUU kN/m2 - - - - -
Phi Angle UU Degree - - - - -
Cohesion C' kN/m2 - - - - -
Phi Angle ' Degree - - - - -
Cohesion C kN/m2 - - - - -
Phi Angle Degree - - - - -
Initial Void Ratio e 0 - - - - -
Conso. Yield Stress Py kN/m2 - - - - -
Compression Index Cc - - - - -
NOTEData used for reference are shown by red color.
Consolidation
Fat clayClayey sandClayey sandwith gravel
qu
SC
ConsolidatedUndrainedTriaxial
CompressionTest
( Measurement
Lean claywith sand
CH
Clayey sandwith gravel
Group Name
Group Symbol
Unconfined CompressiveStrength
E50
SC
f
Location : Near Existing Bago River Bridge (Thanlyin Bridge), Thanlyin Township, Yangon Region
Sample No.
Depth (m)
kN/m2
t g/cm3Bulk Density
SUMMARY OF SOIL TEST RESULTS
kN/m2
Failure Strain %
Project Name : Material Test for Bago River Bridge Construction Project
CL
UnconsolidatedUndrainedTriaxial
Soil Classification ( ASTM D 2487 - 06 )
SC
Material Test for Roadbed
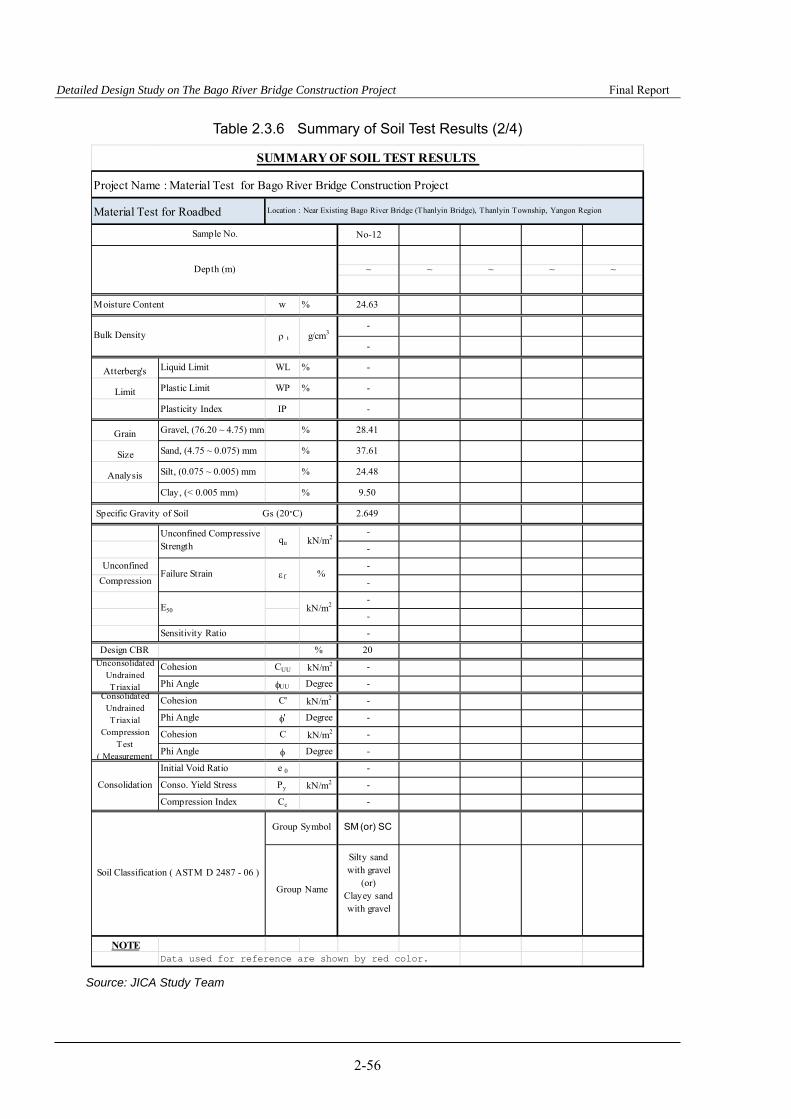
Detailed Design Study on The Bago River Bridge Construction Project Final Report
2-56
Table 2.3.6 Summary of Soil Test Results (2/4)
Source: JICA Study Team
No-12
~ ~ ~ ~ ~
Moisture Content w % 24.63
-
-
Atterberg's Liquid Limit WL % -
Limit Plastic Limit WP % -
Plasticity Index IP -
Grain Gravel, (76.20 ~ 4.75) mm % 28.41
Size Sand, (4.75 ~ 0.075) mm % 37.61
Analysis Silt, (0.075 ~ 0.005) mm % 24.48
Clay, (< 0.005 mm) % 9.50
Specific Gravity of Soil Gs (20˚C) 2.649
-
-
Unconfined -
Compression -
-
-
Sensitivity Ratio -
Design CBR % 20
Cohesion CUU kN/m2 -
Phi Angle UU Degree -
Cohesion C' kN/m2 -
Phi Angle ' Degree -
Cohesion C kN/m2 -
Phi Angle Degree -
Initial Void Ratio e 0 -
Conso. Yield Stress Py kN/m2 -
Compression Index Cc -
NOTEData used for reference are shown by red color.
Group Name
Silty sandwith gravel
(or)Clayey sandwith gravel
UnconsolidatedUndrainedTriaxial
ConsolidatedUndrainedTriaxial
CompressionTest
( Measurement
Consolidation
Soil Classification ( ASTM D 2487 - 06 )
Group Symbol SM (or) SC
Failure Strain f %
E50 kN/m2
Bulk Density t g/cm3
Unconfined CompressiveStrength
qu kN/m2
SUMMARY OF SOIL TEST RESULTS
Project Name : Material Test for Bago River Bridge Construction Project
Material Test for Roadbed Location : Near Existing Bago River Bridge (Thanlyin Bridge), Thanlyin Township, Yangon Region
Sample No.
Depth (m)
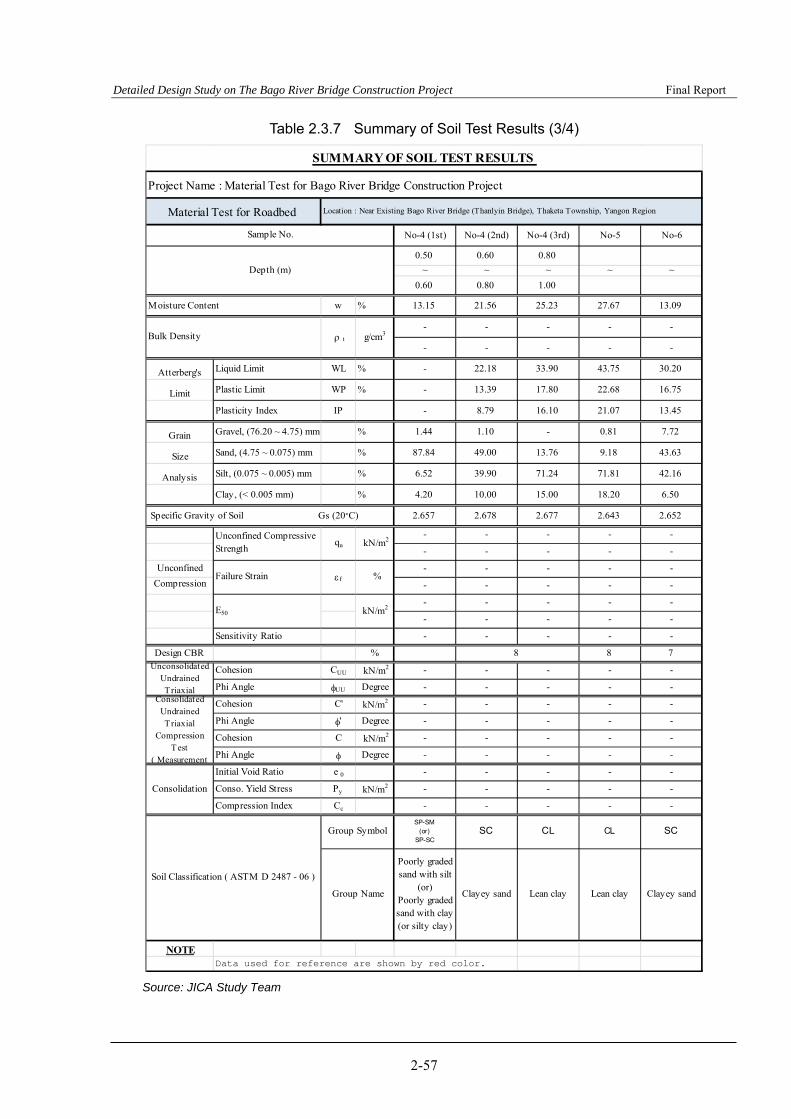
Detailed Design Study on The Bago River Bridge Construction Project Final Report
2-57
Table 2.3.7 Summary of Soil Test Results (3/4)
Source: JICA Study Team
No-4 (1st) No-4 (2nd) No-4 (3rd) No-5 No-6
0.50 0.60 0.80
~ ~ ~ ~ ~
0.60 0.80 1.00
Moisture Content w % 13.15 21.56 25.23 27.67 13.09
- - - - -
- - - - -
Atterberg's Liquid Limit WL % - 22.18 33.90 43.75 30.20
Limit Plastic Limit WP % - 13.39 17.80 22.68 16.75
Plasticity Index IP - 8.79 16.10 21.07 13.45
Grain Gravel, (76.20 ~ 4.75) mm % 1.44 1.10 - 0.81 7.72
Size Sand, (4.75 ~ 0.075) mm % 87.84 49.00 13.76 9.18 43.63
Analysis Silt, (0.075 ~ 0.005) mm % 6.52 39.90 71.24 71.81 42.16
Clay, (< 0.005 mm) % 4.20 10.00 15.00 18.20 6.50
Specific Gravity of Soil Gs (20˚C) 2.657 2.678 2.677 2.643 2.652
- - - - -
- - - - -
Unconfined - - - - -
Compression - - - - -
- - - - -
- - - - -
Sensitivity Ratio - - - - -
Design CBR % 8 7
Cohesion CUU kN/m2 - - - - -
Phi Angle UU Degree - - - - -
Cohesion C' kN/m2 - - - - -
Phi Angle ' Degree - - - - -
Cohesion C kN/m2 - - - - -
Phi Angle Degree - - - - -
Initial Void Ratio e 0 - - - - -
Conso. Yield Stress Py kN/m2 - - - - -
Compression Index Cc - - - - -
NOTEData used for reference are shown by red color.
SC
Group Name
Poorly gradedsand with silt
(or)Poorly gradedsand with clay(or silty clay)
Clayey sand Lean clay Lean clay Clayey sand
UnconsolidatedUndrainedTriaxial
ConsolidatedUndrainedTriaxial
CompressionTest
( Measurement
Consolidation
Soil Classification ( ASTM D 2487 - 06 )
Group SymbolSP-SM
(or)SP-SC
SC CL CL
Failure Strain f %
E50 kN/m2
8
Bulk Density t g/cm3
Unconfined CompressiveStrength
qu kN/m2
SUMMARY OF SOIL TEST RESULTS
Project Name : Material Test for Bago River Bridge Construction Project
Material Test for Roadbed Location : Near Existing Bago River Bridge (Thanlyin Bridge), Thaketa Township, Yangon Region
Sample No.
Depth (m)
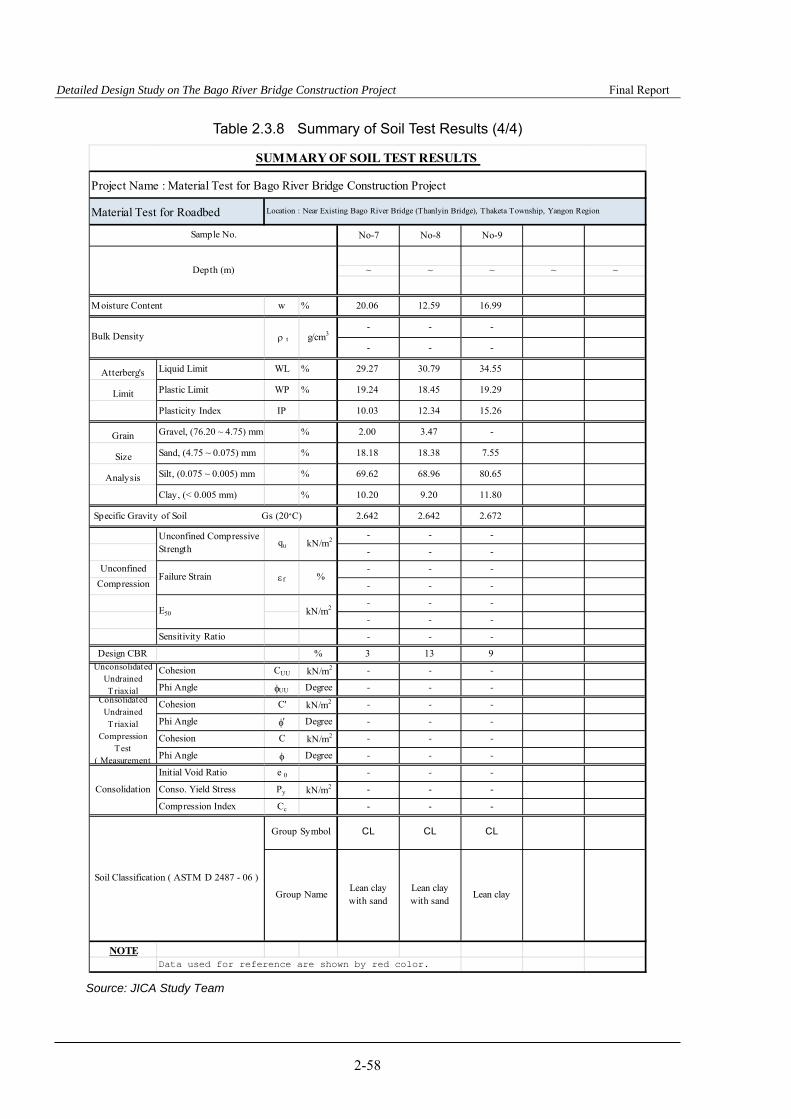
Detailed Design Study on The Bago River Bridge Construction Project Final Report
2-58
Table 2.3.8 Summary of Soil Test Results (4/4)
Source: JICA Study Team
No-7 No-8 No-9
~ ~ ~ ~ ~
Moisture Content w % 20.06 12.59 16.99
- - -
- - -
Atterberg's Liquid Limit WL % 29.27 30.79 34.55
Limit Plastic Limit WP % 19.24 18.45 19.29
Plasticity Index IP 10.03 12.34 15.26
Grain Gravel, (76.20 ~ 4.75) mm % 2.00 3.47 -
Size Sand, (4.75 ~ 0.075) mm % 18.18 18.38 7.55
Analysis Silt, (0.075 ~ 0.005) mm % 69.62 68.96 80.65
Clay, (< 0.005 mm) % 10.20 9.20 11.80
Specific Gravity of Soil Gs (20˚C) 2.642 2.642 2.672
- - -
- - -
Unconfined - - -
Compression - - -
- - -
- - -
Sensitivity Ratio - - -
Design CBR % 3 13 9
Cohesion CUU kN/m2 - - -
Phi Angle UU Degree - - -
Cohesion C' kN/m2 - - -
Phi Angle ' Degree - - -
Cohesion C kN/m2 - - -
Phi Angle Degree - - -
Initial Void Ratio e 0 - - -
Conso. Yield Stress Py kN/m2 - - -
Compression Index Cc - - -
NOTEData used for reference are shown by red color.
CL
Group NameLean claywith sand
Lean claywith sand
Lean clay
ConsolidatedUndrainedTriaxial
CompressionTest
( Measurement
Consolidation
Soil Classification ( ASTM D 2487 - 06 )
Group Symbol CL CL
Failure Strain f %
E50 kN/m2
UnconsolidatedUndrainedTriaxial
Bulk Density t g/cm3
Unconfined CompressiveStrength
qu kN/m2
SUMMARY OF SOIL TEST RESULTS
Project Name : Material Test for Bago River Bridge Construction Project
Material Test for Roadbed Location : Near Existing Bago River Bridge (Thanlyin Bridge), Thaketa Township, Yangon Region
Sample No.
Depth (m)

Detailed Design Study on The Bago River Bridge Construction Project Final Report
2-59
2.3.3.2 Material Test for Filling
(1) Location of Surveys
The location of the surveys is shown in Figure 2.3.4.
The material sampling site was selected by price, quality, and supply area near the project site.
Source: JICA Study Team
Location 1
MARGA
Thanlyin Side
Thaketa Side
Location 2
KO TOE
Location 3
GREAT MOTION
Location 4
GREAT MOTION
Location 5
AUNG WIN
Approx.
19km
Approx.
5km
Approx.
3km
Approx. 8km
Approx. 15km
Figure 2.3.4 Location of Surveys
The selected locations are shown in Table 2.3.9 to Table 2.3.13.
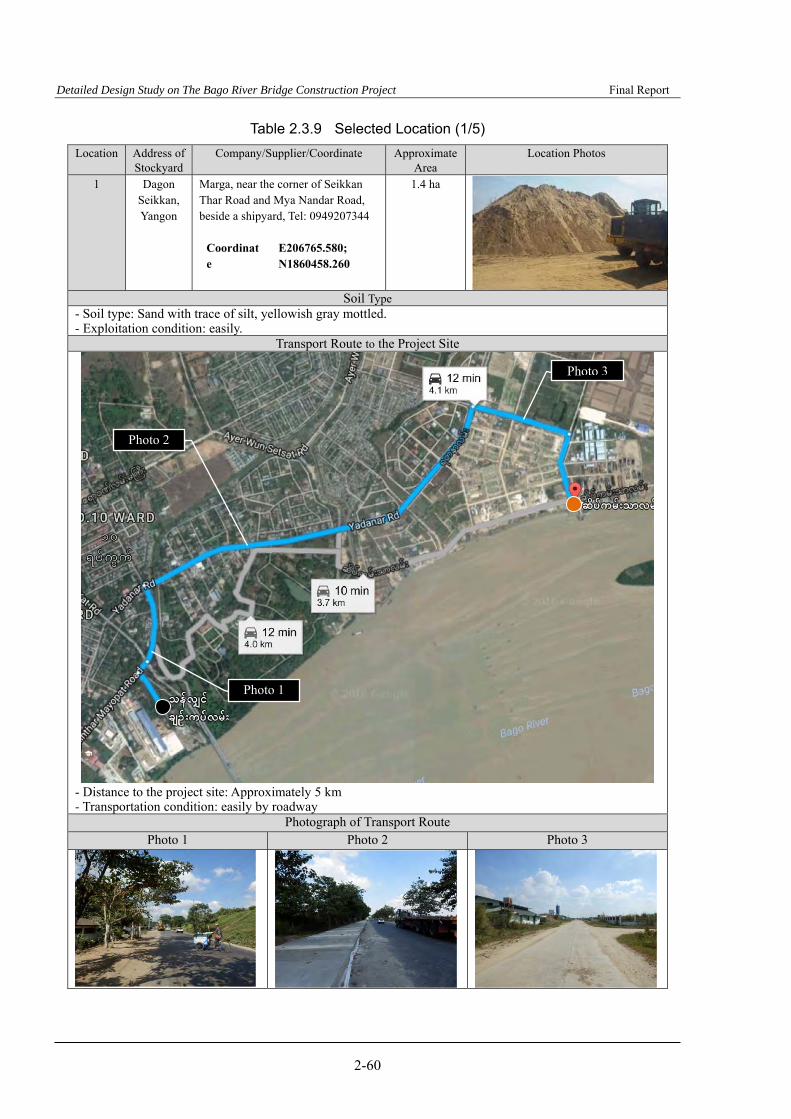
Detailed Design Study on The Bago River Bridge Construction Project Final Report
2-60
Table 2.3.9 Selected Location (1/5)
Location Address of Stockyard
Company/Supplier/Coordinate Approximate Area
Location Photos
1 Dagon Seikkan, Yangon
Marga, near the corner of Seikkan Thar Road and Mya Nandar Road, beside a shipyard, Tel: 0949207344
Coordinate
E206765.580; N1860458.260
1.4 ha
Soil Type - Soil type: Sand with trace of silt, yellowish gray mottled. - Exploitation condition: easily.
Transport Route to the Project Site
- Distance to the project site: Approximately 5 km - Transportation condition: easily by roadway
Photograph of Transport Route Photo 1 Photo 2 Photo 3
Photo 2
Photo 3
Photo 1
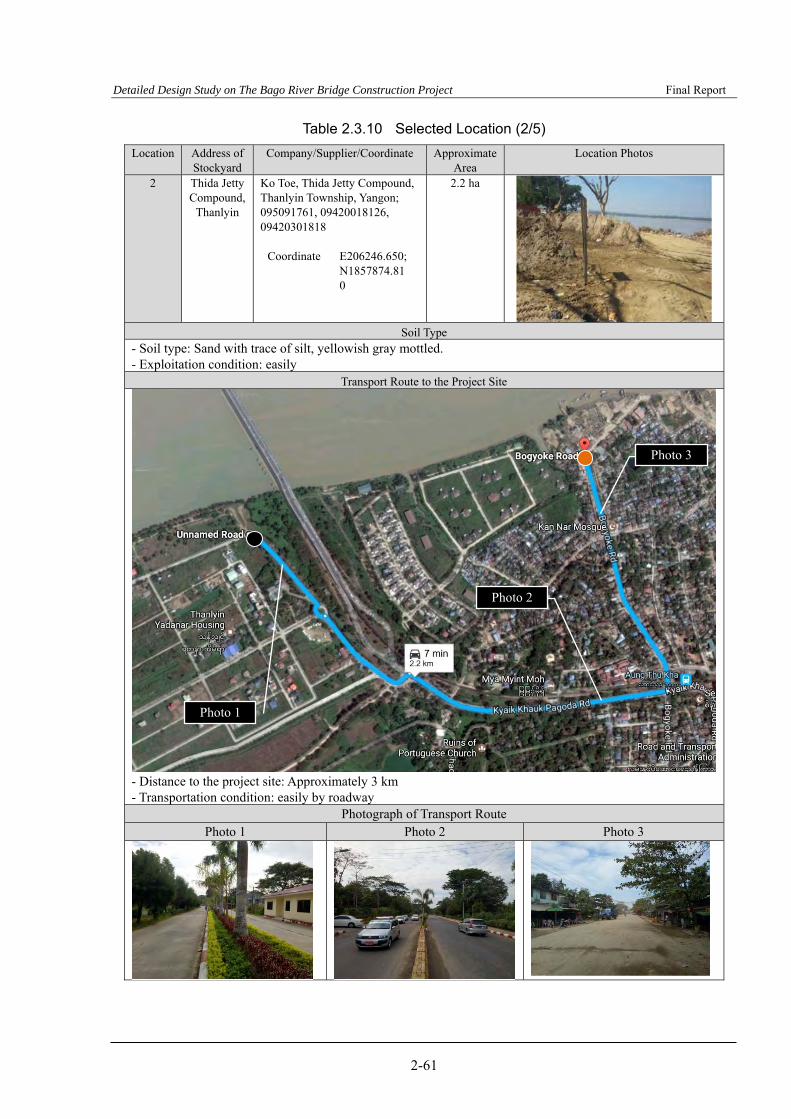
Detailed Design Study on The Bago River Bridge Construction Project Final Report
2-61
Table 2.3.10 Selected Location (2/5)
Location Address of Stockyard
Company/Supplier/Coordinate Approximate Area
Location Photos
2 Thida Jetty Compound,
Thanlyin
Ko Toe, Thida Jetty Compound, Thanlyin Township, Yangon; 095091761, 09420018126, 09420301818
Coordinate E206246.650; N1857874.810
2.2 ha
Soil Type
- Soil type: Sand with trace of silt, yellowish gray mottled. - Exploitation condition: easily
Transport Route to the Project Site
- Distance to the project site: Approximately 3 km - Transportation condition: easily by roadway
Photograph of Transport Route Photo 1 Photo 2 Photo 3
Photo 2
Photo 3
Photo 1

Detailed Design Study on The Bago River Bridge Construction Project Final Report
2-62
Table 2.3.11 Selected Location (3/5)
Location Address of Stockyard
Company/Supplier/Coordinate Approximate Area
Location Photos
3 Thanlyin, Yangon
Great Motion Co., Ltd. No. 17, D, Masoeyeik Street, (5) Quarter, Mayangone, Yangon
Coordinate E206384.600 ; N1853185.660
0.4 ha
Soil Type
- Soil type: Latertic soil, red and yellow mottled - Exploitation condition: easily
Transport Route to the Project Site (Thanlyin Side)
- Distance to the project site: Approximately 8 km - Transportation condition: easily by roadway
Photograph of Transport Route (Thanlyin Side) Photo 1 Photo 2
Photo 1
Photo 2
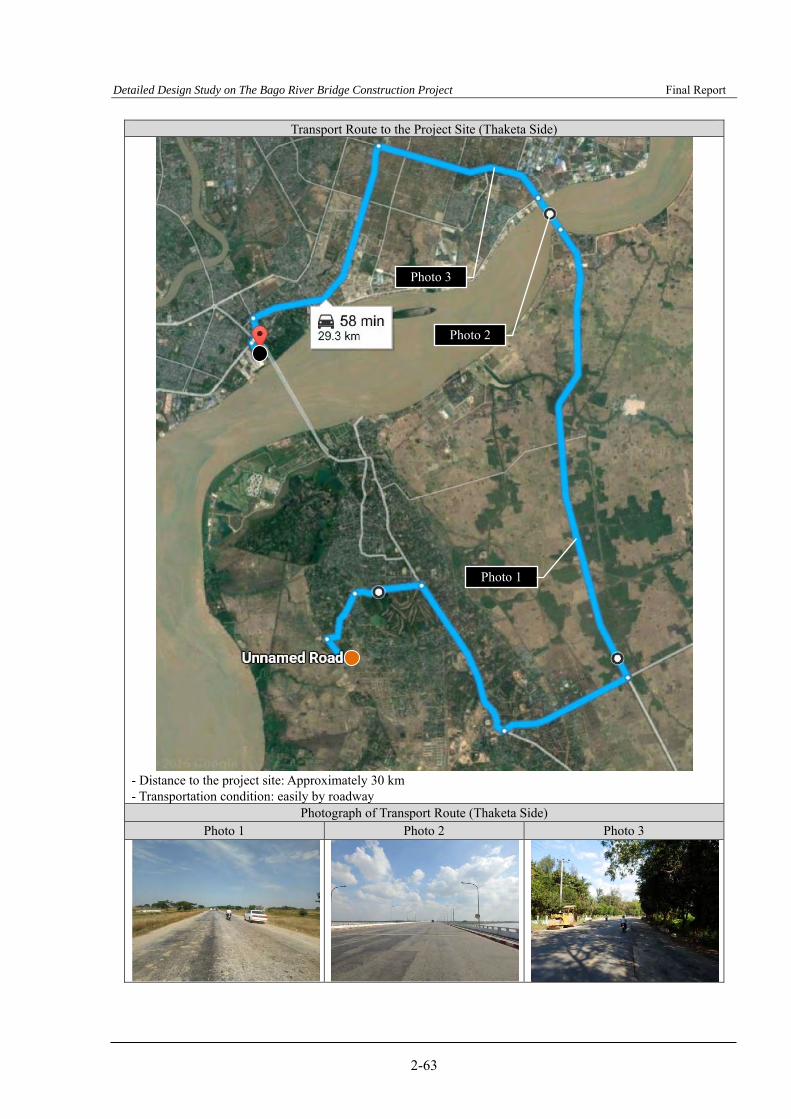
Detailed Design Study on The Bago River Bridge Construction Project Final Report
2-63
Transport Route to the Project Site (Thaketa Side)
- Distance to the project site: Approximately 30 km - Transportation condition: easily by roadway
Photograph of Transport Route (Thaketa Side) Photo 1 Photo 2 Photo 3
Photo 1
Photo 2
Photo 3

Detailed Design Study on The Bago River Bridge Construction Project Final Report
2-64
Table 2.3.12 Selected Location (4/5)
Location Address of Stockyard
Company/Supplier/Coordinate Approximate Area
Location Photos
4 Thanlyin, Yangon
Great Motion Co., Ltd. No. 17, D, Masoeyeik Street, (5) Quarter, Mayangone, Yangon
Coordinate E207825.110 ; N1847689.500
1.1 ha
Soil Type
- Soil type: Latertic soil, red and yellow mottled. - Exploitation condition: easily
Transport Route to the Project Site (Thanlyin Side)
- Distance to the project site: Approximately 15 km - Transportation condition: easily by roadway
Photograph of Transport Route (Thanlyin Side) Photo 1 Photo 2 Photo 3
Photo 2
Photo 1
Photo 3
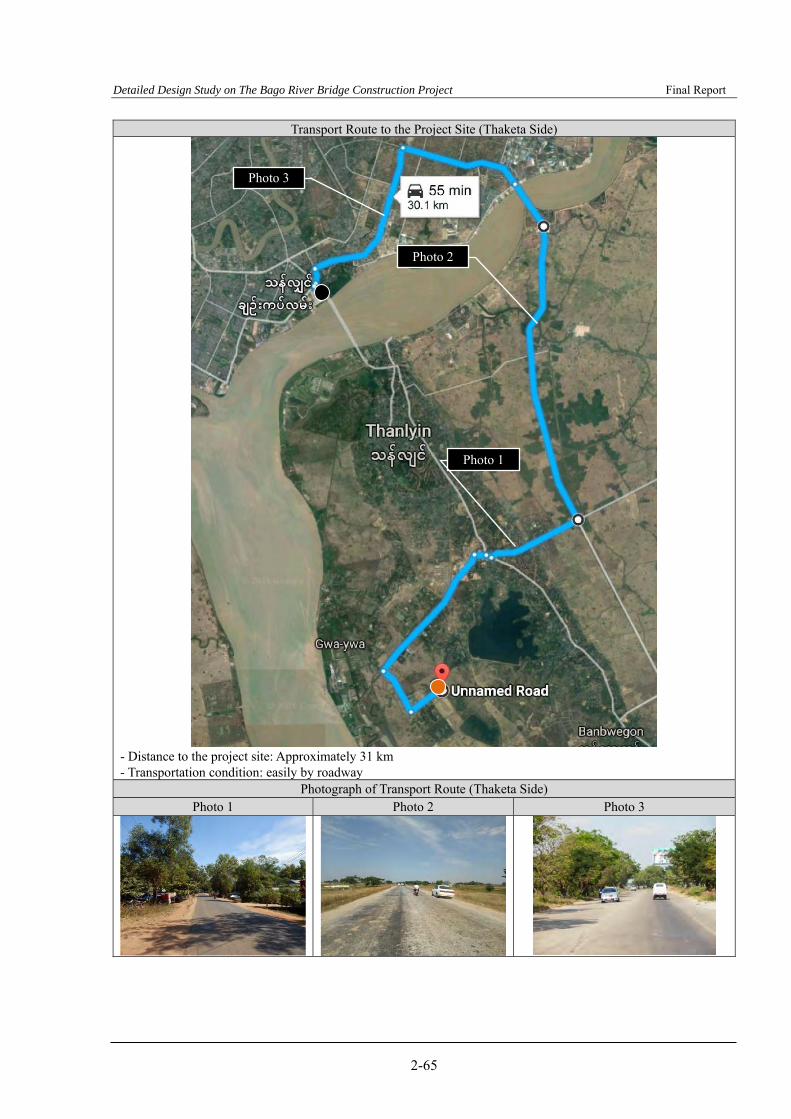
Detailed Design Study on The Bago River Bridge Construction Project Final Report
2-65
Transport Route to the Project Site (Thaketa Side)
- Distance to the project site: Approximately 31 km - Transportation condition: easily by roadway
Photograph of Transport Route (Thaketa Side) Photo 1 Photo 2 Photo 3
Photo 2
Photo 1
Photo 3

Detailed Design Study on The Bago River Bridge Construction Project Final Report
2-66
Table 2.3.13 Selected Location (5/5)
Location Address of Stockyard
Company/Supplier/Coordinate Approximate Area
Location Photos
5 Kyauktan, Yangon
Aung Win, Kyauktan, Township, Yangon Tel; 09799444909
Coordinate E 213646.040 ; N 1842158.930
7.4 ha
Soil Type
- Soil type: Latertic soil, reddish brown. - Exploitation condition: easily.
Transport Route to the Project Site (Thanlyin Side)
- Distance to the project site: Approximately 19 km - Transportation condition: easily by roadway
Photograph of Transport Route (Thanlyin Side) Photo 1 Photo 2
Photo 2 Photo 1

Detailed Design Study on The Bago River Bridge Construction Project Final Report
2-67
Transport route to the project site(Thaketa Side)
- Distance to the project site: Approximately 32 km - Transportation condition: easily by roadway
Photograph of Transport Route (Thaketa Side) Photo 1 Photo 2 Photo 3
Photo 1
Photo 3
Photo 2
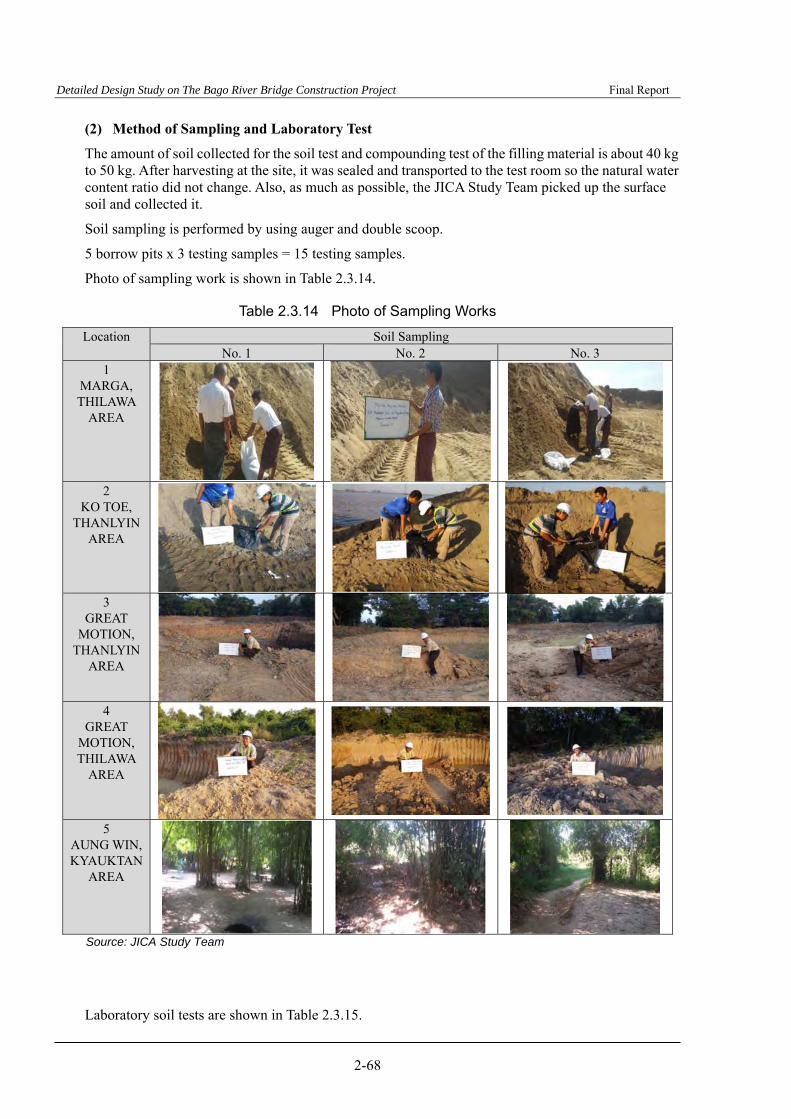
Detailed Design Study on The Bago River Bridge Construction Project Final Report
2-68
(2) Method of Sampling and Laboratory Test
The amount of soil collected for the soil test and compounding test of the filling material is about 40 kg to 50 kg. After harvesting at the site, it was sealed and transported to the test room so the natural water content ratio did not change. Also, as much as possible, the JICA Study Team picked up the surface soil and collected it.
Soil sampling is performed by using auger and double scoop.
5 borrow pits x 3 testing samples = 15 testing samples.
Photo of sampling work is shown in Table 2.3.14.
Table 2.3.14 Photo of Sampling Works
Location Soil Sampling No. 1 No. 2 No. 3
1 MARGA, THILAWA
AREA
2
KO TOE, THANLYIN
AREA
3
GREAT MOTION,
THANLYIN AREA
4
GREAT MOTION, THILAWA
AREA
5 AUNG WIN, KYAUKTAN
AREA
Source: JICA Study Team
Laboratory soil tests are shown in Table 2.3.15.
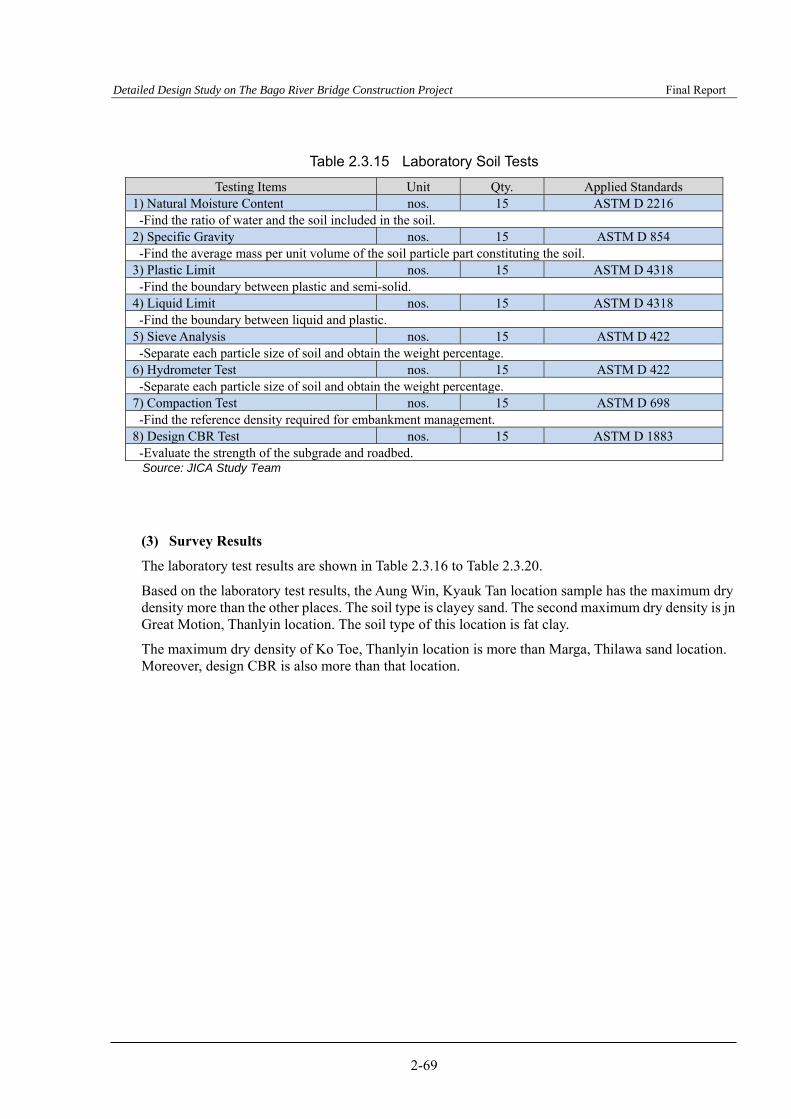
Detailed Design Study on The Bago River Bridge Construction Project Final Report
2-69
Table 2.3.15 Laboratory Soil Tests
Testing Items Unit Qty. Applied Standards 1) Natural Moisture Content nos. 15 ASTM D 2216 -Find the ratio of water and the soil included in the soil.
2) Specific Gravity nos. 15 ASTM D 854 -Find the average mass per unit volume of the soil particle part constituting the soil.
3) Plastic Limit nos. 15 ASTM D 4318 -Find the boundary between plastic and semi-solid.
4) Liquid Limit nos. 15 ASTM D 4318 -Find the boundary between liquid and plastic.
5) Sieve Analysis nos. 15 ASTM D 422 -Separate each particle size of soil and obtain the weight percentage.
6) Hydrometer Test nos. 15 ASTM D 422 -Separate each particle size of soil and obtain the weight percentage.
7) Compaction Test nos. 15 ASTM D 698 -Find the reference density required for embankment management.
8) Design CBR Test nos. 15 ASTM D 1883 -Evaluate the strength of the subgrade and roadbed. Source: JICA Study Team
(3) Survey Results
The laboratory test results are shown in Table 2.3.16 to Table 2.3.20.
Based on the laboratory test results, the Aung Win, Kyauk Tan location sample has the maximum dry density more than the other places. The soil type is clayey sand. The second maximum dry density is jn Great Motion, Thanlyin location. The soil type of this location is fat clay.
The maximum dry density of Ko Toe, Thanlyin location is more than Marga, Thilawa sand location. Moreover, design CBR is also more than that location.
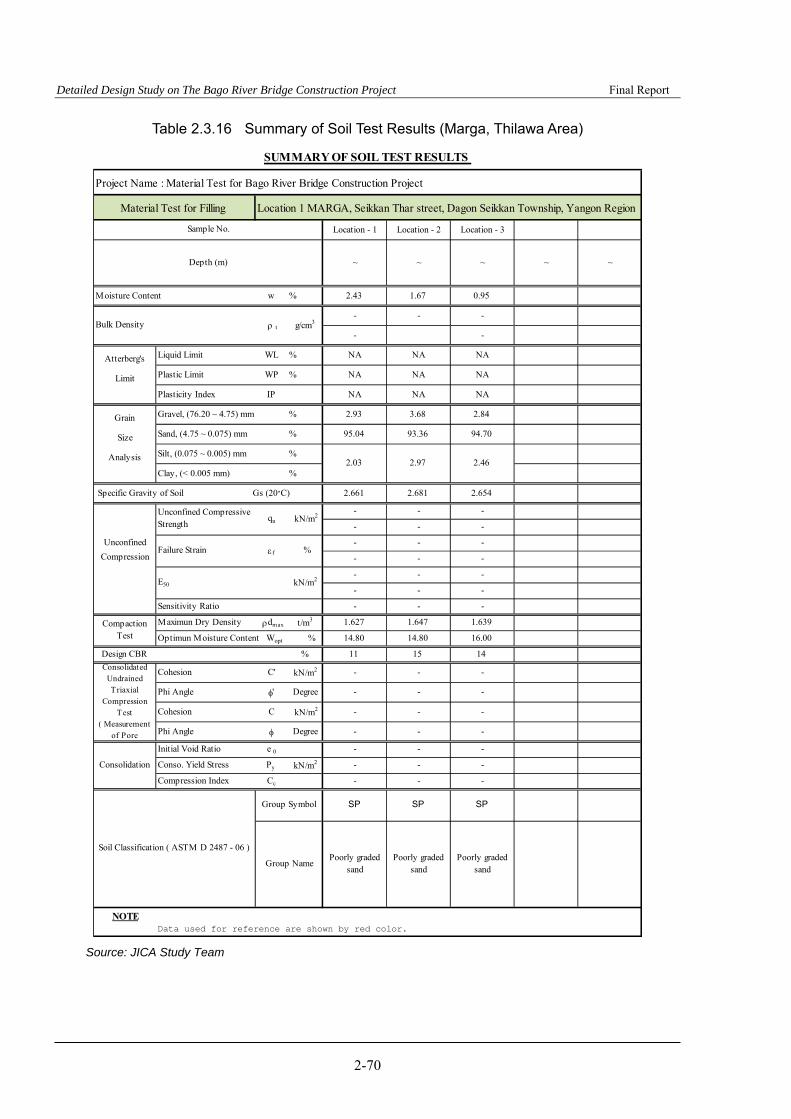
Detailed Design Study on The Bago River Bridge Construction Project Final Report
2-70
Table 2.3.16 Summary of Soil Test Results (Marga, Thilawa Area)
Source: JICA Study Team
Location - 1 Location - 2 Location - 3
~ ~ ~ ~ ~
Moisture Content w % 2.43 1.67 0.95
- - -
- -
Atterberg's Liquid Limit WL % NA NA NA
Limit Plastic Limit WP % NA NA NA
Plasticity Index IP NA NA NA
Grain Gravel, (76.20 ~ 4.75) mm % 2.93 3.68 2.84
Size Sand, (4.75 ~ 0.075) mm % 95.04 93.36 94.70
Analysis Silt, (0.075 ~ 0.005) mm %
Clay, (< 0.005 mm) %
Specific Gravity of Soil Gs (20˚C) 2.661 2.681 2.654
- - -
- - -
Unconfined - - -
Compression - - -
- - -
- - -
Sensitivity Ratio - - -
Maximun Dry Density dmax t/m3 1.627 1.647 1.639
Optimun Moisture Content Wopt % 14.80 14.80 16.00
Design CBR % 11 15 14
Cohesion C' kN/m2 - - -
Phi Angle ' Degree - - -
Cohesion C kN/m2 - - -
Phi Angle Degree - - -
Initial Void Ratio e 0 - - -
Conso. Yield Stress Py kN/m2 - - -
Compression Index Cc - - -
NOTEData used for reference are shown by red color.
2.97
ConsolidatedUndrainedTriaxial
CompressionTest
( Measurementof Pore
Unconfined CompressiveStrength
E50
SP
f
Consolidation
CompactionTest
Soil Classification ( ASTM D 2487 - 06 )
SP
Poorly gradedsand
Poorly gradedsand
qu
SP
Location 1 MARGA, Seikkan Thar street, Dagon Seikkan Township, Yangon Region
Sample No.
Depth (m)
kN/m2
2.46
Poorly gradedsand
Group Name
Group Symbol
SUMMARY OF SOIL TEST RESULTS
kN/m2
Failure Strain %
Project Name : Material Test for Bago River Bridge Construction Project
t g/cm3Bulk Density
2.03
Material Test for Filling

Detailed Design Study on The Bago River Bridge Construction Project Final Report
2-71
Table 2.3.17 Summary of Soil Test Results (Ko Toe, Thanlyin Area)
Source: JICA Study Team
Location - 1 Location - 2 Location - 3
~ ~ ~ ~ ~
Moisture Content w % 1.89 2.95 1.90
- - -
- - -
Atterberg's Liquid Limit WL % NA NA NA
Limit Plastic Limit WP % NA NA NA
Plasticity Index IP NA NA NA
Grain Gravel, (76.20 ~ 4.75) mm % 7.33 3.68 9.24
Size Sand, (4.75 ~ 0.075) mm % 91.79 95.65 90.24
Analysis Silt, (0.075 ~ 0.005) mm %
Clay, (< 0.005 mm) %
Specific Gravity of Soil Gs (20˚C) 2.637 2.648 2.647
- - -
- - -
Unconfined - - -
Compression - - -
- - -
- - -
Sensitivity Ratio - - -
Maximun Dry Density dmax t/m3 1.786 1.736 1.732
Optimun Moisture Content Wopt % 13.20 14.40 15.60
Design CBR % 20 17 12
Cohesion C' kN/m2 - - -
Phi Angle ' Degree - - -
Cohesion C kN/m2 - - -
Phi Angle Degree - - -
Initial Void Ratio e 0 - - -
Conso. Yield Stress Py kN/m2 - - -
Compression Index Cc - - -
NOTEData used for reference are shown by red color.
0.53
SUMMARY OF SOIL TEST RESULTS
Project Name : Material Test for Bago River Bridge Construction Project
Material Test for Filling Location 2 KO TOE, Thida Jetty Compound, Thanlyin Township, Yangon Region
Sample No.
Depth (m)
%
Bulk Density t g/cm3
0.88 0.67
CompactionTest
ConsolidatedUndrainedTriaxial
CompressionTest
( Measurementof Pore
Consolidation
Soil Classification ( ASTM D 2487 - 06 )
Group Symbol
Unconfined CompressiveStrength
qu kN/m2
Failure Strain f
Group NamePoorly graded
sandPoorly graded
sandPoorly graded
sand
E50 kN/m2
SP SP SP
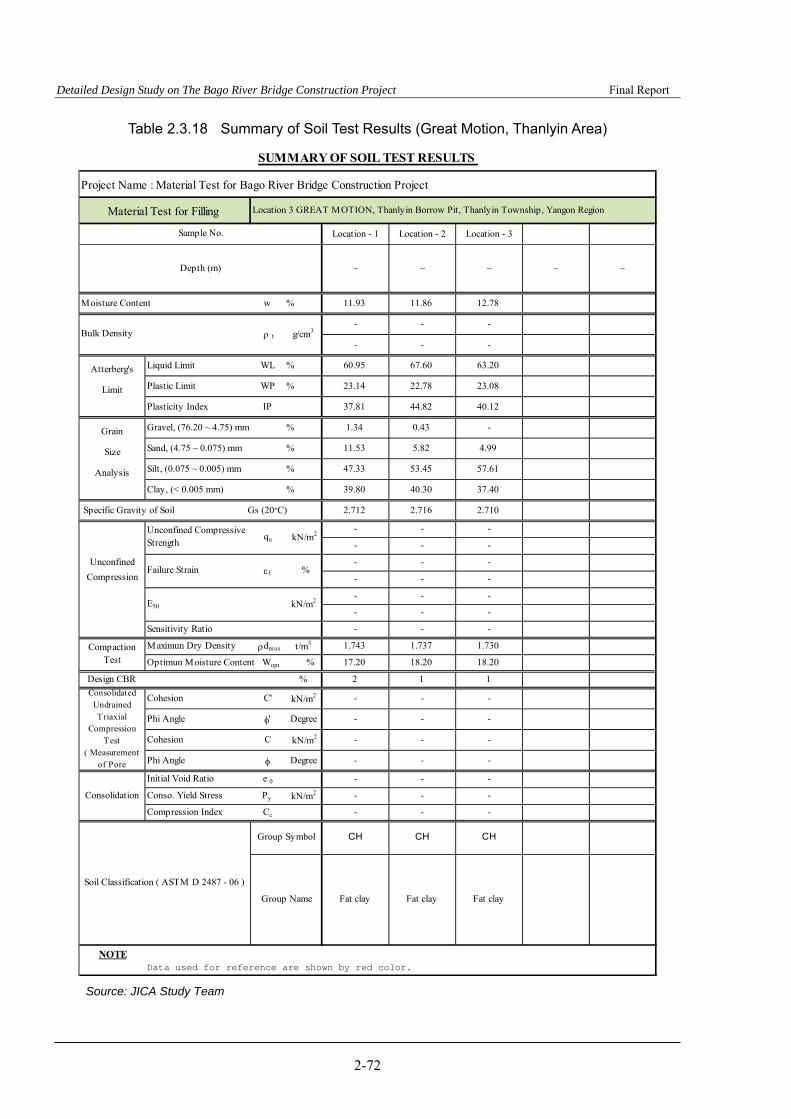
Detailed Design Study on The Bago River Bridge Construction Project Final Report
2-72
Table 2.3.18 Summary of Soil Test Results (Great Motion, Thanlyin Area)
Source: JICA Study Team
Location - 1 Location - 2 Location - 3
~ ~ ~ ~ ~
Moisture Content w % 11.93 11.86 12.78
- - -
- - -
Atterberg's Liquid Limit WL % 60.95 67.60 63.20
Limit Plastic Limit WP % 23.14 22.78 23.08
Plasticity Index IP 37.81 44.82 40.12
Grain Gravel, (76.20 ~ 4.75) mm % 1.34 0.43 -
Size Sand, (4.75 ~ 0.075) mm % 11.53 5.82 4.99
Analysis Silt, (0.075 ~ 0.005) mm % 47.33 53.45 57.61
Clay, (< 0.005 mm) % 39.80 40.30 37.40
Specific Gravity of Soil Gs (20˚C) 2.712 2.716 2.710
- - -
- - -
Unconfined - - -
Compression - - -
- - -
- - -
Sensitivity Ratio - - -
Maximun Dry Density dmax t/m3 1.743 1.737 1.730
Optimun Moisture Content Wopt % 17.20 18.20 18.20
Design CBR % 2 1 1
Cohesion C' kN/m2 - - -
Phi Angle ' Degree - - -
Cohesion C kN/m2 - - -
Phi Angle Degree - - -
Initial Void Ratio e 0 - - -
Conso. Yield Stress Py kN/m2 - - -
Compression Index Cc - - -
NOTEData used for reference are shown by red color.
SUMMARY OF SOIL TEST RESULTS
Project Name : Material Test for Bago River Bridge Construction Project
Material Test for Filling Location 3 GREAT MOTION, Thanlyin Borrow Pit, Thanlyin Township, Yangon Region
Sample No.
Depth (m)
Bulk Density t g/cm3
Unconfined CompressiveStrength
qu kN/m2
Failure Strain f %
E50 kN/m2
CompactionTest
ConsolidatedUndrainedTriaxial
CompressionTest
( Measurementof Pore
Consolidation
Soil Classification ( ASTM D 2487 - 06 )
Group Symbol CH CH CH
Group Name Fat clay Fat clay Fat clay
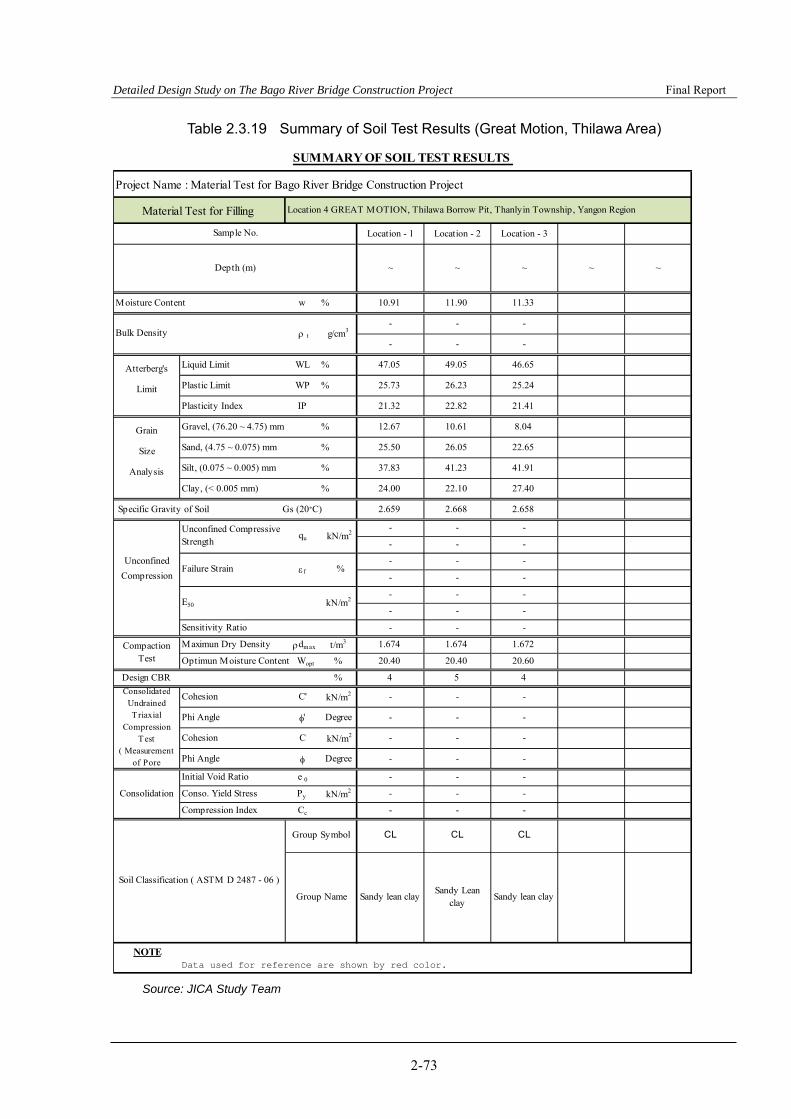
Detailed Design Study on The Bago River Bridge Construction Project Final Report
2-73
Table 2.3.19 Summary of Soil Test Results (Great Motion, Thilawa Area)
Source: JICA Study Team
Location - 1 Location - 2 Location - 3
~ ~ ~ ~ ~
Moisture Content w % 10.91 11.90 11.33
- - -
- - -
Atterberg's Liquid Limit WL % 47.05 49.05 46.65
Limit Plastic Limit WP % 25.73 26.23 25.24
Plasticity Index IP 21.32 22.82 21.41
Grain Gravel, (76.20 ~ 4.75) mm % 12.67 10.61 8.04
Size Sand, (4.75 ~ 0.075) mm % 25.50 26.05 22.65
Analysis Silt, (0.075 ~ 0.005) mm % 37.83 41.23 41.91
Clay, (< 0.005 mm) % 24.00 22.10 27.40
Specific Gravity of Soil Gs (20˚C) 2.659 2.668 2.658
- - -
- - -
Unconfined - - -
Compression - - -
- - -
- - -
Sensitivity Ratio - - -
Maximun Dry Density dmax t/m3 1.674 1.674 1.672
Optimun Moisture Content Wopt % 20.40 20.40 20.60
Design CBR % 4 5 4
Cohesion C' kN/m2 - - -
Phi Angle ' Degree - - -
Cohesion C kN/m2 - - -
Phi Angle Degree - - -
Initial Void Ratio e 0 - - -
Conso. Yield Stress Py kN/m2 - - -
Compression Index Cc - - -
NOTEData used for reference are shown by red color.
SUMMARY OF SOIL TEST RESULTS
Project Name : Material Test for Bago River Bridge Construction Project
Material Test for Filling Location 4 GREAT MOTION, Thilawa Borrow Pit, Thanlyin Township, Yangon Region
Sample No.
Depth (m)
Bulk Density t g/cm3
Unconfined CompressiveStrength
qu kN/m2
Failure Strain f %
E50 kN/m2
CompactionTest
ConsolidatedUndrainedTriaxial
CompressionTest
( Measurementof Pore
Consolidation
Soil Classification ( ASTM D 2487 - 06 )
Group Symbol CL CL CL
Group Name Sandy lean claySandy Lean
claySandy lean clay

Detailed Design Study on The Bago River Bridge Construction Project Final Report
2-74
Table 2.3.20 Summary of Soil Test Results (Aung Win, Kyauktan Area)
Source: JICA Study Team
Location - 1 Location - 2 Location - 3
~ ~ ~ ~ ~
Moisture Content w % 14.15 10.87 15.43
- - -
- - -
Atterberg's Liquid Limit WL % 30.78 20.91 39.35
Limit Plastic Limit WP % 17.94 10.81 21.91
Plasticity Index IP 12.84 10.10 17.44
Grain Gravel, (76.20 ~ 4.75) mm % 11.78 18.98 15.01
Size Sand, (4.75 ~ 0.075) mm % 42.80 43.73 41.42
Analysis Silt, (0.075 ~ 0.005) mm % 20.62 19.59 18.97
Clay, (< 0.005 mm) % 24.80 17.70 24.60
Specific Gravity of Soil Gs (20˚C) 2.641 2.624 2.635
- - -
- - -
Unconfined - - -
Compression - - -
- - -
- - -
Sensitivity Ratio - - -
Maximun Dry Density dmax t/m3 1.844 1.865 1.843
Optimun Moisture Content Wopt % 15.70 14.60 15.00
Design CBR % 34 5 4
Cohesion C' kN/m2 - - -
Phi Angle ' Degree - - -
Cohesion C kN/m2 - - -
Phi Angle Degree - - -
Initial Void Ratio e 0 - - -
Conso. Yield Stress Py kN/m2 - - -
Compression Index Cc - - -
NOTEData used for reference are shown by red color.
SUMMARY OF SOIL TEST RESULTS
Project Name : Material Test for Bago River Bridge Construction Project
Material Test for Filling Location 5 AUNG WIN, Kyauktan Township, Yangon Region
Sample No.
Depth (m)
Bulk Density t g/cm3
Unconfined CompressiveStrength
qu kN/m2
Failure Strain f %
E50 kN/m2
CompactionTest
ConsolidatedUndrainedTriaxial
CompressionTest
( Measurementof Pore
Consolidation
Soil Classification ( ASTM D 2487 - 06 )
Group Symbol SC SC SC
Group Name Clayey sandClayey sandwith gravel
Clayey sandwith gravel

Detailed Design Study on The Bago River Bridge Construction Project Final Report
2-75
2.3.3.3 Material Test for Subgrade
(1) Location of Surveys
The locations of surveys are shown in Figure 2.3.5.
The material sampling site was selected by price, quality, and supply area near the project site.
Source: JICA Study Team
Base material quarry
project site
Location No
Location 1
Mote Palin
Location 2
Thaton Location 3
Yin Nyein
Location 4
Zin Kyeik
Location 5
Paung
Approx.
145km
Approx.
251km Approx.
253km
Approx.
257km
Approx.
277km
Figure 2.3.5 Location of Surveys
The selected locations are shown in Table 2.3.21 to Table 2.3.25.
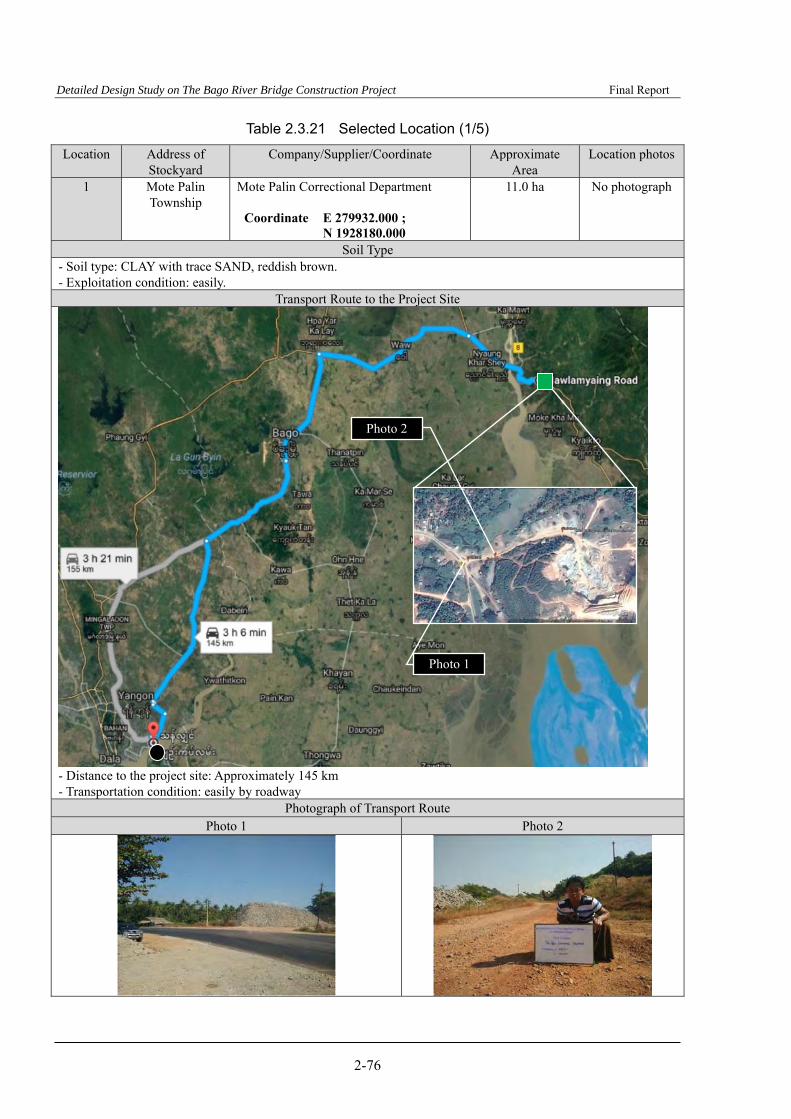
Detailed Design Study on The Bago River Bridge Construction Project Final Report
2-76
Table 2.3.21 Selected Location (1/5)
Location Address of Stockyard
Company/Supplier/Coordinate Approximate Area
Location photos
1 Mote Palin Township
Mote Palin Correctional Department
Coordinate E 279932.000 ; N 1928180.000
11.0 ha No photograph
Soil Type - Soil type: CLAY with trace SAND, reddish brown. - Exploitation condition: easily.
Transport Route to the Project Site
- Distance to the project site: Approximately 145 km - Transportation condition: easily by roadway
Photograph of Transport Route Photo 1 Photo 2
Photo 1
Photo 2

Detailed Design Study on The Bago River Bridge Construction Project Final Report
2-77
Table 2.3.22 Selected Location (2/5)
Location Address of Stockyard
Company/Supplier/Coordinate
Approximate Area
Location Photos
2 Thaton Township
Than Lwin Oo (Rock Production) Coordinate E327348.000 ;
N1860711.000
3.4 ha
Soil Type
- Soil type: CLAY with trace SAND, yellowish brown and yellowish gray mottled. - Exploitation condition: easily
Transport Route to the Project Site
- Distance to the project site: Approximately 251 km - Transportation condition: easily by roadway
Photograph of Transport Route Photo 1 Photo 2
Photo 1
Photo 2

Detailed Design Study on The Bago River Bridge Construction Project Final Report
2-78
Table 2.3.23 Selected Location (3/5)
Location Address of Stockyard
Company/Supplier/Coordinate Approximate Area
Location Photos
3 Yin Nyein Village
Inn Byaung Correctional Department
Coordinate E330380.000 ; N1853893.000
3.2 ha
Soil Type
- Soil type: CLAY with trace SAND, reddish brown. - Exploitative condition: easily.
Transport Route to the Project Site
- Distance to the project site: Approximately 253 km - Transportation condition: easily by roadway
Photograph of Transport Route Photo 1 Photo 2
Photo1
Photo2
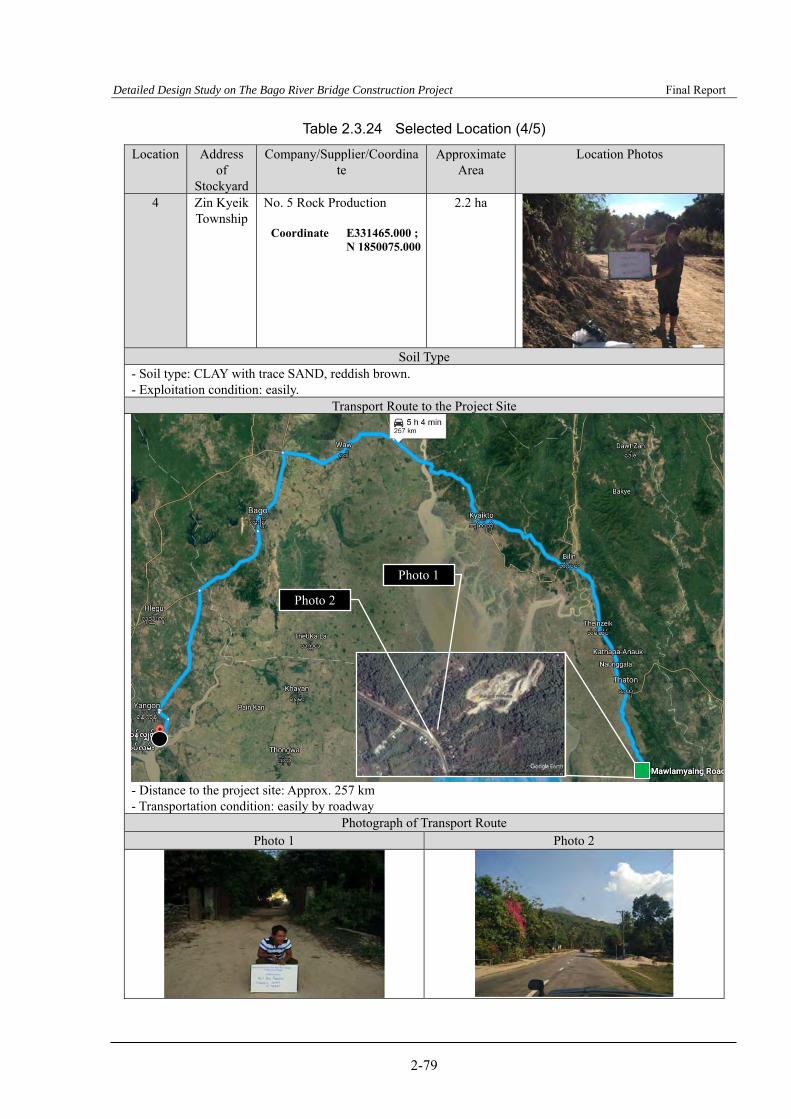
Detailed Design Study on The Bago River Bridge Construction Project Final Report
2-79
Table 2.3.24 Selected Location (4/5)
Location Address of
Stockyard
Company/Supplier/Coordinate
Approximate Area
Location Photos
4 Zin Kyeik Township
No. 5 Rock Production
Coordinate E331465.000 ; N 1850075.000
2.2 ha
Soil Type - Soil type: CLAY with trace SAND, reddish brown. - Exploitation condition: easily.
Transport Route to the Project Site
- Distance to the project site: Approx. 257 km - Transportation condition: easily by roadway
Photograph of Transport Route Photo 1 Photo 2
Photo 1
Photo 2
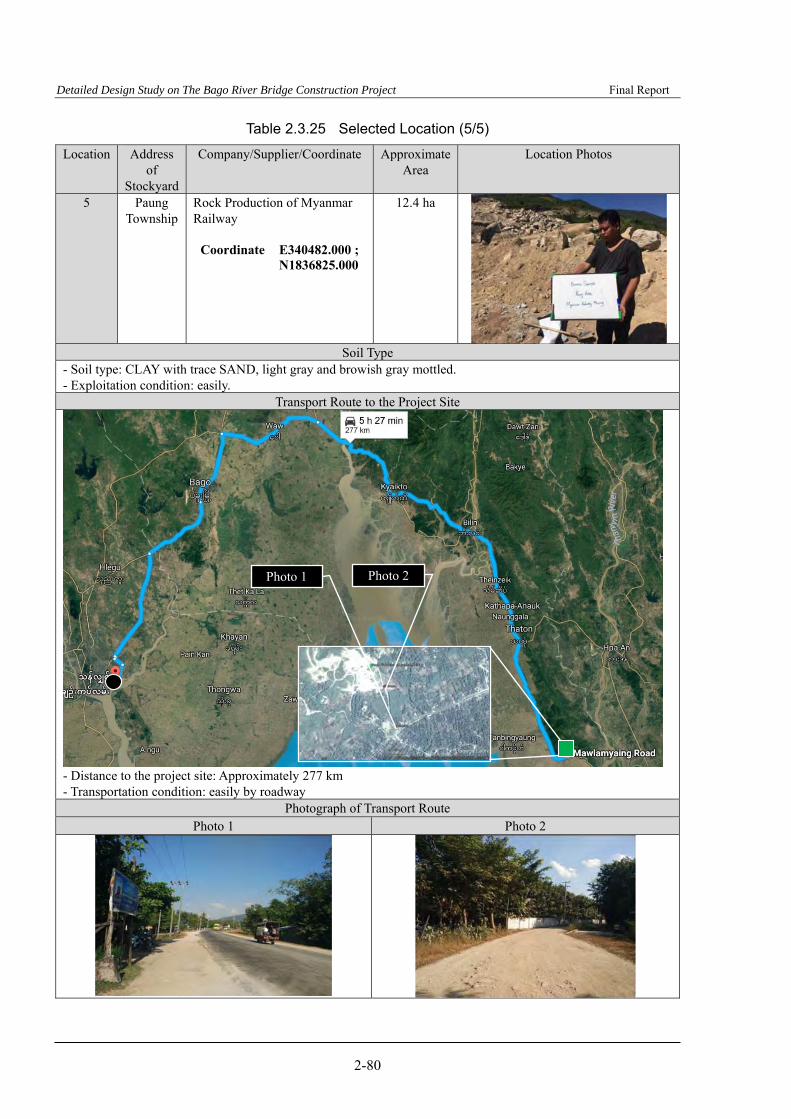
Detailed Design Study on The Bago River Bridge Construction Project Final Report
2-80
Table 2.3.25 Selected Location (5/5)
Location Address of
Stockyard
Company/Supplier/Coordinate Approximate Area
Location Photos
5 Paung Township
Rock Production of Myanmar Railway
Coordinate E340482.000 ; N1836825.000
12.4 ha
Soil Type
- Soil type: CLAY with trace SAND, light gray and browish gray mottled. - Exploitation condition: easily.
Transport Route to the Project Site
- Distance to the project site: Approximately 277 km - Transportation condition: easily by roadway
Photograph of Transport Route Photo 1 Photo 2
Photo 1 Photo 2
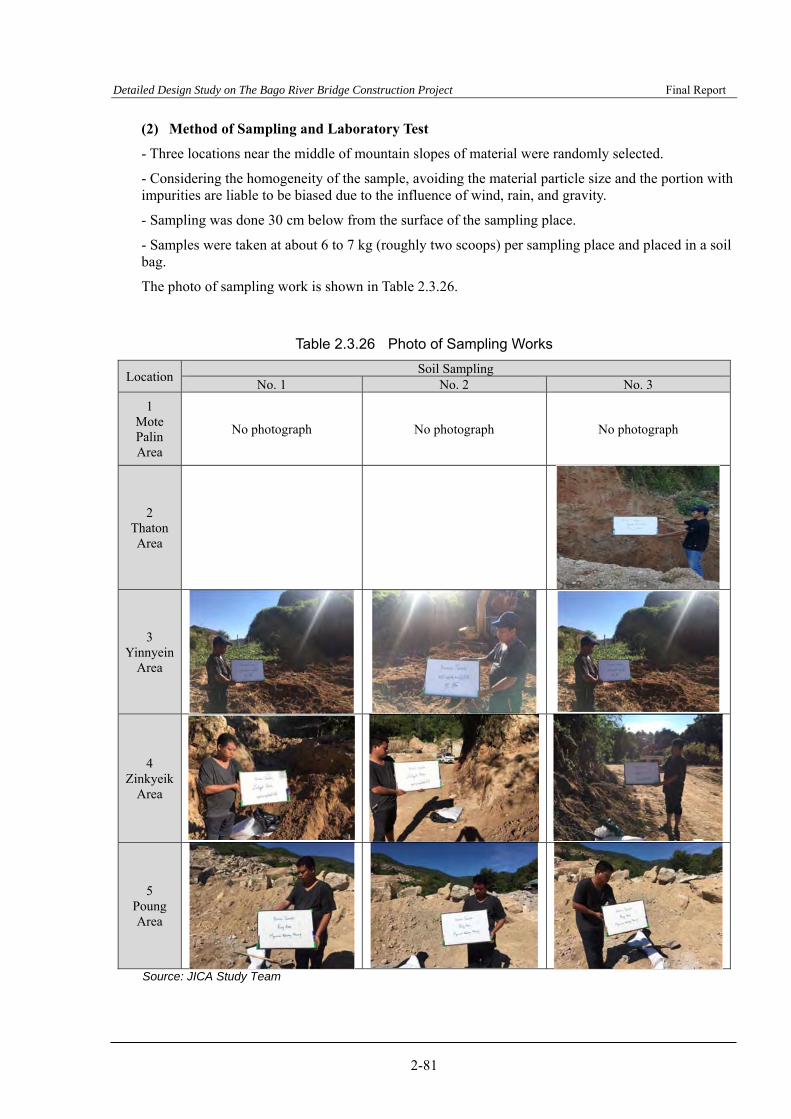
Detailed Design Study on The Bago River Bridge Construction Project Final Report
2-81
(2) Method of Sampling and Laboratory Test
- Three locations near the middle of mountain slopes of material were randomly selected.
- Considering the homogeneity of the sample, avoiding the material particle size and the portion with impurities are liable to be biased due to the influence of wind, rain, and gravity.
- Sampling was done 30 cm below from the surface of the sampling place.
- Samples were taken at about 6 to 7 kg (roughly two scoops) per sampling place and placed in a soil bag.
The photo of sampling work is shown in Table 2.3.26.
Table 2.3.26 Photo of Sampling Works
Location Soil Sampling
No. 1 No. 2 No. 3
1 Mote Palin Area
No photograph No photograph No photograph
2 Thaton Area
3 Yinnyein
Area
4 Zinkyeik
Area
5 Poung Area
Source: JICA Study Team

Detailed Design Study on The Bago River Bridge Construction Project Final Report
2-82
The laboratory soil tests are shown in Table 2.3.27.
Table 2.3.27 Laboratory Soil Tests
Testing Items Unit Qty. Applied Standards 1) Natural Moisture Content nos. 15 ASTM D 2216 -Find the ratio of water and the soil included in the soil.
2) Specific Gravity nos. 15 ASTM D 854 -Find the average mass per unit volume of the soil particle part constituting the soil.
3) Plastic Limit nos. 15 ASTM D 4318 -Find the boundary between plastic and semi-solid.
4) Liquid Limit nos. 15 ASTM D 4318 -Find the boundary between liquid and plastic.
5) Sieve analysis nos. 15 ASTM D 422 -Separate each particle size of soil and obtain the weight percentage.
6) Hydrometer test nos. 15 ASTM D 422 -Separate each particle size of soil and obtain the weight percentage.
7) Compaction test nos. 15 ASTM D 1557 -Find the reference density required for embankment management.
8) Modified CBR test nos. 15 ASTM D 1883 -Evaluate the strength of the subgrade and roadbed. Source: JICA Study Team
(3) Survey Results
The laboratory test results are shown in Table 2.3.28 to Table 2.3.32.
Based on the laboratory test results, all soils are sandy soil location. The maximum dry density of Paung and Zin Kyeik location is more than 2 t/m3. The modified CBR results are more than 50 in average.
The maximum dry density of Thaton and Yinnyein locations is also 1.9 t/m3 in average. The average modified CBR values are also 40 in average.
Table 2.3.28 Summary of Soil Test Results (Mote Palin Area)

Detailed Design Study on The Bago River Bridge Construction Project Final Report
2-83
Source: JICA Study Team
Table 2.3.29 Summary of Soil Test Results (Thaton Area)
Location - 1 Location - 2 Location - 3
~ ~ ~ ~ ~
Moisture Content w % 19.46 32.89 28.47
- - -
- - -
Atterberg's Liquid Limit WL % 41.56 41.44 38.38
Limit Plastic Limit WP % 32.40 34.12 31.65
Plasticity Index IP 9.16 7.32 6.73
Grain Gravel, (76.20 ~ 4.75) mm % 9.96 8.81 8.93
Size Sand, (4.75 ~ 0.075) mm % 53.22 53.51 55.05
Analysis Silt, (0.075 ~ 0.005) mm % 30.82 30.07 28.92
Clay, (< 0.005 mm) % 6.00 7.60 7.10
Specific Gravity of Soil Gs (20˚C) 2.636 2.670 2.672
- - -
- - -
Unconfined - - -
Compression - - -
- - -
- - -
Sensitivity Ratio - - -
Maximun Dry Density dmax t/m3 1.744 1.730 1.767
Optimun Moisture Content Wopt % 17.70 18.50 16.60
(%) 26.50 31.40 36.80
Cohesion C' kN/m2 - - -
Phi Angle ' Degree - - -
Cohesion C kN/m2 - - -
Phi Angle Degree - - -
Initial Void Ratio e 0 - - -
Conso. Yield Stress Py kN/m2 - - -
Compression Index Cc - - -
NOTEData used for reference are shown by red color.
Consolidation
Silty sand Silty sand
qu
SM
ConsolidatedUndrainedTriaxial
CompressionTest
( Measurement
Modified CBR (dmax - 95 %)
Silty sandGroup Name
Group Symbol
Unconfined CompressiveStrength
E50
SM
f
Location 1 Moke Palin Correctional Department, Moke Palin Area, Mon State
Sample No.
Depth (m)
kN/m2
t g/cm3Bulk Density
SUMMARY OF SOIL TEST RESULTS
kN/m2
Failure Strain %
Project Name : Material Test for Bago River Bridge Construction Project
CompactionTest
Soil Classification ( ASTM D 2487 - 06 )
SM
Material Test for Subgrade

Detailed Design Study on The Bago River Bridge Construction Project Final Report
2-84
Source: JICA Study Team
Location - 1 Location - 2 Location - 3
~ ~ ~ ~ ~
Moisture Content w % 12.06 14.27 7.84
- - -
- - -
Atterberg's Liquid Limit WL % 35.30 33.72 34.64
Limit Plastic Limit WP % 30.62 29.31 28.36
Plasticity Index IP 4.68 4.41 6.28
Grain Gravel, (76.20 ~ 4.75) mm % 5.78 7.57 7.17
Size Sand, (4.75 ~ 0.075) mm % 64.42 62.77 66.11
Analysis Silt, (0.075 ~ 0.005) mm % 22.30 22.66 19.93
Clay, (< 0.005 mm) % 7.50 7.00 6.80
Specific Gravity of Soil Gs (20˚C) 2.579 2.596 2.609
- - -
- - -
Unconfined - - -
Compression - - -
- - -
- - -
Sensitivity Ratio - - -
Maximun Dry Density dmax t/m3 1.957 1.909 1.934
Optimun Moisture Content Wopt % 11.50 13.00 11.70
(%) 42.70 61.10 22.50
Cohesion C' kN/m2 - - -
Phi Angle ' Degree - - -
Cohesion C kN/m2 - - -
Phi Angle Degree - - -
Initial Void Ratio e 0 - - -
Conso. Yield Stress Py kN/m2 - - -
Compression Index Cc - - -
NOTEData used for reference are shown by red color.
SM SM
Group Name Silty sand Silty sand Silty sand
Modified CBR (dmax - 95 %)Consolidated
UndrainedTriaxial
CompressionTest
( Measurement
Consolidation
Soil Classification ( ASTM D 2487 - 06 )
Group Symbol SM
Failure Strain f %
E50 kN/m2
CompactionTest
Bulk Density t g/cm3
Unconfined CompressiveStrength
qu kN/m2
SUMMARY OF SOIL TEST RESULTS
Project Name : Material Test for Bago River Bridge Construction Project
Material Test for Subgrade Location 2 Than Lwin Oo Rock Production, Thaton Area, Mon State
Sample No.
Depth (m)
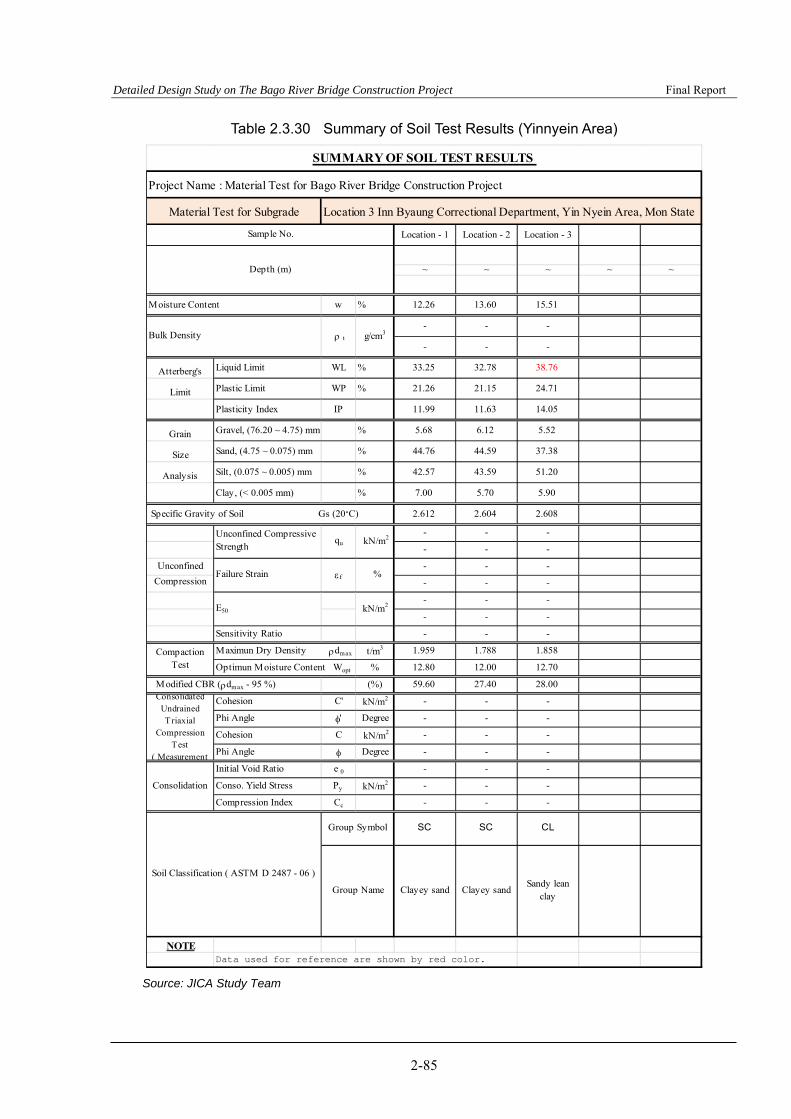
Detailed Design Study on The Bago River Bridge Construction Project Final Report
2-85
Table 2.3.30 Summary of Soil Test Results (Yinnyein Area)
Source: JICA Study Team
Location - 1 Location - 2 Location - 3
~ ~ ~ ~ ~
Moisture Content w % 12.26 13.60 15.51
- - -
- - -
Atterberg's Liquid Limit WL % 33.25 32.78 38.76
Limit Plastic Limit WP % 21.26 21.15 24.71
Plasticity Index IP 11.99 11.63 14.05
Grain Gravel, (76.20 ~ 4.75) mm % 5.68 6.12 5.52
Size Sand, (4.75 ~ 0.075) mm % 44.76 44.59 37.38
Analysis Silt, (0.075 ~ 0.005) mm % 42.57 43.59 51.20
Clay, (< 0.005 mm) % 7.00 5.70 5.90
Specific Gravity of Soil Gs (20˚C) 2.612 2.604 2.608
- - -
- - -
Unconfined - - -
Compression - - -
- - -
- - -
Sensitivity Ratio - - -
Maximun Dry Density dmax t/m3 1.959 1.788 1.858
Optimun Moisture Content Wopt % 12.80 12.00 12.70
(%) 59.60 27.40 28.00
Cohesion C' kN/m2 - - -
Phi Angle ' Degree - - -
Cohesion C kN/m2 - - -
Phi Angle Degree - - -
Initial Void Ratio e 0 - - -
Conso. Yield Stress Py kN/m2 - - -
Compression Index Cc - - -
NOTEData used for reference are shown by red color.
SUMMARY OF SOIL TEST RESULTS
kN/m2
Failure Strain %
Project Name : Material Test for Bago River Bridge Construction Project
CompactionTest
Soil Classification ( ASTM D 2487 - 06 )
SC
Modified CBR (dmax - 95 %)
Material Test for Subgrade Location 3 Inn Byaung Correctional Department, Yin Nyein Area, Mon State
Sample No.
Depth (m)
kN/m2
t g/cm3Bulk Density
Clayey sandGroup Name
Group Symbol
Unconfined CompressiveStrength
E50
SC
f
Consolidation
Clayey sandSandy lean
clay
qu
CL
ConsolidatedUndrainedTriaxial
CompressionTest
( Measurement
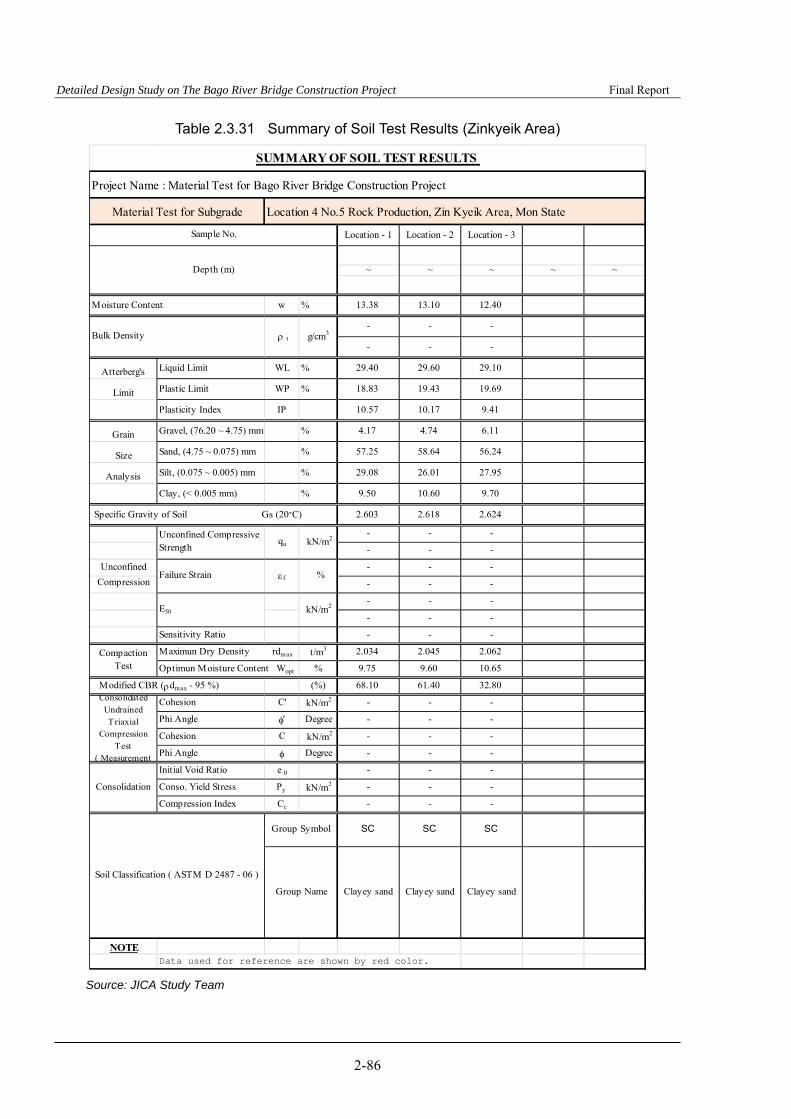
Detailed Design Study on The Bago River Bridge Construction Project Final Report
2-86
Table 2.3.31 Summary of Soil Test Results (Zinkyeik Area)
Source: JICA Study Team
Location - 1 Location - 2 Location - 3
~ ~ ~ ~ ~
Moisture Content w % 13.38 13.10 12.40
- - -
- - -
Atterberg's Liquid Limit WL % 29.40 29.60 29.10
Limit Plastic Limit WP % 18.83 19.43 19.69
Plasticity Index IP 10.57 10.17 9.41
Grain Gravel, (76.20 ~ 4.75) mm % 4.17 4.74 6.11
Size Sand, (4.75 ~ 0.075) mm % 57.25 58.64 56.24
Analysis Silt, (0.075 ~ 0.005) mm % 29.08 26.01 27.95
Clay, (< 0.005 mm) % 9.50 10.60 9.70
Specific Gravity of Soil Gs (20˚C) 2.603 2.618 2.624
- - -
- - -
Unconfined - - -
Compression - - -
- - -
- - -
Sensitivity Ratio - - -
Maximun Dry Density rdmax t/m3 2.034 2.045 2.062
Optimun Moisture Content Wopt % 9.75 9.60 10.65
(%) 68.10 61.40 32.80
Cohesion C' kN/m2 - - -
Phi Angle ' Degree - - -
Cohesion C kN/m2 - - -
Phi Angle Degree - - -
Initial Void Ratio e 0 - - -
Conso. Yield Stress Py kN/m2 - - -
Compression Index Cc - - -
NOTEData used for reference are shown by red color.
Consolidation
Clayey sand Clayey sand
qu
SC
ConsolidatedUndrainedTriaxial
CompressionTest
( Measurement
Clayey sandGroup Name
Group Symbol
Unconfined CompressiveStrength
E50
SC
f
Material Test for Subgrade Location 4 No.5 Rock Production, Zin Kyeik Area, Mon State
Sample No.
Depth (m)
kN/m2
t g/cm3Bulk Density
SUMMARY OF SOIL TEST RESULTS
kN/m2
Failure Strain %
Project Name : Material Test for Bago River Bridge Construction Project
CompactionTest
Soil Classification ( ASTM D 2487 - 06 )
SC
Modified CBR (dmax - 95 %)

Detailed Design Study on The Bago River Bridge Construction Project Final Report
2-87
Table 2.3.32 Summary of Soil Test Results (Poung Area)
Source: JICA Study Team
Location - 1 Location - 2 Location - 3
~ ~ ~ ~ ~
Moisture Content w % 5.24 6.96 6.84
- - -
- - -
Atterberg's Liquid Limit WL % 21.92 23.34 26.27
Limit Plastic Limit WP % 17.41 18.04 20.50
Plasticity Index IP 4.51 5.30 5.77
Grain Gravel, (76.20 ~ 4.75) mm % 24.45 23.51 13.49
Size Sand, (4.75 ~ 0.075) mm % 66.82 65.32 75.05
Analysis Silt, (0.075 ~ 0.005) mm % 5.23 7.17 7.16
Clay, (< 0.005 mm) % 3.50 4.00 4.30
Specific Gravity of Soil Gs (20˚C) 2.619 2.612 2.626
- - -
- - -
Unconfined - - -
Compression - - -
- - -
- - -
Sensitivity Ratio - - -
Maximun Dry Density dmax t/m3 2.042 2.162 2.045
Optimun Moisture Content Wopt % 8.20 7.15 8.30
(%) 74.00 15.60 99.50
Cohesion C' kN/m2 - - -
Phi Angle ' Degree - - -
Cohesion C kN/m2 - - -
Phi Angle Degree - - -
Initial Void Ratio e 0 - - -
Conso. Yield Stress Py kN/m2 - - -
Compression Index Cc - - -
NOTEData used for reference are shown by red color.
SP - SC SP -SC
Group Name
Poorly gradedsand with clayand gravel (orsilty clay and
gravel
Poorly gradedsand with clayand gravel (orsilty clay and
gravel
Poorly gradedsand with clay(or silty clay)
Modified CBR (dmax - 95 %)Consolidated
UndrainedTriaxial
CompressionTest
( Measurement
Consolidation
Soil Classification ( ASTM D 2487 - 06 )
Group Symbol SP - SC
Failure Strain f %
E50 kN/m2
CompactionTest
Bulk Density t g/cm3
Unconfined CompressiveStrength
qu kN/m2
SUMMARY OF SOIL TEST RESULTS
Project Name : Material Test for Bago River Bridge Construction Project
Material Test for Subgrade Location 5 Rock Production of Myanmar Railway, Paung Area, Mon State
Sample No.
Depth (m)
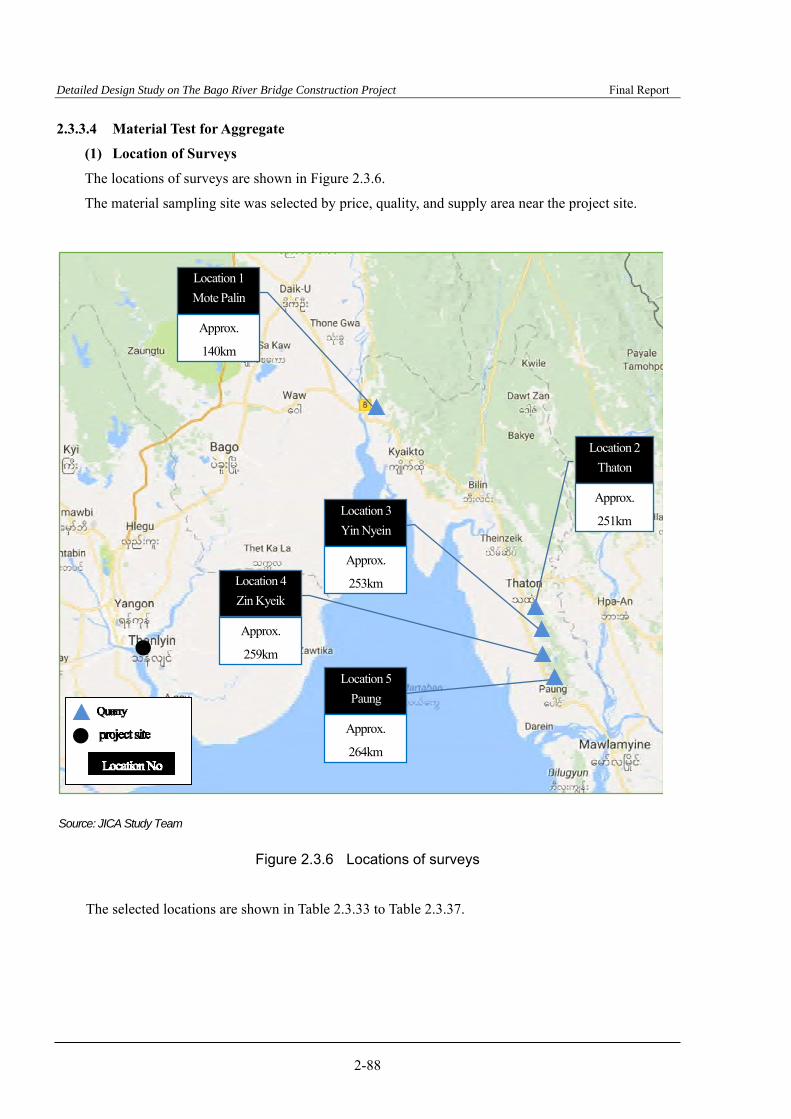
Detailed Design Study on The Bago River Bridge Construction Project Final Report
2-88
2.3.3.4 Material Test for Aggregate
(1) Location of Surveys
The locations of surveys are shown in Figure 2.3.6.
The material sampling site was selected by price, quality, and supply area near the project site.
Source: JICA Study Team
Location 1
Mote Palin
Location 2
Thaton
Location 3
Yin Nyein
Location 4
Zin Kyeik
Location 5
Paung
Approx.
140km
Approx.
251km
Approx.
253km
Approx.
259km
Approx.
264km
Figure 2.3.6 Locations of surveys
The selected locations are shown in Table 2.3.33 to Table 2.3.37.

Detailed Design Study on The Bago River Bridge Construction Project Final Report
2-89
Table 2.3.33 Selected location (1/5)
Location Address of Stockyard
Company/Supplier/Coordinate Approximate Area
Location Photos
1 Mote Palin Township
Royal Yoma Co., Ltd.
Coordinate E276440.000 ; N1930167.000
2.0 ha
Transport Route to the Project Site
- Distance to the project site: Approximately 150 km - Transportation condition: easily by roadway
Photograph of Transport Route Photo 1 Photo 2
Photo 1
Photo 2
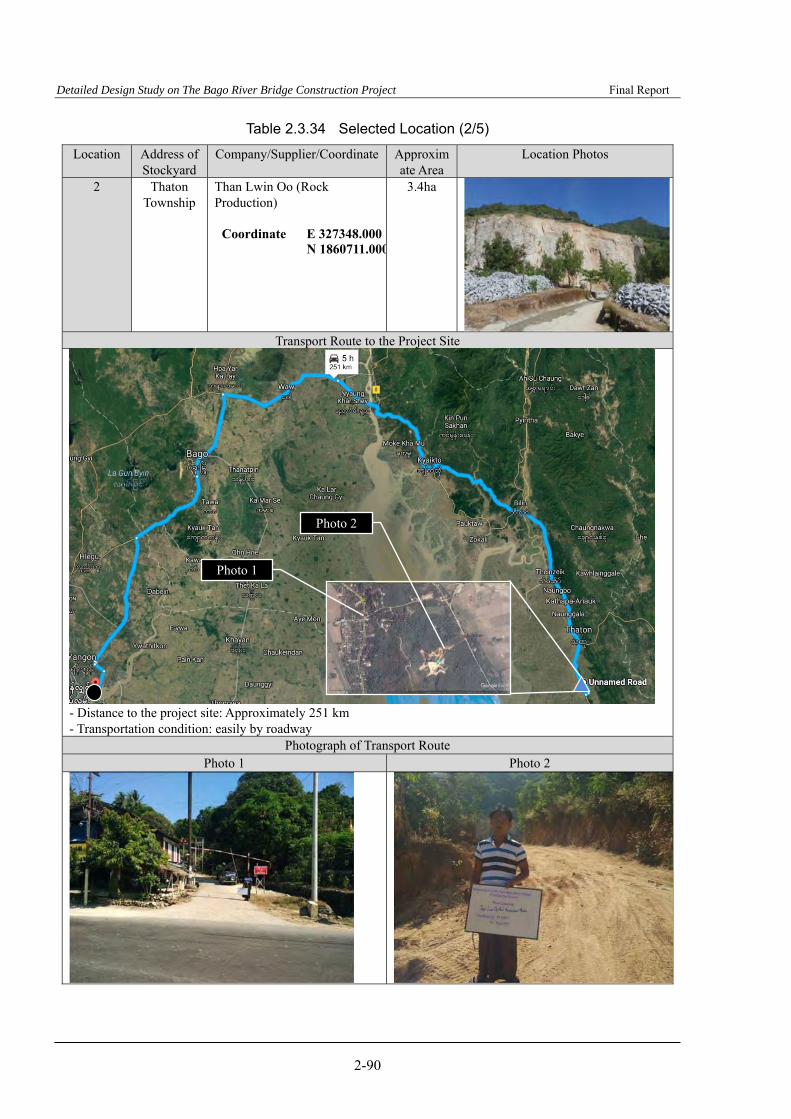
Detailed Design Study on The Bago River Bridge Construction Project Final Report
2-90
Table 2.3.34 Selected Location (2/5)
Location Address of Stockyard
Company/Supplier/Coordinate Approximate Area
Location Photos
2 Thaton Township
Than Lwin Oo (Rock Production)
Coordinate E 327348.000 N 1860711.000
3.4ha
Transport Route to the Project Site
- Distance to the project site: Approximately 251 km - Transportation condition: easily by roadway
Photograph of Transport Route Photo 1 Photo 2
Photo 1
Photo 2

Detailed Design Study on The Bago River Bridge Construction Project Final Report
2-91
Table 2.3.35 Selected Location (3/5)
Location Address of Stockyard
Company/Supplier/Coordinate Approximate Area
Location Photos
3 Yin Nyein Village
Inn Byaung Correctional Department
Coordinate E 330380.000 ; N 1853893.000
3.2 ha No photography
Transport Route to the Project Site
- Distance to the project site: Approximately 253 km - Transportation condition: easily by roadway
Photograph of Transport Route Photo 1 Photo 2
Photo1
Photo2
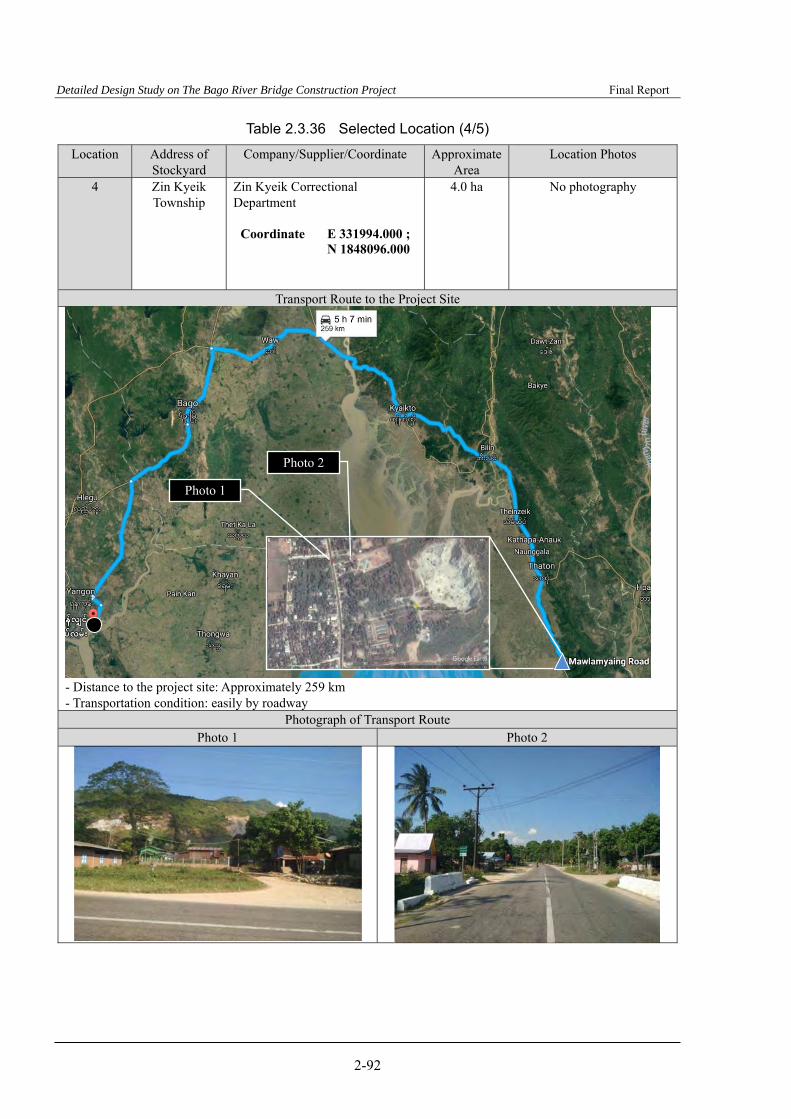
Detailed Design Study on The Bago River Bridge Construction Project Final Report
2-92
Table 2.3.36 Selected Location (4/5)
Location Address of Stockyard
Company/Supplier/Coordinate Approximate Area
Location Photos
4 Zin Kyeik Township
Zin Kyeik Correctional Department
Coordinate E 331994.000 ; N 1848096.000
4.0 ha No photography
Transport Route to the Project Site
- Distance to the project site: Approximately 259 km - Transportation condition: easily by roadway
Photograph of Transport Route Photo 1 Photo 2
Photo 1
Photo 2
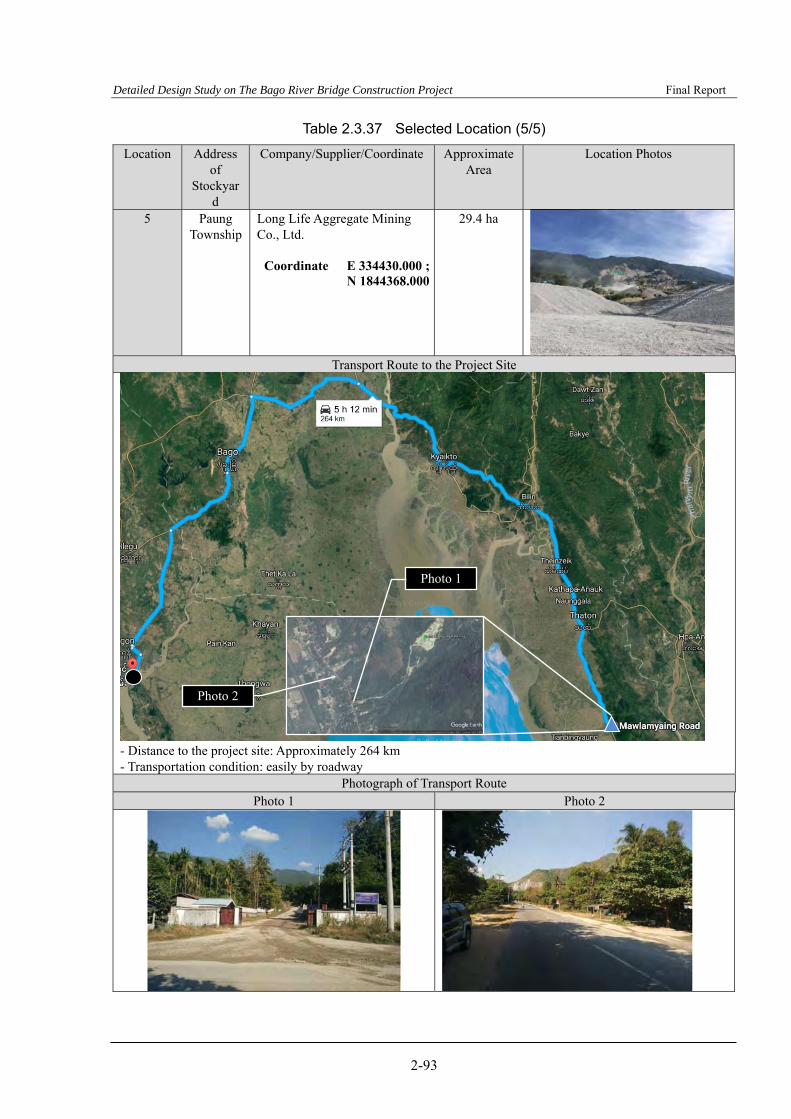
Detailed Design Study on The Bago River Bridge Construction Project Final Report
2-93
Table 2.3.37 Selected Location (5/5)
Location Address of
Stockyard
Company/Supplier/Coordinate Approximate Area
Location Photos
5 Paung Township
Long Life Aggregate Mining Co., Ltd.
Coordinate E 334430.000 ; N 1844368.000
29.4 ha
Transport Route to the Project Site
- Distance to the project site: Approximately 264 km - Transportation condition: easily by roadway
Photograph of Transport Route Photo 1 Photo 2
Photo 1
Photo 2
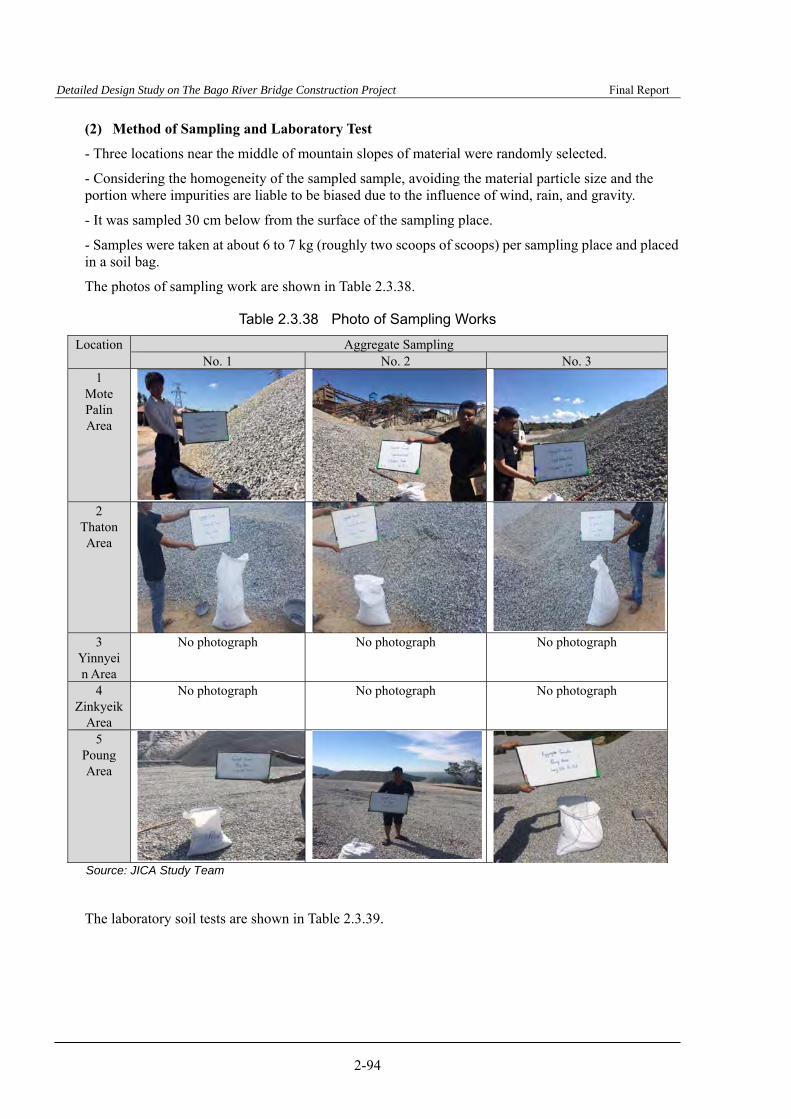
Detailed Design Study on The Bago River Bridge Construction Project Final Report
2-94
(2) Method of Sampling and Laboratory Test
- Three locations near the middle of mountain slopes of material were randomly selected.
- Considering the homogeneity of the sampled sample, avoiding the material particle size and the portion where impurities are liable to be biased due to the influence of wind, rain, and gravity.
- It was sampled 30 cm below from the surface of the sampling place.
- Samples were taken at about 6 to 7 kg (roughly two scoops of scoops) per sampling place and placed in a soil bag.
The photos of sampling work are shown in Table 2.3.38.
Table 2.3.38 Photo of Sampling Works
Location Aggregate Sampling No. 1 No. 2 No. 3
1 Mote Palin Area
2 Thaton Area
3
Yinnyein Area
No photograph No photograph No photograph
4 Zinkyeik
Area
No photograph No photograph No photograph
5 Poung Area
Source: JICA Study Team
The laboratory soil tests are shown in Table 2.3.39.
Detailed Design Study on The Bago River Bridge Construction Project Final Report
2-95
Table 2.3.39 Laboratory Soil Tests
Testing Items Unit Qty. Applied Standards 1) Grain Size Analysis nos. 15 ASTM C 136 -Find the particle size of aggregate used for concrete.
2) Specific Gravity nos. 15 ASTM C 127 -Judge the general property of the aggregate and find absolute capacity of the aggregate in the combination
design of concrete. 3) Water Absorption nos. 15 ASTM C 127 -Find the cavity of the aggregate and the used quantity of water in the combination calculation of the concrete.
4) Abrasion nos. 15 ASTM C 535 -Find abrasion resistance of the aggregate. Source: JICA Study Team
(3) Survey Results
The laboratory test results are shown in Table 2.3.40 to Table 2.3.44.
Based on the laboratory test results, the main particular size of Moke Paline area, Paung area, and Zin Kyeik area is from 25 mm to 38 mm. On the other hand, the main size of Yinnyein area and Thaton area is from 12.5 mm to 25 mm. Hence, aggregate of Yinnyein area and Thaton area are relatively small.
Abrasion rate of Moke Paline area, Paung area, and Zin Kyeik area are less than 20%. Moreover, the one in Yinnyein area and Thaton area is less than 35%. According to JIS standard, the aggregates are suitable for the road since Grade 1 of road aggregate is not more than 35%.

Detailed Design Study on The Bago River Bridge Construction Project Final Report
2-96
Table 2.3.40 Summary of Aggregate Test Results (Mote Palin Area)
Source: JICA Study Team
(%) - - -
(%) - - -
(%) - - -
(%) - - -
(%) - - -
(%) - - -
(%) 2.76 0.46 2.23
(%) 76.83 45.19 71.39
(%) 17.87 41.14 23.48
(%) 2.24 12.53 2.53
(%) 0.07 0.33 0.20
(%) 0.03 0.10 0.03
(%) 0.01 0.01 0.02
Percent under 4.75 mm Sieve (%) 0.19 0.23 0.12
G, Bulk sp gr 2.654 2.661 2.662
G, Bulk sp gr (SSD) 2.664 2.671 2.673
G, Apparent sp gr 2.681 2.688 2.691
Absorption (%) 0.37 0.38 0.401
(%) 18.75 19.12 18.76
Location 1 Moke Palin Area, Moke Palin Township, Mon State
Sample No.
Sp Gr(ASTM C 127-
88)
Los Angeles Abrasion Test (ASTM C 535)
Sieve Analysisof Fine and
CoarseAggregates
(ASTM C 136)
Retain Percent on 125 mm Sieve
Retain Percent on 100 mm Sieve
Retain Percent on 90 mm Sieve
Retain Percent on 12.5 mm Sieve
Retain Percent on 6.3 mm Sieve
Retain Percent on 4.75 mm Sieve
SUMMARY OF AGGREGATE TEST RESULTS
Retain Percent on 63 mm Sieve
Retain Percent on 50 mm Sieve
Retain Percent on 38 mm Sieve
Retain Percent on 25 mm Sieve
Retain Percent on 19 mm Sieve
Project Name : Material Test for Bago River Bridge Construction Project
Moke PalinNo.1
Moke PalinNo.2
Moke PalinNo.3
Retain Percent on 75 mm Sieve
Retain Percent on 9.5 mm Sieve
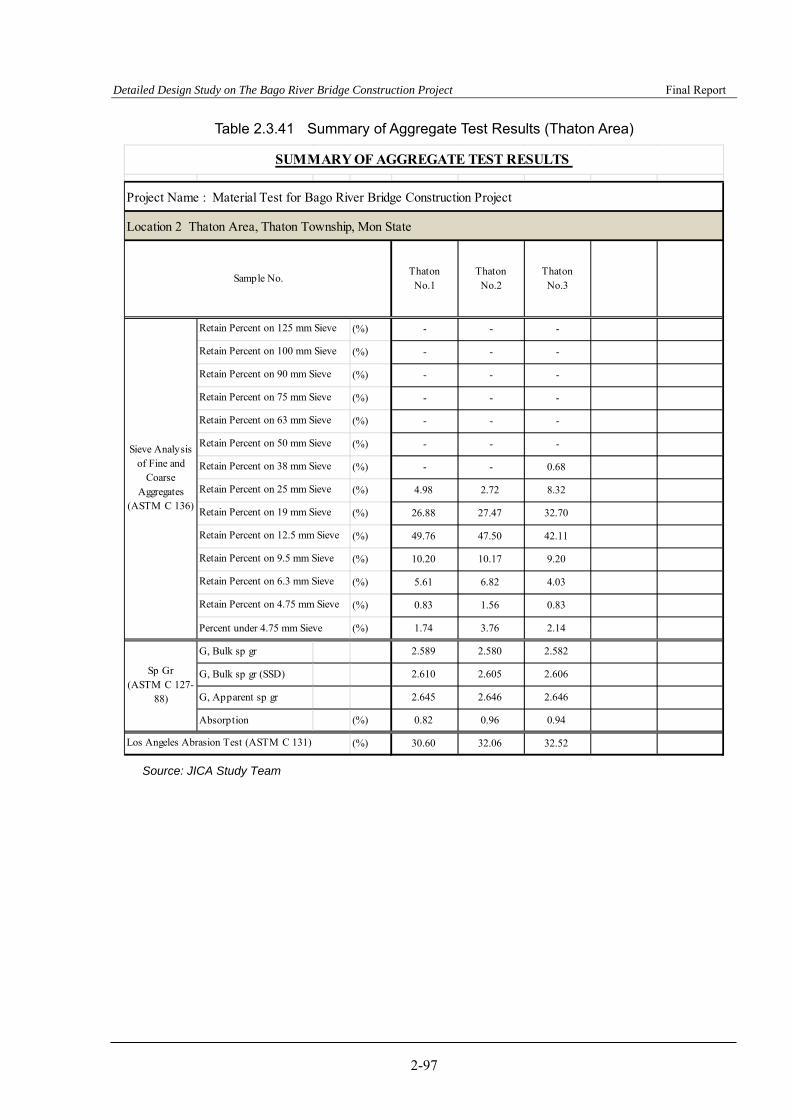
Detailed Design Study on The Bago River Bridge Construction Project Final Report
2-97
Table 2.3.41 Summary of Aggregate Test Results (Thaton Area)
Source: JICA Study Team
(%) - - -
(%) - - -
(%) - - -
(%) - - -
(%) - - -
(%) - - -
(%) - - 0.68
(%) 4.98 2.72 8.32
(%) 26.88 27.47 32.70
(%) 49.76 47.50 42.11
(%) 10.20 10.17 9.20
(%) 5.61 6.82 4.03
(%) 0.83 1.56 0.83
Percent under 4.75 mm Sieve (%) 1.74 3.76 2.14
G, Bulk sp gr 2.589 2.580 2.582
G, Bulk sp gr (SSD) 2.610 2.605 2.606
G, Apparent sp gr 2.645 2.646 2.646
Absorption (%) 0.82 0.96 0.94
(%) 30.60 32.06 32.52
Retain Percent on 12.5 mm Sieve
Retain Percent on 9.5 mm Sieve
Retain Percent on 6.3 mm Sieve
Retain Percent on 4.75 mm Sieve
Sp Gr(ASTM C 127-
88)
Los Angeles Abrasion Test (ASTM C 131)
Sieve Analysisof Fine and
CoarseAggregates
(ASTM C 136)
Retain Percent on 125 mm Sieve
Retain Percent on 100 mm Sieve
Retain Percent on 90 mm Sieve
Retain Percent on 75 mm Sieve
Retain Percent on 63 mm Sieve
Retain Percent on 50 mm Sieve
Retain Percent on 38 mm Sieve
Retain Percent on 25 mm Sieve
Retain Percent on 19 mm Sieve
SUMMARY OF AGGREGATE TEST RESULTS
Project Name : Material Test for Bago River Bridge Construction Project
Location 2 Thaton Area, Thaton Township, Mon State
Sample No.Thaton
No.1Thaton
No.2Thaton
No.3

Detailed Design Study on The Bago River Bridge Construction Project Final Report
2-98
Table 2.3.42 Summary of Aggregate Test Results (Yinnyein Area)
Source: JICA Study Team
(%) - - -
(%) - - -
(%) - - -
(%) - - -
(%) - - -
(%) - - -
(%) - - -
(%) 1.08 0.67 0.97
(%) 43.72 35.34 49.41
(%) 49.88 58.88 48.03
(%) 3.17 3.06 0.96
(%) 0.94 0.90 0.21
(%) 0.20 0.16 0.05
Percent under 4.75 mm Sieve (%) 1.01 1.01 0.38
G, Bulk sp gr 2.613 2.612 2.614
G, Bulk sp gr (SSD) 2.625 2.624 2.625
G, Apparent sp gr 2.644 2.644 2.644
Absorption (%) 0.45 0.45 0.43
(%) 21.86 22.55 23.40
Retain Percent on 12.5 mm Sieve
Retain Percent on 9.5 mm Sieve
Retain Percent on 6.3 mm Sieve
Retain Percent on 4.75 mm Sieve
Sp Gr(ASTM C 127-
88)
Los Angeles Abrasion Test (ASTM C 131)
Sieve Analysisof Fine and
CoarseAggregates
(ASTM C 136)
Retain Percent on 125 mm Sieve
Retain Percent on 100 mm Sieve
Retain Percent on 90 mm Sieve
Retain Percent on 75 mm Sieve
Retain Percent on 63 mm Sieve
Retain Percent on 50 mm Sieve
Retain Percent on 38 mm Sieve
Retain Percent on 25 mm Sieve
Retain Percent on 19 mm Sieve
SUMMARY OF AGGREGATE TEST RESULTS
Project Name : Material Test for Bago River Bridge Construction Project
Location 3 Yin Nyein Area, Paung Township, Mon State
Sample No.Yin Nyein
No.1Yin Nyein
No.2Yin Nyein
No.3

Detailed Design Study on The Bago River Bridge Construction Project Final Report
2-99
Table 2.3.43 Summary of Aggregate Test Results (Zinkyeik Area)
Source: JICA Study Team
(%) - - -
(%) - - -
(%) - - -
(%) - - -
(%) 2.56 - 3.27
(%) 15.28 9.37 17.74
(%) 34.39 29.63 37.77
(%) 38.01 51.03 31.59
(%) 8.31 8.26 7.31
(%) 1.12 1.30 1.82
(%) 0.05 0.04 0.12
(%) 0.07 0.04 0.12
(%) 0.02 0.02 0.04
Percent under 4.75 mm Sieve (%) 0.20 0.30 0.22
G, Bulk sp gr 2.632 2.624 2.630
G, Bulk sp gr (SSD) 2.641 2.632 2.639
G, Apparent sp gr 2.656 2.646 2.654
Absorption (%) 0.34 0.32 0.34
(%) 17.42 12.90 19.37
Retain Percent on 12.5 mm Sieve
Retain Percent on 9.5 mm Sieve
Retain Percent on 6.3 mm Sieve
Retain Percent on 4.75 mm Sieve
Sp Gr(ASTM C 127-
88)
Los Angeles Abrasion Test (ASTM C 535)
Sieve Analysisof Fine and
CoarseAggregates
(ASTM C 136)
Retain Percent on 125 mm Sieve
Retain Percent on 100 mm Sieve
Retain Percent on 90 mm Sieve
Retain Percent on 75 mm Sieve
Retain Percent on 63 mm Sieve
Retain Percent on 50 mm Sieve
Retain Percent on 38 mm Sieve
Retain Percent on 25 mm Sieve
Retain Percent on 19 mm Sieve
SUMMARY OF AGGREGATE TEST RESULTS
Project Name : Material Test for Bago River Bridge Construction Project
Location 4 Zin Kyeik Area, Paung Township, Mon State
Sample No.Zin Kyaik
No.1Zin Kyaik
No.2Zin Kyaik
No.3

Detailed Design Study on The Bago River Bridge Construction Project Final Report
2-100
Table 2.3.44 Summary of Aggregate Test Results (Poung Area)
Source: JICA Study Team
(%) - - -
(%) - - -
(%) - - -
(%) - - -
(%) 2.63 - -
(%) 7.50 13.26 4.60
(%) 37.56 38.04 37.46
(%) 45.31 41.80 50.13
(%) 5.73 5.37 6.58
(%) 0.98 1.13 0.92
(%) 0.05 0.10 0.10
(%) 0.04 0.08 0.05
(%) 0.01 0.03 0.01
Percent under 4.75 mm Sieve (%) 0.18 0.18 0.15
G, Bulk sp gr 2.620 2.620 2.621
G, Bulk sp gr (SSD) 2.630 2.629 2.630
G, Apparent sp gr 2.646 2.645 2.645
Absorption (%) 0.38 0.36 0.35
(%) 13.78 15.44 15.14
Retain Percent on 12.5 mm Sieve
Retain Percent on 9.5 mm Sieve
Retain Percent on 6.3 mm Sieve
Retain Percent on 4.75 mm Sieve
Sp Gr(ASTM C 127-
88)
Los Angeles Abrasion Test (ASTM C 535)
Sieve Analysisof Fine and
CoarseAggregates
(ASTM C 136)
Retain Percent on 125 mm Sieve
Retain Percent on 100 mm Sieve
Retain Percent on 90 mm Sieve
Retain Percent on 75 mm Sieve
Retain Percent on 63 mm Sieve
Retain Percent on 50 mm Sieve
Retain Percent on 38 mm Sieve
Retain Percent on 25 mm Sieve
Retain Percent on 19 mm Sieve
SUMMARY OF AGGREGATE TEST RESULTS
Project Name : Material Test for Bago River Bridge Construction Project
Location 5 Paung Area, Paung Township, Mon State
Sample No.PaungNo.1
PaungNo.2
PaungNo.3
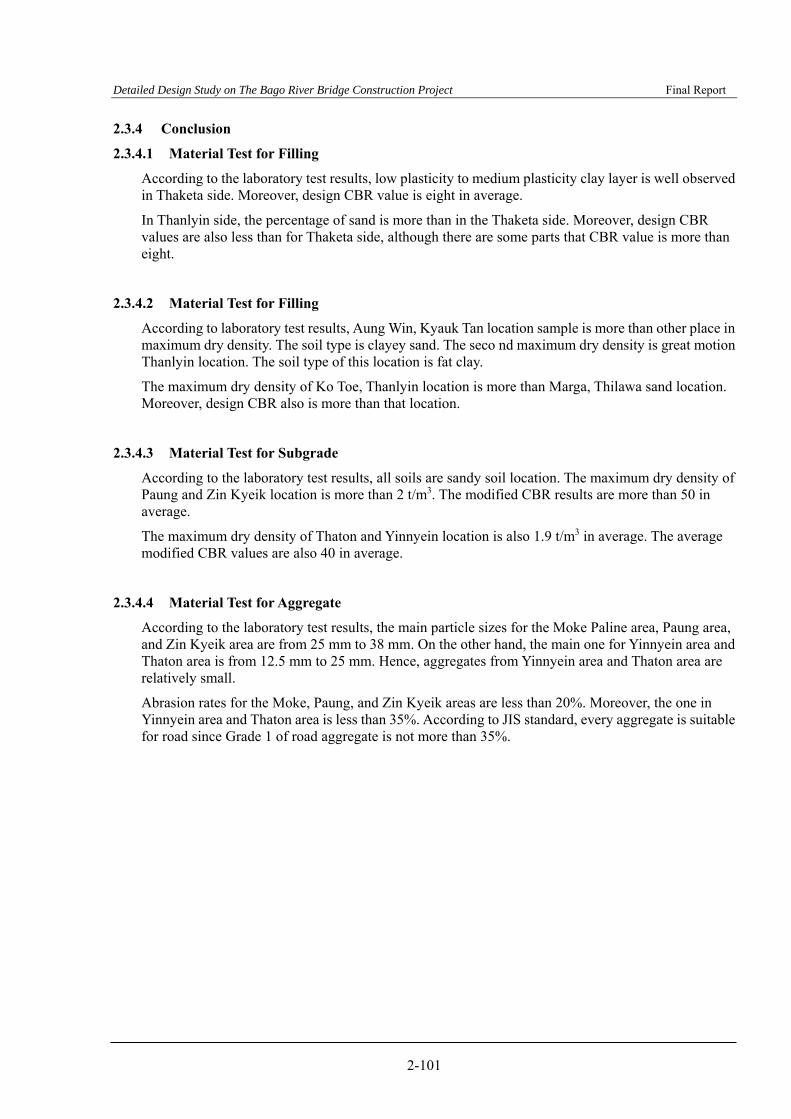
Detailed Design Study on The Bago River Bridge Construction Project Final Report
2-101
2.3.4 Conclusion
2.3.4.1 Material Test for Filling
According to the laboratory test results, low plasticity to medium plasticity clay layer is well observed in Thaketa side. Moreover, design CBR value is eight in average.
In Thanlyin side, the percentage of sand is more than in the Thaketa side. Moreover, design CBR values are also less than for Thaketa side, although there are some parts that CBR value is more than eight.
2.3.4.2 Material Test for Filling
According to laboratory test results, Aung Win, Kyauk Tan location sample is more than other place in maximum dry density. The soil type is clayey sand. The seco nd maximum dry density is great motion Thanlyin location. The soil type of this location is fat clay.
The maximum dry density of Ko Toe, Thanlyin location is more than Marga, Thilawa sand location. Moreover, design CBR also is more than that location.
2.3.4.3 Material Test for Subgrade
According to the laboratory test results, all soils are sandy soil location. The maximum dry density of Paung and Zin Kyeik location is more than 2 t/m3. The modified CBR results are more than 50 in average.
The maximum dry density of Thaton and Yinnyein location is also 1.9 t/m3 in average. The average modified CBR values are also 40 in average.
2.3.4.4 Material Test for Aggregate
According to the laboratory test results, the main particle sizes for the Moke Paline area, Paung area, and Zin Kyeik area are from 25 mm to 38 mm. On the other hand, the main one for Yinnyein area and Thaton area is from 12.5 mm to 25 mm. Hence, aggregates from Yinnyein area and Thaton area are relatively small.
Abrasion rates for the Moke, Paung, and Zin Kyeik areas are less than 20%. Moreover, the one in Yinnyein area and Thaton area is less than 35%. According to JIS standard, every aggregate is suitable for road since Grade 1 of road aggregate is not more than 35%.

Detailed Design Study on The Bago River Bridge Construction Project Final Report
2-102
2.4 RIVER AND HYDROLOGICAL SURVEY
In order to design the new bridge, it is necessary to collect and correlate the basic meteorological and hydraulic data. In this section, hydrological and hydraulic analysis shall be carried out based on hydrological data collection and river section and bathymetric survey.
2.4.1 Review of Hydrological Survey from F/S
Hydrological assessment was carried out in the F/S and planned values for the bridge design were estimated. River and hydrological surveys were conducted at the D/D stage for improving the precision of the result of the hydrological assessment in the F/S. The hydrological data collection survey and river section survey were conducted. The location of the New Bago Bridge is in a tidal reach making historical tide levels and other hydrological data very important. Furthermore, river section survey has not been carried out upstream of the new bridge location but rather estimated by previous bathymetric survey map which was based on Myanma Port Authority (MPA) datum. As a result, hydraulic analysis was conducted with MPA datum. At the F/S stage, the ground elevation of the land survey is supposed to be indicated as zero from MWL +3.121 m at Bo Aung Kyaw Street Wharf Station; however, the relationship of these two data as written above could not be confirmed, and thus, it shall be verified in this survey.
Table 2.4.1 shows the result of the hydrological study in the F/S stage. There were three candidates for new bridge location in the F/S stage and Option 3 in the table below was judged as the most suitable. Design H.W.L. was estimated by comparison between H.W.L., which was the calculated water level in case of 100-year flood and the probable water level at Yangon Port was calculated through statistical analysis. Hydraulic calculation shall obtain these two values with new river and hydrological data at the D/D stage.
Table 2.4.1 Planned Value for New Bago Bridge at F/S
Item Alternative 1 (Monkey Point
Plan)
Alternative 2 (Bago Point Plan)
Alternative 3 (Second Thanlyin Bridge
Plan)
Remarks
Design Discharge 18,292 (m3/s) 15,503 (m3/s) 14,398 (m3/s) 100-year flood
Design H.W.L. 7.7 (m) 7.7 (m) 7.7 (m) MPA-based Design H.W.L. 4.579 (m) 4.579 (m) 4.579 (m) Land survey
Source: The Preparatory Survey for The Project for Construction of Bago River Bridge
2.4.2 Outline of Hydrological Survey at D/D stage
Hydrological survey is composed of the hydrological data collection survey and river section survey. In the hydrological survey at D/D stage, the following items are conducted:
Source: JICA Study Team
Figure 2.4.1 Study Flow at D/D stage
Collecting meteorological and hydrological data from DMH
Survey of river cross section and riverbed
Collecting previous river survey result from MPA, DWIR
Revise hydraulic analysis model
Statistical analysis with extended data (discharge, water level (tide) level)
Hydraulic calculation
(DHWL, scoring, etc.)

Detailed Design Study on The Bago River Bridge Construction Project Final Report
2-103
2.4.3 Hydrological Data Collection Survey
Secondary hydrological data were collected from different government organizations such as the Department of Meteorology and Hydrology (DMH), Irrigation Department (ID), Myanmar Port Authority (MPA) and Navy. The list of each data collection item is shown in Table 2.4.2. This survey was carried out for improving preservation of statistical analysis and acquiring current/transition of river shape. The data book is attached in Appendix-11.
In this survey, if collected water/tide level data is not prepared by Amherst Mean Sea Level (MSL), it is modified to MSL. Since the relationship with MSL and other datum was unknown, the difference between the level in their datum was measured. It obtained that for MSL datum, ground elevation of land survey is +2.814 m at Monkey Point chart datum.
Table 2.4.2 Item List of Data Collection Survey
Source: JICA Study Team
Source: JICA Study Team
Figure 2.4.2 Relationship between MSL and MPA Chart Datum
No. Item Unit Remarks
M-1 Daily Rainfall during 2013-2015 mm Kaba-Aye station. 1095= 3 year * 365 days DMH
m3/sec Bago station during 2015 1= 1 year * 1 day DMH
m3/sec
Zaungtu station during2012-2015
4= 4 years * 1 day DMH
m3/sec
Khamonseik stationduring 2012-2015
4= 4 years * 1 day DMH
H-2Annual Maximum & MinimunWater\Tide Level at 2 stations
m MSL
More than 30 years atMonkey Point (Yangon)and Elephant Point(Estuary) stations
60= 30 years * 1 day *2stations
MPA
H-3 Daily Water Level at 1 station m MSLMore than 10-20 years atBawt Creek Sluice station
3650-= 10-20 years * 365 days ID
H-4Past useful bathymetric surveyresults
- DWIR, MNHC
Note. MoT: Ministry of Transport MPA: Myanmar Port AuthorityMoAH: Ministry of Agriculture and Irrigation ID: Irrigation DepartmentDMH: Department of Meteorology and Hydrology MNHC: Myanmar Naval Hydrographical CenterDWIR: Department of Water Resources and Improvement of River System
H-1Annual Maximum Discharge at 3stations
DWIR - Bathymetry survey (Dec. 2015)MNHC - Nautical chart (Jan. 2016)
Quantity
Meteorological Data Collection Related Organ.: DMH of MoT
Meteorological Data Collection Related Organ.: DMH and MPA of MoT, ID of MoAH

Detailed Design Study on The Bago River Bridge Construction Project Final Report
2-104
2.4.4 River Section and Bathymetric Survey
The profile/cross-section survey for river was conducted at the location of Figure 2.4.3 and Table 2.4.3. River section and bathymetric surveys were carried out by local consultants (Asia Air Survey Myanmar Co., Ltd). The survey was conducted to ground-survey portions on both banks from centerline of the river. In the river portions, it was performed by using an echo sounding machine and GPS for the bathymetric survey. The drawings of river sections are attached in Appendix-12.
Source: JICA Study Team
Figure 2.4.3 Survey Location
Table 2.4.3 Location of River Cross Section Survey
Source: JICA Study Team
X (m) Y (m) X (m) Y (m) L (m)Cross Section C- 1 203893.397 1853390.658 200529.369 1852174.488 3577.115 F/S location
C- 2 203177.998 1855870.984 201624.546 1856447.178 1656.868 F/S locationC- 3 203659.434 1856868.313 202683.342 1857913.420 1430.036 F/S locationC- 4 204367.397 1857240.911 203576.584 1858502.916 1489.310C- 5 205237.751 1857572.738 204406.285 1859011.418 1661.667 F/S locationC- 6 1686.716 F/S locationC- 7 205628.401 1857736.159 204769.924 1859221.578 1715.649 F/S locationC- 8 207012.397 1857903.495 205758.548 1860226.573 2639.854C- 9 208311.581 1858554.664 207194.788 1860730.592 2445.790
C- 10 209629.357 1859518.909 208793.569 1860888.159 1604.178Profile section P- 1 204815.777 1857830.529 205683.231 1858328.046 1000.000 F/S location
P- 2 204616.770 1858177.511 205484.224 1858675.028 1000.000 F/S locationP- 3 204417.763 1858524.493 205285.218 1859022.010 1000.000 F/S location
22907.183
( Same as Road/Bridge Center)
Total 13 sections
ItemID of River
Survey
Coordinates of River Survey Section by WGS84/UTM 47N Ground / BathymetricSurvey Length RemarksLeft Bank Right Bank

Detailed Design Study on The Bago River Bridge Construction Project Final Report
2-105
2.4.5 Meteorological Condition
Yangon's climate is tropical monsoonal type. Rainfall is highly seasonal, being concentrated in the hot humid months of the southwest monsoon (May to October). In contrast, the northwest monsoon (December to March) is relatively cool and dry. Occasionally, severe cyclones cross the Myanmar coast in the April-May period.
There are three observation stations of climatic data in and around Greater Yangon, which were installed and are operated by DMH of the Ministry of Transport (MoT), as shown in Table 2.4.4. Also, the locations of meteorological and hydrological stations are shown in Figure 2.4.4.
Table 2.4.4 Inventory of Meteorological Station
Meteorological
Station
Code
(WMO
)
Coordinates Height
(m)
Period of records
Remarks Latitud
e
Longit
ude
Temper
a-ture
Relative
Humidity
Rain
fall Sunshine
Evapo-
ration Wind
1. Kaba Aye
(Yangon) 48097 16-54 96-10 20 1968- 1968-
1968
- 1977- 1975- 1968-
2. Bago 48093 17-20 96-30 9 1965- 1965- 1965
- - - 1965-
3. Tharrawady 48088 17-38 95-48 15 1965- 1965- 1965
- - - 1965-
Source: DMH
Source: DMH, MPA, ID (Google Earth Map)
Figure 2.4.4 Location Map of Meteorological and Hydrological Stations
(1) Temperature
The monthly mean temperature ranges from 24.8℃ to 30.3℃ in and around Yangon. According to collected data, a mean monthly maximum temperature of 37.6℃ (April) and a mean minimum temperature of 16.2℃ (January) in the Yangon region were recorded respectively during the most recent 25 years.
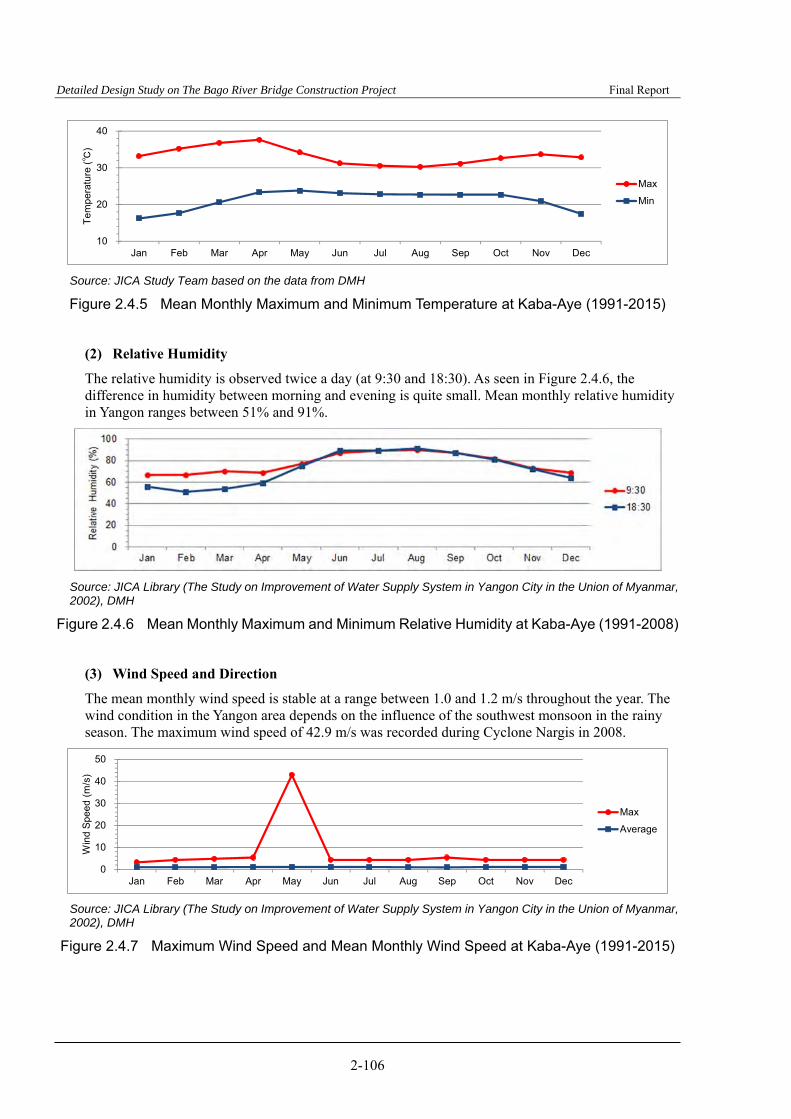
Detailed Design Study on The Bago River Bridge Construction Project Final Report
2-106
Source: JICA Study Team based on the data from DMH
Figure 2.4.5 Mean Monthly Maximum and Minimum Temperature at Kaba-Aye (1991-2015)
(2) Relative Humidity
The relative humidity is observed twice a day (at 9:30 and 18:30). As seen in Figure 2.4.6, the difference in humidity between morning and evening is quite small. Mean monthly relative humidity in Yangon ranges between 51% and 91%.
Source: JICA Library (The Study on Improvement of Water Supply System in Yangon City in the Union of Myanmar, 2002), DMH
Figure 2.4.6 Mean Monthly Maximum and Minimum Relative Humidity at Kaba-Aye (1991-2008)
(3) Wind Speed and Direction
The mean monthly wind speed is stable at a range between 1.0 and 1.2 m/s throughout the year. The wind condition in the Yangon area depends on the influence of the southwest monsoon in the rainy season. The maximum wind speed of 42.9 m/s was recorded during Cyclone Nargis in 2008.
Source: JICA Library (The Study on Improvement of Water Supply System in Yangon City in the Union of Myanmar, 2002), DMH
Figure 2.4.7 Maximum Wind Speed and Mean Monthly Wind Speed at Kaba-Aye (1991-2015)
10
20
30
40
Jan Feb Mar Apr May Jun Jul Aug Sep Oct Nov Dec
Te
mp
erat
ure
(℃)
Max
Min
0
10
20
30
40
50
Jan Feb Mar Apr May Jun Jul Aug Sep Oct Nov Dec
Win
d S
pee
d (m
/s)
Max
Average
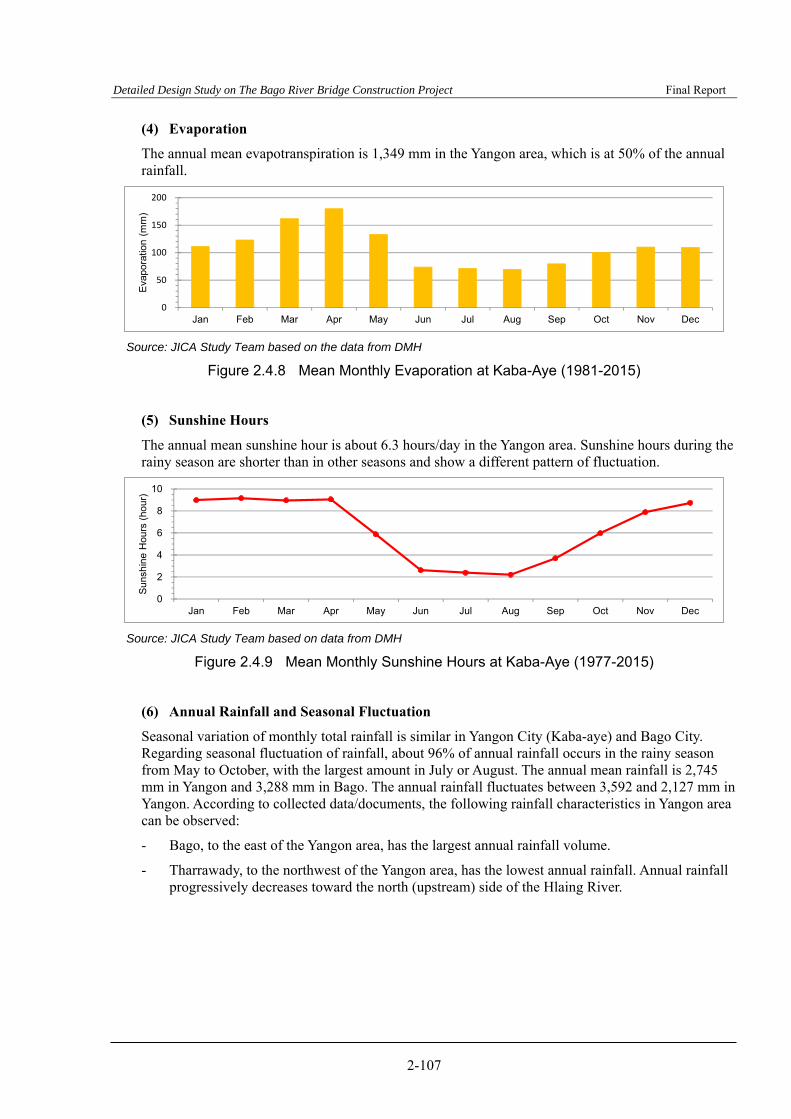
Detailed Design Study on The Bago River Bridge Construction Project Final Report
2-107
(4) Evaporation
The annual mean evapotranspiration is 1,349 mm in the Yangon area, which is at 50% of the annual rainfall.
Source: JICA Study Team based on the data from DMH
Figure 2.4.8 Mean Monthly Evaporation at Kaba-Aye (1981-2015)
(5) Sunshine Hours
The annual mean sunshine hour is about 6.3 hours/day in the Yangon area. Sunshine hours during the rainy season are shorter than in other seasons and show a different pattern of fluctuation.
Source: JICA Study Team based on data from DMH
Figure 2.4.9 Mean Monthly Sunshine Hours at Kaba-Aye (1977-2015)
(6) Annual Rainfall and Seasonal Fluctuation
Seasonal variation of monthly total rainfall is similar in Yangon City (Kaba-aye) and Bago City. Regarding seasonal fluctuation of rainfall, about 96% of annual rainfall occurs in the rainy season from May to October, with the largest amount in July or August. The annual mean rainfall is 2,745 mm in Yangon and 3,288 mm in Bago. The annual rainfall fluctuates between 3,592 and 2,127 mm in Yangon. According to collected data/documents, the following rainfall characteristics in Yangon area can be observed:
- Bago, to the east of the Yangon area, has the largest annual rainfall volume.
- Tharrawady, to the northwest of the Yangon area, has the lowest annual rainfall. Annual rainfall progressively decreases toward the north (upstream) side of the Hlaing River.
0
50
100
150
200
Jan Feb Mar Apr May Jun Jul Aug Sep Oct Nov Dec
Eva
pora
tion
(mm
)
0
2
4
6
8
10
Jan Feb Mar Apr May Jun Jul Aug Sep Oct Nov Dec
Sun
shin
e H
ours
(ho
ur)

Detailed Design Study on The Bago River Bridge Construction Project Final Report
2-108
Source: JICA Study Team based on the data from DMH
Figure 2.4.10 Mean Monthly Rainfall in and around Greater Yangon
(7) Long-term Fluctuation of Annual Rainfall
Figure 2.4.11 shows the long-term fluctuation of annual rainfall by using five-year running mean at Kaba-aye. Although the cycle of wet and droughty periods is not clear, there are clear periods of the wet and drought according to this figure. It is indicated that limited rise trend of annual rainfall has occurred in recent years.
Source: JICA Study Team based on the data from DMH
Figure 2.4.11 Annual Rainfall and Five Year Running Mean Rainfall at Kaba-Aye (1986-2008)
(8) Exceedance Probability and Intensity Curve of Rainfall
The annual maximum daily rainfall data (extremal value) over 40 years or more has been measured at Kaba-aye Station, which is near the location of the New Bago Bridge. The 24-hour rainfall of two 500- year probabilities are calculated by using these extreme values. Also, the correlation between the intensity of short rainfall duration and 24-hour rainfall is estimated in reference to Mononobe's equation. Probable rainfalls and intensity curves are shown in Table 2.4.5 and Figure 2.4.12.
0
200
400
600
800
Jan Feb Mar Apr May Jun Jul Aug Sep Oct Nov Dec
Rai
nfal
l (m
m) Kaba-aye
(1968-2015)
Bago (1996-2005)
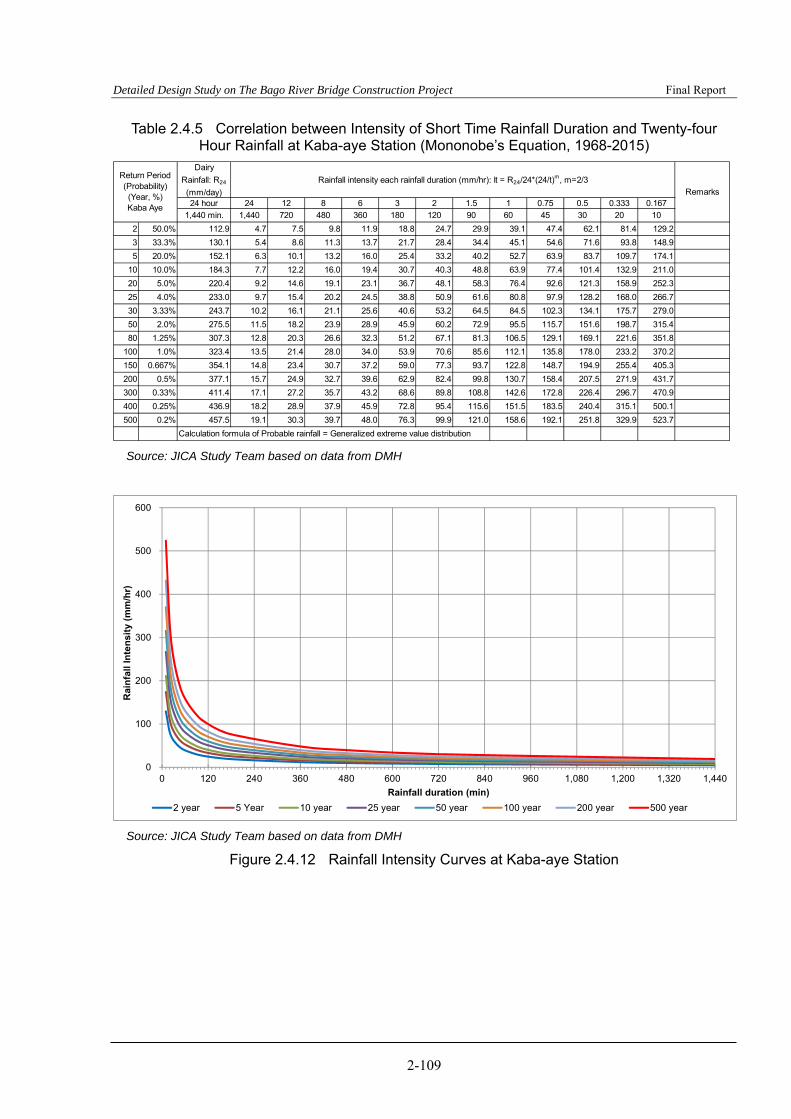
Detailed Design Study on The Bago River Bridge Construction Project Final Report
2-109
Table 2.4.5 Correlation between Intensity of Short Time Rainfall Duration and Twenty-four Hour Rainfall at Kaba-aye Station (Mononobe’s Equation, 1968-2015)
Source: JICA Study Team based on data from DMH
Source: JICA Study Team based on data from DMH
Figure 2.4.12 Rainfall Intensity Curves at Kaba-aye Station
Dairy
Rainfall: R24
(mm/day)
Rainfall intensity each rainfall duration (mm/hr): It = R24/24*(24/t)m, m=2/3
24 hour 24 12 8 6 3 2 1.5 1 0.75 0.5 0.333 0.167
1,440 min. 1,440 720 480 360 180 120 90 60 45 30 20 10
2 50.0% 112.9 4.7 7.5 9.8 11.9 18.8 24.7 29.9 39.1 47.4 62.1 81.4 129.2
3 33.3% 130.1 5.4 8.6 11.3 13.7 21.7 28.4 34.4 45.1 54.6 71.6 93.8 148.9
5 20.0% 152.1 6.3 10.1 13.2 16.0 25.4 33.2 40.2 52.7 63.9 83.7 109.7 174.1
10 10.0% 184.3 7.7 12.2 16.0 19.4 30.7 40.3 48.8 63.9 77.4 101.4 132.9 211.0
20 5.0% 220.4 9.2 14.6 19.1 23.1 36.7 48.1 58.3 76.4 92.6 121.3 158.9 252.3
25 4.0% 233.0 9.7 15.4 20.2 24.5 38.8 50.9 61.6 80.8 97.9 128.2 168.0 266.7
30 3.33% 243.7 10.2 16.1 21.1 25.6 40.6 53.2 64.5 84.5 102.3 134.1 175.7 279.0
50 2.0% 275.5 11.5 18.2 23.9 28.9 45.9 60.2 72.9 95.5 115.7 151.6 198.7 315.4
80 1.25% 307.3 12.8 20.3 26.6 32.3 51.2 67.1 81.3 106.5 129.1 169.1 221.6 351.8
100 1.0% 323.4 13.5 21.4 28.0 34.0 53.9 70.6 85.6 112.1 135.8 178.0 233.2 370.2
150 0.667% 354.1 14.8 23.4 30.7 37.2 59.0 77.3 93.7 122.8 148.7 194.9 255.4 405.3
200 0.5% 377.1 15.7 24.9 32.7 39.6 62.9 82.4 99.8 130.7 158.4 207.5 271.9 431.7
300 0.33% 411.4 17.1 27.2 35.7 43.2 68.6 89.8 108.8 142.6 172.8 226.4 296.7 470.9
400 0.25% 436.9 18.2 28.9 37.9 45.9 72.8 95.4 115.6 151.5 183.5 240.4 315.1 500.1
500 0.2% 457.5 19.1 30.3 39.7 48.0 76.3 99.9 121.0 158.6 192.1 251.8 329.9 523.7
Calculation formula of Probable rainfall = Generalized extreme value distribution
Return Period(Probability)(Year, %)Kaba Aye
Remarks
0
100
200
300
400
500
600
0 120 240 360 480 600 720 840 960 1,080 1,200 1,320 1,440
Rai
nfa
ll In
ten
sity
(m
m/h
r)
Rainfall duration (min)
2 year 5 Year 10 year 25 year 50 year 100 year 200 year 500 year

Detailed Design Study on The Bago River Bridge Construction Project Final Report
2-110
2.4.6 Hydrological Conditions for Road and Bridge Design
In order to predict the flow rate/water level during the flood season, it is necessary to collect and correlate the hydrological and hydraulic conditions of the Yangon (Hlaing), Bago River, and Pazundaung Creek, which surround Yangon. This study is examined in reference to previous reports (JICA report, etc.) in addition to the collection of information from relevant organizations in Myanmar.
Six existing gauging stations (water level / discharge) were managed by DMH and MPA in the Hlaing, Bago, and Yangon River basins. Of these stations, the three stations of MPA are not observed the discharge records. Also, the Bago Station of DMH is influenced by tidal level during October to May (dry season), therefore discharge records during this period are not available. However, discharge records at Bago Station during rainy season are utilizable for flood probability calculation. DMH has their own discharge rating tables and these rating tables have been changed several times to reflect discharge measurement records, taking into account the flow condition. Inventory of river/tidal gauge stations is shown in Table 2.4.6.
Table 2.4.6 Inventory of River / Tidal Gauging Station
Source: DMH, MPA
2.4.6.1 Existing Conditions
(1) Rivers and Characteristics of River Flow
The Yangon riverine system is located at the east end of Ayeyarwady (Irrawaddy) Delta as shown in Figure 2.4.13.
In Yangon City, the Yangon River is formed by the junction of the Panhaling and Hlaing rivers at a point about 13 km (8 miles) upstream of Monkey Point. The Panhlaing River is a distributary of the Ayeyarwady River, while the Hlaing River is a true river rising in the Bago Yomas and having a drainage area of about 12,950 km2 (5,000 square miles). Pazundaung Creek, named Ngamoyeik Creek in the northern part of the city, joins the Yangon River at Monkey Point, the southeastern extremity of the city. Pazundaung Creek has a drainage area of about 1,487 km2 (574 square miles). The Bago River with a drainage area of 5,180 km2 (2,000 square miles), also joins the Yangon River just east of the city, from which point the Yangon River flows south some 45 km (28 miles) into the Gulf of Bengal. The catchment area at the Yangon river-mouth is 25,640 km2 (9,900 square miles).
The Bago River has its source near Thikkyi in the Bago Yoma. It flows down the east-facing slope of the Bago Yoma from north to south approximately parallel to the Sittang River. When it reaches Bago, it turns to the southwest and flows into the sea as Yangon River.
Total length of Yangon River from its source to its mouth at the confluence is about 260 km (162 miles) long. Bago River at Bago gauging station is clearly influenced by the tidal level during the period of low flows.
Latitude Longitude
1. H lain R iver / K ham onseik 6020 16-35 95-30 5,840 14.465 P ile G auge 1987- ○ ○ D M H
2. B ago R iver / Zaungutu 6220 17-38 96-14 1,927 9.8 P ile G auge 1987- ○ ○ D M H
3. B ago R iver / B ago (P egu) 48093 17-20 96-30 2,580 9 P ile G auge 1970- ○ ○ D M H
4. H laing R iver / Y angon
P ort210 16-46 96-11 - -
Steel P late
(A utom atic)- ○ - M P A
other 2 stations at
Y angon P ort
5. Y angon R iver / Thilaw a
P oint- 16-40 96-15 - -
Steel P late
(A utom atic)- ○ - M P A
6. Y nagon R iver / E lephant
P oint- 16-28 96-19 - -
Steel P late
(M anual)- ○ - M P A
P eriod of
R ecord
W ater
(Tide)D ischarge
O bserved
byR em arksR iver / G auging S tation C ode
C oordinates C atchm ent
A rea (km 2)
H eight
(m )
Type of
G auge

Detailed Design Study on The Bago River Bridge Construction Project Final Report
2-111
Source: A one dimensional analysis of the tidal hydraulics of deltas (Nicholas Odd, Report OD 44, July 1982, Hydraulics Research Station, UK), from MoAI Library
Figure 2.4.13 Ayeyarwady (Irrawaddy) Delta and Yangon River
(2) Characteristics of River Flow
1) Characteristics of Upstream Part in Relative River
The discharge-duration curve, which is often used in Japan, is examined in order to understand the potential surface water characteristics of the river through the year. The flow regime shows the annual flow condition using the daily discharge at each hydrological station and is indicated by the daily discharge and the number of exceeded days. The annual flow regime is shown below as follows:

Detailed Design Study on The Bago River Bridge Construction Project Final Report
2-112
- High discharge (95th greatest daily discharge)
- Normal discharge (185th greatest daily discharge)
- Low discharge (275th greatest daily discharge)
- Drought discharge (355th greatest daily discharge)
The flow regime, which was computed at Zaungtu and Khamonseik stations for a 14-year period (1987-2000), is summarized in Table 2.4.7 and Figure 2.4.14. As seen in the following table and figure, the coefficient of river regime extremely differs by rivers. Although the low flow of Hlaing River at Khamonseik and Bago River flow at Zaungtu are not steady, their coefficients of river regime are large. Especially, it is found that the flow regime by Bago River at Zaungtu does not have a sustainable volume of base flow. Also, the magnitude of coefficient of river regime indicates that the flow fluctuation is large, and if it is large, it indicates that the full year water intake is difficult and flood damage occurs easily.
Table 2.4.7 Flow Regime (1987-2000) of Hlaing and Bago Rivers
Source: JICA Library (The Study on Improvement of Water Supply System in Yangon City in the Union of Myanmar, 2002), DMH
Mean Daily Discharge (m3/s)
Max.High
DischageNormal
DischargeLow
DischargeDrought
Discharge Min. Mean
95th day 185th day 275th day 355th dayHlaing
(Khamonsek)2,292 1226 99 20 14 13 602 176.3
Bago(Zaungtu)
837 82 14 3 1 1 72 837.0
River(station)
Coefficient ofRiver Regime Remarks

Detailed Design Study on The Bago River Bridge Construction Project Final Report
2-113
Source: JICA Library (The Study on Improvement of Water Supply System in Yangon City in the Union of Myanmar, 2002), DMH
Figure 2.4.14 Flow Regime (1987-2000) of Hlaing and Bago Rivers
In reference to a previous JICA report (records of 14-year period at 1987-2000), the mean monthly flow pattern at Khamonseik and Zaungtu stations are shown in Figure 2.4.15. As seen in the figure, the monthly discharge shows an increase during the rainy season and peak runoff occurs in August.

Detailed Design Study on The Bago River Bridge Construction Project Final Report
2-114
Source: JICA Library (The Study on Improvement of Water Supply System in Yangon City in the Union of Myanmar, 2002), DMH
Figure 2.4.15 Mean Monthly Flow Pattern at Khamonseik and Zaungth Stations (1987-2000)
2) Characteristics of Relative Tidal River
As mentioned above, the lower reaches of the Yangon riverine system are tidal river that are affected by the tidal variability for the length of more than 100 km from the estuary. The tide range around Yangon Port is about 5.1 m and 2.8 m at spring tide and neap tide, respectively. The spring tide to Yangon Port from estuaries is accompanied by flow of up to 3.0 m/s (velocities around Yangon Port on nautical chart are 1.6-1.8 m/s).
Regarding the tidal range around Yangon Port, the tide chart diagrams of Yangon Port are shown in Figure 2.4.16. From the tide chart diagram, fluctuations of spring, mean, and neap tides are observed as 5.13 m, 4.00 m, and 2.84 m. And, according to the hearing with MPA, the maximum storm surge at Yangon Port is reported 2.13 m (Cyclone Nargis, 2008 May 3, MPA measured as 2.13 m from flood mark after the storm).
Source: MPA
Figure 2.4.16 Tide Level of Yangon Port
For comparison, the probable surge amplitudes (the sea level departure from normal) at Elephant Point per calculation result from the Hydrology Branch of the Irrigation Department are shown in Figure 2.4.8. From this, how high the storm surge of Cyclone Nargis at Yangon Port can be understood.
0
500
1000
1500
2000
Jan Feb Mar Apr May Jun Jul Aug Sep Oct Nov Dec
Mea
n M
on
thly
D
isch
arg
e (m
3 /s)
Hlaing River atKhamonseik(C.A.=5840km2)
Bago River arZaungtu(C.A.=1927km2)
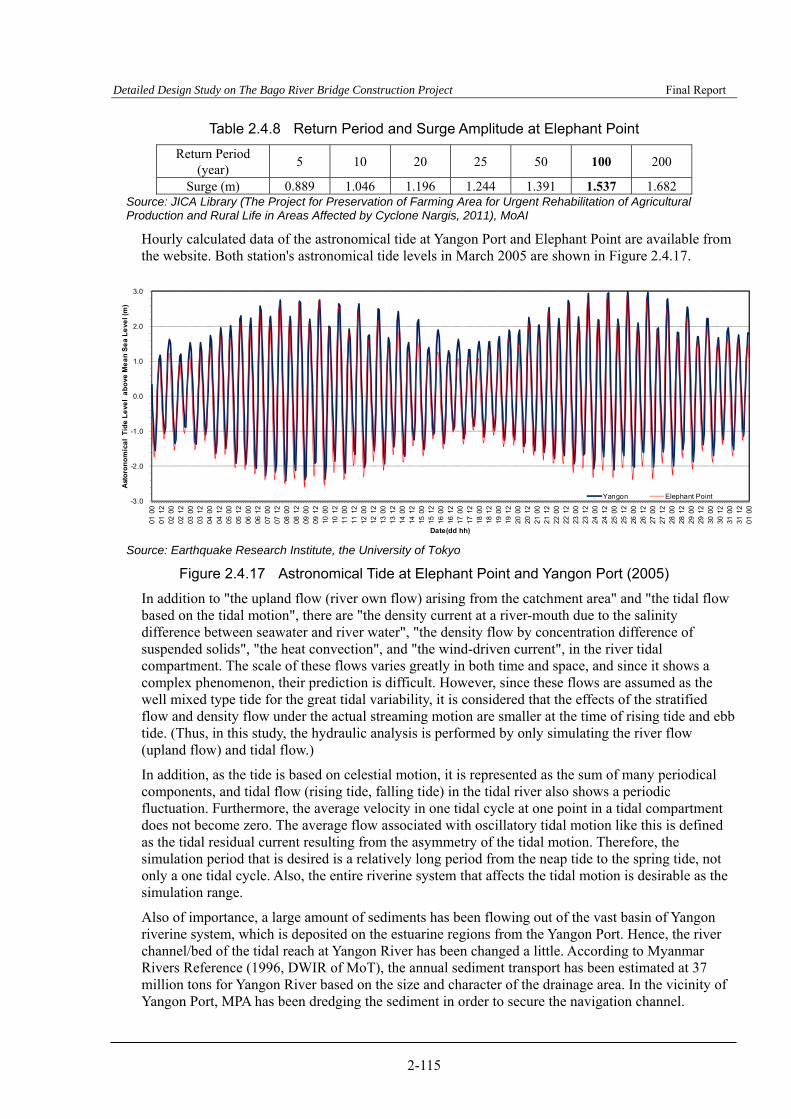
Detailed Design Study on The Bago River Bridge Construction Project Final Report
2-115
Table 2.4.8 Return Period and Surge Amplitude at Elephant Point
Return Period (year)
5 10 20 25 50 100 200
Surge (m) 0.889 1.046 1.196 1.244 1.391 1.537 1.682 Source: JICA Library (The Project for Preservation of Farming Area for Urgent Rehabilitation of Agricultural Production and Rural Life in Areas Affected by Cyclone Nargis, 2011), MoAI
Hourly calculated data of the astronomical tide at Yangon Port and Elephant Point are available from the website. Both station's astronomical tide levels in March 2005 are shown in Figure 2.4.17.
Source: Earthquake Research Institute, the University of Tokyo
Figure 2.4.17 Astronomical Tide at Elephant Point and Yangon Port (2005)
In addition to "the upland flow (river own flow) arising from the catchment area" and "the tidal flow based on the tidal motion", there are "the density current at a river-mouth due to the salinity difference between seawater and river water", "the density flow by concentration difference of suspended solids", "the heat convection", and "the wind-driven current", in the river tidal compartment. The scale of these flows varies greatly in both time and space, and since it shows a complex phenomenon, their prediction is difficult. However, since these flows are assumed as the well mixed type tide for the great tidal variability, it is considered that the effects of the stratified flow and density flow under the actual streaming motion are smaller at the time of rising tide and ebb tide. (Thus, in this study, the hydraulic analysis is performed by only simulating the river flow (upland flow) and tidal flow.)
In addition, as the tide is based on celestial motion, it is represented as the sum of many periodical components, and tidal flow (rising tide, falling tide) in the tidal river also shows a periodic fluctuation. Furthermore, the average velocity in one tidal cycle at one point in a tidal compartment does not become zero. The average flow associated with oscillatory tidal motion like this is defined as the tidal residual current resulting from the asymmetry of the tidal motion. Therefore, the simulation period that is desired is a relatively long period from the neap tide to the spring tide, not only a one tidal cycle. Also, the entire riverine system that affects the tidal motion is desirable as the simulation range.
Also of importance, a large amount of sediments has been flowing out of the vast basin of Yangon riverine system, which is deposited on the estuarine regions from the Yangon Port. Hence, the river channel/bed of the tidal reach at Yangon River has been changed a little. According to Myanmar Rivers Reference (1996, DWIR of MoT), the annual sediment transport has been estimated at 37 million tons for Yangon River based on the size and character of the drainage area. In the vicinity of Yangon Port, MPA has been dredging the sediment in order to secure the navigation channel.
-3.0
-2.0
-1.0
0.0
1.0
2.0
3.0
01 0
001
12
02 0
002
12
03 0
003
12
04 0
004
12
05 0
005
12
06 0
006
12
07 0
007
12
08 0
008
12
09 0
009
12
10 0
010
12
11 0
011
12
12 0
012
12
13 0
013
12
14 0
014
12
15 0
015
12
16 0
016
12
17 0
017
12
18 0
018
12
19 0
019
12
20 0
020
12
21 0
021
12
22 0
022
12
23 0
023
12
24 0
024
12
25 0
025
12
26 0
026
12
27 0
027
12
28 0
028
12
29 0
029
12
30 0
030
12
31 0
031
12
01 0
0
Ast
oro
no
mic
al
Tid
e L
eve
l a
bo
ve M
ea
n S
ea
Le
vel (
m)
Date(dd hh)
Yangon Elephant Point
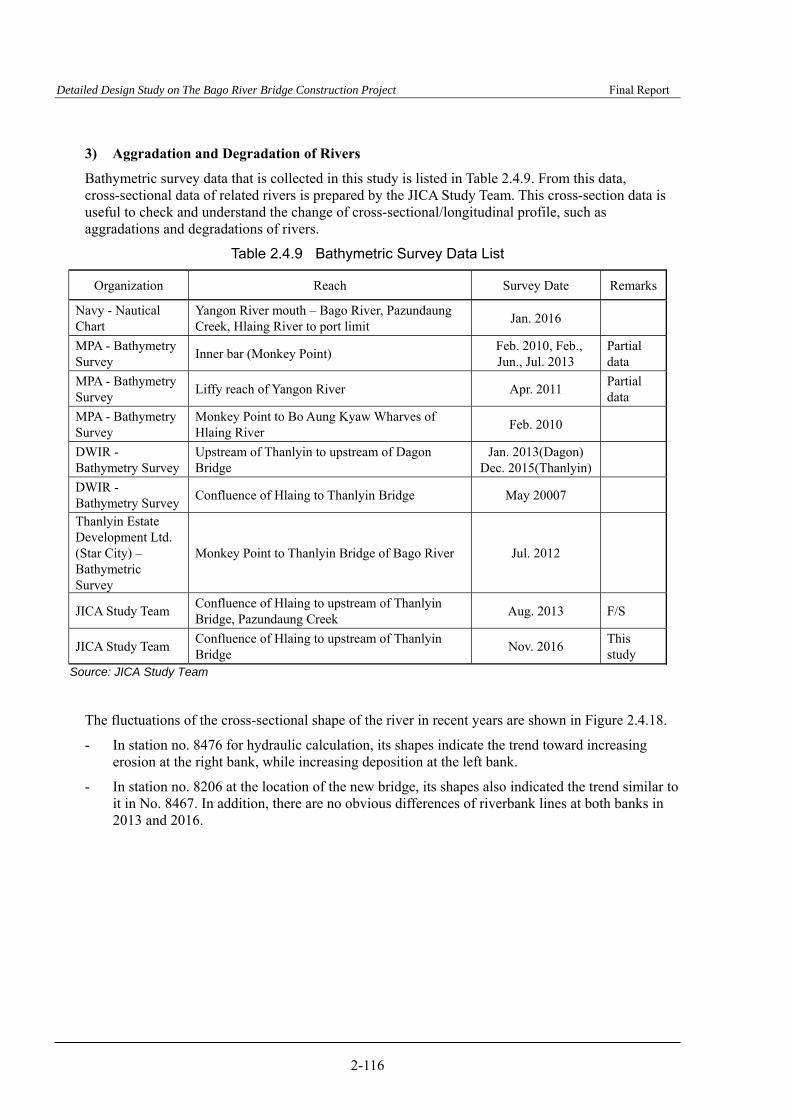
Detailed Design Study on The Bago River Bridge Construction Project Final Report
2-116
3) Aggradation and Degradation of Rivers
Bathymetric survey data that is collected in this study is listed in Table 2.4.9. From this data, cross-sectional data of related rivers is prepared by the JICA Study Team. This cross-section data is useful to check and understand the change of cross-sectional/longitudinal profile, such as aggradations and degradations of rivers.
Table 2.4.9 Bathymetric Survey Data List
Organization Reach Survey Date Remarks
Navy - Nautical Chart
Yangon River mouth – Bago River, Pazundaung Creek, Hlaing River to port limit
Jan. 2016
MPA - Bathymetry Survey
Inner bar (Monkey Point) Feb. 2010, Feb.,
Jun., Jul. 2013 Partial data
MPA - Bathymetry Survey
Liffy reach of Yangon River Apr. 2011 Partial data
MPA - Bathymetry Survey
Monkey Point to Bo Aung Kyaw Wharves of Hlaing River
Feb. 2010
DWIR - Bathymetry Survey
Upstream of Thanlyin to upstream of Dagon Bridge
Jan. 2013(Dagon) Dec. 2015(Thanlyin)
DWIR - Bathymetry Survey
Confluence of Hlaing to Thanlyin Bridge May 20007
Thanlyin Estate Development Ltd. (Star City) – Bathymetric Survey
Monkey Point to Thanlyin Bridge of Bago River Jul. 2012
JICA Study Team Confluence of Hlaing to upstream of Thanlyin Bridge, Pazundaung Creek
Aug. 2013 F/S
JICA Study Team Confluence of Hlaing to upstream of Thanlyin Bridge
Nov. 2016 This study
Source: JICA Study Team
The fluctuations of the cross-sectional shape of the river in recent years are shown in Figure 2.4.18.
- In station no. 8476 for hydraulic calculation, its shapes indicate the trend toward increasing erosion at the right bank, while increasing deposition at the left bank.
- In station no. 8206 at the location of the new bridge, its shapes also indicated the trend similar to it in No. 8467. In addition, there are no obvious differences of riverbank lines at both banks in 2013 and 2016.

Detailed Design Study on The Bago River Bridge Construction Project Final Report
2-117
Source: JICA Study Team and DWIR
Figure 2.4.18 Change of Cross-section Data of River
‐16.0
‐14.0
‐12.0
‐10.0
‐8.0
‐6.0
‐4.0
‐2.0
0.0
2.0
4.0
6.0
8.0
10.0
‐1,800 ‐1,600 ‐1,400 ‐1,200 ‐1,000 ‐800 ‐600 ‐400 ‐200 0 200 400 600 800 1,000 1,200 1,400 1,600 1,800
Elevation (m)
Distance (m)
+8476.1 (C‐7)
January‐13 (DWIR) October‐13 (JICA) November‐16 (JICA)
‐16.0
‐14.0
‐12.0
‐10.0
‐8.0
‐6.0
‐4.0
‐2.0
0.0
2.0
4.0
6.0
8.0
10.0
‐1,800 ‐1,600 ‐1,400 ‐1,200 ‐1,000 ‐800 ‐600 ‐400 ‐200 0 200 400 600 800 1,000 1,200 1,400 1,600 1,800
Elevation (m)
Distance (m)
+8206.2(C‐6:New Bago Bridge)
January‐13 (DWIR) October‐13 (JICA) November‐16 (JICA)
‐16.0
‐14.0
‐12.0
‐10.0
‐8.0
‐6.0
‐4.0
‐2.0
0.0
2.0
4.0
6.0
8.0
10.0
‐1,800 ‐1,600 ‐1,400 ‐1,200 ‐1,000 ‐800 ‐600 ‐400 ‐200 0 200 400 600 800 1,000 1,200 1,400 1,600 1,800
Elevation (m)
Distance (m)
+8051.3 (C‐5)
October‐13 (JICA) November‐16 (JICA)

Detailed Design Study on The Bago River Bridge Construction Project Final Report
2-118
The transition of the riverbank line is important for designing riverine structures. As shown in the figure above, the riverbank at the new bridge location (station no. 8144) has not fluctuated in recent years. Although the left side (Thanlyin side) is a practical navigation route for vessels, there are apprehensions since there is erosion by stream; however, the riverbank slope has been stable at approximately 1:0.8. According to the time series aerial photos of the vicinity of the new bridge site shown in Figure 2.4.19, the riverbank line has been stable at both banks for more than ten years. In addition, the obvious cut bank was not recognized in the field survey even though large water level fluctuation by tide occurs everyday as mentioned above. It says that river bank erosion is not proceeding at least around the new bridge location. As shown in Figure 2.4.20, the closer it is to the land, the steeper the slope of left river bank is. However, it is covered by dry grass.
Source: JICA Study Team (Google Earth Map)
Figure 2.4.19 Change of Cross-section Data of River
Source: JICA Study Team (Google Earth Map)
Figure 2.4.20 Current Condition of Bago River Bank at New Bridge Location (Left Side)

Detailed Design Study on The Bago River Bridge Construction Project Final Report
2-119
(3) Flood Condition including Storm Surge
According to the "Hazard Profile of Myanmar, 2009", flooding has always been one of the major hazards in Myanmar, accounting for 11% of all disasters, second only to fire. Floods around the Yangon area can be classified into three types:
- Riverine floods in the river delta;
- Localized floods in urban area due to a combination of factors, such as cloudburst, saturated soil, poor infiltration rates, and inadequate or poorly built infrastructure (such as blocked drains);
- Flooding due to cyclone and storm surge in the coastal areas.
The types of flood from the aforementioned list that cause the most damages are due to cyclone and storm surges. Figure 2.4.21 shows the flood inundation areas resulting from Cyclone Nargis taken by satellite imagery on 5 May 2008. According to the "Hazard Profile of Myanmar," its damages are described as, "peoples of dead or missing were 138,373, killed cattle were 300,000, houses and schools over 4,000 in more than 6,000 villages were destroyed, damage cost was MMK 13 trillion", including damages that occurred in the Ayeyarwady and Yangon areas.
Source: UNOSAT (www.unosat.org)
Figure 2.4.21 Flood Waters Surrounding Yangon City (Cyclone Nargis, 5 May 2008)
Severe flooding in Myanmar began in July 2015 and continued up to September, affecting 12 of the country's 14 states, resulting in about 103 deaths and affecting up to 1,000,000 people. As for the vicinity of Yangon, most of the flood-affected lands were agricultural fields and there was no significant overflowing of water along the river bank.
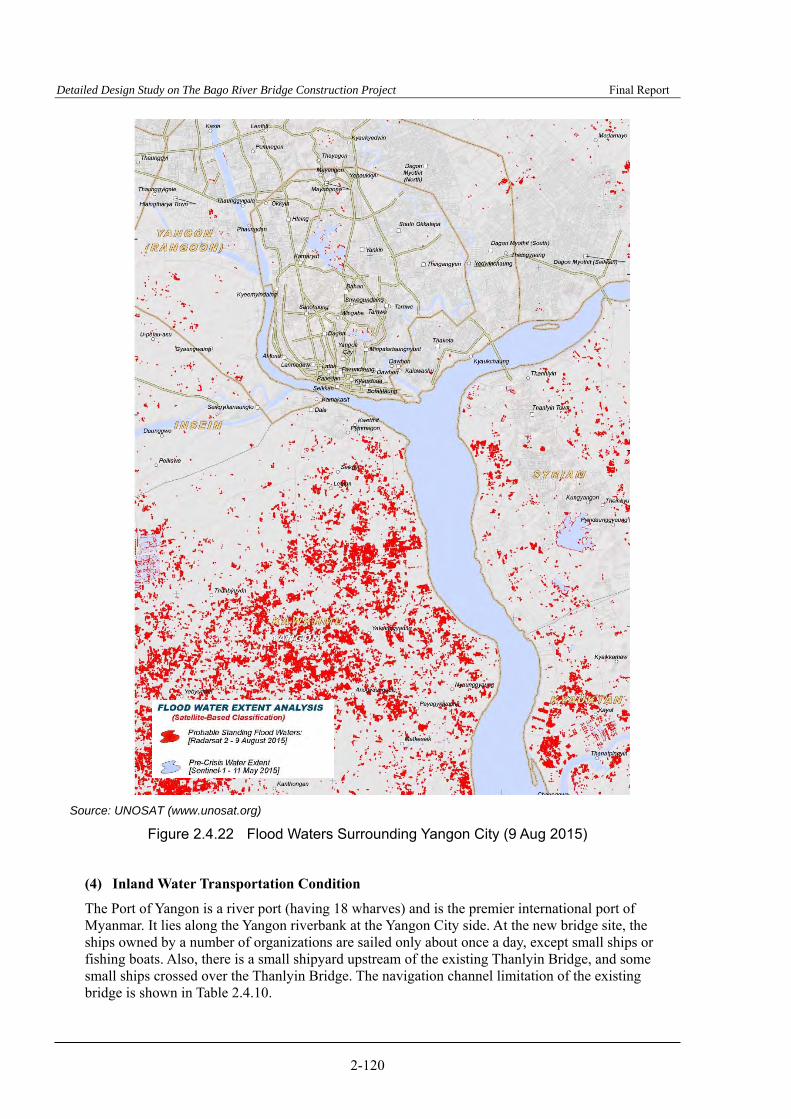
Detailed Design Study on The Bago River Bridge Construction Project Final Report
2-120
Source: UNOSAT (www.unosat.org)
Figure 2.4.22 Flood Waters Surrounding Yangon City (9 Aug 2015)
(4) Inland Water Transportation Condition
The Port of Yangon is a river port (having 18 wharves) and is the premier international port of Myanmar. It lies along the Yangon riverbank at the Yangon City side. At the new bridge site, the ships owned by a number of organizations are sailed only about once a day, except small ships or fishing boats. Also, there is a small shipyard upstream of the existing Thanlyin Bridge, and some small ships crossed over the Thanlyin Bridge. The navigation channel limitation of the existing bridge is shown in Table 2.4.10.

Detailed Design Study on The Bago River Bridge Construction Project Final Report
2-121
Table 2.4.10 Navigation Channel Limitation of Existing Bridge
Bridge Name River Name Clearance (m)
Width Height Thanlyin Bridge Bago 106.1 10.2
Source: IWT
According to the result of the interview with MPA and IWT, the navigation fairway for the Thanlyin Bridge is commonly navigated as shown in Figure 2.4.23.
Source: JICA Study Team based on DWIR map
Figure 2.4.23 Current Status of Riverbed and Practical Navigation Route
P6
P5 P7
Practical navigation route for larger vessels
Shallow area (less than 2m)
Shallow area (less than 2m)
P5
P7
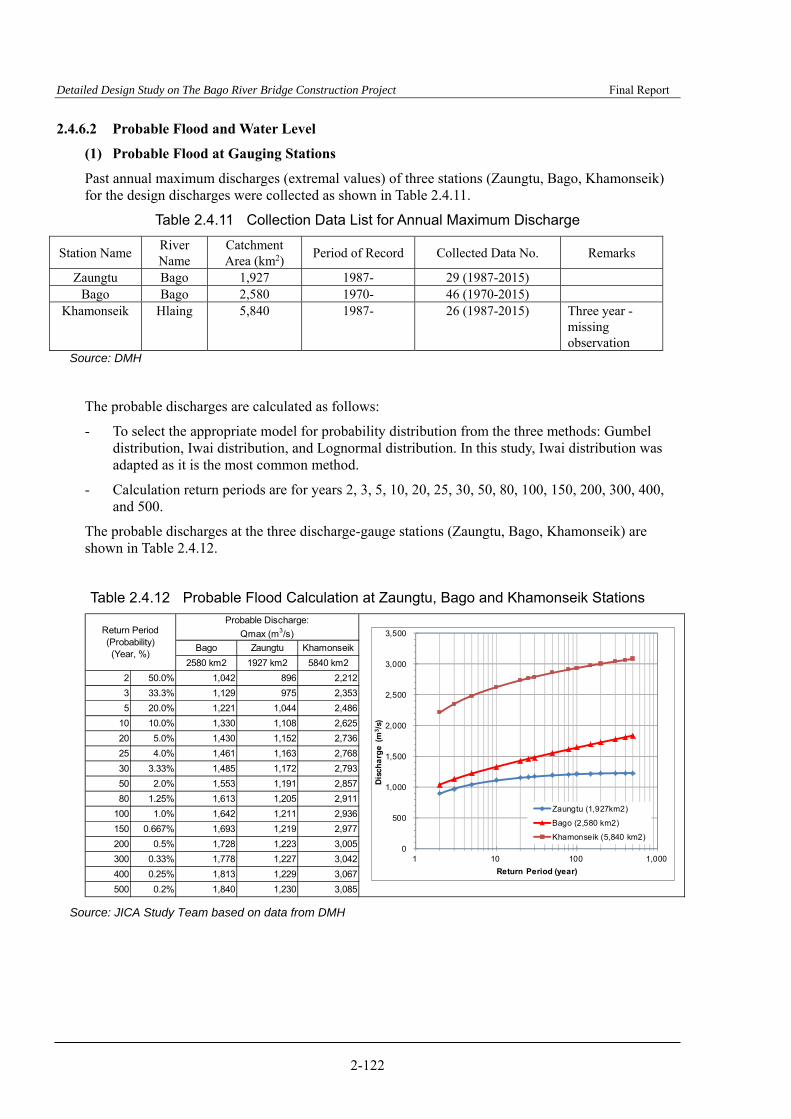
Detailed Design Study on The Bago River Bridge Construction Project Final Report
2-122
2.4.6.2 Probable Flood and Water Level
(1) Probable Flood at Gauging Stations
Past annual maximum discharges (extremal values) of three stations (Zaungtu, Bago, Khamonseik) for the design discharges were collected as shown in Table 2.4.11.
Table 2.4.11 Collection Data List for Annual Maximum Discharge
Station Name River Name
Catchment Area (km2)
Period of Record Collected Data No. Remarks
Zaungtu Bago 1,927 1987- 29 (1987-2015) Bago Bago 2,580 1970- 46 (1970-2015)
Khamonseik Hlaing 5,840 1987- 26 (1987-2015) Three year - missing observation
Source: DMH
The probable discharges are calculated as follows:
- To select the appropriate model for probability distribution from the three methods: Gumbel distribution, Iwai distribution, and Lognormal distribution. In this study, Iwai distribution was adapted as it is the most common method.
- Calculation return periods are for years 2, 3, 5, 10, 20, 25, 30, 50, 80, 100, 150, 200, 300, 400, and 500.
The probable discharges at the three discharge-gauge stations (Zaungtu, Bago, Khamonseik) are shown in Table 2.4.12.
Table 2.4.12 Probable Flood Calculation at Zaungtu, Bago and Khamonseik Stations
Source: JICA Study Team based on data from DMH
Probable Discharge:
Qmax (m3/s)
Bago Zaungtu Khamonseik
2580 km2 1927 km2 5840 km2
2 50.0% 1,042 896 2,212
3 33.3% 1,129 975 2,353
5 20.0% 1,221 1,044 2,486
10 10.0% 1,330 1,108 2,625
20 5.0% 1,430 1,152 2,736
25 4.0% 1,461 1,163 2,768
30 3.33% 1,485 1,172 2,793
50 2.0% 1,553 1,191 2,857
80 1.25% 1,613 1,205 2,911
100 1.0% 1,642 1,211 2,936
150 0.667% 1,693 1,219 2,977
200 0.5% 1,728 1,223 3,005
300 0.33% 1,778 1,227 3,042
400 0.25% 1,813 1,229 3,067
500 0.2% 1,840 1,230 3,085
Return Period(Probability)(Year, %)
0
500
1,000
1,500
2,000
2,500
3,000
3,500
1 10 100 1,000
Dis
cha
rge
(m
3/s
)
Return Period (year)
Zaungtu (1,927km2)
Bago (2,580 km2)
Khamonseik (5,840 km2)

Detailed Design Study on The Bago River Bridge Construction Project Final Report
2-123
(2) Probable Floods from River Flow for Design
The discharge at the proposed bridge sites are calculated by multiplying the proportion of the catchment area of each catchment area to the probable discharges of each gauge stations upstream. (Method by "specific discharge")
The probable discharges used for the hydraulic calculation are shown in Table 2.4.13. Incidentally, these discharges are the runoff volume from the river’s own flow. Additional flow rates due to the influences of the falling tide are not included in these discharges.
Table 2.4.13 Probable Flood from River Flow for Design
Source: JICA Study Team based on Data from DMH
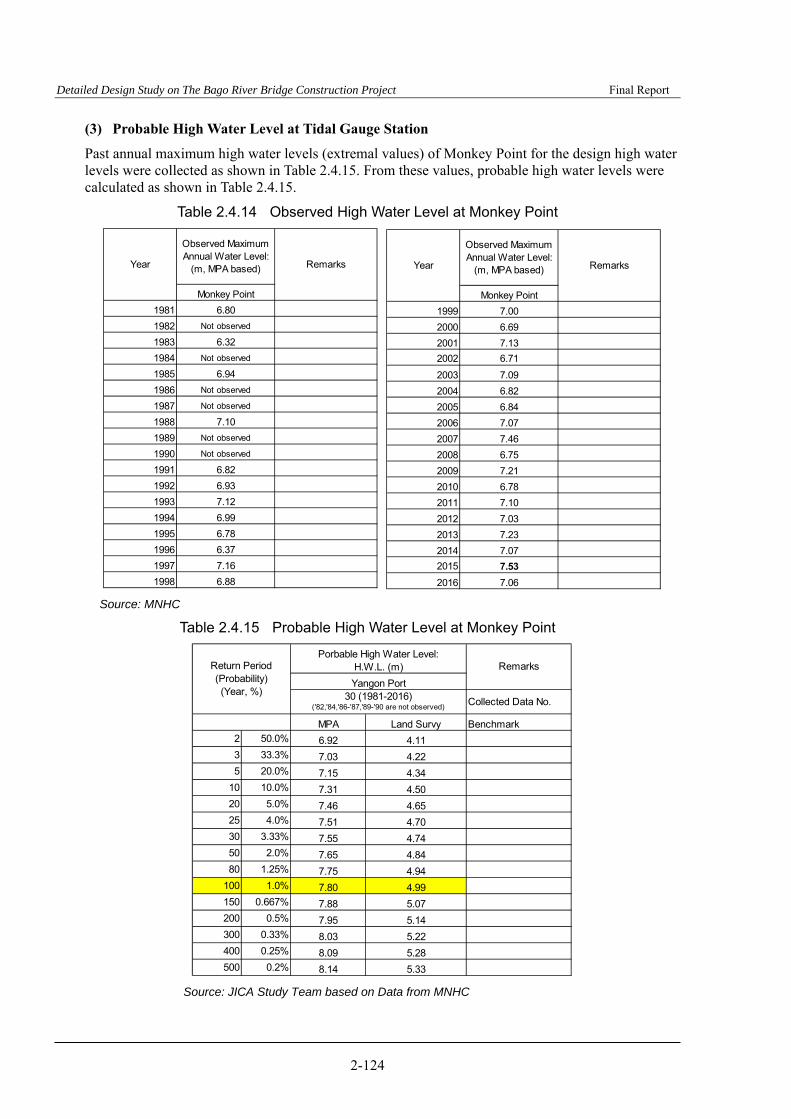
Detailed Design Study on The Bago River Bridge Construction Project Final Report
2-124
(3) Probable High Water Level at Tidal Gauge Station
Past annual maximum high water levels (extremal values) of Monkey Point for the design high water levels were collected as shown in Table 2.4.15. From these values, probable high water levels were calculated as shown in Table 2.4.15.
Table 2.4.14 Observed High Water Level at Monkey Point
Source: MNHC
Table 2.4.15 Probable High Water Level at Monkey Point
Source: JICA Study Team based on Data from MNHC
Porbable High Water Level:H.W.L. (m)
Yangon Port
Collected Data No.
MPA Land Survy Benchmark
2 50.0% 6.92 4.11
3 33.3% 7.03 4.22
5 20.0% 7.15 4.34
10 10.0% 7.31 4.50
20 5.0% 7.46 4.65
25 4.0% 7.51 4.70
30 3.33% 7.55 4.74
50 2.0% 7.65 4.84
80 1.25% 7.75 4.94
100 1.0% 7.80 4.99
150 0.667% 7.88 5.07
200 0.5% 7.95 5.14
300 0.33% 8.03 5.22
400 0.25% 8.09 5.28
500 0.2% 8.14 5.33
RemarksReturn Period(Probability)(Year, %) 30 (1981-2016)
('82,'84,'86-'87,'89-'90 are not observed)
Observed MaximumAnnual Water Level:
(m, MPA based)
Monkey Point
1981 6.80
1982 Not observed
1983 6.32
1984 Not observed
1985 6.94
1986 Not observed
1987 Not observed
1988 7.10
1989 Not observed
1990 Not observed
1991 6.82
1992 6.93
1993 7.12
1994 6.99
1995 6.78
1996 6.37
1997 7.16
1998 6.88
Year Remarks
Observed MaximumAnnual Water Level:
(m, MPA based)
Monkey Point
1999 7.00
2000 6.69
2001 7.13
2002 6.71
2003 7.09
2004 6.82
2005 6.84
2006 7.07
2007 7.46
2008 6.75
2009 7.21
2010 6.78
2011 7.10
2012 7.03
2013 7.23
2014 7.07
2015 7.53
2016 7.06
Year Remarks

Detailed Design Study on The Bago River Bridge Construction Project Final Report
2-125
(4) Hydraulic Calculation
The hydraulic phenomena (rising tide and falling tide in addition to the river’s own flood) at the tidal compartment of the river are needed to simulate all of the tidal reaches. Therefore, the range of numerical calculation shall target the whole tidal area of the Yangon riverine system together with their tributaries such as Bago River and Pazundaung Creek. Elephant Point (the river-mouth of Yangon River) is assumed as the downstream boundary. The upstream boundary of the tributaries is assumed in reference to past documents (Figure 2.4.25), the river length is measured from the river route on the topographic map, and river cross-sections at upstream end of the tributaries are assumed as the virtual cross-section, respectively. Lengths to the upstream boundary from the river-mouth are 100 km or more.
The hydraulic calculation model of the Yangon riverine system is shown in Figure 2.4.24.
Source: JICA Study Team
Figure 2.4.24 Hydraulic Calculation Model of Yangon River System
Yangon River
Pazundaung Creek
Bago River Hlaing River
Virtual Cross-section
Virtual Cross-section
Virtual Cross-section
←Elephant Point

Detailed Design Study on The Bago River Bridge Construction Project Final Report
2-126
Source: A one dimensional analysis of the tidal hydraulics of deltas (Nicholas Odd, Report OD 44, July 1982,Hydraulics Research Station, UK), from MoAI Library
Figure 2.4.25 Past Simulation Example of High Water and Low Water Profiles at Yangon River (on Wet Season of August 1980)
1) Analysis Software
Hydraulic analysis was carried out to simulate the tidal and flood phenomena at the Yangon River using Hydrologic Engineering Center - River Analysis System (HEC-RAS), which was developed by the US Army Corps of Engineers, USA. HEC-RAS has the capability to compute one-dimensional water surface profiles for both steady and unsteady flows. Sub-critical, supercritical, and mix flow regime profiles can be calculated. Water surface profiles are computed from one cross section to the next by solving the energy equation using the standard-step method. Energy losses are evaluated by friction (Manning’s equation) and contraction/expansion coefficients. HEC-RAS requires inputs for boundary conditions of upstream discharge and either downstream water level or known energy gradient. Also, tidal waves are very dynamic. According to the user-manual of this software, in order for the solution to be able to accurately model a tidal surge, theta implicit weighting factor must be close to 0.6.
2) Hydraulic Analyses and Precondition
The hydraulic analyses are conducted through the following procedure:
- To estimate the roughness coefficient of the river channel by using the existing astronomical tide levels at two places in the dry season. (The water level of Yangon Port of upstream, which is calculated from the astronomical tide for Elephant Point of downstream, is approximated as the astronomical tide waveform of the Yangon Port, by changing the roughness coefficient of tidal reaches. The tide table for 2005 at Elephant Point and Yangon Port are given as the known water level data.)

Detailed Design Study on The Bago River Bridge Construction Project Final Report
2-127
- To conduct the calculation case at the time of flood (rainy season) by using the above roughness coefficient calculated from real tide level.
Also, the following are preconditions of the calculation case:
- The cross-sections for hydraulic calculation are given by using the bathymetry survey results, nautical chart, and others in reference to the above hydraulic model.
- The downstream boundary for the hydraulic calculation of the dry season is given as the tide level (from 4 Feb to 24 Feb 2005, neap tide - spring tide - neap tide) at the Elephant Point which varies from hour to hour. (Hence, the flow becomes an unsteady flow.) The upstream boundary of the dry season is given as the steady low-water runoff (275-day discharge).
- The downstream boundary for the hydraulic calculation of the rainy season is given as the tide level (from 17 Oct to 21 Oct 2005, spring tide) at the Elephant Point. The upstream boundary of rainy season is given the 100-year flood as the steady flow to each river.
- The flow rate to the upstream end is given as the proportional distribution between the catchment area at the upstream end and the total area, the flow rate of remaining catchment area is given as "the uniform lateral inflow" against the stream length.
3) Hydraulic Analyses and Result
Hydraulic analyses of the following two cases were performed.
Table 2.4.16 Case of Hydraulic Analyses
Case No. Boundary Condition of Upstream (m3/s)
Boundary Condition of Downstream (Elephant
Point) Remarks
(Objectives) Discharge Hlaing Bago
Pazun-daung
Period of Tidal Waveform
1 Low-water runoff 44 8 5 4 Feb – 24 Feb 2005
(Annual minimum tide, Neap - Spring – Neap tide)
(for calibration of roughness coefficient)
2 100-year flood 6,510 3,297 948 17 Oct to 21 Oct 2005
(Annual Maximum Tide, Spring tide)
(for calculation of HWL)
Note: Discharge is indicated the value at confluence of Hlaing, Bago, and Pazundaung. Source: JICA Study Team
If the riverbed material is very small and the riverbed slope is very gentle such as in the delta area, the roughness coefficient of river channel is generally very small and its coefficient is estimated to be about 0.015 according to the past literatures 1. (From the results of geotechnical survey of the F/S, the mean grain size of riverbed material at the Bago Bridge site is very small and it was measured as 0.015-0.15 mm.)
1 Bed Form and Bed Variation During Floods of the TONE River Mouth, Journal of Japan Society of Civil Engineers, Ser. B1 (Hydraulic Engineering) Vol. 54(2010), Japan
The roughness coefficient for case 1 was set as 0.010, 0.015, 0.020, and 0.025. From the hydraulic calculation results, the calculation case of surge amplitude that was properly synchronized with the astronomical tide is the case wherein 0.015 was set as the roughness coefficient, while about 40 cm at most have a margin of error as shown in Figure 2.4.26.
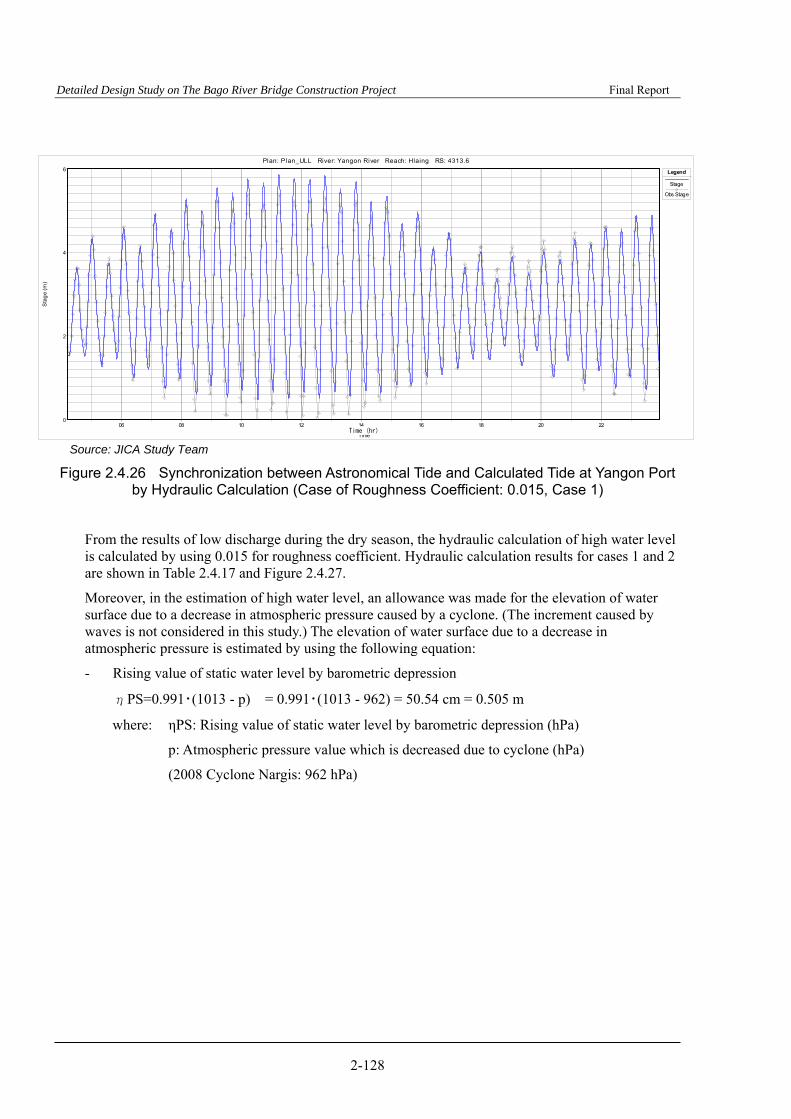
Detailed Design Study on The Bago River Bridge Construction Project Final Report
2-128
Source: JICA Study Team
Figure 2.4.26 Synchronization between Astronomical Tide and Calculated Tide at Yangon Port by Hydraulic Calculation (Case of Roughness Coefficient: 0.015, Case 1)
From the results of low discharge during the dry season, the hydraulic calculation of high water level is calculated by using 0.015 for roughness coefficient. Hydraulic calculation results for cases 1 and 2 are shown in Table 2.4.17 and Figure 2.4.27.
Moreover, in the estimation of high water level, an allowance was made for the elevation of water surface due to a decrease in atmospheric pressure caused by a cyclone. (The increment caused by waves is not considered in this study.) The elevation of water surface due to a decrease in atmospheric pressure is estimated by using the following equation:
- Rising value of static water level by barometric depression
ηPS=0.991・(1013 - p) = 0.991・(1013 - 962) = 50.54 cm = 0.505 m
where: ηPS: Rising value of static water level by barometric depression (hPa)
p: Atmospheric pressure value which is decreased due to cyclone (hPa)
(2008 Cyclone Nargis: 962 hPa)
06 08 10 12 14 16 18 20 222005/02/01
0
2
4
6
Plan: Plan_ULL River: Yangon River Reach: Hlaing RS: 4313.6
Time
Sta
ge
(m)
Legend
Stage
Obs Stage
Time (hr)
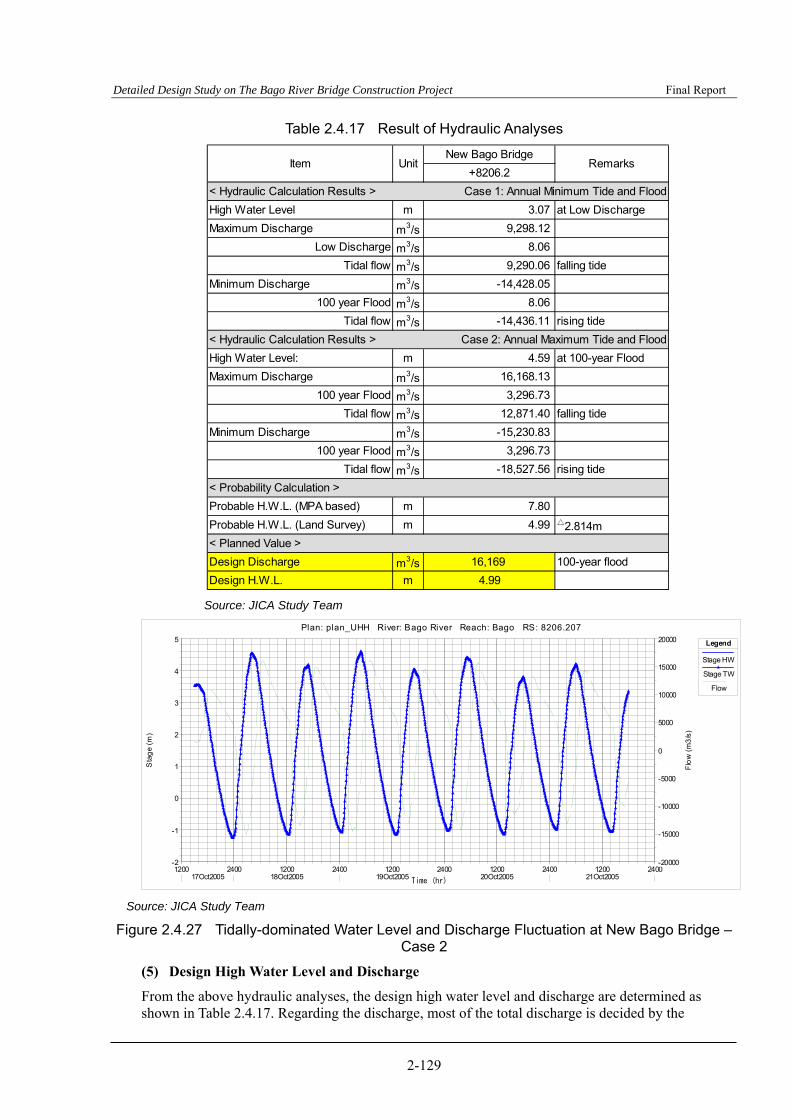
Detailed Design Study on The Bago River Bridge Construction Project Final Report
2-129
Table 2.4.17 Result of Hydraulic Analyses
Source: JICA Study Team
Source: JICA Study Team
Figure 2.4.27 Tidally-dominated Water Level and Discharge Fluctuation at New Bago Bridge – Case 2
(5) Design High Water Level and Discharge
From the above hydraulic analyses, the design high water level and discharge are determined as shown in Table 2.4.17. Regarding the discharge, most of the total discharge is decided by the
New Bago Bridge
+8206.2
< Hydraulic Calculation Results > Case 1: Annual Minimum Tide and Flood
High Water Level m 3.07 at Low Discharge
Maximum Discharge m3/s 9,298.12
Low Discharge m3/s 8.06
Tidal flow m3/s 9,290.06 falling tide
Minimum Discharge m3/s -14,428.05
100 year Flood m3/s 8.06
Tidal flow m3/s -14,436.11 rising tide
< Hydraulic Calculation Results > Case 2: Annual Maximum Tide and Flood
High Water Level: m 4.59 at 100-year Flood
Maximum Discharge m3/s 16,168.13
100 year Flood m3/s 3,296.73
Tidal flow m3/s 12,871.40 falling tide
Minimum Discharge m3/s -15,230.83
100 year Flood m3/s 3,296.73
Tidal flow m3/s -18,527.56 rising tide
< Probability Calculation >
Probable H.W.L. (MPA based) m 7.80
Probable H.W.L. (Land Survey) m 4.99 △2.814m
< Planned Value >
Design Discharge m3/s 16,169 100-year flood
Design H.W.L. m 4.99
Item Unit Remarks
1200 2400 1200 2400 1200 2400 1200 2400 1200 240017Oct2005 18Oct2005 19Oct2005 20Oct2005 21Oct2005
-2
-1
0
1
2
3
4
5
-20000
-15000
-10000
-5000
0
5000
10000
15000
20000
Plan: plan_UHH River: Bago River Reach: Bago RS: 8206.207
Time
Sta
ge
(m)
Flo
w (
m3
/s)
Legend
Stage HW
Stage TW
Flow
Time (hr)

Detailed Design Study on The Bago River Bridge Construction Project Final Report
2-130
component of tidal flow other than the river’s own flow (upland flow) from the catchment area, for too large of a tidal variation.
2.4.6.3 Scouring Depth
(1) Basic Concept
Bridge scour is caused by the erosive action of flowing water, which excavates and carries away materials from the riverbed and its banks. Scour process is cyclic in nature, which makes it complicated to determine the magnitude of scour. Scour can be deepest near the peak of a flood; however, it is hardly visible since scour holes refill with sediment during the receding stage of floods. In general, several floods may be needed to attain maximum scour under typical flow conditions at bridge crossings.
(2) Methodology of Scour Computation
In designing the bridge substructure, it is very important to evaluate the scour potential at piers and abutments, carefully studying site-specific subsurface information. Total scour at a bridge crossing is comprised of three components:
- Long-term aggradation or degradation
- Contraction scour
- Local scour
1) Aggradation and Degradation
Aggradation and degradation are changes of streambed elevation in long-term due to natural or man-induced causes which can affect the streambed. Aggradation involves the deposition of material eroded from the stream or watershed upstream of the bridge and degradation involves the lowering of the streambed due to the lack of sediment supply from upstream. Generally, streams are considered to be stable and balance of sediment transport if the configuration is not changed in long-term.
2) Contraction Scour
Contraction scour at bridge crossings involves the removal of material from the streambed and banks across the channel width as a result from a contraction of the flow area and an increase in discharge at the bridge.
In the case of new bridge construction, common causes for contraction of flows are constriction (encroachment) of road embankment onto the floodplain and/or into the main channel or piers blocking a portion of flow. As a result, the flow area decreases thus causing an increase in velocity and bed shear stress. Hence, more bed material is removed from the contracted reach than transported into the reach. As bed elevation is lowered, the flow area increases, velocity decreases, and a situation of relative equilibrium is reached.
3) Local Scour
Local scour at piers or abutments is due to the removal of bed material as a result of formation of vortices known as the horseshoe vortex and wake vortex at their base. Horseshoe vortices result from a pileup of water on the upstream surface of the obstruction and subsequent acceleration of the flow around the nose of the pier or abutment. The action of the vortex removes bed material around the base of the obstruction. In addition to the horseshoe vortex around the base of a pier, there are vertical vortices downstream of the pier called the wake vortex. Both the horseshoe and wake vortices remove material from the pier base region. The intensity of wake vortices diminishes rapidly as the distance downstream of the pier increases. As a result, immediate downstream of a long pier, there is often deposition of material.
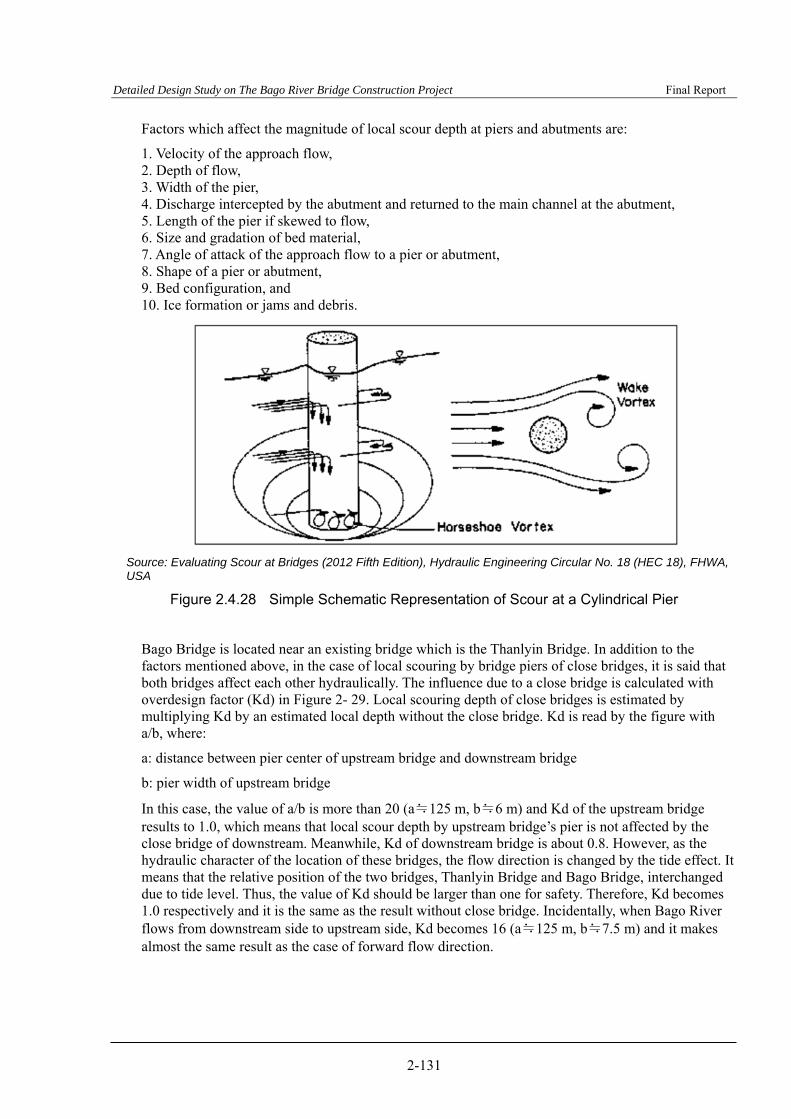
Detailed Design Study on The Bago River Bridge Construction Project Final Report
2-131
Factors which affect the magnitude of local scour depth at piers and abutments are:
1. Velocity of the approach flow, 2. Depth of flow, 3. Width of the pier, 4. Discharge intercepted by the abutment and returned to the main channel at the abutment, 5. Length of the pier if skewed to flow, 6. Size and gradation of bed material, 7. Angle of attack of the approach flow to a pier or abutment, 8. Shape of a pier or abutment, 9. Bed configuration, and 10. Ice formation or jams and debris.
Source: Evaluating Scour at Bridges (2012 Fifth Edition), Hydraulic Engineering Circular No. 18 (HEC 18), FHWA, USA
Figure 2.4.28 Simple Schematic Representation of Scour at a Cylindrical Pier
Bago Bridge is located near an existing bridge which is the Thanlyin Bridge. In addition to the factors mentioned above, in the case of local scouring by bridge piers of close bridges, it is said that both bridges affect each other hydraulically. The influence due to a close bridge is calculated with overdesign factor (Kd) in Figure 2- 29. Local scouring depth of close bridges is estimated by multiplying Kd by an estimated local depth without the close bridge. Kd is read by the figure with a/b, where:
a: distance between pier center of upstream bridge and downstream bridge
b: pier width of upstream bridge
In this case, the value of a/b is more than 20 (a≒125 m, b≒6 m) and Kd of the upstream bridge results to 1.0, which means that local scour depth by upstream bridge’s pier is not affected by the close bridge of downstream. Meanwhile, Kd of downstream bridge is about 0.8. However, as the hydraulic character of the location of these bridges, the flow direction is changed by the tide effect. It means that the relative position of the two bridges, Thanlyin Bridge and Bago Bridge, interchanged due to tide level. Thus, the value of Kd should be larger than one for safety. Therefore, Kd becomes 1.0 respectively and it is the same as the result without close bridge. Incidentally, when Bago River flows from downstream side to upstream side, Kd becomes 16 (a≒125 m, b≒7.5 m) and it makes almost the same result as the case of forward flow direction.
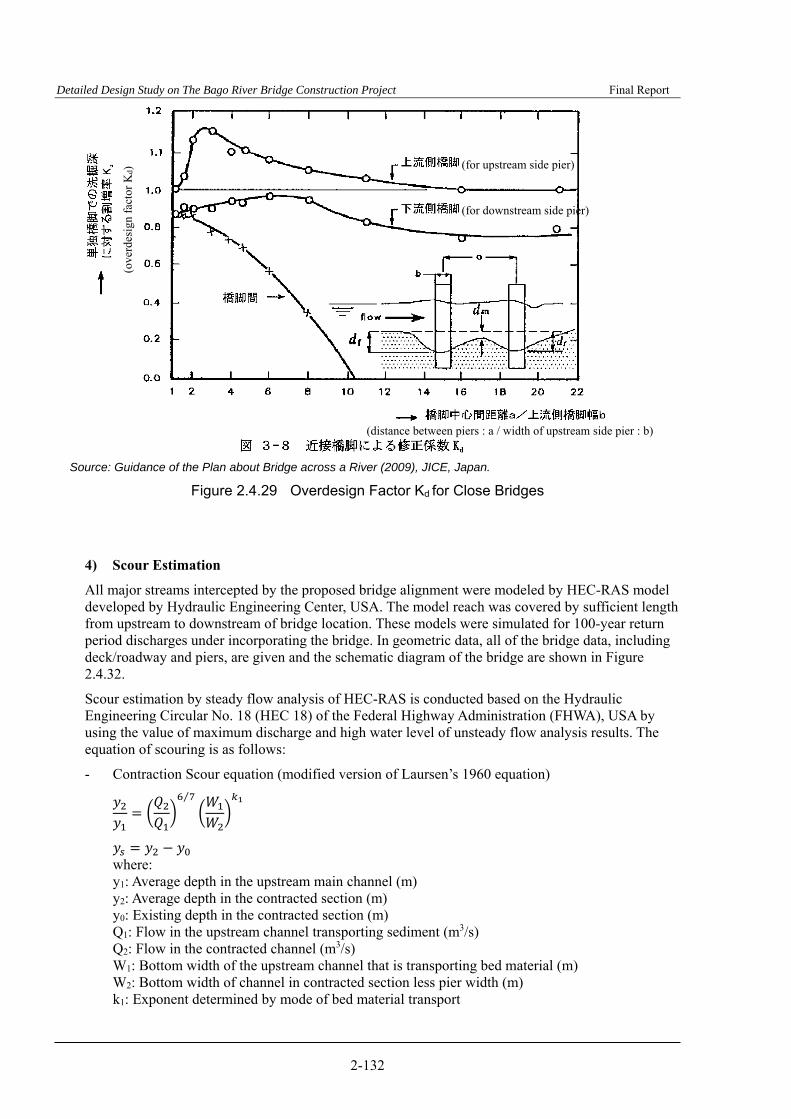
Detailed Design Study on The Bago River Bridge Construction Project Final Report
2-132
Source: Guidance of the Plan about Bridge across a River (2009), JICE, Japan.
Figure 2.4.29 Overdesign Factor Kd for Close Bridges
4) Scour Estimation
All major streams intercepted by the proposed bridge alignment were modeled by HEC-RAS model developed by Hydraulic Engineering Center, USA. The model reach was covered by sufficient length from upstream to downstream of bridge location. These models were simulated for 100-year return period discharges under incorporating the bridge. In geometric data, all of the bridge data, including deck/roadway and piers, are given and the schematic diagram of the bridge are shown in Figure 2.4.32.
Scour estimation by steady flow analysis of HEC-RAS is conducted based on the Hydraulic Engineering Circular No. 18 (HEC 18) of the Federal Highway Administration (FHWA), USA by using the value of maximum discharge and high water level of unsteady flow analysis results. The equation of scouring is as follows:
- Contraction Scour equation (modified version of Laursen’s 1960 equation)
⁄
where: y1: Average depth in the upstream main channel (m) y2: Average depth in the contracted section (m) y0: Existing depth in the contracted section (m) Q1: Flow in the upstream channel transporting sediment (m3/s) Q2: Flow in the contracted channel (m3/s) W1: Bottom width of the upstream channel that is transporting bed material (m) W2: Bottom width of channel in contracted section less pier width (m) k1: Exponent determined by mode of bed material transport
(for upstream side pier)
(for downstream side pier)
(ove
rdes
ign
fact
or K
d)
(distance between piers : a / width of upstream side pier : b)
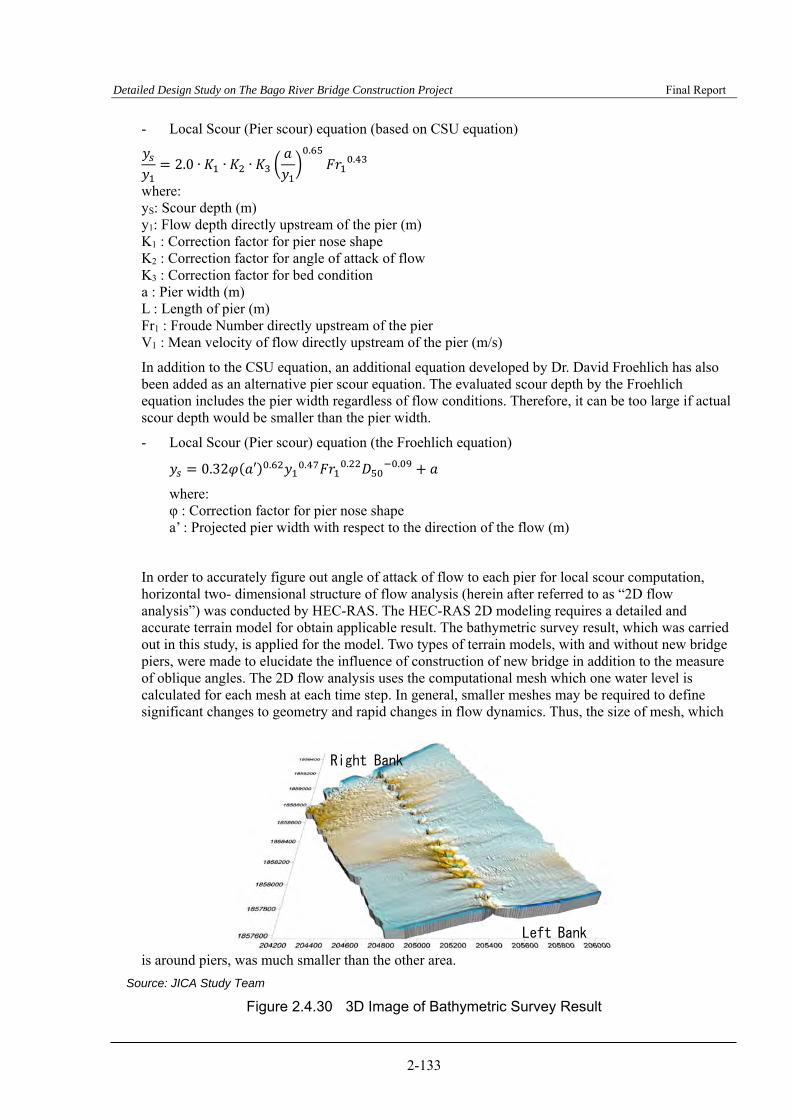
Detailed Design Study on The Bago River Bridge Construction Project Final Report
2-133
- Local Scour (Pier scour) equation (based on CSU equation)
2.0 ∙ ∙ ∙.
.
where: yS: Scour depth (m) y1: Flow depth directly upstream of the pier (m) K1 : Correction factor for pier nose shape K2 : Correction factor for angle of attack of flow K3 : Correction factor for bed condition a : Pier width (m) L : Length of pier (m) Fr1 : Froude Number directly upstream of the pier V1 : Mean velocity of flow directly upstream of the pier (m/s)
In addition to the CSU equation, an additional equation developed by Dr. David Froehlich has also been added as an alternative pier scour equation. The evaluated scour depth by the Froehlich equation includes the pier width regardless of flow conditions. Therefore, it can be too large if actual scour depth would be smaller than the pier width.
- Local Scour (Pier scour) equation (the Froehlich equation)
0.32 ′ . . . .
where: φ : Correction factor for pier nose shape a’ : Projected pier width with respect to the direction of the flow (m)
In order to accurately figure out angle of attack of flow to each pier for local scour computation, horizontal two- dimensional structure of flow analysis (herein after referred to as “2D flow analysis”) was conducted by HEC-RAS. The HEC-RAS 2D modeling requires a detailed and accurate terrain model for obtain applicable result. The bathymetric survey result, which was carried out in this study, is applied for the model. Two types of terrain models, with and without new bridge piers, were made to elucidate the influence of construction of new bridge in addition to the measure of oblique angles. The 2D flow analysis uses the computational mesh which one water level is calculated for each mesh at each time step. In general, smaller meshes may be required to define significant changes to geometry and rapid changes in flow dynamics. Thus, the size of mesh, which
is around piers, was much smaller than the other area.
Source: JICA Study Team
Figure 2.4.30 3D Image of Bathymetric Survey Result
Left Bank
Right Bank
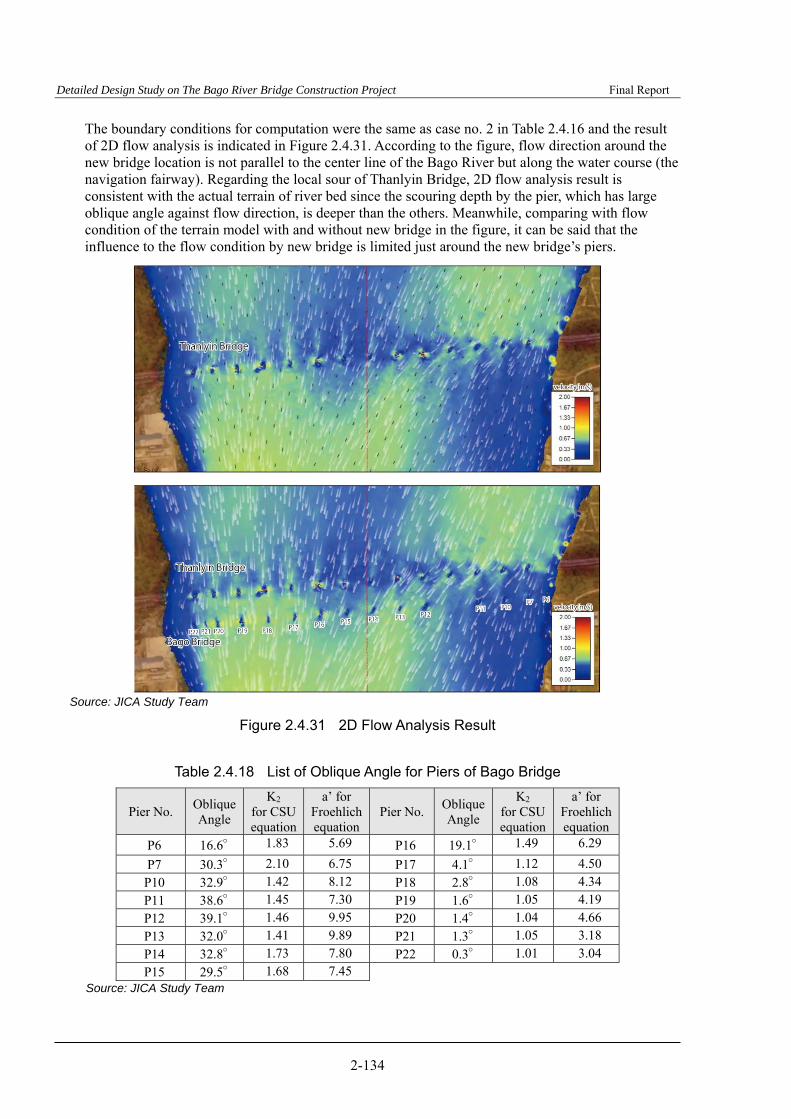
Detailed Design Study on The Bago River Bridge Construction Project Final Report
2-134
The boundary conditions for computation were the same as case no. 2 in Table 2.4.16 and the result of 2D flow analysis is indicated in Figure 2.4.31. According to the figure, flow direction around the new bridge location is not parallel to the center line of the Bago River but along the water course (the navigation fairway). Regarding the local sour of Thanlyin Bridge, 2D flow analysis result is consistent with the actual terrain of river bed since the scouring depth by the pier, which has large oblique angle against flow direction, is deeper than the others. Meanwhile, comparing with flow condition of the terrain model with and without new bridge in the figure, it can be said that the influence to the flow condition by new bridge is limited just around the new bridge’s piers.
Source: JICA Study Team
Figure 2.4.31 2D Flow Analysis Result
Table 2.4.18 List of Oblique Angle for Piers of Bago Bridge
Pier No. Oblique Angle
K2 for CSU equation
a’ for Froehlich equation
Pier No. Oblique Angle
K2 for CSU equation
a’ for Froehlich equation
P6 16.6° 1.83 5.69 P16 19.1° 1.49 6.29
P7 30.3° 2.10 6.75 P17 4.1° 1.12 4.50
P10 32.9° 1.42 8.12 P18 2.8° 1.08 4.34
P11 38.6° 1.45 7.30 P19 1.6° 1.05 4.19
P12 39.1° 1.46 9.95 P20 1.4° 1.04 4.66
P13 32.0° 1.41 9.89 P21 1.3° 1.05 3.18
P14 32.8° 1.73 7.80 P22 0.3° 1.01 3.04
P15 29.5° 1.68 7.45 Source: JICA Study Team
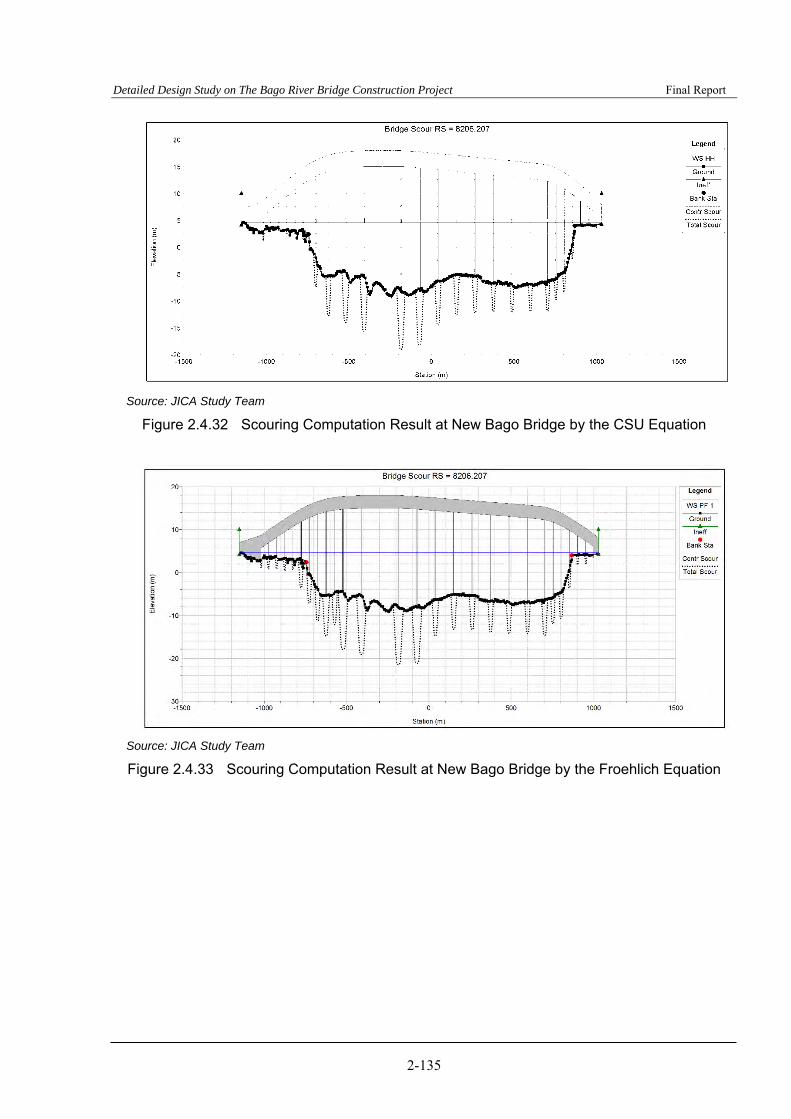
Detailed Design Study on The Bago River Bridge Construction Project Final Report
2-135
Source: JICA Study Team
Figure 2.4.32 Scouring Computation Result at New Bago Bridge by the CSU Equation
Source: JICA Study Team
Figure 2.4.33 Scouring Computation Result at New Bago Bridge by the Froehlich Equation

Detailed Design Study on The Bago River Bridge Construction Project Final Report
2-136
Table 2.4.19 Result of Scouring Computation
Source: JICA Study Team
As shown in Table 2.4.19, the estimated scour depth reaches the foundation of some piers. The foundation of new bridge shall be designed to be stable for scouring without riverbed protection.
The components of a complex pier are illustrated in Figure 2.4.34 (Jones and Sheppard, 2000).
Source: Evaluating Scour at Bridges (2012 Fifth Edition), Hydraulic Engineering Circular No. 18 (HEC 18), FHWA, USA
Figure 2.4.34 Definition Sketch for Scour Components for Complex Pier
Total scour from superposition of components is given by:
where: yS: Total scour depth (m)
Total
S cour (m )
Local
S cour (m )
C ontraction
S cour (m )
Total
S cour (m )
Local
S cour (m )
C ontraction
S cour (m )
P 1 0.62 0.62 0.00 2.72 2.72 0.00
P 2 0.62 0.62 0.00 2.73 2.73 0.00
P 3 0.70 0.70 0.00 2.83 2.83 0.00
P 4 0.58 0.58 0.00 2.70 2.70 0.00
P 5 1.02 1.02 0.00 5.77 5.77 0.00
P 6 5.48 5.13 0.35 7.59 7.24 0.35
P 7 7.40 7.05 0.35 8.08 7.73 0.35
P 10 9.37 9.02 0.35 13.35 13.00 0.35
P 11 10.20 9.85 0.35 13.62 13.27 0.35
P 12 10.87 10.52 0.35 13.30 12.95 0.35
P 13 10.25 9.90 0.35 13.21 12.86 0.35
P 14 8.26 7.91 0.35 8.52 8.17 0.35
P 15 7.53 7.18 0.35 8.19 7.84 0.35
P 16 6.84 6.49 0.35 7.94 7.59 0.35
P 17 5.30 4.95 0.35 7.30 6.95 0.35
P 18 5.26 4.91 0.35 7.37 7.02 0.35
P 19 5.11 4.76 0.35 7.37 7.02 0.35
P 20 5.42 5.07 0.35 8.14 7.79 0.35
P 21 3.91 3.56 0.35 6.12 5.77 0.35
P 22 3.72 3.37 0.35 6.12 5.77 0.35
P 23 2.77 2.42 0.35 4.07 3.72 0.35
P 24 0.25 0.25 0.00 2.30 2.30 0.00
P 25 0.24 0.24 0.00 2.27 2.27 0.00
P ier N o.
the Froehlich equationthe C S U equation
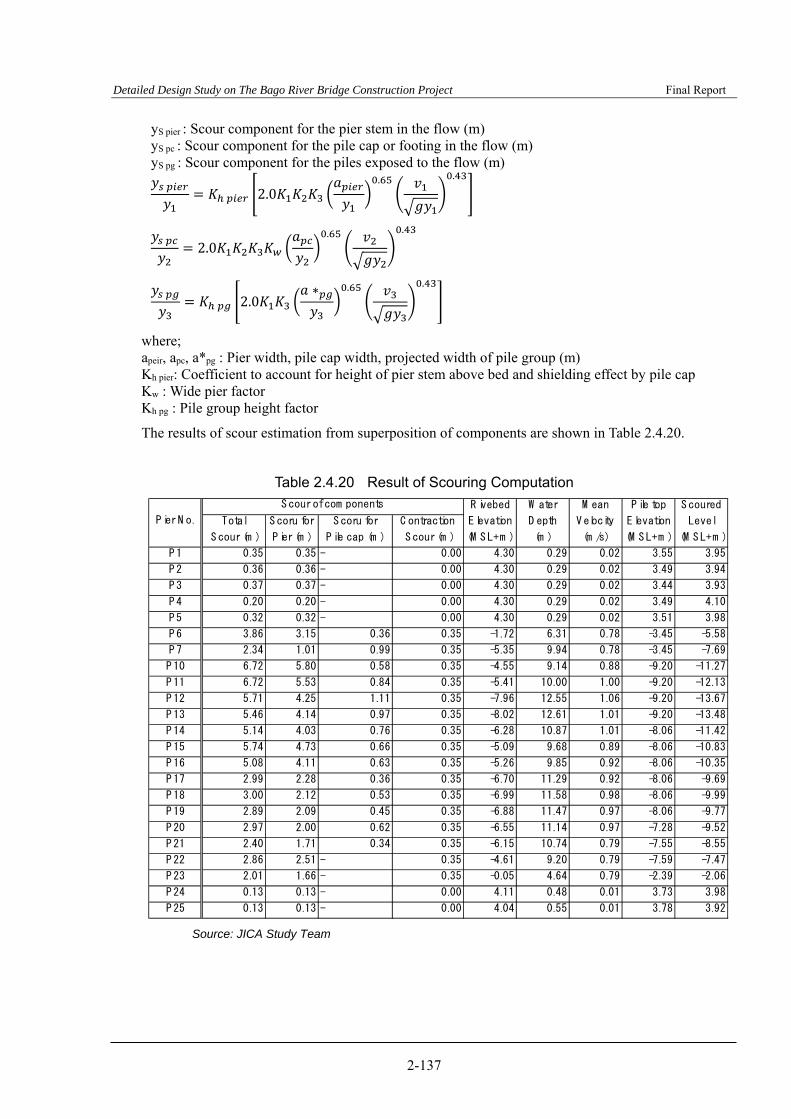
Detailed Design Study on The Bago River Bridge Construction Project Final Report
2-137
yS pier : Scour component for the pier stem in the flow (m) yS pc : Scour component for the pile cap or footing in the flow (m) yS pg : Scour component for the piles exposed to the flow (m)
2.0
. .
2.0. .
2.0
∗ . .
where; apeir, apc, a*pg : Pier width, pile cap width, projected width of pile group (m) Kh pier: Coefficient to account for height of pier stem above bed and shielding effect by pile cap Kw : Wide pier factor Kh pg : Pile group height factor
The results of scour estimation from superposition of components are shown in Table 2.4.20.
Table 2.4.20 Result of Scouring Computation
Source: JICA Study Team
Total
S cour (m )
S coru for
P ier (m )
S coru for
P ile cap (m )
C ontraction
S cour (m )
P 1 0.35 0.35 - 0.00 4.30 0.29 0.02 3.55 3.95
P 2 0.36 0.36 - 0.00 4.30 0.29 0.02 3.49 3.94
P 3 0.37 0.37 - 0.00 4.30 0.29 0.02 3.44 3.93
P 4 0.20 0.20 - 0.00 4.30 0.29 0.02 3.49 4.10
P 5 0.32 0.32 - 0.00 4.30 0.29 0.02 3.51 3.98
P 6 3.86 3.15 0.36 0.35 -1.72 6.31 0.78 -3.45 -5.58
P 7 2.34 1.01 0.99 0.35 -5.35 9.94 0.78 -3.45 -7.69
P 10 6.72 5.80 0.58 0.35 -4.55 9.14 0.88 -9.20 -11.27
P 11 6.72 5.53 0.84 0.35 -5.41 10.00 1.00 -9.20 -12.13
P 12 5.71 4.25 1.11 0.35 -7.96 12.55 1.06 -9.20 -13.67
P 13 5.46 4.14 0.97 0.35 -8.02 12.61 1.01 -9.20 -13.48
P 14 5.14 4.03 0.76 0.35 -6.28 10.87 1.01 -8.06 -11.42
P 15 5.74 4.73 0.66 0.35 -5.09 9.68 0.89 -8.06 -10.83
P 16 5.08 4.11 0.63 0.35 -5.26 9.85 0.92 -8.06 -10.35
P 17 2.99 2.28 0.36 0.35 -6.70 11.29 0.92 -8.06 -9.69
P 18 3.00 2.12 0.53 0.35 -6.99 11.58 0.98 -8.06 -9.99
P 19 2.89 2.09 0.45 0.35 -6.88 11.47 0.97 -8.06 -9.77
P 20 2.97 2.00 0.62 0.35 -6.55 11.14 0.97 -7.28 -9.52
P 21 2.40 1.71 0.34 0.35 -6.15 10.74 0.79 -7.55 -8.55
P 22 2.86 2.51 - 0.35 -4.61 9.20 0.79 -7.59 -7.47
P 23 2.01 1.66 - 0.35 -0.05 4.64 0.79 -2.39 -2.06
P 24 0.13 0.13 - 0.00 4.11 0.48 0.01 3.73 3.98
P 25 0.13 0.13 - 0.00 4.04 0.55 0.01 3.78 3.92
P ile top
E levation
(M S L+m )
S coured
Level
(M S L+m )
S cour of com ponents R ivebed
E levation
(M S L+m )
W ater
D epth
(m )
M ean
V elocity
(m /s)
P ier N o.
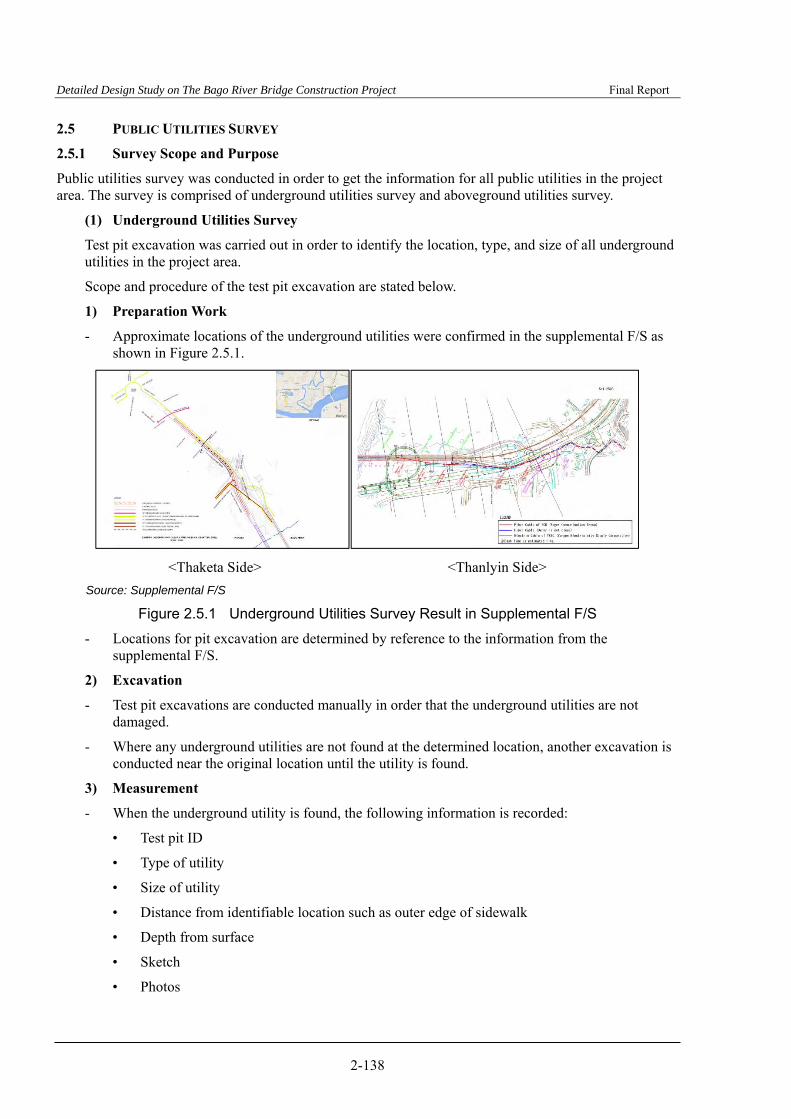
Detailed Design Study on The Bago River Bridge Construction Project Final Report
2-138
2.5 PUBLIC UTILITIES SURVEY
2.5.1 Survey Scope and Purpose
Public utilities survey was conducted in order to get the information for all public utilities in the project area. The survey is comprised of underground utilities survey and aboveground utilities survey.
(1) Underground Utilities Survey
Test pit excavation was carried out in order to identify the location, type, and size of all underground utilities in the project area.
Scope and procedure of the test pit excavation are stated below.
1) Preparation Work
- Approximate locations of the underground utilities were confirmed in the supplemental F/S as shown in Figure 2.5.1.
<Thaketa Side> <Thanlyin Side>
Source: Supplemental F/S
Figure 2.5.1 Underground Utilities Survey Result in Supplemental F/S
- Locations for pit excavation are determined by reference to the information from the supplemental F/S.
2) Excavation
- Test pit excavations are conducted manually in order that the underground utilities are not damaged.
- Where any underground utilities are not found at the determined location, another excavation is conducted near the original location until the utility is found.
3) Measurement
- When the underground utility is found, the following information is recorded:
• Test pit ID
• Type of utility
• Size of utility
• Distance from identifiable location such as outer edge of sidewalk
• Depth from surface
• Sketch
• Photos
Detailed Design Study on The Bago River Bridge Construction Project Final Report
2-139
4) Backfill
- The road excavated is brought back to original conditions after the measurement is completed.
5) Reporting
- Survey report is prepared for all test pit locations.
(2) Aboveground Utilities Survey
Aboveground utilities survey was carried out in order to identify the location, type, size, and material of all aboveground utilities in the project area.
In addition to public utilities such as electric pole, telecommunication pole, lighting, and private facilities such as advertisement, drinking water post were also surveyed.
2.5.2 Survey Result
(1) Underground Utilities Survey Result
As a result of underground utilities survey, i.e., test pit excavations, the following utilities were found in the project area:
- Water pipeline
- Diesel pipeline
- Gas pipeline
- Telecommunication line
- Fiber cable
A sample of underground utilities survey data sheet is shown in Figure 2.5.2.
All survey data sheets are attached in Appendix-13.
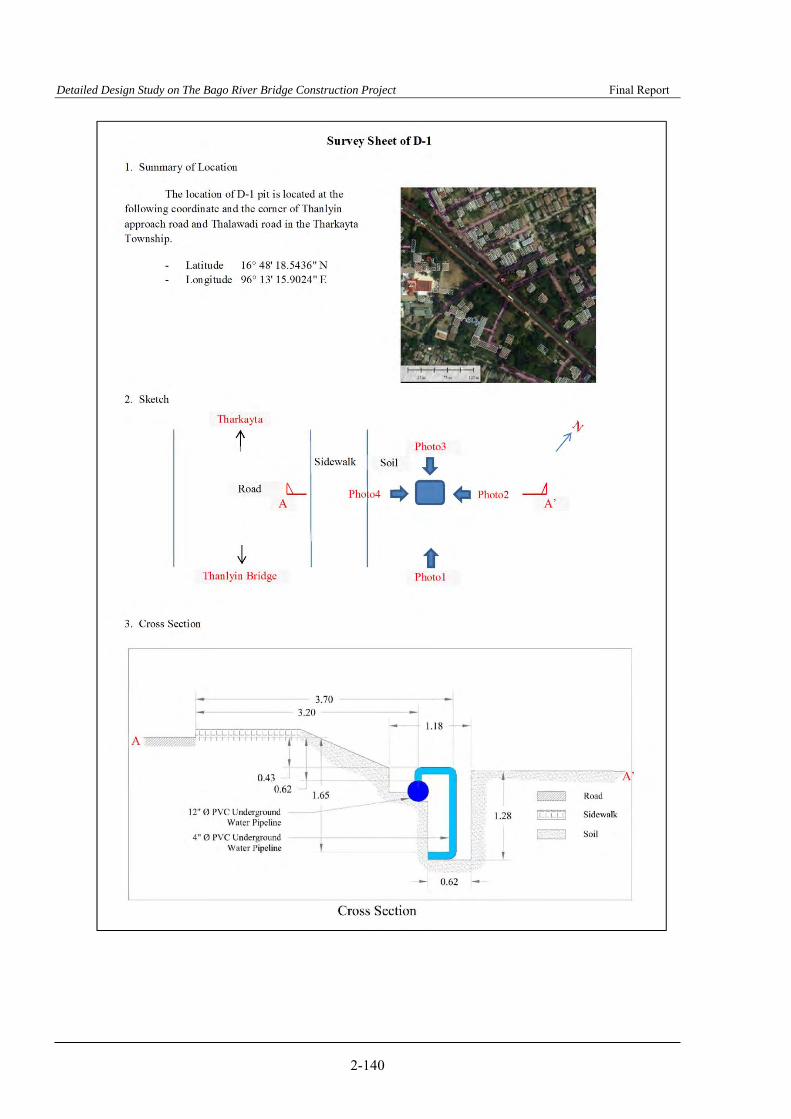
Detailed Design Study on The Bago River Bridge Construction Project Final Report
2-140
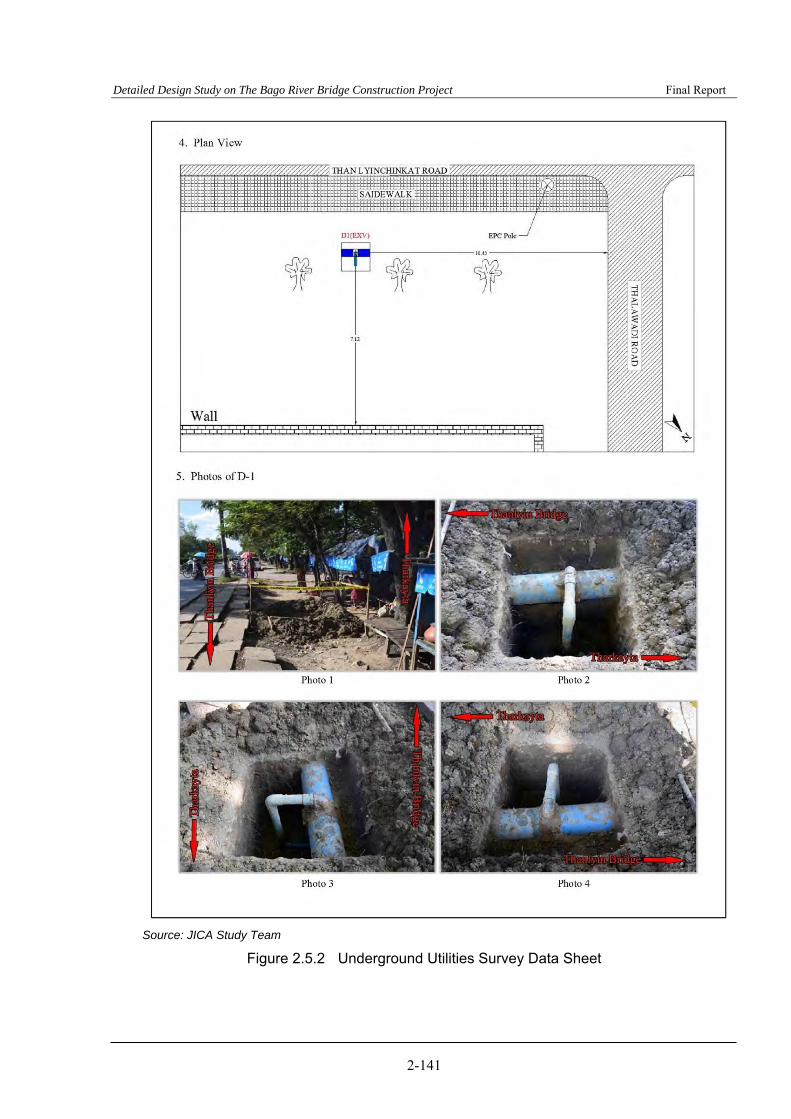
Detailed Design Study on The Bago River Bridge Construction Project Final Report
2-141
Source: JICA Study Team
Figure 2.5.2 Underground Utilities Survey Data Sheet

Detailed Design Study on The Bago River Bridge Construction Project Final Report
2-142
(2) Aboveground Utilities Survey Result
As a result of the aboveground utilities survey, many kinds of utilities were found in the project area. A sample of aboveground utilities survey data sheet is shown in Figure 2.5.3.
Source: JICA Study Team
Figure 2.5.3 Aboveground Utilities Survey Data Sheet
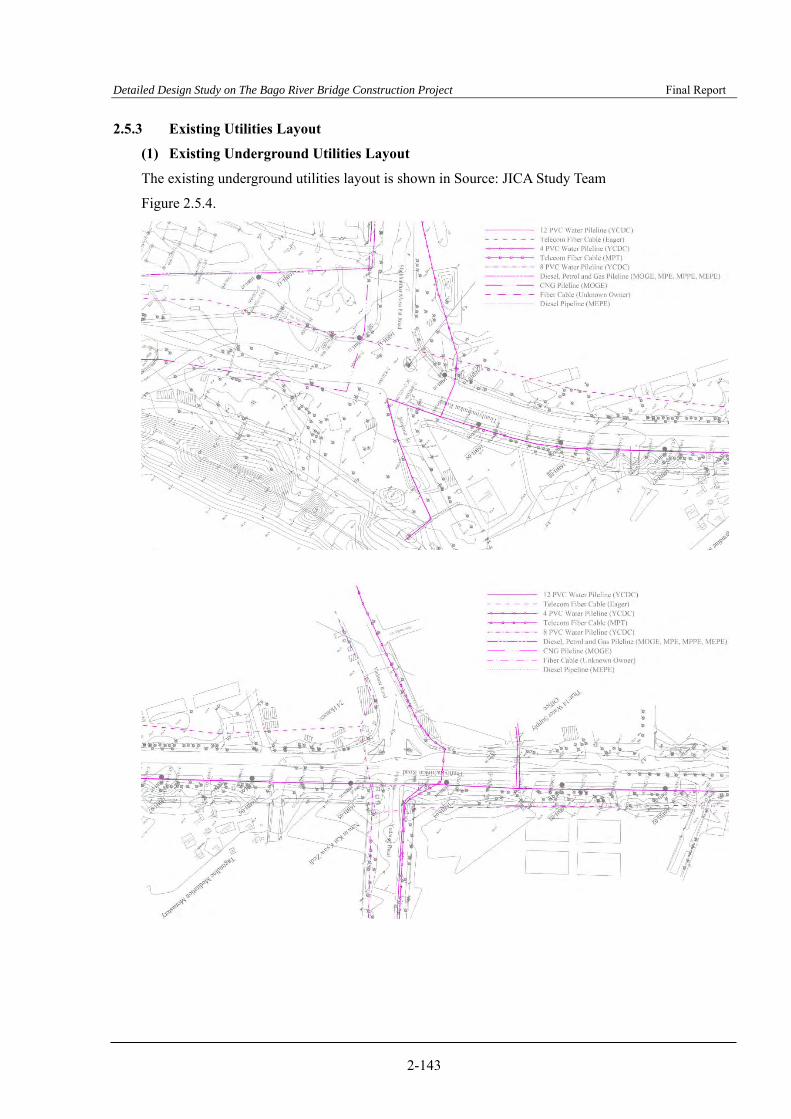
Detailed Design Study on The Bago River Bridge Construction Project Final Report
2-143
2.5.3 Existing Utilities Layout
(1) Existing Underground Utilities Layout
The existing underground utilities layout is shown in Source: JICA Study Team
Figure 2.5.4.

Detailed Design Study on The Bago River Bridge Construction Project Final Report
2-144
Source: JICA Study Team
Figure 2.5.4 Existing Underground Utilities Layout
(2) Existing Aboveground Utilities Layout
The existing aboveground utilities layout is shown in Figure 2.5.5.
Source: JICA Study Team
Figure 2.5.5 Existing Aboveground Utilities Layout
2.5.4 Procedure of Public Utilities Relocation
All public utilities within the road area must be relocated before construction is commenced. Relocation of public utilities will be conducted based on the following procedures:

Detailed Design Study on The Bago River Bridge Construction Project Final Report
2-145
Source: JICA Study Team
Figure 2.5.6 Procedure of Public Utilities Relocation
2.5.5 Conceptual Plan for Utility Relocation
(1) Plan for Existing Aboveground Utilities and Road Area
It is recommended that utility authorities will prepare the relocation plan based on the plan for existing aboveground utilities and road area shown in Figure 2.5.7. Relocation plan must be prepared so that all public utilities within the road area are removed.
Detailed Design (by JICA Study Team)
Conceptual Plan for Relocation (by JICA Study Team)
Request Letter from MOC to Related Authorities for Preparation of Relocation Plan and Cost Estimates (by MOC)
Preparation of Relocation Plan and Cost Estimates (by Utility Authorities)
Preparation of Budget for Relocation (by MOC)
Relocation of Public Utilities (by Utility Authorities)
Construction
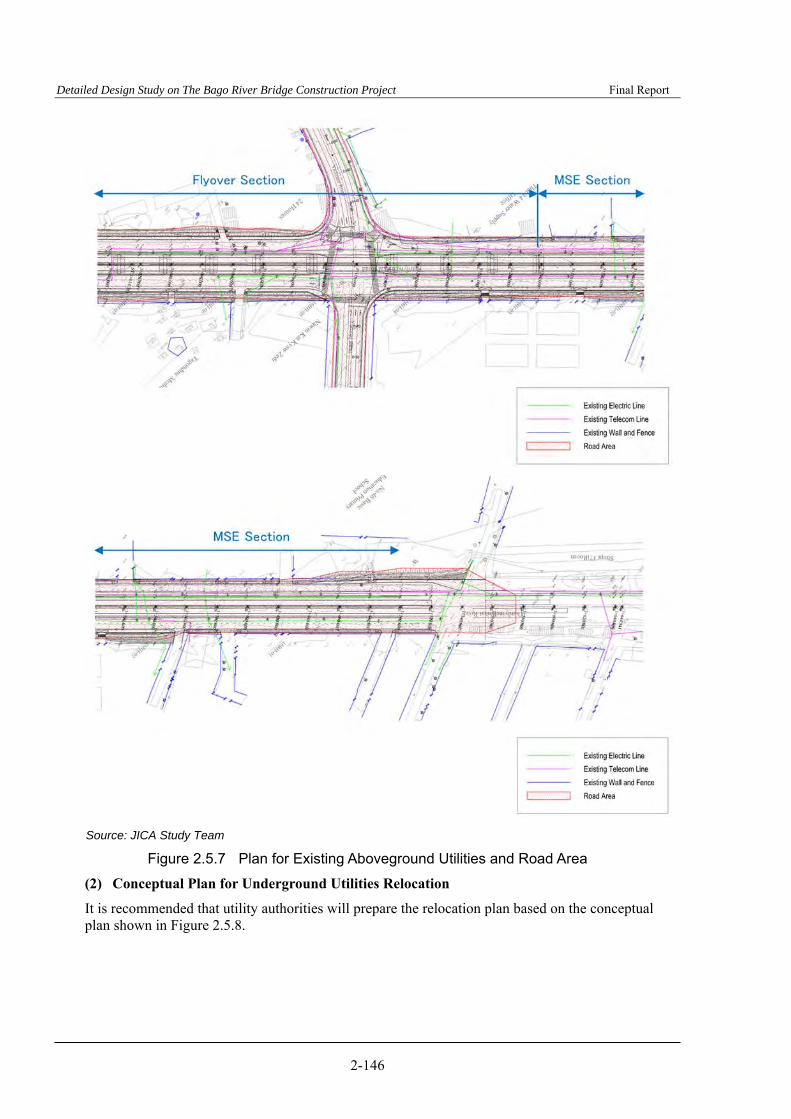
Detailed Design Study on The Bago River Bridge Construction Project Final Report
2-146
Source: JICA Study Team
Figure 2.5.7 Plan for Existing Aboveground Utilities and Road Area
(2) Conceptual Plan for Underground Utilities Relocation
It is recommended that utility authorities will prepare the relocation plan based on the conceptual plan shown in Figure 2.5.8.

Detailed Design Study on The Bago River Bridge Construction Project Final Report
2-147
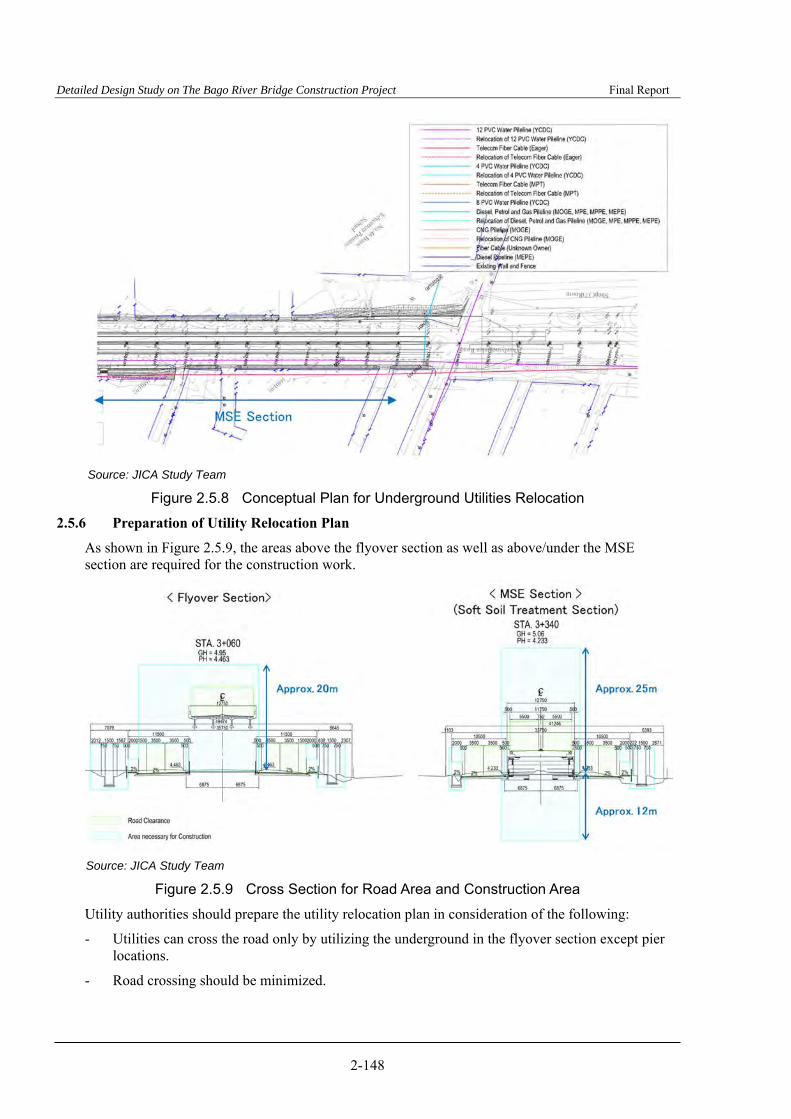
Detailed Design Study on The Bago River Bridge Construction Project Final Report
2-148
Source: JICA Study Team
Figure 2.5.8 Conceptual Plan for Underground Utilities Relocation
2.5.6 Preparation of Utility Relocation Plan
As shown in Figure 2.5.9, the areas above the flyover section as well as above/under the MSE section are required for the construction work.
Source: JICA Study Team
Figure 2.5.9 Cross Section for Road Area and Construction Area
Utility authorities should prepare the utility relocation plan in consideration of the following:
- Utilities can cross the road only by utilizing the underground in the flyover section except pier locations.
- Road crossing should be minimized.