Design Sketching for Space and Time
23
Design Sketching for Space and Time Simone Rozzi, William Wong, Paola Amaldi, Peter Woodward, and Bob Fields Middlesex University Hendon London NW4 4BT United Kingdom s.rozzi, w.wong, p.amaldi-trillo, p.woodward, b.fieldsOmdx.ac.uk Abstract. In this paper we present a case study of how design sketching can be used as a technique for exploring and creating a common understanding between users, designers and software developers, of the representation design requirements for supporting spatial-temporal reasoning in Air Traffic Control (ATC). The safe and expeditious control of aircraft requires the ATC controller to think in tenns of 3D air space, and also plan ahead in time. We refer to this mental process as spatial-temporal reasoning. ATC is a 4D (3D plus time) problem but is currently supported by 2D tools such as the Plan Position Indicator-type radar displays that are seen in ATC centres. This requires the air traffic controllers to construct mental models of the air traffic situation to ensure safe vertical and horizontal separations between moving aircraft, and also expedite traffic flow. These objectives require prediction of traffic patterns and potential bottlenecks. To explain how we used design sketching, we report on the Task Analysis of an exemplar ATC task, and the characterisation of this task in spatial-temporal terms, and how the Ecological Interface Design principle of visualisation of constraints was applied to guide the development of the 4D visual form of the representation design. Introduction The purpose of this paper is to present a case study which was used to explore how design sketching could be used to elicit and understand the spatial-temporal issues in designing interfaces for supporting space and time applications, such as air traffic control. We will present a preliminary framework for discussing the interaction between spatial and temporal aspects of work and their effect on representation design, as well as discuss how design sketching, informed by the framework, can be used to facilitate the creation of a common understanding of the spatial-temporal issues of the problem and the design space, between users, analysts, designers and software developers. This work is part of a European Commission funded project aimed at the development of a 4D Human Machine Interface for Air Traffic Control (ATC). The role of ATC is to ensure the safe and expeditious movement of aircraft within the airspace under its control. This requires the ATC controller to think of aircraft movements in terms of 3D space, de-conflicting aircraft travelling at different altitudes, speeds, and in various directions, to intercept a point in space, to Please me the following format when citing this chapter: Rozzi, S.. Wong. W.. Amaldi. P., Woodward. P., Fields. B., 2006. in IFIP International Federation for Information Pro- cessing. Volume 221. Hiunan Work Interaction Design: Designing for Human Work, ed. T. Clemmensen, Campos. P.. Omgreen, R.,Petjersen,Al., and Wong, W., (Boston: Springer), pp. 161-183.
-
Upload
independent -
Category
Documents
-
view
1 -
download
0
Transcript of Design Sketching for Space and Time
Design Sketching for Space and Time
Simone Rozzi, William Wong, Paola Amaldi, Peter Woodward, and Bob Fields
Middlesex University Hendon London NW4 4BT
United Kingdom
s.rozzi, w.wong, p.amaldi-trillo, p.woodward, b.fieldsOmdx.ac.uk
Abstract. In this paper we present a case study of how design sketching can be used as a technique for exploring and creating a common understanding between users, designers and software developers, of the representation design requirements for supporting spatial-temporal reasoning in Air Traffic Control (ATC). The safe and expeditious control of aircraft requires the ATC controller to think in tenns of 3D air space, and also plan ahead in time. We refer to this mental process as spatial-temporal reasoning. ATC is a 4D (3D plus time) problem but is currently supported by 2D tools such as the Plan Position Indicator-type radar displays that are seen in ATC centres. This requires the air traffic controllers to construct mental models of the air traffic situation to ensure safe vertical and horizontal separations between moving aircraft, and also expedite traffic flow. These objectives require prediction of traffic patterns and potential bottlenecks. To explain how we used design sketching, we report on the Task Analysis of an exemplar ATC task, and the characterisation of this task in spatial-temporal terms, and how the Ecological Interface Design principle of visualisation of constraints was applied to guide the development of the 4D visual form of the representation design.
Introduction
The purpose of this paper is to present a case study which was used to explore how design sketching could be used to elicit and understand the spatial-temporal issues in designing interfaces for supporting space and time applications, such as air traffic control. We will present a preliminary framework for discussing the interaction between spatial and temporal aspects of work and their effect on representation design, as well as discuss how design sketching, informed by the framework, can be used to facilitate the creation of a common understanding of the spatial-temporal issues of the problem and the design space, between users, analysts, designers and software developers. This work is part of a European Commission funded project aimed at the development of a 4D Human Machine Interface for Air Traffic Control (ATC).
The role of ATC is to ensure the safe and expeditious movement of aircraft within the airspace under its control. This requires the ATC controller to think of aircraft movements in terms of 3D space, de-conflicting aircraft travelling at different altitudes, speeds, and in various directions, to intercept a point in space, to
Please me the following format when citing this chapter:
Rozzi, S.. Wong. W.. Amaldi. P., Woodward. P., Fields. B., 2006. in IFIP International Federation for Information Processing. Volume 221. Hiunan Work Interaction Design: Designing for Human Work, ed. T. Clemmensen, Campos. P.. Omgreen, R.,Petjersen,Al., and Wong, W., (Boston: Springer), pp. 161-183.
162 Human Work Interaction Design
join or sequence aircraft into a queue, and then to predict the likely future situation and then to plan ahead in time. We refer to this mental process as spatial-temporal reasoning. The ATC controller is currently supported by 2D tools such as the Plan Position Indicator-type radar display which show only the plan view of aircraft, showing only horizontal separations. Aircraft altitude infonnation is provided as a text label tagged to each aircraft's radar blip, requiring the ATC controller to create a mental model of the 3D space in order to assess vertical separations. Planning and de-confliction is supported by tools such as the arrival and departure manager software and short tenn conflict detection software. Aircraft unfortunately do not only fly straight and level, but also climb and descend, at different rates of climb, and often turning at the same time. In addition, the controller also has to project the situation into the future, based on current and past aircraft track behaviours, as well as instructions that are likely but have yet to be given. This is the temporal or what some refer to as the 4' dimension, when referring to a 3D + time, or what we now refer to as a 4D display. The development of such a 3D mental picture [1 ] of the air traffic situation and then projecting it over time, 4D, represents a significant challenge for the expertise of air traffic controllers, often taking several years of training and experience to develop. Our project team was presented with the challenge of developing a visual format that could support such 4D visualisation and interaction needs.
To meet this challenge, we conducted a task analysis to first understand the spatial-temporal nature and cognitive demands of the ATC task. This has been briefly outlined above and will be elaborated further on in this paper. The task included a cognitive task analysis using the Critical Decision Method in-depth interview to understand the reasons for their actions and considerations; field observations including several hours of video recordings in order to identify the patterns and structure of work and information handling behaviours within the context of the work environment; and Contextual Inquiry interviews which were done in-situ near the ATC controllers' workstations to understand their actions.
Design sketching is a rough and quick drawing technique where the intention is to capture, represent and illustrate key features of the problem that need to be visualised. We used the rough sketches to articulate, visualise, communicate and clarify our understanding of the spatial-temporal requirements and hence the nature of the likely visualisation support needed during discussions with users, other analysts, designers and software developers. Because the designs were sketches, we could very quickly clarify, and refine concepts and ideas by quickly adding to or taking away from the sketch. We also applied the technique of storyboarding to step through temporal issues such as how to show future states of an air traffic situation in 3D space over a period of time. The Ecological Interface Design approach has a number of design principles, of which the visualisation of constraints is one. We used this principle to focus our attention on developing time into spatial representation terms.
Human Work Interaction Design 163
Design Sketching
A design sketch "... should be simple, starting with rectangles, names, and simple descriptions of relationships between functional areas ..." [2]. Lauesen has developed a systematic approach that supports and expands this approach. He introduced the concept of the virtual vi'indow, i.e. a 'user-oriented presentation of persistent data' [3]. which can be synthesized as a framework to move systematically, from infomiation requirements to the graphical representation of information. This should occur along three phases: (1) the definition and grouping of infomiation according to the relevant user tasks to be supported; (2) the planning of the data to be presented in each virtual windows; (3) the design of the interactive features such as button, menus, and icons. Lauesen does not mention directly the use of sketches, but the virtual window provides a form of sketching path along which the appearance of a set of interfaces can be sketched and developed. Finally, a last group of contributions explain the importance of using low fidelity paper prototypes at the beginning of the design process. These low quality, sketchy interfaces, sometimes using sticky Post It notes and paper cut-outs of GUI elements such as windows and drop-boxes, enable the design team to evaluate the working of the concepts, and in the process identify early usability issues while the interface is still being designed [4].
The literature on software user interface and interaction design, and in particular, sketching as an early design technique, is somewhat limited. The literature in the requirements engineering domain usually emphasises the description, organization, negotiation and verification of the requirements along the interface development process. Alternatively, we find different design principles based on Human Visual Perception [5] and Human Factors [6] principles that support good display design practices. These contributions create the context of action for the system designer, who, based on the requirements and assisted by good design principles will define the interface appearance. This allows them to move fi-om early interface designs to the definition of the final layout. However, there has generally been only a few contributions which explain the role of sketching in this process.
One such example is from Buxton [7] who suggests that design sketching is fundamental in the early ideation phases, but "...due to the temporal nature of what we are designing ..." i.e. the need to consider behaviour of both users and system interacting over a period of time, "... conventional sketching is not adequate" [7]. In other words, design sketching for user interface and representation design, does not have the maturity that the same technique has in fields such as industrial design or architecture. Design sketching techniques for software user interface development need to be further developed to cater, for example, for the dynamics of the spatial-temporal nature of human work demands. Some of these demands include the avoidance of biases in temporal decision making, minimising temporal errors, and maximising temporal awareness [8].
164 Human Work Interaction Design
Air Traffic Control and the Approach Sector
Air traffic control is a service provided for the purpose of preventing collisions between aircraft and expediting and maintaining the orderly flow of air traffic. The type of air traffic control services may be divided according to the different aircraft control phases. As an aircraft take-off is handed over from the controller in the airport Tower, to the controllers at the Area Control Centre or ACC. The controllers at the ACC use radar to guide, sequence and de-conflict arriving, departing and transiting aircraft, as they fly, climb or descend, through this airspace known as the Terminal Manoeuvring Area or TMA. This area is sometimes referred to as the Approach Sector, and the controller, the Approach Controller, Once the aircraft clears the TMA, the aircraft is handed over to the En Route Controllers who will manage the traffic, usually at a higher altitude, between the respective TMAs.
The de-conflicting activity of the controllers is a very cognitively demanding task. It requires the controller to maintain a dynamic mental picture of several aircraft climbing and descending within a relatively limited portion of airspace, and over a short period of time. At one point during our study, we had observed an Approach Controller sequencing 12 aircraft to land at an airport within 10 minutes. For each of these the approach controller must ensure the safety sequencing and separations, i.e. aircraft must be under no circumstances closer than 3 miles horizontally and 1000 feet vertically.
In the approach control three controllers usually operate together. A coordinator takes aircraft from the en route sector. S/he makes a plan about 10-20 minutes in advance about aircraft trajectories towards the airport. Then as the aircraft gets closer to the airport they are sequenced and separated by the approach controllers. These working positions can include one to three controllers depending on traffic conditions.
Rationale for Introducing 4D Technology into ATC
Approach Control represents one of the domains of interest for the AD4 project. Due to the lack of important 3D aspects of information such as altitude and 4D aspects such as projected future arrival sequences, 2D PPI radar displays are often augmented with these additional information, e.g. altitudes tagged as text labels, and arrival sequences packaged within decision support tools such as the Arrival Manager software.
Ironically, while 3D and stereoscopic displays can contribute towards an approach to resolving the information overload problems of 2D radar representations, it also poses new challenges for the display design. Recent work suggests that the pictorial realism often found in 3D user interfaces does not necessarily improve operator work efficiency. Instead, it can lead to breakdowns in performance that increase visual complexity, perceptual error, and mental effort [9]. Therefore, part of the AD4 project efforts have been allocated to the investigation of the type of representation form that could effectively support the controller's spatial-temporal reasoning in the approach control, without unnecessary photo-realism.

Human Work Interaction Design 165
Methodology
The study investigated the control task perfonned by Approach Controllers at the Rome Approach Control Centre, over two blocks of three days each. The study combined a number of techniques. We conducted a number of cognitive task analysis interviews using an approach similar to the Critical Decision Method, investigating difficult or non-routine situations in order to identify the strategies they invoked and the cues they attended to when sequencing and de-conflicting aircraft in 3D space and over time. We also observed and video recorded how controllers operated under routine conditions, paying special attention to patterns of behaviours and information handling practices involved in coordinating actions between controllers and planning ahead. In between these observations as the opportunities arose due lower workload, we used Contextual Inquiry techniques to interview the controllers in the context of their natural settings. This allowed us to ask the controllers to explain their rationale for a decision and they can very quickly walk-through their decision while the aircraft are still on the radar display, as is the case in the example being reported.
The results were further analysed within the context of the Ecological Interface Design principle of making constraints visible, to derive an understanding of what might be needed to represent space and time as visible constraints. This approach implies the direct visualization of the cognitive workspace and the associated constraints for the operator. For example, this involves computation of distances, altitude, speed and rate of climb at a particular distance. These cognitively demanding computations can be allocated to the display itself by making visible these parameters in relation to the aircraft and its flight. These concepts were encapsulated into the specification of scenario based user requirements (i.e. what the user needs to know), as well as visual requirements (i.e. what the user needs to see).
Task Analysis: What Are the Spatial-Temporal Demands of the Approach Controller Task?
This section describes one of the many control situations studied during our investigations. It is useful as an exemplar of the cognitive complexity typically encountered in ATC work. It describes how a controller evaluated vertical separations and subsequently de-conflicted aircraft trajectories projected forward in time. The speech bubbles in the diagrams have been translated from the Italian. Using this scenario and other scenarios studied but not reported in this paper, we derived a series of 4D representation design needs. The next section will then report on the use of design sketches to translate those spatial-temporal needs into early representation fonns of the user interface.
6.1 The Scenario
Flight LOT 314 (see Figure 1) had just taken off and is now under the control of the Approach Controller. It is currently at FL (Flight Level) 140 (or 14,000 feet), and
166 Human Work Interaction Design
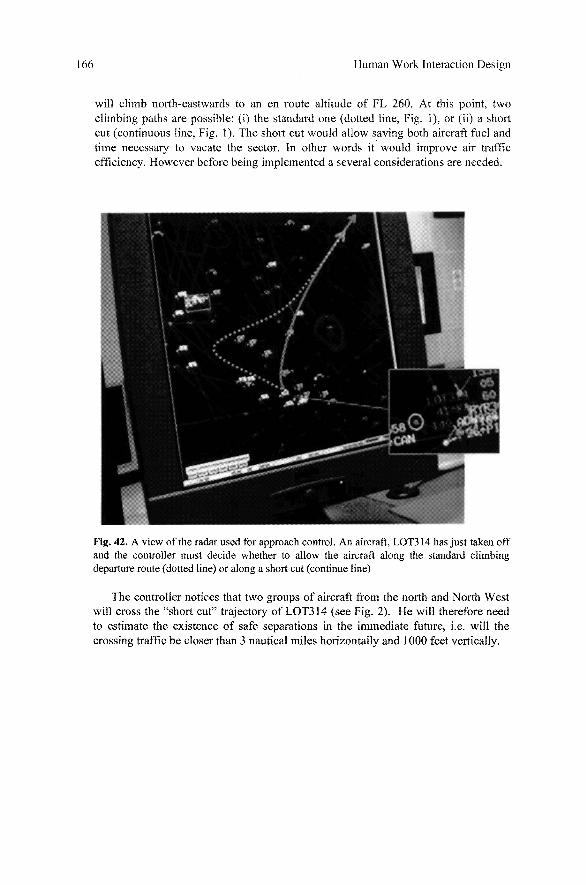
will climb north-eastwards to an en route altitude of FL 260. At this point, two climbing paths are possible: (i) the standard one (dotted line, Fig. 1), or (ii) a short cut (continuous line. Fig. 1). The short cut would allow saving both aircraft fuel and time necessary to vacate the sector. In other words it would improve air traffic efficiency. However before being implemented a several considerations are needed.
Fig. 42. A view of the radar used for approach control. An aircraft, LOTS 14 has just taken off and the controller must decide whether to allow the aircraft along the standard climbing departure route (dotted line) or along a short cut (continue line)
The controller notices that two groups of aircraft from the north and North West will cross the "short cut" trajectory of LOTS 14 (see Fig. 2). He will therefore need to estimate the existence of safe separations in the immediate future, i.e. will the crossing traffic be closer than 3 nautical miles horizontally and 1000 feet vertically.

Human Work Interaction Design 167
aircrafi maki ItmorediHicult ! should ask the
{xjrdmator"
always consicfcr also ths
^ ctescendmq
Fig. 43. Traffic patterns (circled in the picture) considered by the controller before deciding whether it is possible to allow the LOT314 to climb along the short cut (the main arrow leading off to the right). The arrows within the ellipses indicate the direction of the two groups of aircraft. The balloons report the controller's explanation
In order to assess if there is an adequate safe separation (see Figure 3), he mentally projects the position where LOT 314 will be and the path it will likely to take in the next two to three minutes. He then checks which other aircraft is going to be near the projected position or path.
3-'First 1 sm^sne that L0T314^ be here m 3
minuies
Fig. 44. Short term assessment of separations. The end of the dotted line represents the expected position of the LOT in three minutes. The controller also assesses which other aircraft is going to be close to this area in the same time frame. For each aircraft likely to intersect with the new shortcut on the horizontal plane an evaluation is made for the vertical plane (Flight Level), this is to ensure that the safe separation limits are kept
The LOT aircraft, as mentioned earlier, is climbing from FL 140 to FL 260. In the first assessment in Figure 4 (Note 5) the controller is considering that Flight
168 Human Work Interaction Design
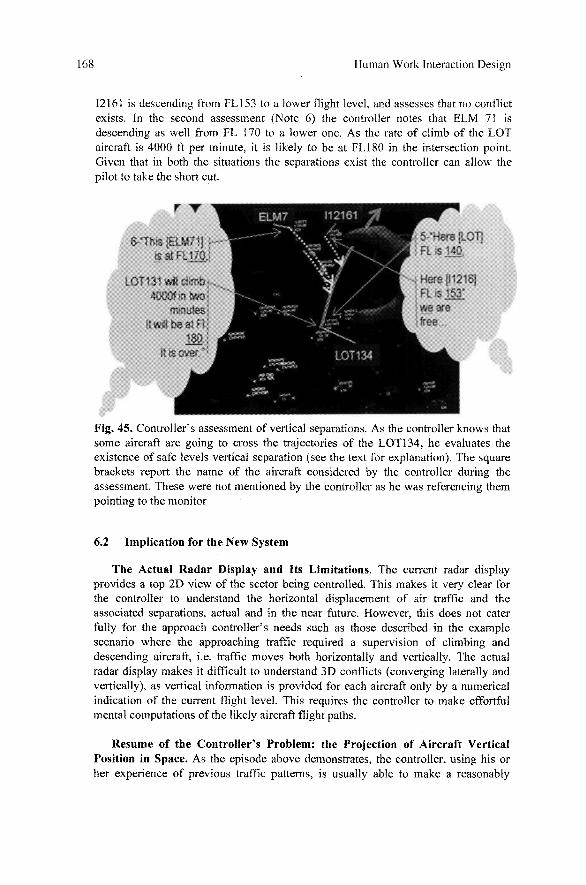
12161 is descending from FL153 to a lower flight level, and assesses that no conflict exists. In the second assessment (Note 6) the controller notes that ELM 71 is descending as well from FL 170 to a lower one. As the rate of climb of the LOT aircraft is 4000 ft per minute, it is likely to be at FL180 in the intersection point. Given that in both the situations the separations exist the controller can allow the pilot to take the short cut.
r T
y - ifsslELMJIl IS at FL170.
.0T131 m cl-mb 40C0f n h«)
fn-nutes It Will be at Fl
M-It is avef.'
•Hers [LOT] FL •$ 140
Here (11216) FL -s 153'
•free
IviM, 45. Controller's assessment of vertical separations. As the controller knows that some aircraft are going to cross the trajectories of the LOT134, he evaluates the existence of safe levels vertical separation (see the text for explanation). The square brackets report the name of the aircraft considered by the controller during the assessment. These were not mentioned by the controller as he was referencing them pointing to the monitor
6.2 Implication for the New System
The Actual Radar Display and Its Limitations. The current radar display provides a top 2D view of the sector being controlled. This makes it very clear for the controller to understand the horizontal displacement of air traffic and the associated separations, actual and in the near future. However, this does not cater fully for the approach controller's needs such as those described in the example scenario where the approaching traffic required a supervision of climbing and descending aircraft, i.e. traffic moves both horizontally and vertically. The actual radar display makes it difficult to understand 3D conflicts (converging laterally and vertically), as vertical information is provided for each aircraft only by a numerical indication of the current flight level. This requires the controller to make effortful mental computations of the likely aircraft flight paths.
Resume of the Controller's Problem: the Projection of Aircraft Vertical Position in Space. As the episode above demonstrates, the controller, using his or her experience of previous traffic patterns, is usually able to make a reasonably
Human Work Interaction Design 169
accurate projection about the horizontal position that a given aircraft is likely to occupy in the near future. Unfortunately this is not so when determining the aircraft's next vertical position. This requires the following mental calculation to be made for each aircraft that must be de-conflicted:
(l)Rate of climb (or descent) x (2) time
As the rate of climb information (1) is usually available only to pilots and not to the controllers, an explicit request from the controller to the pilot is needed. Therefore, such computations will require a communication between the controller and pilot, limiting what the controller can do during that very short time frame, as s/he would be engaged in a radio communication with the pilot. Thus, to ascertain the aircraft's vertical position, the controller needs to perform a mental computation, and also a communication with as many pilot as many the number of aircraft that must be de-conflicted.
Based on the cognitive task analysis of this incident and other similar incidents, one of the main contributions a 3D user interface could offer to a controller would be to make visually salient the vertical and angular separations between aircraft in the 3D space. This could potentially reduce the effort which currently requires a demanding mental computation by the controller to make. A number of visual representation requirements resulted from the work analysis, and they include the following:
(a) Show the intersection point in 3D space, when required by controller. The 2D radar scope must still available to controller so to avoid losing the pattern recognition skills that controllers have developed with this tool. The 2D scope would serve the identification of critical traffic, these could be then accessed with a 3D on demand, in order to verify the associated vertical separations.
(b) Show estimated vertical, horizontal and angular separations expected at the predicted intersecting point. Based on the work analysis it was felt that making visually salient these variables would determine a quicker controller decision making.
(c) Visualize the rate of climb (or descent) of the aircraft. In this way it is available to the controller an important data that today is available only to pilot;
(d) Show the heading of the aircraft and whether the aircraft is navigating on an assigned flight level, or is climbing/descending to a new FL. This was felt to be fundamental to provide to the controller an indication of the position that the aircraft would be likely to occupy in the near future.

170 Human Work Interaction Design
Framework for Spatial Temporal Representation Requirements
The primary focus of our work in this project is to understand what 4D aspects of the air traffic control task need to be represented and how they should be best rendered. As described earlier in this paper, this task is very much spatial and temporal in nature: the controllers need to visualise in their mind the 3D positions of the aircraft in relation to key features of the airspace environment, and in terms of time, as they coordinate current actions and plan ahead. In this section we propose a framework for considering the elements of 3D space and time, and in so doing, identify the goals, functional relationships and entities, that need to be represented in an ATC control interface.
Our cognitive task analysis suggests that the cognitive work that is performed by air traffic controllers can be generally described along two dimensions: spatially and temporally. Objects exist in 3D space, and these entities include aircraft, airways, fixes, beacon points, and terrain. Objects can also have attributes, e.g. aircraft labels provide additional information such as aircraft call sign, model, and more dynamic information such as altitude, which defines their position in space. These objects are subject to constraints such as the permissible distances between objects such as aircraft. We call these proximities separations and minimum altitudes. When operating in certain localities or over certain terrain, the aircraft may be subject to other constraints, for example, where they can fly over or the minimum safe altitudes they should transit the area.
While these two groups of information are often adequate to develop visual spatial representations of work domains such as ATC and even emergency ambulance control, they are often inadequate for representing the work of the domain so that the controllers can perform their jobs effectively. The objects and constraints can show where the aircraft are and are heading, and the constraints such as separations and distances from each other as well as larger obstacles such as weather. However, controllers also need to know other relationship-hased information. One such fundamental relationship in activity-based systems, is the who-what-where relationship: Who is that aircraft? what is it doing? where is it going? Implicit in this relationship is the aircraft relationship to (i) other aircraft, to determine if their trajectories are likely to cross and if they are likely to come within too close to each other, or (ii) obstacles, i.e. their likelihood to come close to some larger obstacle such as heavy weather or no-fly zone. Together these three sets of information allow us to know what is happening to the activity being controlled. This is illustrated in the Spatial Dimensions half of the Spatial-Temporal Framework in Figure 5.
Here, the spatial parameters of the work domain identified above are static, They represent the state of an aircraft at a point in time. Navigation beacon points and airways boundaries, for example, do not change either. Again, this is therefore inadquate to fully represent the work in a dynamic environment such as ATC. The dynamics of the environment are the interactions between the objects and its constraints, and hence the relationships that emerge from those interactions. We have referred to this as the behaviours in Figure 5.

Human Work Interaction Design 171
Spatial Dimensions Temporal Dimensions
Objects
airways., fixes, be&:ofi potote, tetfatn
Constraints Ptoximsties. miniRiurn aKitudes.
Relationships Who - y^tiat • Mmtis - -Mmn.
Past
Present Has bfi&a. >s 0oi'Kf
Pro|©cled
Inient
5 I
Fig. 46. The Spatial-Temporal Framework
As interactions can only occur over time, behaviours, or sets of interactions, integrate the spatially-based activity with the temporal dimension of the framework. Behaviours or events can be viewed in terms of different time horizons which have been called time bands [10]. Each time band being relevant to different aspects of the event, such as second to second for real time control and coordination activity, the day or the month it happened in terms of reporting and debriefing activity. This notion of time banding allows us to consider how different levels of activities such as planning and coordination occur, and the processes that should be supported.
However, in ATC, longer timeframes such as days and months are not directly relevant to real-time control activities, although air traffic patterns of behaviours over months and years are important for longer term (time band) activities such as infrastructure planning. From the real-time ATC control perspective, the real-time control time band of seconds and minutes, is the time band of focus. Behaviours within this time band may be described in terms of their (immediate) past, where they are and what they are doing at the present, and then based on this track history, predict what they might be doing in the projected immediate future. For instance, an aircraft that has been (past) and still is (present), flying straight and level at 27,000 ft, heading 020 degrees, with a speed of 460 knots, can be projected to be at a point bearing 020 degrees and 38.3 nautical miles away.
Intended behaviours are however, not projectable in the same way based on past or historical data. In the scenario cited earlier in this paper, we described how a controller is projecting into the future the intention to send an aircraft through a short cut. If we were to use the aircraft track history at the time the decision was being considered, i.e. the aircraft was climbing and turning as it departs the runway, the projected position will be erroneous. Instead, the controller was making use of a different, non-existent set of data: i/the aircraft were to be at a point A and if it were to take the short cut, what would be the possible conflicts with its trajectory? This is
172 Human Work Interaction Design
not based on 'hard' past performance data from which we can compute effects from a cause and perhaps, draw projected positions on the display; but on 'soft' intentional data that are yet to exist in the control system, and therefore the system cannot automatically compute and render a future position. Such a distinction has been referred to by the terms causal systems and intentional systems [11]. In causal systems, the outcomes are predictable by the laws of nature, whereas, intentional systems cannot be and are instead based on human motivation.
As we use design sketches to study how a future 4D visualisation and interactions would work, we started to observe the need to make distinctions in behaviours over time. Our design sketches need to reflect the wide spectrum of activity that a controller needs to respond to or initiate, that is distributed within space and over time, and with infoimation based on actual data, and also, based on intentions. In other words, following from the Law of Requisite Variety [12], the designs that our sketches explore need to have/possess the capability to support the variety of situations that the task domain is likely to present the controller, otherwise, the misfits can lead to performance degradation.
The following sections illustrate how the identified tasks were translated to show spatial and temporal issues.
Communicating the Spatial Temporal Nature of the User Problem
In order to translate the requirements derived from the work analysis into the visual designs, it was felt that a design dissemination workshop was needed to share the researchers' understanding of the control problem, and to start to visualize the form of the novel 4D display. The design team included about ten people, with a background respectively in Human Factors, Information Visualization, Safety, 3D Programming, and Management. The following subsection explains the role of the sketches during the meeting. All of the sketches here reported were drawn on large 50x72cm sheets of paper.
Initially dissemination of the results of the analysis was intended to be achieved by means of a Power Point presentation to the other team members. However this was inadequate given the complexity of the factors involved in the controller's job. Therefore some first sketches were drawn so as to explain the user problem, especially to team members not non-familiar with the ATC domain.
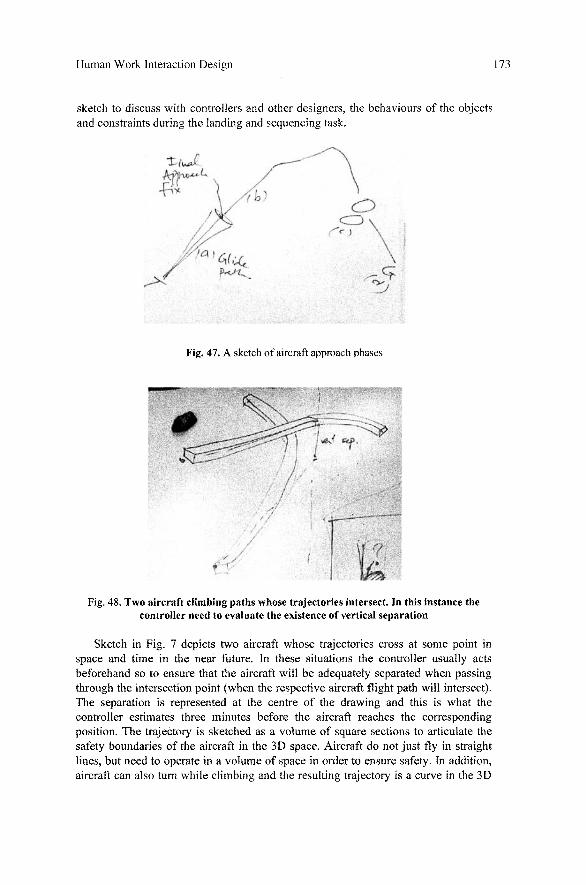
Sketch in Fig. 6 depicts the phases of flight an incoming aircraft. When approaching the airport usually an aircraft enters the controlled sector (see drawing point d), then it must be directed towards the airport along a series of fixed points (the 'fix', and can be thought as a fixed point in the 3D space represented as a longitude, latitude, and an altitude). The controller in this phase can give instructions concerning aircraft speed, route, flight level, so to take the aircraft to the final approach fix, where the Instrument Landing System begins along the glide path(see drawing point a). In some cases such as emergency situations, aircraft can be placed in a holding stack (see drawing point c) while the controllers attempt to give landing priority to the aircraft with the emergency. This example shows how we used the
Human Work Interaction Design 173
sketch to discuss with controllers and other designers, the behaviours of the objects and constraints during the landing and sequencing task.
\l'fU^X,
A;fl) «--"'--|--ix
, • • ' ' . ' •
.•>/
\
% •''
'Q
^^ /'
' ] ' '' il
^'Lf f-<.̂ C .
^ • • - ' ' " \
\ \
^'r t \
' \
Fig. 47. A sketch of aircraft approach phases
M9.
Fig. 48. Two aircraft climbing paths whose trajectories intersect. In this instance the controller need to evaluate the existence of vertical separation
Sketch in Fig. 7 depicts two aircraft whose trajectories cross at some point in space and time in the near future. In these situations the controller usually acts beforehand so to ensure that the aircraft will be adequately separated when passing through the intersection point (when the respective aircraft flight path will intersect). The separation is represented at the centre of the drawing and this is what the controller estimates three minutes before the aircraft reaches the corresponding position. The trajectory is sketched as a volume of square sections to articulate the safety boundaries of the aircraft in the 3D space. Aircraft do not just fly in straight lines, but need to operate in a volume of space in order to ensure safety. In addition, aircraft can also turn while climbing and the resulting trajectory is a curve in the 3D

174 Human Work Interaction Design
space with a turning radius, again, rather than straight lines joining at a sharp angle to each other.
Overall, the sketches in Fig. 6 and 7, up to this point, served the purpose of explicating the controller's cognitive work space rather than serving the purpose of representing new ideas for interface design. The domain objects and constraints that usually are mentally considered by the controllers include flight phases, trajectories, fixes, and relationships between them include separations in time. These spatial objects populate in an informal but understandable manner, the sketches.
This sketching process at the same time revealed some of the complexity factors encapsulated in the scenario, which are: (1) the extent of the projection in time, i.e., how much in advance a decision imust be taken; (2) the number of conflicts that must be accounted for; (3) the geometry of the conflicts, e.g. two aircraft climbing towards the same point in space from opposite direction. Up to this point it can be said that the sketching process contributed to shape the team awareness of the design problem.
8.1 Switching from user problem to design problem
Sketch in Fig. 8 and 9 report some design ideas following the user problem setting phase. Sketch Fig. 8 represents a possible trajectory visualization strategy for climbing aircraft: The aircraft trajectory is 'connected' to the ground through a vertical surface, so as to make visually salient the aircraft behaviour in relation to the ground in the 3D space, as well as to show the existence of possible conflicts.
.4 ,r '•' 'I
i
. . ' • ' • | g:- ;
;..i..,: ' -i
Fig. 49. An early design idea concerning the visualization of aircraft trajectories. In order to make them visually salient it was though to make them connected to the ground
Human Work Interaction Design 175
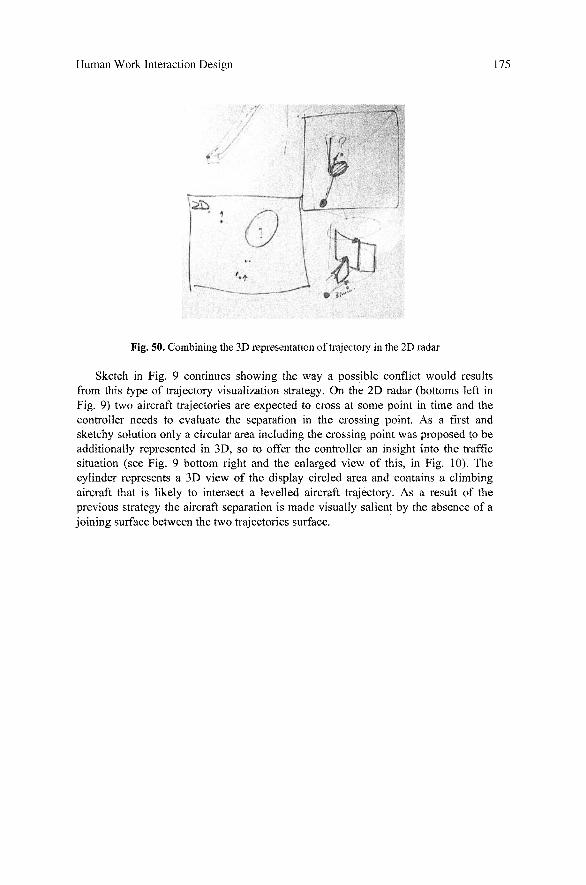
Fig. 50. Combining the 3D representation of trajectory in the 2D radar
Sketch in Fig. 9 continues showing the way a possible conflict would results from this type of trajectory visualization strategy. On the 2D radar (bottoms left in Fig. 9) two aircraft trajectories are expected to cross at some point in time and the controller needs to evaluate the separation in the crossing point. As a first and sketchy solution only a circular area including the crossing point was proposed to be additionally represented in 3D, so to offer the controller an insight into the traffic situation (see Fig. 9 bottom right and the enlarged view of this, in Fig. 10). The cylinder represents a 3D view of the display circled area and contains a climbing aircraft that is likely to intersect a levelled aircraft trajectory. As a result of the previous strategy the aircraft separation is made visually salient by the absence of a joining surface between the two trajectories surface.
176 Human Work Interaction Design
Levelled a/c
Separation
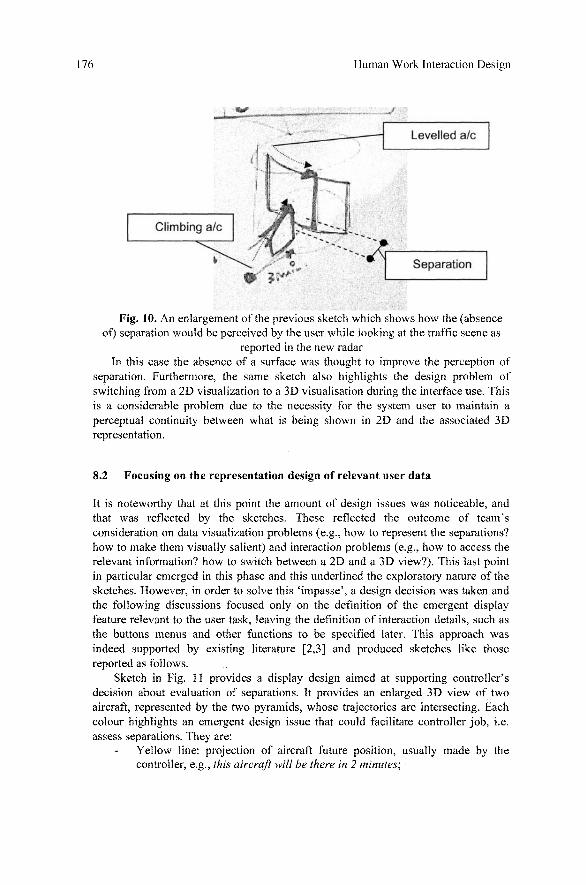
Fig. 10. An enlargement of the previous sketch which shows how the (absence of) separation would be perceived by the user while looking at the traffic scene as
reported in the new radar In this case the absence of a surface was thought to improve the perception of
separation. Furthermore, the same sketch also highlights the design problem of switching from a 2D visualization to a 3D visualisation during the interface use. This is a considerable problem due to the necessity for the system user to maintain a perceptual continuity between what is being shown in 2D and the associated 3D representation.
8.2 Focusing on tlie representation design of relevant user data
It is noteworthy that at this point the amount of design issues was noticeable, and that was reflected by the sketches. These reflected the outcome of team's consideration on data visualization problems (e.g., how to represent the separations? how to make them visually salient) and interaction problems (e.g., how to access the relevant information? how to switch between a 2D and a 3D view?). This last point in particular emerged in this phase and this underlined the exploratory nature of the sketches. However, in order to solve this 'impasse', a design decision was taken and the following discussions focused only on the definition of the emergent display feature relevant to the user task, leaving the definition of interaction details, such as the buttons menus and other functions to be specified later. This approach was indeed supported by existing literature [2,3] and produced sketches like those reported as follows.
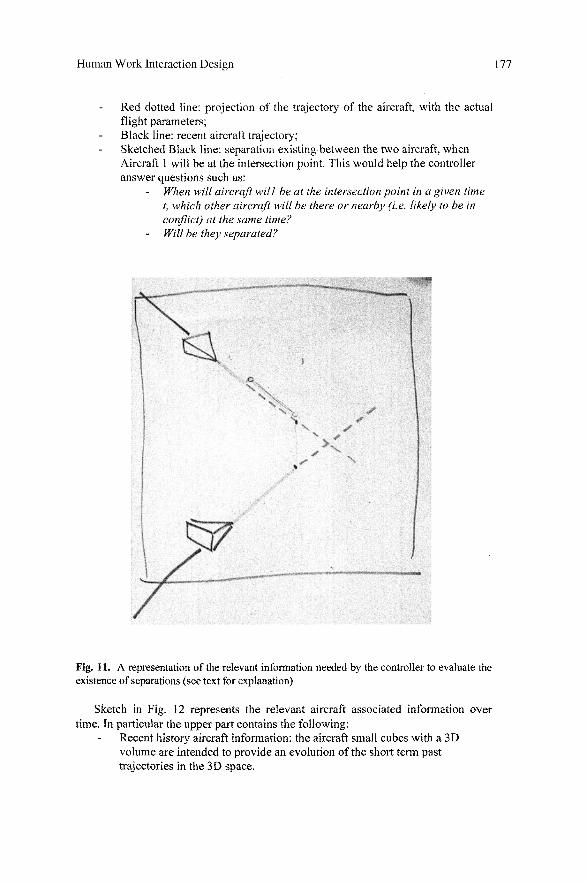
Sketch in Fig. 11 provides a display design aimed at supporting controller's decision about evaluation of separations. It provides an enlarged 3D view of two aircraft, represented by the two pyramids, whose trajectories are intersecting. Each colour highlights an emergent design issue that could facilitate controller job, i.e. assess separations. They are:
Yellow line: projection of aircraft future position, usually made by the controller, e.g., this aircraft will be there in 2 minutes;
Human Work Interaction Design 177
Red dotted line: projection of the trajectory of the aircraft, with the actual flight parameters; Black line: recent aircraft trajectory; Sketched Black line: separation existing between the two aircraft, when Aircraft 1 will be at the intersection point. This would help the controller answer questions such as;
When will aircraft will be at the intersection point in a given time t, which other aircraft will be there or nearby (i.e. likely to be in conflict) at the same time? Will be they separated?
' " ' " '"^•'• ' ' ' ^ ' ^ ' ^ - ' •«w. ' -C
.** *.IKrm-!.in)S^
Fig. 11. A representation of the relevant information needed by the controller to evaluate the existence of separations (see text for explanation)
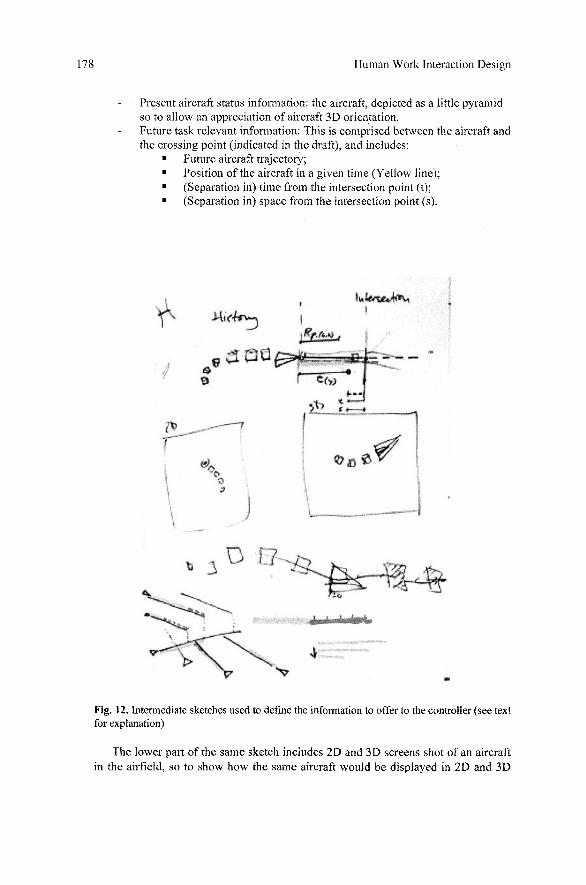
Sketch in Fig. 12 represents the relevant aircraft associated information over time. In particular the upper part contains the following:
Recent history aircraft information: the aircraft small cubes with a 3D volume are intended to provide an evolution of the short term past trajectories in the 3D space.
178 Human Work Interaction Design
Present aircraft status infonnation: the aircraft, depicted as a little pyramid so to allow an appreciation of aircraft 3D orientation. Future task relevant infonnation: This is comprised between the aircraft and the crossing point (indicated in the draft), and includes:
• Future aircraft trajectory; " Position of the aircraft in a given time (Yellow line); • (Separation in) time from the intersection point (t); • (Separation in) space from the intersection point (s).
' ^ Sufeftfe^At
•^A &«f^^ 1
„ . o n- '<">
Fig. 12. Intermediate sketches used to define the information to offer to the controller (see text for explanation)
The lower part of the same sketch includes 2D and 3D screens shot of an aircraft in the airfield, so to show how the same aircraft would be displayed in 2D and 3D
Human Work Interaction Design 179
view. Furthennore it includes on the bottom a view of multiple conflicts where six aircraft are converging towards the same trajectories. Finally it reports also a possible code to distinguish past from future infonnation (yellow/red bar).
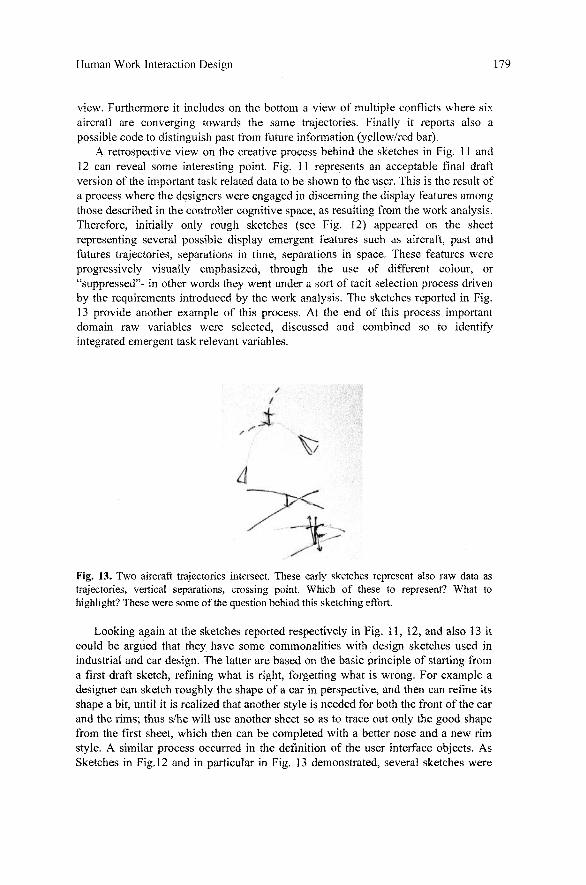
A retrospective view on the creative process behind the sketches in Fig. 11 and 12 can reveal some interesting point. Fig. 11 represents an acceptable final draft version of the important task related data to be shown to the user. This is the result of a process where the designers were engaged in discerning the display features among those described in the controller cognitive space, as resulting from the work analysis. Therefore, initially only rough sketches (see Fig. 12) appeared on the sheet representing several possible display emergent features such as aircraft, past and futures trajectories, separations in time, separations in space. These features were progressively visually emphasized, through the use of different colour, or "suppressed"- in other words they went under a sort of tacit selection process driven by the requirements introduced by the work analysis. The sketches reported in Fig. 13 provide another example of this process. At the end of this process important domain raw variables were selected, discussed and combined so to identify integrated emergent task relevant variables.
Fig. 13. Two aircraft trajectories intersect. These early sketches represent also raw data as trajectories, vertical separations, crossing point. Which of these to represent? What to highlight? These were some of the question behind this sketching effort.
Looking again at the sketches reported respectively in Fig. 11, 12, and also 13 it could be argued that they have some commonalities with design sketches used in industrial and car design. The latter are based on the basic principle of starting from a first draft sketch, refining what is right, forgetting what is wrong. For example a designer can sketch roughly the shape of a car in perspective, and then can refine its shape a bit, until it is realized that another style is needed for both the front of the car and the rims; thus s/he will use another sheet so as to trace out only the good shape from the first sheet, which then can be completed with a better nose and a new rim style. A similar process occurred in the definition of the user interface objects. As Sketches in Fig. 12 and in particular in Fig. 13 demonstrated, several sketches were
180 Human Work Interaction Design
need to model and refine the display elements, so to allow the emergent variables to emerge on the display surface.
In addition, this comparison with the design sketching technique used in Industrial Design highlights also a difference because the design of the display features must consider the temporal dimension. In fact the objects of the user interface have a behaviour which deteniiines how and when the relevant emergent display features will be displayed. The implication of that is that the sketches are dynamic representation. Furthermore, the temporal dimension assumes a strong relevance especially when it is necessary to define how the user will interact with the interface, as explained in the following section.
8.3 Sketching the Access to Relevant Data
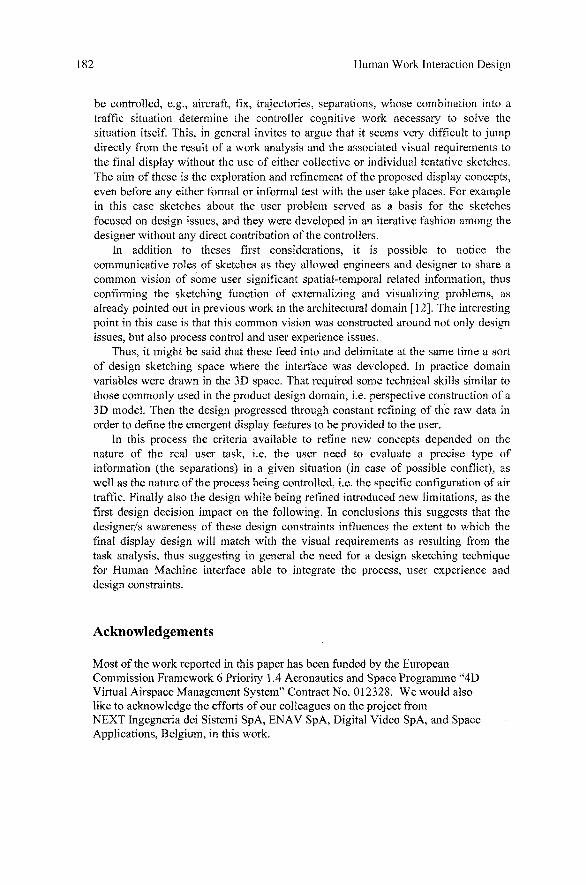
Once the consideration of the main visualization format of the Human Machine Interface was complete, the design team efforts focused on the data access. Sketch in Fig. 14 represents a few screen shots, to be read from left to right. They explain how the user can access the data referred to in Fig. 11. On the right, a 2D radar shows a situation similar to the one revealed by the scenario. An aircraft is supposed to flight along a given trajectory. Two groups of aircraft, represented by the black dots, are likely to cross the aircraft trajectory. The controller before authorizing the aircraft in question to follow this path needs to assess the presence of separations in the crossing point.
Thus, in order to evaluate the existence of separation in the crossing point, the controller can click where the aircraft which needs to be de-conflicted is likely to intersect the first group of aircraft in a few minutes (the click area is indicated in the drawing). At this point the data will turn into a 3D representation that shows the evolution of the trajectory in the 3D space and the existence of separation (see sketch in the middle, which represent a climbing trajectory). This representation can then be further enlarged (see sketch in the right, which represent an estimation of the separation, both vertical and horizontal) in order to access the data representation as defined in Fig. 11.

Human Work Interaction Design 181
fi 'ihe&L\
Fig. 14. Interaction sequence in order to access the task relevant data as defined in Fig. 11 (see text for explanation)
Discussion and Conclusions
This paper reported a case study concerning the development of a 4D user interface. It included the user work analysis, an account for the design problem, a framework for considering for supporting spatial-temporal reasoning, and some of the design sketches used in order to move from the finding of the analysis to the early representation forms of the interface. On these bases it is possible to draw a few considerations concerning the role design sketches during this process.
The design sketches presented in this work were focused not only on tentative representations of the display design, e.g. what (and where) information is to lay out, but also included representations of the spatial-temporal variables of the process to
182 Human Work Interaction Design
be controlled, e.g., aircraft, fix, trajectories, separations, whose combination into a traffic situation determine the controller cognitive work necessary to solve the situation itself. This, in general invites to argue that it seems very difficult to jump directly from the result of a work analysis and the associated visual requirements to the final display without the use of either collective or individual tentative sketches. The aim of these is the exploration and refinement of the proposed display concepts, even before any either fonnal or informal test with the user take places. For example in this case sketches about the user problem served as a basis for the sketches focused on design issues, and they were developed in an iterative fashion among the designer without any direct contribution of the controllers.
In addition to theses first considerations, it is possible to notice the communicative roles of sketches as they allowed engineers and designer to share a common vision of some user significant spatial-temporal related information, thus confirming the sketching function of externalizing and visualizing problems, as already pointed out in previous work in the architectural domain [12]. The interesting point in this case is that this common vision was constructed around not only design issues, but also process control and user experience issues.
Thus, it might be said that these feed into and delimitate at the same time a sort of design sketching space where the interface was developed. In practice domain variables were drawn in the 3D space. That required some technical skills similar to those commonly used in the product design domain, i.e. perspective construction of a 3D model. Then the design progressed through constant refining of the raw data in order to define the emergent display features to be provided to the user.
In this process the criteria available to refine new concepts depended on the nature of the real user task, i.e. the user need to evaluate a precise type of infonnation (the separations) in a given situation (in case of possible conflict), as well as the nature of the process being controlled, i.e. the specific configuration of air traffic. Finally also the design while being refined introduced new limitations, as the first design decision impact on the following. In conclusions this suggests that the designer/s awareness of these design constraints influences the extent to which the final display design will match with the visual requirements as resulting from the task analysis, thus suggesting in general the need for a design sketching technique for Human Machine interface able to integrate the process, user experience and design constraints.
Acknowledgements
Most of the work reported in this paper has been funded by the European Commission Framework 6 Priority 1.4 Aeronautics and Space Programme "4D Virtual Airspace Management System" Contract No. 012328. We would also like to acknowledge the efforts of our colleagues on the project from NEXT Ingegneria dei Sistemi SpA, ENAV SpA, Digital Video SpA, and Space Applications, Belgium, in this work.

Human Work Interaction Design 183
References
1. Endsley, M. R., Smolensky, M. W.: Situation Awareness in Air Traffic Control: The Picture. In M. W. Smolensky & E. S. Stein (Eds.): Human Factors in Air Traffic Control. Academic Press, San Diego (1998) 115-150
2. Cooper, A., Reimann, R.: About face 2.0: The essentials of interaction design. Wiley Publishing, Indianapolis (2003) 86
3. Lauesen, S.: User Interface Design. A Software Engineering Perspective. Addison Wesley, Harlow UK (2005) 167
4. Rettig, M. Prototyping for Tiny Fingers. Communication of the ACM, April, Vol.37, No. 4 (1994) 23
5. Ware, C : Infonnation Visualization. Perception for Design. Elsevier Science, San Francisco (2004)
6. Wickens, CD., Gordon, S.E. & Liu, Y. Human Factors Engineering. Longman, US (1998) 226-232
7. Buxton, W.: Sketching and Experience design. Interact 2005, Tenth IFIPT International Conference on Human-Computer Interaction, Rome 11-12 September (2005) 1.
8. Hildebrandt, M., Rantanen, E.M.: Time design. In Proceedings of the Human Factors and Ergonomics Society 48th Annual Meeting HFES 2004, New Orleans Human Factors and Ergonomics Society, Santa Monica CA (2004) 703-707
9. Smallman, H. S., & St John, M: Naive realism: Limits of realism as a display principle. In Proceedings of the Human Factors and Ergonomics Society 49th Annual Meeting, Santa Monica, CA (2005)
10. Bums, A., Baxter, G.: Time bands in system structure. In Besnard, C , Gacek, C. & C. Jones (eds.): Structure for Dependability: Computer-based Systems from an Interdisciplinary Perspective, Springer. London (2006) 74-90
11. Rasmussen, J. Information Processing and Human-Machine Interaction: An Approach to Cognitive Engineering, Vol. 12. Elsevier Science Publishing Co., Inc., New York (1986)
12. Hollnagel, E., Woods, D.D.: Joint Cognitive Systems: Foundations of Cognitive Systems Engineering. FL 33487-2742: CRC Press, Taylor and Francis Group, LLC Boca Raton (2005)
13. Do, E.Y., Gross, M.D., Neiman, B. and Zimring, C : Intentions in and relations among design drawings. Design studies Vol. 21 No. 5 (2000) 483-503