Design, preparation and characterization of polymer inclusion ...
307
DESIGN, PREPARATION AND CHARACTERIZATION OF POLYMER INCLUSION MEMBRANES AS AN EMERGING TECHNIQUE FOR PRECONCENTRATION AND SPECIATION MEASUREMENTS Ruben Vera Chamorro Per citar o enllaçar aquest document: Para citar o enlazar este documento: Use this url to cite or link to this publication: http://hdl.handle.net/10803/666994 ADVERTIMENT. L'accés als continguts d'aquesta tesi doctoral i la seva utilització ha de respectar els drets de la persona autora. Pot ser utilitzada per a consulta o estudi personal, així com en activitats o materials d'investigació i docència en els termes establerts a l'art. 32 del Text Refós de la Llei de Propietat Intel·lectual (RDL 1/1996). Per altres utilitzacions es requereix l'autorització prèvia i expressa de la persona autora. En qualsevol cas, en la utilització dels seus continguts caldrà indicar de forma clara el nom i cognoms de la persona autora i el títol de la tesi doctoral. No s'autoritza la seva reproducció o altres formes d'explotació efectuades amb finalitats de lucre ni la seva comunicació pública des d'un lloc aliè al servei TDX. Tampoc s'autoritza la presentació del seu contingut en una finestra o marc aliè a TDX (framing). Aquesta reserva de drets afecta tant als continguts de la tesi com als seus resums i índexs. ADVERTENCIA. El acceso a los contenidos de esta tesis doctoral y su utilización debe respetar los derechos de la persona autora. Puede ser utilizada para consulta o estudio personal, así como en actividades o materiales de investigación y docencia en los términos establecidos en el art. 32 del Texto Refundido de la Ley de Propiedad Intelectual (RDL 1/1996). Para otros usos se requiere la autorización previa y expresa de la persona autora. En cualquier caso, en la utilización de sus contenidos se deberá indicar de forma clara el nombre y apellidos de la persona autora y el título de la tesis doctoral. No se autoriza su reproducción u otras formas de explotación efectuadas con fines lucrativos ni su comunicación pública desde un sitio ajeno al servicio TDR. Tampoco se autoriza la presentación de su contenido en una ventana o marco ajeno a TDR (framing). Esta reserva de derechos afecta tanto al contenido de la tesis como a sus resúmenes e índices. WARNING. Access to the contents of this doctoral thesis and its use must respect the rights of the author. It can be used for reference or private study, as well as research and learning activities or materials in the terms established by the 32nd article of the Spanish Consolidated Copyright Act (RDL 1/1996). Express and previous authorization of the author is required for any other uses. In any case, when using its content, full name of the author and title of the thesis must be clearly indicated. Reproduction or other forms of for profit use or public communication from outside TDX service is not allowed. Presentation of its content in a window or frame external to TDX (framing) is not authorized either. These rights affect both the content of the thesis and its abstracts and indexes.
-
Upload
khangminh22 -
Category
Documents
-
view
5 -
download
0
Transcript of Design, preparation and characterization of polymer inclusion ...
DESIGN, PREPARATION AND CHARACTERIZATION OF POLYMER INCLUSION
MEMBRANES AS AN EMERGING TECHNIQUE FOR PRECONCENTRATION AND SPECIATION
MEASUREMENTS
Ruben Vera Chamorro
Per citar o enllaçar aquest document: Para citar o enlazar este documento: Use this url to cite or link to this publication: http://hdl.handle.net/10803/666994
ADVERTIMENT. L'accés als continguts d'aquesta tesi doctoral i la seva utilització ha de respectar els drets de la persona autora. Pot ser utilitzada per a consulta o estudi personal, així com en activitats o materials d'investigació i docència en els termes establerts a l'art. 32 del Text Refós de la Llei de Propietat Intel·lectual (RDL 1/1996). Per altres utilitzacions es requereix l'autorització prèvia i expressa de la persona autora. En qualsevol cas, en la utilització dels seus continguts caldrà indicar de forma clara el nom i cognoms de la persona autora i el títol de la tesi doctoral. No s'autoritza la seva reproducció o altres formes d'explotació efectuades amb finalitats de lucre ni la seva comunicació pública des d'un lloc aliè al servei TDX. Tampoc s'autoritza la presentació del seu contingut en una finestra o marc aliè a TDX (framing). Aquesta reserva de drets afecta tant als continguts de la tesi com als seus resums i índexs.
ADVERTENCIA. El acceso a los contenidos de esta tesis doctoral y su utilización debe respetar los derechos de la persona autora. Puede ser utilizada para consulta o estudio personal, así como en actividades o materiales de investigación y docencia en los términos establecidos en el art. 32 del Texto Refundido de la Ley de Propiedad Intelectual (RDL 1/1996). Para otros usos se requiere la autorización previa y expresa de la persona autora. En cualquier caso, en la utilización de sus contenidos se deberá indicar de forma clara el nombre y apellidos de la persona autora y el título de la tesis doctoral. No se autoriza su reproducción u otras formas de explotación efectuadas con fines lucrativos ni su comunicación pública desde un sitio ajeno al servicio TDR. Tampoco se autoriza la presentación de su contenido en una ventana o marco ajeno a TDR (framing). Esta reserva de derechos afecta tanto al contenido de la tesis como a sus resúmenes e índices.
WARNING. Access to the contents of this doctoral thesis and its use must respect the rights of the author. It can be used for reference or private study, as well as research and learning activities or materials in the terms established by the 32nd article of the Spanish Consolidated Copyright Act (RDL 1/1996). Express and previous authorization of the author is required for any other uses. In any case, when using its content, full name of the author and title of the thesis must be clearly indicated. Reproduction or other forms of for profit use or public communication from outside TDX service is not allowed. Presentation of its content in a window or frame external to TDX (framing) is not authorized either. These rights affect both the content of the thesis and its abstracts and indexes.
Doctoral Thesis
Design, preparation and characterization of polymer
inclusion membranes as an emerging technique for
preconcentration and speciation measurements
Ruben Vera Chamorro
2019
Doctoral programme in water science and technology
Supervised by:
Dr. Clàudia Fontàs Dr. Enriqueta Anticó
Thesis submitted in fulfilment of the requirements for the degree of Doctor from the University of Girona.

Dr. Clàudia Fontàs and Dr. Enriqueta Anticó, of the University of Girona,
WE DECLARE:
That the thesis entitled “Design, preparation and characterization of polymer inclusion
membranes as an emerging technique for preconcentration and speciation
measurements”, presented by Ruben Vera Chamorro to obtain a doctoral degree, has been
completed under our supervision and meets the requirements to qualify for an
International Doctorate.
For all intents and purposes, we hereby sign this document.
Dr. Clàudia Fontàs Dr. Enriqueta Anticó
Girona, 4 February of 2019


This thesis was financially supported by the Spanish Ministry of Economy and Competitiveness
(MINECO) through the national research projects CTM2013-48967-C2-2-P, CTM2016-78798-
C2-2-P (AEI/FEDER/UE), through a predoctoral research fellowship (BES-2014-068316), and
through a grant for short-term stays (EEBB-I-17-12404).


“Come as you are, as you were
As I want you to be
As a friend, as a friend
As an old enemy
Take your time, hurry up
Choice is yours, don't be late
Take a rest as a friend
As an old memoria”
Nirvana (Nevermind, 1991)

Agraïments / Acknowledgements
Ara que malauradament s’acaba aquesta etapa, m’agradaria escriure unes paraules
a totes aquelles persones amb les quals he tingut la sort de compartir bons moments i que
han fet que aquest llarg viatge que m’ha portat a escriure una tesi hagi sigut completament
especial.
En primer lloc m’agradaria agrair a les dues persones que principalment han fet
possible que estigui ara escrivint tot això, a la Clàudia i l’Enriqueta. Gràcies Clàudia per
haver-me donat l’oportunitat al 2012 (com passa el temps...), no només d’acceptar-me com
el teu estudiant per a fer el treball experimental de final de carrera, amb el qual vaig
començar a endinsar-me en el món de la investigació, sinó també per comptar amb mi pel
projecte amb l’empresa Dena Desarrollos S.A i posteriorment oferir-me realitzar aquesta
tesi amb la beca del ministeri. T’estaré sempre agraït no només per totes les oportunitats
que m’has donat en aquest temps, sinó també per haver-me permès assistir a diversos
congressos nacionals i internacionals i poder haver viscut durant prop de mig any a l’altra
punta de món, on vaig aprendre moltíssimes coses. Moltes gràcies Enriqueta per totes les
converses i moments viscuts al llarg d’aquesta tesi. Ha sigut una gran sort tenir-te també de
directora d’aquesta tesi. A totes dues m’agradaria dir-vos que ha sigut realment gratificant
poder compartir tot aquest temps junts, contagiant-me de la vostra passió pel que feu cada
dia i haver après tan com he pogut de tot el que m’heu ensenyat.
També m’agradaria agrair a la resta de professors que formen l’àrea de química
analítica i ambiental de la Universitat de Girona com son l’Eva Marguí, per tota l’ajuda
rebuda durant el meu treball de final de carrera, a la Mònica per tots els dubtes i problemes
resolts amb el vell i estimat ICP-OES, a la Victòria, la Nela i en Juanma per tota l’amabilitat
rebuda durant tot aquests anys. No puc oblidar tampoc la gran amabilitat d'en Josep
Galceran i tot el grup de recerca de Lleida així com de l'Olga Serra, amb els quals he tingut
la sort de treballar en l'elaboració d'algunes de les publicacions d'aquesta tesi. No puedo
olvidarme tampoco de Juana Benavente, a la que guardo un especial cariño por su
amabilidad, cercanía y humildad lo cual ha hecho que trabajar con ella haya sido todo un
placer. Gracias por tratarnos tan bien durante nuestra breve estancia en Málaga y ofrecerte
para resolver cualquier duda.
També vull agrair als antics membres del grup de química analítica i ambiental amb
els quals vaig coincidir a la meva primera etapa del doctorat, a la Dolors Companys, Mònica
Alonso, Anna Godayol i Ester Sagristà. Gràcies als grans consells de la Carme Valls i la
Raquel Güell, els quals em van ajudar a decidir-me i encarar el doctorat de la millor
manera. I que puc dir de l’Aida Garcia, des del primer moment que vam coincidir, sempre
et vas disposar a ajudar-me amb qualsevol cosa, s’aprèn molt d’algú com tu. Gràcies per
haver inaugurat la ruta Girona-Melbourne i per tots els consells i experiències compartides.
Tampoc puc oblidar-me de membres d’altres àrees, amb els que he coincidit en sopars
quan encara eren doctorands, com en Pep Antón, la Cristina Rosés o la Iteng Choi. A tots
els anteriorment anomenats, us desitjo el millor en la vostra vida personal i professional.
I can’t forget to mention two amazing guys that I also met right at the beginning of
my thesis. It was a big pleasure to share things with you, Subha and Santanu. Subha, I still
remember when you compared me with a bottle of wine in the acknowledgements of your
thesis, I am extremely happy that everything is going awesome in your life. It is impossible
to forget either all the discussions and tips provided by Santanu and I really appreciate all
the knowledge you shared with me about India. I keep very nice memories from both of
you and, although thousands of kilometres separate us, we are still in touch and it is always
so nice to hearing from you. I wish you all the best for your future endeavours not only
professionally but also in life!
Moreover, I also met a crazy Turkish guy that was an incredible discover. The real
perfect man, as you used to say. We lived very funny moments inside the lab but also
outside the university. Thanks for all the Turkish words you tried to teach me. I wish we
could catch up soon.
Tampoc em puc oblidar de totes les persones que en un moment o altra han
aparegut pels laboratoris d’analítica, ja sigui degut al treball final de grau, a pràctiques en
empresa o a breus estades de doctorat. Tirant la vista enrere, m’adono que he viscut
moments realment únics. Moltes gràcies a tots aquells amb els quals he compartit bons
moments: Anna Ballesteros, Gerard Serrat, Andreu Llort, Vanessa Vivet, Eline Michielsen,
Albert Solanas, Cristina Turón (x2), Michiel Vereeke, Adrià Casanovas, Ester López,
Cristina Juanola, Clàudia Martínez (Clàudia Jr.), Eva Sigüenza, Eva Mateo, Silvia Montero,
David Palma, Sindy Carolina, Ibrahim, Karima, Mouhamed Dekkouche, Rogerta Dalipi,
Albert Salado, Miquel “de Ses Illes”, Sergi Cot, Roger, Soetkin Leys, Donatella Chillè “la
calapacci”. D'altra banda, la calma i la pau del passadís es van veure afectats per 3 persones
que van coincidir en el temps i en l’espai: l’Albert Rodríguez, en Gerard Samsó i la Cristina
García. Encara avui, queden moltes paraules i expressions d’aquells dies: el velero, aúpa
ahí, etc. Eskerrik asko a los tres!
També, cal destacar i recordar la gran feina de la “comissió de festes del
departament de química” formada per l’Àngel Oliveras, la Cristina Camó, l’Ester Manrique
i en Martí Wang. Ells van ser els responsables de molts dels dinars de nadal i primavera,
organitzats al departament. Us desitjo el millor!
Un apartat d’aquests agraïments ha d’anar dirigit obligatòriament a la Laura Torrent
i a la Gemma Elias. Laura, vam començar alhora aquest llarg camí que suposa fer un
doctorat, hem patit, hem rigut, hem après noves paraules i hem crescut junts durant aquests
anys. Gràcies per tots els moments viscuts. A tu Gemma, gràcies per totes les converses
que hem tingut durant tots aquests anys i per totes les experiències que hem compartit
junts. A totes dues us desitjo el millor a la vostra vida personal (que al final és la mes
important) així com a la professional, us ho mereixeu!
De la mateixa manera voldria agrair a la Gemma Mostazo també coneguda per little
Gemma, per tots els petits moments i totes les converses i riures que hem viscut, ha sigut
genial compartir despatx tot aquests temps amb vosaltres!
I would also like to thank all the members of Kolev’s research group from the
University of Melbourne where I spent almost five months conducting a part of this thesis.
I really appreciate all the kindness, sincere support and mentorship received during my
stay. It was a real rewarding experience, which it has been extremely useful not only for the
development of my thesis but also for my future life endeavours. Thanks to all the students
of the research group: Lenka Sraj, Mason Bonacci, Justin Cheng, Charles Croft, Bosirul
Hoque, Edward Nagul, Neda Nematollahi, Fidelis Nitti, Jonathan Peters, Syane Agacy and
Madeline King. Of course I can’t forget to thank Patrick Mornane for helping me out
assembling the Flow analysis system, Yanlin Zhang who shared his wisdom and answered
me hundreds of questions as well as he took me to collect river water samples and Inês G.
S. Almeida, an incredible researcher, who is always ready to solve your upcoming
problems. Thanks Inês for all the support received throughout the project, it was really
special to catch up last year in Girona! I would also like to acknowledge the honorary staff,
Robert W. Cattrall and Ian D. Mckelvie. Robert turns regular Thursdays into a special day
because of the chocolate’s tradition while taking a cup of coffee. An adorable tradition that
I was lucky to join almost every week during my stay. Thanks Ian for all the useful tips and
to strongly encourage me to visit different places while I was in Australia. Lastly, but no less
important I would like to thank Spas for all the things you have done for me. I couldn’t
have got a better supervisor for my international stay. I tried to learn as much as I could
from one of the best researchers I have ever met. Your dedication and passion for your
work are contagious and creates an incredible atmosphere in the whole research group. If
I had to repeat an international stay I wouldn’t have a doubt to join again your group. I will
always remember my ozzy experience in such a lovely research group.
I would also like to highlight the good memories that I shared with Lucie Zelena,
Victoria, Shaif Salik, Eri Makri, Prakhar Bhargava, Amer, Avi Gandhi, Muzay, Mayu
Sasakura, Soumya Mukherjee, Shubham Rawal, Melissa Kennedy, Claudio Pacciarelli,
Joshua Rhee and many others!! All the above-mentioned made my Melbourne experience
amazing, thank you all!
A mis compañeros de la capital que conocí en Melbourne: Esther, Cecilia, José y
Germán os deseo lo mejor en vuestros proyectos personales! No me cabe duda que en
cuanto al tema profesional no hace falta que os desee suerte. Espero que nos podamos ver
pronto todos en Madrid o Girona. ¡De momento ya he visto a Germán y Esther!
A vosaltres, Bernat Riera, Albert Manso i Ernest Iñigo, us podria dedicar un parell
de fulls, però ho resumiré de forma breu, donant-vos les gràcies per ser-hi sempre. Espero
i desitjo que l’amistat continuï per molts més anys. Gràcies també a la Laura “Gonfaus” i a
la Julia per totes les converses i moments viscuts al llarg de tots aquests anys d’amistat.
Durant aquest doctorat també he après a donar importància als petits moments, a
tot el que ens envolta el dia a dia i als detalls que sovint no acabem de valorar
completament. Haver-te conegut Jordi Gascons ha sigut una de les millors coses que m’han
passat mai. És molt gran tot el que transmets a la resta que t’envolta. Ha sigut un gran regal
vital poder-te conèixer i compartir tants moments únics durant aquests anys. T'asseguro
que sempre podràs comptar amb mi. També agrair a la Dolors, l’Amadeu i l’Enric per
sempre haver tingut un tracte tan especial i afectuós amb mi. No puc deixar enrere a la
Sandra, amb la qual he compartit infinitat d’instants durant tot aquest temps i que han fet
que aquest doctorat fos molt més fàcil de portar endavant. Res de tot això hagués sigut
possible sense la teva ajuda.
Ja per concloure, agrair a la meva família: pares, germà i avis, per tot el suport rebut
durant tots aquests anys de formació, gràcies per tota l’ajuda i suport que m’heu anat donant
al llarg d’aquests 28 anys. A vosaltres, Elsa i Ian, tan sols us desitjo que sigui quin sigui el

camí que escolliu quan sigueu grans, que hi poseu totes les ganes i empenta en fer allò que
mes us agradi i motivi.
Moltes gràcies a tots, els que he anomenat i als que malauradament hagi pogut
oblidar. I a tu, siguis qui siguis, gràcies per mirar-te aquesta tesi, encara que només siguin
els agraïments, perquè representa una etapa de mes de quatre anys de la meva vida.

i
PUBLICATIONS LIST
This thesis meets all the requirements to be presented as a compendium of publications
and has resulted in the publication of six scientific articles and one submitted.
R. Vera, C. Fontàs, E. Anticó, Titanium dioxide solid phase for inorganic species
adsorption and determination: the case of arsenic, Environ. Sci. Pollut. Res. 24 (2017)
10939-10948.
DOI: https://doi.org/10.1007/s11356-016-7667-0
Impact factor: 2.800
Quartile: Q2
R. Vera, L. Gelde, E. Anticó, M.V. Martínez de Yuso, J. Benavente, C. Fontàs, Tuning
physicochemical, electrochemical and transport characteristics of polymer inclusion
membrane by varying the counter-anion of the ionic liquid Aliquat 336, J. Memb. Sci.
529 (2017) 87-94.
DOI: https://doi.org/10.1016/j.memsci.2017.01.055
Impact factor: 6.578
Quartile: Q1
R. Vera, C. Fontàs, J. Galceran, O. Serra, E. Anticó, Polymer inclusion membrane to
access Zn speciation: Comparison with root uptake, Sci. Total Environ. 622-623 (2018)
316-324.
DOI: https://doi.org/10.1016/j.scitotenv.2017.11.316
Impact factor: 4.610
Quartile: Q1
R. Vera, S. Insa, C. Fontàs, E. Anticó, A new extraction phase based on a polymer
inclusion membrane for the detection of chlorpyrifos, diazinon and cyprodinil in natural
water samples, Talanta 185 (2018) 291-298.
DOI: https://doi.org/10.1016/j.talanta.2018.03.056
Impact factor: 4.244
Quartile: Q1
ii
R. Vera, E. Anticó, C. Fontàs, The Use of a Polymer Inclusion Membrane for Arsenate
Determination in Groundwater, Water 10 (2018) 1093.
DOI: https://doi.org/10.3390/w10081093
Impact factor: 2.069
Quartile: Q2
R. Vera, Y. Zhang, C. Fontàs, M.I.G.S Almeida, E. Anticó, R.W. Cattrall, S.D. Kolev,
Automatic determination of arsenate in drinking water by flow analysis with dual
membrane-based separation, Food Chem. 283 (2019) 232-238.
DOI: https://doi.org/10.1016/j.foodchem.2018.12.122
Impact factor: 4.946
Quartile: Q1
R. Vera, E. Anticó, N. Aranburu, C. Fontàs, First report on a solvent-free preparation of
polymer inclusion membranes with an ionic liquid, React. Funct. Polym. (submitted).


v
ABBREVIATIONS LIST
2-FP2-NPE 2-fluorophenyl 2-nitrophenyl ether
A Absorbance
ACA Catalan Water Agency
ACN Acetonitrile
AFM Atomic force microscopy
AFS Atomic fluorescence spectroscopy
AGNES Absence of gradient Nernstian equilibrium stripping
AHS Agricultural Health Study
Aliquat 336 / AlqCl Methyltrioctylammonium chloride
AMPA Aminomethylphosphonic acid
AOAC Association of Official Analytical Chemists
AR Absolute recovery
ASV Anodic stripping voltammetry
ATR Attenued total reflectance
BBPA Bis(1-butylpentyl) adipate
BE Binding energy
BLM Biotic Ligand Model
BLM Bulk liquid membrane
Bmim 1-butyl-3-methyl imidazolium
BuDC18C6 Di-tert-butylcyclohexano-18-crown-6
C Concentration in the effluent measured
C0 Initial concentration
CA Cellulose acetate
CAB Cellulose acetate butyrate
CAH Cellulose acetate hydrogen phthalate
CAP Cellulose acetate propionate
CCA Chromated-copper-arsenate
CLE-AdCSV Competitive ligand equilibration-adsorptive cathodic stripping voltammetry

vi
Cmax Maximum adsorption capacity
CMPO Octyl(phenyl)-N,N-diisobutyl carbamoylmethyl phosphine oxide
CP Chlorpyrifos
CPE Cloud-point extraction
CTA Cellulose triacetate
CTAB Cetyltrimethylammonium bromide
CTB Cellulose tributyrate
cv Cultivated variety
Cyanex 272 Bis(2,4,4-trimethylpentyl)phosphinic acid
Cyanex 301 Bis(2,4,4-trimethylpentyl)dithiophosphinic acid
Cyanex 302 Bis(2,4,4-trimethylpentyl)monothiophosphinic acid
Cyanex 471X Tri-isobutylphosphine sulfide
CYP Cyprodinil
Cyphos 101 Trihexyl(tetradecyl)phosphonium chloride
Cyphos 104 Trihexyl(tetradecyl)phosphonium-(2,4,4-trimethylpentyl)phosphinate
D2EHDTPA Di(2-ethylhexyl) dithiophosphoric acid
D2EHPA Di(2-ethylhexyl) phosphoric acid
DBBP Dibutyl butyl phosphonate
DBP Dibutyphtalate
DBS Dibutylsebacate
DDT Dichlorodiphenyltrichloroethane
DEHA bis(2-ethylhexyl) adipate
DGT Diffusive gradient in thin-film gels
DMA Dimethylarsinic acid
DMT Donnan membrane techniques
DNNDS Dinonylnaphthalene disulfonic acid
DNNS Dinonylnaphthalene sulfonic acid
DOP Dioctyl phthalate
DPC Diphenylcarbazide
DSC Differential scanning calorimetry
vii
DSMA Disodium methanearsonate
DTPA Diethylenetriaminepentaacetic acid
DZ Diazinon
e.g. For example
EB Ethyl benzoate
ECD Electron capture detector
EDTA Ethylenediaminetetraacetic acid
EDXRF Energy dispersion X-ray fluorescence
EE Extraction efficiency
EI Electron impact
ELM Emulsion liquid membrane
EPA Environmental Protection Agency
Eq. Equation
et.al And others
EU European Union
EXAFS X-ray absoprtion fine structure
FA Flow analysis
FAO Food and Agriculture Organization
FDA Fluorescein di-acetate
FIA Flow Injection analysis
FIAM Free Ion Activity Model
FTIR Fourier transform infrared spectroscopy
GC Gas chromatography
GC-ECD Gas chromatography coupled to electron capture detector
GC-FPD Gas chromatography coupled to flame photometric detector
GC-ITMS Gas chromatography coupled to ion trap mass spectrometry
GC-NPD Gas chromatography coupled to nitrogen phosphorous detector
GC-QqQ Gas chromatography coupled to triple quadrupole mass spectrometry
GDC Gas-diffusion cell
GFAAS Graphite furnace atomic absorption spectrometry

viii
GLYP Glyphosphate
GW Groundwater
h Hours
ha Hectare
HA Humic acid
HF Holow fibre
HG-AAS Hydride generation atomic absorption spectrometry
HG-AFS Hydride generation atomic fluorescence spectrometry
HG-ICP-OES Hydrde generation inductively coupled plasma optical emission
spectrometry
HPLC High performance liquid chromatography
i.d. Internal diameter
i.e. Id est (that is)
IARC International Agency for Research on Cancer
IC Ion chromatography
ICP-AES Inductively coupled plasma atomic emission spectrometry
ICP-MS Inductively coupled plasma mass spectrometry
IDL Instrumental detection limit
IL Ionic liquid
IR Infrared
IS Impedance spectroscopy
ISE Ion-selective electrode
IUPAC International Union of Pure and Applied Chemistry
IV Injection valve
JPIM PIM flux
Jroot Root flux
Kelex 100 7-(4-Ethyl-1-methyloctyl)-8-hydroxyquinoline
Kow Octanol-water partitioning coefficient
LC Liquid chromatography
LED light emitting diode
LIX® 84-1 2-Hydroxy-5-nonylacetophenone oxime
ix
LLE Liquid-liquid extraction
LM Liquid membrane
LOD Limit of detection
LOQ Limit of quantification
LPME Liquid-phase microextraction
m/z Mass to charge ratio
MDL Method detection limit
ME Matrix effect
MES acid 2-(N-morpholino) ethanesulfonic
MMA Monomethylarsonic acid
MRM Multiresidue methods
MS Mass spectrometry
MSMA Monosodium methanearsonate
MW Molecular weight
MWc Critical entanglement molecular weight
n number of replicates
NAA Neutron activation analysis
NPD Nitrogen phosphorous detector
NPOE 2-nitrophenyloctyl ether
NPOT 2-Nitrophenyl octanoate
NPPE 2-nitrophenylpentyl ether
OCs Organochlorines
OPPs Organophosphate pesticide
OPs Organophosphates
PCL Poli !-caprolactone
PDMS Polydimethylsiloxane
PEEK Polyetheretherketone
PEG-DA Poly(ethylene glycol) diacrylate
PEG-DMA Poly(ethylene glycol) dimethacrylate
pHpzc pH at the point of zero charge
x
PI Propidium iodide
PIM Polymer Inclusion Membrane
PLM Permeation liquid membrane
POCIS Polar organic chemical integrative sampler
PTFE Poly(tetrafluoroethylene)
PVC Poly(vinyl chloride)
PVDF-HFP Poly(vinylidine fluoride-cohexafluoropropylene)
PVDF-TFE Poly(vinylidene fluoride-co-tetrafluoroethylene)
PVP Poly(vinylpyrrolidone)
R Recovery
R2 Coefficient of determination
RC Reaction coil
RIMM Reflection infrared mapping microscopy
RSD Relative standard deviation
S/N Signal noise ratio
SBSE Stir-bar sorptive extraction
SCP Stripping chronopotentiometry
SD Standard deviation
SDDC Silver diethyldithiocarbamate
SEM Scanning electron microscope
SEM-EDS Scanning electron microscope-energy dispersive spectroscopy
SFA Segmented flow analysis
SGW Simulated groundwater
SIA Sequential injection analysis
SLM Supported liquid membrane
SMX Sulfamethoxazole
SPE Solid-phase extraction
SPMD Semipermeable membrane device
SPME Solid-phase microextraction
SRM Selected reaction monitoring mode
xi
TBA Tri-n-butylamine
TBEP Tris(2- butoxyethyl) phosphate
TBP Tri-n-butyl phosphate
TDA Tri-n-decylamine
TDPNO 4-(1’-n-tridecyl)pyridine N-oxide
TE Transport efficiency
TEHP Tris-(2-ethylhexyl) phosphate
Tg Transition temperature
TGA Thermogravimetric analysis
THA Tri-n-hexylamine
THF Tetrahydrofuran
TIMM Transmission infrared mapping microscopy
Tm Melting temperature
TMS Teorell-Meyer-Sievers
TOA Tri-n-octyl amine
TOC Total organic carbon
TODGA N,N,N’,N’-Tetraoctyl-3-oxapentanediamide
TOMA Trioctylmethylammonium
TOPO Tri-n-octyl phosphine oxide
TPU Thermoplastic polyurethane
TWA Time weight average
UAE Ultrasonic assisted extraction
UV-Vis Ultraviolet-visible
UN United Nations
Unicef United Nations Children’s Fund
USA United States of America
USD United State Dollar
vs. Versus
WFD Water Framework Directive
WHO World Health Organization
xii
w/w Weight by weight
XANES X-ray absorption near-edge structure
XIC Extracted-ion chromatogram
XPS X-ray photoelectron spectroscopy
XRD X-ray diffraction
XRF X-ray fluorescence
Zincon 2-carboxy-2 '-hydroxy-5 '-sulfoformazylbenzene
LLME Liquid-liquid microextraction
DLME Dispersive liquid-liquid microextraction
SDME Single drop microextraction
xiii
FIGURES LIST
Figure 1.1 Speciation of arsenite (As(III)) and arsenate (As(V)) as a function of pH (arsenic concentration 1mM). ---------------------------------------------------------------------------------------- 14 Figure 1.2 Distribution of arsenic in the Spanish topsoil [28]. --------------------------------------- 15 Figure 1.3 World population exposed to elevated levels of arsenic in groundwater [35]. ------- 16 Figure 1.4 Speciation of chromate (Cr(VI)) as a function of pH (chromium concentration 1mM). ------------------------------------------------------------------------------------------------------------------ 19 Figure 1.5 Effects of either a high (left side) or low zinc intake (right side) on human health [78]. ------------------------------------------------------------------------------------------------------------------ 23 Figure 1.6 Evolution of the number of PIM papers (including reviews) from 2000 until 2018 (according to ISI web of Knowledge). ------------------------------------------------------------------- 37 Figure 1.7 Mechanisms for maintaining electroneutrality during the transport of a cation (M+) and the counter-transport of H+ through a LM. C stands for the carrier. --------------------------- 38 Figure 1.8 PIM placed on a wooden plank. ------------------------------------------------------------- 49 Figure 1.9 SEM images of PIMs consisting of 50% CTA–50% Aliquat 336: surface (a), cross-section (b). ---------------------------------------------------------------------------------------------------- 50 Figure 1.10 Experimental set-up of IS on membrane characterization using two probes (a) or four probes (b) [235]. --------------------------------------------------------------------------------------------- 52 Figure 1.11 Two-compartment transport cell placed on a magnetic multistirrer. ----------------- 54 Figure 1.12 PIM-based device used for preconcentration and passive sampling of different target compounds. --------------------------------------------------------------------------------------------------- 57 Figure 3.1 The effect of NaCl concentration used as a stripping solution on As(V) transport in both ultrapure and groundwater GW1 (spiked at 100 µg L−1 As(V)). Polymer inclusion membrane (PIM): 69% poly(vinyl chloride) (PVC) – 31% Aliquat 336 (w/w); time: 24 h; feed volume: 100 mL; stripping volume: 5 mL. (n=2). ---------------------------------------------------------------------- 93 Figure 3.2 As(V) transport efficiency using a PIM-device with different volumes as feed and stripping solutions in both ultrapure and GW1 (spiked at 100 µg L−1 As(V)), after 24 h (a) and 5 h (b) contact time (n=2). PIM composition was 69% PVC – 31% Aliquat 336 (w/w) and 2 M NaCl was used as the stripping phase. -------------------------------------------------------------------- 94 Figure 3.3 Calibration curve obtained with the PIM-based method. PIM, 52% CTA – 48% Aliquat 336 (w/w) (n=3). Feed solution, 50 mL of different As(V) concentrations in simulated groundwater (SGW); stripping solution 2.5 mL 2 M NaCl. ------------------------------------------ 98 Figure 3.4 Schematic representation of the FA manifold. P1-P3: peristaltic pumps; R1: gas-diffusion acceptor stream (0.2 mM M KMnO4, 0.05 M NaOH); R2: NaBH4 stream (0.5% (w/v) NaBH4, 0.05 mol L-1 NaOH); R3: reductant stream (4 M HCl, 1% (w/v) KI, 0.5% (w/v) ascorbic acid); R4: PIM acceptor stream (0.1 M NaCl); R5: PIM donor stream; RC: reaction coil; IV: injection valve; GDC: gas-diffusion cell; PIM: polymer inclusion membrane. ------------------ 107

xiv
Figure 3.5 Schematic representation of the GDC used in the on-line separation of arsine. (a) Cross-section (donor and acceptor channels depths - 6 and 0.5 mm, respectively) and (b) top view of one of the halves of the GDC. ------------------------------------------------------------------------ 108 Figure 3.6 Influence of the stop-flow flow time and the flow rate of Stream R5 on the analytical signal for a 500 µg L-1 As(V) standard. ---------------------------------------------------------------- 115 Figure 3.7 Effect of the concentration of phosphate (△), nitrate (l), sulphate (¯), carbonate (�), and chloride (¢) on the normalised analytical signal for a 0.67 µmol L-1 (50 µg L-1) As(V) standard. ----------------------------------------------------------------------------------------------------- 116 Figure 3.8 Breakthrough curves obtained for Adsorbsia As600 when a solution containing 20 mg L−1 of arsenic was pumped through the column. (a) As(V), 0.2 g of adsorbent; (b) As(III), 0.2 g of adsorbent; (c) As(V), 0.8 g of adsorbent. Flow rate 1 mL min−1. C is the concentration of arsenic in the effluent measured with ICP-OES; Co is the concentration of the feed solution (20 mg L−1). ---------------------------------------------------------------------------------------------------------------- 133 Figure 3.9 Elution isoplane for As(V) loaded Adsorbsia As600 sorbent (0.2 g). NaOH solution (0.1 M) was used for the elution and the flow rate was 1mL min−1. C is the concentration of arsenic in the effluent measured with ICP-OES; Co is the concentration of the feed solution used for loading the sorbent (20 mg L−1). -------------------------------------------------------------------- 134 Figure 3.10 Study of the interference from major anions in As(V) adsorption. Sixty milligrams of solid phase packed in a minicolumn. The volume of the solution percolated through the column was 50 mL and the flow rate was 1 mL min−1. The concentration values tested were 50mg L−1 nitrate, 100 mg L−1 sulphate, 100 mg L−1 chloride and 500 mg L−1 hydrogen carbonate. As(V) concentration was 200 µgL−1 at pH 7.3. ---------------------------------------------------------------- 137 Figure 3.11 Core level spectra for 30% AlqCl (solid line), 30% AlqNO3 (dashed line) and 30% AlqSCN (dashed-dot line) PIMs. (a) C 1s and (b) N 1s.--------------------------------------------- 153 Figure 3.12 IR spectra of (a) 60% AlqCl, (b) 60% AlqNO3, and (c) 60% AlqSCN PIMs. ---- 155 Figure 3.13 TGA curves obtained with the different membranes prepared: (a) 60% AlqCl, (b) 60% AlqNO3 and (c) 60% AlqSCN. -------------------------------------------------------------------- 156 Figure 3.14 Variation of the contact angle of PIM surface in relation to the counter-anion and IL content (n=6). ------------------------------------------------------------------------------------------- 157 Figure 3.15 Nyquits (a and b) and Bode plots (c and d) for PIMs: 30% AlqCl (■), 30% AlqNO3 (▲), 30% AlqSCN (♦), 60% AlqCl (□), 60% AlqNO3 (Δ), 60% AlqSCN (◊). Pure AlqCl IL (x) Bode plot in (d). -------------------------------------------------------------------------------------------- 159 Figure 3.16 pH variation with time depending on the IL nature and content. (a) 30% IL; (b) 60% IL. (n=2). ---------------------------------------------------------------------------------------------------- 161 Figure 3.17 Membrane potential as a function of the NaCl variable concentration, Cv, for the studied membranes (Cf=0.01 M). (a) 30% AlqCl (■), 30% AlqNO3 (▲) and 30% AlqSCN (♦); (b) 60% AlqCl (□), 60% AlqNO3 (Δ) and 60% AlqSCN (◊). Membrane potential for an ideal anion-exchanger: solid line; NaCl diffusion potentials: dashed line. ------------------------------------- 162 Figure 3.18 TGA curves for 70% TPU – 30% Aliquat 336 (a) and 70% PCL – 30% Aliquat 336 (b). ------------------------------------------------------------------------------------------------------------ 177
xv
Figure 3.19 SEM images of 70% TPU – 30% Aliquat 336 surface (a), cross-section (b); 70% PCL – 30% Aliquat 336 surface (c), cross-section (d). ---------------------------------------------- 178 Figure 3.20 Transient Cr(VI) extraction at pH 4 using two different PIM compositions (n=2). ---------------------------------------------------------------------------------------------------------------- 180 Figure 3.21 Schematics of the PIM device and the whole setup used in the experiments. ---- 194 Figure 3.22 Evolution of PIM flux in front of the device deployment time. The initial concentration was 35 µM of Zn. The values show the mean ± SD (n=2). ------------------------ 197 Figure 3.23 JPIM at different free Zn concentrations in the donor phase added to the half strength Hoagland medium. PIM deployment time was 24 h. The values show the mean ± SD (n=3). 198 Figure 3.24 Comparison of [Zn2+] determined with the PIM device and the free concentration calculated with MINTEQ for several source solutions consisting of half strength Hoagland medium without and with added ligands (EDTA, HA and citrate). Deployment time was 48 h. Full symbols, 70 µM total Zn; empty symbols, 35 µM total Zn. The values show the mean ± SD (n=3). The solid line is the 1:1 along which [Zn2+]MINTEQ would exactly match [Zn2+]PIM. ---- 199 Figure 3.25 Representative epifluorescent micrographs of roots stained with FDA (green nuclei) showing the living cells and PI (red nuclei) showing the dead cells after different treatments: control with no Zn added (a) and 35 µM of Zn content (b) supplemented with 20 µM EDTA (c), 60mg L−1 of HA (d), 240 µM citrate (e) and 20 µM of histidine (f). ------------------------------ 204 Figure 3.26 Comparison of normalized root fluxes (35 µM Zn treatment and supplemented with EDTA, HA and citrate as ligands). Deployment time was 48 h. The values show the mean ± SD (n=3). -------------------------------------------------------------------------------------------------------- 206 Figure S3.27 Scheme of the experimental design showing the applied treatments (i.e. different donor hydroponic media for the final exposure). MS: Murashige and Skoog solid medium. - 213 Figure S3.28 Correlation between normalized root fluxes and JPIM (35 µM Zn treatment and supplemented with EDTA, HA and citrate as ligands). Deployment time was 48 h. The values show the mean ± SD (n=3). The dashed line was plotted to join those points for which both JPIM and Jroots are expected to be proportional to the free Zn concentration. --------------------------- 213 Figure 3.29 Bright field representative micrographs of potato roots grown in hydroponics media supplemented with 35 µM Zn in absence (a) or presence of 60 mg L-1 humic acids (b). Note the high abundance of hair cells when humic acids are present in the medium. Scale bar corresponds to 200 µm.--------------------------------------------------------------------------------------------------- 214 Figure 3.30 Transient amount of CP in the remaining aqueous solution. PIM composition was 70% CTA – 30% NPOE (n=2). -------------------------------------------------------------------------- 223 Figure 3.31 Evaluation of CP elution under different experimental conditions: ultrasound assisted elution and time. PIM 70% CTA – 30% NPOE (n=2). ---------------------------------------------- 224 Figure 3.32 Effect of different agitation modes during the extraction step: orbital agitation, magnetic stirring and rotary agitation for pesticides (a) DZ, (b) CP and (c) CYP. PIM: 70% CTA–30% NPOE. Elution was conducted with 1 mL of ACN for 15 min with UAE (n=3). --------- 225 Figure 3.33 Effect of the use of different plasticizers in the extraction of selected pesticides (a) DZ, (b) CP and (c) CYP. PIM: 70% CTA – 30% plasticizer. Elution was conducted with 1 mL of ACN for 15 min with UAE (n=3). ---------------------------------------------------------------------- 226
xvi
Figure 3.34 SRM chromatograms of the pesticides obtained after application of the PIM-assisted extraction in spiked Ter River water (a) and non-spiked Ter River water (b). ------------------- 232 Figure S3.35 Pesticide chemical structures, (a) Diazinon, (b) Chlorpyrifos and (c) Cyprodinil. ---------------------------------------------------------------------------------------------------------------- 239 Figure S3.36 SEM images of a PIM (70% CTA – 30% NPOE) surface (a) and cross section (b). ---------------------------------------------------------------------------------------------------------------- 239 Figure 4.1 Surface SEM images of different PIM compositions: (a1) 70% CTA – 30% AlqCl, (b1) 70% CTA – 30% AlqNO3, (c1) 70% CTA – 30% AlqSCN and (a2) 40% CTA – 60% AlqCl, (b2) 40% CTA – 60% AlqNO3, (c2) 40% CTA – 60% AlqSCN. ---------------------------------- 250 Figure 4.2 Transient concentration curves in As(V) transport experiments involving 50% (w/w) CTA – 50% (w/w) AlqCl (a) and 50% (w/w) CTA – 50%(w/w) AlqNO3 (b). (Experimental conditions: feed solution: 10 mg L−1 As(V), pH = 7; stripping solution: 0.1 M NaCl in (a) and 0.1M NaNO3 in (b)). -------------------------------------------------------------------------------------- 253 Figure 4.3 Correlation between normalized Jroot and JPIM (35 µM Zn treatment and supplemented with EDTA, HA and citrate as ligands). --------------------------------------------------------------- 257
xvii
TABLES LIST
Table 1.1 Physical properties of polymers frequently used in PIMs. ------------------------------- 43 Table 1.2 Classification and some examples of the different carriers used in PIMs studies. ---- 45 Table 1.3 Physicochemical parameters of some PIM plasticizers (adapted from [205]). -------- 48 Table 3.1 Characteristics and georeferences of the water samples used in this study. ----------- 91 Table 3.2 Effect of membrane composition and thickness on As(V) preconcentration in the stripping phase (n=3). Feed composition: 100 µg L−1 As(V) in GW1 (50 mL). ------------------- 95 Table 3.3 Comparison of the different GW samples on arsenate transport efficiency with the proposed PIM-based method (n=2). ---------------------------------------------------------------------- 96 Table 3.4 Effect of water sample on As(V) recovery (n=2). ----------------------------------------- 99 Table 3.5 As(V) concentration in GW samples determined by the ICP-OES reference method and the proposed PIM-based device method (n=2). ------------------------------------------------------- 100 Table 3.6 Optimization of the FA system for the determination of As(V). ---------------------- 111 Table 3.7 As(V) concentration in spiked drinking water samples determined by the newly developed FA method and HG-ICP-OES. ------------------------------------------------------------- 117 Table 3.8 Characteristics of the water samples used for this study. ------------------------------- 130 Table 3.9 Arsenic adsorption capacity by TiO2 based materials. ---------------------------------- 132 Table 3.10 Influence of elution flow rate: concentration of arsenic in the elution solution (n=2). Standard deviation given in brackets.------------------------------------------------------------------- 136 Table 3.11 Concentration values and recovery (R) results for spiked water samples (n=2) measured with the present method. --------------------------------------------------------------------- 138 Table 3.12 Average values of the atomic concentration percentages of the characteristic elements of the PIMs found on both membrane surfaces. ------------------------------------------------------ 154 Table 3.13 Effect of PIM composition on the conductivity (σm) and dielectric constant (εm) values for dry samples. ------------------------------------------------------------------------------------ 160 Table 3.14 Chemical structures, melting point and processing temperatures of the different polymers and the IL used for PIM preparation. ------------------------------------------------------- 171 Table 3.15 Characteristics of the PIMs prepared with thermo-compression procedure. ------- 175 Table 3.16 Mass concentration of the characteristic elements of the PIM, presented as the average values percentages (n=2). --------------------------------------------------------------------------------- 175 Table 3.17 Chemical composition of the nutrient solution corresponding to a half strength Hoagland solution, used as donor medium in all the experiments performed throughout the study. ---------------------------------------------------------------------------------------------------------------- 192
xviii
Table 3.18 Effect of PIM and receiving phase compositions on Zn transport and depletion. Contact time: 24 h.----------------------------------------------------------------------------------------- 196 Table 3.19 Evaluation of matrix effect (ME), extraction efficiency (EE) and absolute recovery (AR) for the different river waters. PIM: 70% CTA – 30% NPOE. Standard deviations are given in parentheses. ---------------------------------------------------------------------------------------------- 228 Table 3.20 Quality parameters for the PIM-assisted extraction method. ------------------------- 230 Table 3.21 Comparison of the PIM-assisted extraction method with others previously reported for the studied pesticides. --------------------------------------------------------------------------------- 231 Table S3.22 Physicochemical of the pesticides selected for study1 ------------------------------- 240 Table S3.23 Mass spectral characterization and quality parameters of the instrumental method (GC-QqQ) for the studied pesticides. ------------------------------------------------------------------- 240 Table 3.24 Chemical structure and physical properties of plasticizers used in this study. ----- 241 Table 4.1 Effect of PIM composition on the analytical signal. ------------------------------------ 247 Table 4.2 Effect of PIM composition on different membrane parameters. Standard deviation is given in parentheses based on three replicates. ------------------------------------------------------- 251 Table 4.3 Mass loss of PIMs after being immersed in ultrapure water or 0.1M NaCl solution for 24 h. Standard deviation is given in parentheses based on three replicates. ---------------------- 252 Table 4.4 Comparison of the PIM-assisted extraction method with EPA methods. ------------ 259
TABLE OF CONTENTS
Publications list------------------------------------------------------------------------------------- i
Abbreviations list --------------------------------------------------------------------------------- v
Figures list --------------------------------------------------------------------------------------- xiii
Tables list --------------------------------------------------------------------------------------- xvii
Abstract --------------------------------------------------------------------------------------------------------- 1
Resum ---------------------------------------------------------------------------------------------------------- 3
Resumen-------------------------------------------------------------------------------------------------------- 5
CHAPTER 1 General Introduction ------------------------------------------------------ 9
1.1 The occurrence and problem of pollutants in the environment ---------------------- 12 1.1.1 Oxyanions ----------------------------------------------------------------------------------- 12
1.1.1.1 Arsenic ---------------------------------------------------------------------------------- 12 Regulation and health implications ------------------------------------------------------- 17 Uses of arsenic ------------------------------------------------------------------------------- 18
1.1.1.2 Chromium ------------------------------------------------------------------------------ 19 Regulation and health implications ------------------------------------------------------- 20 Uses of chromium --------------------------------------------------------------------------- 20
1.1.2 Zinc ------------------------------------------------------------------------------------------- 21 Regulation and health implications ------------------------------------------------------- 22 Uses of zinc ---------------------------------------------------------------------------------- 23
1.1.3 Pesticides ------------------------------------------------------------------------------------ 23
1.2 Determination of pollutants in waters ------------------------------------------------------ 27 1.2.1 Metal and metalloid determination ------------------------------------------------------- 27 1.2.2 Pesticide determination -------------------------------------------------------------------- 29
1.3 Speciation studies ------------------------------------------------------------------------------- 30 1.4 Separation and preconcentration processes ----------------------------------------------- 33 1.5 Polymer Inclusion Membrane (PIM) ------------------------------------------------------- 36
1.5.1 PIM Components --------------------------------------------------------------------------- 40 1.5.2 Characteristics of PIMs -------------------------------------------------------------------- 49 1.5.3 Characterization of PIMs ------------------------------------------------------------------ 50 1.5.4 Analytical applications of PIMs ---------------------------------------------------------- 53
References ------------------------------------------------------------------------------------------------ 59
CHAPTER 2 Objectives ----------------------------------------------------------------------- 79
CHAPTER 3 Results ---------------------------------------------------------------------------- 83
3.1 Development of new analytical methodologies for arsenic determination --------- 85 3.1.1 The Use of a Polymer Inclusion Membrane for Arsenate Determination in Groundwater -------------------------------------------------------------------------------------- 86
Abstract ----------------------------------------------------------------------------------------- 86 Introduction ------------------------------------------------------------------------------------ 86 Methods ----------------------------------------------------------------------------------------- 88
Reagents and Solutions --------------------------------------------------------------------- 88 Colorimetric Detection of As(V) --------------------------------------------------------- 88 Polymer Inclusion Membrane (PIM) Preparation -------------------------------------- 89 Preconcentration Experiments and Calibration Curve -------------------------------- 89 Apparatus ------------------------------------------------------------------------------------- 90 Water Samples ------------------------------------------------------------------------------- 90
Results and discussion ----------------------------------------------------------------------- 92 Parameters Affecting the Preconcentration System------------------------------------ 92 Analytical Application of the PIM-device ---------------------------------------------- 96
Conclusions ----------------------------------------------------------------------------------- 100 References ------------------------------------------------------------------------------------ 100
3.1.2 Automatic determination of arsenate in drinking water by flow analysis with dual membrane-based separation ---------------------------------------------------------- 103
Abstract --------------------------------------------------------------------------------------- 103 Introduction ---------------------------------------------------------------------------------- 103 Experimental --------------------------------------------------------------------------------- 105
Reagents and solutions ------------------------------------------------------------------- 105 Instrumentation ---------------------------------------------------------------------------- 106 Flow Analysis (FA) manifold ----------------------------------------------------------- 106 FA procedure ------------------------------------------------------------------------------ 109 Optimisation of the FA method --------------------------------------------------------- 109 PIM preparation --------------------------------------------------------------------------- 110 Interference studies ----------------------------------------------------------------------- 110 Sample analysis --------------------------------------------------------------------------- 110
Results and discussion --------------------------------------------------------------------- 111 Optimization of the FA system parameters ------------------------------------------- 111 Effect of the reaction coil length, flow rate of Stream R1 and type of the gas-diffusion membrane ----------------------------------------------------------------------- 112 Effect of the PIM and the compositions of Stream R4 ------------------------------ 113 Effect of the flow rate of Stream R5 and the stop-flow time for Stream R4 ----- 114 Interference studies ----------------------------------------------------------------------- 115 Analytical figures of merit --------------------------------------------------------------- 116 Analysis of drinking water samples ---------------------------------------------------- 117
Conclusions ----------------------------------------------------------------------------------- 118 References ------------------------------------------------------------------------------------ 118
3.1.3 Titanium dioxide solid phase for inorganic species adsorption and determination: the case of arsenic ---------------------------------------------------------- 123
Abstract --------------------------------------------------------------------------------------- 123 Introduction ---------------------------------------------------------------------------------- 123 Experimental --------------------------------------------------------------------------------- 126
Reagents and solutions ------------------------------------------------------------------- 126 Instruments --------------------------------------------------------------------------------- 126 Determination of the capacity of the adsorbent -------------------------------------- 127 Selecting the elution conditions --------------------------------------------------------- 128 Interference from major ions ------------------------------------------------------------ 128
Calibration curve and method validation ---------------------------------------------- 129 Water Samples ----------------------------------------------------------------------------- 129
Results and discussion --------------------------------------------------------------------- 130 Fundamentals and sorption capacity of Adsorbsia As600 -------------------------- 130 Elution experiments ----------------------------------------------------------------------- 134 Preconcentration with a minicolumn filled with Adsorbsia As600: the effect of eluent volume and flow rate ------------------------------------------------------------- 135 Interference from the anions presents in water samples----------------------------- 136 Analytical performance of the method ------------------------------------------------- 137 Determination of arsenic in water samples -------------------------------------------- 138
Conclusions ----------------------------------------------------------------------------------- 139 References ------------------------------------------------------------------------------------ 139
3.2 Advances on PIMs ---------------------------------------------------------------------------- 145 3.2.1 Tuning physicochemical, electrochemical and transport characteristics of polymer inclusion membrane by varying the counter-anion of the ionic liquid Aliquat 336 --------------------------------------------------------------------------------------- 146
Abstract --------------------------------------------------------------------------------------- 146 Introduction ---------------------------------------------------------------------------------- 146 Experimental --------------------------------------------------------------------------------- 148
Reagents and solutions ------------------------------------------------------------------- 148 PIM preparation --------------------------------------------------------------------------- 149 IR spectroscopy --------------------------------------------------------------------------- 149 TGA analysis ------------------------------------------------------------------------------ 149 Contact angle ------------------------------------------------------------------------------ 150 XPS measurements ----------------------------------------------------------------------- 150 IS measurements -------------------------------------------------------------------------- 151 Membrane potentials --------------------------------------------------------------------- 151 Study of HCl permeation though the PIMs ------------------------------------------- 152
Results and discussion --------------------------------------------------------------------- 152 Physicochemical characterization of PIMs -------------------------------------------- 152 Characterization of the PIMs in contact with electrolyte solution ----------------- 160
Conclusions ----------------------------------------------------------------------------------- 163 References ------------------------------------------------------------------------------------ 164
3.2.3 First report on a solvent-free preparation of polymeric membranes with an ionic liquid --------------------------------------------------------------------------------------- 168
Abstract --------------------------------------------------------------------------------------- 168 Introduction ---------------------------------------------------------------------------------- 168 Experimental --------------------------------------------------------------------------------- 171
Reagents and solutions ------------------------------------------------------------------- 171 Polymeric membrane preparation ------------------------------------------------------ 172 Membrane characterization -------------------------------------------------------------- 173 Membrane stability studies -------------------------------------------------------------- 173 Cr(VI) extraction experiments ---------------------------------------------------------- 173
Results and discussion --------------------------------------------------------------------- 174 Preparation of polymeric membranes -------------------------------------------------- 174 Membrane characterization -------------------------------------------------------------- 175 Stability studies ---------------------------------------------------------------------------- 179 Testing membranes efficiency: Cr(VI) extraction ----------------------------------- 179
Conclusions ----------------------------------------------------------------------------------- 180 References ------------------------------------------------------------------------------------ 181
3.3 Novel applications of PIMs ----------------------------------------------------------------- 187
3.3.1 Polymer inclusion membrane to access Zn speciation: Comparison with root uptake --------------------------------------------------------------------------------------------- 188
Abstract --------------------------------------------------------------------------------------- 188 Introduction ---------------------------------------------------------------------------------- 188 Experimental --------------------------------------------------------------------------------- 191
Reagents and solution -------------------------------------------------------------------- 191 Instrument and apparatus ---------------------------------------------------------------- 192 Membrane preparation ------------------------------------------------------------------- 193 PIM-device experiments ----------------------------------------------------------------- 193 Plant growth -------------------------------------------------------------------------------- 194 Plant exposure and analysis ------------------------------------------------------------- 194 Vital staining of roots--------------------------------------------------------------------- 195
Results and discussion --------------------------------------------------------------------- 195 Evaluation of the PIM system ----------------------------------------------------------- 195 Stability studies ---------------------------------------------------------------------------- 196 Measurement of diffusional JPIM -------------------------------------------------------- 198 Modelling the flux of Zn ----------------------------------------------------------------- 200 Toxicity of the ligands for the roots ---------------------------------------------------- 203 Plant metal uptake and comparison with JPIM ----------------------------------------- 204
Conclusions ----------------------------------------------------------------------------------- 206 References ------------------------------------------------------------------------------------ 207 Supplementary data ------------------------------------------------------------------------ 213
3.3.2 A new extraction phase based on a polymer inclusion membrane for the detection of chlorpyrifos, diazinon and cyprodinil in natural water samples ---- 215
Abstract --------------------------------------------------------------------------------------- 215 Introduction ---------------------------------------------------------------------------------- 215 Experimental --------------------------------------------------------------------------------- 217
Chemicals and standards ----------------------------------------------------------------- 217 Equipment and chromatographic conditions ------------------------------------------ 218 Preparation of the PIM ------------------------------------------------------------------- 219 Evaluation of different parameters for pesticide extraction and elution ---------- 220 Extraction efficiency and absolute recovery ------------------------------------------ 220 Quality parameters of the method ------------------------------------------------------ 222
Results and discussion --------------------------------------------------------------------- 222 Preliminary studies: Influence of contact time on the extraction of chlorpyrifos and the selection of the solvent for elution ------------------------------------------------- 222 Extraction conditions for the three pesticides----------------------------------------- 224 Evaluation of PIM composition --------------------------------------------------------- 225 Extraction efficiency and absolute recovery ------------------------------------------ 226 Quality parameters for the PIM-assisted extraction method ----------------------- 228 Recovery test and real water analysis -------------------------------------------------- 229
Conclusions ----------------------------------------------------------------------------------- 233 References ------------------------------------------------------------------------------------ 233 Supplementary data ------------------------------------------------------------------------ 239
---------------------------------------------------------------------------------------------------------------- 239
---------------------------------------------------------------------------------------------------------------- 239
CHAPTER 4 General discussion and future perspectives --------------- 243
4.1 Development of new analytical methodologies for arsenic determination ------- 245 4.2 Advances on PIMs ---------------------------------------------------------------------------- 249 4.3 Novel PIM applications ---------------------------------------------------------------------- 254

4.4 Future perspectives --------------------------------------------------------------------------- 259 References ------------------------------------------------------------------------------------------- 261
CHAPTER 5 Conclusions ------------------------------------------------------------------ 265

1
ABSTRACT
Water is essential for humankind not only for its direct consumption but also for
its multiple applications in industry or agriculture, among others. The presence of
undesirable substances or pollutants directly affects its quality. Therefore, it is of
paramount importance to develop analytical methodologies which permit the detection
and/or quantification of different species or compounds that can restrict their usage.
The research presented in this thesis is focused on the design, preparation and
characterization of new analytical methodologies based on functionalized membranes for
the preconcentration and speciation of pollutants in the aqueous environment.
Frequently, the direct analysis of environmental samples cannot be achieved due
to the high complexity of the matrix, or because the concentration of the different
compounds is found below the technique’s detection limit. Thus, a previous
preconcentration step is needed that allows separation and/or preconcentration in order to
remove interferences and/or improve compound detection at low levels. It is also
important to obtain information about the different chemical species present in the
sample, as toxicity is often species-related. The design of devices which allow the
miniaturization and automation of the whole process as well as enabling in situ analysis
is also relevant.
Taking into account all the aforementioned aspects, in this thesis we have
developed simple and innovative analytical methods based on polymer inclusion
membranes (PIMs) for water sample treatment in order to facilitate its analysis. Hence,
we have developed a PIM-based device, using Aliquat 336 as the carrier, which has
allowed satisfactory arsenate determination in groundwater samples. Besides, an
analogous membrane has been coupled into a flow analysis system allowing the online
detection and determination of arsenate. Furthermore, the use of a commercial sorbent
based on titanium dioxide, named Adsorbsia As600, has been explored and has shown
great retention capacity towards both inorganic arsenic species. The use of minicolumns
embedded with this sorbent has facilitated the detection of total arsenic in water samples.
We have focused not only on the preparation of PIMs but also on the
characterization of physicochemical and electrochemical properties by modifying the
ionic liquid (IL), using Aliquat 336 as a carrier. Depending on the hydrophilic nature of
the membrane, the results have shown a direct impact on its efficiency in transport
systems. Furthermore, in order to reduce the impact on the environment, a new PIM
2
preparation methodology has been developed that avoids the use of harmful solvents and
at the same time uses polymers from renewable or biodegradable sources for the first
time.
PIMs containing D2EHPA as the carrier, have been used as an emerging technique
to conduct zinc speciation studies from a nutrient solution. Results have shown that the
metal flow through the membrane is proportional to its free fraction, despite the presence
of various organic ligands. Moreover, we have related PIM results with the internalization
of metal in the roots of potato plants (Solanum tuberosum), showing that different
processes intervene in the internalization of metal in plants that are not observed in
chemical systems.
Finally, another innovative application of PIMs has been presented based on its
satisfactory use as a sorbent for the preconcentration of three pesticides. The membrane
used is only made up of polymer and plasticizer, without the addition of a carrier agent.
This analytical methodology has facilitated the analysis of pesticides at trace levels in
river water samples.
3
RESUM
L’aigua és un bé essencial i necessari per la humanitat, no només pel seu consum
directe, sinó també pel seus usos industrials o agrícoles, entre d'altres. La presència de
substàncies no desitjables o contaminants afecta directament la seva qualitat. Cal doncs,
disposar de metodologies analítiques que permetin la seva anàlisi per tal de detectar i/o
quantificar diferents espècies o compostos que poden limitar el seu ús.
La investigació que es presenta en aquesta tesi es centra en el disseny, la
preparació i caracterització de noves metodologies analítiques basades en membranes
funcionalitzades per a la preconcentració i l’especiació de contaminants al medi aquós.
Freqüentment, l'anàlisi directe de mostres ambientals no es pot dur a terme, ja
sigui degut a la complexitat de la matriu o bé perquè la concentració dels compostos
d'interès a analitzar, es troba per sota del límit de detecció de la tècnica. Per això, és
necessària una etapa prèvia que permeti la separació i/o preconcentració per tal d'eliminar
les interferències i/o millorar la seva detecció a nivells baixos de concentració. D'altra
banda, també es important obtenir informació sobre les diferents espècies químiques
presents a la mostra, ja que sovint la toxicitat hi està estretament relacionada. A més, es
important dissenyar dispositius que permetin la miniaturització i automatització dels
processos i que també permetin l'anàlisi in situ.
Tenint en compte tots els aspectes anteriorment anomenats, en aquesta tesi s’han
desenvolupat mètodes analítics simples i innovadors basats en membranes d'inclusió
polimèrica (PIMs) per al tractament de mostres d’aigua per tal de facilitar-ne la seva
anàlisi. Així, s’ha desenvolupat un dispositiu basat en PIM, utilitzant Aliquat 336 com a
agent portador, el qual ha permès la satisfactòria determinació d'arsenat en aigües
subterrànies. També, una membrana similar s'ha acoblat en un sistema d'anàlisi en continu
permetent la detecció i determinació online d'arsenat. D’altra banda, s'ha explorat la
utilització d’un sorbent comercial basat en diòxid de titani, anomenat Adsorbsia As600,
el qual ha demostrat una gran capacitat per la retenció d’ambdues formes d'arsènic
inorgàniques. Així, utilitzant minicolumnes amb aquest sorbent s’ha facilitat la detecció
d’arsènic total en mostres d’aigua.
S’ha fet èmfasi en la preparació de PIMs així com en la caracterització de les
propietats fisicoquímiques i electroquímiques tot modificant el líquid iònic (LI), Aliquat
336 utilitzat com a agent portador. Els resultats obtinguts han demostrat que en funció el
caràcter hidrofílic de la membrana té un impacte directe sobre la seva eficàcia en sistemes
4
de transport. També, per tal de reduir l'impacte sobre el medi ambient, s’ha desenvolupat
una nova metodologia de preparació de PIMs que evita l’ús de dissolvents nocius i a la
vegada s'han utilitzat, per primera vegada, polímers de fonts renovables o biodegradables.
Es presenta també l’ús de PIMs, contenint D2EHPA com a agent extractant, com
a tècnica emergent per realitzar estudis d’especiació de zinc contingut en una dissolució
nutrient. Els estudis han demostrat que el flux de metall a través de la membrana és
proporcional a la fracció lliure d'aquest, tot i la presència de diversos lligands orgànics.
Tanmateix, els resultats obtinguts amb PIM s'han relacionat amb la internalització de
metall a les arrels de plantes de patata (Solanum tuberosum), demostrant que diferents
processos intervenen en la internalització de metall a les plantes els quals no s'observen
en sistemes químics.
Finalment, s'ha presentat una altra innovadora aplicació de les PIMs basada en la
seva satisfactòria utilització com a sorbent per a la preconcentració de tres pesticides. La
membrana utilitzada només està constituïda de polímer i plastificant, sense l'addició d'un
agent portador. Aquesta metodologia analítica ha facilitat l'anàlisi de pesticides a nivells
traça en mostres d’aigua de riu.
5
RESUMEN
El agua es un bien preciado y necesario para la humanidad, no solo por su
consumo directo sino también por sus usos industriales o agrícolas, entre otros. La
presencia de substancias no deseadas o contaminantes afecta directamente a su calidad.
Por ello, se necesitan metologías analíticas que permitan su análisis para poder detectar
y/o cuantificar las diferentes especies o compuestos que puedan limitar su uso.
La investigación que se presenta en esta tesis se centra en el diseño, la preparación
y caracterización de nuevas metodologías analíticas basadas en membranas
funcionalizadas para la preconcentración y especiación de contaminantes en medio
acuoso.
Frecuentemente, el análisis directo de muestras ambientales no se puede llevar a
cabo, debido a una alta complejidad de la matriz o bien porque la concentración de los
compuestos de interés a ser analizados se encuentra por debajo del límite de detección de
la técnica. Por ello, es necesaria una etapa previa que permita la separación y/o
preconcentración para poder eliminar las interferencias y/o mejorar su detección a niveles
bajos de concentración. Por otra parte, también es importante obtener información sobre
las diferentes especies químicas presentes en la muestra, ya que la toxicidad está
estrechamente relacionada en función de la especie. Además, es importante diseñar
dispositivos que permitan la miniaturización y automatización de los procesos y que
también permitan el análisis in situ.
Teniendo en cuenta todos los aspectos anteriormente mencionados, en esta tesis
se han desarrollado métodos analíticos simples e innovadores basados en membranas de
inclusión polimérica (PIM) para el tratamiento de muestra de agua con el fin de facilitar
su análisis. De este modo se ha desarrollado un dispositivo basado en PIM, utilizando
Aliquat 336 como agente portador, el cual ha permitido la satisfactoria determinación de
arsenato en aguas subterráneas. También, una membrana similar ha sido acoplada en un
sistema de análisis en continuo permitiendo la detección y determinación online de
arsenato. Por otra parte, se ha explorado la utilización de un adsorbente comercial basado
en dióxido de titanio, llamado Adsorbsia As600, el cual ha demostrado una alta capacidad
para la retención de ambas formas inorgánicas de arsénico. De este modo, la utilización
de minicolumnas conteniendo el adsorbente han facilitado la detección de arsénico total
en muestras de agua.
6
Se ha hecho énfasis en la preparación de PIMs así como en la caracterización de
las propiedades fisicoquímicas y electroquímicas mediante la modificación del líquido
iónico (LI), Aliquat 336, utilizado como agente portador. Los resultados obtenidos han
demostrado que en función del carácter hidrofílico de la membrana, este afecta
directamente a su eficacia en sistemas de transporte. También, por tal de reducir el
impacto sobre el medio ambiente, se ha desarrollado una nueva metodología de
preparación de PIMs que evita la utilización de disolventes nocivos y a su vez utiliza por
primera vez, polímeros de fuentes renovables o biodegradables.
Se presenta también el uso de PIMs, conteniendo D2EHPA como agente
extractante, como técnica emergente para la realización de estudios de especiación de
zinc en disoluciones nutrientes. Los estudios han demostrado que el flujo de metal a través
de la membrana es proporcional a la fracción libre de este, aun con la presencia de
diversos ligandos orgánicos. Del mismo modo, los resultados obtenidos con PIM se han
relacionado con la internalización de metal en raíces de plantas de patata (Solanum
tuberosum), demostrando que diferentes procesos intervienen en la internalización de
metal en las plantas los cuales no se observan en sistemas químicos.
Finalmente, se ha presentado otra innovadora aplicación de las PIMs basada en su
satisfactoria utilización como adsorbente para la preconcentración de tres pesticidas. La
membrana utilizada solo está formada por polímero y plastificante, sin la adición de un
agente portador. Esta metodología analítica ha facilitado el análisis de pesticidas a
concentraciones traza en muestras de agua de río.


CHAPTER 1
General Introduction

Chapter 1 – General Introduction
11
Water is essential for humankind and its management throughout history has
contributed to the development of our society. As one of our principal resources, its
supply must be kept at a satisfactory level to avoid major impacts on people’s well-being
[1]. Nevertheless, an ever-increasing world population as well as industrial growth and
development, have led to considerable pressure on the environment, threatening the
integrity of freshwater resources. There is a finite supply of freshwater and only less than
a half of one percent of all the water on earth is available, the largest reserve being
groundwater. The remaining amount is seawater, stored frozen in polar ice or too
inaccessible for practical usage [2]. Moreover, accessibility to clean water has been
considered by organizations such as United Nations Children’s Fund (UNICEF), the
United Nations (UN) and the World Health Organization (WHO) as one of the biggest
challenges of this century. In July 2010, the UN General Assembly recognized the human
right to water and sanitation. Every human being should have access to enough water,
which must be safe, acceptable, affordable and physically accessible [3,4].
Water scarcity can be defined as a situation in which insufficient water resources
are available to satisfy long-term average requirements and similarly [5] as the
overexploitation of water resources when demand for water is higher than water
availability [6]. Nearly 20% of the world’s population (1.2 billion people) live in areas of
physical water scarcity [7] and this has an important impact on the socio-economic
development and prosperity in many different countries [8]. Indeed, water is
progressively being degraded in terms of quality, increasing the cost of treatment and
threatening human and ecosystem health [7].
Safe drinking water, as defined by the WHO, is one that does not represent any
significant risk to health over a lifetime of consumption, including different sensitivities
that may occur at different life stages, such as infancy, early childhood or old age [9].
Therefore, one of the target goals of WHO included in the 2030 agenda for drinking water
is to improve water quality by reducing pollution, eliminating dumping and minimizing
the release of hazardous chemicals and materials, with the aim of reducing by half the
proportion of untreated wastewater and substantially increasing recycling and safe reuse
globally [10].
Waters must be free from pathogens and elevated levels of harmful pollutants in
order to be considered safe for drinking purposes. At a global scale, the faecal matter
(microbial contamination) and the amount of arsenic and fluoride are the highest priority
parameters regarding the risk to human health [10]. Microbial contamination is a
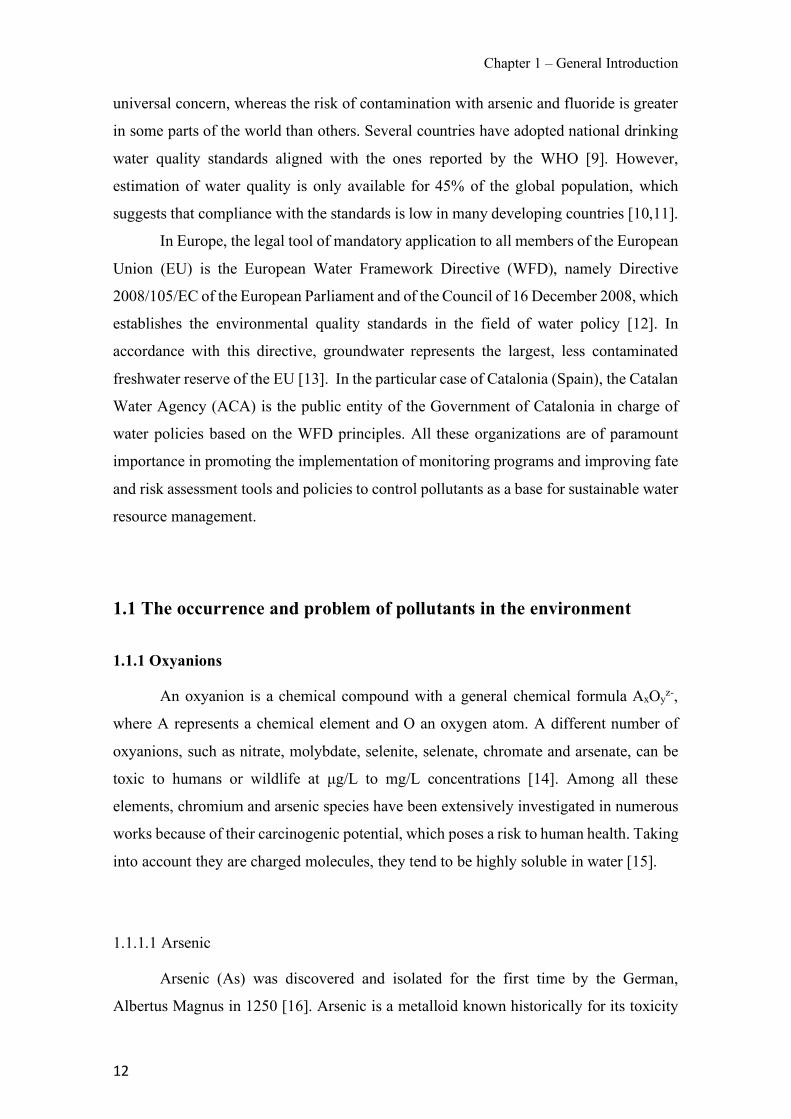
Chapter 1 – General Introduction
12
universal concern, whereas the risk of contamination with arsenic and fluoride is greater
in some parts of the world than others. Several countries have adopted national drinking
water quality standards aligned with the ones reported by the WHO [9]. However,
estimation of water quality is only available for 45% of the global population, which
suggests that compliance with the standards is low in many developing countries [10,11].
In Europe, the legal tool of mandatory application to all members of the European
Union (EU) is the European Water Framework Directive (WFD), namely Directive
2008/105/EC of the European Parliament and of the Council of 16 December 2008, which
establishes the environmental quality standards in the field of water policy [12]. In
accordance with this directive, groundwater represents the largest, less contaminated
freshwater reserve of the EU [13]. In the particular case of Catalonia (Spain), the Catalan
Water Agency (ACA) is the public entity of the Government of Catalonia in charge of
water policies based on the WFD principles. All these organizations are of paramount
importance in promoting the implementation of monitoring programs and improving fate
and risk assessment tools and policies to control pollutants as a base for sustainable water
resource management.
1.1 The occurrence and problem of pollutants in the environment
1.1.1 Oxyanions
An oxyanion is a chemical compound with a general chemical formula AxOyz-,
where A represents a chemical element and O an oxygen atom. A different number of
oxyanions, such as nitrate, molybdate, selenite, selenate, chromate and arsenate, can be
toxic to humans or wildlife at µg/L to mg/L concentrations [14]. Among all these
elements, chromium and arsenic species have been extensively investigated in numerous
works because of their carcinogenic potential, which poses a risk to human health. Taking
into account they are charged molecules, they tend to be highly soluble in water [15].
1.1.1.1 Arsenic
Arsenic (As) was discovered and isolated for the first time by the German,
Albertus Magnus in 1250 [16]. Arsenic is a metalloid known historically for its toxicity
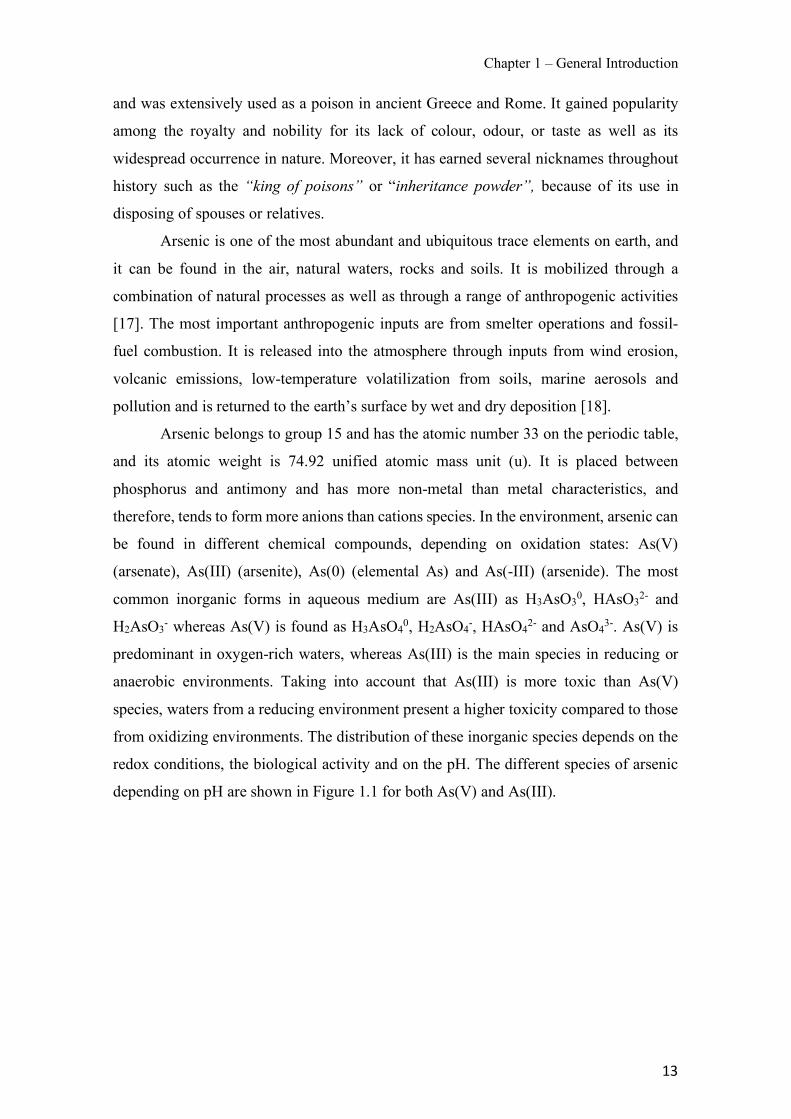
Chapter 1 – General Introduction
13
and was extensively used as a poison in ancient Greece and Rome. It gained popularity
among the royalty and nobility for its lack of colour, odour, or taste as well as its
widespread occurrence in nature. Moreover, it has earned several nicknames throughout
history such as the “king of poisons” or “inheritance powder”, because of its use in
disposing of spouses or relatives.
Arsenic is one of the most abundant and ubiquitous trace elements on earth, and
it can be found in the air, natural waters, rocks and soils. It is mobilized through a
combination of natural processes as well as through a range of anthropogenic activities
[17]. The most important anthropogenic inputs are from smelter operations and fossil-
fuel combustion. It is released into the atmosphere through inputs from wind erosion,
volcanic emissions, low-temperature volatilization from soils, marine aerosols and
pollution and is returned to the earth’s surface by wet and dry deposition [18].
Arsenic belongs to group 15 and has the atomic number 33 on the periodic table,
and its atomic weight is 74.92 unified atomic mass unit (u). It is placed between
phosphorus and antimony and has more non-metal than metal characteristics, and
therefore, tends to form more anions than cations species. In the environment, arsenic can
be found in different chemical compounds, depending on oxidation states: As(V)
(arsenate), As(III) (arsenite), As(0) (elemental As) and As(-III) (arsenide). The most
common inorganic forms in aqueous medium are As(III) as H3AsO30, HAsO32- and
H2AsO3- whereas As(V) is found as H3AsO40, H2AsO4-, HAsO42- and AsO43-. As(V) is
predominant in oxygen-rich waters, whereas As(III) is the main species in reducing or
anaerobic environments. Taking into account that As(III) is more toxic than As(V)
species, waters from a reducing environment present a higher toxicity compared to those
from oxidizing environments. The distribution of these inorganic species depends on the
redox conditions, the biological activity and on the pH. The different species of arsenic
depending on pH are shown in Figure 1.1 for both As(V) and As(III).
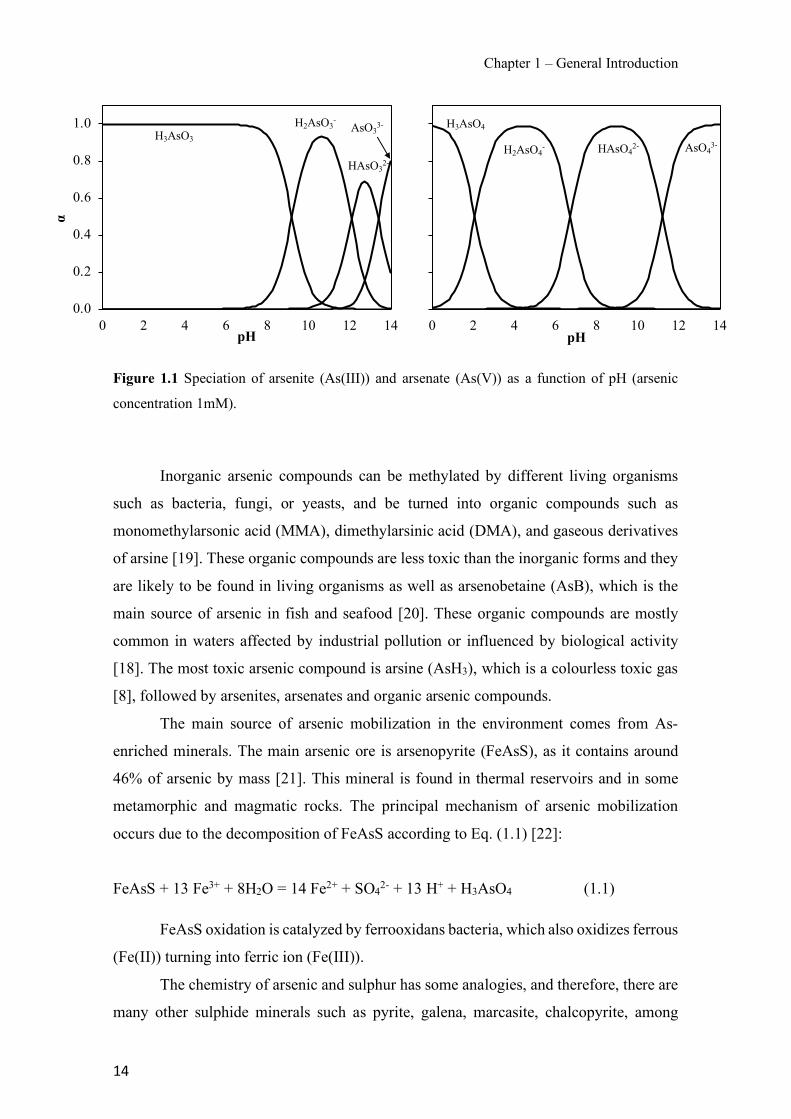
Chapter 1 – General Introduction
14
Figure 1.1 Speciation of arsenite (As(III)) and arsenate (As(V)) as a function of pH (arsenic
concentration 1mM).
Inorganic arsenic compounds can be methylated by different living organisms
such as bacteria, fungi, or yeasts, and be turned into organic compounds such as
monomethylarsonic acid (MMA), dimethylarsinic acid (DMA), and gaseous derivatives
of arsine [19]. These organic compounds are less toxic than the inorganic forms and they
are likely to be found in living organisms as well as arsenobetaine (AsB), which is the
main source of arsenic in fish and seafood [20]. These organic compounds are mostly
common in waters affected by industrial pollution or influenced by biological activity
[18]. The most toxic arsenic compound is arsine (AsH3), which is a colourless toxic gas
[8], followed by arsenites, arsenates and organic arsenic compounds.
The main source of arsenic mobilization in the environment comes from As-
enriched minerals. The main arsenic ore is arsenopyrite (FeAsS), as it contains around
46% of arsenic by mass [21]. This mineral is found in thermal reservoirs and in some
metamorphic and magmatic rocks. The principal mechanism of arsenic mobilization
occurs due to the decomposition of FeAsS according to Eq. (1.1) [22]:
FeAsS + 13 Fe3+ + 8H2O = 14 Fe2+ + SO42- + 13 H+ + H3AsO4 (1.1)
FeAsS oxidation is catalyzed by ferrooxidans bacteria, which also oxidizes ferrous
(Fe(II)) turning into ferric ion (Fe(III)).
The chemistry of arsenic and sulphur has some analogies, and therefore, there are
many other sulphide minerals such as pyrite, galena, marcasite, chalcopyrite, among
0.0
0.2
0.4
0.6
0.8
1.0
0 2 4 6 8 10 12 14
α
pH
H3AsO3H2AsO3-
HAsO32-
AsO33-
0 2 4 6 8 10 12 14pH
H3AsO4
H2AsO4- HAsO42- AsO43-
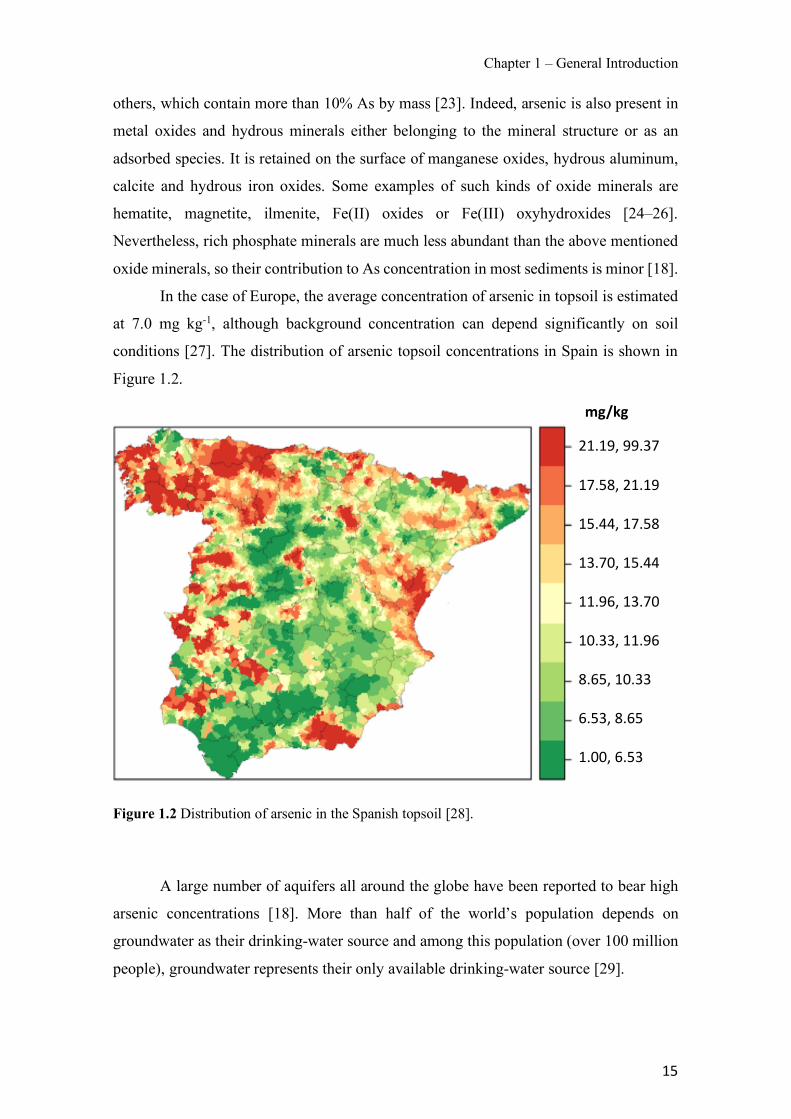
Chapter 1 – General Introduction
15
others, which contain more than 10% As by mass [23]. Indeed, arsenic is also present in
metal oxides and hydrous minerals either belonging to the mineral structure or as an
adsorbed species. It is retained on the surface of manganese oxides, hydrous aluminum,
calcite and hydrous iron oxides. Some examples of such kinds of oxide minerals are
hematite, magnetite, ilmenite, Fe(II) oxides or Fe(III) oxyhydroxides [24–26].
Nevertheless, rich phosphate minerals are much less abundant than the above mentioned
oxide minerals, so their contribution to As concentration in most sediments is minor [18].
In the case of Europe, the average concentration of arsenic in topsoil is estimated
at 7.0 mg kg-1, although background concentration can depend significantly on soil
conditions [27]. The distribution of arsenic topsoil concentrations in Spain is shown in
Figure 1.2.
Figure 1.2 Distribution of arsenic in the Spanish topsoil [28].
A large number of aquifers all around the globe have been reported to bear high
arsenic concentrations [18]. More than half of the world’s population depends on
groundwater as their drinking-water source and among this population (over 100 million
people), groundwater represents their only available drinking-water source [29].
21.19, 99.37
17.58, 21.19
15.44, 17.58
13.70, 15.44
11.96, 13.70
10.33, 11.96
8.65, 10.33
6.53, 8.65
1.00, 6.53
mg/kg
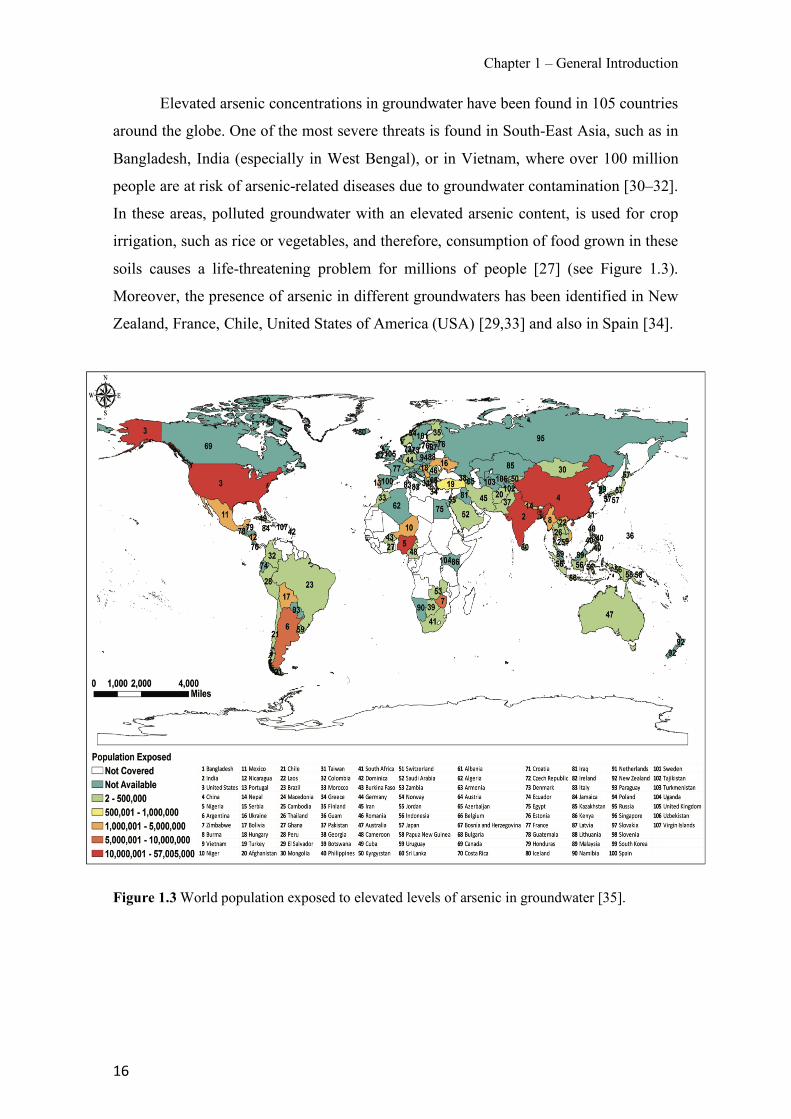
Chapter 1 – General Introduction
16
Elevated arsenic concentrations in groundwater have been found in 105 countries
around the globe. One of the most severe threats is found in South-East Asia, such as in
Bangladesh, India (especially in West Bengal), or in Vietnam, where over 100 million
people are at risk of arsenic-related diseases due to groundwater contamination [30–32].
In these areas, polluted groundwater with an elevated arsenic content, is used for crop
irrigation, such as rice or vegetables, and therefore, consumption of food grown in these
soils causes a life-threatening problem for millions of people [27] (see Figure 1.3).
Moreover, the presence of arsenic in different groundwaters has been identified in New
Zealand, France, Chile, United States of America (USA) [29,33] and also in Spain [34].
Figure 1.3 World population exposed to elevated levels of arsenic in groundwater [35].
Chapter 1 – General Introduction
17
• Regulation and health implications
The evidence of the toxicological effects of arsenic has led the maximum arsenic
concentration for human consumption recommended by the WHO to be established at 10
µg L-1. However, in many developing countries, the WHO has established a limit of 50
µg L-1, as a result of economic constraints and the difficulty of analytical determination
when arsenic is present at very low concentrations [9,10]. On applying the WHO
guideline of 10 µg L-1, more than 100 million people are at risk, and out of these more
than 45 million people, mainly in developing countries in Asia, are at risk of being
exposed to more than 50 µg L-1 [33]. On a minor scale, the presence of this pollutant has
also been detected in different areas in the northeast of Catalonia (Spain). Hence, different
municipalities have set up arsenic removal water treatment plants in order to achieve
satisfactory levels based on the coprecipitation of arsenate with iron(III) salts [36,37].
Moreover, maximum levels of arsenic in food have been established by
Commission Regulation (EU) No 2015/1006 [38], which was applicable from 1 January
2016 onwards. Apart from drinking water, grain-based processed products, such as wheat
bread, rice, milk and dairy products, are the main sources of exposure for the general
population in Europe. Children under 3 years of age are the most exposed to inorganic
arsenic because they consume more rice-based products. Indeed, certain ethnic groups or
people following a gluten-free diet, who have relatively higher intakes of rice, or are high
consumers of algae-based products, can exceed their tolerable weekly intake of inorganic
arsenic [39].
Inorganic arsenic compounds are classified by the International Agency for
Research on Cancer (IARC) in Group 1 (carcinogenic to humans) on the basis of
sufficient evidence for carcinogenicity in humans and limited evidence for
carcinogenicity in animals [40]. The acute toxicity of arsenic compounds in humans is
predominantly a function of their rate of removal from the body.
The regular consumption of water polluted with arsenic can cause skin, lung,
bladder and kidney cancer, as well as changes in pigmentation, neurological disorders,
muscle weakness, loss of appetite, nausea and diabetes [41]. Moreover, there is emerging
evidence of negative impacts on foetal and infant development, as birth weight is reduced.
Humans can be exposed to arsenic by inhalation, skin absorption, and ingestion of food
and water. Inhalation may occur due to industrial emissions, tobacco smoke or gas from
electricity-generating combustion plants. Regarding ingestion, studies have been carried
Chapter 1 – General Introduction
18
out in which the gastrointestinal tract rapidly absorbs arsenic, and its effects depend on
the source of arsenic [42]. On the other hand, the risk associated with skin absorption is
relatively low compared to that of ingestion.
• Uses of arsenic
Despite its toxicity, arsenic is still being used in various applications, although
increasingly less over time. Arsenical pesticides and insecticides, such as lead arsenate,
zinc arsenate, calcium arsenate, zinc arsenite, Paris green and magnesium arsenate, have
been extensively used in numerous countries for decades until the development of
dichlorodiphenyltrichloroethane (DDT) [43–45]. Among the different applications,
arsenic-based pesticides have been used as herbicides, insecticides, cotton desiccants,
defoliants, and soil sterilants. Inorganic arsenic pesticides were stopped being applied on
USA crops in 1993. However, organic forms were allowed until 2009, when the
Environmental Protection Agency (EPA) issued a cancellation order to eliminate and
terminate gradually the use of organic arsenical pesticides by 2013. The only exception
was monosodium methanearsonate (MSMA), a broadleaf weed herbicide, which is still
allowed on cotton crops. Conversely, the herbicide disodium methanearsonate (DSMA,
or cacodylic acid), used on cotton fields was banned under the aforementioned EPA
organic arsenical product regulation [46,47]. Other organic arsenical products such as
roxarsone or arsanilic acid are used as animal feed additives to increase weight gain,
enhance productivity or disease control in the poultry and swine industries [48–51].
One of the main applications of this element has been as a preservative to protect
wood from microorganisms, fungi and insects. These products consist of a mixture of
arsenic oxides, chromium and copper. Chromated-copper-arsenate (CCA) has been
extensively used for several years in Europe and North America [52]. In 2003, CCA’s
manufacturers voluntarily discontinued producing this compound for homeowner users,
although no prohibition has been established and only recommendations to use the new
generation of preservatives has been advised by the EPA [53].
In addition, gallium and indium arsenides (GaAs and InAs) are important
semiconductor materials, which have different applications in laser devices, solar panels
or light-emitting diodes (LEDs). Besides, arsenic is also used as an additive in lead alloys
and, in small amounts, helps to inhibit brass corrosion [46,54].
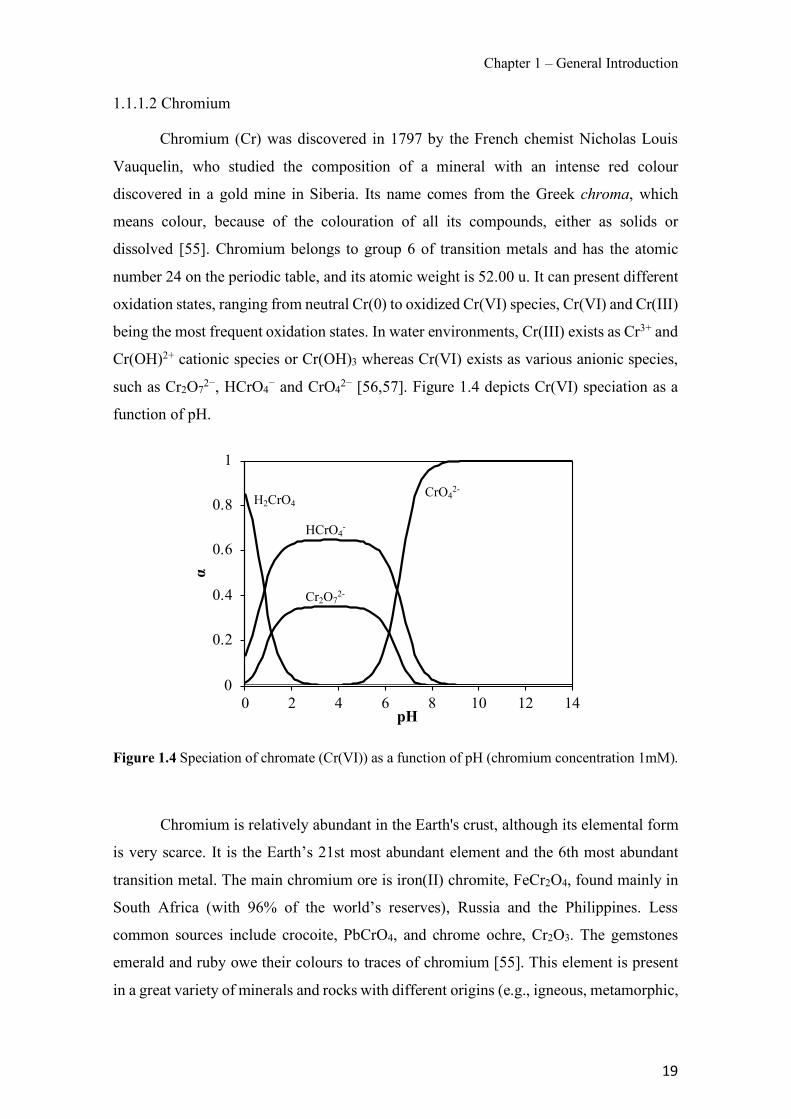
Chapter 1 – General Introduction
19
1.1.1.2 Chromium
Chromium (Cr) was discovered in 1797 by the French chemist Nicholas Louis
Vauquelin, who studied the composition of a mineral with an intense red colour
discovered in a gold mine in Siberia. Its name comes from the Greek chroma, which
means colour, because of the colouration of all its compounds, either as solids or
dissolved [55]. Chromium belongs to group 6 of transition metals and has the atomic
number 24 on the periodic table, and its atomic weight is 52.00 u. It can present different
oxidation states, ranging from neutral Cr(0) to oxidized Cr(VI) species, Cr(VI) and Cr(III)
being the most frequent oxidation states. In water environments, Cr(III) exists as Cr3+ and
Cr(OH)2+ cationic species or Cr(OH)3 whereas Cr(VI) exists as various anionic species,
such as Cr2O72−, HCrO4− and CrO42− [56,57]. Figure 1.4 depicts Cr(VI) speciation as a
function of pH.
Figure 1.4 Speciation of chromate (Cr(VI)) as a function of pH (chromium concentration 1mM).
Chromium is relatively abundant in the Earth's crust, although its elemental form
is very scarce. It is the Earth’s 21st most abundant element and the 6th most abundant
transition metal. The main chromium ore is iron(II) chromite, FeCr2O4, found mainly in
South Africa (with 96% of the world’s reserves), Russia and the Philippines. Less
common sources include crocoite, PbCrO4, and chrome ochre, Cr2O3. The gemstones
emerald and ruby owe their colours to traces of chromium [55]. This element is present
in a great variety of minerals and rocks with different origins (e.g., igneous, metamorphic,
0
0.2
0.4
0.6
0.8
1
0 2 4 6 8 10 12 14
α
pH
H2CrO4
HCrO4-
Cr2O72-
CrO42-
Chapter 1 – General Introduction
20
sedimentary) and its oxidation state and isotope composition provide valuable
information on the genesis, redox conditions and mineralization history of the Earth’s
materials [57].
The average concentration of chromium in ambient air is normally below 20 ng
m-3, although in indoor air areas with permitted cigarette smoking, this level can be
increased by 10 to 400 times. Soils usually contain 10 to 90 mg Kg-1 and chromium levels
in surface waters tend to oscillate between concentrations of less than 1 µg L-1 and up to
about 30 µg L-1, with an average value of 10 µg L-1 [58–60].
• Regulation and health implications
Cr(III) is considered an essential trace element for the proper functioning of living
organisms, whereas Cr(VI) is highly toxic and can produce mutagenic and carcinogenic
effects in humans. During wastewater treatment, the less toxic Cr(III) often changes its
oxidation state and turns into a more toxic species, Cr(VI). The toxicity of Cr(VI), which
has been reported to be 100-1000 times more toxic than Cr(III), is remarkable even at low
concentrations. Therefore, the WHO recommends a maximum level of Cr(VI) of 5 µg L-
1 in waste water. Moreover, many countries have regulations regarding the maximum
permissible concentration of Cr(VI) and total chromium in natural or drinking water. In
Spain, the permissible concentration of total chromium in drinking water is 50 µg L-1
[61].
• Uses of chromium
Nowadays, the global production of chromium is increasing as a result of the huge
range of different applications of this element. A great number of chromium applications
are related to enhancing the resistance of materials to physical and chemical agents. Some
of these applications are leather tanning, metallurgy, metal finishing, pigments, wood
protection, electroplating, catalysis and electrical and electronic equipment, or as a
magnetic agent (in the manufacture of audio or video tapes), despite its toxicity [62].
However, the main industry that benefits from the advantages of this phenomenon is the
galvanization industry, which makes coatings with a layer of chromium by means of an
electrolytic process. This process generates large volumes of residual water with a high
Cr(VI) content that must be treated [58]. Chromium can also enter drinking water supply
Chapter 1 – General Introduction
21
systems via corrosion inhibitors used in water pipes and containers or via contamination
of underground water leaching from sanitary landfill [63].
Other frequent applications are based on its resistance, as in the production of
stainless steel, which normally contains a minimum of 10.5% chromium (traditionally 11
or 12%). Thus, it has considerable corrosion resistance when compared to steels with a
lower percentage of this element. Its corrosion resistance is due to the formation of a self-
repairing passive layer of chromium oxide on the surface of stainless steel [64].
1.1.2 Zinc
Zinc (Zn), was first isolated by the German chemist Andreas Sigismund Marggraf
in 1746. Zinc is considered a post-transition metal and a moderately reactive metal and
strong-reducing agent. It belongs to group twelve and has the atomic number 30 on the
periodic table, and its atomic weight is 65.39 u. As it presents a d subshell with 2s
electrons, the divalent cation (Zn2+) is its only naturally occurring oxidation state.
However, the unusual oxidation state Zn(I) has also been reported [65]. Zinc can also
exist in a neutral or uncharged species, Zn(0). Besides, it has relative stability and the
ability to coordinate 4 or occasionally 6 ligands, and a capacity to act as a Lewis acid.
Zinc is the second most important transition metal in organisms after iron, and it
is considered a micronutrient, present in all tissues, organs and fluids in the organism
[66]. The relevance of zinc was first reported in 1869 due to its importance for the normal
growth of the common bread mould fungus Aspergillus niger [67].
Zinc is one of the most abundant elements on earth, ranking in 23rd place [68].
Zinc sulphide is the main component of the mineral sphalerite, which is the principal zinc
ore mineral in the world. Approximately 0.012% of the earth's crust is zinc [69]. The most
quoted range of total zinc in normal soils in 10–300 mg kg−1 with a natural mean level of
50 mg kg-1. However, total zinc content in soil depends upon the parent rock, weathering,
organic matter, texture and pH [70]. Soils formed from basic rocks such as basalt present
greater zinc content than those from acid rocks such as granite or gneisses. Zinc can be
present in soils in a variety of chemical forms that can be classified in five different pools:
water soluble, exchangeable, adsorbed, chelated or complexed zinc. Zinc is of paramount
importance in terms of plant nutrition [70]. The factors that control the amount of zinc
available for plants are the total zinc content, clay content, calcium carbonate content,
redox conditions, and microbial activity in the rhizosphere, soil moisture status,
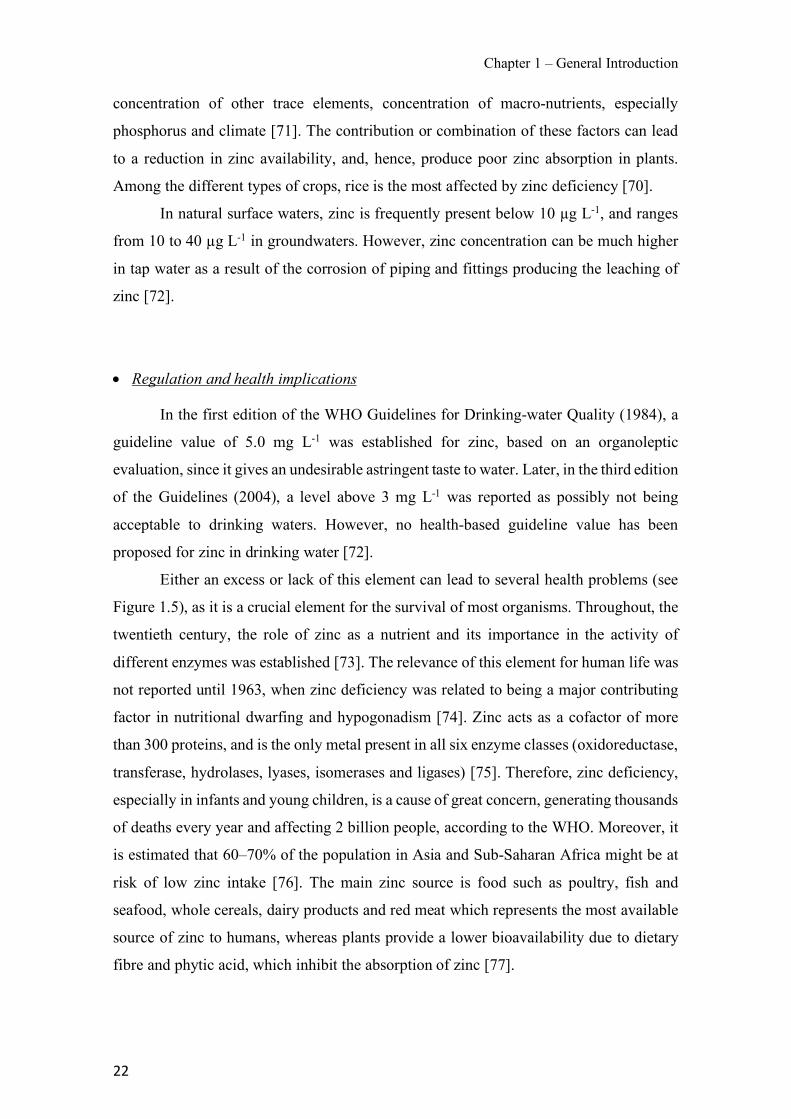
Chapter 1 – General Introduction
22
concentration of other trace elements, concentration of macro-nutrients, especially
phosphorus and climate [71]. The contribution or combination of these factors can lead
to a reduction in zinc availability, and, hence, produce poor zinc absorption in plants.
Among the different types of crops, rice is the most affected by zinc deficiency [70].
In natural surface waters, zinc is frequently present below 10 µg L-1, and ranges
from 10 to 40 µg L-1 in groundwaters. However, zinc concentration can be much higher
in tap water as a result of the corrosion of piping and fittings producing the leaching of
zinc [72].
• Regulation and health implications
In the first edition of the WHO Guidelines for Drinking-water Quality (1984), a
guideline value of 5.0 mg L-1 was established for zinc, based on an organoleptic
evaluation, since it gives an undesirable astringent taste to water. Later, in the third edition
of the Guidelines (2004), a level above 3 mg L-1 was reported as possibly not being
acceptable to drinking waters. However, no health-based guideline value has been
proposed for zinc in drinking water [72].
Either an excess or lack of this element can lead to several health problems (see
Figure 1.5), as it is a crucial element for the survival of most organisms. Throughout, the
twentieth century, the role of zinc as a nutrient and its importance in the activity of
different enzymes was established [73]. The relevance of this element for human life was
not reported until 1963, when zinc deficiency was related to being a major contributing
factor in nutritional dwarfing and hypogonadism [74]. Zinc acts as a cofactor of more
than 300 proteins, and is the only metal present in all six enzyme classes (oxidoreductase,
transferase, hydrolases, lyases, isomerases and ligases) [75]. Therefore, zinc deficiency,
especially in infants and young children, is a cause of great concern, generating thousands
of deaths every year and affecting 2 billion people, according to the WHO. Moreover, it
is estimated that 60–70% of the population in Asia and Sub-Saharan Africa might be at
risk of low zinc intake [76]. The main zinc source is food such as poultry, fish and
seafood, whole cereals, dairy products and red meat which represents the most available
source of zinc to humans, whereas plants provide a lower bioavailability due to dietary
fibre and phytic acid, which inhibit the absorption of zinc [77].
Chapter 1 – General Introduction
23
Figure 1.5 Effects of either a high (left side) or low zinc intake (right side) on human health [78].
• Uses of zinc
Considering tonnage production, it occupies the fourth position in the entire
world’s metal production, after iron, aluminium and cooper. About 75 % of this element
is consumed as a metal used for galvanizing iron or steel to protect them from corrosion,
for the production of corrosion-resistant alloys and brass, as a zinc-based die and as rolled
zinc. The remaining 25 % is dedicated to the production of fertilizers or pesticides (zinc
carbamate), to rubbers used as a white pigment (ZnO), and to various chemical and paint
industries [68,72].
1.1.3 Pesticides
A pesticide is a chemical or biological substance designed to kill or retard the
growth of pests that damage or interfere with the growth of crops, shrubs, trees, timber

Chapter 1 – General Introduction
24
and other vegetation desired by humans [79]. They act by interfering with a variety of
biochemical and physiological processes that are common to a wide range of organisms.
The term pesticide includes, amongst others: herbicides, fungicides, insecticides,
acaricides, nematicides, molluscicides, rodenticides, growth regulators, repellents and
biocides. Therefore, target pests can include insects, plant pathogens, weeds, molluscs,
nematodes (roundworms), and microbes that cause nuisances, spread disease or are
vectors for disease [80,81].
Pesticides may be organic or inorganic compounds. Organic pesticides belong to
a variety of substance classes, including N- and P-containing compounds. Based on their
chemical family, the different molecules of organic pesticides may be grouped into
classes, such as organophosphates, carbamates, pyrethroids or organochlorine
compounds. Conversely, inorganic pesticides are copper or arsenic-containing products,
or, to a lesser extent, zinc- and mercury-based compounds [82]. The different chemical
families present diverse toxicities and environmental persistency as will be commented
upon later.
In the context of the escalating challenges of population growth, placing pressure
on energy resources, the environment and global food supplies, agrochemicals have
gained an important role as they are used not only to protect crops but also to enhance
crop yields [83]. From the 1940s onwards, a further increase in food production was
allowed by the introduction of synthetic crop protection chemicals; in other words, the
use of pesticides was advisable to maintain high levels of food production.
The use of pesticides is not equal across the world due not only to the cost of the
chemicals (most of them patented), but also to the cost of manpower and the specific pests
of each climatic/geographic region. The Food and Agriculture Organization (FAO) has
computed the average application rates of pesticides per hectare (ha) of arable land, 6.5–
60 kg/ha being the highest average values occurring in Asia and in some countries of
South America. However, in North America and West Europe, the use of herbicides,
intensively applied in agriculture and in urban areas, has experienced a boom in the last
decades. In Asia, the use of herbicides has remained low and contrasts with the use of
insecticides, which is still very high [84].
On a global scale, worldwide pesticide production increased at a rate of about 11%
per year, from 0.2 million tons in 1950s to almost 6 million tons by 2005 [85]. The value
of expenditure on pesticides in 2008 was 48.8 billion United State Dollar (USD)
compared to 55.9 billion USD achieved in 2012. In that year, herbicides, including plant
Chapter 1 – General Introduction
25
growth regulators, were in first place and represented 44% of the total value, followed by
insecticides, which accounted for about 29% of the total expenditure, fungicides (26%)
and other pesticides, such as nematicides, fumigants, and other miscellaneous pesticides
(1 %) [86]. The total quantity of pesticide sales in Europe for 2013 was close to 360,000
tonnes, and among the different EU Member States, Spain (19.5%), France (18.7%), Italy
(13.8%), Germany (12.3%) and Poland (6.2%) accumulated up to 70.5% of EU pesticide
sales [87].
Early synthetic pesticides developed to control agriculture pests, such as DDT,
prohibited in 1972, or lindane (i.e. gamma-hexachlorocyclohexane, γ-HCH), prohibited
in 2008, both belonging to the organochlorine class, were intensively used for the control
of cattle ticks and human parasites in North America or Europe, and, despite their current
prohibition, they are still popular food preservatives for sun-dried fish in South Asia and
remain in use, sometimes illegally, to control malaria vectors and household pests in
urban areas in the tropics [84]. The reason for the prohibition of the aforementioned
pesticides is due to their persistence and to the fact that these compounds could give rise
to harmful effects on human health or the environment. Persistence is defined by IUPAC
[88] as the residence time of a chemical species in a specifically defined compartment of
the environment and which presents bio-accumulative properties which contribute to
spreading these compounds in the environment. Therefore, it is of paramount importance
to control them in a wide variety of samples [89–91].
Nowadays, the EU aims to achieve a sustainable use of pesticides throughout the
European Union through Directive 2009/128/EC. This Directive seeks to reduce the risks
and impacts of pesticide use on human health and the environment, and promote the use
of integrated pest management and alternative approaches or techniques, such as non-
chemical alternatives to pesticides [92].
Pesticides can be introduced in the aquatic system due to different processes such
as surface water runoff, rainwater or melted snow which can transport pesticides into
deeper soil and into underground water supplies, accidental spills or irresponsible
dumping of these kinds of chemicals, or by either an excessive or improper application
of these products near freshwater sources [93]. Among the different economic sectors,
agriculture represents the main cause of degradation of water resources since it demands
the highest amount of fresh water (70% of world consumption) [94].
A great number of pesticides are included in the monitoring schedule of most
western countries. However, the cost of analysis and the necessity to sample at critical
Chapter 1 – General Introduction
26
times of the year, linked to periods of pesticide use, produces a lack of extensive data
[95]. According to the Stockholm Convention on Persistent Organic Pollutants, 9 of the
12 most dangerous and persistent organic chemicals are pesticides [96]. In Europe, the
WFD has set 0.1 µg L-1 as the maximum concentration permitted for individual pesticides
in waters intended to be used for drinking purposes [12]. However, it is still challenging
for regulatory agencies to understand the potential effects of chemical mixtures on
humans and the environment, and, although guidelines evaluating the possible effects
from exposure to chemical mixtures have been provided, their implementation is difficult
due to the complexity of mixtures that occur in the environment and the inadequacy of
data on their toxicity [97].
In 2012, the European Commission released a communication on the combined
effects of chemicals, to ensure that risks associated with chemical mixtures are properly
understood and assessed, and to state the current limitations of evaluating compounds
individually. It highlights that EU have strict policies for individual chemicals but their
combination is rarely assessed [98].
With regard to human health risks, pesticides can pose a threat depending on how
toxic they are, the amount present in water, and how much exposure occurs on a daily
basis. Health effects depend on the type of pesticide; for example, in the case of
organophosphates and carbamates, these kinds of compounds affect the nervous system.
There are others that can cause skin or eye irritation and some can be carcinogenic [97].
The studies conducted as part of this thesis are focused on two organophosphate
(OPs) insecticides, namely chlorpyrifos (CP) and diazinon (DZ), and one fungicide which
belongs to the chemical class of aminopyrimidines, cyprodinil (CYP).
OPs emerged from wartime research on nerve gases. OPs block cholinesterase,
the chemical that transfers nerve impulses across synapses, and so their effect is primarily
on the nervous system. The advantage of OPs is that they are rapidly degraded in the
environment to non-toxic secondary compounds, unlike organochlorines (OCs) [99].
CP is recognized as a priority pollutant by WFD [12], and considered hazardous
to humans by the WHO, as more than 10,000 CP-related human deaths are reported per
year [100]. In the case of DZ, it has been classified by IARC as "probably carcinogenic
to humans". The Agricultural Health Study cohort has linked exposure to this pesticide
with a higher risk of leukaemia. DZ-induced DNA or chromosomal damage in rodents
and in human and mammalian cells in vitro [101].

Chapter 1 – General Introduction
27
Aminopyrimidines play an important role in biological processes, as the
pyrimidine ring is present in several vitamins, nucleic acids and coenzymes. They
interfere with the biosynthesis of methionine and other aminoacids and inhibit the
secretion of hydrolytic enzymes. Nevertheless, fungi treated with these kinds of
compounds tend to create resistance [102,103]. It has been reported that CYP is able to
cause slight acute toxicity [104].
There are many difficulties linked to controlling pesticides as they are
mainly found in low quantities in the environment. This is even more of a problematic
issue in many developing countries as it requires highly flexible field and laboratory
programs responding to periods of pesticide application, discrimination between those
pesticides that appear as artifacts of historical use versus those that are currently being
used, and the need for detection levels that have meaning for human health and ecosystem
protection [97].
1.2 Determination of pollutants in waters
As previously explained, the aquatic environment might contain several
metallic/metalloid species or other toxic pollutants due to both natural and anthropogenic
activities. All these contaminants are increasingly under the spotlight and even though
they might be present at trace levels, their adverse effects on animals, aquatic life and
even humans are cause for great concern [105,106]. Therefore, it is of utmost relevance
to employ very sensitive analytical techniques to satisfy environmental regulations.
1.2.1 Metal and metalloid determination
Depending on the cost, sample throughput, sensitivity and detection limit,
concentration range, matrices, and regulation requirements, different instruments can be
selected for a wide range of environmental applications.
Most inexpensive and widespread methodologies for the determination of metals
and metalloids are based on colorimetric methods. In the case of arsenic, molybdenum
blue, silver diethyldithiocarbamate (SDDC) or leuco malachite green methods are the
most used. In the molybdenum blue method, As(V) reacts with Mo(VI) to form a
Chapter 1 – General Introduction
28
characteristic blue complex in which its typical absorbance can be measured with a
spectrophotometer at 865 nm [107]. In the SDDC method, arsenic is reduced to arsine,
which is absorbed in a SDDC solution prepared in chloroform or pyridine. The red-violet
complex is formed as a result and measured at 510-525 nm [108]. The leuco-malachite
green method is based on the reaction between arsenic and potassium iodide in acidic
conditions to liberate iodine, which selectively oxidises leuco-malachite green into
malachite green dye, measured at 617 nm [109].
The necessity to ensure sufficient detection limits has originated the combination
of these colorimetric methods with other enrichment/preconcentration steps so as to
enhance the applicability with environmental samples.
In the case of chromium, the most widely used spectrophotometric method is
based on the selective reaction of diphenylcarbazide (DPC) with Cr(VI) at pH 1 [56],
whereas in the case of zinc, the reagent (2-carboxy-2'-hydroxy-5'-sulfoformazylbenzene)
(Zincon) has traditionally been used for its rapid determination [110].
Atomic spectroscopy and spectrometry techniques are the most popular for trace
metal analysis, and they have been extensively employed for the determination of
elements, such as the ones studied in this thesis (i.e. arsenic, chromium, zinc).
For instance, in the case of arsenic, a great number of highly sensitive analytical
techniques have been employed to determine total arsenic in environmental samples at
µg L-1 level, such as graphite furnace atomic absorption spectrometry (GFAAS)
[111,112], hydride generation atomic absorption spectrometry (HG-AAS) [113–115],
hydride generation atomic fluorescence spectrometry (HG-AFS) [116–119], neutron
activation analysis (NAA) [120], inductively coupled plasma atomic emission
spectrometry (ICP-AES) [121] or inductively coupled plasma mass spectrometry (ICP-
MS) [122,123]. When using ICP-AES, arsenic determination can suffer from spectral
interferences at high concentrations of titanium, iron, manganese or chromium due to
vacuum ultraviolet lines (under 200 nm) and also high concentration of vanadium and
chromium due to ultraviolet lines [124]. Conversely, ICP-MS provides higher precision
and the capability to reach lower detection limits. However, samples with high amounts
of chloride (Cl-), can cause interference given that when chloride and argon combine in
the plasma they form argon chloride (40Ar35Cl), which has similar mass to arsenic (75As).
These types of interferences can be overcome by using mathematical correction
equations, high-resolution detectors or a collision/reaction cell [125,126]. In addition,
arsenic can suffer from poor ionization in the plasma, which can cause a problem when
Chapter 1 – General Introduction
29
analysing low concentrations of arsenic in environmental samples. Some possibilities of
enhancing the sensitivity of the analysis exist, such as the addition of a certain amount of
methanol, ethanol or other C-containing compounds, to enhance the ionization of arsenic
in the plasma [127]. Another approach is hydride generation, which is frequently used
not only to avoid matrix interferences but also to enhance the detection limits of the
method. It is based on the reaction of arsenic with a reducing reagent such as sodium
borohydride to form a volatile arsenic hydride, which is then transported to the plasma,
ensuring a more efficient sample introduction to the system [128].
The determination of chromium and zinc in liquid samples at low levels can also
be achieved by means of spectroscopic techniques such as GFAAS, ICP-AES, ICP-MS
or NAA [63,129]. In the case of chromium, various potential spectral interferences can
occur at high concentrations of tungsten and cobalt when analysing by ICP-AES [130].
Moreover, the analysis of this metal by ICP-MS can also present some interferences
specially when matrices contain high levels of chloride or carbon leading to the formation
of polyatomic ions such as 35Cl16OH+, 40Ar12C+ or 37Cl14NH+, which interfere with the
detection of 52Cr [131]. These interferences can also be overcome using the
aforementioned approaches as in the case of arsenic.
1.2.2 Pesticide determination
The correct selection of the methodology for the determination of pesticides
depends on the sample matrix and on the structure and properties of the target compounds.
Indeed, when considering the lowest permissible levels of pesticides in various matrices,
it is highly important to select sensitive and selective analytical techniques. Conventional
methods for pesticide determination are described by EPA and can be divided into three
groups: (i) the ones based on the use of gas chromatography (GC) with selective detection
(e.g. electron capture detector (ECD) or nitrogen phosphorous detector (NPD)), (ii) those
which use gas chromatography mass spectrometry (GC-MS) and (iii) those which use
liquid chromatography (LC) with fluorescent or diode array detection [132,133].
Nowadays, several multiresidue methods have been developed either based on GC or
HPLC coupled to high-resolution mass spectrometry (HRMS) [134,135]. However, often
due to long time analysis, effort required and the need for large volumes of organic
solvents, these methods do not meet expectations and are, therefore, combined with
different preconcentration techniques.
Chapter 1 – General Introduction
30
1.3 Speciation studies
The International Union of Pure and Applied Chemistry (IUPAC) defines
speciation analysis as analytical activities of identifying and/or measuring the quantities
of one or more individual chemical species in a sample. The different species can consider
differences at the levels of isotopic composition, electronic or oxidation state, inorganic
and organic compounds and their complexes, organometallic species, and
macromolecular compounds and complexes [136].
Speciation studies can be achieved by means of chromatographic techniques. In
such cases, separation is accomplished by chromatography (GC, HPLC, ion
chromatography) or capillary electrophoresis (CE), and detection by sensitive
spectroscopy or spectrometry techniques (ICP-AES and ICP-MS) resulting in hyphenated
techniques. (IC). For instance, separation of chromium species (Cr(VI) and Cr(III)) is
achieved by means of an anion-exchange column and detection with ICP-MS. Cr(III)
cation is previously derivatized by the addition of a ligand that does not form a complex
with Cr(VI) species [137]. In the case of arsenic, the use of an ion-pair reversed phase
HPLC hyphenated with ICP-MS has allowed the separation and determination of eight
arsenic species including As(III), As(V), MMA, DMA, trimethylarsinoxide (TMAO),
tetramethylarsonium (Tetra), arsenocholine (AsC) and AsB [126].
Other approaches are based on the separation of the metal species from the
solution by adsorption on a solid such as ion exchange or complexing resins or liquids
supported on solids. Different strategies based on solid extraction can be performed to
achieve speciation: i) the use of an adsorbent that retains the different species and then,
the selective elution by using the appropriate elutant solutions [138]; ii) the use of
functionalized sorbents that selectively retain one species while the other species remains
in solution [139]; iii) the combination of a selective adsorption (under appropriate pH
conditions of the medium) with a selective elution [140]. Many examples of different
applications can be found in the literature. In the case of chromium, the use of chitosan-
modified magnetic nanoparticles exhibit excellent adsorption performance for Cr(III) at
pH 9 and total Cr (Cr(III) and Cr(VI)) at pH 6, thus allowing its speciation [141]. Another
approach consists of the selective extraction of a Cr(VI)-APDC chelate by multiwalled
carbon nanotubes (MWNTs). The total chromium content is determined by a previous
oxidation of Cr(III) to Cr(VI) by using hydrogen peroxide [142]. In the case of arsenic,
several methodologies have been reported [143,144], which allow the speciation of
Chapter 1 – General Introduction
31
inorganic arsenic species. Chen et al. [143] used ordered mesoporous silica micro-
columns modified with 3-(2-aminoethylamino) propyltrimethoxysilane for inorganic
arsenic speciation, since only As(V) was selectively adsorbed on the micro-column
within the pH range 3–9, whereas Xiong et al. [144] used a micro-column packed
with CTAB-modified alkyl silica sorbent where only the negatively charged As(V) was
adsorbed at the studied pH. In both studies, the total inorganic arsenic was obtained after
As(III) oxidation.
In effect, there are essential elements for living organisms, such as boron, silicon,
selenium or zinc, which carry out important physiological functions, as they are part of
different biologically relevant molecules. Living organisms obtain these dissolved trace
metals from the soluble forms in sediments or water where they can be found in various
chemical species, such as free ions, inorganic or organic complexes. However, not all
metal species are available, and therefore, a lack or an excess of these elements can
generate severe consequences for living organisms. In this context, availability can be
defined as the fraction of the total metal in the water column or sediment compartments
that is unbound, free, or available for uptake by an organism [145]. In the case of cationic
metals the general consensus is that the concentration of the free metal ion is the best
predictor for both metal bioaccumulation and toxicity in aquatic systems [146].
Information about the free metal ion or labile species can be obtained by means of
different techniques. Electrochemical methods have been used for metal speciation,
namely anodic stripping voltammetry (ASV), which is based on metal reduction at the
mercury electrode at deposition potential [147], competitive ligand equilibration-
adsorptive cathodic stripping voltammetry (CLE-AdCSV), which is an indirect method
that detects an electrochemically active complex formed between a metal and a well-
characterized organic ligand added to the sample [148], stripping chronopotentiometry
(SCP), where ions are reduced at a constant potential for a fixed period of time and
subsequently stripped to quantify the accumulated metal [149] and absence of gradient
Nernstian equilibrium stripping (AGNES), which is specially designed for the analysis of
free metal ions [150].
Other approaches have recently been developed, such as Donnan membrane
techniques (DMT), diffusive gradient in thin-film gels (DGT), Chemcatcher® and liquid
membranes (LMs) [151]. DMT is based on the distribution of metal ions among phases
for the determination of free metal ion in non-perturbed samples [152]. In the case of
DGT, the flux of metal ions through a porous gel matrix into an underlying layer of
Chapter 1 – General Introduction
32
complexing cation exchange beads is used for the quantification of the concentration of
labile metals [153], whereas Chemcatcher® is formed by a chelating disk receiving phase
overlaid with a cellulose acetate (CA) diffusion-limiting membrane for the accumulation
by diffusion of the labile fraction of metals with minimal disturbance of the system [154].
In LM systems, the membrane is a liquid, which is immiscible with both the feed (i.e.
donor) and stripping (i.e. receiving) solutions and serves as a semipermeable barrier
between these two liquid or gas phases, allowing the selective transport of gases, ions or
molecules [155]. Different types of LMs have been proposed, but the most used
configuration for speciation studies consists of the organic phase impregnating the pores
of a thin, macroporous hydrophobic support. Selectivity and transport efficiency in a LM
can be improved by the addition of an extractant (i.e carrier). This technique has been
used in different geometries such as flat-sheet membranes or as hollow fibre (HF). Bayen
et al. [156] studied the flux of Ni species in the presence of different organic ligands, such
as tartrate, glycine or oxalate, using a flat-sheet LM containing a mixture of 1,10-didecyl-
1,10-diaza-18-crown-6 ether (22DD) and di(2-ethylhexyl)phosphoric acid (D2EHPA) in
toluene/phenylhexane. They demonstrated that the proposed LM system was a reliable
tool to measure free nickel concentrations in the presence or absence of ligands, rather
than the total concentration of Ni. Likewise, Slaveykova et al. [157] also used a flat-sheet
LM containing 22DD and lauric acid dissolved in a mixture of toluene/phenylhexane to
meaure Pb fluxes in the absence and presence of tiron and nitrilotriacetic, iminodiacetic,
malonic, citric, polyacrylic and fulvic acids. Other authors have used a LM using HF
geometry in order to measure lower amounts of metal in the absence and presence of
complexing agents. HF geometry allows us to measure down to 10−9 M of free Cd species
compared to 10−8 M using a flat-sheet LM [158]. In the case of zinc, Gramlich et al.
developed a LM, with a HF configuration, containing 22DD and lauric acid, for the
measurement of free Zn species in the presence of organic ligands, such as
ethylenediaminetetraacetate or citrate. However, when L-histidine was added, higher than
calculated free Zn concentrations were measured suggesting that positively charged
complexes contributed to the metal flux [159]. Moreover, other authors have reported an
LM with HF configuration to determine free zinc concentration in three water samples
from a mining area, reaching enrichment factors of around 700 in the stripping phase
[160].
Chapter 1 – General Introduction
33
1.4 Separation and preconcentration processes
As previously stated, sample treatment is sometimes required not only to achieve
very low limits of detection (in order to satisfy the corresponding environmental policy
requirements), but also to remove matrix interferences.
One of the most traditional techniques for separation is liquid-liquid extraction
(LLE) consisting of the transfer of a solute from one solvent to another, the two solvents
being immiscible with each other. Water or an aqueous mixture and a non-polar organic
liquid are frequently used as solvents. LLE comprises a step of mixing followed by a step
of phase separation. Both steps are crucial in terms of solvent selection and modes of
operation. Equilibrium is reached when the chemical potential of the extractable solute is
the same in the two phases, leading to the definition of a “distribution coefficient” (K),
which indicates the relative preference of the solute for the solvents, as shown in Eq.
(1.2):
# = [&]()*[&]+,
(1.2)
where [A]org and [A]aq are the equilibrium concentrations of the solute in the
organic and aqueous phases, respectively. For the extraction of neutral compounds, the
organic phase consists solely of a solvent. However, for ionic organic compounds or
inorganic cations and anions, the presence of an additional compound, called extractant,
is required. The proper selection of the extractant is a key parameter to achieve an
efficient extraction. The extractant is responsible for binding with the species of interest
by means of different mechanisms, such as ion exchange, solvation or chelation. A list of
available extractants is further detailed in section 1.5.
LLE presents some advantages, such as ease of operation and simplicity of the
method. However, LLE implies the use of high amounts of organic solvents (e.g.,
dichloromethane, hexane, petroleum ether, among others) and the risk of emulsion
formation during agitation. This fact has led to the replacement of this extraction
technique by other more environmentally-friendly alternatives [161]. This is the case of
LMs where the small volume of organic phase encompasses the reduction of the amount
of organic solvent employed and allows the use of expensive and tailor-made extractants
[162,163]. LMs have been used for the separation and preconcentration of both organic
Chapter 1 – General Introduction
34
[164] and inorganic species [165]. For instance, in the case of organic compounds, LMs
have been employed for the transport and preconcentration of the herbicide glyphosate
and its main metabolite using a LM consisting of 0.2 M Aliquat 336 in dodecane modified
with 4% dodecanol [166]. A LM with the same components was also used for the
separation of arsenic species at pH= 13. Even though both As(III) and As(V) are present
as anionic species at this basic pH and were quantitatively extracted by an anion-exchange
mechanism by LLE, when using the LM and HCl as stripping phase only As(V) was
transported due to differences in the extraction kinetics of arsenate and arsenite at this pH
[167]. Besides, a LM with a HF geometry was also developed for the removal and
preconcentration of chromium species, namely Cr(VI), using Aliquat 336 as carrier and
a diluted HNO3 solution as stripping. This methodology allowed both the separation and
enrichment of the metal in the stripping phase [61].
Other techniques that are used to achieve both separation and preconcentration are
liquid-phase microextraction (LPME), single drop microextraction (SDME), dispersive
liquid-liquid microextraction or cloud-point extraction (CPE), amongst others. These
techniques have been applied for the determination of different metallic species [168,169]
as well as for the determination of organic compounds [170,171].
Another approach for the preconcentration of target species relies on the sorption
of analytes on a solid sorbent (solid phase extraction, SPE). The solid phase usually
consists of small porous particles of silica, with or without bonded organic chains, organic
polymers and ion exchangers. Depending on the kind of solid phase employed, the
extraction mechanism can be adsorption, partitioning or an ion exchange. Compared to
LLE systems, solid sorbents are faster and provide high enrichment factors and they can
also be used for the extraction of both organic and inorganic compounds. The most
commonly used SPE sorbents reported in the literature for the determination of organic
compounds are alkyl-bonded silicas, such as octacedcyl (C18) or octyl-bonded silica, and
copolymer sorbents like cross-linked polystyrene-divinylbenzene (PS-DVB) resins such
as the Amberlite XAD series, in-house hypercross-linked polymeric sorbent and
hydrophilic lipophilic balanced polymers, such as Oasis HLB, which form the monomers
divinylbenzenevinylpyrrolidone (DVB) and N-vinylpyrrolidone. Different applications
of these solid sorbents are reported in the literature [172].
However, these solid sorbents might not be well suited for the retention of species
when these are polar or ionic, in particular in the case of inorganic compounds For this
reason, they are modified with functional groups responsible for the extraction of the
Chapter 1 – General Introduction
35
target compound. As previously mentioned, different methodologies have been reported
not only for the speciation but also for the preconcentration of inorganic arsenic species,
which can be achieved by means of silica modified with 3-(2-aminoethylamino)
propyltrimethoxysilane [143], or by using cetyltrimethylammonium bromide (CTAB)-
modified alkyl silica [144], after the corresponding oxidation of As(III) to As(V).
Chromium species have been extracted with PS-DVB functionalized with 2-Naphthol-
3,6-disulfonic acid from waste waters by adjustment of the pH [173] or by using a
polymeric sorbent containing aminocarboxylic groups [174]. Moreover, Cr(VI) species
can be extracted and preconcentrated from water samples using activated alumina,
tributyltin chloride immobilized on C18 cartridges, ion-exchange columns and DPC
immobilized on silica [63]. Zinc has been extracted with XAD-4 loaded with APDC, or
Chelex-100, where iminodiacetate functional groups are bound to polystyrene [175].
Other solid sorbents used for the extraction of inorganic species are based on the
use of oxides such as alumina A12O3 and magnesia MgO, among other oxide species. In
the case of arsenic adsorption, different solid sorbents such as iron oxides or zero-valent
iron [176,177], modified calcinated bauxite [178], hydrotalcite [179], and titanium
dioxide (TiO2) [180] among others [181], have also been used. An extensive list of
different TiO2-based materials for the adsorption of arsenic species can be found in the
literature [182]. TiO2 solid sorbent allows the adsorption of both inorganic arsenic species
without a further oxidation step. This solid can act as a photocatalyst and adsorbent of
As(III)/organic arsenic in the presence of UV light or sunlight irradiation or only as
adsorbent in the absence of irradiation. TiO2 has been used in different forms such as
nanotubes, nanocrystalline particles, hydrous or granular or impregnated in chitosan beds,
among others.
Solid-phase microextraction (SPME) was introduced in the early nineties by
Professor Janusz Pawliszyn [183] as an alternative to SPE for the extraction of organic
compounds. The commercial SPME device contains a fused silica fibre coated with a
suitable stationary phase polymer, polydimethylsiloxane (PDMS), polyacrylate (PA), and
also mixtures of polydimethylsiloxane and polydivinylbenzene (PDMS-DVB), carbowax
and polydivinylbenzene (CW-DVB) being the most common [161]. This technique has
been extensively used for the determination of different organic compounds [184,185].
Likewise, stir-bar sorptive extraction (SBSE) consisting of a magnetic stirrer coated with
a thick layer of PDMS, where the target compounds are extracted, has been employed
showing greater sorption capacity compared to SPME fibres [161,186].
Chapter 1 – General Introduction
36
Recently, other sorbent-based microextraction techniques have also been explored
using magnetic molecularly imprinted polymers [187], silicone rods and silicone tubes
[188] or HF [189].
1.5 Polymer Inclusion Membrane (PIM)
Among the different sample treatments, membrane-based processes have attracted
noticeable attention as a valuable alternative to conventional separation processes [190].
In general, a membrane can be defined as a semipermeable barrier between two phases
[191]. The membrane restricts the movement of the different molecules through various
mechanisms such as size exclusion, differences between diffusion coefficients, electric
charge, among others [192]. Membranes can be classified by the driving force that causes
the flow of the analytes through the membrane [193]: pressure difference across the
porous membrane (i.e. reverse osmosis, ultrafiltration, microfiltration, membrane gas and
vapour separation), temperature difference across the membrane (i.e. membrane
distillation), concentration difference across the membrane (i.e. dialysis, membrane
extraction), electric potential difference across the membrane (i.e. electrodialysis) and
chemical potential difference across the membrane (i.e. liquid membrane, LM). In
contrast to osmotic, dialysis, filtration or size-exclusion type membranes, LMs rely on
the action of a chemical agent to extract the solute of interest from an aqueous phase
[162]. The carrier is usually solubilized in an organic solvent and different types of LMs
have been described, depending on whether they only contain liquid phases or the liquid
phase is retained in a polymeric support. Bulk liquid membrane (BLM) consists of a bulk
aqueous feed and stripping phases separated by a bulk organic, water-immiscible liquid
phase. Emulsion liquid membrane (ELM) is prepared from the mixture between the
aqueous feed solution and an emulsion, which is formed by the stripping solution, an
organic solution and the suitable surfactant. In this kind of membranes, the stripping
solution is emulsified in an immiscible LM, which is dispersed in the feed solution
allowing the mass transfer from the feed into the internal stripping phase. Supported
liquid membranes (SLMs) are usually constituted with the mobile carrier and the organic
solvent, in the pores of a solid microporous support, where it is retained by capillarity.
SLMs have been extensively studied since they offer high transport rates and good
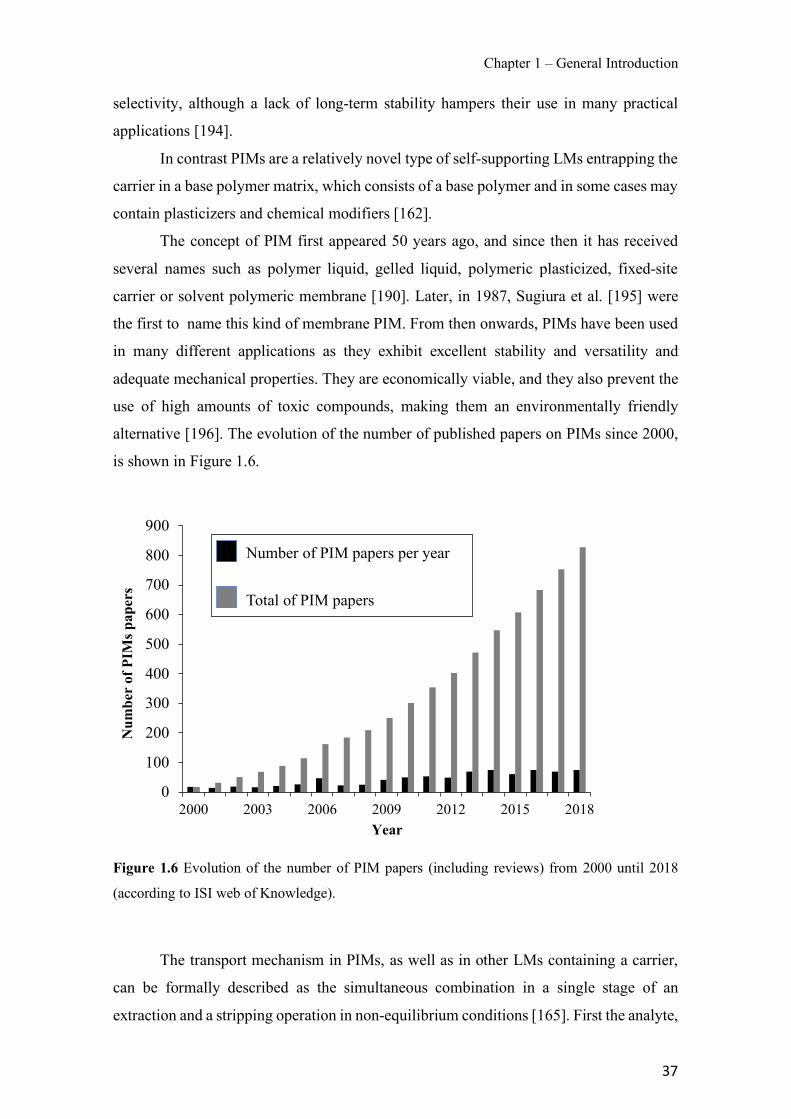
Chapter 1 – General Introduction
37
selectivity, although a lack of long-term stability hampers their use in many practical
applications [194].
In contrast PIMs are a relatively novel type of self-supporting LMs entrapping the
carrier in a base polymer matrix, which consists of a base polymer and in some cases may
contain plasticizers and chemical modifiers [162].
The concept of PIM first appeared 50 years ago, and since then it has received
several names such as polymer liquid, gelled liquid, polymeric plasticized, fixed-site
carrier or solvent polymeric membrane [190]. Later, in 1987, Sugiura et al. [195] were
the first to name this kind of membrane PIM. From then onwards, PIMs have been used
in many different applications as they exhibit excellent stability and versatility and
adequate mechanical properties. They are economically viable, and they also prevent the
use of high amounts of toxic compounds, making them an environmentally friendly
alternative [196]. The evolution of the number of published papers on PIMs since 2000,
is shown in Figure 1.6.
Figure 1.6 Evolution of the number of PIM papers (including reviews) from 2000 until 2018
(according to ISI web of Knowledge).
The transport mechanism in PIMs, as well as in other LMs containing a carrier,
can be formally described as the simultaneous combination in a single stage of an
extraction and a stripping operation in non-equilibrium conditions [165]. First the analyte,
0
100
200
300
400
500
600
700
800
900
2000 2003 2006 2009 2012 2015 2018
Num
ber
of P
IMs p
aper
s
Year
Number of PIM papers per year
Total of PIM papers
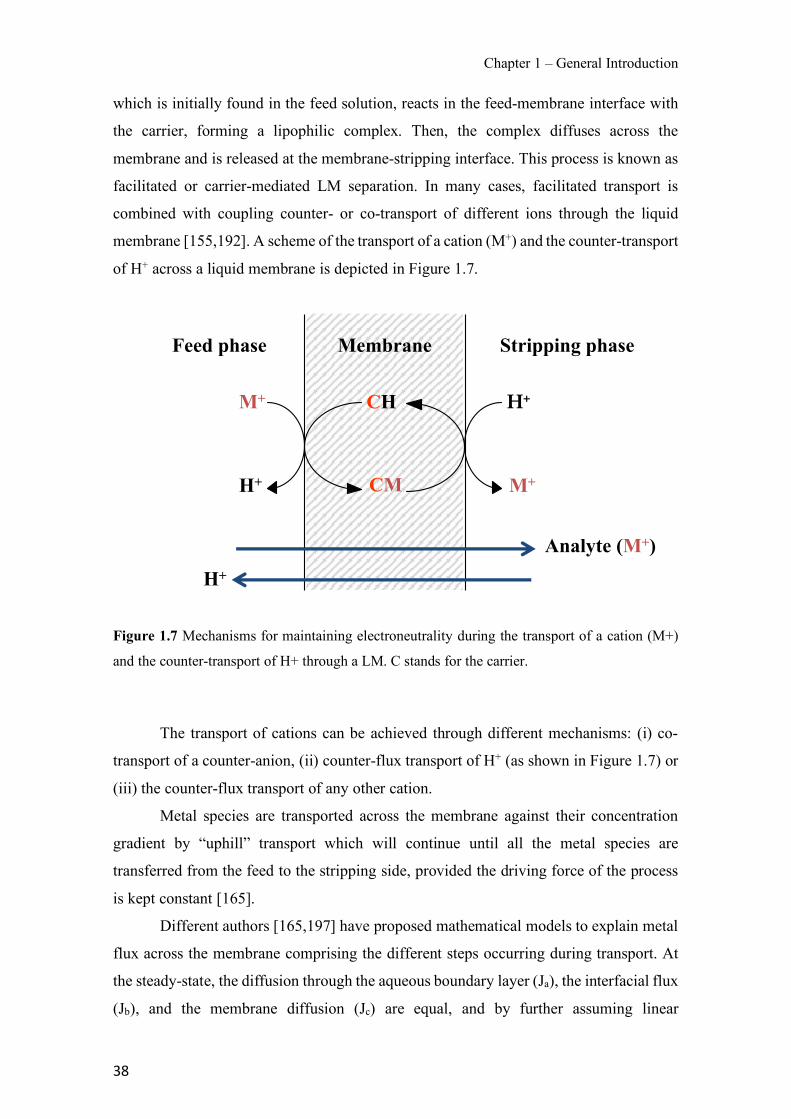
Chapter 1 – General Introduction
38
which is initially found in the feed solution, reacts in the feed-membrane interface with
the carrier, forming a lipophilic complex. Then, the complex diffuses across the
membrane and is released at the membrane-stripping interface. This process is known as
facilitated or carrier-mediated LM separation. In many cases, facilitated transport is
combined with coupling counter- or co-transport of different ions through the liquid
membrane [155,192]. A scheme of the transport of a cation (M+) and the counter-transport
of H+ across a liquid membrane is depicted in Figure 1.7.
Figure 1.7 Mechanisms for maintaining electroneutrality during the transport of a cation (M+)
and the counter-transport of H+ through a LM. C stands for the carrier.
The transport of cations can be achieved through different mechanisms: (i) co-
transport of a counter-anion, (ii) counter-flux transport of H+ (as shown in Figure 1.7) or
(iii) the counter-flux transport of any other cation.
Metal species are transported across the membrane against their concentration
gradient by “uphill” transport which will continue until all the metal species are
transferred from the feed to the stripping side, provided the driving force of the process
is kept constant [165].
Different authors [165,197] have proposed mathematical models to explain metal
flux across the membrane comprising the different steps occurring during transport. At
the steady-state, the diffusion through the aqueous boundary layer (Ja), the interfacial flux
(Jb), and the membrane diffusion (Jc) are equal, and by further assuming linear
H+
Feed phase Membrane Stripping phase
M+ CH
CM M+
Analyte (M+)
H+
H+
Chapter 1 – General Introduction
39
concentration gradients, the following equation (Eq. 1.3) is obtained for membrane flux
(J), and permeability coefficient (P):
. = /0 =
12123+4+5162
374758
(1.3)
where C stands for the time-dependent bulk concentration of metal species in the feed
solution, K1 and K-1 are the pseudo-first-order rate constants of the interfacial reactions,
da and d0 are the thickness of the aqueous and membrane diffusion layer, respectively. Da
and D0 represent the aqueous and the membrane diffusion coefficient, respectively.
Equation (1.3) can be further simplified when interfacial chemical reactions are
very fast and since the relationship of J with the concentration (C), the feed volume (V)
and the membrane area (A) is (Eq. 1.4):
9 = − ;0;< ·
>& (1.4)
the resulting integrated form of the flux is (Eq. 1.5):
?@ 007= − &
> .A (1.5)
where C0 is the value of C at time zero. Equations (1.3) and (1.5) are used to predict the
permeation behaviour of LMs when feed solutions are relatively dilute in metal species
[165].
Apart from the characterization of the membrane system by experimentally
determining the permeability coefficient, LMs can provide different types of information
by measuring the total concentration of the analyte in the stripping solution:
• At equilibrium, the corresponding concentration at the stripping phase is
proportional to either the total concentration or to that of the free analyte species
in the source solution, depending on the nature of the stripping phase and the
volumes of stripping and feed phases.
Chapter 1 – General Introduction
40
• The flux through the membrane over a short accumulation time may provide
the concentration of free analyte species, the whole of the labile complexes or
lipophilic complexes depending on the characteristics of the device used [197].
Then, with the appropriate design of the membrane system, including chemical
and physical parameters, LMs, can be used as a tool for preconcentration of analyte
species, thus facilitating their determination, and they can also be used as sensors for
speciation measurements. Both aspects have been indicated in previous sections.
1.5.1 PIM Components
Membrane properties depend essentially on the materials that comprise them and
their structure. The choice of these components plays a fundamental role in the selectivity
of the separation and in the stability of the membrane.
The polymer that constitutes the skeleton of the PIM consists of linear polymer
strands and because there are no cross-links between these strands, they can be dissolved
in a suitable organic solvent, where the polymer strands become separated. It plays a
crucial role as it provides the membrane with mechanical strength due to a combination
of intermolecular forces and the process of entanglement. Despite the absence of
intermolecular covalent bonds, a very stable film is formed. Membrane flexibility is
governed by the nature of the main polymer chain as well as the side chains. Depending
on the saturation of the main chain, the bonds may rotate or not, and therefore, either a
flexible or rigid chain will be generated. Indeed, the presence of aromatic or heterocyclic
groups in the main chain reduces flexibility, but increases both thermal and chemical
stability. Conversely, the presence of other elements such as oxygen or nitrogen increases
the flexibility of the material. On the other hand, if the lateral groups are long, strong
interactions will be generated between them, restricting the movement, and therefore
decreasing flexibility.
The length of polymer chains, which is the number of repeating units, determines
the properties of the material. The longer the chain, the more possibilities of interaction
with other chains, and therefore the properties of the polymer will be different. Polymers
contain a great number of chains and not all of them with the same molecular weight
(MW). This is the reason why an average MW is given for each polymer. Polymer MW
Chapter 1 – General Introduction
41
is a key parameter that must be higher than the critical entanglement molecular weight
(MWc). MW variations above MWc are expected to produce a negligible influence either
on membrane performance or mechanical strength [198].
In terms of interaction between polymer chains, in the case of three-dimensional
polymers, interactions are mostly covalent bonds, whereas in the case of side chains,
interactions are hydrogen bonding, dispersion forces or dipole-dipole interactions. All
these interactions are strongly related to the polymer’s physical properties and to its
permeability.
Another parameter that must be taken into account is the state of the polymer,
whether crystalline, liquid or vitreous. Generally, a degree of crystallinity reduces
permeability through the membrane, whereas it is enhanced with membrane elasticity.
One characteristic of the polymers is the vitreous transition temperature (Tg), which is
the gradual and reversible transition from which an amorphous polymer (not crystalline)
turns from a rigid and relatively brittle state (vitreous state) into a viscous or rubbery state
as the temperature is increased. In this state the free rotation of the polymer chains allows
more flexible membranes. Besides, the degree of crystallinity determines the state of the
polymer. Some polymers have regular structural units that allow the formation of crystals,
since the chains can be packaged according to an ordered pattern. The presence of crystals
clearly influences the mechanical and transport properties of the membrane.
If the polymer is amorphous, an increase in temperature above the Tg will cause
a drastic modification to its chemical and physical properties. This change will also occur
in crystalline polymers if we exceed the melting temperature (Tm). Nevertheless, if the
temperature increase is too high, irreversible degradation (decomposition, oxidation, etc.)
can be achieved.
Polymers used on PIM preparations are thermoplastic and among the great
variety, poly(vinyl chloride) (PVC) and cellulose triacetate (CTA) are the two main
polymers used in most of the investigations conducted so far. The widespread use of these
two polymers is due to the fact that they provide a thin film through a simple procedure
based on a solvent casting method and to the scarcity of information regarding the role of
the base polymer [190]. The physical properties of different polymers used in PIM
preparations are summarized in Table 1.1.
CTA is a polar and frequently highly crystalline polymer with a number of
hydroxyl and acetyl groups that are capable of forming highly orientated hydrogen
bonding. Moreover, CTA can be slightly hydrated and, thus, prone to acid hydrolysis. In

Chapter 1 – General Introduction
42
contrast, the group C-Cl in PVC is relatively polar and non-specific dispersion forces
dominate the intermolecular interactions. Thus, PVC is an amorphous polymer with a
small degree of crystallinity [190].
Besides PVC or CTA, a few other base polymers have been tested, such as
cellulose derivatives (i.e. cellulose acetate propionate (CAP), cellulose acetate butyrate
(CAB), and cellulose tributyrate (CTB)). Gardner et al. [199] compared the different
cellulose derivates in terms of resistance against hydrolysis under alkaline or acidic
conditions, finding that resistance to hydrolysis was enhanced with an increase in the
alkyl chain, although the transport across the membrane decreased. Besides, Ocampo et
al. [200], tested different PIMs based on CAP, CAB and cellulose acetate hydrogen
phthalate (CAH) as polymers and dinonylnaphthalene sulfonic acid (DNNS) and
dinonylnaphthalene disulfonic acid (DNNDS) as carriers. The PIM preparation was not
possible using DNNS and only fragile membranes were obtained when DNNS was
employed as the carrier.
In addition, more recently some PIMs have been prepared using poly(vinylidene
fluoride-co-tetrafluoroethylene) (PVDF-TFE) [201,202] or poly(vinylidine fluoride-
cohexafluoropropylene) (PVDF-HFP) [203,204] as the base polymers. PVDF is a
thermoplastic fluoropolymer that shows good chemical resistance, because of the lack of
reactive functional groups, and an excellent thermal and mechanical stability. All these
advantages have made it an attractive base polymer for PIM preparations [205].
PVDF-HFP has been used for the preparation of cross-linking membranes with
the aim of further reducing membrane leaching into the adjacent aqueous phases. The
cross-linking process is based on the creation of a more tortuous and rigid environment
in the PIM polymeric structure, which is achieved by treating PVDF-HFP with
bisnucleophiles, such as diamines or bisphenols at an elevated temperature, or by
irradiation (e.g., electron beam). As an alternative to these difficult approaches, PVDF-
HFP can also be combined with a cross-linking oligomer such as poly(ethylene glycol)
diacrylate (PEG-DA) [206] or poly(ethylene glycol) dimethacrylate (PEG-DMA) [207],
in order to obtain a semi-interpenetrating polymer network. First, the polymer is dissolved
in an organic solvent and later the solution is cast to obtain a film. Then, the film is treated
either with heat or with ultraviolet light to induce the cross-linking of the oligomer leading
to the distribution of PVDF-HFP chains in the membrane's three-dimensional network.
Although the cross-linking process leads to an increase in tortuosity and rigidity,
which may cause an undesired effect by depleting membrane permeability, photo-
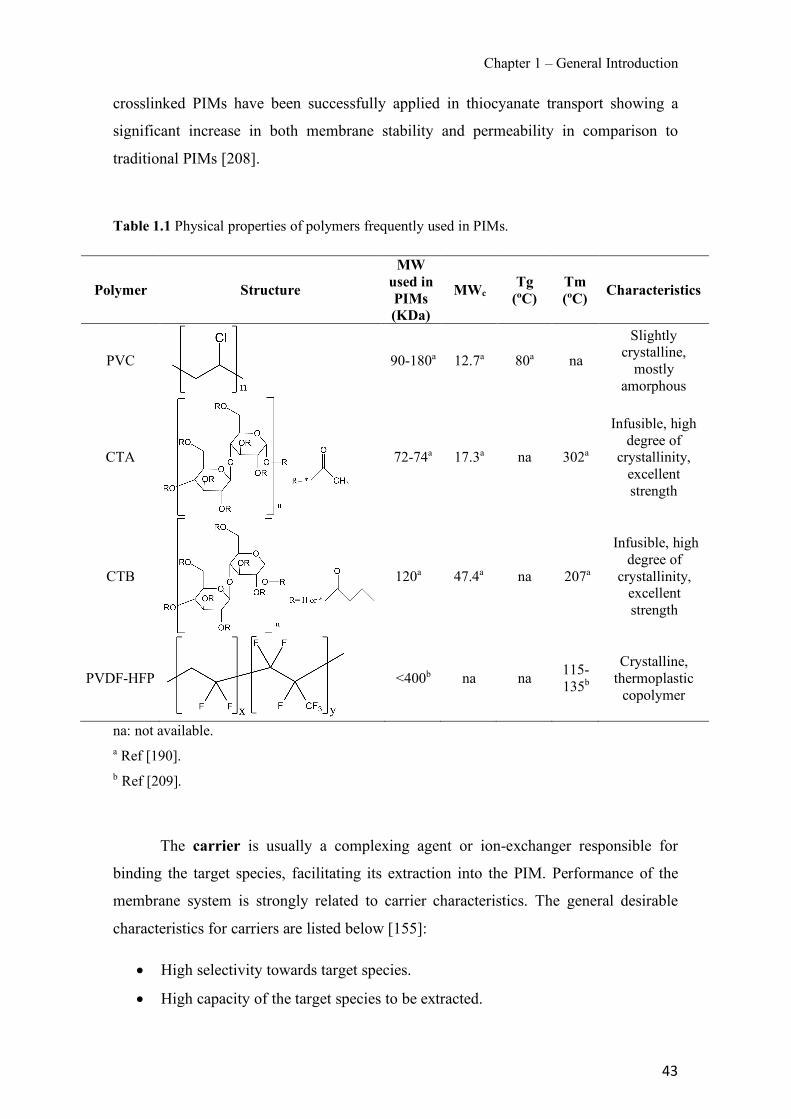
Chapter 1 – General Introduction
43
crosslinked PIMs have been successfully applied in thiocyanate transport showing a
significant increase in both membrane stability and permeability in comparison to
traditional PIMs [208].
Table 1.1 Physical properties of polymers frequently used in PIMs.
Polymer Structure
MW used in PIMs (KDa)
MWc Tg (ºC)
Tm (ºC) Characteristics
PVC
90-180a 12.7a 80a na
Slightly crystalline,
mostly amorphous
CTA
72-74a 17.3a na 302a
Infusible, high degree of
crystallinity, excellent strength
CTB
120a 47.4a na 207a
Infusible, high degree of
crystallinity, excellent strength
PVDF-HFP
<400b na na 115-135b
Crystalline, thermoplastic
copolymer
na: not available. a Ref [190]. b Ref [209].
The carrier is usually a complexing agent or ion-exchanger responsible for
binding the target species, facilitating its extraction into the PIM. Performance of the
membrane system is strongly related to carrier characteristics. The general desirable
characteristics for carriers are listed below [155]:
• High selectivity towards target species.
• High capacity of the target species to be extracted.
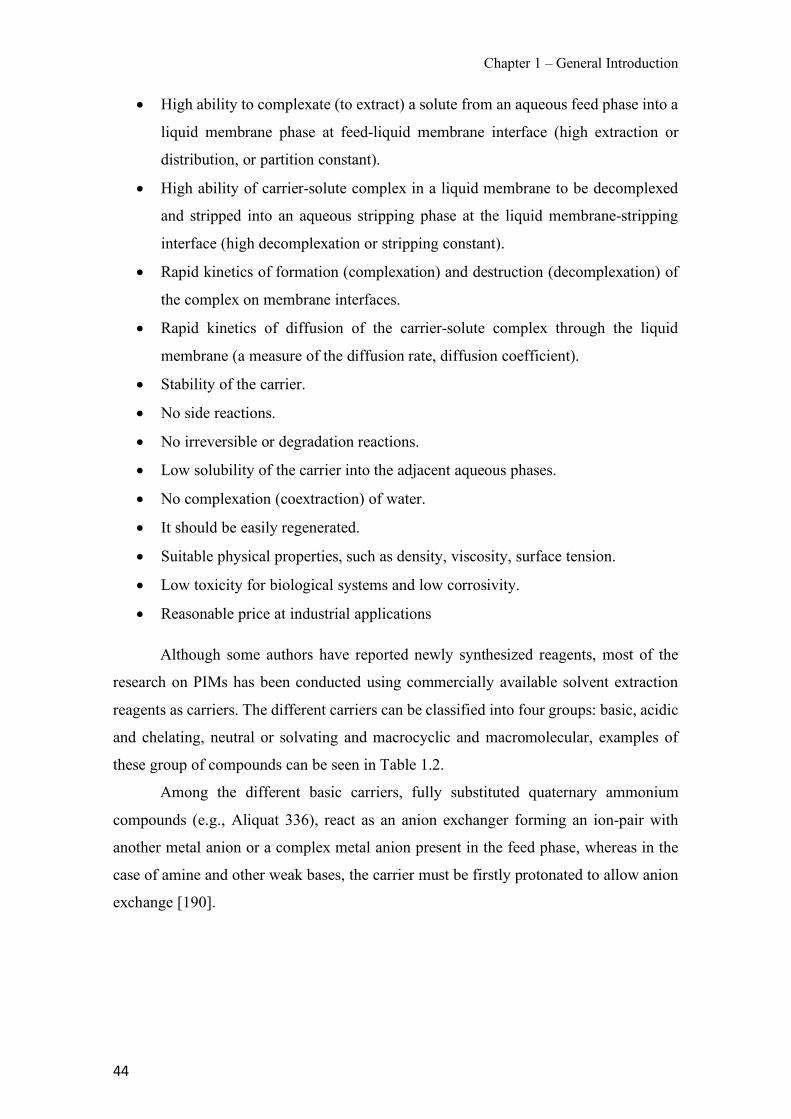
Chapter 1 – General Introduction
44
• High ability to complexate (to extract) a solute from an aqueous feed phase into a
liquid membrane phase at feed-liquid membrane interface (high extraction or
distribution, or partition constant).
• High ability of carrier-solute complex in a liquid membrane to be decomplexed
and stripped into an aqueous stripping phase at the liquid membrane-stripping
interface (high decomplexation or stripping constant).
• Rapid kinetics of formation (complexation) and destruction (decomplexation) of
the complex on membrane interfaces.
• Rapid kinetics of diffusion of the carrier-solute complex through the liquid
membrane (a measure of the diffusion rate, diffusion coefficient).
• Stability of the carrier.
• No side reactions.
• No irreversible or degradation reactions.
• Low solubility of the carrier into the adjacent aqueous phases.
• No complexation (coextraction) of water.
• It should be easily regenerated.
• Suitable physical properties, such as density, viscosity, surface tension.
• Low toxicity for biological systems and low corrosivity.
• Reasonable price at industrial applications
Although some authors have reported newly synthesized reagents, most of the
research on PIMs has been conducted using commercially available solvent extraction
reagents as carriers. The different carriers can be classified into four groups: basic, acidic
and chelating, neutral or solvating and macrocyclic and macromolecular, examples of
these group of compounds can be seen in Table 1.2.
Among the different basic carriers, fully substituted quaternary ammonium
compounds (e.g., Aliquat 336), react as an anion exchanger forming an ion-pair with
another metal anion or a complex metal anion present in the feed phase, whereas in the
case of amine and other weak bases, the carrier must be firstly protonated to allow anion
exchange [190].
Chapter 1 – General Introduction
Table 1.2 Classification and some examples of the different carriers used in PIMs studies.
Type of carriers Examples
Basic Quaternary amines methyltrioctylammonium chloride (Aliquat 336)
Tertiary amines Tri-n-octyl amine (TOA), tri-n-decylamine (TDA), tri-n-butylamine (TBA), tri-n-hexylamine (THA), among other tri-alkyl amines
Pyridine and derivatives 4-(1’-n-tridecyl)pyridine N-oxide (TDPNO) Acidic Hydroxyoximes 2-Hydroxy-5-nonylacetophenone oxime (LIX® 84-1)
Hydroxyquinoline 7-(4-Ethyl-1-methyloctyl)-8-hydroxyquinoline (Kelex 100) β-Diketones Benzoylacetone, dibenzoylacetone, benzoyltrifluoroacetone
Alkyl phosphoric acids Di(2-ethylhexyl) phosphoric acid (D2EHPA), Di(2-ethylhexyl) dithiophosphoric acid (D2EHDTPA), Bis(2,4,4-trimethylpentyl)phosphinic acid (Cyanex 272), Bis(2,4,4-trimethylpentyl)dithiophosphinic acid (Cyanex 301),
Bis(2,4,4-trimethylpentyl)monothiophosphinic acid (Cyanex 302), Tri-isobutylphosphine sulfide (Cyanex 471X) Sulfonic and carboxylic acids DNNS, DNNDS, Lauric acid, Lasalocid A
Neutral Phosphoric acid esters Tri-n-butyl phosphate (TBP) Phosphonic acid esters Dibutyl butyl phosphonate (DBBP)
Others Octyl(phenyl)-N,N-diisobutyl carbamoylmethyl phosphine oxide (CMPO), N,N,N’,N’-Tetraoctyl-3-oxapentanediamide (TODGA), Tri-n-octyl phosphine oxide (TOPO), polyethylene glycol
Ionic liquids (ILs) Ammonium methyltrioctylammonium chloride (Aliquat 336), methyltrioctylammonium thiosalicylate
Phosphonium Trihexyl(tetradecyl)phosphonium chloride (Cyphos 101), trihexyl(tetradecyl)phosphonium-(2,4,4-trimethylpentyl)phosphinate (Cyphos 104)
Imidazolium 1-Butyl-3-methylimidazolium hexafluorophosphate, 1-octyl-3-methylimidazolium tetrafluoroborate Others 1-butyl-1-methylpyrrolidinium trifluoromethanesulfonate, 1-butyl-3-methylpyridinium tetrafluoroborate
Macrocyclic and macromolecular Crown ethers and calixarenes Di-tert-butylcyclohexano-18-crown-6 (BuDC18C6), DC18C6, imidazole azothiacrown ether, Meso-octamethyl-
porphyrinogen (Calix[4]pyrrole), among others. Others Bathophenanthroline, bathocuproine, poly(vinylpyrrolidone) (PVP)
Chapter 1 – General Introduction
46
Basic carriers are used for the extraction and/or transport of anionic complexes
of heavy metals (e.g., As(V), Au(III), Cd(II), Co(II), Cr(VI), Cu(II), Ni(II), Pd(II), Pt(IV),
Re(VII)), anions (e.g., I-, SCN-) and organic compounds (e.g., antibiotics, small
saccharides, thiourea, among others)
Acidic carriers (e.g., alkyl phosphoric acids, sulfonic acids and carboxylic acids)
are frequently used for the extraction and transport of metal cations (e.g., Zn(II), U(VI),
Pb(II), Cd(II), Cr(III), Fe(III)), involving the exchange of the metal ion for protons of the
carrier. Moreover, the group of compounds such as hydroxyoximes, hydroxyquinoline
and β-Diketones, present both acidic and strong chelating properties.
Neutral and solvating carriers show a high selectivity towards actinides and
lanthanides such as U(VI) and Ce(III). In the case of phosphoric and phosphonic acid
esters, the mechanism is based on the replacement of the water molecules coordinated to
the metallic cation by molecules of the carrier. The carrier D2EHPA has been
incorporated in PIMs allowing the extraction of bivalent ions such as Zn(II), Cd(II) or
Pb(II) [210]. This carrier has a hydrophobic character and good solubility in many organic
solvents. Extraction with D2EHPA is based on a counter-transport mechanism; in this
case, a crossed transport of protons and metallic ions takes place [211].
Another important group of carriers are ionic liquids (ILs), which are molten salts
liquid at room temperature formed by an organic cation and an organic or inorganic anion.
ILs present remarkable features, such as high ion conductivity, negligible vapour
pressure, low volatility, non-flammability, high potential for recycling, high solvating
capacity and high viscosity. However, they only attracted attention after the mid-1980s
when ILs with a low melting temperature were presented as solvents for organic synthesis
[212,213]. Since then a large amount of ILs have been reported with a great variety of
structures and properties. The extensive range of combinations of cation and anion that
ILs provide, permits an extensive variety of tunable interactions and applications
[214,215]. In the late 1990s, the concept of task-specific ILs (TSILs) was introduced.
TSILs are formed by ILs containing metal ion-ligating functional groups. They can be
used both as the hydrophobic solvent and the extractant. One example of these
compounds is Aliquat 336 which is classified as a basic carrier but also has properties
related to ILs. Aliquat 336 is an affordable cation source of a new family of hydrophobic
ILs [216]. This extractant has been incorporated in different PIM-based systems for the
extraction and preconcentration of a wide range of target compounds such as oxyanions,
anion metallic species or different organic compounds, as shown in the literature [196].
Chapter 1 – General Introduction
47
Moreover, Aliquat 336 allows the extraction of As(V) present in waters at neutral pH
(mainly H2AsO4− and HAsO42−) by an anion-exchange mechanism. As(III) is not
transported under neutral pH conditions since it is mainly present as a neutral species
(H3AsO3) and thus permits the speciation of arsenic inorganic species [217]. Moreover,
Aliquat 336 also allows the extraction of Cr(VI) species at low pH as the predominant
species is the anion HCrO4− [218].
Finally, macrocyclic and macromolecular carriers bear high complexing
selectivity toward metal ions as their structure can be tailored to a selected metal ion. The
extraction is based on the recognition of the target compound. Besides, they also exhibit
low water solubility, although they are expensive to synthesize and most of them are not
commercially available.
The addition of plasticizers or modifiers increases membrane softness and
flexibility. They are usually organic compounds that contain a hydrophobic alkyl skeleton
with a polar group or more. However, the addition of these compounds is not mandatory
when the carrier also presents plasticizing properties (e.g., Aliquat 336, D2EHPA and
TBP). The addition of these compounds has also been shown to enhance metal flux across
the membrane [219].
Plasticizers penetrate between polymer chains, which are held together by a
combination of various types of attractive forces, and “neutralize” the polar groups of the
polymer with their own polar groups or increase the distance between polymer molecules,
reducing the strength of the intermolecular forces.
The Tg temperature of a plasticized membrane decreases as the amount of
plasticizer increases. In general terms, this can produce an increase in the diffusion
coefficient and therefore in membrane permeability. From a physicochemical point of
view, individual molecular chains are connected to a polymeric membrane by a
combination of various types of forces. As an example, Van der Waals forces are very
frequent but weak and little specific. In addition, polar interactions, which are much
stronger, only occur with the presence of polar centres in the molecule. These polar
interactions increase the rigidity of membranes due to an unlikely three-dimensional
structure that hampers the diffusion of the species of interest. Therefore, plasticizers are
used to improve the flexibility and the compatibility between the membrane components
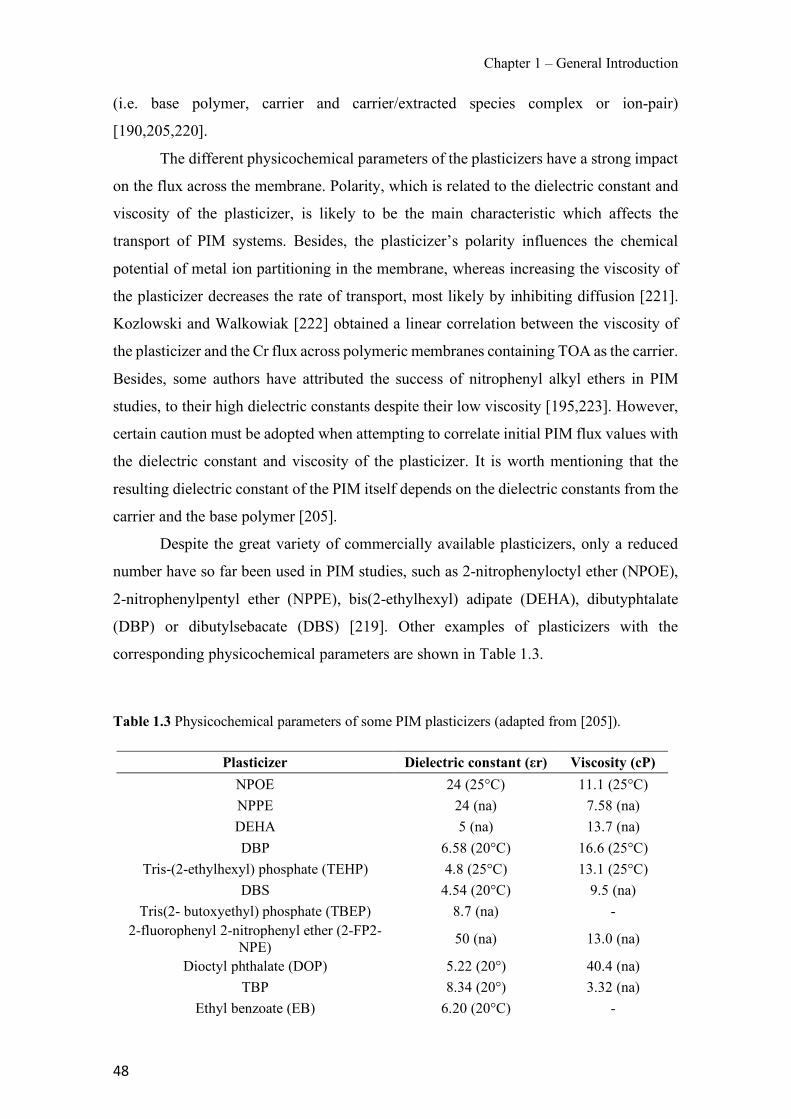
Chapter 1 – General Introduction
48
(i.e. base polymer, carrier and carrier/extracted species complex or ion-pair)
[190,205,220].
The different physicochemical parameters of the plasticizers have a strong impact
on the flux across the membrane. Polarity, which is related to the dielectric constant and
viscosity of the plasticizer, is likely to be the main characteristic which affects the
transport of PIM systems. Besides, the plasticizer’s polarity influences the chemical
potential of metal ion partitioning in the membrane, whereas increasing the viscosity of
the plasticizer decreases the rate of transport, most likely by inhibiting diffusion [221].
Kozlowski and Walkowiak [222] obtained a linear correlation between the viscosity of
the plasticizer and the Cr flux across polymeric membranes containing TOA as the carrier.
Besides, some authors have attributed the success of nitrophenyl alkyl ethers in PIM
studies, to their high dielectric constants despite their low viscosity [195,223]. However,
certain caution must be adopted when attempting to correlate initial PIM flux values with
the dielectric constant and viscosity of the plasticizer. It is worth mentioning that the
resulting dielectric constant of the PIM itself depends on the dielectric constants from the
carrier and the base polymer [205].
Despite the great variety of commercially available plasticizers, only a reduced
number have so far been used in PIM studies, such as 2-nitrophenyloctyl ether (NPOE),
2-nitrophenylpentyl ether (NPPE), bis(2-ethylhexyl) adipate (DEHA), dibutyphtalate
(DBP) or dibutylsebacate (DBS) [219]. Other examples of plasticizers with the
corresponding physicochemical parameters are shown in Table 1.3.
Table 1.3 Physicochemical parameters of some PIM plasticizers (adapted from [205]).
Plasticizer Dielectric constant (εr) Viscosity (cP) NPOE 24 (25°C) 11.1 (25°C) NPPE 24 (na) 7.58 (na) DEHA 5 (na) 13.7 (na) DBP 6.58 (20°C) 16.6 (25°C)
Tris-(2-ethylhexyl) phosphate (TEHP) 4.8 (25°C) 13.1 (25°C) DBS 4.54 (20°C) 9.5 (na)
Tris(2- butoxyethyl) phosphate (TBEP) 8.7 (na) - 2-fluorophenyl 2-nitrophenyl ether (2-FP2-
NPE) 50 (na) 13.0 (na)
Dioctyl phthalate (DOP) 5.22 (20°) 40.4 (na) TBP 8.34 (20°) 3.32 (na)
Ethyl benzoate (EB) 6.20 (20°C) -

Chapter 1 – General Introduction
49
2-Nitrophenyl octanoate (NPOT) 5.88 (na) - 1-dodecanol 5.82 (30°C) -
1-tetradecanol 4.42 (45°C) - na: temperature not available
The amount of plasticizer is also a crucial factor, as a low amount can lead to
undesirable rigidity and brittleness being obtained. This phenomenon is commonly
referred to as the “anti-plasticizing” effect. The minimum amount varies according to the
plasticizer and the base polymer used. Conversely, the addition of a great amount of
plasticizer is also problematic, since it can interfere in the membrane/aqueous phase
interface, creating an additional barrier that limits the transport of the species of interest
through the membrane. Therefore, an excess of plasticizer can produce a decrease in the
mechanical resistance of the membrane, as well as a reduction in its transport efficiency
[190].
1.5.2 Characteristics of PIMs
These aforementioned components are incorporated into a PIM by a relatively
simple process. All components are dissolved using a suitable solvent, mixed, cast in a
mould (e.g. a glass ring positioned on a flat glass plate or in a petri dish) and the solvent
is allowed to evaporate. Once this has been achieved, a transparent, flexible and
homogeneous film is left; this film is a PIM (see Figure 1.8).
Figure 1.8 PIM placed on a wooden plank.
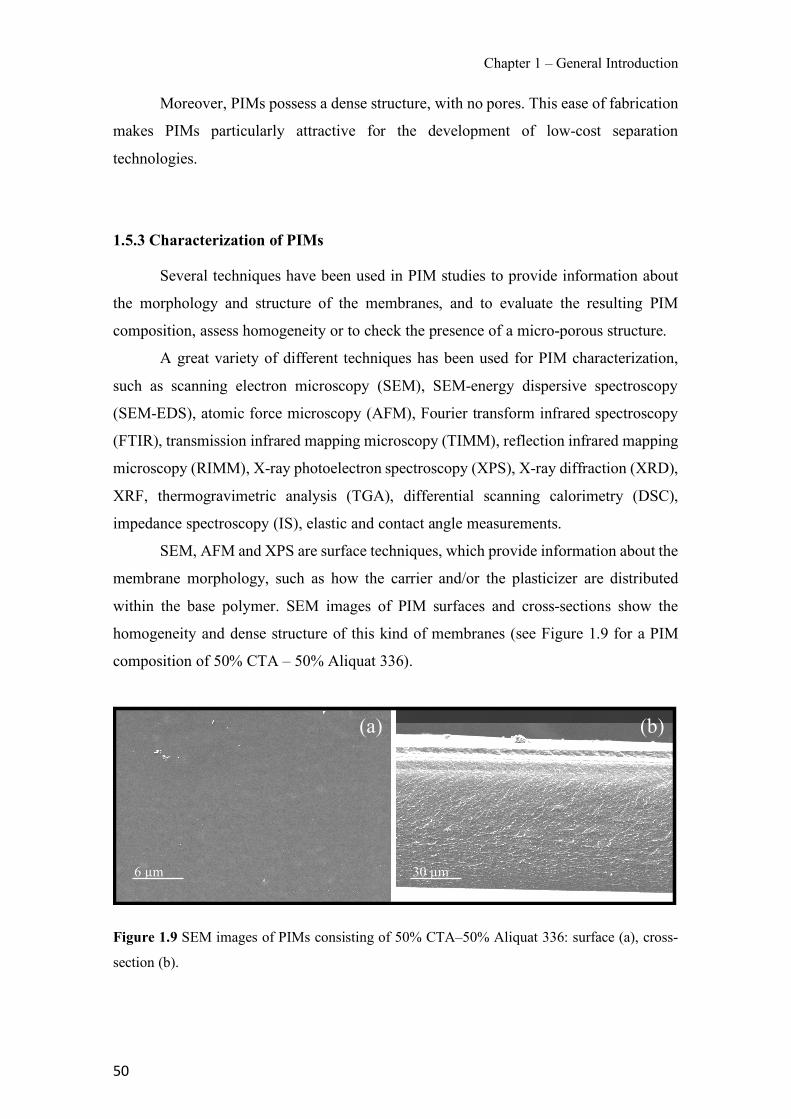
Chapter 1 – General Introduction
50
Moreover, PIMs possess a dense structure, with no pores. This ease of fabrication
makes PIMs particularly attractive for the development of low-cost separation
technologies.
1.5.3 Characterization of PIMs
Several techniques have been used in PIM studies to provide information about
the morphology and structure of the membranes, and to evaluate the resulting PIM
composition, assess homogeneity or to check the presence of a micro-porous structure.
A great variety of different techniques has been used for PIM characterization,
such as scanning electron microscopy (SEM), SEM-energy dispersive spectroscopy
(SEM-EDS), atomic force microscopy (AFM), Fourier transform infrared spectroscopy
(FTIR), transmission infrared mapping microscopy (TIMM), reflection infrared mapping
microscopy (RIMM), X-ray photoelectron spectroscopy (XPS), X-ray diffraction (XRD),
XRF, thermogravimetric analysis (TGA), differential scanning calorimetry (DSC),
impedance spectroscopy (IS), elastic and contact angle measurements.
SEM, AFM and XPS are surface techniques, which provide information about the
membrane morphology, such as how the carrier and/or the plasticizer are distributed
within the base polymer. SEM images of PIM surfaces and cross-sections show the
homogeneity and dense structure of this kind of membranes (see Figure 1.9 for a PIM
composition of 50% CTA – 50% Aliquat 336).
Figure 1.9 SEM images of PIMs consisting of 50% CTA–50% Aliquat 336: surface (a), cross-
section (b).
(b)(a)
6 µm 30 µm
Chapter 1 – General Introduction
51
Moreover, a combined analysis of SEM-EDS can be used to obtain semi-
quantitative elemental results about very specific locations within an area of interest, as
reported by Mercader-Trejo et al. [224], where the sulphur content of Cyanex 471X was
monitored to demonstrate the homogeneous distribution of the carrier across the
membrane. An analogous technique is XPS, which provides valuable quantitative and
chemical state information from the surface of the membrane [225].
The use of AFM has been demonstrated as a useful technique for detecting the
leaching of the carrier from a PVC-based PIM [226]. Moreover, this technique has also
been used to compare the more homogeneous surface and smoother appearance of
membranes plasticized with TBP compared to those plasticized with NPOE, correlating
the smoother surface with an enhanced permeation [227].
FTIR analysis has been used to provide information about the interaction between
the different PIM components. However, different studies have concluded that no
covalent bonding takes place between the different constituents of the membrane; there
are only weak interactions such as Van der Waals or hydrogen bonds [210,228].
Some authors have used the TIMM technique to obtain a distribution profile of
the membrane components. Ansari et al. [229], found a slightly non-uniform distribution
of the carrier TODGA in CTA-based PIMs, whereas De San Miguel et al. [230] used
TIMMs maps to study the distribution of kelex 100 and NPOE. In addition, the analogous
technique RIMM was used to study the distribution of the carrier D2EHPA in PIMs with
different compositions, obtaining an increase in the extractant absorbance band with the
increase in its concentration [231].
XRD examines the crystallinity of a sample. It provides information about the
crystal structure(s) of the membrane, as well as the space group, lattice parameters,
preferred orientation and crystallite size. It suggests that CTA-based PIMs containing
crown ethers as carriers, and TBP or NPOE as plasticizers, present an amorphous
structure [232,233]. Moreover, energy dispersion X-ray fluorescence (EDXRF) which is
a non-destructive technique, has been used to directly quantify the amount of mercury
adsorbed in a PIM without a further elution step [234]. This technique has also been
employed to monitor the leaching of the carrier Aliquat 336 by determining the presence
of chloride, before and after mass loss experiments, in CTA-based PIMs.
To understand the type of interaction between the base polymer and the different
carriers as well as to provide information about the thermal degradation of the different
PIM components, TGA has been employed as an effective technique [200,210]. TGA and
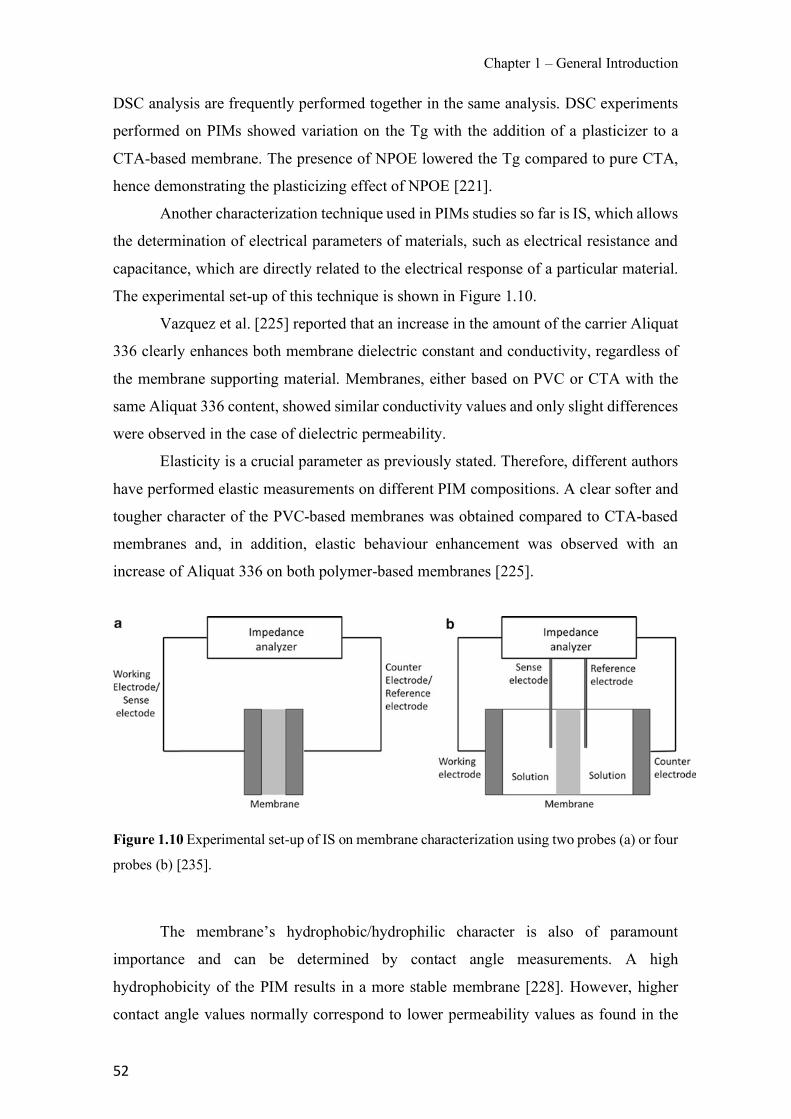
Chapter 1 – General Introduction
52
DSC analysis are frequently performed together in the same analysis. DSC experiments
performed on PIMs showed variation on the Tg with the addition of a plasticizer to a
CTA-based membrane. The presence of NPOE lowered the Tg compared to pure CTA,
hence demonstrating the plasticizing effect of NPOE [221].
Another characterization technique used in PIMs studies so far is IS, which allows
the determination of electrical parameters of materials, such as electrical resistance and
capacitance, which are directly related to the electrical response of a particular material.
The experimental set-up of this technique is shown in Figure 1.10.
Vazquez et al. [225] reported that an increase in the amount of the carrier Aliquat
336 clearly enhances both membrane dielectric constant and conductivity, regardless of
the membrane supporting material. Membranes, either based on PVC or CTA with the
same Aliquat 336 content, showed similar conductivity values and only slight differences
were observed in the case of dielectric permeability.
Elasticity is a crucial parameter as previously stated. Therefore, different authors
have performed elastic measurements on different PIM compositions. A clear softer and
tougher character of the PVC-based membranes was obtained compared to CTA-based
membranes and, in addition, elastic behaviour enhancement was observed with an
increase of Aliquat 336 on both polymer-based membranes [225].
Figure 1.10 Experimental set-up of IS on membrane characterization using two probes (a) or four
probes (b) [235].
The membrane’s hydrophobic/hydrophilic character is also of paramount
importance and can be determined by contact angle measurements. A high
hydrophobicity of the PIM results in a more stable membrane [228]. However, higher
contact angle values normally correspond to lower permeability values as found in the
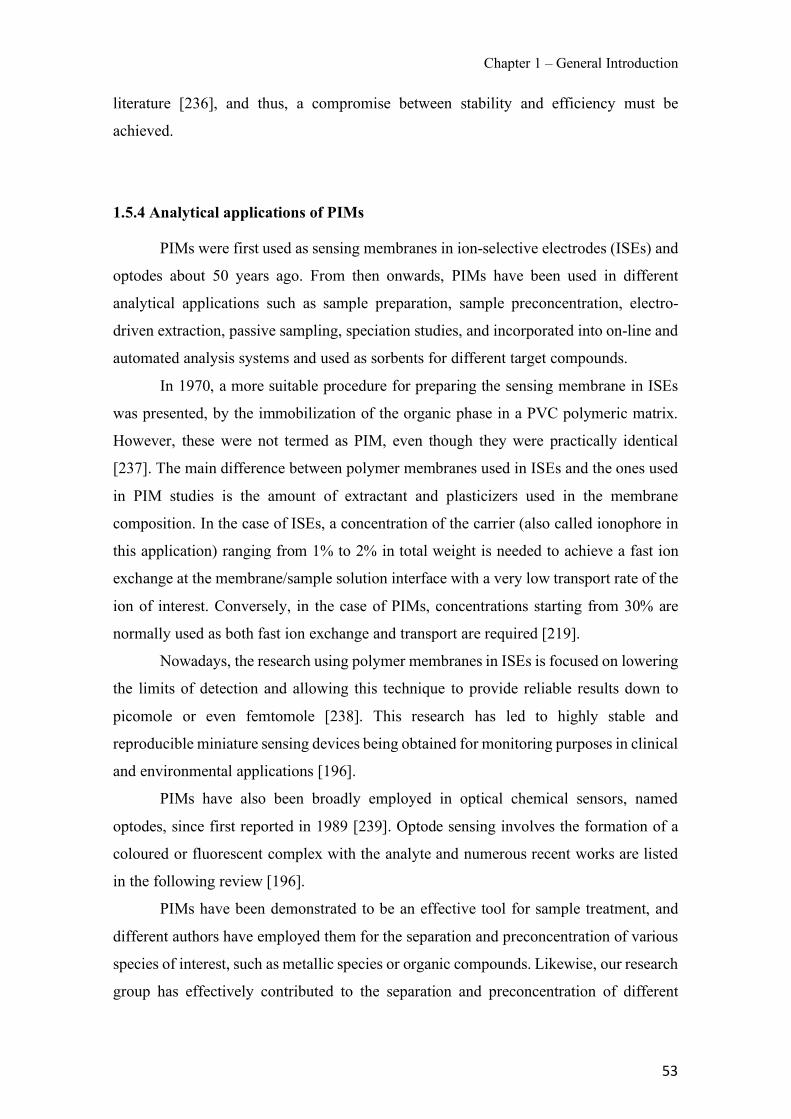
Chapter 1 – General Introduction
53
literature [236], and thus, a compromise between stability and efficiency must be
achieved.
1.5.4 Analytical applications of PIMs
PIMs were first used as sensing membranes in ion-selective electrodes (ISEs) and
optodes about 50 years ago. From then onwards, PIMs have been used in different
analytical applications such as sample preparation, sample preconcentration, electro-
driven extraction, passive sampling, speciation studies, and incorporated into on-line and
automated analysis systems and used as sorbents for different target compounds.
In 1970, a more suitable procedure for preparing the sensing membrane in ISEs
was presented, by the immobilization of the organic phase in a PVC polymeric matrix.
However, these were not termed as PIM, even though they were practically identical
[237]. The main difference between polymer membranes used in ISEs and the ones used
in PIM studies is the amount of extractant and plasticizers used in the membrane
composition. In the case of ISEs, a concentration of the carrier (also called ionophore in
this application) ranging from 1% to 2% in total weight is needed to achieve a fast ion
exchange at the membrane/sample solution interface with a very low transport rate of the
ion of interest. Conversely, in the case of PIMs, concentrations starting from 30% are
normally used as both fast ion exchange and transport are required [219].
Nowadays, the research using polymer membranes in ISEs is focused on lowering
the limits of detection and allowing this technique to provide reliable results down to
picomole or even femtomole [238]. This research has led to highly stable and
reproducible miniature sensing devices being obtained for monitoring purposes in clinical
and environmental applications [196].
PIMs have also been broadly employed in optical chemical sensors, named
optodes, since first reported in 1989 [239]. Optode sensing involves the formation of a
coloured or fluorescent complex with the analyte and numerous recent works are listed
in the following review [196].
PIMs have been demonstrated to be an effective tool for sample treatment, and
different authors have employed them for the separation and preconcentration of various
species of interest, such as metallic species or organic compounds. Likewise, our research
group has effectively contributed to the separation and preconcentration of different
Chapter 1 – General Introduction
54
compounds using PIMs. In 2006, a novel method was reported for the separation and
preconcentration of Cr(VI) from electroplating waste waters by means of an Aliquat 336-
based PIM used as a sorbent. PIMs showed a higher degree of homogeneity in terms of
metal distribution when compared to SLM [240].
In addition, a simple and effective procedure for both cadmium removal and
separation, using an Aliquat 336-based PIM from either acidic or saline solutions, was
also presented [241]. Besides, a PIM-based system was used for the separation and
transport of inorganic As species (arsenite and arsenate) from aqueous solutions using a
two-compartment transport cell (see Figure 1.11) [121]. Moreover, a different
configuration was used for arsenate transport, where the volume of the stripping phase (5
mL) was lower than the volume of the feed phase (100 mL) and thus, allowed a
preconcentration of arsenate. The resulting method was successfully applied for the
determination of arsenate in groundwaters [217]. With regard to organic compounds,
PIMs have successfully been applied for the transport and preconcentration of six
different antibiotics (four sulphonamides and two tetracyclines) from environmental
water samples [242].
Figure 1.11 Two-compartment transport cell placed on a magnetic multistirrer.
Besides the above mentioned off-line configurations which involve two
compartments separated by a PIM and where samples need to be manually collected from
the stripping phase, PIMs have also been incorporated in on-line systems which use a
Feed phase PIM Stripping phase

Chapter 1 – General Introduction
55
flow-through approach where both feed and stripping solutions flow past the PIM. In
2011, the first use of a PIM for on-line separation in FIA, involving simultaneous
extraction and back-extraction, was reported. The optimal PIM composition consisted of
40% D2EHPA as the carrier, 10% DOP as the plasticizer and 50% PVC as the base
polymer, and allowed the on-line determination of Zn(II) in aqueous samples in the
presence of other metallic species [243]. Later, the same authors presented two different
approaches involving temperature and sonication to improve the already existing FIA
system by enhancing the overall mass transfer process in the PIM separation cell [244].
Moreover, the same research group presented a highly sensitive FA system for the trace
determination of phosphate in natural waters, using a PIM containing Aliquat 336 as the
carrier. The resulting method allowed the analysis of natural water samples containing
concentrations of phosphate in the low µg L−1 range [245]. More recently, a PIM
constituted by PVDF, Cyphos 101 and NPOE was used for the on-line extractive
separation of V(V) prior to its spectrophotometric determination in a FIA system. The
developed system allowed the determination of V(V) in water and dietary supplement
samples [246].
PIMs have also been tested in electro-membrane extraction, where membrane
extraction is driven by an electric field rather than facilitated transport. SLMs have
traditionally been used in this application. However, due to their limited stability, the use
of PIMs has emerged as an attractive alternative. The first electro-driven extraction using
a PIM was presented by See and Hauser [247]. A CTA-based PIM containing Aliquat
336 and the plasticizer NPOE was used for the extraction and preconcentration of
glyphosphate (GLYP) and aminomethylphosphonic acid (AMPA) from spiked river
water samples. In this study, an enrichment factor of 26 was achieved. However, after the
modification of continuously pumping the feed solution through its compartment, while
the stripping solution was stagnant, greater enrichments were obtained for both
compounds [248]. Schmidt-Marzinkowski et al. [249] reported an electro-driven
extraction of perchlorate through a PIM without carrier, only containing NPOE and CTA,
due to the high lipophilicity of this anion compared to others such as phosphate or
sulphate. For the transport of less liphophilic anions, a PIM with a high content of
extractant was needed. Even though most PIM studies are carried out with casting flat-
sheet membranes, other configurations are also possible. As an example, Mamat and See
[250] prepared a small cylindrical PIM with a hollow centre, where 20 µL of stripping
phase were accommodated. This setup allowed the electroextraction of three basic drugs
Chapter 1 – General Introduction
56
(i.e. amphetamine, methamphetamine and 3,4-methylenedioxy-N-methylamphetamine)
from human plasma samples through a PIM made of CTA as base polymer, D2EHPA as
carrier and TEHP as plasticizer.
Passive sampling involves the exposure of sampling devices for extended periods
of time (from days to weeks) within the aquatic system of interest (e.g. lake, river or
drain) to provide time weight average (TWA) concentration data. Passive samplers (e.g.
Chemcatcher®, semipermeable membrane devices (SPMDs), DGT, polar organic
chemical integrative samplers (POCISs)) present some limitations, such as a need for
calibration in order to correlate the amount of analyte accumulated in the receiving phase
with its TWA concentration in the same sample. However, this comparison is not easy
due to different environmental factors (e.g. temperature, flow pattern, biofouling) that can
modify the diffusion of the target compound across the semi-permeable barrier.
Moreover, the stripping phase of the sampler is frequently a resin or sorbent which
requires a further elution step. This disadvantage can be overcome with the use of PIMs,
as the stripping solution is an aqueous solution and can, therefore, be directly analysed.
PIMs incorporated in a device (see Figure 1.12) have been used for the passive sampling
of different inorganic species (e.g. Zn(II), NH4+) and organic compounds (e.g.
sulfamethoxazole) in environmental samples. For instance, Almeida et al. [251] presented
a novel passive sampler which contained acidic stripping solution and was separated from
the feed solution by a PIM made of PVC as the base polymer and D2EHPA as the carrier.
The developed passive sampler was used to measure TWA concentration of Zn(II) from
urban waters. The same author also reported a passive sampler for the TWA concentration
of total ammonia (i.e. molecular ammonia and the ammonium cation) in freshwaters (e.g.
stormwater drain and creek water), using a PIM composed of PVC as the base polymer,
DNNS as the carrier and 1-tetradecanol as the plasticizer. In effect, an acidic solution was
also used as stripping phase.
García-Rodríguez et al [252], reported for the first time a PIM-based passive
sampler for the monitoring of sulfamethoxazole. The PIM was composed of CTA,
Aliquat 336 and NPOE, and allowed the transport of sulfamethoxazole from different
environmental samples (i.e. groundwater, river water and wastewater) towards a sodium
chloride stripping solution.
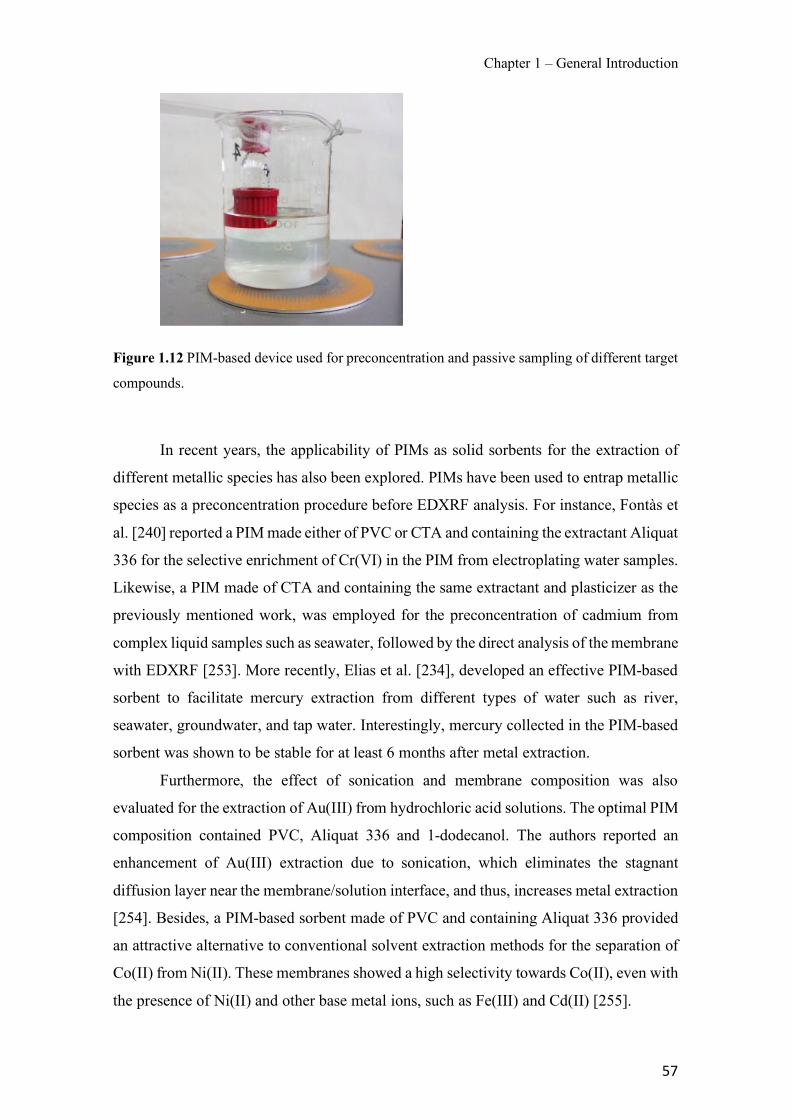
Chapter 1 – General Introduction
57
Figure 1.12 PIM-based device used for preconcentration and passive sampling of different target
compounds.
In recent years, the applicability of PIMs as solid sorbents for the extraction of
different metallic species has also been explored. PIMs have been used to entrap metallic
species as a preconcentration procedure before EDXRF analysis. For instance, Fontàs et
al. [240] reported a PIM made either of PVC or CTA and containing the extractant Aliquat
336 for the selective enrichment of Cr(VI) in the PIM from electroplating water samples.
Likewise, a PIM made of CTA and containing the same extractant and plasticizer as the
previously mentioned work, was employed for the preconcentration of cadmium from
complex liquid samples such as seawater, followed by the direct analysis of the membrane
with EDXRF [253]. More recently, Elias et al. [234], developed an effective PIM-based
sorbent to facilitate mercury extraction from different types of water such as river,
seawater, groundwater, and tap water. Interestingly, mercury collected in the PIM-based
sorbent was shown to be stable for at least 6 months after metal extraction.
Furthermore, the effect of sonication and membrane composition was also
evaluated for the extraction of Au(III) from hydrochloric acid solutions. The optimal PIM
composition contained PVC, Aliquat 336 and 1-dodecanol. The authors reported an
enhancement of Au(III) extraction due to sonication, which eliminates the stagnant
diffusion layer near the membrane/solution interface, and thus, increases metal extraction
[254]. Besides, a PIM-based sorbent made of PVC and containing Aliquat 336 provided
an attractive alternative to conventional solvent extraction methods for the separation of
Co(II) from Ni(II). These membranes showed a high selectivity towards Co(II), even with
the presence of Ni(II) and other base metal ions, such as Fe(III) and Cd(II) [255].

Chapter 1 – General Introduction
58
Despite all the above mentioned uses and applications of PIMs for analytical
purposes, it is expected that ongoing research will expand the applicability of these
membranes and broaden their use for different purposes due to the advantages and
feasibility they present.

Chapter 1 – General Introduction
59
References
[1] F.R. Rijsberman, Water scarcity: Fact or fiction?, Agric. Water Manag. 80 (2006) 5–22.
[2] M. Barlow, T. Clarke, Blue Gold: The Battle against Corporate Theft of the World’s Water. Earthscan, London (UK), (2002).
[3] United Nations (UN), Resolution adopted by the General Assembly on 28 July 2010- 64/292. The human right to water and sanitation, (2010). http://www.un.org/es/comun/docs/?symbol=A/RES/64/292&lang=E (accessed April 10, 2018).
[4] United Nations (UN), Global Issues of Water- The right to water, (n.d.). http://www.un.org/en/sections/issues-depth/water/ (accessed April 10, 2018).
[5] European Union (EU), Addressing the Challenge of Water Scarcity and Droughts in the European Union, Communication from the Commission to the European Parliament and the Council, Eur. Comm., DG Environ., Brussels, 2007.
[6] A.F. Van Loon, H.A.J. Van Lanen, Making the distinction between water scarcity and drought using an observation-modeling framework, Water Resour. Res. 49 (2013) 1483–1502.
[7] H. Cooley, N. Ajami, M.-L. Ha, V. Srinivasan, J. Morrison, K. Donnelly, J. Christian-Smith, Global water governance in the 21st century. Pacific Institute, Oakland, 2013.
[8] J. Schewe, J. Heinke, D. Gerten, I. Haddeland, N.W. Arnell, D.B. Clark, R. Dankers, S. Eisner, B.M. Fekete, F.J. Colón-González, S.N. Gosling, H. Kim, X. Liu, Y. Masaki, F.T. Portmann, Y. Satoh, T. Stacke, Q. Tang, Y. Wada, D. Wisser, T. Albrecht, K. Frieler, F. Piontek, L. Warszawski, P. Kabat, Multimodel assessment of water scarcity under climate change, Proc. Natl. Acad. Sci. 111 (2014) 3245–3250.
[9] World Health Organization (WHO). Guidelines for Drinking-water quality, 4th edition., 2017.
[10] WHO/UNICEF, Safely managed drinking water - thematic report on drinking water. Geneva (Switzerland), (2017) 1–56.
[11] WHO/UNICEF, Progress on drinking water, sanitation and hygiene: 2017 update and SDG baselines, Geneva (Switzerland), 2017.
[12] Directive 2008/105/EC of the European Parliament and of the Council of 16 December 2008 on environmental quality standards in the field of water policy, (2008).
[13] A. Jurado, E. Vàzquez-Suñé, J. Carrera, M. López de Alda, E. Pujades, D. Barceló, Emerging organic contaminants in groundwater in Spain: A review of sources, recent occurrence and fate in a European context, Sci. Total Environ. 440 (2012) 82–94.
Chapter 1 – General Introduction
60
[14] G. Montes-Hernandez, N. Concha-Lozano, F. Renard, E. Quirico, Removal of oxyanions from synthetic wastewater via carbonation process of calcium hydroxide: Applied and fundamental aspects, J. Hazard. Mater. 166 (2009) 788–795.
[15] H. Rüdel, C. Díaz Muñiz, H. Garelick, N.G. Kandile, B.W. Miller, L. Pantoja Munoz, W.J.G.M. Peijnenburg, D. Purchase, Y. Shevah, P. van Sprang, M. Vijver, J.P.M. Vink, Consideration of the bioavailability of metal/metalloid species in freshwaters: experiences regarding the implementation of biotic ligand model-based approaches in risk assessment frameworks, Environ. Sci. Pollut. Res. 22 (2015) 7405–7421.
[16] K.R. Henke, Arsenic. Environmental Chemistry, Health Threats and Waste Treatment, John and Wiley & Sons Ltd., West Sussex, UK, 2009.
[17] I. Villaescusa, J.-C. Bollinger, Arsenic in drinking water: sources, occurrence and health effects (a review), Rev. Environ. Sci. Bio/Technology. 7 (2008) 307–323.
[18] P.L. Smedley, D.G. Kinniburgh, A review of the source, behaviour and distribution of arsenic in natural waters, Appl. Geochemistry. 17 (2002) 517–568.
[19] M. Bissen, F.H. Frimmel, Arsenic - A review. Part I: Occurrence, toxicity, speciation, mobility, Acta Hydrochim. Hydrobiol. 31 (2003) 9–18.
[20] A. Navas-Acien, K.A. Francesconi, E.K. Silbergeld, E. Guallar, Seafood intake and urine concentrations of total arsenic, dimethylarsinate and arsenobetaine in the US population, Environ. Res. 111 (2011) 110–118.
[21] D.K. Nordstrom, Arsenic, antimony, selenium, tellurium and bismuth, in: C. Young (Ed.), Minor elements 2000. Society for mining, Metallurgy and Exploration, 2000: pp. 21–30.
[22] A. Garcia-Sanchez, E. Alvarez-Ayuso, Arsenic in soils and waters and its relation to geology and mining activities (Salamanca Province, Spain), J. Geochemical Explor. 80 (2003) 69–79.
[23] W.H. Baur, B.M.H. Onishi, Arsenic, in: K.H. Wedepohl (Ed.), Handb. Geochemistry, Springer-Verlag, Berlin, 1969: pp. 33-A-1-33-0–5.
[24] J.M. Brannon, W.H. Patrick, Fixation, Transformation, and Mobilization of Arsenic in Sediments, Environ. Sci. Technol. 21 (1987) 450–459.
[25] S. Goldberg, R.A. Glaubig, Anion Sorption on a Calcareous, Montmorillonitic Soil—Arsenic, Soil Sci. Soc. Am. J. 52 (1988) 1297.
[26] B.A. Manning, S. Goldberg, Modeling Competitive Adsorption of Arsenate with Phosphate and Molybdate on Oxide Minerals, Soil Sci. Soc. Am. J. 60 (1996) 121–131.
[27] R. Singh, S. Singh, P. Parihar, V.P. Singh, S.M. Prasad, Arsenic contamination, consequences and remediation techniques: A review, Ecotoxicol. Environ. Saf. 112 (2015) 247–270.
[28] O. Núñez, P. Fernández-Navarro, I. Martín-Méndez, A. Bel-Lan, J.F. Locutura, G.
Chapter 1 – General Introduction
61
López-Abente, Arsenic and chromium topsoil levels and cancer mortality in Spain, Environ. Sci. Pollut. Res. 23 (2016) 17664–17675.
[29] J.O. Nriagu, P. Bhattacharya, A.B. Mukherjee, J. Bundschuh, R. Zevenhoven, R.H. Loeppert, Arsenic in soil and groundwater: an overview, in: P. Bhattacharya, A.B. Mukherjee, J. Bundschuh, R. Zevenhoven, R.H. Loeppert (Eds.), Arsen. Soil Groundw. Environ., Elsevier, Amsterdam, 2007: pp. 3–60.
[30] R. Bhattacharyya, D. Chatterjee, B. Nath, J. Jana, G. Jacks, M. Vahter, High arsenic groundwater: Mobilization, metabolism and mitigation - An overview in the Bengal Delta Plain, Mol. Cell. Biochem. 253 (2003) 347–355.
[31] M. Kumar, M.M. Rahman, A.L. Ramanathan, R. Naidu, Arsenic and other elements in drinking water and dietary components from the middle Gangetic plain of Bihar, India: Health risk index, Sci. Total Environ. 539 (2016) 125–134.
[32] D. Chakraborti, M.M. Rahman, S. Ahamed, R.N. Dutta, S. Pati, S.C. Mukherjee, Arsenic groundwater contamination and its health effects in Patna district (capital of Bihar) in the middle Ganga plain, India, Chemosphere. 152 (2016) 520–529.
[33] P. Ravenscroft, H. Brammer, K. Richards, Arsenic Pollution: A Global Synthesis, Wiley-Blackwell, Oxford, 2009.
[34] A. Navarro, X. Font, M. Viladevall, Geochemistry and groundwater contamination in the La Selva geothermal system (Girona, Northeast Spain), Geothermics. 40 (2011) 275–285.
[35] S.K. Singh, E.A. Stern, Global Arsenic Contamination: Living With the Poison Nectar, Environ. Sci. Policy Sustain. Dev. 59 (2017) 24–28.
[36] X. Valeri, Setcases aconsella no beure aigua de la xarxa per causa del nivell d´arsènic, Diariv de Girona. (2014). http://www.diaridegirona.cat/comarques/2014/08/23/setcases-aconsella-no-beure-aigua/684343.html.
[37] Ajuntament de Caldes de Malavella- Planta potabilitzadora-depuradora, (n.d.). http://www.caldesdemalavella.cat/planta-potabilitzadora-depuradora (accessed April 23, 2018).
[38] Commission regulation (EU) 2015/1006 of 25 June 2015 amending regulation (EC) No. 1881/2006 as regards maximum levels of inorganic arsenic in foodstuff, (2015).
[39] European Commission - Arsenic in food, (n.d.). https://ec.europa.eu/food/safety/chemical_safety/contaminants/catalogue/arsenic_en (accessed April 25, 2018).
[40] International Agency for Research on Cancer (IARC). Monographs on the Evaluation of Cancerogenic Risks to Humans, Lyon, (2002).
[41] T.S.Y. Choong, T.G. Chuah, Y. Robiah, F.L. Gregory Koay, I. Azni, Arsenic toxicity, health hazards and removal techniques from water: an overview, Desalination. 217 (2007) 139–166.
Chapter 1 – General Introduction
62
[42] G.K.H. Tam, S.M. Charbonneau, F. Bryce, C. Pomroy, E. Sandi, Metabolism of inorganic arsenic (74As) in humans following oral ingestion, Toxicol. Appl. Pharmacol. 50 (1979) 319–322.
[43] H. Garelick, H. Jones, A. Dybowska, E. Valsami-Jones, Arsenic Pollution Sources- Reviews of Environmental Contamination Volume 197: International Perspectives on Arsenic Pollution and Remediation, in: Springer New York, New York, NY, 2008: pp. 17–60.
[44] S. Wang, C.N. Mulligan, Occurrence of arsenic contamination in Canada: Sources, behavior and distribution, Sci. Total Environ. 366 (2006) 701–721.
[45] L.L. Embrick, K.M. Porter, A. Pendergrass, D.J. Butcher, Characterization of lead and arsenic contamination at Barber Orchard, Haywood County, NC, Microchem. J. 81 (2005) 117–121.
[46] International Agency for Research on Cancer (IARC), Arsenic, metals, fibres, and dusts: A review of human carcinogens, (2012). https://www.ncbi.nlm.nih.gov/books/NBK304375/pdf/Bookshelf_NBK304375.pdf (accessed April 25, 2018).
[47] Environmental Protection Agency (EPA). Organic Arsenicals; Product Cancellation Order and Amendments to Terminate Uses (EPA–HQ– OPP–2009–0191; FRL–8437–7), (2009).
[48] Environmental Protection Agency (EPA). National Primary Drinking Water Regulations: Arsenic and Clarifications to Compliance and New Source Contaminants Monitoring; Proposed Rule [40 CFR Parts 141 and 142]Fed Regist, (2000) 38888–38983.
[49] Environmental Protection Agency (EPA). Revised Reregistration Eligibility Decision for MSMA, DSMA, CAMA, and Cacodylic Acid (EPA 738-R-06–021), (2006).
[50] Food and Drug Administration (FDA). Roxarsone (21CFR558.530), (2008) 500–503.
[51] Food Drug Administration (FDA). Arsanilic acid (21CFR558.62), (2008) 413–414.
[52] J.A. Hingston, C.D. Collins, R.J. Murphy, J.N. Lester, Leaching of chromated copper arsenate wood preservatives: A review, Environ. Pollut. 111 (2001) 53–66.
[53] United States Environmental Protection Agency (EPA)- Chromated arsenicals (CAA), (n.d.). https://www.epa.gov/ingredients-used-pesticide-products/chromated-arsenicals-cca (accessed September 8, 2018).
[54] E. Claesson, O. Rod, The effect of alloying elements on the corrosion resistance of brass, Mater. Sci. Technol. 32 (2016) 1794–1803.
[55] D. Mohan, C.U. Pittman, Activated carbons and low cost adsorbents for remediation of tri- and hexavalent chromium from water, J. Hazard. Mater. 137 (2006) 762–811.
Chapter 1 – General Introduction
63
[56] H. Chen, Y.-Y. Zhang, K.-L. Zhong, L.-W. Guo, J.-L. Gu, L. Bo, M.-H. Zhang, J.-R. Li, Selective sampling and measurement of Cr(VI) in water with polyquaternary ammonium salt as a binding agent in diffusive gradients in thin-films technique., J. Hazard. Mater. 271 (2014) 160–5.
[57] J. Farkaš, V. Chrastný, M. Novák, E. Čadkova, J. Pašava, R. Chakrabarti, S.B. Jacobsen, L. Ackerman, T.D. Bullen, Chromium isotope variations (δ53/52Cr) in mantle-derived sources and their weathering products: Implications for environmental studies and the evolution of δ53/52Cr in the Earth’s mantle over geologic time, Geochim. Cosmochim. Acta. 123 (2013) 74–92.
[58] E. Merian, Metals and their compounds in the environment: occurrence, analysis, and biological relevance, New York: VCH Publishers, (1991).
[59] Agency for toxic substances & disease registry, (n.d.). https://www.atsdr.cdc.gov/toxprofiles/tp7-c2.pdf (accessed May 23, 2018).
[60] B.K. Mandal, R. Vankayala, L. Uday Kumar, Speciation of Chromium in Soil and Sludge in the Surrounding Tannery Region, Ranipet, Tamil Nadu, ISRN Toxicol. 2011 (2011) 1–10.
[61] R. Güell, E. Anticó, V. Salvadó, C. Fontàs, Efficient hollow fiber supported liquid membrane system for the removal and preconcentration of Cr(VI) at trace levels, Sep. Purif. Technol. 62 (2008) 389–393.
[62] J. Konczyk, C. Kozlowski, W. Walkowiak, Removal of chromium(III) from acidic aqueous solution by polymer inclusion membranes with D2EHPA and Aliquat 336, Desalination. 263 (2010) 211–216.
[63] V. Gómez, M.P. Callao, Chromium determination and speciation since 2000, TrAC - Trends Anal. Chem. 25 (2006) 1006–1015.
[64] Aalco Metals Limited, Stainless Steel - General Information - Alloying Elements in Stainless Steel, (n.d.). http://www.aalco.co.uk/datasheets/Stainless-Steel_Alloying-Elements-in-Stainless-Steel_98.ashx (accessed May 25, 2018).
[65] G. Parkin, Zinc-Zinc Bonds: A New Frontier, Science. 305 (2004) 1117–1118.
[66] H. Kozlowski, A. Janicka-Klos, J. Brasun, E. Gaggelli, D. Valensin, G. Valensin, Copper, iron, and zinc ions homeostasis and their role in neurodegenerative disorders (metal uptake, transport, distribution and regulation), Coord. Chem. Rev. 253 (2009) 2665–2685.
[67] J. Raulin, Chemical studies on vegetation, Ann. Sci. Nat. 11 (1869) 93–99.
[68] United States Geological Survey (USGS). Zinc Statistics and Information, (n.d.). https://minerals.usgs.gov/minerals/pubs/commodity/zinc/ (accessed June 5, 2018).
[69] W. Yawar, K. Naeem, P. Akhter, I. Rehana, M. Saeed, Assessment of three digestion procedures for Zn contents in Pakistani soil by flame atomic absorption spectrometry, J. Saudi Chem. Soc. 14 (2010) 125–129.
[70] A. Sharma, B. Patni, D. Shankhdhar, S.C. Shankhdhar, Zinc - An Indispensable Micronutrient, Physiol. Mol. Biol. Plants. 19 (2013) 11–20.
Chapter 1 – General Introduction
64
[71] B.J. Alloway, Zinc in soils and crop nutrition, International Zinc Association, Brussels, Belgium, 2008.
[72] World Health Organization (WHO). Chemical hazards in drinking-water: Zinc, (n.d.). http://www.who.int/water_sanitation_health/water-quality/guidelines/chemicals/zinc/en/ (accessed June 6, 2018).
[73] B.L. O’Dell, P.G. Reeves, Zinc Status and Food Intake, in: C.F. Mills (Ed.), Zinc Hum. Biol., Springer London, London, 1989: pp. 173–181.
[74] A.S. Prasad, J.A. Halsted, M. Nadimi, Syndrome of iron deficiency anemia, hepatosplenomegaly, hypogonadism, dwarfism and geophagia, Am. J. Med. 31 (1961) 532–546.
[75] N. Gupta, H. Ram, B. Kumar, Mechanism of Zinc absorption in plants: uptake, transport, translocation and accumulation, Rev. Environ. Sci. Biotechnol. 15 (2016) 89–109.
[76] R. Prasad, Zinc in soils and in plant, human and animal nutrition, Indian J. Fertil. 2 (2006) 103–119.
[77] S. Das, A. Green, Importance of zinc in crops and human health, J. SAT. Agric. Res. 11 (2016) 31–40.
[78] L.M. Plum, L. Rink, H. Hajo, The essential toxin: Impact of zinc on human health, Int. J. Environ. Res. Public Health. 7 (2010) 1342–1365.
[79] R. Bhadekar, S. Pote, V. Tale, B. Nirichan, Developments in Analytical Methods for Detection of Pesticides in Environmental Samples, Am. J. Anal. Chem. 02 (2011) 1–15.
[80] European Comission (EC)- Pesticides, (n.d.). https://ec.europa.eu/food/plant/pesticides_en (accessed May 28, 2018).
[81] R.C. Gilden, K. Huffling, B. Sattler, Pesticides and Health Risks, J. Obstet. Gynecol. Neonatal Nurs. 39 (2010) 103–110.
[82] R. Jayaraj, P. Megha, P. Sreedev, Organochlorine pesticides, their toxic effects on living organisms and their fate in the environment, Interdiscip. Toxicol. 9 (2016) 90–100.
[83] F.P. Carvalho, Agriculture, pesticides, food security and food safety, Environ. Sci. Policy. 9 (2006) 685–692.
[84] F.P. Carvalho, Pesticides, environment, and food safety, Food Energy Secur. 6 (2017) 48–60.
[85] Food and Agriculture Organization (FAO), (n.d.). http://www.fao.org/faostat/en/#home (accessed May 30, 2018).
[86] United States Environmental Protection Agency (EPA)-Pesticides Industry Sales and Usage, 2008-2012 Market estimates, (n.d.). https://www.epa.gov/sites/production/files/2017-01/documents/pesticides-industry-sales-usage-2016_0.pdf (accessed May 30, 2018).
Chapter 1 – General Introduction
65
[87] Forti, R., Henrard, M. (eds.). Agriculture, forestry and fishery statistics, Luxembourg, EU, (2015).
[88] R. Greenhalgh, R. Baron, J. Desmoras, R. Engst, H. Esser, W. Klein, Definition of Persistence in Pesticide Chemistry, Int. Union Pure Appl. Chem. 52 (1980) 2563–66.
[89] E. Herrero-Hernández, M.S. Andrades, A. Álvarez-Martín, E. Pose-Juan, M.S. Rodríguez-Cruz, M.J. Sánchez-Martín, Occurrence of pesticides and some of their degradation products in waters in a Spanish wine region, J. Hydrol. 486 (2013) 234–245.
[90] Z. Likudis, V. Costarelli, A. Vitoratos, C. Apostolopoulos, Determination of pesticide residues in olive oils with protected geographical indication or designation of origin, Int. J. Food Sci. Technol. 49 (2014) 484–492.
[91] A. Lozano, S. Uclés, A. Uclés, C. Ferrer, A.R. Fernández-Alba, Pesticide Residue Analysis in Fruit- and Vegetable-Based Baby Foods Using GC-Orbitrap MS, J. AOAC Int. (2018) 374–382.
[92] European Comission (EC)-Sustainable use of pesticides, (n.d.). https://ec.europa.eu/food/plant/pesticides/sustainable_use_pesticides_en (accessed September 15, 2018).
[93] ATS environmental services- Pesticides in drinking water, (n.d.). http://www.atsenvironmental.com/residential/water/contaminants/list/pesticides/ (accessed May 31, 2018).
[94] Organisation for Economic Cooperation and Development (OECD)- Water use in agriculture, (n.d.). http://www.oecd.org/agriculture/water-use-in-agriculture.htm (accessed May 31, 2018).
[95] E.D. Ongley, Control of water pollution from agriculture - FAO irrigation and drainage paper 55, in: FAO, 1996.
[96] Stockholm convention on persistent organic pollutants, (2001). http://www.pops.int (accessed June 1, 2018).
[97] Safe Drinking Water Fundation (SDWF)- Pesticides and water pollution, (n.d.). https://www.safewater.org/fact-sheets-1/2017/1/23/pesticides (accessed May 30, 2018).
[98] A. Kienzler, S.K. Bopp, S. van der Linden, E. Berggren, A. Worth, Regulatory assessment of chemical mixtures: Requirements, current approaches and future perspectives, Regul. Toxicol. Pharmacol. 80 (2016) 321–334.
[99] J. Pretty, The pesticide detox: Towards a more sustainable agriculture, Routledge, London (UK), 2012.
[100] R. Vera, S. Insa, C. Fontàs, E. Anticó, A new extraction phase based on a polymer inclusion membrane for the detection of chlorpyrifos, diazinon and cyprodinil in natural water samples, Talanta. 185 (2018) 291–298.
[101] K.Z. Guyton, D. Loomis, Y. Grosse, F. El Ghissassi, L. Benbrahim-Tallaa, N.
Chapter 1 – General Introduction
66
Guha, C. Scoccianti, H. Mattock, K. Straif, Carcinogenicity of tetrachlorvinphos, parathion, malathion, diazinon, and glyphosate, Lancet Oncol. 16 (2015) 490–491.
[102] N. Petsikos-Panayotarou, E. Markellou, A.E. Kalamarakis, D. Kyriakopoulou, N.E. Malathrakis, In vitro and in vivo activity of cyprodinil and pyrimethanil on Botrytis cinerea isolates resistant to other botryticides and selection for resistance to pyrimethanil in a greenhouse population in Greece, Eur. J. Plant Pathol. 109 (2003) 173–182.
[103] B. Forster, T. Staub, Basis for use strategies of anilinopyrimidine and phenylpyrrole fungicides against Botrytis cinerea, Crop Prot. 15 (1996) 529–537.
[104] C.C. Fang, F.Y. Chen, C.R. Chen, C.C. Liu, L.C. Wong, Y.W. Liu, J.G.J. Su, Cyprodinil as an activator of aryl hydrocarbon receptor, Toxicology. 304 (2013) 32–40.
[105] A. Pal, K.Y.H. Gin, A.Y.C. Lin, M. Reinhard, Impacts of emerging organic contaminants on freshwater resources: Review of recent occurrences, sources, fate and effects, Sci. Total Environ. 408 (2010) 6062–6069.
[106] S. Rist, B. Carney Almroth, N.B. Hartmann, T.M. Karlsson, A critical perspective on early communications concerning human health aspects of microplastics, Sci. Total Environ. 626 (2018) 720–726.
[107] D.L. Johnson, M.E.Q. Pilson, Spectrophotometric determination of arsenite, arsenate, and phosphate in natural waters, Anal. Chim. Acta. 58 (1972) 289–299.
[108] M.H. Arbab-Zavar, M. Hashemi, Evaluation of electrochemical hydride generation for spectrophotometric determination of As(III) by silver diethyldithiocarbamate, Talanta. 52 (2000) 1007–1014.
[109] H. Revanasiddappa, B. Dayananda, T. Kumar, A sensitive spectrophotometric method for the determination of arsenic in environmental samples, Environ. Chem. Lett. 5 (2007) 151–155.
[110] J.A. Platte, V.M. Marcy, Photometric Determination of Zinc with Zincon: Application to Water Containing Heavy Metals, Anal. Chem. 31 (1959) 1226–1228.
[111] R. Kashanaki, H. Ebrahimzadeh, M. Moradi, B. Hazer, T. Duan, X. Zhang, J. Dědina, D.J. Thomas, M. Stýblo, Ultrasound-assisted supramolecular solvent microextraction coupled with graphite furnace atomic absorption spectrometry for speciation analysis of inorganic arsenic, Anal. Methods. 9 (2017) 3121–3127.
[112] V.N. Alves, T.S. Neri, S.S.O. Borges, D.C. Carvalho, N.M.M. Coelho, Determination of inorganic arsenic in natural waters after selective extraction using Moringa oleífera seeds, Ecol. Eng. 106 (2017) 431–435.
[113] G.M. dos Santos, D. Pozebon, C. Cerveira, D.P. de Moraes, Inorganic arsenic speciation in rice products using selective hydride generation and atomic absorption spectrometry (AAS), Microchem. J. 133 (2017) 265–271.
[114] M.L. Susko, M.S. Bloom, I.A. Neamtiu, A.A. Appleton, S. Surdu, C. Pop, E.F. Fitzgerald, D. Anastasiu, E.S. Gurzau, Low-level arsenic exposure via drinking
Chapter 1 – General Introduction
67
water consumption and female fecundity - A preliminary investigation, Environ. Res. 154 (2017) 120–125.
[115] H.I. Ulusoy, M. Akçay, S. Ulusoy, R. Gürkan, Determination of ultra trace arsenic species in water samples by hydride generation atomic absorption spectrometry after cloud point extraction, Anal. Chim. Acta. 703 (2011) 137–144.
[116] G. Chen, B. Lai, X. Mao, T. Chen, M. Chen, Continuous Arsine Detection Using a Peltier-Effect Cryogenic Trap to Selectively Trap Methylated Arsines, Anal. Chem. 89 (2017) 8678–8682.
[117] W. Zhang, Y. Qi, D. Qin, J. Liu, X. Mao, G. Chen, C. Wei, Y. Qian, Determination of inorganic arsenic in algae using bromine halogenation and on-line nonpolar solid phase extraction followed by hydride generation atomic fluorescence spectrometry, Talanta. 170 (2017) 152–157.
[118] H. Luo, X. Wang, R. Dai, Y. Liu, X. Jiang, X. Xiong, K. Huang, Simultaneous determination of arsenic and cadmium by hydride generation atomic fluorescence spectrometry using magnetic zero-valent iron nanoparticles for separation and pre-concentration, Microchem. J. 133 (2017) 518–523.
[119] X.P. Lu, X.A. Yang, L. Liu, H.H. Hu, W.B. Zhang, Selective and sensitive determination of As(III) and tAs in Chinese herbal medicine samples using L-cysteine modified carbon paste electrode-based electrolytic hydride generation and AFS analysis, Talanta. 165 (2017) 258–266.
[120] P. Avino, G. Capannesi, A. Rosada, Ultra-trace nutritional and toxicological elements in Rome and Florence drinking waters determined by Instrumental Neutron Activation Analysis, Microchem. J. 97 (2011) 144–153.
[121] R. Güell, E. Anticó, S.D. Kolev, J. Benavente, V. Salvadó, C. Fontàs, Development and characterization of polymer inclusion membranes for the separation and speciation of inorganic As species, J. Memb. Sci. 383 (2011) 88–95.
[122] C. Fontàs, R. Vera, A. Batalla, S.D. Kolev, E. Anticó, A novel low-cost detection method for screening of arsenic in groundwater, Environ. Sci. Pollut. Res. 21 (2013) 11682–8.
[123] R. Vera, C. Fontàs, E. Anticó, Titanium dioxide solid phase for inorganic species adsorption and determination: the case of arsenic, Environ. Sci. Pollut. Res. (2016) 1–10.
[124] K.M. Attar, K. Alam, Spectral interferences on arsenic and mercury prominent emission lines in vacuum inductively coupled plasma-atomic emission spectrometry and use of methanol vapor as optical filter for spectral order sorting, Spectrochim. Acta Part B At. Spectrosc. 45 (1990) 221–232.
[125] V. Dufailly, L. Noël, T. Guérin, Optimisation and critical evaluation of a collision cell technology ICP-MS system for the determination of arsenic in foodstuffs of animal origin, Anal. Chim. Acta. 611 (2008) 134–142.
[126] K. Nan, M. He, B. Chen, Y. Chen, B. Hu, Arsenic speciation in tree moss by mass spectrometry based hyphenated techniques, Talanta. 183 (2018) 48–54.
Chapter 1 – General Introduction
68
[127] E.H. Larsen, S. Sturup, Carbon-enhanced inductively coupled plasma mass spectrometric detection of arsenic and selenium and its application to arsenic speciation, J. Anal. At. Spectrom. 9 (1994) 1099–1105.
[128] P. Montoro Leal, E. Vereda Alonso, M.M. López Guerrero, M.T.S. Cordero, J.M. Cano Pavón, A. García de Torres, Speciation analysis of inorganic arsenic by magnetic solid phase extraction on-line with inductively coupled mass spectrometry determination, Talanta. 184 (2018) 251–259.
[129] S. Ata, F.H. Wattoo, M. Ahmed, M.H.S. Wattoo, S.A. Tirmizi, A. Wadood, A method optimization study for atomic absorption spectrophotometric determination of total zinc in insulin using direct aspiration technique, Alexandria J. Med. 51 (2015) 19–23.
[130] M. Archer, R.I. McCrindle, E.R. Rohwer, Analysis of cobalt, tantalum, titanium, vanadium and chromium in tungsten carbide by inductively coupled plasma-optical emission spectrometry, J. Anal. At. Spectrom. 18 (2003) 1493–1496.
[131] Z.L. Chen, M. Megharaj, R. Naidu, Removal of interferences in the speciation of chromium using an octopole reaction system in ion chromatography with inductively coupled plasma mass spectrometry, Talanta. 73 (2007) 948–952.
[132] United States Environmental Protection Agency (EPA). Standardized Analytical Methods for Environmental Restoration Following Homeland Security Events—Revision 5.0; EPA-United States Environmental Protection Agency: Cincinnati, OH, USA, (2009).
[133] D. Barceló, Environmental Protection Agency and other methods for the determination of priority pesticides and their transformation products in water, J. Chromatogr. A. 643 (1993) 117–143.
[134] L. Alder, K. Greulich, G. Kempe, B. Vieth, Residue analysis of 500 high priority pesticides: better by GC-MS or LC-MS/MS?, Mass Spectrom. Rev. 25 (2006) 838–865.
[135] M.M. Gómez-Ramos, C. Ferrer, O. Malato, A. Agüera, A.R. Fernández-Alba, Liquid chromatography-high-resolution mass spectrometry for pesticide residue analysis in fruit and vegetables: Screening and quantitative studies, J. Chromatogr. A. 1287 (2013) 24–37.
[136] A. Gonzalvez, M.L. Cervera, S. Armenta, M. de la Guardia, A review of non-chromatographic methods for speciation analysis, Anal. Chim. Acta. 636 (2009) 129–157.
[137] Z.L. Chen, M. Megharaj, R. Naidu, Speciation of chromium in waste water using ion chromatography inductively coupled plasma mass spectrometry, Talanta. 72 (2007) 394–400.
[138] A.C. Sahayam, Speciation of Cr(III) and Cr(VI) in potable waters by using activated neutral alumina as collector and ET-AAS for determination, Anal. Bioanal. Chem. 372 (2002) 840–842.
[139] H. Filik, M. Doǧutan, R. Apak, Speciation analysis of chromium by separation on a 5-palmitoyl oxine-functionalized XAD-2 resin and spectrophotometric
Chapter 1 – General Introduction
69
determination with diphenylcarbazide, Anal. Bioanal. Chem. 376 (2003) 928–933.
[140] S. Cathum, C. Brown, W. Wong, Determination of Cr3+, CrO42-, and Cr2O72- in environmental matrixes by high-performance liquid chromatography with diode-array detection (HPLC-DAD), Anal. Bioanal. Chem. 373 (2002) 103–110.
[141] C. Cui, M. He, B. Chen, B. Hu, Chitosan modified magnetic nanoparticles based solid phase extraction combined with ICP-OES for the speciation of Cr(III) and Cr(VI), Anal. Methods. 6 (2014) 8577–8583.
[142] M. Tuzen, M. Soylak, Multiwalled carbon nanotubes for speciation of chromium in environmental samples, J. Hazard. Mater. 147 (2007) 219–225.
[143] D. Chen, C. Huang, M. He, B. Hu, Separation and preconcentration of inorganic arsenic species in natural water samples with 3-(2-aminoethylamino) propyltrimethoxysilane modified ordered mesoporous silica micro-column and their determination by inductively coupled plasma optical emission, J. Hazard. Mater. 164 (2009) 1146–1151.
[144] C. Xiong, Y. Qin, B. Hu, On-line separation/preconcentration of V(IV)/V(V) in environmental water samples with CTAB-modified alkyl silica microcolumn and their determination by inductively coupled plasma-optical emission spectrometry, J. Hazard. Mater. 178 (2010) 164–170.
[145] D.M. Di Toro, C.D. Kavvadas, R. Mathew, P.R. Paquin, The persistence and availability of metals in aquatic environments, Internatio Council on Metals and Environment (ICME), Ottawa, Canada, 2001.
[146] C.M. Zhao, P.G.C. Campbell, K.J. Wilkinson, When are metal complexes bioavailable?, Environ. Chem. 13 (2016) 425–433.
[147] G. Kefala, A. Economou, A. Voulgaropoulos, M. Sofoniou, A study of bismuth-film electrodes for the detection of trace metals by anodic stripping voltammetry and their application to the determination of Pb and Zn in tapwater and human hair, Talanta. 61 (2003) 603–610.
[148] C.M.G. van den Berg, P.J.M. Buckley, Z.Q. Huang, M. Nimmo, An Electrochemical Study of the Speciation of Copper, Zinc and Iron in Two Estuaries in England, Estuar. Coast. Shelf Sci. 22 (1986) 479–486.
[149] R. Matarese Palmieri, L. La Pera, G. Di Bella, G. Dugo, Simultaneous determination of Cd(II), Cu(II), Pb(II) and Zn(II) by derivative stripping chronopotentiometry in Pittosporum tobira leaves: A measurement of local atmospheric pollution in Messina (Sicily, Italy), Chemosphere. 59 (2005) 1161–1168.
[150] D. Aguilar, C. Parat, J. Galceran, E. Companys, J. Puy, L. Authier, M. Potin-Gautier, Determination of free metal ion concentrations with AGNES in low ionic strength media, J. Electroanal. Chem. 689 (2013) 276–283.
[151] M. Pesavento, G. Alberti, R. Biesuz, Analytical methods for determination of free metal ion concentration, labile species fraction and metal complexation capacity of environmental waters: A review, Anal. Chim. Acta. 631 (2009) 129–141.
Chapter 1 – General Introduction
70
[152] E.J.J. Kalis, L. Weng, F. Dousma, E.J.M. Temminghoff, W.H. Van Riemsdijk, Measuring Free Metal Ion Concentrations in Multicomponent Solutions Using the Donnan Membrane Technique Measuring Free Metal Ion Concentrations in Multicomponent Solutions Using the Donnan Membrane Technique, Enviromental Sci. Technol. 40 (2006) 955–961.
[153] A. Gramlich, S. Tandy, E. Frossard, J. Eikenberg, R. Schulin, Diffusion limitation of zinc fluxes into wheat roots, PLM and DGT devices in the presence of organic ligands, Environ. Chem. 11 (2014) 41–50.
[154] I.J. Allan, J. Knutsson, N. Guigues, G.A. Mills, A.-M. Fouillac, R. Greenwood, Chemcatcher® and DGT passive sampling devices for regulatory monitoring of trace metals in surface water, J. Environ. Monit. 10 (2008) 821.
[155] V.S. Kislik, ed., Liquid membranes, Principles & Applications in Chemical Separations & Wastewater treatment, Elsevier Science, Oxford (UK), 2010.
[156] S. Bayen, K.J. Wilkinson, J. Buffle, The permeation liquid membrane as a sensor for free nickel in aqueous samples, Analyst. 132 (2007) 262–267.
[157] V.I. Slaveykova, N. Parthasarathy, J. Buffle, K.J. Wilkinson, Permeation liquid membrane as a tool for monitoring bioavailable Pb in natural waters., Sci. Total Environ. 328 (2004) 55–68.
[158] S. Bayen, I. Worms, N. Parthasarathy, K. Wilkinson, J. Buffle, Cadmium bioavailability and speciation using the permeation liquid membrane, Anal. Chim. Acta. 575 (2006) 267–273.
[159] A. Gramlich, S. Tandy, V.I. Slaveykova, A. Duffner, R. Schulin, The use of permeation liquid membranes for free zinc measurements in aqueous solution, Environ. Chem. 9 (2012) 429–437.
[160] C. Fontàs, E. Anticó, V. Salvadó, Design of a Hollow Fiber Supported Liquid Membrane System for Zn Speciation in Natural Waters, Membranes (Basel). 8 (2018) 88.
[161] J. Stocka, M. Tankiewicz, M. Biziuk, J. Namie, Green Aspects of Techniques for the Determination of Currently Used Pesticides in Environmental Samples, Int. J. Mol. Sci. (2011) 7785–7805.
[162] A.M. St John, S.D. Kolev, C. Fontàs, Polymer inclusion membranes for the separation of uranium and arsenic from dilute aqueous solutions, in: A. Figoli, J. Hoinkis, J. Bundschuh (Eds.), Membr. Technol. Water Treat. Remov. Toxic Trace Elem. with Emphas. Arsenic, Fluoride Uranium (Sustainable Water Dev., CRC Press, Boca Raton, 2016: pp. 179–200.
[163] E. Anticó, Estudis de sistemes líquid-líquid i sòlid-líquid en processos de separació de metalls valuosos, Pd(II) i Y(III), Tesi Doctoral, Universitat Autònoma de Barcelona, 1995.
[164] L.C. Branco, J.G. Crespo, C.A.M. Afonso, Studies on the selective transport of organic compounds by using ionic liquids as novel supported liquid membranes, Chemistry. 8 (2002) 3865–71.
Chapter 1 – General Introduction
71
[165] P.R. Danesi, Separation of Metal Species by Supported Liquid Membranes, Sep. Sci. Technol. 19 (1984) 857–894.
[166] C. Rios, V. Salvadó, M. Hidalgo, Facilitated transport and preconcentration of the herbicide glyphosate and its metabolite AMPA through a solid supported liquid-membrane, J. Memb. Sci. 203 (2002) 201–208.
[167] R. Güell, C. Fontàs, V. Salvadó, E. Anticó, Modelling of liquid-liquid extraction and liquid membrane separation of arsenic species in environmental matrices, Sep. Purif. Technol. 72 (2010) 319–325.
[168] M.A. Aguirre, E.J. Selva, M. Hidalgo, A. Canals, Dispersive liquid-liquid microextraction for metals enrichment: A useful strategy for improving sensitivity of laser-induced breakdown spectroscopy in liquid samples analysis, Talanta. 131 (2015) 348–353.
[169] P. Biparva, A.A. Matin, Microextraction Techniques as a Sample Preparation Step for Metal Analysis, At. Absorpt. Spectrosc. 258 (2012) 62–88.
[170] H. Farahani, Y. Yamini, S. Shariati, M.R. Khalili-Zanjani, S. Mansour-Baghahi, Development of liquid phase microextraction method based on solidification of floated organic drop for extraction and preconcentration of organochlorine pesticides in water samples., Anal. Chim. Acta. 626 (2008) 166–73.
[171] L. Fu, X. Liu, J. Hu, X. Zhao, H. Wang, X. Wang, Application of dispersive liquid-liquid microextraction for the analysis of triazophos and carbaryl pesticides in water and fruit juice samples., Anal. Chim. Acta. 632 (2009) 289–95.
[172] A. Andrade-Eiroa, M. Canle, V. Leroy-Cancellieri, V. Cerdà, Solid-phase extraction of organic compounds: A critical review (Part I), TrAC Trends Anal. Chem. 80 (2016) 655–667.
[173] B.C. Mondal, D. Das, A.K. Das, Synthesis and characterization of a new resin functionalized with 2-naphthol-3,6-disulfonic acid and its application for the speciation of chromium in natural water, Talanta. 56 (2002) 145–152.
[174] I. Kubrakova, T. Kudinova, A. Formanovsky, N. Kuzmin, Determination of Chromium(III) and Chromium(VI) in River Water by Electrothermal Atomic Absorption Spectrometry After Sorption Preconcentration in a Microwave Field, Analyst. 119 (1994) 2477–2480.
[175] P. Su-Cheng, Pre-concentration efficiency of chelex-100 resin for heavy metals in seawater. Part 2. Distribution of Heavy Metals on a Chelex-100 Column and Optimization of the Column Efficiency by a Plate Simulation Method, Anal. Chim. Acta. 211 (1988) 271–280.
[176] S. Bhowmick, S. Chakraborty, P. Mondal, W. Van Renterghem, S. Van den Berghe, G. Roman-Ross, D. Chatterjee, M. Iglesias, Montmorillonite-supported nanoscale zero-valent iron for removal of arsenic from aqueous solution: Kinetics and mechanism, Chem. Eng. J. 243 (2014) 14–23.
[177] J.C. Hsu, C.J. Lin, C.H. Liao, S.T. Chen, Removal of As(V) and As(III) by reclaimed iron-oxide coated sands, J. Hazard. Mater. 153 (2008) 817–826.
Chapter 1 – General Introduction
72
[178] S. Ayoob, A.K. Gupta, P.B. Bhakat, Analysis of breakthrough developments and modeling of fixed bed adsorption system for As(V) removal from water by modified calcined bauxite (MCB), Sep. Purif. Technol. 52 (2007) 430–438.
[179] G.P. Gillman, A simple technology for arsenic removal from drinking water using hydrotalcite, Sci. Total Environ. 366 (2006) 926–931.
[180] M.Z. López Paraguay, J.A. Cortes, J.F. Pérez-Robles, M.T. Alarcón-Herrera, Adsorption of Arsenite from Groundwater Using Titanium Dioxide, Clean - Soil, Air, Water. 42 (2014) 713–721.
[181] D. Mohan, C.U. Pittman, Arsenic removal from water/wastewater using adsorbents-A critical review, J. Hazard. Mater. 142 (2007) 1–53.
[182] X. Guan, J. Du, X. Meng, Y. Sun, B. Sun, Q. Hu, Application of titanium dioxide in arsenic removal from water: A review, J. Hazard. Mater. 215–216 (2012) 1–16.
[183] C. Arthur, J. Pawliszyn, Solid phase microextraction with thermal desorption using fused silica optical fibers, Anal. Chem. 62 (1990) 2145–2148.
[184] D. García-Rodríguez, A.M. Carro, R. Lorenzo, F. Fernández, R. Cela, Determination of trace levels of aquaculture chemotherapeutants in seawater samples by SPME-GC-MS/MS., J. Sep. Sci. 31 (2008) 2882–90.
[185] K. Korba, L. Pelit, F.O. Pelit, K.V. Ozdokur, H. Ertaş, A.E. Eroğlu, F.N. Ertaş, Preparation and characterization of sodium dodecyl sulfate doped polypyrrole solid phase micro extraction fiber and its application to endocrine disruptor pesticide analysis, J. Chromatogr. B. 929 (2013) 90–6.
[186] J.M.F. Nogueira, Stir-bar sorptive extraction: 15 years making sample preparation more environment-friendly, TrAC Trends Anal. Chem. 71 (2015) 214–223.
[187] F. Zare, M. Ghaedi, A. Daneshfar, A. Ostovan, Magnetic molecularly imprinted polymer for the efficient and selective preconcentration of diazinon before its determination by high-performance liquid chromatography, J. Sep. Sci. 38 (2015) 2797–803.
[188] A. Martin, C. Margoum, J. Randon, M. Coquery, Silicone rubber selection for passive sampling of pesticides in water, Talanta. 160 (2016) 306–313.
[189] R. Montes, I. Rodríguez, E. Rubí, M. Ramil, R. Cela, Suitability of polypropylene microporous membranes for liquid- and solid-phase extraction of halogenated anisoles from water samples, J. Chromatogr. A. 1198–1199 (2008) 21–6.
[190] L. Nghiem, P. Mornane, I. Potter, J. Perera, R. Cattrall, S. Kolev, Extraction and transport of metal ions and small organic compounds using polymer inclusion membranes (PIMs), J. Memb. Sci. 281 (2006) 7–41.
[191] A. Figoli, Chapter 7 - Liquid Membrane in Gas Separations, in: V.S.B.T.-L.M. Kislik (Ed.), Liq. Membr., Elsevier, Amsterdam, 2010: pp. 327–356.
[192] C. Fontàs, Disseny i Caracterització de Sistemes de Membrana Líquida per al Transport de Metalls del Grup del Platí, Tesi Doctoral, Universitat de Girona, 2001.
Chapter 1 – General Introduction
73
[193] Matsuura T, Synthetic membranes and membrane separation processes. Boca Raton, USA: CRC Press, (1994).
[194] B. Pospiech, W. Kujawski, Ionic liquids as selective extractants and ion carriers of heavy metal ions from aqueous solutions utilized in extraction and membrane separation, Rev Chem Eng. 31 (2015) 179–191.
[195] M. Sugiura, M. Kikkawa, S. Urita, Effect of Plasticizer on Carrier-Mediated Transport of Zinc Ion through Cellulose Triacetate Membranes, Sep. Sci. Technol. 22 (1987) 2263–2268.
[196] M.I.G.S. Almeida, R.W. Cattrall, S.D. Kolev, Polymer inclusion membranes (PIMs) in chemical analysis - A review, Anal. Chim. Acta. 987 (2017) 1–14.
[197] J. Buffle, N. Parthasarathy, L. Djane, L. Matthiasson, Permeation liquid membranes for field analysis and speciation of trace compounds in waters, in: J. Buffle, G. Horvai (Eds.), Situ Monit. Aquat. Syst. Chem. Anal. Speciat., John and Wiley & Sons Ltd., West Sussex, UK, 2000: pp. 407–493.
[198] J. Rais, C. V Mason, K.D. Abney, Use of PVC Plasticized Membranes for Uptake of Radioactive Cesium and Strontium, Sep. Sci. Technol. 32 (1997) 951–969.
[199] J.S. Gardner, J.O. Walker, J.D. Lamb, Permeability and durability effects of cellulose polymer variation in polymer inclusion membranes, J. Memb. Sci. 229 (2004) 87–93.
[200] A.L. Ocampo, J.C. Aguilar, E. Rodríguez de San Miguel, M. Monroy, P. Roquero, J. de Gyves, Novel proton-conducting polymer inclusion membranes, J. Memb. Sci. 326 (2009) 382–387.
[201] L. Guo, Y. Liu, C. Zhang, J. Chen, Preparation of PVDF-based polymer inclusion membrane using ionic liquid plasticizer and Cyphos IL 104 carrier for Cr(VI) transport, J. Memb. Sci. 372 (2011) 314–321.
[202] L. Guo, J. Zhang, D. Zhang, Y. Liu, Y. Deng, J. Chen, Preparation of poly(vinylidene fluoride-co-tetrafluoroethylene)-based polymer inclusion membrane using bifunctional ionic liquid extractant for Cr(VI) transport, Ind. Eng. Chem. Res. 51 (2012) 2714–2722.
[203] Y.Y.N. Bonggotgetsakul, R.W. Cattrall, S.D. Kolev, Recovery of gold from aqua regia digested electronic scrap using a poly(vinylidene fluoride-co-hexafluoropropene) (PVDF-HFP) based polymer inclusion membrane (PIM) containing Cyphos® IL 104, J. Memb. Sci. 514 (2016) 274–281.
[204] Y. O’Bryan, R.W. Cattrall, Y.B. Truong, I.L. Kyratzis, S.D. Kolev, The use of poly(vinylidenefluoride-co-hexafluoropropylene) for the preparation of polymer inclusion membranes. Application to the extraction of thiocyanate, J. Memb. Sci. 510 (2016) 481–488.
[205] M.I.G.S. Almeida, R.W. Cattrall, S.D. Kolev, Recent trends in extraction and transport of metal ions using polymer inclusion membranes (PIMs), J. Memb. Sci. 415–416 (2012) 9–23.
[206] Y.J. Wang, D. Kim, The effect of F127 addition on the properties of PEGDA/PVdF
Chapter 1 – General Introduction
74
cross-linked gel polymer electrolytes, J. Memb. Sci. 312 (2008) 76–83.
[207] L. Zhao, H. Zhang, X. Li, C. Zhao, X. Yuan, Modification of Electrospun Poly(vinylidene fluoride-co-hexafluoropropylene) Membranes Through the Introduction of Poly(ethylene glycol) Dimethacrylate, J. Appl. Polym. Sci. 111 (2009) 3104–3112.
[208] Y. O’Bryan, Y.B. Truong, R.W. Cattrall, I.L. Kyratzis, S.D. Kolev, A new generation of highly stable and permeable polymer inclusion membranes (PIMs) with their carrier immobilized in a crosslinked semi-interpenetrating polymer network . Application to the transport of thiocyanate, J. Memb. Sci. 529 (2017) 55–62.
[209] Poly(vinylidene fluoride-co-hexafluoropropylene)- Sigma Aldrich, (n.d.). https://www.sigmaaldrich.com/catalog/product/aldrich/427160?lang=es®ion=ES (accessed October 5, 2018).
[210] O. Kebiche-Senhadji, L. Mansouri, S. Tingry, P. Seta, M. Benamor, Facilitated Cd(II) transport across CTA polymer inclusion membrane using anion (Aliquat 336) and cation (D2EHPA) metal carriers, J. Memb. Sci. 310 (2008) 438–445.
[211] M. Resina, J. Macan, J. De Gyves, M. Mu, Zn(II), Cd(II) and Cu(II) separation through organic–inorganic Hybrid Membranes containing di (2-ethylhexyl) phosphoric acid or di-(2-ethylhexyl) dithiophosphoric acid as a carrier, J. Memb. Sci. 268 (2006) 57–64.
[212] S.E. Fry, N.J. Pienta, Effects of Molten Salts on Reactions. Nucleophilic Aromatic Substitution by Halide Ions in Molten Dodecyltributylphosphonium Salts1, J. Am. Chem. Soc. 107 (1985) 6399–6400.
[213] J.A. Boon, J.A. Levisky, J.L. Pflug, J.S. Wilkes, Friedel-Crafts Reactions in Ambient-Temperature Molten Salts, J. Org. Chem. 51 (1986) 480–483.
[214] P.S. Kulkarni, L.C. Branco, J.G. Crespo, M.C. Nunes, A. Raymundo, C.A.M. Afonso, Comparison of physicochemical properties of new ionic liquids based on imidazolium, quaternary ammonium, and guanidinium cations., Chemistry. 13 (2007) 8478–88.
[215] A. Stojanovic, B.K. Keppler, Ionic Liquids as Extracting Agents for Heavy Metals, Sep. Sci. Technol. 47 (2012) 189–203.
[216] J.-P. Mikkola, P. Virtanen, R. Sjöholm, Aliquat 336®—a versatile and affordable cation source for an entirely new family of hydrophobic ionic liquids, Green Chem. 8 (2006) 250.
[217] C. Fontàs, R. Vera, A. Batalla, S.D. Kolev, E. Anticó, A novel low-cost detection method for screening of arsenic in groundwater., Environ. Sci. Pollut. Res. 21 (2014) 11682–8.
[218] O. Kebiche-Senhadji, S. Tingry, P. Seta, M. Benamor, Selective extraction of Cr(VI) over metallic species by polymer inclusion membrane (PIM) using anion (Aliquat 336) as carrier, Desalination. 258 (2010) 59–65.
[219] S.D. Kolev, M.I.G.S. Almeida, R.W. Cattrall, Polymer Inclusion membranes, in:
Chapter 1 – General Introduction
75
Handb. Membr. Sep. Chem. Pharm. Food Biotechnol. Appl., CRC Press, Boca Raton, New York (United States), 2015: pp. 721–737.
[220] M. Resina, Desenvolupament de noves membranes per a la millora de la seva estabilitat, Tesi Doctoral, Universitat Autònoma de Barcelona, 2008.
[221] C. Fontàs, R. Tayeb, M. Dhahbi, E. Gaudichet, F. Thominette, P. Roy, K. Steenkeste, M.P. Fontaine-Aupart, S. Tingry, E. Tronel-Peyroz, P. Seta, Polymer inclusion membranes: The concept of fixed sites membrane revised, J. Memb. Sci. 290 (2007) 62–72.
[222] C.A. Kozlowski, W. Walkowiak, Transport of Cr(VI), Zn(II), and Cd(II) Ions Across Polymer Inclusion Membranes with Tridecyl(pyridine) Oxide and Tri-n-Octylamine, Sep. Sci. Technol. 39 (2004) 3127–3141.
[223] C. Fontàs, R. Tayeb, S. Tingry, M. Hidalgo, P. Seta, Transport of platinum(IV) through supported liquid membrane (SLM) and polymeric plasticized membrane (PPM), J. Memb. Sci. 263 (2005) 96–102.
[224] F.E. Mercader-Trejo, E.R. de San Miguel, J. de Gyves, Mercury(II) removal using polymer inclusion membranes containing Cyanex 471X, J. Chem. Technol. Biotechnol. 84 (2009) 1323–1330.
[225] M.I. Vázquez, V. Romero, C. Fontàs, E. Anticó, J. Benavente, Polymer inclusion membranes (PIMs) with the ionic liquid (IL) Aliquat 336 as extractant: Effect of base polymer and IL concentration on their physical–chemical and elastic characteristics, J. Memb. Sci. 455 (2014) 312–319.
[226] L. Wang, W. Shen, Chemical and morphological stability of Aliquat 336 / PVC membranes in membrane extraction : A preliminary study, Sep. Purif. Technol. 46 (2005) 51–62.
[227] A. Bhattacharyya, P.K. Mohapatra, P.A. Hassan, V.K. Manchanda, Studies on the selective Am3+ transport, irradiation stability and surface morphology of polymer inclusion membranes containing Cyanex-301 as carrier extractant, J. Hazard. Mater. 192 (2011) 116–123.
[228] A. Kaya, C. Onac, H.K. Alpoguz, A. Yilmaz, N. Atar, Removal of Cr(VI) through calixarene based polymer inclusion membrane from chrome plating bath water, Chem. Eng. J. 283 (2016) 141–149.
[229] S.A. Ansari, P.K. Mohapatra, V.K. Manchanda, Cation transport across plasticized polymeric membranes containing N,N,N’,N’-tetraoctyl-3-oxapentanediamide(TODGA) as the carrier, Desalination. 262 (2010) 196–201.
[230] E.R. De San Miguel, A. V. Garduño-García, J.C. Aguilar, J. De Gyves, Gold(III) transport through polymer inclusion membranes: Efficiency factors and pertraction mechanism using Kelex 100 as carrier, Ind. Eng. Chem. Res. 46 (2007) 2861–2869.
[231] E. Rodríguez de San Miguel, M. Monroy-Barreto, J.C. Aguilar, A.L. Ocampo, J. de Gyves, Structural effects on metal ion migration across polymer inclusion membranes: Dependence of membrane properties and transport profiles on the weight and volume fractions of the components, J. Memb. Sci. 379 (2011) 416–
Chapter 1 – General Introduction
76
425.
[232] P.K. Mohapatra, D.S. Lakshmi, A. Bhattacharyya, V.K. Manchanda, Evaluation of polymer inclusion membranes containing crown ethers for selective cesium separation from nuclear waste solution, J. Hazard. Mater. 169 (2009) 472–479.
[233] O. Arous, M. Amara, H. Kerdjoudj, Selective Transport of Metal Ions Using Polymer Inclusion Membranes Containing Crown Ethers and Cryptands, Arab. J. Sci. Eng. 35 (2010).
[234] G. Elias, E. Marguí, S. Díez, C. Fontàs, Polymer Inclusion Membrane as an Effective Sorbent to Facilitate Mercury Storage and Detection by X-ray Fluorescence in Natural Waters, Anal. Chem. 90 (2018) 4756–4763.
[235] E. Fontananova, Impedance Spectroscopy, Membrane Characterization by BT - Encyclopedia of Membranes, in: E. Drioli, L. Giorno (Eds.), Springer Berlin Heidelberg, Berlin, Heidelberg, 2016: pp. 1025–1027.
[236] A. Yilmaz, G. Arslan, A. Tor, I. Akin, Selectively facilitated transport of Zn(II) through a novel polymer inclusion membrane containing Cyanex 272 as a carrier reagent, Desalination. 277 (2011) 301–307.
[237] G.J. Moody, R.B. Oke, J.D.R. Thomas, A calcium-sensitive electrode based on a liquid ion exchanger in a poly(vinyl chloride) matrix, Analyst. 95 (1970) 910–918.
[238] E. Bakker, E. Pretsch, Potentiometric sensors for trace-level analysis, TrAC Trends Anal. Chem. 24 (2005) 199–207.
[239] S.S.S. Tan, P.C. Hauser, N.A. Chaniotakis, G. Suter, W. Simon, Anion-selective optical sensors based on a coextraction of anion-proton pairs into a solvent-polymeric membrane, Chimia (Aarau). 43 (1989) 257–261.
[240] C. Fontàs, I. Queralt, M. Hidalgo, Novel and selective procedure for Cr(VI) determination by X-ray fluorescence analysis after membrane concentration, Spectrochim. Acta - Part B At. Spectrosc. 61 (2006) 407–413.
[241] N. Pont, V. Salvadó, C. Fontàs, Selective transport and removal of Cd from chloride solutions by polymer inclusion membranes, J. Memb. Sci. 318 (2008) 340–345.
[242] A. Garcia-Rodríguez, V. Matamoros, S.D. Kolev, C. Fontàs, Development of a polymer inclusion membrane (PIM) for the preconcentration of antibiotics in environmental water samples, J. Memb. Sci. 492 (2015) 32–39.
[243] L.L. Zhang, R.W. Cattrall, S.D. Kolev, The use of a polymer inclusion membrane in flow injection analysis for the on-line separation and determination of zinc, Talanta. 84 (2011) 1278–1283.
[244] L.L. Zhang, R.W. Cattrall, M. Ashokkumar, S.D. Kolev, On-line extractive separation in flow injection analysis based on polymer inclusion membranes : A study on membrane stability and approaches for improving membrane permeability, Talanta. 97 (2012) 382–387.
[245] E.A. Nagul, C. Fontàs, I.D. McKelvie, R.W. Cattrall, S.D. Kolev, The use of a
Chapter 1 – General Introduction
77
polymer inclusion membrane for separation and preconcentration of orthophosphate in flow analysis, Anal. Chim. Acta. 803 (2013) 82–90.
[246] M.R. Yaftian, M.I.G.S. Almeida, R.W. Cattrall, S.D. Kolev, Flow injection spectrophotometric determination of V(V) involving on-line separation using a poly(vinylidene fluoride-co-hexafluoropropylene)-based polymer inclusion membrane, Talanta. 181 (2018) 385–391.
[247] H.H. See, P.C. Hauser, Electric field-driven extraction of lipophilic anions across a carrier-mediated polymer inclusion membrane., Anal. Chem. 83 (2011) 7507–7513.
[248] H.H. See, S. Stratz, P.C. Hauser, Electro-driven extraction across a polymer inclusion membrane in a flow-through cell, J. Chromatogr. A. 1300 (2013) 79–84.
[249] S.-M. Julia, S.H. Heng, H.P. C., Electric Field Driven Extraction of Inorganic Anions Across a Polymer Inclusion Membrane, Electroanalysis. 25 (2013) 1879–1886.
[250] N.A. Mamat, H.H. See, Development and evaluation of electromembrane extraction across a hollow polymer inclusion membrane, J. Chromatogr. A. 1406 (2015) 34–39.
[251] M.I.G.S. Almeida, C. Chan, V.J. Pettigrove, R.W. Cattrall, S.D. Kolev, Development of a passive sampler for Zinc(II) in urban pond waters using a polymer inclusion membrane., Environ. Pollut. 193 (2014) 233–9.
[252] A. Garcia-Rodríguez, C. Fontàs, V. Matamoros, M.I.G.S. Almeida, R.W. Cattrall, S.D. Kolev, Development of a polymer inclusion membrane-based passive sampler for monitoring of sulfamethoxazole in natural waters. Minimizing the effect of the flow pattern of the aquatic system, Microchem. J. 124 (2016) 175–180.
[253] E. Marguí, C. Fontàs, K. Van Meel, R. Van Grieken, I. Queralt, M. Hidalgo, High-energy polarized-beam energy-dispersive X-ray fluorescence analysis combined with activated thin layers for cadmium determination at trace levels in complex environmental liquid samples, Anal. Chem. 80 (2008) 2357–2364.
[254] Y.Y.N. Bonggotgetsakul, M. Ashokkumar, R.W. Cattrall, S.D. Kolev, The use of sonication to increase extraction rate in polymer inclusion membranes. An application to the extraction of gold(III), J. Memb. Sci. 365 (2010) 242–247.
[255] A.H. Blitz-Raith, R. Paimin, R.W. Cattrall, S.D. Kolev, Separation of cobalt(II) from nickel(II) by solid-phase extraction into Aliquat 336 chloride immobilized in poly(vinyl chloride), Talanta. 71 (2007) 419–423.


CHAPTER 2
Objectives

Chapter 2 – Objectives
81
The overall aim of this study is to develop new analytical methodologies for the
preconcentration and speciation measurements of both inorganic and organic compounds.
This general aim will be met by achieving the following specific objectives:
• To design, prepare and characterize polymer inclusion membranes using ionic
liquids or specific carriers as a separation technique to be used for
preconcentration and speciation measurements.
• To investigate the effect of modifications of the commercial ionic liquid Aliquat
336 as well as new routes of PIM preparations on physicochemical membrane
characteristics and performance.
• To explore PIMs incorporated in a special device as well as in a flow technique to
facilitate arsenic determination.
• To establish a transport model for the measurement of zinc speciation from a
nutrient solution using PIMs as an emerging technique and its comparison with
root uptake.
• To use PIMs made up of a polymer and a plasticizer as an extracting sorbent to
preconcentrate pesticides from natural river samples prior to their determination.


CHAPTER 3
Results

3.1 Development of new analytical methodologies for arsenic
determination
The contents of this section are based on the following studies:
R. Vera, E. Anticó, C. Fontàs, The Use of a Polymer Inclusion Membrane for Arsenate
Determination in Groundwater, Water 10 (2018) 1093.
R. Vera, Y. Zhang, C. Fontàs, M.I.G.S. Almeida, E. Anticó, R.W. Cattrall, S.D. Kolev,
Automatic determination of arsenate in drinking water by flow analysis with dual
membrane-based separation, Food Chem. 283 (2019) 232-238.
R. Vera, C. Fontàs, E. Anticó, Titanium dioxide solid phase for inorganic species
adsorption and determination: the case of arsenic, Environ. Sci. Pollut. Res. 24 (2017)
10939–10948.
Chapter 3 – Results
86
3.1.1 The Use of a Polymer Inclusion Membrane for Arsenate Determination in
Groundwater
Abstract
A polymer inclusion membrane (PIM) containing the ionic liquid
methyltrioctylammonium chloride (Aliquat 336) as the carrier has been used
satisfactorily for the preconcentration of arsenate present in groundwater samples,
allowing its determination by a simple colorimetric method. The optimization of different
chemical and physical parameters affecting the membrane performance allowed its
applicability to be broadened. The transport of As(V) was not affected by the polymer
used to make the PIM (cellulose triacetate (CTA) or poly(vinyl chloride) (PVC)) nor the
thickness of the membrane. Moreover, the use of a 2 M NaCl solution as a stripping phase
was found to allow the effective transport of arsenate despite the presence of other major
anions in groundwater. Using the PIM for the analysis of different groundwaters spiked
at 100 µg L-1 resulted in recoveries from 79% to 124% after only 5 h of contact time.
Finally, the validated PIM-based method was successfully applied to the analysis of
waters containing naturally occurring arsenate.
Introduction
Arsenic is a well-known pollutant that is present in high levels in soil and water
in different countries around the world [1]. The World Health Organization (WHO) has
set an upper limit of 10 µg L-1 in a guideline for concentrations in drinking water [2]. Due
to the high toxicity of arsenic even at low concentrations, it is of paramount importance
to perform routine analyses to monitor this pollutant in waters. Of the different separation
techniques, functionalized membranes have attracted considerable attention as a valuable
technology for many analytical purposes in recent years. This is the case of polymer
inclusion membranes (PIMs), which are non-porous functionalized membranes that
consist of a polymer, a plasticizer, and an extractant. These membranes are transparent,
flexible and stable, and have been used in many applications such as sensing, both ion-
selective electrodes (ISE) and optodes, sample pre-treatment (separation and pre-
concentration), and electro-driven extraction. PIMs have also been used as passive
samplers deploying the membrane device for a 7-day period without reporting any
Chapter 3 – Results
87
drawback due to membrane fouling [3–5]. With the proper selection of the carrier, these
membranes can effectively transport different species, such as inorganic pollutants [5],
organic compounds [6] and metallic species [7].
In a previous study [8], a PIM made of cellulose triacetate (CTA) as the polymer
and Aliquat 336 as the carrier was used for the transport of arsenate from aqueous natural
samples to an 0.1 M NaCl stripping solution. Arsenate was transported through the
membrane by the formation of the ion-pair [(R3R’N+)2HAsO42-], which was released in
the stripping compartment by exchanging arsenate with the chloride present in this phase
[8]. Under neutral pH conditions, inorganic As(III) transport was negligible since it is
mainly present as a neutral species and, thus, the developed PIM allowed the quantitative
separation of both inorganic As species. Moreover, it was found that even though other
anions present in natural waters were also transported (e.g., chloride, phosphate, nitrate,
sulphate and carbonate), As(V) transport efficiency was not hampered. The developed
PIM-based separation system was later implemented in a special device, incorporating a
PIM made of 69% (w/w) poly(vinyl chloride) (PVC) as the base polymer and 31% (w/w)
Aliquat 336 as the carrier, which allowed the preconcentration of arsenate, thus providing
easy arsenate detection by means of the formation of a blue complex [9]. This method
provided a working range from 20 µg L-1 to 120 µg L-1 As(V) in ultrapure water, and a
limit of detection (LOD) of 4.5 µg L-1 after 24 h of contact time using 5 mL 0.1 M NaCl
as the stripping phase. It was successfully applied in the analysis of different waters from
the Pyrenees region with low conductivity values. These two previous works allows us
to establish the conditions for the effective transport of inorganic As(V) in a transport cell
(without preconcentration) [8], and to apply the membrane system in a PIM-based device
to allow As(V) preconcentration and detection with good results after 24 h contact time
for water samples bearing low conductivity [9].
In the present study, in order to extend the applicability of this separation system,
we have evaluated and optimized the chemical and physical parameters that can affect
the PIM-based device, such as membrane composition, stripping phase characteristics,
and membrane thickness, in order to accomplish the preconcentration of arsenic species
in a more convenient timescale and to broaden the applicability of the method to more
complex groundwater (GW) samples.
Chapter 3 – Results
88
Methods
Reagents and Solutions
Stock solution (100 mg L−1) of As(V) was prepared from solid Na2HAsO4·7H2O
purchased from Merck (Darmstadt, Germany). Working solutions of arsenate in ultrapure
water and GW were prepared by dilution of the corresponding stock solution. Sodium
chloride, obtained from Fluka (Bern, Switzerland), was used to prepare the stripping
solution. Calibration standards of arsenic were prepared using the Spectrascan standard
solution for atomic spectroscopy (Teknolab, Drшbak, Norway).
The extractant Aliquat 336 and the polymer PVC were purchased from Sigma-
Aldrich (Steinheim, Germany) and CTA from Acros Organics (Geel, Belgium). The
organic solvents tetrahydrofuran (THF) and chloroform (CHCl3) (Panreac, Castellar del
Vallès, Spain) were used to prepare the polymeric films.
Simulated groundwater (SGW) was prepared by dissolving 0.17 g of NaHCO3, 0.22 g of
CaCl2·6H2O (Panreac, Castellar del Vallès, Spain) and 0.07 g of Na2SO4 (Merck,
Darmstadt, Germany) in 1 L of ultrapure water.
All reagents and solvents were of analytical reagent grade. Ultrapure water from
a MilliQ Plus water purification system (Millipore Ibérica S.A., Madrid, Spain) was used
to prepare all solutions.
Colorimetric Detection of As(V)
The determination of As(V) preconcentrated in the stripping phase was performed
using the molybdenum blue method, which is based on the formation of an
arsenomolybdate complex. The reagent solutions were prepared in accordance with the
latest, improved version of the method [10]. Ammonium molybdate was prepared by
dissolving 5.2 g of (NH4)6Mo7O24·4H2O (Scharlau, Barcelona, Spain) and 8.8 mg of
potassium antimonyl tartrate, K(SbO)C4H4O6·0.5H2O (Merck, Darmstadt, Germany) in
30 mL of 9 M sulphuric acid and diluted with deionized water to 50 mL in a volumetric
flask. A solution 10% (w/v) of ascorbic acid (Panreac, Castellar del Vallès, Spain), which
was used as a reductant, was prepared daily. The reagents were added to As(V) samples
or standard solutions in accordance with the recommended procedure. To account for the
matrix effect, standard solutions were prepared both in ultrapure water and 2 M NaCl.
Chapter 3 – Results
89
Polymer Inclusion Membrane (PIM) Preparation
PIMs were prepared by dissolving either CTA (200 mg) or PVC (400 mg) and the
appropriate volume of a 0.5 M Aliquat 336 solution in chloroform or in THF,
respectively. The solution was poured into a 9.0 cm diameter flat-bottom glass Petri dish
which was set horizontally and covered loosely. The solvent was allowed to evaporate
over 24 h at room temperature and the resulting film was then carefully peeled off the
bottom of the Petri dish and circular 2.5 cm2 pieces were cut from its central section and
used in the experiments. PIMs of different thicknesses were prepared by reducing
proportionally the total mass of polymer and Aliquat 336.
All PIM compositions are given in mass percentages for each component.
Preconcentration Experiments and Calibration Curve
The schematics and the whole set-up of the PIM-based device used in the
preconcentration experiments are described elsewhere [11]. The device incorporates the
PIM with an area of 2.5 cm2 and contains the stripping solution. This device is immersed
1 cm in a vertical position in 100 or 50 mL of a water sample containing arsenic and
placed on a magnetic stirrer. After a predetermined contact time, the device was removed
from the solution and a selected volume of the stripping solution (usually 2 mL) was taken
for the colorimetric analysis.
Arsenic transport efficiency (TE) was determined by using Eq. (3.1):
TE(%)=[%&]&()*+(()1
[%&].//0(0)2)× 100 (3.1)
where [As]strip(t) denotes the arsenic concentration in the stripping compartment at the end
of the contact time, whereas [As]feed(0) is the initial arsenic concentration in the water
sample. The volume ratio between the feed solution and stripping solutions is denoted by
Vr.
The calibration curve for the preconcentration method was prepared by using the
final selected conditions in accordance with the TE results (50 mL of aqueous feed
solution, 2.5 mL of 2 M NaCl as the stripping phase and 5 h contact time).
Chapter 3 – Results
90
All experiments were conducted at 22 ± 1 ºC, and were done per duplicate as
minimum. Standard deviation (SD) is shown for each case with the corresponding number
of replicates (n).
Apparatus
A Cary ultraviolet-visible (UV-Vis) (Agilent Technologies, Tokyo, Japan)
instrument was used to measure the absorbance of As(V) complex at λ = 845 nm.
Arsenic concentration in the source solution of two GW samples with naturally
occurring arsenic was measured using an inductively coupled plasma optical emission
spectroscopy system (Agilent 5100 Vertical Dual View ICP-OES, Agilent Technologies,
Tokyo, Japan).
PIM thickness was measured using a Digimatic Micrometer 0–25 mm (Mitutoyo,
Takatsu-ku Japan).
The pH and conductivity values were determined with a Crison Model GLP 22
pH meter and Ecoscan, Entech Instruments, portable conductimeter, respectively. A
magnetic multistirrer 15 (Fischer Scientific, Hampton, NH, USA) was also used.
Water Samples
Seven GW samples were collected from different locations in north-east Catalonia
(Spain). Table 3.1 indicates the location of the different sampling spots as well as the
main chemical characteristics of the different waters. GW samples 1–5 do not contain As
and were used to study the effect of the water matrix by adding arsenate at different
concentrations. GW samples 6 and 7 contained naturally occurring arsenic. All waters
were used without any treatment (filtration or pH adjustment) except for sample GW7,
which was brought to neutral pH by adding HCl.
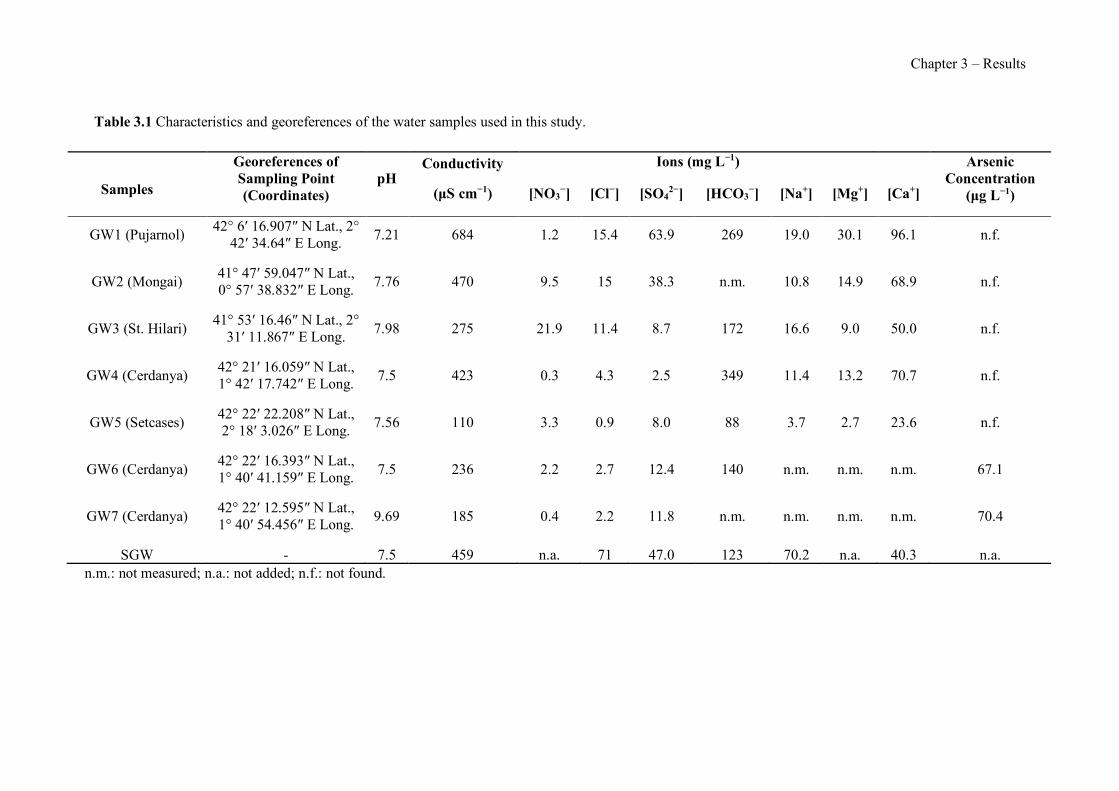
Chapter 3 – Results
Table 3.1 Characteristics and georeferences of the water samples used in this study.
n.m.: not measured; n.a.: not added; n.f.: not found.
Samples
Georeferences of Sampling Point (Coordinates)
pH Conductivity
(µS cm−1)
Ions (mg L−1) Arsenic Concentration
(µg L−1) [NO3−] [Cl−] [SO4
2−] [HCO3−] [Na+] [Mg+] [Ca+]
GW1 (Pujarnol) 42° 6′ 16.907″ N Lat., 2° 42′ 34.64″ E Long. 7.21 684 1.2 15.4 63.9 269 19.0 30.1 96.1 n.f.
GW2 (Mongai) 41° 47′ 59.047″ N Lat., 0° 57′ 38.832″ E Long. 7.76 470 9.5 15 38.3 n.m. 10.8 14.9 68.9 n.f.
GW3 (St. Hilari) 41° 53′ 16.46″ N Lat., 2° 31′ 11.867″ E Long. 7.98 275 21.9 11.4 8.7 172 16.6 9.0 50.0 n.f.
GW4 (Cerdanya) 42° 21′ 16.059″ N Lat., 1° 42′ 17.742″ E Long. 7.5 423 0.3 4.3 2.5 349 11.4 13.2 70.7 n.f.
GW5 (Setcases) 42° 22′ 22.208″ N Lat., 2° 18′ 3.026″ E Long. 7.56 110 3.3 0.9 8.0 88 3.7 2.7 23.6 n.f.
GW6 (Cerdanya) 42° 22′ 16.393″ N Lat., 1° 40′ 41.159″ E Long. 7.5 236 2.2 2.7 12.4 140 n.m. n.m. n.m. 67.1
GW7 (Cerdanya) 42° 22′ 12.595″ N Lat., 1° 40′ 54.456″ E Long. 9.69 185 0.4 2.2 11.8 n.m. n.m. n.m. n.m. 70.4
SGW - 7.5 459 n.a. 71 47.0 123 70.2 n.a. 40.3 n.a.
Chapter 3 – Results
92
Results and discussion
Parameters Affecting the Preconcentration System
Stripping composition
As reported in our previous study [9], As(V) transport through the PIM containing
Aliquat 336 is based on an anionic exchange in which the chloride present in the striping
phase is the driving force behind the up-hill transport of the arsenate anion. Despite other
anions such as sulphate or nitrate also being transported through the PIM, the
effectiveness of the system was not affected as long as the total concentration of anions
in GW did not exceed the chloride concentration in the stripping solution. However, the
applicability of the method was severely hampered in the case of water samples with high
conductivity. Thus, to broaden the application of this PIM-based preconcentration
system, we tested the use of a 2 M NaCl solution instead of 0.1 M NaCl, maintaining all
the other experimental parameters (e.g., PIM: 69% PVC – 31% Aliquat 336 (w/w), time:
24 h, feed volume: 100 mL and stripping volume: 5 mL). The results are presented in
Figure 3.1 as As(V) transport efficiency for both ultrapure water and GW1 and the two
stripping solution compositions tested. It is worth mentioning that the conductivity of
GW1 (648 µS) is between 2–6 times higher than the conductivity of natural waters studied
in our previous work (in the 120–194 µS range) [9]. As can be observed, As(V) transport
efficiency is dramatically affected if 0.1 M NaCl is used as the stripping phase, since only
34% of arsenate is transported. TE for GW1 increases up to 70% when the concentration
of NaCl in the stripping phase is increased to 2 M. Similar results were observed in the
work of Garcia-Rodríguez et al. [12], where the same PIM device was used for the
monitoring of sulfamethoxazole (SMX) in natural waters, where a 2 M NaCl solution
allowed a more efficient mass transfer across the membrane than an 0.5 M NaCl solution.
Hence, a stripping phase consisting of a 2 M NaCl solution was fixed for subsequent
experiments.
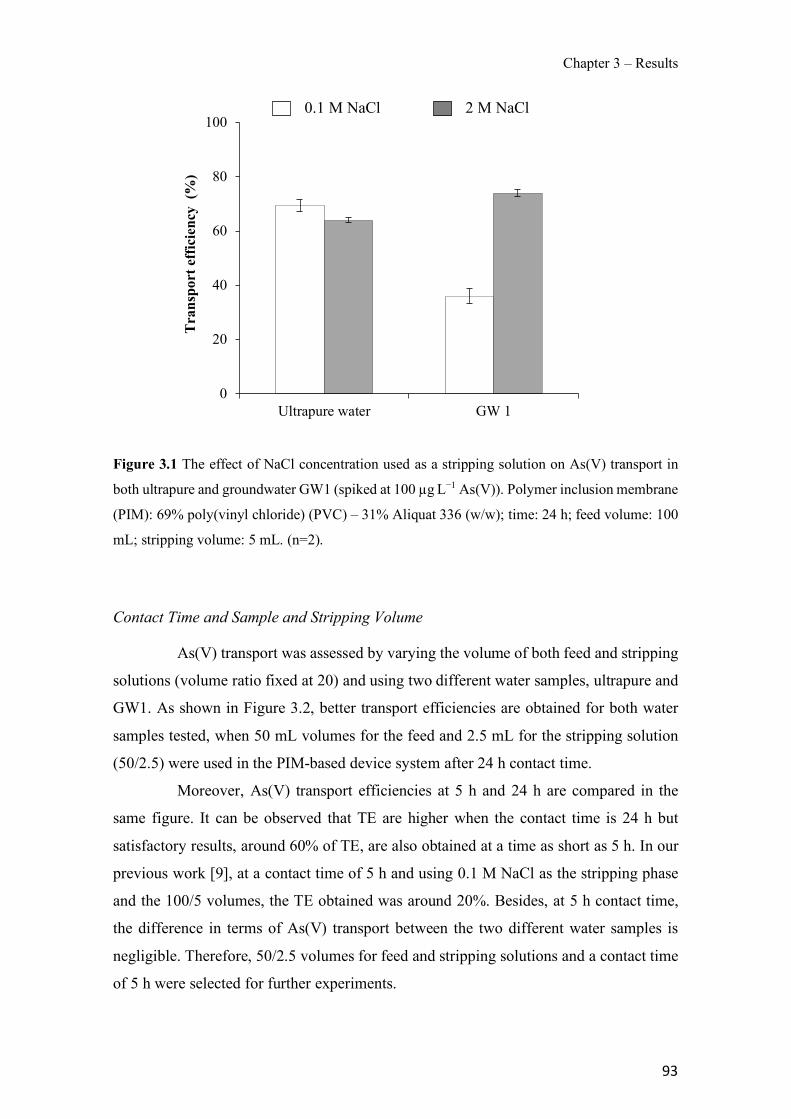
Chapter 3 – Results
93
Figure 3.1 The effect of NaCl concentration used as a stripping solution on As(V) transport in
both ultrapure and groundwater GW1 (spiked at 100 µg L−1 As(V)). Polymer inclusion membrane
(PIM): 69% poly(vinyl chloride) (PVC) – 31% Aliquat 336 (w/w); time: 24 h; feed volume: 100
mL; stripping volume: 5 mL. (n=2).
Contact Time and Sample and Stripping Volume
As(V) transport was assessed by varying the volume of both feed and stripping
solutions (volume ratio fixed at 20) and using two different water samples, ultrapure and
GW1. As shown in Figure 3.2, better transport efficiencies are obtained for both water
samples tested, when 50 mL volumes for the feed and 2.5 mL for the stripping solution
(50/2.5) were used in the PIM-based device system after 24 h contact time.
Moreover, As(V) transport efficiencies at 5 h and 24 h are compared in the
same figure. It can be observed that TE are higher when the contact time is 24 h but
satisfactory results, around 60% of TE, are also obtained at a time as short as 5 h. In our
previous work [9], at a contact time of 5 h and using 0.1 M NaCl as the stripping phase
and the 100/5 volumes, the TE obtained was around 20%. Besides, at 5 h contact time,
the difference in terms of As(V) transport between the two different water samples is
negligible. Therefore, 50/2.5 volumes for feed and stripping solutions and a contact time
of 5 h were selected for further experiments.
0
20
40
60
80
100
Ultrapure water GW 1
Tran
spor
t effi
cien
cy (
%)
0.1 M NaCl 2 M NaCl
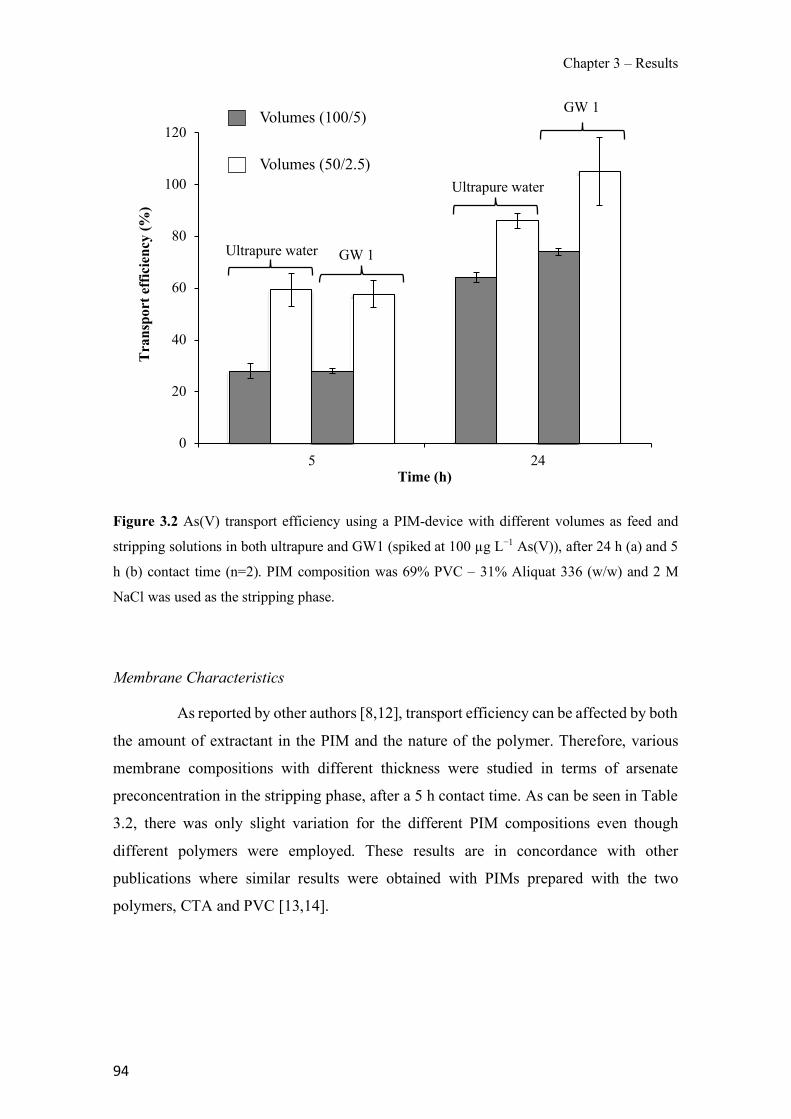
Chapter 3 – Results
94
Figure 3.2 As(V) transport efficiency using a PIM-device with different volumes as feed and
stripping solutions in both ultrapure and GW1 (spiked at 100 µg L−1 As(V)), after 24 h (a) and 5
h (b) contact time (n=2). PIM composition was 69% PVC – 31% Aliquat 336 (w/w) and 2 M
NaCl was used as the stripping phase.
Membrane Characteristics
As reported by other authors [8,12], transport efficiency can be affected by both
the amount of extractant in the PIM and the nature of the polymer. Therefore, various
membrane compositions with different thickness were studied in terms of arsenate
preconcentration in the stripping phase, after a 5 h contact time. As can be seen in Table
3.2, there was only slight variation for the different PIM compositions even though
different polymers were employed. These results are in concordance with other
publications where similar results were obtained with PIMs prepared with the two
polymers, CTA and PVC [13,14].
Ultrapure water
Ultrapure water
GW 1
0
20
40
60
80
100
120
5 24
Tran
spor
t effi
cien
cy (%
)
Time (h)
Volumes (100/5)
Volumes (50/2.5)
GW 1
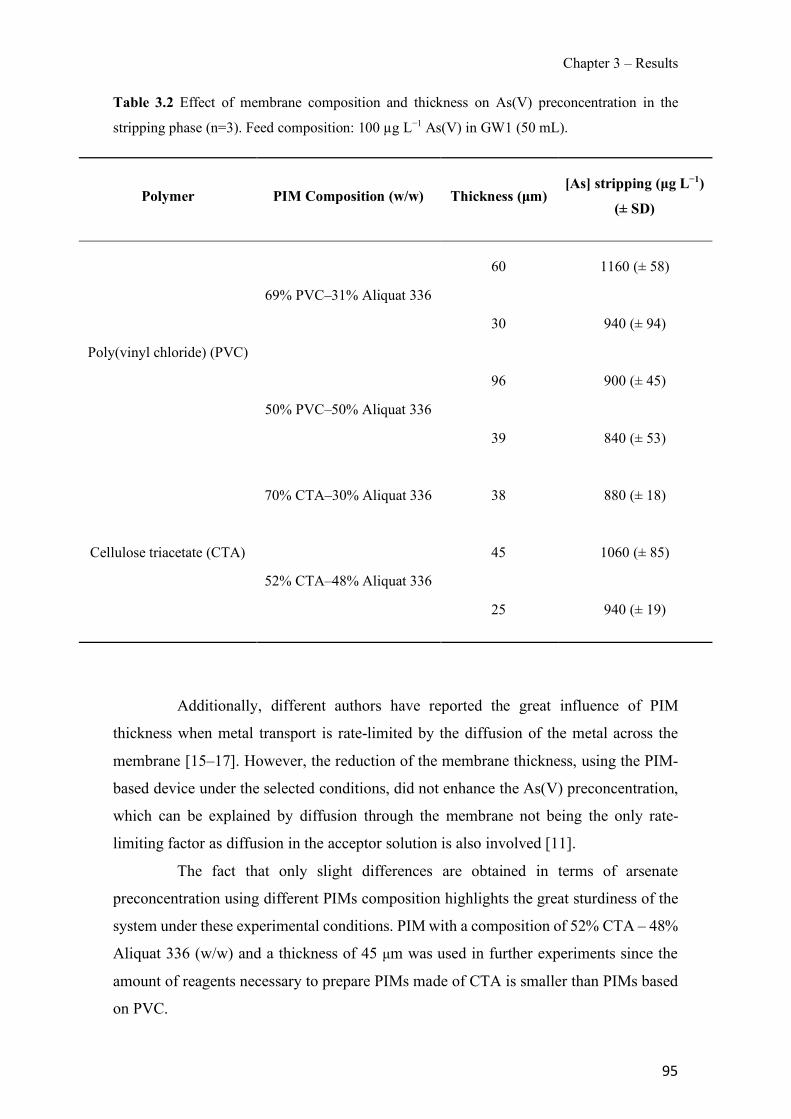
Chapter 3 – Results
95
Table 3.2 Effect of membrane composition and thickness on As(V) preconcentration in the
stripping phase (n=3). Feed composition: 100 µg L−1 As(V) in GW1 (50 mL).
Polymer PIM Composition (w/w) Thickness (µm) [As] stripping (µg L−1)
(± SD)
Poly(vinyl chloride) (PVC)
69% PVC–31% Aliquat 336
60 1160 (± 58)
30 940 (± 94)
50% PVC–50% Aliquat 336
96 900 (± 45)
39 840 (± 53)
Cellulose triacetate (CTA)
70% CTA–30% Aliquat 336 38 880 (± 18)
52% CTA–48% Aliquat 336
45 1060 (± 85)
25 940 (± 19)
Additionally, different authors have reported the great influence of PIM
thickness when metal transport is rate-limited by the diffusion of the metal across the
membrane [15–17]. However, the reduction of the membrane thickness, using the PIM-
based device under the selected conditions, did not enhance the As(V) preconcentration,
which can be explained by diffusion through the membrane not being the only rate-
limiting factor as diffusion in the acceptor solution is also involved [11].
The fact that only slight differences are obtained in terms of arsenate
preconcentration using different PIMs composition highlights the great sturdiness of the
system under these experimental conditions. PIM with a composition of 52% CTA – 48%
Aliquat 336 (w/w) and a thickness of 45 µm was used in further experiments since the
amount of reagents necessary to prepare PIMs made of CTA is smaller than PIMs based
on PVC.

Chapter 3 – Results
96
It should be noted that the preconcentration system provides an arsenate
enrichment of around 10 times the initial concentration in the feed solution, which is a
clear improvement in facilitating the detection of arsenate in polluted GW samples at low
levels.
Analytical Application of the PIM-device
Effect of Water Matrix
The matrix composition of the calibration standards must be considered for the
application of the PIM-based preconcentration system in the determination of As(V) as
this is a critical point which can affect the TE and, consequently, the sensitivity of the
method. For this reason, different water samples, GW1 to GW5 and SGW, were tested
(see Table 3.1 for composition) under the selected experimental conditions. As(V)
transport efficiencies are compared in Table 3.3, where values ranging from 53% up to
72% for GW1–4 and a value of 81% for GW5 are presented. The highest TE of GW5 is
clearly related to the lowest conductivity value, which enables higher arsenate transport
across the PIM. Our results support the hypothesis that the accuracy of the method might
be compromised by the matrix composition used for the preparation of the calibration
standards and the conductivity of the target water sample. As SGW presents an
intermediate TE between GW1 and GW5, this is finally selected for the calibration and
validation of the PIM-based device method.
Table 3.3 Comparison of the different GW samples on arsenate transport efficiency with the
proposed PIM-based method (n=2).
Water
Sample Conductivity (µS cm−1) Amount of As(V) Added (µg L−1) TE (%) (± SD)
GW1 684 100 53 (± 8)
GW2 470 100 65 (± 6)
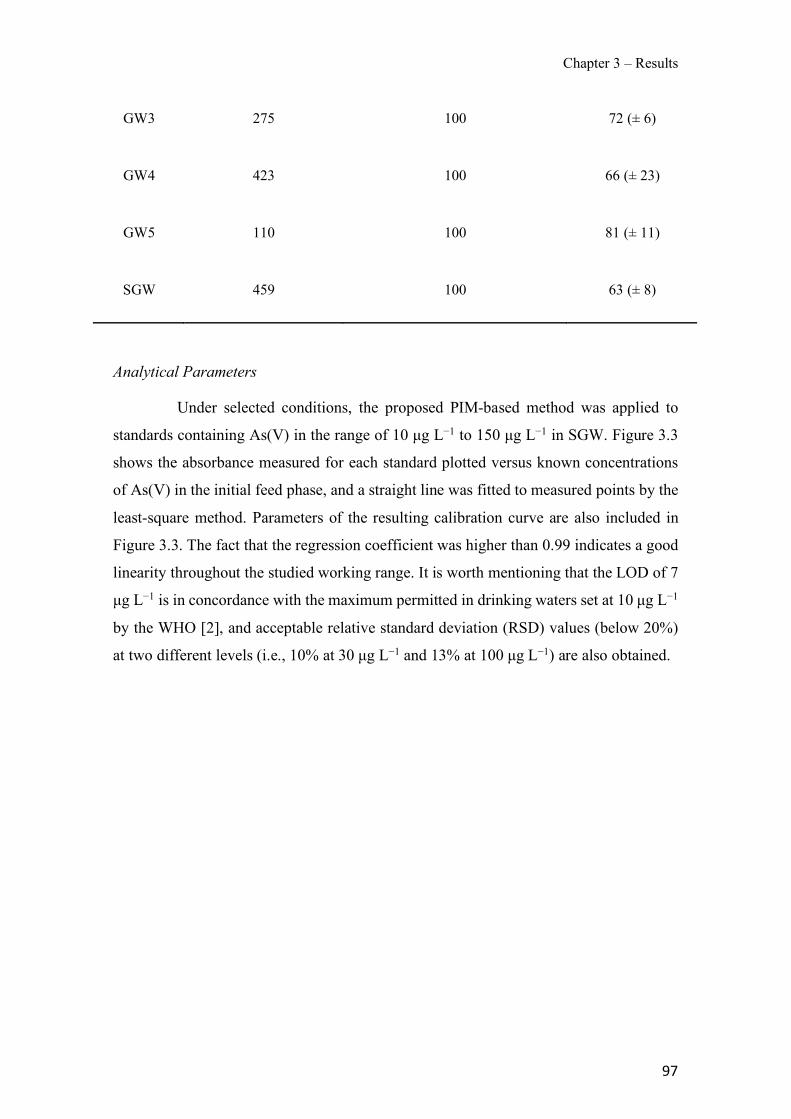
Chapter 3 – Results
97
GW3 275 100 72 (± 6)
GW4 423 100 66 (± 23)
GW5 110 100 81 (± 11)
SGW 459 100 63 (± 8)
Analytical Parameters
Under selected conditions, the proposed PIM-based method was applied to
standards containing As(V) in the range of 10 µg L−1 to 150 µg L−1 in SGW. Figure 3.3
shows the absorbance measured for each standard plotted versus known concentrations
of As(V) in the initial feed phase, and a straight line was fitted to measured points by the
least-square method. Parameters of the resulting calibration curve are also included in
Figure 3.3. The fact that the regression coefficient was higher than 0.99 indicates a good
linearity throughout the studied working range. It is worth mentioning that the LOD of 7
µg L−1 is in concordance with the maximum permitted in drinking waters set at 10 µg L−1
by the WHO [2], and acceptable relative standard deviation (RSD) values (below 20%)
at two different levels (i.e., 10% at 30 µg L−1 and 13% at 100 µg L−1) are also obtained.
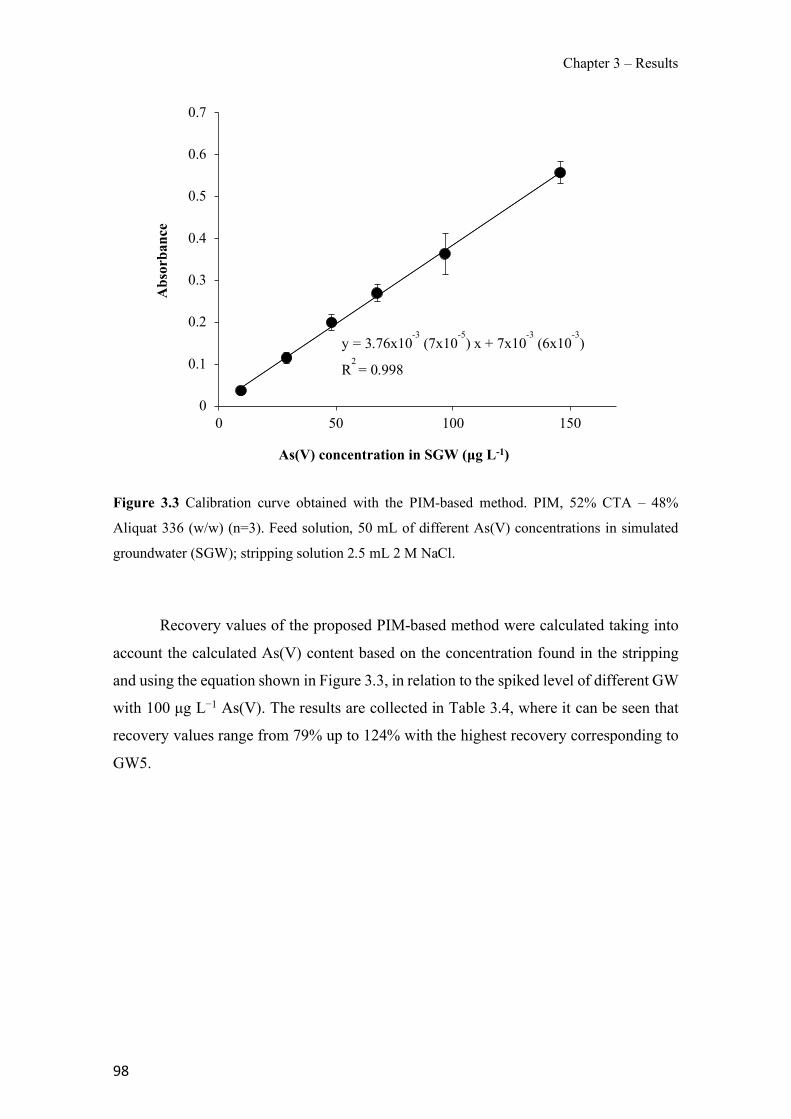
Chapter 3 – Results
98
Figure 3.3 Calibration curve obtained with the PIM-based method. PIM, 52% CTA – 48%
Aliquat 336 (w/w) (n=3). Feed solution, 50 mL of different As(V) concentrations in simulated
groundwater (SGW); stripping solution 2.5 mL 2 M NaCl.
Recovery values of the proposed PIM-based method were calculated taking into
account the calculated As(V) content based on the concentration found in the stripping
and using the equation shown in Figure 3.3, in relation to the spiked level of different GW
with 100 µg L−1 As(V). The results are collected in Table 3.4, where it can be seen that
recovery values range from 79% up to 124% with the highest recovery corresponding to
GW5.
0
0.1
0.2
0.3
0.4
0.5
0.6
0.7
0 50 100 150
Abs
orba
nce
As(V) concentration in SGW (µg L-1)
y = 3.76x10⁻³
(7x10⁻⁵
) x + 7x10⁻³
(6x10⁻³
)
R2 = 0.998
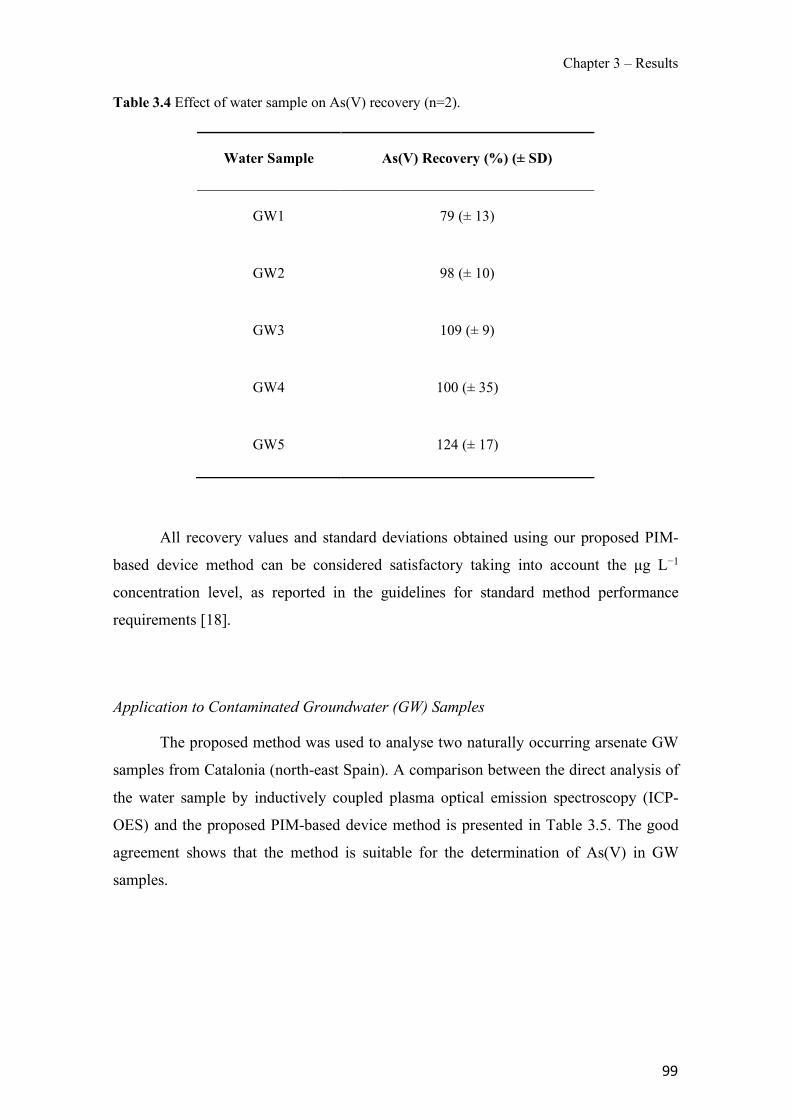
Chapter 3 – Results
99
Table 3.4 Effect of water sample on As(V) recovery (n=2).
Water Sample As(V) Recovery (%) (± SD)
GW1 79 (± 13)
GW2 98 (± 10)
GW3 109 (± 9)
GW4 100 (± 35)
GW5 124 (± 17)
All recovery values and standard deviations obtained using our proposed PIM-
based device method can be considered satisfactory taking into account the µg L−1
concentration level, as reported in the guidelines for standard method performance
requirements [18].
Application to Contaminated Groundwater (GW) Samples
The proposed method was used to analyse two naturally occurring arsenate GW
samples from Catalonia (north-east Spain). A comparison between the direct analysis of
the water sample by inductively coupled plasma optical emission spectroscopy (ICP-
OES) and the proposed PIM-based device method is presented in Table 3.5. The good
agreement shows that the method is suitable for the determination of As(V) in GW
samples.
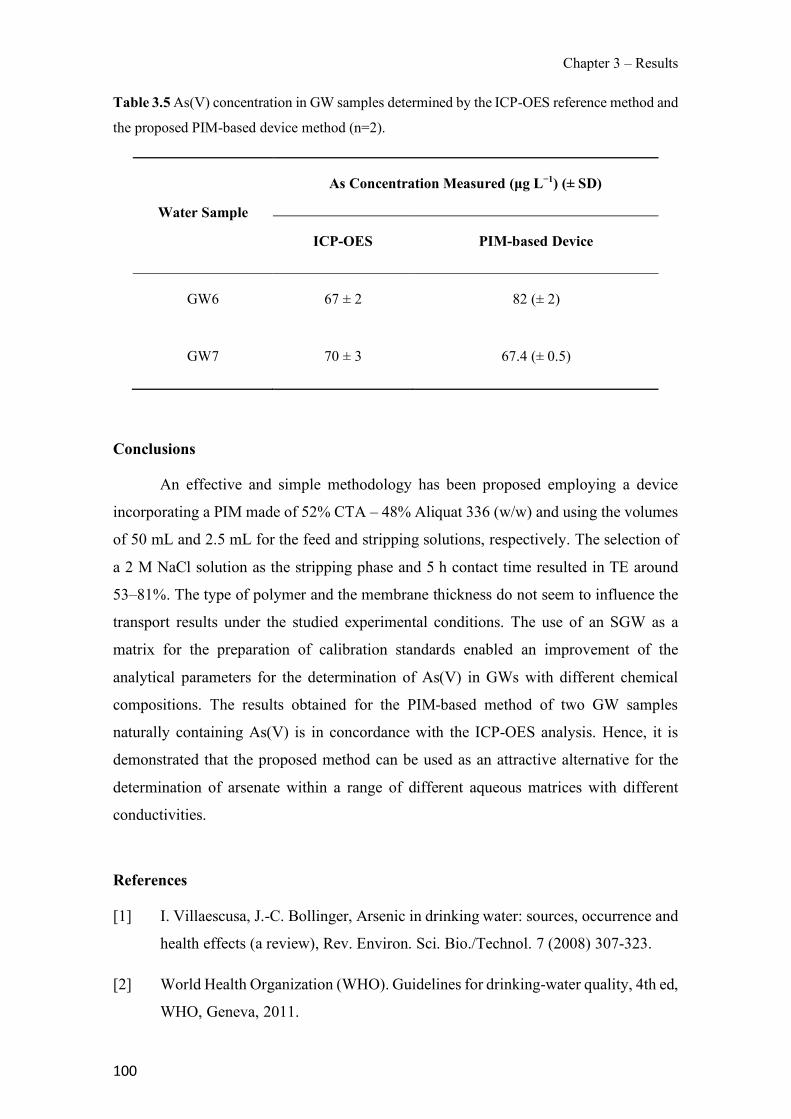
Chapter 3 – Results
100
Table 3.5 As(V) concentration in GW samples determined by the ICP-OES reference method and
the proposed PIM-based device method (n=2).
Water Sample
As Concentration Measured (µg L−1) (± SD)
ICP-OES PIM-based Device
GW6 67 ± 2 82 (± 2)
GW7 70 ± 3 67.4 (± 0.5)
Conclusions
An effective and simple methodology has been proposed employing a device
incorporating a PIM made of 52% CTA – 48% Aliquat 336 (w/w) and using the volumes
of 50 mL and 2.5 mL for the feed and stripping solutions, respectively. The selection of
a 2 M NaCl solution as the stripping phase and 5 h contact time resulted in TE around
53–81%. The type of polymer and the membrane thickness do not seem to influence the
transport results under the studied experimental conditions. The use of an SGW as a
matrix for the preparation of calibration standards enabled an improvement of the
analytical parameters for the determination of As(V) in GWs with different chemical
compositions. The results obtained for the PIM-based method of two GW samples
naturally containing As(V) is in concordance with the ICP-OES analysis. Hence, it is
demonstrated that the proposed method can be used as an attractive alternative for the
determination of arsenate within a range of different aqueous matrices with different
conductivities.
References
[1] I. Villaescusa, J.-C. Bollinger, Arsenic in drinking water: sources, occurrence and
health effects (a review), Rev. Environ. Sci. Bio./Technol. 7 (2008) 307-323.
[2] World Health Organization (WHO). Guidelines for drinking-water quality, 4th ed,
WHO, Geneva, 2011.
Chapter 3 – Results
101
[3] M.I.G.S. Almeida, R.W. Cattrall, S.D. Kolev, Polymer inclusion membranes
(PIMs) in chemical analysis - A review, Anal. Chim. Acta. 987 (2017) 1–14.
[4] M.I.G.S. Almeida, C. Chan, V.J. Pettigrove, R.W. Cattrall, S.D. Kolev,
Development of a passive sampler for Zinc(II) in urban pond waters using a
polymer inclusion membrane, Environ. Pollut. 193 (2014) 233–9.
[5] M.I.G.S. Almeida, A.M.L. Silva, R. a Coleman, V.J. Pettigrove, R.W. Cattrall,
S.D. Kolev, Development of a passive sampler based on a polymer inclusion
membrane for total ammonia monitoring in freshwaters, Anal. Bioanal. Chem.
408 (2016) 3213–22.
[6] A. Garcia-Rodríguez, V. Matamoros, S.D. Kolev, C. Fontàs, Development of a
polymer inclusion membrane (PIM) for the preconcentration of antibiotics in
environmental water samples, J. Membr. Sci. 492 (2015) 32–39.
[7] N. Pont, V. Salvadó, C. Fontàs, Selective transport and removal of Cd from
chloride solutions by polymer inclusion membranes, J. Membr. Sci. 318 (2008)
340–345.
[8] R. Güell, E. Anticó, S.D. Kolev, J. Benavente, V. Salvadó, C. Fontàs,
Development and characterization of polymer inclusion membranes for the
separation and speciation of inorganic As species, J. Membr. Sci. 383 (2011) 88–
95.
[9] C. Fontàs, R. Vera, A. Batalla, S.D. Kolev, E. Anticó, A novel low-cost detection
method for screening of arsenic in groundwater, Environ. Sci. Pollut. Res. 21
(2014) 11682–8.
[10] S. Tsang, F. Phu, M.M. Baum, G.A. Poskrebyshev, Determination of
phosphate/arsenate by a modified molybdenum blue method and reduction of
arsenate by S2O42-, Talanta. 71 (2007) 1560–1568.
[11] R. Vera, C. Fontàs, J. Galceran, O. Serra, E. Anticó, Polymer inclusion membrane
to access Zn speciation: Comparison with root uptake, Sci. Total Environ. 622–
623 (2018) 316–324.
[12] A. Garcia-Rodríguez, C. Fontàs, V. Matamoros, M.I.G.S. Almeida, R.W. Cattrall,
Chapter 3 – Results
102
S.D. Kolev, Development of a polymer inclusion membrane-based passive
sampler for monitoring of sulfamethoxazole in natural waters. Minimizing the
effect of the flow pattern of the aquatic system, Microchem. J. 124 (2016) 175–
180.
[13] M.I. Vázquez, V. Romero, C. Fontàs, E. Anticó, J. Benavente, Polymer inclusion
membranes (PIMs) with the ionic liquid (IL) Aliquat 336 as extractant: Effect of
base polymer and IL concentration on their physical–chemical and elastic
characteristics, J. Membr. Sci. 455 (2014) 312–319.
[14] O. Kebiche-Senhadji, S. Tingry, P. Seta, M. Benamor, Selective extraction of
Cr(VI) over metallic species by polymer inclusion membrane (PIM) using anion
(Aliquat 336) as carrier, Desalination. 258 (2010) 59–65.
[15] J. Konczyk, C. Kozlowski, W. Walkowiak, Removal of chromium(III) from
acidic aqueous solution by polymer inclusion membranes with D2EHPA and
Aliquat 336, Desalination. 263 (2010) 211–216.
[16] P.K. Mohapatra, D.S. Lakshmi, A. Bhattacharyya, V.K. Manchanda, Evaluation
of polymer inclusion membranes containing crown ethers for selective cesium
separation from nuclear waste solution, J. Hazardous Mater. 169 (2009) 472–479.
[17] S.P. Kusumocahyo, T. Kanamori, K. Sumaru, S. Aomatsu, H. Matsuyama, M.
Teramoto, T. Shinbo, Development of polymer inclusion membranes based on
cellulose triacetate: Carrier-mediated transport of cerium(III), J. Membr. Sci. 244
(2004) 251–257.
[18] AOAC Official Methods of analysis, Guidelines for standard method performance
requirements Appendix F, AOAC International, 2012, pp. 1–17.
Chapter 3 – Results
103
3.1.2 Automatic determination of arsenate in drinking water by flow analysis with
dual membrane-based separation
Abstract
The sequential application of a polymer inclusion membrane (PIM), composed of
poly(vinylidenefluoride-co-hexafluoropropylene) and the anionic extractant Aliquat 336,
and a microporous polytetrafluoroethylene (PTFE) gas-permeable membrane was
utilized for the first time to develop a flow analysis (FA) system, for the automatic
determination of trace levels of arsenate (As(V)) in drinking water as arsine. The system
incorporated a flow-through extraction cell for separation and preconcentration of
arsenate and a gas-diffusion cell for the separation of arsine prior to its
spectrophotometric determination based on the discoloration of a potassium
permanganate solution. Under optimal conditions the FA system is characterized by a
limit of detection of 3 µg L-1 As(V) and repeatability of 1.8% (n=5, 25 µg L-1 As(V)) and
2.8% (n=5, 50 µg L-1 As(V)). The newly developed FA method was successfully applied
to the determination of arsenate in drinking water samples in the µg L-1 concentration
range.
Introduction
Arsenic is a naturally occurring toxic element, which is present in natural waters
around the world [1]. Inorganic species, such as arsenate (As(V)) and arsenite (As(III)),
are the most common and toxic forms of arsenic found in aquatic systems [2]. Arsenic is
considered a leading pollutant since it is often found at elevated levels in natural waters
and long-term exposure to its forms have been associated with skin, lung, urinary tract,
kidney, and liver cancer [3]. Therefore, the World Health Organization (WHO) has set
the guideline concentration for arsenic in drinking water at 10 µg L-1 [4]. It should be
pointed out that arsenic in drinking water is present very often almost entirely as arsenate
(As(V)) [5,6]. The low regulated level of arsenic and its complex chemistry represent a
challenge from an analytical point of view. Hence, a great number of highly sensitive
analytical techniques have been developed and employed for the determination of arsenic
in environmental samples, namely graphite furnace atomic absorption spectrometry
Chapter 3 – Results
104
(GFAAS) [7], hydride generation atomic absorption spectrometry (HG-AAS) [8], hydride
generation atomic fluorescence spectrometry (HG-AFS) [9], inductively coupled plasma
atomic emission spectrometry (ICP-OES) [10], and inductively coupled plasma mass
spectrometry (ICP-MS) [2,11]. These techniques provide the sensitivity required to
directly measure arsenic concentrations in water samples at the µg L-1 level. However,
the techniques mentioned above require expensive equipment and highly trained
laboratory technicians.
Flow injection analysis (FIA) is a technique suitable for performing analysis on-
line in an automatic fashion and it is highly efficient in minimizing both reagent and
sample consumption as well as the overall analysis time and associated costs [12,13].
Different detection techniques have been successfully applied in FIA systems for the
determination and speciation of arsenic (e.g., voltammetry [14], amperometry [15,16],
chemiluminescence [17], or spectrophotometry [18-20]. A great number of
spectrophotometric methods for arsenic are based on the method proposed by Johnson
and Pilson [21], in which an arsenomolybdenum blue complex is formed. However, this
method is affected by severe interferences from silicate or phosphate, often present in
arsenic samples, which impose serious limitations on the applicability of this method. To
avoid the interference of phosphate and silicate, some authors have used an anion-
exchange column to retain the interfering anions [22,23] or optimized the molybdenum
blue method to improve its selectivity for arsenate over phosphate, as reported by Dhar
et al. [24]. Rupasinghe et al. [19] and Toda et al. [25] have reported on the development
of FIA systems based on hydride generation where arsenic is converted into arsine
followed by bleaching an oxidant acceptor KMnO4 solution. The concentration of arsenic
in many water samples is at trace level and preconcentration is often required.
Membrane-based extraction procedures involving liquid membranes have
emerged as promising alternatives to ion-exchange based separation and preconcentration
where retention and stripping of the analyte take place sequentially. In liquid membrane-
based separation the extraction and back-extraction of the analyte from a donor aqueous
stream into an acceptor aqueous stream occur simultaneously. Supported liquid
membranes (SLMs), which are considered as the most frequently used type of liquid
membranes at present, have been used successfully in the determination of arsenate in
drinking water [26]. However, in this type of membranes the membrane liquid phase,
consisting of an extractant and diluent, is retained in the micrometre size pores of a
hydrophobic polymeric membrane and this leads to leaching of the membrane liquid
Chapter 3 – Results
105
phase into the donor and acceptor aqueous phases, thus causing potential deterioration in
the performance of the SLM [27].
Recently, polymer inclusion membranes (PIMs) have been shown to have a better
stability than SLMs [28]. PIMs are casted from a solution of a base polymer, extractant
and in some cases plasticizer or modifier in a suitable solvent [28,29]. The reason behind
their superior stability compared to SLMs stems from the fact that the membrane liquid
phase of PIMs (i.e., extractant and plasticizer/modifier) is retained between the entangled
polymer chains of the base polymer, thus minimizing significantly its leaching to the
adjacent aqueous solutions. The base polymer provides mechanical strength to the PIM,
while the extractant (carrier) is responsible for the extraction/transport of the chemical
species of interest. The plasticizer or modifier are often added to the PIM composition to
provide elasticity or increased solubility of the extracted species in the membrane liquid
phase, respectively [29]. PIMs have been successfully employed in flow analysis (FA)
systems for the on-line separation and preconcentration of Zn(II) [30,31], orthophosphate
[32] and vanadium(V) [33].
The present paper reports on the development of a spectrophotometric FA system
implementing on-line preconcentration of arsenate using a PIM consisting of
poly(vinylidene fluoride-co-hexafluoropropylene) (PVDF-HFP) and Aliquat 336
followed by on-line generation of arsine which diffuses across a gas-permeable
membrane into a permanganate solution causing its discoloration. To the best of our
knowledge this is the first use of a PIM in an FA system for the determination of arsenate
in drinking waters at low µg L-1 levels and the first coupling of on-line membrane-based
extractive separation with on-line membrane-based gas-diffusion separation.
Experimental
Reagents and solutions
All reagents and solvents used in this study were of analytical reagent grade. The
polymers PVDF-HFP (Aldrich, USA) and poly(vinyl chloride) PVC (Fluka, Italy), the
extractant Aliquat 336 (Aldrich, USA), and the modifier 1-tetradecanol (Aldrich, USA)
were used as constituents of the PIMs studied. Tetrahydrofuran (THF) without a
stabilizer, purchased from VWR (Australia), was used as the membrane casting solvent.
The acceptor solution used in the PIM-based separation step contained 0.1 mol L-1 NaCl
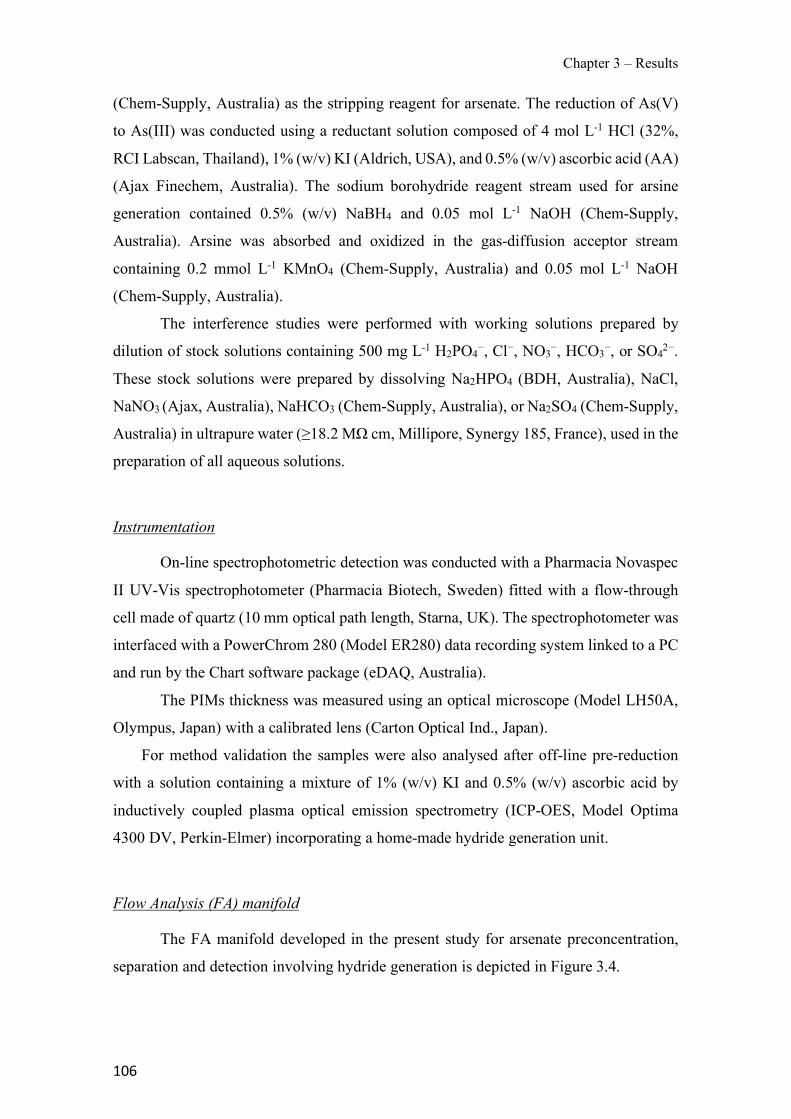
Chapter 3 – Results
106
(Chem-Supply, Australia) as the stripping reagent for arsenate. The reduction of As(V)
to As(III) was conducted using a reductant solution composed of 4 mol L-1 HCl (32%,
RCI Labscan, Thailand), 1% (w/v) KI (Aldrich, USA), and 0.5% (w/v) ascorbic acid (AA)
(Ajax Finechem, Australia). The sodium borohydride reagent stream used for arsine
generation contained 0.5% (w/v) NaBH4 and 0.05 mol L-1 NaOH (Chem-Supply,
Australia). Arsine was absorbed and oxidized in the gas-diffusion acceptor stream
containing 0.2 mmol L-1 KMnO4 (Chem-Supply, Australia) and 0.05 mol L-1 NaOH
(Chem-Supply, Australia).
The interference studies were performed with working solutions prepared by
dilution of stock solutions containing 500 mg L-1 H2PO4−, Cl−, NO3−, HCO3−, or SO42−.
These stock solutions were prepared by dissolving Na2HPO4 (BDH, Australia), NaCl,
NaNO3 (Ajax, Australia), NaHCO3 (Chem-Supply, Australia), or Na2SO4 (Chem-Supply,
Australia) in ultrapure water (≥18.2 MΩ cm, Millipore, Synergy 185, France), used in the
preparation of all aqueous solutions.
Instrumentation
On-line spectrophotometric detection was conducted with a Pharmacia Novaspec
II UV-Vis spectrophotometer (Pharmacia Biotech, Sweden) fitted with a flow-through
cell made of quartz (10 mm optical path length, Starna, UK). The spectrophotometer was
interfaced with a PowerChrom 280 (Model ER280) data recording system linked to a PC
and run by the Chart software package (eDAQ, Australia).
The PIMs thickness was measured using an optical microscope (Model LH50A,
Olympus, Japan) with a calibrated lens (Carton Optical Ind., Japan).
For method validation the samples were also analysed after off-line pre-reduction
with a solution containing a mixture of 1% (w/v) KI and 0.5% (w/v) ascorbic acid by
inductively coupled plasma optical emission spectrometry (ICP-OES, Model Optima
4300 DV, Perkin-Elmer) incorporating a home-made hydride generation unit.
Flow Analysis (FA) manifold
The FA manifold developed in the present study for arsenate preconcentration,
separation and detection involving hydride generation is depicted in Figure 3.4.
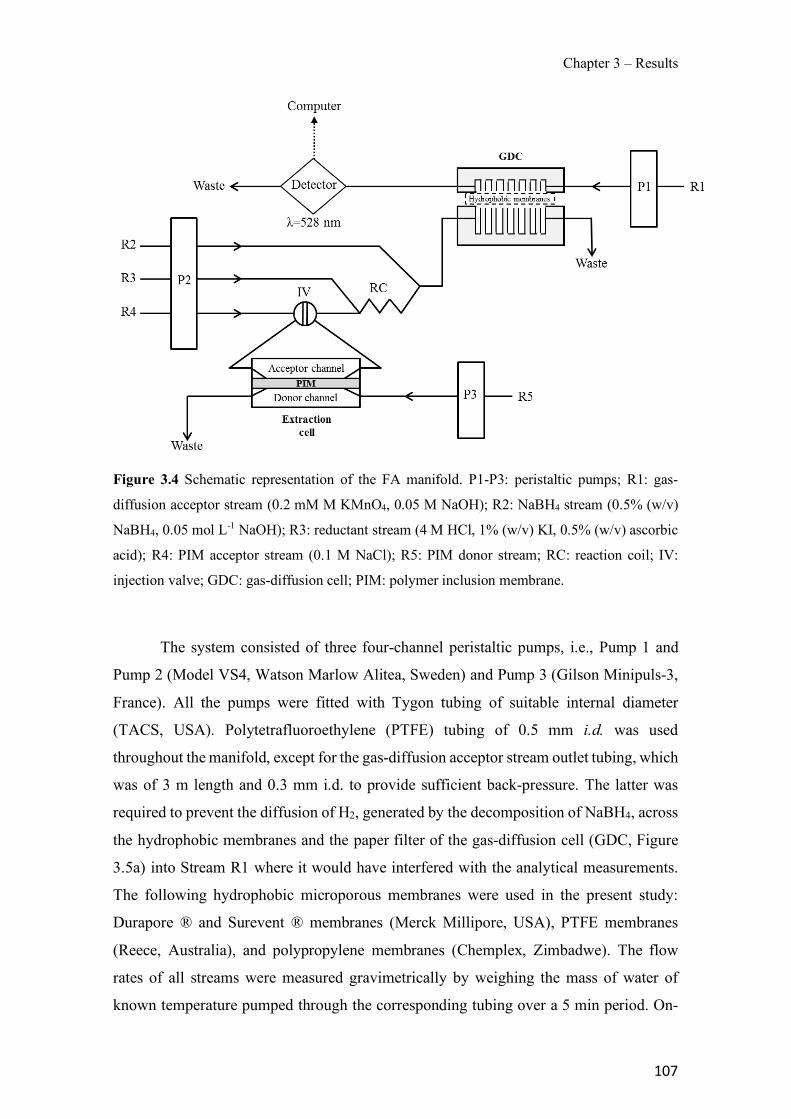
Chapter 3 – Results
107
Figure 3.4 Schematic representation of the FA manifold. P1-P3: peristaltic pumps; R1: gas-
diffusion acceptor stream (0.2 mM M KMnO4, 0.05 M NaOH); R2: NaBH4 stream (0.5% (w/v)
NaBH4, 0.05 mol L-1 NaOH); R3: reductant stream (4 M HCl, 1% (w/v) KI, 0.5% (w/v) ascorbic
acid); R4: PIM acceptor stream (0.1 M NaCl); R5: PIM donor stream; RC: reaction coil; IV:
injection valve; GDC: gas-diffusion cell; PIM: polymer inclusion membrane.
The system consisted of three four-channel peristaltic pumps, i.e., Pump 1 and
Pump 2 (Model VS4, Watson Marlow Alitea, Sweden) and Pump 3 (Gilson Minipuls-3,
France). All the pumps were fitted with Tygon tubing of suitable internal diameter
(TACS, USA). Polytetrafluoroethylene (PTFE) tubing of 0.5 mm i.d. was used
throughout the manifold, except for the gas-diffusion acceptor stream outlet tubing, which
was of 3 m length and 0.3 mm i.d. to provide sufficient back-pressure. The latter was
required to prevent the diffusion of H2, generated by the decomposition of NaBH4, across
the hydrophobic membranes and the paper filter of the gas-diffusion cell (GDC, Figure
3.5a) into Stream R1 where it would have interfered with the analytical measurements.
The following hydrophobic microporous membranes were used in the present study:
Durapore ® and Surevent ® membranes (Merck Millipore, USA), PTFE membranes
(Reece, Australia), and polypropylene membranes (Chemplex, Zimbadwe). The flow
rates of all streams were measured gravimetrically by weighing the mass of water of
known temperature pumped through the corresponding tubing over a 5 min period. On-
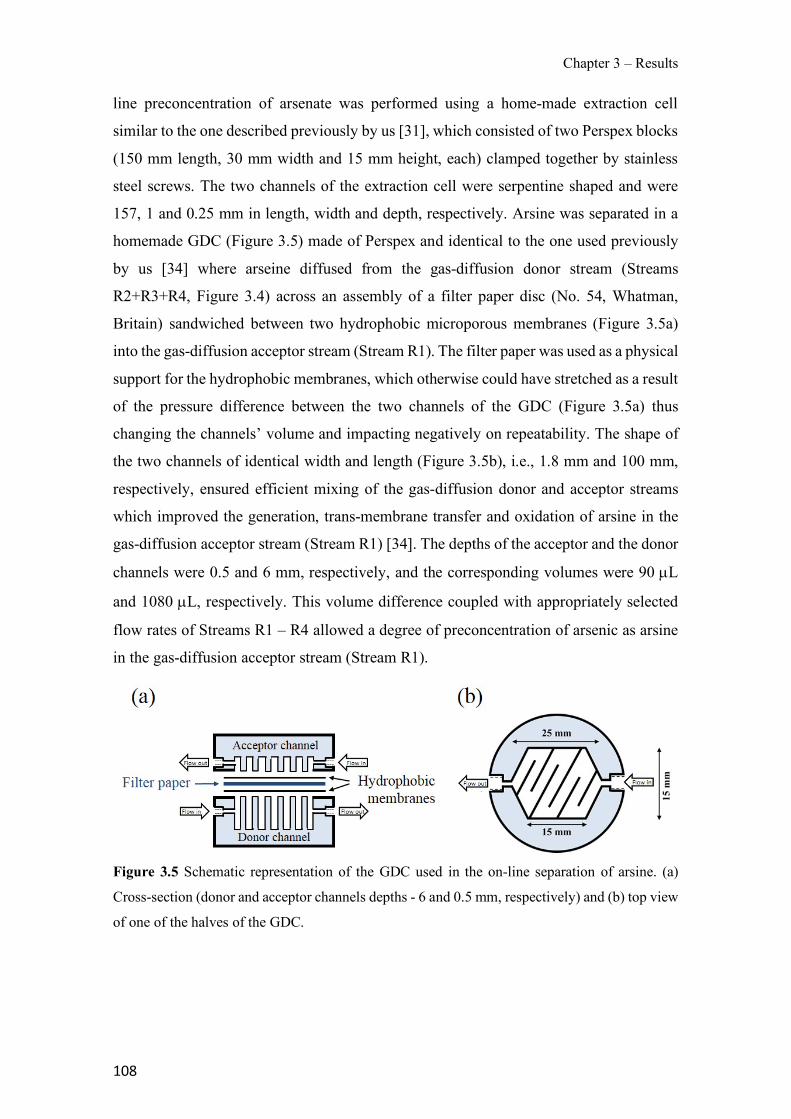
Chapter 3 – Results
108
line preconcentration of arsenate was performed using a home-made extraction cell
similar to the one described previously by us [31], which consisted of two Perspex blocks
(150 mm length, 30 mm width and 15 mm height, each) clamped together by stainless
steel screws. The two channels of the extraction cell were serpentine shaped and were
157, 1 and 0.25 mm in length, width and depth, respectively. Arsine was separated in a
homemade GDC (Figure 3.5) made of Perspex and identical to the one used previously
by us [34] where arseine diffused from the gas-diffusion donor stream (Streams
R2+R3+R4, Figure 3.4) across an assembly of a filter paper disc (No. 54, Whatman,
Britain) sandwiched between two hydrophobic microporous membranes (Figure 3.5a)
into the gas-diffusion acceptor stream (Stream R1). The filter paper was used as a physical
support for the hydrophobic membranes, which otherwise could have stretched as a result
of the pressure difference between the two channels of the GDC (Figure 3.5a) thus
changing the channels’ volume and impacting negatively on repeatability. The shape of
the two channels of identical width and length (Figure 3.5b), i.e., 1.8 mm and 100 mm,
respectively, ensured efficient mixing of the gas-diffusion donor and acceptor streams
which improved the generation, trans-membrane transfer and oxidation of arsine in the
gas-diffusion acceptor stream (Stream R1) [34]. The depths of the acceptor and the donor
channels were 0.5 and 6 mm, respectively, and the corresponding volumes were 90 µL
and 1080 µL, respectively. This volume difference coupled with appropriately selected
flow rates of Streams R1 – R4 allowed a degree of preconcentration of arsenic as arsine
in the gas-diffusion acceptor stream (Stream R1).
Figure 3.5 Schematic representation of the GDC used in the on-line separation of arsine. (a)
Cross-section (donor and acceptor channels depths - 6 and 0.5 mm, respectively) and (b) top view
of one of the halves of the GDC.

Chapter 3 – Results
109
FA procedure
The standard/sample solution (Stream R5, Figure 3.4) was propelled for a
predetermined period of time through the donor channel of the extraction cell where a
PIM separated the sample (donor) stream (Stream R5) from the acceptor stream (Stream
R4). The acceptor stream was stopped for a predetermined stop-flow time during the
sample passage through the donor channel of the extraction cell to allow preconcentration
of arsenate in the static acceptor solution located in the acceptor channel of the cell. At
the end of the stop-flow time, the acceptor stream (R4) was re-started and arsenate was
reduced to arsenite by merging the acceptor stream of the extraction cell (R4) with a
reagent stream (R3) containing HCl, KI and ascorbic acid. Subsequently, arsine was
generated by merging the combined R4+R3 stream with a sodium borohydride stream
(R2). The generated arsine in the combined stream R4+R3+R2 diffused across the
hydrophobic membranes and the filter paper of the GDC (Figure 3.5a) into its acceptor
solution (R1) where it was oxidised by KMnO4 resulting in a decrease in the
permanganate absorbance, monitored continuously at 528 nm in the spectrophotometric
measuring cell of the manifold. In all measurements the analytical signal recorded was
the maximum decrease in KMnO4 absorbance relative to the baseline level.
Optimisation of the FA method
The optimization of the reaction coil (RC) length (Figure 3.4) and the flow rate of
Stream R1 and the selection of the most appropriate hydrophobic gas-diffusion membrane
was carried out in a FA system similar to the one shown in Figure 3.4 where the extraction
cell was replaced with an injection valve with a 500 µL sample loop. The standards
injected in these experiments contained 1000 µg L-1 As(V).
The suitability of different PIM compositions was tested in the FA manifold shown
in Figure 1 using a stop-flow procedure in which 5 mL of a 1000 µg L-1 As(V) standard
solution was propelled at a flow rate of 0.2 mL min-1 through the donor channel of the
extraction cell. The influence of the stop-flow time and the flow rate of Stream R5 was
studied by propelling a standard solution containing 500 µg L-1 As(V) through the donor
channel of the extraction cell.
Chapter 3 – Results
110
PIM preparation
PVC-based PIMs containing 70% (w/w) PVC and 30% (w/w) Aliquat 336 were
prepared by dissolving 180 mg of Aliquat 336 in 18 mL of THF, followed by slow
addition of 420 mg of PVC into the casting solution, which was constantly stirred to avoid
aggregation of the polymer. Finally, the resulting mixture was poured into a 16.5 cm in
diameter glass ring sitting on a flat glass plate. The ring was covered with filter paper and
a watch glass to slow down the evaporation of THF in the next 15 h after which the
resulting PIM was carefully peeled from the glass plate [11,32].
PIMs containing 1-tetradecanol as a modifier were also prepared by the casting
method outlined above. However, in this case 60 mg of this compound and 120 mg of
Aliquat 336 were dissolved in the casting solution together with 420 mg of PVC and the
corresponding PIMs contained 70% (w/w) PVC, 20% (w/w) Aliquat 336 and 10% (w/w)
1-tetradecanol.
The PVDF-HFP-based membranes were prepared following the procedure
described by O'Bryan et al. [35]. In this method, 700 mg of PVDF-HFP and 300 mg of
Aliquat 336 were dissolved in 8 mL of THF at 50 °C and the mixture was mechanically
stirred until the complete dissolution of all PIM components. The casting solution was
then spread onto a glass plate using a casting knife with 0.5 mm depth setting [35]. The
glass plate was covered with an aluminium tray to allow the slow evaporation of THF in
the next 48 h after which the membrane was peeled from the glass plate.
Interference studies
The effect of common anions in appropriately selected concentration ranges (i.e.,
0.15 mg L-1 – 140 mg L-1 in the case of H2PO4- and 1.0 mg L-1 – 40 mg L-1 in the case of
NO3-, Cl-, HCO3-, and SO42-) on the analytical signal for a 0.05 mg L-1 (0.67 µmol L-1)
As(V) standard was studied.
Sample analysis
Spiked with arsenate at the µg L-1 level tap and mineral water samples were
analysed by both the newly developed FA method and ICP-OES. The tap water was
obtained from Melbourne’s public water supply, and the commercial mineral waters
analysed were: Voss Still Water (Norway), Woolworths Mountain Spring Water
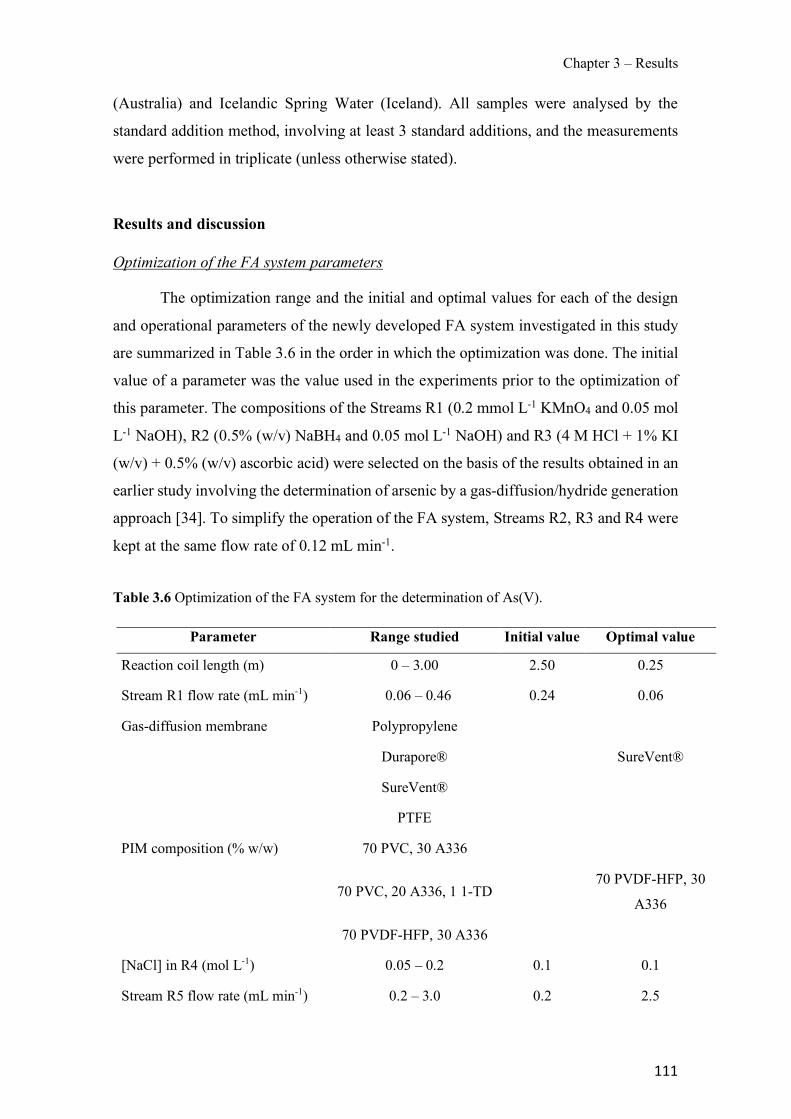
Chapter 3 – Results
111
(Australia) and Icelandic Spring Water (Iceland). All samples were analysed by the
standard addition method, involving at least 3 standard additions, and the measurements
were performed in triplicate (unless otherwise stated).
Results and discussion
Optimization of the FA system parameters
The optimization range and the initial and optimal values for each of the design
and operational parameters of the newly developed FA system investigated in this study
are summarized in Table 3.6 in the order in which the optimization was done. The initial
value of a parameter was the value used in the experiments prior to the optimization of
this parameter. The compositions of the Streams R1 (0.2 mmol L-1 KMnO4 and 0.05 mol
L-1 NaOH), R2 (0.5% (w/v) NaBH4 and 0.05 mol L-1 NaOH) and R3 (4 M HCl + 1% KI
(w/v) + 0.5% (w/v) ascorbic acid) were selected on the basis of the results obtained in an
earlier study involving the determination of arsenic by a gas-diffusion/hydride generation
approach [34]. To simplify the operation of the FA system, Streams R2, R3 and R4 were
kept at the same flow rate of 0.12 mL min-1.
Table 3.6 Optimization of the FA system for the determination of As(V).
Parameter Range studied Initial value Optimal value
Reaction coil length (m) 0 – 3.00 2.50 0.25
Stream R1 flow rate (mL min-1) 0.06 – 0.46 0.24 0.06
Gas-diffusion membrane Polypropylene
Durapore® SureVent®
SureVent®
PTFE
PIM composition (% w/w) 70 PVC, 30 A336
70 PVC, 20 A336, 1 1-TD 70 PVDF-HFP, 30
A336
70 PVDF-HFP, 30 A336
[NaCl] in R4 (mol L-1) 0.05 – 0.2 0.1 0.1
Stream R5 flow rate (mL min-1) 0.2 – 3.0 0.2 2.5
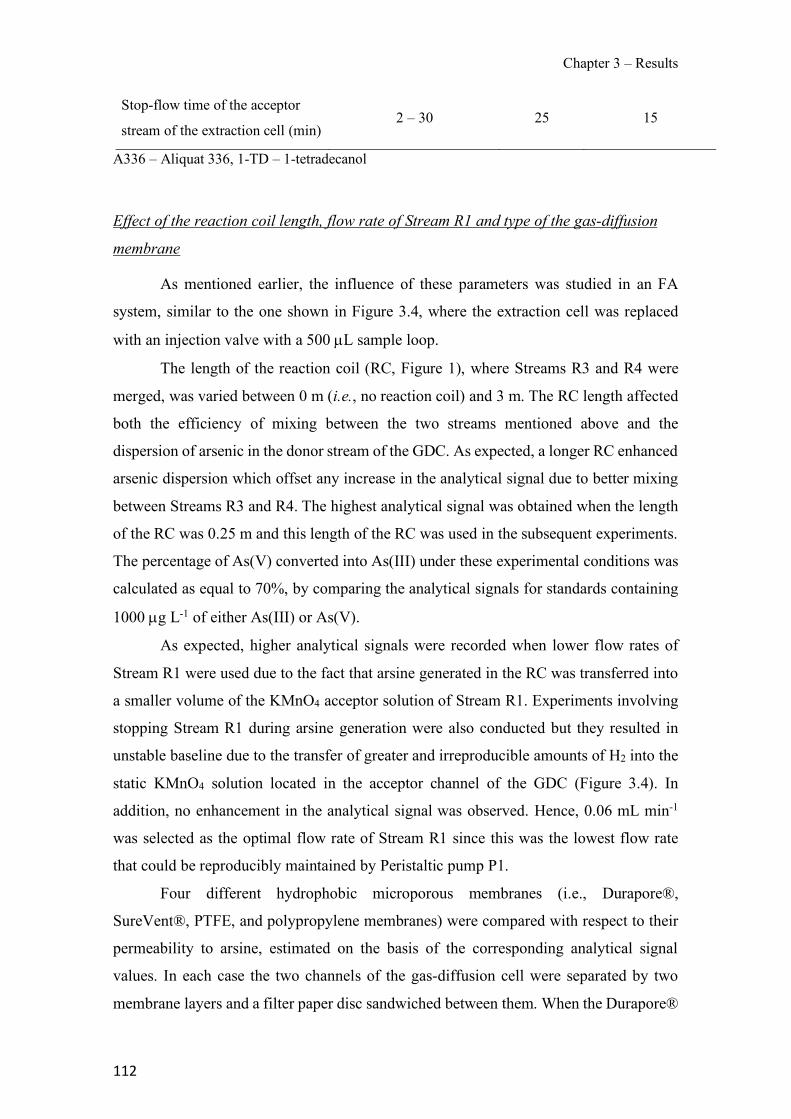
Chapter 3 – Results
112
Stop-flow time of the acceptor
stream of the extraction cell (min) 2 – 30 25 15
A336 – Aliquat 336, 1-TD – 1-tetradecanol
Effect of the reaction coil length, flow rate of Stream R1 and type of the gas-diffusion
membrane
As mentioned earlier, the influence of these parameters was studied in an FA
system, similar to the one shown in Figure 3.4, where the extraction cell was replaced
with an injection valve with a 500 µL sample loop.
The length of the reaction coil (RC, Figure 1), where Streams R3 and R4 were
merged, was varied between 0 m (i.e., no reaction coil) and 3 m. The RC length affected
both the efficiency of mixing between the two streams mentioned above and the
dispersion of arsenic in the donor stream of the GDC. As expected, a longer RC enhanced
arsenic dispersion which offset any increase in the analytical signal due to better mixing
between Streams R3 and R4. The highest analytical signal was obtained when the length
of the RC was 0.25 m and this length of the RC was used in the subsequent experiments.
The percentage of As(V) converted into As(III) under these experimental conditions was
calculated as equal to 70%, by comparing the analytical signals for standards containing
1000 µg L-1 of either As(III) or As(V).
As expected, higher analytical signals were recorded when lower flow rates of
Stream R1 were used due to the fact that arsine generated in the RC was transferred into
a smaller volume of the KMnO4 acceptor solution of Stream R1. Experiments involving
stopping Stream R1 during arsine generation were also conducted but they resulted in
unstable baseline due to the transfer of greater and irreproducible amounts of H2 into the
static KMnO4 solution located in the acceptor channel of the GDC (Figure 3.4). In
addition, no enhancement in the analytical signal was observed. Hence, 0.06 mL min-1
was selected as the optimal flow rate of Stream R1 since this was the lowest flow rate
that could be reproducibly maintained by Peristaltic pump P1.
Four different hydrophobic microporous membranes (i.e., Durapore®,
SureVent®, PTFE, and polypropylene membranes) were compared with respect to their
permeability to arsine, estimated on the basis of the corresponding analytical signal
values. In each case the two channels of the gas-diffusion cell were separated by two
membrane layers and a filter paper disc sandwiched between them. When the Durapore®
Chapter 3 – Results
113
membrane was tested a rapid formation of a brown stain on both membrane surfaces was
observed due to manganese dioxide formation, and for this reason this membrane was
discarded. The average analytical signals based on 10 replicate measurements of a 1000
µg L-1 As(V) standard for the remaining three membranes were 0.081 ± 0.004 for the
polyprolylene membrane, 0.101 ± 0.004 for the PTFE membrane, and 0.102 ± 0.004 for
the SureVent® membrane. Although no significant difference between the last two
membranes was obtained, the baseline was not very stable when using the PTFE
membrane, possibly due to its malleability. SureVent® membrane was selected for
further use because it was slightly thicker and more robust than the PTFE membrane and
no issues with baseline stability were observed.
Effect of the PIM and the compositions of Stream R4
Fontàs et al. [11], reported on the successful use of a PIM composed of the base
polymer PVC and the carrier Aliquat 336 for the preconcentration of arsenate in
groundwater samples. The optimal composition of this PIM, i.e., 70% (w/w) PVC and
30% (w/w) Aliquat 336, was determined in a previous study by the same research team
[10]. In this and other studies [10,36] 0.1 M NaCl was found to be the most suitable
receiving solution for arsenate. The separation of arsenate using an Aliquat 336-based
PIM involves the extraction of the HAsO42- anion from the sample solution into the PIM,
followed by the diffusion of the corresponding adduct of this anion with the quaternary
alkylammonium cation of Aiquat 336 (A+) across the membrane and the back-extraction
of HAsO42- into the acceptor solution containing NaCl as the stripping reagent [10]. The
equilibrium, described by Eq. (3.2), is shifted to the right (extraction into the PIM) at the
sample solution/PIM interface and to the left (back-extraction into the acceptor solution)
at the PIM/acceptor solution interface.
HAsO42- + 2(A+Cl-)PIM ⇆ [(A+)2HAsO42-]PIM + 2Cl- (3.2)
The PIM and the receiving solution, mentioned above, were initially used in the
newly developed FA system for the on-line preconcentration of As(V). However, the
analytical signals obtained in 3 consecutive measurements of a 1000 µg L-1 As(V)
standard (0.09, 0.08, 0.03) were relatively low. The poor repeatability was most likely
due to the leaching of the PIM liquid phase consisting of Aliquat 336 into the adjacent
Chapter 3 – Results
114
aqueous phases. Therefore, other PIM compositions were explored.
One of them was the composition reported by Cho et al. [37] for the extraction of
thiocyanate from weakly alkaline aqueous solutions which consisted of 20% (w/w)
Aliquat 336, 10% (w/w) 1-tetradecanol and 70% (w/w) PVC. This study demonstrated
that the addition of a modifier (e.g., 1-tetradecanol) of a very low water solubility reduced
significantly the leaching of the PIM liquid phase. However, the analytical signal
achieved with this PIM composition (i.e., 0.041, 0.017, 0.023), though higher than the
one for the PIM composed of only 70% (w/w) PVC and 30% (w/w) Aliquat, also showed
poor repeatability.
O’Bryan et al. [35] demonstrated that PVDF-HFP-based PIMs containing 30%
(w/w) Aliquat 336 and 70% (w/w) PVDF-HFP exhibited a significantly higher extraction
and back-extraction rates for thiocyanate and higher stability compared to PVC-based
PIMs containing the same concentration of liquid phase. This PIM provided much higher
analytical signal (i.e., 0.173, 0.173, 0.172) and excellent repeatability and therefore was
used in the subsequent experiments.
The concentration of NaCl in Stream R4 was varied between 0.05 and 0.20 mol
L-1. As expected, the analytical signal increased with increasing the NaCl concentration
up to 0.1 mol L-1 after which no further signal enhancement was observed. Therefore, 0.1
mol L-1 was selected as the optimal NaCl concentration in Stream R4.
Effect of the flow rate of Stream R5 and the stop-flow time for Stream R4
It can be expected that the analytical signal will depend heavily on both the flow
rate of Stream R5 and the stop-flow time (i.e., duration of the sample flow through the
extraction cell) because these two parameters determine the sample volume and its
contact time with the PIM. The individual effects of these two parameters on the
analytical signal are not independent of each other and for this reason their combined
effect was studied and the results are presented in Figure 3.6. It was observed that,
independently of the flow rate of Stream R5, the analytical signal increased rapidly with
increasing the stop-flow time up to 15 min and then it started gradually to level off. Also,
it was observed that independently of the stop-flow time, the analytical signal increased
with increasing the flow rate of Stream R5 up to 2.5 mL min-1 after which it started
decreasing. Therefore, 2.5 mL min-1 was selected as the optimal flow rate. The analytical
signal did not increase significantly for stop-flow times greater than 15 min (e.g., an
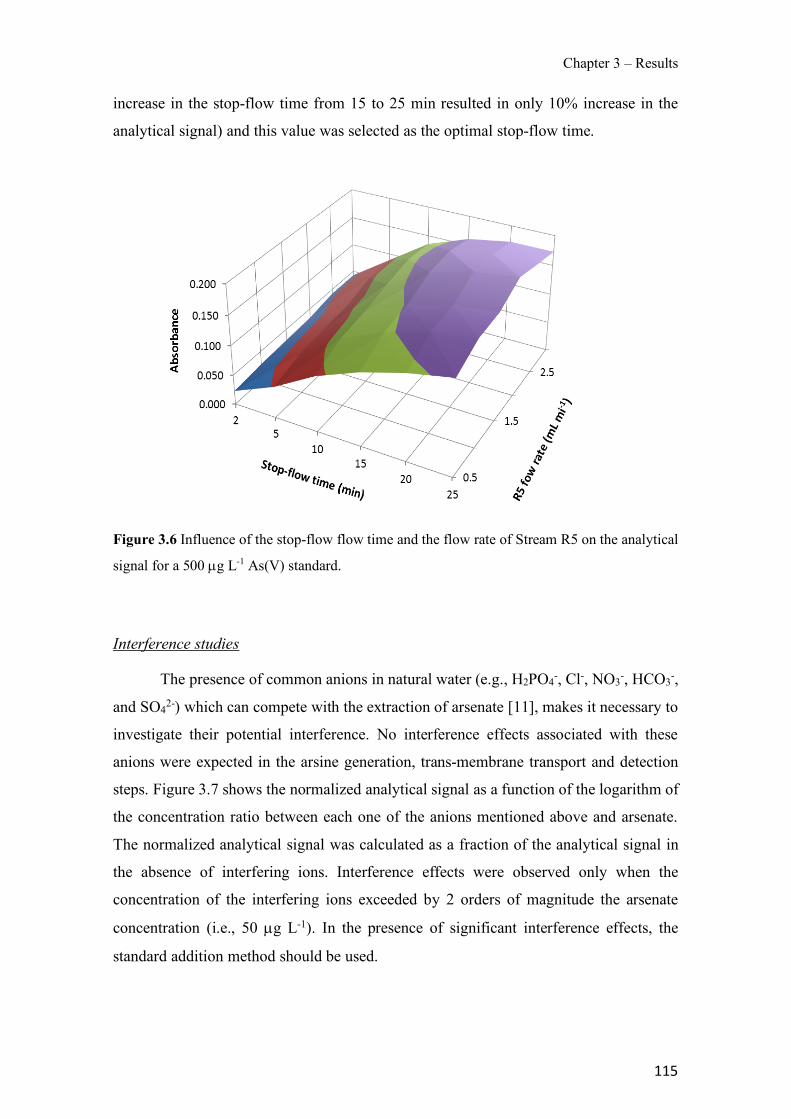
Chapter 3 – Results
115
increase in the stop-flow time from 15 to 25 min resulted in only 10% increase in the
analytical signal) and this value was selected as the optimal stop-flow time.
Figure 3.6 Influence of the stop-flow flow time and the flow rate of Stream R5 on the analytical
signal for a 500 µg L-1 As(V) standard.
Interference studies
The presence of common anions in natural water (e.g., H2PO4-, Cl-, NO3-, HCO3-,
and SO42-) which can compete with the extraction of arsenate [11], makes it necessary to
investigate their potential interference. No interference effects associated with these
anions were expected in the arsine generation, trans-membrane transport and detection
steps. Figure 3.7 shows the normalized analytical signal as a function of the logarithm of
the concentration ratio between each one of the anions mentioned above and arsenate.
The normalized analytical signal was calculated as a fraction of the analytical signal in
the absence of interfering ions. Interference effects were observed only when the
concentration of the interfering ions exceeded by 2 orders of magnitude the arsenate
concentration (i.e., 50 µg L-1). In the presence of significant interference effects, the
standard addition method should be used.
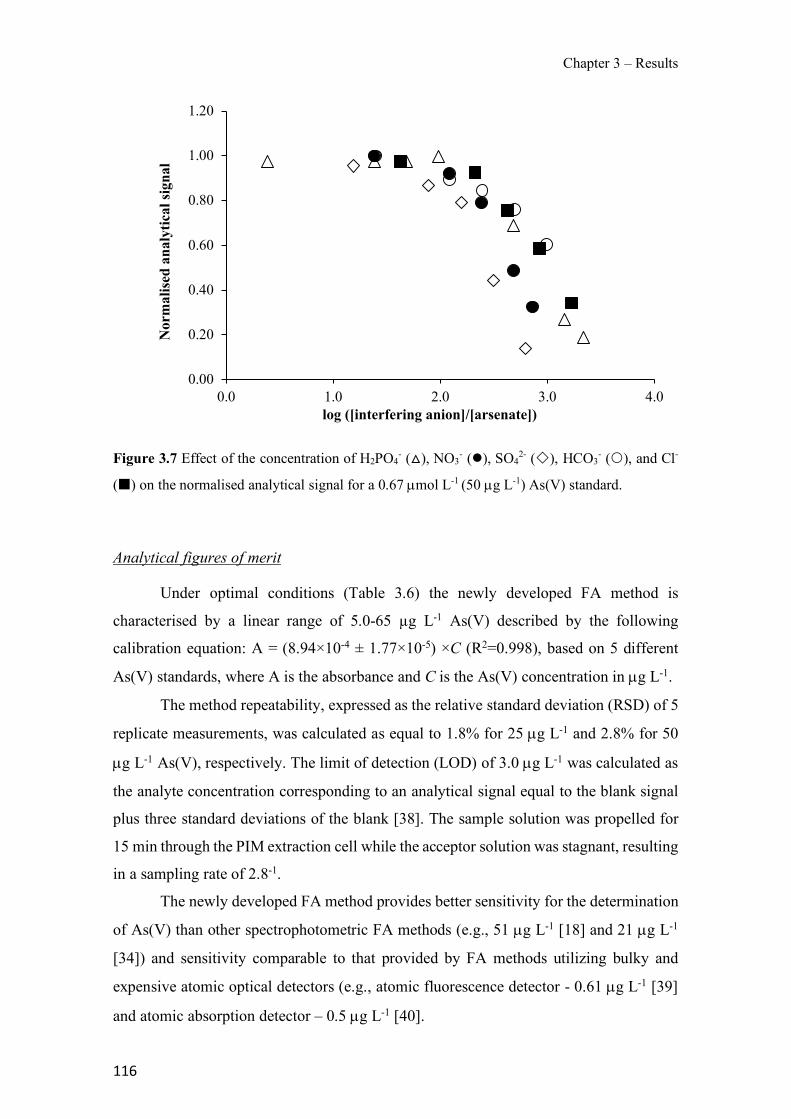
Chapter 3 – Results
116
Figure 3.7 Effect of the concentration of H2PO4- (△), NO3
- (l), SO42- (¯), HCO3
- (�), and Cl-
(¢) on the normalised analytical signal for a 0.67 µmol L-1 (50 µg L-1) As(V) standard.
Analytical figures of merit
Under optimal conditions (Table 3.6) the newly developed FA method is
characterised by a linear range of 5.0-65 µg L-1 As(V) described by the following
calibration equation: A = (8.94×10⁻⁴ ± 1.77×10⁻⁵) ×C (R2=0.998), based on 5 different
As(V) standards, where A is the absorbance and C is the As(V) concentration in µg L-1.
The method repeatability, expressed as the relative standard deviation (RSD) of 5
replicate measurements, was calculated as equal to 1.8% for 25 µg L-1 and 2.8% for 50
µg L-1 As(V), respectively. The limit of detection (LOD) of 3.0 µg L-1 was calculated as
the analyte concentration corresponding to an analytical signal equal to the blank signal
plus three standard deviations of the blank [38]. The sample solution was propelled for
15 min through the PIM extraction cell while the acceptor solution was stagnant, resulting
in a sampling rate of 2.8-1.
The newly developed FA method provides better sensitivity for the determination
of As(V) than other spectrophotometric FA methods (e.g., 51 µg L-1 [18] and 21 µg L-1
[34]) and sensitivity comparable to that provided by FA methods utilizing bulky and
expensive atomic optical detectors (e.g., atomic fluorescence detector - 0.61 µg L-1 [39]
and atomic absorption detector – 0.5 µg L-1 [40].
0.00
0.20
0.40
0.60
0.80
1.00
1.20
0.0 1.0 2.0 3.0 4.0
Nor
mal
ised
anal
ytic
al si
gnal
log ([interfering anion]/[arsenate])
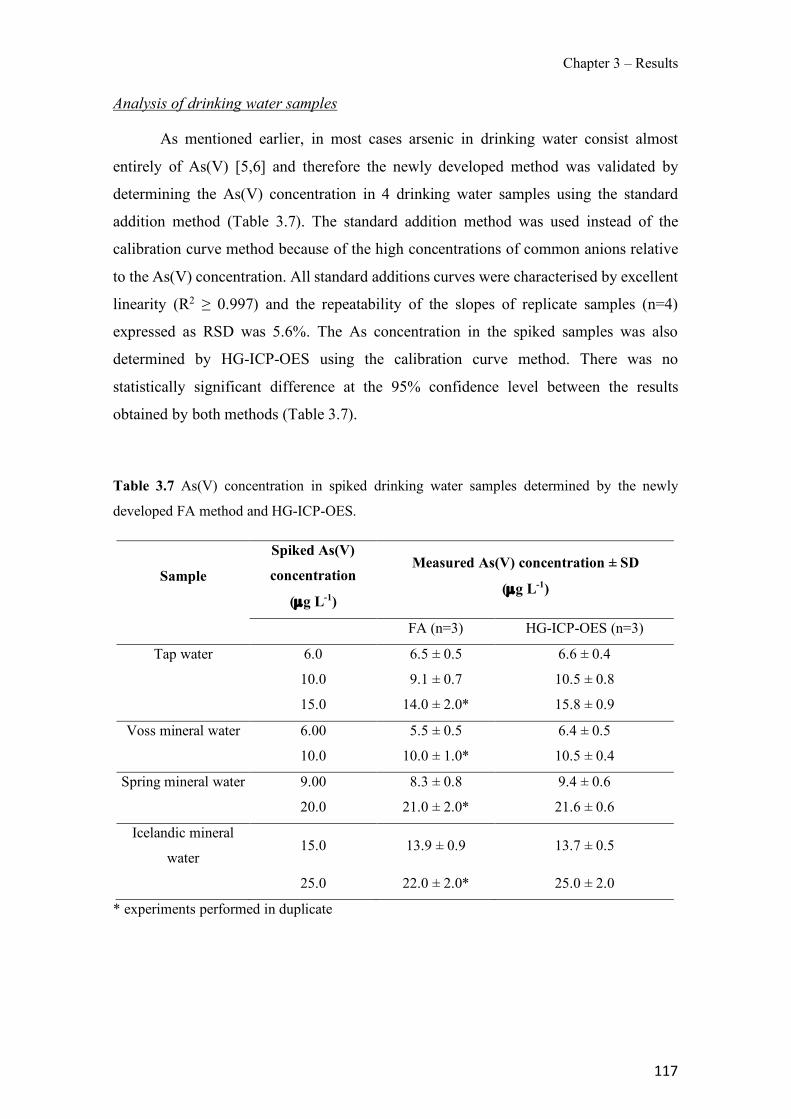
Chapter 3 – Results
117
Analysis of drinking water samples
As mentioned earlier, in most cases arsenic in drinking water consist almost
entirely of As(V) [5,6] and therefore the newly developed method was validated by
determining the As(V) concentration in 4 drinking water samples using the standard
addition method (Table 3.7). The standard addition method was used instead of the
calibration curve method because of the high concentrations of common anions relative
to the As(V) concentration. All standard additions curves were characterised by excellent
linearity (R2 ≥ 0.997) and the repeatability of the slopes of replicate samples (n=4)
expressed as RSD was 5.6%. The As concentration in the spiked samples was also
determined by HG-ICP-OES using the calibration curve method. There was no
statistically significant difference at the 95% confidence level between the results
obtained by both methods (Table 3.7).
Table 3.7 As(V) concentration in spiked drinking water samples determined by the newly
developed FA method and HG-ICP-OES.
Sample
Spiked As(V)
concentration
(µg L-1)
Measured As(V) concentration ± SD
(µg L-1)
FA (n=3) HG-ICP-OES (n=3)
Tap water 6.0 6.5 ± 0.5 6.6 ± 0.4
10.0 9.1 ± 0.7 10.5 ± 0.8
15.0 14.0 ± 2.0* 15.8 ± 0.9
Voss mineral water 6.00 5.5 ± 0.5 6.4 ± 0.5
10.0 10.0 ± 1.0* 10.5 ± 0.4
Spring mineral water 9.00 8.3 ± 0.8 9.4 ± 0.6
20.0 21.0 ± 2.0* 21.6 ± 0.6
Icelandic mineral
water 15.0 13.9 ± 0.9 13.7 ± 0.5
25.0 22.0 ± 2.0* 25.0 ± 2.0
* experiments performed in duplicate
Chapter 3 – Results
118
Conclusions
The hydride generation FA system for the determination of arsenate in drinking
waters at low µg L-1 levels, developed as part of the current study, utilizes for the first
time PIM-based on-line extractive separation of arsenate from the sample matrix which
is subsequently reduced to arsine, detected spectrophotometrically after its on-line gas-
diffusion separation. Under optimal conditions the FA system is characterized by an LOD
of 3.0 µg L-1 and a repeatability, expressed as RSD, of 1.8% (n=5, 25 µg L-1) and 2.8%
(n=5, 50 µg L-1). Lower limits of detection could be potentially achieved by using longer
stop-flow times of the extraction cell acceptor solution, i.e., larger sample volumes.
Common anions, such as phosphate, nitrate, sulphate, carbonate, and chloride, were found
to interfere in the PIM-based separation process only at a concentrations 100 times higher
than that of arsenate. The newly developed FA system allowed the accurate determination
of arsenate in drinking water spiked with As(V) at the low µg L-1 level using the multi-
point standard addition method. Since arsenic in most drinking waters is almost entirely
composed of arsenate, it can be expected that the FA system, mentioned above, would be
applicable for total arsenic determination of drinking water.
References
[1] I. Villaescusa, J.-C. Bollinger, Arsenic in drinking water: sources, occurrence and
health effects (a review), Rev. Environ. Sci. Bio./Technol. 7 (2008) 307-323.
[2] R. Vera, C. Fontas, E. Antico, Titanium dioxide solid phase for inorganic species
adsorption and determination: the case of arsenic, Environ. Sci. Pollut. Res.
24(12) (2017) 10939–10948.
[3] M. Bissen, F.H. Frimmel, Arsenic - A review. Part I: Occurrence, toxicity,
speciation, mobility, Acta Hydrochim. Hydrobiol. 31 (2003) 9–18.
[4] World Health Organization (WHO). Guidelines for drinking-water quality, 4th ed,
WHO, Geneva, 2011.
[5] S. Döker, M. Yılmaz, Speciation of Arsenic in Spring, Well, and Tap Water by
High-performance Liquid Chromatography–Inductively Coupled Plasma–Mass
Spectrometry, Anal. Lett. 51(1-2) (2018) 254–264.
Chapter 3 – Results
119
[6] I. Komorowicz, D. Barałkiewicz, Determination of total arsenic and arsenic
species in drinking water, surface water, wastewater, and snow from
Wielkopolska, Kujawy-Pomerania, and Lower Silesia provinces, Poland,
Environ. Monit. Assess 188 (2016) 504.
[7] V.N. Alves, T.S. Neri, S.S.O. Borges, D.C. Carvalho, N.M.M. Coelho,
Determination of inorganic arsenic in natural waters after selective extraction
using Moringa oleífera seeds, Ecological Engineering 106 (2017) 431-435.
[8] M.L. Susko, M.S. Bloom, I.A. Neamtiu, A.A. Appleton, S. Surdu, C. Pop, E.F.
Fitzgerald, D. Anastasiu, E.S. Gurzau, Low-level arsenic exposure via drinking
water consumption and female fecundity - A preliminary investigation, Environ.
Res. 154 (2017) 120–125.
[9] G. Chen, B. Lai, X. Mao, T. Chen, M. Chen, Continuous Arsine Detection Using
a Peltier-Effect Cryogenic Trap to Selectively Trap Methylated Arsines, Anal.
Chem. 89 (2017) 8678–8682.
[10] R. Güell, E. Anticó, S.D. Kolev, J. Benavente, V. Salvadó, C. Fontàs,
Development and characterization of polymer inclusion membranes for the
separation and speciation of inorganic As species, J. Membr. Sci. 383 (2011) 88–
95.
[11] C. Fontàs, R. Vera, A. Batalla, S.D. Kolev, E. Anticó, A novel low-cost detection
method for screening of arsenic in groundwater, Environ. Sci. Pollut. Res. 21
(2013) 11682–8.
[12] M. Valcarcel, M.D. Luque de Castro, Flow-Injection Analysis: Principles and
Applications, Ellis Horwood, Chichester, 1987.
[13] V. Cerda, J.M. Estela, On-line sample pretreatment: dissolution and digestion, in:
S.D. Kolev, I.D. McKelvie (Eds.), Advances in Flow Injection Analysis and
Related Techniques, Elsevier, Amsterdam, 2008, pp. 129–158.
[14] A.G. Fogg, N.K. Bsebsu, Differential-pulse voltammetric determination of
phosphate as molybdovanadophosphate at a glassy carbon electrode and
assessment of eluents for the flow injection voltammetric determination of
phosphate, silicate, arsenate and germanate, Analyst 106(1269) (1981) 1288–
Chapter 3 – Results
120
1295.
[15] J.R. Farrell, P.J. Iles, Y.J. Yuan, Determination of arsenic by hydride generation
gas diffusion flow injection analysis with electrochemical detection, Anal. Chim.
Acta 334 (1996) 193–197.
[16] T. Rupasinghe, T.J. Cardwell, R.W. Cattrall, S.D. Kolev, Determination of arsenic
in industrial samples by pervaporation flow injection with amperometric
detection, Anal. Chim. Acta 652 (2009) 266–271.
[17] C. Lomonte, M. Currell, R.J.S. Morrison, I.D. McKelvie, S.D. Kolev, Sensitive
and ultra-fast determination of arsenic(III) by gas-diffusion flow injection
analysis with chemiluminescence detection, Anal. Chim. Acta 583 (2007) 72–77.
[18] W. Boonjob, M. Miró, S.D. Kolev, On-line speciation analysis of inorganic
arsenic in complex environmental aqueous samples by pervaporation sequential
injection analysis, Talanta 117 (2013) 8–13.
[19] T. Rupasinghe, T.J. Cardwell, R.W. Cattrall, I.D. Potter, S.D. Kolev,
Determination of arsenic by pervaporation-flow injection hydride generation and
permanganate spectrophotometric detection, Anal. Chim. Acta 510 (2004) 225–
230.
[20] T. Rupasinghe, T.J. Cardwell, R.W. Cattrall, M.D. Luque de Castro, S.D. Kolev,
Pervaporation-flow injection determination of arsenic based on hydride
generation and the molybdenum blue reaction, Anal. Chim. Acta 445 (2001) 229–
238.
[21] D.L. Johnson, M.E.Q. Pilson, Spectrophotometric determination of arsenite,
arsenate, and phosphate in natural waters, Anal. Chim. Acta 58 (1972) 289–299.
[22] W. Frenzel, F. Titzenthaler, S. Elbel, Selective determination of arsenite by flow
injection spectrophotometry, Talanta 41 (1994) 1965–1971.
[23] Y. Narusawa, Flow-injection spectrophotometric determination of silicate,
phosphate and arsenate with on-line column separation, Anal. Chim. Acta 204
(1988) 53–62.
[24] R.K. Dhar, Y. Zheng, J. Rubenstone, A. Van Geen, A rapid colorimetric method
Chapter 3 – Results
121
for measuring arsenic concentrations in groundwater, Anal. Chim. Acta 526
(2004) 203–209.
[25] K. Toda, T. Ohba, Highly Sensitive Flow Analysis of Trace Level Arsenic in
Water Based on Vaporization-collection In-line Preconcentration, Chem. Lett. 34
(2005) 176–177.
[26] M.A. Kamyabi, A. Aghaei, Electromembrane extraction and spectrophotometric
determination of As(V) in water samples, Food Chem. 212 (2016) 65–71.
[27] M.I.G.S. Almeida, R.W. Cattrall, S.D. Kolev, Polymer inclusion membranes
(PIMs) in chemical analysis - A review, Anal. Chim. Acta 987 (2017) 1–14.
[28] M.I.G.S. Almeida, R.W. Cattrall, S.D. Kolev, Recent trends in extraction and
transport of metal ions using polymer inclusion membranes (PIMs), J. Membr.
Sci. 415–416 (2012) 9–23.
[29] L.D. Nghiem, P. Mornane, I.D. Potter, J.M. Perera, R.W. Cattrall, S.D. Kolev,
Extraction and transport of metal ions and small organic compounds using
polymer inclusion membranes (PIMs), J. Membr. Sci. 281 (2006) 7–41.
[30] L.L. Zhang, R.W. Cattrall, M. Ashokkumar, S.D. Kolev, On-line extractive
separation in flow injection analysis based on polymer inclusion membranes : A
study on membrane stability and approaches for improving membrane
permeability, Talanta 97 (2012) 382–387.
[31] L.L. Zhang, R.W. Cattrall, S.D. Kolev, The use of a polymer inclusion membrane
in flow injection analysis for the on-line separation and determination of zinc,
Talanta 84 (2011) 1278–1283.
[32] E.A. Nagul, C. Fontàs, I.D. McKelvie, R.W. Cattrall, S.D. Kolev, The use of a
polymer inclusion membrane for separation and preconcentration of
orthophosphate in flow analysis, Anal. Chim. Acta 803 (2013) 82–90.
[33] M.R. Yaftian, M.I.G.S. Almeida, R.W. Cattrall, S.D. Kolev, Flow injection
spectrophotometric determination of V(V) involving on-line separation using a
poly(vinylidene fluoride-co-hexafluoropropylene)-based polymer inclusion
membrane, Talanta 181 (2018) 385–391.
Chapter 3 – Results
122
[34] Y. Zhang, M. Miró, S.D. Kolev, Hybrid flow system for automatic dynamic
fractionation and speciation of inorganic arsenic in environmental solids, Environ.
Sci. Technol. 49 (2015) 2733–2740.
[35] Y. O'Bryan, R.W. Cattrall, Y.B. Truong, I.L. Kyratzis, S.D. Kolev, The use of
poly(vinylidenefluoride-co-hexafluoropropylene) for the preparation of polymer
inclusion membranes. Application to the extraction of thiocyanate, J. Membr. Sci.
510 (2016) 481–488.
[36] R. Güell, C. Fontàs, E. Anticó, V. Salvadó, J.G. Crespo, S. Velizarov, Transport
and separation of arsenate and arsenite from aqueous media by supported liquid
and anion-exchange membranes, Sep. Purif. Technol. 80 (2011) 428–434.
[37] Y. Cho, C. Xu, R.W. Cattrall, S.D. Kolev, A polymer inclusion membrane for
extracting thiocyanate from weakly alkaline solutions, J. Membr. Sci. 367 (2011)
85–90.
[38] J.C. Miller, J.N. Miller, Statistics and chemometrics for Analytical Chemistry,
Pearson Education Limited, Harlow, Essex England, 2010.
[39] A. Caballo-Lopez, M.D. Luque de Castro, Hydride generation-pervaporation-
atomic fluorescence detection prior to speciation analysis of arsenic in dirty
samples, J. Anal. At. Spectrom. 17 (2002) 1363–1367.
[40] Y. Zhang, S.B. Adeloju, Flow injection-hydride generation atomic absorption
spectrometric determination of selenium, arsenic and bismuth, Talanta 76(4)
(2008) 724-730.
Chapter 3 – Results
123
3.1.3 Titanium dioxide solid phase for inorganic species adsorption and
determination: the case of arsenic
Abstract
We have evaluated a new titanium dioxide (Adsorbsia As600) for the adsorption
of both inorganic As(V) and As(III) species. In order to characterize the sorbent, batch
experiments were undertaken to determine the capacities of As(III) and As(V) at pH 7.3,
which were found to be 0.21 and 0.14 mmol g−1, respectively. Elution of adsorbed species
was only possible using basic solutions, and arsenic desorbed under batch conditions was
50% when 60 mg of loaded titanium dioxide was treated with 0.5 M NaOH solution.
Moreover, its use as a sorbent for solid-phase extraction and preconcentration of arsenic
species from well waters has been investigated, without any previous pretreatment of the
sample. Solid-phase extraction was implemented by packing several minicolumns with
Adsorbsia As600. The method has been validated showing good accuracy and precision.
Acceptable recoveries were obtained when spiked waters at 100–200 µg L−1 were
measured. The presence of major anions commonly found in waters did not affect arsenic
adsoption, and only silicate at 100 mg L−1 level severely competed with arsenic species
to bind to the material. Finally, the measured concentrations in water samples containing
arsenic from the Pyrinees (Catalonia, Spain) showed good agreement with the ICP-MS
results.
Introduction
Arsenic is an element found in the earth’s crust. Its concentration in most rocks
ranges from 0.5 to 2.5 mg/kg, though higher concentrations are found in finer-grained
argillaceous sediments and phosphorites [1]. Arsenic is mobilized by natural weathering
reactions, biological activity, geochemical reactions, volcanic emissions and other
anthropogenic activities. Moreover, it was commonly used as part of the formulation of
different pesticides used in agriculture [2]. Its occurrence in groundwater has been
reported mainly in Bangladesh, China, India, Chile, Argentina, Mexico, Taiwan,
Vietnam, and the USA, but also in several regions of Europe [3]. Arsenic is recognized
to be carcinogenic and long-term drinking water exposure causes pigmentation changes,
Chapter 3 – Results
124
skin thickening, neurological disorders, muscular weakness, loss of appetite, and nausea
[4]. For this reason, the World Health Organization (WHO) fixed a limit concentration of
arsenic in drinking waters at 10 µg L−1 [5]. From the chemical point of view, arsenic in
waters can be encountered as inorganic or organic species and also in different oxidation
states, e.g. As(V) and the more toxic As(III). Under reducing conditions, As(III) is
prevalent while As(V) is the major species present under oxidizing atmospheres [3].
Due to the great toxicity of arsenic and the low levels that are permitted in drinking
water, it has become necessary to develop highly sensitive methods for its monitoring.
Besides atomic fluorescence spectroscopy (AFS), graphite furnace atomic absorption
(GFAAS), hydride generation atomic absorption (HGAAS), and inductively coupled
plasma-mass spectrometry (ICP-MS) [6,7], which require significant investment and
trained personnel, simpler methodologies such as colorimetry can be employed [8], which
are usually preceded by a preconcentration step. Solvent extraction and sorption on solid
supports [9,10] are a good alternative for arsenic preconcentration. The affinity of As(V)
to adsorb on solid phases has been well documented for removal purposes [11]. High
elimination efficiency is obtained using iron oxides or zero-valent iron [12,13], modified
calcinated bauxite [14], hydrotalcite [15], and titanium dioxide [16-20] among others. In
fact, the arsenic removal from groundwater for drinking purposes is mainly based on such
adsorption phases.
The behaviour of titanium dioxide (TiO2) as a photocatalyst and for arsenic
removal has been extensively reviewed by Guan et al. [21]. It has been applied in different
forms, such as nanocrystalline particles, nanotubes, hydrous and granular, impregnated
in chitosan beads, and based bimetal adsorbents. The authors discuss the capability of
TiO2 to oxidize As(III) to As(V), emphasizing the key role of crystal morphology and
specific surface area to ensure an efficient removal of arsenic from water. Adsorption
capacities at pH 7 ranging from 83 to 2.05 mg g−1 (1.094 to 0.027 mmol g−1) were reported
for hydrous TiO2 (anatase) and TiO2 impregnated in chitosan beads, respectively [21].
For analytical purposes, different solid phases have been suggested to
preconcentrate arsenic, including the use of ion exchangers and chemically functionalized
sorbents. Ion exchangers and aluminosilicate disposable cartridges have been exploited
for field speciation of arsenic contemplating the pH dependence of arsenic species to
enable selective preconcentration. The procedure employed consists of the selective
retention of As(V) when a volume of water sample is passed through the disposable
cartridge. The analysis of the filtered sample allows the As(III) concentration to be
Chapter 3 – Results
125
determined, while total arsenic is determined from an independent non-filtered sample
[22,23] or through a previous oxidation/reduction step [24,25]. Additionally, anion and
cation exchangers have also been successfully applied for the speciation of organic and
inorganic arsenic [26].
Ordered mesoporous silica modified with 3-(2-aminoethylamino)
propyltrimethoxysilane [27] and CTAB-modified alkyl silica [28] has also been
employed for arsenic preconcentration. The formation of arsenic complexes that are later
entrapped in a solid sorbent has been exploited by Pozebon et al. [29]. In their research,
ammonium diethyl dithiophosphate was used for the complexation of As(III) and a C-18
bonded silica gel microcolumn was used for the sorption; As(V) was then determined
after being reduced using potassium iodide together with ascorbic acid. Other approaches
are based on the preconcentration and separation of arsenic species in a knotted reactor
coupled to hydride generation atomic fluorescence spectrometry [30].
The reported use of TiO2 with or without modifiers for analytical purposes is, to
the best of our knowledge, limited to Chen et al. [31], Huang et al. [32] and Liang and
Liu [33]. Chen et al. [31] use a PTFE microcolumn filled with TiO2 nanotubes for the
speciation of inorganic arsenic in environmental water samples by ICP-MS. In Huang et
al. [32], dimercaptosuccinic acid-modified TiO2 and inductively coupled plasma optical
emission spectrometry is used for the online separation of arsenic species. The detection
limit (LOD) reached for the offline mode is rather low (0.1 µg L−1) due to the higher
enrichment factor (50), and speciation is accomplished by choosing the most appropriate
working pH. Liang et al. have reported the speciation analysis of inorganic arsenic in
water samples by using a nanometre TiO2 immobilized on silica gel and graphite furnace
atomic absorption spectrometry [33]. Only As(III) could be adsorbed quantitatively on
the sorbent in the 9.5– 10.5 pH range. The LOD is 24 ng L−1 with an enrichment factor
of 50. The present research aimed to investigate the use of Adsorbsia As600, a
commercial-grade TiO2, as an adsorbent for arsenic in analytical applications. The solid
can be easily obtained and it has been fully characterized for the adsorption and
preconcentration of arsenic species prior to their determination using ICP-OES. The
analytical parameters and the application of the designed system to the determination of
arsenic in well waters are shown.
Chapter 3 – Results
126
Experimental
Reagents and solutions
Stock solutions (100 mg L−1) of As(V) and As(III) were prepared from
Na2HAsO4·7H2O (Merck) and NaAsO2 (Fluka) solids, respectively. Solutions of As(V)
in ultrapure water were prepared by dilution of the corresponding stock solutions and the
resulting pH was 7.3. However, to obtain this pH in the case of As(III), acidification with
HCl was required. Sodium hydroxide (Panreac) was used to prepare the elution solution.
Calibration standards of As were prepared using the Spectrascan standard solution for
atomic spectroscopy (Teknolab). All reagents and solvents were of analytical reagent
grade and distilled water was purified through a Milli-Q Plus system (Millipore).
Commercial TiO2 Adsorbsia As600 was purchased from the manufacturer (Dow).
This sorbent is designed as a single-use adsorbent for the treatment of drinking water. It
is selective for oxyanions such as arsenate, chromate and selenite, but it also shows a
strong affinity for lead and other heavy metals. According to the information supplied,
the material consists of granulated TiO2 media with particle size ranging from 250 to
1180 µm and a specific surface area of 250 m2 g−1. The solid was cleaned with high purity
water and air-dried before being used, and only particles with a particle size from 500 to
900 µm were selected.
Instruments
A sequential inductively coupled plasma atomic emission spectrometer (Liberty
RL, Varian, Mulgrave, Vic., Australia) was used to determine the total concentration of
As in the aqueous solutions at λ = 228 nm. The detection limit in 0.1 M NaCl medium
was 300 µg L−1 of As.
A quadrupole-based ICP-MS system (Agilent 7500c, Agilent Technologies,
Tokyo, Japan) equipped with an octopole collision reaction cell was used for arsenic
determination in natural water samples. The isotope 75As was selected and special
conditions in the reaction cell (3 mL min−1 H2 + 0.5 mL min−1 He) were employed to
avoid spectral interferences due to the presence of chloride in water samples. The anionic
composition of the water samples was determined by an ion chromatograph (IC)
DIONEX IC5000 equipped with an autosampler AS-AP, a conductivity detector, and an
IonPac® AS18 anion-exchange column (4 × 250 mm) with the AG Guard column (4 ×
Chapter 3 – Results
127
50 mm).
X-ray diffraction measurement was performed on a Bruker D8Advance
equipment using Cu Kalpha radiation, in transmission mode. X-ray fluorescence (XRF)
spectra were obtained with a Bruker S2Ranger, equipped with a Pd tube and Spectra EDX
software.
Isoelectric point measurements were performed dispersing the sample (previously
grinded to a particle size <100 µm) in water (0.1% w/v) and modifying its pH by adding
small volumes of HCl and NaOH solutions. At each pH point, the zeta potential of the
sample was measured using the ZetaSizer Nano ZS (Malvern Instruments).
The pH and conductivity values of the water samples were determined with a
Crison Model GLP 22 pH meter and an Ecoscan portable conductometer (Entech
Instruments), respectively.
A Gilson peristaltic pump (Pacisa, Barcelona, Spain) was used to load the arsenic
solutions into the minicolumn.
A rotary mixer (Labinco) was used in experiments where rotatory agitation was
necessary.
Determination of the capacity of the adsorbent
Batch experiments
To evaluate the capacity of Adsorbsia As600 following a batch procedure, 20 mL
of As solution (10 mg L−1) was contacted with 0.06 g of the sorbent at different
predetermined times (1 h for As(V) and 24 h for As(III)) in stoppered glass tubes. The
mixture was filtered and the solution was analysed to determine the arsenic concentration
in the filtrate. This process was repeated by using fresh solution until saturation was
reached.
Flow experiments
Two types of packed columns were prepared depending on the purpose. For
determining breakthrough curves, the solid granules (0.2 g or 0.8 g) were packed in a
glass column with 0.6 cm i.d. A solution containing 20 mg L−1 As(V) at the working pH
was pumped through the column at a flow rate of 1 mL min−1. The arsenic concentration
Chapter 3 – Results
128
in the effluent was continuously monitored to obtain the breakthrough curves. For
preconcentration purposes, 60 mg of Adsorbsia As600 was packed into a self-made
minicolumn consisting of a micropipette tip, plugged with a small portion of glass wool
at both ends, and then connected to a flow system. The amount of sorbent in the
minicolumn took into account the capacity of Adsorbsia As600 towards As(V) and
As(III). This amount is similar to the amount of solid phase in commercial ion exchange
cartridges [34]. In this case, 0.5 and 1 mL min−1 were tested as flow rates.
Selecting the elution conditions
The elution of adsorbed As(V) and As(III) was studied under batch and flow
conditions. Considering previously reported results, HCl, NaCl and NaOH solutions were
tested as elutant in batch mode [31,35,36]. For batch experiments, the loaded sorbent (0.1
g) was contacted with 20 mL of the tested solution to evaluate the percentage of As(V)
and As(III) eluted, with a contact time of 24 h.
Elution under flow conditions with the sorbent packed in the glass column was
also investigated, for which 0.2 g of loaded sorbent was contacted with 0.1 M NaOH
solution at 1 mL min−1, and the arsenic concentration in the effluent was continuously
monitored. Elution curves were then plotted using these data.
For the elution of arsenic loaded in the 60-mg minicolumn, 2–4 mL of 0.5M
NaOH solution was used at a flow rate of 0.5 and 1 mL min−1.
Interference from major ions
Competitive experiments were designed with samples containing nitrate, sulphate,
chloride, hydrogen carbonate, phosphate and silicate at the highest concentration level
found in the non-contaminated natural water samples. Fifty millilitres of spiked water
was used containing 200 µg L−1 As(V) at pH 7.3, percolated trough the Adsorbsia As600
minicolumn, and elution was performed with 2 mL of 0.5 M NaOH solution. Both loading
and elution flow rate were 1 mL min−1.
Chapter 3 – Results
129
Calibration curve and method validation
Solutions (50 mL) containing As in ultrapure water at different concentrations
from 50 to 500 µg L−1 were passed through the minicolumn at a flow rate of 1 mL min−1.
The loaded As was eluted with 2 mL of 0.5 M NaOH solution and ICP-OES signal
intensity was measured. A calibration curve was obtained by plotting the signal intensity
vs. the arsenic content in the ultrapure water solutions.
The method was validated by checking the linearity in the selected working range,
the limit of detection, the repeatability (n=3), and also by performing recovery
experiments at a concentration level of 200 µg L−1 of both As(V) and As(III). The limit
of detection of the method was calculated as the concentration giving a signal equal to
the intercept of the calibration curve plus three times the standard deviation of the
intercept [37], under the final experimental conditions.
Water Samples
Water samples containing naturally occurring arsenic and others without arsenic
were collected in the north of Catalonia (Spain). The samples were analysed and their
composition is given in Table 3.8. Three different wells at both Lles and Setcases, villages
in the foothills of the Pyrenees, were sampled. At Caldes, the water was collected from a
hot spring. Unless otherwise stated, 50 mL of water samples were percolated trough the
Adsorbsia As600 minicolumn, then eluted with 2 mL of 0.5 M NaOH solution and finally,
the arsenic signal was measured. The amount of arsenic in the samples was obtained by
interpolating the intensity value in the experimental calibration plot.
All experiments were at least performed in duplicate. The temperature was kept
within the range 22 ± 2 °C.
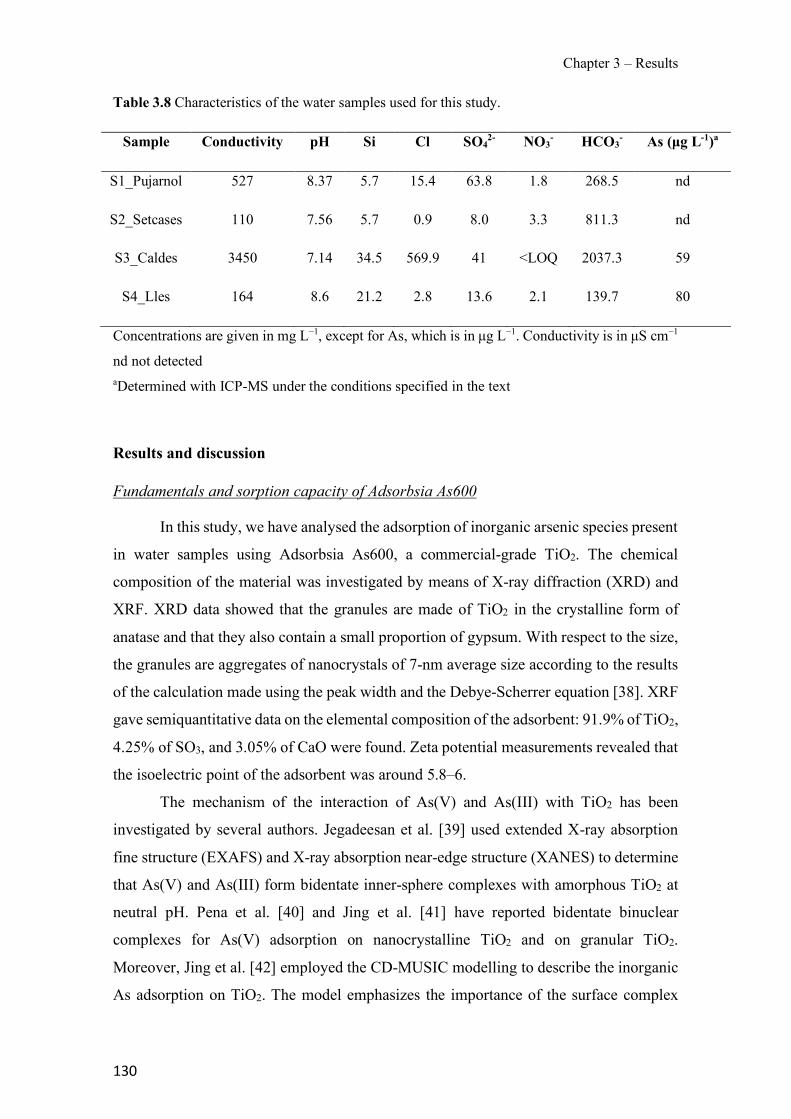
Chapter 3 – Results
130
Table 3.8 Characteristics of the water samples used for this study.
Sample Conductivity pH Si Cl SO42- NO3
- HCO3- As (µg L-1)a
S1_Pujarnol 527 8.37 5.7 15.4 63.8 1.8 268.5 nd
S2_Setcases 110 7.56 5.7 0.9 8.0 3.3 811.3 nd
S3_Caldes 3450 7.14 34.5 569.9 41 <LOQ 2037.3 59
S4_Lles 164 8.6 21.2 2.8 13.6 2.1 139.7 80
Concentrations are given in mg L−1, except for As, which is in µg L−1. Conductivity is in µS cm−1
nd not detected aDetermined with ICP-MS under the conditions specified in the text
Results and discussion
Fundamentals and sorption capacity of Adsorbsia As600
In this study, we have analysed the adsorption of inorganic arsenic species present
in water samples using Adsorbsia As600, a commercial-grade TiO2. The chemical
composition of the material was investigated by means of X-ray diffraction (XRD) and
XRF. XRD data showed that the granules are made of TiO2 in the crystalline form of
anatase and that they also contain a small proportion of gypsum. With respect to the size,
the granules are aggregates of nanocrystals of 7-nm average size according to the results
of the calculation made using the peak width and the Debye-Scherrer equation [38]. XRF
gave semiquantitative data on the elemental composition of the adsorbent: 91.9% of TiO2,
4.25% of SO3, and 3.05% of CaO were found. Zeta potential measurements revealed that
the isoelectric point of the adsorbent was around 5.8–6.
The mechanism of the interaction of As(V) and As(III) with TiO2 has been
investigated by several authors. Jegadeesan et al. [39] used extended X-ray absorption
fine structure (EXAFS) and X-ray absorption near-edge structure (XANES) to determine
that As(V) and As(III) form bidentate inner-sphere complexes with amorphous TiO2 at
neutral pH. Pena et al. [40] and Jing et al. [41] have reported bidentate binuclear
complexes for As(V) adsorption on nanocrystalline TiO2 and on granular TiO2.
Moreover, Jing et al. [42] employed the CD-MUSIC modelling to describe the inorganic
As adsorption on TiO2. The model emphasizes the importance of the surface complex
Chapter 3 – Results
131
structure and of the charge distribution at the interface.
Inorganic arsenic species in the aqueous solution are neutral or anionic, according
to the corresponding pKa values and the pH of the sample [2]. At the pH range of the
tested water samples, H2AsO4−, HAsO42− and H3AsO3 are the predominant species while
the primary anatase nanoparticles include the neutral species TiOH0 and the negatively
charged TiO−. Then, the formation of the following bidentate complexes has been
postulated [21]:
2 TiOH + H2AsO4- ↔ [(TiO)2….AsO4]- + 2 H2O
2 TiOH + HAsO42- ↔ [(TiO)2….AsO4]- + H2O + OH-
2 TiOH + H3AsO3 ↔ [(TiO)2….AsO3]- + 2 H2O + H+
Whether As(III) is oxidized to As(V) or not, when adsorbed on TiO2, is still an
issue not fully understood and different opinions have been reported [16,41,43].
We have investigated the experimental capacity of Adsorbsia As600 for arsenic
species under batch conditions. A value of 0.14 mmol g−1 (10.1 mg g−1) and 0.21 mmol
g−1 (16.5 mg g−1) at pH 7.3 was obtained for As(V) and As(III), respectively. These values
agree with those reported in the literature (see Table 3.9) for a similar working pH and
taking into account the particle size and the specific surface area [39,40,43,44]. Moreover,
the fact that TiO2 solid phase is efficient for both the retention of As(V) and As(III) at pH
7.3 gives it a clear advantage over sorbents based on an ion exchange mechanism, in
which only species present as anions can interact with the solid phase [45].
In addition, we could observe from these experiments that the complete removal
of the arsenic species was accomplished in less than 2 h.
The capacity under flow conditions (flow rate 1 mL min−1) was also investigated and the breakthrough curves we obtained are shown in Figure 3.8. It can be observed in Figure 3.8a, b that breakthrough volumes are reached very early for As(V) and As(III) (9 and 13 mL, respectively), and in both cases, the concentration of arsenic in the effluent increases linearly with the volume of solution. Similar curve shapes are shown in the work of Zeng et al. [46], and they explain this behaviour as arsenic removal being mass transport-limited. In Figure 3.8c,when the amount of Adsorbsia As600 is increased until 0.8 g, a breakthrough volume of about 100 mL is obtained. The increase of breakthrough volume is explained by the increase in the surface area providing more binding sites. It is also worth mentioning that the stoichiometric capacity of the column was not reached in any of the cases.
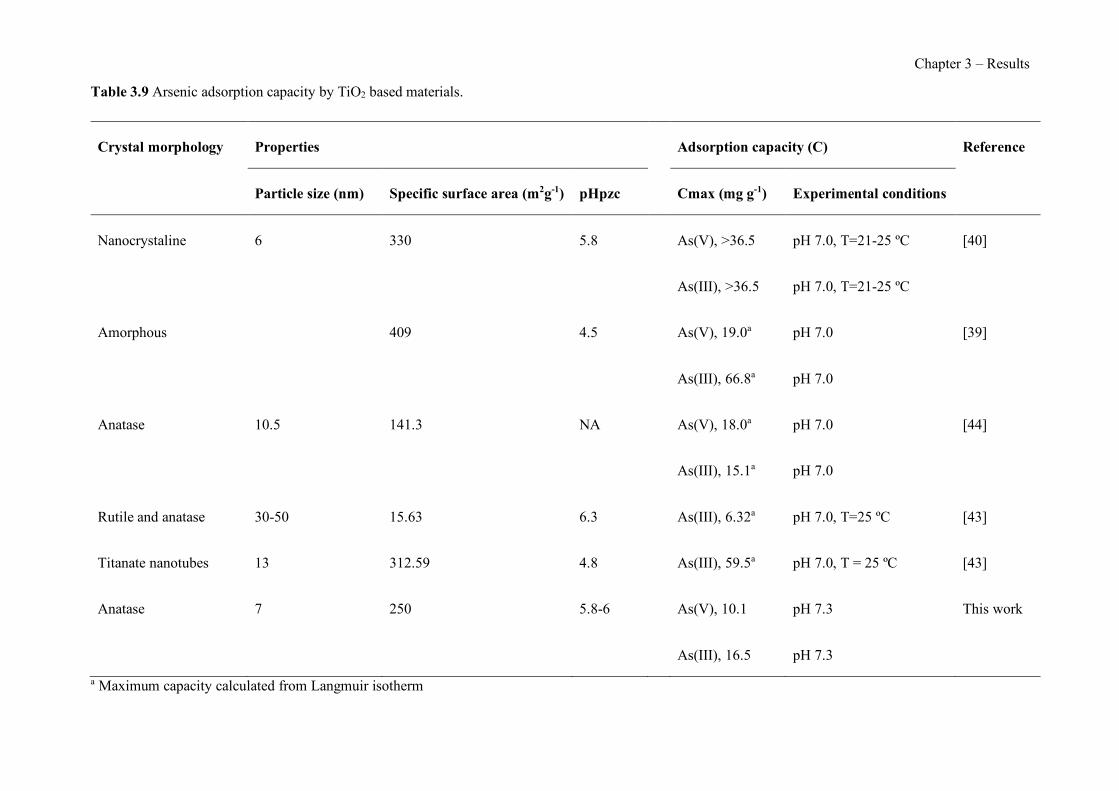
Chapter 3 – Results
Table 3.9 Arsenic adsorption capacity by TiO2 based materials.
Crystal morphology Properties Adsorption capacity (C) Reference
Particle size (nm) Specific surface area (m2g-1) pHpzc Cmax (mg g-1) Experimental conditions
Nanocrystaline 6 330 5.8 As(V), >36.5 pH 7.0, T=21-25 ºC [40]
As(III), >36.5 pH 7.0, T=21-25 ºC
Amorphous 409 4.5 As(V), 19.0a pH 7.0 [39]
As(III), 66.8a pH 7.0
Anatase 10.5 141.3 NA As(V), 18.0a pH 7.0 [44]
As(III), 15.1a pH 7.0
Rutile and anatase 30-50 15.63 6.3 As(III), 6.32a pH 7.0, T=25 ºC [43]
Titanate nanotubes 13 312.59 4.8 As(III), 59.5a pH 7.0, T = 25 ºC [43]
Anatase 7 250 5.8-6 As(V), 10.1 pH 7.3 This work
As(III), 16.5 pH 7.3
a Maximum capacity calculated from Langmuir isotherm
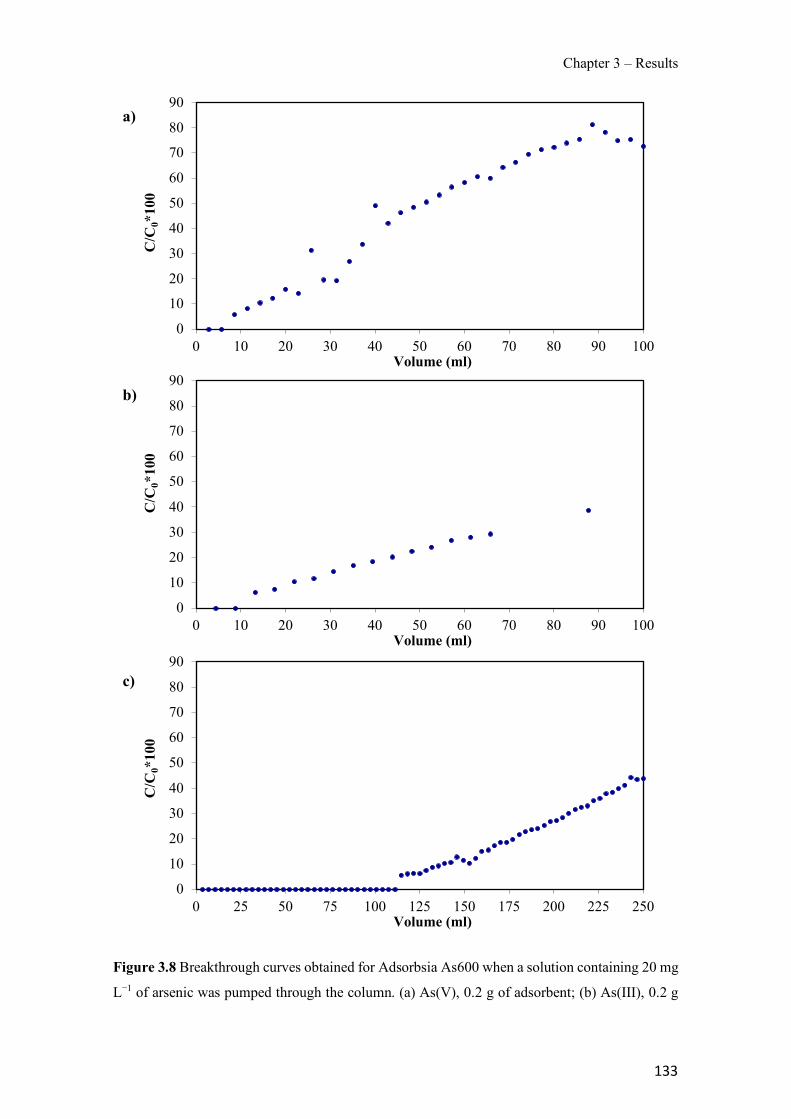
Chapter 3 – Results
133
Figure 3.8 Breakthrough curves obtained for Adsorbsia As600 when a solution containing 20 mg
L−1 of arsenic was pumped through the column. (a) As(V), 0.2 g of adsorbent; (b) As(III), 0.2 g
0
10
20
30
40
50
60
70
80
90
0 10 20 30 40 50 60 70 80 90 100
C/C
0*10
0
Volume (ml)
0
10
20
30
40
50
60
70
80
90
0 10 20 30 40 50 60 70 80 90 100
C/C
0*10
0
Volume (ml)
0
10
20
30
40
50
60
70
80
90
0 25 50 75 100 125 150 175 200 225 250
C/C
0*10
0
Volume (ml)
a)
b)
c)
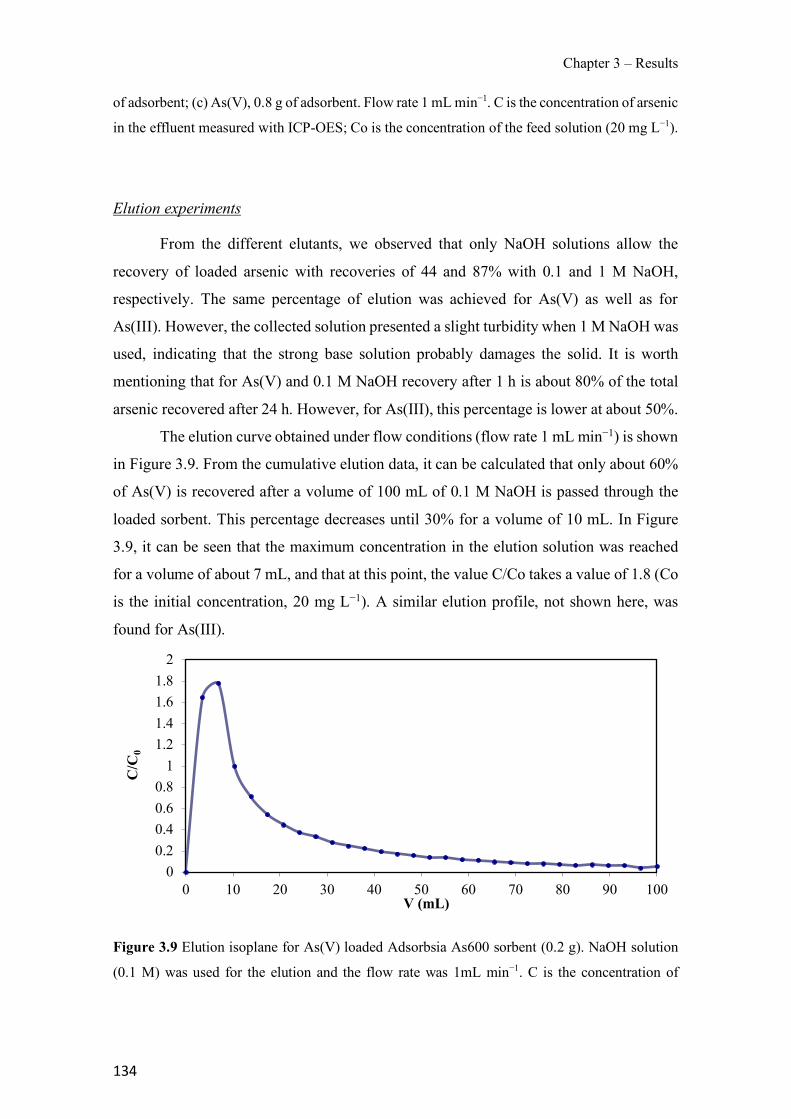
Chapter 3 – Results
134
of adsorbent; (c) As(V), 0.8 g of adsorbent. Flow rate 1 mL min−1. C is the concentration of arsenic
in the effluent measured with ICP-OES; Co is the concentration of the feed solution (20 mg L−1).
Elution experiments
From the different elutants, we observed that only NaOH solutions allow the
recovery of loaded arsenic with recoveries of 44 and 87% with 0.1 and 1 M NaOH,
respectively. The same percentage of elution was achieved for As(V) as well as for
As(III). However, the collected solution presented a slight turbidity when 1 M NaOH was
used, indicating that the strong base solution probably damages the solid. It is worth
mentioning that for As(V) and 0.1 M NaOH recovery after 1 h is about 80% of the total
arsenic recovered after 24 h. However, for As(III), this percentage is lower at about 50%.
The elution curve obtained under flow conditions (flow rate 1 mL min−1) is shown
in Figure 3.9. From the cumulative elution data, it can be calculated that only about 60%
of As(V) is recovered after a volume of 100 mL of 0.1 M NaOH is passed through the
loaded sorbent. This percentage decreases until 30% for a volume of 10 mL. In Figure
3.9, it can be seen that the maximum concentration in the elution solution was reached
for a volume of about 7 mL, and that at this point, the value C/Co takes a value of 1.8 (Co
is the initial concentration, 20 mg L−1). A similar elution profile, not shown here, was
found for As(III).
Figure 3.9 Elution isoplane for As(V) loaded Adsorbsia As600 sorbent (0.2 g). NaOH solution
(0.1 M) was used for the elution and the flow rate was 1mL min−1. C is the concentration of
00.20.40.60.8
11.21.41.61.8
2
0 10 20 30 40 50 60 70 80 90 100
C/C
0
V (mL)
Chapter 3 – Results
135
arsenic in the effluent measured with ICP-OES; Co is the concentration of the feed solution used
for loading the sorbent (20 mg L−1).
The fact that the recovery is not quantitative and that the desorption kinetics are
slow are clear drawbacks of this adsorbent when its use is intended for analytical
purposes. In order to improve the results, we tested 0.5 M NaOH as an intermediate
solution for both As(V) and As(III). In this case, an elution efficiency of 51% was
obtained after 1 h contact time under batch conditions. This intermediate concentration
was chosen as a compromise for further experiments.
Preconcentration with a minicolumn filled with Adsorbsia As600: the effect of eluent
volume and flow rate
The influence of eluent volume and flow rate was studied by pumping 50 mL of
200 µg L−1 As(V) through the solid at a flow rate of 1mL min−1. Under these conditions,
all the arsenic was retained in the TiO2 phase. After that, 2 and 4 mL of 0.5M NaOH were
pumped through the solid and we obtained a percentage of arsenic eluted of 27 and 40%,
respectively. These values are much lower than those obtained under batch conditions,
which may be explained by the flow conditions affecting the contact between the loaded
sorbent and the NaOH solution. In spite of the higher percentage of arsenic eluted with 4
mL, 2 mL was selected for further experiments in order to avoid sample dilution and to
obtain a higher enrichment factor.
Similar experiments were performed for As(III) and we observed that, for this
species, the percentage of arsenic eluted was only 13% (see Table 3.10). In order to
improve this value, the effect of flow rate was studied and we observed that when the
loading flow rate was decreased to 0.5 mL min−1, improvement was obtained neither for
As(V) nor for As(III). However, when the elution was evaluated at 0.5 mL min−1, the
percentage of As(III) eluted increased to 28%, indicating that this is a critical parameter
especially for As(III).
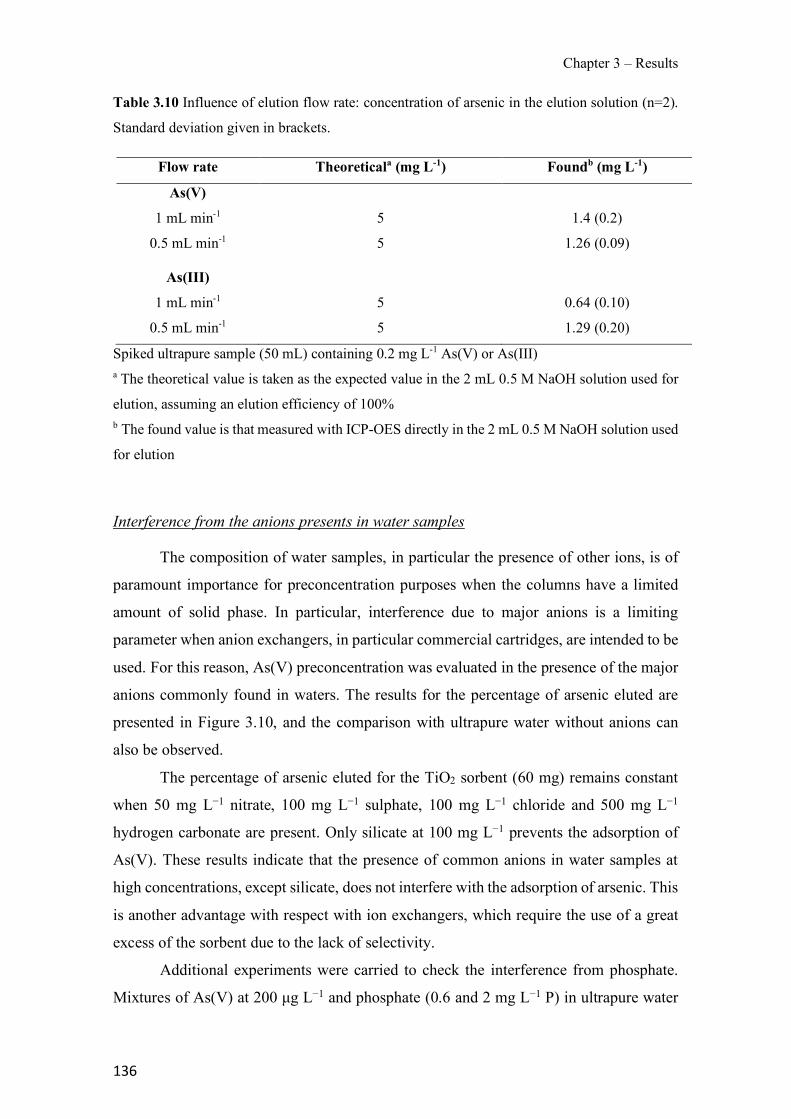
Chapter 3 – Results
136
Table 3.10 Influence of elution flow rate: concentration of arsenic in the elution solution (n=2).
Standard deviation given in brackets.
Flow rate Theoreticala (mg L-1) Foundb (mg L-1)
As(V)
1 mL min-1 5 1.4 (0.2)
0.5 mL min-1 5 1.26 (0.09)
As(III)
1 mL min-1 5 0.64 (0.10)
0.5 mL min-1 5 1.29 (0.20)
Spiked ultrapure sample (50 mL) containing 0.2 mg L-1 As(V) or As(III) a The theoretical value is taken as the expected value in the 2 mL 0.5 M NaOH solution used for
elution, assuming an elution efficiency of 100% b The found value is that measured with ICP-OES directly in the 2 mL 0.5 M NaOH solution used
for elution
Interference from the anions presents in water samples
The composition of water samples, in particular the presence of other ions, is of
paramount importance for preconcentration purposes when the columns have a limited
amount of solid phase. In particular, interference due to major anions is a limiting
parameter when anion exchangers, in particular commercial cartridges, are intended to be
used. For this reason, As(V) preconcentration was evaluated in the presence of the major
anions commonly found in waters. The results for the percentage of arsenic eluted are
presented in Figure 3.10, and the comparison with ultrapure water without anions can
also be observed.
The percentage of arsenic eluted for the TiO2 sorbent (60 mg) remains constant
when 50 mg L−1 nitrate, 100 mg L−1 sulphate, 100 mg L−1 chloride and 500 mg L−1
hydrogen carbonate are present. Only silicate at 100 mg L−1 prevents the adsorption of
As(V). These results indicate that the presence of common anions in water samples at
high concentrations, except silicate, does not interfere with the adsorption of arsenic. This
is another advantage with respect with ion exchangers, which require the use of a great
excess of the sorbent due to the lack of selectivity.
Additional experiments were carried to check the interference from phosphate.
Mixtures of As(V) at 200 µg L−1 and phosphate (0.6 and 2 mg L−1 P) in ultrapure water
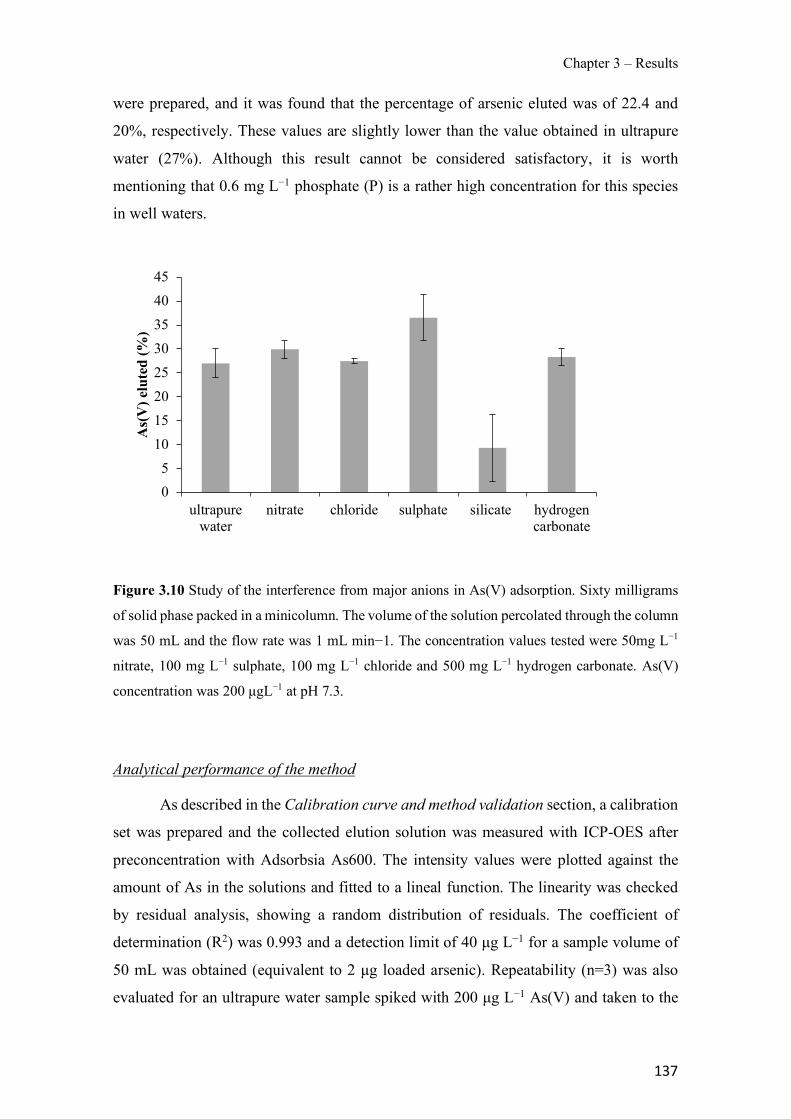
Chapter 3 – Results
137
were prepared, and it was found that the percentage of arsenic eluted was of 22.4 and
20%, respectively. These values are slightly lower than the value obtained in ultrapure
water (27%). Although this result cannot be considered satisfactory, it is worth
mentioning that 0.6 mg L−1 phosphate (P) is a rather high concentration for this species
in well waters.
Figure 3.10 Study of the interference from major anions in As(V) adsorption. Sixty milligrams
of solid phase packed in a minicolumn. The volume of the solution percolated through the column
was 50 mL and the flow rate was 1 mL min−1. The concentration values tested were 50mg L−1
nitrate, 100 mg L−1 sulphate, 100 mg L−1 chloride and 500 mg L−1 hydrogen carbonate. As(V)
concentration was 200 µgL−1 at pH 7.3.
Analytical performance of the method
As described in the Calibration curve and method validation section, a calibration
set was prepared and the collected elution solution was measured with ICP-OES after
preconcentration with Adsorbsia As600. The intensity values were plotted against the
amount of As in the solutions and fitted to a lineal function. The linearity was checked
by residual analysis, showing a random distribution of residuals. The coefficient of
determination (R2) was 0.993 and a detection limit of 40 µg L−1 for a sample volume of
50 mL was obtained (equivalent to 2 µg loaded arsenic). Repeatability (n=3) was also
evaluated for an ultrapure water sample spiked with 200 µg L−1 As(V) and taken to the
05
1015202530354045
ultrapurewater
nitrate chloride sulphate silicate hydrogencarbonate
As(
V) e
lute
d (%
)
Chapter 3 – Results
138
whole procedure. The relative standard deviation (RSD) obtained was 19%, which can be
considered acceptable within the concentration range studied [37]. For this sample, the
recovery value obtained was 108%. For As(III), we obtained an RSD of 14% and 102%
recovery. The values obtained make it clear that the preconcentration system followed by
ICP-OES measurement provides a satisfactory system for arsenic determination. It is
worth mentioning that a unique calibration curve is used for both As(V) and As(III), with
it only being necessary to modify the elution flow rate, and that no previous oxidation of
As(III) is needed, making this procedure much easier than the others reported in the
literature [25].
Determination of arsenic in water samples
Different water samples, some spiked with 100 or 200 µg L−1 As(V) and others
containing natural arsenic, were tested and the results compared with the theoretical
concentration (values from ICP-MS plus As(V) added in spiked samples). The results are
presented in Table 3.11, where it can be seen that the recovery results are satisfactory
except for the water sample from Caldes (S3). This result is not surprising considering
the complexity of this water matrix as shown in Table 3.8. When the amount of solid
sorbent is increased from 60 to 120 mg, then the behaviour of the preconcentration system
can be considered acceptable. Preconcentration with Adsorbsia As600 was applied to S4,
and also, good results were found considering the arsenic concentration level in the
sample.
Table 3.11 Concentration values and recovery (R) results for spiked water samples (n=2)
measured with the present method.
Sampleb Initialc (µg L-1) Added (µg L-1) Found (µg L-1) R (%)
S1 - 200 280 140 (14)
S1 - 100 120 95 (18)
S2 - 200 260 130 (8)
S2 - 100 120 94 (39)
S3 59 200 150 58 (7)
Chapter 3 – Results
139
S3* 59 200 190 73 (16)
S4 80 - 90(1)
For S3 which contains natural arsenic, the recovery values were calculated by taking into account
both, natural and spiked arsenic a120 mg of adsorbent used bIdentification as in Table 1 cTaken from Table 1
Finally, a water sample (50 mL) spiked at 10 µg L−1, the WHO regulated level,
was measured and a value of 11.3 µg L−1 was obtained.
Thus, we can conclude that the solid allows the preconcentration and
determination of arsenic present in natural waters and that the composition of the matrix
has little influence.
Conclusions
We have evaluated the adsorption behaviour of the commercial material
Adsorbsia As600, for As(V) and As(III), and a capacity of 0.14 and 0.21 mmol g−1,
respectively, was obtained at pH 7.3. We have established the setup and the experimental
conditions for using this TiO2 sorbent for As(V) and As(III) preconcentration prior to its
determination with ICP-OES. Good recoveries with acceptable reproducibility were
obtained for waters containing As(V) when using 2 mL of 0.5 M NaOH solution for the
elution at a flow rate of 1 mL min−1. It was also observed that for As(III), the elution flow
rate should be decreased to 0.5 mL min−1. As an advantage over other As determination
techniques, the developed method can be used for the determination of As(V) and As(III)
at µg L−1 level without any previous oxidation step or coupling with the well-known
hydride generation technique.
References
[1] A. Leónard, Arsenic, in E. Merian (Ed), Metals and their compounds in the
environment. Occurrence, analysis and biological relevance, VCH
Verlagsgesellschaft mbH, Weinheim, 1991, pp. 751–774.
Chapter 3 – Results
140
[2] I. Villaescusa, J.-C. Bollinger, Arsenic in drinking water: sources, occurrence and
health effects (a review), Rev. Environ. Sci. Bio./Technol. 7 (2008) 307–323.
[3] P.L. Smedley, D.G. Kinniburgh, A review of the source, behaviour and
distribution of arsenic in natural waters, Appl. Geochem. 17 (2002) 517–568.
[4] T.S.Y. Choong, T.G. Chuah, Y. Robiah, F.L.G Koay, I. Azni, Arsenic toxicity,
health hazards and removal techniques from water: an overview, Desalination 217
(2007) 139–166.
[5] World Health Organization (WHO). Arsenic in drinking water, WHO Factsheet
210, 3rd ed, WHO, Geneva, 1993.
[6] J.L. Gómez-Ariza, D. Sánchez-Rodas, I. Giráldez, E. Morales, A comparison
between ICP-MS and AFS detection for arsenic speciation in environmental
samples, Talanta 51 (2000) 257–268.
[7] T. Kubota, T. Yamaguchi, T. Okutani, Determination of arsenic content in natural
water by graphite furnace atomic adsorption spectrometry after collection as
molybdoarsenate on activated carbon, Talanta 46 (1998) 1311–1319.
[8] E.A. Nagul, I.D. McKelvie, P. Worsfold, S.D Kolev, The molybdenum blue
reaction for the determination of orthophosphate revisited: opening the black box,
Anal. Chim. Acta 890 (2015) 60–82.
[9] M.M. Bradley, L.M Siperko, M.D. Porter, Colorimetric-solid phase extraction
method for trace level determination of arsenite in water, Talanta 86 (2011) 64–
70.
[10] T. Okazaki, W. Wang, H. Kuramitz, N. Hata, S. Taguchi, Molibdenum blue
spectrophotometry for trace arsenic in ground water using a soluble membrane
filter and calcium carbonate column, Anal. Sci. 29 (2013) 67–72.
[11] D.Jr. Mohan, C.U. Pittman, Arsenic removal from water/wastewater using
adsorbents-a critical review, J. Hazard. Mat. 142 (2007) 1–53.
[12] S. Bhowmick, S. Chakraborty, P. Mondal, W. Van Renterghem, S. Van den
Berghe, G. Roman-Ross, D. Chatterjee, M. Iglesias, Montmorillonite-supported
nanoscale zero-valent iron for removal of arsenic from aqueous solution: kinetics

Chapter 3 – Results
141
and mechanism, Chem. Eng. J. 243 (2014) 14–23.
[13] J-C. Hsu, C-J. Lin, C-H. Liao, S-T. Chen, Removal of As (V) and As (III) by
reclaimed iron-oxide coated sands, J. Hazard. Mat. 153 (2008) 817–826.
[14] S. Ayoob, A.K. Gupta, P.B. Bhakat, Analysis of breakthrough developments and
modeling of fixed bed adsorption system for As (V) removal from water by
modified calcinated bauxite (MCB), Sep. Purif. Tech. 52 (2007) 430–438.
[15] G.P. Gillman, A simple technology for arsenic removal from drinking water using
hydrotalcite, Sci. Total Environ. 366 (2006) 926–931.
[16] Z.Ö. Kocabaş-Atakh, Y. Yürüm, Synthesis and characterization of anatase
nanoadsorbent and application in removal of lead, copper and arsenic from water,
Chem. Eng. J. 225 (2013) 625–635.
[17] M.Z. López Paraguay, J. Apolinar Cortés, J.F. Pérez-Robles, M.T. Alarcón
Herrera, Adsorption of arsenite from groundwater using titanium dioxide, Clean-
soil, air, water 42 (2014) 713–721.
[18] J. Guo, X. Cai, Y. Li, R. Zhai, S. Zhou, P. Na, The preparation and
characterization of a three-dimensional titanium dioxide nanostructure with high
surface hydroxyl group density and high performance in water treatment, Chem.
Eng. J. 221 (2013) 342–352.
[19] K.K. Gupta, N.L. Singh, A. Pandey, S.K. Shukla, S.N. Upadayay, V. Mishra, P.
Srivastava, N.P. Lalla, P.K. Mishra, Effect of anastase/rutile TiO2 phase
composition on arsenic adsorption, J. Dispers. Sci. Technol. 34 (2013) 1043–
1052.
[20] S.L. Wu, W.T. Hu, X.B. Luo, F. Deng, K. Yu, S.L. Luo, L.X. Yang, X.M. Tu,
G.S. Zeng, Direct removal of aqueous As (III) and As (V) by amorphous titanium
dioxide nanotube arrays, Environ. Tech. 34 (2013) 2285–2290.
[21] X. Guan, J. Du, X. Meng, Y. Sun, B. Sun, Q. Hu, Application of titanium dioxide
in arsenic removal from water: a review, J. Hazard. Mat. 215–216 (2012) 1–16.
[22] X. Meng, W. Wang, Speciation of arsenic by disposable cartridges, Third
international conference on arsenic exposure and health effects, San Diego
Chapter 3 – Results
142
(California), 1998.
[23] W.H. Ficklin, Separation of arsenic (III) and arsenic (V) in ground waters by ion-
exchange, Talanta 30 (1983) 371–373.
[24] N.B. Issa, V.N. Rajaković-Ognjanović, B.M. Jovanović, L.V. Rajaković,
Determination of inorganic arsenic species in natural waters- benefits of
separation and preconcentration on ion exchange and hybrid resins, Anal. Chim.
Acta 673 (2010) 185–193.
[25] K. Jitmanee, M. Oshima, S. Motomizu, Speciation of arsenic (III) and arsenic (V)
by inductively coupled plasma-atomic emission spectrometry coupled with
preconcentration system, Talanta 66 (2005) 529–533.
[26] M.J. Watts, J. O’Reilly, A.L. Marcilla, R.A. Shaw, N.I. Ward, Field based
speciation of arsenic in UK and Argentinean water samples, Environ. Geochem.
Health 32 (2010) 479–490.
[27] D. Chen, C. Huang, M. He, B. Hu, Separation and preconcentration of inorganic
arsenic species in natural water samples with 3-(2- aminoethylamino)
propyltrimethoxysilane modified ordered mesoporous silica micro-column and
their determination by inductively coupled plasma optical emission spectrometry,
J. Hazard. Mat. 164 (2009) 1146–1151.
[28] C. Xiong, M. He, B. Hu, On-line separation and preconcentration of inorganic
arsenic and selenium species in natural water samples with CTAB-modified alkyl
silica microcolumn and determination by inductively coupled plasma-optical
emission spectrometry, Talanta 76 (2008) 772–778.
[29] D. Pozebon, V.L. Dressler, J.A. Gomes Neto, A.J. Curtius, Determination of
arsenic (III) and arsenic (V) by electrothermal atomic spectrometry after
complexation and sorption on a C-18 bonded silica column, Talanta 45 (1998)
1167–1175.
[30] X.P. Yan, X.B. Yin, X.W. He, Y. Jiang, Flow injection on-line sorption
preconcentration coupled with hydride generation fluorescence spectrometry for
determination of (ultra) trace amounts of arsenic (III) and arsenic (V) in natural
water samples, Anal. Chem. 74 (2002) 2162–2166.
Chapter 3 – Results
143
[31] S.Z. Chen, X. Guo, Y. He, D. Lu, Titanium dioxide nanotubes for speciation of
inorganic arsenic in environmental water samples by ICP-MS, Atom. Spectrosc.
34 (2013) 113–118.
[32] C. Huang, B. Hin, Z. Jiang, Simultaneous speciation of inorganic arsenic and
antimony in natural waters by dimercaptosuccinic acid modified mesoporous
titanium dioxide micro-column on-line separation and inductively coupled plasma
emission spectrometry determination, Spectrochim. Acta B 62 (2007) 454–460.
[33] P. Liang, R. Liu, Speciation analysis of inorganic arsenic in water samples by
immobilized nanometer titanium dioxide separation and graphite furnace atomic
absorption spectrometric determination, Anal. Chim. Acta 602 (2007) 32–36.
[34] Waters. http://www.waters.com/waters/en_US/Oasis-Sample-Extraction-
Products (accessed September 10, 2015).
[35] R. Güell, C. Fontàs, V. Salvadó, E. Anticó, Modelling of liquid-liquid extraction
and liquid membrane separation of arsenic species in environmental matrices,
Sep. Pur. Technol. 72 (2010) 319–325.
[36] R. Güell, E. Anticó, S.D. Kolev, J. Benavente, V. Salvadó, C. Fontàs,
Development and characterization of polymer inclusion membranes for the
separation and speciation of inorganic As species, J. Membr. Sci. 383 (2011) 88–
95.
[37] AOAC Official Methods of analysis, Guidelines for standard method performance
requirements Appendix F, AOAC International, 2012, pp. 1–17.
[38] B.D. Cullity, S.R. Stock, Elements of X-ray diffraction, 3rd ed, Prentice Hall,
Upper Saddle River (New Jersey), 2001.
[39] G. Jegadeesan, S.R. Al-Abed, V. Sundaram, H. Choi, K.G. Scheckel, D.D.
Dionysiou, Arsenic sorption on TiO2 nanoparticles: size and crystalline effects,
Water Res. 44 (2010) 965–973.
[40] M. Pena, X.G. Meng, G.P. Korfiatis, C.Y. Jing, Adsorption mechanism of arsenic
on nanocrystalline titanium dioxide, Environ. Sci. Technol. 40 (2006) 1257–1262.
[41] C. Jing, X. Meng, E. Calvache, G. Jiang, Remediation of organic and inorganic
Chapter 3 – Results
144
arsenic contaminated groundwater using a nanocrystalline TiO2-based adsorbent,
Environ. Pollut. 157 (2009) 2514–2519.
[42] C. Jing, X. Meng, S. Liu, S. Baidas, R. Patraju, C. Christodoulatos, G.P. Korfiatis,
Surface complexation of organic arsenic on nanocrystalline titanium dioxide, J.
Colloid Interface Sci. 290 (2005) 14–21.
[43] H.Y. Niu, J.M. Wang, Y.L. Shi, Y.Q. Cai, F.S. Wei, Adsorption behavior of
arsenic onto protonated titanate nanotubes prepared via hydrothermal method,
Microporous Mesoporous Mater. 122 (2009) 28–35.
[44] Z. Xu, X. Meng, Size effects of nanocrystalline TiO2 on As(V) and As(III)
adsorption and As(III) photooxidation, J. Hazard. Mat. 168 (2009) 747–752.
[45] C.E. Meloan, Chemical separations. Principles, techniques and experiments, in
techniques in analytical chemistry, Wiley-Interscience Publications, New York,
1999.
[46] H. Zeng, M. Arashiro, D.E. Giammar, Effects of water chemistry and flow rate on
arsenate removal by adsorption to an iron oxide-based sorbent, Water Res. 42
(2008) 4629–4636.
Chapter 3 – Results
145
3.2 Advances on PIMs
The contents of this section are based on the following studies:
R. Vera, L. Gelde, E. Anticó, M.V. Martínez de Yuso, J. Benavente, C. Fontàs, Tuning
physicochemical, electrochemical and transport characteristics of polymer inclusion
membrane by varying the counter-anion of the ionic liquid Aliquat 336, J. Memb. Sci.
529 (2017) 87-94.
R. Vera, E. Anticó, J.I. Eguiazábal, N. Aranburu, C. Fontàs, First report on a solvent-free
preparation of polymeric membranes with an ionic liquid, React. Funct. Polym.
(submitted).
Chapter 3 – Results
146
3.2.1 Tuning physicochemical, electrochemical and transport characteristics of
polymer inclusion membrane by varying the counter-anion of the ionic liquid
Aliquat 336
Abstract
Polymer inclusion membranes (PIMs) have been prepared using cellulose
triacetate (CTA) as polymer and derivatives of the commercial ionic liquid (IL) Aliquat
336, trioctyl methylammonium chloride (AlqCl), as extractants. The different ILs were
prepared by exchanging chloride anion from AlqCl for other more lipophilic anions,
obtaining IL derivatives AlqNO3 and AlqSCN. PIMs containing these extractants at two
different concentrations (30% and 60%) were prepared and characterized using X-ray
photoelectron spectroscopy (XPS), infrared spectroscopy (FTIR), thermogravimetric
analysis (TGA), contact angle and impedance spectroscopy to obtain information on the
material properties of both the surface and bulk membranes. The IL counter-anion affects
the membrane's electrical parameters (dielectric constant and conductivity) as well as its
hydrophobic character, which also depends on the IL concentration in the PIM
formulation. Passive transport across the different PIMs using HCl and NaCl aqueous
solutions was also considered, and the results obtained seem to be directly related to the
hydrophilic/hydrophobic character of the studied membranes.
Introduction
Membrane-based processes attract significant attention as a valuable technology
for many industries. Besides membrane systems that exclude compounds due to pore size,
there is great interest in the development of functionalized membranes, for which the
separation is based on the chemical affinity of the target compound with the ligand or
functional group present in the membrane. Among this type of functionalized membranes,
polymer inclusion membranes (PIMs) have shown themselves to be useful for the
separation of a wide variety of compounds from anions or metallic species to small
organic molecules [1]. These membranes can be classified as a type of liquid membranes
where the extractant or carrier is entrapped within a polymeric matrix, normally made of
cellulose triacetate (CTA) or polyvinyl chloride (PVC). The role of the polymer is to
Chapter 3 – Results
147
provide mechanical strength to the membrane, and a plasticizer is sometimes added to
improve the elasticity and to modify the membrane's diffusion characteristics [2]. There
is increasing interest in PIMs thanks to their easy preparation, low cost, versatility, good
chemical resistance and high efficiency, which is closely related to the carrier
incorporated in the membrane. A large number of extractants can be used in PIMs [3],
many of which are commercially available. This is the case of the ionic liquid (IL) Aliquat
336 (a trioctylmethyl ammonium chloride), which has been proved to successfully
transport analytes as different as metals [4–6], antibiotics [7] or nutrients [8]. Moreover,
this extractant possesses the unique properties of ILs such as low vapour pressure, high
electrical conductivity and ion mobility as well as good chemical and thermal stability
[9]. It is important to consider that PIMs prepared with this IL are flexible and
mechanically stable using both CTA and PVC polymers, so the use of a plasticizer is not
mandatory [10].
Aliquat 336 has also shown itself to be a versatile cation source to prepare new
hydrophobic ionic liquids by combining a trioctylmethyl ammonium (TOMA) cation
with a number of anions prepared by means of simple replacement of the chloride anion
in Aliquat 336. Mikkola et al. show in [11] the preparation and characterization of 12 new
ILs containing both inorganic and organic anions. Kogelnig et al. describe in [12] the
greener synthesis of three new ammonium ionic liquids also prepared from Aliquat 336:
TOMA thiosalicylate, TOMA benzoate, and TOMA hexanoate, and studied their
performance as extracting agents for cadmium.
Some Aliquat 336 derivatives have also been included in PIMs, such as in the
work of Sakay et al. [13], where PIMs were made with PVC as a polymer, 2-nitrophenyl
octyl ether as a plasticizer and different TOMA derivatives as carriers incorporating
acetate, nitrate and perchlorate as anions. The resulting membranes were tested for the
transport of thiourea, and it was found that the transport efficiency of this organic
molecule was dependent on the anion accompanying TOMA, following the trend acetate
> chloride > nitrate > > perchlorate. Even though a different behaviour was evidenced
depending on the counter anion, PIMs were not characterized to understand the effects
that these modifications have on membrane properties.
Thus, the aim of this work is to explore if slight changes in the formulation of the
IL affect membrane characteristics that, in turn, can modify transport properties. To this
end, we have chosen nitrate and thiocyanate anions to be exchanged by the chloride
existing in Aliquat 336, and PIMs have been prepared with these ILs at two different
Chapter 3 – Results
148
concentrations (30% IL and 60% IL, weight percentage) and fixing CTA as the polymer.
A thorough characterization of the PIMs has been undertaken using different techniques
to establish whether or not the physicochemical and electrochemical properties of the
membranes are affected by the variation of the counter-anion of Aliquat 336. Thus,
membranes were studied using techniques such as infrared spectroscopy (FTIR) and
thermogravimetric analysis (TGA) to understand the type of interaction between the base
polymer and the different ILs. These techniques have shown their effectiveness in the
analysis of different PIMs, as reported in [14–16]. Contact angle measurements were used
to provide information on the hydrophobic/hydrophilic character of the PIMs. These data
are of great importance since hydrophobicity has been reported as increasing membrane
stability [17]. The chemical characterization of the surface of the PIMs was performed by
X-ray photoelectron spectroscopy (XPS) to assess whether or not the presence of the ILs
on the surface of the membrane was dependent on the IL composition. This fact may be
directly related to the ability of the carrier to interact with the target analyte, and,
ultimately, with the efficiency of the membrane [18]. Besides these physicochemical
parameters, the electrical behaviour of the polymeric membranes was also investigated
using impedance spectroscopy (IS) to shed light on their ability to transport charged
species. This technique has been successfully applied to characterize supported liquid
membranes containing ILs [19], and to PIMs containing different plasticizers and Cyanex
272 as a carrier [20], as well as in our previous work dealing with PIMs made of CTA
and Aliquat 336 [10]. Moreover, Salar- García et al. proposed a new method based on IS
to calculate the internal resistance of PIMs including three different ILs to predict their
behaviour as novel proton exchange membranes [21]. Finally, diffusive transport of ions
has been studied with PIMs in contact with electrolyte solution, i.e. HCl and NaCl, to
understand how transport/rejection characteristics of the membranes are affected by the
nature of the counter-anion.
Experimental
Reagents and solutions
The extractant Aliquat 336 (AlqCl) and the polymer CTA were purchased from
Fluka Chemie. CHCl3 (Panreac) was used to dissolve the polymer and the ILs. NaSCN
and NaNO3 (Panreac, Spain) were used as anions source to prepare the new ILs. A 0.1N

Chapter 3 – Results
149
AgNO3 solution was used as an indicator of chloride presence in the aqueous solution.
HCl (Panreac) and NaCl (Merck) were used for transport experiments.
PIM preparation
First, nitrate and thiocyanate salts of TOMA (AlqNO3 and AlqSCN) were
prepared, respectively, as follows: 5 mL of a 0.5 M AlqCl solution in CHCl3 were
contacted with 7–8 mL of a 2 M NaNO3 or NaSCN and left stirring for 2–3 h inside 25
mL glass tubes. This procedure was repeated several times until the aqueous phase gave
no white precipitation of AgCl with a solution of AgNO3 [13]. The resulting chloroform
solution was used to prepare the corresponding PIM.
Each membrane was prepared dissolving 200 mg of CTA in chloroform (5 h) and
adding the corresponding volume of the chloroform solution of AlqCl, AlqNO3 or
AlqSCN to finally obtain an IL content of 30% and 60% (w/w) in the PIM. This solution
was left to stir for 2 h more, and, after this time, the solution was poured into a 9.0 cm
diameter flat bottom glass Petri dish, which was set horizontally and covered loosely. The
solvent was allowed to evaporate over 24 h at room temperature, and the resulting film
was then carefully peeled off from the bottom of the Petri dish and taken for further
studies.
Thus, the resulting membranes were 70% CTA+30% IL (30% AlqCl, 30%
AlqNO3, 30% AlqSCN samples), or 40% CTA+60% IL (60% AlqCl, 60% AlqNO3 and
60% AlqSCN samples).
IR spectroscopy
IR spectra were obtained with the aid of a diamond attenuated total reflectance
(ATR) accessory on an Agilent Cary 630 FTIR spectrometer.
TGA analysis
The thermogravimetric analysis and differential scanning calorimetry (DSC) were
performed using a Mettler Toledo TGA/DSC combined instrument. A sample of about
Chapter 3 – Results
150
10 mg was used and a heating cycle from 30 to 650 °C at a heating rate of 10 °C/min
under nitrogen atmosphere (40 mL min−1).
Contact angle
Changes in the hydrophobic character of the membrane surfaces associated to both
the composition of IL and its content were determined from contact angle measurements,
which were performed by the tensile drop method using distilled water drops of 5 µL and
a Teclis T2010 instrument equipped with a video system. Measurements were carried out
on both membrane faces.
XPS measurements
A Physical Electronics spectrometer (PHI 5700) with X-ray Mg Kα radiation (300
W, 15 kV, 1253.6 eV) as the excitation source was used. High-resolution spectra were
recorded at a given take-off angle of 45° by a concentric hemispherical analyzer operating
in the constant pass energy mode at 29.35 eV, using a 720 µm diameter analysis area.
Accurate ± 0.1 eV binding energies were determined with respect to the position of the
adventitious C 1s peak at 285.0 eV, and the residual pressure in the analysis chamber was
maintained below 5×10⁻⁷ Pa during data acquisition. Membranes were mounted on a
sample holder without adhesive tape and kept overnight at high vacuum in the preparation
chamber before being transferred to the analysis chamber of the spectrometer for testing.
Each spectral region was scanned several sweeps until a good signal-to-noise ratio was
observed. PHI ACCESS ESCA-V6.0F software package was used for acquisition and
data analysis. Membrane samples were irradiated for a maximum time of 20 min to reduce
possible X-ray damage. A Shirley-type background was subtracted from the signals. To
determinate more accurately the binding energy (BE) of the different element core levels,
recorded spectra were fitted by Gauss–Lorentz curves following the methodology
detailed elsewhere [22]. Atomic concentration (A.C.) percentages of the characteristic
elements on the membranes surfaces were determined taking into account the
corresponding area sensitivity factor [23] for the different measured spectral regions.
Chapter 3 – Results
151
IS measurements
The test cell used for impedance spectroscopy measurements of the studied PIMs
consists of a Teflon support on which two Pt electrodes were placed and screwed down
(Pt-electrode//Membrane//Pt-electrode system). The electrodes were connected to a
Frequency Response Analyzer (FRA, Solartron 1260, England) and 100 data points were
recorded for frequency (f) ranging between 1 Hz and 107 Hz, at a maximum voltage of
0.01 V. These measurements were performed at room conditions (relative humidity ≈65%
and temperature of 25 ± 2 °C).
The impedance of a system is a complex number, Z=Zreal+j Zimg, which can be
separated into real and imaginary parts by algebra rules. For simple systems Zreal and Zimg
are related to the electrical resistance (R) and the capacitance (C) by the following
expressions (Eq. 3.3):
Zreal = (R/[1 + (wRC)2]); Zimg = - (wR2C/[1 + (w.RC)2]) (3.3)
where w represents the angular frequency (w = 2pf). In the case of non-homogeneous
systems, a non-ideal capacitor or constant phase element, Q(w), is usually used instead of
C; where Q(w) = Yo(jw)-n, Yo is the inverse of the impedance (Yo = 1/Z), and n is an
experimental parameter (0 ≤ n ≤ 1). The fit of the impedance curves derived from the
experimental data, obtained from a broad range of frequencies and using equivalent-
circuits as models, permits the estimation of the electrical resistance and capacitance
values associated to each membrane sample [24].
Membrane potentials
The membrane potential (ΔΦmbr) or the equilibrium electrical potential
difference at both sides of a membrane, separating two solutions of the same electrolyte
but different concentrations (C1 and C2), were obtained from the cell potential (ΔE).
These potentials were measured with NaCl solutions and using two reversible Ag/AgCl
electrodes connected to a digital voltmeter (Yokohama 7552, 1 GΩ input resistance) in a
dead-end test cell similar to that described in [18]; the NaCl solutions were stirred at 540
rpm to minimize the concentration-polarization at the membrane surfaces. Measurements
were performed at room temperature (25 ± 2) ºC and neutral pH by keeping the NaCl
concentration constant at one side of the membrane (Cf) and gradually changing the
Chapter 3 – Results
152
concentration of the solution at the other side (Cv, between 0.002 M and 0.1 M). DFmbr
values were obtained by subtracting the calculated electrode potential (DFelect =
(RT/F).ln(Cv/Cf)) from the measured cell potential values, in other words, DFmbr = DE -
DFelect [24].
Study of HCl permeation though the PIMs
A similar two-compartment dead-end cell [25] was used to investigate the
transport of 1 M HCl from the feed compartment to the stripping phase (ultrapure water).
The exposed membrane area was 11.5 cm2 and continuous stirring of both compartments
was maintained during the experiment. The pH variation in the stripping solution was
monitored using a pH-meter and a glass electrode.
Results and discussion
Physicochemical characterization of PIMs
Chemical differences in the surface of the studied PIMs were obtained by the XPS
technique, which gives information on the elements present on the surface of a given
sample by analysing the XPS spectra. Figure 3.11 shows the C 1s and N 1s core level
spectra obtained for the three 30% IL membranes, as well as the spectrum corresponding
to the 60% AlqCl sample for comparison. The signal of C 1s (Figure 3.11 (a)) obtained
for the three membranes with the same IL content only shows small differences between
the samples. In all cases, two different peaks at binding energies (BE) of 285.0 eV, which
correspond to aliphatic chains plus adventitious carbon, and 288.5–289.0 eV for the COO
bond of CTA can clearly be observed. Moreover, a shoulder at 286.5–287 eV for the C-
OH and C-O-C cellulose bonds was also obtained [26], and the relative intensity of this
shoulder seems to decrease with the increase of the IL content in the membranes.
However, the comparison of the N 1s signal (Figure 3.11 (b)) shows some differences
depending on the IL, with a common peak at 402.0 eV associated to the quaternary
nitrogen of the cationic part of Aliquat 336, while the contribution of nitrogen associated
to NO3- (at 406.4 eV) and thiocyanate (at 397.3 eV) can also be observed in AlqNO3 and
AlqSCN samples, respectively.
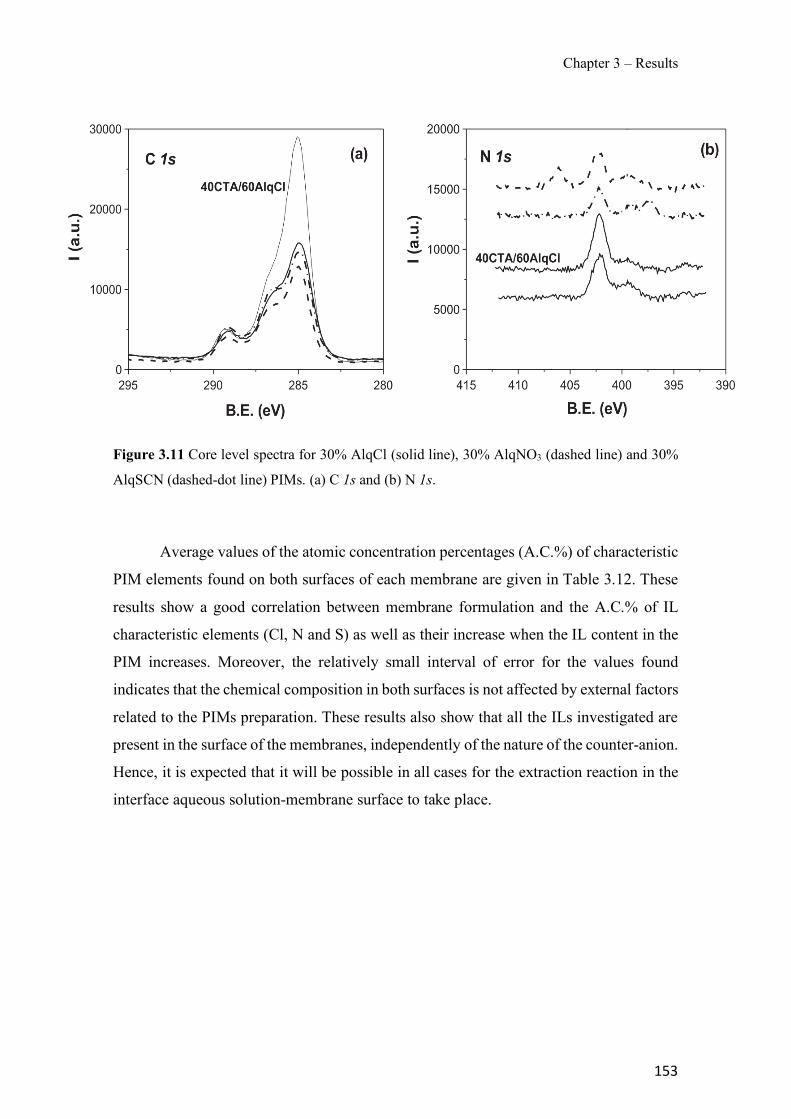
Chapter 3 – Results
153
Figure 3.11 Core level spectra for 30% AlqCl (solid line), 30% AlqNO3 (dashed line) and 30%
AlqSCN (dashed-dot line) PIMs. (a) C 1s and (b) N 1s.
Average values of the atomic concentration percentages (A.C.%) of characteristic
PIM elements found on both surfaces of each membrane are given in Table 3.12. These
results show a good correlation between membrane formulation and the A.C.% of IL
characteristic elements (Cl, N and S) as well as their increase when the IL content in the
PIM increases. Moreover, the relatively small interval of error for the values found
indicates that the chemical composition in both surfaces is not affected by external factors
related to the PIMs preparation. These results also show that all the ILs investigated are
present in the surface of the membranes, independently of the nature of the counter-anion.
Hence, it is expected that it will be possible in all cases for the extraction reaction in the
interface aqueous solution-membrane surface to take place.
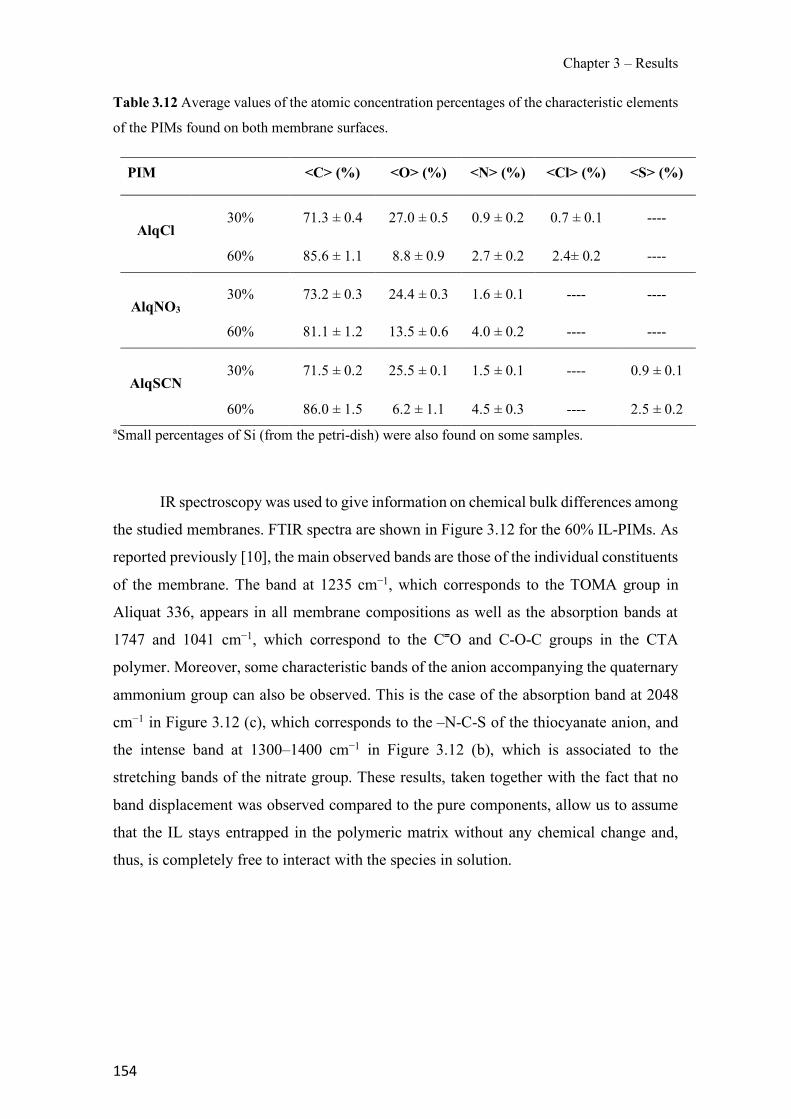
Chapter 3 – Results
154
Table 3.12 Average values of the atomic concentration percentages of the characteristic elements
of the PIMs found on both membrane surfaces.
PIM <C> (%) <O> (%) <N> (%) <Cl> (%) <S> (%)
AlqCl 30% 71.3 ± 0.4 27.0 ± 0.5 0.9 ± 0.2 0.7 ± 0.1 ----
60% 85.6 ± 1.1 8.8 ± 0.9 2.7 ± 0.2 2.4± 0.2 ----
AlqNO3 30% 73.2 ± 0.3 24.4 ± 0.3 1.6 ± 0.1 ---- ----
60% 81.1 ± 1.2 13.5 ± 0.6 4.0 ± 0.2 ---- ----
AlqSCN 30% 71.5 ± 0.2 25.5 ± 0.1 1.5 ± 0.1 ---- 0.9 ± 0.1
60% 86.0 ± 1.5 6.2 ± 1.1 4.5 ± 0.3 ---- 2.5 ± 0.2 aSmall percentages of Si (from the petri-dish) were also found on some samples.
IR spectroscopy was used to give information on chemical bulk differences among
the studied membranes. FTIR spectra are shown in Figure 3.12 for the 60% IL-PIMs. As
reported previously [10], the main observed bands are those of the individual constituents
of the membrane. The band at 1235 cm−1, which corresponds to the TOMA group in
Aliquat 336, appears in all membrane compositions as well as the absorption bands at
1747 and 1041 cm−1, which correspond to the C˭O and C-O-C groups in the CTA
polymer. Moreover, some characteristic bands of the anion accompanying the quaternary
ammonium group can also be observed. This is the case of the absorption band at 2048
cm−1 in Figure 3.12 (c), which corresponds to the –N-C-S of the thiocyanate anion, and
the intense band at 1300–1400 cm−1 in Figure 3.12 (b), which is associated to the
stretching bands of the nitrate group. These results, taken together with the fact that no
band displacement was observed compared to the pure components, allow us to assume
that the IL stays entrapped in the polymeric matrix without any chemical change and,
thus, is completely free to interact with the species in solution.
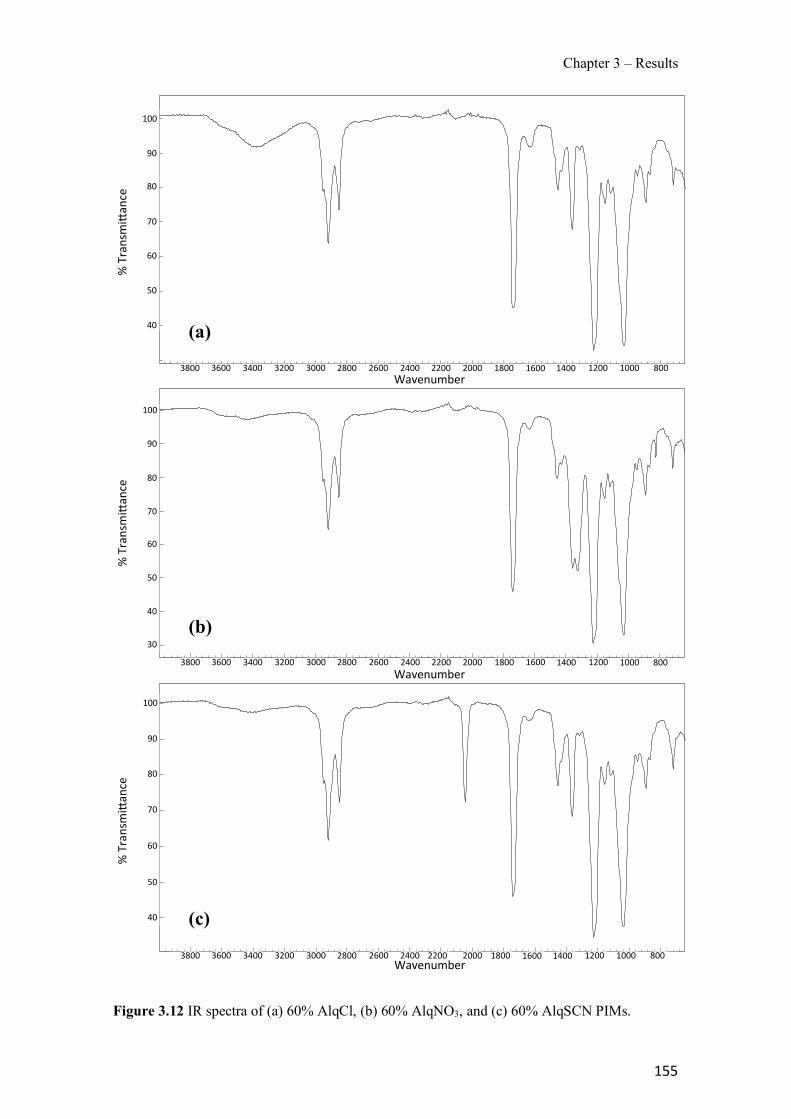
Chapter 3 – Results
155
Figure 3.12 IR spectra of (a) 60% AlqCl, (b) 60% AlqNO3, and (c) 60% AlqSCN PIMs.
Name Membrana 60%A336Cl inicial 120116 mesurada el 290116
Agilent Resolutions Pro
%Tr
ansm
ittan
ce 100
90
80
70
60
50
40
Membrana 60%A336Cl inicial 120116 mesurada el 290116
3800 3600 3400 3200 3000 2800 2600 2400 2200 2000 1800 1600 1400 1200 1000 800
Wavenumber
Name Memb Cel.la INICIAL 60%A336NO3 1_12_15
Agilent Resolutions Pro
%Tr
ansm
ittan
ce
100
90
80
70
60
50
40
30
Memb Cel.la INICIAL 60%A336NO3 1_12_15
3800 3600 3400 3200 3000 2800 2600 2400 2200 2000 1800 1600 1400 1200 1000 800
Wavenumber
Name Memb Cel.la INICIAL 60%A336SCN 1_12_15
Agilent Resolutions Pro
%Tr
ansm
ittan
ce
100
90
80
70
60
50
40
Memb Cel.la INICIAL 60%A336SCN 1_12_15
3800 3600 3400 3200 3000 2800 2600 2400 2200 2000 1800 1600 1400 1200 1000 800
Wavenumber
(a)
(b)
(c)
100#
90#
80#
70#
60#
50#
40#
100#
90#
80#
70#
60#
50#
40#
30#
100#
90#
80#
70#
60#
50#
40#
3800# 3600# 3400# 3200# 3000# 2800# 2600# 2400# 2200# 2000# 1800# 1600# 1400# 1200# 1000# 800#
3800# 3600# 3400# 3200# 3000# 2800# 2600# 2400# 2200# 2000# 1800# 1600# 1400# 1200# 1000# 800#
3800# 3600# 3400# 3200# 3000# 2800# 2600# 2400# 2200# 2000# 1800# 1600# 1400# 1200# 1000# 800#
%#Transmi4ance#
%#Transmi4ance#
%#Transmi4ance#
Wavenumber#
Wavenumber#
Wavenumber#
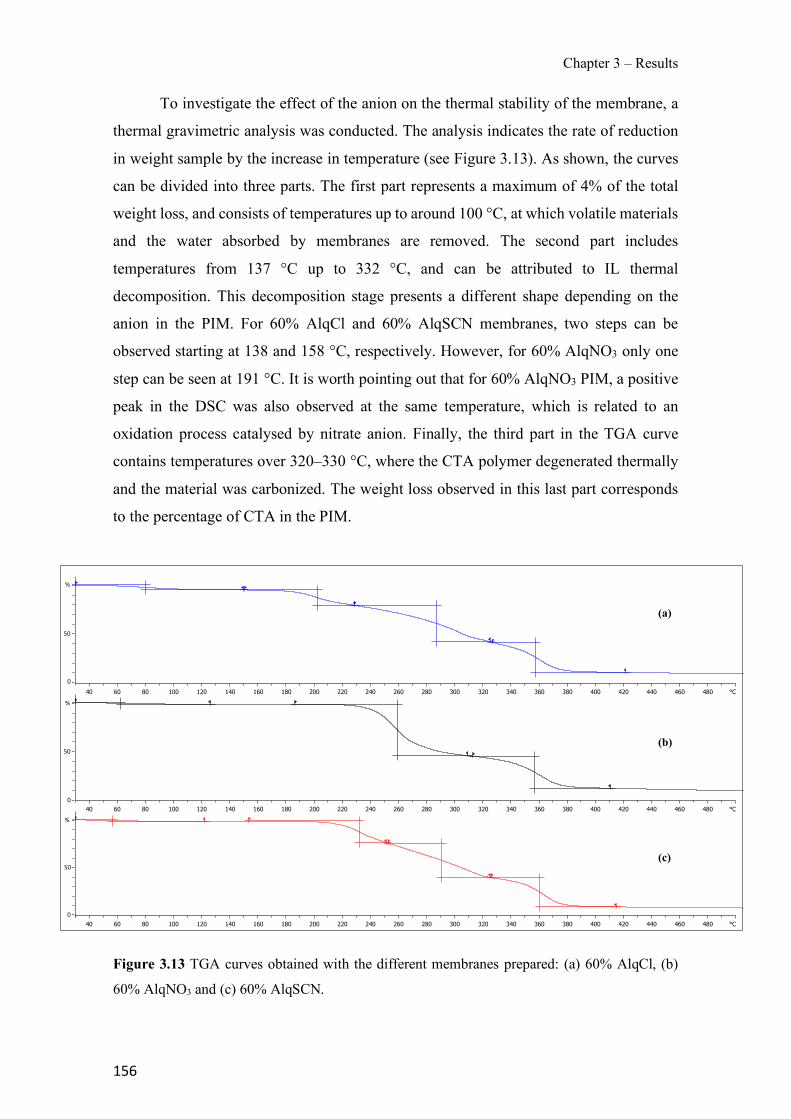
Chapter 3 – Results
156
To investigate the effect of the anion on the thermal stability of the membrane, a
thermal gravimetric analysis was conducted. The analysis indicates the rate of reduction
in weight sample by the increase in temperature (see Figure 3.13). As shown, the curves
can be divided into three parts. The first part represents a maximum of 4% of the total
weight loss, and consists of temperatures up to around 100 °C, at which volatile materials
and the water absorbed by membranes are removed. The second part includes
temperatures from 137 °C up to 332 °C, and can be attributed to IL thermal
decomposition. This decomposition stage presents a different shape depending on the
anion in the PIM. For 60% AlqCl and 60% AlqSCN membranes, two steps can be
observed starting at 138 and 158 °C, respectively. However, for 60% AlqNO3 only one
step can be seen at 191 °C. It is worth pointing out that for 60% AlqNO3 PIM, a positive
peak in the DSC was also observed at the same temperature, which is related to an
oxidation process catalysed by nitrate anion. Finally, the third part in the TGA curve
contains temperatures over 320–330 °C, where the CTA polymer degenerated thermally
and the material was carbonized. The weight loss observed in this last part corresponds
to the percentage of CTA in the PIM.
Figure 3.13 TGA curves obtained with the different membranes prepared: (a) 60% AlqCl, (b)
60% AlqNO3 and (c) 60% AlqSCN.
!"#$%&'!#()%#**)('+
&
%
,%
-'$% )% .% /%% /0% /$% /)% /.% 0%% 00% 0$% 0)% 0.% *%% *0% *$% *)% *.% $%% $0% $$% $)% $.%
!"#$%'!#()%&1#**)(23*
&
%
,%
-'$% )% .% /%% /0% /$% /)% /.% 0%% 00% 0$% 0)% 0.% *%% *0% *$% *)% *.% $%% $0% $$% $)% $.%
!"#$%&'!#()%&1#**)(4'2
&
%
,%
-'$% )% .% /%% /0% /$% /)% /.% 0%% 00% 0$% 0)% 0.% *%% *0% *$% *)% *.% $%% $0% $$% $)% $.%
exoexoexoexo UAT-15-QUI1-02. 40%CTA-60A336 (Cl, NO3, SCN)UAT-15-QUI1-02. 40%CTA-60A336 (Cl, NO3, SCN)UAT-15-QUI1-02. 40%CTA-60A336 (Cl, NO3, SCN)UAT-15-QUI1-02. 40%CTA-60A336 (Cl, NO3, SCN) 19.07.2016 15:21:1819.07.2016 15:21:1819.07.2016 15:21:1819.07.2016 15:21:18
SSSSTATATATARRRReeee SW 13.00 SW 13.00 SW 13.00 SW 13.00UdG: UATUdG: UATUdG: UATUdG: UAT
(a)
(b)
(c)
!"#
$#
"#
!"#
$#
"#
!"#
$#
"#
!
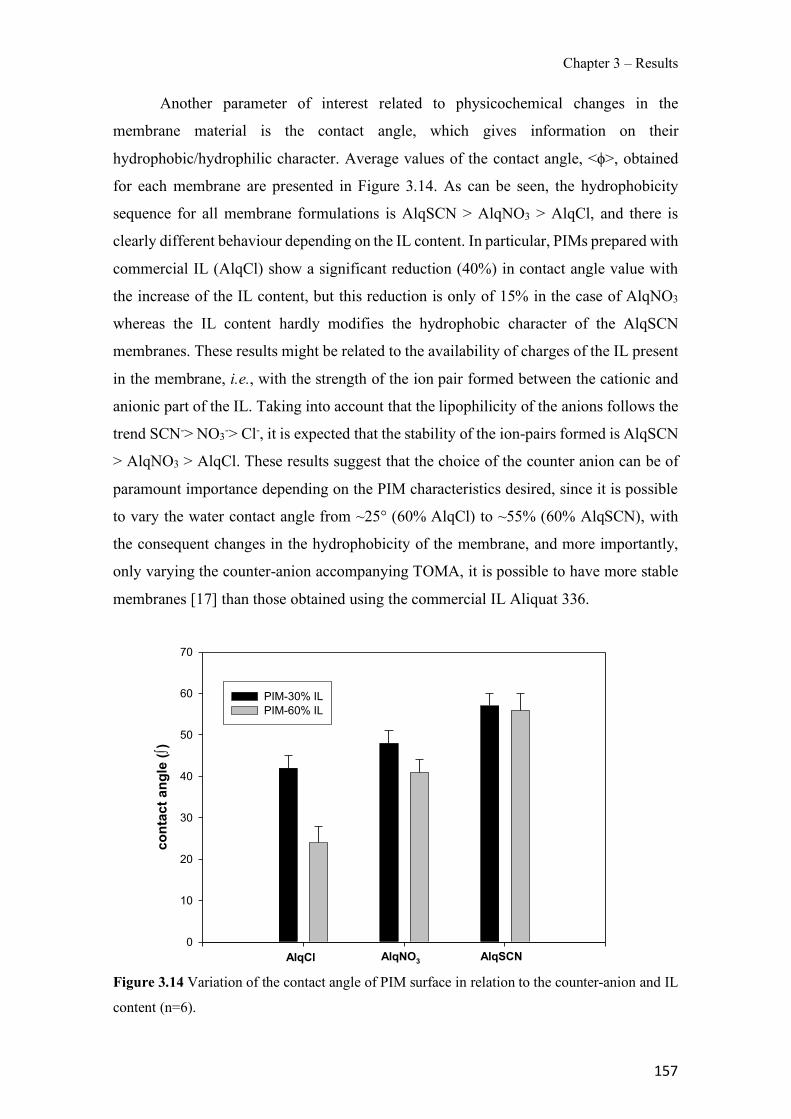
Chapter 3 – Results
157
Another parameter of interest related to physicochemical changes in the
membrane material is the contact angle, which gives information on their
hydrophobic/hydrophilic character. Average values of the contact angle, <ϕ>, obtained
for each membrane are presented in Figure 3.14. As can be seen, the hydrophobicity
sequence for all membrane formulations is AlqSCN > AlqNO3 > AlqCl, and there is
clearly different behaviour depending on the IL content. In particular, PIMs prepared with
commercial IL (AlqCl) show a significant reduction (40%) in contact angle value with
the increase of the IL content, but this reduction is only of 15% in the case of AlqNO3
whereas the IL content hardly modifies the hydrophobic character of the AlqSCN
membranes. These results might be related to the availability of charges of the IL present
in the membrane, i.e., with the strength of the ion pair formed between the cationic and
anionic part of the IL. Taking into account that the lipophilicity of the anions follows the
trend SCN-> NO3-> Cl-, it is expected that the stability of the ion-pairs formed is AlqSCN
> AlqNO3 > AlqCl. These results suggest that the choice of the counter anion can be of
paramount importance depending on the PIM characteristics desired, since it is possible
to vary the water contact angle from ~25° (60% AlqCl) to ~55% (60% AlqSCN), with
the consequent changes in the hydrophobicity of the membrane, and more importantly,
only varying the counter-anion accompanying TOMA, it is possible to have more stable
membranes [17] than those obtained using the commercial IL Aliquat 336.
Figure 3.14 Variation of the contact angle of PIM surface in relation to the counter-anion and IL
content (n=6).
cont
act a
ngle
(∫)
0
10
20
30
40
50
60
70
PIM-30% ILPIM-60% IL
AlqCl AlqNO3 AlqSCN !
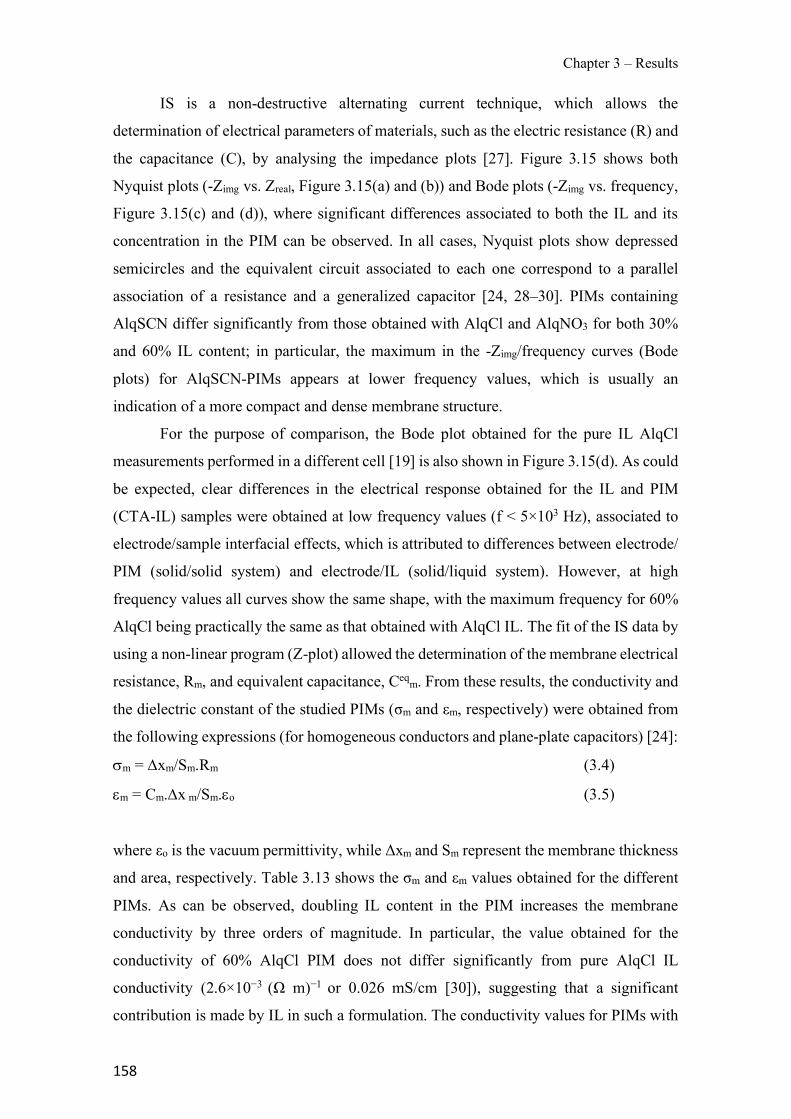
Chapter 3 – Results
158
IS is a non-destructive alternating current technique, which allows the
determination of electrical parameters of materials, such as the electric resistance (R) and
the capacitance (C), by analysing the impedance plots [27]. Figure 3.15 shows both
Nyquist plots (-Zimg vs. Zreal, Figure 3.15(a) and (b)) and Bode plots (-Zimg vs. frequency,
Figure 3.15(c) and (d)), where significant differences associated to both the IL and its
concentration in the PIM can be observed. In all cases, Nyquist plots show depressed
semicircles and the equivalent circuit associated to each one correspond to a parallel
association of a resistance and a generalized capacitor [24, 28–30]. PIMs containing
AlqSCN differ significantly from those obtained with AlqCl and AlqNO3 for both 30%
and 60% IL content; in particular, the maximum in the -Zimg/frequency curves (Bode
plots) for AlqSCN-PIMs appears at lower frequency values, which is usually an
indication of a more compact and dense membrane structure.
For the purpose of comparison, the Bode plot obtained for the pure IL AlqCl
measurements performed in a different cell [19] is also shown in Figure 3.15(d). As could
be expected, clear differences in the electrical response obtained for the IL and PIM
(CTA-IL) samples were obtained at low frequency values (f < 5×10³ Hz), associated to
electrode/sample interfacial effects, which is attributed to differences between electrode/
PIM (solid/solid system) and electrode/IL (solid/liquid system). However, at high
frequency values all curves show the same shape, with the maximum frequency for 60%
AlqCl being practically the same as that obtained with AlqCl IL. The fit of the IS data by
using a non-linear program (Z-plot) allowed the determination of the membrane electrical
resistance, Rm, and equivalent capacitance, Ceqm. From these results, the conductivity and
the dielectric constant of the studied PIMs (σm and εm, respectively) were obtained from
the following expressions (for homogeneous conductors and plane-plate capacitors) [24]:
sm = Dxm/Sm.Rm (3.4)
em = Cm.Dx m/Sm.eo (3.5)
where εo is the vacuum permittivity, while Δxm and Sm represent the membrane thickness
and area, respectively. Table 3.13 shows the σm and εm values obtained for the different
PIMs. As can be observed, doubling IL content in the PIM increases the membrane
conductivity by three orders of magnitude. In particular, the value obtained for the
conductivity of 60% AlqCl PIM does not differ significantly from pure AlqCl IL
conductivity (2.6×10⁻³ (Ω m)−1 or 0.026 mS/cm [30]), suggesting that a significant
contribution is made by IL in such a formulation. The conductivity values for PIMs with
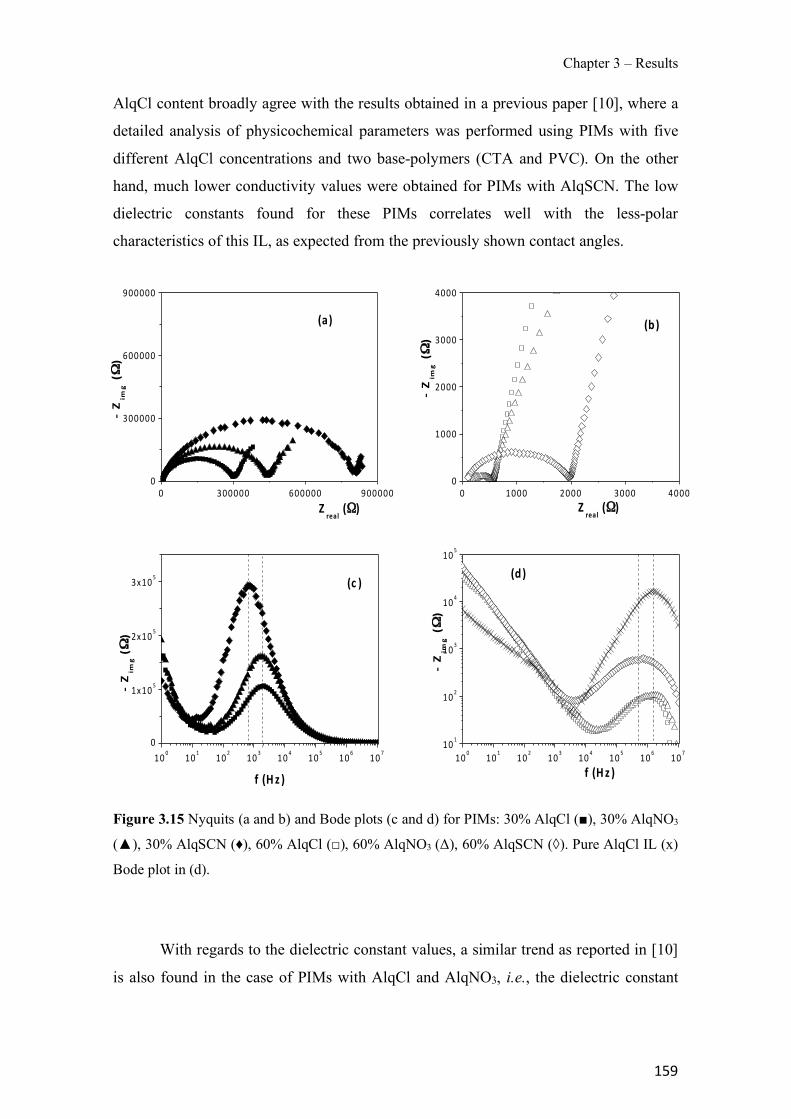
Chapter 3 – Results
159
AlqCl content broadly agree with the results obtained in a previous paper [10], where a
detailed analysis of physicochemical parameters was performed using PIMs with five
different AlqCl concentrations and two base-polymers (CTA and PVC). On the other
hand, much lower conductivity values were obtained for PIMs with AlqSCN. The low
dielectric constants found for these PIMs correlates well with the less-polar
characteristics of this IL, as expected from the previously shown contact angles.
Figure 3.15 Nyquits (a and b) and Bode plots (c and d) for PIMs: 30% AlqCl (■), 30% AlqNO3
(▲), 30% AlqSCN (♦), 60% AlqCl (□), 60% AlqNO3 (Δ), 60% AlqSCN (◊). Pure AlqCl IL (x)
Bode plot in (d).
With regards to the dielectric constant values, a similar trend as reported in [10]
is also found in the case of PIMs with AlqCl and AlqNO3, i.e., the dielectric constant
! "!!!!! #!!!!! $!!!!!!
"!!!!!
#!!!!!
$!!!!!
!"#
$%&"'!(
#)*+,
"'!(
'+(
! "!!! #!!! $!!! %!!!!
"!!!
#!!!
$!!!
%!!!
!"#
$%&"'!(
#)*+,
"'!(
'-(
!"" !"! !"# !"$ !"% !"& !"' !"("
!)!"&
#)!"&
$)!"&
!"#
$%&"'!(
)"'* + (
', (
!!"" !"! !"# !"$ !"% !"& !"' !"(
!"!
!"#
!"$
!"%
!"&
!"#
$%&"'!(
)"'* + (
',(
!
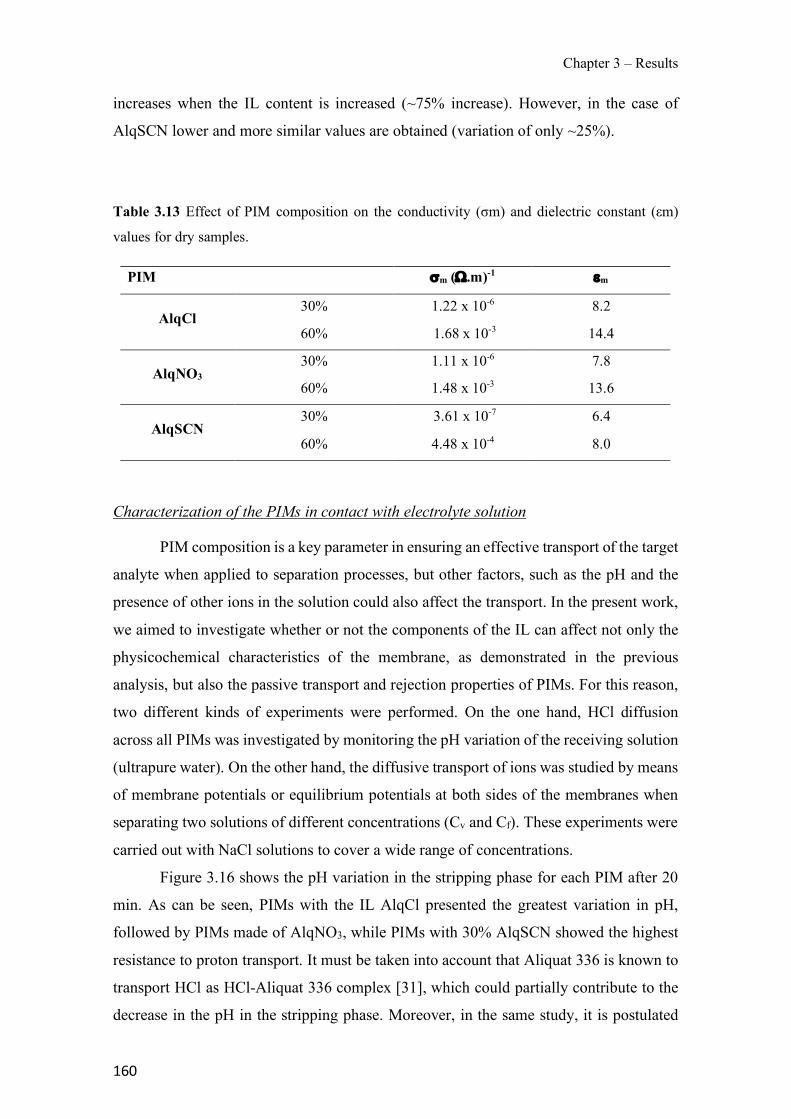
Chapter 3 – Results
160
increases when the IL content is increased (~75% increase). However, in the case of
AlqSCN lower and more similar values are obtained (variation of only ~25%).
Table 3.13 Effect of PIM composition on the conductivity (σm) and dielectric constant (εm)
values for dry samples.
PIM sm (W.m)-1 em
AlqCl 30% 1.22 x 10⁻⁶ 8.2
60% 1.68 x 10⁻³ 14.4
AlqNO3 30% 1.11 x 10⁻⁶ 7.8
60% 1.48 x 10⁻³ 13.6
AlqSCN 30% 3.61 x 10⁻⁷ 6.4
60% 4.48 x 10⁻⁴ 8.0
Characterization of the PIMs in contact with electrolyte solution
PIM composition is a key parameter in ensuring an effective transport of the target
analyte when applied to separation processes, but other factors, such as the pH and the
presence of other ions in the solution could also affect the transport. In the present work,
we aimed to investigate whether or not the components of the IL can affect not only the
physicochemical characteristics of the membrane, as demonstrated in the previous
analysis, but also the passive transport and rejection properties of PIMs. For this reason,
two different kinds of experiments were performed. On the one hand, HCl diffusion
across all PIMs was investigated by monitoring the pH variation of the receiving solution
(ultrapure water). On the other hand, the diffusive transport of ions was studied by means
of membrane potentials or equilibrium potentials at both sides of the membranes when
separating two solutions of different concentrations (Cv and Cf). These experiments were
carried out with NaCl solutions to cover a wide range of concentrations.
Figure 3.16 shows the pH variation in the stripping phase for each PIM after 20
min. As can be seen, PIMs with the IL AlqCl presented the greatest variation in pH,
followed by PIMs made of AlqNO3, while PIMs with 30% AlqSCN showed the highest
resistance to proton transport. It must be taken into account that Aliquat 336 is known to
transport HCl as HCl-Aliquat 336 complex [31], which could partially contribute to the
decrease in the pH in the stripping phase. Moreover, in the same study, it is postulated
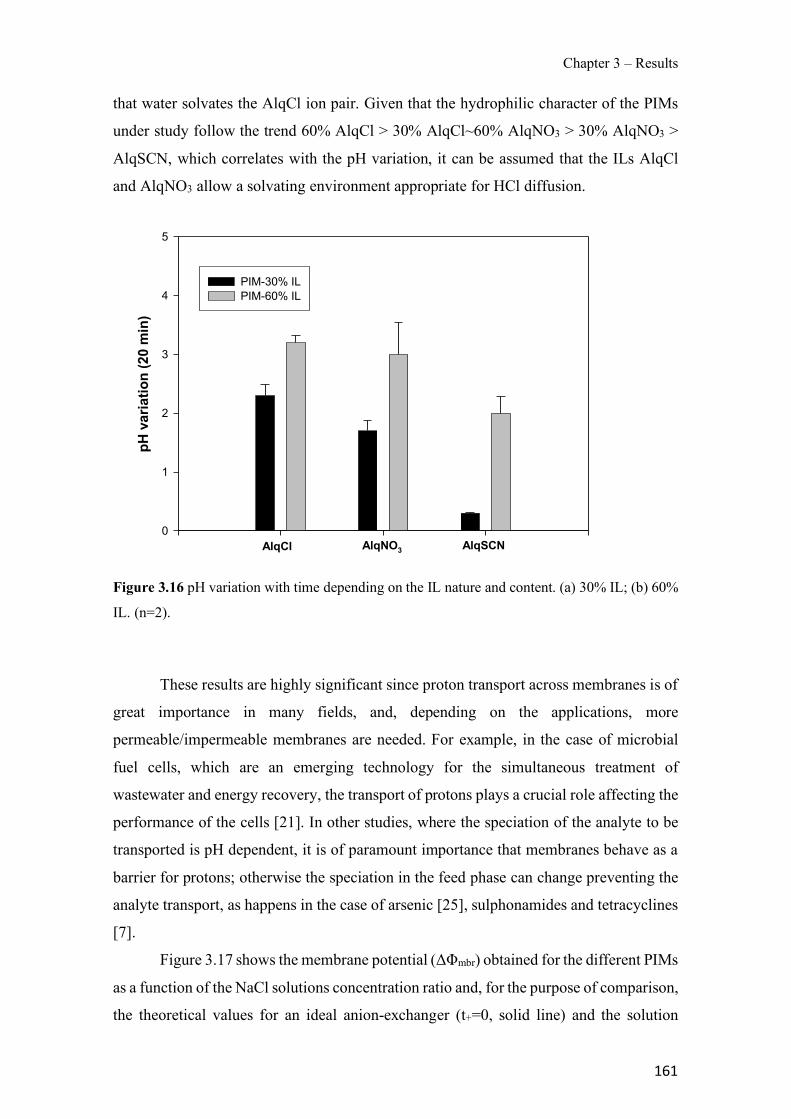
Chapter 3 – Results
161
that water solvates the AlqCl ion pair. Given that the hydrophilic character of the PIMs
under study follow the trend 60% AlqCl > 30% AlqCl~60% AlqNO3 > 30% AlqNO3 >
AlqSCN, which correlates with the pH variation, it can be assumed that the ILs AlqCl
and AlqNO3 allow a solvating environment appropriate for HCl diffusion.
Figure 3.16 pH variation with time depending on the IL nature and content. (a) 30% IL; (b) 60%
IL. (n=2).
These results are highly significant since proton transport across membranes is of
great importance in many fields, and, depending on the applications, more
permeable/impermeable membranes are needed. For example, in the case of microbial
fuel cells, which are an emerging technology for the simultaneous treatment of
wastewater and energy recovery, the transport of protons plays a crucial role affecting the
performance of the cells [21]. In other studies, where the speciation of the analyte to be
transported is pH dependent, it is of paramount importance that membranes behave as a
barrier for protons; otherwise the speciation in the feed phase can change preventing the
analyte transport, as happens in the case of arsenic [25], sulphonamides and tetracyclines
[7].
Figure 3.17 shows the membrane potential (ΔΦmbr) obtained for the different PIMs
as a function of the NaCl solutions concentration ratio and, for the purpose of comparison,
the theoretical values for an ideal anion-exchanger (t+=0, solid line) and the solution
pH v
aria
tion
(20
min
)
0
1
2
3
4
5
PIM-30% ILPIM-60% IL
AlqCl AlqNO3 AlqSCN!
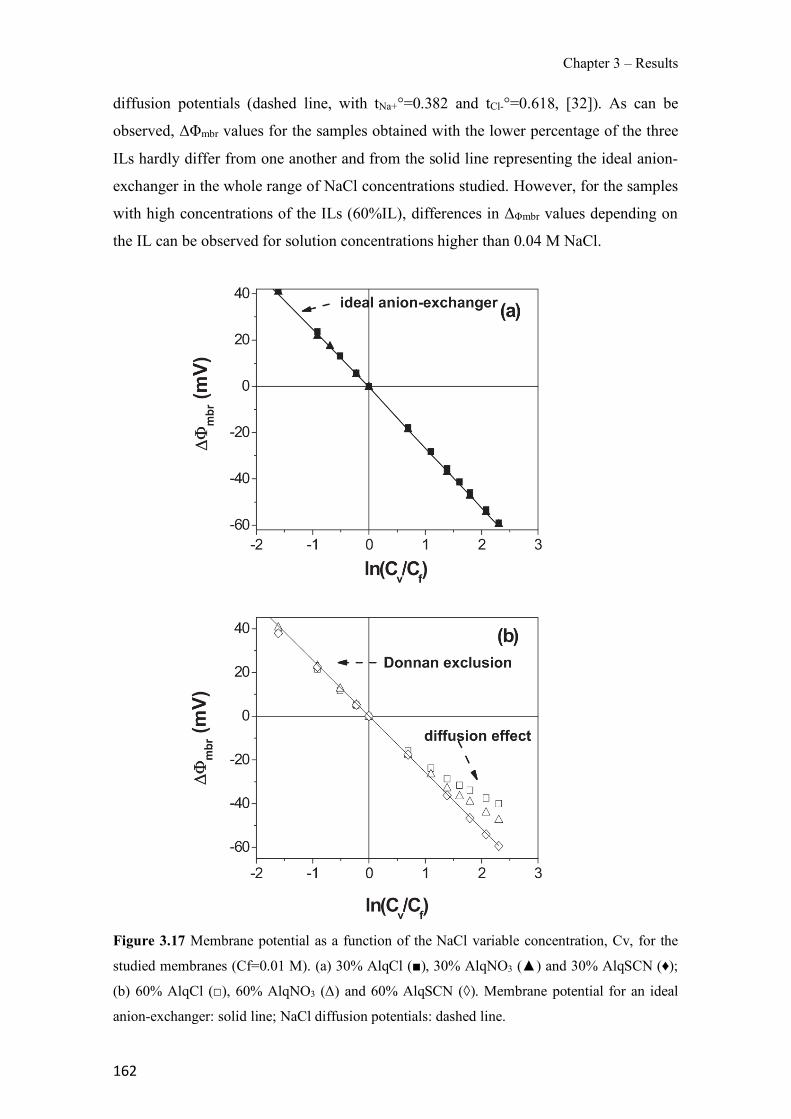
Chapter 3 – Results
162
diffusion potentials (dashed line, with tNa+°=0.382 and tCl-°=0.618, [32]). As can be
observed, ΔΦmbr values for the samples obtained with the lower percentage of the three
ILs hardly differ from one another and from the solid line representing the ideal anion-
exchanger in the whole range of NaCl concentrations studied. However, for the samples
with high concentrations of the ILs (60%IL), differences in ΔΦmbr values depending on
the IL can be observed for solution concentrations higher than 0.04 M NaCl.
Figure 3.17 Membrane potential as a function of the NaCl variable concentration, Cv, for the
studied membranes (Cf=0.01 M). (a) 30% AlqCl (■), 30% AlqNO3 (▲) and 30% AlqSCN (♦);
(b) 60% AlqCl (□), 60% AlqNO3 (Δ) and 60% AlqSCN (◊). Membrane potential for an ideal
anion-exchanger: solid line; NaCl diffusion potentials: dashed line.
Chapter 3 – Results
163
The Teorell-Meyer-Sievers (TMS) model [33,34] considers membrane potentials
basically as the sum of two different contributions: i) two Donnan potentials (ΔΦDn), one
at each membrane/solution interface, responsible for the exclusion of co-ions (ions with
similar charges to that of the fixed charge of the membrane) from the membrane due to
electrical interactions and, consequently, its effect can be reduced at high solution
concentration values; ii) a diffusion potential in the membrane (ΔΦdif) caused by
differences in the mobility of the ions diffusing across the membrane, and its contribution
usually increases with the concentration gradient in the membrane [35,36]. Taking into
account the TMS model, membrane potential results obtained for the 30% IL and the 60%
AlqSCN samples seem to indicate almost total exclusion of Na+ ions from the
membranes, although the increase in the hydrophilicity of 60% AlqCl and 60% AlqNO3
membranes could favour the inclusion and diffusive transport of Na+ ions in these
samples at high concentration gradients.
Conclusions
We have demonstrated that new Aliquat 336 derivatives can be successfully
prepared by a liquid-liquid exchange process. These new derivatives have been used for
the preparation of PIMs at two different concentrations, and the effect on the
physicochemical properties of the membranes has been investigated in terms of IL
composition and content. The results obtained by XPS and FTIR are in agreement with
the expected membrane composition. TGA analysis has not shown differences in the
initial decomposition temperature of the membranes, independently of the IL counter-
anion present in the PIM. However, higher conductivity and dielectric constants were
obtained for membranes containing AlqCl and AlqNO3 compared with those with
AlqSCN, and a significant increase in conductivity values (3 orders of magnitude) was
observed when the IL concentration was changed from 30% to 60%. It is worth
mentioning the differences found in the hydrophilic character of the PIMs, which follows
the sequence AlqCl > AlqNO3 > AlqSCN, independently of the IL content. The higher
hydrophilicity of the AlqCl membranes supports the results obtained with HCl and NaCl
diffusive transport measurements. Consequently, it has been shown that the
characteristics of PIMs containing quaternary ammonium salts can be manipulated by
varying the corresponding counter anion.
Chapter 3 – Results
164
References
[1] L.D. Nghiem, P. Mornane, I.D. Potter, J.M. Perera, R.W. Cattrall, S.D. Kolev,
Extraction and transport of metal ions and small organic compounds using
polymer inclusion membranes (PIMs), J. Membr. Sci. 281 (2006) 7–41.
[2] C. Fontàs, R. Tayeb, M. Dhahbi, E. Gaudichet, F. Thominette, P. Roy, K.
Steenkeste, M.P. Fontaine-Aupart, S. Tingry, E. Tronel-Peyroz, P. Seta, Polymer
inclusion membranes: the concept of fixed sites membrane revised, J. Membr. Sci.
290 (2007) 62–72.
[3] M.I.S.G. Almeida, R.W. Cattrall, S.D. Kolev, Recent trends in transport and
extraction of metal ions using polymer inclusion membranes (PIMs), J. Membr.
Sci. 415–416 (2012) 9–23.
[4] C. Fontàs, R. Tayeb, S. Tingry, M. Hidalgo, P. Seta, Transport of platinum(IV)
through supported liquid membrane (SLM) and polymeric plasticized membrane
(PPM), J. Membr. Sci. 263 (2005) 96–102.
[5] N. Pont, V. Salvadó, C. Fontàs, Selective transport and removal of Cd from
chloride solutions by polymer inclusion membranes, J. Memb. Sci. 318 (2008)
340–345.
[6] C.I. Gherasim, G. Bourceanu, R. Olariu, C. Arsene, Removal of lead(II) from
aqueous solutions by a polyvinyl-chloride inclusion membrane without added
plasticizer, J. Membr. Sci. 377 (2011) 167–174.
[7] A. Garcia-Rodríguez, V. Matamoros, S.D. Kolev, C. Fontàs, Development of a
polymer inclusion membrane (PIM) for the preconcentration of antibiotics in
environmental water samples, J. Membr. Sci. 492 (2015) 32–39.
[8] E.A. Nagul, C. Fontàs, I.D. Mckelvie, R.W. Cattrall, S.D. Kolev, The use of a
polymer inclusion membrane for separation and preconcentration of
orthophosphate in flow analysis, Anal. Chim. Acta 803 (2015) 82–90.
[9] R.L. Gardas, J.A.P. Coutinho, Group contribution methods for the prediction of
thermophysical and transport properties of ionic liquids, AIChE J. 55 (2009).
Chapter 3 – Results
165
[10] M.I. Vázquez, V. Romero, C. Fontàs, E. Anticó, J. Benavente, Polymer inclusion
membranes (PIMs) with the ionic liquid (IL) Aliquat 336 as extractant: effect of
base polymer and IL concentration on their physical-chemical and elastic
characteristics, J. Membr. Sci. 455 (2014) 312–319.
[11] J.P. Mikkola, P. Virtanen, R. Sjöholm, Aliquat 336 – a versatile and affordable
cation source for an entirely new family of hydrophobic ionic liquids, Green
Chem. 8 (2006) 250–255.
[12] D. Jogelnig, A. Stojanovic, M. Galanski, M. Groessl, F. Jirsa, R. Krachler, B.K.
Keppler, Greener synthesis of new ammonium ionic liquids and their potential as
extracting agents, Tetrahedron Lett. 49 (2008) 2782–2785.
[13] Y. Sakai, K. Kadota, T. Hayashita, R.W. Cattrall, S.D. Kolev, The effect of the
counter anion on the transport of thiourea in a PVC-based polymer inclusion
membrane using Capriquat as carrier, J. Membr. Sci. 346 (2010) 250–255.
[14] I.I. Nasser, F.I.E.H. Amor, L. Donato, C. Algieri, A. Garofalo, E. Drioli, C.
Ahmed, Removal and recovery of Ag(CN)2 - from synthetic electroplating baths
by polymer inclusion membrane containing Aliquat 336 as a carrier, Chem. Eng.
J. 295 (2016) 207–217.
[15] B.N. Mahanty, P.K. Mohapatra, D.R. Raut, D.K. Das, P.G. Behere, Md Afzal, W.
Verboom, Polymer inclusion membrane containing a tripodal diglycolamide
(TDGA): characterization and sorption isotherm studies, JECE 4 (2016) 1826–
1838.
[16] A. Manzak, Y. Yildiz, O. Tutkun, Characterization of polymer inclusion
membrane containing Aliquat 336 as a carrier, Membr. Water Treat. 6 (2015) 95–
102.
[17] A. Kaya, C. Onac, H.K. Alpoguz, A. Yilmaz, N. Atar, Removal of Cr(VI) through
calixarene based polymer inclusion membrane from chrome plating bath water,
Chem. Eng. J. 283 (2016) 141–149.
[18] R. Fortunato, C.A.M. Afonso, J. Benavente, E. Rodríguez-Castellón, J.G. Crespo,
Stability of supported ionic liquid membranes as studied by X-ray photoelectron
spectroscopy, J. Membr. Sci. 256 (2005) 216–223.
Chapter 3 – Results
166
[19] R. Fortunato, L. Branco, C.A.M. Afonso, J. Benavente, J.G. Crespo, Electrical
impedance spectroscopy characterisation of supported ionic liquid membranes, J.
Mem. Sci. 270 (2006) 42–49.
[20] E. Rodríguez de San Miguel, J.C. Aguilar, J. de Gyves, Structural effects on metal
ion migration across polymer inclusion membranes: dependence of transport
profiles on nature of active plasticizer, J. Membr. Sci. 307 (2008) 105–116.
[21] M.J. Salar-Gacía, V.M. Ortiz-Martínez, A.P. de los Ríos, F.J. Hernández
Fernández, A method based on impedance spectrocopy for predicting the behavior
of novel ionic liquid-polymer inclusion membranes in microbial fuel cells, Energy
89 (2015) 648–654.
[22] J.F. Moulder, W.F. Stickl, P.E. Sobol, K.D. Bomben, Handbook of X-Ray
Photoelectron Spectroscopy, Perkin-Elmer: Eden Prairie, Minneapolis (USA),
1992.
[23] D. Briggs, M.P. Seah, Practical Surface Analysis, 2 ed. Vol I: Auger and X-ray
photoelectron spectroscopy, John Wiley & Sons, Chichester, England, 1995
[24] V. Romero, V. Vega, J. García, R. Zierold, K. Nielsch, V.M. Prida, B. Hernando,
J. Benavente, Changes in morphology and ionic transport induced by ALD SiO2
coating of nanoporous alumina membranes, ACS Appl. Mater. Interfaces 5 (2013)
152–159.
[25] R. Güell, E. Anticó, S.D. Kolev, J. Benavente, V. Salvadó, C. Fontàs,
Development and characterization of polymer inclusion membranes for the
separation and speciation of inorganic As species, J. Membr. Sci. 383 (2011) 88–
95.
[26] R.M. France, R.D. Short, Plasma treatment of polymers: the effects of energy
transfer from an argon plasma on the surface chemistry of polystyrene, and
polypropylene. A high-energy resolution X-ray photoelectron spectroscopy study,
Langmuir 14 (1998) 4827.
[27] R.J. MacDonals, Impedance Spectroscopy, Wiley, New York (USA), 1987.
Chapter 3 – Results
167
[28] K. Asaka, Dielectric properties of cellulose acetate reverse osmosis membranes in
aqueous salt solutions, J. Membr. Sci. 50 (1990) 71–84.
[29] M. Algarra, M.I. Vázquez, B. Alonso, C.M. Casado, J. Casado, J. Benavente,
Characterization of an engineered cellulose based membrane by thiol dendrimer
for heavy metals removal, Chem. Eng. J. 253 (2014) 472–477.
[30] Y. Litaiem, M. Dhahb, Measurements and correlations of viscosity, conductivity
and density of an hydrophobic ionic liquid (Aliquat 336) mixtures with a non-
associated dipolar aprotic solvent (DMC), J. Mol. Liq. 169 (2012) 54–62.
[31] R.V. Subba Rao, P. Sivakumar, R. Natarajan, P.R. Vasudeva Rao, Effect of
Aliquat 336 concentration on transportation of hydrochloric acid across supported
liquid membrane, J. Radioanal. Nucl. Chem. 252 (1) (2002) 95–98.
[32] R.A. Robinson, R.H. Stokes, Electrolyte Solutions, Butterworth & Co., London
(England), 1959.
[33] K.H. Meyer, J.F. Sievers, The permeability of membranes I – the theory of ionic
permeability I, Helv. Chim. Acta 19 (1936) 649–664.
[34] T. Teorell, Transport phenomena in membranes, Discuss. Faraday Soc. 21 (1956)
9–26.
[35] N. Lakshminarayanaiah, Transport Phenomena in Membranes, Academic Press,
New York (USA), 1969.
[36] V. Romero, M.I. Vázquez, J. Benavente, Study of ionic and diffusive transport
through a regenerated cellulose nanoporous membrane, J. Membr. Sci. 433 (2013)
152–159.
Chapter 3 – Results
168
3.2.3 First report on a solvent-free preparation of polymeric membranes with an
ionic liquid
Abstract
A novel and environmentally-friendly procedure for the preparation of polymer
inclusion membranes (PIMs) containing an ionic liquid is presented for the first time.
Traditionally, PIMs are prepared by a solvent casting method and involve the use of
harmful organic solvents such as chloroform or dichloromethane. Here we report a new
solvent-free procedure based on a thermal-compression technique which involve the
melting of the components of the PIM and the application of a high pressure to the melted
specimen to form a flat-sheet film. In our study, we have tested different polymers, such
as two cellulose derivatives as well as two thermoplastic polymers, polyurethane (TPU)
and poli ε-caprolactone (PCL). The ionic liquid (IL) trioctylmethylammonium chloride
(Aliquat 336) has been used to produce PIMs with a fixed composition of 70% polymer–
30% IL (w/w). From our results, it can be stated that both TPU and PCL polymers provide
successful membranes, which have been characterized by elemental analysis,
thermogravimetric analysis and scanning electron microscope. Membrane stability was
investigated in terms of IL leaching and it is worth mentioning the great stability of PIMs
based on the polymer PCL. To test whether the properties of the IL were affected by the
preparation conditions, the extraction ability of Aliquat 336 was investigated for both
PCL and TPU membranes in terms of Cr(VI) extraction. Satisfactory values (90 %
extraction) were obtained for both membranes tested, showing this novel procedure as a
green alternative for the preparation of PIMs with ILs.
Introduction
Membrane-based processes have attracted a great attention during the last decades
as a valuable alternative for many separation applications [1,2]. Among the different types
of membranes, polymeric membranes incorporating ionic liquids (ILs) are under the
spotlight due to the satisfactory properties of these compounds. ILs are molten salts liquid
at room temperature formed by an organic cation (e.g. dialkylimidazolium,
tetralkylammonium, trycaprylmethylammonium, among others) and an organic or
inorganic anion. ILs exhibit certain remarkable features such as negligible vapour
Chapter 3 – Results
169
pressure, high ion conductivity, low volatility, non-flammability, liquid range of up to at
least 300ºC, high potential for recycling, high solvating capacity and high viscosity, etc.
[3,4]. However, the use of ILs presents some limitations due to, for example, their high
price for synthesis and high energy consumption for recycling, which can be overcome
by including them into polymeric membranes, where a less amount of IL is required [4].
Polymer inclusion membranes (PIMs) are a type of polymeric membranes where
the extractant is immobilized between the entangled chains of the membrane’s base
polymer. PIMs have successfully been used in different separation systems, including
analytical applications [5], transport of organic compounds [6,7] as well as metallic
species [8,9].
The IL trioctylmethylammonium chloride (Aliquat 336) is widely to produce
membranes due to its versatility and affordability, and has successfully been employed
as a cation source of a new family of hydrophobic ILs [10]. Its ability to extract anionic
species has been exploited in several studies concerning either inorganic [11–15] and
organic compounds [16,17].
PIMs are conventionally prepared by the solvent casting method, where the
polymer and the extractant are properly dissolved in an appropriate volatile solvent,
which afterwards, is let to evaporate to form a thin stable polymeric film. Another
approach is the phase inversion technique, that involves several steps, such as the
dissolution of the polymer and extractant in a solvent, the spreading of this solution onto
a substrate, and the solvent removal by immersing the nascent membrane in water [11].
Even though the simplicity of these procedures, they present the important drawback of
requiring the use of harmful organic solvents. This is the case when the polymers
cellulose triacetate (CTA) or polyvinyl chloride (PVC) are used. In the first case, CTA
needs solvents such as chloroform or dichloromethane (10 mL for 0.1 g of polymer)
[8,18,19], whereas PVC is dissolved using tetrahydrofuran (5 mL for 0.1 g of polymer)
[20,21]. These two polymers, and more recently poly(vinylidine fluoride-
cohexafluoropropylene) (PVDF-HFP), which needs to be dissolved in THF, are the most
employed polymers to produce PIMs.
Recent research on the preparation of polymeric membranes is focused on the use
of polymers that need less harmful reagents such as the case of Pebax 1657, which can
be dissolved in a mixture of ethanol and water at a high temperature [22] or in 1-butanol
[23]. Membranes prepared with this polymer and the IL based on the cation 1- butyl-3-
methyl imidazolium ([Bmim+]) combined with different anions are obtained by the
Chapter 3 – Results
170
solvent casting method, and have shown a good efficiency in terms of CO2 separation.
Besides, a review on different non-toxic solvents used for the preparation of polymeric
membranes has recently been presented by Figoli et al. [24]. This review highlights the
possibility to use less toxic organic solvents such as methyl or ethyl lactate,
triethylphosphate, dimethyl sulfoxide or γ-butyrolactone as safer and attractive
alternatives to dissolve polymers such as cellulose acetate (CA) or poly(vinylidene
fluoride) (PVDF) to produce membranes for ultrafiltration, microfiltration or reverse
osmosis processes.
As a further step to achieve greener separation processes based on membranes,
we have explored, in this study, a new methodology avoiding the use of hazardous
chemicals to prepare PIMs incorporating an IL. This methodology is based on a melt
mixing followed by a thermal-compression of the different components. Melt mixing is
extensively used as the processing method for the production of polymeric
nanocomposites [25,26] or in the preparation of various polymer blends [27]. In our study,
this technology has been investigated together with the use of eco-friendly polymers. This
is the case of the thermoplastic polymers polyurethane (TPU) and poli ε-caprolactone
(PCL). TPUs are linear block copolymers containing hard and soft segments. According
to the manufacturer, TPU used in this work is a linear, aromatic bio-polyurethane based
on specialty polyol from renewable sources (67% renewable material) with an extremely
high crystallization rate and a very high thermoplasticity level. TPU polymers show a
wide range of properties, making them suitable for different applications including
automotive, electronics, sports goods, footwear and medical applications [28]. The
polymer PCL is a biodegradable high molecular weight linear polyester derived from
caprolactone monomer with a great potential to be used as an implantable biomaterial in
the biomedical field [29,30]. It must be highlighted that the biodegradability of this
polymer will reduce its overall environmental impact, such as the formation of
microplastics, which is of a great concern nowadays. To the best of our knowledge, this
is the first study on the preparation of PIMs incorporating ILs by a thermal-compression
procedure.
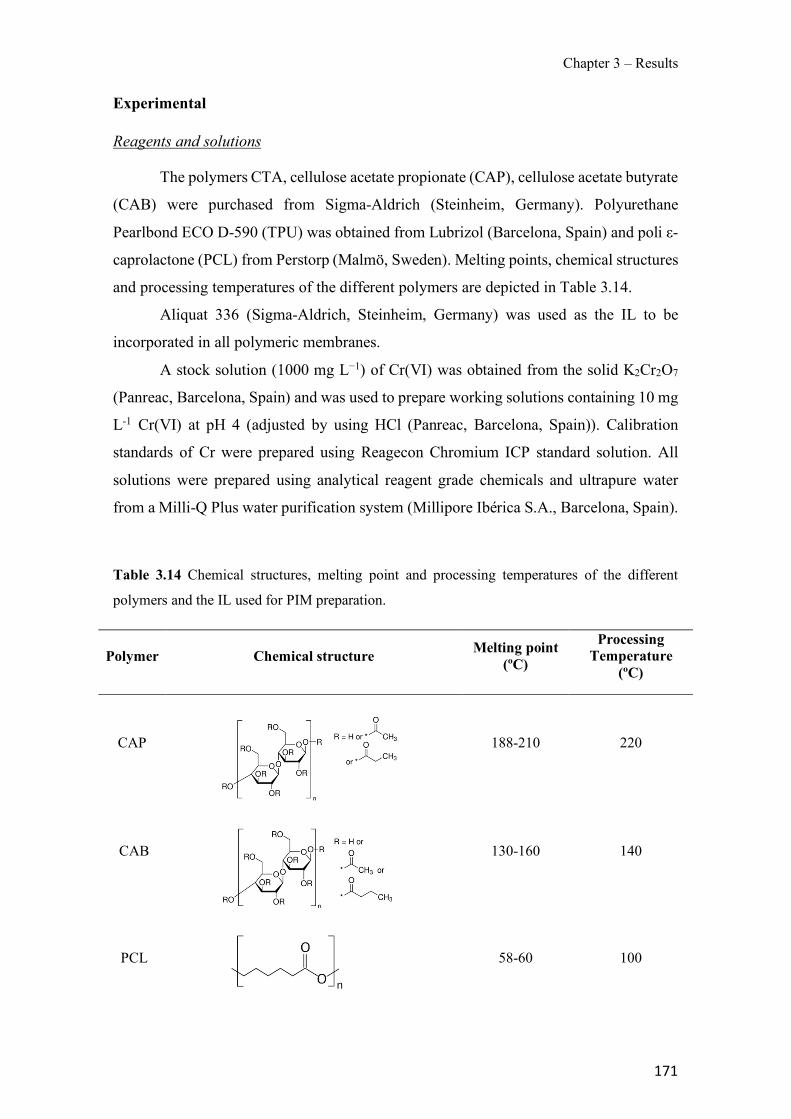
Chapter 3 – Results
171
Experimental
Reagents and solutions
The polymers CTA, cellulose acetate propionate (CAP), cellulose acetate butyrate
(CAB) were purchased from Sigma-Aldrich (Steinheim, Germany). Polyurethane
Pearlbond ECO D-590 (TPU) was obtained from Lubrizol (Barcelona, Spain) and poli ε-
caprolactone (PCL) from Perstorp (Malmö, Sweden). Melting points, chemical structures
and processing temperatures of the different polymers are depicted in Table 3.14.
Aliquat 336 (Sigma-Aldrich, Steinheim, Germany) was used as the IL to be
incorporated in all polymeric membranes.
A stock solution (1000 mg L−1) of Cr(VI) was obtained from the solid K2Cr2O7
(Panreac, Barcelona, Spain) and was used to prepare working solutions containing 10 mg
L-1 Cr(VI) at pH 4 (adjusted by using HCl (Panreac, Barcelona, Spain)). Calibration
standards of Cr were prepared using Reagecon Chromium ICP standard solution. All
solutions were prepared using analytical reagent grade chemicals and ultrapure water
from a Milli-Q Plus water purification system (Millipore Ibérica S.A., Barcelona, Spain).
Table 3.14 Chemical structures, melting point and processing temperatures of the different
polymers and the IL used for PIM preparation.
Polymer Chemical structure Melting point (ºC)
Processing Temperature
(ºC)
CAP
188-210 220
CAB
130-160 140
PCL
58-60 100
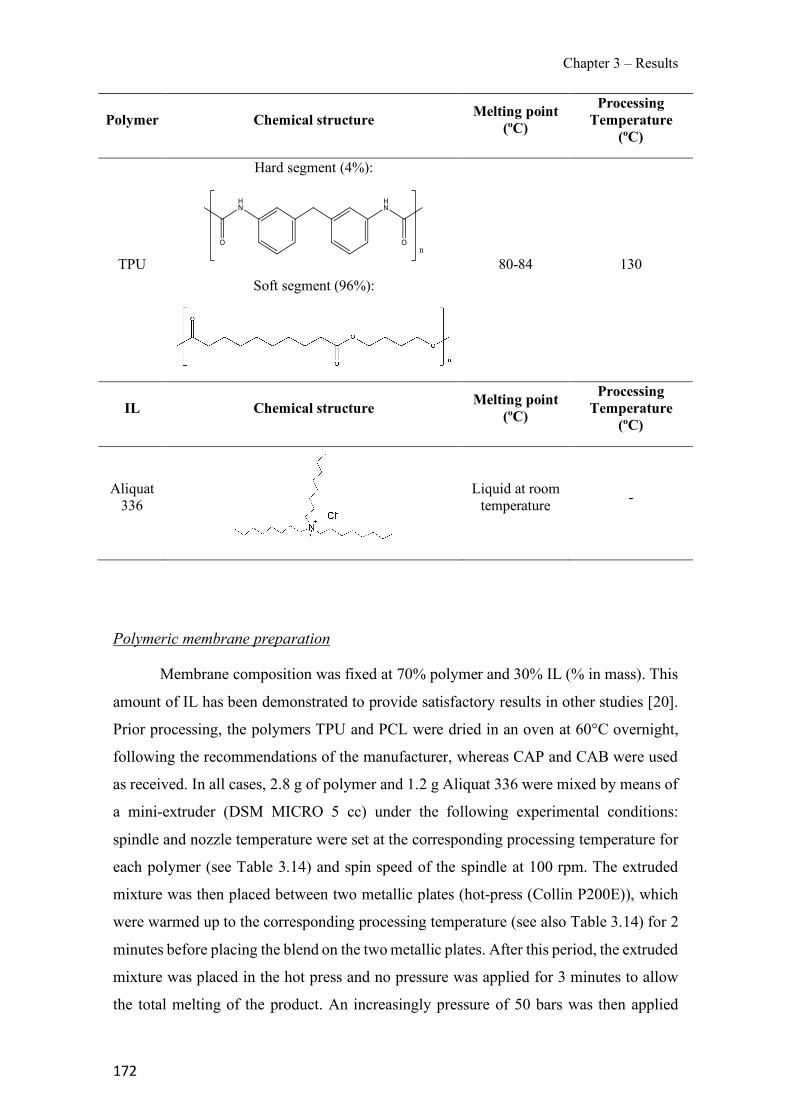
Chapter 3 – Results
172
Polymer Chemical structure Melting point (ºC)
Processing Temperature
(ºC)
TPU
Hard segment (4%):
Soft segment (96%):
80-84 130
IL Chemical structure Melting point (ºC)
Processing Temperature
(ºC)
Aliquat 336
Liquid at room temperature -
Polymeric membrane preparation
Membrane composition was fixed at 70% polymer and 30% IL (% in mass). This
amount of IL has been demonstrated to provide satisfactory results in other studies [20].
Prior processing, the polymers TPU and PCL were dried in an oven at 60°C overnight,
following the recommendations of the manufacturer, whereas CAP and CAB were used
as received. In all cases, 2.8 g of polymer and 1.2 g Aliquat 336 were mixed by means of
a mini-extruder (DSM MICRO 5 cc) under the following experimental conditions:
spindle and nozzle temperature were set at the corresponding processing temperature for
each polymer (see Table 3.14) and spin speed of the spindle at 100 rpm. The extruded
mixture was then placed between two metallic plates (hot-press (Collin P200E)), which
were warmed up to the corresponding processing temperature (see also Table 3.14) for 2
minutes before placing the blend on the two metallic plates. After this period, the extruded
mixture was placed in the hot press and no pressure was applied for 3 minutes to allow
the total melting of the product. An increasingly pressure of 50 bars was then applied
Chapter 3 – Results
173
every 15 seconds up to 200 bars, and maintained for 2 minutes. Finally, the system was
cooled down to room temperature and a flat membrane was obtained.
For comparison purposes, a membrane made of CTA was also prepared by the
solvent casting method [19,31].
Membrane characterization
Elemental analysis of the PIMs was performed using a Perkin Elmer EA2400
instrument. Thermogravimetric analysis (TGA) was done using a Mettler Toledo
TGA/DSC combined instrument and a sample amount of about 10 mg. The heating cycle
was from 30 to 650 °C at a heating rate of 10 °C/min under nitrogen atmosphere (40 mL
min−1). Scanning electron microscope (SEM) images (Hitachi S-2700) were taken from
both surface and cross section, obtained by cryogenic fracture, at an accelerating voltage
of 15 kV. The samples were placed on a stub and coated with gold.
Membrane stability studies
The stability of the different membranes was investigated by means of mass
change. For that, segments of an approximate area of 4 cm2 (in the mass range of 0.0225
and 0.0326 g) were cut from different parts of the membrane and were placed in
polypropylene vessels containing 50 mL ultrapure water, which were shaken using an
orbital mixer for 24 h. Before and after the experiment, membrane segments were
carefully weighted. Mass loss is calculated by using Eq. (3.6):
!"##%&##(%) = +,0.−+,0.+,0.
× 100 (3.6)
where W(0) is the initial membrane weight, and W(f) is the final membrane weight after
24 h immersed in ultrapure water. All experiments were carried out at room temperature
of 22 ± 1 ºC and were run in triplicate.
Cr(VI) extraction experiments
The efficiency of the different membranes to extract Cr(VI) was investigated
using membrane segments of approximately 4 cm2 size contacted with 25 mL of 10 mg
L-1 Cr(VI) at pH 4. These conditions ensured an excess of moles of Aliquat 336 over
Chapter 3 – Results
174
about three times with regards to moles of Cr(VI) in aqueous sample. To ensure the
possibility to quantitatively extract the metal, extraction efficiency (Eq. (3.7)) was
evaluated by measuring the metal concentration with a sequential inductively coupled
plasma atomic emission spectrometer (ICP-AES) (Liberty RL, Varian, Mulgrave, Vic.,
Australia).
3456"758&9:00878:97;(%) =<6(=>),0.−<6(=>),ℎ.
<6(=>),0.× 100 (3.7)
where Cr(VI)(0) is the initial metal in the aqueous solution and Cr(VI)(h) is the metal
concentration in the source solution after a certain time.
All experiments were carried out at room temperature of 22 ± 1 ºC and were done
by duplicate.
Results and discussion
Preparation of polymeric membranes
As stated in the introduction, PVC and CTA are widely used in the preparation of
PIMs. However, both polymers present high melting temperatures and are not appropriate
for the thermal-compression method due to the high temperatures required [32] that
would lead to the degradation of the IL. Given this, instead of CTA, two cellulose acetate
derivatives, CAP and CAB, that have also been used to produce PIMs by the solvent
casting method [33,34] were selected due to their more adequate melting points.
Moreover, membranes based on TPU and PCL were also tested.
The characteristics of the membranes prepared by the thermal-compression
technique are collected in Table 3.15. Due to the high processing temperature needed to
prepare membranes using CAP, the resulting film was not mechanically stable. Besides,
the brownish colour can be related to the IL degradation. Hence, this polymer was
discarded for further experiments. When CAB was employed as the base polymer, the
degradation of the IL was not observed, but the resulting membranes presented an oily
surface, a lack of flexibility and a brittle behaviour. The presence of oil droplets on the
surface is an indicator that the IL is not completely entrapped into the polymeric matrix
as a result of a low compatibility between the polymer and the IL [35]. Non-oily and
flexible membranes were obtained with both polymers TPU and PCL. Taking into
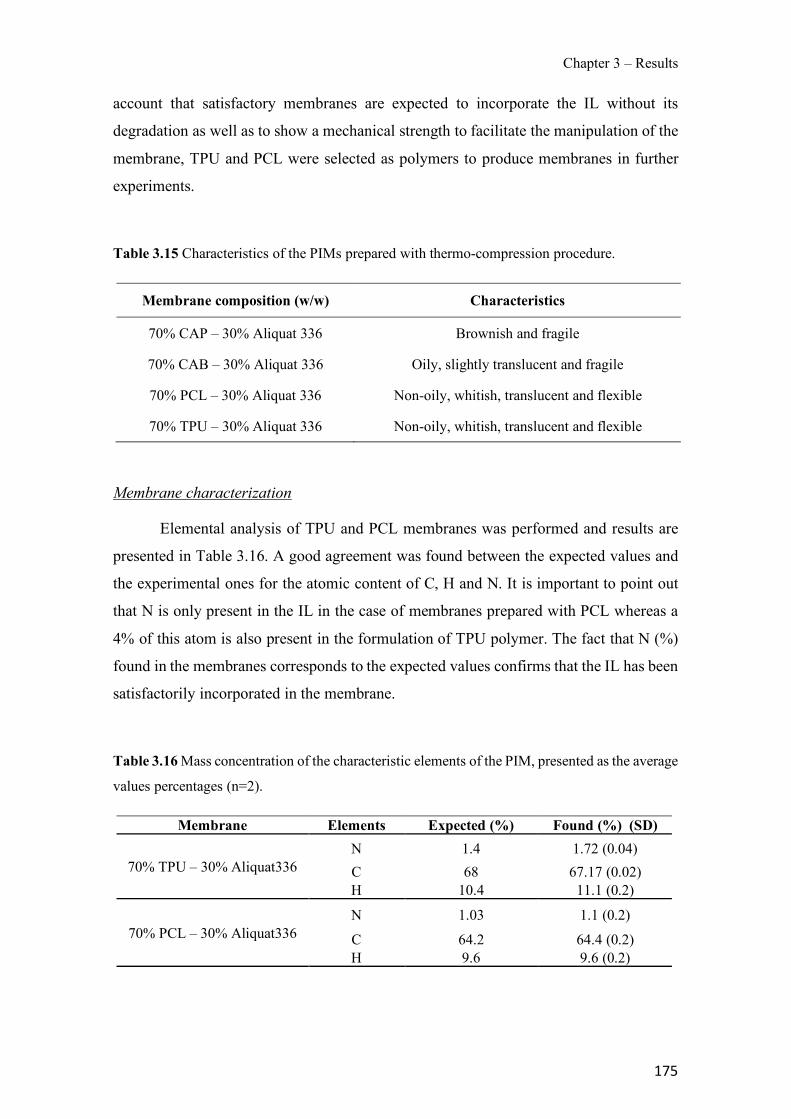
Chapter 3 – Results
175
account that satisfactory membranes are expected to incorporate the IL without its
degradation as well as to show a mechanical strength to facilitate the manipulation of the
membrane, TPU and PCL were selected as polymers to produce membranes in further
experiments.
Table 3.15 Characteristics of the PIMs prepared with thermo-compression procedure.
Membrane composition (w/w) Characteristics
70% CAP – 30% Aliquat 336 Brownish and fragile
70% CAB – 30% Aliquat 336 Oily, slightly translucent and fragile
70% PCL – 30% Aliquat 336 Non-oily, whitish, translucent and flexible
70% TPU – 30% Aliquat 336 Non-oily, whitish, translucent and flexible
Membrane characterization
Elemental analysis of TPU and PCL membranes was performed and results are
presented in Table 3.16. A good agreement was found between the expected values and
the experimental ones for the atomic content of C, H and N. It is important to point out
that N is only present in the IL in the case of membranes prepared with PCL whereas a
4% of this atom is also present in the formulation of TPU polymer. The fact that N (%)
found in the membranes corresponds to the expected values confirms that the IL has been
satisfactorily incorporated in the membrane.
Table 3.16 Mass concentration of the characteristic elements of the PIM, presented as the average
values percentages (n=2).
Membrane Elements Expected (%) Found (%) (SD)
70% TPU – 30% Aliquat336 N 1.4 1.72 (0.04) C 68 67.17 (0.02) H 10.4 11.1 (0.2)
70% PCL – 30% Aliquat336 N 1.03 1.1 (0.2)
C 64.2 64.4 (0.2) H 9.6 9.6 (0.2)
Chapter 3 – Results
176
PIMs were also investigated by TGA analysis. TGA curves are presented in Figure
3.18 including both obtained for the membrane and the corresponding to the pure
components. The TGA curve of the membrane 70% TPU–30% Aliquat 336 clearly shows
three parts: a first decrease of the total weight loss (around 4%) at temperatures up to
around 100°C, which corresponds to the loss of volatile materials and water absorbed by
the membrane. Secondly, the loss starting at a temperature of 180-200ºC that can be
attributed to Aliquat 336 thermal decomposition, which is also observed in the Aliquat
336 TGA curve (blue line) and represents a weight loss of 30%. Finally, the third decrease
in the membrane TGA curves at temperatures over 320–330°C, which is associated to the
thermal degradation of the polymer TPU. These results are in concordance with other
studies where PIMs containing Aliquat 336 were prepared by solvent casting [32]. The
TGA curve of the membrane 70% PCL–30% Aliquat 336 also presents three parts.
However, the weight loss corresponding to the IL represents a 20% of the total value
instead of the expected 30%. This result was confirmed by analysing different new
segments of the membrane. This fact seems to indicate that Aliquat 336 degradation is
shifted to further temperature and cannot be isolated from the polymer decomposition,
likely due to some interactions in between the polymer and the IL.
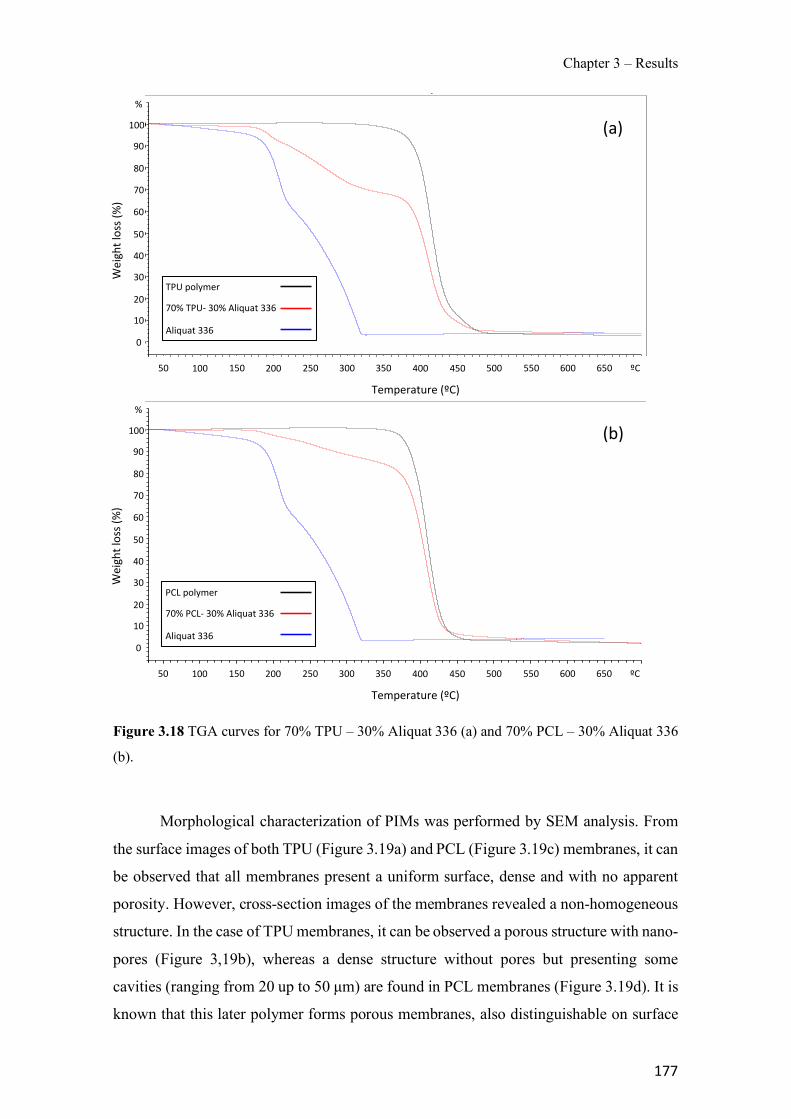
Chapter 3 – Results
177
Figure 3.18 TGA curves for 70% TPU – 30% Aliquat 336 (a) and 70% PCL – 30% Aliquat 336
(b).
Morphological characterization of PIMs was performed by SEM analysis. From
the surface images of both TPU (Figure 3.19a) and PCL (Figure 3.19c) membranes, it can
be observed that all membranes present a uniform surface, dense and with no apparent
porosity. However, cross-section images of the membranes revealed a non-homogeneous
structure. In the case of TPU membranes, it can be observed a porous structure with nano-
pores (Figure 3,19b), whereas a dense structure without pores but presenting some
cavities (ranging from 20 up to 50 µm) are found in PCL membranes (Figure 3.19d). It is
known that this later polymer forms porous membranes, also distinguishable on surface
��"� � ������������������������!� �����������������
�� ����������������� � ������
Weight'loss'(%)'
90'
70'
40'
30'
20'
10'
0'
Temperature'(ºC)'
50' 100' 150' 200' 250' 300' 350' 400' 450' 500'
50'
60'
80'
100'
%'
550' 600' 650' ºC'
PCL'polymer'
70%'PCLC'30%'Aliquat'336'
Aliquat'336'
Temperature'(ºC)'
��!� � ����������������������� �� ����������������
�� ����������������� � ������
Weight'loss'(%)'
90'
70'
40'
30'
20'
10'
0'
50' 100' 150' 200' 250' 300' 350' 400' 450' 500'
50'
60'
80'
100'
%'
550' 600' 650' ºC'
TPU'polymer'
70%'TPUC'30%'Aliquat'336'
Aliquat'336'
(b)'
(a)'
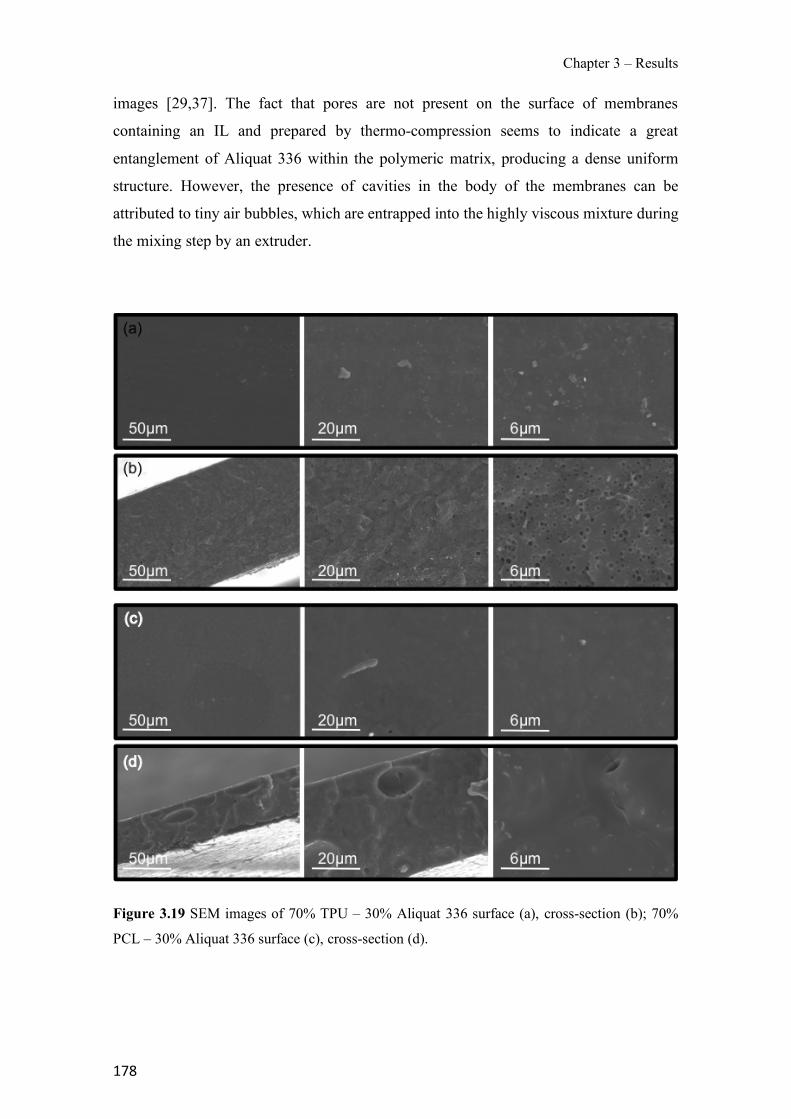
Chapter 3 – Results
178
images [29,37]. The fact that pores are not present on the surface of membranes
containing an IL and prepared by thermo-compression seems to indicate a great
entanglement of Aliquat 336 within the polymeric matrix, producing a dense uniform
structure. However, the presence of cavities in the body of the membranes can be
attributed to tiny air bubbles, which are entrapped into the highly viscous mixture during
the mixing step by an extruder.
Figure 3.19 SEM images of 70% TPU – 30% Aliquat 336 surface (a), cross-section (b); 70%
PCL – 30% Aliquat 336 surface (c), cross-section (d).
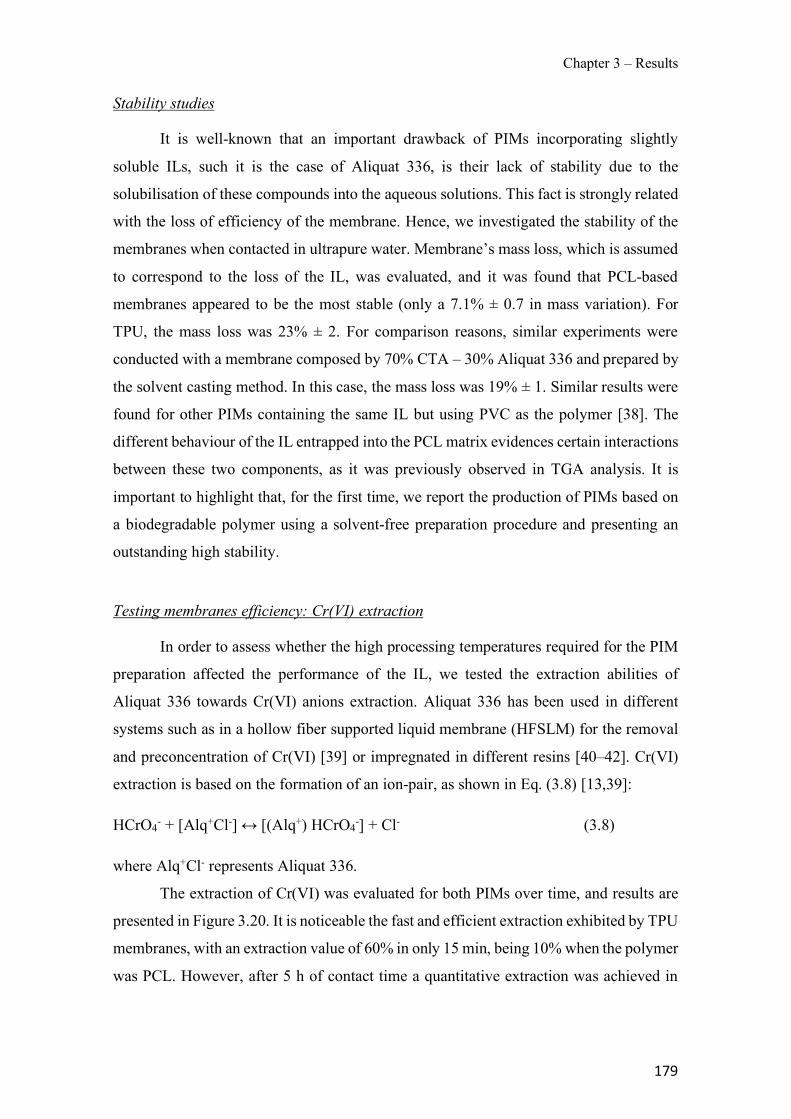
Chapter 3 – Results
179
Stability studies
It is well-known that an important drawback of PIMs incorporating slightly
soluble ILs, such it is the case of Aliquat 336, is their lack of stability due to the
solubilisation of these compounds into the aqueous solutions. This fact is strongly related
with the loss of efficiency of the membrane. Hence, we investigated the stability of the
membranes when contacted in ultrapure water. Membrane’s mass loss, which is assumed
to correspond to the loss of the IL, was evaluated, and it was found that PCL-based
membranes appeared to be the most stable (only a 7.1% ± 0.7 in mass variation). For
TPU, the mass loss was 23% ± 2. For comparison reasons, similar experiments were
conducted with a membrane composed by 70% CTA – 30% Aliquat 336 and prepared by
the solvent casting method. In this case, the mass loss was 19% ± 1. Similar results were
found for other PIMs containing the same IL but using PVC as the polymer [38]. The
different behaviour of the IL entrapped into the PCL matrix evidences certain interactions
between these two components, as it was previously observed in TGA analysis. It is
important to highlight that, for the first time, we report the production of PIMs based on
a biodegradable polymer using a solvent-free preparation procedure and presenting an
outstanding high stability.
Testing membranes efficiency: Cr(VI) extraction
In order to assess whether the high processing temperatures required for the PIM
preparation affected the performance of the IL, we tested the extraction abilities of
Aliquat 336 towards Cr(VI) anions extraction. Aliquat 336 has been used in different
systems such as in a hollow fiber supported liquid membrane (HFSLM) for the removal
and preconcentration of Cr(VI) [39] or impregnated in different resins [40–42]. Cr(VI)
extraction is based on the formation of an ion-pair, as shown in Eq. (3.8) [13,39]:
HCrO4- + [Alq+Cl-] ↔ [(Alq+) HCrO4-] + Cl- (3.8)
where Alq+Cl- represents Aliquat 336.
The extraction of Cr(VI) was evaluated for both PIMs over time, and results are
presented in Figure 3.20. It is noticeable the fast and efficient extraction exhibited by TPU
membranes, with an extraction value of 60% in only 15 min, being 10% when the polymer
was PCL. However, after 5 h of contact time a quantitative extraction was achieved in
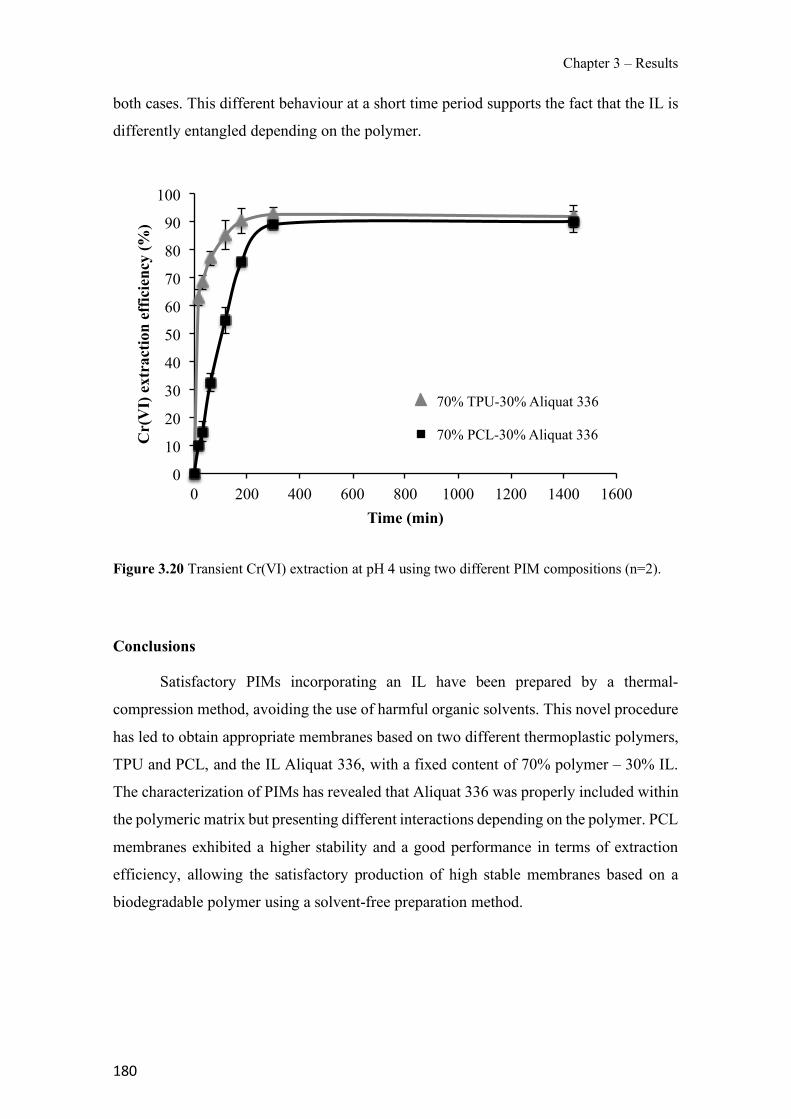
Chapter 3 – Results
180
both cases. This different behaviour at a short time period supports the fact that the IL is
differently entangled depending on the polymer.
Figure 3.20 Transient Cr(VI) extraction at pH 4 using two different PIM compositions (n=2).
Conclusions
Satisfactory PIMs incorporating an IL have been prepared by a thermal-
compression method, avoiding the use of harmful organic solvents. This novel procedure
has led to obtain appropriate membranes based on two different thermoplastic polymers,
TPU and PCL, and the IL Aliquat 336, with a fixed content of 70% polymer – 30% IL.
The characterization of PIMs has revealed that Aliquat 336 was properly included within
the polymeric matrix but presenting different interactions depending on the polymer. PCL
membranes exhibited a higher stability and a good performance in terms of extraction
efficiency, allowing the satisfactory production of high stable membranes based on a
biodegradable polymer using a solvent-free preparation method.
0
10
20
30
40
50
60
70
80
90
100
0 200 400 600 800 1000 1200 1400 1600
Cr(
VI)
ext
ract
ion
effic
ienc
y (%
)
Time (min)
70% TPU-30% Aliquat 336
70% PCL-30% Aliquat 336
Chapter 3 – Results
181
References
[1] A.K. Pabby, S.S.H. Rizvi, A.M. Sastre, Handbook of Membrane Separations:
Chemical, Pharmaceutical, Food, and Biotechnological Applications, CRC Press,
Boca Raton, 2009.
[2] R.W. Baker, Membrane Technology and Applications, 2nd ed., John Wiley &
Sons, Ltd., New York, 2004.
[3] R.L. Gardas, J.A.P. Coutinho, Group contribution methods for the prediction of
thermophysical and transport properties of ionic liquids, AIChE J. 55 (2009)
1274–1290.
[4] J. Wang, J. Luo, S. Feng, H. Li, Y. Wan, X. Zhang, Recent development of ionic
liquid membranes, Green Energy & Environ. 1 (2016) 43–61.
[5] M.I.G.S. Almeida, R.W. Cattrall, S.D. Kolev, Polymer inclusion membranes
(PIMs) in chemical analysis - A review, Anal. Chim. Acta. 987 (2017) 1–14.
[6] A. Garcia, A. Alvarez, V. Matamoros, V. Salvadó, C. Fontàs, Development of
polymer Inclusion membranes for the extraction of antibiotics from
environmental waters, Procedia Eng. 44 (2012) 804–806.
[7] A. Garcia-Rodríguez, V. Matamoros, S.D. Kolev, C. Fontàs, Development of a
polymer inclusion membrane (PIM) for the preconcentration of antibiotics in
environmental water samples, J. Memb. Sci. 492 (2015) 32–39.
[8] N. Pont, V. Salvadó, C. Fontàs, Selective transport and removal of Cd from
chloride solutions by polymer inclusion membranes, J. Memb. Sci. 318 (2008)
340–345.
[9] L. Nghiem, P. Mornane, I. Potter, J. Perera, R. Cattrall, S. Kolev, Extraction and
transport of metal ions and small organic compounds using polymer inclusion
membranes (PIMs), J. Memb. Sci. 281 (2006) 7–41.
[10] J.-P. Mikkola, P. Virtanen, R. Sjöholm, Aliquat 336®—a versatile and affordable
cation source for an entirely new family of hydrophobic ionic liquids, Green
Chem. 8 (2006) 250.
[11] Y. O’Bryan, R.W. Cattrall, Y.B. Truong, I.L. Kyratzis, S.D. Kolev, The use of
Chapter 3 – Results
182
poly(vinylidenefluoride-co-hexafluoropropylene) for the preparation of polymer
inclusion membranes. Application to the extraction of thiocyanate, J. Memb. Sci.
510 (2016) 481–488.
[12] Y. O’Bryan, Y.B. Truong, R.W. Cattrall, I.L. Kyratzis, S.D. Kolev, Electrospun
polystyrene / Aliquat 336 for preconcentration and determination of thiocyanate
in flow analysis, Electrospinning. (2017) 100–110.
[13] O. Kebiche-Senhadji, S. Tingry, P. Seta, M. Benamor, Selective extraction of
Cr(VI) over metallic species by polymer inclusion membrane (PIM) using anion
(Aliquat 336) as carrier, Desalination. 258 (2010) 59–65.
[14] A.H. Blitz-Raith, R. Paimin, R.W. Cattrall, S.D. Kolev, Separation of cobalt(II)
from nickel(II) by solid-phase extraction into Aliquat 336 chloride immobilized
in poly(vinyl chloride), Talanta. 71 (2007) 419–423.
[15] C. Fontàs, R. Tayeb, S. Tingry, M. Hidalgo, P. Seta, Transport of platinum ( IV )
through supported liquid membrane (SLM) and polymeric plasticized membrane
(PPM), J. Memb. Sci. 263 (2005) 96–102.
[16] A. Garcia-Rodríguez, C. Fontàs, V. Matamoros, M.I.G.S. Almeida, R.W. Cattrall,
S.D. Kolev, Development of a polymer inclusion membrane-based passive
sampler for monitoring of sulfamethoxazole in natural waters. Minimizing the
effect of the flow pattern of the aquatic system, Microchem. J. 124 (2016) 175–
180.
[17] M. Matsumoto, A. Panigrahi, Y. Murakami, K. Kondo, Effect of ammonium- and
phosphonium-based ionic liquids on the separation of lactic acid by supported
ionic liquid membranes (SILMs), Membranes (Basel). 1 (2011) 98–108.
[18] R. Vera, S. Insa, C. Fontàs, E. Anticó, A new extraction phase based on a polymer
inclusion membrane for the detection of chlorpyrifos, diazinon and cyprodinil in
natural water samples, Talanta. 185 (2018) 291–298.
[19] R. Güell, E. Anticó, S.D. Kolev, J. Benavente, V. Salvadó, C. Fontàs,
Development and characterization of polymer inclusion membranes for the
separation and speciation of inorganic As species, J. Memb. Sci. 383 (2011) 88–
95.
Chapter 3 – Results
183
[20] C. Fontàs, R. Vera, A. Batalla, S.D. Kolev, E. Anticó, A novel low-cost detection
method for screening of arsenic in groundwater., Environ. Sci. Pollut. Res. 21
(2014) 11682–8.
[21] C. Fontàs, I. Queralt, M. Hidalgo, Novel and selective procedure for Cr(VI)
determination by X-ray fluorescence analysis after membrane concentration,
Spectrochim. Acta - Part B At. Spectrosc. 61 (2006) 407–413.
[22] M. Li, X. Zhang, S. Zeng, L. Bai, H. Gao, J. Deng, Q. Yang, S. Zhang, Pebax-
based composite membranes with high gas transport properties enhanced by ionic
liquids for CO2 separation, RSC Adv. 7 (2017) 6422–6431.
[23] E. Ghasemi Estahbanati, M. Omidkhah, A. Ebadi Amooghin, Preparation and
characterization of novel Ionic liquid/Pebax membranes for efficient CO2/light
gases separation, J. Ind. Eng. Chem. 51 (2017) 77–89.
[24] A. Figoli, T. Marino, S. Simone, E. Di Nicolò, X.M. Li, T. He, S. Tornaghi, E.
Drioli, Towards non-toxic solvents for membrane preparation: A review, Green
Chem. 16 (2014) 4034–4059.
[25] I. González, J.I. Eguiazábal, J. Nazabal, Attaining high electrical conductivity and
toughness in PA6 by combined addition of MWCNT and rubber, Compos. Part A
Appl. Sci. Manuf. 43 (2012) 1482–1489.
[26] A. Granado, J.I. Eguiazábal, Poly(amino ether)/organoclay nanocomposites:
Preparation and characterization, J. Appl. Polym. Sci. 132 (2015) 17–20.
[27] N. Aranburu, J.I. Eguiazábal, Compatible blends of polypropylene with an
amorphous polyamide, Polym. Eng. Sci. 54 (2014) 2762–2769.
[28] U. Tayfun, M. Dogan, E. Bayramli, Effect of Surface Modification of Rice Straw
on Mechanical and Flow Properties of TPU-Based Green Composites, Polym.
Compos. 37 (2016) 1596–1602.
[29] S. Sánchez-González, N. Diban, A. Urtiaga, Hydrolytic degradation and
mechanical stability of poly(ε-Caprolactone)/reduced graphene oxide membranes
as scaffolds for in vitro neural tissue regeneration, Membranes (Basel). 8 (2018)
1–14.
Chapter 3 – Results
184
[30] J. Yan, Y. Zhang, Y. Xiao, Y. Zhang, M. Lang, Novel poly(ε-caprolactone)s
bearing amino groups: Synthesis, characterization and biotinylation, React. Funct.
Polym. 70 (2010) 400–407.
[31] R. Vera, E. Anticó, C. Fontàs, The Use of a Polymer Inclusion Membrane for
Arsenate Determination in Groundwater, Water. 10 (2018) 1093.
[32] F.W. Billmeyer, Textbook of Polymer Science, 3rd ed., Wiley, New York, 1984.
[33] A.L. Ocampo, J.C. Aguilar, E. Rodríguez de San Miguel, M. Monroy, P. Roquero,
J. de Gyves, Novel proton-conducting polymer inclusion membranes, J. Memb.
Sci. 326 (2009) 382–387.
[34] J.S. Gardner, J.O. Walker, J.D. Lamb, Permeability and durability effects of
cellulose polymer variation in polymer inclusion membranes, J. Memb. Sci. 229
(2004) 87–93.
[35] S. Kagaya, Y. Ryokan, R.W. Cattrall, S.D. Kolev, Stability studies of poly(vinyl
chloride)-based polymer inclusion membranes containing Aliquat 336 as a carrier,
Sep. Purif. Technol. 101 (2012) 69–75.
[36] R. Vera, L. Gelde, E. Anticó, M.V.M. De Yuso, J. Benavente, C. Fontàs, Tuning
physicochemical, electrochemical and transport characteristics of polymer
inclusion membrane by varying the counter-anion of the ionic liquid Aliquat 336,
J. Memb. Sci. 529 (2017) 87–94.
[37] N. Diban, S. Sánchez-González, M. Lázaro-Díez, J. Ramos-Vivas, A. Urtiaga,
Facile fabrication of poly(ε-caprolactone)/graphene oxide membranes for
bioreactors in tissue engineering, J. Memb. Sci. 540 (2017) 219–228.
[38] G. Argiropoulos, R. Cattrall, The study of a membrane for extracting gold (III)
from hydrochloric acid solutions, J. Memb. Sci. 138 (1998) 279–285
[39] R. Güell, E. Anticó, V. Salvadó, C. Fontàs, Efficient hollow fiber supported liquid
membrane system for the removal and preconcentration of Cr(VI) at trace levels,
Sep. Purif. Technol. 62 (2008) 389–393.
[40] N. Kabay, Ö. Solak, M. Arda, Ü. Topal, M. Yüksel, A. Trochimczuk, M. Streat,
Packed column study of the sorption of hexavalent chromium by novel solvent
Chapter 3 – Results
185
impregnated resins containing aliquat 336: Effect of chloride and sulfate ions,
React. Funct. Polym. 64 (2005) 75–82.
[41] B. Saha, R.J. Gill, D.G. Bailey, N. Kabay, M. Arda, Sorption of Cr(VI) from
aqueous solution by Amberlite XAD-7 resin impregnated with Aliquat 336, React.
Funct. Polym. 60 (2004) 223–244.
[42] N. Kabay, M. Arda, B. Saha, M. Streat, Removal of Cr(VI) by solvent
impregnated resins (SIR) containing aliquat 336, React. Funct. Polym. 54 (2003)
103–115.


Chapter 3 – Results
187
3.3 Novel applications of PIMs
The contents of this section are based on the following studies:
R. Vera, C. Fontàs, J. Galceran, O. Serra, E. Anticó, Polymer inclusion membrane to
access Zn speciation: Comparison with root uptake, Sci. Tot. Environ. 622-623 (2018)
316-324.
R. Vera, S. Insa, C. Fontàs, E. Anticó, A new extraction phase based on a polymer
inclusion membrane for the detection of chlorpyrifos, diazinon and cyprodinil in natural
water samples, Talanta 185 (2018) 291-298.
Chapter 3 – Results
188
3.3.1 Polymer inclusion membrane to access Zn speciation: Comparison with root
uptake
Abstract
Metal speciation studies can be performed with a new technique based on a
functionalized membrane. The estimation of not only the total amount of metal, but also
the metal available to living organisms is very important. In this context, we have
investigated the use of a polymer inclusion membrane (PIM) in a new tool for the
determination of free metal ion concentration. In order to check the usefulness of PIM
devices in metal speciation studies and metal availability to potato plants (Solanum
tuberosum), Zn has been chosen as a case study. The PIM designed for Zn transport uses
polyvinyl chloride (PVC) as polymer and di-(2-ethylhexyl) phosphoric acid (D2EHPA)
as carrier, with 0.01M nitric acid in the receiving solution. The stability of the PIM has
been demonstrated and good linearity of PIM-device fluxes (JPIM) with free metal
concentration was observed for total metal concentrations ranging from 3 µM up to 70
µM. The presence of different ligands, such as ethylenediaminetetraacetic acid (EDTA),
humic acid (HA) and citrate, greatly influences the measured JPIM because the formation
of metal complexes in the donor phase decreases the free Zn concentration in the sample.
Good correlation has been found when comparing PIM fluxes and metal accumulation in
potato plants roots in the presence of EDTA. But, the root uptake did not change when
adding citrate and HA to the hydroponic medium, so the uptake does not always follows
the Free Ion Activity Model (FIAM). These ligands might induce physiological changes
in the roots and enhance metal uptake.
Introduction
Dissolved trace metals in environmental water or in pore water of soils and
sediments can be found in numerous chemical forms or species, such as free ions, and
inorganic or organic complexes. Metal partitioning among the different forms is a
dynamic process that depends on different parameters such as type and concentration of
ligands, temperature, pH or redox conditions of the medium. It has been established that
for cationic metals, the concentration of the free, uncomplexed, metal ion is usually the
Chapter 3 – Results
189
best predictor for both metal bioaccumulation and toxicity in most aquatic systems. This
general consensus has led to the predominance of the free ion activity model (FIAM),
which postulates that the metal uptake by an organism is proportional to the free ion
concentration of the metal in the surrounding solution. FIAM relies on the internalisation
flux being limiting, rather than the supply of the metal from the solution to the surface of
the organism [1].
The biotic ligand model (BLM) is an extension of the FIAM taking into account
the competitive binding of cations and protons at the surface of the biological membrane
(i.e. the biotic ligand) [2]. Despite being extensively accepted, exemptions to these
models have also been reported, and some studies point out that in the case of higher
plants, the uptake might be favoured by the presence of organic ligands, which would
facilitate the metal uptake at the roots [3-5]. Indeed, apart from internalisation of the free
cation [6,7], other mechanisms can contribute to the uptake such as the direct
internalisation of intact metal complexes by the organism (simple diffusion across the
lipid bilayer or permeation across the lipid bilayer via a ligand transport site).
Different techniques have been developed to measure, not only metal speciation,
but also to estimate labile fractions available for organisms [8,9]. This is the case of
diffusive gradients in thin films (DGT) technique, for example, consisting of a porous gel
matrix attached to a layer of complexing cation exchange beads (Chelex 100). DGT is
nowadays widely accepted as a tool to monitor metal availability and to calculate the so-
called DGT concentrations [10,11].
Permeation liquid membrane (PLM) techniques are used for the separation and
preconcentration of target elements, which are complexed by an organic complexing
agent supported in a membrane. This membrane separates two different aqueous
solutions: the donor (also called source or feed) phase, containing the sample with the
analyte, and the acceptor (also called receiving or stripping) phase, where the analyte is
accumulated. The transport is based on liquid-liquid extraction coupled with diffusion. In
the nineties, Buffle and Parthasarathy firstly reported PLM for speciation studies as an
approach to mimic the processes of metal transport across biological membranes [12].
The metal flux across the membrane is evaluated from the variation of the metal
concentration in the acceptor solution as a function of time. Under certain conditions,
PLMs measure the free metal ion fraction [13], and PLM has been used as a reliable
sensor for free Ni concentrations down to 10−7 M as reported by Bayen et al. [14]. Pb
availability to freshwater algae was studied by comparing PLM fluxes and Pb biouptake
Chapter 3 – Results
190
fluxes [15]. Both, the simplicity of this technique and the large number of available
complexing agents render this methodology very attractive. However, a weak point is the
poor stability of the membrane due to the leaching of the organic extracting compound
into the aqueous adjacent phases [16]. This fact has seriously limited a wider use of PLM.
In this work, we explore for the first time the use of a simple device based on a
polymer inclusion membrane (PIM) to determine free ion concentrations in aqueous
samples (i.e. specifically targeting one relevant fraction of the total concentration). The
principles of this system are similar to those of PLM, since the analyte is transported
across the membrane, by means of the carrier, from the donor to the acceptor phase.
However, to increase the stability of the membrane, this carrier is entrapped within a
polymeric matrix, normally made of cellulose triacetate (CTA) or polyvinyl chloride
(PVC). The role of the polymer is to provide mechanical strength to the membrane, and
sometimes, besides these components, the addition of a plasticizer is also necessary to
improve the elasticity as well as to modify the diffusion characteristics of the membrane
[17]. This improved stability, in addition to their easy preparation, low cost, versatility,
good chemical resistance and high efficiency, had led to the use of these membranes for
separation or preconcentration purposes of different metals or organic compounds
[18,19]. PIMs made of PVC and the carrier di-(2-ethylhexyl) phosphoric acid (D2EHPA)
have been applied for the determination of the time-weighted average total concentration
of Zn [20], but its use as sensor for Zn speciation has -as far as we know- not been
described yet. The environmental relevance of this new sensor stems from the crucial
role, as stated by FIAM and BLM, of the free ion concentration on the ecotoxicological
impact of the considered element.
Zn is one of the essential trace metal micronutrients, required by plants in small
amounts for various biochemical reactions and physiological functions such as formation
of chlorophyll, photosynthesis and respiration [21,22]. Even though Zn deficiency is
more widespread than Zn toxicity, excessive Zn accumulation affects the capacity to
maintain homeostasis and can induce oxidative stress.
In this work, PIM fluxes for Zn in the absence and presence of organic ligands
forming complexes with different binding strength and charge, such as EDTA, citrate,
and humic acids, have been determined using as a donor phase a plant nutrient solution
(i.e. a hydroponic medium). Moreover, PIM fluxes have been compared with Zn uptake
by potato (Solanum tuberosum) roots under the same experimental conditions. Potato
plants were chosen for this study because (i) potato is one of the most commonly
Chapter 3 – Results
191
consumed vegetable crop worldwide, and (ii) potato plantlets were reproduced asexually
using cuttings, reducing the overall variability among samples and contributing to
increase the reproducibility of the experiment. Special attention is devoted to elucidate
whether the PIM-based sensor (in the current conditions) are determining the free Zn
concentration, rather than the total concentration or any other fraction.
Experimental
Reagents and solution
All reagents and solvents used in this study were of analytical grade. The polymer
PVC, and the acid 2-(N-morpholino) ethanesulfonic (MES) were obtained from Fluka
(Bern, Switzerland). The organic solvent, tetrahydrofuran (THF), was purchased from
Panreac (Barcelona, Spain). The carrier, D2EHPA, was provided by Sigma-Aldrich (St
Louis,Missouri, USA). For the preparation of the hydroponic solution the following
reagents, purchased from Panreac (Barcelona, Spain), were used: ammonium nitrate
(NH4NO3), boric acid (H3BO3), calcium nitrate (Ca(NO3)2·4H2O), copper sulphate
(CuSO4·5H2O), potassium nitrate (KNO3), potassium dihydrogen phosphate (KH2PO4),
sodium molybdate (Na2MoO4·2H2O), sodium hydroxide (NaOH), magnesium sulphate
heptahydrate (MgSO4·7H2O), potassium hydroxide (KOH), manganese chloride
(MnCl2·4H2O) and zinc sulphate seven hydrate (ZnSO4·7H2O). As iron source the
commercial product Kelamix Fe was used (Sicosa, Girona, Spain). Hoagland solution at
half strength, used as a nutrient solution and donor medium, is described in Table 3.17.
The pH of the solution was adjusted at 6.0 ± 0.1 using 2.5 mM MES. Suprapur grade
nitric acid (HNO3) was obtained from Panreac (Barcelona, Spain). Organic ligands such
as L-histidine monohydrochloride monohydrate, humic acids sodium salt (HA, used as
received), ethylenediaminetetraacetic acid (EDTA) were provided by Sigma-Aldrich (St
Louis, Missouri, USA) and sodium citrate (Na3C6H5O7·H2O) was obtained from Scharlau
(Barcelona, Spain). Propidium iodide (PI) and Fluorescein di-acetate (FDA) stains were
obtained from Sigma and Invitrogen (Thermo Fisher, Waltham, Massachusetts, USA).
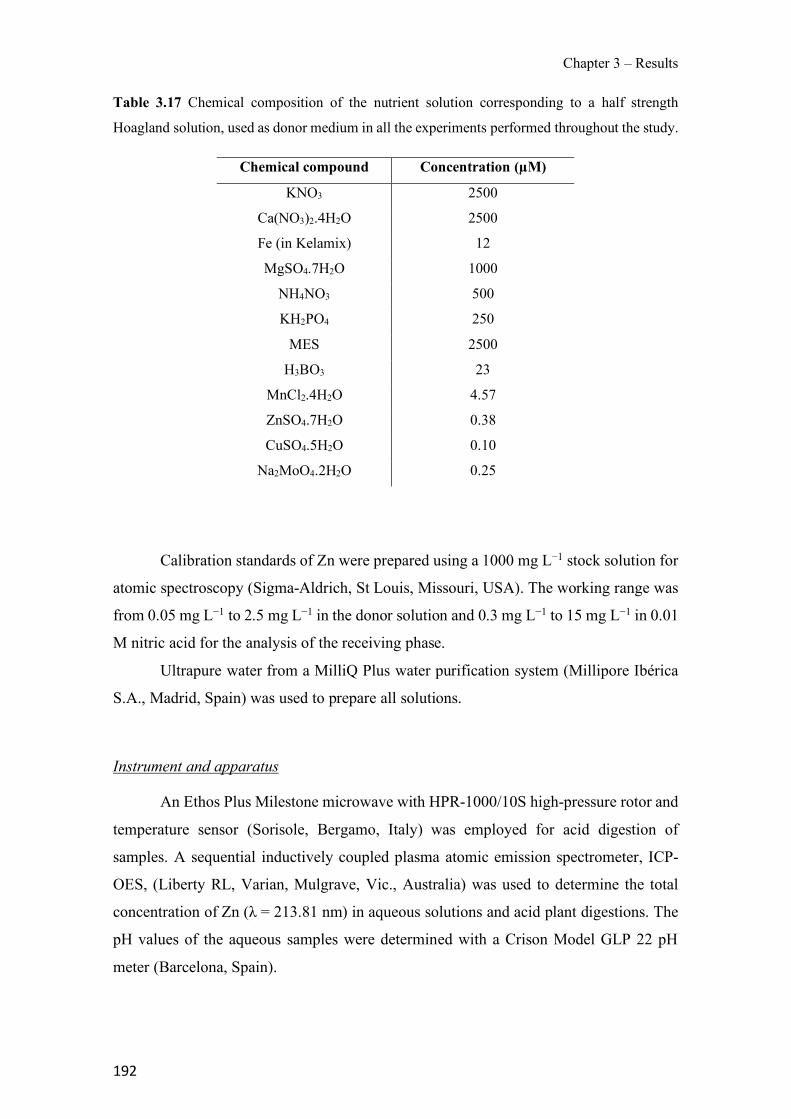
Chapter 3 – Results
192
Table 3.17 Chemical composition of the nutrient solution corresponding to a half strength
Hoagland solution, used as donor medium in all the experiments performed throughout the study.
Chemical compound Concentration (µM)
KNO3 2500
Ca(NO3)2.4H2O 2500
Fe (in Kelamix) 12
MgSO4.7H2O 1000
NH4NO3 500
KH2PO4 250
MES 2500
H3BO3 23
MnCl2.4H2O 4.57
ZnSO4.7H2O 0.38
CuSO4.5H2O 0.10
Na2MoO4.2H2O 0.25
Calibration standards of Zn were prepared using a 1000 mg L−1 stock solution for
atomic spectroscopy (Sigma-Aldrich, St Louis, Missouri, USA). The working range was
from 0.05 mg L−1 to 2.5 mg L−1 in the donor solution and 0.3 mg L−1 to 15 mg L−1 in 0.01
M nitric acid for the analysis of the receiving phase.
Ultrapure water from a MilliQ Plus water purification system (Millipore Ibérica
S.A., Madrid, Spain) was used to prepare all solutions.
Instrument and apparatus
An Ethos Plus Milestone microwave with HPR-1000/10S high-pressure rotor and
temperature sensor (Sorisole, Bergamo, Italy) was employed for acid digestion of
samples. A sequential inductively coupled plasma atomic emission spectrometer, ICP-
OES, (Liberty RL, Varian, Mulgrave, Vic., Australia) was used to determine the total
concentration of Zn (λ = 213.81 nm) in aqueous solutions and acid plant digestions. The
pH values of the aqueous samples were determined with a Crison Model GLP 22 pH
meter (Barcelona, Spain).
Chapter 3 – Results
193
Fluorescent root plant images were obtained using an epifluorescence BX-41
Olympus microscope that was connected to a DP-73 Olympus digital camera (Olympus,
Tokyo, Japan).
Membrane preparation
PIMs were prepared by dissolving 400 mg of PVC in 12 mL of THF and the
resulting mixture was stirred for 2 h. Later on, the appropriate amount of carrier D2EHPA
(from a 0.5 M D2EHPA solution in THF) was added to the corresponding polymeric
solution and stirred again for 1 h in order to obtain the final membrane composition of
70% PVC – 30% D2EHPA or 60% PVC – 40% D2EHPA (% in mass). Finally, the
resulting mixture was poured out into a 9.0 cm diameter flat bottom glass petri dish, which
was set horizontally and covered loosely. The organic solvent was allowed to evaporate
during 24 h at room temperature, and the resulting film (of an approximate thickness of
55 µm) was afterward carefully peeled off from the bottom of the petri dish.
Reproducibility of the PIM preparation was routinely checked by means of total weight,
IR spectroscopy and thickness measurements.
PIM-device experiments
The designed device (see Figure 3.21), with similarities to those previously
reported [20,23] consists of a glass tube with two openings, one at the top (0.9 cm
diameter) and another one at the bottom (1.8 cm diameter). The PIM was placed at the
bottom opening (1.75 cm2) and fixed with a screw cap. The opening at the top was closed
with a standard screw cap and was used to fill the device with 5 mL of receiving solution.
To carry out the experiments using this device, 250 mL of donor nutrient solution spiked
with zinc (and organic ligands when indicated) were poured into a glass beaker placed on
a magnetic stirrer. The device incorporating the membrane and receiving solution (5 mL
0.01 M HNO3) was immersed 1 cm in the donor nutrient solution in a vertical position
under stirring conditions. After the deployment period, the device was removed from the
solution and the receiving solution was taken for analysis. The final concentration in the
donor solution was also checked in order to verify that no depletion took place.
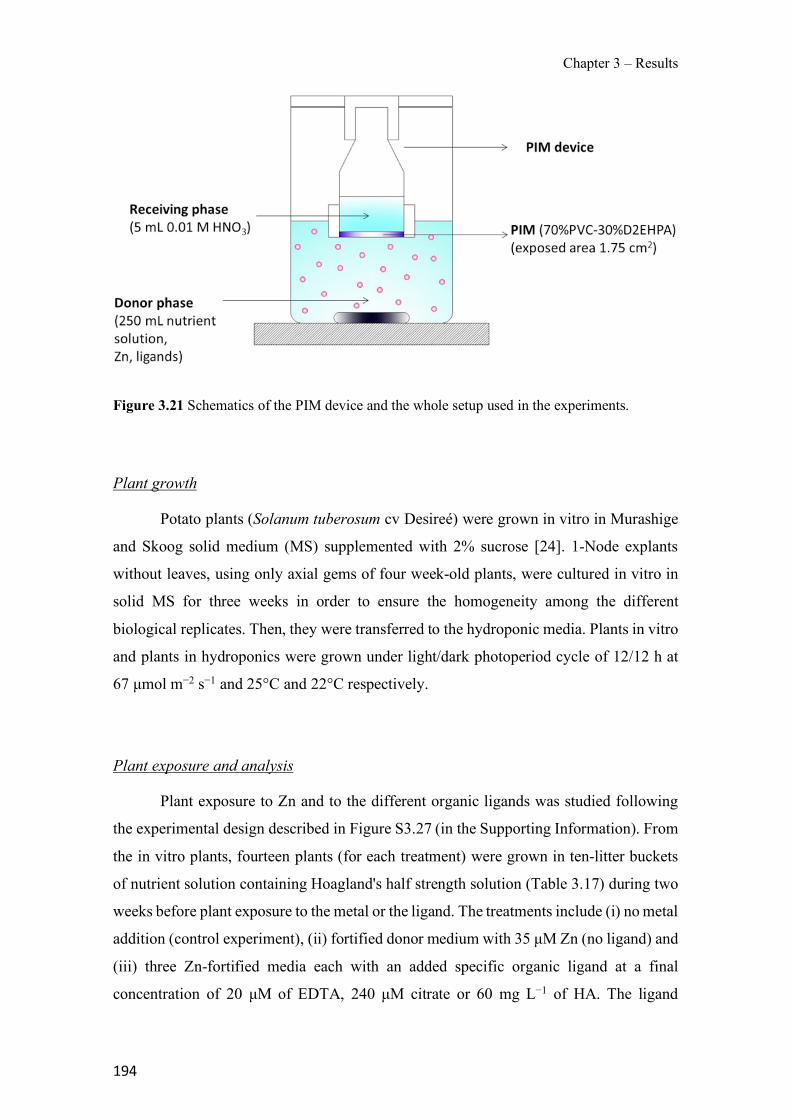
Chapter 3 – Results
194
Figure 3.21 Schematics of the PIM device and the whole setup used in the experiments.
Plant growth
Potato plants (Solanum tuberosum cv Desireé) were grown in vitro in Murashige
and Skoog solid medium (MS) supplemented with 2% sucrose [24]. 1-Node explants
without leaves, using only axial gems of four week-old plants, were cultured in vitro in
solid MS for three weeks in order to ensure the homogeneity among the different
biological replicates. Then, they were transferred to the hydroponic media. Plants in vitro
and plants in hydroponics were grown under light/dark photoperiod cycle of 12/12 h at
67 µmol m−2 s−1 and 25°C and 22°C respectively.
Plant exposure and analysis
Plant exposure to Zn and to the different organic ligands was studied following
the experimental design described in Figure S3.27 (in the Supporting Information). From
the in vitro plants, fourteen plants (for each treatment) were grown in ten-litter buckets
of nutrient solution containing Hoagland's half strength solution (Table 3.17) during two
weeks before plant exposure to the metal or the ligand. The treatments include (i) no metal
addition (control experiment), (ii) fortified donor medium with 35 µM Zn (no ligand) and
(iii) three Zn-fortified media each with an added specific organic ligand at a final
concentration of 20 µM of EDTA, 240 µM citrate or 60 mg L−1 of HA. The ligand
Chapter 3 – Results
195
concentrations for this study were selected so that, for a total Zn concentration of 35 µM,
similar free Zn concentrations were reached in all treatments. Plants were exposed for a
period of 48 h. After that, plants were removed from buckets and carefully dipped into
cold water for 30 s prior to rinsing them with a 5 mM Pb(NO3)2 solution (Panreac,
Barcelona, Spain) to remove Zn from the surface of the roots. Finally, plants were dried
in an oven at 60 °C for 5 days [3,25]. Pools of roots from 4 plants were cut into small
pieces, dried and weighted before microwave acid digestion. Then, they were transferred
to PTFE vessels and digested with 8 mL of nitric acid of suprapure grade (69%) and 2
mL of hydrogen peroxide (30%). The vessels were closed and heated into the microwave
following a digestion program consisting of a first step of 5 min to reach 180°C and then
10 min at 180°C. After cooling, digested sample solutions were transferred to a 30 mL
flask and brought to volume with ultrapure de-ionized water prior to ICP-OES analysis.
Vital staining of roots
Once the different exposures were finished, a pool of three plants were removed
from the buckets and their roots were cut and transferred directly to an aqueous solution
containing 5 µg mL−1 of PI and 2 µg mL−1 of FDA for 15–30 min. The roots were then
rinsed twice with water, and mounted on a microscope slide which was subsequently
submerged in water [26]. The samples were viewed within 15 min from the staining with
a BX-41 Olympus microscope that was connected to a DP-73 Olympus digital camera.
For FDA detection, we used the excitation filter B (excitation at 475 nm and emission at
515 nm using a long path filter). For PI detection, we used the excitation filter G
(excitation at 530 nm and emission at 610 nm). The same specimen was analysed
separately at wavelengths specific to each stain and the two images were merged to give
the final image.
Results and discussion
Evaluation of the PIM system
When speciation is of interest, the test sample composition should not be
modified, and, in particular, the decrease in analyte concentration in the source solution
due to membrane extraction should be negligible (i.e. no depletion of the analyte test
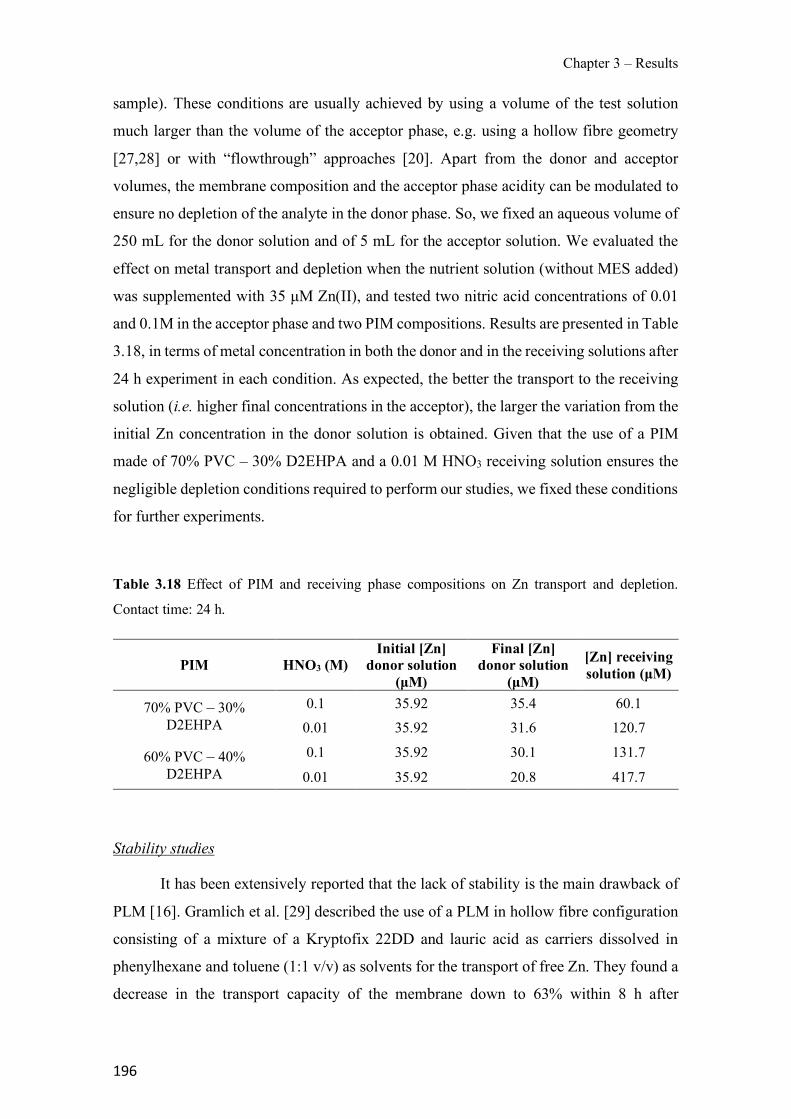
Chapter 3 – Results
196
sample). These conditions are usually achieved by using a volume of the test solution
much larger than the volume of the acceptor phase, e.g. using a hollow fibre geometry
[27,28] or with “flowthrough” approaches [20]. Apart from the donor and acceptor
volumes, the membrane composition and the acceptor phase acidity can be modulated to
ensure no depletion of the analyte in the donor phase. So, we fixed an aqueous volume of
250 mL for the donor solution and of 5 mL for the acceptor solution. We evaluated the
effect on metal transport and depletion when the nutrient solution (without MES added)
was supplemented with 35 µM Zn(II), and tested two nitric acid concentrations of 0.01
and 0.1M in the acceptor phase and two PIM compositions. Results are presented in Table
3.18, in terms of metal concentration in both the donor and in the receiving solutions after
24 h experiment in each condition. As expected, the better the transport to the receiving
solution (i.e. higher final concentrations in the acceptor), the larger the variation from the
initial Zn concentration in the donor solution is obtained. Given that the use of a PIM
made of 70% PVC – 30% D2EHPA and a 0.01 M HNO3 receiving solution ensures the
negligible depletion conditions required to perform our studies, we fixed these conditions
for further experiments.
Table 3.18 Effect of PIM and receiving phase compositions on Zn transport and depletion.
Contact time: 24 h.
PIM HNO3 (M) Initial [Zn]
donor solution (µM)
Final [Zn] donor solution
(µM)
[Zn] receiving solution (µM)
70% PVC – 30% D2EHPA
0.1 35.92 35.4 60.1
0.01 35.92 31.6 120.7
60% PVC – 40% D2EHPA
0.1 35.92 30.1 131.7
0.01 35.92 20.8 417.7
Stability studies
It has been extensively reported that the lack of stability is the main drawback of
PLM [16]. Gramlich et al. [29] described the use of a PLM in hollow fibre configuration
consisting of a mixture of a Kryptofix 22DD and lauric acid as carriers dissolved in
phenylhexane and toluene (1:1 v/v) as solvents for the transport of free Zn. They found a
decrease in the transport capacity of the membrane down to 63% within 8 h after
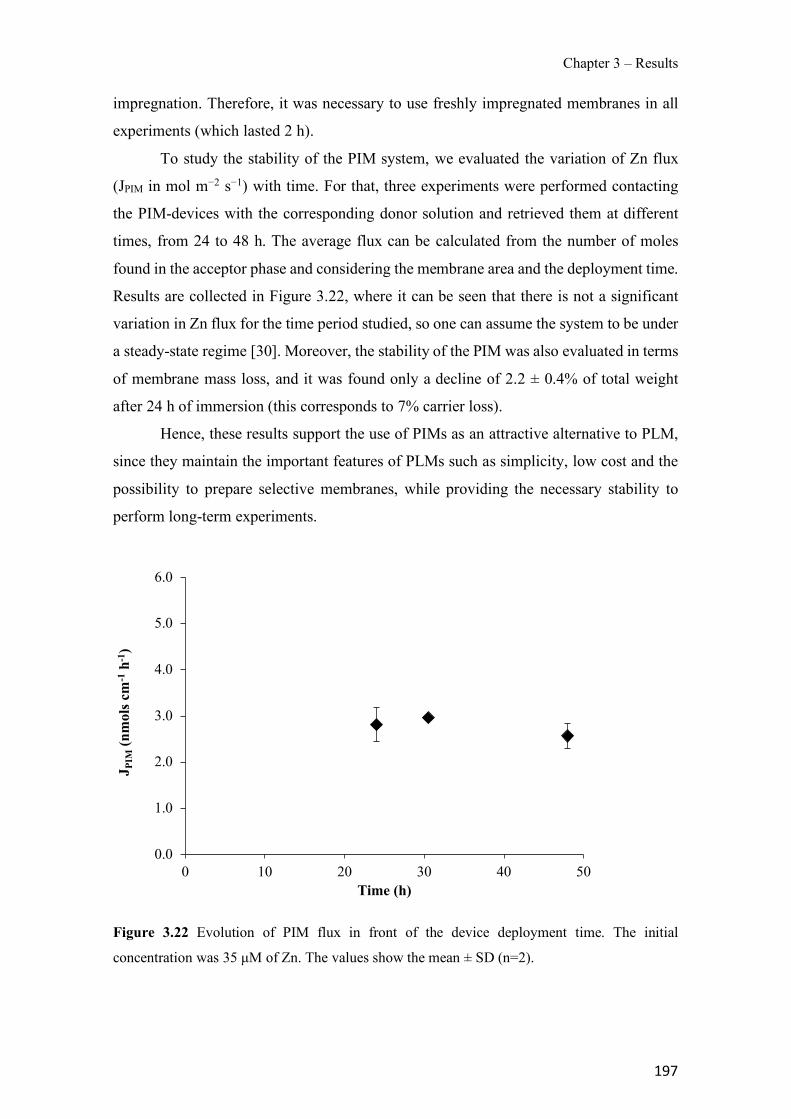
Chapter 3 – Results
197
impregnation. Therefore, it was necessary to use freshly impregnated membranes in all
experiments (which lasted 2 h).
To study the stability of the PIM system, we evaluated the variation of Zn flux
(JPIM in mol m−2 s−1) with time. For that, three experiments were performed contacting
the PIM-devices with the corresponding donor solution and retrieved them at different
times, from 24 to 48 h. The average flux can be calculated from the number of moles
found in the acceptor phase and considering the membrane area and the deployment time.
Results are collected in Figure 3.22, where it can be seen that there is not a significant
variation in Zn flux for the time period studied, so one can assume the system to be under
a steady-state regime [30]. Moreover, the stability of the PIM was also evaluated in terms
of membrane mass loss, and it was found only a decline of 2.2 ± 0.4% of total weight
after 24 h of immersion (this corresponds to 7% carrier loss).
Hence, these results support the use of PIMs as an attractive alternative to PLM,
since they maintain the important features of PLMs such as simplicity, low cost and the
possibility to prepare selective membranes, while providing the necessary stability to
perform long-term experiments.
Figure 3.22 Evolution of PIM flux in front of the device deployment time. The initial
concentration was 35 µM of Zn. The values show the mean ± SD (n=2).
0.0
1.0
2.0
3.0
4.0
5.0
6.0
0 10 20 30 40 50
J PIM
(nm
ols c
m-1
h-1)
Time (h)
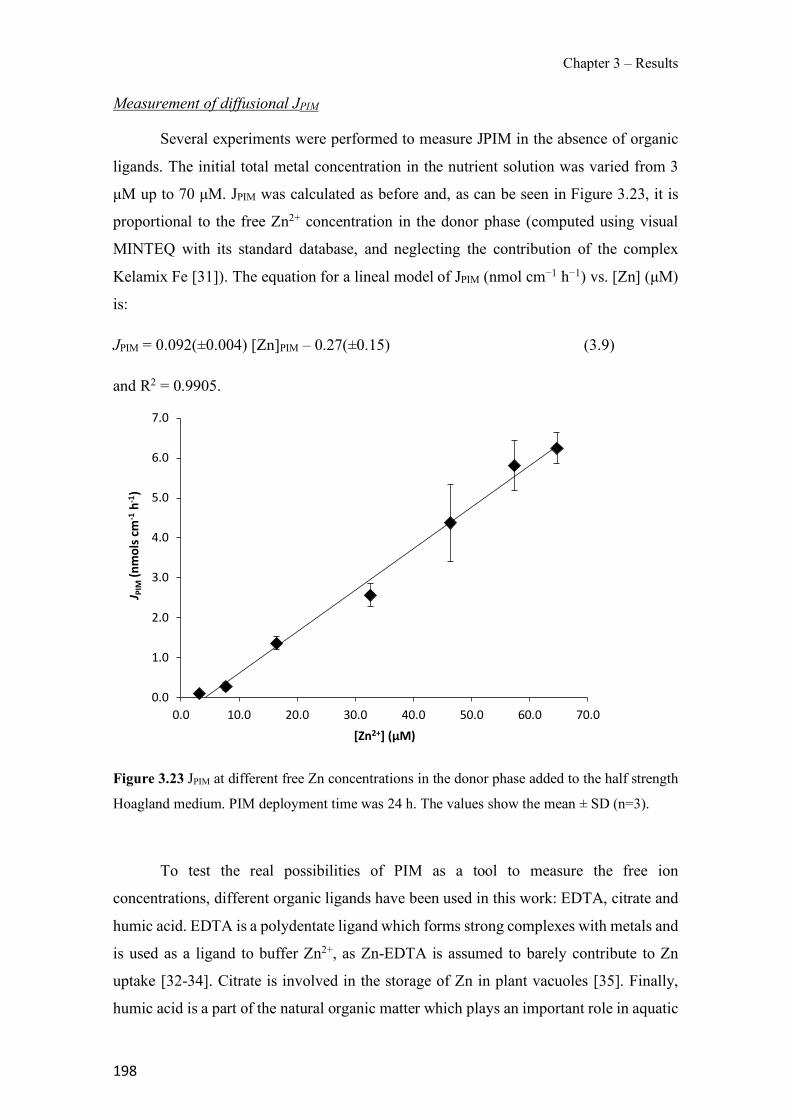
Chapter 3 – Results
198
Measurement of diffusional JPIM
Several experiments were performed to measure JPIM in the absence of organic
ligands. The initial total metal concentration in the nutrient solution was varied from 3
µM up to 70 µM. JPIM was calculated as before and, as can be seen in Figure 3.23, it is
proportional to the free Zn2+ concentration in the donor phase (computed using visual
MINTEQ with its standard database, and neglecting the contribution of the complex
Kelamix Fe [31]). The equation for a lineal model of JPIM (nmol cm−1 h−1) vs. [Zn] (µM)
is:
JPIM = 0.092(±0.004) [Zn]PIM – 0.27(±0.15) (3.9)
and R2 = 0.9905.
Figure 3.23 JPIM at different free Zn concentrations in the donor phase added to the half strength
Hoagland medium. PIM deployment time was 24 h. The values show the mean ± SD (n=3).
To test the real possibilities of PIM as a tool to measure the free ion
concentrations, different organic ligands have been used in this work: EDTA, citrate and
humic acid. EDTA is a polydentate ligand which forms strong complexes with metals and
is used as a ligand to buffer Zn2+, as Zn-EDTA is assumed to barely contribute to Zn
uptake [32-34]. Citrate is involved in the storage of Zn in plant vacuoles [35]. Finally,
humic acid is a part of the natural organic matter which plays an important role in aquatic
0.0
1.0
2.0
3.0
4.0
5.0
6.0
7.0
0.0 10.0 20.0 30.0 40.0 50.0 60.0 70.0
J PIM
(nm
ols c
m-1
h-1)
[Zn2+] (μM)
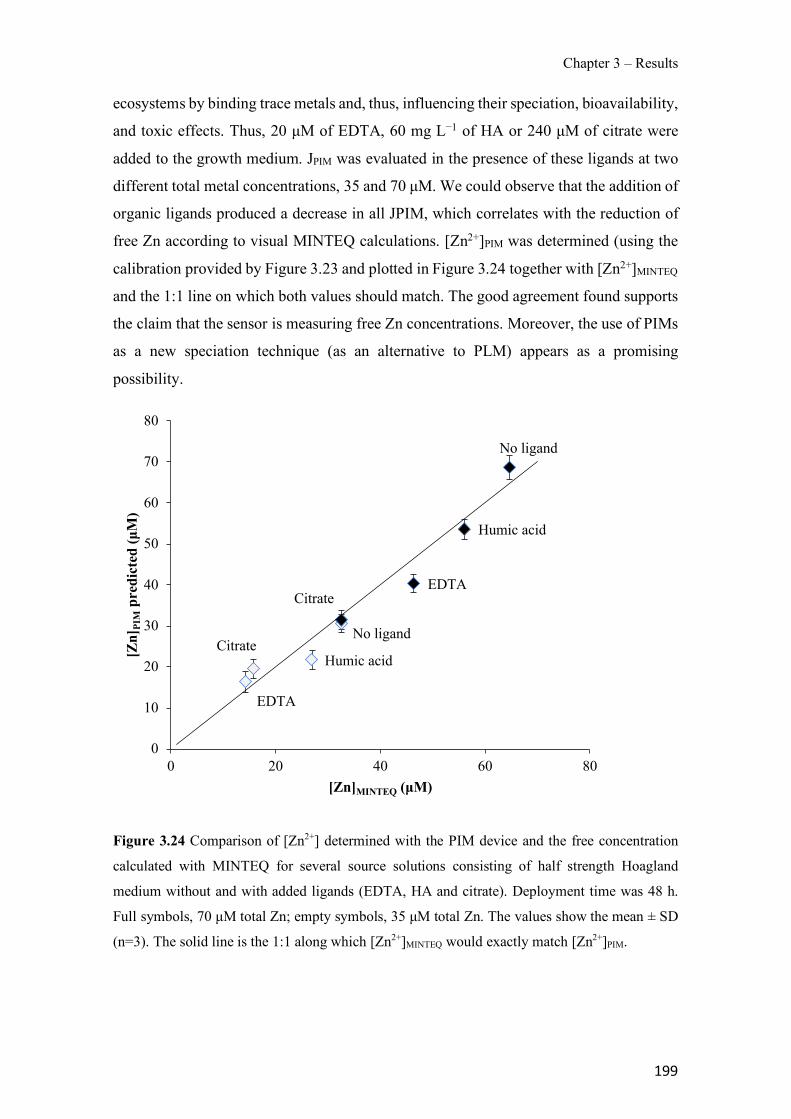
Chapter 3 – Results
199
ecosystems by binding trace metals and, thus, influencing their speciation, bioavailability,
and toxic effects. Thus, 20 µM of EDTA, 60 mg L−1 of HA or 240 µM of citrate were
added to the growth medium. JPIM was evaluated in the presence of these ligands at two
different total metal concentrations, 35 and 70 µM. We could observe that the addition of
organic ligands produced a decrease in all JPIM, which correlates with the reduction of
free Zn according to visual MINTEQ calculations. [Zn2+]PIM was determined (using the
calibration provided by Figure 3.23 and plotted in Figure 3.24 together with [Zn2+]MINTEQ
and the 1:1 line on which both values should match. The good agreement found supports
the claim that the sensor is measuring free Zn concentrations. Moreover, the use of PIMs
as a new speciation technique (as an alternative to PLM) appears as a promising
possibility.
Figure 3.24 Comparison of [Zn2+] determined with the PIM device and the free concentration
calculated with MINTEQ for several source solutions consisting of half strength Hoagland
medium without and with added ligands (EDTA, HA and citrate). Deployment time was 48 h.
Full symbols, 70 µM total Zn; empty symbols, 35 µM total Zn. The values show the mean ± SD
(n=3). The solid line is the 1:1 along which [Zn2+]MINTEQ would exactly match [Zn2+]PIM.
No ligand
EDTA
Humic acidCitrate
No ligand
EDTA
Humic acid
Citrate
0
10
20
30
40
50
60
70
80
0 20 40 60 80
[Zn]
PIM
pred
icte
d (µ
M)
[Zn]MINTEQ (µM)

Chapter 3 – Results
200
Modelling the flux of Zn
Separation by means of functionalized membranes is based on the chemical
affinity of the target compound towards the ligand or functional group existing inside the
membrane. In both, PLMs and PIMs, an appropriate carrier is added to the membrane to
interact with the analyte, Zn2+ in this study. For this work, the extraction reaction of the
metal by D2EHPA (denoted as HL) can be described with the following equilibrium
reaction [36]:
Zn2+(aq) + 3/2 (HL)2(mem) ⇌ ZnL2·HL (mem)+ 2H+(aq) (3.10)
Taking into account our current data and similarly to existing literature on PLM
[16], a simple model can be derived from the following hypotheses:
A) Equilibrium at both interfaces.
For the Donor/membrane (indicated as superscript D/m) interface
(3.11)
while for the membrane/Acceptor (indicated as superscript m/A) interface
(3.12)
All concentrations in these section are expressed in mol m-3.
B) diffusion co-limitation of the fluxes, both in the membrane
(3.13)
(where is the thickness of the membrane, in m, and is the diffusion coefficient,
in m2 s-1, of the complexed carrier inside the membrane) and in the Acceptor solution
(3.14)
[ ] ( )( )( )
2D/mD/m2
3/2 D/mD/m 22
ZnL ·HL H
HL ZnK
+
+
é ùë û=
é ùé ùë û ë û
[ ] ( )( )( )
2m/Am/A2
3/2 m/Am/A 22
ZnL ·HL H
HL ZnK
+
+
é ùë û=
é ùé ùë û ë û
[ ] [ ]( )2
mD/m m/AZnL ·HLm
2 2ZnL ·HL ZnL ·HLD
J = -!!
2
mZnL ·HLD
( )2 m/AA ZnA Zn 0
DJ
d+ +é ù= -ë û
Chapter 3 – Results
201
(where is the thickness of the diffusion layer in the Acceptor and is the diffusion
coefficient of free Zn ion there).
C) Given that the presence of labile ligands (see Figure 3.24) does not relevantly increase
JPIM (but rather JPIM is proportional to the free Zn concentration), we assume that there
is no limitation by diffusion in the Donor solution
(3.15) where superscript * indicate the bulk concentration of the sample. This also leads to
(3.16) D) Steady state is assumed taking into account the lack of variation of JPIM seen in Figure
3.22. In steady-state regime, all fluxes of Zn (be it complexed or free) have to be equal
to the resulting flux
(3.17)
Simple algebra using previous assumptions leads to
(3.18)
In general, and are not constant, but depend on the
loading of Zn, because of the balance of ligand, e.g. at interface Donor/membrane,
(3.19) where cT,L stands for the total D2EHPA (monomer) concentration inside the membrane.
Ad 2ZnD +
D/m *2 2Zn Zn+ +é ù é ù»ë û ë û
D/m *+ +H Hé ù é ù»ë û ë û
m APIMJ J J= =
( )( )( )( )( )( )
2
2
3/2D/m
2
2*
*2PIM 3/2m/A
A2 Zn
2m Am/AZnL ·HL
HL
HZn
HL
H
K
JK D
D d+
+
+
+
é ùë û
é ùë ûé ù= ë û
é ùë û+
é ùë û
!
( ) D/m
2HLé ùë û ( ) m/A
2HLé ùë û
( ) [ ]D/m D/m2 T,L2
2 HL 3 ZnL ·HL cé ù´ + ´ =ë û
Chapter 3 – Results
202
Given the observed linear relationship between flux and free concentrations, we
consider “excess of ligand” conditions, i.e. the amount of Zn bound to the carrier is
approximately constant:
(3.20)
Considering the fast diffusion of protons and their huge concentration (in
comparison to Zn)-, one can take
With these considerations, Eq. (3.18) simplifies to
(3.21)
This expression justifies:
i) the linearity of the steady-state flux with free Zn concentration (Figures 3.23 and
3.24) and the lack of impact of labile complexes present in the donor solution. This
proportionality is reflected in Eq. (3.9), where the non-null intercept can be attributed
to experimental uncertainty as well as to the system having an initial transient regime
not considered in Eq. (3.21);
ii) higher fluxes when the acceptor is more acidic, i.e. higher [H+]A (in Table 3.18, for
instance, in the case of 30% D2EHPA, compare the final accumulated [Zn2+] in the
acceptor around 121 µM for 0.1 M HNO3 with [Zn2+] around 60 µM for 0.01M HNO3)
and
iii) higher fluxes are expected for higher total carrier concentrations, i.e. higher cT,L (in
Table 3.18, for instance, in the case of 0.01M HNO3, compare the final accumulated
[Zn2+] around 132 µM for 40% D2EHPA with [Zn] around 60 µM for 30% D2EHPA).
Apart from limitation by diffusion in both the membrane and in the acceptor
solutions (as underlying Eq. (3.21)), the accumulation rate of the analyte might be
( ) ( )D/m m/AT,L2 2
HL HL2c
é ù é ù» »ë û ë û
m/A AH H+ +é ù é ù»ë û ë û
( )( )( )( )
2
2
3/2
T,L2*
*2PIM 3/2 A
T,L Zn2m AA
ZnL ·HL
/ 2
HZn
/ 2
H
K c
JK c D
D d+
+
+
+
é ùë ûé ù» ë û
+é ùë û
!

Chapter 3 – Results
203
affected by other processes such as interfacial kinetics (which could become critical for
low concentrations of carrier), but this is not considered here given some previous
reported results with PIM [37,38] and given that the model agrees with our current data.
Further experiments varying the membrane thickness and the carrier ligand
concentration over a range of values [39], can confirm or discard the present model and
experimentally tune the PIM to probe the free fraction or others (such a labile one).
Toxicity of the ligands for the roots
According to the FIAM paradigm, biological fluxes are directly proportional to
free metal ion concentrations rather than to the total ones [40]. This assumption has been
tested using living organisms such as freshwater algae [15,41], microalgae [42] or wheat
plants in hydroponics media [43]. Alternatively, fluxes measured with the different
speciation techniques (PLM, DGT) have also been correlated with metal bioavailability
in some systems [44]. However, it is essential to take into account the intrinsic metal and
ligand toxicity before biological fluxes are measured. It has been described that metal
chelates at higher concentrations may damage roots, which in turn affects metal uptake
[32].
So, we performed viability analyses of the roots of potato plants growing in the
different donor solution media with 35 µM Zn and supplemented with the different
ligands. Distinction between viable and inviable cells was performed through a double
fluorescent staining procedure. FDA is cleaved by esterases present in living cells and
fluoresces green after it is cleaved. On the other hand, PI fluoresces red in the nuclei of
dead cells. PI also stains most of the cell walls, viable or inviable, which means that PI
staining sometimes overlaps FDA staining and appears yellow. In potato plants, young
lateral roots are viable when no treatment is applied (Figure 3.25 a) and all the root tips
assessed presented green colour. When 35 µM metal content was supplemented in the
donor solution, roots succeeded in being stained with FDA and a green colour was
obtained in root tips (Figure 3.25 b). Likewise, in treatments where 35 µM metal content
and either EDTA, HA or citrate were applied as ligands, cells were metabolically active
and thus, green colour was also predominant (Figure 3.25 c–e). Lateral roots treated with
the same amount of Zn and histidine ligand, failed to stain with FDA, but were stained
with PI (red), suggesting that the cells die as a consequence of the treatment (see Figure
3.25f). Therefore, measurements with histidine as a ligand were not reported in
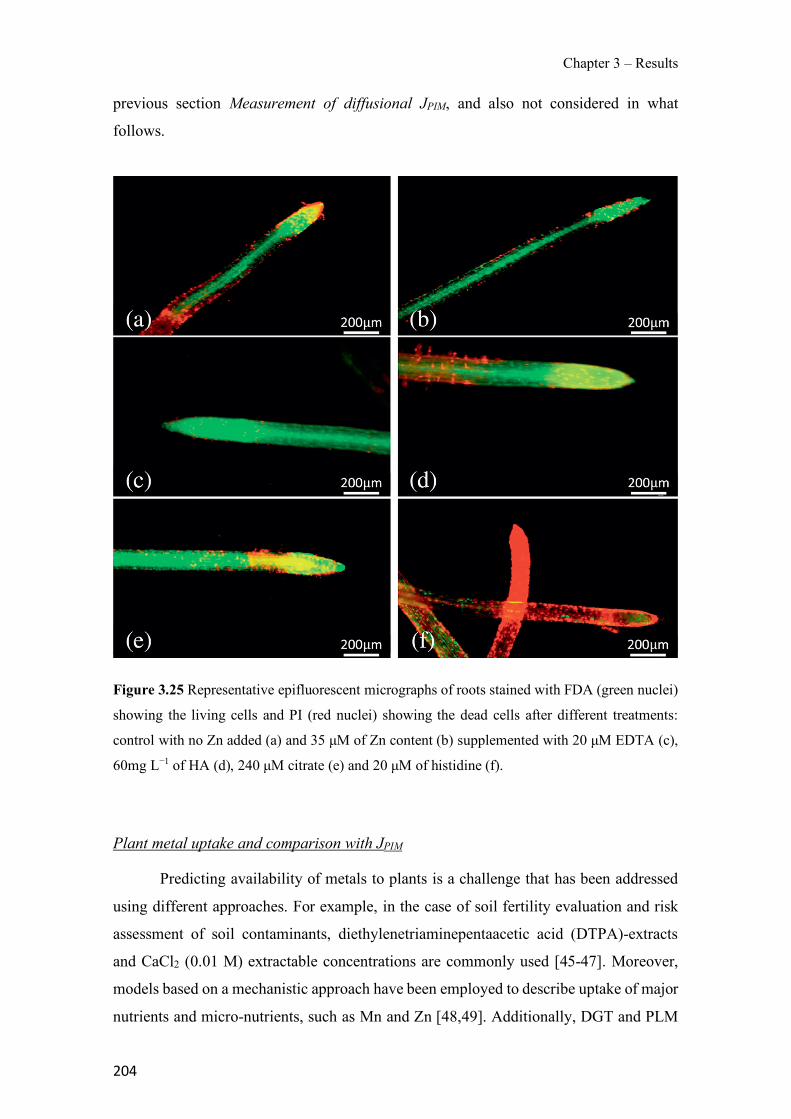
Chapter 3 – Results
204
previous section Measurement of diffusional JPIM, and also not considered in what
follows.
Figure 3.25 Representative epifluorescent micrographs of roots stained with FDA (green nuclei)
showing the living cells and PI (red nuclei) showing the dead cells after different treatments:
control with no Zn added (a) and 35 µM of Zn content (b) supplemented with 20 µM EDTA (c),
60mg L−1 of HA (d), 240 µM citrate (e) and 20 µM of histidine (f).
Plant metal uptake and comparison with JPIM
Predicting availability of metals to plants is a challenge that has been addressed
using different approaches. For example, in the case of soil fertility evaluation and risk
assessment of soil contaminants, diethylenetriaminepentaacetic acid (DTPA)-extracts
and CaCl2 (0.01 M) extractable concentrations are commonly used [45-47]. Moreover,
models based on a mechanistic approach have been employed to describe uptake of major
nutrients and micro-nutrients, such as Mn and Zn [48,49]. Additionally, DGT and PLM
Chapter 3 – Results
205
techniques have been suggested as tools to predict metal bioavailability and different
studies have been reported. The limiting transport steps in PLMs and biological plasma
membranes have been compared [16,50]. Despite being the transport processes in the test
solution almost identical for living organisms and PLM setup, the size and geometry of
the systems clearly differ. Also, relevant differences may arise in the transport steps at
the water membrane interface or inside the membrane, despite being conceptually similar
processes: the nature of the binding sites is different, multistep processes usually account
for the transport in biological membranes, and passive diffusion of lipophilic complexes
is differently affected by the viscosity and other physical parameters. In any case, PLM
has been used to test the FIAM model, and considering the advantages of PIMs compared
to PLM, we have performed a series of experiments devoted to compare JPIM with fluxes
in plant roots. Thus, the accumulated Zn in the roots was measured and “normalized”
fluxes (Jroot) were computed by using the dry weight of the roots instead of an area. Zn
fluxes obtained were in the range 0.56 ± 0.05–1.10 ± 0.05 nmol mg−1 h−1. A control
experiment with no Zn supplementation, showed also some metal uptake (0.12 ± 0.02
nmol mg−1 h−1) due to the presence of just a trace amount of Zn in the donor solution.
The normalized biological fluxes are shown in Figure 3.26 for the different
treatments. An ANOVA test was performed and significant differences (p = 1.92 × 10⁻¹⁰)
were found among the treatments. As can be seen, in the treatment with EDTA, the
obtained root plant uptake was lower compared to the treatment without ligand, which
supports that the total concentration of Zn in the solution is not the best indicator for
uptake. This tendency can also be observed in Figure S3.28 (Supporting Information),
where normalized Jroot-values are represented in front of JPIM. In the presence of HA and
citrate, the found root fluxes are practically identical to the fluxes without ligand. Similar
results for citrate were found by other authors [3] and were attributed to the high lability
and mobility of these metal-organic complexes that dissociate in the vicinity of the root
surface. The direct uptake of undissociated complexes has also been reported. In these
situations, FIAM would not apply (i.e. the uptake is not proportional to the free
concentration).
In the case of HA, we have observed the formation of lateral roots (Figure S3.29
in the Supporting Information), which in turn would increase the exchange area and
would yield a metal uptake higher than expected. Moreover, the adsorption of humic
substances into biological surfaces can increase their negative surface charge and, thus,
enhance their overall electrostatic attraction for cations [6]. The increase of cell
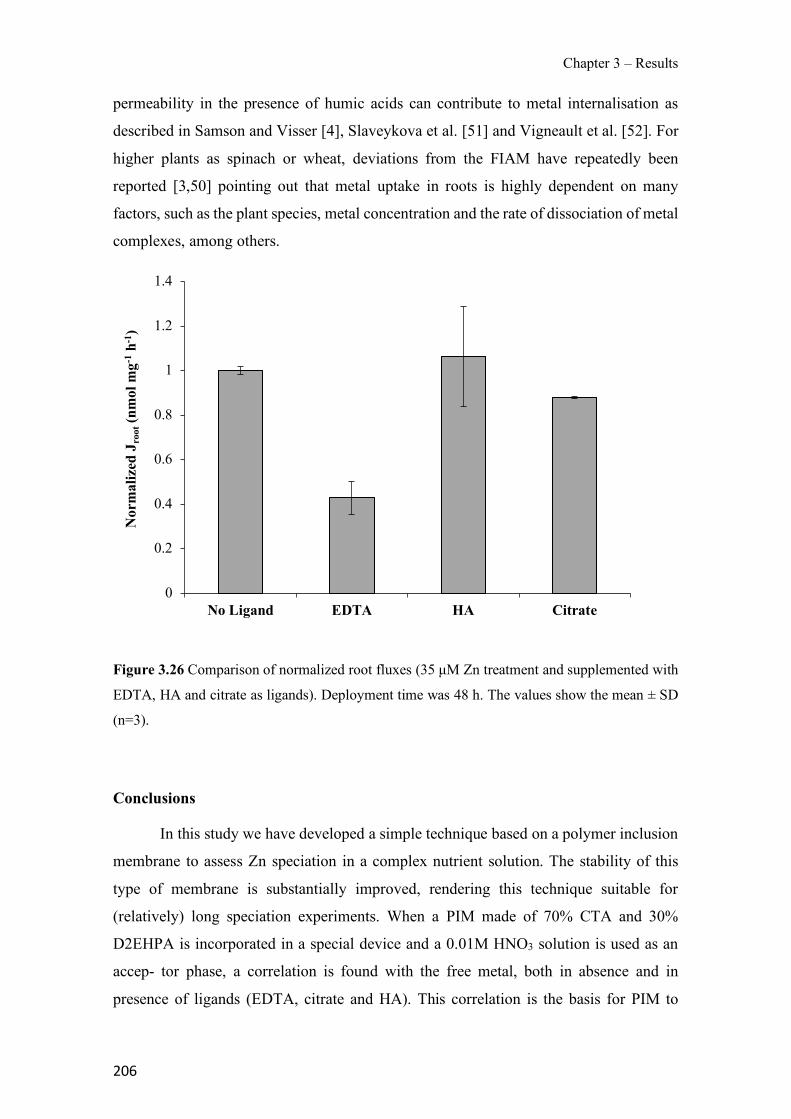
Chapter 3 – Results
206
permeability in the presence of humic acids can contribute to metal internalisation as
described in Samson and Visser [4], Slaveykova et al. [51] and Vigneault et al. [52]. For
higher plants as spinach or wheat, deviations from the FIAM have repeatedly been
reported [3,50] pointing out that metal uptake in roots is highly dependent on many
factors, such as the plant species, metal concentration and the rate of dissociation of metal
complexes, among others.
Figure 3.26 Comparison of normalized root fluxes (35 µM Zn treatment and supplemented with
EDTA, HA and citrate as ligands). Deployment time was 48 h. The values show the mean ± SD
(n=3).
Conclusions
In this study we have developed a simple technique based on a polymer inclusion
membrane to assess Zn speciation in a complex nutrient solution. The stability of this
type of membrane is substantially improved, rendering this technique suitable for
(relatively) long speciation experiments. When a PIM made of 70% CTA and 30%
D2EHPA is incorporated in a special device and a 0.01M HNO3 solution is used as an
accep- tor phase, a correlation is found with the free metal, both in absence and in
presence of ligands (EDTA, citrate and HA). This correlation is the basis for PIM to
0
0.2
0.4
0.6
0.8
1
1.2
1.4
No Ligand EDTA HA Citrate
Nor
mal
ized
Jro
ot(n
mol
mg-1
h-1)
Chapter 3 – Results
207
determine [Zn2+] and has been justified with a model consistent with existent evidences.
We have also evidenced the need to consider viability and physiological changes of the
roots prior to study metal internalisation. Additionally, when comparing JPIM and metal
uptake by potato plant roots, different behaviours arise depending on the ligand. In the
case of Zn-citrate and Zn-HA complexes we have observed a direct proportionality
between total metal and root uptake. However, in the case of EDTA, this relationship is
observed for free metal.
References
[1] K.J. Wilkinson, J. Buffle, Critical evaluation of physicochemical parameters and
processes for modelling the biological uptake of trace metals in environmental
(aquatic) systems. In: H.P. Van Leeuwen, W. Köster (Eds.), Physicochemical
Kinetics and Transport at Biointerfaces. John Wiley & Sons, Chichester (UK),
2004, pp. 447–533.
[2] D.M. Di Toro, H.E. Allen, H.L. Bergman, J.S. Meyer, P.R. Paquin, R.C. Santore,
Biotic ligand model of the acute toxicity of metals. 1. Technical basis, Environ.
Toxicol. Chem. 20 (2001) 2383–2396.
[3] A. Gramlich, S. Tandy, E. Frossard, J. Eikenberg, R. Schulin, Availability of zinc
and the ligands citrate and histidine to wheat: does uptake of entire complexes
play a role?, J. Agric. Food Chem. 61 (2013) 10409–10417.
[4] G. Samson, S.A. Visser, Surface-active effects of humic acids on potato cell
membrane properties, Soil Biol. Biochem. 21 (1989) 343–347.
[5] P. Wang, D.M. Zhou, X.S. Luo, L.Z. Li, Effects of Zn-complexes on zinc uptake
by wheat (Triticum aestivum) roots: a comprehensive consideration of physical,
chemical and biological processes on biouptake, Plant Soil 316 (2009) 177–192.
[6] C.M. Zhao, P.G.C. Campbell, K.J. Wilkinson, When are metal complexes
bioavailable?, Environ. Chem. 13 (2016) 425–433.
[7] F. Degryse, E. Smolders, D.R. Parker, Metal complexes increase uptake of Zn and
Cu by plants: implications for uptake and deficiency studies in chelator-buffered
solutions, Plant Soil 289 (2006) 171–185.
Chapter 3 – Results
208
[8] J. Sierra, N. Roig, G. Giménez Papiol, E. Pérez-Gallego, M. Schumacher,
Prediction of the bioavailability of potentially toxic elements in freshwaters.
Comparison between speciation models and passive samplers, Sci. Total Environ.
605–606 (2017) 211–218.
[9] A.M. Jones, Y. Xue, A.S. Kinsela, K.M. Wilchen, R.N. Collins, Donnan
membrane speciation of Al, Fe, trace metals and REE in coastal lowland acid
sulfate soil-impacted drainage waters, Sci. Total Environ. 547 (2016) 104–113.
[10] W. Davison (Ed.), Diffusive Gradients in Thin-films for Environmental
Measurements, Cambridge Environmental Chemistry Series. Cambridge
University Press, Cambridge (UK), 2016.
[11] W. Davison, H. Zhang, In situ speciation measurements of trace components in
natural waters using thin-film gels, Nature 367 (1994) 546–548.
[12] N. Parthasarathy, J. Buffle, Capabilities of supported liquid membranes for metal
speciation in natural waters: application to copper speciation, Anal. Chim. Acta
284 (1994) 649–659.
[13] M. Pesavento, G. Alberti, R. Biesuz, Analytical methods for determination of free
metal ion concentration, labile species fraction and metal complexation capacity
of environmental waters: a review, Anal. Chim. Acta 631 (2009) 129–141.
[14] S. Bayen, K.J. Wilkinson, J. Buffle, The permeation liquid membrane as a sensor
for free nickel in aqueous samples, Analyst 132 (2007) 262–267.
[15] V.I. Slaveykova, N. Parthasarathy, J. Buffle, K.J. Wilkinson, Permeation liquid
membrane as a tool for monitoring bioavailable Pb in natural waters, Sci. Total
Environ. 328 (2004) 55–68.
[16] J. Buffle, N. Parthasarathy, L. Djane, L. Matthiasson, Permeation liquid
membranes for field analysis and speciation of trace compounds in waters. In: J.
Buffle, G. Hoarvai (Eds.), In Situ Monitoring of Aquatic Systems; Chemical
Analysis and Speciation. John Wiley & Sons, West Sussex (UK), 2000, pp. 407–
493.
Chapter 3 – Results
209
[17] M.I.G.S. Almeida, R.W. Cattrall, S.D. Kolev, Recent trends in extraction and
transport of metal ions using polymer inclusion membranes (PIMs), J. Membr.
Sci. 415–416 (2012) 9–23.
[18] A. Garcia-Rodríguez, V. Matamoros, S.D. Kolev, C. Fontàs, Development of a
polymer inclusion membrane (PIM) for the preconcentration of antibiotics in
environmental water samples, J. Membr. Sci. 492 (2015) 32–39.
[19] R. Güell, E. Anticó, S.D. Kolev, J. Benavente, V. Salvadó, C. Fontàs,
Development and characterization of polymer inclusion membranes for the
separation and speciation of inorganic As species, J. Membr. Sci. 383 (2011) 88–
95.
[20] M.I.G.S. Almeida, C. Chan, V.J. Pettigrove, R.W. Cattrall, S.D. Kolev,
Development of a passive sampler for Zinc(II) in urban pond waters using a
polymer inclusion membrane, Environ. Pollut. 193 (2014) 233–239.
[21] A. Humayan Kabir, A.M. Swaraz, J. Stangoulis, Zinc-deficiency resistance and
biofortification in plants, J. Plant Nutr. Soil Sci. 177 (2014) 311–319.
[22] T. Remans, K. Opdenakker, Y. Guisez, R. Carleer, H. Schat, J. Vangronsveld, A.
Cuypers, Exposure of Arabidopsis thaliana to excess Zn reveals a Zn-specific
oxidative stress signature, Environ. Exp. Bot. 84 (2012) 61–71.
[23] M.I.G.S. Almeida, A.M.L. Silva, R.A. Coleman, V.J. Pettigrove, R.W. Cattrall,
S.D. Kolev, Development of a passive sampler based on a polymer inclusion
membrane for total ammonia monitoring in freshwaters, Anal. Bioanal. Chem.
408 (2016) 3213–3222.
[24] O. Serra, M. Soler, C. Hohn, V. Sauveplane, F. Pinot, R. Franke, L. Schreiber, S.
Prat, M. Molinas, M. Figueras, CYP86A33-targeted gene silencing in potato tuber
alters suberin composition, distorts suberin lamellae, and impairs the periderm's
water barrier function, Plant Physiol. 149 (2008) 1050–1060.
[25] A.N.N. Cuypers, J. Vangronsveld, H. Clijsters, Peroxidases in roots and primary
leaves of Phaseolus vulgaris copper and zinc phytotoxicity: a comparison, J. Plant
Physiol. 159 (2002) 869–876.
Chapter 3 – Results
210
[26] L.C. John, P.L. Grisafi, G.R. Fink, A pathway for lateral root formation in
Arabidopsis thaliana, Genes Dev. 9 (1995) 2131–2142.
[27] L. Tomaszewski, J. Buffle, J. Galceran, Theoretical and analytical
characterization of a flow-through permeation liquid membrane with controlled
flux for metal speciation measurements, Anal. Chem. 75 (2003) 893–900.
[28] V.I. Slaveykova, I.B. Karadjova, M. Karadjov, D.L. Tsalev, Trace metal
speciation and bioavailability in surface waters trace metal speciation and
bioavailability in surface waters of the Black Sea coastal area evaluated by HF-
PLM and DGT, Environ. Sci. Technol. 43 (2009) 1798–1803.
[29] A. Gramlich, S. Tandy, V.I. Slaveykova, A. Duffner, R. Schulin, The use of
permeation liquid membranes for free zinc measurements in aqueous solution,
Environ. Chem. 9 (2012) 429–437.
[30] J. Galceran, J. Puy, Interpretation of diffusion gradients in thin films (DGT)
measurements: a systematic approach, Environ. Chem. 12 (2015) 112–122.
[31] F. Yunta, S. García-Marco, J.J. Lucena, M. Gómez-Gallego, R. Alcázar, M.A.
Sierra, Chelating agents related to ethylenediamine bis(2-hydroxyphenyl)acetic
acid (EDDHA): synthesis, characterization, and equilibrium studies of the free
ligands and their Mg2+, Ca2+, Cu2+, Fe3+ chelates, Inorg. Chem. 42 (2003) 5412–
5421.
[32] P.F. Bell, M.J. Mclaughlin, G. Cozens, D.P. Stevens, G. Owens, H. South, Plant
uptake of 14 C-EDTA, 14C-Citrate, and 14C-Histidine from chelator-buffered
and conventional hydroponic solutions, Plant Soil 253 (2003) 311–319.
[33] J. Hart, W. Norvell, R. Welch, L. Sullivan, L. Kochian, Characterization of zinc
uptake, binding, and translocation in intact seedlings of bread and durum wheat
cultivars, Plant Physiol. 118 (1998) 219–226.
[34] S.P. Stacey, M.J. McLaughlin, I. Çakmak, G.M. Hettiarachchi, K.G. Scheckel, M.
Karkkainen, Root uptake of lipophilic zinc - rhamnolipid complexes, J. Agric.
Food Chem. 56 (2008) 2112–2117.
Chapter 3 – Results
211
[35] P.J. White, M.R. Broadley, Biofortification of crops with seven mineral elements
often lacking in human diets- iron, zinc, copper, calcium, magnesium, selenium
and iodine, New Phytol. 182 (2009) 49–84.
[36] S.D. Kolev, Y. Baba, R.W. Cattrall, T. Tasaki, N. Pereira, J.M. Perera, G.W.
Stevens, Solid phase extraction of zinc(II) using a PVC-based polymer inclusion
membrane with di (2-ethylhexyl) phosphoric acid (D2EHPA) as the carrier.
Talanta 78 (2009) 795–799.
[37] C. Fontàs, R. Tayeb, M. Dhahbi, E. Gaudichet, F. Thominette, P. Roy, K.
Steenkeste, M.P. Fontaine-Aupart, S. Tingry, E. Tronel-Peyroz, P. Seta, Polymer
inclusion membranes: the concept of fixed sites membrane revised, J. Membr. Sci.
290 (2007) 62–72.
[38] S.D. Kolev, A.M St John, R.W. Cattrall, Mathematical modeling of the extraction
of uranium(VI) into a polymer inclusion membrane composed of PVC and di-(2-
ethylhexyl) phosphoric acid, J. Membr. Sci. 425–426 (2013) 169–175.
[39] H.P. Van Leeuwen, R. Town, J. Buffle, R. Cleven, W. Davison, J. Puy, W. Van
Riemsdijk, L. Sigg, Dynamic speciation analysis and bioavailability of metals in
aquatic systems, Environ. Sci. Technol. 39 (2005) 8545–8556.
[40] P.G.C. Campbell, Interactions between tracemetals and aquatic organisms: a
critique of the free-ion activity model. In: A. Tessier, D. Turner (Eds.), Metal
Speciation and Bioavailability in Aquatic Systems. vol. 3. John Wiley & Sons,
Chichester (UK), 1995, pp. 45–102.
[41] S. Bayen, I. Worms, N. Parthasarathy, K. Wilkinson, J. Buffle, Cadmium
bioavailability and speciation using the permeation liquid membrane, Anal. Chim.
Acta 575 (2006) 267–273.
[42] E.A. Rodríguez-Morales, E.R. De SanMiguel, J. De Gyves, Evaluation of the
measurement of Cu(II) bioavailability in complex aqueousmedia using a hollow-
fiber supported liquid membrane device (HFSLM) and two microalgae species
(Pseudokirchneriella subcapitata and Scenedesmus acutus), Environ. Pollut. 206
(2015) 712–719.
Chapter 3 – Results
212
[43] A. Gramlich, S. Tandy, E. Frossard, J. Eikenberg, R. Schulin, Diffusion limitation
of zinc fluxes into wheat roots, PLM and DGT devices in the presence of organic
ligands, Environ. Chem. 11 (2014) 41–50.
[44] P. Bradac, R. Behra, L. Sigg, Accumulation of cadmiumin periphyton under
various freshwater speciation conditions, Environ. Sci. Technol. 43 (2009) 7291–
7296.
[45] W.L. Lindsay, W.A. Norvell, Development of a DTPA soil test for zinc, iron,
manganese, and copper, Soil Sci. Soc. Am. J. 42 (1978) 421–428.
[46] E. Meers, R. Samson, F.M.G. Tack, A. Ruttens, M. Vandegehuchte, J.
Vangronsveld, M.G. Verloo, Phytoavailability assessment of heavy metals in soils
by single extractions and accumulation by Phaseolus vulgaris, Environ. Exp. Bot.
60 (2007) 385–396.
[47] N.W. Menzies, M.J. Donn, P.M. Kopittke, Evaluation of extractants for estimation
of the phytoavailable trace metals in soils, Environ. Pollut. 145 (2007) 121–130.
[48] T. Adhikari, R.K. Rattan, Modelling zinc uptake by rice crop using a Barber-
Cushman approach, Plant Soil 227 (2000) 235–242.
[49] U.S. Sadana, N. Claassen, Manganese dynamics in the rhizosphere and Mn uptake
by different crops evaluated by a mechanistic model, Plant Soil 218 (2000) 233–
238.
[50] F. Degryse, E. Smolders, H. Zhang, W. Davison, Predicting availability of mineral
elements to plants with the DGT technique: a review of experimental data and
interpretation by modelling, Environ. Chem. 6 (2009) 198–218.
[51] V.I. Slaveykova, K.J. Wilkinson, A. Ceresa, E. Pretsch, Role of fulvic acid on
lead bioaccumulation by Chlorella kesslerii, Environ. Sci. Technol. 37 (2003)
1114–1121.
[52] B. Vigneault, A. Percot, M. Lafleur, P.G.C. Campbell, Permeability changes in
model and phytoplankton membranes in the presence of aquatic humic substances,
Environ. Sci. Technol. 34 (2000) 3907–3913.
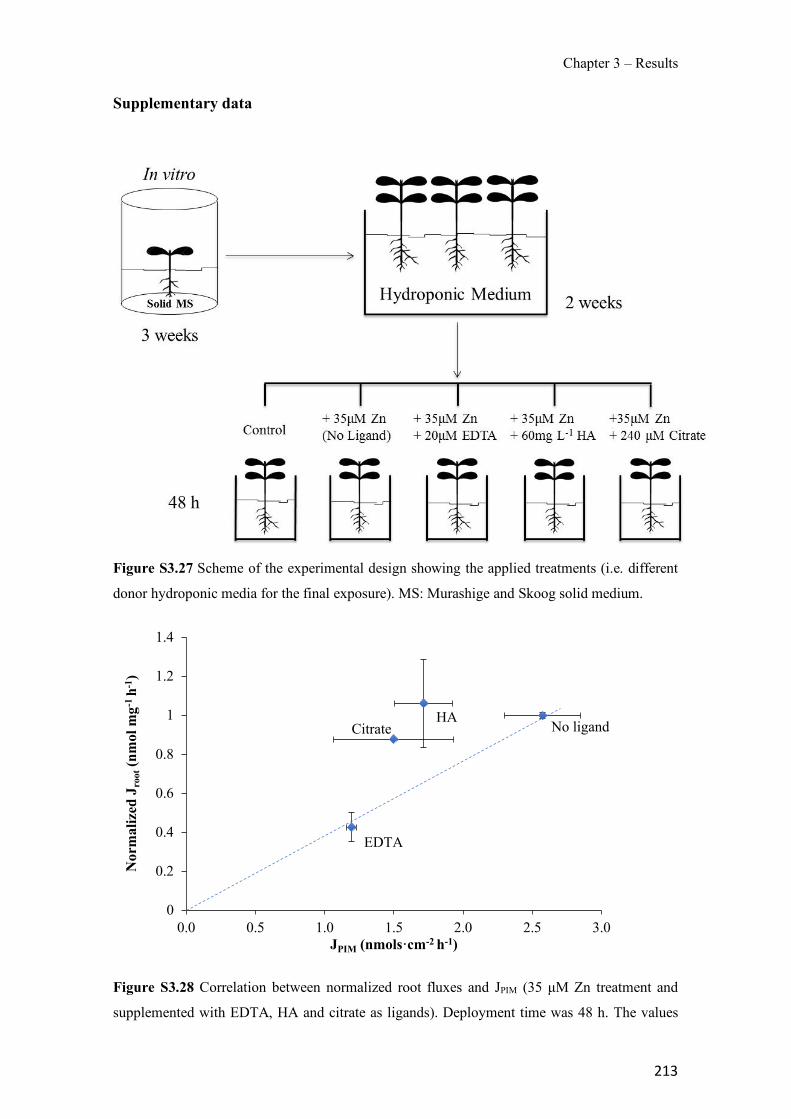
Chapter 3 – Results
213
Supplementary data
Figure S3.27 Scheme of the experimental design showing the applied treatments (i.e. different
donor hydroponic media for the final exposure). MS: Murashige and Skoog solid medium.
Figure S3.28 Correlation between normalized root fluxes and JPIM (35 µM Zn treatment and
supplemented with EDTA, HA and citrate as ligands). Deployment time was 48 h. The values
No ligand
EDTA
HACitrate
0
0.2
0.4
0.6
0.8
1
1.2
1.4
0.0 0.5 1.0 1.5 2.0 2.5 3.0
Nor
mal
ized
Jro
ot(n
mol
mg-1
h-1
)
JPIM (nmols·cm-2 h-1)
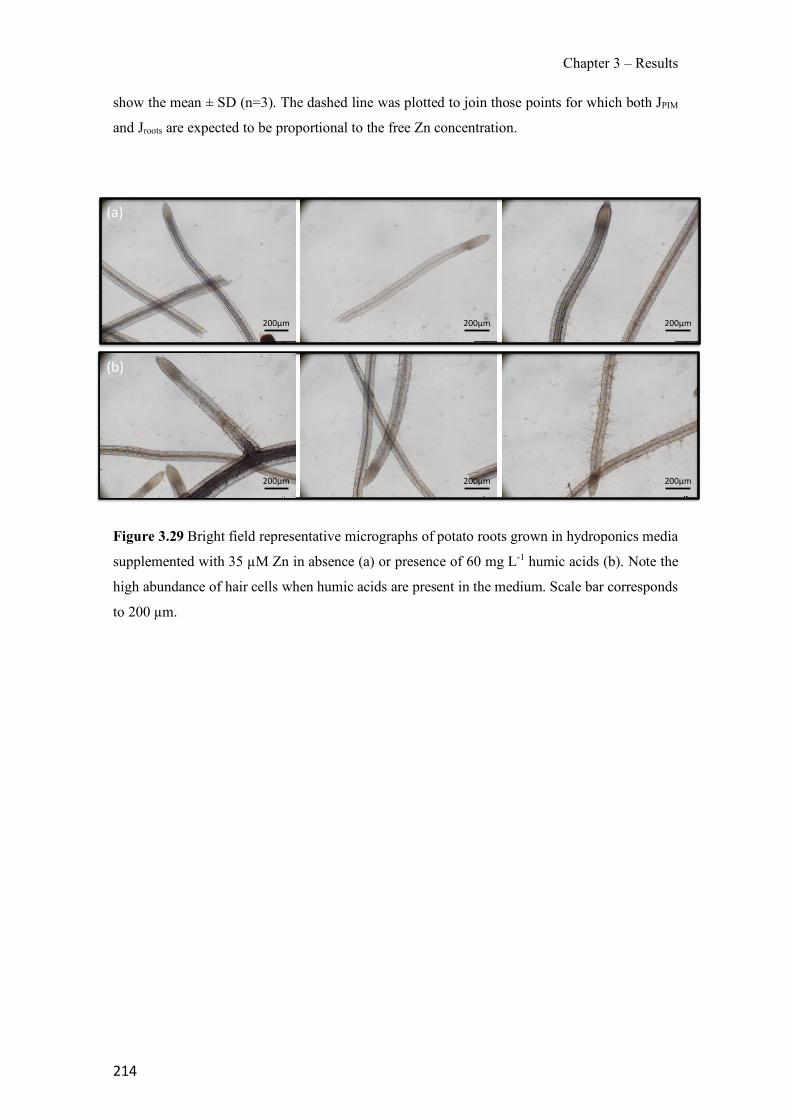
Chapter 3 – Results
214
show the mean ± SD (n=3). The dashed line was plotted to join those points for which both JPIM
and Jroots are expected to be proportional to the free Zn concentration.
Figure 3.29 Bright field representative micrographs of potato roots grown in hydroponics media
supplemented with 35 µM Zn in absence (a) or presence of 60 mg L-1 humic acids (b). Note the
high abundance of hair cells when humic acids are present in the medium. Scale bar corresponds
to 200 µm.
(a)$
(b)$
200μm$ 200μm$ 200μm$
200μm$ 200μm$ 200μm$
Chapter 3 – Results
215
3.3.2 A new extraction phase based on a polymer inclusion membrane for the
detection of chlorpyrifos, diazinon and cyprodinil in natural water samples
Abstract
A simple and effective method for the detection of three pesticides (chlorpyrifos,
diazinon and cyprodinil) is developed using a polymer inclusion membrane (PIM) prior
to gas chromatography and mass spectrometry detection (GC-MS). Analytes are extracted
from natural water samples using a 3 cm2 PIM made of the polymer, cellulose triacetate
(CTA), and the plasticizer, nitrophenyl octyl ether (NPOE). Addition of the plasticizer to
the CTA matrix is found to be necessary for the extraction of pesticides. After extraction,
analytes are recovered from the membrane with 1 mL of acetonitrile and injected into the
GC-MS system. The main factors affecting the extraction efficiency are evaluated,
including membrane composition, stirring mode, extraction and elution time. Ultrasonic
assisted elution of the extracted pesticides is accomplished after 15 min of contact. The
PIM assisted extraction method makes it possible for pesticides to be determined in the
range of 50–1000 ng L−1 with good linearity (coefficient of determination ≥0.995) and
suitable recoveries (85–119%) and precision (< 21%, n=3) using 100 mL of a water
sample. This methodology is shown to be suitable for the detection of chlorpyrifos in
local river waters.
Introduction
An ever-increasing world population placing pressure on global food supplies,
energy resources and the environment has led to agrochemicals being used not only to
protect crops from pests but also to enhance crop yields [1]. Many pesticides used in
agriculture are highly toxic both to the environment and to living organisms when their
application is uncontrolled. Storm runoff events can cause pesticides to be mobilized from
fields to waterbodies. Due to their highly persistent properties, pesticides bioaccumulate
in food and can present a risk to animal and human health [2]. Chlorpyrifos (CP), diazinon
(DZ) and cyprodinil (CYP) are three of the most widely used pesticides. CP and DZ
belong to the organophophate pesticides chemical family (OPPs). OPPs, like some nerve
agents, inhibit a neuromuscular enzyme that is essential for normal function in insects,
Chapter 3 – Results
216
humans and many other animals. CP is considered by the World Health Organization to
be moderately hazardous to humans and more than 10,000 related human deaths a year
are reported. CYP is a fungicide which belongs to the family of aminopyrimidines.
Aminopyrimidines play an important role in biological processes, since the pyrimidine
ring is present in several vitamins, nucleic acids, and coenzymes. The European Water
Framework Directive [3] recognizes CP as a priority pollutant and has set 0.1 µg L−1 as
the maximum concentration permitted in fresh waters. Furthermore, a maximum level for
individual pesticides of 0.1 µg L−1 has been established in water intended to be used for
drinking purposes.
Chromatographic techniques have been extensively used as they are powerful
separation techniques and enable the analysis of pesticide residues. However, extraction
and concentration is needed prior to chromatographic separation and detection to make
the sample more amenable to the analytical techniques and to separate the analytes of
interest from other interfering species [4]. Sample preparation is therefore an important
step in the analytical process. Conventional methods such as liquid–liquid extraction
(LLE) and solid-phase extraction (SPE) are labour-intensive and environmentally
harmful [5,6]. As a result, considerable effort has been devoted to the development of
novel sample preparation methods, such as stir bar sorptive extraction [7], solid-phase
microextraction (SPME) [8], membrane assisted liquid-liquid extraction [9], single drop
microextraction [10], and dispersive liquid–liquid microextraction [11]. Recently, new
sample treatment approaches [12–14] and new materials (sorbents) for pesticide
extraction have also been explored. In this respect, magnetic molecularly imprinted
polymers [15] and magnetic graphene nanoparticles [16] have been described. Moreover,
thin films based on polydimethylsiloxane (PDMS) [17], silicone rods and silicone tubes
[18], and microporous polypropylene hollow-fibre (HF) membranes [9] can be used
directly as solid sorbents to extract target species based on an adsorption mechanism.
Extraction of the compounds of interest from water samples can also be achieved
with a new class of membranes called polymer inclusion membranes (PIM). These new
membranes consist of a base polymer, usually polyvinyl chloride (PVC) or cellulose
triacetate (CTA) and a plasticizer. The role of the plasticizer is to increase both the
flexibility and the softness. Additionally, plasticizers can modify the solubility properties
of the sorbent due to their different polarities and dielectric constants. A third component,
an organic extractant or carrier, is needed when separation of species relies on a transport
mechanism. Ease of preparation, stability, and mechanical strength are noticeable features
Chapter 3 – Results
217
of PIMs, which have found many applications in transport systems for the separation and
recovery of inorganic species and organic compounds [19,20]. Moreover, membranes
made of CTA and the extractant Aliquat 336 have been used as the extraction phase for
the preconcentration of trace amounts of several metals such as Cd(II) [21], Cr(VI) [22],
Pd(II) and Pt(IV) [23] in complex liquid samples such as electroplating solutions and sea
water samples. Once the metals were extracted by the PIM, analysis of the membrane by
X-ray fluorescence showed this PIM-assisted extraction to be an easy way to improve the
instrumental sensitivity for the detection of these metals. However, the use of PIMs as an
extraction phase for organic compounds has yet to be fully exploited.
In this study our intention is to evaluate the use of PIMs as an extraction phase for
pesticides prior to their determination using gas chromatography coupled to mass
spectrometry. We have studied membranes made of CTA as a polymer and nitrophenyl
octyl ether (NPOE), dibutyl sebacate (DBS) and bis (1-butylpentyl) adipate (BBPA) as
plasticizers. The extraction efficiency of the different membranes has been evaluated for
three pesticides, CP, DZ and CYP. Parameters such as the kinetics of the extraction
process as well as elution conditions using different organic solvents such as methanol
and acetonitrile (ACN) have also been studied. Moreover, the PIM-assisted extraction for
the determination of these pesticides has been validated in a GC-QqQ system. To the best
of our knowledge, this work constitutes the first application of a PIM as an extraction
phase for the preconcentration of pesticides in river waters.
Experimental
Chemicals and standards
All reagents and solvents used in this study were of analytical grade. CP, DZ and
CYP were obtained from Sigma-Aldrich (Steinheim, Germany). The structure and
physico-chemical properties of the studied compounds are shown in Figure S3.35 and
Table S3.22. Chlorpyriphos-d10 from Dr. Ehrenstorfer GmbH (Augsburg, Germany) was
selected as the internal standard (IS). Other reagents (CTA, NPOE, DBS and BBPA),
were obtained from Sigma-Adrich (Steinheim, Germany). Sodium chloride was
purchased from Fisher Chemical (Fair Lawn, NJ, USA). Ultrapure water from a Milli-Q
Plus water purification system (Millipore Ibérica S.A., Barcelona, Spain) was used. All
solvents employed in this study were HPLC-hypergradient. Methanol and
Chapter 3 – Results
218
trichloromethane were purchased from Panreac (Castellar del Vallès, Spain). ACN was
acquired from Fisher Chemical (Fair lawn, NJ, USA).
Stock standard solutions of all pesticides (containing about 500 mg L−1) were
prepared in methanol. Intermediate solutions of each pesticide (5 mg L−1) were also
prepared in methanol and replaced every week. All these solutions were stored in
darkness at 4°C.
Water samples were collected from different rivers in Catalonia (north-east
Spain): Riells River (pH of 8.15, a conductivity of 99 µS, and total organic carbon (TOC)
of 1.81 mg C L−1), sampled in the Montseny Natural Park; Ter River (pH of 8.08, a
conductivity of 628 µS, and TOC of 27.80 mg C L−1), sampled in l’Estartit close to the
mouth of the river; Tordera River (pH of 7.99, a conductivity of 624 µS, and TOC of 5.98
mg C L−1), located between the province of Girona and Barcelona; and Llémena River
(pH of 8.24, a conductivity of 318 µS, and TOC of 2.16 mg C L−1), in the Garrotxa county.
Samples, which were collected during the summer and autumn of 2016, were immediately
filtered through a 0.45 µm cellulose acetate membrane filter and stored in darkness at
−18°C in glass bottles.
Equipment and chromatographic conditions
GC-ITMS
Preliminary studies, evaluation of extraction conditions and PIM composition
were performed using a Trace GC 2000 coupled to a PolarisQ ion trap mass spectrometer
detector (Thermo Scientific, Waltham, MA, USA). A TG-5SIL MS capillary column
(30m×0.25mm i.d. x 0.25 µm film thickness) (Thermo Scientific) was used and the carrier
gas was 99.9990% pure helium (Carburos Metálicos, Barcelona, Spain) at a constant flow
rate of 1 mL min−1. The split/splitless injection port was equipped with a 0.75 mm ID
liner and operated in splitless mode (maintained for 1 min) at 250°C (270°C and 5 min
for SPME experiments).
The oven temperature programme started at 80°C, was held for 2 min; then
ramped up to 300°C at 10 °C min−1, and held for 6 min; the total run time was 30 min.
Ionization was performed in the electron impact mode at 70 eV. The transfer line
temperature was set at 250°C and the ion source temperature at 225°C. MS analyses were
conducted in full acquisition mode with an m/z range from 40 to 400 amu. Peak areas of
the compounds were obtained from XIC chromatograms with the following m/z ions: 314
Chapter 3 – Results
219
and 197 for CP, 225 and 224 for CYP, 304 and 179 for DZ (adapted from Correia et al.
[24]). Data analysis was performed using Xcalibur 1.4 software (Thermo Scientific).
GC-QqQ
Method validation and determination of pesticides in river water samples were
performed by Trace GC Ultra gas chromatograph equipped with a TriplusTM
autosampler coupled to a TSQ Quantum triple quadrupole mass spectrometer system
(Thermo Fisher Scientific). Chromatographic separation was performed using a Trace
GOLD TG- 5SILMS column from Thermo Fisher Scientific (30m x 0.25mm i.d. x 0.25
µm). The injector was operated in splitless mode (maintained for 1 min) at 250 °C. The
oven temperature program was as follows: initial temperature 60°C, held for 2 min; then
ramped up to 300°C at 10°C min−1, and held for 6 min; the total run time was 30 min.
Mass spectrometric ionization was carried out in electron impact (EI) ionization mode
with an EI voltage of 70 eV and a source temperature of 250°C. Detection was performed
in Selected Reaction Monitoring mode (SRM), using the ions indicated in Table S3.23.
The acquired data were processed by TraceFinder EFS 3.1 software.
Preparation of the PIM
Membranes with a composition of 70% polymer and 30% plasticizer (w/w) were
prepared according to the procedure found in the literature [25]. In summary, 200 mg of
CTA were dissolved in 20 mL trichloromethane and maintained under stirring for 5 h. 90
mg of plasticizer were then added and the resulting mixture was stirred for 2 h more.
Different plasticizers (NPOE, DBS and BBPA) with similar viscosity values but different
dielectric constants were tested (see Table S3.24). The mixture was then poured into a
9.0 cm diameter flat bottom glass petri dish, which was set horizontally and covered
loosely. The organic solvent was allowed to evaporate over 24 h at room temperature,
and the resulting film was then carefully peeled off the bottom of the petri dish. Circular
pieces with an area of 3 cm2 were cut from its central section and used in extraction
experiments.
Chapter 3 – Results
220
Evaluation of different parameters for pesticide extraction and elution
In preliminary experiments, only CP was evaluated. For this, 100 mL of Llémena
River sample was spiked with 2000 ng L−1 CP and put in contact with the PIM sorbent.
Samples were stirred for different time periods. CP remaining in the aqueous solution
was determined by SPME-GC-ITMS. SPME experiments were performed with an SPME
Triplus autosampler (Thermo Scientific, Waltham, MA, USA). A previously conditioned
commercially available fibre with a 50/30 µm divinylbenzene/
carboxen/polydimethylsiloxane (DVB/CAR/PDMS) coating (Supelco; Bellefonte, PA,
USA), was used. Volumes of 15 mL of sample solution were placed in 20 mL glass vials
closed with aluminium caps furnished with Teflon-faced septa. The fibre was then
immersed in the sample for extraction (50°C for 30 min). Constant stirring was applied
during the extraction process. After completion, the fibre was pulled into the needle and
the SPME device was removed from the vial and inserted into the injection port of the
GC.
Methanol and ACN were evaluated for the elution of CP. To this end, 1 mL of
organic solvent was placed into a glass vial closed with Teflon caps and put into contact
with a piece of a CP-loaded PIM sorbent that had been previously washed with ultrapure
water and carefully dried. The use of an ultrasonic bath to help in the release of retained
pesticide and the time needed for the elution step were also investigated. The elution
efficiency was evaluated by direct injection of the organic extract in the GC without
further evaporation.
Moreover, the influence of PIM composition and the effect of orbital, magnetic
and rotary stirring were also checked for the three compounds.
Extraction efficiency and absolute recovery
To study the extraction efficiency of PIMs for the target pesticides at the
concentration levels encountered in surface water, a GC coupled to a QqQ system was
employed. First, calibration standards were prepared by taking several pieces (one piece
for each experiment) of the PIM, which were contacted with 1 mL ACN for 15 min in an
ultrasonic bath; the pieces of membrane were then removed and the appropriate amount
of the intermediate solution containing the three pesticides was added. The solvent was
evaporated to dryness under gentle nitrogen stream and the residue was reconstituted with
1 mL hexane. Fifty µL of the IS solution (100 µg L−1) was finally added. Calibration
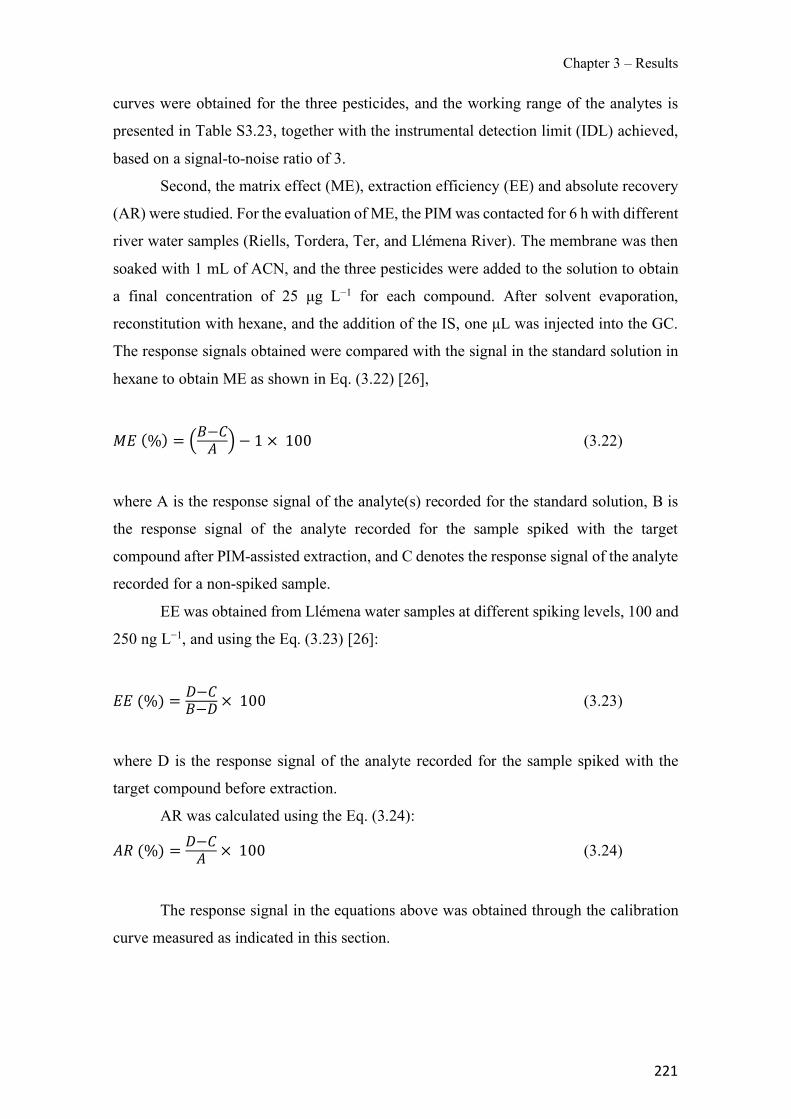
Chapter 3 – Results
221
curves were obtained for the three pesticides, and the working range of the analytes is
presented in Table S3.23, together with the instrumental detection limit (IDL) achieved,
based on a signal-to-noise ratio of 3.
Second, the matrix effect (ME), extraction efficiency (EE) and absolute recovery
(AR) were studied. For the evaluation of ME, the PIM was contacted for 6 h with different
river water samples (Riells, Tordera, Ter, and Llémena River). The membrane was then
soaked with 1 mL of ACN, and the three pesticides were added to the solution to obtain
a final concentration of 25 µg L−1 for each compound. After solvent evaporation,
reconstitution with hexane, and the addition of the IS, one µL was injected into the GC.
The response signals obtained were compared with the signal in the standard solution in
hexane to obtain ME as shown in Eq. (3.22) [26],
!3(%) = @A−<B C − 1 × 100 (3.22)
where A is the response signal of the analyte(s) recorded for the standard solution, B is
the response signal of the analyte recorded for the sample spiked with the target
compound after PIM-assisted extraction, and C denotes the response signal of the analyte
recorded for a non-spiked sample.
EE was obtained from Llémena water samples at different spiking levels, 100 and
250 ng L−1, and using the Eq. (3.23) [26]:
33(%) = D−<A−D× 100 (3.23)
where D is the response signal of the analyte recorded for the sample spiked with the
target compound before extraction.
AR was calculated using the Eq. (3.24):
BE(%) = D−<B × 100 (3.24)
The response signal in the equations above was obtained through the calibration
curve measured as indicated in this section.
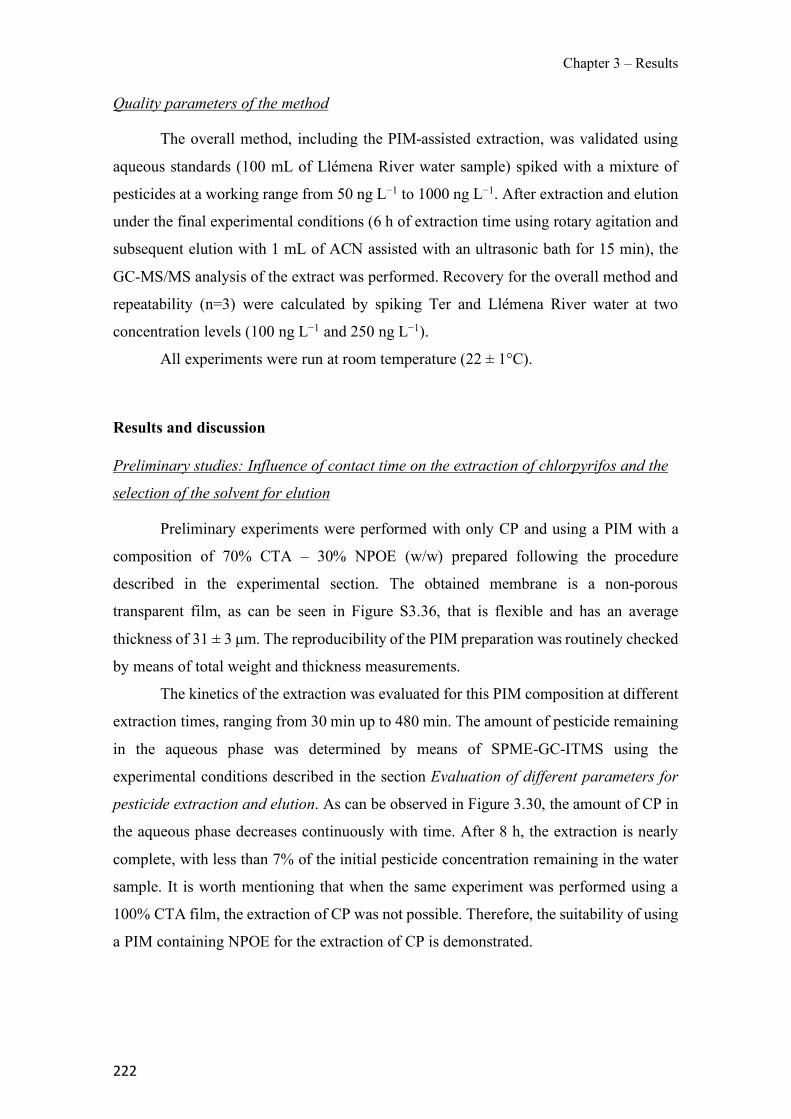
Chapter 3 – Results
222
Quality parameters of the method
The overall method, including the PIM-assisted extraction, was validated using
aqueous standards (100 mL of Llémena River water sample) spiked with a mixture of
pesticides at a working range from 50 ng L−1 to 1000 ng L−1. After extraction and elution
under the final experimental conditions (6 h of extraction time using rotary agitation and
subsequent elution with 1 mL of ACN assisted with an ultrasonic bath for 15 min), the
GC-MS/MS analysis of the extract was performed. Recovery for the overall method and
repeatability (n=3) were calculated by spiking Ter and Llémena River water at two
concentration levels (100 ng L−1 and 250 ng L−1).
All experiments were run at room temperature (22 ± 1°C).
Results and discussion
Preliminary studies: Influence of contact time on the extraction of chlorpyrifos and the
selection of the solvent for elution
Preliminary experiments were performed with only CP and using a PIM with a
composition of 70% CTA – 30% NPOE (w/w) prepared following the procedure
described in the experimental section. The obtained membrane is a non-porous
transparent film, as can be seen in Figure S3.36, that is flexible and has an average
thickness of 31 ± 3 µm. The reproducibility of the PIM preparation was routinely checked
by means of total weight and thickness measurements.
The kinetics of the extraction was evaluated for this PIM composition at different
extraction times, ranging from 30 min up to 480 min. The amount of pesticide remaining
in the aqueous phase was determined by means of SPME-GC-ITMS using the
experimental conditions described in the section Evaluation of different parameters for
pesticide extraction and elution. As can be observed in Figure 3.30, the amount of CP in
the aqueous phase decreases continuously with time. After 8 h, the extraction is nearly
complete, with less than 7% of the initial pesticide concentration remaining in the water
sample. It is worth mentioning that when the same experiment was performed using a
100% CTA film, the extraction of CP was not possible. Therefore, the suitability of using
a PIM containing NPOE for the extraction of CP is demonstrated.
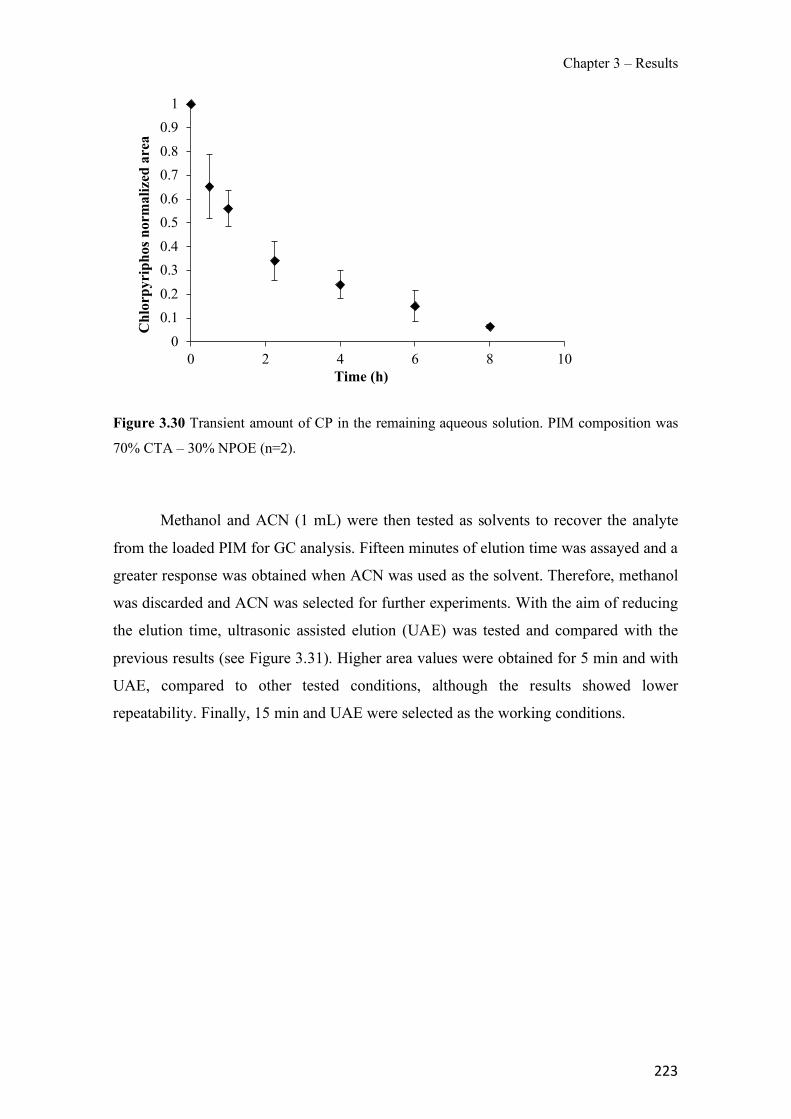
Chapter 3 – Results
223
Figure 3.30 Transient amount of CP in the remaining aqueous solution. PIM composition was
70% CTA – 30% NPOE (n=2).
Methanol and ACN (1 mL) were then tested as solvents to recover the analyte
from the loaded PIM for GC analysis. Fifteen minutes of elution time was assayed and a
greater response was obtained when ACN was used as the solvent. Therefore, methanol
was discarded and ACN was selected for further experiments. With the aim of reducing
the elution time, ultrasonic assisted elution (UAE) was tested and compared with the
previous results (see Figure 3.31). Higher area values were obtained for 5 min and with
UAE, compared to other tested conditions, although the results showed lower
repeatability. Finally, 15 min and UAE were selected as the working conditions.
00.10.20.30.40.50.60.70.80.9
1
0 2 4 6 8 10
Chl
orpy
riph
os n
orm
aliz
ed a
rea
Time (h)
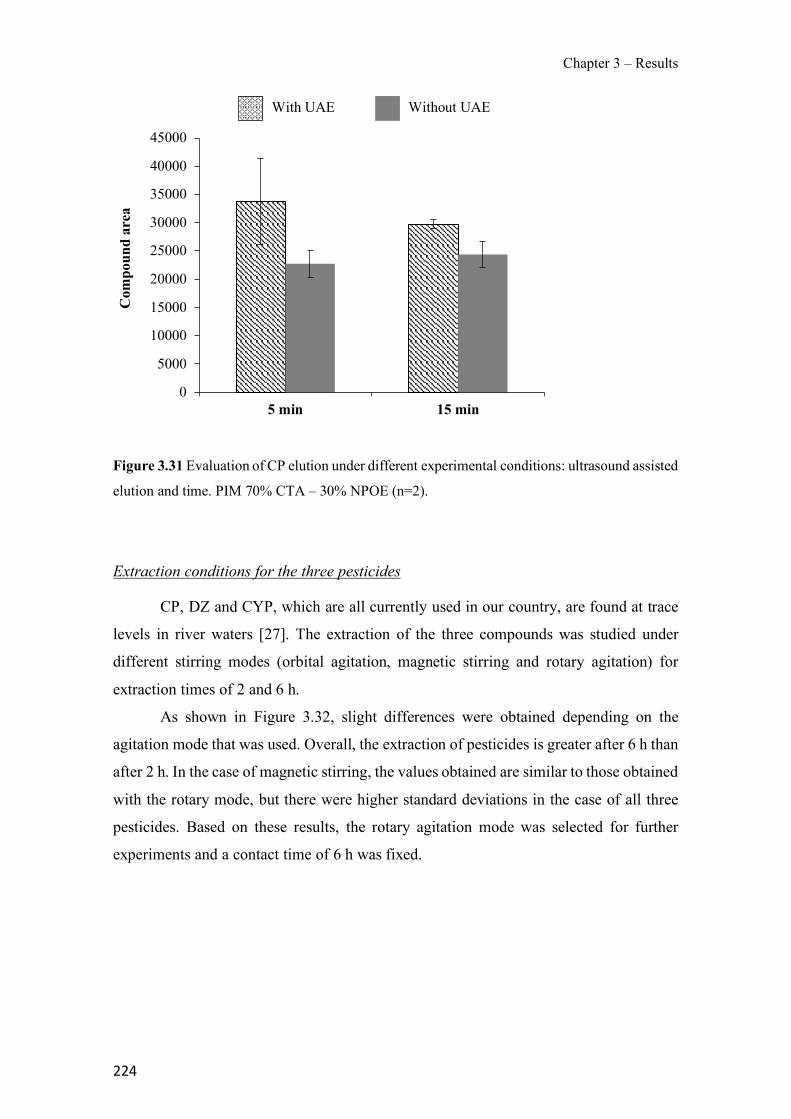
Chapter 3 – Results
224
Figure 3.31 Evaluation of CP elution under different experimental conditions: ultrasound assisted
elution and time. PIM 70% CTA – 30% NPOE (n=2).
Extraction conditions for the three pesticides
CP, DZ and CYP, which are all currently used in our country, are found at trace
levels in river waters [27]. The extraction of the three compounds was studied under
different stirring modes (orbital agitation, magnetic stirring and rotary agitation) for
extraction times of 2 and 6 h.
As shown in Figure 3.32, slight differences were obtained depending on the
agitation mode that was used. Overall, the extraction of pesticides is greater after 6 h than
after 2 h. In the case of magnetic stirring, the values obtained are similar to those obtained
with the rotary mode, but there were higher standard deviations in the case of all three
pesticides. Based on these results, the rotary agitation mode was selected for further
experiments and a contact time of 6 h was fixed.
With UAE Without UAE
0
5000
10000
15000
20000
25000
30000
35000
40000
45000
5 min 15 min
Com
poun
d ar
ea
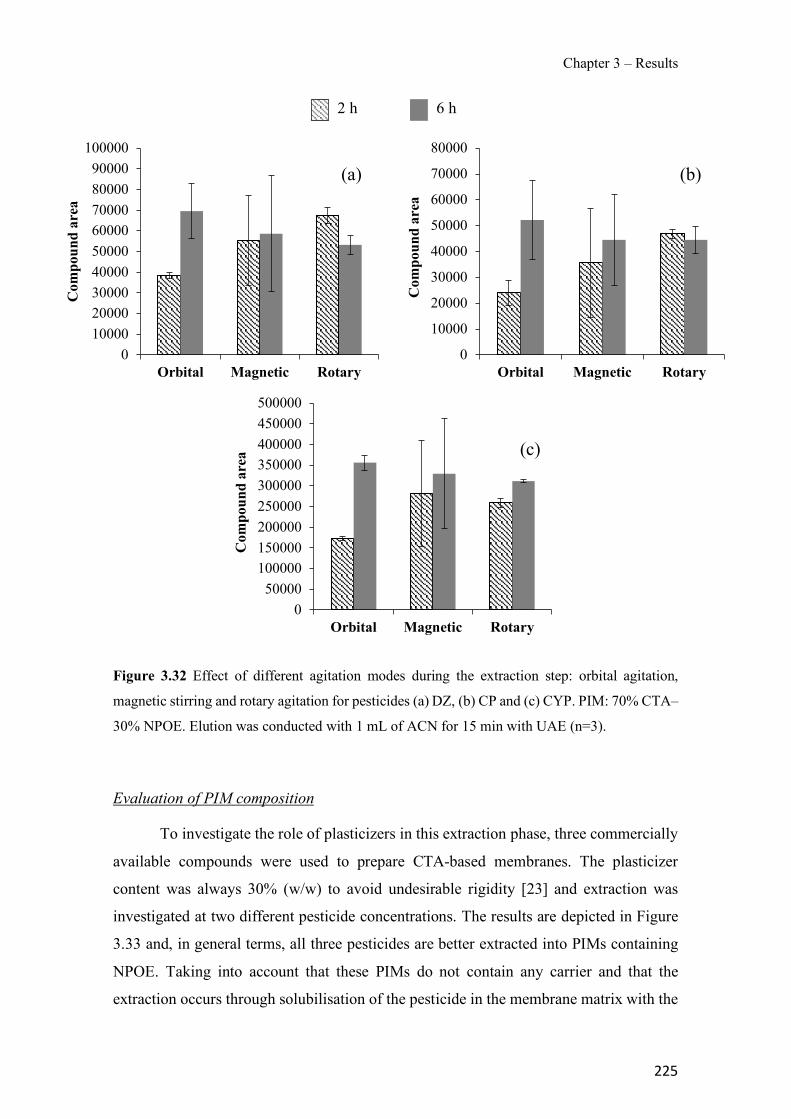
Chapter 3 – Results
225
Figure 3.32 Effect of different agitation modes during the extraction step: orbital agitation,
magnetic stirring and rotary agitation for pesticides (a) DZ, (b) CP and (c) CYP. PIM: 70% CTA–
30% NPOE. Elution was conducted with 1 mL of ACN for 15 min with UAE (n=3).
Evaluation of PIM composition
To investigate the role of plasticizers in this extraction phase, three commercially
available compounds were used to prepare CTA-based membranes. The plasticizer
content was always 30% (w/w) to avoid undesirable rigidity [23] and extraction was
investigated at two different pesticide concentrations. The results are depicted in Figure
3.33 and, in general terms, all three pesticides are better extracted into PIMs containing
NPOE. Taking into account that these PIMs do not contain any carrier and that the
extraction occurs through solubilisation of the pesticide in the membrane matrix with the
0100002000030000400005000060000700008000090000
100000
Orbital Magnetic Rotary
Com
poun
d ar
ea
0
10000
20000
30000
40000
50000
60000
70000
80000
Orbital Magnetic Rotary
Com
poun
d ar
ea
050000
100000150000200000250000300000350000400000450000500000
Orbital Magnetic Rotary
Com
poun
d ar
ea
2 h 6 h
(a) (b)
(c)
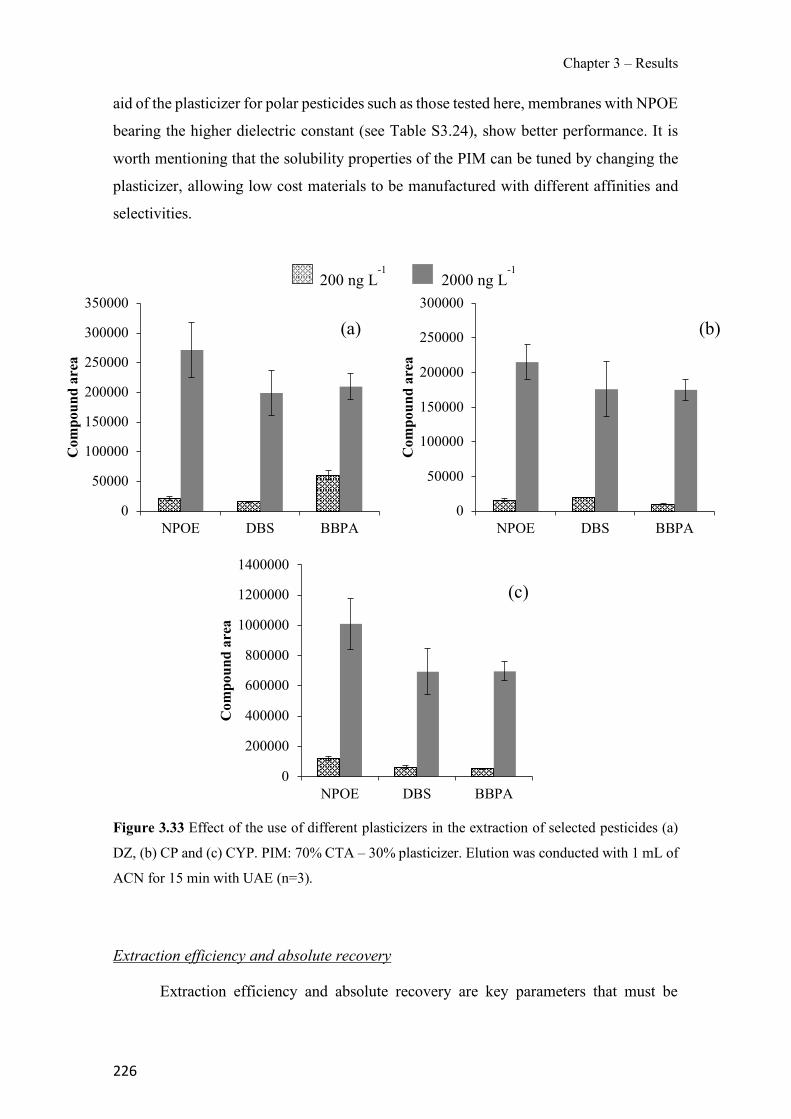
Chapter 3 – Results
226
aid of the plasticizer for polar pesticides such as those tested here, membranes with NPOE
bearing the higher dielectric constant (see Table S3.24), show better performance. It is
worth mentioning that the solubility properties of the PIM can be tuned by changing the
plasticizer, allowing low cost materials to be manufactured with different affinities and
selectivities.
Figure 3.33 Effect of the use of different plasticizers in the extraction of selected pesticides (a)
DZ, (b) CP and (c) CYP. PIM: 70% CTA – 30% plasticizer. Elution was conducted with 1 mL of
ACN for 15 min with UAE (n=3).
Extraction efficiency and absolute recovery
Extraction efficiency and absolute recovery are key parameters that must be
0
50000
100000
150000
200000
250000
300000
350000
NPOE DBS BBPA
Com
poun
d ar
ea
0
50000
100000
150000
200000
250000
300000
NPOE DBS BBPA
Com
poun
d ar
ea
0
200000
400000
600000
800000
1000000
1200000
1400000
NPOE DBS BBPA
Com
poun
d ar
ea
200 ng L-1
2000 ng L-1
(a) (b)
(c)

Chapter 3 – Results
227
evaluated when a novel extraction phase is designed and are usually calculated from the
experimentally obtained chromatographic signal (peak areas). However, in the case of
GC-MS, matrix effects cause signal suppression/enhancement due to the accumulation of
non-volatile matrix components in the GC system or blockage of active sites in the
injector. ME is used to evaluate the impact of matrix components on the analyte response
detector in GC-MS determinations. The EE corresponds to the effectiveness of the PIM-
assisted extraction procedure and the AR takes into account the influence of the matrix
components (ME) on the whole efficiency. A methodology and a general scheme has
been proposed by Caban et al. [26] to evaluate these effects with specially designed
experiments and this methodology has been followed in the present work.
For this reason, we focused our efforts on the evaluation of the different
interferences and matrix effect arising from the PIM-assisted extraction method with the
triple quadrupole MS/MS instrument prior to EE and AR evaluation (Eqs. 3.22 to 3.24).
The experimental conditions of the MS/MS system, choice of precursor ions, product
ions, and collision energies were adapted from reference [28] and were not optimized.
In Table 3.19 a), ME is presented for Tordera, Riells, Llémena and Ter river water
samples. Values in the range of −1% to −3% were found for DZ and CP, and higher for
CYP (−8.6% and −15.2%, for Tordera and Riells samples, respectively). Higher values
for the Ter River correlate with the higher TOC of this water. Considering the different
characteristics of the tested river waters, it is noticeable that the proposed method suffers
from little interference due to a matrix effect, which is an advantage compared to SPE
where extensive clean up procedures are needed.
Water from the Llémena River was selected for the evaluation of EE and AR,
which was undertaken at two different concentration levels (100 and 250 ng L−1). As
shown in Table 3.19 b), values of AR between 36% and 46% for CYP, 42% and 45% for
DZ, and 68-70% for CP were found. The higher AR for CP agrees with the log Kow values,
CP bearing the higher value and may be related to the affinity of the compound towards
the plasticizer NPOE.
The AR results obtained in the present work are in concordance with others
reported in the literature for new extraction phases [29]. Moreover, the AR values found
encourage us to evaluate a quantification method for the determination of the selected
pesticides based on PIM-assisted extraction as preconcentration step.
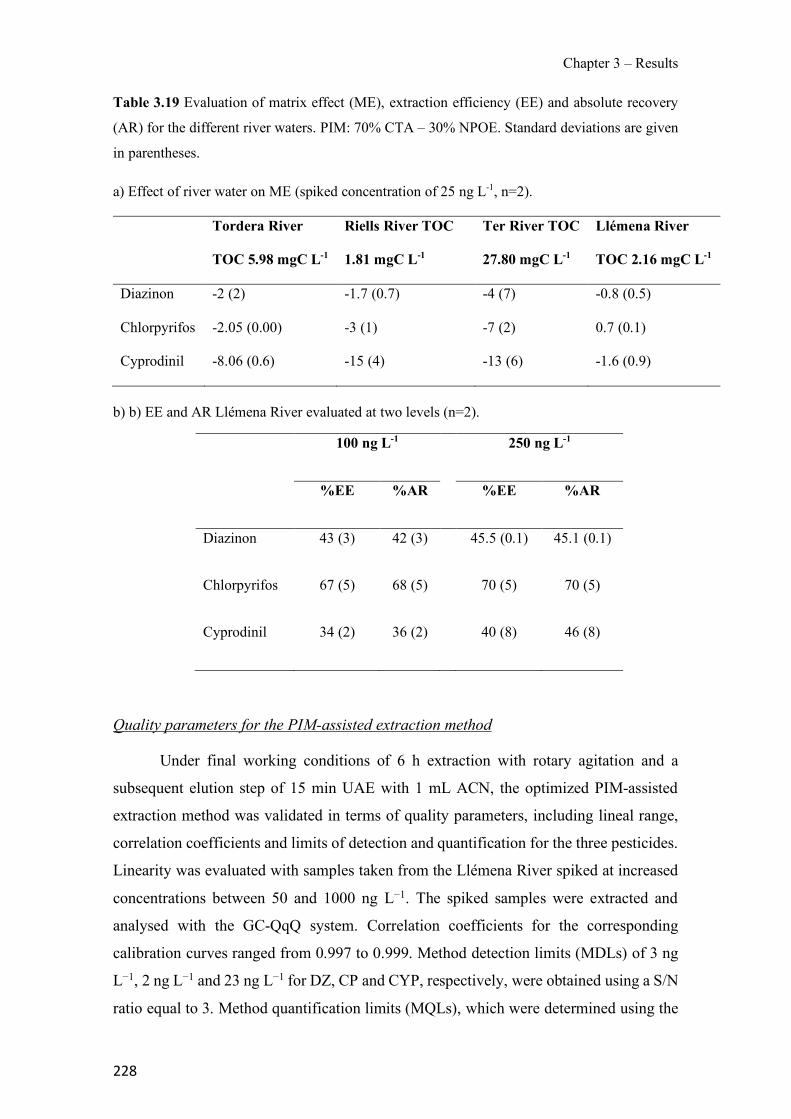
Chapter 3 – Results
228
Table 3.19 Evaluation of matrix effect (ME), extraction efficiency (EE) and absolute recovery
(AR) for the different river waters. PIM: 70% CTA – 30% NPOE. Standard deviations are given
in parentheses.
a) Effect of river water on ME (spiked concentration of 25 ng L-1, n=2).
Tordera River
TOC 5.98 mgC L-1
Riells River TOC
1.81 mgC L-1
Ter River TOC
27.80 mgC L-1
Llémena River
TOC 2.16 mgC L-1
Diazinon -2 (2) -1.7 (0.7) -4 (7) -0.8 (0.5)
Chlorpyrifos -2.05 (0.00) -3 (1) -7 (2) 0.7 (0.1)
Cyprodinil -8.06 (0.6) -15 (4) -13 (6) -1.6 (0.9)
b) b) EE and AR Llémena River evaluated at two levels (n=2).
100 ng L-1 250 ng L-1
%EE %AR %EE %AR
Diazinon 43 (3) 42 (3) 45.5 (0.1) 45.1 (0.1)
Chlorpyrifos 67 (5) 68 (5) 70 (5) 70 (5)
Cyprodinil 34 (2) 36 (2) 40 (8) 46 (8)
Quality parameters for the PIM-assisted extraction method
Under final working conditions of 6 h extraction with rotary agitation and a
subsequent elution step of 15 min UAE with 1 mL ACN, the optimized PIM-assisted
extraction method was validated in terms of quality parameters, including lineal range,
correlation coefficients and limits of detection and quantification for the three pesticides.
Linearity was evaluated with samples taken from the Llémena River spiked at increased
concentrations between 50 and 1000 ng L−1. The spiked samples were extracted and
analysed with the GC-QqQ system. Correlation coefficients for the corresponding
calibration curves ranged from 0.997 to 0.999. Method detection limits (MDLs) of 3 ng
L−1, 2 ng L−1 and 23 ng L−1 for DZ, CP and CYP, respectively, were obtained using a S/N
ratio equal to 3. Method quantification limits (MQLs), which were determined using the
Chapter 3 – Results
229
S/N ratio equal to 10 but also taking into account the error in the calibration curve, are set
out in Table 3.20. In Table 3.21, MDLs from our method are compared with other
extraction methods reported in the literature for the determination of CP, DZ and CYP in
waters, such as liquid-liquid extraction combined with GC-FPD, GC-NPD and GC-ECD
[30–33], liquid-solid extraction combined with GC-MS [34], solid-phase microextraction
combined with GC-ECD and GC-MS/MS [35,36], dispersive liquid-liquid
microextraction combined with GC-MS [37], and other microextraction techniques
[2,15,38–41]. As shown in the table, the MDLs of the present method are much lower
than those of EPA methods, and comparable to those of other extraction- based systems.
Recovery test and real water analysis
Water samples from the Ter (sample from November 2016) and Llémena rivers
were fortified at two concentration levels, 100 ng L−1 and 250 ng L−1, to determine the
overall method recovery by comparing the concentration obtained using the calibration
curve with the initial spiked level. The selection of the fortified levels was based on the
regulated values according to the Water Framework Directive. In Figure 3.34a), the
chromatographic peaks obtained for the three fortified pesticides are depicted.
Satisfactory recoveries were found ranging from 85% to 119% for the three compounds.
Intra-day precision was determined and we found RSD from 2% to 21%, the latter value
for DZ. These values can be considered satisfactory for the ng L−1 concentration range
[42].
The practical applicability of the PIM-assisted extraction method was
demonstrated by determining the concentration of CP, DZ and CYP in water samples
from the Ter, Tordera, Llémena and Riells rivers. As shown in Figure 3.34b), only in the
case of the Ter River water (sample from July 2016) was CP found at a concentration of
36 ng L−1. Traces of DZ can also be observed below the MQL. As has been mentioned,
CP is a pesticide that is commonly used today in our country and which has been found
in other river water samples in Catalonia. For example, in the Llobregat River water, a
maximum value of 6.23 ng L−1 was determined in 2010 and of 13.65 ng L−1 in 2011 [24].
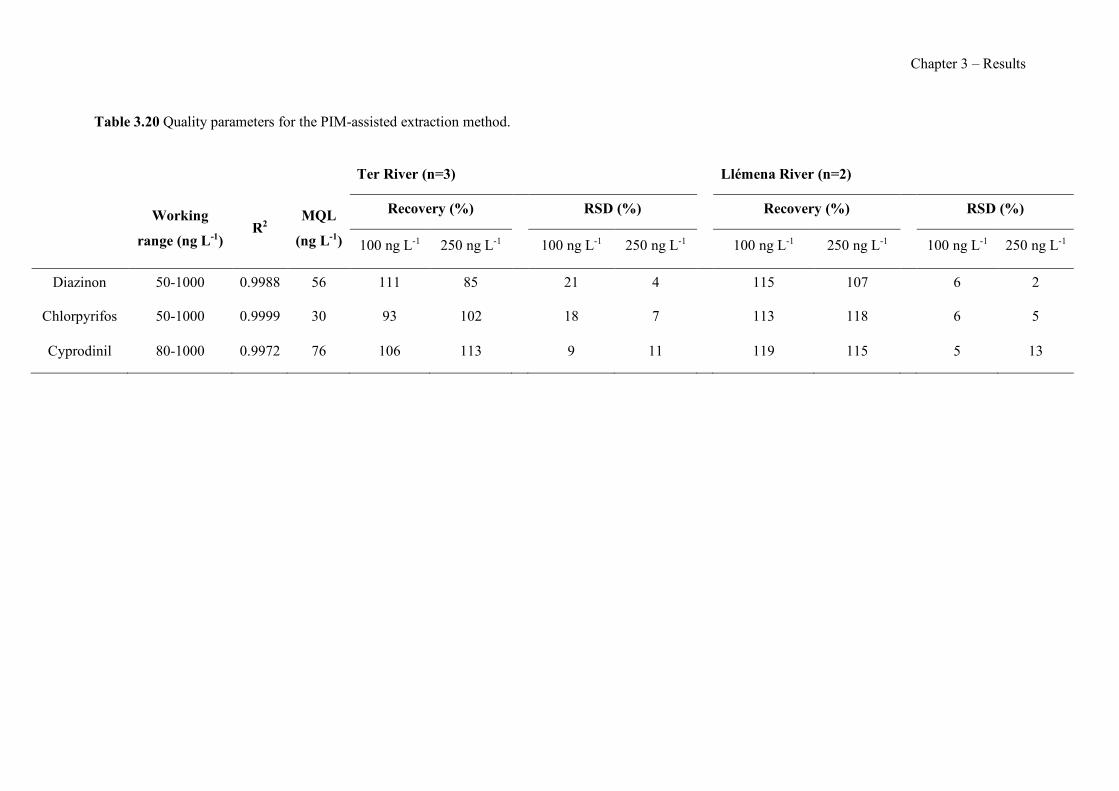
Chapter 3 – Results
Table 3.20 Quality parameters for the PIM-assisted extraction method.
Ter River (n=3) Llémena River (n=2)
Working
range (ng L-1) R2
MQL
(ng L-1)
Recovery (%) RSD (%) Recovery (%) RSD (%)
100 ng L-1 250 ng L-1 100 ng L-1 250 ng L-1 100 ng L-1 250 ng L-1 100 ng L-1 250 ng L-1
Diazinon 50-1000 0.9988 56 111 85 21 4 115 107 6 2
Chlorpyrifos 50-1000 0.9999 30 93 102 18 7 113 118 6 5
Cyprodinil 80-1000 0.9972 76 106 113 9 11 119 115 5 13
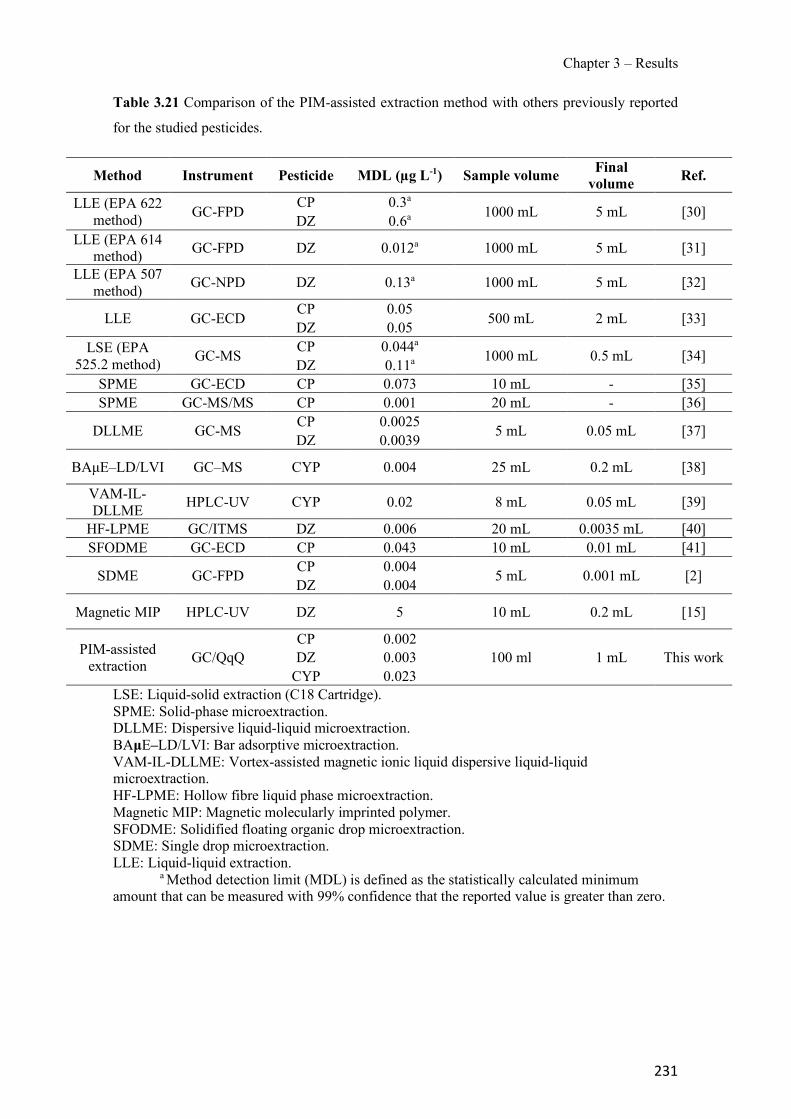
Chapter 3 – Results
231
Table 3.21 Comparison of the PIM-assisted extraction method with others previously reported
for the studied pesticides.
Method Instrument Pesticide MDL (µg L-1) Sample volume Final volume Ref.
LLE (EPA 622 method) GC-FPD CP 0.3a
1000 mL 5 mL [30] DZ 0.6a
LLE (EPA 614 method) GC-FPD DZ 0.012a 1000 mL 5 mL [31]
LLE (EPA 507 method) GC-NPD DZ 0.13a 1000 mL 5 mL [32]
LLE GC-ECD CP 0.05 500 mL 2 mL [33] DZ 0.05 LSE (EPA
525.2 method) GC-MS CP 0.044a
1000 mL 0.5 mL [34] DZ 0.11a
SPME GC-ECD CP 0.073 10 mL - [35] SPME GC-MS/MS CP 0.001 20 mL - [36]
DLLME GC-MS CP 0.0025 5 mL 0.05 mL [37] DZ 0.0039
BAµE–LD/LVI GC–MS CYP 0.004 25 mL 0.2 mL [38]
VAM-IL-DLLME HPLC-UV CYP 0.02 8 mL 0.05 mL [39]
HF-LPME GC/ITMS DZ 0.006 20 mL 0.0035 mL [40] SFODME GC-ECD CP 0.043 10 mL 0.01 mL [41]
SDME GC-FPD CP 0.004 5 mL 0.001 mL [2] DZ 0.004
Magnetic MIP HPLC-UV DZ 5 10 mL 0.2 mL [15]
PIM-assisted extraction GC/QqQ
CP 0.002 100 ml 1 mL This work DZ 0.003
CYP 0.023 LSE: Liquid-solid extraction (C18 Cartridge). SPME: Solid-phase microextraction. DLLME: Dispersive liquid-liquid microextraction. BAµE–LD/LVI: Bar adsorptive microextraction. VAM-IL-DLLME: Vortex-assisted magnetic ionic liquid dispersive liquid-liquid microextraction. HF-LPME: Hollow fibre liquid phase microextraction. Magnetic MIP: Magnetic molecularly imprinted polymer. SFODME: Solidified floating organic drop microextraction. SDME: Single drop microextraction. LLE: Liquid-liquid extraction. a Method detection limit (MDL) is defined as the statistically calculated minimum amount that can be measured with 99% confidence that the reported value is greater than zero.
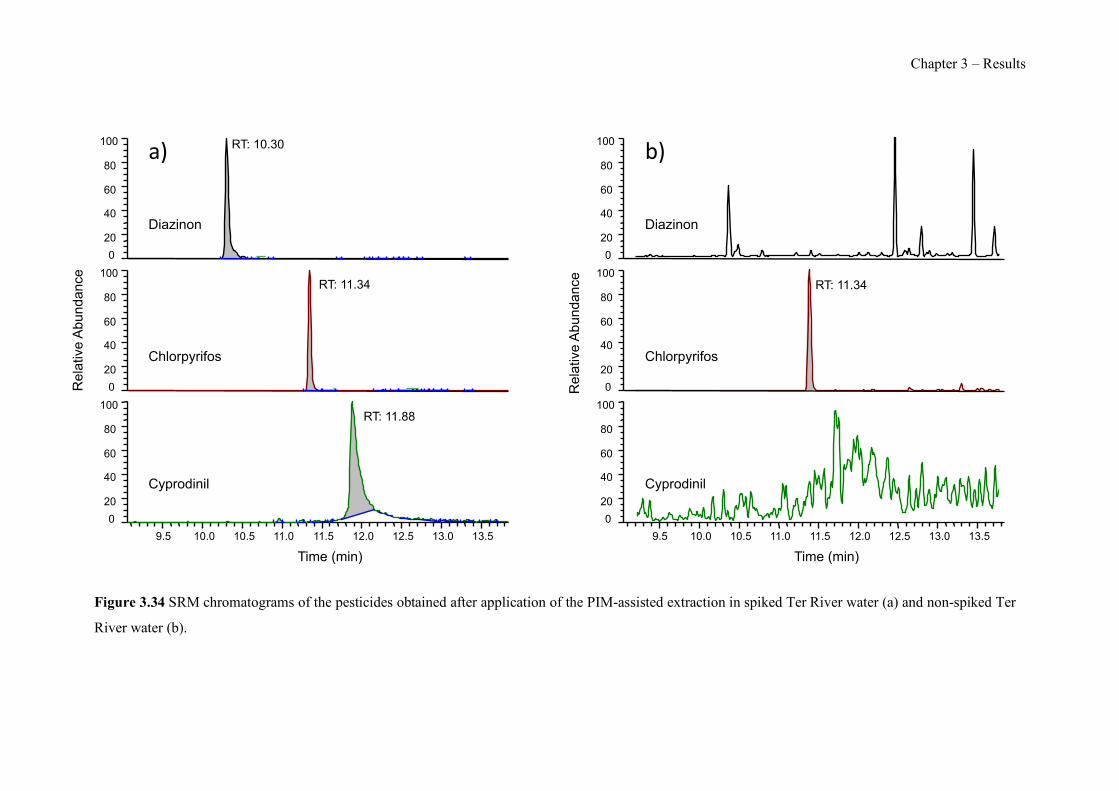
Chapter 3 – Results
Figure 3.34 SRM chromatograms of the pesticides obtained after application of the PIM-assisted extraction in spiked Ter River water (a) and non-spiked Ter
River water (b).
9.5 10.0 10.5 11.0 11.5 12.0 12.5 13.0 13.5 Time (min)
0 20 40 60 80
100 0
20 40 60 80
100
Rel
ativ
e A
bund
ance 0
20 40 60 80
100 RT: 10.30
RT: 11.34
RT: 11.88
Diazinon
Chlorpyrifos
Cyprodinil
RT: 11.34
9.5 10.0 10.5 11.0 11.5 12.0 12.5 13.0 13.5 Time (min)
0 20 40 60 80
100 0
20 40 60 80
100
Rel
ativ
e A
bund
ance 0
20 40 60 80
100
Diazinon
Chlorpyrifos
Cyprodinil
!"# $"#
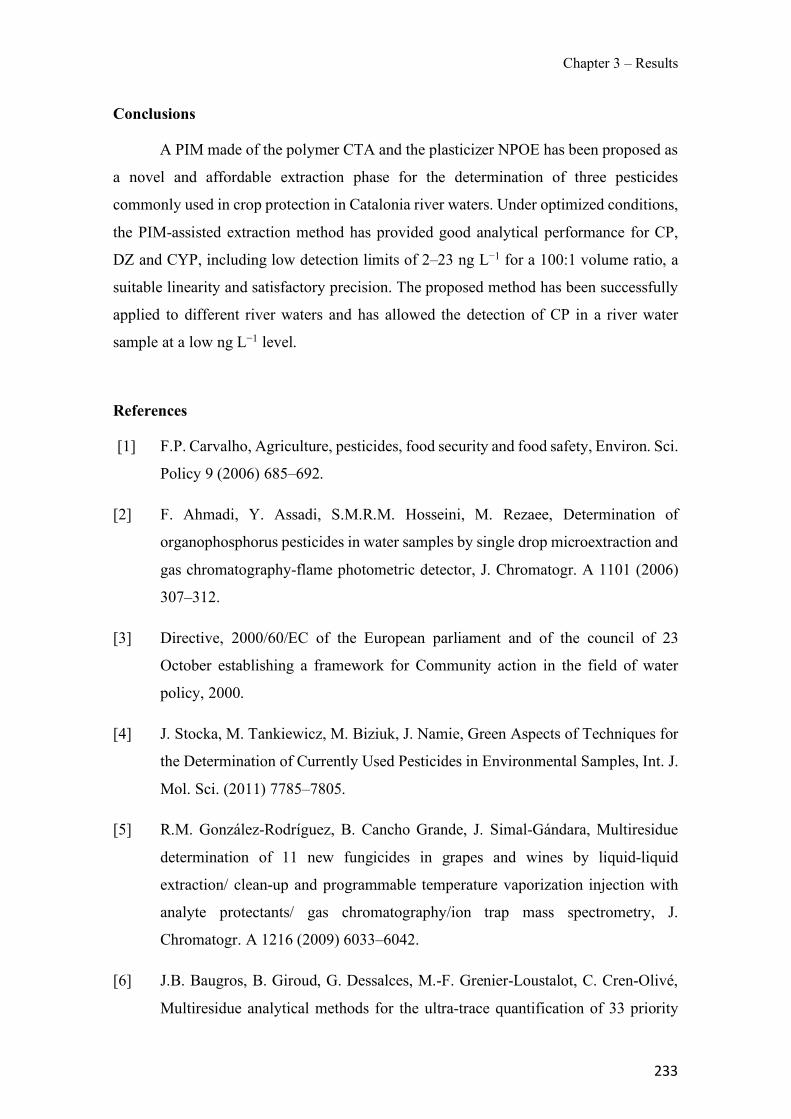
Chapter 3 – Results
233
Conclusions
A PIM made of the polymer CTA and the plasticizer NPOE has been proposed as
a novel and affordable extraction phase for the determination of three pesticides
commonly used in crop protection in Catalonia river waters. Under optimized conditions,
the PIM-assisted extraction method has provided good analytical performance for CP,
DZ and CYP, including low detection limits of 2–23 ng L−1 for a 100:1 volume ratio, a
suitable linearity and satisfactory precision. The proposed method has been successfully
applied to different river waters and has allowed the detection of CP in a river water
sample at a low ng L−1 level.
References
[1] F.P. Carvalho, Agriculture, pesticides, food security and food safety, Environ. Sci.
Policy 9 (2006) 685–692.
[2] F. Ahmadi, Y. Assadi, S.M.R.M. Hosseini, M. Rezaee, Determination of
organophosphorus pesticides in water samples by single drop microextraction and
gas chromatography-flame photometric detector, J. Chromatogr. A 1101 (2006)
307–312.
[3] Directive, 2000/60/EC of the European parliament and of the council of 23
October establishing a framework for Community action in the field of water
policy, 2000.
[4] J. Stocka, M. Tankiewicz, M. Biziuk, J. Namie, Green Aspects of Techniques for
the Determination of Currently Used Pesticides in Environmental Samples, Int. J.
Mol. Sci. (2011) 7785–7805.
[5] R.M. González-Rodríguez, B. Cancho Grande, J. Simal-Gándara, Multiresidue
determination of 11 new fungicides in grapes and wines by liquid-liquid
extraction/ clean-up and programmable temperature vaporization injection with
analyte protectants/ gas chromatography/ion trap mass spectrometry, J.
Chromatogr. A 1216 (2009) 6033–6042.
[6] J.B. Baugros, B. Giroud, G. Dessalces, M.-F. Grenier-Loustalot, C. Cren-Olivé,
Multiresidue analytical methods for the ultra-trace quantification of 33 priority
Chapter 3 – Results
234
substances present in the list of REACH in real water samples, Anal. Chim. Acta
607 (2008) 191–203.
[7] C. Margoum, C. Guillemain, X. Yang, M. Coquery, Stir bar sorptive extraction
coupled to liquid chromatography-tandem mass spectrometry for the
determination of pesticides in water samples: method validation and measurement
uncertainty, Talanta 116 (2013) 1–7.
[8] Q. Wu, C. Feng, G. Zhao, C. Wang, Z. Wang, Graphene-coated fiber for solid-
phase microextraction of triazine herbicides in water samples, J. Sep. Sci. 35
(2012) 193–199.
[9] R. Montes, I. Rodríguez, E. Rubí, M. Ramil, R. Cela, Suitability of polypropylene
microporous membranes for liquid- and solid-phase extraction of halogenated
anisoles from water samples, J. Chromatogr. A 1198– 1199 (2008) 21–26.
[10] J.P. dos Anjos, J.B. de Andrade, Simultaneous determination of pesticide
multiresidues in white wine and rosé wine by SDME/GC-MS, Microchem. J. 120
(2015) 69–76.
[11] L. Fu, X. Liu, J. Hu, X. Zhao, H. Wang, X. Wang, Application of dispersive
liquidliquid microextraction for the analysis of triazophos and carbaryl pesticides
in water and fruit juice samples, Anal. Chim. Acta 632 (2009) 289–295.
[12] P. Liang, F. Wang, Q. Wan, Ionic liquid-based ultrasound-assisted emulsification
microextraction coupled with high performance liquid chromatography for the
determination of four fungicides in environmental water samples, Talanta 105
(2013) 57–62.
[13] Y. Wen, J. Li, F. Yang, W. Zhang, W. Li, C. Liao, et al., Salting-out assisted
liquidliquid extraction with the aid of experimental design for determination of
benzimidazole fungicides in high salinity samples by high-performance liquid
chromatography, Talanta 106 (2013) 119–126.
[14] H. Farahani, Y. Yamini, S. Shariati, M.R. Khalili-Zanjani, S. Mansour-Baghahi,
Development of liquid phase microextraction method based on solidification of
floated organic drop for extraction and preconcentration of organochlorine
pesticides in water samples, Anal. Chim. Acta 626 (2008) 166–173.

Chapter 3 – Results
235
[15] F. Zare, M. Ghaedi, A. Daneshfar, A. Ostovan, Magnetic molecularly imprinted
polymer for the efficient and selective preconcentration of diazinon before its
determination by high-performance liquid chromatography, J. Sep. Sci. 38 (2015)
2797–2803.
[16] Z. Li, M. Hou, S. Bai, C. Wang, Z. Wang, Extraction of Imide Fungicides in water
and juice samples using magnetic graphene nanoparticles as adsorbent followed
by their determination with gas chromatography and electron capture detection,
Anal. Sci. 29 (2013) 325–331.
[17] E. Boyaci, K. Goryńksi, C.R. Viteri, J. Pawliszyn, A study of thin film solid phase
microextraction methods for analysis of fluorinated benzoic acids in seawater, J.
Chromatogr. A 1436 (2016) 51–58.
[18] A. Martin, C. Margoum, J. Randon, M. Coquery, Silicone rubber selection for
passive sampling of pesticides in water, Talanta 160 (2016) 306–313.
[19] A. Garcia-Rodríguez, V. Matamoros, S.D. Kolev, C. Fontàs, Development of a
polymer inclusion membrane (PIM) for the preconcentration of antibiotics in
environmental water samples, J. Membr. Sci. 492 (2015) 32–39.
[20] L. Nghiem, P. Mornane, I. Potter, J. Perera, R. Cattrall, S. Kolev, Extraction and
transport of metal ions and small organic compounds using polymer inclusion
membranes (PIMs), J. Membr. Sci. 281 (2006) 7–41.
[21] E. Marguí, C. Fontàs, K. Van Meel, R. Van Grieken, I. Queralt, M. Hidalgo, High-
Energy Polarized-Beam Energy-Dispersive X-ray Fluorescence Analysis
Combined with Activated Thin Layers for Cadmium Determination at Trace
Levels in Complex Environmental Liquid Samples, Anal. Chem. 80 (2008) 2357–
2364.
[22] C. Fontàs, I. Queralt, M. Hidalgo, Novel and selective procedure for Cr (VI)
determination by X-ray fluorescence analysis after membrane concentration,
Spectroch, Acta 61 (2006) 407–413.
[23] C. Fontàs, E. Marguí, M. Hidalgo, I. Queralt, Improvement approaches for the
determination of Cr(VI), Cd(II), Pd(II) and Pt(IV) contained in aqueous samples
by conventional XRF instrumentation, X-Ray Spectrom. 38 (2009) 9–17.
Chapter 3 – Results
236
[24] M. Correia, C. Delerue-Matos, A. Alves, Multi-residue methodology for pesticide
screening in wines, J. Chromatogr. A 889 (2000) 59–67.
[25] R. Güell, E. Anticó, S.D. Kolev, J. Benavente, V. Salvadó, C. Fontàs,
Development and characterization of polymer inclusion membranes for the
separation and speciation of inorganic As species, J. Membr. Sci. 383 (2011) 88–
95.
[26] M. Caban, N. Migowska, P. Stepnowski, M. Kwiatkowski, J. Kumirska, Matrix
effects and recovery calculations in analyses of pharmaceuticals based on the
determination of β-blockers and β-agonists in environmental samples, J.
Chromatogr. A 1258 (2012) 117–127.
[27] A. Masiá, J. Campo, A. Navarro-Ortega, D. Barceló, Y. Picó, Pesticide monitoring
in the basin of Llobregat River (Catalonia, Spain) and comparison with historical
data, Sci. Total Environ. 503– 504 (2015) 58–68.
[28] S. Walorczyk, Development of a multi-residue screening method for the
determination of pesticides in cereals and dry animal feed using gas
chromatography-triple quadrupole tandem mass spectrometry, J. Chromatogr. A
1165 (2007) 200–212.
[29] S.S. Lakade, F. Borrull, K.G. Furton, A. Kabir, R.M. Marcé, N. Fontanals,
Dynamic fabric phase sorptive extraction for a group of pharmaceuticals and
personal care products from environmental waters, J. Chromatogr. A 1456 (2016)
19–26.
[30] M. US EPA, method 622: the determination of organophosphorus Pesticides in
municipal and industrial wastewater.
https://www.epa.gov/sites/production/files/2015−10/documents/method_622_19
92.pdf (accessed 26 October 2016).
[31] M. US EPA, method 614: the determination of organophosphorus pesticides in
municipal and industrial wastewater. https://www.epa.gov/sites/production/files/
2015−10/documents/method_614_1992.pdf (accessed 26 October 2016).
[32] M. US EPA, method 507: determination of nitrogen - and phosphorous-
containing pesticides in water by gas chromatography with a nitrogen-
Chapter 3 – Results
237
phosphorous detector. ⟨https://www.epa.gov/sites/production/files/2015
07/documents/epa-507.pdf⟩ (accessed 26 October 2016), 1995.
[33] M.I.R. Mamun, J.H. Park, J.-H. Choi, H.K. Kim, W.J. Choi, S.-S. Han, et al.,
Development and validation of a multiresidue method for determination of 82
pesticides in water using GC, J. Sep. Sci. 32 (2009) 559–574.
[34] M. US EPA, test method 525.2: determination of organic compounds in drinking
water by liquid-solid extraction and capillary column Gas Chromatography/Mass
Spectrometry (accessed 26 October), (2016) ⟨https://www.epa.gov/sites/
production/files/2015-06/documents/epa-525.2.pdf⟩ (accessed 26 October).
[35] K. Korba, L. Pelit, F.O. Pelit, K.V. Ozdokur, H. Ertaş, A.E. Eroğlu, et al.,
Preparation and characterization of sodium dodecyl sulfate doped polypyrrole
solid phase micro extraction fiber and its application to endocrine disruptor
pesticide analysis, J. Chromatogr. B 929 (2013) 90–96.
[36] D. García-Rodríguez, A.M. Carro, R. a Lorenzo, F. Fernández, R. Cela,
Determination of trace levels of aquaculture chemotherapeutants in seawater
samples by SPME-GC-MS/MS, J. Sep. Sci. 31 (2008) 2882–2890.
[37] A.C.H. Alves, M.M.P.B. Gonçalves, M.M.S. Bernardo, B.S. Mendes, Validated
dispersive liquid-liquid microextraction for analysis of organophosphorous
pesticides in water, J. Sep. Sci. 34 (2011) 1326–1332.
[38] C. Almeida, J.M.F. Nogueira, Comparison of the selectivity of different sorbent
phases for bar adsorptive microextraction–Application to trace level analysis of
fungicides in real matrices, J. Chromatogr. A 1265 (2012) 7–16.
[39] M. Yang, X. Xi, X. Wu, R. Lu, W. Zhou, S. Zhang, et al., Vortex-assisted
magnetic β- cyclodextrin/attapulgite-linked ionic liquid dispersive liquid-liquid
microextraction coupled with high-performance liquid chromatography for the
fast determination of four fungicides in water samples, J. Chromatogr. A 1381
(2015) 37–47.
[40] P.-S. Chen, S.-D. Huang, Determination of ethoprop, diazinon, disulfoton and
fenthion using dynamic hollow fiber-protected liquid-phase microextraction
Chapter 3 – Results
238
coupled with gas chromatography-mass spectrometry, Talanta 69 (2006) 669–
675.
[41] F.O. Pelit, L. Pelit, C. Alaca, H. Ertaş, F.N. Ertaş, Preconcentration and
determination of Endocrine disruptor pesticides in well, Water Solidi. Float. Org.
Drop Micro., CLEAN - Soil, Air, Water 42 (2014) 1284–1291.
[42] AOAC Official Methods of analysis, Guidelines for standard method performance
requirements Appendix F, AOAC International, 2012, pp. 1–17.
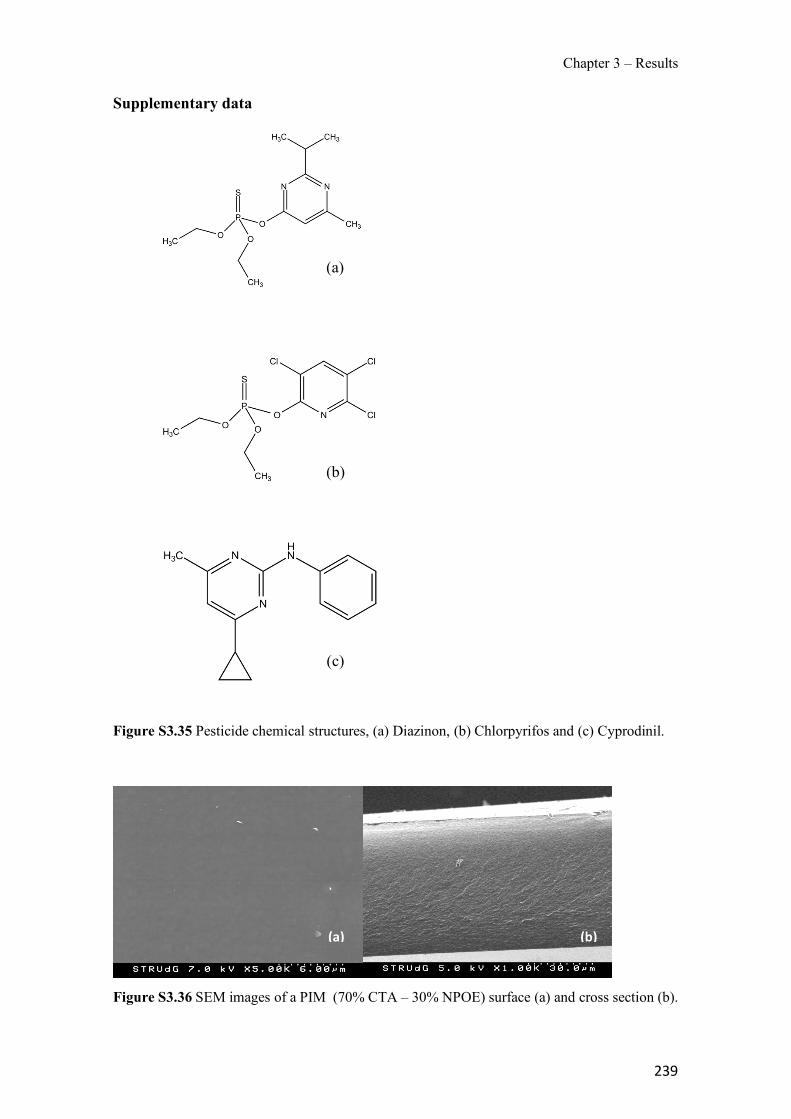
Chapter 3 – Results
239
Supplementary data
Figure S3.35 Pesticide chemical structures, (a) Diazinon, (b) Chlorpyrifos and (c) Cyprodinil.
Figure S3.36 SEM images of a PIM (70% CTA – 30% NPOE) surface (a) and cross section (b).
(b) (a)
(a)
(c)
(b)
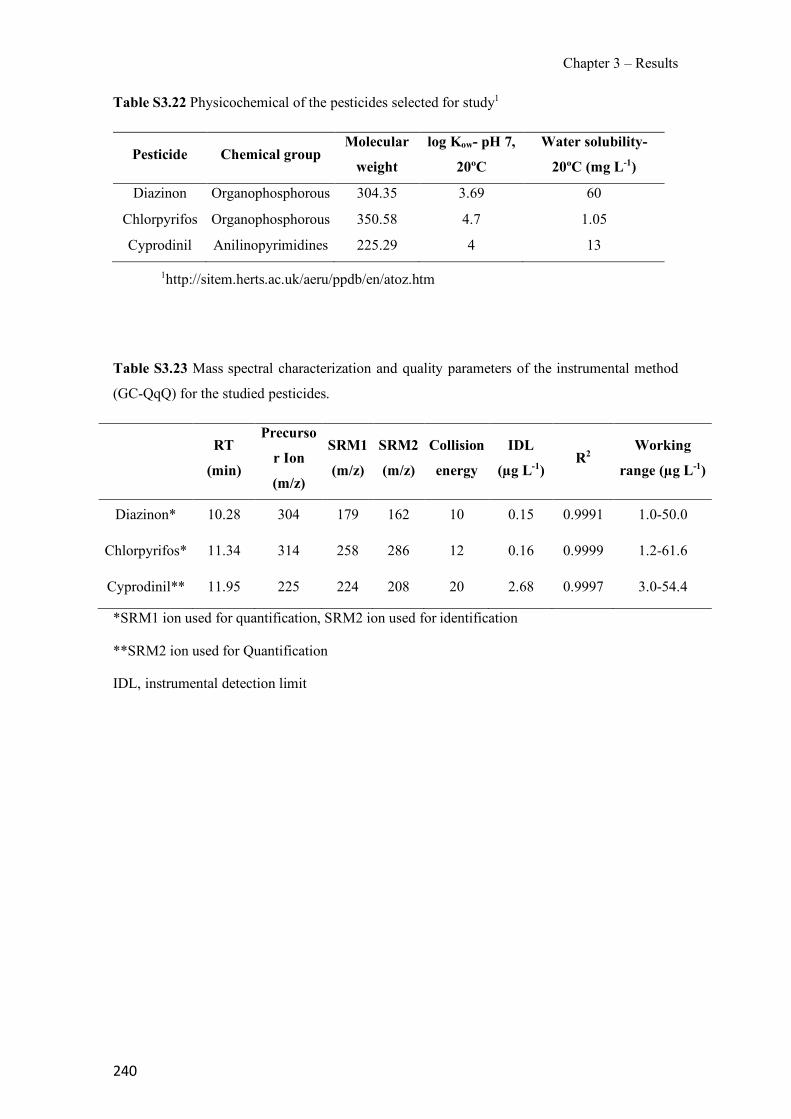
Chapter 3 – Results
240
Table S3.22 Physicochemical of the pesticides selected for study1
Pesticide Chemical group Molecular
weight
log Kow- pH 7,
20ºC
Water solubility-
20ºC (mg L-1)
Diazinon Organophosphorous 304.35 3.69 60
Chlorpyrifos Organophosphorous 350.58 4.7 1.05
Cyprodinil Anilinopyrimidines 225.29 4 13
1http://sitem.herts.ac.uk/aeru/ppdb/en/atoz.htm
Table S3.23 Mass spectral characterization and quality parameters of the instrumental method
(GC-QqQ) for the studied pesticides.
RT
(min)
Precurso
r Ion
(m/z)
SRM1
(m/z)
SRM2
(m/z)
Collision
energy
IDL
(µg L-1) R2
Working
range (µg L-1)
Diazinon* 10.28 304 179 162 10 0.15 0.9991 1.0-50.0
Chlorpyrifos* 11.34 314 258 286 12 0.16 0.9999 1.2-61.6
Cyprodinil** 11.95 225 224 208 20 2.68 0.9997 3.0-54.4
*SRM1 ion used for quantification, SRM2 ion used for identification
**SRM2 ion used for Quantification
IDL, instrumental detection limit

Chapter 3 – Results
241
Table 3.24 Chemical structure and physical properties of plasticizers used in this study.
Name Structure Viscosity
Pa·s (cP)
Dielectric
constant
(ε)
2-
nitrophenyl
octyl ether
(NPOE)
12.8·10-3 23.1
Bis (2-
ethylhexyl)
sebacate
(DEHS)
9.5·10-3 4.5
Bis (1-
butylpentyl)
adipate
(BBPA)
14·10-3 4


CHAPTER 4
General discussion and future perspectives

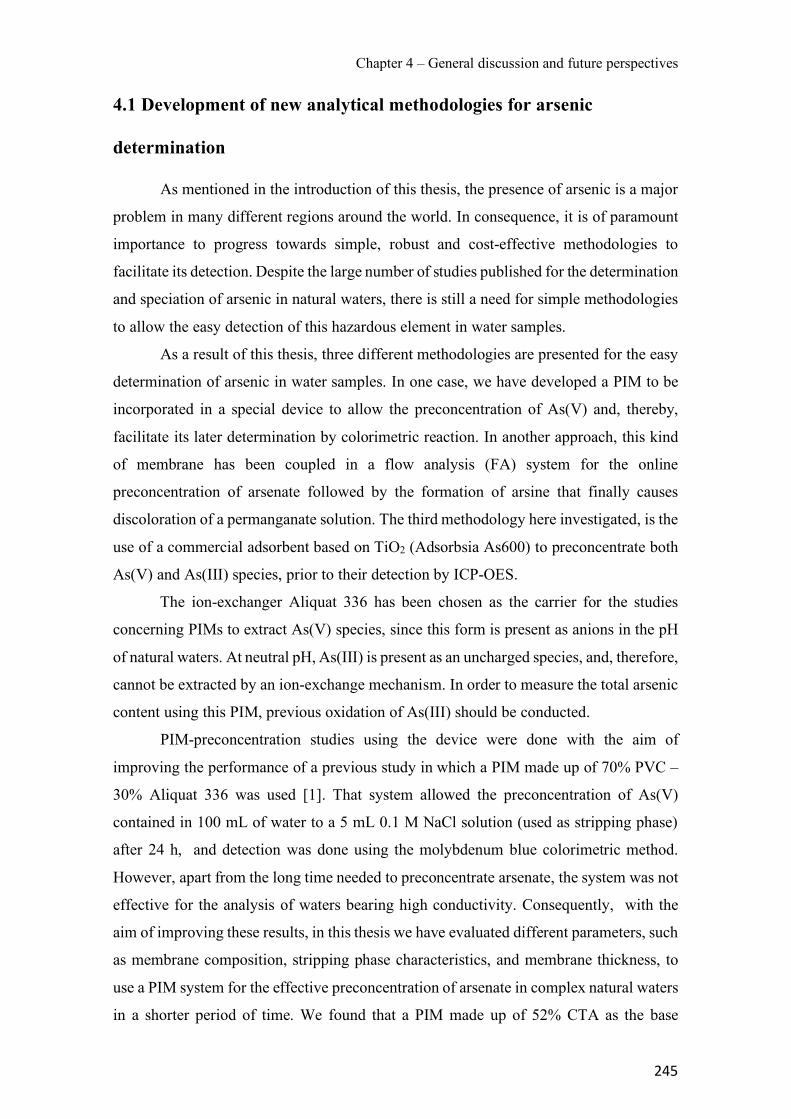
Chapter 4 – General discussion and future perspectives
245
4.1 Development of new analytical methodologies for arsenic
determination
As mentioned in the introduction of this thesis, the presence of arsenic is a major
problem in many different regions around the world. In consequence, it is of paramount
importance to progress towards simple, robust and cost-effective methodologies to
facilitate its detection. Despite the large number of studies published for the determination
and speciation of arsenic in natural waters, there is still a need for simple methodologies
to allow the easy detection of this hazardous element in water samples.
As a result of this thesis, three different methodologies are presented for the easy
determination of arsenic in water samples. In one case, we have developed a PIM to be
incorporated in a special device to allow the preconcentration of As(V) and, thereby,
facilitate its later determination by colorimetric reaction. In another approach, this kind
of membrane has been coupled in a flow analysis (FA) system for the online
preconcentration of arsenate followed by the formation of arsine that finally causes
discoloration of a permanganate solution. The third methodology here investigated, is the
use of a commercial adsorbent based on TiO2 (Adsorbsia As600) to preconcentrate both
As(V) and As(III) species, prior to their detection by ICP-OES.
The ion-exchanger Aliquat 336 has been chosen as the carrier for the studies
concerning PIMs to extract As(V) species, since this form is present as anions in the pH
of natural waters. At neutral pH, As(III) is present as an uncharged species, and, therefore,
cannot be extracted by an ion-exchange mechanism. In order to measure the total arsenic
content using this PIM, previous oxidation of As(III) should be conducted.
PIM-preconcentration studies using the device were done with the aim of
improving the performance of a previous study in which a PIM made up of 70% PVC –
30% Aliquat 336 was used [1]. That system allowed the preconcentration of As(V)
contained in 100 mL of water to a 5 mL 0.1 M NaCl solution (used as stripping phase)
after 24 h, and detection was done using the molybdenum blue colorimetric method.
However, apart from the long time needed to preconcentrate arsenate, the system was not
effective for the analysis of waters bearing high conductivity. Consequently, with the
aim of improving these results, in this thesis we have evaluated different parameters, such
as membrane composition, stripping phase characteristics, and membrane thickness, to
use a PIM system for the effective preconcentration of arsenate in complex natural waters
in a shorter period of time. We found that a PIM made up of 52% CTA as the base
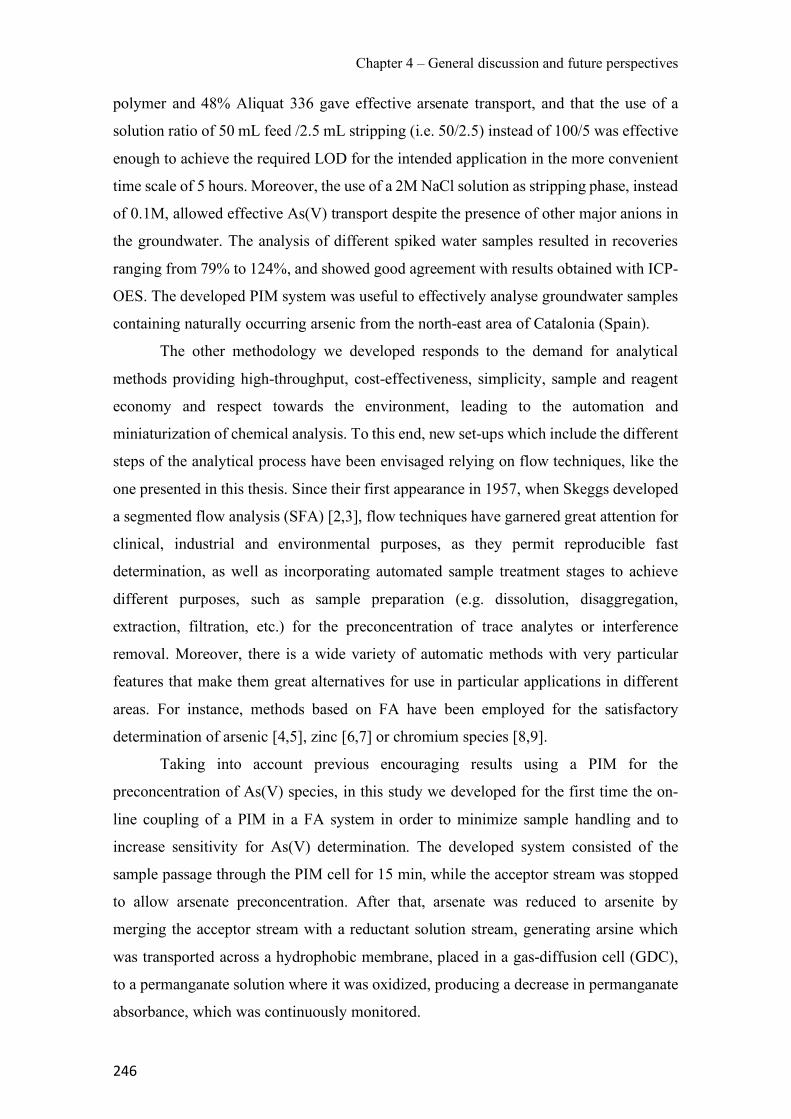
Chapter 4 – General discussion and future perspectives
246
polymer and 48% Aliquat 336 gave effective arsenate transport, and that the use of a
solution ratio of 50 mL feed /2.5 mL stripping (i.e. 50/2.5) instead of 100/5 was effective
enough to achieve the required LOD for the intended application in the more convenient
time scale of 5 hours. Moreover, the use of a 2M NaCl solution as stripping phase, instead
of 0.1M, allowed effective As(V) transport despite the presence of other major anions in
the groundwater. The analysis of different spiked water samples resulted in recoveries
ranging from 79% to 124%, and showed good agreement with results obtained with ICP-
OES. The developed PIM system was useful to effectively analyse groundwater samples
containing naturally occurring arsenic from the north-east area of Catalonia (Spain).
The other methodology we developed responds to the demand for analytical
methods providing high-throughput, cost-effectiveness, simplicity, sample and reagent
economy and respect towards the environment, leading to the automation and
miniaturization of chemical analysis. To this end, new set-ups which include the different
steps of the analytical process have been envisaged relying on flow techniques, like the
one presented in this thesis. Since their first appearance in 1957, when Skeggs developed
a segmented flow analysis (SFA) [2,3], flow techniques have garnered great attention for
clinical, industrial and environmental purposes, as they permit reproducible fast
determination, as well as incorporating automated sample treatment stages to achieve
different purposes, such as sample preparation (e.g. dissolution, disaggregation,
extraction, filtration, etc.) for the preconcentration of trace analytes or interference
removal. Moreover, there is a wide variety of automatic methods with very particular
features that make them great alternatives for use in particular applications in different
areas. For instance, methods based on FA have been employed for the satisfactory
determination of arsenic [4,5], zinc [6,7] or chromium species [8,9].
Taking into account previous encouraging results using a PIM for the
preconcentration of As(V) species, in this study we developed for the first time the on-
line coupling of a PIM in a FA system in order to minimize sample handling and to
increase sensitivity for As(V) determination. The developed system consisted of the
sample passage through the PIM cell for 15 min, while the acceptor stream was stopped
to allow arsenate preconcentration. After that, arsenate was reduced to arsenite by
merging the acceptor stream with a reductant solution stream, generating arsine which
was transported across a hydrophobic membrane, placed in a gas-diffusion cell (GDC),
to a permanganate solution where it was oxidized, producing a decrease in permanganate
absorbance, which was continuously monitored.
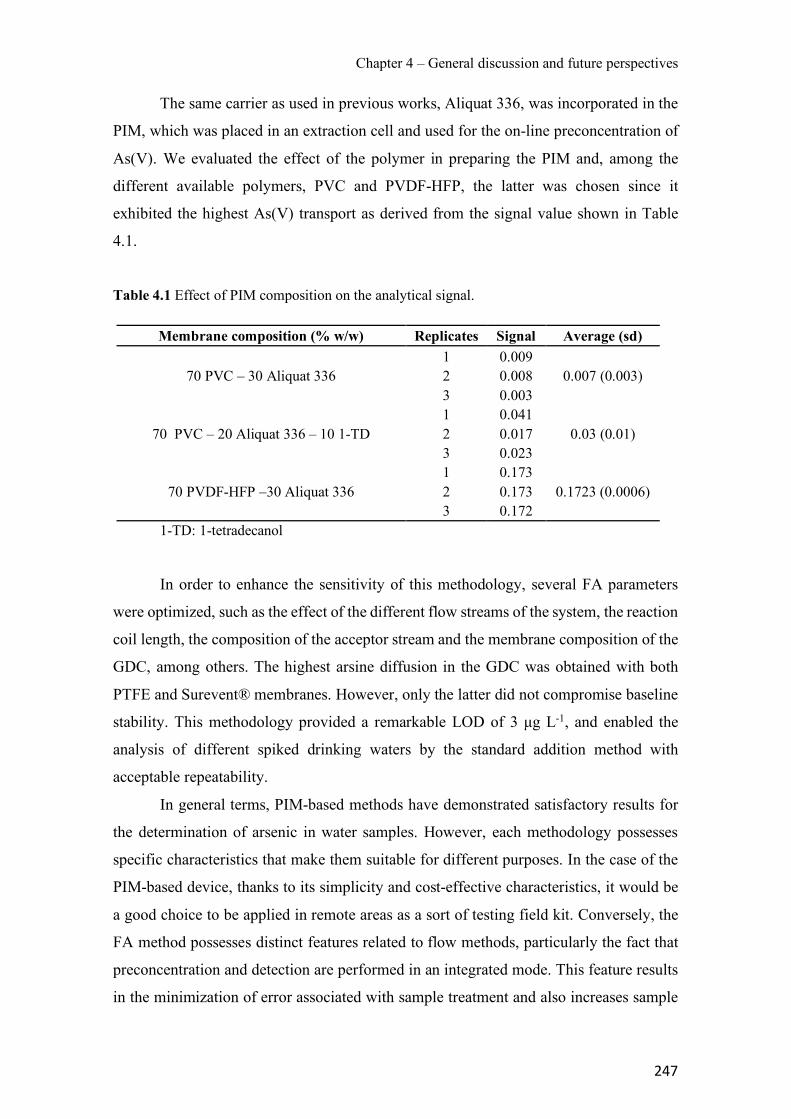
Chapter 4 – General discussion and future perspectives
247
The same carrier as used in previous works, Aliquat 336, was incorporated in the
PIM, which was placed in an extraction cell and used for the on-line preconcentration of
As(V). We evaluated the effect of the polymer in preparing the PIM and, among the
different available polymers, PVC and PVDF-HFP, the latter was chosen since it
exhibited the highest As(V) transport as derived from the signal value shown in Table
4.1.
Table 4.1 Effect of PIM composition on the analytical signal.
Membrane composition (% w/w) Replicates Signal Average (sd) 1 0.009
0.007 (0.003) 70 PVC – 30 Aliquat 336 2 0.008 3 0.003 1 0.041
0.03 (0.01) 70 PVC – 20 Aliquat 336 – 10 1-TD 2 0.017 3 0.023 1 0.173
0.1723 (0.0006) 70 PVDF-HFP –30 Aliquat 336 2 0.173 3 0.172
1-TD: 1-tetradecanol
In order to enhance the sensitivity of this methodology, several FA parameters
were optimized, such as the effect of the different flow streams of the system, the reaction
coil length, the composition of the acceptor stream and the membrane composition of the
GDC, among others. The highest arsine diffusion in the GDC was obtained with both
PTFE and Surevent® membranes. However, only the latter did not compromise baseline
stability. This methodology provided a remarkable LOD of 3 µg L-1, and enabled the
analysis of different spiked drinking waters by the standard addition method with
acceptable repeatability.
In general terms, PIM-based methods have demonstrated satisfactory results for
the determination of arsenic in water samples. However, each methodology possesses
specific characteristics that make them suitable for different purposes. In the case of the
PIM-based device, thanks to its simplicity and cost-effective characteristics, it would be
a good choice to be applied in remote areas as a sort of testing field kit. Conversely, the
FA method possesses distinct features related to flow methods, particularly the fact that
preconcentration and detection are performed in an integrated mode. This feature results
in the minimization of error associated with sample treatment and also increases sample
Chapter 4 – General discussion and future perspectives
248
throughput, which could be of interest for analytical laboratories devoted to the detection
of arsenic in waters.
As an alternative methodology, in this thesis we have also investigated the use of
the commercial sorbent Adsorbsia As600, which is specially designed for the removal of
arsenic in waters, for analytical purposes. This sorbent is based on TiO2, the crystalline
form of anatase with a small proportion of gypsum, and an average size of 7 nm.
The experimental capacity of the sorbent was evaluated under batch conditions, obtaining
values of 0.14 mmol g−1 (10.1 mg g−1) for As(V) and 0.21 mmol g−1 (16.5 mg g−1) for
As(III), at pH of 7.3, demonstrating the good performance of this material to adsorb both
inorganic forms of arsenic present in natural waters. The fact that no previous oxidation
of As(III) to As(V) is needed exposes this methodology as an attractive possibility to be
taken into account when the aim is to determine total arsenic content in water.
The presence of major anions commonly found in natural waters did not disturb
the efficiency of the system, as happens when sorbents based on an ion exchange
mechanism are used. Only the presence of 100 mg L-1 of silicate clearly diminished
arsenic adsorption, demonstrating that this sorbent is less sensitive to anionic
interferences.
Even though it is stated by the manufacturer that Adsorbsia As600 cannot be
regenerated, we investigated the elution of retained arsenic species to allow its detection
by ICP-OES. Among the elutants tested, only NaOH provided good results, although the
elution was not quantitative and deteriorated the sorbent. Percolating 50 mL of solution
through a minicolum packed with 60 mg of sorbent and using 2 mL of 0.5 M NaOH as
elutant, an LOD of 40 µg L-1 of arsenic was obtained. This LOD could be easily decreased
by using a larger amount of sample due to the high capacity of the sorbent.
The good results in terms of As adsorption using this TiO2 based sorbent could be
further explored, using, for example, this sorbent for the online preconcentration of both
inorganic arsenic species in a FA system or as a material to be incorporated into PIMs in
order to modify their properties. In the literature, different examples of the addition of
inorganic nanoparticles into polymeric membranes can be found, such as the inclusion of
gold [10], palladium [11] or SiO2 nanoparticles [12].
Chapter 4 – General discussion and future perspectives
249
4.2 Advances on PIMs
Despite the attractive features of PIMs, such as simplicity in preparation and
handling, different improvements are required to boost the applicability of this technique.
On the one hand, it is of utmost importance to explore new carriers to further enhance
stability of the membrane, and on the other, to develop new preparation routes avoiding
the use of harmful chemicals. In addition, focusing on a green membrane process, not
only the reduction of organic solvents is desirable, but the use of biodegradable or
renewable materials to replace oil-derived plastics is advisable.
To evaluate how slight differences on the components of the PIM affected the
physicochemical and electrical characteristics as well as membrane stability and
efficiency, we prepared Aliquat 336 derivatives to be incorporated as carriers in PIMs.
Hence, we obtained the derivatives AlqNO3 and AlqSCN and they were used to prepare
PIMs, along with the commercial compound AlqCl, with a composition of 30% or 60%
(w/w) in CTA. PIMs were fully characterized by different techniques. The morphology
of the resulting membranes was evaluated by means of SEM images. As shown in Figure
4.1, PIMs containing 30% of IL (see Figure 4.1 a1, b1 and c1) presented a dense, smooth
surface. Likewise, the same morphology was obtained for a PIM containing 60% of the
IL AlqCl (see Figure 4.1 a2), whereas PIMs based either on AlqNO3 or AlqSCN presented
spherical deposits on the surface (see Figure b2 and c2, respectively). This appearance
can be due to an aggregation of the IL, maybe due to low compatibility with the polymer
CTA, which is not observed in the case of AlqCl. Despite the presence of these deposits
on the surface, apparently none of the membranes presented an oily texture, which
indicated the totality of the IL was incorporated in the PIM.
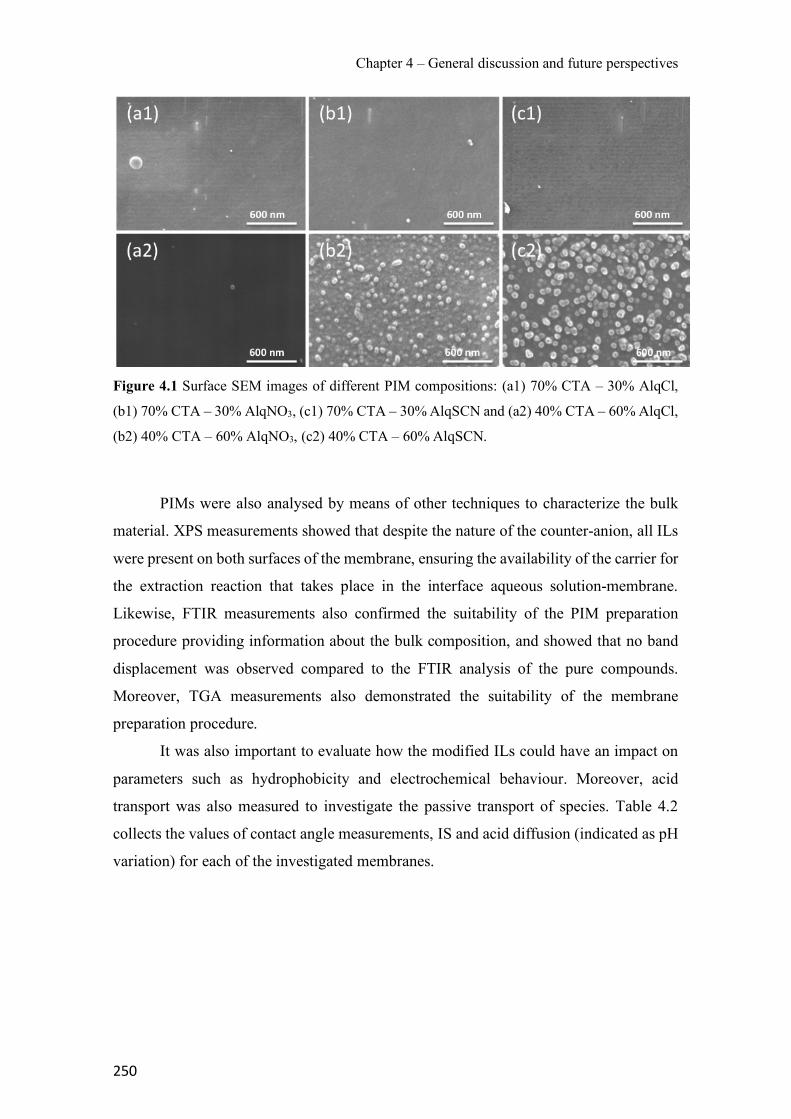
Chapter 4 – General discussion and future perspectives
250
Figure 4.1 Surface SEM images of different PIM compositions: (a1) 70% CTA – 30% AlqCl,
(b1) 70% CTA – 30% AlqNO3, (c1) 70% CTA – 30% AlqSCN and (a2) 40% CTA – 60% AlqCl,
(b2) 40% CTA – 60% AlqNO3, (c2) 40% CTA – 60% AlqSCN.
PIMs were also analysed by means of other techniques to characterize the bulk
material. XPS measurements showed that despite the nature of the counter-anion, all ILs
were present on both surfaces of the membrane, ensuring the availability of the carrier for
the extraction reaction that takes place in the interface aqueous solution-membrane.
Likewise, FTIR measurements also confirmed the suitability of the PIM preparation
procedure providing information about the bulk composition, and showed that no band
displacement was observed compared to the FTIR analysis of the pure compounds.
Moreover, TGA measurements also demonstrated the suitability of the membrane
preparation procedure.
It was also important to evaluate how the modified ILs could have an impact on
parameters such as hydrophobicity and electrochemical behaviour. Moreover, acid
transport was also measured to investigate the passive transport of species. Table 4.2
collects the values of contact angle measurements, IS and acid diffusion (indicated as pH
variation) for each of the investigated membranes.
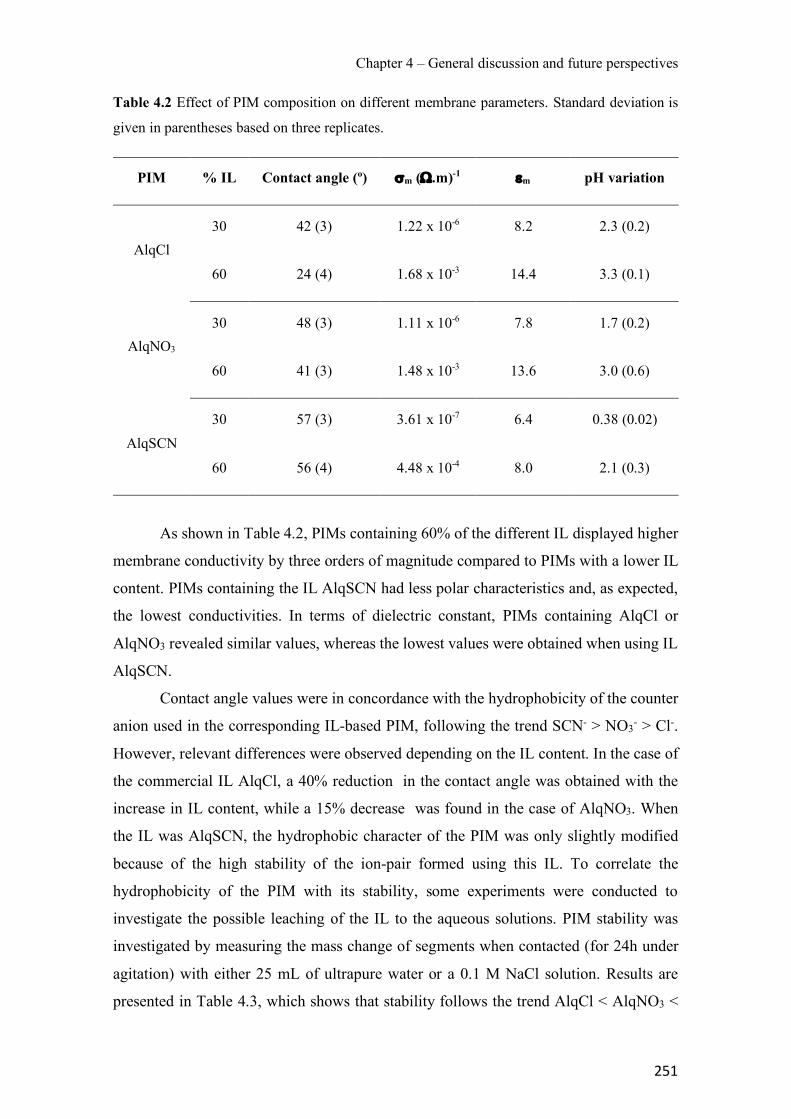
Chapter 4 – General discussion and future perspectives
251
Table 4.2 Effect of PIM composition on different membrane parameters. Standard deviation is
given in parentheses based on three replicates.
PIM % IL Contact angle (º) sm (W.m)-1 em pH variation
AlqCl 30 42 (3) 1.22 x 10⁻⁶ 8.2 2.3 (0.2)
60 24 (4) 1.68 x 10⁻³ 14.4 3.3 (0.1)
AlqNO3 30 48 (3) 1.11 x 10⁻⁶ 7.8 1.7 (0.2)
60 41 (3) 1.48 x 10⁻³ 13.6 3.0 (0.6)
AlqSCN 30 57 (3) 3.61 x 10⁻⁷ 6.4 0.38 (0.02)
60 56 (4) 4.48 x 10⁻⁴ 8.0 2.1 (0.3)
As shown in Table 4.2, PIMs containing 60% of the different IL displayed higher
membrane conductivity by three orders of magnitude compared to PIMs with a lower IL
content. PIMs containing the IL AlqSCN had less polar characteristics and, as expected,
the lowest conductivities. In terms of dielectric constant, PIMs containing AlqCl or
AlqNO3 revealed similar values, whereas the lowest values were obtained when using IL
AlqSCN.
Contact angle values were in concordance with the hydrophobicity of the counter
anion used in the corresponding IL-based PIM, following the trend SCN- > NO3- > Cl-.
However, relevant differences were observed depending on the IL content. In the case of
the commercial IL AlqCl, a 40% reduction in the contact angle was obtained with the
increase in IL content, while a 15% decrease was found in the case of AlqNO3. When
the IL was AlqSCN, the hydrophobic character of the PIM was only slightly modified
because of the high stability of the ion-pair formed using this IL. To correlate the
hydrophobicity of the PIM with its stability, some experiments were conducted to
investigate the possible leaching of the IL to the aqueous solutions. PIM stability was
investigated by measuring the mass change of segments when contacted (for 24h under
agitation) with either 25 mL of ultrapure water or a 0.1 M NaCl solution. Results are
presented in Table 4.3, which shows that stability follows the trend AlqCl < AlqNO3 <
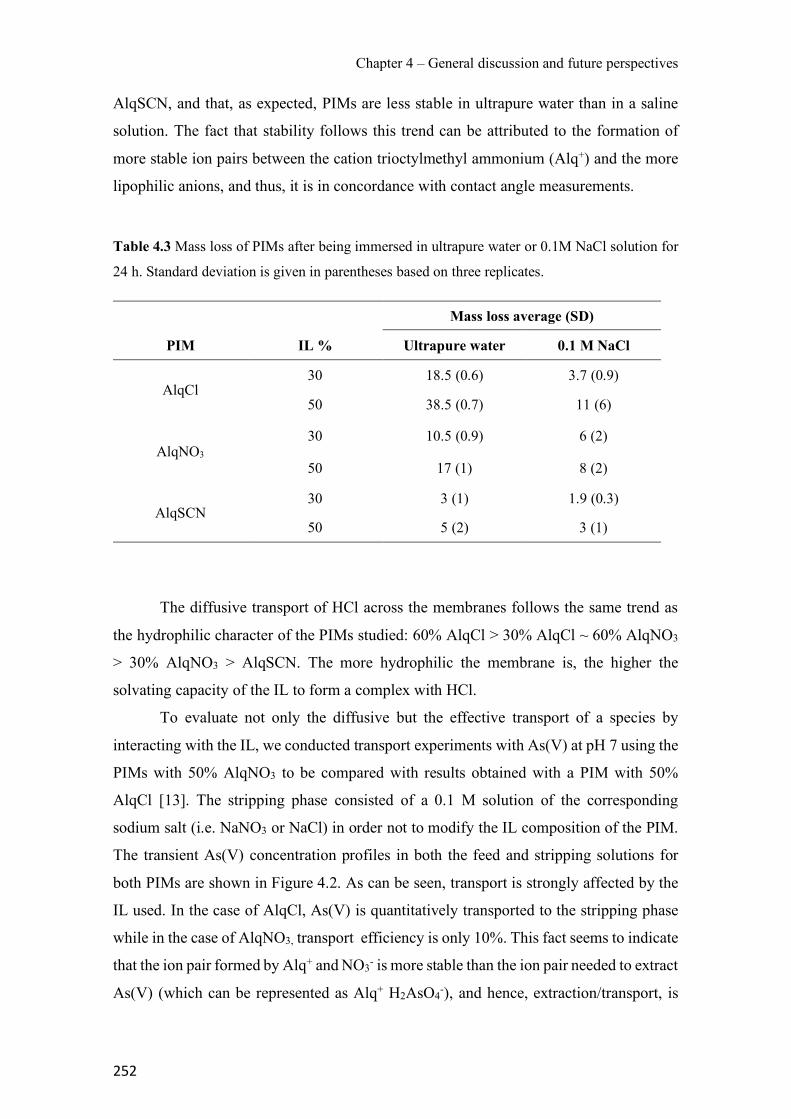
Chapter 4 – General discussion and future perspectives
252
AlqSCN, and that, as expected, PIMs are less stable in ultrapure water than in a saline
solution. The fact that stability follows this trend can be attributed to the formation of
more stable ion pairs between the cation trioctylmethyl ammonium (Alq+) and the more
lipophilic anions, and thus, it is in concordance with contact angle measurements.
Table 4.3 Mass loss of PIMs after being immersed in ultrapure water or 0.1M NaCl solution for
24 h. Standard deviation is given in parentheses based on three replicates.
Mass loss average (SD)
PIM IL % Ultrapure water 0.1 M NaCl
AlqCl 30 18.5 (0.6) 3.7 (0.9)
50 38.5 (0.7) 11 (6)
AlqNO3 30 10.5 (0.9) 6 (2)
50 17 (1) 8 (2)
AlqSCN 30 3 (1) 1.9 (0.3)
50 5 (2) 3 (1)
The diffusive transport of HCl across the membranes follows the same trend as
the hydrophilic character of the PIMs studied: 60% AlqCl > 30% AlqCl ~ 60% AlqNO3
> 30% AlqNO3 > AlqSCN. The more hydrophilic the membrane is, the higher the
solvating capacity of the IL to form a complex with HCl.
To evaluate not only the diffusive but the effective transport of a species by
interacting with the IL, we conducted transport experiments with As(V) at pH 7 using the
PIMs with 50% AlqNO3 to be compared with results obtained with a PIM with 50%
AlqCl [13]. The stripping phase consisted of a 0.1 M solution of the corresponding
sodium salt (i.e. NaNO3 or NaCl) in order not to modify the IL composition of the PIM.
The transient As(V) concentration profiles in both the feed and stripping solutions for
both PIMs are shown in Figure 4.2. As can be seen, transport is strongly affected by the
IL used. In the case of AlqCl, As(V) is quantitatively transported to the stripping phase
while in the case of AlqNO3, transport efficiency is only 10%. This fact seems to indicate
that the ion pair formed by Alq+ and NO3- is more stable than the ion pair needed to extract
As(V) (which can be represented as Alq+ H2AsO4-), and hence, extraction/transport, is
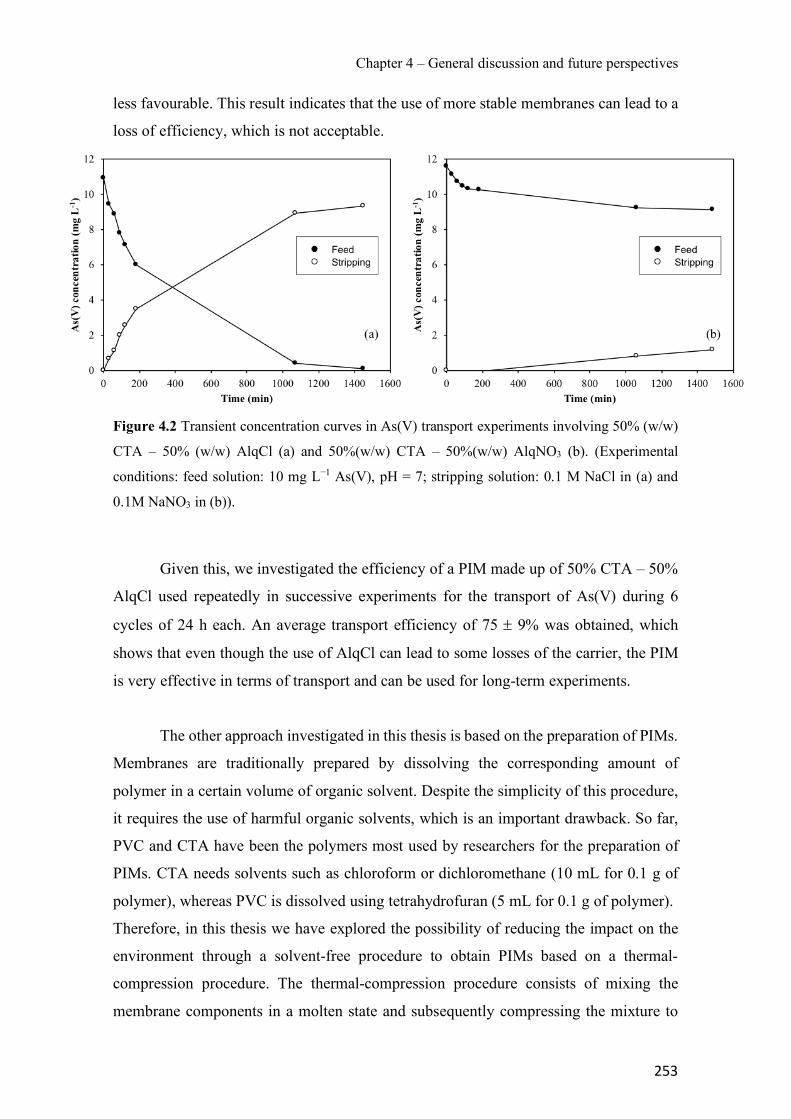
Chapter 4 – General discussion and future perspectives
253
less favourable. This result indicates that the use of more stable membranes can lead to a
loss of efficiency, which is not acceptable.
Figure 4.2 Transient concentration curves in As(V) transport experiments involving 50% (w/w)
CTA – 50% (w/w) AlqCl (a) and 50%(w/w) CTA – 50%(w/w) AlqNO3 (b). (Experimental
conditions: feed solution: 10 mg L−1 As(V), pH = 7; stripping solution: 0.1 M NaCl in (a) and
0.1M NaNO3 in (b)).
Given this, we investigated the efficiency of a PIM made up of 50% CTA – 50%
AlqCl used repeatedly in successive experiments for the transport of As(V) during 6
cycles of 24 h each. An average transport efficiency of 75 ± 9% was obtained, which
shows that even though the use of AlqCl can lead to some losses of the carrier, the PIM
is very effective in terms of transport and can be used for long-term experiments.
The other approach investigated in this thesis is based on the preparation of PIMs.
Membranes are traditionally prepared by dissolving the corresponding amount of
polymer in a certain volume of organic solvent. Despite the simplicity of this procedure,
it requires the use of harmful organic solvents, which is an important drawback. So far,
PVC and CTA have been the polymers most used by researchers for the preparation of
PIMs. CTA needs solvents such as chloroform or dichloromethane (10 mL for 0.1 g of
polymer), whereas PVC is dissolved using tetrahydrofuran (5 mL for 0.1 g of polymer).
Therefore, in this thesis we have explored the possibility of reducing the impact on the
environment through a solvent-free procedure to obtain PIMs based on a thermal-
compression procedure. The thermal-compression procedure consists of mixing the
membrane components in a molten state and subsequently compressing the mixture to
Chapter 4 – General discussion and future perspectives
254
obtain a thin film. The main consideration to be taken into account when using this
procedure, is the thermal stability of membrane components. PVC or CTA are not
advisable polymers due to the very high temperatures required to reach the melting point.
Hence, two thermoplastic polymers were tested with good feasible characteristics,
namely TPU and PCL. A high percentage of the polymer TPU is produced from
renewable sources, whereas PCL is a biodegradable polymer that can decompose in the
media after its use. Membranes were prepared by mixing these polymers with Aliquat
336 at 30% content (w/w) by the thermal compression technique, and the obtained films
were characterized by elemental analysis, TGA and SEM. Elemental analysis results
correlated with the expected composition of the membranes. However, when TGA
analysis was conducted in the case of membranes based on PCL, it was shown that a
partial decomposition of Aliquat 336 shifted to higher temperatures, which could be
explained by certain interactions between the IL and the polymeric matrix.
With regard to the SEM images, TPU-based membrane presented a porous
structure with the presence of nano-pores, whereas the membrane constituted by PCL
showed a dense structure with some cavities. Nevertheless, the presence of these nano-
pores or cavities in both membrane compositions, did not affect the extraction abilities of
Aliquat 336, which was tested using a PIM segment immersed in a Cr(VI) solution. It is
well known that chromate is extracted by Aliquat 336 by an ion-exchange mechanism,
and in our study, both PIMs made of PCL and TPU effectively extracted the metal.
Moreover, the stability of the PIMs was also investigated, and it was found that PCL-
based membranes are the most stable and thus, can be an attractive polymer to be taken
into account to prepare more eco-friendly and stable PIMs.
We have proved in this thesis the possibility of tuning PIM characteristics by
changing the counter-anion of a quaternary ammonium IL that can be of a great interest
depending on its application. Besides, a promising scenario towards greener membrane
preparation is opened using eco-friendly materials and avoiding the use of harmful
reagents, drastically reducing their impact on the environment.
4.3 Novel PIM applications
As presented in the previous sections, PIM systems are commonly employed for
the extraction, transport or removal of different analytes by using appropriate carriers in
Chapter 4 – General discussion and future perspectives
255
a mechanism based on the facilitated transport of target analytes against their
concentration gradient. However, new applications are yet to be explored. Thus, in this
thesis we have evaluated PIMs for speciation studies, measuring the free metal fraction
in the presence of different organic ligands.
To this end, we explored the use of PIMs for the first time for measuring metal
speciation in aqueous solutions, in particular, zinc, in the absence and presence of organic
ligands. We then compared the obtained flux measurements to the metal uptake by a
living organism (i.e. a potato plant), as a tool to predict plant exposure. Metals can be
found in the media in different chemical forms, such as free ions, and inorganic or organic
complexes with different stabilities and charges. If we consider that the metal flux through
the membrane depends on the different species, flux measurements can provide
information about metal speciation. This hypothesis has been previously explored with
supported liquid membranes (SLMs) [14–16], but not yet with PIMs. Thus, we studied
the flux of zinc from a nutrient solution using a PIM composition of 70% PVC – 30%
D2EHPA and a receiving composition of 0.01M HNO3. In contrast to the previously
mentioned ion-exchanger, Aliquat 336, the carrier D2EHPA presents great selectivity
towards Zn2+ and often acts as a carrier following a counter-transport mechanism; in this
case, a crossed transport of protons and metallic ions takes place [17]. No significant
variations in terms of zinc flux were observed between 24 and 48 h of deployment time,
demonstrating that the system was under steady-state regime and also highlights the great
stability that PIMs present compared to other types of liquid membranes, such as SLM,
making the use of PIMs a suitable technique for long-term experiments. No depletion of
the analyte was observed either.
The JPIM was evaluated by varying total metal concentration (ranging from 3 up
to 70 µM) without the addition of organic ligands. Results showed a linear correlation to
the free metal concentration, according to MINTEQ calculations, in the donor phase. In
addition, we tested two zinc concentrations 35 and 70 µM in the presence of different
organic ligands namely EDTA, citrate and HA. Our results showed that JPIM was
decreased in all cases due to the presence of the organic ligands as there was a reduction
in the free metal fraction. This fact supports that PIM measurement can be used as a
speciation technique for the determination of free zinc concentrations.
Considering the obtained results and taking into account different hypotheses we
managed to formulate a simple model for JPIM as shown in the following equation (Eq.
4.1):
Chapter 4 – General discussion and future perspectives
256
(4.1)
This equation justifies the linearity of the steady state with Zn2+ concentration and
the lack of impact of labile complexes present in the donor solution. Moreover, a higher
flux is expected with an increase in the acidity of the acceptor phase as well as with an
enhanced total carrier concentration. In addition, some other information can be derived
from the previous equation such as a certain limitation by diffusion in both the membrane
and in the acceptor solutions. If membrane thickness and the carrier concentration are
evaluated over a range of values, PIM could be used to measure labile fractions or again
the free fraction.
On the other hand, we wanted to correlate the resulting JPIM obtained in the
presence of the different ligands compared to the plant metal uptake in the same media.
Other authors have also performed metal uptake studies using higher plants, such as wheat
[18] or spinach plants [19,20]. Hence, we used the potato plant (Solanum tuberosum) as
another alternative. Before conducting flux measurements, we wanted to demonstrate
root viability to ensure that root cells were still alive after being in contact with the
different medias (i.e. EDTA, HA, citrate or histidine). Only the ligand histidine caused
toxicity to the roots reducing the number of living cells, and therefore, further
experiments were not conducted using this ligand.
When comparing JPIM and Jroot, a non-satisfactory correlation was observed in the
presence of the different organic ligands. These results suggest that metal uptake in roots
is highly dependent on many factors, which can result in a higher than expected metal
uptake, as shown in Figure 4.3.
( )( )( )( )
2
2
3/2
T,L2*
*2PIM 3/2 A
T,L Zn2m AA
ZnL ·HL
/ 2
HZn
/ 2
H
K c
JK c D
D d+
+
+
+
é ùë ûé ù» ë û
+é ùë û
!
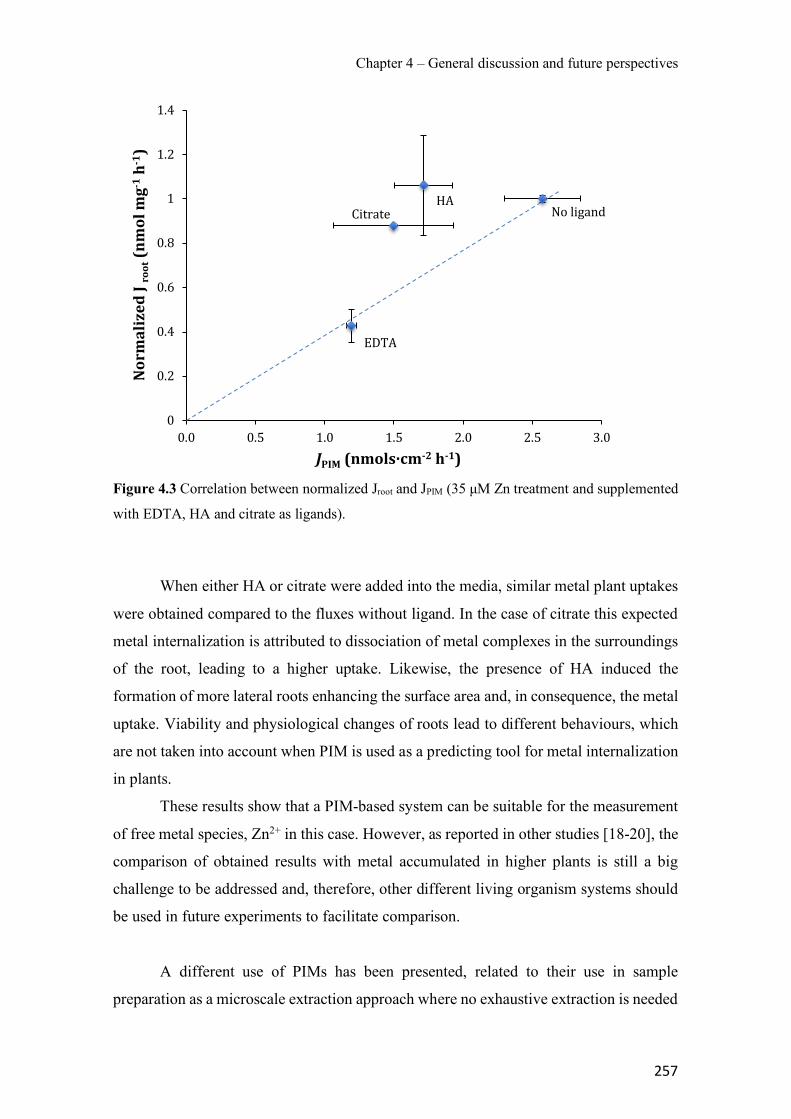
Chapter 4 – General discussion and future perspectives
257
Figure 4.3 Correlation between normalized Jroot and JPIM (35 µM Zn treatment and supplemented
with EDTA, HA and citrate as ligands).
When either HA or citrate were added into the media, similar metal plant uptakes
were obtained compared to the fluxes without ligand. In the case of citrate this expected
metal internalization is attributed to dissociation of metal complexes in the surroundings
of the root, leading to a higher uptake. Likewise, the presence of HA induced the
formation of more lateral roots enhancing the surface area and, in consequence, the metal
uptake. Viability and physiological changes of roots lead to different behaviours, which
are not taken into account when PIM is used as a predicting tool for metal internalization
in plants.
These results show that a PIM-based system can be suitable for the measurement
of free metal species, Zn2+ in this case. However, as reported in other studies [18-20], the
comparison of obtained results with metal accumulated in higher plants is still a big
challenge to be addressed and, therefore, other different living organism systems should
be used in future experiments to facilitate comparison.
A different use of PIMs has been presented, related to their use in sample
preparation as a microscale extraction approach where no exhaustive extraction is needed
Noligand
EDTA
HACitrate
0
0.2
0.4
0.6
0.8
1
1.2
1.4
0.0 0.5 1.0 1.5 2.0 2.5 3.0
NormalizedJroot(nmolmg-1h-1 )
JPIM (nmols·cm-2 h-1)
Chapter 4 – General discussion and future perspectives
258
(microextraction techniques). For the first time, this methodology has been explored for
the determination of selected pesticides (e.g. chlorpyrifos or CP, diazinon or DZ and
cyprodinil or CYP) using GC-MS.
In contrast to previous PIM systems, in which a carrier was required in order to
achieve transport through the membrane, the PIM-assisted extraction method does not
require the addition of a carrier as the mechanism is based on sorption/solubilization and
only a base polymer plus a plasticizer are needed (i.e. 70% CTA – 30% NPOE).
Preliminary extraction and elution experiments were conducted with CP, showing that
only 7% of the initial pesticide remained in the solution after 8 h of extraction, which
means that quantitative extraction into the membrane was achieved. Better elution results
and repeatability were obtained using 1mL of ACN and 15 min using UAE. Ultrasounds
clearly helped to release the retained pesticide into the organic solvent reducing the total
elution time.
In terms of extraction efficiency, only slight differences were obtained using
different agitation modes for the three pesticides tested. Rotary agitation was selected for
further experiments due to higher reproducibility. Since extraction occurs by the
solubilization of pesticides into the membrane matrix with the aid of the plasticizers,
different plasticizers were incorporated in membranes (i.e. DBS, BBPA and NPOE) and
evaluated. NPOE, bearing the highest dielectric constant, allows better solubilization of
polar pesticides than the ones studied. Therefore, NPOE was selected to conduct
extraction experiments.
In terms of method validation, the PIM-assisted extraction method only showed
small matrix effect (ME), which is a clear advantage if compared to other methods where
an extensive clean-up must be carried out in order to remove interferences. Indeed, the
absolute recovery (AR), is greater for CP (68 ± 5 at 100 ng L-1 and 70 ± 5 at 250 ng L-1)
as is the pesticide with the highest log Kow value and therefore, presenting a major affinity
towards NPOE.
PIM-assisted extraction methods showed comparable MDL to other existing
extraction methods and improved EPA methods, as summarized in Table 4.4. The method
detection limits (MDLs) of the PIM-assisted extraction method were below the ones
reported in the EPA methods. Moreover, it would be expected that this value could be
further reduced if a greater sample volume had been used to conduct the extraction
experiments.
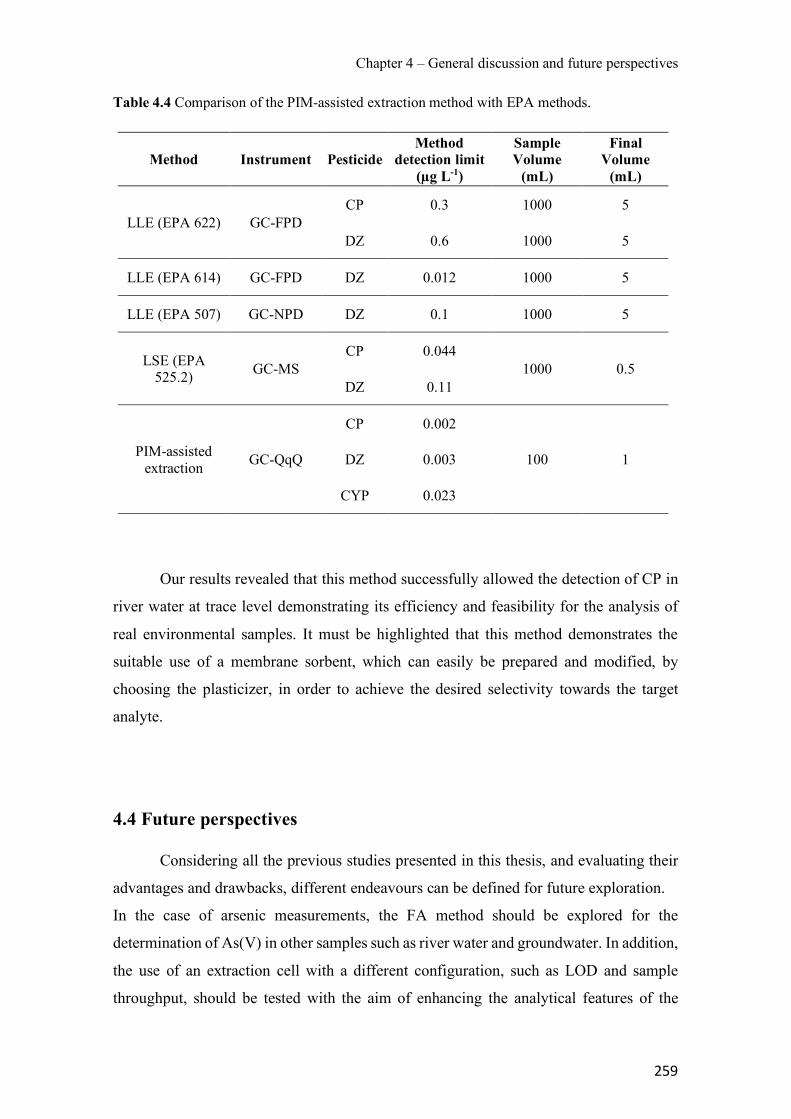
Chapter 4 – General discussion and future perspectives
259
Table 4.4 Comparison of the PIM-assisted extraction method with EPA methods.
Method Instrument Pesticide Method
detection limit (µg L-1)
Sample Volume
(mL)
Final Volume
(mL)
LLE (EPA 622) GC-FPD CP 0.3 1000 5
DZ 0.6 1000 5
LLE (EPA 614) GC-FPD DZ 0.012 1000 5
LLE (EPA 507) GC-NPD DZ 0.1 1000 5
LSE (EPA 525.2) GC-MS
CP 0.044 1000 0.5
DZ 0.11
PIM-assisted extraction GC-QqQ
CP 0.002
100 1 DZ 0.003
CYP 0.023
Our results revealed that this method successfully allowed the detection of CP in
river water at trace level demonstrating its efficiency and feasibility for the analysis of
real environmental samples. It must be highlighted that this method demonstrates the
suitable use of a membrane sorbent, which can easily be prepared and modified, by
choosing the plasticizer, in order to achieve the desired selectivity towards the target
analyte.
4.4 Future perspectives
Considering all the previous studies presented in this thesis, and evaluating their
advantages and drawbacks, different endeavours can be defined for future exploration.
In the case of arsenic measurements, the FA method should be explored for the
determination of As(V) in other samples such as river water and groundwater. In addition,
the use of an extraction cell with a different configuration, such as LOD and sample
throughput, should be tested with the aim of enhancing the analytical features of the
Chapter 4 – General discussion and future perspectives
260
methodology. Moreover, the As(III) analysis could be achieved by incorporating an
oxidation step before introducing the sample into the system. One of the simplest options
would be the use of ozone to achieve this oxidation, although the total method cost would
be increased. In addition, another novel FA system including a PIM as a preconcentration
step could be developed for the online high-throughput analysis of different target
compounds, such as nutrients, metals or relevant organic compounds (i.e. pesticides,
endocrine disruptors, among others).
With regard to further improving stability and membrane performance, PIMs
based on the polymer PVDF-HFP have appeared as an attractive alternative to
conventional polymers. Moreover, they can be combined with PEG-DMA, allowing the
fabrication of cross-linked PIMs by ultraviolet irradiation. The high degree of
entanglement of the polymeric matrix in crosslinked PIMs leads to a significant increase
in both membrane stability and permeability, as reported in the literature [21]. Therefore,
a wide range of possibilities are yet to be fully explored.
Future PIM studies must consider sustainability during the fabrication of the
membrane itself by exploring more eco-friendly materials, and reducing or eliminating
waste generation. To this end, an improvement in the solvent-free preparation of polymer
inclusion membranes with an ionic liquid must be conducted and endeavours to find new
polymers are recommended.
Considering the better stability of PIMs compared to other types of liquid
membranes (i.e. PLMs), which have traditionally been employed for this purpose, it
would not be unreasonable to think that several future studies will further explore metal
speciation based on the use of PIMs, as presented for the first time in this thesis.
The full potential of PIMs to be used as a sorbent appears to be a very competitive
alternative to other traditional techniques, such as SPE, due to their low cost, easy
preparation and high selectivity. PIMs can be used in future studies for the extraction of
new contaminants or other compounds by simply tuning their affinity towards the target
of interest.
Chapter 4 – General discussion and future perspectives
261
References
[1] C. Fontàs, R. Vera, A. Batalla, S.D. Kolev, E. Anticó, A novel low-cost detection
method for screening of arsenic in groundwater., Environ. Sci. Pollut. Res. 21
(2014) 11682–8.
[2] V. Cerdà, L. Ferrer, J. Avivar, A. Cerdà, Chapter 1 - Evolution and Description of
the Principal Flow Techniques, in: V. Cerdà, L. Ferrer, J. Avivar, A.B. Cerdà
(Eds.), Elsevier, Boston, 2014: pp. 1–42.
[3] L. Skeggs, An Automatic Method for Colorimetric Analysis, Am. J. Clin. Pathol.
28 (1957) 311–322.
[4] L.O. Leal, R. Forteza, V. Cerdà, Speciation analysis of inorganic arsenic by a
multisyringe flow injection system with hydride generation-atomic fluorescence
spectrometric detection, Talanta. 69 (2006) 500–508.
[5] Y. Zhang, M. Miró, S.D. Kolev, Hybrid flow system for automatic dynamic
fractionation and speciation of inorganic arsenic in environmental solids, Environ.
Sci. Technol. 49 (2015) 2733–2740.
[6] L.L. Zhang, R.W. Cattrall, S.D. Kolev, The use of a polymer inclusion membrane
in flow injection analysis for the on-line separation and determination of zinc,
Talanta. 84 (2011) 1278–1283.
[7] D.S. De Jesus, R.J. Cassella, S.L.C. Ferreira, A.C.S. Costa, M.S. De Carvalho,
R.E. Santelli, Polyurethane foam as a sorbent for continuous flow analysis:
Preconcentration and spectrophotometric determination of zinc in biological
materials, Anal. Chim. Acta. 366 (1998) 263–269.
[8] E. Punrat, C. Maksuk, S. Chuanuwatanakul, W. Wonsawat, O. Chailapakul,
Polyaniline/graphene quantum dot-modified screen-printed carbon electrode for
the rapid determination of Cr(VI) using stopped-flow analysis coupled with
voltammetric technique, Talanta. 150 (2016) 198–205.
[9] B. Lesniewska, L. Trzonkowska, E. Zambrzycka, B. Godlewska-Zyłkiewicz,
Multi-commutation flow system with on-line solid phase extraction exploiting the
ion-imprinted polymer and FAAS detection for chromium speciation analysis in
sewage samples, Anal. Methods. 7 (2015) 1517–1526.
Chapter 4 – General discussion and future perspectives
262
[10] Y.Y.N. Bonggotgetsakul, R.W. Cattrall, S.D. Kolev, The preparation of a gold
nanoparticle monolayer on the surface of a polymer inclusion membrane using
EDTA as the reducing agent, J. Memb. Sci. 379 (2011) 322–329.
[11] Y.Y.N. Bonggotgetsakul, R.W. Cattrall, S.D. Kolev, A method for coating a
polymer inclusion membrane with palladium nanoparticles, React. Funct. Polym.
97 (2015) 30–36.
[12] X. Zuo, S. Yu, X. Xu, J. Xu, R. Bao, X. Yan, New PVDF organic-inorganic
membranes: The effect of SiO2 nanoparticles content on the transport performance
of anion-exchange membranes, J. Memb. Sci. 340 (2009) 206–213.
[13] R. Güell, E. Anticó, S.D. Kolev, J. Benavente, V. Salvadó, C. Fontàs,
Development and characterization of polymer inclusion membranes for the
separation and speciation of inorganic As species, J. Memb. Sci. 383 (2011) 88–
95.
[14] A. Gramlich, S. Tandy, V.I. Slaveykova, A. Duffner, R. Schulin, The use of
permeation liquid membranes for free zinc measurements in aqueous solution,
Environ. Chem. 9 (2012) 429–437.
[15] V.I. Slaveykova, N. Parthasarathy, J. Buffle, K.J. Wilkinson, Permeation liquid
membrane as a tool for monitoring bioavailable Pb in natural waters., Sci. Total
Environ. 328 (2004) 55–68.
[16] S. Bayen, I. Worms, N. Parthasarathy, K. Wilkinson, J. Buffle, Cadmium
bioavailability and speciation using the permeation liquid membrane, Anal. Chim.
Acta. 575 (2006) 267–273.
[17] M. Resina, J. Macan, J. De Gyves, M. Mu, Zn(II), Cd(II) and Cu(II) separation
through organic–inorganic Hybrid Membranes containing di (2-ethylhexyl)
phosphoric acid or di-(2-ethylhexyl) dithiophosphoric acid as a carrier, J. Memb.
Sci. 268 (2006) 57–64.
[18] A. Gramlich, S. Tandy, E. Frossard, J. Eikenberg, R. Schulin, Availability of zinc
and the ligands citrate and histidine to wheat: Does uptake of entire complexes
play a role?, J. Agric. Food Chem. 61 (2013) 10409–10417.
Chapter 4 – General discussion and future perspectives
263
[19] F. Degryse, E. Smolders, R. Merckx, Labile Cd complexes increase Cd
availability to plants, Environ. Sci. Technol. 40 (2006) 830–836.
[20] F. Degryse, E. Smolders, H. Zhang, W. Davison, Predicting availability of mineral
elements to plants with the DGT technique: A review of experimental data and
interpretation by modelling, Environ. Chem. 6 (2009) 198–218.
[21] Y. O’Bryan, Y.B. Truong, R.W. Cattrall, I.L. Kyratzis, S.D. Kolev, A new
generation of highly stable and permeable polymer inclusion membranes (PIMs)
with their carrier immobilized in a crosslinked semi-interpenetrating polymer
network . Application to the transport of thiocyanate, J. Memb. Sci. 529 (2017)
55–62.


CHAPTER 5
Conclusions
Chapter 5 – Conclusions
266
The general main conclusions extracted from the research conducted in this thesis
are summarised as follows:
• A simple and cost-effective analytical methodology based on the use of a PIM
consisting of CTA and Aliquat 336, placed in a special device, has been used for the
satisfactory arsenate preconcentration of a 2 M NaCl solution after 5 h of contact time.
This methodology has allowed the determination of arsenate from different
groundwater samples.
• A FA system has been developed for the first time, implementing an on-line
preconcentration and extractive separation of arsenate (using a PIM made of 70%
PVDF-HFP – 30% Aliquat 336), and subsequently reduced to arsine, which is
spectrophotometrically detected after its on-line gas-diffusion separation. The method
allowed the determination of arsenate at the low µg L-1 level by the multi-point
standard addition method, making it an attractive methodology for arsenic
determination in drinking waters.
• The determination of both inorganic arsenic species has been accomplished using the
TiO2-based sorbent Adsorbsia As600, that has been used, for the first time, for
analytical applications. We have established the setup and the experimental
conditions for using this sorbent for As(V) and As(III) preconcentration prior to its
determination with ICP- OES and good recoveries and reproducibility were obtained.
A detection limit of 40 µg L−1 for a sample volume of 50 mL was obtained using 2
mL of 0.5 M NaOH as elutant.
• We have demonstrated that new Aliquat 336 derivatives can be successfully prepared
by a liquid-liquid exchange process. Impedance spectroscopy and membrane
potentials have been used for the electrochemical characterization that PIMs prepared
with the new ionic liquids. Higher conductivity and dielectric constants were obtained
for membranes containing AlqCl and AlqNO3 compared to those with AlqSCN.
• The hydrophilic character and transport efficiency of PIMs was found to follow the
sequence AlqCl > AlqNO3 > AlqSCN, whereas stability followed the opposite order.
Chapter 5 – Conclusions
267
• Greener PIM preparation strategies have been presented for the first time, dismissing
the use of toxic organic solvents for their preparation as well as employing more eco-
friendly polymers. Membranes consisting of the biodegradable polymer PCL, showed
great stability without compromising good performance in terms of Cr(VI) extraction.
• A simple device based on a PIM consisting of 70% PVC – 30% D2EHPA has been
used for the first time, for the determination of free zinc concentrations in aqueous
samples in the absence and presence of the organic ligands: EDTA, citrate and HA.
JPIM fluxes were compared to metal uptake by potato root plants, showing that in the
case of citrate and HA, direct proportionality between total metal and root uptake was
obtained, whereas in the presence of EDTA this relationship was observed for the free
metal fraction.
• A simple and novel microextraction methodology based on the use of a 70% CTA –
30% NPOE PIM as a sorbent for the effective preconcentration of three pesticides,
namely CP, DZ and CYP. An extraction time of 6 h and elution using 1 mL of ACN
allowed the detection of CP in river water at a concentration of 36 ng L-1.