
Intelligent product agents: The key to implementing collaboration process networks?
Upload
khangminh22Category
view
7download
0
Design parameter management in productdevelopment process
Juranić, Jasmin
Doctoral thesis / Disertacija
2021
Degree Grantor / Ustanova koja je dodijelila akademski / stručni stupanj: University of Zagreb, Faculty of Mechanical Engineering and Naval Architecture / Sveučilište u Zagrebu, Fakultet strojarstva i brodogradnje
Permanent link / Trajna poveznica: https://urn.nsk.hr/urn:nbn:hr:235:109167
Rights / Prava: In copyright
Download date / Datum preuzimanja: 2022-03-12
Repository / Repozitorij:
Repository of Faculty of Mechanical Engineering and Naval Architecture University of Zagreb
Faculty of Mechanical Engineering and Naval Architecture
Jasmin Juranić
DESIGN PARAMETER MANAGEMENT IN PRODUCT DEVELOPMENT PROCESS
DOCTORAL DISSERTATION
Zagreb, 2021
Faculty of Mechanical Engineering and Naval Architecture
Jasmin Juranić
DESIGN PARAMETER MANAGEMENT IN PRODUCT DEVELOPMENT PROCESS
DOCTORAL DISSERTATION
Supervisor: Prof. Neven Pavković, PhD.
Zagreb, 2021
Fakultet strojarstva i brodogradnje
Jasmin Juranić
UPRAVLJANJE KONSTRUKCIJSKIM PARAMETRIMA U PROCESU RAZVOJA
PROIZVODA
DOKTORSKI RAD
Mentor: Prof. dr. sc. Neven Pavković
Zagreb, 2021
BIBLIOGRAPHY DATA
UDC: 658.5
Keywords: product development; engineering design process; design
parameters; coloured petri nets; computer supported
collaborative work; multiple domain matrix;
Scientific area: Technical Sciences
Scientific field: Mechanical Engineering
Institution: University of Zagreb
Faculty of Mechanical Engineering and Naval Architecture
Supervisor: Prof. Neven Pavković, PhD.
Number of pages: 149
Number of figures: 56
Number of tables: 17
Number of references: 114
Date of oral examination: 25.06.2021
Committee members: Prof. Nenad Bojčetić, PhD. (University of Zagreb, Croatia)
Prof. Mario Štorga, PhD. (University of Zagreb, Croatia)
Asst. Prof. Tomaž Savšek, PhD. (Faculty of Industrial
Engineering Novo Mesto, Slovenia)
Archive: University of Zagreb,
Faculty of Mechanical Engineering and Naval Architecture

II
ACKNOWLEDGEMENTS
First and foremost, I am extremely grateful to my supervisor, Prof. Neven Pavković for his
invaluable advices, continuous support, and patience during my PhD study. His immense
knowledge and plentiful experience have encouraged me in all the time of my academic
research. I would also like to thank the examiners, Prof. Nenad Bojčetić, Prof. Mario Štorga
and Asst. Prof. Tomaž Savšek for reviewing the thesis and providing insightful comments.
I would like to express gratitude to the colleagues at the Chair of design and product
development. Special thanks go to Dr.-Ing Thomas Naumann for providing the data used in this
study.
I would like to express my gratitude to my parents, brother and my wife. Without their
tremendous understanding and encouragement in the past few years, it would be impossible for
me to complete my study.

III
IV
CONTENTS
ABSTRACT ........................................................................................................................... VII
PROŠIRENI SAŽETAK .......................................................................................................... IX
LIST OF FIGURES ............................................................................................................... XIII
LIST OF TABLES ................................................................................................................ XVI
LIST OF APPENDICES ...................................................................................................... XVII
LIST OF ABBREVIATIONS AND SYMBOLS ............................................................... XVIII
1. INTRODUCTION .................................................................................................................. 1
1.1. Research focus, aim, and hypothesis ............................................................................... 1
1.2. Research methodology .................................................................................................... 5
1.3. Scientific contribution ..................................................................................................... 8
1.4. Thesis structure ................................................................................................................ 8
2. THEORETICAL BACKGROUND ..................................................................................... 11
2.1. Engineering design process ........................................................................................... 11
2.2. Design activities ............................................................................................................ 12
2.2.1. Ontology of engineering design activities .............................................................. 12
2.3. Engineering design parameters ...................................................................................... 14
2.3.1. Real-time updating of information and workflows ................................................. 15
2.4. Communication in the design process ........................................................................... 17
2.4.1. Computer supported cooperative work ................................................................... 17
2.4.2. Critical situations in design team collaboration ...................................................... 18
2.4.3. Design review meetings .......................................................................................... 19
2.5. Iterations in the design process ...................................................................................... 20
2.6. Matrix based methods .................................................................................................... 22
2.6.1. Design/Dependency Structure Matrix ..................................................................... 22
2.6.2. Multiple Domain Matrix ......................................................................................... 23
2.6.3. Matrix-based methods limitations........................................................................... 25
2.7. Research gaps ................................................................................................................ 27
3. ANALYSIS OF DESIGN PROCESS ACTIVITIES IN PARTNER COMPANY .............. 30
3.1. Obtaining data for the analysis ...................................................................................... 30
3.2. Experimental dataset ...................................................................................................... 32
3.3. Report analysis .............................................................................................................. 35
V
3.3.1. Extraction of EDP types from meeting reports ....................................................... 37
3.3.2. Extraction of phrases that denote activities ............................................................ 40
3.3.3. Generalisation of recognised design activities ........................................................ 41
3.3.4. Tailored engineering design activities taxonomy ................................................... 45
4. MODEL AND FRAMEWORK FOR ACTIVITY EXECUTION PROCESS .................... 47
4.1. A roadmap of building the proposed framework ........................................................... 49
4.2. Obtaining input data without external sources .............................................................. 52
4.3. Obtaining input data using external sources .................................................................. 56
4.4. CPN colours in described CPN models ......................................................................... 59
4.5. Executing a CPN model with external application ........................................................ 61
4.6. Activity list and instantiation of activities ..................................................................... 62
4.7. Instantiation of CPN templates ...................................................................................... 65
4.8. Lifecycle of a CPN instance .......................................................................................... 67
4.9. Developed CPN model templates .................................................................................. 71
4.9.1. The model for automatic parameter change ............................................................ 71
4.9.2. Model of negotiation on coupled parameters values .............................................. 77
5. IMPLEMENTATION OF THE FRAMEWORK ................................................................ 83
5.1. Software components .................................................................................................... 87
5.1.1. Procedures that manage the whole solution ............................................................ 87
5.1.2. Procedures specific to each CPN model type ......................................................... 88
5.1.3. Procedures that manage activity list ....................................................................... 88
5.1.4. Procedures for data transfer and communication with external data sources ......... 90
5.1.5. Procedures that establish and support communication with CPN Tools ................ 90
5.1.6. Procedures that enable a user to observe, check and visualize activity execution
progress ............................................................................................................................. 91
5.2. Implementation issues and challenges of CPN models ................................................. 91
5.2.1. Interaction between user and CPN model ............................................................... 91
5.2.2. Support for additional activity types ....................................................................... 92
5.2.3. Partial reuse of CPN model templates .................................................................... 92
5.2.4. Hierarchy of CPN model templates ........................................................................ 92
6. FRAMEWORK VALIDATION .......................................................................................... 96
6.1. Validation of the framework based on CPN methodology ............................................ 96
6.2. Case study of the application of CPN model for resolving coupled parameters ......... 102
7. DISCUSSION .................................................................................................................... 111
VI
7.1. Research contribution .................................................................................................. 111
7.2. Potentials of the proposed framework and model for executing EDA ........................ 116
8. CONCLUSION .................................................................................................................. 120
8.1. Research summary ....................................................................................................... 120
8.2. Research limitation ...................................................................................................... 122
8.3. Future work .................................................................................................................. 123
REFERENCES ....................................................................................................................... 125
APPENDICES ........................................................................................................................ 135
Appendix A: A literature review on Petri nets and their extensions .................................. 135
A.1. Petri Nets .................................................................................................................... 135
A.1.1. Ordinary Petri Nets .............................................................................................. 135
A.1.2. Petri nets extensions ............................................................................................. 137
A.1.3. Coloured Petri Nets .............................................................................................. 140
A.1.4. Application of Petri Nets in engineering design .................................................. 141
A.1.5. Roles of the Coloured Petri Nets in the proposed framework ............................. 143
Appendix B: Custom SML functions ................................................................................. 144
Appendix C: Complete CPN models .................................................................................. 145
Appendix C.1. CPN model for automatic parameter change .......................................... 145
Appendix C.2. CPN model of negotiation on coupled parameters values ...................... 146
BIOGRAPHY ......................................................................................................................... 147
ŽIVOTOPIS ........................................................................................................................... 148
BIBLIOGRAPHY .................................................................................................................. 149
VII
ABSTRACT
Engineering designers in product development organisations face the increasing complexity of
engineering design activities. To accomplish the assigned activities, they reach for various tools
and methods in their daily work that support them in developing products, managing data and
communicating with other designers within a team or outside the team. Thus, design team
members need enhanced software support for design team collaboration, including the
management of design process dynamics, especially in critical situations.
The research reported in the thesis aims to improve a designer's working experience through
enhancements in computer supported collaborative work (CSCW). A more concrete research
aim has been formed as follows: to develop a model and software support that would enable
consistent updating and propagation of design information in teamwork in a manner that the
improvement does not require additional effort for engineering designers while performing
design activities.
The research has been conducted in line with Design Research Methodology stages and in such
a way is reported in this thesis. The literature review provided several major issues of current
techniques and support systems used in engineering design processes. The two most significant
for this work are that design activities are sometimes performed with outdated product
information and that critical situations burden the whole system, from a designer to
management. The research continued with the analysis of the empirical dataset. The dataset
consists of over 800 records that originate from meeting reports obtained from three long-
lasting product development projects in an automotive company. The analysis results have
shown what types of design activities are most frequent, what types are most critical and how
designers are dealing with design activities. Based on the recognised activity type, an
engineering design activities taxonomy has been proposed.
The next natural step in the research was to use the knowledge obtained from the previous phase
and propose a novel CSCW enhancement. The goal of the enhancement has been set to semi-
automatically execute defined engineering design activities and thus support engineering
designers in their work. The enhancement is based on Coloured Petri Nets modelling language
(CPN). One CPN model has been created for each engineering design activity type. CPN
models are executed as part of the proposed framework for semi-automated execution of
engineering design activities.
Abstract
VIII
The framework manages an activity life cycle and thus a CPN model life cycle, communication
with designers and all processes beneath the proposed enhancement.
The proposed framework and all belonging processes have been validated using two different
case studies. The case studies showed that the proposed enhancement has significant potential
to provide real-time updating and propagation of design information in teamwork. The main
contributions of the thesis are: 1. Definition of engineering design activity taxonomy, 2.
Proposal of the framework and process for semi-automatic execution of engineering design
activities, 3. CPN models that should enhance CSCW and design communication, and 4. MDM
modification for indicating necessary communication.
Keywords:
product development; engineering design process; design parameters; coloured petri nets;
computer supported collaborative work; multiple domain matrix;
IX
PROŠIRENI SAŽETAK
Timski rad je ključan, ali i neizbježan element tijekom razvoja kompleksnih proizvoda. Kako
bi timski rad bio efikasan, komunikacija između članova tima, ali i između timova mora biti
uvijek na visokoj razini promatrano s više aspekata. Nažalost, to u velikom broju slučajeva nije
moguće ostvariti, a potvrda za to pronađena je kroz diskusiju s razvojnim inženjerima u
automobilskoj industriji kao i tijekom pregleda znanstvene i stručne literature. Loše
organizirana i nepravodobna komunikacija često u praksi uzrokuje znatna kašnjenja i dodatne
troškove te umanjuje kvalitetu rješenja. Takvi problemi dolaze do izražaja tijekom procesa
rasuđivanja i donošenja odluka u dugotrajnim razvojnim projektima koji uključuju velike
distribuirane timove. Istraživanje je ostvareno u području koje se fokusira na probleme
upravljanja parametrima u procesu razvoja arhitekture vozila.
Cilj je istraživanja razviti model i računalnu podršku koji će omogućiti dosljedno ažuriranje i
propagiranje informacija u timskom radu na način da se ne ostvaruje dodatno opterećenje za
konstruktore. Ponavljajući uzorci komunikacijskih situacija i dijelova procesa konstruiranja
ekstrahirat će se iz analize procesiranja informacija te tokova informacija u kompleksnom
okruženju razvoja proizvoda.
Predloženim istraživanjem verificira se sljedeća hipoteza: Računalna realizacija i praktična
implementacija dosljednog dinamičkog ažuriranja i propagiranja informacija o konstrukcijskim
parametrima osnovni su preduvjet za razvoj modela djelomične automatizacije obrade i
transfera konstrukcijskih informacija, što bi značajno smanjilo broj nepotrebnih iteracija i
dodatne troškove u projektima.
Metodologija
Istraživanje je metodološki utemeljeno na općoj metodologiji istraživanja u znanosti o
konstruiranju te je provedeno u četiri osnovna koraka: preliminarno istraživanje (raščišćavanje
zahtjeva na istraživanje), pregled literature i analiza prikupljenog skupa podataka (deskriptivno
istraživanje I), razvoj modela i okvira za poluautomatsko izvršavanje konstrukcijskih aktivnosti
(preskriptivno istraživanje I), vrednovanje modela i razvijenih procesa za izvršavanje aktivnosti
(deskriptivno istraživanje II). Preliminarno istraživanje uključuje pregled postojeće znanstvene
i stručne literature unutar područja istraživanja s ciljem inicijalnog opisa postojeće situacije,
željenih doprinosa te definiranja osnovnih pretpostavki.
Prošireni sažetak
X
Pregledom literature dan je uvid na trenutna dostignuća na području procesa konstruiranja na
najvišoj razini, no pregled je uključivao i napretke na nižim razinama granularnosti kao što su
iteracije tijekom konstruiranja koje su sve prisutne u procesu konstruiranja, kritične situacije
koje se događaju tijekom razvoja proizvoda, mogućnosti koje pruža računalom podržan
kolaborativni rad te upravljanje konstrukcijskim parametrima. Nadalje, pregled je usmjeren ka
metodama na bazi matrica s obzirom da se one redovito upotrebljavaju tijekom razvoja
proizvoda te tijekom upravljanja konstrukcijskim parameterima. Predloženi okvir za
procesiranje konstrukcijskih aktivnosti u pozadini je temeljen na metodologiji Obojenih
Petrijevih mreža tako da su Petrijeve mreže kao i sva glavna proširenja metodologije detaljno
istraženi. Ishod ove faze istraživanja su formulirana istraživačka pitanja čime je usmjeren
daljnji tijek istraživanja. Kako bi se mogli ponuditi odgovori na istraživačka pitanja, bilo je
potrebno sakupiti te analizirati podatke iz industrijskog radnog okruženja. Prikupljeni podaci
pretežito su zapisnici s projektnih sastanaka održanih tijekom provedbe tri dugotrajna razvojna
projekta u automobilskoj industriji. Konstrukcijske aktivnosti prepoznate u zapisima okupljene
su u predloženu taksonomiju konstrukcijski aktivnosti koja je prilagođena aktivnostima tvrtke
u kojoj su podaci prikupljeni. Paralelno je razvijen model te procesi koji uz pomoć definiranih
modela konstrukcijskih aktivnosti (modeliranih pomoću Obojenih Petrijevih mreža)
podržavaju konstruktore tijekom razvojnih procesa. Model i pripadajući procesi evaluirani su
kroz dvije različite studije slučaja. Nakon studija slučaja dolazi se do rasprave o rezultatima,
doprinosima ovog rada te potencijalima predloženog rješenja.
Analiza prikupljenog seta podataka
Nakon izvršenog pregleda literature i definiranih istraživačkih pitanja, postalo je očito da
predloženo poboljšanje računalom podržanom timskog rade neće biti dovoljno efikasno ako se
ne posegne za podacima iz realnog okruženja koji će upotpuniti saznanja proizašla iz pregleda
literature. Podaci su prikupljeni u suradnji s istraživačkim odjelom partnerske tvrtke iz
automobilske industrije. S obzirom na pravila privatnosti i izrazito snažan sindikat, nije bilo
moguće prikupiti podatke o procesu konstruiranja koji nisu nastali tijekom formalne
komunikacije (npr. emailovi, razgovori među konstruktorima). Stoga, prikupljeni su zapisi
(izvješća) s formalnih projektnih sastanaka nastalih tijekom višemjesečnog procesa razvoja
vozila. Prikupljeni podaci sadrže preko 800 zapisa proizašlih iz tri različita razvojna projekta.
Prije analize podataka, podaci su anonimizirani. Izvješća sa sastanaka su strukturirani tekstualni
dokumenti koji sadrže osnovne podatke o održanom sastanku te detalje i prepisku diskusije za
svaku točku na dnevnom redu. Upravo te prepiske diskusije su se koristile kao ulazni podaci
Prošireni sažetak
XI
tijekom analize podataka. Prvi korak u analizi uključivao je pretraživanje podataka kako bi se
odredila učestalost ponavljanja pojmova koji se koriste tijekom razvoja proizvoda (npr.
parametar, udaljenost, masa, kut, visina, materijal). Drugi korak analize se odnosio na
prepoznavanje konstrukcijskih aktivnosti. Nakon prepoznavanja i generaliziranja aktivnosti,
one su bile osnovni elementi za definiranje taksonomije konstrukcijskih aktivnosti. Uz pomoć
elemenata taksonomije, skup podataka je ovaj put kodiran kako bi se odredila učestalost
pojavljivanja određenih konstrukcijskih aktivnosti i time definiralo koje vrste aktivnosti bi bilo
najvrjednije procesirati uz pomoć rješenja razvijenog u sklopu ovog rada.
Model unaprjeđenja računalne podrške konstruiranju
Podaci prikupljeni u tvrtki poslužili su kao temelj za koncipiranje modela za unaprjeđenja
računalne podrške tijekom izvršavanja konstrukcijskih zadataka. Temeljem spoznaja iz
pregledane literature i promatranih procesa u tvrtki napravljena je sinteza okvira za modeliranje
i praćenje izvršavanja timskih aktivnosti u složenim i dugotrajnim razvojnim projektima.
Tijekom ove faze istraživanja definirana je arhitektura predloženog sustava i detaljno je
razrađen permanentan ciklički proces koji primarno treba osigurati postavljene ciljeve
konzistentnog ažuriranja vrijednosti spregnutih parametara u timskom radu. Nastavno na
arhitekturu modela definirane su i detaljno opisane programske komponente razvijenog
sustava. Razmotreni su izazovi koji se mogu pojaviti pri gradnji pojedinačnih modela prema
predloženoj arhitekturi i metodologiji koja se temelji na Obojenim Petrijevim mrežama. U
sklopu razvoja modela i pripadajućih procesa, detaljno su opisana dva primjera CPN modela
konkretnih konstrukcijskih aktivnosti u timskom procesu upravljanja konstrukcijskim
parametrima.
Vrednovanje istraživanja
Vrednovanje predložene taksonomije konstrukcijskih aktivnosti, teoretskog okvira, razvijenih
procesa i modela Obojenih Petrijevih mreža provedeno je pomoću dvije studije slučaja. U prvoj
studiji slučaja korištene su konstrukcijske aktivnosti iz taksonomije kako bi se definirao mali
skup aktivnosti koji je procesiran pomoću predloženog rješenja. Izabrani su različiti tipovi
aktivnosti, te su za svaku aktivnost izabrane različite vrste parametara koje je potrebno
procesirati. Za svaku aktivnost definirano je procijenjeno vrijeme trajanja te su aktivnosti
simulirane kako bi se dobilo ukupno vrijeme trajanja aktivnosti i to za dva načina rada. Prvi
način je ustaljeni način na koji inženjeri izvršavaju aktivnosti, a drugi način koristeći model za
processiranje aktivnosti koji je predložen u ovom radu. U drugoj studiji slučaja analiziran je
kompleksan projekt razvijen od strane studenata. Ključni parametri izdvojeni su u matricu koja
Prošireni sažetak
XII
je pružila uvid u različite relacije između parametara te između parametara i konstruktora.
Fokus je bio postavljen na relacije spregnutih parametara te se je krenulo u smjeru
prepoznavanja potencijalnih situacija u kojima konstruktori moraju komunicirati kako bi mogli
odrediti vrijednosti spregnutih parametara. U sklopu ove studije slučaja predstavljena je i
modifikacija više-domenskih matrica koje se odnosi na prepoznavanje potencijalnih situacija
komuniciranja među konstruktorima. Prepoznate situacije procesirane su pomoću modela
Obojenih Petrijevih mreža.
Na temelju vrednovanja istraživanja naglašeno je nekoliko osnovnih aspekata znanstvenog
doprinosa. Prvi aspekt obuhvaća definiranje taksonomije konstrukcijskih aktivnosti. Nakon
analize prikupljenog skupa podataka, 26 konstrukcijskih aktivnosti je klasificirano na tri razine
hijerarhije. Glavni razlog definiranja taksonomije leži u potrebi se definiranjem aktivnosti na
najmanjoj razini granularnosti, na razini gdje se procesiraju konstrukcijski parametri. Tek na
takvoj razini granularnosti je moguće napraviti automatizirano izvršavanje aktivnosti koje je i
napravljeno pomoću modela Obojenih Petrijevih mreža. Drugi aspekt doprinosa očituje se u
prijedlogu modela i procesa za polu-automatsko izvršavanje konstrukcijskih aktivnosti. Novina
u tom pristupu je način procesiranja aktivnosti gdje se izvršavanje provodi u ciklusima te u
svakom ciklusu model aktivnosti se pokreće, učitava prethodno pohranjeno stanje, procesuira
se do točke u kojoj više nema dostupnih podataka, gdje se stanje ponovo pohranjuje kako bi se
procesiranje moglo nastaviti u sljedećem ciklusu. Treći aspekt doprinosa se nadovezuje na
prethodno spomenuti a to su modeli Obojenih Petrijevih mreža koji poboljšavaju mogućnosti
računalom podržanog timskog rada i timske komunikacije naročito vezane za rješavanje pitanja
spregnutih parametara. Modeli su definirani unaprijed te se oni koriste kao predlošci koji se
tijekom procesiranja popunjavaju s podacima specifičnim za svaku konkretnu konstrukcijsku
aktivnost. Kao zadnji glavni aspekt doprinosa navodi se modifikacija metode matričnog prikaza
relacija između parametara, arhitekture proizvoda i konstruktora. Modifikacija na originalan
način unapređuje planiranje projekta predviđanjem kritičnih komunikacijskih situacija.
Ključne riječi
razvoj proizvoda; proces konstruiranja; konstrukcijski parametri; obojene petrijeve mreže;
računalom podržan timski rad; više-domenska matrica;
XIII
LIST OF FIGURES
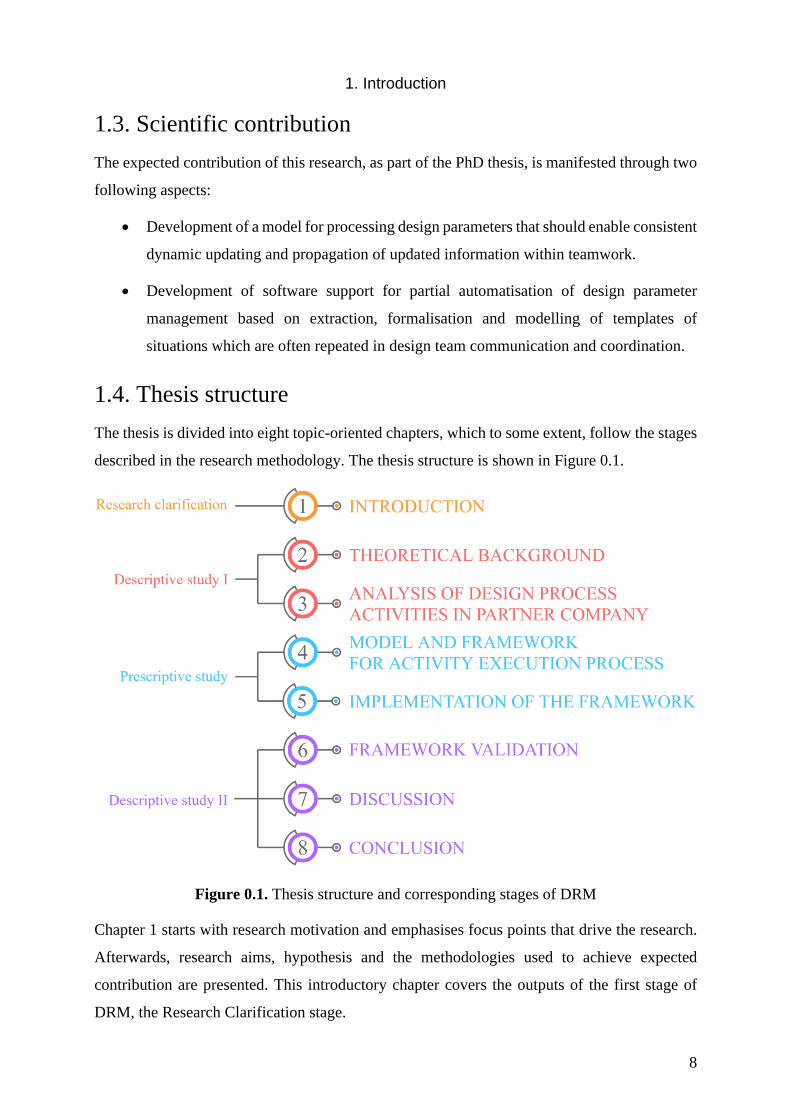
Figure 1.1. Thesis structure and corresponding stages of DRM ............................................................. 8
Figure 2.1. Three types of DSM dependency configurations ............................................................... 23
Figure 2.2. Multiple Domain Matrix with two domains: Activities and designers .............................. 24
Figure 3.1. Anonymised example of an agenda for a weekly meeting ................................................. 33
Figure 3.2. General information of meeting reports from three projects: Facelift projects (FL_A and
FL_B) and module development project (ML_A) ........................................................................ 36
Figure 3.3. Number of discussed topics per meeting for all three projects .......................................... 39
Figure 3.4. Process of creating a list of generalised design activities and engineering design activities
taxonomy ....................................................................................................................................... 40
Figure 3.5. Distribution of ten most frequently recognised activities from each project meeting ....... 44
Figure 3.6. Taxonomy of engineering activities tailored to analysed projects ..................................... 46
Figure 4.1. Schematic representation of relations between PDM, parameter database and CPN based
framework ..................................................................................................................................... 48
Figure 4.2. Schematic representation of the framework based on CPN methodology. The left side is
an activity definition process. The right side is the activity execution process. ............................ 49
Figure 4.3. CPN model as a black box ................................................................................................. 53
Figure 4.4. CPN model - Get Parameter Value before execution (v1) ................................................. 53
Figure 4.5. CPN model - Get Parameter Value after execution (v1) .................................................... 55
Figure 4.6. CPN model - Get Parameter Value before execution (v2) ................................................. 57
Figure 4.7. Activity list and parameter database as text documents ..................................................... 57
Figure 4.8. CPN model - Get Parameter Value in progress (v2) .......................................................... 58
Figure 4.9. CPN model - Get Parameter Value after execution (v2) .................................................... 58
Figure 4.10. Flow diagram of CPN model execution using an external application ............................ 62
Figure 4.11. Activity instantiation process ........................................................................................... 65
Figure 4.12. CPN template (above) and CPN instance (below) ........................................................... 67
Figure 4.13. Lifecycle of basic and extended CPN instance ................................................................ 68
Figure 4.14. Events during Extended CPN model instance lifecycle ................................................... 69
Figure 4.15. Processing of activity list ................................................................................................. 71
Figure 4.16. Sector of CPN model template needed for gathering parameter’s value and properties
from external sources .................................................................................................................... 72
Figure 4.17. Sector of CPN model template that manages calculation of new parameter’s absolute
value .............................................................................................................................................. 73
Figure 4.18. Sector of CPN model template responsible for checking if the new parameter value is in
allowed limits ................................................................................................................................ 74

XIV
Figure 4.19. Sector of CPN model template with two possible actions – sending a notification to a
responsible user and changing the parameter value in the database .............................................. 75
Figure 4.20. Sector of CPN model template which informs users and asks for feedback if these
options are selected during activity instance definition ................................................................ 76
Figure 4.21. Sector of CPN model template which activates if preconditions for completing the
activity instance are fulfilled ......................................................................................................... 77
Figure 4.22. Sector of CPN model template which collects all necessary information to prepare an
initial proposal for coupled parameter negotiation ........................................................................ 78
Figure 4.23. Sector of CPN model template which prepares and sends the initial negotiation proposal
to all stakeholder ........................................................................................................................... 79
Figure 4.24. Sector of CPN model template which shows different paths that can be enabled based on
the token value in input CPN place ............................................................................................... 80
Figure 4.25. Sector of CPN model template that informs about completed activity instance and
completes the activity .................................................................................................................... 81
Figure 5.1. Framework of the cyclic execution process of engineering design activities .................... 83
Figure 5.2. Cyclic execution process of management of engineering design activities ....................... 86
Figure 5.3. CPN model example for calling Java function ................................................................... 89
Figure 5.4. Hierarchy example - two separate models ......................................................................... 93
Figure 5.5. Hierarchy example - extended model ................................................................................ 93
Figure 5.6. Schematic representation of hierarchy CPN model ........................................................... 94
Figure 5.7. Hierarchy example - top-level model ................................................................................. 94
Figure 5.8. Hierarchy example - sub-model 1 ...................................................................................... 95
Figure 5.9. Hierarchy example - sub-model 2 ...................................................................................... 95
Figure 6.1. Model of negotiation process used in simulations ............................................................. 99
Figure 6.2. Duration of the first 1000 simulation ............................................................................... 102
Figure 6.3. Number of simulations sorted by duration ....................................................................... 102
Figure 6.4. 3D render of the developed virtual prototype of the submersible remotely operated device
for inspection of welds in a nuclear reactor pressure vessel used in the case study .................... 104
Figure 6.5. Main product components defined during conceptual design and recognised coupled
dimensions ................................................................................................................................... 105
Figure 6.6. MDM with identified design parameters ......................................................................... 106
Figure 6.7. Structure of MDM as the basis for management of c coupled parameters ...................... 107
Figure A.0.1. Ordinary PN: a) before firing b) after firing ................................................................. 136
Figure A.0.2. Generalized PN: a) before firing the transition b) after firing the transition ................ 137
Figure A.0.3. Finite capacity PN: a) enabled b) not enabled because one of the places has full capacity
..................................................................................................................................................... 138
Figure A.0.4. Extended PN: a) enabled b) not enabled ...................................................................... 138

XV
Figure A.0.5. Priority PN: a) before firing b) after firing ................................................................... 139
Figure A.0.6. Two states of a CPN model .......................................................................................... 141
XVI
LIST OF TABLES
Table 2.1. Time-space groupware matrix [17] ..................................................................................... 17
Table 2.2. Typical iteration process situations [50] .............................................................................. 21
Table 2.3. Common DSM types ........................................................................................................... 22
Table 3.1. Example of the coding process for EDP types .................................................................... 37
Table 3.2. Design parameter types ....................................................................................................... 38
Table 3.3. Excerpt (10 of 835 records) from the spreadsheet with coded phrases that denote
engineering design activities ......................................................................................................... 41
Table 3.4. Most frequently used generalised activities extracted from analysed reports ..................... 42
Table 3.5. Excerpt from the spreadsheet with assigned generalised engineering design activities for
each recognised activity in meetings’ topic discussions ............................................................... 42
Table 3.6. Reliability of the coded activities ........................................................................................ 43
Table 4.1. Example of the instantiation process ................................................................................... 65
Table 6.1. Taxonomy entities used in the case study ............................................................................ 97
Table 6.2. Activity instances used in the case study ............................................................................. 97
Table 6.3. Duration estimations and iterations for negotiation process sub-activities ....................... 100
Table 6.4. Duration of simulated negotiation activities ...................................................................... 101
Table 6.5. Categories (classes of relationships) used in the proposed MDM approach ..................... 108
Table 6.6. List of sequentially related parameters interactions .......................................................... 109
Table 6.7. List of coupled parameters interactions ............................................................................. 109

XVII
LIST OF APPENDICES
Appendix A: A literature review on Petri nets and their extensions………..……………….……….136
Appendix B: Custom SML functions ……………………………………………………….……….145
Appendix C: Complete CPN models…………………………………………………….…………..146
Appendix C.1. CPN model for automatic parameter change ………………………………………..146
Appendix C.2. CPN model of negotiation on coupled parameters values ……………….………….147
XVIII
LIST OF ABBREVIATIONS AND
SYMBOLS
Abbreviations
API Application Programming Interface
CAD Computer Aided Design
CAE Computer Aided Engineering
CPN Coloured Petri Nets
CPN ML CPN Modelling Language
CSCD Computer Supported Collaborative Design
CSCW Computer Supported Collaborative Work
DRM Design Research Methodology
DMM Domain Mapping Matrices
DSM Design/Dependency Structure Matrix
EDA Engineering Design Activity
EDP Engineering Design Parameter
ERP Enterprise Resource Planning
FL_A Facelift project A
FL_B Facelift project B
IBIS Issue Based Information Systems
I/O Input/Output
MDM Multiple Domain Matrix
ML_A Module development project
NLP Natural Language Processing
PD Product Development

XIX
PDM Product Data Management
PLM Product Lifecycle Management
PN Petri Nets
RAPN Resource Aware Petri Nets
REST Representational State Transfer
RPV Reactor Pressure Vessel
SML Standard Meta Language
SQL Structured Query Language
WF-Net Workflow Net
Symbols
C(Pi) specified capacity of a PN place
mi A set of PN marking; the number of tokens in a place Pi
Pi a set of PN places
Ti a set of PN transitions

1
1. INTRODUCTION
The first chapter is an introductory chapter that provides a glance at topics such as motivation
for this work, research aims, hypothesis, and methodology used. At the end of this chapter, the
reader will be introduced to expected contributions, followed by the thesis structure.
1.1. Research focus, aim, and hypothesis
Managing product development processes is complex and challenging [1]. Researchers have
developed numerous process models to understand, improve, and support the product
development processes considering their particular characteristics. However, the complexity is
such that no single model can address all the issues [2]. Karniel and Reich [1] argue that
iterations in product development are considered a major source of increased product
development lead-time and cost. Their opinion is that simulating product development
processes using their specific contexts can provide project managers with decision-making
methods.
In literature, the product development process is usually composed of design activities. One of
the first classifications of activities in product design was proposed by Hubka and Eder. They
consider design activity as the level of abstraction that the rational cognitive activity in
designing can be decomposed into. In the literature, several authors contributed the
classification of the design activities [3] [4], [5],[6], [7].
Engineering parameters are an indispensable part of almost every engineering design activity.
Ropohl [8] defines engineering parameters as: “An Engineering Parameter represents any
characteristic of quality and relation which can specifically be described by a quantity. It
thereby explicitly carries the name of the describing characteristic and a quantity (numerical
value and optionally a unit).”
The motivation for this research came from discussions with the researchers from the research
and development department of a leading automotive company. Those discussions exposed the
increasing significance of issues and problems in design practice whose resolving require
improvements in synchronous design team communication. These claims are supported by the
literature [9], [10]. Such issues are of particular interest during decision-making processes in
long-lasting product development projects involving large distributed teams. One part of these
decision-making processes relates to the determination of engineering parameter values.

1. Introduction
2
Fernandes et al. [11] presented the study regarding the determination of design parameter values
during conceptual design of jet engine, identifying an iterative process in which parameter
values are changed within defined range that become narrower as a solution is reached.
Research in this PhD thesis continues and builds upon already established research in the field
that focuses on issues of engineering design parameter management in the process of
developing a vehicle architecture [12],[13],[14].
The main reasons to develop an approach that should support synchronous teamwork
communication on design parameters during product development are supported by the
following claims found in the literature but are also expressed during discussions with the
design engineers:
- Design activities are sometimes performed with outdated or wrong product data
(e.g., parameter values)
Having valid data with correct values is the most precious thing during any activity. If
data does not have the correct and newest value Flanagan [15], delays and re-execution
of an activity can be expected. The reasons for incorrect data can be numerous. Still,
most common are:
• Using outdated values for generating values of dependent parameters,
• Incorrect interpretation of context during the determination of parameter value,
• Making typos while rewriting a value from one place to another.
When the problem is caused by using wrong values, the source of the problem can be
found in the drawbacks of workflows in product life cycle management systems [1].
There is also another source of the problem, and systems themselves cannot be blamed
since it is more human nature [16]. Engineering designers do not update values in the
design support systems immediately after the values are changed, but with some delay
(they are using values locally). That delay can cause a problem if the value is not linked
with the original value and if it is used at some other place in the meantime.
- Critical situations burden the whole system, from a designer to a management
According to McMahon [17], critical situations in product development are typically
collaborative, where a choice is made, or the process takes a new direction on a
conceptual or embodiment design level. Badke-Shaub and Frankeneberger [18]
1. Introduction
3
distinguished designers’ daily work to routine work and critical situations. Routine work
is every work in which an engineering designer knows in advance what will be the result
after the activity is finished and uncertainties do not exist. On the other side, during
critical situations, designers determine “choice points” in the development process [18],
reflecting the outcomes of the whole project. The authors in their research found out
that in nine of ten critical situations, designers will contact their colleagues for advice.
Therefore, communication between team members has a huge role in resolving critical
situations. More about critical situations, how they arise, and how they are usually
resolved is described in Section 2.4.2. This research tends to resolve critical situations
by supporting communication between designers using Coloured Petri Net (CPN)
models, which partially automate identified design activities.
To get a better and more precise overview of the most significant problems and critical
situations in the discussed areas, it has been decided to perform a detailed analysis of reports
from weekly design team meetings. The analysis was conducted for three completed and
documented long-term development projects, which included 50 multidisciplinary teams of the
automotive company. The analysis of the projects itself was not sufficient to identify all critical
situations that might arise; hence discussions with researchers and engineering designers from
the R&D department were conducted.
The results of these analyses provided valuable insights and directions for establishing an
approach for developing improved and innovative features of the design support system that
should address drawbacks of current computer-supported collaborative work (CSCW)
methodologies and tools. Starting points for improvements of the current CSCW systems are
primarily based on McMahon's [17] extensive overview of state of art for supporting the design
actors.
As already stated, this research continues on the research in the field of design parameters
management, management of design activities, and design communication in critical situations.
During the initial discussion with the company, which provided data for the analysis, it was
decided to explore an approach based mainly on Petri nets (PN). Therefore, a great effort has
been invested in the research of PN and its extensions. Ordinary PN is a comprehensive
methodology, but it lacks some useful features (e.g., data types, manipulation of data values
[19], [20]), which are included in various extensions. Since there is no single tool that supports
all extensions (at least widely used extensions), the task was to find out which tool comprises
1. Introduction
4
as many as possible PN extensions that will cover most of the needs for the developed approach.
The suitability of Coloured Petri Nets (CPN) and a tool that supports that PN extension for this
approach has been presented in Juranic et al. [21] and Pavković et al. [22].
The data and information produced during design activities are used by and processed in several
design support and information systems (e.g., computer-aided design, enterprise resource
planning, product data management). Consequently, the same data is often used in several
different contexts, depending on the user’s role (e.g., engineering designer, project manager).
During discussions with engineering designers and researchers in the company, many
complained that they are burdened with a high percentage of administrative tasks and routine
tasks instead of creative ones. Škec [23] in his thesis showed that engineering designers have
less than 70 % of working time available for engineering design activities. One of the goals of
this research is to model and partially automate elements of design activities, including
information processing activities.
Based on the initial research, several questions were raised. These questions are afterwards
refined and shaped into research questions. The research questions are presented in Section 2.6,
after literature review and recognized research gaps. Each research question is described in
detail in that section, while this section will continue with research aims and proposed
hypothesis.
Research aims
The aim of the presented research is to develop a model and software support that would enable
consistent updating and propagation of design information in teamwork. It is essential that the
usage of the proposed model and software support do not require additional efforts for
engineering designers while performing design activities. Repetitive patterns of communication
situations and parts of the design process will be extracted by analysing information processing
and information flows in a complex product development process.
Hypothesis
The proposed research will verify the following hypothesis: Computer-based realisation and
practical implementation of consistent updating and propagation of information about design
parameter is the essential precondition for developing models of partial automatization of
design information processing and transfer which would significantly reduce the number of
unnecessary iterations and additional costs.
1. Introduction
5
1.2. Research methodology
Research in design science aims to formulate and evaluate models and theories on the
phenomenon of design and development of technical systems, based on which the strategies,
procedures, methods, techniques and tools are used to improve practical knowledge, project
management and education [24]. Modelling of the product development processes and their
implementation and simulation within teamwork is a very complex task that requires an
integration of multiple approaches and disciplines [1], especially in technical science and
management [25], [26], [27]. Above all, a systematic research methodology is needed.
The process of collaborative engineering design takes place in complex socio-technical context,
and often results in conflicts due to various combinations of technical and social factors. To
analyse the causes of such conflicts it is necessary to combine several deductive and inductive
research approaches. Finally, mathematical approaches together with computer science
knowledge have to be used during the model development to better understand, model and
foresee the dynamic nature of engineering design activities that deal with design parameters
within development processes and the aspects in the focus of proposed research.
In line with the current trend in design research area, this thesis will use the integrated research
methodology in the form of "analyse - evaluate - create - refine - validate". The research will
build on the state-of-the-art developments in the exploration of principles of organisational
information management. These principles will be enhanced with insights from modelling,
simulation and visualisation of the complex design activities to support the communication and
information processing in product development projects.
The research methodology consists of the following phases: preliminary research, data
gathering, model and simulation realization and evaluation. These phases are furthermore
elaborated through the adjustment of general research methodology in design science [24],
using the guidelines for research elaboration and the conduction of descriptive and prescriptive
studies.
1) Preliminary research: This stage starts with an overview of existing scientific and
expert literature within the research area to give an initial description of the existing
situation and desired results and to define basic assumptions. A literature review involves
the definition of literature sources, extraction and synthesis of data, and categorization of
publications [1], [25], [28], [29]. Preliminary research provides insight into existing
1. Introduction
6
product development process models. Particular interest is devoted to the context and
lower granularity levels of engineering design activities, to methods for modelling
engineering design parameter flows in teamwork and issues in team communication. In
the end, preliminary research should provide research goals, main research questions and
the hypothesis.
2) Data gathering: To get an overview of design parameter management during the design
activities, collection and analysis of meeting reports generated during the development
project have been conducted. Data has been gathered in an industrial environment with
empirical methods, observations, and the participation of the primary researcher in the
R&D department of an automotive company for a limited time. The goal of this phase is
a better understanding of lower granularity levels of activities in the development process
along with information processing and exchange for the cases that are unsatisfactorily
supported by literature data. Empirical methods involved extensive interviews with a
leader of the department that supports design engineering teams with new methods and
tools. Data gathering has to complement the reference model and ensure a better
understanding of the current industrial practice as a foundation for model realization.
3) Model development: The model realisation entails broadening the current knowledge
by synthesising data collected by literature review and empirical studies. Model
development has been conducted in two steps.
The first step is creating an initial model of information processing during design
activities (with the focus on design parameters). This step is based on literature review
and empirical studies, including interviews with employees of the R&D department in an
automotive company. The model creation will include information processing and
information flows using conventional methods for design activities management
depending on the organisational and project context.
The second step will extend and adapt the initial model to include consistent timely
updating and propagation of the design information. In such an approach, the model
elements will be expanded to the lowest level of granularity of design activities. Based
on the analysis of gathered data about engineering design activities, repetitive patterns
and situations as elements of design process activities will be extracted. The extraction
starts with an analysis of routine activities of design information processing with the focus
on coupled design parameter information flows [15] and especially on issues of
1. Introduction
7
information updating and information propagation [30]. For extracted elements of design
activities, modelling and visualisation of dynamics are conducted using Petri nets models
in the form of generic templates. This concept of CPN templates is based on the work of
Mulyar and van der Aalst [31], [19]. A similar approach to building CPN templates can
be found in the paper of Arena [32].
To complete the research's impact analysis, it is necessary to establish plans and methods
for model evaluation during both steps. The desired result of the second step is a set of
CPN model templates of selected communication situations and elements of design
activities focused on engineering design parameters. The implementation of the proposed
model should be able to manage and execute parts of the design activities with the aim of
gradual automatisation of recognised information processing and information transfer
activities. For the realisation of the proposed model, various variants and extensions of
Petri nets [30], [33], [34], [35] have been examined. Possible extensions which would
enable the implementation of design process knowledge capturing and storing will also
be considered.
4) Research evaluation: The evaluation has been conducted by validating and
implementing the proposed model based on the analysis of data gathered during real
development processes and by comparing the results with research aims. To further
expand the evaluation, it is necessary to analyse the development processes of
organisations in which the methods and the model might be implemented (with interviews
and with an overview of documentation, CAD and PDM data).
The influence of the model for processing design activities (based on CPN templates) on
reducing iterations and duration of activities in the process of design parameters
management is analysed. Based on the derived conclusions, theoretical and practical
contribution to scientific research are evaluated. Furthermore, the advantages and
disadvantages of the developed model and methods are pointed out. The outcome of this
phase includes proposals for necessary improvements, guidelines for the implementation
of simulation models within the real processes of planning and management of
development projects, and guidelines for further research based on the final findings and
conclusion.
1. Introduction
8
1.3. Scientific contribution
The expected contribution of this research, as part of the PhD thesis, is manifested through two
following aspects:
• Development of a model for processing design parameters that should enable consistent
dynamic updating and propagation of updated information within teamwork.
• Development of software support for partial automatisation of design parameter
management based on extraction, formalisation and modelling of templates of
situations which are often repeated in design team communication and coordination.
1.4. Thesis structure
The thesis is divided into eight topic-oriented chapters, which to some extent, follow the stages
described in the research methodology. The thesis structure is shown in Figure 0.1.
Figure 0.1. Thesis structure and corresponding stages of DRM
Chapter 1 starts with research motivation and emphasises focus points that drive the research.
Afterwards, research aims, hypothesis and the methodologies used to achieve expected
contribution are presented. This introductory chapter covers the outputs of the first stage of
DRM, the Research Clarification stage.
1. Introduction
9
Chapter 2 encompasses the literature review study and concludes with found research gaps. The
chapter is divided into several sections, where each of them presents insights into a specific
topic relevant to this work. The review process starts with papers related to the engineering
design process itself. Then, it continues to design activities and their classification as they are
the central part of the design process.
The literature review further focuses on managing design parameters since engineering
designers cope with them during each design activity, and they describe every product or part.
While working with parameters, engineering designers typically work in teams. Hence, the next
topic to explore is communication during the design process, especially communication about
design parameters.
The last part of the literature review is dedicated to Matrix-based methods since they are widely
used in industrial practice for some aspects of design parameter management.
After all relevant topics are covered, the chapter is concluded with recognised research gaps,
which ought to be filled with the contributions resulted from this research. The second chapter
as such follows the first part of the Descriptive Study I stage.
The other part of the Descriptive Study I is presented in Chapter 3. After the literature review,
the next endeavour was to analyse data provided by the company. The analysis of collected data
gave insights into engineering designer’ work and their communication during critical
situations. During the analysis, the focus was on the type and frequency of various design
activities conducted within analysed development projects. In order to develop a model for
automating routine tasks, knowing the activity type and frequency was not enough; it was
necessary to lower the granularity of analysed data. Therefore, besides activities, parameters,
relations between parameters and their values were extracted and analysed. The results
collected from this phase were used as a building material for the next phase.
Using obtained knowledge from Descriptive Study I, the development of a model for automated
execution of engineering design activities has begun. Chapter 4 covers several areas of the
model and framework development, from its core and theoretical basis, up to software
components described in Chapter 5, that were necessary to make it functional for validation
purposes. The framework is based on several CPN principles, so they are described, and it is
presented how they are incorporated and tailored for this specific purpose. The chapter ends
with a description of the CPN model templates developed during this research. From DRM’s
1. Introduction
10
perspective, Chapter 4 and Chapter 5 present the activities that are usually performed in
Prescriptive Study I.
The developed model for supporting engineering design activities and belonging CPN models
are evaluated and validated in Chapter 6. The evaluation is performed using two case studies
that differ in scope, duration, expected results, and how the projects are managed. The aim was
to use different case studies and therefore evaluate the framework in a broader scope, to find
out if the framework is scalable, robust enough and finally, if obtained results confirm or deny
hypothesis and do they provide answers to research questions raised in Chapter 2.
Chapter 7 discusses the developed framework and CPN models. This includes analysis of
strengths and possibilities allowed with these models, but also potential implications on
research and practice. Furthermore, the insights from the available literature have been used to
discuss presented results in the context of the research questions and present the potentials of
the proposed methodology and the framework as the final step in Descriptive Study II.
The final chapter, Chapter 8, concludes the research by reflecting on the proposed research
aims, main research hypothesis and expected contributions. Moreover, this chapter presents the
limitations identified by conducting the Prescriptive Study and provides directions for future
research that would contribute to the support for engineering designers regarding parameter
management during engineering design activities.
11
2.THEORETICAL BACKGROUND
This chapter coincides with the Descriptive Study I stage of DRM. It provides a literature
review on the most relevant topics for this research, including an overview of the engineering
design process on a macro level, management of design activities on a meso-level and design
parameters on a micro-level. A literature review of Petri Nets and existing extensions are
presented in appendix A as they are extensively used in the rest of the research. At the end of
this chapter, research gaps matching the introduced hypothesis are provided and briefly
discussed.
2.1. Engineering design process
A few decades ago, Eder [36] defined an engineering design process as follows: “Engineering
design is a process performed by humans aided by technical means through which information
in the form of requirements is converted into information in the form of descriptions of technical
systems, such that technical systems meet the needs of mankind.”
Starting from the end of engineering design definition, the term "technical system" is a synonym
for all manufactured artefacts, including technical products and processes. According to Hubka
and Eder [37], the technical system is the subject of the collection of activities performed by
engineers within the processes of engineering design, including generating, retrieving,
processing, and transmitting information about products. To make better products, services or
systems, it is required to use the best available processes [38].
Numerous research papers point out that the proper management of engineering design
processes can help with the generation of better final products but also help to avoid potentially
significant problems. Developing a complex product can involve thousands of experts over long
periods of time. To make that possible, decisions at the micro-level (design activities and their
context), meso-level (management of tasks during the progress), and macro-level (management
of projects) must be handled with special care [39]. Developing a complex product immediately
drag along a need to manage the complex dependency structures. The best example of that is
managing engineering designers in concurrent product development while they work in
geographically dispersed teams. Regardless of obstacles, they may face, the right deliverables
should be produced at the right time to avoid becoming starved for information or becoming
overwhelmed with urgent tasks.
2. Theoretical background
12
In the literature, the design process is usually represented as a series of stages in which each
stage will receive more concrete information about design resulting from the previous stage [2].
These stages are divided into the following main phases [40]:
• Planning and task clarification
• Conceptual design
• Embodiment design
• Detail design
After the requirements and are tasks defined and clarified, the conceptual design phase may
begin. In that phase, the overall layout of an artefact is established, and decisions made here
have a vast influence on the following phases and final design of the artefact [40]. Therefore, it
is to expect that information that will define the product’s function, and its initial shape will be
defined and managed mostly in this phase. In all the following phases, information from the
conceptual phase is further refined until the final design. According to the previous statement,
this research will focus on the conceptual design phase with the goal of supporting engineering
designers during the definition and management of product information.
Engineering design processes involve the effort of many people performing multiple and varied
activities in order to obtain a common goal, such as the development of a product [41].
Moreover, engineering design processes have multi-layered nature what makes managing the
processes more challenging [17]. On the top level, engineering design processes consist of
phases (stages) mentioned before, which are composed of milestones (work packages).
2.2. Design activities
2.2.1. Ontology of engineering design activities
In the beginning, philosophers and mathematicians gave much attention to ontology over
centuries, dealing with the conceptualisation of reality and, afterwards, the multiple perceptions
of the physical phenomenon. This has generated many papers in the field of knowledge
engineering and surrounding engineering domains that leverage knowledge and knowledge-
based techniques [42]. In the literature, one can identify two different strategies for developing
ontologies. These are the top-down and bottom-up strategies. The top-down strategy supports
a higher abstraction-level ontology development by emphasizing the underpinning theories or
philosophical stances/assumptions. On the other hand, the bottom-up strategy of ontology

2. Theoretical background
13
development attracts non-logicians and non-philosophers since bottom-up ontologies may
structure knowledge belonging to a specific domain. That development direction is represented
by domain ontologies, which describe concepts for a specific domain, and application
ontologies, which include concepts for a particular application. With the growing demand for
artificial intelligence-based techniques in engineering design, ontology also has a great role to
play, especially by coupling reasoning and learning capabilities [43].
Ahmed and Štorga [4] offered a general ontology for an engineering design that can be adjusted
to two different perspectives based on a particular need: to a practitioner’s one or researcher’s
one. The approaches for two independent research studies leading to the development of two
ontologies were examined: Engineering design integrated taxonomies [44] and Design ontology
[45].
Another approach is presented by Li et al. [46], where structured design rationale is retrieved
using ontology-aided indexing. Rockwell et al. [47] developed a decision support ontology to
enable decision-making within a collaborative design, which includes decision-related
information, such as the design issue, alternatives, evaluation, criteria, and preferences. Lim et
al. [47] compiled state-of-the-art ontology applications for design information and knowledge
management. They reported their findings from a number of perspectives that included
ontology engineering, major applications of ontology in design engineering, and the state of
ontology adoption in the industry. During the design process, in most cases, designers do not
have a common understanding of the design activities they perform [3]. After discovering that
issue, the authors performed a literature review which resulted in the identification and
classification of a generic set of design activities. Additionally, Sim and Duffy [3] presented a
set of consistent and coherent definition of these activities.
Their classification has three groups of activities:
1. Design definition activities (abstracting, associating, composing, decomposing,
defining, detailing, generating, standardising, structuring, synthesising)
2. Design evaluation activities (analysing, decision making, evaluation, modelling,
selecting, simulating, testing)
3. Design management activities (constraining, exploring, identifying, information
gathering, planning, prioritising, resolving, searching, selecting, scheduling)
Design definition activities cope with the complexity of the evolving design. They define design
from the very beginning until it has all the details required for production. The second group of

2. Theoretical background
14
activities, design evaluation activities, analyse and evaluate the feasibility of potential design
solutions. They are reducing design solution space by discarding infeasible solutions. The last
group, design management activities, manage the complexity of coordinating activities related
to an evolving design and its process. The design management activities are further classified
into activities that manage the evolution of a design problem into a design solution and activities
that manage the design process as the design evolves.
2.3. Engineering design parameters
In the conceptual, embodiment or detailing phase of product development, information on the
lowest level of granularity is a parameter, and it could be observed as one of the essential parts
of the process. Despite it is a building block of every product, when designers are asked how
they would define a parameter, numerous answers are received. It has a more concrete
definition in fields other than engineering. For example, Vajna [48] argued about the meanings
and interpretations of the term parameter in the context of Mathematics, Informatics and
Engineering. In the engineering field, Ropohl [8] propose the following definition of design
parameters:
“An Engineering Parameter represents any characteristic of quality and relation
which can specifically be described by a quantity. It thereby explicitly carries the
name of the describing characteristic and a quantity (numerical value and
optionally a unit).”
Management of parameters in a teamwork environment could be highly complicated, and it
could raise serious issues and increase lead time and expenses, especially if coordination and
communication about coupled parameters are not efficiently organised and supported by
existing software tools (Flanagan, Eckert, and Clarkson, 2003). Some researchers emphasise
that hype of increased modularisation and standardisation in the industry leads to enormous
complexity [49] of parameter management since components are used on various products, and
it is very difficult to cope with procedural complexity [14]. Although the research on those
issues started a few decades ago, they are present today as well [50], [51], [52].
Several leading PLM systems support the management of engineering or design parameters.
Mostly, they are oriented to tying them to requirements. If the value of a parameter is inside the
defined range, that implies that the requirement is fulfilled. PLM systems allow the definition
of several properties for parameters during their creation. These properties follow the research
2. Theoretical background
15
literature, which is reviewed in the scope of this research. The following list enumerates these
properties:
• Parameter name (must be unique)
• Parameter title
• Owner
• Description
• Priority
• Function
• Value (nominal, minimal, maximal or multiple discrete values)
A similar approach is developed from scratch by some researchers in the automotive industry
[12]. They developed an approach for parameter management that is based on system
engineering principles. The central part of this approach is a parameter repository that stores
parameters and all related properties, but also relations among these parameters [13]. To capture
the knowledge and parameter changes, researchers established a traceability mechanism that
follows a parameter from its creation. Nevertheless, this topic is to be explored further in order
to develop an approach that will be efficient enough to gain popularity among designers.
Otherwise, it will just be additional administrative work they are already overwhelmed with.
2.3.1. Real-time updating of information and workflows
Companies which operate in technical branch cope with very demanding market and
competition, in all possible ways. One way to improve productivity and effectiveness is by
using the product lifecycle management (PLM) systems. Among all mainstream areas that PLM
systems cover, e.g. System Engineering, Product Design, Manufacturing Process Management
or Product Data Management, PLM systems are capable of supporting team communication
and partially dynamic situations during the design process [1]. Such dynamic situations are of
particular interest during reasoning and decision-making processes in long-lasting product
development projects, especially if those projects involve large teams which do not work from
the same location [53].
Even though PLM systems support design process dynamics, some authors addressed the
drawbacks which could play a significant role in decision making during product development.
2. Theoretical background
16
For example, Karniel and Reich [1] questioned whether the services in PLM systems always
use updated product information in their operations. They wrote that even if users have instant
access to all information and information is consistently updated, that does not guarantee that
information will be used properly.
Research conducted in the automotive industry points out that PLM systems do not sufficiently
support communication among teams that collaborate on a project [16]. Additionally, some
authors [12], [13] highlight the ineffective exchange of information and knowledge between
team members. That issue especially comes to the fore in the case of low-granularity
engineering information, such as design parameters. The communication dynamics problem is
not a new research topic. As a matter of fact, it is continuously studied since the research of
Eckert and Stacey [9] and Eckert et al. [54].
Karniel and Reich [1] emphasised that information about changes should be flawlessly
integrated into the design process. Following that, Wynn et al. [55] stated that the propagation
of changes should be an integral part of dynamic process planning and execution. Integration
of changes in design is critical to deal more efficiently with the challenges in product
development process management [30]. Researchers argue that process management, which is
executed through embedded workflow tools, is incapable of integrating updated product
information into dynamic run-time operations. Many aspects of this problem were addressed in
a comprehensive systematic literature review of product development process modelling
methods [29], where more focus was given to static scheme processes, but according to Karniel
and Reich [1], [30] methods that tackle the demands of the dynamically evolving schemes of
product development processes are still missing.
Static workflows offer little flexibility for engineering design since they are designed prior to
the start of the design process. In the work of Rouibah and Caskey [55], the authors confirm
that such workflow systems could be observed as static. The same authors [56] described an
improvement in which the engineering workflow approach controls the early phases of product
design that is suitable for concurrent engineering’s dynamic and iterative processes. The
approach uses design parameters to reflect basic engineering decisions. Besides evident lack of
support for dynamics in workflows, Müller [57] concluded that conventional workflow
management systems do not provide sufficient flexibility to cope with the wide range of failure
situations that may occur during workflow execution. Some benefits could be achieved by
workflow monitoring which results in improvement or even avoidance of delays in industrial
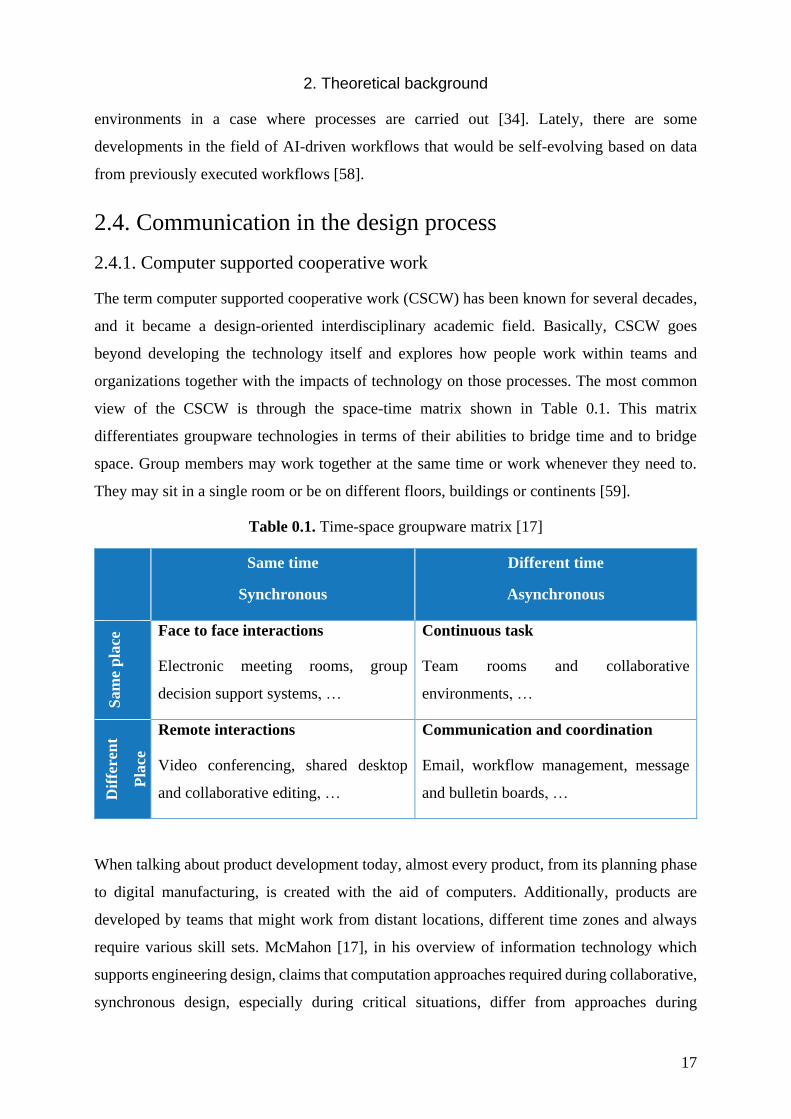
2. Theoretical background
17
environments in a case where processes are carried out [34]. Lately, there are some
developments in the field of AI-driven workflows that would be self-evolving based on data
from previously executed workflows [58].
2.4. Communication in the design process
2.4.1. Computer supported cooperative work
The term computer supported cooperative work (CSCW) has been known for several decades,
and it became a design-oriented interdisciplinary academic field. Basically, CSCW goes
beyond developing the technology itself and explores how people work within teams and
organizations together with the impacts of technology on those processes. The most common
view of the CSCW is through the space-time matrix shown in Table 0.1. This matrix
differentiates groupware technologies in terms of their abilities to bridge time and to bridge
space. Group members may work together at the same time or work whenever they need to.
They may sit in a single room or be on different floors, buildings or continents [59].
Table 0.1. Time-space groupware matrix [17]
Same time
Synchronous
Different time
Asynchronous
Sam
e p
lace
Face to face interactions
Electronic meeting rooms, group
decision support systems, …
Continuous task
Team rooms and collaborative
environments, …
Dif
fere
nt
Pla
ce
Remote interactions
Video conferencing, shared desktop
and collaborative editing, …
Communication and coordination
Email, workflow management, message
and bulletin boards, …
When talking about product development today, almost every product, from its planning phase
to digital manufacturing, is created with the aid of computers. Additionally, products are
developed by teams that might work from distant locations, different time zones and always
require various skill sets. McMahon [17], in his overview of information technology which
supports engineering design, claims that computation approaches required during collaborative,
synchronous design, especially during critical situations, differ from approaches during
2. Theoretical background
18
individual work and more asynchronous modes of routine design. He defined synchronous
working as work where people interact in real-time such as in meeting, and asynchronous
working as independent work where the interaction is done by mail which matches the
description from Baecker et al. [59].
Brisco et al. [60] studied CSCW in the design domain called computer supported collaborative
design (CSCD). The aim was to develop a systematic method for engineering design teams to
evaluate and select the most suitable CSCD technologies. The authors compared technology
functionality and project requirements established in the peer-reviewed literature, which results
in 220 factors that influence successful CSCD.
2.4.2. Critical situations in design team collaboration
In the previous subsections, critical situations were brought up several times. This paragraph
will explain the situations and tasks that are considered “critical” in the context of this thesis.
A critical situation from the engineering design perspective can be defined as any situation that
impacts the direction or development of the design activity being undertaken [61]. What
designates one situation as critical is usually how much time is available to resolve it or how
many resources are allocated to resolve the specific critical situation. The lack of available time
could have many roots, from poorly planned activities to additional unexpected activities that
have a higher priority [54]. Critical situations can arise from unresolved conflicts as well. These
issues might significantly impact the quality of outputs, which are design solutions or project
outcomes in a broader scope. The primary causes of all these problems often occur during the
activity of information gathering if such information is not timely updated, it is unavailable, or
the designers are not even aware that particular information exists. In teamwork, critical
situations are not rare; on the contrary, they are quite common [9].
According to McMahon [17], critical situations could be captured using two approaches. The
first approach is by capturing design rationale. The author clarifies that in recent years research
is focused on using graphical representation techniques like issue-based information systems
(IBIS). He also stated that the usage of such approaches had been well received in many
engineering companies. The other direction is capturing meetings using video and audio
techniques. Current research aims to the incorporation of automatic transcription of dialogue in
such meetings or by analysis of meeting reports. Conway and Ion [62] presented the
development of a system architecture designed to address the challenges associated with
creating accurate and reusable records of synchronous design activities. When dealing with
2. Theoretical background
19
large collaborative engineering design projects, success is denoted by the effective use and
understanding of working synchronously [63].
2.4.3. Design review meetings
Every project that is conducted by more than one person at some point demands parties to meet
and discuss the progress, problems and future steps of the project. The frequency and purpose
of the meetings may vary a lot and depend on the complexity of the project, how many
stakeholders are involved, and how teams and activities are organised. Here, the focus is on the
design review meeting, especially during the conceptual stage of long-lasting projects where
several teams are included, but many things are general and can be found in any kind of
meeting.
If implemented in the right way, design reviews enhance the potential for delivering a product
with the required quality, performance, safety and potential for reducing costs and delivery
times [64]. During design review meetings, the most common topics are usually clarifying
design assumptions, identifying design problems, and informing others about completed
activities [65].
Design review is defined as a cognitive process where information must be communicated to
stakeholders for efficient decisions [66]. Communication during the design process has a
significant role because it exchanges messages and carries ideas to people from different
disciplines. Review meeting belongs to the group of formal meetings, and it has a predefined
structure. Before the meeting, the agenda is sent to all stakeholders and after the meeting,
minutes are shared in order to have a written trail of discussion, decisions and requests.
Particularly for design review, key design decisions, design experiences and associated
rationale are very often made explicit. According to Huet et al. [67], the knowledge generated
during these meetings is very valuable and can be the key for the successful subsequent period.
Authors argue that it is critical to understand the process of information transaction process
during the meeting activity in order to build an effective knowledge-oriented recording strategy.
In that context, Juranić et al. [68] presented an extensive analysis of design meeting reports in
a large automotive company which includes both critical situations which had to be resolved
and routine design tasks. The authors gave insight and directions for reasoning needed to
improve the design team collaboration.
2. Theoretical background
20
2.5. Iterations in the design process
Design, development, and other projects inevitably involve iterations. When iterations are
mentioned, the first suggestion is increased duration and costs of a project, but iterations also
have positive effects such as enabling progressive generation of knowledge, enabling
concurrency and integrating necessary changes [38].
Piccolo et al. [69] analyse a socio-technical perspective on iteration in the design and
development process. They argue that, while many researchers consider design iteration from
either a technical perspective (e.g. dependencies among tasks) or a social perspective (e.g.
interactions among people), an approach considering both these domains together can yield
additional insight. They investigate the patterns of iteration in different design phases and use
regression analysis to test hypotheses about the relationship between iterations and network
characteristics of the interactions among documents, activities, and people.
The source of the need for the process of iteration in design may vary a lot, but it always comes
down to the situations where interrelationships are so complex that the desired solution cannot
be achieved in one step, and that information is frequently needed from a subsequent step [40].
In the planning phase, it could be due to disagreement or misunderstanding between client and
designer, legal obstacles, tailoring the cost estimate or something else. In the later phases,
iterations usually have a more technical nature and could have the following sources: iteration
to progress the design, iteration to correct problems or implement changes and iteration to
enable coordination within a process or between a process and its context [50]. On the other
hand, the iteration process can also have positive effects, including exploration of concepts,
finding and correcting flaws, and enabling development under complexity, uncertainty and
change [70]. The iterations which are interesting for this research are about defining values of
parameters.
During the planning stage, an initial product description is defined. Such a description specifies
only the key design parameters according to the customer’s requirements. It does not involve
most of the parameters, which will be progressively defined and adjusted as the work proceeds
during the other product development phases [68]. These parameters are often easy to
determine, but in many cases, parameters are coupled, which leads to the iteration processes.
Coupled parameters are not straightforward to calculate, and it is even more complicated if
parameters are not defined just by one designer. In many cases, coupled parameters originate
from different parts or assemblies which are designed by different designers. To make things
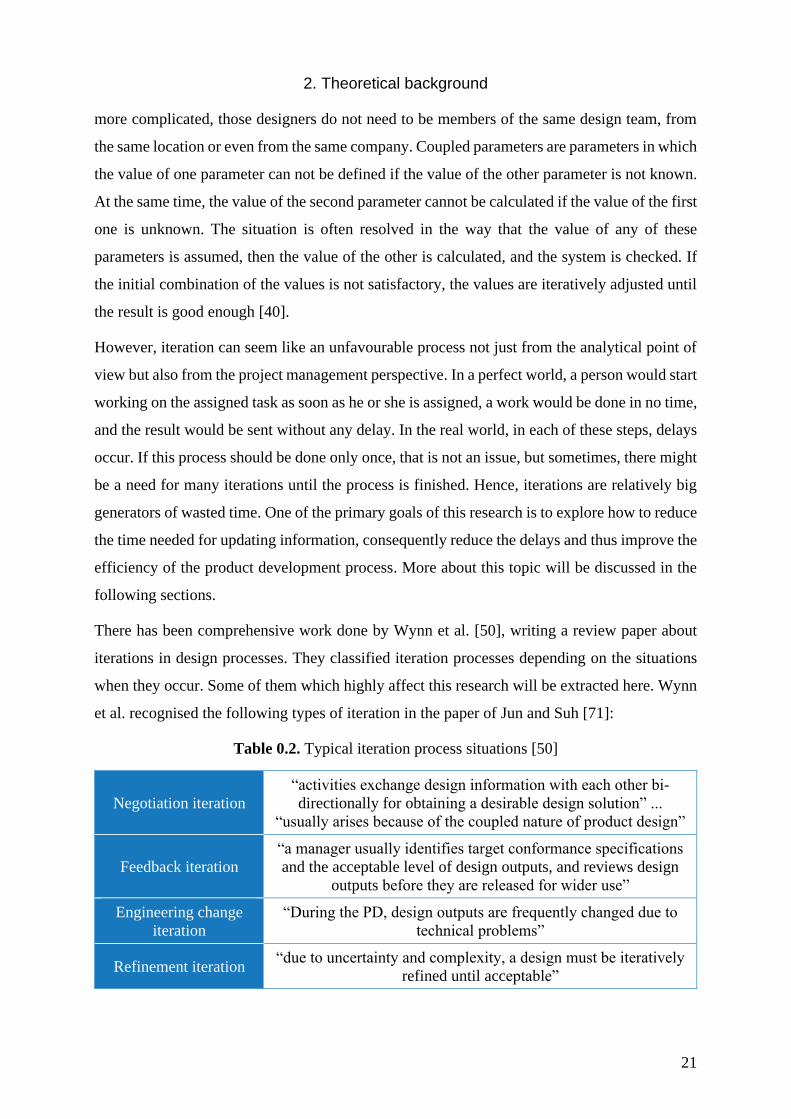
2. Theoretical background
21
more complicated, those designers do not need to be members of the same design team, from
the same location or even from the same company. Coupled parameters are parameters in which
the value of one parameter can not be defined if the value of the other parameter is not known.
At the same time, the value of the second parameter cannot be calculated if the value of the first
one is unknown. The situation is often resolved in the way that the value of any of these
parameters is assumed, then the value of the other is calculated, and the system is checked. If
the initial combination of the values is not satisfactory, the values are iteratively adjusted until
the result is good enough [40].
However, iteration can seem like an unfavourable process not just from the analytical point of
view but also from the project management perspective. In a perfect world, a person would start
working on the assigned task as soon as he or she is assigned, a work would be done in no time,
and the result would be sent without any delay. In the real world, in each of these steps, delays
occur. If this process should be done only once, that is not an issue, but sometimes, there might
be a need for many iterations until the process is finished. Hence, iterations are relatively big
generators of wasted time. One of the primary goals of this research is to explore how to reduce
the time needed for updating information, consequently reduce the delays and thus improve the
efficiency of the product development process. More about this topic will be discussed in the
following sections.
There has been comprehensive work done by Wynn et al. [50], writing a review paper about
iterations in design processes. They classified iteration processes depending on the situations
when they occur. Some of them which highly affect this research will be extracted here. Wynn
et al. recognised the following types of iteration in the paper of Jun and Suh [71]:
Table 0.2. Typical iteration process situations [50]
Negotiation iteration
“activities exchange design information with each other bi-
directionally for obtaining a desirable design solution” ...
“usually arises because of the coupled nature of product design”
Feedback iteration
“a manager usually identifies target conformance specifications
and the acceptable level of design outputs, and reviews design
outputs before they are released for wider use”
Engineering change
iteration
“During the PD, design outputs are frequently changed due to
technical problems”
Refinement iteration “due to uncertainty and complexity, a design must be iteratively
refined until acceptable”
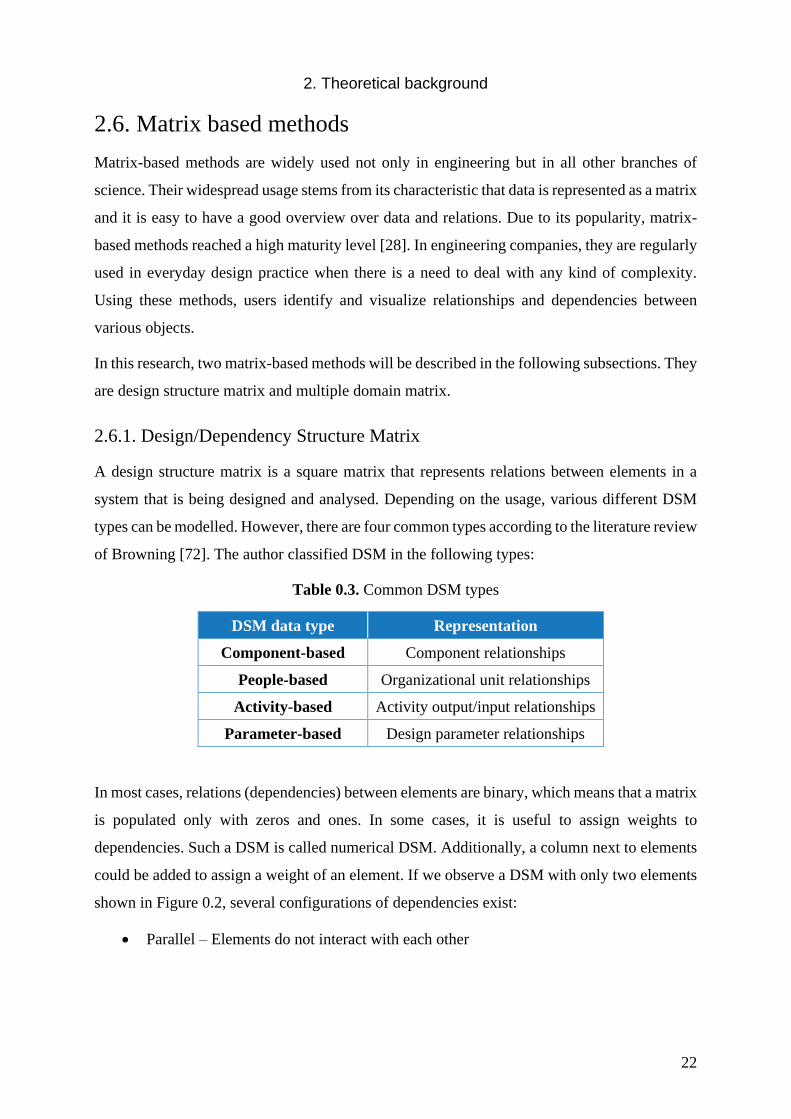
2. Theoretical background
22
2.6. Matrix based methods
Matrix-based methods are widely used not only in engineering but in all other branches of
science. Their widespread usage stems from its characteristic that data is represented as a matrix
and it is easy to have a good overview over data and relations. Due to its popularity, matrix-
based methods reached a high maturity level [28]. In engineering companies, they are regularly
used in everyday design practice when there is a need to deal with any kind of complexity.
Using these methods, users identify and visualize relationships and dependencies between
various objects.
In this research, two matrix-based methods will be described in the following subsections. They
are design structure matrix and multiple domain matrix.
2.6.1. Design/Dependency Structure Matrix
A design structure matrix is a square matrix that represents relations between elements in a
system that is being designed and analysed. Depending on the usage, various different DSM
types can be modelled. However, there are four common types according to the literature review
of Browning [72]. The author classified DSM in the following types:
Table 0.3. Common DSM types
DSM data type Representation
Component-based Component relationships
People-based Organizational unit relationships
Activity-based Activity output/input relationships
Parameter-based Design parameter relationships
In most cases, relations (dependencies) between elements are binary, which means that a matrix
is populated only with zeros and ones. In some cases, it is useful to assign weights to
dependencies. Such a DSM is called numerical DSM. Additionally, a column next to elements
could be added to assign a weight of an element. If we observe a DSM with only two elements
shown in Figure 0.2, several configurations of dependencies exist:
• Parallel – Elements do not interact with each other
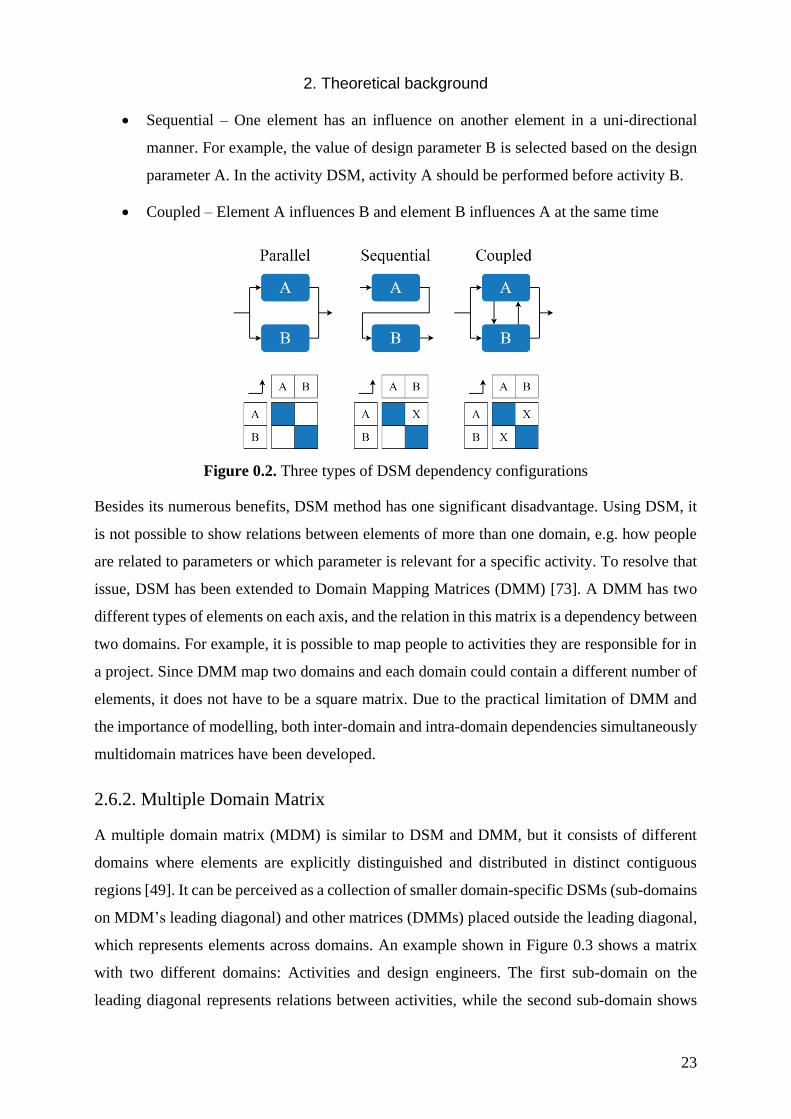
2. Theoretical background
23
• Sequential – One element has an influence on another element in a uni-directional
manner. For example, the value of design parameter B is selected based on the design
parameter A. In the activity DSM, activity A should be performed before activity B.
• Coupled – Element A influences B and element B influences A at the same time
Figure 0.2. Three types of DSM dependency configurations
Besides its numerous benefits, DSM method has one significant disadvantage. Using DSM, it
is not possible to show relations between elements of more than one domain, e.g. how people
are related to parameters or which parameter is relevant for a specific activity. To resolve that
issue, DSM has been extended to Domain Mapping Matrices (DMM) [73]. A DMM has two
different types of elements on each axis, and the relation in this matrix is a dependency between
two domains. For example, it is possible to map people to activities they are responsible for in
a project. Since DMM map two domains and each domain could contain a different number of
elements, it does not have to be a square matrix. Due to the practical limitation of DMM and
the importance of modelling, both inter-domain and intra-domain dependencies simultaneously
multidomain matrices have been developed.
2.6.2. Multiple Domain Matrix
A multiple domain matrix (MDM) is similar to DSM and DMM, but it consists of different
domains where elements are explicitly distinguished and distributed in distinct contiguous
regions [49]. It can be perceived as a collection of smaller domain-specific DSMs (sub-domains
on MDM’s leading diagonal) and other matrices (DMMs) placed outside the leading diagonal,
which represents elements across domains. An example shown in Figure 0.3 shows a matrix
with two different domains: Activities and design engineers. The first sub-domain on the
leading diagonal represents relations between activities, while the second sub-domain shows
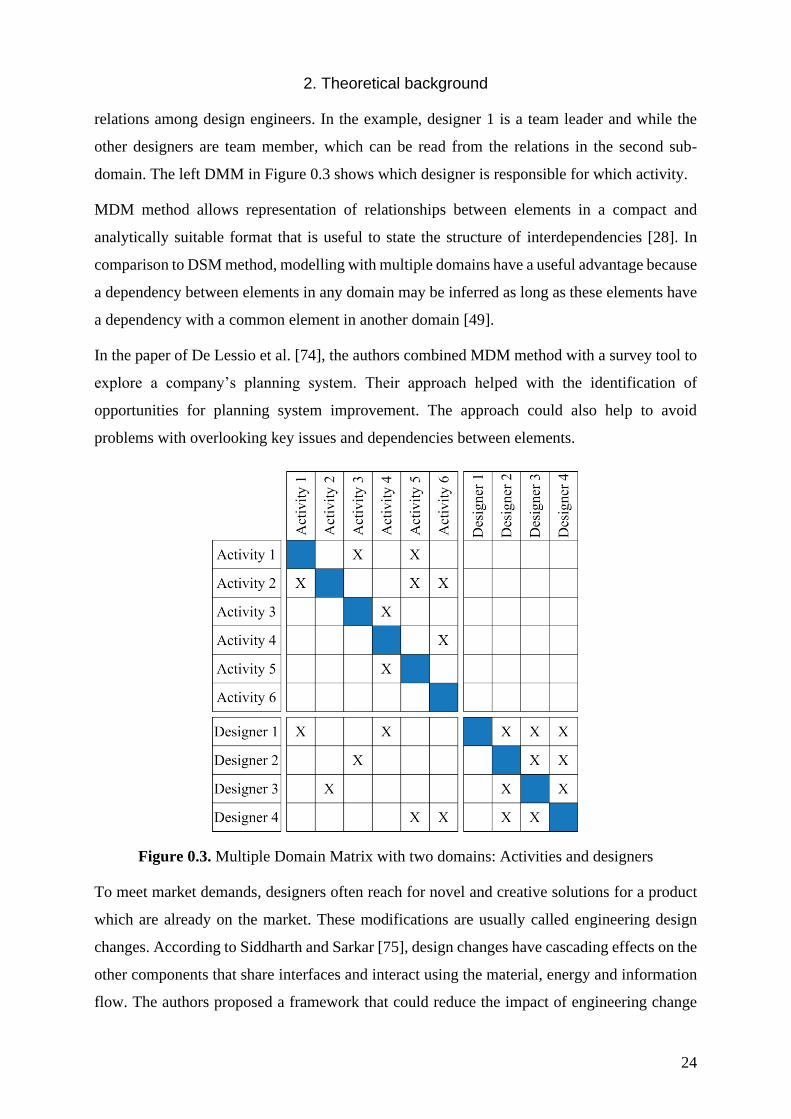
2. Theoretical background
24
relations among design engineers. In the example, designer 1 is a team leader and while the
other designers are team member, which can be read from the relations in the second sub-
domain. The left DMM in Figure 0.3 shows which designer is responsible for which activity.
MDM method allows representation of relationships between elements in a compact and
analytically suitable format that is useful to state the structure of interdependencies [28]. In
comparison to DSM method, modelling with multiple domains have a useful advantage because
a dependency between elements in any domain may be inferred as long as these elements have
a dependency with a common element in another domain [49].
In the paper of De Lessio et al. [74], the authors combined MDM method with a survey tool to
explore a company’s planning system. Their approach helped with the identification of
opportunities for planning system improvement. The approach could also help to avoid
problems with overlooking key issues and dependencies between elements.
Figure 0.3. Multiple Domain Matrix with two domains: Activities and designers
To meet market demands, designers often reach for novel and creative solutions for a product
which are already on the market. These modifications are usually called engineering design
changes. According to Siddharth and Sarkar [75], design changes have cascading effects on the
other components that share interfaces and interact using the material, energy and information
flow. The authors proposed a framework that could reduce the impact of engineering change
2. Theoretical background
25
on redesigning the product. The framework is, in essence, a multiple-domain matrix where the
knowledge of relationships among the product and manufacturing parameters are stored. The
authors applied an indirect change propagation method to identify the list of parameters that get
affected by a design change.
Matrix methods are used in the project management field, although they should get even more
consideration, according to Vallath Ramachandran [76]. The authors studied dozens of journal
papers while focusing on interdependencies between the product itself, development process,
organizational structure, tools, technologies and project goals. The authors concluded that
matrix methods had been used as a tool to enable critical path calculation in project
management. Also, methods provide better visualization of interdependencies within the
individual domains as well as across multiple domains.
2.6.3. Matrix-based methods limitations
Matrix-based methods are characterised as mainly static. Although numerous methods of
processing matrix data exist (e.g. clustering, partitioning, alignment), data itself remain the
same (but could change a position in the matrix), or in other words, data is not updated
continuously during the design process.
For most use cases, this characteristic does not present any obstacle. For example, if a team
leader wants to know in which sequence project activities will be executed, a simple static
matrix will provide satisfactory result during the whole development process. Contrary to static
cases, in many product development activities, an evident need to trace and manage several
aspects of design process dynamics exists.
Product development projects with a wider scope and higher complexity are usually divided
into subsystems (or hierarchy of tasks) and require collocated or distributed teamwork. In such
projects, particular tasks are allocated to different team members. This way of product
decomposition and task allocation unavoidably entails solutions with a set of design parameters
that are coupled among two or even more designers. That means that either those team members
have to establish a hierarchy of responsibility or sequence for the determination of parameter
values during design iterations or, more frequent, that they have to intensively and timely
communicate and negotiate about the coupled values among them. Besides coordination issues,
Karniel and Reich [1] stress that timed (as soon as the change occurs) informing of all other
team members with new values of the parameter and, if possible, reasoning behind the change

2. Theoretical background
26
is essential. In the work of Juranić et al. [68], the authors presented a framework for modelling
the patterns of engineering design collaboration activities based on Coloured Petri Nets. The
presented approach upgrades the static representation of design parameter relations with the
management of design iterations’ dynamics in which the values of multi-dependent parameters
are frequently changed by different design team members.
Toepfer and Naumann [12] discuss the static behaviour of MDM and DSM as one of the major
obstacles for usage in everyday practice. Their development of a design parameter management
system is an example of an effort to fully manage design parameter iterations. Such an approach
shows that the initial recording of design parameter relationships should be upgraded by using
the methods and tools to manage the iterative determination and especially the timely design
team coordination on values of coupled parameters.
Based on the initial representation of the designer-component relationships, Sosa (2008)
developed a model that predicts the interactions of the designers around the interfaces of the
individual product components. His work is oriented to software development, so it does not
focus on parameters but seeks to help project managers to encourage timely communication of
team members. In a very similar way, the approach proposed as a validation case in this PhD
thesis extracts design parameters coupled between multiple designers, which automatically
implies the need for their communication. The presented methodology aims to partially
automate the communication and negotiation process within the design team in the iterative
coordination of the coupled parameters values.
Several authors studied the relation between MDM and processes and how to model the process
to be suitable for analysis by matrix-based methods [16]. Their conclusion is that future research
should be oriented to how to make intuitive interaction between such models and how to extend
MDM, which is oriented to the analysis of the structure to a methodology that encompasses all
aspects of managing a complex process structure.
An interesting approach is proposed by Kreimeyer et al. [77] to combine the analytical
advantage of matrix-based methods with modelling capabilities of graphical notation to model
process flows. For graphical notations, Event-driven Process Chains were used, and MDM as
a matrix-based method. Similar to this approach, Juranić et al. [78] presented a contribution to
CSCD technologies combining MDM with graphical and programming features of CPN.
2. Theoretical background
27
2.7. Research gaps
The literature review on engineering design processes and design parameter management in the
context of product development has facilitated the identification and formulation of the main
research gaps.
The gaps particularly concern the lack of sufficient support for timely information transfer
between stakeholders, delayed communication about engineering objects and, according to
reviewed literature, issues that could emerge from static behaviour of matrix-based methods.
Additional focus was given to the PN method and its extensions as a possible method to bridge
research gaps and mentioned concerns. All literature review and the following research
questions are oriented to contribute to the improvement of design parameters management.
The research gaps are briefly discussed in this section and summarised in the form of research
questions. Research questions are discussed and answered in the conclusion chapter, but they
are also preliminary addressed in subsequent sections of the thesis. Next to each research
question, the chapter where it is preliminarily addressed is indicated.
Several authors emphasized the importance of critical situations in product development and
how they are managed throughout the process. Besides critical situations, researchers argue
about routine tasks that are straightforward, and in many cases, designers are accomplishing
them with ease, especially in the development of a product where the structure is completely
known, for example, in the development of product variants. Critical situations often arise if
coupled parameters are not timely updated among design engineers. Between parameters exist
relations which can be represented as design parameter network. It is also usual that engineers
work on coupled parameters, but they are not aware of their relation. This research will give an
overview of all these situations, both critical and routine. One of the research contributions is
to manage these situations in a semi-automatic way, especially routine tasks. Hence, the first
research question is formulated as follows:
RQ1 What are the most frequent activities and critical situations that may arise due
to relations between design parameters during the product development
process?
2. Theoretical background
28
Literature review and analysis of the experimental dataset showed that information about
engineering design activities that exist in written form provides an adequate source for this
research. Some key decisions might be found in emails but also in meeting reports which are
shared among all stakeholders. Managers are using this information to create new activities
which have to be accomplished. Analysis of frequent activities which appear during product
development could be categorized further depending on the type of activity. A similar approach
was proposed by Sim and Duffy [3], where they identified and classified a generic set of design
activities. This set of activities will serve as a basis for the activity groups in this research. The
question that arises in this context is:
RQ2 What are favourable approaches and directions to improve CSCW for
engineering design activities that are identified in the analysed dataset?
This research extends existing research on methods and tools for supporting team
communication in the dynamic and iterative process of defining and resolving values for a set
of coupled design parameters. In the previous section, an overview of coupled parameters and
how they could be resolved using DSM and MDM techniques was given. The conducted
literature review showed that parameters are generally resolved only on the static level and by
no means on the dynamic level. This research will provide an approach to combine such
methods with CPN in order to support the management of parameters in a more dynamic
manner. An additional concern that will be investigated is about advantages and obstacles
which could arise in the approach where MDM is combined with CPN. Consequently, the main
question here is:
RQ3 How to apply MDM to identify parameters coupled between several designers
in teamwork based design, because in such situations, it is expected that the
application of developed models could bring the most benefits?
This research is aiming to help engineers in several aspects of information management during
the design process. Hence, permanent attention in this research should be paid to ensure that all
team members always have all the necessary up-to-date information in every situation and
especially critical ones. The aim is to avoid misunderstandings, delays and additional
2. Theoretical background
29
unnecessary iterations, which often happens during teamwork because of untimely or missing
communication. Many papers present examples of these problems in industry practice [79], [9],
[15]. Such problems are often the result of insufficient or inadequate implementation of
complexity management methods. Hence, this research explores an approach of using
generalised activity patterns to build improved and more robust design support systems. The
research question which addresses this issue is formulated as:
RQ4 What are the benefits of applying the proposed CPN based framework for
supporting engineering design activities?
30
3. ANALYSIS OF DESIGN PROCESS
ACTIVITIES IN PARTNER COMPANY
This chapter provides a supplementary matter which could not be found in the literature. Even
though the first part of the descriptive study provided some valuable conclusions about state of
the art in the observed research field and that the literature review yielded the research gaps
and research questions, the contribution this research provides is hidden in data collected in
an industrial working environment.
3.1. Obtaining data for the analysis
Data obtaining and the analyses were performed during an internship that took place in the IT
research department of the partner company. A team in which the research was conducted is
responsible for supporting engineers in their daily work by creating new methods and
continuously enhancing the existing ones.
The company is using an in-house developed PDM system which is constantly being improved.
The researchers in the company are developing a system called parameter database [13] which
would enable management of engineering design parameters (EDPs), including their definition,
linkage to CAD data, traceability of values changes and connecting them into a network of
parameters. Parameters in the network are related via active chains [12], which provide an
overview of dependencies for each parameter. Toepfer and Naumann [80] argue that
complexity in product development can be handled with the help of such a system (parameter
database) in a way that it provides a process-supporting benefit for designers instead of causing
additional work.
Although parameter management supports engineering designers mainly in their product
development activities, EDPs are an indispensable element of all other activities during product
development (e.g. communication, reports).
To find out what are the parameters that are most often discussed (and within which activities)
during weekly design meetings meeting reports from three projects (see Section 3.2) have been
obtained from the company and analysed.
3. Analysis of design process activities in partner company
31
In the first analysis of meeting reports, EDPs were coded and afterwards classified (Section
3.3.1). During the second analysis, design activities have been extracted from meeting reports
(Section 3.3.2) to get a list of design activities that can be generalised. These generalised
activities have been further used for coding activities in meeting reports. Finally, the activities
have been categorised into engineering design activities taxonomy (Section 3.3.4). The
proposed taxonomy is not definite since it contains only the activities that have been extracted
from meeting reports.
When planning the engineering design activities analysis, it was initially decided to gather data
from different sources and to determine later what source provides data that best fits the purpose
of the research. Therefore, several approaches were pursued:
• Direct communication with design engineers (e.g. interviews)
• Going through the records of informal communication (e.g. emails)
• Analysing the formal communication records (e.g. meeting minutes)
Using the first approach, the most detailed information was obtained. Although this approach
provides detailed information, it was abandoned very quickly since each engineer needs to
prepare for the interview and to spend time during the interview. That was not acceptable for
the company. The second approach was abandoned before it actually started due to company
regulations. The company does not allow collecting communication records among designers,
which are done via email, even for research purposes. Therefore, it has been decided to continue
only with the third approach; meeting reports which are written based on meeting minutes from
formal weekly design team meetings. In the company, that type of communication is the main
formal communication channel among designers and project managers. Later in this chapter is
described what data were obtained, how it was analysed and what results were achieved.
Parallel to the data analysis, it has been decided to develop the approach based on Petri Nets. It
was necessary to explore if PN methodology is applicable for such a task. Based on the
conducted research, it was decided to proceed with the Coloured Petri Net extension since it
has features that match well with the whole approach. During the third internship, the main
focus was on developing a software solution that will connect CPN models to the testing version
of the parameter database, ERP database and CAD system. The solution is fully described in
Chapter 4 of this thesis.
3. Analysis of design process activities in partner company
32
3.2. Experimental dataset
To get a better understanding of current practices in the industry and to identify the most
significant problems and critical situations in the previously discussed context, a
comprehensive analysis of the three already completed and documented, long-term, large
development projects in the partner company were conducted. This section presents the
structure of the analysed data sets, the methodology applied for data analysis, and the obtained
results.
Unfortunately, the obtained data originates only from one source (meeting reports) and this type
of more general data about a specific task or issue with fewer details than what could be
obtained from emails. On the other hand, meeting reports are way better structured than regular
emails and therefore much easier to analyse. Meeting reports do not contain irrelevant
information that employees usually exchange in their everyday communication over email,
calls or via some other channel.
The meeting reports used in this research are from the projects conducted in the conceptual
phase. In such meetings, only configurations, key dimensions and decisions about the project
are discussed. The meetings are usually held on a weekly basis, with some exceptions during
holidays or vacations. Participants who attend weekly meetings are employees leading the
project, representatives of each team involved in the project, and depending on topics discussed,
employees that are experts for such topics. The whole process is the same as any other regular
meeting and consists of several main parts: Preparing an agenda, conducting a meeting, and
writing a meeting report.
The agenda is prepared continuously, starting from the last meeting held until the beginning of
the next meeting for which the agenda is prepared. Before the meeting starts, the agenda has to
be sent to all participants and others who are interested in the topics discussed at the meeting.
The agenda is formatted as a textual document (Figure 0.4) with defined general information
about the planned meeting and a list of topics that will be discussed during the meeting. The
agenda document consists of general information about the specific meeting (e.g. date, location,
participants) and a list of topics to be discussed.
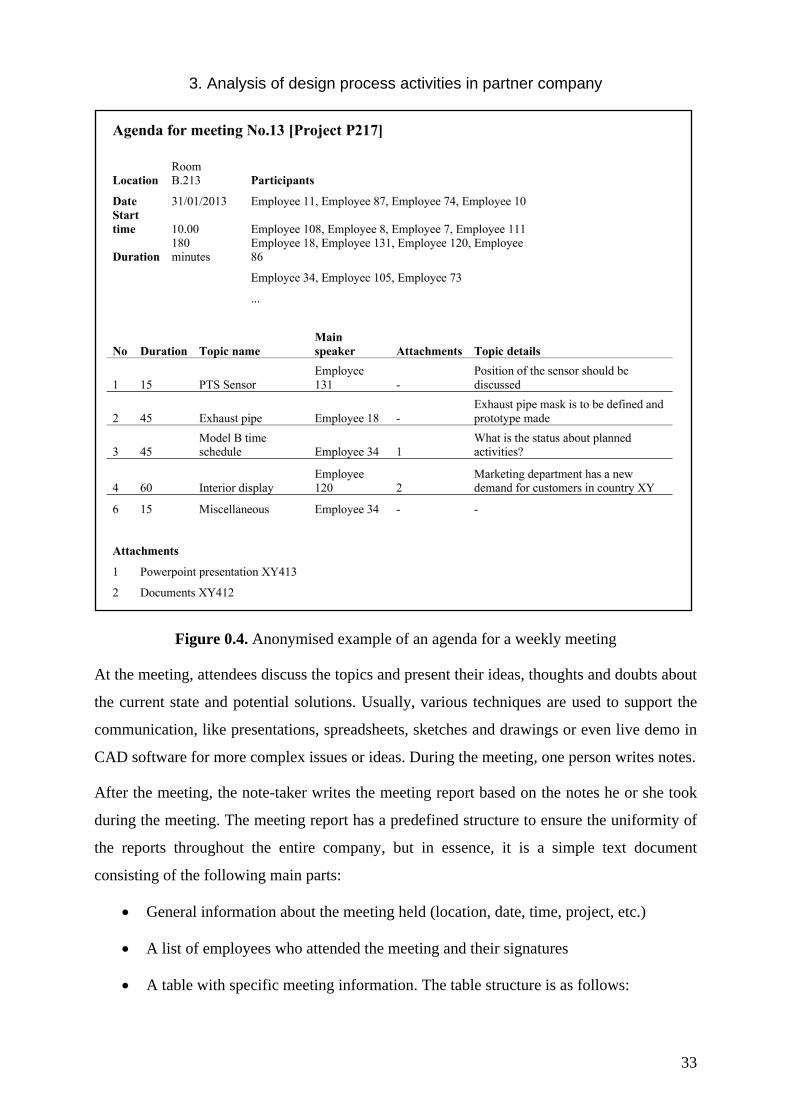
3. Analysis of design process activities in partner company
33
Figure 0.4. Anonymised example of an agenda for a weekly meeting
At the meeting, attendees discuss the topics and present their ideas, thoughts and doubts about
the current state and potential solutions. Usually, various techniques are used to support the
communication, like presentations, spreadsheets, sketches and drawings or even live demo in
CAD software for more complex issues or ideas. During the meeting, one person writes notes.
After the meeting, the note-taker writes the meeting report based on the notes he or she took
during the meeting. The meeting report has a predefined structure to ensure the uniformity of
the reports throughout the entire company, but in essence, it is a simple text document
consisting of the following main parts:
• General information about the meeting held (location, date, time, project, etc.)
• A list of employees who attended the meeting and their signatures
• A table with specific meeting information. The table structure is as follows:
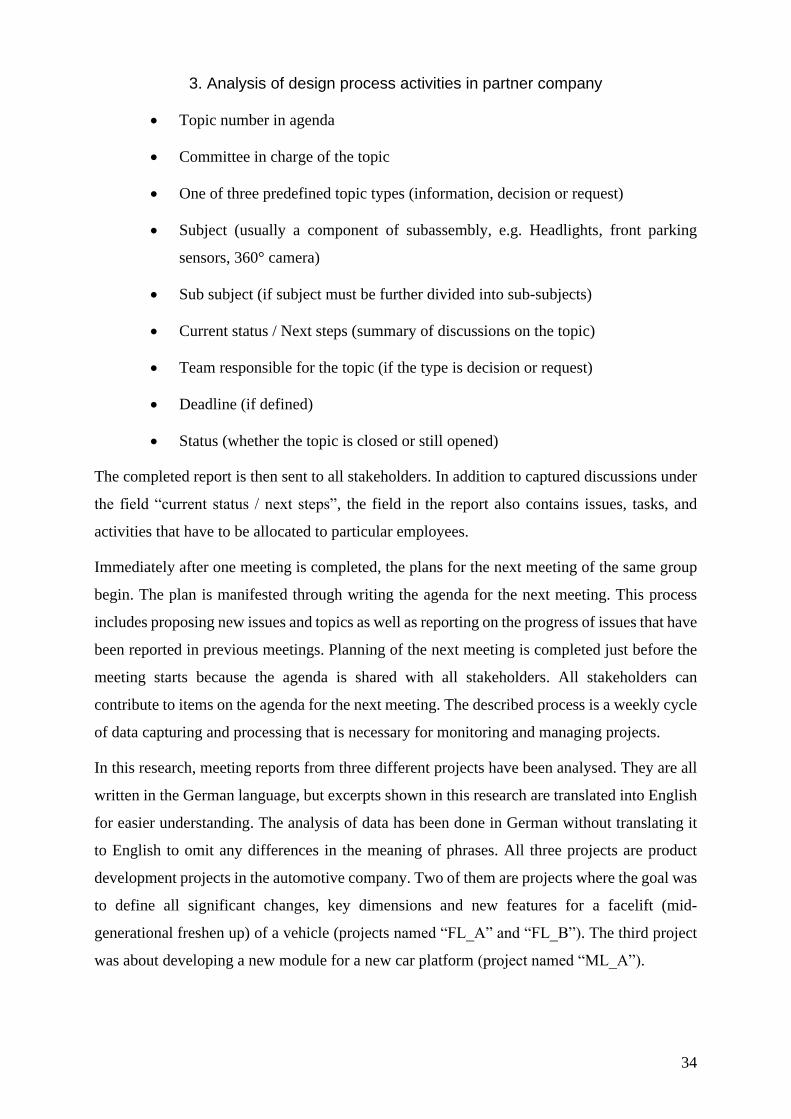
3. Analysis of design process activities in partner company
34
• Topic number in agenda
• Committee in charge of the topic
• One of three predefined topic types (information, decision or request)
• Subject (usually a component of subassembly, e.g. Headlights, front parking
sensors, 360° camera)
• Sub subject (if subject must be further divided into sub-subjects)
• Current status / Next steps (summary of discussions on the topic)
• Team responsible for the topic (if the type is decision or request)
• Deadline (if defined)
• Status (whether the topic is closed or still opened)
The completed report is then sent to all stakeholders. In addition to captured discussions under
the field “current status / next steps”, the field in the report also contains issues, tasks, and
activities that have to be allocated to particular employees.
Immediately after one meeting is completed, the plans for the next meeting of the same group
begin. The plan is manifested through writing the agenda for the next meeting. This process
includes proposing new issues and topics as well as reporting on the progress of issues that have
been reported in previous meetings. Planning of the next meeting is completed just before the
meeting starts because the agenda is shared with all stakeholders. All stakeholders can
contribute to items on the agenda for the next meeting. The described process is a weekly cycle
of data capturing and processing that is necessary for monitoring and managing projects.
In this research, meeting reports from three different projects have been analysed. They are all
written in the German language, but excerpts shown in this research are translated into English
for easier understanding. The analysis of data has been done in German without translating it
to English to omit any differences in the meaning of phrases. All three projects are product
development projects in the automotive company. Two of them are projects where the goal was
to define all significant changes, key dimensions and new features for a facelift (mid-
generational freshen up) of a vehicle (projects named “FL_A” and “FL_B”). The third project
was about developing a new module for a new car platform (project named “ML_A”).
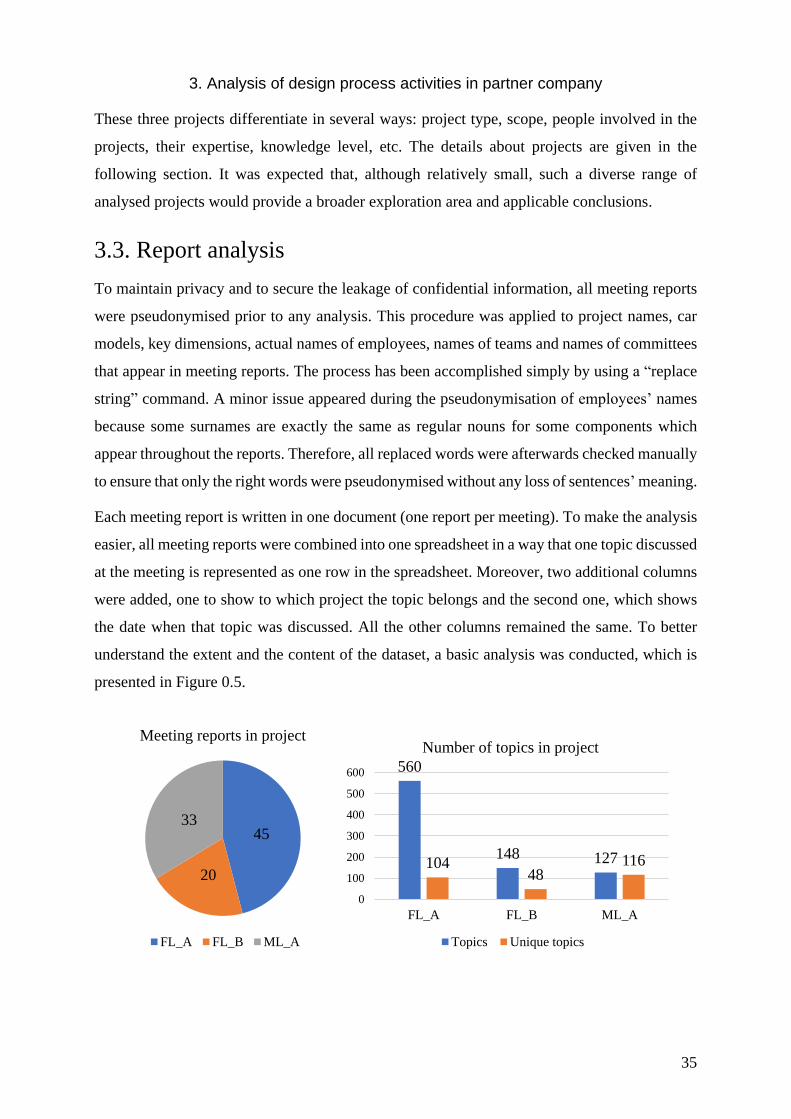
3. Analysis of design process activities in partner company
35
These three projects differentiate in several ways: project type, scope, people involved in the
projects, their expertise, knowledge level, etc. The details about projects are given in the
following section. It was expected that, although relatively small, such a diverse range of
analysed projects would provide a broader exploration area and applicable conclusions.
3.3. Report analysis
To maintain privacy and to secure the leakage of confidential information, all meeting reports
were pseudonymised prior to any analysis. This procedure was applied to project names, car
models, key dimensions, actual names of employees, names of teams and names of committees
that appear in meeting reports. The process has been accomplished simply by using a “replace
string” command. A minor issue appeared during the pseudonymisation of employees’ names
because some surnames are exactly the same as regular nouns for some components which
appear throughout the reports. Therefore, all replaced words were afterwards checked manually
to ensure that only the right words were pseudonymised without any loss of sentences’ meaning.
Each meeting report is written in one document (one report per meeting). To make the analysis
easier, all meeting reports were combined into one spreadsheet in a way that one topic discussed
at the meeting is represented as one row in the spreadsheet. Moreover, two additional columns
were added, one to show to which project the topic belongs and the second one, which shows
the date when that topic was discussed. All the other columns remained the same. To better
understand the extent and the content of the dataset, a basic analysis was conducted, which is
presented in Figure 0.5.
45
20
33
Meeting reports in project
FL_A FL_B ML_A
560
148 12710448
116
0
100
200
300
400
500
600
FL_A FL_B ML_A
Number of topics in project
Topics Unique topics

3. Analysis of design process activities in partner company
36
Figure 0.5. General information of meeting reports from three projects: Facelift projects
(FL_A and FL_B) and module development project (ML_A)
All three projects were long-lasting, which means that they lasted from 7 to 17 months, with
numerous experts and teams included. In total, 98 meeting reports with 835 discussed topics
among 329 participants have been analysed. It has to be noticed that the number of words per
topic varies substantially, which of course, depends on the person who has written the notes.
This factor undoubtedly has a partial impact on the results of this research. The same data
structuring in every report ensures that the dataset is uniform and that common mechanisms for
the analysis of the whole data set are applicable. To continue with the more complex processing
methods, data from the spreadsheet has been transferred to an SQL database with the same
structure as the spreadsheet. The database has been normalised to enable the building of
complex queries.
162582005
9475
Total number of words in
project reports
FL_A FL_B ML_A
26
1170
Words per topic (median value)
FL_A FL_B ML_A
74
43
35
Number of teams involved
FL_A FL_B ML_A
156
80
93
Number of participants
FL_A FL_B ML_A
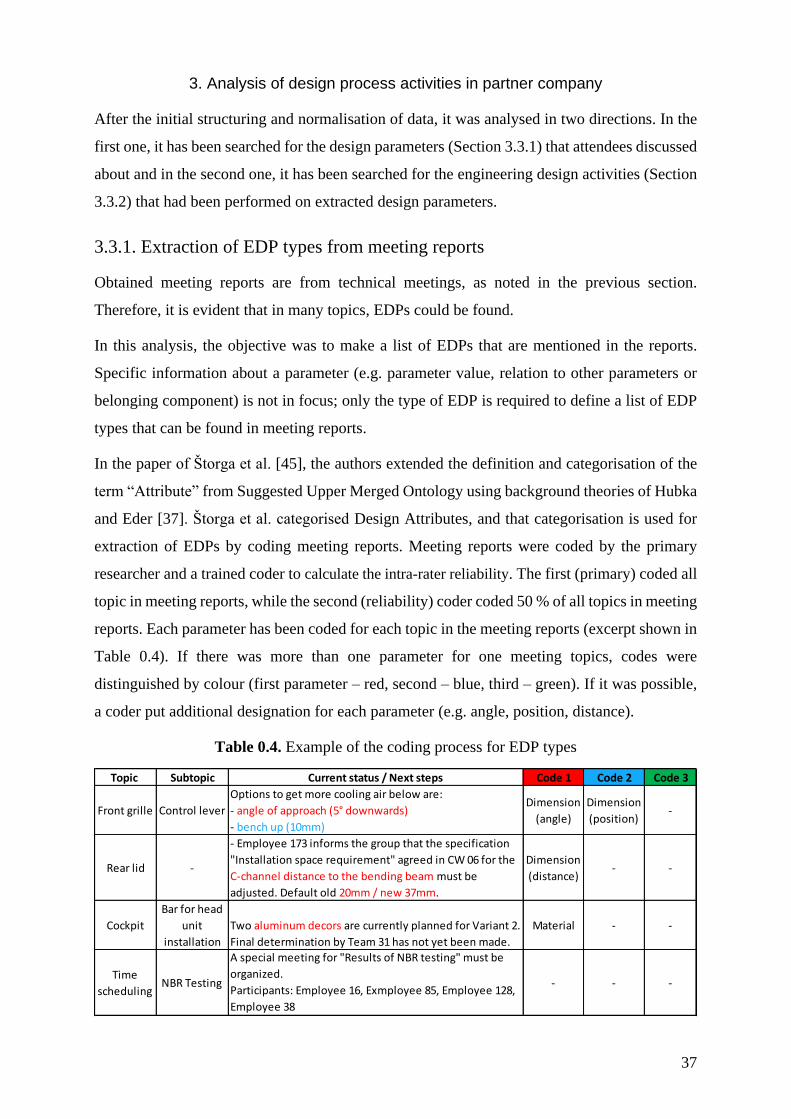
3. Analysis of design process activities in partner company
37
After the initial structuring and normalisation of data, it was analysed in two directions. In the
first one, it has been searched for the design parameters (Section 3.3.1) that attendees discussed
about and in the second one, it has been searched for the engineering design activities (Section
3.3.2) that had been performed on extracted design parameters.
3.3.1. Extraction of EDP types from meeting reports
Obtained meeting reports are from technical meetings, as noted in the previous section.
Therefore, it is evident that in many topics, EDPs could be found.
In this analysis, the objective was to make a list of EDPs that are mentioned in the reports.
Specific information about a parameter (e.g. parameter value, relation to other parameters or
belonging component) is not in focus; only the type of EDP is required to define a list of EDP
types that can be found in meeting reports.
In the paper of Štorga et al. [45], the authors extended the definition and categorisation of the
term “Attribute” from Suggested Upper Merged Ontology using background theories of Hubka
and Eder [37]. Štorga et al. categorised Design Attributes, and that categorisation is used for
extraction of EDPs by coding meeting reports. Meeting reports were coded by the primary
researcher and a trained coder to calculate the intra-rater reliability. The first (primary) coded all
topic in meeting reports, while the second (reliability) coder coded 50 % of all topics in meeting
reports. Each parameter has been coded for each topic in the meeting reports (excerpt shown in
Table 0.4). If there was more than one parameter for one meeting topics, codes were
distinguished by colour (first parameter – red, second – blue, third – green). If it was possible,
a coder put additional designation for each parameter (e.g. angle, position, distance).
Table 0.4. Example of the coding process for EDP types
Topic Subtopic Current status / Next steps Code 1 Code 2 Code 3
Front grille Control lever
Options to get more cooling air below are:
- angle of approach (5° downwards)
- bench up (10mm)
Dimension
(angle)
Dimension
(position)-
Rear lid -
- Employee 173 informs the group that the specification
"Installation space requirement" agreed in CW 06 for the
C-channel distance to the bending beam must be
adjusted. Default old 20mm / new 37mm.
Dimension
(distance)- -
Cockpit
Bar for head
unit
installation
Two aluminum decors are currently planned for Variant 2.
Final determination by Team 31 has not yet been made.
Material - -
Time
schedulingNBR Testing
A special meeting for "Results of NBR testing" must be
organized.
Participants: Employee 16, Exmployee 85, Employee 128,
Employee 38
- - -

3. Analysis of design process activities in partner company
38
The list of parameters that have been coded along with the number of occurrences and Cohen’s
Kappa number is shown in Table 0.5.
Table 0.5. Design parameter types
EDP Type Example Quantity Coder
reliability
Position Position 289 0,99
Dimension Area 61 0,98
Dimension Distance 50 0,97
Dimension Clearance 41 0,98
Dimension Angle 28 0,99
Dimension Measure 26 0,96
Dimension Height 21 0,99
Tolerance Tolerance 20 0,98
Dimension Width 19 0,99
Dimension Displacement 18 0,97
Material Material 4 0,97
The results show that position (of components) is the most frequently mentioned EDP in the
reports. During the coding, it was noticed that a type of design parameters and topics discussed
during a meeting significantly differ based on the stage in which a project currently is. Since
these meetings were from the conceptual stage of product development, it might be expected
that participants often discuss the arrangements of new or modified components of a vehicle
and they do not go into the depth of technical issues. All the other types of design parameters
were mentioned in every 20th meeting topic (on average). The situation probably would be very
different if project review meetings of the later development phase were analysed.
Figure 0.6 shows how many topics were discussed at each project meeting for all three projects.
In the graphs, “W1” means the first week since the project had started. If some week is omitted
in the figure, it means that data for that week was not available, and in most cases, it assumes
that the meeting had not been held in that week. The second and third projects have a relatively
small number of average topics per meeting. Hence, it is hard to argue about the trends that are
happening during those projects. Interesting insights can be seen in the number of topics over
time for project FL_A.
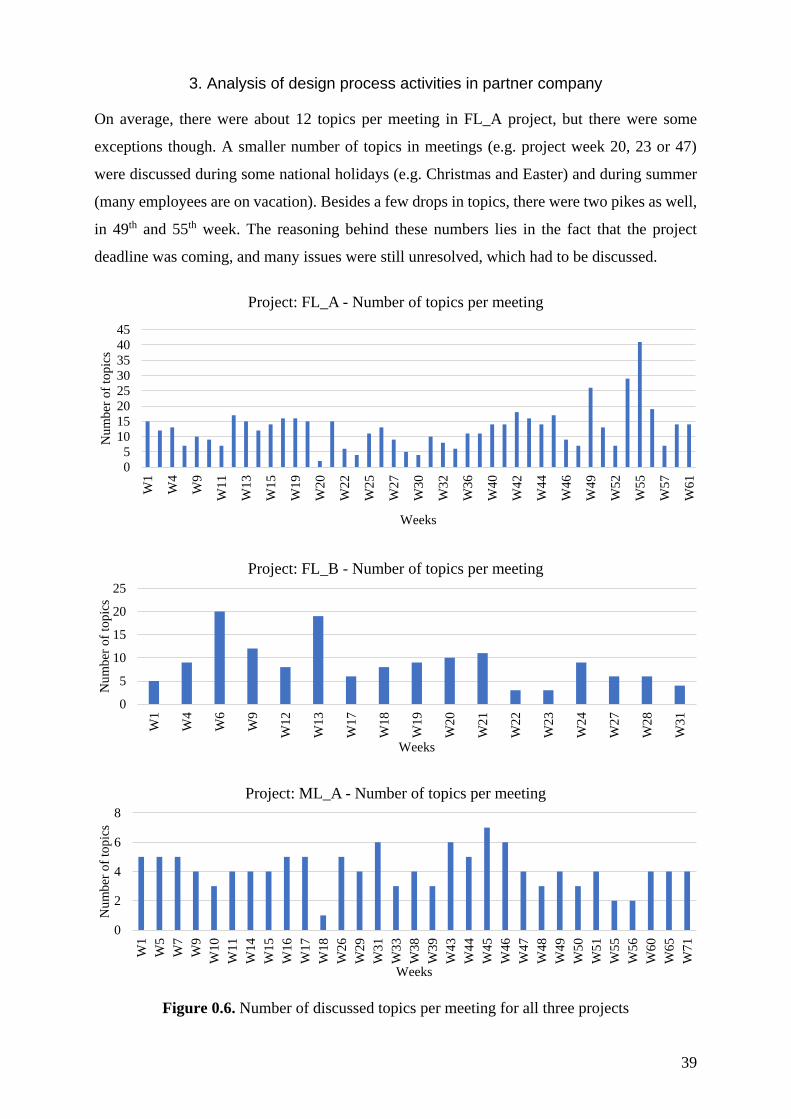
3. Analysis of design process activities in partner company
39
On average, there were about 12 topics per meeting in FL_A project, but there were some
exceptions though. A smaller number of topics in meetings (e.g. project week 20, 23 or 47)
were discussed during some national holidays (e.g. Christmas and Easter) and during summer
(many employees are on vacation). Besides a few drops in topics, there were two pikes as well,
in 49th and 55th week. The reasoning behind these numbers lies in the fact that the project
deadline was coming, and many issues were still unresolved, which had to be discussed.
Figure 0.6. Number of discussed topics per meeting for all three projects
0
5
10
15
20
25
30
35
40
45
W1
W4
W9
W1
1
W13
W1
5
W1
9
W2
0
W2
2
W25
W2
7
W3
0
W3
2
W3
6
W40
W4
2
W4
4
W4
6
W4
9
W52
W5
5
W5
7
W6
1
Nu
mb
er o
f to
pic
s
Weeks
Project: FL_A - Number of topics per meeting
0
5
10
15
20
25
W1
W4
W6
W9
W1
2
W1
3
W1
7
W1
8
W19
W2
0
W2
1
W2
2
W2
3
W2
4
W2
7
W2
8
W3
1
Nu
mb
er o
f to
pic
s
Weeks
Project: FL_B - Number of topics per meeting
0
2
4
6
8
W1
W5
W7
W9
W1
0
W11
W14
W15
W16
W17
W18
W26
W29
W31
W33
W3
8
W39
W43
W44
W45
W46
W47
W48
W49
W50
W51
W55
W56
W60
W65
W71
Nu
mber
of
top
ics
Weeks
Project: ML_A - Number of topics per meeting

3. Analysis of design process activities in partner company
40
3.3.2. Extraction of phrases that denote activities
After creating the list of EDPs from meeting reports (Table 0.5), the analysis continued with
the extraction of phrases related to the common engineering design activities (EDA) in which
EDPs are present. This was the initial step for the creation of a list of generalised design
activities, which is a requirement for the proposal of a tailored engineering design activities
taxonomy described in the last subsection of this chapter. For the easier following of the next
several subsections, the complete process is shown in Figure 0.7.
Figure 0.7. Process of creating a list of generalised design activities and engineering design
activities taxonomy
Reports that were used for coding in the first step are used in this analysis as well. Since the
summary of the topic’s discussion is written in the conversational language, one activity might
be denoted by several similar phrases. Additionally, it was unknown which particular activities
appear in the reports. Hence, it was decided to proceed with the extraction of phrases that
denotes those activities. Table 0.6 shows the extraction process on the small excerpt taken from
the analysed spreadsheet. The activity phrases were highlighted by changing the font colour for
each phrase that denotes activity. Each activity type is coloured in a different colour, while the
similar phrases that denote the same activity type have the same font colour.
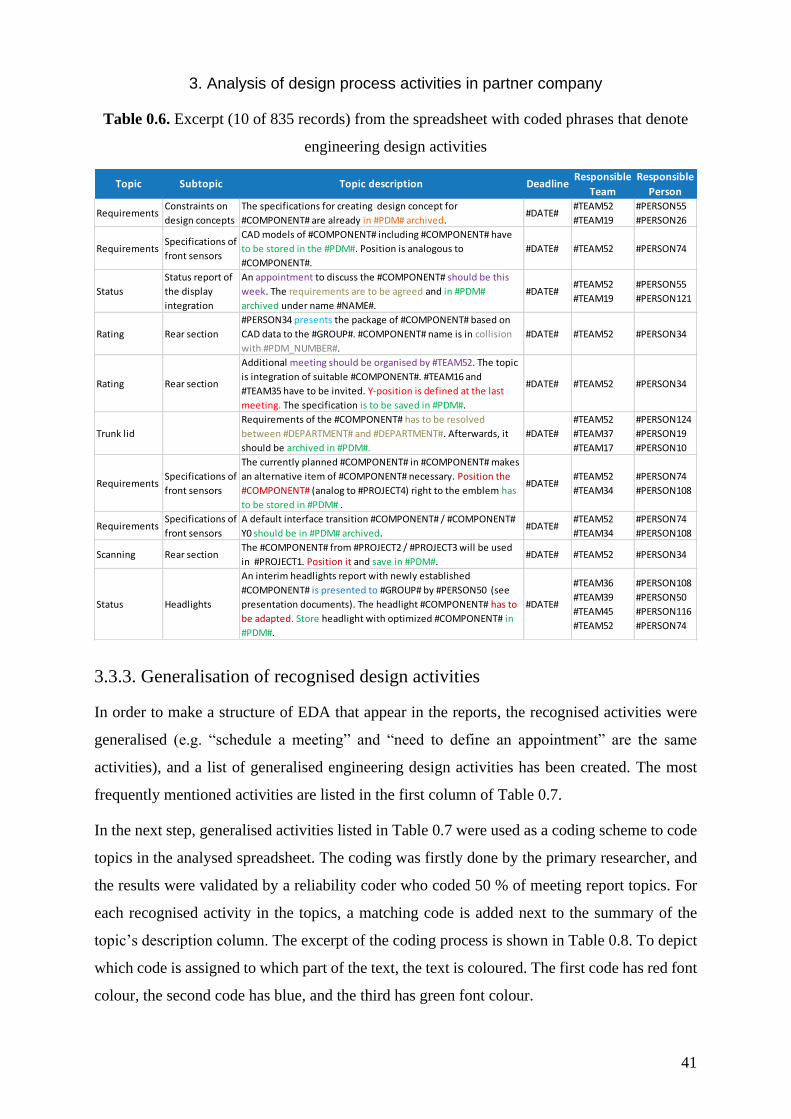
3. Analysis of design process activities in partner company
41
Table 0.6. Excerpt (10 of 835 records) from the spreadsheet with coded phrases that denote
engineering design activities
3.3.3. Generalisation of recognised design activities
In order to make a structure of EDA that appear in the reports, the recognised activities were
generalised (e.g. “schedule a meeting” and “need to define an appointment” are the same
activities), and a list of generalised engineering design activities has been created. The most
frequently mentioned activities are listed in the first column of Table 0.7.
In the next step, generalised activities listed in Table 0.7 were used as a coding scheme to code
topics in the analysed spreadsheet. The coding was firstly done by the primary researcher, and
the results were validated by a reliability coder who coded 50 % of meeting report topics. For
each recognised activity in the topics, a matching code is added next to the summary of the
topic’s description column. The excerpt of the coding process is shown in Table 0.8. To depict
which code is assigned to which part of the text, the text is coloured. The first code has red font
colour, the second code has blue, and the third has green font colour.
Topic Subtopic Topic description DeadlineResponsible
Team
Responsible
Person
RequirementsConstraints on
design concepts
The specifications for creating design concept for
#COMPONENT# are already in #PDM# archived.#DATE#
#TEAM52
#TEAM19
#PERSON55
#PERSON26
RequirementsSpecifications of
front sensors
CAD models of #COMPONENT# including #COMPONENT# have
to be stored in the #PDM#. Position is analogous to
#COMPONENT#.
#DATE# #TEAM52 #PERSON74
Status
Status report of
the display
integration
An appointment to discuss the #COMPONENT# should be this
week. The requirements are to be agreed and in #PDM#
archived under name #NAME#.
#DATE##TEAM52
#TEAM19
#PERSON55
#PERSON121
Rating Rear section
#PERSON34 presents the package of #COMPONENT# based on
CAD data to the #GROUP#. #COMPONENT# name is in collision
with #PDM_NUMBER#.
#DATE# #TEAM52 #PERSON34
Rating Rear section
Additional meeting should be organised by #TEAM52. The topic
is integration of suitable #COMPONENT#. #TEAM16 and
#TEAM35 have to be invited. Y-position is defined at the last
meeting. The specification is to be saved in #PDM#.
#DATE# #TEAM52 #PERSON34
Trunk lid
Requirements of the #COMPONENT# has to be resolved
between #DEPARTMENT# and #DEPARTMENT#. Afterwards, it
should be archived in #PDM#.
#DATE#
#TEAM52
#TEAM37
#TEAM17
#PERSON124
#PERSON19
#PERSON10
RequirementsSpecifications of
front sensors
The currently planned #COMPONENT# in #COMPONENT# makes
an alternative item of #COMPONENT# necessary. Position the
#COMPONENT# (analog to #PROJECT4) right to the emblem has
to be stored in #PDM# .
#DATE##TEAM52
#TEAM34
#PERSON74
#PERSON108
RequirementsSpecifications of
front sensors
A default interface transition #COMPONENT# / #COMPONENT#
Y0 should be in #PDM# archived.#DATE#
#TEAM52
#TEAM34
#PERSON74
#PERSON108
Scanning Rear sectionThe #COMPONENT# from #PROJECT2 / #PROJECT3 will be used
in #PROJECT1. Position it and save in #PDM#.#DATE# #TEAM52 #PERSON34
Status Headlights
An interim headlights report with newly established
#COMPONENT# is presented to #GROUP# by #PERSON50 (see
presentation documents). The headlight #COMPONENT# has to
be adapted. Store headlight with optimized #COMPONENT# in
#PDM#.
#DATE#
#TEAM36
#TEAM39
#TEAM45
#TEAM52
#PERSON108
#PERSON50
#PERSON116
#PERSON74
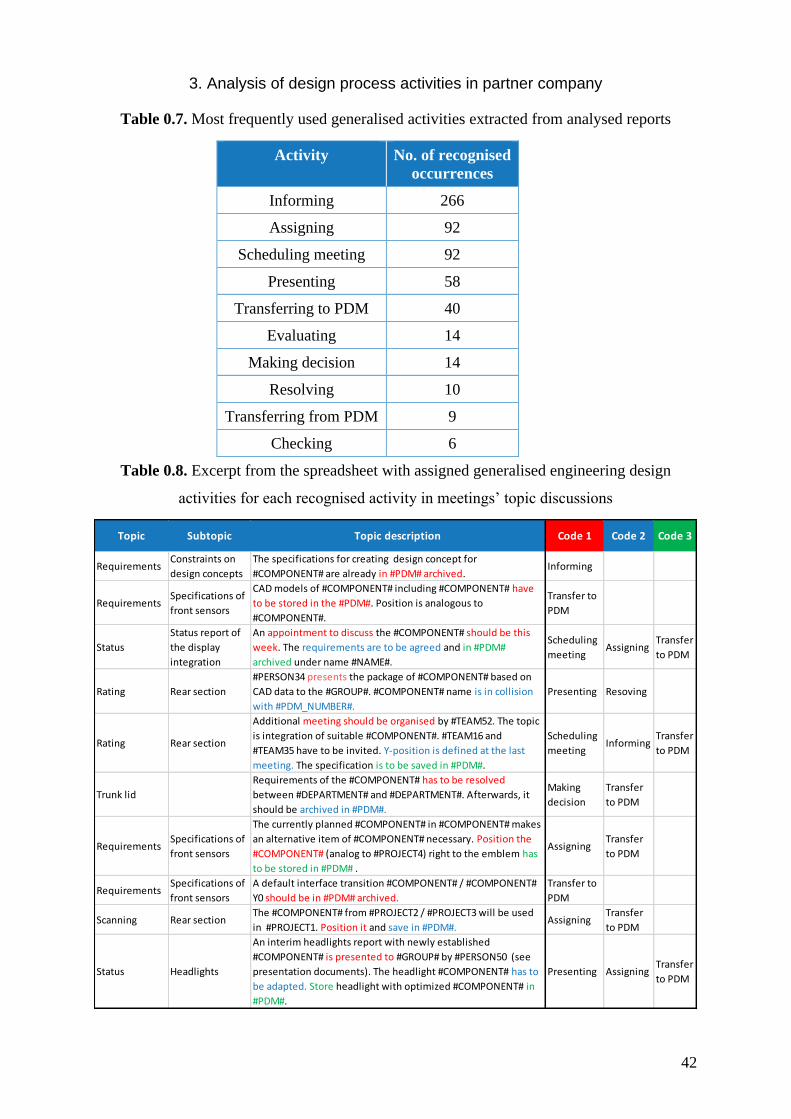
3. Analysis of design process activities in partner company
42
Table 0.7. Most frequently used generalised activities extracted from analysed reports
Activity No. of recognised
occurrences
Informing 266
Assigning 92
Scheduling meeting 92
Presenting 58
Transferring to PDM 40
Evaluating 14
Making decision 14
Resolving 10
Transferring from PDM 9
Checking 6
Table 0.8. Excerpt from the spreadsheet with assigned generalised engineering design
activities for each recognised activity in meetings’ topic discussions
Topic Subtopic Topic description Code 1 Code 2 Code 3
RequirementsConstraints on
design concepts
The specifications for creating design concept for
#COMPONENT# are already in #PDM# archived.Informing
RequirementsSpecifications of
front sensors
CAD models of #COMPONENT# including #COMPONENT# have
to be stored in the #PDM#. Position is analogous to
#COMPONENT#.
Transfer to
PDM
Status
Status report of
the display
integration
An appointment to discuss the #COMPONENT# should be this
week. The requirements are to be agreed and in #PDM#
archived under name #NAME#.
Scheduling
meetingAssigning
Transfer
to PDM
Rating Rear section
#PERSON34 presents the package of #COMPONENT# based on
CAD data to the #GROUP#. #COMPONENT# name is in collision
with #PDM_NUMBER#.
Presenting Resoving
Rating Rear section
Additional meeting should be organised by #TEAM52. The topic
is integration of suitable #COMPONENT#. #TEAM16 and
#TEAM35 have to be invited. Y-position is defined at the last
meeting. The specification is to be saved in #PDM#.
Scheduling
meetingInforming
Transfer
to PDM
Trunk lid
Requirements of the #COMPONENT# has to be resolved
between #DEPARTMENT# and #DEPARTMENT#. Afterwards, it
should be archived in #PDM#.
Making
decision
Transfer
to PDM
RequirementsSpecifications of
front sensors
The currently planned #COMPONENT# in #COMPONENT# makes
an alternative item of #COMPONENT# necessary. Position the
#COMPONENT# (analog to #PROJECT4) right to the emblem has
to be stored in #PDM# .
AssigningTransfer
to PDM
RequirementsSpecifications of
front sensors
A default interface transition #COMPONENT# / #COMPONENT#
Y0 should be in #PDM# archived.
Transfer to
PDM
Scanning Rear sectionThe #COMPONENT# from #PROJECT2 / #PROJECT3 will be used
in #PROJECT1. Position it and save in #PDM#.Assigning
Transfer
to PDM
Status Headlights
An interim headlights report with newly established
#COMPONENT# is presented to #GROUP# by #PERSON50 (see
presentation documents). The headlight #COMPONENT# has to
be adapted. Store headlight with optimized #COMPONENT# in
#PDM#.
Presenting AssigningTransfer
to PDM
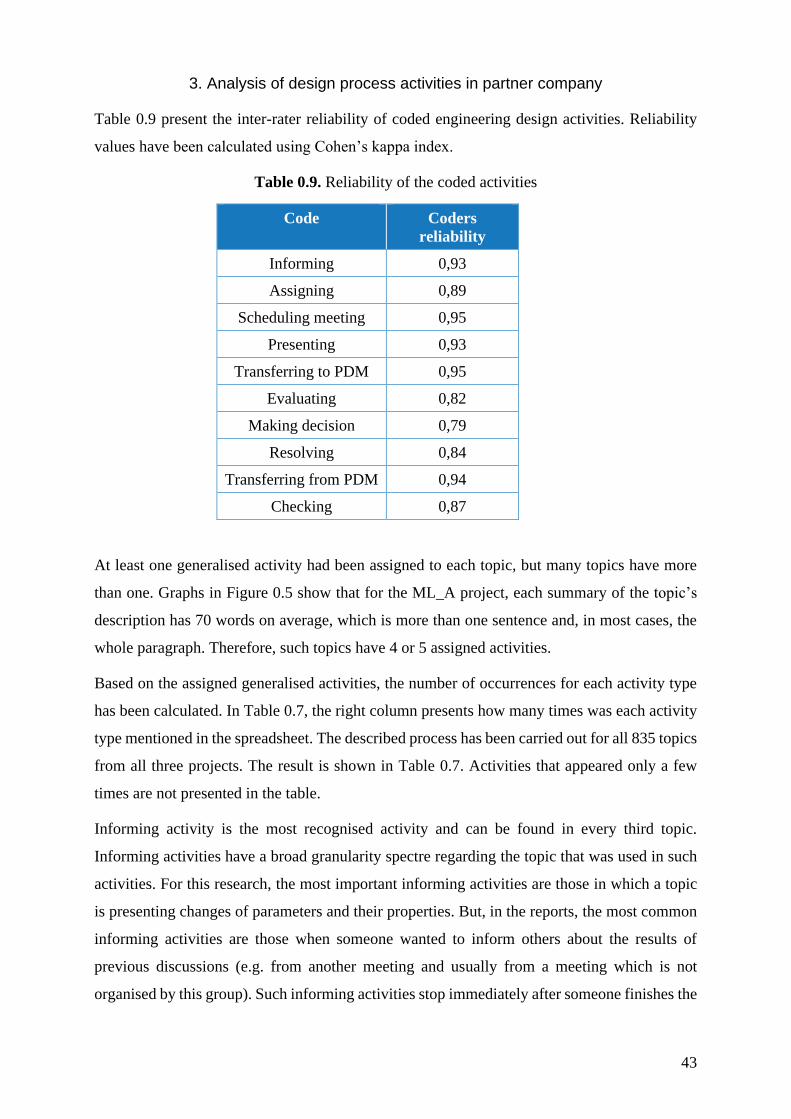
3. Analysis of design process activities in partner company
43
Table 0.9 present the inter-rater reliability of coded engineering design activities. Reliability
values have been calculated using Cohen’s kappa index.
Table 0.9. Reliability of the coded activities
Code Coders
reliability
Informing 0,93
Assigning 0,89
Scheduling meeting 0,95
Presenting 0,93
Transferring to PDM 0,95
Evaluating 0,82
Making decision 0,79
Resolving 0,84
Transferring from PDM 0,94
Checking 0,87
At least one generalised activity had been assigned to each topic, but many topics have more
than one. Graphs in Figure 0.5 show that for the ML_A project, each summary of the topic’s
description has 70 words on average, which is more than one sentence and, in most cases, the
whole paragraph. Therefore, such topics have 4 or 5 assigned activities.
Based on the assigned generalised activities, the number of occurrences for each activity type
has been calculated. In Table 0.7, the right column presents how many times was each activity
type mentioned in the spreadsheet. The described process has been carried out for all 835 topics
from all three projects. The result is shown in Table 0.7. Activities that appeared only a few
times are not presented in the table.
Informing activity is the most recognised activity and can be found in every third topic.
Informing activities have a broad granularity spectre regarding the topic that was used in such
activities. For this research, the most important informing activities are those in which a topic
is presenting changes of parameters and their properties. But, in the reports, the most common
informing activities are those when someone wanted to inform others about the results of
previous discussions (e.g. from another meeting and usually from a meeting which is not
organised by this group). Such informing activities stop immediately after someone finishes the
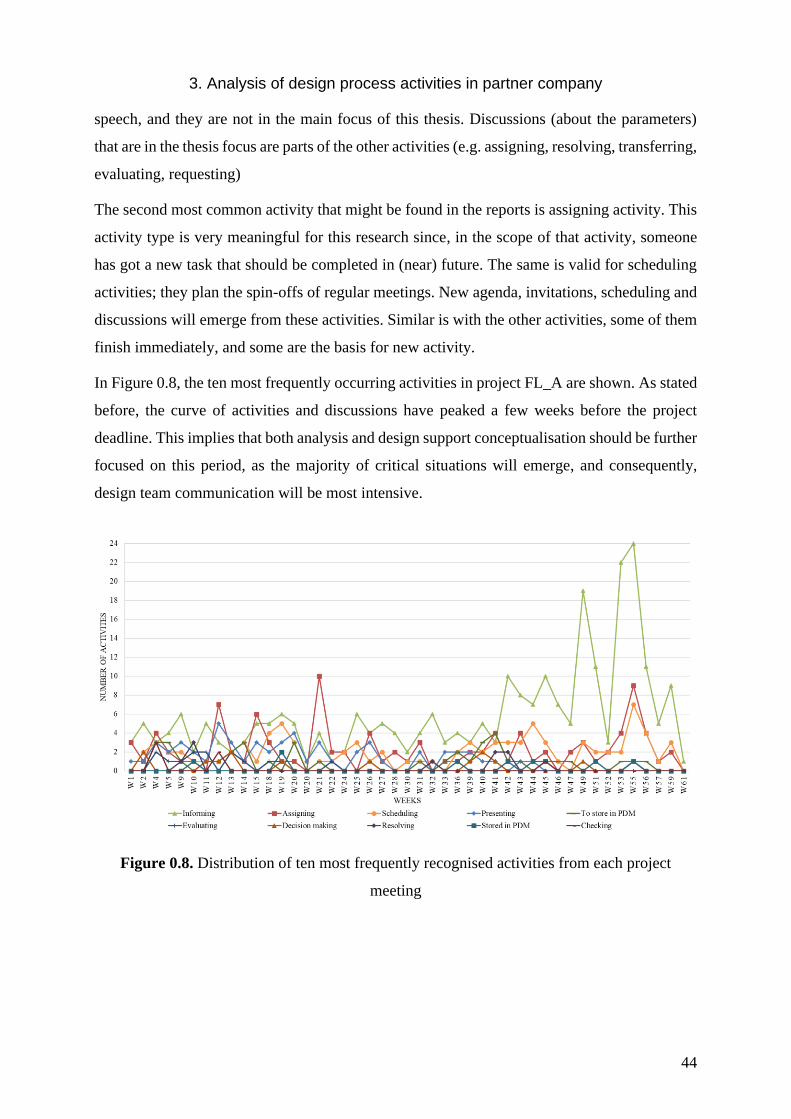
3. Analysis of design process activities in partner company
44
speech, and they are not in the main focus of this thesis. Discussions (about the parameters)
that are in the thesis focus are parts of the other activities (e.g. assigning, resolving, transferring,
evaluating, requesting)
The second most common activity that might be found in the reports is assigning activity. This
activity type is very meaningful for this research since, in the scope of that activity, someone
has got a new task that should be completed in (near) future. The same is valid for scheduling
activities; they plan the spin-offs of regular meetings. New agenda, invitations, scheduling and
discussions will emerge from these activities. Similar is with the other activities, some of them
finish immediately, and some are the basis for new activity.
In Figure 0.8, the ten most frequently occurring activities in project FL_A are shown. As stated
before, the curve of activities and discussions have peaked a few weeks before the project
deadline. This implies that both analysis and design support conceptualisation should be further
focused on this period, as the majority of critical situations will emerge, and consequently,
design team communication will be most intensive.
Figure 0.8. Distribution of ten most frequently recognised activities from each project
meeting
3. Analysis of design process activities in partner company
45
3.3.4. Tailored engineering design activities taxonomy
Based on the analysis that has been conducted, some meaningful conclusions may be drawn.
Several generalised activities occur significantly more frequently compared to others. Table 0.7
shows the number of repetitions of EDAs recognised and extracted in the first iteration of the
analysis. In the following iterations, granulation was refined, and a hierarchy of activities
relying on the design activity ontology of Sim and Duffy [3] has been created. The taxonomy
developed in this research mostly coincides with the ontology of Sim and Duffy, but there are
some other activities that are specific to this type of industry and specific for the projects being
analysed. The proposed taxonomy is shown in Figure 0.9.
Activities at the lowest level of the hierarchy mostly corresponded with the initial generalised
activities obtained in the first iteration of the report analysis. The initial generalised activity list
was formed by scanning and examining project reports and by extracting the most repetitive
terms that denote EDAs in the reports. The described process could be traced from Table 0.6
(highlighted notions in the third column), then to Table 0.7 (most frequent activities that have
been generalised), Table 0.8 (columns with assigned generalised activities) and finally to Figure
0.9 (defined taxonomy entities).
The taxonomy has three major groups of activities, depending on the data flow. The outcome
of the approach used for data analysis is a dataflow oriented taxonomy of engineering design
activities that are defined in analysed meeting reports. The first group in the taxonomy are
activities for which currently undetermined data values have to be obtained. They are grouped
under assigning activity. In such an activity, a task will be assigned to a responsible person or
group of people. These activities usually start after the meeting and might last longer than the
time between two meetings. The second group are reporting activities. These activities start and
finish at the meeting, but they are often prepared before the actual meeting. This group is
divided into activities of informing meeting attendees about the findings and new data and into
presenting the reasoning behind the new information.

3. Analysis of design process activities in partner company
46
Figure 0.9. Taxonomy of engineering activities tailored to analysed projects
The third group of activities are requesting activities. Requested information might be a general
one (e.g. Is a supplier ready to deliver a component?) or a more specific one, like requesting
testing of some component or solution. The third subgroup is requesting information from PDM
since not all employees have access to all information, and someone has to forward the
requested information.
This research benefits most from the first and the third group of activities since they are most
eligible to automate them. In the following section, the process of how these activities could be
automated and thus support the design engineers is described.
47
4. MODEL AND FRAMEWORK FOR
ACTIVITY EXECUTION PROCESS
After the first three chapters in which the hypothesis was defined, research gaps found, along
with methods and solutions that served as the basis for the proposed CSCW enhancement, it is
time to present the systematic development of the framework for implementing solutions for
automated execution of engineering design activities. This phase follows the Prescriptive Study
stage of DRM, which is the next natural step. The phase started with the initial development of
the framework to see if the proposed enhancement is feasible and afterwards was fully defined
and described in this chapter. After a brief introduction of this phase, the first several sections
present the potentials for developing CPN templates for recognised activity types. The chapter
continues with a description of one activity instance and CPN model instance, presents the final
framework, explains the framework’s interfaces and concludes with CPN model templates for
various activity types.
The partner company use an in-house developed PDM system. Besides mainstream design
support systems (e.g. CAD, CAE, PDM), the company is developing an approach based on a
database solution that allows the management of parameters relevant for the development
process. Toepfer and Naumann [12] argue that a parameter generally describes a characteristic
variable of a system element or an element relation that can possess multiple instances in
different product variants. Parameter database allows users (in this case, engineering designers)
to define new parameters, edit existing parameter values, and link parameters with 3D models.
Parameter database has a different role in data management compared to the common usage of
design support systems. The developed concept of parameter management enriches the PDM
with additional information about parameters. Details about the parameter management
approach and parameter database are given in the work of Toepfer and Naumann [12], [13],
[14].
Figure 0.10 shows basic relations and data transfers between PDM, parameter database and the
proposed framework. Management of engineering design activities is based on weekly
meetings held in the product development department. During those meetings, engineering
designers discuss and define new activities that have to be accomplished until the next meeting.
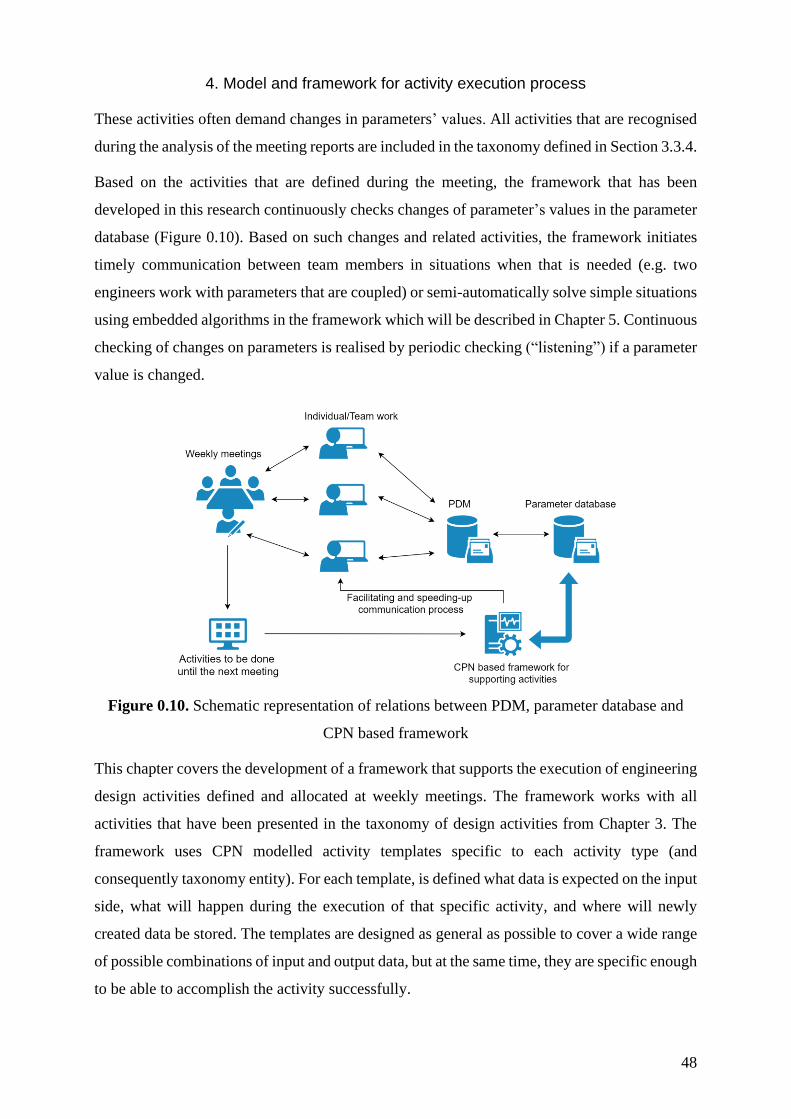
4. Model and framework for activity execution process
48
These activities often demand changes in parameters’ values. All activities that are recognised
during the analysis of the meeting reports are included in the taxonomy defined in Section 3.3.4.
Based on the activities that are defined during the meeting, the framework that has been
developed in this research continuously checks changes of parameter’s values in the parameter
database (Figure 0.10). Based on such changes and related activities, the framework initiates
timely communication between team members in situations when that is needed (e.g. two
engineers work with parameters that are coupled) or semi-automatically solve simple situations
using embedded algorithms in the framework which will be described in Chapter 5. Continuous
checking of changes on parameters is realised by periodic checking (“listening”) if a parameter
value is changed.
Figure 0.10. Schematic representation of relations between PDM, parameter database and
CPN based framework
This chapter covers the development of a framework that supports the execution of engineering
design activities defined and allocated at weekly meetings. The framework works with all
activities that have been presented in the taxonomy of design activities from Chapter 3. The
framework uses CPN modelled activity templates specific to each activity type (and
consequently taxonomy entity). For each template, is defined what data is expected on the input
side, what will happen during the execution of that specific activity, and where will newly
created data be stored. The templates are designed as general as possible to cover a wide range
of possible combinations of input and output data, but at the same time, they are specific enough
to be able to accomplish the activity successfully.
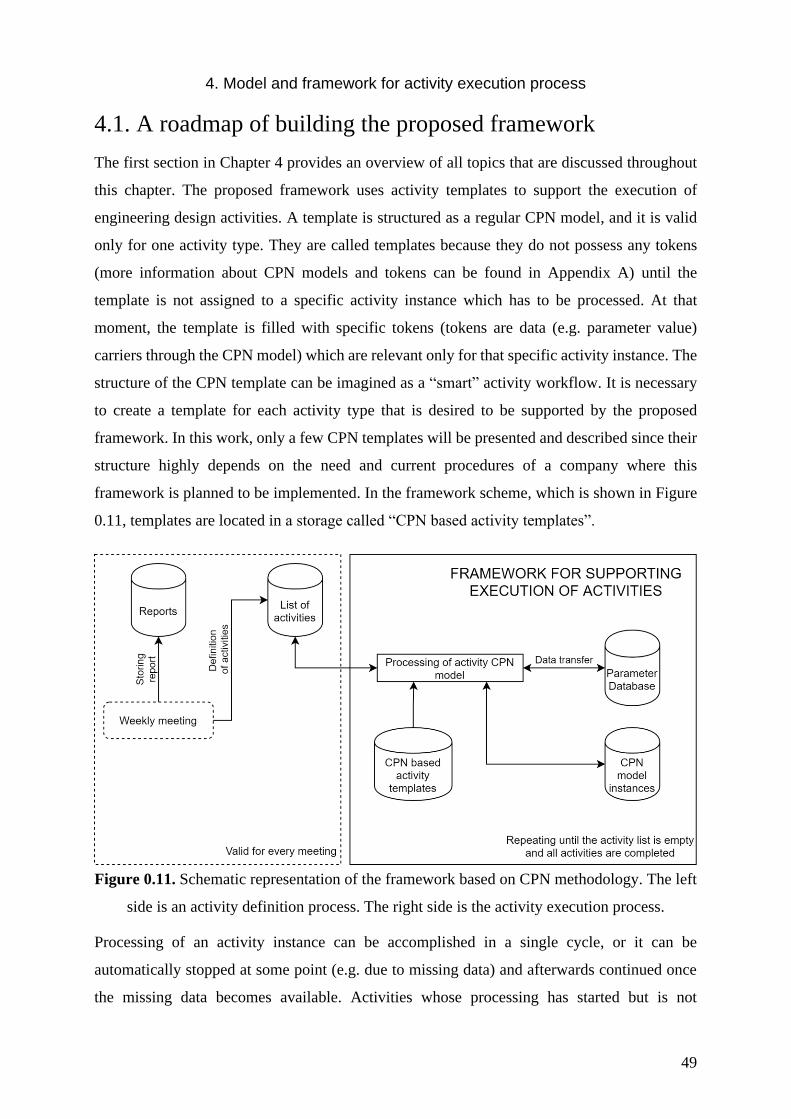
4. Model and framework for activity execution process
49
4.1. A roadmap of building the proposed framework
The first section in Chapter 4 provides an overview of all topics that are discussed throughout
this chapter. The proposed framework uses activity templates to support the execution of
engineering design activities. A template is structured as a regular CPN model, and it is valid
only for one activity type. They are called templates because they do not possess any tokens
(more information about CPN models and tokens can be found in Appendix A) until the
template is not assigned to a specific activity instance which has to be processed. At that
moment, the template is filled with specific tokens (tokens are data (e.g. parameter value)
carriers through the CPN model) which are relevant only for that specific activity instance. The
structure of the CPN template can be imagined as a “smart” activity workflow. It is necessary
to create a template for each activity type that is desired to be supported by the proposed
framework. In this work, only a few CPN templates will be presented and described since their
structure highly depends on the need and current procedures of a company where this
framework is planned to be implemented. In the framework scheme, which is shown in Figure
0.11, templates are located in a storage called “CPN based activity templates”.
Figure 0.11. Schematic representation of the framework based on CPN methodology. The left
side is an activity definition process. The right side is the activity execution process.
Processing of an activity instance can be accomplished in a single cycle, or it can be
automatically stopped at some point (e.g. due to missing data) and afterwards continued once
the missing data becomes available. Activities whose processing has started but is not
4. Model and framework for activity execution process
50
completed are stored, and that storage is shown in Figure 4.2 labelled as “CPN activity
instances”.
After a meeting, a meeting report is shared with all other participants. Besides the report, after
the meeting, a list of activities that have to be accomplished is created. The activity list acts as
an input node of the proposed framework. It is a buffer in which activity instances are stored
while they wait for the execution. The left part of Figure 0.11 shows a process that repeats for
every meeting. After writing a meeting report and writing down all the activities, the process
on the left side is completed, and the activity execution process on the right side starts. This
process is continuous as long as there are activities on the list that are not completed. It should
be highlighted that meetings are only one of the possible activity sources, but this research will
cover only this source of the activities. For example, the other source could be activity defined
in a conversation between a project leader and an engineer. In that case, the project leader would
insert a new activity instance on the activity list.
Process of activity execution (right part of the figure) is a continuous process that runs as long
as at least one activity exists in the activity list. The activities are executed in the sequence in
which they appear in the list. If an activity is not completed after the first execution, it will be
executed again during the next cycle of the activity list processing. Why is sequential processing
of the activity instances list selected for the framework, and how activity instance execution
and re-execution are realised will be further described in the CPN instance lifecycle section.
An activity might be completed in a few hours (e.g. changing dimension in the 3D model), up
to several weeks (e.g. negotiation about coupled parameters), maybe even months. When a CPN
model is instantiated, its progress and latest status are stored. Storing the model gives a user a
clear image of which part of the specific activity instance is already finished, what data is
missing and what are the next steps to finish the activity.
To be able to work correctly, the framework requires a connection to data sources, depending
on the activity type that is processed. At least, it should have a connection to the employee
database for most activities, with relations to teams, work and interest groups. Furthermore, it
should have a connection to the design parameter database and PDM. Section 4.4 describes
how a CPN model can be connected to external sources. Connection to a particular database
requires a bidirectional link with the database, and establishing such a connection is part of the
implementation process, which is specific for each database.
4. Model and framework for activity execution process
51
Up to this point, the framework is described in a manner to give a reader a basic overview of
how it works and what are its main components. The following subsections are oriented to the
gradual development of a CPN model template using a simple generic activity and starting from
basic CPN model building blocks up to the CPN models, which are used as templates in the
framework.
After the description of CPN templates development, the presentation will continue with a
detailed explanation of the activity list, instantiation of activities, the lifecycle of an activity
instance and how all of these elements are combined into a framework for supporting the
execution of engineering design activities. The last part of the chapter is dedicated to the
description of the CPN model templates for actual activity types. The CPN templates which are
presented here are for two different activity types, which are entities of engineering design
activities taxonomy from Chapter 3:
1. Automatic parameter change
One example of such activity can be found in meeting reports as follows: “Position of a parking
sensor should be 1 mm higher in Z direction.” It is known who is responsible for the component
that has to be changed, and at the meeting is defined which component has to be changed, what
parameter has to be changed and what is the new value of the parameter. Such an activity can
be fully supported by the developed framework since all required data for accomplishing the
activity are known at the moment of activity definition.
The same activity type can be defined slightly differently: “Position of a parking sensor should
be at 63 mm from the ground”. In this case, the parameter is the same, and the final value is the
same, but it is defined as an absolute value, while in the first example, it is defined as an
incremental value that depends on the current value. Therefore, the CPN template should be
flexible enough and calculate such changes in order to store the correct value.
The third example of the same activity type is the following: “for racing vehicle variant, tailpipe
must be made out of titanium.” Now, there is no geometrical parameter, but the material of the
component has to be changed.
In all these examples, the CPN template is the same; only the input and output data are different.
As an input, the template needs a component name, parameter name and the new value of the
parameter. This activity type has been chosen to show the possible flexibility of CPN templates.
Another reason is that this activity type can be accomplished without user (engineering
4. Model and framework for activity execution process
52
designer) interaction and in one processing cycle (does not need to be stopped and processed
again), while this is not a case with the following activity type.
2. Negotiation about coupled parameters
Usually, the purpose of negotiating is to reach an agreement that will result in mutual benefits.
Each party tries to come to an agreement that will serve its own interests. The same is with a
negotiation about coupled parameters. During product design, there are many situations where
two or more parameters are interdependent, and at the same time, more than one designer is
responsible for them. In such a situation, they must negotiate and find a common compromise
solution. CPN based model cannot resolve such a problem automatically, but it can timely
initiate and support communication between designers. The model of negotiation activity used
in this research is based on the negotiation process presented by Yang et al. [81] and a detailed
negotiation model defined by Khosravifar [82]. The model of such a complex activity must be
divided into smaller sub-activities such as: informing parties about changes in the process,
collecting relevant parameters or inviting additional party into the process.
Such a complex CPN template represents the activity in which more than one user is required,
the activity cannot be completed in one processing cycle, and the activity cannot be completed
without the user’s interaction.
To get a better overview of the rest of the chapter, the following roadmap connects covered
topics with sections for easier following:
• Gradual development of CPN model templates using a simple generic activity, starting
from basic CPN model building blocks. Partial models show several types of obtaining
input data (Sections 4.2 to 4.5),
• Definition of the activity list, how are activities instantiated from items in the list, the
definition of activity instance and its lifecycle (Sections 4.6 to 4.8),
• Presentation and explanation of developed CPN model templates (Section 4.12)
4.2. Obtaining input data without external sources
Depending on an activity type, processing of a CPN model will require input data. The
collection of data is explained in Section 4.4. After the execution, new or changed data will be
generated and stored. The process on the highest level, where the CPN model is represented
just as a black box, is shown in Figure 0.12.
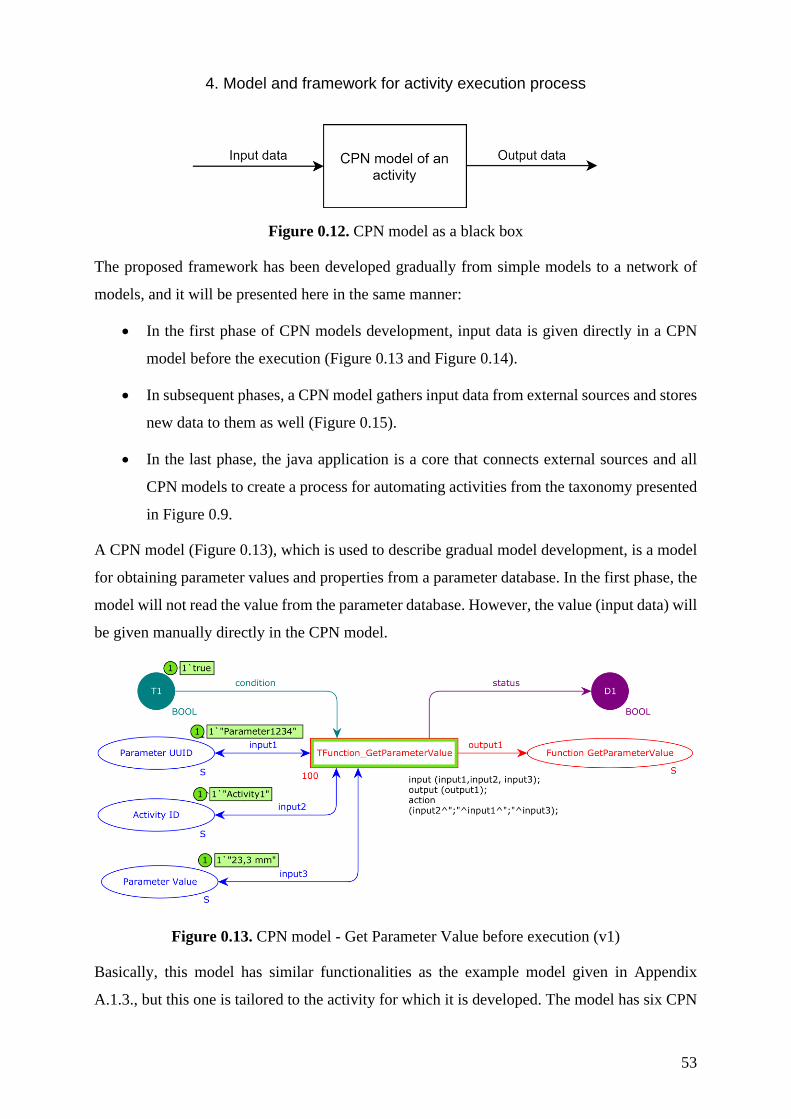
4. Model and framework for activity execution process
53
Figure 0.12. CPN model as a black box
The proposed framework has been developed gradually from simple models to a network of
models, and it will be presented here in the same manner:
• In the first phase of CPN models development, input data is given directly in a CPN
model before the execution (Figure 0.13 and Figure 0.14).
• In subsequent phases, a CPN model gathers input data from external sources and stores
new data to them as well (Figure 0.15).
• In the last phase, the java application is a core that connects external sources and all
CPN models to create a process for automating activities from the taxonomy presented
in Figure 0.9.
A CPN model (Figure 0.13), which is used to describe gradual model development, is a model
for obtaining parameter values and properties from a parameter database. In the first phase, the
model will not read the value from the parameter database. However, the value (input data) will
be given manually directly in the CPN model.
Figure 0.13. CPN model - Get Parameter Value before execution (v1)
Basically, this model has similar functionalities as the example model given in Appendix
A.1.3., but this one is tailored to the activity for which it is developed. The model has six CPN
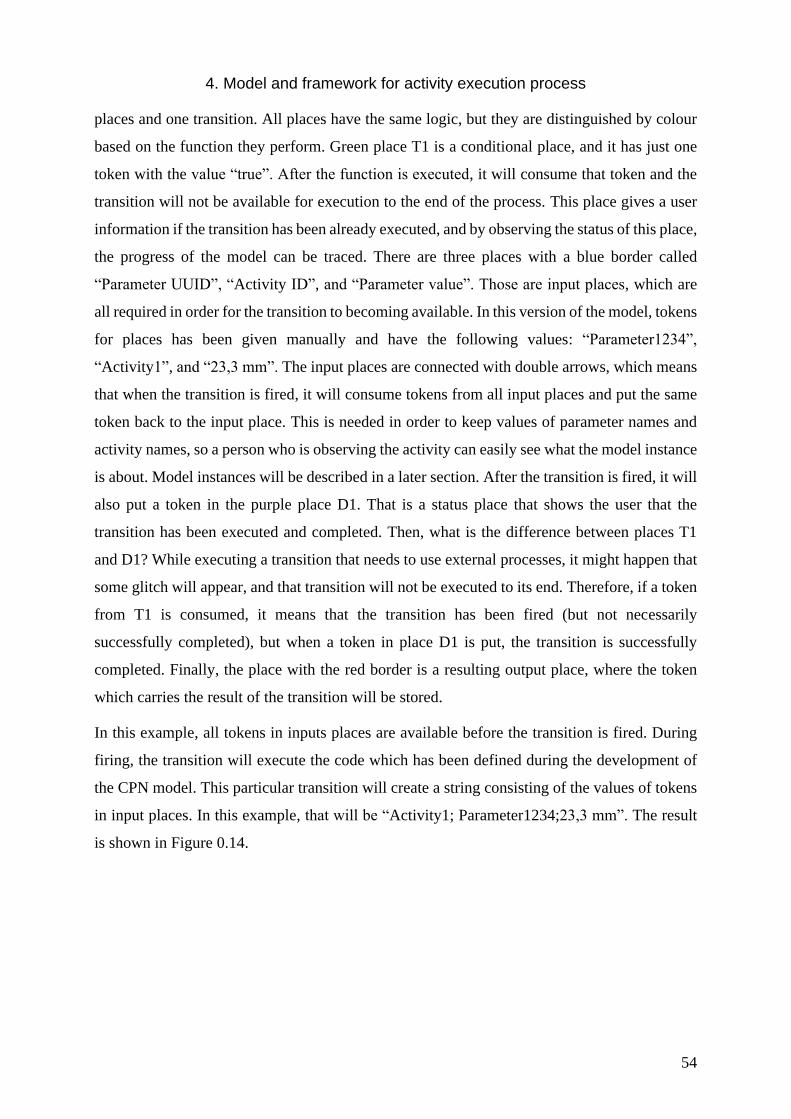
4. Model and framework for activity execution process
54
places and one transition. All places have the same logic, but they are distinguished by colour
based on the function they perform. Green place T1 is a conditional place, and it has just one
token with the value “true”. After the function is executed, it will consume that token and the
transition will not be available for execution to the end of the process. This place gives a user
information if the transition has been already executed, and by observing the status of this place,
the progress of the model can be traced. There are three places with a blue border called
“Parameter UUID”, “Activity ID”, and “Parameter value”. Those are input places, which are
all required in order for the transition to becoming available. In this version of the model, tokens
for places has been given manually and have the following values: “Parameter1234”,
“Activity1”, and “23,3 mm”. The input places are connected with double arrows, which means
that when the transition is fired, it will consume tokens from all input places and put the same
token back to the input place. This is needed in order to keep values of parameter names and
activity names, so a person who is observing the activity can easily see what the model instance
is about. Model instances will be described in a later section. After the transition is fired, it will
also put a token in the purple place D1. That is a status place that shows the user that the
transition has been executed and completed. Then, what is the difference between places T1
and D1? While executing a transition that needs to use external processes, it might happen that
some glitch will appear, and that transition will not be executed to its end. Therefore, if a token
from T1 is consumed, it means that the transition has been fired (but not necessarily
successfully completed), but when a token in place D1 is put, the transition is successfully
completed. Finally, the place with the red border is a resulting output place, where the token
which carries the result of the transition will be stored.
In this example, all tokens in inputs places are available before the transition is fired. During
firing, the transition will execute the code which has been defined during the development of
the CPN model. This particular transition will create a string consisting of the values of tokens
in input places. In this example, that will be “Activity1; Parameter1234;23,3 mm”. The result
is shown in Figure 0.14.
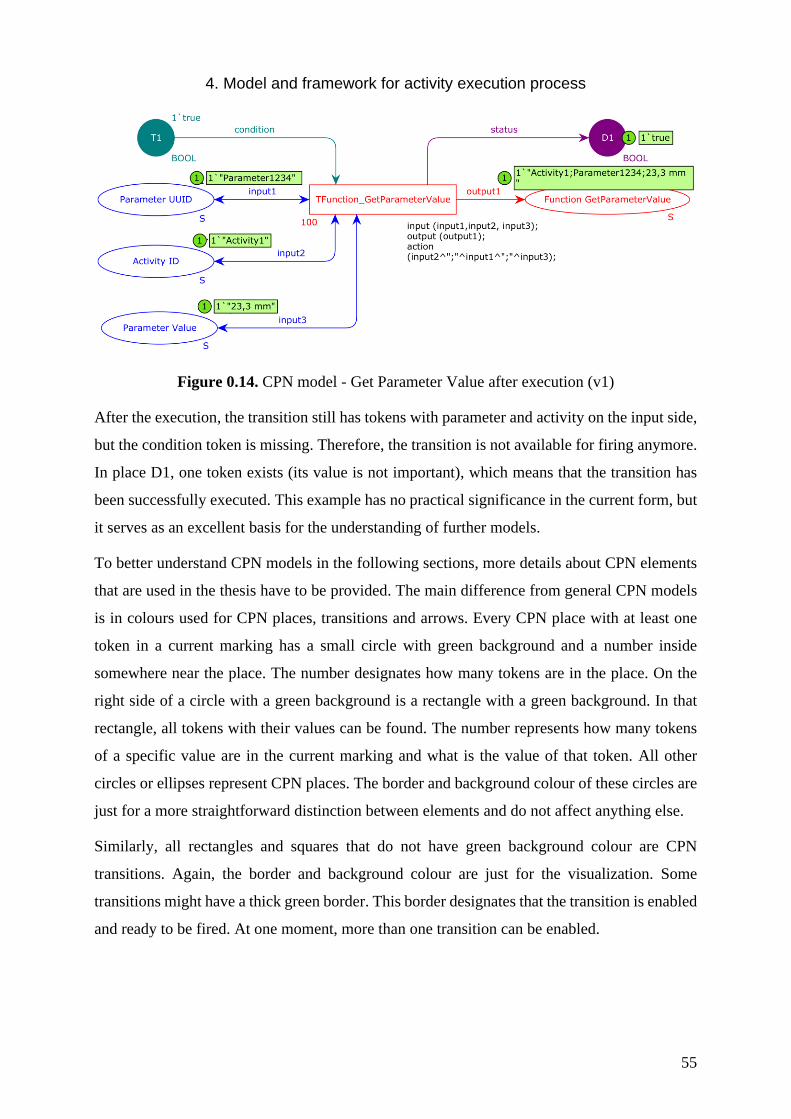
4. Model and framework for activity execution process
55
Figure 0.14. CPN model - Get Parameter Value after execution (v1)
After the execution, the transition still has tokens with parameter and activity on the input side,
but the condition token is missing. Therefore, the transition is not available for firing anymore.
In place D1, one token exists (its value is not important), which means that the transition has
been successfully executed. This example has no practical significance in the current form, but
it serves as an excellent basis for the understanding of further models.
To better understand CPN models in the following sections, more details about CPN elements
that are used in the thesis have to be provided. The main difference from general CPN models
is in colours used for CPN places, transitions and arrows. Every CPN place with at least one
token in a current marking has a small circle with green background and a number inside
somewhere near the place. The number designates how many tokens are in the place. On the
right side of a circle with a green background is a rectangle with a green background. In that
rectangle, all tokens with their values can be found. The number represents how many tokens
of a specific value are in the current marking and what is the value of that token. All other
circles or ellipses represent CPN places. The border and background colour of these circles are
just for a more straightforward distinction between elements and do not affect anything else.
Similarly, all rectangles and squares that do not have green background colour are CPN
transitions. Again, the border and background colour are just for the visualization. Some
transitions might have a thick green border. This border designates that the transition is enabled
and ready to be fired. At one moment, more than one transition can be enabled.
4. Model and framework for activity execution process
56
A black text that is usually placed near the right bottom corner of a transition is a custom
function that will be executed when the transition is fired. These functions are written in the
SML programming language, the language which is behind the CPN.
The direction of an arrow shows the way in which tokens will be transferred, or in other words,
arrows show if a CPN place is an input or an output place of a connected transition. The colour
of the arrow does not affect anything.
4.3. Obtaining input data using external sources
The model from Figure 0.14 has been enriched in the way that values of tokens in input places
are read from a simple external textual document. Such a model is the next phase in developing
a CPN model template, and it is shown in Figure 0.15. There is an important difference in
elements between these models, so it would be valuable to go through this model thoroughly.
In the beginning, the model has one transition that can be fired, which reads a list of activities
and a parameter database. In this scenario, both external sources are textual documents shown
in Figure 0.16. The transition has an embedded custom function for reading textual documents,
which will be executed during firing, and as a result, the function will create a tuple of lists of
strings where one string is one line in a text document. The results (the tuple of lists) will be
divided and stored in two places, where one place is “PL_ActivityList”, which will store a list
of activities, and the second one is “PL_ParameterDBase”, in which a list of parameters is
stored. Both places have custom CPN colour (data type) LS (List of Strings). The result of the
current model status is shown in Figure 0.17.
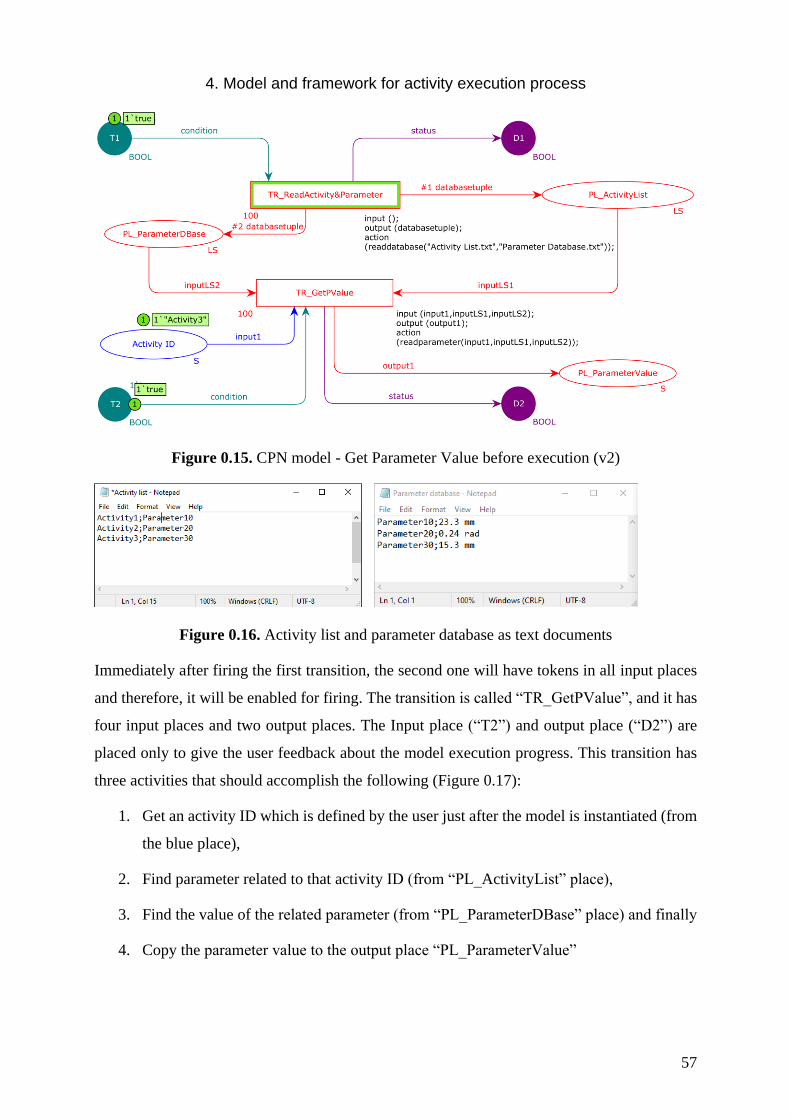
4. Model and framework for activity execution process
57
Figure 0.15. CPN model - Get Parameter Value before execution (v2)
Figure 0.16. Activity list and parameter database as text documents
Immediately after firing the first transition, the second one will have tokens in all input places
and therefore, it will be enabled for firing. The transition is called “TR_GetPValue”, and it has
four input places and two output places. The Input place (“T2”) and output place (“D2”) are
placed only to give the user feedback about the model execution progress. This transition has
three activities that should accomplish the following (Figure 0.17):
1. Get an activity ID which is defined by the user just after the model is instantiated (from
the blue place),
2. Find parameter related to that activity ID (from “PL_ActivityList” place),
3. Find the value of the related parameter (from “PL_ParameterDBase” place) and finally
4. Copy the parameter value to the output place “PL_ParameterValue”
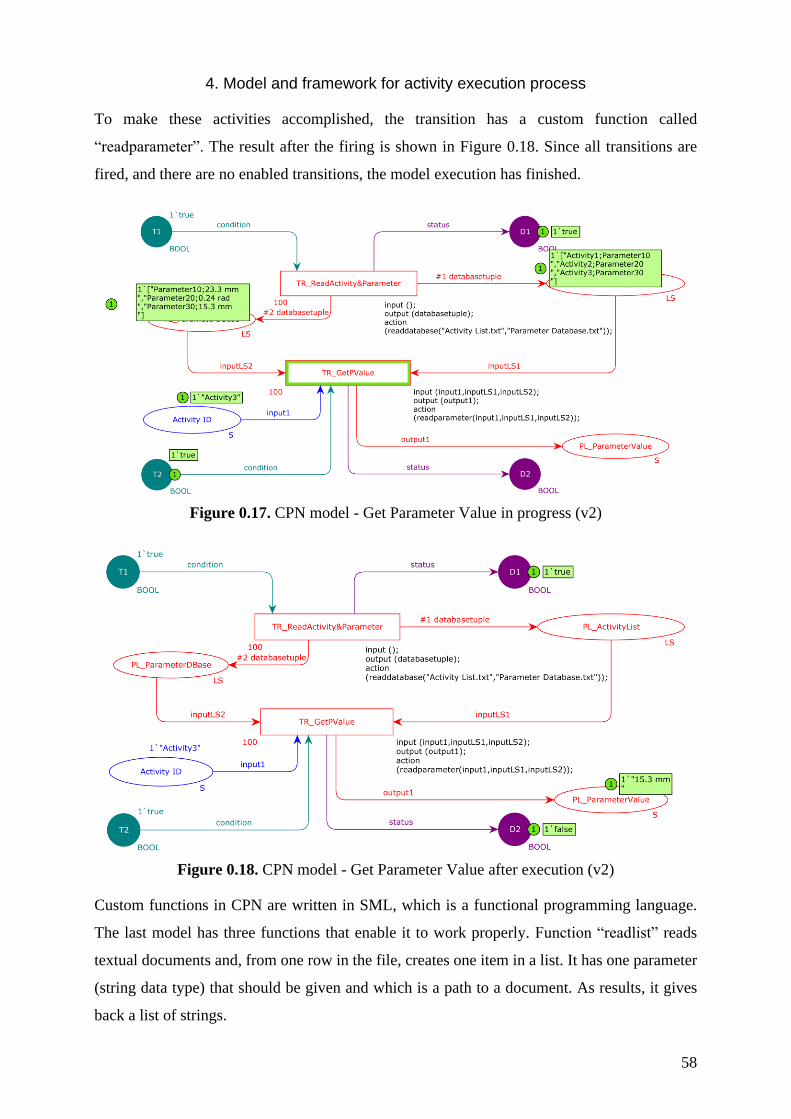
4. Model and framework for activity execution process
58
To make these activities accomplished, the transition has a custom function called
“readparameter”. The result after the firing is shown in Figure 0.18. Since all transitions are
fired, and there are no enabled transitions, the model execution has finished.
Figure 0.17. CPN model - Get Parameter Value in progress (v2)
Figure 0.18. CPN model - Get Parameter Value after execution (v2)
Custom functions in CPN are written in SML, which is a functional programming language.
The last model has three functions that enable it to work properly. Function “readlist” reads
textual documents and, from one row in the file, creates one item in a list. It has one parameter
(string data type) that should be given and which is a path to a document. As results, it gives
back a list of strings.
4. Model and framework for activity execution process
59
The second function used in the model is “readdatabase”. When this function is called, two
parameters must be given (both are strings). One is the path to the parameter database file, and
the other is the full path to the activity list file. The function will call the function “readlist” two
times, one for each document, and it will forward the path to that function. Afterwards, it will
combine two lists of strings (parameter list and activity list) into a tuple. One might ask, how is
then tuple divided, and a proper list is sent to proper CPN place? Arrows in CPN do not just
show in which direction tokens go, but they show which variable is carried by the token and
can even extract or filter data from a token. In Figure 0.17, between the first transition and
places, “PL_ActivityList” and “PL_ParameterDBase” are arrows with an inscription above
them (#1 databasetuple and #2 databasetuple). These inscriptions will extract data from the
tuple, which is generated in the transition. The number designates which part of the tuple is
extracted and passed to which place.
The third function is called “readparameter” and it has three input parameters: activity ID
(string data type), parameters with their values (list of strings) and activities with parameters
(list of strings). What the function does, is described in the paragraph where the second
transition was explained. All three functions are shown in Appendix A.
4.4. CPN colours in described CPN models
One CPN element that was not tackled until now is the CPN colour. Hence, the concept of
colours will be presented in this section. It is necessary to come back a bit and start from tokens
in general PN. Tokens are the only live thing in CPN models; they move from a place to a place
and show the progress in the model as well as the results of transitions. While they were just
black dots in PN, in CPN tokens, they are data carriers.
The first task when one starts building a CPN model is to declare colour sets. After that, a colour
set must be assigned to each place. Regarding colour sets, several rules must be followed:
• A place can have only one colour set,
• The colour set cannot be changed during the simulation,
• One colour set can be assigned to more than one place,
• Input and output places of a transition do not have to have the same colour set, and
• A place can receive a token only if the token has the same data type as place’s colour
set.
4. Model and framework for activity execution process
60
According to the last rule, a transition should change the input data type to fit the output place’s
colour set. If the data type is the same, it can just perform the requested action on the data. CPN
supports some of the regular data types (e.g. Boolean, integer, large, real, string, etc.). Besides
regular types, it allows the declaration of compound colour sets using previously declared
regular colour sets. Compound colour sets are the following:
• Product,
• Record,
• List,
• Union,
• Subset, and
• Alias.
After the declaration of colour sets, variables that will be used in the model can be declared.
The variable must have a unique name and one of the colour sets must be assigned to it.
Variables are used in functions and as inscriptions above arrows.
The first model, shown in Figure 0.13, is using two colour sets: Boolean and string. That is
depicted by “BOOL” or “S” in the right bottom corner of each place. This model uses several
variables as well: condition (bool), status (bool), input1 (string), input2 (string), input3 (string),
and output1 (string). The function is consuming three input tokens (all are string type), performs
an action on them and sends new data to the output place. The data type remains the same.
The second model, shown in Figure 0.15, in addition to the two already mentioned colour sets,
has one compound colour set. It is called a list of strings and can store strings in a list. These
lists are used in functions to go through them and find the required string (e.g. search for a
parameter in the parameter list). With colour set and variables, this phase of developing the
CPN model template is completely described. The following paragraph goes beyond the core
of CPN and allows control of the CPN model using external process.
4. Model and framework for activity execution process
61
4.5. Executing a CPN model with external application
This is the key phase for this research since it will connect many pieces into one final solution.
Instantiating, controlling and monitoring CPN models using external processes give a
tremendous opportunity to automate some (especially routine) activities in product
development.
The model explained in this phase will be the same model from the Figure 0.18 described in
Section 4.3. The main difference is that in past examples (Figure 0.13 and Figure 0.15), a user
had to interact with CPN models using CPN Tools and thus fire the desired CPN transition.
This way of executing activities is not preferred because this framework is intended to work
with many CPN templates, activity instances and users. The ultimate goal is to move
engineering designers from interacting directly with the CPN model and CPN Tools and that is
why there is a need to control and execute CPN model via a custom program application.
In the example described in this section, the user will still interact with the CPN model in the
way that the user will change a token value in the place with the blue border called “Activity
ID”. After that, the external process (started by the user from the custom application) will start
executing the CPN model by automatically firing enabled transitions (instead of the user who
had to click an enabled transition in the previous phase (Figure 0.15).
Although CPN Tools is a mature environment for designing and simulating CPN models, it has
some limitations as well. It does not fully support connecting CPN models with an external
application (e.g. to fire a transition inside a CPN model). Thankfully, Westergaard and
Kristensen [83] developed Access/CPN framework, which extends CPN Tools capabilities and
thus allows the integration of CPN Tools functions into external applications. The Access/CPN
framework is developed in Java and provides an object-oriented representation of CPN models,
an instrument to load models created using CPN Tools and an interface to the CPN simulator.
More details about the framework will not be covered here since it is well described in the paper
[83].
In this example, functions from Access/CPN are used to control and execute CPN models. They
are called from custom java application developed during this research to run a specific CPN
model. Java application is a main connection point in the framework. It reads the activity list
and takes activity instances one by one. Then it takes the corresponding CPN model template
and fills it with data defined in the activity instance. It also controls the execution of CPN
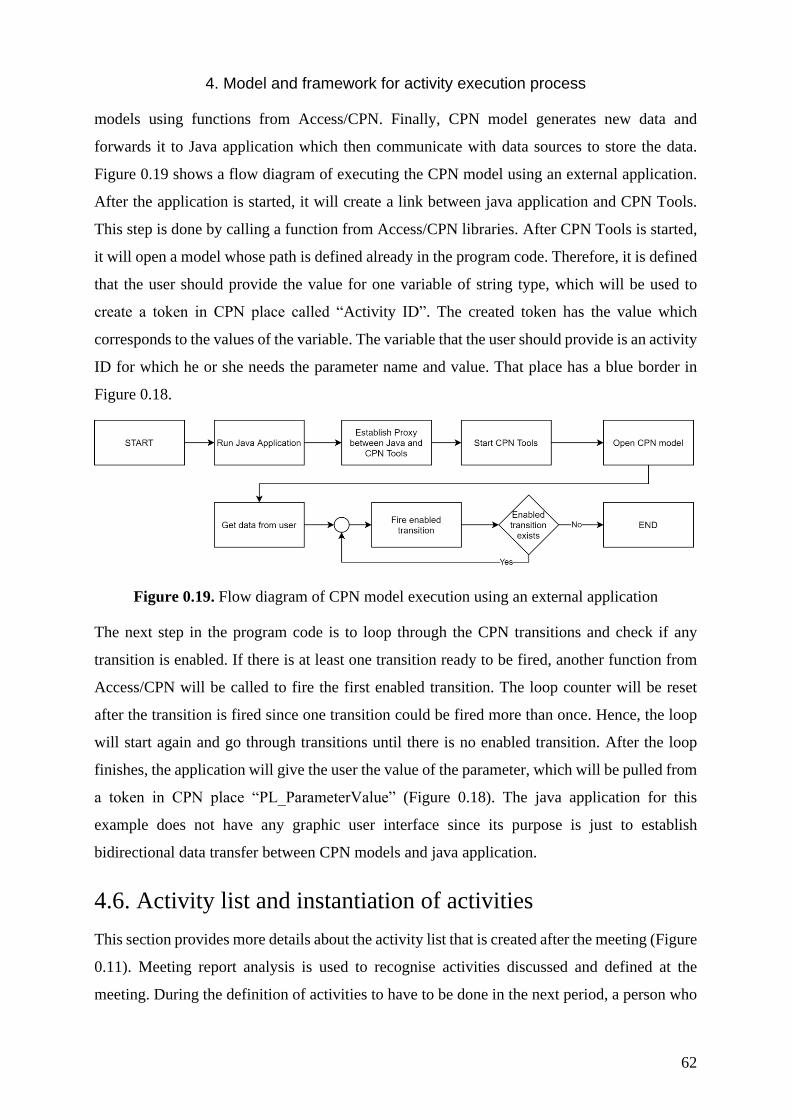
4. Model and framework for activity execution process
62
models using functions from Access/CPN. Finally, CPN model generates new data and
forwards it to Java application which then communicate with data sources to store the data.
Figure 0.19 shows a flow diagram of executing the CPN model using an external application.
After the application is started, it will create a link between java application and CPN Tools.
This step is done by calling a function from Access/CPN libraries. After CPN Tools is started,
it will open a model whose path is defined already in the program code. Therefore, it is defined
that the user should provide the value for one variable of string type, which will be used to
create a token in CPN place called “Activity ID”. The created token has the value which
corresponds to the values of the variable. The variable that the user should provide is an activity
ID for which he or she needs the parameter name and value. That place has a blue border in
Figure 0.18.
Figure 0.19. Flow diagram of CPN model execution using an external application
The next step in the program code is to loop through the CPN transitions and check if any
transition is enabled. If there is at least one transition ready to be fired, another function from
Access/CPN will be called to fire the first enabled transition. The loop counter will be reset
after the transition is fired since one transition could be fired more than once. Hence, the loop
will start again and go through transitions until there is no enabled transition. After the loop
finishes, the application will give the user the value of the parameter, which will be pulled from
a token in CPN place “PL_ParameterValue” (Figure 0.18). The java application for this
example does not have any graphic user interface since its purpose is just to establish
bidirectional data transfer between CPN models and java application.
4.6. Activity list and instantiation of activities
This section provides more details about the activity list that is created after the meeting (Figure
0.11). Meeting report analysis is used to recognise activities discussed and defined at the
meeting. During the definition of activities to have to be done in the next period, a person who
4. Model and framework for activity execution process
63
is defining the activity actually instantiates the design taxonomy entity and assigns values to
taxonomy entity attributes.
The newly created activity instance is stored in the activity list (including specific data for the
instance) and is ready to be processed using the CPN models. Before processing, data for the
instance is obtained from the activity list, required tokens in the CPN model are created, and
the data is assigned to the tokens. This process is shown in Figure 0.11. To better explain how
this list is created, it is useful to go back to the project review meetings. At the end of the design
project review meeting, the note-taker checks, completes and verifies the report. The report is
then sent to all participants, stored, and analysed to extract activities.
In this research, two ways to process the meeting reports and extract the activities are proposed:
1. Extraction done by a person reading the meeting report
2. Extraction from a tailored meeting report done by software procedure
The first method is already described in Section 3.3. It is a basic method and not software
supported in which a user must extract an activity and values from a text or, in the best case,
from one sentence. The method is slow, but it has high accuracy, and it is resistant to some
grammatical errors in the text. It is also suitable for research purposes, but in practice, too much
time would be spent on that simple activity, especially if the number of meeting and projects
within the company is substantial.
The accuracy of activity extraction was mentioned, and there is a good reason for that. One can
imagine a case where the system would automatically change some dimension of a component,
but it recognised a wrong component to be changed. Or if the recognised activity is to schedule
a new meeting, but the system recognised the wrong date or not all participants are invited. If
someone has to check if each activity is correctly recognised, it is a huge time waste for the
company.
The second method can be seen as a combination of the two previously mentioned methods. If
the current report has a more advanced and improved (tailored) structure, it could be easily
analysed automatically. Instead of just writing unstructured text in the current status column
(see Table 0.6), which already contains all information, it is proposed that this column is divided
into several columns, as follows:
• Activity type (based on the taxonomy entities)
4. Model and framework for activity execution process
64
• Additional columns depending on selected activity (design parameters, stakeholders,
documents)
• Details (which are not required for activity execution but describes the activity)
To explore issues about the faster generation of meeting reports and thus activity list, a simple
test was conducted. In his master’s thesis, Breški [84] proposed an application to create meeting
reports even during a meeting (nowadays, note-taker just write minutes and then rewrites the
report). When creating a new item for meeting minute, a note-taker should choose the type of
meeting topic to fill in (e.g. scheduling meeting, discussion, presentation, assignment). By
selecting the topic, a dynamic user interface shows only relevant input fields for the selected
topic that are ought to be filled. These predefined input fields help the user with writing the
report, but what is more important is that structured input eases the analysis of the report
afterwards. Besides predefined input fields, the user can add additional fields based on a
specific need. The application is simple to use and allows users to write the report faster and
with fewer mistakes than using the conventional method. The drawback of the application is
that a user needs some time to learn how to use all its functions efficiently. Despite its fast
learning curve, users often refuse to gain new knowledge if they have an option to choose
whether they will stick with an old solution or switch to a new one. Using a structured meeting
report created with the application mentioned above, the process of recognising and extracting
activities could be automatized since it has more fields that could be automatically recognized.
That way, analysis is less prone to errors and higher accuracy can be achieved.
However, the way how the activity list is created is not in the focus and scope of this thesis.
The activity list is a buffer in which activity instances are stored are wait for execution. The
framework developed and presented in this research requires an activity list as a source of
activities that have to be processed. In Figure 0.11, the left side of the figure is about analysing
a meeting and preparing the activity list, while the right side is an explanation of how this list
is processed, which is in the main focus for the rest of the research.
Instantiation of activity entity from the taxonomy is the first instantiation step and it is done
during an activity definition. The instantiation process is shown in Figure 0.20. During the first
step, a person who prepares activities for the activity list instantiates the activity from taxonomy
and assigns values from the meeting report to the activity instance. This is a necessary step in
order to do the second instantiation step, which is described in the next section.
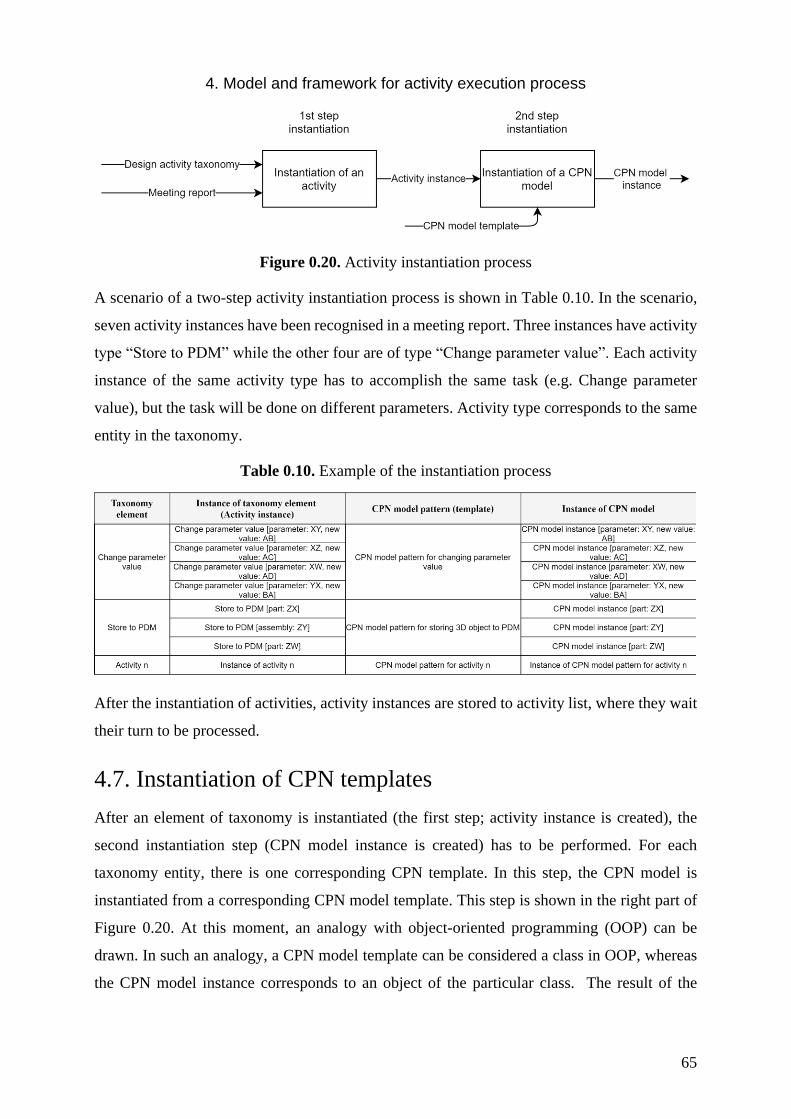
4. Model and framework for activity execution process
65
Figure 0.20. Activity instantiation process
A scenario of a two-step activity instantiation process is shown in Table 0.10. In the scenario,
seven activity instances have been recognised in a meeting report. Three instances have activity
type “Store to PDM” while the other four are of type “Change parameter value”. Each activity
instance of the same activity type has to accomplish the same task (e.g. Change parameter
value), but the task will be done on different parameters. Activity type corresponds to the same
entity in the taxonomy.
Table 0.10. Example of the instantiation process
After the instantiation of activities, activity instances are stored to activity list, where they wait
their turn to be processed.
4.7. Instantiation of CPN templates
After an element of taxonomy is instantiated (the first step; activity instance is created), the
second instantiation step (CPN model instance is created) has to be performed. For each
taxonomy entity, there is one corresponding CPN template. In this step, the CPN model is
instantiated from a corresponding CPN model template. This step is shown in the right part of
Figure 0.20. At this moment, an analogy with object-oriented programming (OOP) can be
drawn. In such an analogy, a CPN model template can be considered a class in OOP, whereas
the CPN model instance corresponds to an object of the particular class. The result of the
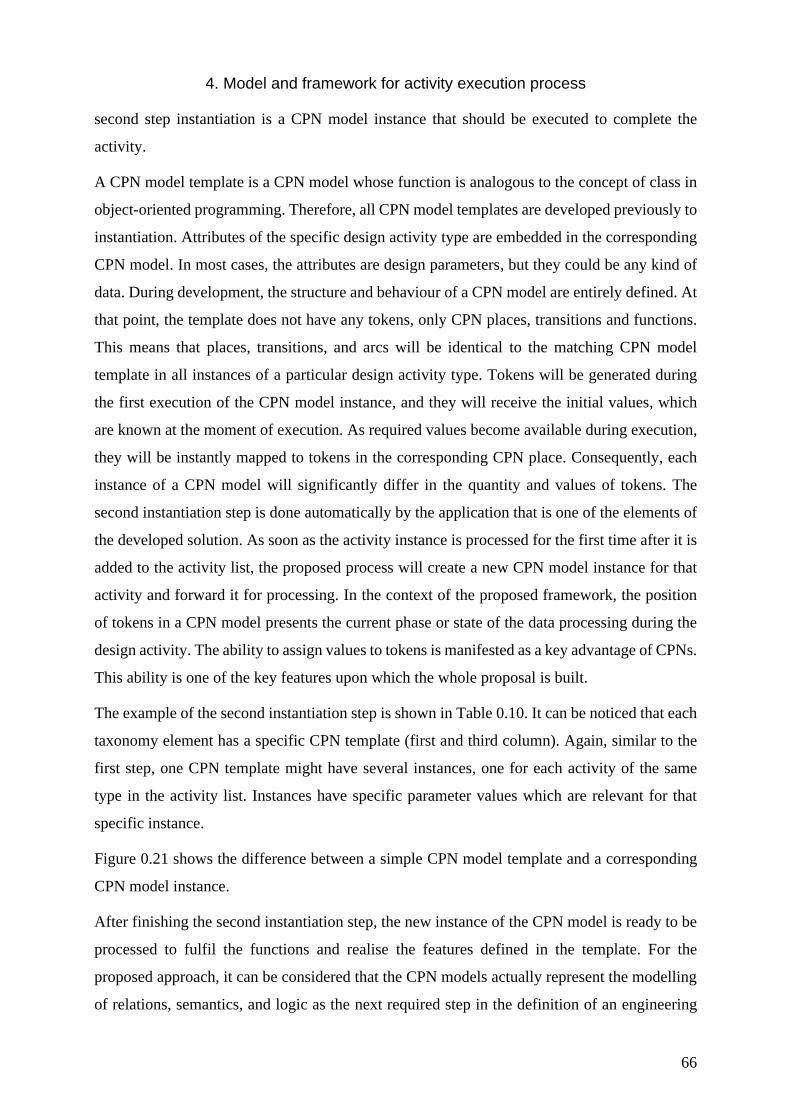
4. Model and framework for activity execution process
66
second step instantiation is a CPN model instance that should be executed to complete the
activity.
A CPN model template is a CPN model whose function is analogous to the concept of class in
object-oriented programming. Therefore, all CPN model templates are developed previously to
instantiation. Attributes of the specific design activity type are embedded in the corresponding
CPN model. In most cases, the attributes are design parameters, but they could be any kind of
data. During development, the structure and behaviour of a CPN model are entirely defined. At
that point, the template does not have any tokens, only CPN places, transitions and functions.
This means that places, transitions, and arcs will be identical to the matching CPN model
template in all instances of a particular design activity type. Tokens will be generated during
the first execution of the CPN model instance, and they will receive the initial values, which
are known at the moment of execution. As required values become available during execution,
they will be instantly mapped to tokens in the corresponding CPN place. Consequently, each
instance of a CPN model will significantly differ in the quantity and values of tokens. The
second instantiation step is done automatically by the application that is one of the elements of
the developed solution. As soon as the activity instance is processed for the first time after it is
added to the activity list, the proposed process will create a new CPN model instance for that
activity and forward it for processing. In the context of the proposed framework, the position
of tokens in a CPN model presents the current phase or state of the data processing during the
design activity. The ability to assign values to tokens is manifested as a key advantage of CPNs.
This ability is one of the key features upon which the whole proposal is built.
The example of the second instantiation step is shown in Table 0.10. It can be noticed that each
taxonomy element has a specific CPN template (first and third column). Again, similar to the
first step, one CPN template might have several instances, one for each activity of the same
type in the activity list. Instances have specific parameter values which are relevant for that
specific instance.
Figure 0.21 shows the difference between a simple CPN model template and a corresponding
CPN model instance.
After finishing the second instantiation step, the new instance of the CPN model is ready to be
processed to fulfil the functions and realise the features defined in the template. For the
proposed approach, it can be considered that the CPN models actually represent the modelling
of relations, semantics, and logic as the next required step in the definition of an engineering
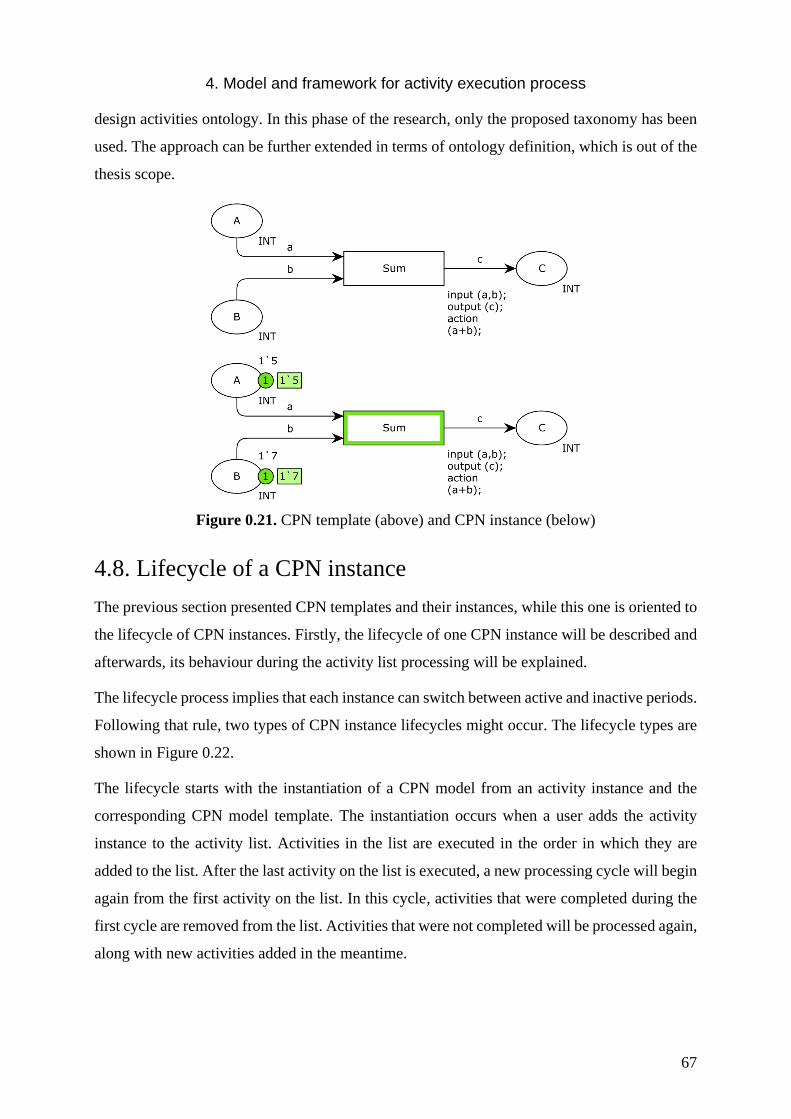
4. Model and framework for activity execution process
67
design activities ontology. In this phase of the research, only the proposed taxonomy has been
used. The approach can be further extended in terms of ontology definition, which is out of the
thesis scope.
Figure 0.21. CPN template (above) and CPN instance (below)
4.8. Lifecycle of a CPN instance
The previous section presented CPN templates and their instances, while this one is oriented to
the lifecycle of CPN instances. Firstly, the lifecycle of one CPN instance will be described and
afterwards, its behaviour during the activity list processing will be explained.
The lifecycle process implies that each instance can switch between active and inactive periods.
Following that rule, two types of CPN instance lifecycles might occur. The lifecycle types are
shown in Figure 0.22.
The lifecycle starts with the instantiation of a CPN model from an activity instance and the
corresponding CPN model template. The instantiation occurs when a user adds the activity
instance to the activity list. Activities in the list are executed in the order in which they are
added to the list. After the last activity on the list is executed, a new processing cycle will begin
again from the first activity on the list. In this cycle, activities that were completed during the
first cycle are removed from the list. Activities that were not completed will be processed again,
along with new activities added in the meantime.

4. Model and framework for activity execution process
68
Figure 0.22. Lifecycle of basic and extended CPN instance
When the CPN instance is run for the first time, it will become active. The model will run until
it comes to one of two possible states:
- All transitions are fired, and the model goes in the completed state,
- The process comes to the state where there are no tokens to fire the next transition. In
that state, the execution process is not completed, and the instance goes in an inactive
period.
Therefore, CPN models instance lifecycle might have at least three states (instantiation, active
period, completed state). Consequently, two different lifecycles can be differentiated: A
lifecycle with a single active period and a lifecycle with multiple active periods, which could
switch between inactive and active periods. CPN instance always has an odd number of periods.
Suppose there are more than three periods; after an active period goes an inactive period, then
an active period once again. To sum up, after the instantiation period always comes an active
period, after the active period, two possible paths exist, a completed state or an inactive period.
After the inactive period always comes the active period.
Lifecycle with a single active period – A basic CPN instance lifecycle which must have all
the required input information available before the processing even starts because it will fire all
transition in only one active period. When processing is completed, the instance will receive
the ‘completed’ status, and it will not be further processed.
Lifecycle with multiple active periods – If an instance does not have all of the input
information available at the beginning, it is necessary to extend the lifecycle through several
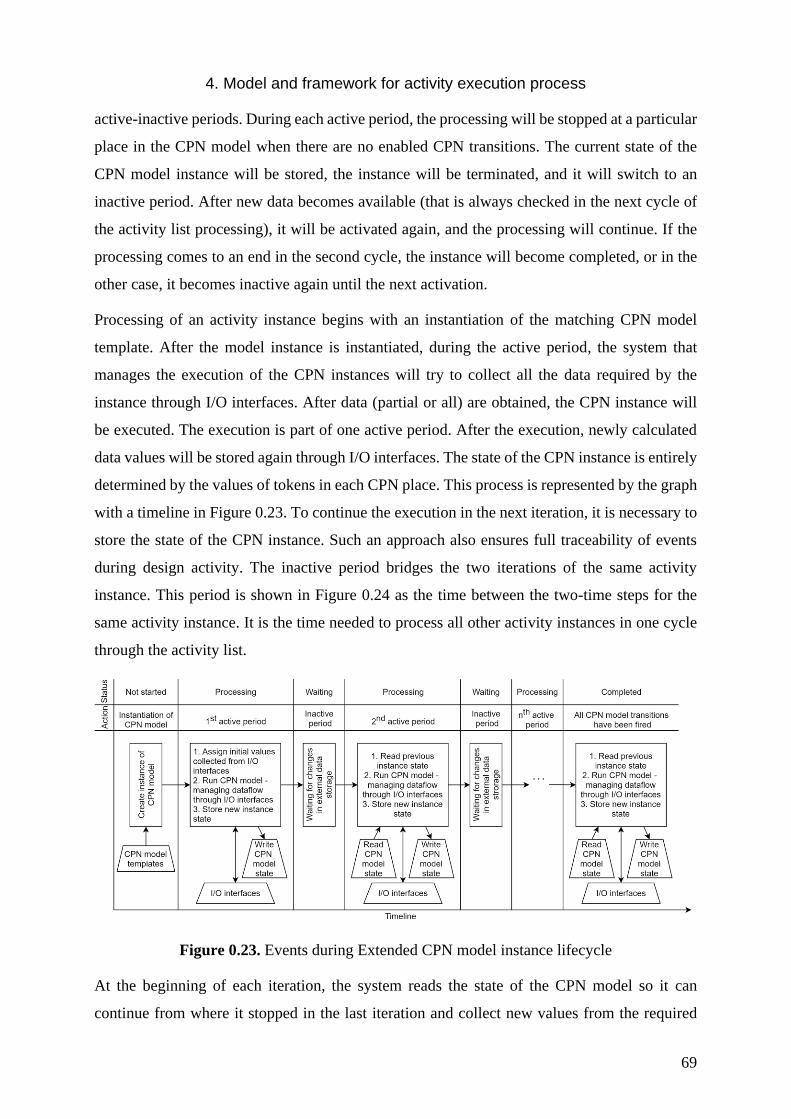
4. Model and framework for activity execution process
69
active-inactive periods. During each active period, the processing will be stopped at a particular
place in the CPN model when there are no enabled CPN transitions. The current state of the
CPN model instance will be stored, the instance will be terminated, and it will switch to an
inactive period. After new data becomes available (that is always checked in the next cycle of
the activity list processing), it will be activated again, and the processing will continue. If the
processing comes to an end in the second cycle, the instance will become completed, or in the
other case, it becomes inactive again until the next activation.
Processing of an activity instance begins with an instantiation of the matching CPN model
template. After the model instance is instantiated, during the active period, the system that
manages the execution of the CPN instances will try to collect all the data required by the
instance through I/O interfaces. After data (partial or all) are obtained, the CPN instance will
be executed. The execution is part of one active period. After the execution, newly calculated
data values will be stored again through I/O interfaces. The state of the CPN instance is entirely
determined by the values of tokens in each CPN place. This process is represented by the graph
with a timeline in Figure 0.23. To continue the execution in the next iteration, it is necessary to
store the state of the CPN instance. Such an approach also ensures full traceability of events
during design activity. The inactive period bridges the two iterations of the same activity
instance. This period is shown in Figure 0.24 as the time between the two-time steps for the
same activity instance. It is the time needed to process all other activity instances in one cycle
through the activity list.
Figure 0.23. Events during Extended CPN model instance lifecycle
At the beginning of each iteration, the system reads the state of the CPN model so it can
continue from where it stopped in the last iteration and collect new values from the required

4. Model and framework for activity execution process
70
data set. During the waiting period, the values of some data may change or be determined for
the first time. Any changes in the data set will cause propagation during the execution of the
CPN model instance. After processing, the system will store new values again and save the
newest state of the CPN model instance. In any iteration, propagation through the CPN instance
could be partial, which means that only some transitions were fired. When all transitions are
fired, the CPN model instance execution process is completed, and the matching activity
instance status is changed to ‘completed’, which means that the process for this activity instance
is stopped.
The activity list is dynamic, which means that new activity instances could be added to the list
at any moment. Adding new instances to the list and as well as removing items when they are
completed affect the length of the list. Since an activity instance could be added at any time to
the list, it can be assumed that one cycle through the activity list could last forever. In a real
working environment, that will never happen. It is assumed that project meetings are held once
a week, and only a small number of activities are defined at one meeting. Hence, it is not
expected that new items will be added to the activity list frequently compared to the duration
of one activity list processing cycle. One cycle through the activity list is the time needed to
process all activity instances just once. The exact time cannot be known since the number of
total activity instances and the number of instances that will be processed (only ones with new
data which was not available in the last cycle) vary from cycle to cycle significantly. One
activity list processing cycle consists of a series of discrete intervals, whereby only one activity
instance is processed in each interval. The duration of one interval is the same as the duration
of the lifecycle with a single active period or the same as one active period in the instances in
the CPN model instances that have a lifecycle with multiple active periods.
After the end of this section, a reader might ask why all instances are not processed
simultaneously and why is inactive period needed at all? It is to expect that in a company, only
one system that manages all activity instances exists. Therefore, it has to process a considerable
number of activities. Each CPN model which is executed consumes computer resources, and it
is realistic that the system would run out of memory. One solution to solve this problem is to
execute CPN model instances sequentially, one after the other. The main drawback in that
approach is that the CPN model instance execution will not continue as soon as new data
becomes available. There is always a time gap from the moment when data become available
until a particular CPN model instance gets its turn to rerun the execution. Another issue with

4. Model and framework for activity execution process
71
this approach is that it is slower since the system needs some time (a matter of seconds) to store
the CPN model instance after each processing and load the other one.
Figure 0.24. Processing of activity list
4.9. Developed CPN model templates
In this section, the CPN model templates will be shown and described to show the extensiveness
of the CPN model templates and the possibilities that the approach can provide. These templates
are presented to show a broad spectre of functionalities that are integrated into other CPN model
templates. The complete models are shown in Appendix B, while here they will be described
gradually, sector by sector.
4.9.1. The model for automatic parameter change
During the meeting reports analysis, it was noticed that often some parameter value has to be
changed. Since the projects were in the early development stage, it can be considered that there
are in the concept development phase of the design process. In that stage, the general
arrangement of components is made. At a meeting, a participant might ask to move a component
5 mm to the front of a vehicle. Or to position the component at 23 mm on z-axis instead of 20
mm, what was the state before. Or the third example, the view angle range has to be changed
in the parameter database. Using the traditional design approach, someone has to save the
current work, close it and open the assembly to change the specific parameter value. With the
implementation of the proposed framework, the design approach could be changed and would
work as follows: An activity to change a value should be defined, afterwards it would be
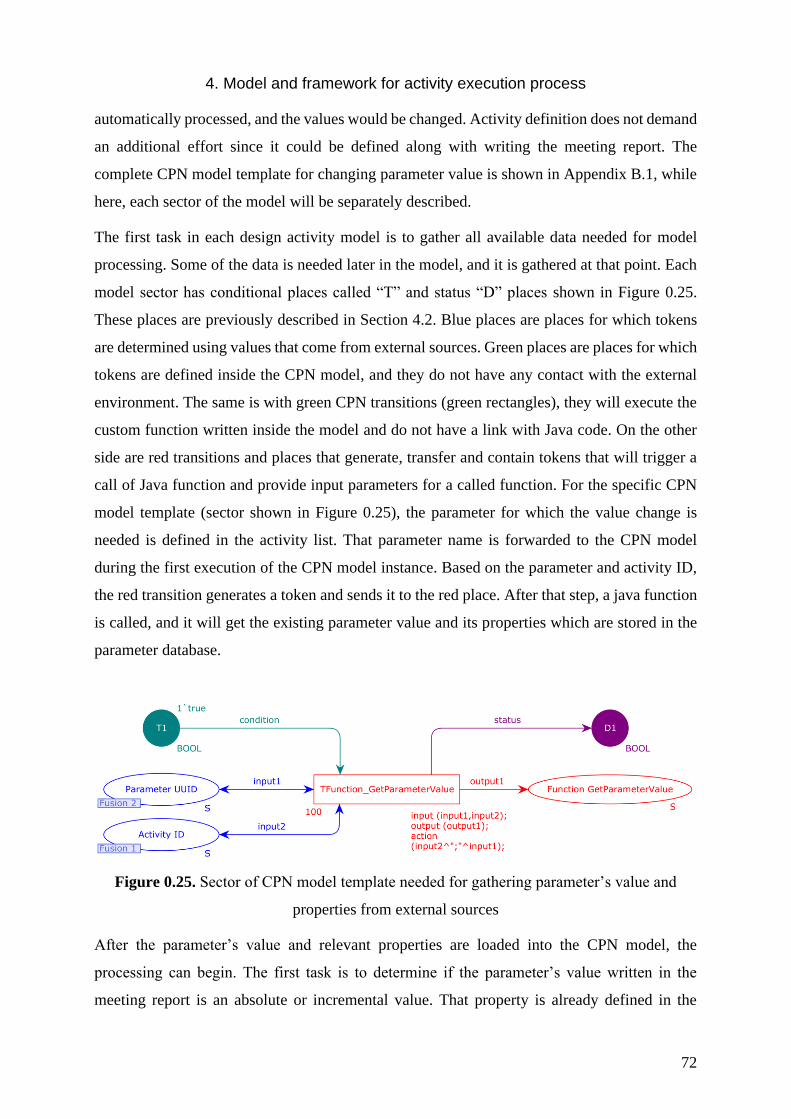
4. Model and framework for activity execution process
72
automatically processed, and the values would be changed. Activity definition does not demand
an additional effort since it could be defined along with writing the meeting report. The
complete CPN model template for changing parameter value is shown in Appendix B.1, while
here, each sector of the model will be separately described.
The first task in each design activity model is to gather all available data needed for model
processing. Some of the data is needed later in the model, and it is gathered at that point. Each
model sector has conditional places called “T” and status “D” places shown in Figure 0.25.
These places are previously described in Section 4.2. Blue places are places for which tokens
are determined using values that come from external sources. Green places are places for which
tokens are defined inside the CPN model, and they do not have any contact with the external
environment. The same is with green CPN transitions (green rectangles), they will execute the
custom function written inside the model and do not have a link with Java code. On the other
side are red transitions and places that generate, transfer and contain tokens that will trigger a
call of Java function and provide input parameters for a called function. For the specific CPN
model template (sector shown in Figure 0.25), the parameter for which the value change is
needed is defined in the activity list. That parameter name is forwarded to the CPN model
during the first execution of the CPN model instance. Based on the parameter and activity ID,
the red transition generates a token and sends it to the red place. After that step, a java function
is called, and it will get the existing parameter value and its properties which are stored in the
parameter database.
Figure 0.25. Sector of CPN model template needed for gathering parameter’s value and
properties from external sources
After the parameter’s value and relevant properties are loaded into the CPN model, the
processing can begin. The first task is to determine if the parameter’s value written in the
meeting report is an absolute or incremental value. That property is already defined in the
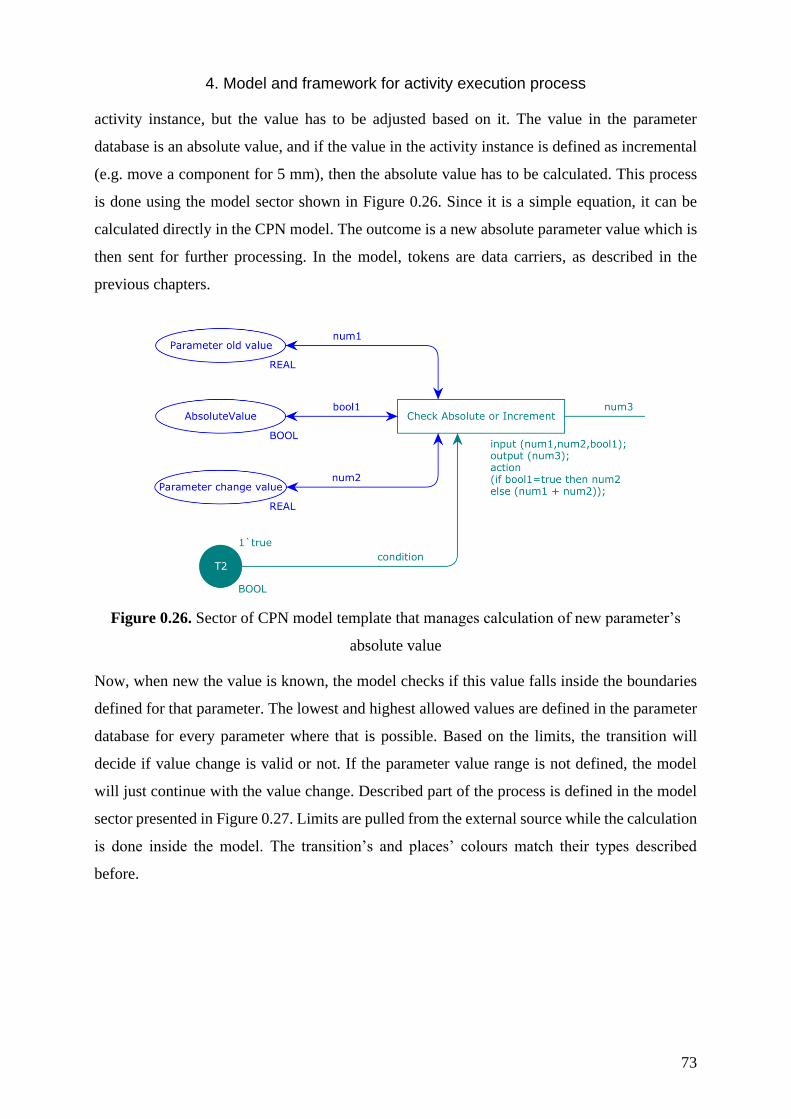
4. Model and framework for activity execution process
73
activity instance, but the value has to be adjusted based on it. The value in the parameter
database is an absolute value, and if the value in the activity instance is defined as incremental
(e.g. move a component for 5 mm), then the absolute value has to be calculated. This process
is done using the model sector shown in Figure 0.26. Since it is a simple equation, it can be
calculated directly in the CPN model. The outcome is a new absolute parameter value which is
then sent for further processing. In the model, tokens are data carriers, as described in the
previous chapters.
Figure 0.26. Sector of CPN model template that manages calculation of new parameter’s
absolute value
Now, when new the value is known, the model checks if this value falls inside the boundaries
defined for that parameter. The lowest and highest allowed values are defined in the parameter
database for every parameter where that is possible. Based on the limits, the transition will
decide if value change is valid or not. If the parameter value range is not defined, the model
will just continue with the value change. Described part of the process is defined in the model
sector presented in Figure 0.27. Limits are pulled from the external source while the calculation
is done inside the model. The transition’s and places’ colours match their types described
before.
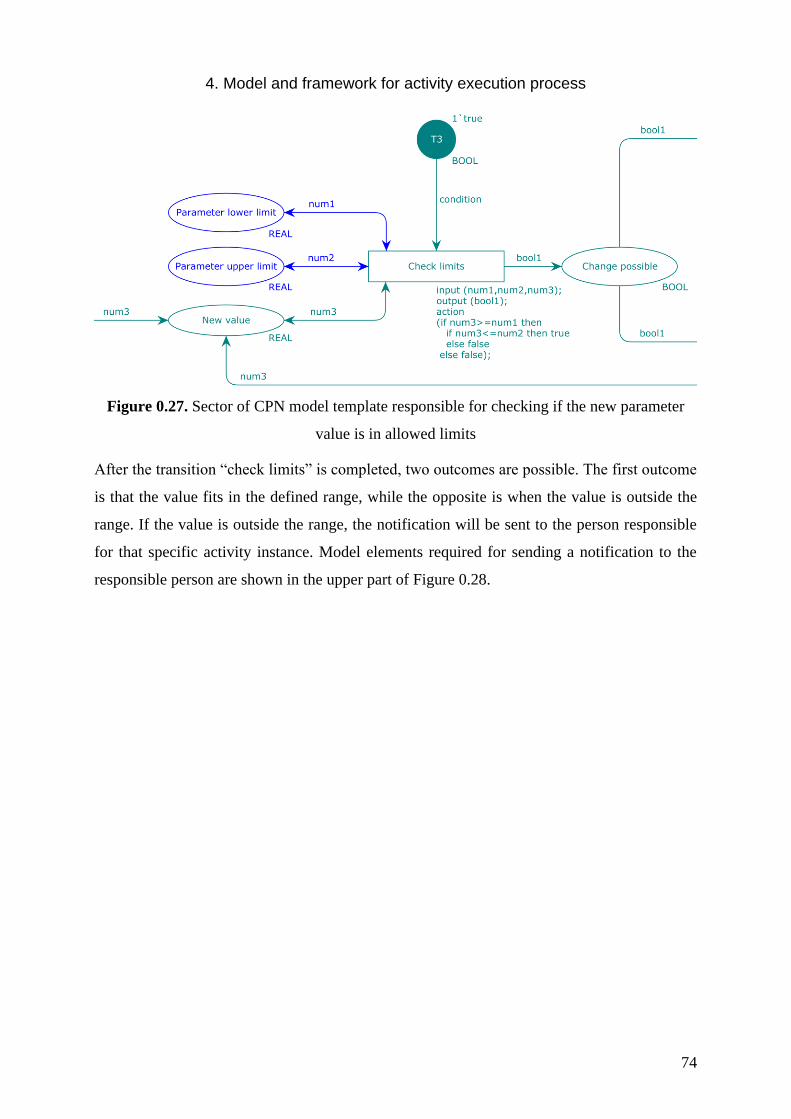
4. Model and framework for activity execution process
74
Figure 0.27. Sector of CPN model template responsible for checking if the new parameter
value is in allowed limits
After the transition “check limits” is completed, two outcomes are possible. The first outcome
is that the value fits in the defined range, while the opposite is when the value is outside the
range. If the value is outside the range, the notification will be sent to the person responsible
for that specific activity instance. Model elements required for sending a notification to the
responsible person are shown in the upper part of Figure 0.28.
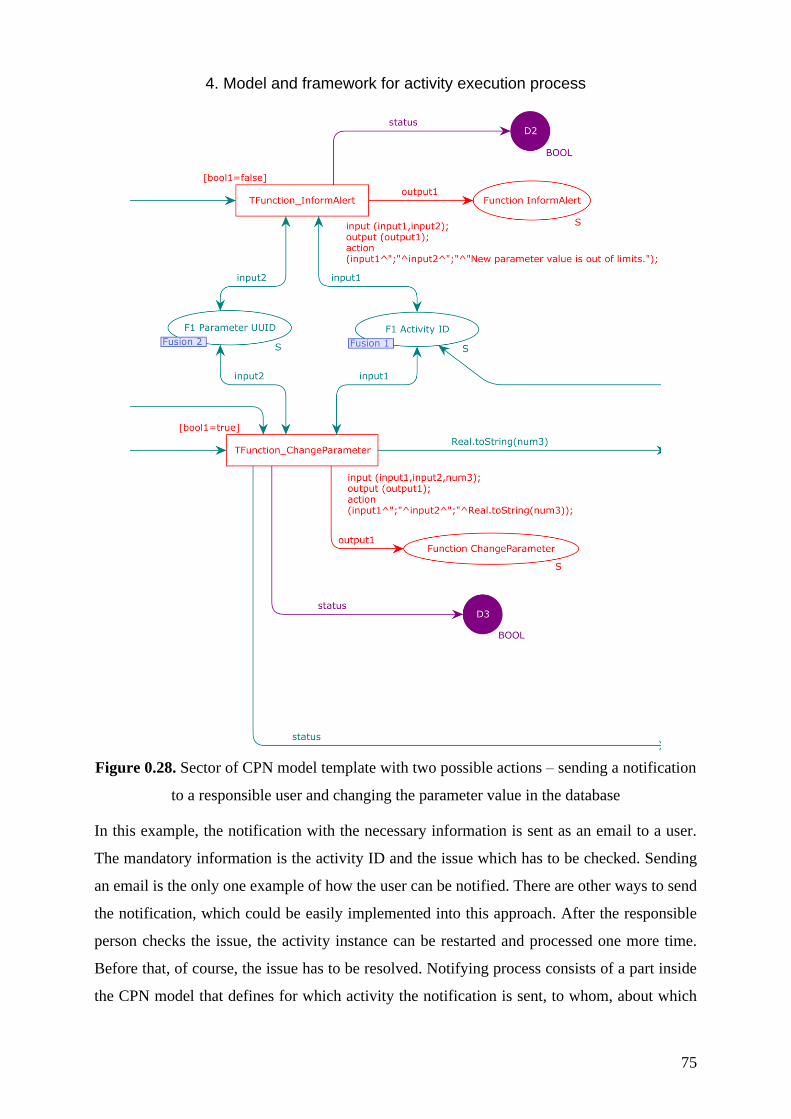
4. Model and framework for activity execution process
75
Figure 0.28. Sector of CPN model template with two possible actions – sending a notification
to a responsible user and changing the parameter value in the database
In this example, the notification with the necessary information is sent as an email to a user.
The mandatory information is the activity ID and the issue which has to be checked. Sending
an email is the only one example of how the user can be notified. There are other ways to send
the notification, which could be easily implemented into this approach. After the responsible
person checks the issue, the activity instance can be restarted and processed one more time.
Before that, of course, the issue has to be resolved. Notifying process consists of a part inside
the CPN model that defines for which activity the notification is sent, to whom, about which
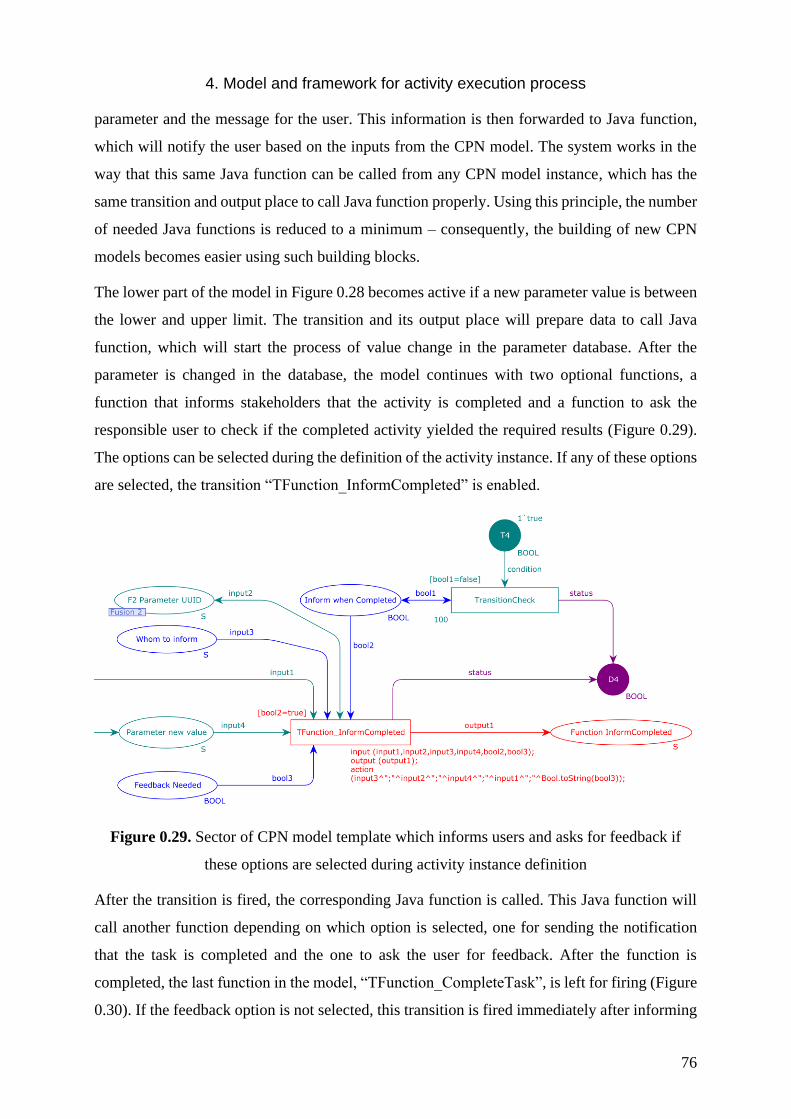
4. Model and framework for activity execution process
76
parameter and the message for the user. This information is then forwarded to Java function,
which will notify the user based on the inputs from the CPN model. The system works in the
way that this same Java function can be called from any CPN model instance, which has the
same transition and output place to call Java function properly. Using this principle, the number
of needed Java functions is reduced to a minimum – consequently, the building of new CPN
models becomes easier using such building blocks.
The lower part of the model in Figure 0.28 becomes active if a new parameter value is between
the lower and upper limit. The transition and its output place will prepare data to call Java
function, which will start the process of value change in the parameter database. After the
parameter is changed in the database, the model continues with two optional functions, a
function that informs stakeholders that the activity is completed and a function to ask the
responsible user to check if the completed activity yielded the required results (Figure 0.29).
The options can be selected during the definition of the activity instance. If any of these options
are selected, the transition “TFunction_InformCompleted” is enabled.
Figure 0.29. Sector of CPN model template which informs users and asks for feedback if
these options are selected during activity instance definition
After the transition is fired, the corresponding Java function is called. This Java function will
call another function depending on which option is selected, one for sending the notification
that the task is completed and the one to ask the user for feedback. After the function is
completed, the last function in the model, “TFunction_CompleteTask”, is left for firing (Figure
0.30). If the feedback option is not selected, this transition is fired immediately after informing
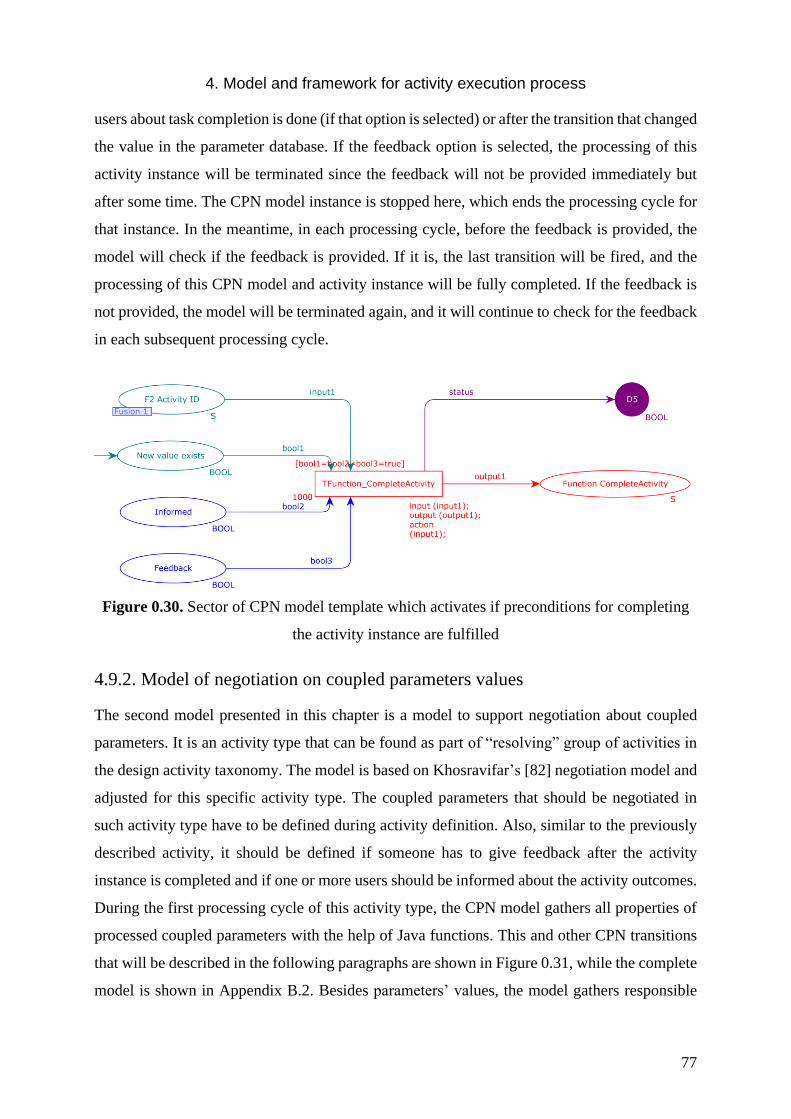
4. Model and framework for activity execution process
77
users about task completion is done (if that option is selected) or after the transition that changed
the value in the parameter database. If the feedback option is selected, the processing of this
activity instance will be terminated since the feedback will not be provided immediately but
after some time. The CPN model instance is stopped here, which ends the processing cycle for
that instance. In the meantime, in each processing cycle, before the feedback is provided, the
model will check if the feedback is provided. If it is, the last transition will be fired, and the
processing of this CPN model and activity instance will be fully completed. If the feedback is
not provided, the model will be terminated again, and it will continue to check for the feedback
in each subsequent processing cycle.
Figure 0.30. Sector of CPN model template which activates if preconditions for completing
the activity instance are fulfilled
4.9.2. Model of negotiation on coupled parameters values
The second model presented in this chapter is a model to support negotiation about coupled
parameters. It is an activity type that can be found as part of “resolving” group of activities in
the design activity taxonomy. The model is based on Khosravifar’s [82] negotiation model and
adjusted for this specific activity type. The coupled parameters that should be negotiated in
such activity type have to be defined during activity definition. Also, similar to the previously
described activity, it should be defined if someone has to give feedback after the activity
instance is completed and if one or more users should be informed about the activity outcomes.
During the first processing cycle of this activity type, the CPN model gathers all properties of
processed coupled parameters with the help of Java functions. This and other CPN transitions
that will be described in the following paragraphs are shown in Figure 0.31, while the complete
model is shown in Appendix B.2. Besides parameters’ values, the model gathers responsible
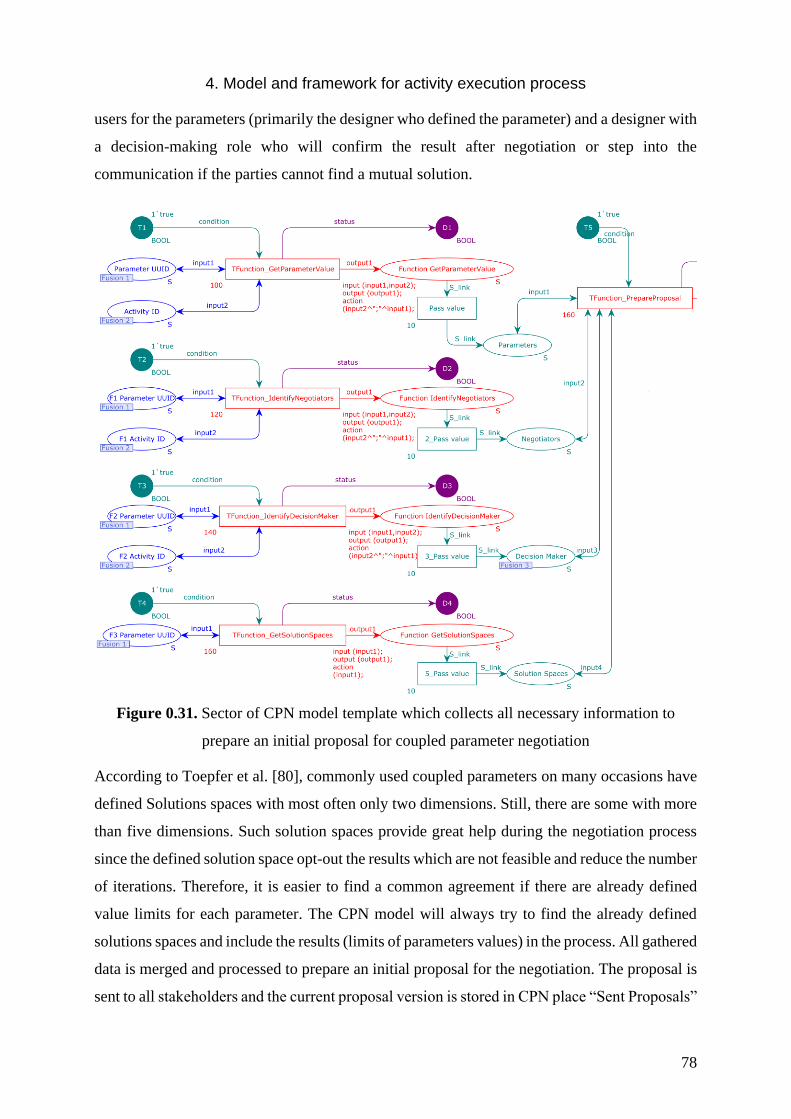
4. Model and framework for activity execution process
78
users for the parameters (primarily the designer who defined the parameter) and a designer with
a decision-making role who will confirm the result after negotiation or step into the
communication if the parties cannot find a mutual solution.
Figure 0.31. Sector of CPN model template which collects all necessary information to
prepare an initial proposal for coupled parameter negotiation
According to Toepfer et al. [80], commonly used coupled parameters on many occasions have
defined Solutions spaces with most often only two dimensions. Still, there are some with more
than five dimensions. Such solution spaces provide great help during the negotiation process
since the defined solution space opt-out the results which are not feasible and reduce the number
of iterations. Therefore, it is easier to find a common agreement if there are already defined
value limits for each parameter. The CPN model will always try to find the already defined
solutions spaces and include the results (limits of parameters values) in the process. All gathered
data is merged and processed to prepare an initial proposal for the negotiation. The proposal is
sent to all stakeholders and the current proposal version is stored in CPN place “Sent Proposals”
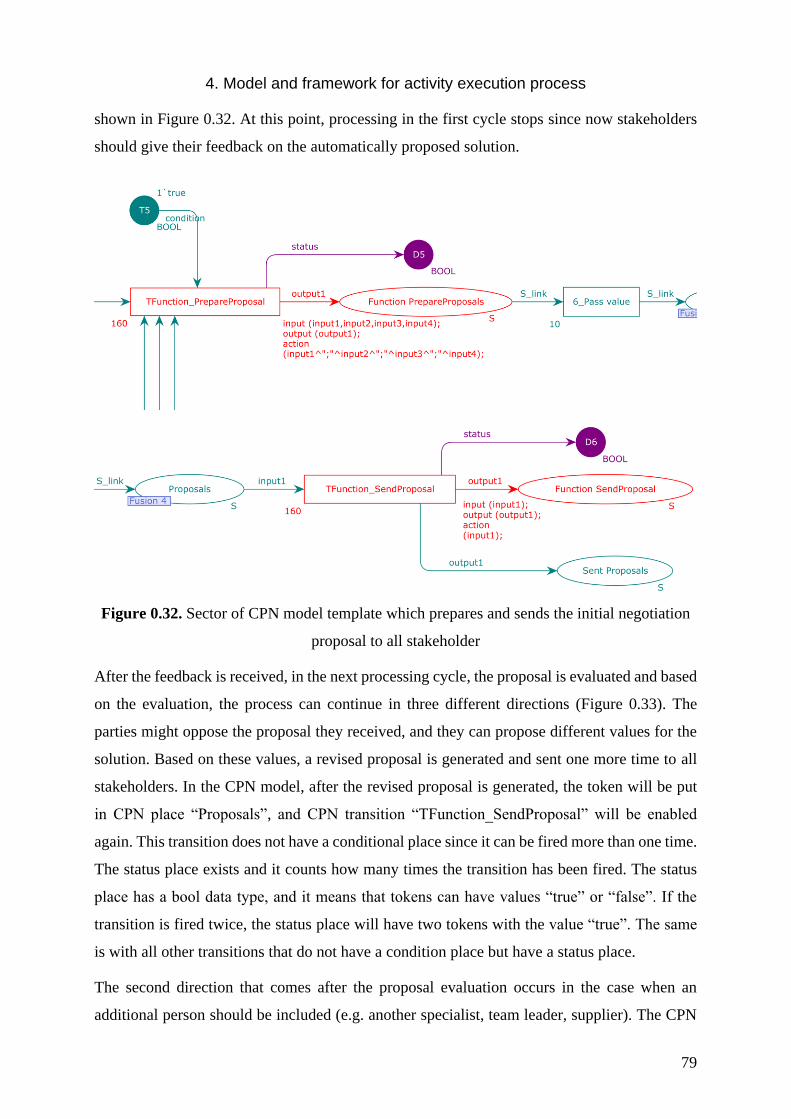
4. Model and framework for activity execution process
79
shown in Figure 0.32. At this point, processing in the first cycle stops since now stakeholders
should give their feedback on the automatically proposed solution.
Figure 0.32. Sector of CPN model template which prepares and sends the initial negotiation
proposal to all stakeholder
After the feedback is received, in the next processing cycle, the proposal is evaluated and based
on the evaluation, the process can continue in three different directions (Figure 0.33). The
parties might oppose the proposal they received, and they can propose different values for the
solution. Based on these values, a revised proposal is generated and sent one more time to all
stakeholders. In the CPN model, after the revised proposal is generated, the token will be put
in CPN place “Proposals”, and CPN transition “TFunction_SendProposal” will be enabled
again. This transition does not have a conditional place since it can be fired more than one time.
The status place exists and it counts how many times the transition has been fired. The status
place has a bool data type, and it means that tokens can have values “true” or “false”. If the
transition is fired twice, the status place will have two tokens with the value “true”. The same
is with all other transitions that do not have a condition place but have a status place.
The second direction that comes after the proposal evaluation occurs in the case when an
additional person should be included (e.g. another specialist, team leader, supplier). The CPN
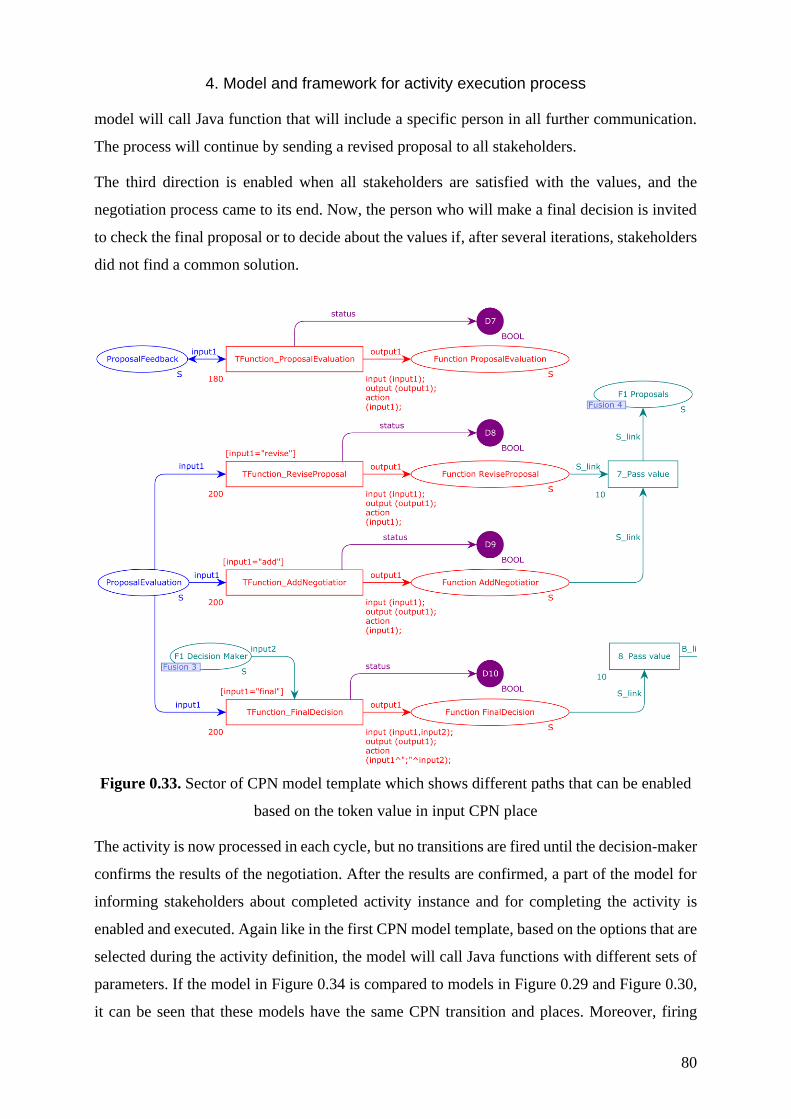
4. Model and framework for activity execution process
80
model will call Java function that will include a specific person in all further communication.
The process will continue by sending a revised proposal to all stakeholders.
The third direction is enabled when all stakeholders are satisfied with the values, and the
negotiation process came to its end. Now, the person who will make a final decision is invited
to check the final proposal or to decide about the values if, after several iterations, stakeholders
did not find a common solution.
Figure 0.33. Sector of CPN model template which shows different paths that can be enabled
based on the token value in input CPN place
The activity is now processed in each cycle, but no transitions are fired until the decision-maker
confirms the results of the negotiation. After the results are confirmed, a part of the model for
informing stakeholders about completed activity instance and for completing the activity is
enabled and executed. Again like in the first CPN model template, based on the options that are
selected during the activity definition, the model will call Java functions with different sets of
parameters. If the model in Figure 0.34 is compared to models in Figure 0.29 and Figure 0.30,
it can be seen that these models have the same CPN transition and places. Moreover, firing
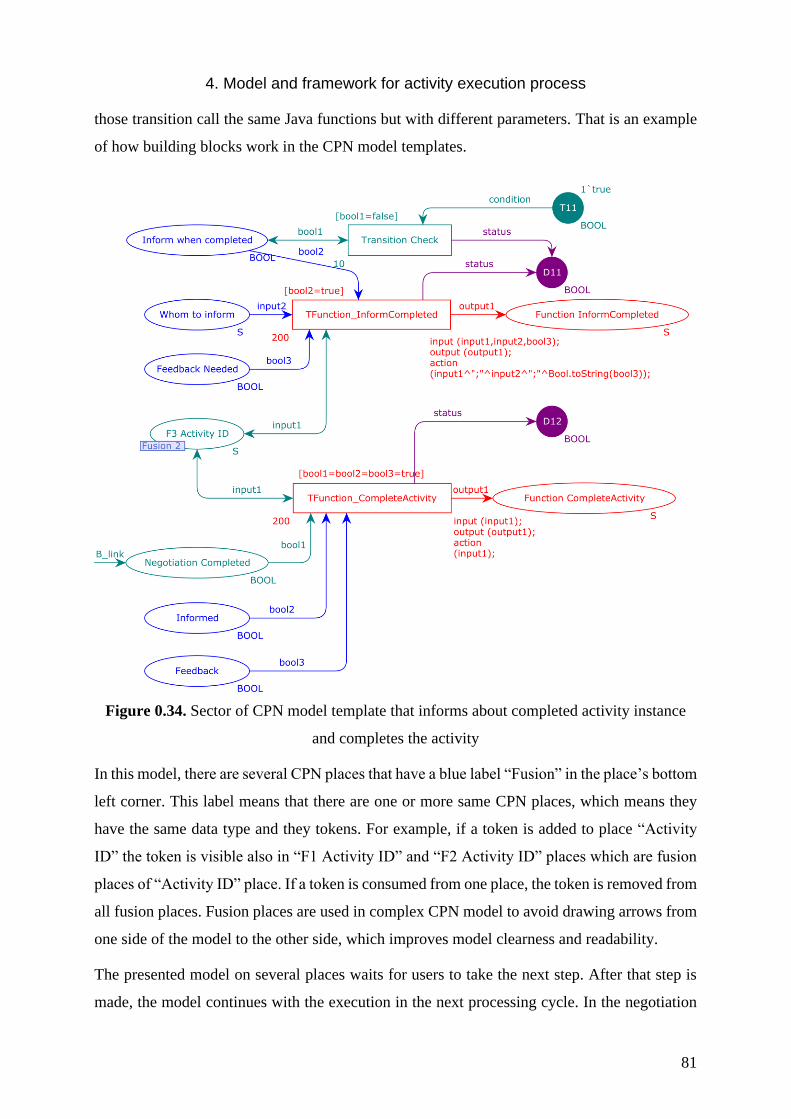
4. Model and framework for activity execution process
81
those transition call the same Java functions but with different parameters. That is an example
of how building blocks work in the CPN model templates.
Figure 0.34. Sector of CPN model template that informs about completed activity instance
and completes the activity
In this model, there are several CPN places that have a blue label “Fusion” in the place’s bottom
left corner. This label means that there are one or more same CPN places, which means they
have the same data type and they tokens. For example, if a token is added to place “Activity
ID” the token is visible also in “F1 Activity ID” and “F2 Activity ID” places which are fusion
places of “Activity ID” place. If a token is consumed from one place, the token is removed from
all fusion places. Fusion places are used in complex CPN model to avoid drawing arrows from
one side of the model to the other side, which improves model clearness and readability.
The presented model on several places waits for users to take the next step. After that step is
made, the model continues with the execution in the next processing cycle. In the negotiation

4. Model and framework for activity execution process
82
process, it is expected that more than one iteration will be needed until all stakeholders agree
on the values they are discussing. Taking this fact into consideration, the time to complete this
activity might vary from a few hours to even a few months. During all this time, the activity
instance is processed in every cycle, but no transitions are fired. Moreover, all this time, the
activity instance exists in the activity list. On the other hand, in the first CPN model template,
which changes a parameter value in the database, and if no feedback is needed, the activity
instance can be completed in a matter of seconds.
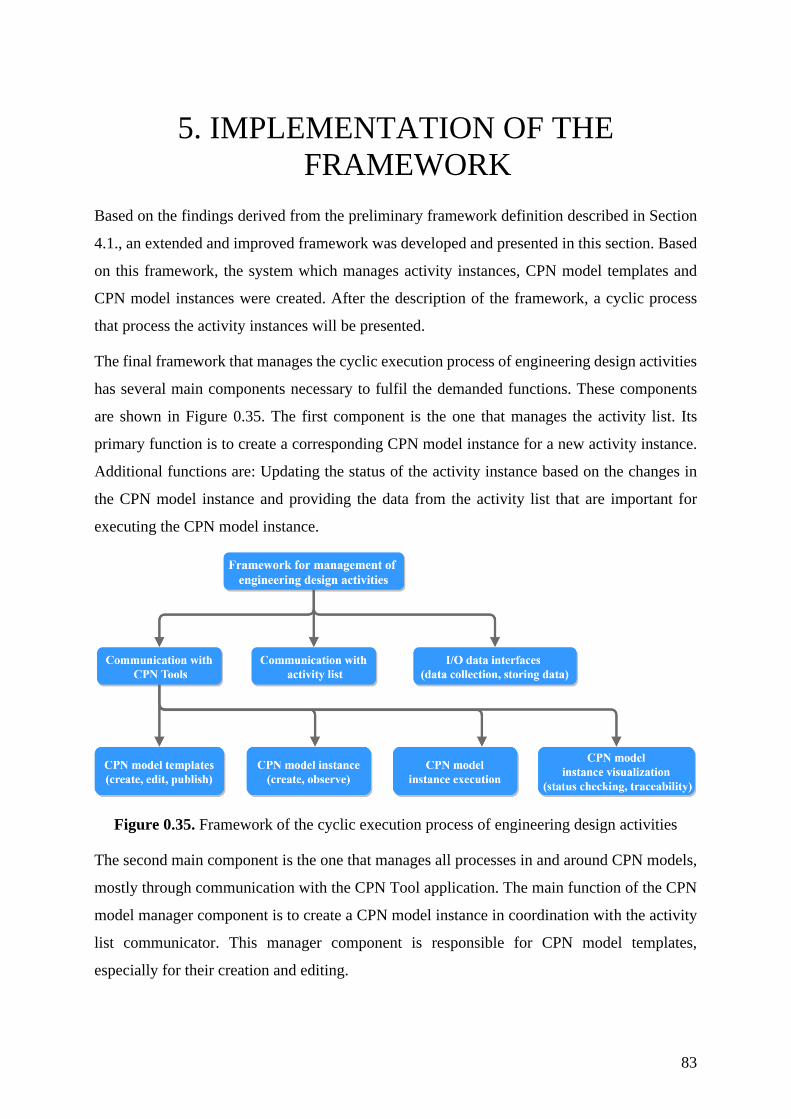
83
5. IMPLEMENTATION OF THE
FRAMEWORK
Based on the findings derived from the preliminary framework definition described in Section
4.1., an extended and improved framework was developed and presented in this section. Based
on this framework, the system which manages activity instances, CPN model templates and
CPN model instances were created. After the description of the framework, a cyclic process
that process the activity instances will be presented.
The final framework that manages the cyclic execution process of engineering design activities
has several main components necessary to fulfil the demanded functions. These components
are shown in Figure 0.35. The first component is the one that manages the activity list. Its
primary function is to create a corresponding CPN model instance for a new activity instance.
Additional functions are: Updating the status of the activity instance based on the changes in
the CPN model instance and providing the data from the activity list that are important for
executing the CPN model instance.
Figure 0.35. Framework of the cyclic execution process of engineering design activities
The second main component is the one that manages all processes in and around CPN models,
mostly through communication with the CPN Tool application. The main function of the CPN
model manager component is to create a CPN model instance in coordination with the activity
list communicator. This manager component is responsible for CPN model templates,
especially for their creation and editing.
5. Implementation of the framework
84
The same component checks which activity instance is the next on the list for executing and if
there is new data available for the specific CPN model instance. Gathering new data is the task
of the I/O data interfaces component.
CPN model manager component also reads the last saved state of the specific CPN model
instance before it is executed and stores a new state after the execution is completed. The
component provides support for the visualisation of a CPN model instance if a user wants to
verify the state of the specific instance or to find out what values are used in previously fired
CPN transitions. Using this component, the user can check where a delay in execution might
occur (e.g. what data is missing, who did not update the data).
The framework processes the activity instances in the sequence in which they appear in the
activity list. The list is prepared based on a weekly meeting of project teams. How the list is
created is not important for the framework; it expects the structured activity list as an input
resource. The activity list can be updated at any time and it does not affect the functioning of
the other processes. The processes run continuously, assuming that most updates of the activity
list will be conducted after the weekly project meetings.
Software components of the proposed framework have been developed in Java programming
language because that is the best option for solving data transfers and connection between CPN
Tools which manages CPN models and procedures developed as I/O data interfaces to data
sources (e.g. PDM, parameter database).
The cyclic execution process (Figure 0.36), which runs based on the described framework,
fulfils the following functions in one processing cycle:
• Parses the activity list and takes the next uncompleted activity instance for the
processing,
• Recognises the type of activity instance based on the taxonomy,
• Opens the last stored version of the CPN model instance. The system stores all versions
of each instance. If the instance was never processed, it would create a new CPN model
instance.
• Collects all required and available data based on the current progress of the currently
processed instance. Data is collected through I/O interfaces connected to the system,
and in the next step, data is assigned to corresponding tokens in the CPN model. The
structure of a CPN template defines from which source data should be collected.
5. Implementation of the framework
85
• If there is an enabled transition in the current active instance, the system fires it. If there
are no enabled transitions, the system stores this instance and goes for the next activity
on the list.
• If any transition is fired, the system stores the status and newly created values and
checks if there is another enabled transition. If there is any, it will be fired. If there is
none, the system will check if there is new available data to be assigned to the tokens.
In the case of new data, the enabled transition would be fired and in case of no new
data, the instance would be stored, and this cycle would be finished.
One of the important features of the developed processing algorithm is that when a CPN model
instance finishes the execution, its state is saved at the end of its processing cycle. In the next
cycle, the saved state of the instance is loaded and executed again. Such a solution, which
divides and runs the whole process in discrete steps, was chosen because a larger number of
simultaneously active CPN models, which are relatively complex, would require excessive
computer resources.
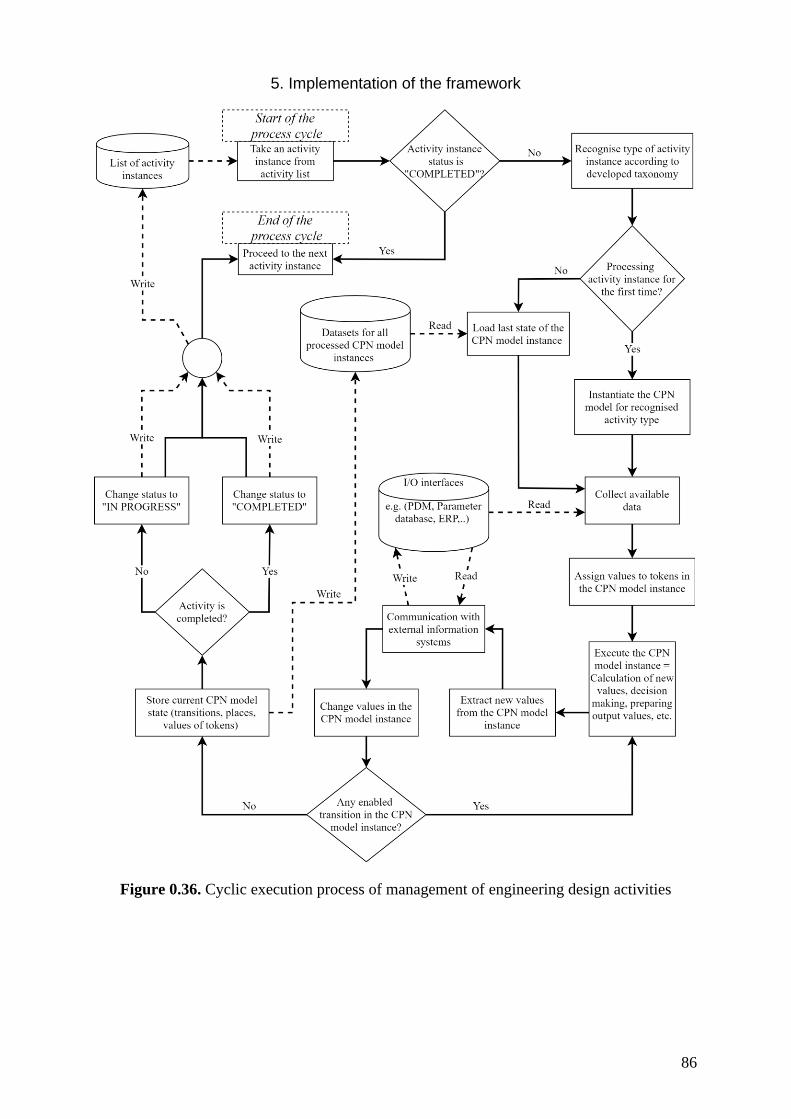
5. Implementation of the framework
86
Figure 0.36. Cyclic execution process of management of engineering design activities
5. Implementation of the framework
87
5.1. Software components
The software components and the process algorithm of the framework are developed in Java
programming language. In designed solution is designed that all processes regarding the
activity list, activity instances and CPN model instances work continuously on a server-side.
On the other hand, each user can access a web-based application to give instructions (based on
his or her role) that will run processes on the server-side. This section will provide details about
the software components that are needed for the realisation of such a solution concept.
The complete software solution consists of the following main components:
1. Procedures that manage processes at the level of the whole solution
2. Procedures specific to each CPN model type
3. Procedures that manage the activity list
4. Procedures that establish and support communication with CPN Tools
5. Procedures that enable communication with databases (e.g. PDM, parameter database,
ERP)
6. Procedures that enable a user to observe, check and visualise the activity execution
progress
5.1.1. Procedures that manage the whole solution
The software solution consists of two main components: The front-end user application and
processes that run on a server. The user application is a web-based application where the user
can log in, check the progress of activity instances depending on the user’s role (e.g. engineer,
team leader, project leader), add new activity instance on the activity list, manage the activity
list, visualise CPN model instance or receive notification from a CPN model instance. Since
the application is web-based, it should not be demanding to implement it into the existing
company’s intranet portal.
The main processes which are the core of this framework run on the server-side, and there are
several reasons for that decision:
4. All databases needed for this solution run on the server-side,
• More than one user has access to the specific CPN model instance,

5. Implementation of the framework
88
• All processes run in real-time,
• CPN Tools application requires a lot of random-access memory for executing complex
CPN models, and
• It should be easier to install and maintain the solution.
The next several subsections are devoted to software components that run on the server-side
and which are required to run the proposed solution.
5.1.2. Procedures specific to each CPN model type
During the previous sections, it has been shown that each CPN model is used for a specific
purpose. That purpose is defined by the structure of a CPN model template using sets of CPN
transitions and places that function as an extended process workflow. In order to distinguish
these models from simple workflows, for each transition, the user is able to define a custom
function that enhances the features of the CPN model. These user-defined functions are built-
in in the CPN model, and they are defined already in CPN model templates. To write user-
defined functions, a functional programming language called SML is used. These functions
change data provided through tokens on the input side (input CPN place) of a transition and
provide results on the output side of the same transition. If a transition demands data that is not
already in the CPN model, it can be accessed using Java connector and procedures defined in
Java environment. These procedures have access to I/O interfaces and can pull and push data
to databases using APIs (Application Programming Interface).
If a CPN model needs data from external sources, the CPN model will have a transition that
will put a token in the corresponding output CPN place after firing. The token’s value consists
of the name of the Java function that should be called and the input parameter for that function.
If the function completes successfully, it will place a token in the corresponding place in the
CPN model. The example of such a CPN model segment is shown in Figure 0.37.
5.1.3. Procedures that manage activity list
The activity list is a very important component of the system. For the purpose of this research,
the activity list is modelled and recorded as a spreadsheet with a defined structure. It is a
component necessary at the beginning and also at the end of each CPN model instance
processing cycle. Besides these functions, it is needed to store new activities that emerged in
the meantime after the processing has started.
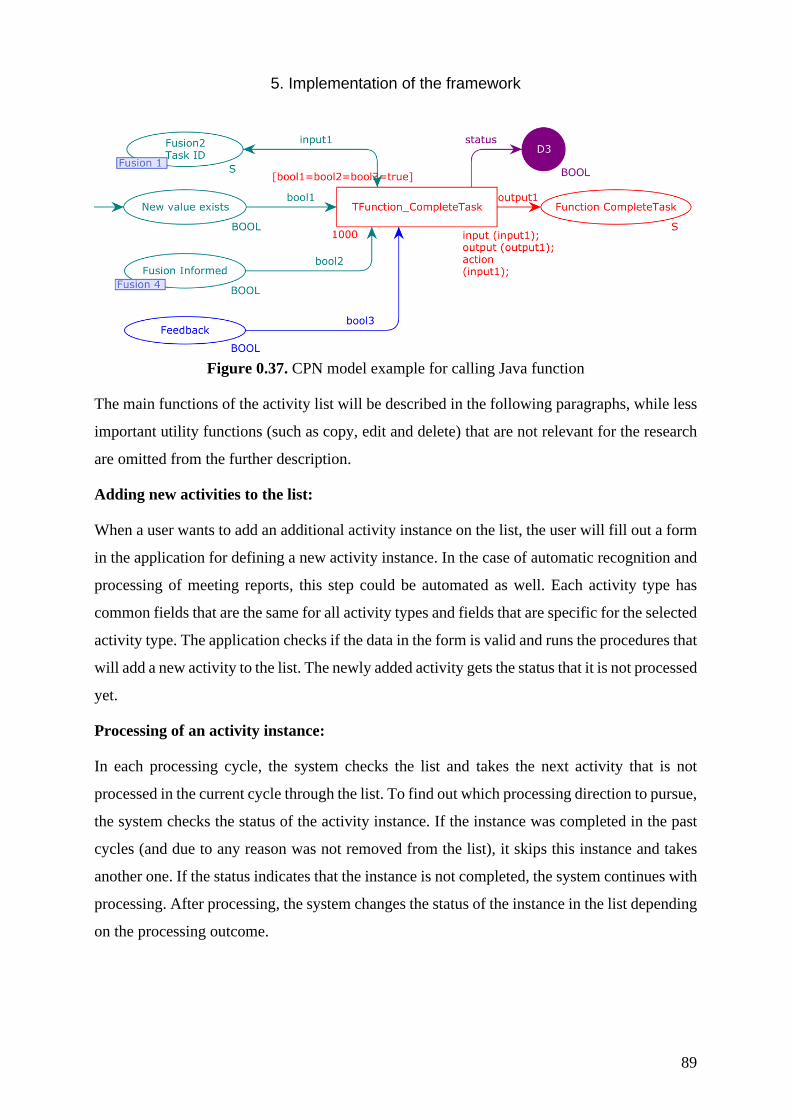
5. Implementation of the framework
89
Figure 0.37. CPN model example for calling Java function
The main functions of the activity list will be described in the following paragraphs, while less
important utility functions (such as copy, edit and delete) that are not relevant for the research
are omitted from the further description.
Adding new activities to the list:
When a user wants to add an additional activity instance on the list, the user will fill out a form
in the application for defining a new activity instance. In the case of automatic recognition and
processing of meeting reports, this step could be automated as well. Each activity type has
common fields that are the same for all activity types and fields that are specific for the selected
activity type. The application checks if the data in the form is valid and runs the procedures that
will add a new activity to the list. The newly added activity gets the status that it is not processed
yet.
Processing of an activity instance:
In each processing cycle, the system checks the list and takes the next activity that is not
processed in the current cycle through the list. To find out which processing direction to pursue,
the system checks the status of the activity instance. If the instance was completed in the past
cycles (and due to any reason was not removed from the list), it skips this instance and takes
another one. If the status indicates that the instance is not completed, the system continues with
processing. After processing, the system changes the status of the instance in the list depending
on the processing outcome.

5. Implementation of the framework
90
Visualisation of an activity instance:
A user can on-demand check the progress of a particular activity instance. The activity list
stores links to every activity instance version created after each processing cycle and thus
ensures full traceability. After the instance and version are selected, the system opens the CPN
model instance version in CPN Tools allowing the user to observe the state of each CPN
transition, place and tokens at the end of the selected processing cycle (end of the active period
according to Figure 0.24).
5.1.4. Procedures for data transfer and communication with external data
sources
CPN model instances, as well as the other components of software solution, have to establish
bidirectional data transfer with external data sources in order to run the whole process properly.
These sources can be various, from collections of CAD parts, assemblies and configurations
(e.g. PDM) to users, teams and interested groups (e.g. ERP). Each CPN model type uses some
of these sources for its work. Models can use just one or maybe all of the available data sources.
Which of them will they use is defined in the CPN model template. The CPN model itself can
not access those sources, but it can demand information from them. After the demand is
established, the procedures written in Java will take this demand and make a query to get
information from the specific source. Since this research is created in a limited environment,
most of the sources are modelled as excel spreadsheets and textual documents. To confirm that
a connection to the real databases is feasible, a testing copy of a parameter database has been
created, and a bidirectional connection between the database and the solution was established.
Besides connections to data sources, the developed solution has an option to access email
services and calendars in order to send necessary notifications to users (e.g. to schedule an
appointment, to notify about activity changes).
5.1.5. Procedures that establish and support communication with CPN Tools
CPN Tools is an application used to create CPN model templates and execute CPN model
instances. The developed solution stores all versions of instances after each CPN model
processing, and therefore, full traceability can be realised. Any version of an instance can be
checked, restored and visualised. CPN Tools is a 3rd party application whose user interface is
developed using Java programming language, but the mathematical core of Coloured Petri Nets
is still based on SML programming language.
5. Implementation of the framework
91
Along with CPN Tools, their developers created Access CPN, a collection of procedures that
enable connection from any other application to CPN Tools. This connection allows creating
of CPN models, editing, simulating and visualisation. Basically, any function inside CPN Tools
can be activated through Access CPN. Therefore, a connection to CPN Tools was not developed
in the scope of this research. On the contrary, already developed procedures are included and
enriched in this solution.
When a CPN model instance has to be executed, a proxy will be created to run the CPN Tools
process. After the cycle shown in Figure 0.36 is completed for one instance, the application will
order CPN Tools to close the current CPN model instance and to wait until the next cycle
begins.
5.1.6. Procedures that enable a user to observe, check and visualize activity
execution progress
In the previous subsections, visualization of activity instances and their versions were
introduced. After a user selects the activity instance and its version, the CPN model instance
opens in the CPN Tools application. Using this functionality, the user is able to check the
progress of the activity instance. If some instance is stuck or is inactive for a long time due to
missing data, the user can easily check which data is missing and thus speed up the whole
process. Also, in some cases, it can be needed that the user should decide in which direction the
CPN model will continue. Another reason for using this function can be for knowledge
capturing since values in all input and output places will stay written in the CPN model, and
thus, it is easy to go back in time to verify and examine the past decisions.
5.2. Implementation issues and challenges of CPN models
5.2.1. Interaction between user and CPN model
Some CPN models for particular kinds of design activities demand user interaction. When such
kind of model is started and until the user does not provide information, CPN models instance
will undergo eventless cycles. In these cycles, the instance is started, the system checks if there
is new data, but since there is not, the instance will be terminated. The possibility of interaction
with the user is not directly within CPN model instance. The user usually even does not see the
CPN model instance. The needed information usually can be found in external data sources.
Therefore, in most cases, the user will actually change a value in an application he is using (e.g.
CAD, CAE, process planner) and that value will be stored in some database. In the next
5. Implementation of the framework
92
processing cycle, the CPN model instance will check that database and pull the value it needs
to continue executing the CPN model instance.
5.2.2. Support for additional activity types
The solution developed in the scope of this research does not support all activity types defined
in the developed taxonomy Figure 0.9. Moreover, there is a great possibility that a new activity
type will be added to the design activity taxonomy in future research. For those future activities,
there are no existing CPN model templates. Therefore, a user is able to create new CPN model
templates for additional activity types. But it is not enough to solely develop a new CPN model
template since all of them require procedures that are specific to each activity type. This process
can be simplified by using building blocks, which are further described in the next subsections.
5.2.3. Partial reuse of CPN model templates
If there is a demand for a new CPN model template, it can be created easily using the parts of
already existing templates. Templates created in this research are modelled in the way that each
functional part of one template is grouped together and has connections to the other group in
the same model. That way, groups are separated and can be easily copied to some other CPN
model. Those groups can be seen as building blocks.
One might ask what is then happening with customized functions that are specific to each CPN
model type? As long as the name of the transition, which has an underlying user-defined
function, remains the same, there will be no problems.
5.2.4. Hierarchy of CPN model templates
To further contribute to the concept of building blocks, another useful feature of CPN
methodology is a hierarchy of CPN models. Each functional group can be defined as one sub-
model on the lower level of the hierarchy. Sub-models are then physically separated from the
main model, and their further usage is even simpler.
Here is presented one simple example of calculating two related functions to explain better the
hierarchy and reuse of CPN model templates. One task is to sum up two integer number. The
other task is to multiply the result from the first task with the third number.
Here is a solution with two separated CPN models. Model A, a solution for the first task and
model B for the second task. After the first task is completed, the user should write a value for
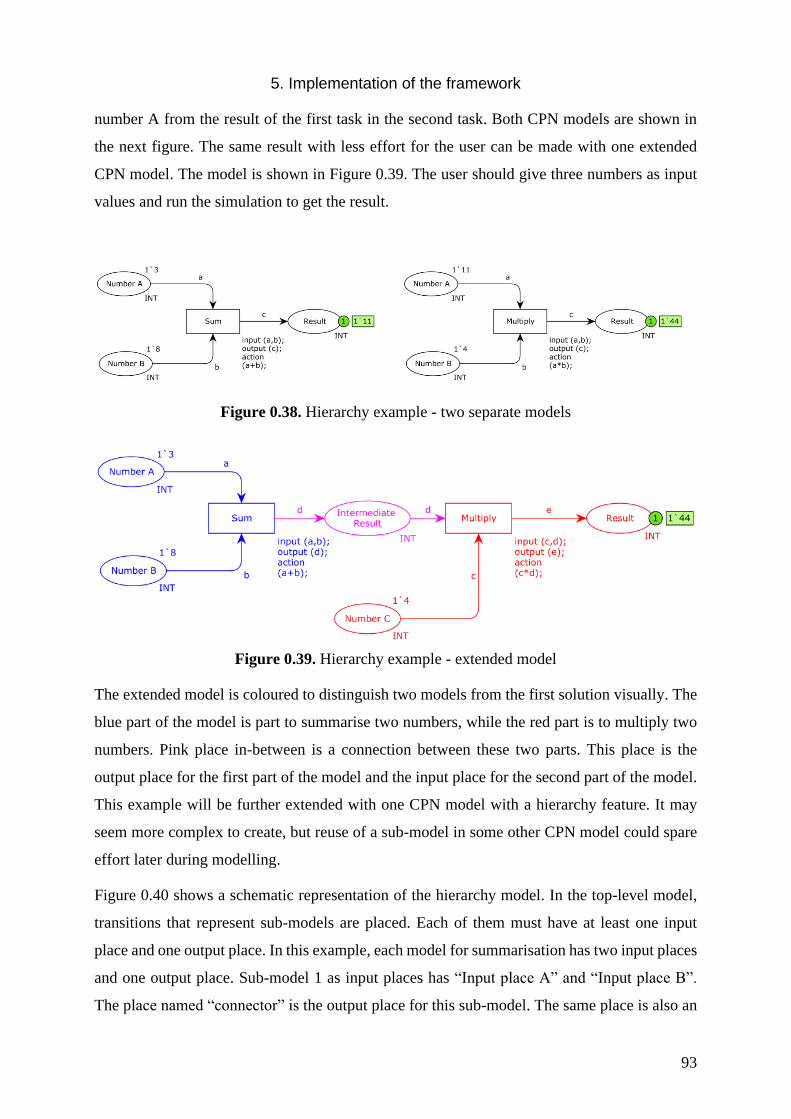
5. Implementation of the framework
93
number A from the result of the first task in the second task. Both CPN models are shown in
the next figure. The same result with less effort for the user can be made with one extended
CPN model. The model is shown in Figure 0.39. The user should give three numbers as input
values and run the simulation to get the result.
Figure 0.38. Hierarchy example - two separate models
Figure 0.39. Hierarchy example - extended model
The extended model is coloured to distinguish two models from the first solution visually. The
blue part of the model is part to summarise two numbers, while the red part is to multiply two
numbers. Pink place in-between is a connection between these two parts. This place is the
output place for the first part of the model and the input place for the second part of the model.
This example will be further extended with one CPN model with a hierarchy feature. It may
seem more complex to create, but reuse of a sub-model in some other CPN model could spare
effort later during modelling.
Figure 0.40 shows a schematic representation of the hierarchy model. In the top-level model,
transitions that represent sub-models are placed. Each of them must have at least one input
place and one output place. In this example, each model for summarisation has two input places
and one output place. Sub-model 1 as input places has “Input place A” and “Input place B”.
The place named “connector” is the output place for this sub-model. The same place is also an

5. Implementation of the framework
94
input place for sub-model 2. The other input place for this sub-model is “Input place C”. Output
place of the second sub-model is the place named “Result”. Each sub-model is then modelled
as a separate CPN model. The general reason to use hierarchy is to make the CPN model easier
to follow and understand by dividing it into smaller parts. In this research, sub-models are also
used as building blocks during the creation of new CPN model templates. It is important that a
sub-model always has exactly the same number and type of input and output places.
Figure 0.40. Schematic representation of hierarchy CPN model
The following figure shows a top-level model of the hierarchy example. It can be noticed that
the model is slightly changed in comparison with the model in Figure 0.39. Transition on top-
level are representations of sub-models, and they are shown as rectangles with double border.
Above the border is the name of the corresponding sub-model.
Figure 0.41. Hierarchy example - top-level model
Each sub-model is now a separate CPN model on the lower level. To make the example a bit
more complex, each sub-model now has an additional “dummy” place and transition. These
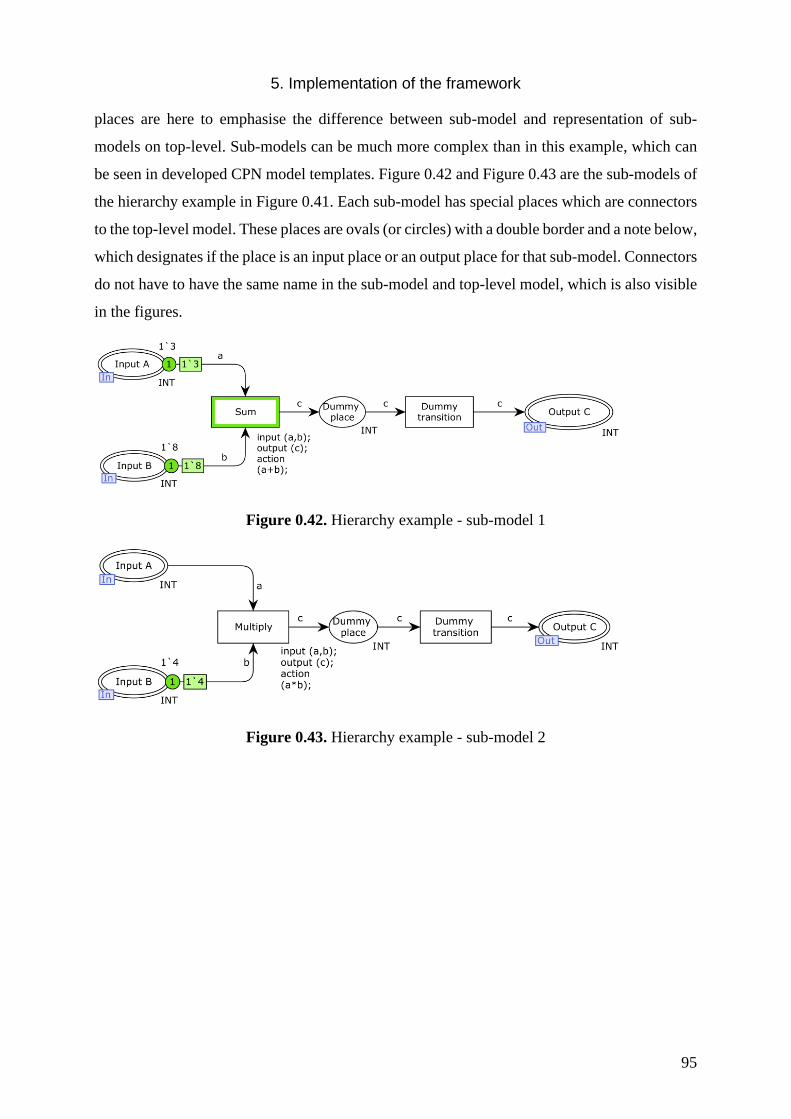
5. Implementation of the framework
95
places are here to emphasise the difference between sub-model and representation of sub-
models on top-level. Sub-models can be much more complex than in this example, which can
be seen in developed CPN model templates. Figure 0.42 and Figure 0.43 are the sub-models of
the hierarchy example in Figure 0.41. Each sub-model has special places which are connectors
to the top-level model. These places are ovals (or circles) with a double border and a note below,
which designates if the place is an input place or an output place for that sub-model. Connectors
do not have to have the same name in the sub-model and top-level model, which is also visible
in the figures.
Figure 0.42. Hierarchy example - sub-model 1
Figure 0.43. Hierarchy example - sub-model 2
96
6. FRAMEWORK VALIDATION
To confirm that hypothesis defined after the preliminary literature review is valid and to check
if all assumptions were correct, the validation of the proposed CSCW enhancement should be
performed. The chapter also provides insights into the applicability and usefulness of the
developed enhancement, which correlates with the Descriptive Study II stage of DRM. The
validation has been carried out on two case studies. The projects used in the case studies have
a different scope but also differ in their characteristics which are described in the following
sections.
6.1. Validation of the framework based on CPN methodology
The purpose of this section is to present the results of a case study that has been designed to
validate the proposed CSCW enhancement, including the developed framework and associated
cyclic process for engineering design activity execution. This case study gives the answer to
whether the proposed framework based on the elements of the taxonomy of engineering design
activities can work with CPN methodology to semi-automate design activities. Within this case
study, it will be confirmed if usage of the presented CSCW enhancement supports design
engineers and to what extent. Time spent for the execution of activities that are commonly
conducted during product development (such as negotiation about parameters, change of
parameter value, informing about change that has been made) will be compared with the time
needed to execute the same activities using the proposed enhancement.
In Section 4.9 could be noticed that CPN templates consist of certain parts that are the same for
all other CPN models. For example, all CPN templates contain a part that will conclude the
activity instance once it is executed. Therefore, this case study includes three different activity
types (consequently also three different CPN templates) that are part of the design activity
taxonomy defined in this research. The activity types (taxonomy entities) are listed in Table
0.11. To identify these entities later in tables, the taxonomy entity ID column is added in the
table.
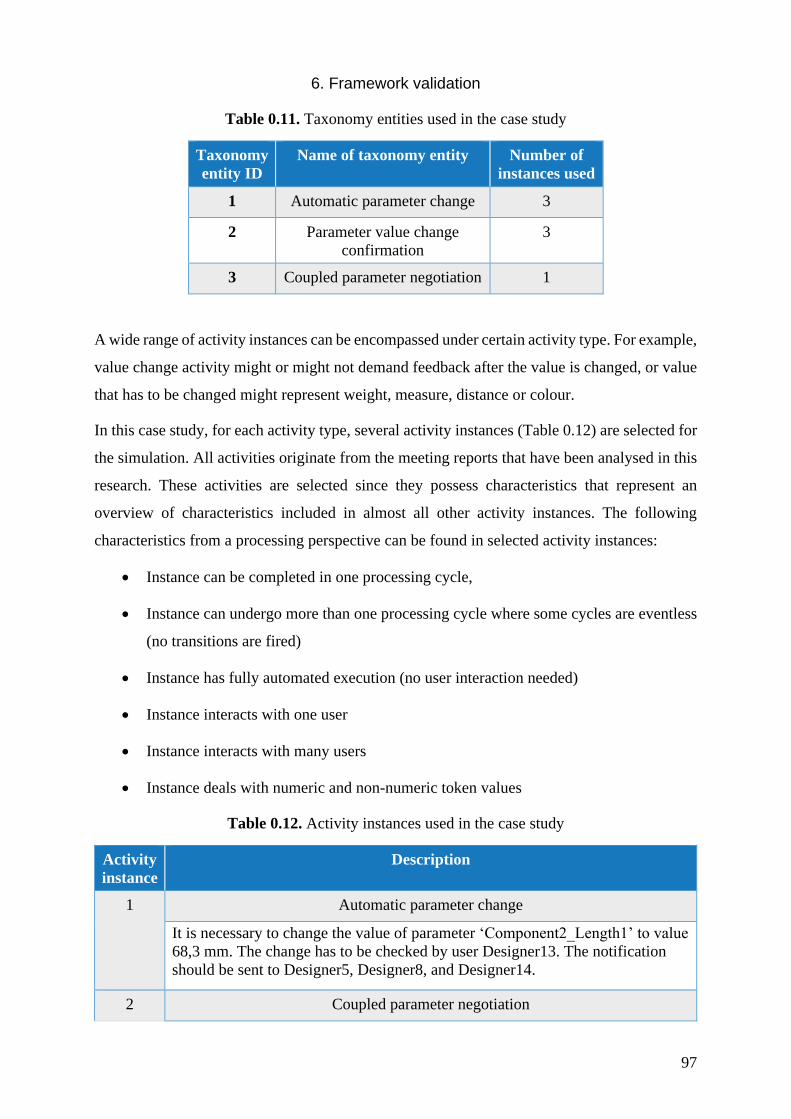
6. Framework validation
97
Table 0.11. Taxonomy entities used in the case study
Taxonomy
entity ID
Name of taxonomy entity Number of
instances used
1 Automatic parameter change 3
2 Parameter value change
confirmation
3
3 Coupled parameter negotiation 1
A wide range of activity instances can be encompassed under certain activity type. For example,
value change activity might or might not demand feedback after the value is changed, or value
that has to be changed might represent weight, measure, distance or colour.
In this case study, for each activity type, several activity instances (Table 0.12) are selected for
the simulation. All activities originate from the meeting reports that have been analysed in this
research. These activities are selected since they possess characteristics that represent an
overview of characteristics included in almost all other activity instances. The following
characteristics from a processing perspective can be found in selected activity instances:
• Instance can be completed in one processing cycle,
• Instance can undergo more than one processing cycle where some cycles are eventless
(no transitions are fired)
• Instance has fully automated execution (no user interaction needed)
• Instance interacts with one user
• Instance interacts with many users
• Instance deals with numeric and non-numeric token values
Table 0.12. Activity instances used in the case study
Activity
instance
Description
1 Automatic parameter change
It is necessary to change the value of parameter ‘Component2_Length1’ to value
68,3 mm. The change has to be checked by user Designer13. The notification
should be sent to Designer5, Designer8, and Designer14.
2 Coupled parameter negotiation
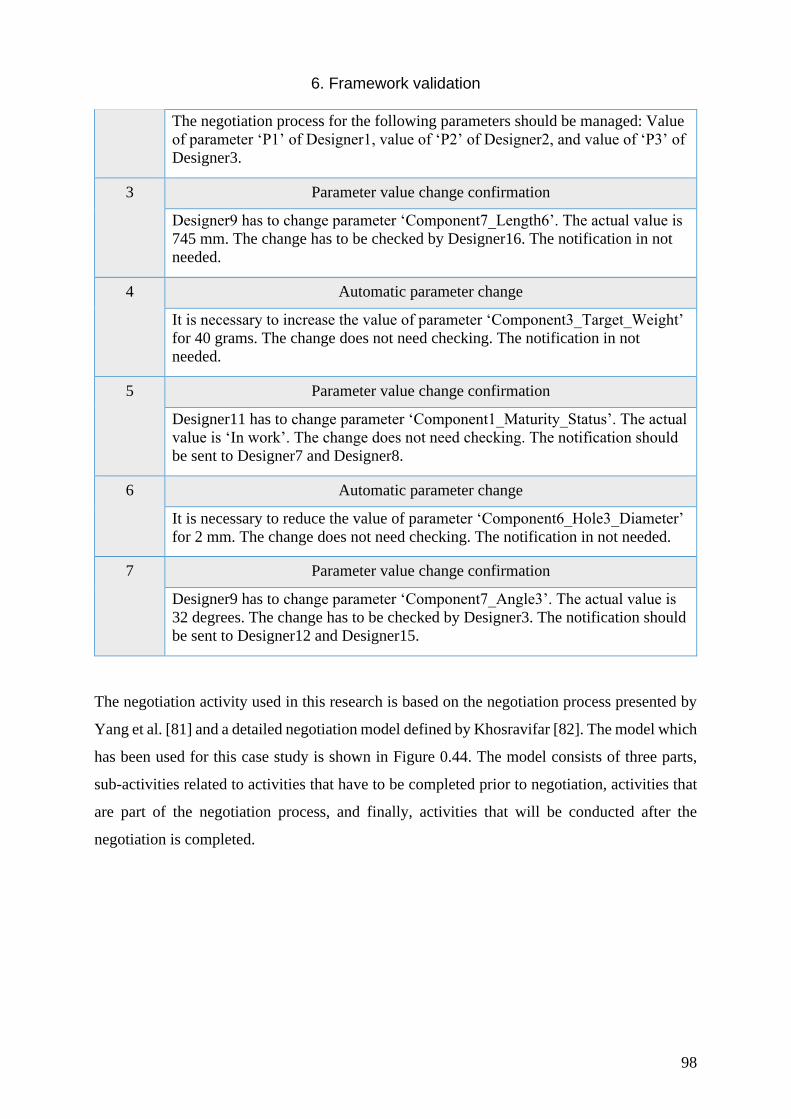
6. Framework validation
98
The negotiation process for the following parameters should be managed: Value
of parameter ‘P1’ of Designer1, value of ‘P2’ of Designer2, and value of ‘P3’ of
Designer3.
3 Parameter value change confirmation
Designer9 has to change parameter ‘Component7_Length6’. The actual value is
745 mm. The change has to be checked by Designer16. The notification in not
needed.
4 Automatic parameter change
It is necessary to increase the value of parameter ‘Component3_Target_Weight’
for 40 grams. The change does not need checking. The notification in not
needed.
5 Parameter value change confirmation
Designer11 has to change parameter ‘Component1_Maturity_Status’. The actual
value is ‘In work’. The change does not need checking. The notification should
be sent to Designer7 and Designer8.
6 Automatic parameter change
It is necessary to reduce the value of parameter ‘Component6_Hole3_Diameter’
for 2 mm. The change does not need checking. The notification in not needed.
7 Parameter value change confirmation
Designer9 has to change parameter ‘Component7_Angle3’. The actual value is
32 degrees. The change has to be checked by Designer3. The notification should
be sent to Designer12 and Designer15.
The negotiation activity used in this research is based on the negotiation process presented by
Yang et al. [81] and a detailed negotiation model defined by Khosravifar [82]. The model which
has been used for this case study is shown in Figure 0.44. The model consists of three parts,
sub-activities related to activities that have to be completed prior to negotiation, activities that
are part of the negotiation process, and finally, activities that will be conducted after the
negotiation is completed.

6. Framework validation
99
Figure 0.44. Model of negotiation process used in simulations
It can be noticed that some sub-activities can be conducted more than one time. How many
times will they be conducted in unknown and is really case dependent. Therefore, during this
case study, the number of iterations was estimated, and the iteration range was defined. In Table
0.13, in columns “executions min” and “executions max”, the range of iterations is shown.
Depending on the sub-activity, it can be performed ones, more than one time or even not once.
If performing an activity points back to the activity that already has been performed, all
following sub-activities along the chain will also be performed.
Generally, in this case study, each activity instance has been dissolved into smaller sub-
activities, and for each sub-activity time needed for execution was estimated. Since sub-
activities of activity instances that are of the same type might demand different time for the
execution, time ranges were estimated and defined. For each sub-activity is then calculated the
mean value of execution time and standard deviation. Table 0.13 shows mean values and
standard deviation of execution time for sub-activities in negotiation activity. Times in the table
are unitless since absolute values are highly dependent on the specific activity instance. Hence,
the results will show the relative differences between the two ways of performing the activities.
At the beginning of this section was mentioned that in the case study, the time needed for an
activity execution using the established way of performing such activities will be compared
with the time spent on activities using the proposed CSCW enhancement. Therefore, Table 0.13
shows estimated times for each sub-activity and for performing the activity by the traditional
way (column “duration traditional”) as well as using the support of CPN models (column
“duration new”).
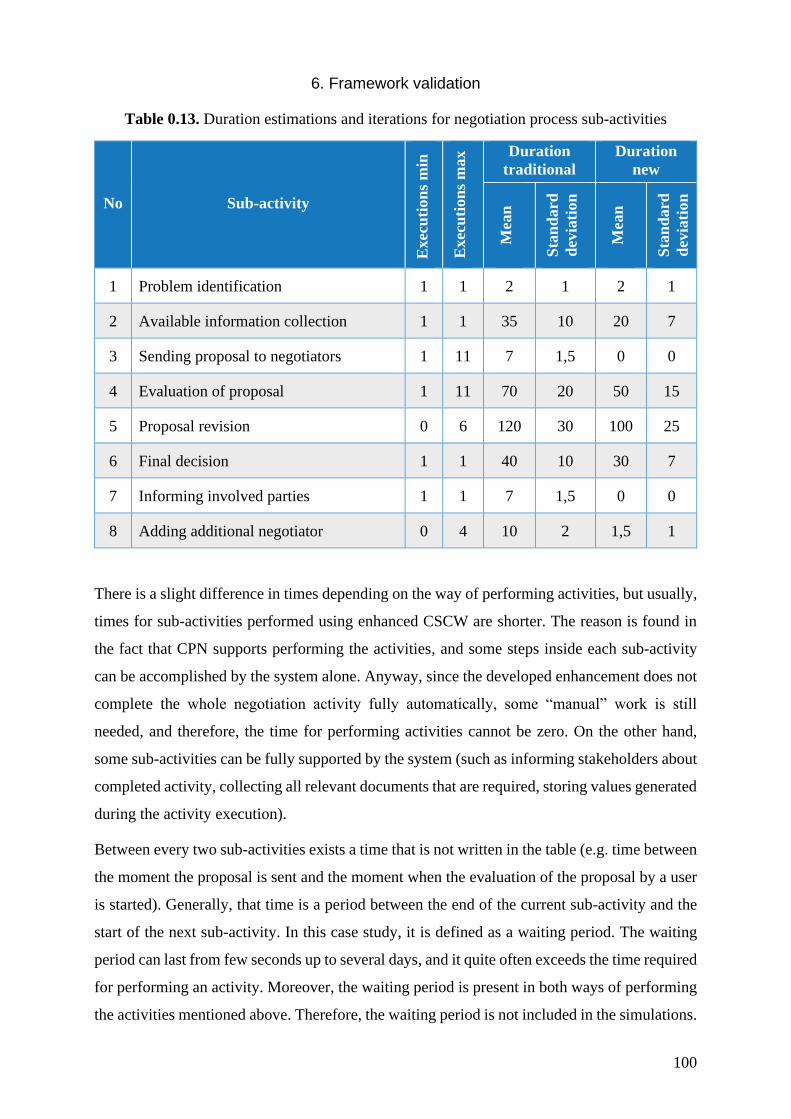
6. Framework validation
100
Table 0.13. Duration estimations and iterations for negotiation process sub-activities
No
Sub-activity
Exec
uti
on
s m
in
Exec
uti
on
s m
ax
Duration
traditional
Duration
new
Mea
n
Sta
nd
ard
dev
iati
on
Mea
n
Sta
nd
ard
dev
iati
on
1 Problem identification 1 1 2 1 2 1
2 Available information collection 1 1 35 10 20 7
3 Sending proposal to negotiators 1 11 7 1,5 0 0
4 Evaluation of proposal 1 11 70 20 50 15
5 Proposal revision 0 6 120 30 100 25
6 Final decision 1 1 40 10 30 7
7 Informing involved parties 1 1 7 1,5 0 0
8 Adding additional negotiator 0 4 10 2 1,5 1
There is a slight difference in times depending on the way of performing activities, but usually,
times for sub-activities performed using enhanced CSCW are shorter. The reason is found in
the fact that CPN supports performing the activities, and some steps inside each sub-activity
can be accomplished by the system alone. Anyway, since the developed enhancement does not
complete the whole negotiation activity fully automatically, some “manual” work is still
needed, and therefore, the time for performing activities cannot be zero. On the other hand,
some sub-activities can be fully supported by the system (such as informing stakeholders about
completed activity, collecting all relevant documents that are required, storing values generated
during the activity execution).
Between every two sub-activities exists a time that is not written in the table (e.g. time between
the moment the proposal is sent and the moment when the evaluation of the proposal by a user
is started). Generally, that time is a period between the end of the current sub-activity and the
start of the next sub-activity. In this case study, it is defined as a waiting period. The waiting
period can last from few seconds up to several days, and it quite often exceeds the time required
for performing an activity. Moreover, the waiting period is present in both ways of performing
the activities mentioned above. Therefore, the waiting period is not included in the simulations.
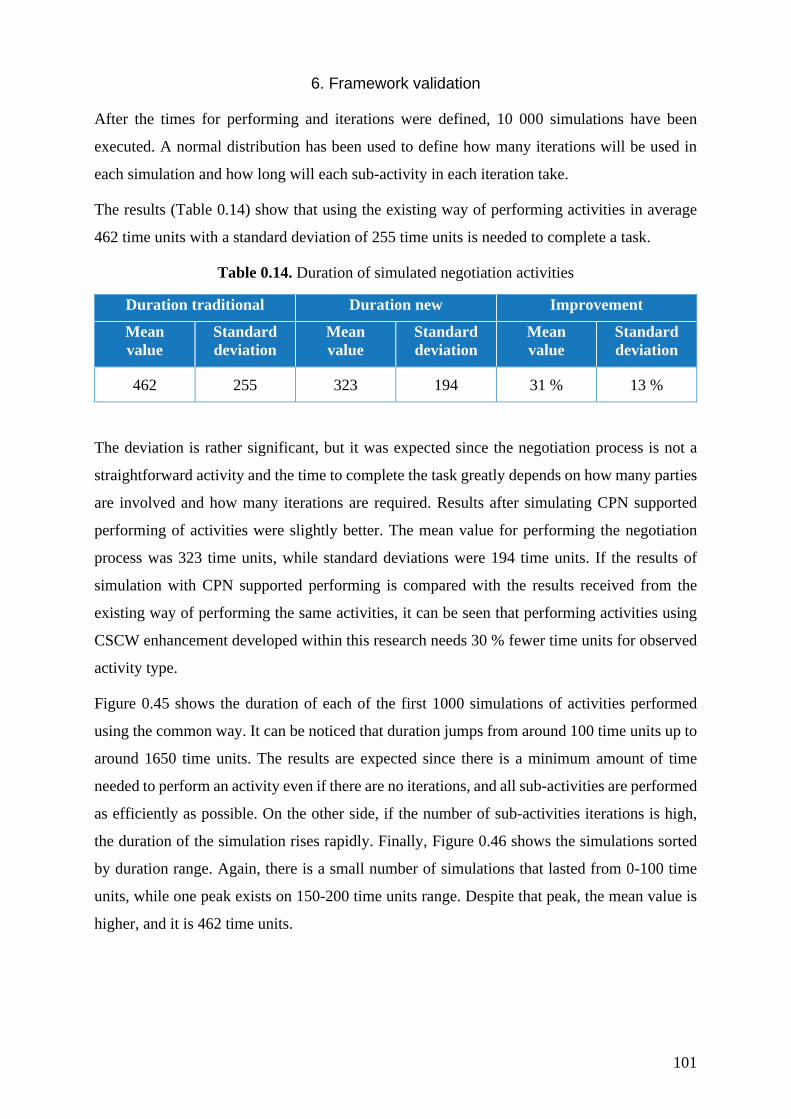
6. Framework validation
101
After the times for performing and iterations were defined, 10 000 simulations have been
executed. A normal distribution has been used to define how many iterations will be used in
each simulation and how long will each sub-activity in each iteration take.
The results (Table 0.14) show that using the existing way of performing activities in average
462 time units with a standard deviation of 255 time units is needed to complete a task.
Table 0.14. Duration of simulated negotiation activities
Duration traditional Duration new Improvement
Mean
value
Standard
deviation
Mean
value
Standard
deviation
Mean
value
Standard
deviation
462 255 323 194 31 % 13 %
The deviation is rather significant, but it was expected since the negotiation process is not a
straightforward activity and the time to complete the task greatly depends on how many parties
are involved and how many iterations are required. Results after simulating CPN supported
performing of activities were slightly better. The mean value for performing the negotiation
process was 323 time units, while standard deviations were 194 time units. If the results of
simulation with CPN supported performing is compared with the results received from the
existing way of performing the same activities, it can be seen that performing activities using
CSCW enhancement developed within this research needs 30 % fewer time units for observed
activity type.
Figure 0.45 shows the duration of each of the first 1000 simulations of activities performed
using the common way. It can be noticed that duration jumps from around 100 time units up to
around 1650 time units. The results are expected since there is a minimum amount of time
needed to perform an activity even if there are no iterations, and all sub-activities are performed
as efficiently as possible. On the other side, if the number of sub-activities iterations is high,
the duration of the simulation rises rapidly. Finally, Figure 0.46 shows the simulations sorted
by duration range. Again, there is a small number of simulations that lasted from 0-100 time
units, while one peak exists on 150-200 time units range. Despite that peak, the mean value is
higher, and it is 462 time units.
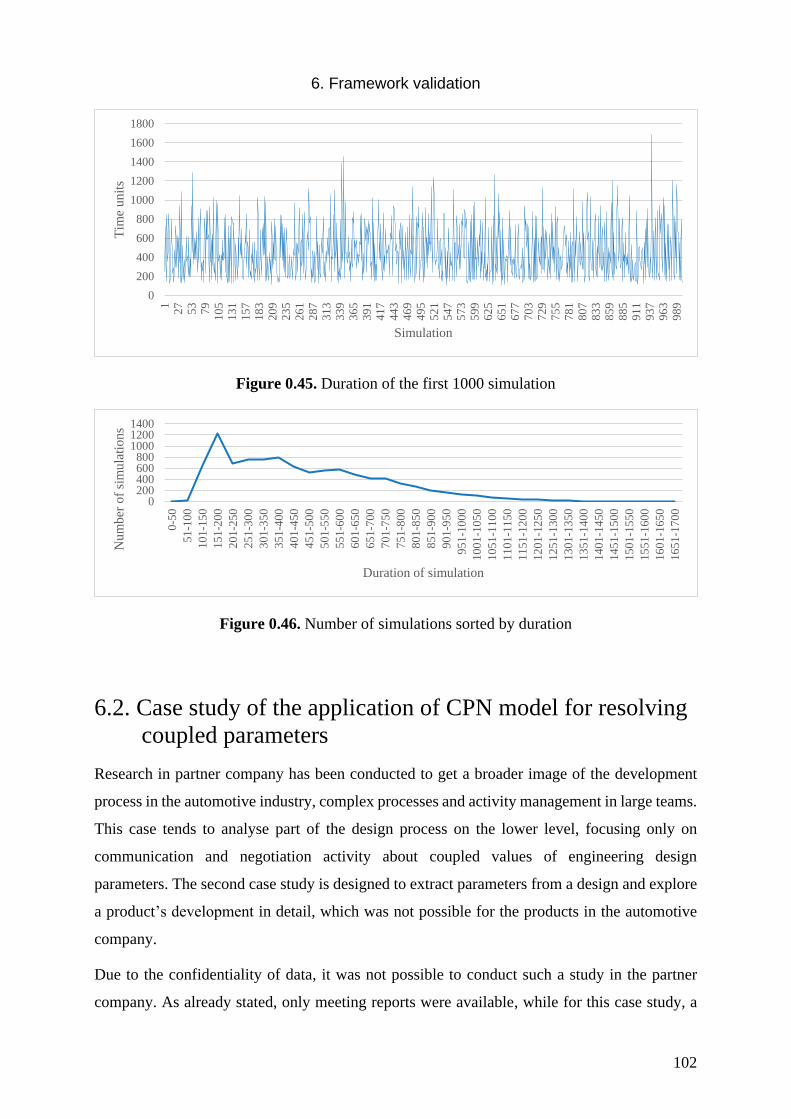
6. Framework validation
102
Figure 0.45. Duration of the first 1000 simulation
Figure 0.46. Number of simulations sorted by duration
6.2. Case study of the application of CPN model for resolving
coupled parameters
Research in partner company has been conducted to get a broader image of the development
process in the automotive industry, complex processes and activity management in large teams.
This case tends to analyse part of the design process on the lower level, focusing only on
communication and negotiation activity about coupled values of engineering design
parameters. The second case study is designed to extract parameters from a design and explore
a product’s development in detail, which was not possible for the products in the automotive
company.
Due to the confidentiality of data, it was not possible to conduct such a study in the partner
company. As already stated, only meeting reports were available, while for this case study, a
0
200
400
600
800
1000
1200
1400
1600
1800
127
53
79
105
131
157
183
209
235
261
287
313
339
365
391
417
443
469
495
521
547
573
599
625
651
677
703
729
755
781
807
833
859
885
911
937
963
989
Tim
e u
nit
s
Simulation
0200400600800
100012001400
0-5
0
51-1
00
101-1
50
151-2
00
201-2
50
251-3
00
301-3
50
351-4
00
401-4
50
451-5
00
501-5
50
551-6
00
601-6
50
651-7
00
701-7
50
751-8
00
801-8
50
851-9
00
901-9
50
951-1
000
1001-1
050
1051-1
100
1101-1
150
1151-1
200
1201-1
250
1251-1
300
1301-1
350
1351-1
400
1401-1
450
1451-1
500
1501-1
550
1551-1
600
1601-1
650
1651-1
700
Nu
mber
of
sim
ula
tion
s
Duration of simulation

6. Framework validation
103
student project is used where a complete design of the product is available along with records
from the beginning of the product development (e.g. product specification, concepts).
In this case study environment is different compared to an automotive company. The aim is to
apply a modified MDM method to extract coupled parameters among designers. Afterwards,
potential communication situations are extracted and used to test the CPN model for resolving
coupled parameters in teamwork. In the partner company, parameter management is conducted
in a different way, using active chains. Toepfer [12,13] stated that active chains are simple
aggregations of parameters that can be created without restrictions by stakeholders to monitor
parameters of interest. Active chains function as an intermediator of information between
stakeholders and their models of a distributed development process and allow for traceability
among engineering object.
This project was a part of a multinational student project, and its goal has been defined as a
development of a submersible remotely operated device for inspection of welds in a nuclear
reactor pressure vessel (RPV). The welds in the RPV have to be periodically examined in order
to find if micro-cracks have appeared and/or propagated. Inspection is being done with non-
destructive testing methods such as ultrasound or eddy current testing.
The industrial partner is renowned for technological and service excellence in the nuclear
industry, providing systems for nuclear power plant examination and repair services, supported
by intensive research and development programmes. The following list of most challenging
requirements illustrate the project complexity:
1. The device should be able to move through the water inside the RPV in all directions
and rotate about the vertical axis
2. Near-neutral buoyancy should be achieved
3. Linear velocity in all direction should be at least 100 mm/s, as well as scanning speed
4. Scanning should be made simultaneously along vertical and horizontal axes
5. The device could be fixed anywhere inside the vessel
6. Two driven axes are needed for surface scanning - one scanning axis and one
incremental axis -increment should be 10 mm, the scanning area is 300 mm wide along
the weld.
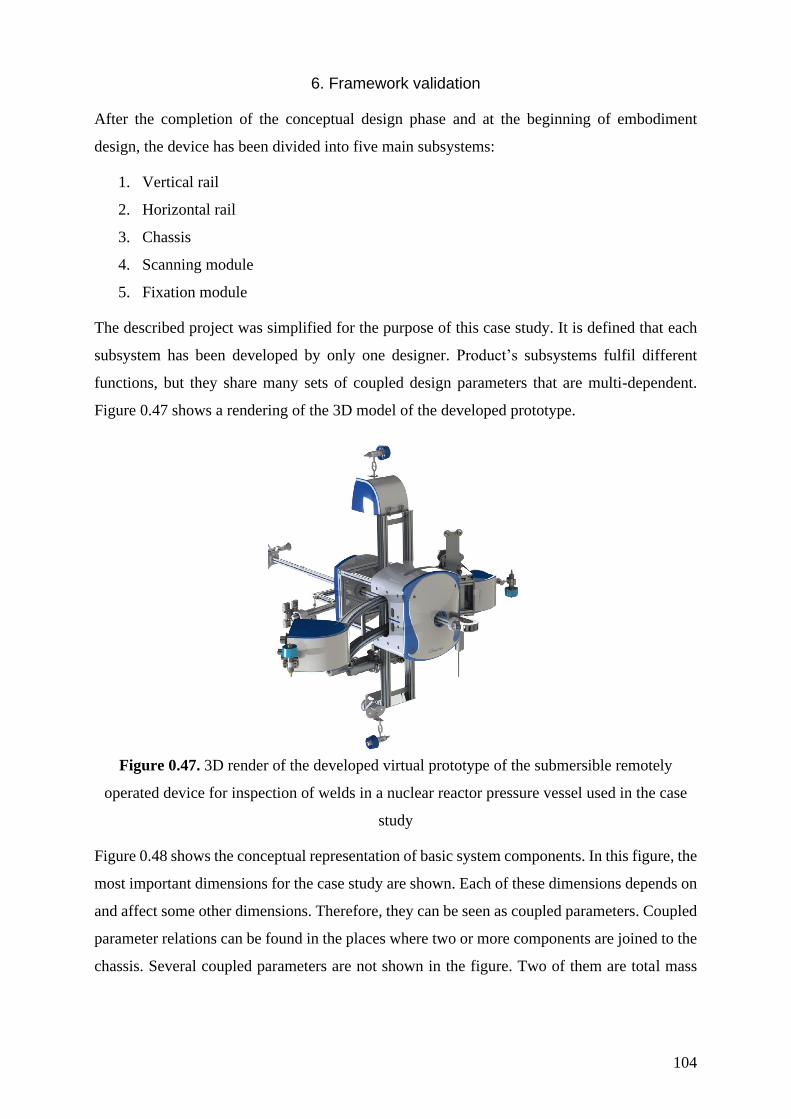
6. Framework validation
104
After the completion of the conceptual design phase and at the beginning of embodiment
design, the device has been divided into five main subsystems:
1. Vertical rail
2. Horizontal rail
3. Chassis
4. Scanning module
5. Fixation module
The described project was simplified for the purpose of this case study. It is defined that each
subsystem has been developed by only one designer. Product’s subsystems fulfil different
functions, but they share many sets of coupled design parameters that are multi-dependent.
Figure 0.47 shows a rendering of the 3D model of the developed prototype.
Figure 0.47. 3D render of the developed virtual prototype of the submersible remotely
operated device for inspection of welds in a nuclear reactor pressure vessel used in the case
study
Figure 0.48 shows the conceptual representation of basic system components. In this figure, the
most important dimensions for the case study are shown. Each of these dimensions depends on
and affect some other dimensions. Therefore, they can be seen as coupled parameters. Coupled
parameter relations can be found in the places where two or more components are joined to the
chassis. Several coupled parameters are not shown in the figure. Two of them are total mass
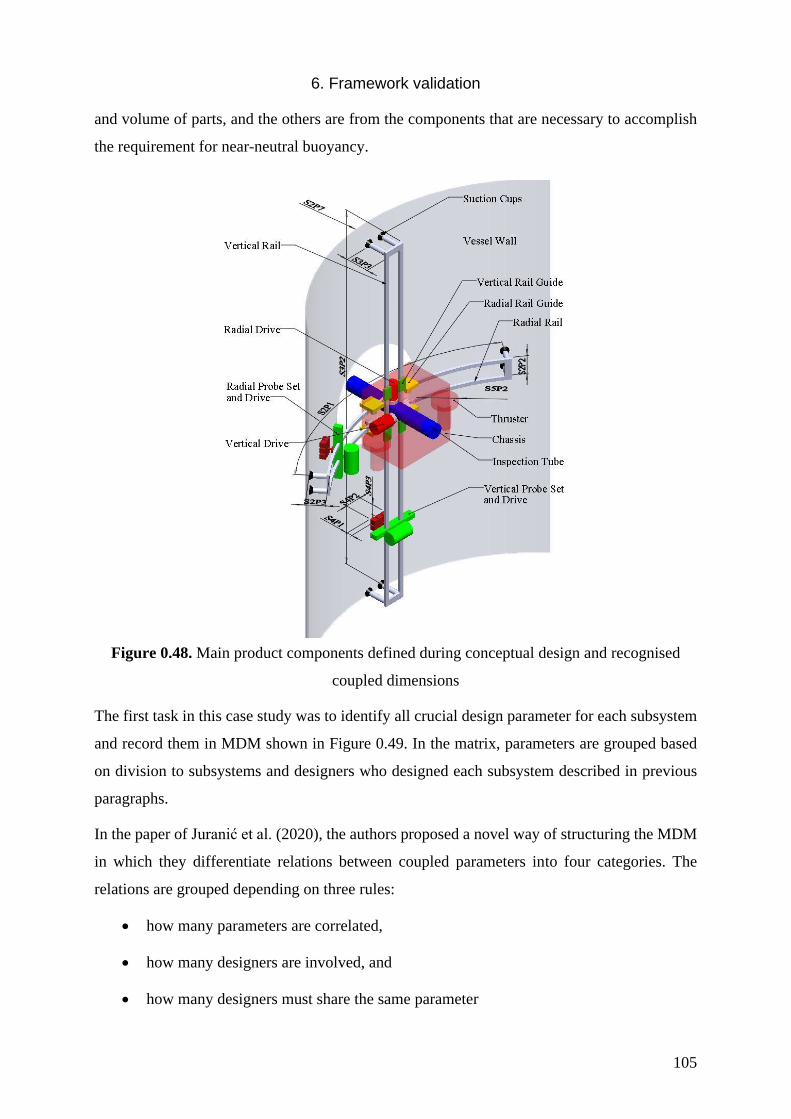
6. Framework validation
105
and volume of parts, and the others are from the components that are necessary to accomplish
the requirement for near-neutral buoyancy.
Figure 0.48. Main product components defined during conceptual design and recognised
coupled dimensions
The first task in this case study was to identify all crucial design parameter for each subsystem
and record them in MDM shown in Figure 0.49. In the matrix, parameters are grouped based
on division to subsystems and designers who designed each subsystem described in previous
paragraphs.
In the paper of Juranić et al. (2020), the authors proposed a novel way of structuring the MDM
in which they differentiate relations between coupled parameters into four categories. The
relations are grouped depending on three rules:
• how many parameters are correlated,
• how many designers are involved, and
• how many designers must share the same parameter
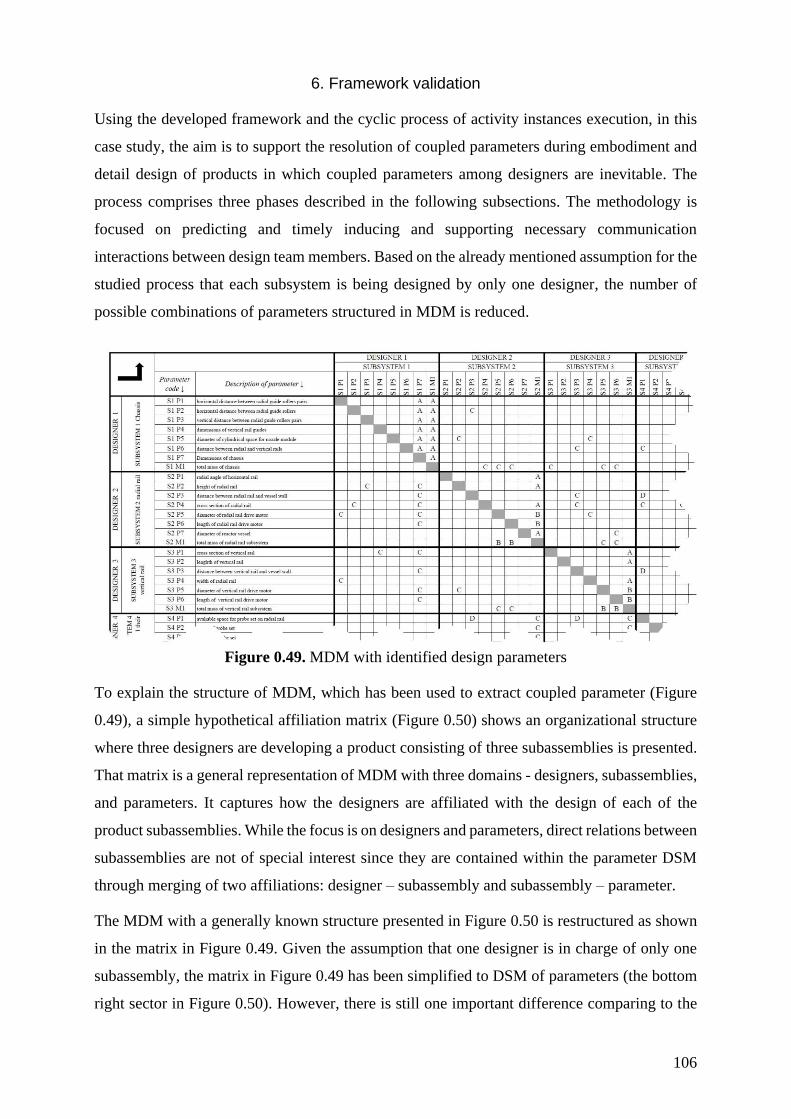
6. Framework validation
106
Using the developed framework and the cyclic process of activity instances execution, in this
case study, the aim is to support the resolution of coupled parameters during embodiment and
detail design of products in which coupled parameters among designers are inevitable. The
process comprises three phases described in the following subsections. The methodology is
focused on predicting and timely inducing and supporting necessary communication
interactions between design team members. Based on the already mentioned assumption for the
studied process that each subsystem is being designed by only one designer, the number of
possible combinations of parameters structured in MDM is reduced.
Figure 0.49. MDM with identified design parameters
To explain the structure of MDM, which has been used to extract coupled parameter (Figure
0.49), a simple hypothetical affiliation matrix (Figure 0.50) shows an organizational structure
where three designers are developing a product consisting of three subassemblies is presented.
That matrix is a general representation of MDM with three domains - designers, subassemblies,
and parameters. It captures how the designers are affiliated with the design of each of the
product subassemblies. While the focus is on designers and parameters, direct relations between
subassemblies are not of special interest since they are contained within the parameter DSM
through merging of two affiliations: designer – subassembly and subassembly – parameter.
The MDM with a generally known structure presented in Figure 0.50 is restructured as shown
in the matrix in Figure 0.49. Given the assumption that one designer is in charge of only one
subassembly, the matrix in Figure 0.49 has been simplified to DSM of parameters (the bottom
right sector in Figure 0.50). However, there is still one important difference comparing to the
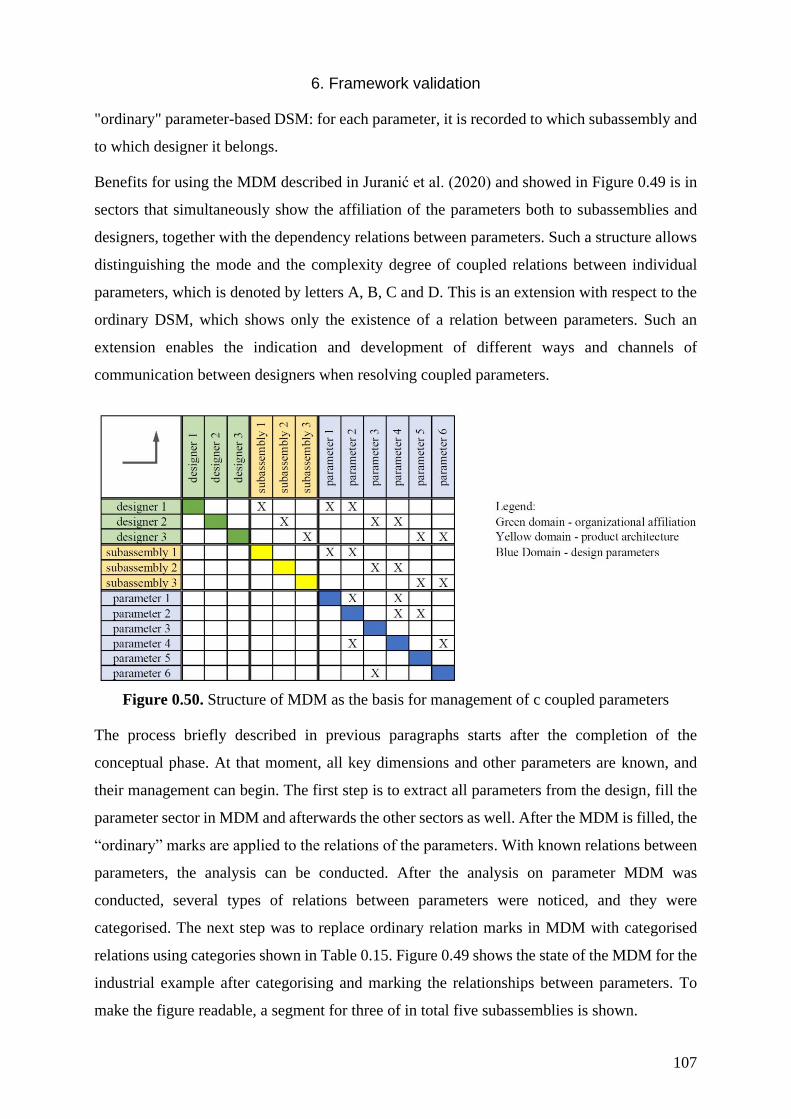
6. Framework validation
107
"ordinary" parameter-based DSM: for each parameter, it is recorded to which subassembly and
to which designer it belongs.
Benefits for using the MDM described in Juranić et al. (2020) and showed in Figure 0.49 is in
sectors that simultaneously show the affiliation of the parameters both to subassemblies and
designers, together with the dependency relations between parameters. Such a structure allows
distinguishing the mode and the complexity degree of coupled relations between individual
parameters, which is denoted by letters A, B, C and D. This is an extension with respect to the
ordinary DSM, which shows only the existence of a relation between parameters. Such an
extension enables the indication and development of different ways and channels of
communication between designers when resolving coupled parameters.
Figure 0.50. Structure of MDM as the basis for management of c coupled parameters
The process briefly described in previous paragraphs starts after the completion of the
conceptual phase. At that moment, all key dimensions and other parameters are known, and
their management can begin. The first step is to extract all parameters from the design, fill the
parameter sector in MDM and afterwards the other sectors as well. After the MDM is filled, the
“ordinary” marks are applied to the relations of the parameters. With known relations between
parameters, the analysis can be conducted. After the analysis on parameter MDM was
conducted, several types of relations between parameters were noticed, and they were
categorised. The next step was to replace ordinary relation marks in MDM with categorised
relations using categories shown in Table 0.15. Figure 0.49 shows the state of the MDM for the
industrial example after categorising and marking the relationships between parameters. To
make the figure readable, a segment for three of in total five subassemblies is shown.
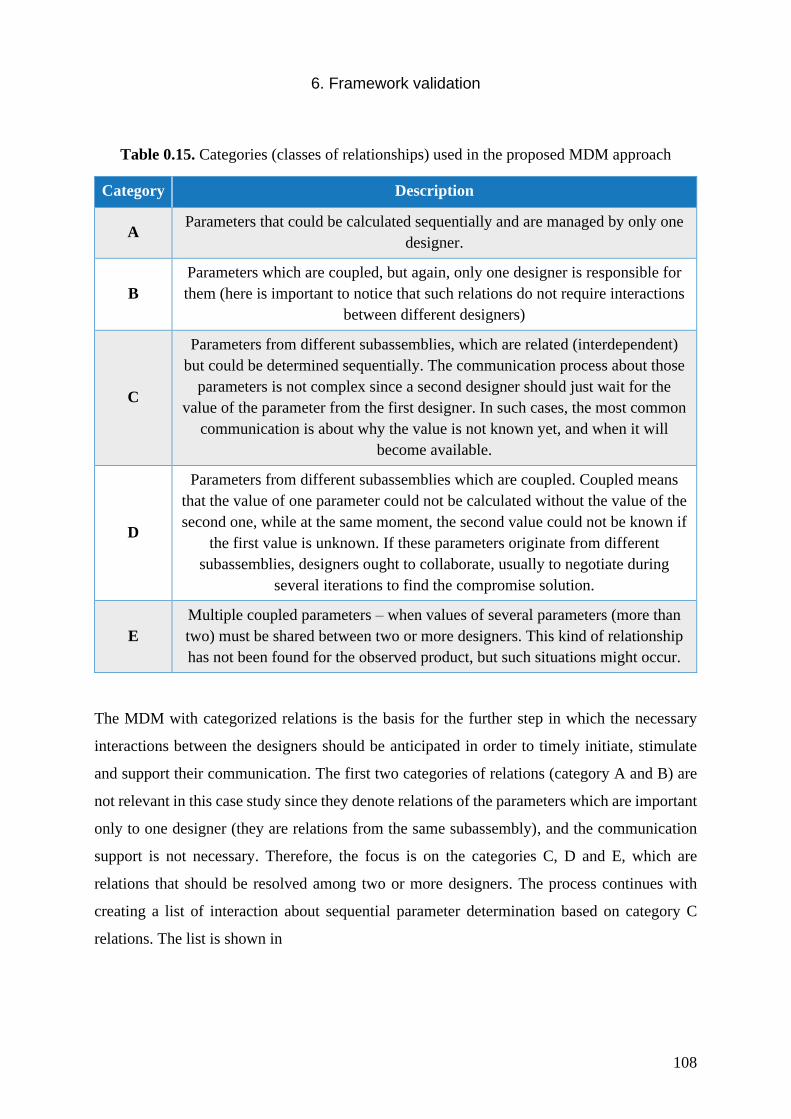
6. Framework validation
108
Table 0.15. Categories (classes of relationships) used in the proposed MDM approach
Category Description
A Parameters that could be calculated sequentially and are managed by only one
designer.
B
Parameters which are coupled, but again, only one designer is responsible for
them (here is important to notice that such relations do not require interactions
between different designers)
C
Parameters from different subassemblies, which are related (interdependent)
but could be determined sequentially. The communication process about those
parameters is not complex since a second designer should just wait for the
value of the parameter from the first designer. In such cases, the most common
communication is about why the value is not known yet, and when it will
become available.
D
Parameters from different subassemblies which are coupled. Coupled means
that the value of one parameter could not be calculated without the value of the
second one, while at the same moment, the second value could not be known if
the first value is unknown. If these parameters originate from different
subassemblies, designers ought to collaborate, usually to negotiate during
several iterations to find the compromise solution.
E
Multiple coupled parameters – when values of several parameters (more than
two) must be shared between two or more designers. This kind of relationship
has not been found for the observed product, but such situations might occur.
The MDM with categorized relations is the basis for the further step in which the necessary
interactions between the designers should be anticipated in order to timely initiate, stimulate
and support their communication. The first two categories of relations (category A and B) are
not relevant in this case study since they denote relations of the parameters which are important
only to one designer (they are relations from the same subassembly), and the communication
support is not necessary. Therefore, the focus is on the categories C, D and E, which are
relations that should be resolved among two or more designers. The process continues with
creating a list of interaction about sequential parameter determination based on category C
relations. The list is shown in
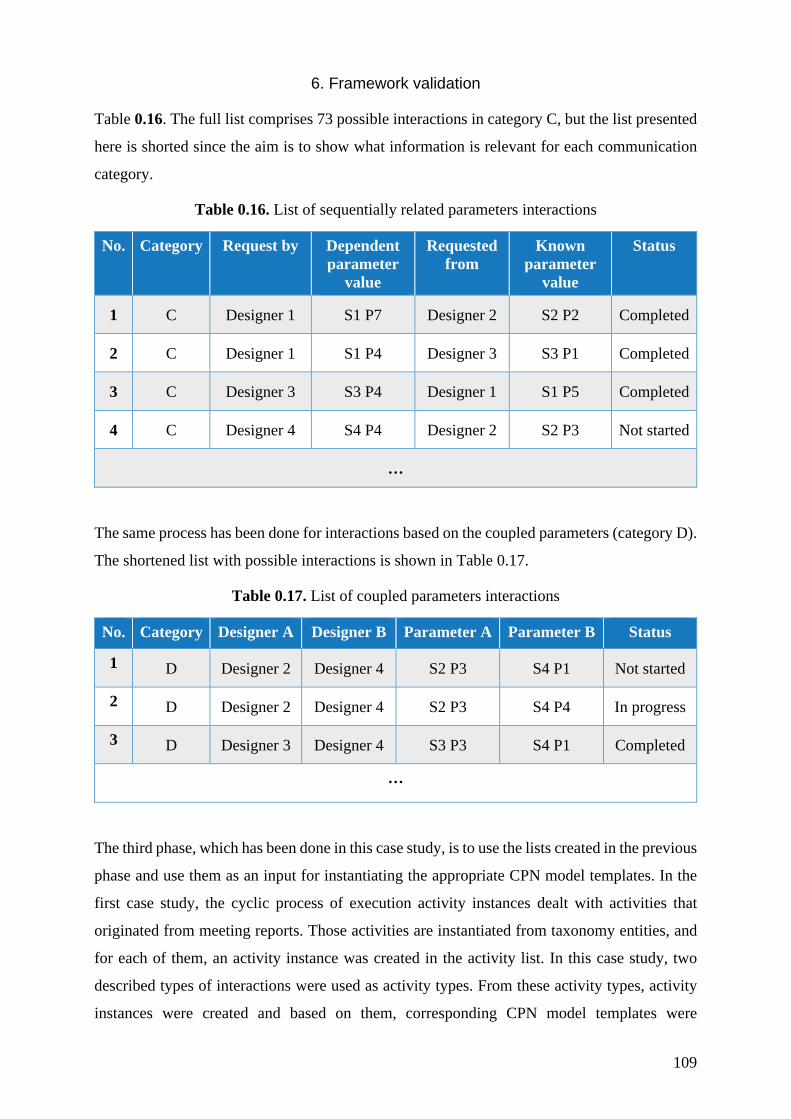
6. Framework validation
109
Table 0.16. The full list comprises 73 possible interactions in category C, but the list presented
here is shorted since the aim is to show what information is relevant for each communication
category.
Table 0.16. List of sequentially related parameters interactions
No. Category Request by Dependent
parameter
value
Requested
from
Known
parameter
value
Status
1 C Designer 1 S1 P7 Designer 2 S2 P2 Completed
2 C Designer 1 S1 P4 Designer 3 S3 P1 Completed
3 C Designer 3 S3 P4 Designer 1 S1 P5 Completed
4 C Designer 4 S4 P4 Designer 2 S2 P3 Not started
…
The same process has been done for interactions based on the coupled parameters (category D).
The shortened list with possible interactions is shown in Table 0.17.
Table 0.17. List of coupled parameters interactions
No. Category Designer A Designer B Parameter A Parameter B Status
1 D Designer 2 Designer 4 S2 P3 S4 P1 Not started
2 D Designer 2 Designer 4 S2 P3 S4 P4 In progress
3 D Designer 3 Designer 4 S3 P3 S4 P1 Completed
…
The third phase, which has been done in this case study, is to use the lists created in the previous
phase and use them as an input for instantiating the appropriate CPN model templates. In the
first case study, the cyclic process of execution activity instances dealt with activities that
originated from meeting reports. Those activities are instantiated from taxonomy entities, and
for each of them, an activity instance was created in the activity list. In this case study, two
described types of interactions were used as activity types. From these activity types, activity
instances were created and based on them, corresponding CPN model templates were
6. Framework validation
110
instantiated and CPN model instances were created. The rest of the process for cyclic execution
of activity instances remains the same as described in previous sections and used in the first
case study.
During the research, it has been noticed that coupled parameters are most valuable to manage,
but at the same time, their management is the most complex. Therefore, in this research, an
modification of MDM is created. The foci of validation in this case study were to confirm that
the CPN model created to support a negotiation process of coupled parameters fulfils the
required function on the example of complex design products developed in teamwork.
111
7. DISCUSSION
The seventh chapter discusses the results of the validating process reported in the previous
chapter. The primary aim of this discussion is to address the research questions, emphasise the
research contributions and to present the potentials of the proposed methodology and the
framework as the final step in Descriptive Study II.
7.1. Research contribution
The scientific contribution of this research from the design research perspective is manifested
through the CSCW enhancement reported in this thesis. The main aspects of contributions are:
- Engineering design activity taxonomy
The first contribution of this research concerns analysis of the obtained dataset and the creation
of the taxonomy of engineering design activities which consists of 26 activities classified in
three levels of hierarchy. The proposed tailored taxonomy presented in this research has three
main groups on the highest level, based on the direction of data flow: Assigning (requesting
new data by assigning the task to someone), Reporting (sharing existing information with
someone) and Requesting (requesting information from someone). Some activities from the
lower level were reused from existing taxonomies and ontologies that are classifying EDA.
Wasiak et al. [85] analysed information that can be found in engineering emails. They proposed
a grouping of information transactions (e.g. informing, clarifying, confirming, requesting
information, evaluating) that are fully aligned with the activities found in meeting reports in the
partner company. Since Wasiak et al. were primarily focused on communication processes
among engineers, their classification does not entirely fit the proposed taxonomy in this
research since this research aims to support engineering by semi-automating the EDA.
Taxonomy for mechanical engineering defined by Ullman [6], which is a basis for classification
of mechanical design, covers only the classification of PD on the process level (e.g. conceptual
design, parametric design, routine design) what makes it impractical for usage in this research.
Ostergaard and Summers [7] proposed a taxonomy that includes top-level attributes of team
composition, communication, distribution, design approach, information, and nature of the
problem during collaborative design. The collaborative design factors organized in their
taxonomy provides a description of collaborative design situations on the highest level.
7. Discussion
112
Those situations are too general to use them to define templates for the execution of design
activities.
Sim and Duffy [3] developed an extensive design activity ontology, which matches the EDA
that is found during the analysis of the meeting reports. Despite that their ontology mainly fits
the activities from meeting reports, Sim and Duffy’s ontology is still not defined on the lowest
level of granularity which is the reason why the activities classification from that ontology
cannot be fully reused. The statement which supports that decision can be found in the paper of
Kumar and Mocko [86]. Kumar and Mocko analysed the ontology proposed by Sim and Duffy
[3] using four case studies and concluded the following: (1) the knowledge flow between
activities are insufficient for modelling complex design processes, (2) activities can be further
decomposed into constitutive activities and (3) the predefined relationships between activities
must be refined.
In this research, the tailored engineering design taxonomy has been defined based on the
activities found in meeting reports. Each working environment has its own specialities, which
make the definition of complete and universal taxonomy of engineering design activities on the
lowest granularity level almost impossible. Only on the lowest level of granularity, semi-
automatic execution of the activities can achieve proper functionality using the CPN model
templates. Lowering the granularity, a number of options that have to be taken into account are
smaller, the models are less error-prone, and consequently, the models can achieve a higher
level of automation. For example, the model for parameter change presented in Section 4.9.1
can work fully automatically, while the negotiation model cannot be completed if users do not
make certain decisions during the execution.
- Proposal of the process for semi-automatic execution of engineering design
activities
The developed process for execution of EDA, which is a central part of that framework for
supporting the execution of EDA, is considered the second contribution of this work. The
framework encompasses several modules that are necessary for the proper execution of CPN
models. It processes the activity list, establishes data transfers and manages CPN based activity
templates via CPN Tools software. The CPN Tools is required for designing of CPN model
templates, their execution, simulation and visualization. Using the CPN Tools, a user can
observe the current status of CPN model instances but also make decisions for further execution
of CPN instance.
7. Discussion
113
Developing CPN models template for EDA is on the trail of Mulyar and van der Aalst’s work
[19], [31], where they developed CPN models (they are calling them activity patterns) which
act as templates for simulating activities in information technology. The difference is in the
way how tokens are generated. Since they dealt with activities simulations, they assigned tokens
manually in CPN models for each simulation, while in this research, the framework is
responsible for assigning the tokens which values are obtained from external sources (e.g.
parameter database).
Arena and Kiritsis [32] proposed ontology-driven instantiation of PN manufacturing process
models. As the title of their proposal declares, the authors created ontology for one case study
for an automated assembly system. One of the classes is called “activity”, which comprises
operations that automated assembly station can perform. The authors then used that ontology
class to instantiate different PN model depending on the required operation. A similar principle
is designed in this research as described in Section 4.7. EDA from engineering design activity
taxonomy is instantiated each time the framework needs to process the activity which has not
been processed yet. The instantiation process of the activities is described in Section 4.6.
The process for execution of activities described in Chapter 5 represents a novel approach in
using CPN methodology. CPN methodology is a common tool for modelling, simulating and
visualization of systems, but in this research, its main purpose is to manage the execution of
EDA. Nonetheless, its original purpose is still preserved. It is used for modelling of EDA
templates, used for simulation of activities, and it enables visualisation of the current state of
processing the EDA. The novelty can be seen in the way how CPN models are processed. The
process works in execution cycles, and in each cycle, the following steps will be conducted:
1. Re-execution of the CPN model instance (last saved state is restored)
2. Checking if new data become available in the meantime (since the instance execution
was terminated in the last processing cycle)
3. Processing of CPN model from where it stopped in the last cycle
4. Finishing the execution (activity is completed) or termination until the next cycle (data
for processing is missing)
After each cycle, all information about the CPN instance is stored in order to continue the
execution in the next cycle. That means that the quantity and values of all tokens for every CPN
7. Discussion
114
place in the model have to be stored. How does the model know where to continue? If the model
is not complete (part of the model that completes the activity was not executed), new data is
awaited. When data become available, one of the CPN transitions will become available for
firing, and the model execution will continue.
- CPN models that enhance CSCW and design communication
The framework and the process for execution would not work without the CPN models.
Therefore, they are considered as the second contribution. CPN model themselves are
commonly used in practice for modelling, simulation and visualisation of the various processes
[87],[88]. Using them for semi-automatically execution of engineering design activities as they
are designed in this thesis was not found in the available literature. The opposite case is with
models that support communication, which is observed in the existing literature and tailored
for the purpose of this research. It is already stated that the negotiation model is based on the
PN model of Khosravifar [82]. The useful CPN models were found in the paper of Mulyar and
van der Aalst [31] in which authors proposed 34 CPN models for activities in Information
technology branch (e.g. database manager, log manager, data merge, synchronous transfer).
These CPN models provided a basis for development of the models for data transfer used in
this research.
Differently from other contributors to the field of CPN models, functions inside CPN models
are virtually grouped what make their reusing in other CPN models available. The naming of
the transitions and places is defined in the way that they can unambiguously communicate with
external functions that are specific for each functional group. Execution of CPN model instance
in different execution cycles is enabled using condition and status places, giving a user a clear
picture of what part of the instance has been executed already and what is still left to be
executed.
In Chapter 6, the validation of the framework and the model for processing has been conducted.
Different activities have been simulated to give the answer to research question 4. Required
times for conducting each sub-activity in these activities has been estimated, and the simulation
was conducted. Two ways of conducting the activities were simulated; the first one is the
common way engineering designers are doing nowadays, and the second way is by using the
proposed framework for supporting the execution of EDAs. The results on 10 000 simulations
show that the time for executing the activity using the proposed framework can be reduced by
31 % (standard deviation is 13 %) compared to the common way. That improvement has been

7. Discussion
115
seen in the reduced number of iterations by automating some sub-activities (e.g. informing
participants about change, automatic value collection), but it is also dependent on the activity
type that has been executing.
- MDM modification for indicating necessary communication
The third contribution concerns a proposal for restructuring the Multiple Domain Matrix
(MDM) methodology to extract potential and necessary communication activities based on the
extraction of coupled parameters among multiple designers. Even though MDM is widely used
to show relations between elements from different domains, in this research MDM is used to
extract potential communication situations about coupled parameter values. Using MDM,
relations between parameters were extracted and classified into four distinctive classes. The
research further focused only on two classes: Interdependent parameter values that can be
defined sequentially and coupled parameter values. These relations define the type of
communication situation that will take place during value determination.
If parameters’ values can be determined sequentially, the CPN model informs the owner of the
subsequent parameter about updated value as soon as it becomes available, thus helping with
the issue of dynamic updating and propagation of design information. In a case of relation that
denotes coupled parameters, the CPN model supports the negotiation process among all
stakeholders and enables transparent and traceable value determination. Given that MDM is
considered as static in the literature [89], [75] and this is generally cited as a major obstacle to
its wider use in practice, this contribution can be a step towards linking MDM and dynamic
situations.
A similar methodology is proposed by Karniel and Reich [33] by presenting formal definitions
of the DSM method used for process planning and a formal conversion of a DSM-based plan
to a DSM-net process model. To conclude, the contribution of this thesis reflects in a novel
approach to predicting, classifying and managing communication patterns that are necessary
during teamwork coordination on critical interfaces between product components developed by
different team members.
7. Discussion
116
7.2. Potentials of the proposed framework and model for
executing EDA
The first research question seeks to answer which are the most frequent sequences of activities
and critical situations that may arise due to relations between engineering design parameters
during the product development process. The answer is provided in Chapter 3 after the
extensive analysis of meeting reports from three long-term development projects. The question
is looking for the answer regarding two topics: “most frequent activities” and “critical
situations”. Both of them are preferred in front of the other activities when discussing the
benefits of their semi-automatic execution process. Most frequent activities are on the top of
the priority list because of their number of occurrences. If those activities could be automated,
a lot of effort can be saved. On the other side, there are activities derived from critical situations.
Automating or just supporting such activities can help users to solve the critical situation with
fewer iterations and in less time, which has been seen in simulations results during validation.
Supporting all the other activities could improve the working experience as well, but not as
much as supporting frequent and critical activities.
The aim of the research reported in this thesis is to enhance CSCW by the semi-automation
execution of frequent activities and activities that deal with a critical situation, such as
negotiation about the coupled parameters values. After building the taxonomy, the research
focused on developing separate CPN models that could help accomplish the research goals.
Based on CPN use cases found in the literature [31], [82], [90], [88] and results from initial
trials, the CPN methodology has proven to be a promising approach for solving the problem.
To process activity using CPN models, the CPN model needs data to work with. Data has to be
collected from various sources, and if that process is not automated, such a contribution to the
CSCW would probably consume more time for CPN model definition than it could be saved
by automatic processing of an activity. In order to bring such a contribution to the next level
and to provide an answer to the second research question, the framework and process for semi-
automated processing of engineering design activities have been developed. The framework
uses pre-defined activities in the form of an activity list. Each activity on the list is unique, and
the execution process for it has to be specific. Based on the activity type, a CPN model is
instantiated from the collection of CPN model templates, and the CPN model is automatically
filled with data required for its execution. The activity could be processed fully automatically
or partially if the processed activity has to include interaction with users. The author considers
7. Discussion
117
linking activities instances, CPN templates and belonging processes as parts of the proposed
framework as a favourable approach for CSCW enhancement based on the elements of the
taxonomy of engineering design activities.
The proposed framework is validated using two case studies. In the second case study, the
parameters were extracted from the 3D model assembly and they were arranged into DSM. The
relations were added to find out in which order the parameter values have to be calculated.
Knowing only the relations between parameter was not enough. Therefore, DSM has been
switched with the modified MDM. Important relations for this research are relations between
two or more parameters where each of the parameters has a different responsible designer. In
such a case, communication is inevitable. The modified MDM presented in Section 6.2. is
considered as a novel approach for the extraction of potential communication situations among
designers. From the relations defined in MDM, engineering design activities were extracted,
and they have been used as activity instances in the activity list. This case study showed that
activities could originate from different sources if they were defined in the way that the CPN
model template can use the defined activity to execute the CPN model. Moreover, the case
study presented an approach in which MDM representing product structure and design process
architecture is combined with the proposed framework to contribute to the CSCW
enhancement. The approach provides the answer to the third research question.
It is expected that using this approach, some misunderstandings, delays and additional
unnecessary iterations which often happen in practice due to untimely or missing
communication could be avoided. Examples found in the literature [91], [9], [15] showing that
in teamwork, designers are often unaware of the connections between parameters and
consequently the need for timely communication.
Brisco et al. [60] presented 220 factors that influence successful CSCW. They summarised
categorised factors into 19 statements that represent CSCW requirements. If the presented
research is analysed and compared to Brisco et al. [60], the author believes that potentials of
contributions in this thesis could correspond with at least the following three statements:
1. "Supports communication through synchronous and asynchronous multi-threaded and
multi-channel software for prompt discussion in a way which supports the context of
the message."
7. Discussion
118
2. "Allows for greater productivity through fast objective focused communication,
organisation of work and a greater quantity of output to promote collaboration
readiness, reflection and reduced rework time."
3. "Encourages a shared understanding by defining and framing conversations within a
common context which makes it easy to understand information, clarify meaning and
reduce miscommunications."
In the light of the last research question raised, the following paragraphs tackle the benefits and
advantages of the proposed CSCW enhancement that is based on the CPN methodology. Many
benefits have been already stated in the previous chapters, while in this section, they are
summarised, and additional usage examples from other authors are presented. In addition to
other features, the CPN methodology enables the conceptualisation of rules and relationships
and is therefore suitable for formalising knowledge [20]. CPN methodology showed great
potential as one of the possible solutions for issues recognised in CSCW and design
communication. Its potential in projects with a strong emphasis on safety and efficiency can be
found in papers on using Petri Nets for formal modelling and simulation of train control systems
[92] and various military applications [93], [94].
The author argues that the proposed framework demands additional work regarding
implementation (e.g. connection to all required systems in a company) in a real working
environment. The great advantages of CPN models are their dynamic behaviour (it can run
automatically, but a user can take control of execution at any moment and thus change the
processing path) and good process visualisation capabilities.
Work that needs to be carried out in order to implement any design method to the industry is
discussed by Wallace [95]. Wallace stated that design methods are frequently embodied as
software tools. Designers in the industry spend a considerable amount of their working days on
the computer using both dedicated design and analysis tools as well as a bunch of office tools.
These software tools have been written by large teams of professional programmers and are
powerful, robust and have sophisticated interfaces. It is not the main task of academic
researchers to write software code, even if they are competent at it. They may need to code their
proposed methods in order to test them, but the resulting software is not likely to be
sophisticated, robust or user-friendly by modern standards. There is often a considerable gap
between the prototype software tools produced by individual researchers and the software that
companies are prepared to install on their IT systems.
7. Discussion
119
In his book, Birkhofer [96] emphasises that industry only reluctantly adapts design
methodological models and methods. Despite the high number of graduates with Design
Methodology knowledge, researchers and practitioners conclude that methodical development
is only used partially in industry and, even then, only in a rather simple, rudimentary form (e.g.
simple creativity techniques). Considering the issue mentioned by Birkhofer, the author argues
that the implementation process of the proposed solution is extremely complex since it involves
changes in current methods and tools, connections with data sources, and finally, supporting
users to use the proposed solution. The implementation process should be gradual and long-
lasting since it requires significant additional effort from the design teams. In the beginning,
only necessary processes have to be established, and simple activity types should be
incorporated. Lately, more complex activities could be added. This process would also require
further parallel research work to refine and upgrade the proposed framework concept and
elements.
120
8. CONCLUSION
The research reported in this thesis confirms the hypothesis. The research covered
multidisciplinary topics which are outstandingly complex for implementation in practice.
Nevertheless, based on the arguments discussed and the conducted analysis, it can be concluded
that the proposed methodology certainly has potential for CSCW enhancement. The ultimate
goal is still far, and to reach it, the limitations presented in the next section have to be tackled,
and the proposals for future work have to be considered.
8.1. Research summary
The research reported in the thesis tends to improve designer’s working experience through
CSCW enhancements. In order to achieve this, a more concrete research aim has been defined:
To develop methods and tools that would enable consistent dynamic updating and propagation
of design information in teamwork in a manner that will not generate additional tasks for
designers. The basis for developing the proposed method were analyses of repetitive patterns
of communication situations and parts of the design process found in a complex product
development environment.
State-of-the-art tools used in the PD processes already enables updating and propagation of
design information. Therefore, is this research trying to solve a problem for which a solution
already exists? The simple answer is no. The more extensive answer highlights two very
important words in the research aim: “consistent dynamic”. During the literature review, on
several occasions, it was quite obvious that tools and methods currently used during the PD
have their issues. One of them is that sometimes correct information is not available at the
required moment. In their work, several authors [1], [13] claim that a significant delay might
arise from the moment in which a parameter gets its updated and currently correct value to the
moment until that the value becomes available for others to use it. The reasons for that issue
were described in Chapter 2. Through the rest of the chapters, the author presented his vision
for improving the mentioned issue, embodiment of the vision and its validation.
Prior to any development, a comprehensive literature review has been conducted. The literature
review has been divided into two main fields: literature needed to understand better the defined
problem being solved and the literature needed to develop a solution for the problem.
8. Conclusion
121
The reviewed literature comprises the field of engineering design processes on the top level,but
also includes details on the lower level of granularity such as iterations that are omnipresent in
PD, critical situations that arise during PD, Computer supported collaborative work and on the
lowest level of granularity, design parameters. The literature review further provides insights
into topics of matrix-based methods since they are extensively used in PD [28] and into topics
of natural language processing. The theoretical framework defined in this research uses Petri
Nets as its core, so a great effort has been invested in the overview of Petri Net methodology
and its all main extensions. The literature review reported in Chapter 2 formulated research
gaps and research questions that directed the development of the research.
Additionally to the theoretical background, it has been reached for data from the real
environment that will support theoretical background and, at the same time, provide a basis for
the development of the framework. In Chapter 3, an experimental dataset analysed in this
research has been presented. Along with the dataset, it has been reported how the data has been
obtained and what steps have been conducted during the data analysis. The results derived from
data analysis together with the design activity ontology of Sim and Duffy [3] were prerequisites
for developing an engineering design activity taxonomy tailored to the activities that could be
found in the PD processes of the partner company.
The prescriptive part of the research has been presented in Chapter 4. This is the central part of
the research in which gained knowledge and data from the descriptive study have been used to
develop a solution that should confirm or deny the research hypothesis. The proposed solution
for CSCW enhancement is based on the framework developed and presented in Chapter 4. The
framework runs a continuous cyclic process for the semi-automatic execution of selected
engineering design activities using the CPN methodology and custom functions written
specifically for each activity type. The first section in Chapter 4 provides an overview of the
execution process of the activities and introduces the reader with a roadmap of how the CSCW
enhancement has been developed. Several subsequent sections present a different way how a
CPN model can be designed (from simple to complex) and describe the main elements of CPN
models, which are mandatory to understand the models presented at the end of the chapter. In
the same chapter, an activity list has been defined, and it is described how activities are
instantiated and how they are changed during their lifecycle. Section 4.10 presents the final
framework for CSCW enhancement and associated process for execution of engineering design
activities. The chapter continues with a description of software components that support the
8. Conclusion
122
normal work of the execution process. Chapter 4 concludes with a detailed explanation of each
segment of two different CPN model templates. These segments also represent all potentials
that can be achieved using such CPN models as templates for the execution of engineering
design activities in the scope of the proposed framework.
After the CSCW enhancement has been developed, it was validated through two case studies.
The validation process was reported in Chapter 5. Two different projects have been used to
validate the framework’s ability to work in a different working environment. In the first case
study, several activities that had been recognised in the experimental dataset were processed
using the execution process and corresponding CPN model templates. In the second case study,
an MDM matrix was used to recognise and mark out possible critical communication situations
in order to create activity instances based on such situations. The aim of these activities is to
support engineers during the negotiations about design parameter values.
Finally, this chapter summarises the research reported in this thesis. After the executive
summary, research contributions will be pointed out as well as research limitations. The chapter
concludes with the proposals for future work that would enhance the proposed framework and
process for the execution of engineering design activities.
8.2. Research limitations
Research limitations are primarily related to the quality and quantity of the empirical dataset.
The examined dataset comprised three projects, of which two are the projects for making
facelift changes on vehicles only on a conceptual level. In contrast, the third analysed project
was a conceptual design for a vehicle architecture module. The input data has greatly defined
the direction of the research, but also it put some constraints on the research. In order to make
the CSCW enhancement more comprehensive, additional projects should be analysed.
Moreover, not only more projects but also different types of projects should be analysed. The
recognised activity types are extracted from a conceptual design project, while more and
different kind of activities might be found in embodiment or detail design projects. Using such
projects, the taxonomy would be extended, and new types of CPN model templates would be
needed. While developing the framework, this factor has been taken into account. Therefore,
the core of the CSCW enhancement would remain the same - only new activity types would
have to be defined and templates designed.
8. Conclusion
123
Quality of data had a significant impact on dataset analysis. Data is obtained from meeting
reports that were written by several note-takers. Each person has a unique style of writing notes,
and on many occasions, typos and grammatical errors were found. In the German language,
many surnames of designers are the same as vehicle components. All of those are a barrier for
accurate data analysis.
The proposed enhancement could bring many benefits, which are discussed in the previous
chapter, but all benefits could be better recognized in large companies on large projects than in
smaller companies. Moreover, it is difficult to conduct a framework validation and testing of
the solution on a project with a small scope due to a limited number of designers and activities
that can arise. The enhancement uses CPN models that have to be defined and built before any
usage. Hence, if the activity would occur only a few times in long time periods, it is not
beneficial to develop an additional CPN model for such an activity type. The proposed CSCW
enhancement could reach its maximal potential on projects where the emphasis is on variant
development such as vehicle development since activity types remain the same for all projects;
only the parameter values would change.
Regarding CPN models and their execution process, the main drawback of the current solution
is that the execution of a CPN model instance will not continue as soon as the new data becomes
available. It will be executed only in the next processing cycle. Therefore, there is always a
time gap from the moment when data become available until a particular CPN model instance
gets its turn to rerun the execution.
It is important to highlight that this CSCW enhancement has been developed in a limited testing
environment. In the partner company where the analysis has been conducted, a large number
of projects and tasks are conducted simultaneously.
8.3. Future work
Besides the additional work required to address the research limitations, there also exist several
possible directions for further developments and research extensions.
Using the proposed CSCW enhancement, the activity instances have to be defined by a person
who will recognise them in meeting reports or define them in some other way. This step could
be brought to the next level by implementing a software solution such as one proposed by
Breški [84], which would support a user in the definition of the activities.

8. Conclusion
124
During the analysis of activities, it has been noticed that particular activities always come in
the same sequence (e.g. make a change → store change; schedule an additional meeting →
inform about the discussion on the next regular meeting). Such activity sequences could be then
processed as one set of activities and therefore make the activity processing more efficient.
Another improvement could be made by enhancing the execution process of the activity list in
which more than one activity could be processed at once. That way, the time to process all
activity instances in one processing cycle would be reduced.
Regarding CPN models, additional logic could be implemented, which would capture and
analyse all past decisions made during the activity execution, and therefore help a user during
execution of the future activities of the same type to choose the best direction for finishing the
activity instance.
Finally, further research could be directed toward a gradual introduction of artificial intelligence
methods to simulate a semi-intelligent behaviour if some simple and routine sequences of
reasoning are executed in automatic CPN simulation mode. This should be the groundwork for
introducing ‘smart’ engineering design support.
REFERENCES
[1] Karniel A, Reich Y. Managing the Dynamics of New Product Development Processes.
London: Springer London; 2011. https://doi.org/10.1007/978-0-85729-570-5.
[2] Wynn DC, Clarkson PJ. Process models in design and development. Res Eng Des
2017;29:161–202. https://doi.org/10.1007/s00163-017-0262-7.
[3] Sim SK, Duffy AHB. Towards an ontology of generic engineering design activities.
Res Eng Des 2003;14:200–23. https://doi.org/10.1007/s00163-003-0037-1.
[4] Ahmed S, Štorga M. Merged ontology for engineering design: Contrasting empirical
and theoretical approaches to develop engineering ontologies. Artif Intell Eng Des
Anal Manuf 2009;23:391–407. https://doi.org/10.1017/S0890060409000146.
[5] Boes S, Batliner M, Stücheli M, Meboldt M. A Taxonomy of Testing Activities in
Product Development. 2017.
[6] Ullman DG. A taxonomy for mechanical design. Res Eng Des 1992;3:179–89.
https://doi.org/10.1007/BF01580519.
[7] Ostergaard KJ, Summers JD. A Taxonomy for Collaborative Design. Vol. 2 29th Des.
Autom. Conf. Parts A B, ASMEDC; 2003, p. 755–64.
https://doi.org/10.1115/DETC2003/DAC-48781.
[8] Ropohl G. Allgemeine Technologie : eine Systemtheorie der Technik. 3., überarb.
Aufl. Universitätsverlag Karlsruhe; 2009. https://doi.org/10.5445/KSP/1000011529.
[9] Eckert C, Stacey M. Dimensions of communication in design. Proc. 13th Int. Conf.
Eng. Des. Des. Manag. – Process Inf. Issues, Glasgow, UK: 2001, p. 473–80.
[10] Gopsill JA, McAlpine HC, Hicks BJ. Supporting engineering design communication
using a custom-built social media tool - PartBook. Adv Eng Informatics 2015;29:523–
48. https://doi.org/10.1016/j.aei.2015.04.008.
[11] Fernandes J, Henriques E, Silva A, Moss MA. A method for imprecision management
in complex product development. Res Eng Des 2014;25:309–24.
https://doi.org/10.1007/s00163-014-0178-4.
[12] Toepfer F, Naumann T. Management of vehicle architecture parameters. In:
Marjanovic D, Storga M, Pavkovic N, Bojcetic N, Skec S, editors. Proc. Des. 2016,
14th Int. Des. Conf., Design Society, Glasgow, UK; 2016, p. 1679–88.
[13] Toepfer F, Naumann T. Parameter Management, a Novel Approach in Systems
Engineering. In: Chakrabarti A, Chakrabarti D, editors. Res. into Des. Communities,
References
126
Vol. 1 Proc. ICoRD 2017, Singapore: Springer Singapore; 2017, p. 383–95.
https://doi.org/10.1007/978-981-10-3518-0_34.
[14] Toepfer F, Naumann T. Towards cross-linked development of highly complex
products. In: Maier A, Škec S, Kim H, Kokkolaras M, Oehmen J, Fadel G, et al.,
editors. Proc. 21st Int. Conf. Eng. Des. (ICED 17), vol. 2, THE UNIVERSITY OF
BRITISH COLUMBIA, VANCOUVER, CANADA; 2017, p. 279–88.
[15] Flanagan TL, Eckert CM, Clarkson PJ. Parameter trails 2003:1–10.
[16] Königs SF. Konzeption und Realisierung einer Methode zur templategestützten
Systementwicklung 2014. https://doi.org/10.14279/depositonce-3475.
[17] McMahon C. Design Informatics: Supporting Engineering Design Processes with
Information Technology. J INDIAN Inst Sci 2015;95:365–78.
[18] Badke-Schaub P, Frankenberger E. Design Representations in Critical Situations of
Product Development. Des. Represent., London: Springer London; 2004, p. 105–26.
https://doi.org/10.1007/978-1-85233-863-3_5.
[19] Mulyar NA, Van Der Aalst WMP. Towards a pattern language for colored petri nets.
In: Kurt J, editor. roceedings Sixth Work. Pract. Use Coloured Petri Nets CPN Tools
(CPN 2005), Aarhus, Denmark: University of Aarhus; 2005, p. 39–48.
[20] Jensen K, Kristensen LM. Coloured Petri Nets. vol. 1. Berlin, Heidelberg: Springer
Berlin Heidelberg; 2009. https://doi.org/10.1007/b95112.
[21] Juranic J, Pavkovic N, Naumann T, Marjanovic D. Modelling the design parameters
dynamics with Petri Nets. In: Maier A, Škec S, Kim H, Kokkolaras M, Oehmen J,
Fadel G, et al., editors. Proc. 21st Int. Conf. Eng. Des., vol. 2, THE UNIVERSITY OF
BRITISH COLUMBIA, VANCOUVER, CANADA; 2017, p. 91–100.
[22] Pavković N, Vlah L, Juranić J, Kuzmić N. Coloured Petri Nets model of designers
collaboration in iterative resolving of coupled design parameters. Proc. 15th Int. Des.
Conf. Des. 2018, 417–428. Dubrovnik, Croat. May 21–24, 2018, p. 417–28.
https://doi.org/10.21278/idc.2018.0182.
[23] Škec S. Nematerijalni indikatori u razvoju tehničkih sustava. Faculty of Mechanical
Engineering and Naval Architecture Zagreb, University of Zagreb, 2015.
[24] Blessing LTM, Chakrabarti A. DRM, a Design Research Methodology. London:
Springer London; 2009. https://doi.org/10.1007/978-1-84882-587-1.
[25] Wynn DC, Kreimeyer M, Clarkson PJ, Lindemann U. Dependency modelling in
complex system design. J Eng Des 2012;23:718–21.
References
127
https://doi.org/10.1080/09544828.2012.714530.
[26] van der Hoorn B. Discussing project status with the project-space model: An action
research study. Int J Proj Manag 2016;34:1638–57.
https://doi.org/10.1016/j.ijproman.2016.09.001.
[27] Shapiro D, Hamraz B, Sommer AF, Clarkson PJ. Investigating the impact of changes
in iteration-likelihoods on design process performance. Concurr Eng 2015;23:250–64.
https://doi.org/10.1177/1063293X15588202.
[28] Browning TR. Design Structure Matrix Extensions and Innovations: A Survey and
New Opportunities. IEEE Trans Eng Manag 2016;63:27–52.
https://doi.org/10.1109/TEM.2015.2491283.
[29] Amigo CR, Iritani DR, Rozenfeld H, Ometto A. Product Development Process
Modeling: State of the Art and Classification. In: Abramovici M, Stark R, editors.
Smart Prod. Eng., Springer Berlin Heidelberg; 2013, p. 169–79.
https://doi.org/10.1007/978-3-642-30817-8_17.
[30] Karniel A, Reich Y. Multi-level modelling and simulation of new product development
processes. J Eng Des 2013;24:185–210.
https://doi.org/10.1080/09544828.2012.720015.
[31] Mulyar NA, Van Der Aalst WMP. Patterns in Colored Petri Nets. BETA Work. Pap.
Ser., Eindhoven: Eindhoven University of Technology; 2005.
[32] Arena D, Kiritsis D. A Methodological Framework for Ontology-Driven Instantiation
of Petri Net Manufacturing Process Models. 14th IFIP Int. Conf. PLM 2017, 2017, p.
557–67. https://doi.org/10.1007/978-3-319-72905-3_49.
[33] Karniel A, Reich Y. Formalizing a Workflow-Net Implementation of Design-Structure-
Matrix-Based Process Planning for New Product Development. IEEE Trans Syst Man,
Cybern - Part A Syst Humans 2011;41:476–91.
https://doi.org/10.1109/TSMCA.2010.2091954.
[34] Pla A, Gay P, Meléndez J, López B. Petri net-based process monitoring: A workflow
management system for process modelling and monitoring. J Intell Manuf
2014;25:539–54. https://doi.org/10.1007/s10845-012-0704-z.
[35] Lenka A. A Review of Petri Net Modeling of Dynamical Systems. Indian J Comput Sci
Eng 2012;3:605–22.
[36] Eder WE. Information Systems for Designers. Int. Conf. Eng. Des., 1989.
[37] Hubka V, Eder WE. Theory of Technical Systems. Berlin, Heidelberg: Springer Berlin
References
128
Heidelberg; 1988. https://doi.org/10.1007/978-3-642-52121-8.
[38] Wynn DC, Eckert CM, Clarkson PJ. Research into the design and development
process: some themes and an overview of the special issue. Res Eng Des 2019;30:157–
60. https://doi.org/10.1007/s00163-019-00315-7.
[39] Wynn DC, Clarkson PJ. Process models in design and development. Res Eng Des
2018;29:161–202. https://doi.org/10.1007/s00163-017-0262-7.
[40] Pahl G, Beitz W, Feldhusen J, Grote K-H. Engineering Design. London: Springer
London; 2007. https://doi.org/10.1007/978-1-84628-319-2.
[41] Urlich KT, Eppinger SD, Yang MC. Product Design and Development. 7th ed.
McGraw-Hill Education; 2020.
[42] Demoly F, Kim K-Y, Horváth I. Ontological engineering for supporting semantic
reasoning in design: deriving models based on ontologies for supporting engineering
design. J Eng Des 2019;30:405–16. https://doi.org/10.1080/09544828.2019.1633626.
[43] Baclawski K, Bennett M, Berg-Cross G, Fritzsche D, Schneider T, Sharma R, et al.
Ontology Summit 2017 communiqué – AI, learning, reasoning and ontologies. Appl
Ontol 2018;13:3–18. https://doi.org/10.3233/AO-170191.
[44] Ahmed S. Encouraging reuse of design knowledge: a method to index knowledge. Des
Stud 2005;26:565–92. https://doi.org/10.1016/j.destud.2005.02.005.
[45] Štorga M, Andreasen MM, Marjanović D. The design ontology: foundation for the
design knowledge exchange and management. J Eng Des 2010;21:427–54.
https://doi.org/10.1080/09544820802322557.
[46] Li L, Qin F, Gao S, Liu Y. An approach for design rationale retrieval using ontology-
aided indexing. J Eng Des 2014;25:259–79.
https://doi.org/10.1080/09544828.2014.969690.
[47] Lim SCJ, Liu Y, Yong C. No Title. Proc. 20th Int. Conf. Eng. Des. (ICED15). Milan,
Italy, July 27–30, 2015, p. 267–76.
[48] Vajna S. Integrated Design Engineering. Springer; 2014.
[49] Lindemann U, Maurer M, Braun T. Structural Complexity Management. Berlin,
Heidelberg: Springer Berlin Heidelberg; 2009. https://doi.org/10.1007/978-3-540-
87889-6.
[50] Wynn DC, Eckert CM. Perspectives on iteration in design and development. Res Eng
Des 2016;28:153–84. https://doi.org/10.1007/s00163-016-0226-3.
[51] Clarkson PJ, Simons C, Eckert C. Predicting Change Propagation in Complex Design.
References
129
J Mech Des 2004;126:788. https://doi.org/10.1115/1.1765117.
[52] Eckert CM, Clarkson PJ. Planning development processes for complex products. Res
Eng Des 2010;21:153–71. https://doi.org/10.1007/s00163-009-0079-0.
[53] Maier AM, Kreimeyer M, Lindemann U, Clarkson PJ. Reflecting communication: a
key factor for successful collaboration between embodiment design and simulation. J
Eng Des 2009;20:265–87. https://doi.org/10.1080/09544820701864402.
[54] Eckert C, Clarkson J, Stacey M. Information flow in engineering companies: Problems
and their causes. Int Conf Eng Des 2001:43–50.
[55] Rouibah K, Caskey K. A workflow system for the management of inter-company
collaborative engineering processes. J Eng Des 2003;14:273–93.
https://doi.org/10.1080/0954482031000091059.
[56] Rouibah K, Caskey KR. Change management in concurrent engineering from a
parameter perspective. Comput Ind 2003;50:15–34. https://doi.org/10.1016/S0166-
3615(02)00138-0.
[57] Müller R. Event-Oriented Dynamic Adaptation of Workflows: Model, Architecture and
Implementation. University of Leipzig, Germany, 2002.
[58] Colson E. What AI-driven decision making looks like. Harv Bus Rev 2019.
https://hbr.org/2019/07/what-ai-driven-decision-making-looks-like#comment-section.
[59] Baecker RM, Grudin J, Greeberg S, Buxton W. Readings in Human-Computer
Interaction : Toward the Year 2000. Morgan Kaufmann; 1995.
[60] Brisco R, Whitfield RI, Grierson H. A novel systematic method to evaluate computer-
supported collaborative design technologies. Res Eng Des 2019;31:53–81.
https://doi.org/10.1007/s00163-019-00323-7.
[61] Badke-Schaub P, Frankenberger E. Analysis of design projects. Des Stud
1999;20:465–80. https://doi.org/10.1016/S0142-694X(99)00017-4.
[62] Conway AP, Ion WJ. Enhancing the design dialogue: an architecture to document
engineering design activities. J Eng Des 2013;24:140–64.
https://doi.org/10.1080/09544828.2012.690859.
[63] Conway AP, Giess MD, Lynn A, Ding L, Goh YM, McMahon CA, et al. Holistic
Engineering Design: A Combined Synchronous and Asynchronous Approach. Vol. 3
28th Comput. Inf. Eng. Conf. Parts A B, ASME; 2008, p. 1227–36.
https://doi.org/10.1115/DETC2008-49340.
[64] Wolfartsberger J. Analyzing the potential of Virtual Reality for engineering design
References
130
review. Autom Constr 2019;104:27–37. https://doi.org/10.1016/j.autcon.2019.03.018.
[65] Freeman IJ, Salmon JL, Coburn JQ. CAD Integration in Virtual Reality Design
Reviews for Improved Engineering Model Interaction. Vol. 11 Syst. Des. Complex.,
American Society of Mechanical Engineers; 2016.
https://doi.org/10.1115/IMECE2016-66948.
[66] Noel F, Nguyen A, Ba N, Sadeghi S. Qualitative comparison of 2D and 3D perception
for information sharing dedicated to manufactured product design. 2012 IEEE 3rd Int.
Conf. Cogn. Infocommunications, IEEE; 2012, p. 261–5.
https://doi.org/10.1109/CogInfoCom.2012.6421991.
[67] Huet G, Culley SJ, McMahon CA, Fortin C. Making sense of engineering design
review activities. Artif Intell Eng Des Anal Manuf 2007;21:243.
https://doi.org/10.1017/S0890060407000261.
[68] Juranić J, Pavković N, Naumann T, Toepfer F. Patterns of engineering design
collaboration and reasoning activities modelled with Coloured Petri Nets. J Eng Des
2019;30:563–98. https://doi.org/10.1080/09544828.2019.1630803.
[69] Piccolo SA, Maier AM, Lehmann S, McMahon CA. Iterations as the result of social
and technical factors: empirical evidence from a large-scale design project. Res Eng
Des 2019;30:251–70. https://doi.org/10.1007/s00163-018-0301-z.
[70] Le HN. A transformation-based model integration framework to support iteration
management in engineering design. University of Cambridge, 2013.
[71] Jun H-B, Suh H-W. A Modeling Framework for Product Development Process
Considering its Characteristics. IEEE Trans Eng Manag 2008;55:103–19.
https://doi.org/10.1109/TEM.2007.912808.
[72] Browning TR. Applying the design structure matrix to system decomposition and
integration problems: a review and new directions. IEEE Trans Eng Manag
2001;48:292–306. https://doi.org/10.1109/17.946528.
[73] Danilovic M, Browning TR. Managing complex product development projects with
design structure matrices and domain mapping matrices. Int J Proj Manag
2007;25:300–14. https://doi.org/10.1016/j.ijproman.2006.11.003.
[74] De Lessio MP, Wynn DC, Clarkson PJ. Modelling the planning system in design and
development. Res Eng Des 2019;30:227–49. https://doi.org/10.1007/s00163-017-0272-
5.
[75] Siddharth L, Sarkar P. A Multiple-Domain Matrix Support to Capture Rationale for

References
131
Engineering Design Changes. J Comput Inf Sci Eng 2018;18.
https://doi.org/10.1115/1.4039850.
[76] Vallath Ramachandran V. Managing the Interdependencies in Complex Development
Projects with Matrix-Based Methods. Proc. 21st Int. DSM Conf., The Design Society;
2019, p. 101–8. https://doi.org/10.35199/dsm2019.14.
[77] Kreimeyer M, Braun S, Guertler M, Lindemann U. Extending multiple domain
matrices to allow for the modeling of boolean operators in process models. DS 58-1
Proc. ICED 09, 17th Int. Conf. Eng. Des. Vol. 1, Des. Process. Palo Alto, CA, USA,
24.-27.08.2009, 2009, p. 1–12.
[78] Juranić J, Pavković N, Jurinić D. Management of design iterations on coupled
parameters in design teamwork using multiple domain matrix and Coloured petri nets.
Proc Des Soc Des Conf 2020;1:617–26. https://doi.org/10.1017/dsd.2020.264.
[79] Clarkson PJ, Hamilton JR. “Signposting”, a parameter-driven task-based model of the
design process. Res Eng Des - Theory, Appl Concurr Eng 2000;12:18–38.
https://doi.org/10.1007/s001630050021.
[80] Toepfer F, Naumann T, Anderer J, Vajna S. Integrating the knowledge about
functional interdependencies into a parameter management approach, 2018, p. 477–86.
https://doi.org/10.21278/idc.2018.0222.
[81] Yang C, Yang R, Xu T, Li Y. Negotiation model and tactics of manufacturing
enterprise supply chain based on multi-agent. Adv Mech Eng
2018;10:168781401878362. https://doi.org/10.1177/1687814018783625.
[82] Khosravifar S. Modeling Multi Agent Communication Activities with Petri Nets. Int J
Inf Educ Technol 2013;3:310–4. https://doi.org/10.7763/IJIET.2013.V3.287.
[83] Westergaard M, Kristensen LM. The Access/CPN Framework: A Tool for Interacting
with the CPN Tools Simulator, 2009, p. 313–22. https://doi.org/10.1007/978-3-642-
02424-5_19.
[84] Breški T. Software support for preparing reports from the project team meeting.
University of Zagreb, Faculty of Mechanical Engineering and Naval Architecture,
2018.
[85] Wasiak J, Hicks B, Newnes L, Dong A, Burrow L. Understanding engineering email:
the development of a taxonomy for identifying and classifying engineering work. Res
Eng Des 2010;21:43–64. https://doi.org/10.1007/s00163-009-0075-4.
[86] Kumar P, Mocko G. Modeling and Analysis of an Ontology of Engineering Design
References
132
Activities Using the Design Structure Matrix. Vol. 3 19th Int. Conf. Des. Theory
Methodol. 1st Int. Conf. Micro- Nanosyst. 9th Int. Conf. Adv. Veh. Tire Technol. Parts
A B, ASMEDC; 2007, p. 559–71. https://doi.org/10.1115/DETC2007-35634.
[87] Sheng J, Prescott D. A coloured Petri net framework for modelling aircraft fleet
maintenance. Reliab Eng Syst Saf 2019;189:67–88.
https://doi.org/10.1016/j.ress.2019.04.004.
[88] Brant-Ribeiro T, Araújo RD, Mendonça IE, Soares MS, Cattelan RG. Interactive web
interfaces modeling, simulation and analysis using Colored Petri Nets. Softw Syst
Model 2019;18:721–37. https://doi.org/10.1007/s10270-017-0593-x.
[89] Yang Q, Kherbachi S, Hong YS, Shan C. Identifying and managing coordination
complexity in global product development project. Int J Proj Manag 2015;33:1464–75.
https://doi.org/10.1016/j.ijproman.2015.06.011.
[90] van der Aalst WMP, Stahl C, Westergaard M. Strategies for Modeling Complex
Processes Using Colored Petri Nets. In: Jensen K, van der Aalst W, Balbo G, Koutny
M, Wolf K, editors. Trans. Petri Nets Other Model. Concurr., 2013, p. 6–55.
https://doi.org/10.1007/978-3-642-38143-0_2.
[91] Clarkson PJ, Hamilton JR. “Signposting”, A Parameter-driven Task-based Model of
the Design Process. Res Eng Des 2000;12:18–38.
https://doi.org/10.1007/s001630050021.
[92] Durmus MS, Takai S. Modeling Moving-Block Railway Systems: A Generalized
Batches Petri Net Approach. SICE J Control Meas Syst Integr 2013;6:403–10.
https://doi.org/10.9746/jcmsi.6.403.
[93] Yu Y, Zhao Z, Lv Y, Guo H. Research on Missile Attack and Defense Modeling of
High-level Missile Based on Discrete Event. Proc. 2017 5th Int. Conf. Front. Manuf.
Sci. Meas. Technol. (FMSMT 2017), Paris, France: Atlantis Press; 2017.
https://doi.org/10.2991/fmsmt-17.2017.242.
[94] Wang Z, Song JH, Zhu XD. Research for Model Based on Petri Nets about
Maintenance and Support of Military Aviation Equipment. Appl Mech Mater
2013;347–350:2968–72. https://doi.org/10.4028/www.scientific.net/AMM.347-
350.2968.
[95] Wallace K. Transferring Design Methods into Practice. Futur. Des. Methodol.,
London: Springer London; 2011, p. 239–48. https://doi.org/10.1007/978-0-85729-615-
3_21.
References
133
[96] Birkhofer H. Summary - General Reflections on Design Methodology. Futur. Des.
Methodol., London: Springer London; 2011, p. 285–90. https://doi.org/10.1007/978-0-
85729-615-3_25.
[97] Petri CA. Kommunikation mit Automaten. Universität Hamburg, 1962.
[98] Reisig W. Petri Nets: An introduciton. Springer, Berlin, Heidelberg; 1985.
https://doi.org/https://doi.org/10.1007/978-3-642-69968-9.
[99] Jensen K, Rozenberg G. High-level Petri Nets: Theory and Application. 1st ed.
Springer-Verlag Berlin Heidelberg; 1991. https://doi.org/10.1007/978-3-642-84524-6.
[100] Huber P, Jensen K, Shapiro RM. Hierarchies in Coloured Petri Nets. High-level Petri
Nets, Berlin, Heidelberg: Springer Berlin Heidelberg; 1991, p. 215–43.
https://doi.org/10.1007/978-3-642-84524-6_7.
[101] Agha GA, Cindio FD, Rozenberg G. Concurrent Object-Oriented Programming and
Petri Nets: Advances in Petri Nets. 1st ed. Springer-Verlag Berlin Heidelberg; 2001.
https://doi.org/10.1007/3-540-45397-0.
[102] Diallo O, Rodrigues JJPC, Sene M. Performances evaluation and Petri nets. Model.
Simul. Comput. Networks Syst., Elsevier; 2015, p. 313–55.
https://doi.org/10.1016/B978-0-12-800887-4.00011-0.
[103] Merlin PM. A study of the recoverability of computing systems. University of
California, Irvine, 1974.
[104] Ramachandani C. Analysis of asynchronous concurrent systems by timed Petri nets.
201 Vassar Street, W59-200 Cambridge, MA, United States: 1974.
[105] Sifakis J. Use of Petri Nets for Performance Evaluation. Meas. Model. Eval. Comput.
Syst. Proc. Third Int. Symp., BonBad Godesberg, Germany, October 3-5; 1977, p. 75–
93.
[106] Walter B. Transaktionsorientierte Recovery-Konzepte für verteilte Datenbanksysteme.
University of Stuttgart, Germany, 1982.
[107] Popova-Zeugmann L. Time and Petri Nets. Berlin, Heidelberg: Springer Berlin
Heidelberg; 2013. https://doi.org/10.1007/978-3-642-41115-1.
[108] Jensen K, Kristensen LM, Wells L. Coloured Petri Nets and CPN Tools for modelling
and validation of concurrent systems. Int J Softw Tools Technol Transf 2007;9:213–54.
https://doi.org/10.1007/s10009-007-0038-x.
[109] Gkolfi A, Din CC, Johnsen EB, Kristensen LM, Steffen M, Yu IC. Translating active
objects into colored Petri nets for communication analysis. Sci Comput Program
References
134
2019;181:1–26. https://doi.org/10.1016/j.scico.2019.04.002.
[110] McMahon CA, Xianyi M. A network approach to parametric design integration. Res
Eng Des 1996;8:14–31. https://doi.org/10.1007/BF01616554.
[111] Horvath I, Vergeest J, van Der Vegte W. Modeling design processes and designer
decisions with advanced petri-nets. In: Lehoczky L, Kalmar L, editors. Int. Comput.
Sci. Conf., Miskolc: University of Miskolc; 2000, p. 81–90.
https://doi.org/10.1.1.142.4701.
[112] Karniel A, Reich Y. Formalizing a Workflow-Net Implementation of Design-Structure-
Matrix-Based Process Planning for New Product Development. IEEE Trans Syst Man,
Cybern - Part A Syst Humans 2011;41:476–91.
https://doi.org/10.1109/TSMCA.2010.2091954.
[113] Topic G, Jevtic D, Kunstic M. Petri Net-Based Simulation and Analysis of the
Software Development Process. Knowledge-Based Intell. Inf. Eng. Syst., Berlin,
Heidelberg: Springer Berlin Heidelberg; 2008, p. 418–25. https://doi.org/10.1007/978-
3-540-85565-1_52.
[114] Topic G, Jevtic D. Modelling, simulation and resource optimisation of complex
development project by fusion of multiple-domain matrix and coloured Petri nets
methods. Int J Simul Process Model 2019;14:51–63.
https://doi.org/10.1504/IJSPM.2019.097713.
135
APPENDICES
Appendix A: A literature review on Petri nets and their
extensions
A.1. Petri Nets
Petri Net (PN) is a mathematical modelling language for the representation of discrete event
dynamic systems introduced by Carl Petri in the early ’60s [97]. Over the years, it has evolved
through four distinguishable generations:
6. Low-level PN – used for modelling system control [98]
7. High-level PN – describing both control and system data [99]
8. Hierarchical PN – introduced abstracted system structures [100]
9. Object-oriented PN – support for modern system-oriented approaches [101]
Further development of the language was not stopped there; contrary, it has got many
extensions, of which some are used in this research. Even decades later, researchers [102] claim
that PNs are a tremendously important mathematical and graphical tool in modelling discrete
events systems, which are characterised as distributed, concurrent, synchronous or
asynchronous, parallel, nondeterministic and stochastic. An additional advantage of the tool is
its performance analysis of a modelled system. Its graphical component allows the user to
model a system and visualise its behaviours using a bipartite directed graph. The following sub-
sections give an overview of ordinary PN, extensions used in this research and application of
PN in the product design area.
A.1.1. Ordinary Petri Nets
An ordinary PN is a PN that comprises only the basics concepts. However, it provides the
optimum way to explain the basic components and most important properties, which are crucial
for the latter understanding of PN models. Typical PN has two different types of nodes called
places and transitions. Places are represented by circles, while rectangles represent transitions.
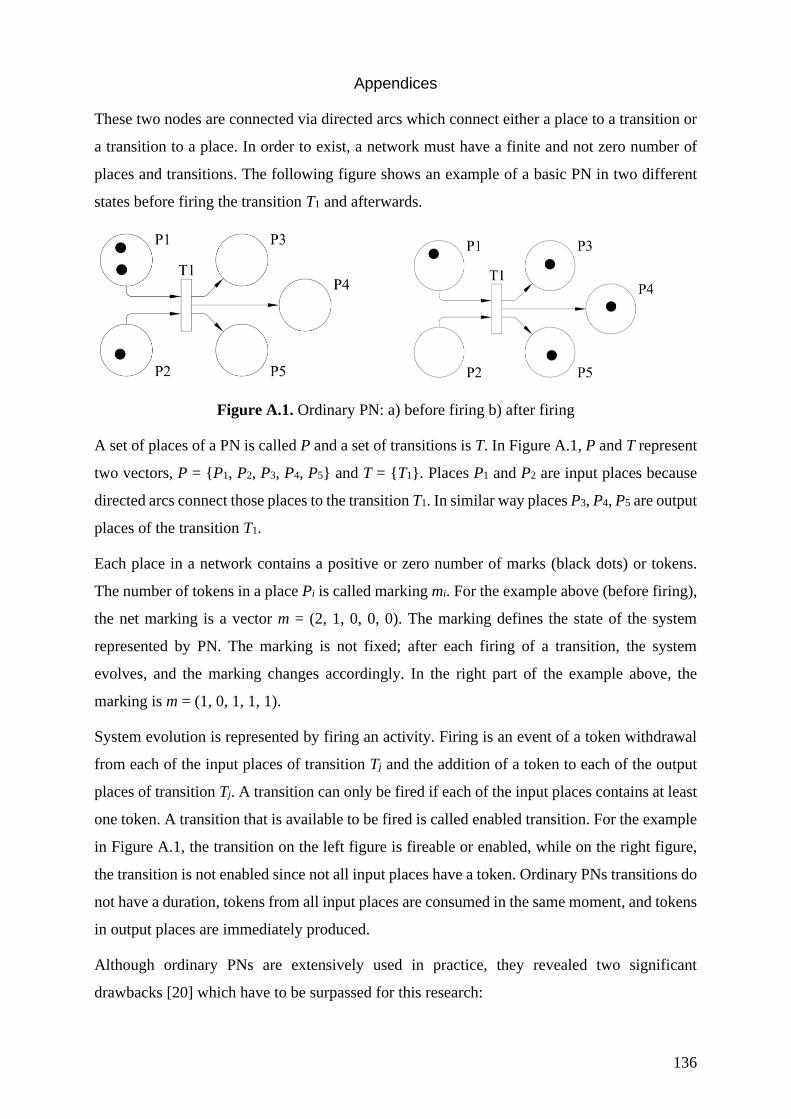
Appendices
136
These two nodes are connected via directed arcs which connect either a place to a transition or
a transition to a place. In order to exist, a network must have a finite and not zero number of
places and transitions. The following figure shows an example of a basic PN in two different
states before firing the transition T1 and afterwards.
Figure A.1. Ordinary PN: a) before firing b) after firing
A set of places of a PN is called P and a set of transitions is T. In Figure A.1, P and T represent
two vectors, P = {P1, P2, P3, P4, P5} and T = {T1}. Places P1 and P2 are input places because
directed arcs connect those places to the transition T1. In similar way places P3, P4, P5 are output
places of the transition T1.
Each place in a network contains a positive or zero number of marks (black dots) or tokens.
The number of tokens in a place Pi is called marking mi. For the example above (before firing),
the net marking is a vector m = (2, 1, 0, 0, 0). The marking defines the state of the system
represented by PN. The marking is not fixed; after each firing of a transition, the system
evolves, and the marking changes accordingly. In the right part of the example above, the
marking is m = (1, 0, 1, 1, 1).
System evolution is represented by firing an activity. Firing is an event of a token withdrawal
from each of the input places of transition Tj and the addition of a token to each of the output
places of transition Tj. A transition can only be fired if each of the input places contains at least
one token. A transition that is available to be fired is called enabled transition. For the example
in Figure A.1, the transition on the left figure is fireable or enabled, while on the right figure,
the transition is not enabled since not all input places have a token. Ordinary PNs transitions do
not have a duration, tokens from all input places are consumed in the same moment, and tokens
in output places are immediately produced.
Although ordinary PNs are extensively used in practice, they revealed two significant
drawbacks [20] which have to be surpassed for this research:
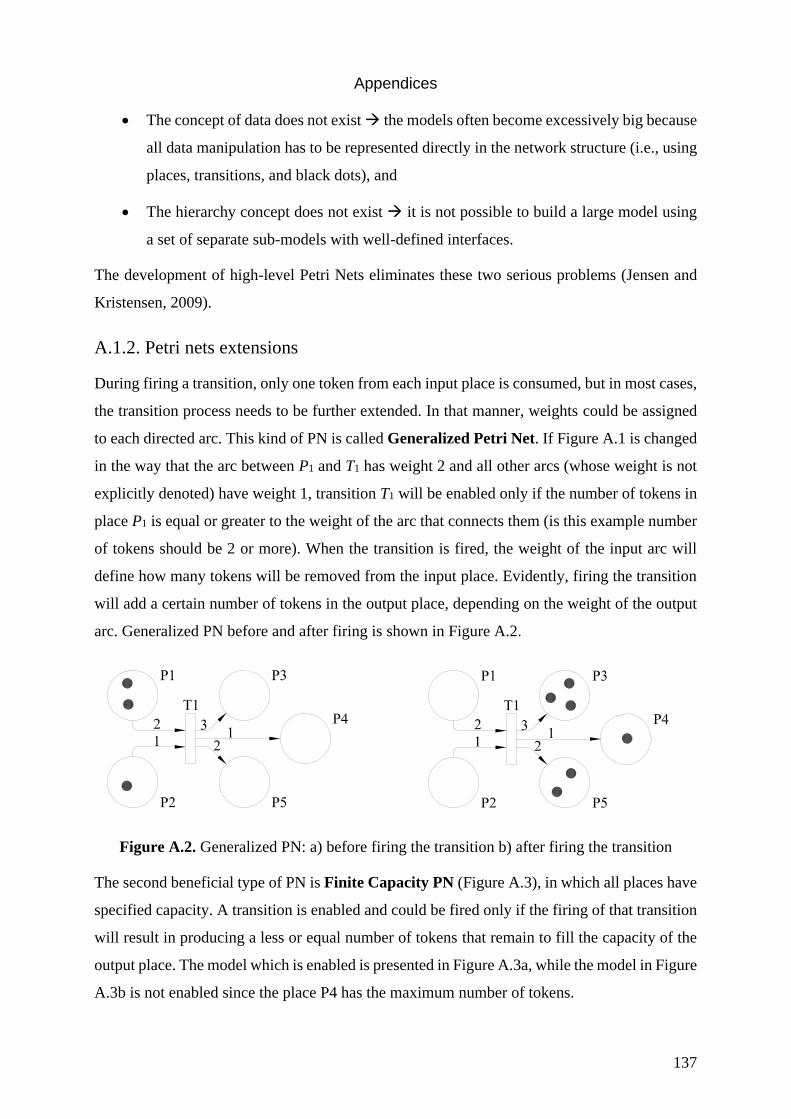
Appendices
137
• The concept of data does not exist → the models often become excessively big because
all data manipulation has to be represented directly in the network structure (i.e., using
places, transitions, and black dots), and
• The hierarchy concept does not exist → it is not possible to build a large model using
a set of separate sub-models with well-defined interfaces.
The development of high-level Petri Nets eliminates these two serious problems (Jensen and
Kristensen, 2009).
A.1.2. Petri nets extensions
During firing a transition, only one token from each input place is consumed, but in most cases,
the transition process needs to be further extended. In that manner, weights could be assigned
to each directed arc. This kind of PN is called Generalized Petri Net. If Figure A.1 is changed
in the way that the arc between P1 and T1 has weight 2 and all other arcs (whose weight is not
explicitly denoted) have weight 1, transition T1 will be enabled only if the number of tokens in
place P1 is equal or greater to the weight of the arc that connects them (is this example number
of tokens should be 2 or more). When the transition is fired, the weight of the input arc will
define how many tokens will be removed from the input place. Evidently, firing the transition
will add a certain number of tokens in the output place, depending on the weight of the output
arc. Generalized PN before and after firing is shown in Figure A.2.
Figure A.2. Generalized PN: a) before firing the transition b) after firing the transition
The second beneficial type of PN is Finite Capacity PN (Figure A.3), in which all places have
specified capacity. A transition is enabled and could be fired only if the firing of that transition
will result in producing a less or equal number of tokens that remain to fill the capacity of the
output place. The model which is enabled is presented in Figure A.3a, while the model in Figure
A.3b is not enabled since the place P4 has the maximum number of tokens.

Appendices
138
Figure A.3. Finite capacity PN: a) enabled b) not enabled because one of the places has full
capacity
Among all extensions, there is one called Extended PN. An advantage for that type of PN is
that it has an additional type of directed arcs called inhibitor arc. Inhibitor arc is always directed
from a place Pi to a transition Tj, which implies that the place Pi could only serve as input place.
Instead of an arrow on one or both ends, it has a small circle on the end, which connects to a
transition. A transition that has an input place connected with inhibitor arc must have an
additional regular input place. The cause can be found in an inhibitor arc behaviour. For
example, if place P2 in Figure A.4 is connected with inhibitor arc to T1, transition T1 will be
enabled only if P2 does not contain any token and all other input places contain at least one
token (Figure A.4b).
Figure A.4. Extended PN: a) enabled b) not enabled
When simulating PN, a common issue is that more than one transition is enabled at the same
moment. Although firing a transition takes no time, it is important to give priority to one
transition to fire it before the other enabled transitions. Hence, Priority PN will come in handy
in such situations. This type of net includes a PN and a partial order relation on the net
transitions. The order relation will determine which transition has a firing priority if they are
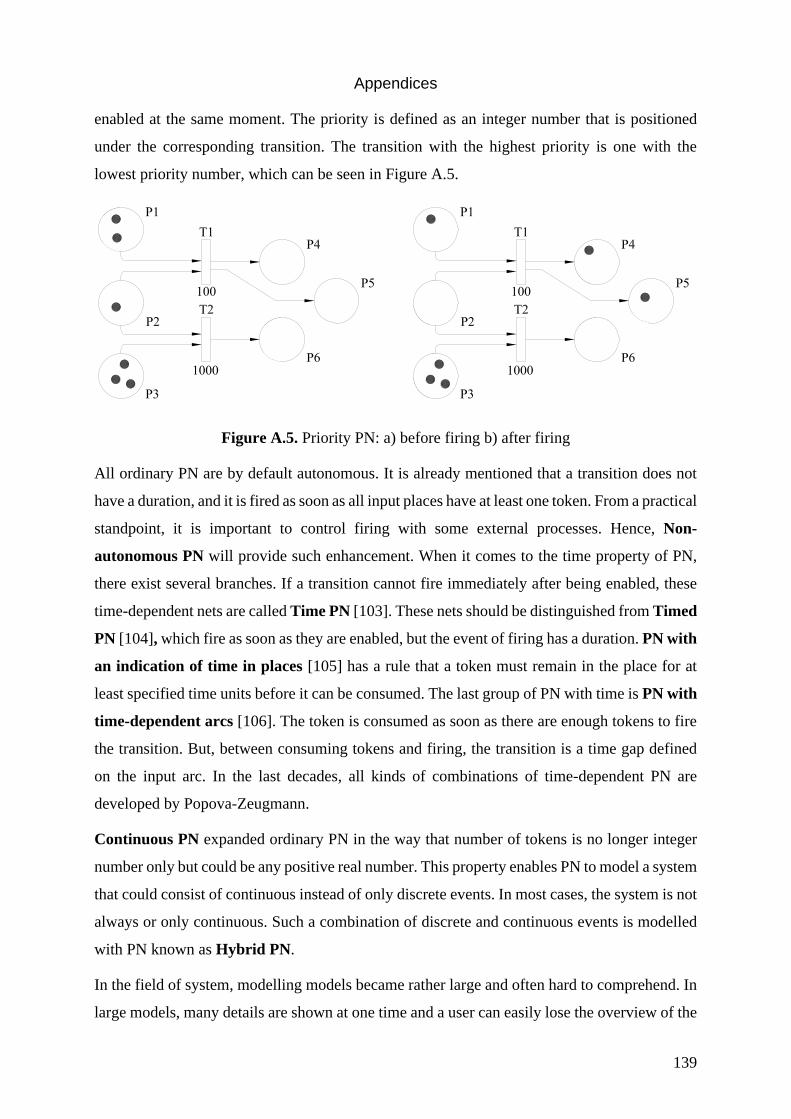
Appendices
139
enabled at the same moment. The priority is defined as an integer number that is positioned
under the corresponding transition. The transition with the highest priority is one with the
lowest priority number, which can be seen in Figure A.5.
Figure A.5. Priority PN: a) before firing b) after firing
All ordinary PN are by default autonomous. It is already mentioned that a transition does not
have a duration, and it is fired as soon as all input places have at least one token. From a practical
standpoint, it is important to control firing with some external processes. Hence, Non-
autonomous PN will provide such enhancement. When it comes to the time property of PN,
there exist several branches. If a transition cannot fire immediately after being enabled, these
time-dependent nets are called Time PN [103]. These nets should be distinguished from Timed
PN [104], which fire as soon as they are enabled, but the event of firing has a duration. PN with
an indication of time in places [105] has a rule that a token must remain in the place for at
least specified time units before it can be consumed. The last group of PN with time is PN with
time-dependent arcs [106]. The token is consumed as soon as there are enough tokens to fire
the transition. But, between consuming tokens and firing, the transition is a time gap defined
on the input arc. In the last decades, all kinds of combinations of time-dependent PN are
developed by Popova-Zeugmann.
Continuous PN expanded ordinary PN in the way that number of tokens is no longer integer
number only but could be any positive real number. This property enables PN to model a system
that could consist of continuous instead of only discrete events. In most cases, the system is not
always or only continuous. Such a combination of discrete and continuous events is modelled
with PN known as Hybrid PN.
In the field of system, modelling models became rather large and often hard to comprehend. In
large models, many details are shown at one time and a user can easily lose the overview of the
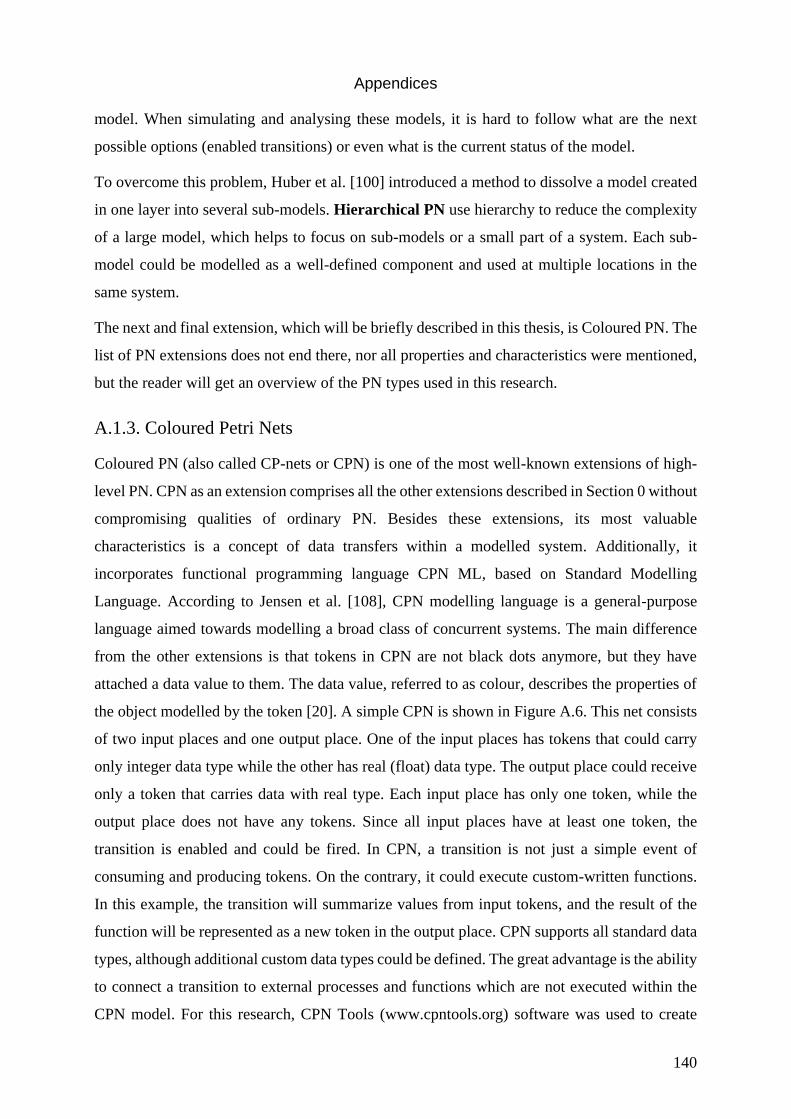
Appendices
140
model. When simulating and analysing these models, it is hard to follow what are the next
possible options (enabled transitions) or even what is the current status of the model.
To overcome this problem, Huber et al. [100] introduced a method to dissolve a model created
in one layer into several sub-models. Hierarchical PN use hierarchy to reduce the complexity
of a large model, which helps to focus on sub-models or a small part of a system. Each sub-
model could be modelled as a well-defined component and used at multiple locations in the
same system.
The next and final extension, which will be briefly described in this thesis, is Coloured PN. The
list of PN extensions does not end there, nor all properties and characteristics were mentioned,
but the reader will get an overview of the PN types used in this research.
A.1.3. Coloured Petri Nets
Coloured PN (also called CP-nets or CPN) is one of the most well-known extensions of high-
level PN. CPN as an extension comprises all the other extensions described in Section 0 without
compromising qualities of ordinary PN. Besides these extensions, its most valuable
characteristics is a concept of data transfers within a modelled system. Additionally, it
incorporates functional programming language CPN ML, based on Standard Modelling
Language. According to Jensen et al. [108], CPN modelling language is a general-purpose
language aimed towards modelling a broad class of concurrent systems. The main difference
from the other extensions is that tokens in CPN are not black dots anymore, but they have
attached a data value to them. The data value, referred to as colour, describes the properties of
the object modelled by the token [20]. A simple CPN is shown in Figure A.6. This net consists
of two input places and one output place. One of the input places has tokens that could carry
only integer data type while the other has real (float) data type. The output place could receive
only a token that carries data with real type. Each input place has only one token, while the
output place does not have any tokens. Since all input places have at least one token, the
transition is enabled and could be fired. In CPN, a transition is not just a simple event of
consuming and producing tokens. On the contrary, it could execute custom-written functions.
In this example, the transition will summarize values from input tokens, and the result of the
function will be represented as a new token in the output place. CPN supports all standard data
types, although additional custom data types could be defined. The great advantage is the ability
to connect a transition to external processes and functions which are not executed within the
CPN model. For this research, CPN Tools (www.cpntools.org) software was used to create
Appendices
141
high-level PN. It is a toolset that provides support for the modelling, analysis, and simulation
of all PN extensions [108].
Figure A.6. Two states of a CPN model
Distinctive areas of CPN application are simulations of communication protocols, data
networks, business processes, production systems, and other similar areas [87,109]. Interactive
simulation allows users to look at different outcomes and check whether the model works as
expected [88].
A.1.4. Application of Petri Nets in engineering design
Soon after high-level PN had been developed, several authors introduced proposals for using
PN to support the design process from various viewpoints. The development of high-level PN
eliminated some of their pristine drawbacks, and nowadays, they are accepted as one of the
most adequate and sound languages for the description and analysis of synchronisation,
communication, and resource sharing between concurrent processes [20] in many fields.
McMahon and Xianyi [110] presented a method for the integration of multiple computing
processes to solve a parametric design problem using PN. They consider PN places to represent
data states in the design process. Places may represent geometrical model, material properties
or mathematical model, and tokens indicate that the relevant information is available for further
processing. A transition represents a design activity that could be carried out using data stored
in input places. It should be emphasised that the data type in these tokens is not a standard data
type but a geometrical model or a document with material properties. A few years later, Horvath
et al. [111] claimed that in the design process, the designer’s decisions strongly influence the
process itself as well as a designed artefact. Due to inherited complexity, authors applied
advanced PN as a means of modelling design processes together with the decision patterns of
designers. The results proved their fundamental hypothesis that the decision mechanisms
behind design processes can be adequately represented in terms of predefined abstract activity
patterns, which can be clearly represented using advanced Petri Nets.
Appendices
142
Karniel and Reich [30] presented a multi-level approach that combines a design structure matrix
(DSM) with Petri Nets to simulate product development processes. In the research, authors
defined a new type of PN which they call Workflow Net (WF-Net). Based on their previous
work [112], the authors constructed DSM, reordered it, then defined design process matrix and
finally integrated static process planning (design process matrix) with PN to simulate the
development process. The authors emphasized a property of PN, which could be considered as
a drawback in some situations, but for this research, it is not pertinent. Typical PN is predefined,
and its static process scheme does not change during utilization. Their solution to this problem
is the dependency structure matrix net which has a dynamically evolving structure.
It is widely known that workflows are used for describing the order of execution and
dependencies between activities of various processes. Pla et al. [34] claim that workflow
monitoring could help to improve and avoid delays in environments where concurrent processes
are carried out. As the main issue of the standard workflows, they mention the lack of resource
availability monitoring. This issue authors have surpassed with resource-aware Petri nets
(RAPN). Using RAPN, the authors created a workflow management system that monitors the
execution of workflows and detects possible delays.
In the design process, a great amount of time is devoted to communication. More about the
communication process in engineering design is given in Section 2.4. Several authors suggested
various approaches for the development and usage of generic templates of communication
processes. Khosravifar [82] proposed PN based models for different types of communication
such as negotiation, persuasion, defence locution and information seeking process. These
models are represented as templates created using PN, which facilitate the specification of
communication activities in a multi-agent environment.
Topic et al. [113] have explored improvements, which can be achieved by applying PN to the
modelling, simulation, and analysis of the software development process. Topic and Jevtic
[114] developed a procedure for the dynamic management of complex project systems. They
combined a multiple-domain matrix with CPN. Their focus was on how to convert MDM
matrix, which includes complex relations between resources and activities, to the CPN model,
where MDM matrix is expanded by capabilities of the dynamic system description available in
CPN methodology.
Appendices
143
A.1.5. Roles of the Coloured Petri Nets in the proposed framework
The development of high-level PN removed some of their initial drawbacks. For example, CPN
includes and unites concepts of data structures, hierarchy, and time. Therefore, it has been used
in modelling, simulating, and controlling discrete event dynamic systems. Still, it has also been
successfully applied in many engineering design case studies, which were reported in the
previous section. The approaches from these studies were used as starting points during the
process of development of theoretical and software framework in this research. The aim is to
apply the CPN methodology to some selected areas of design process modelling. Rather than
modelling the whole process on higher abstract levels, the focus is primarily on the process of
design communication, especially regarding issues of design team communication about design
parameters.
Product development is a complex process, and modelling complex processes in terms of CPN
is a nontrivial task. However, such a task could be decomposed into recurring modelling
problems that can be solved by applying design patterns [90]. In this research, a similar pattern-
based approach was applied after distinguishing and extracting repetitive patterns in the design
process from several complex product development processes. Additionally to design patterns,
generic templates of communication processes are recognized, similar to ones developed by
Khosravifar [82] and Mulyar and Van Der Aalst [19], [31].
The following features, which are already incorporated in CPN are necessary for the approach
developed and applied in this research:
• the ability to communicate with external sources and services,
• the ability to execute predefined decision-making and consequently immediately
activate appropriate procedures, and
• the ability to visualise the current process state using the positions of the tokens and
their values and to trace the process by storing all the data values and CPN model states.
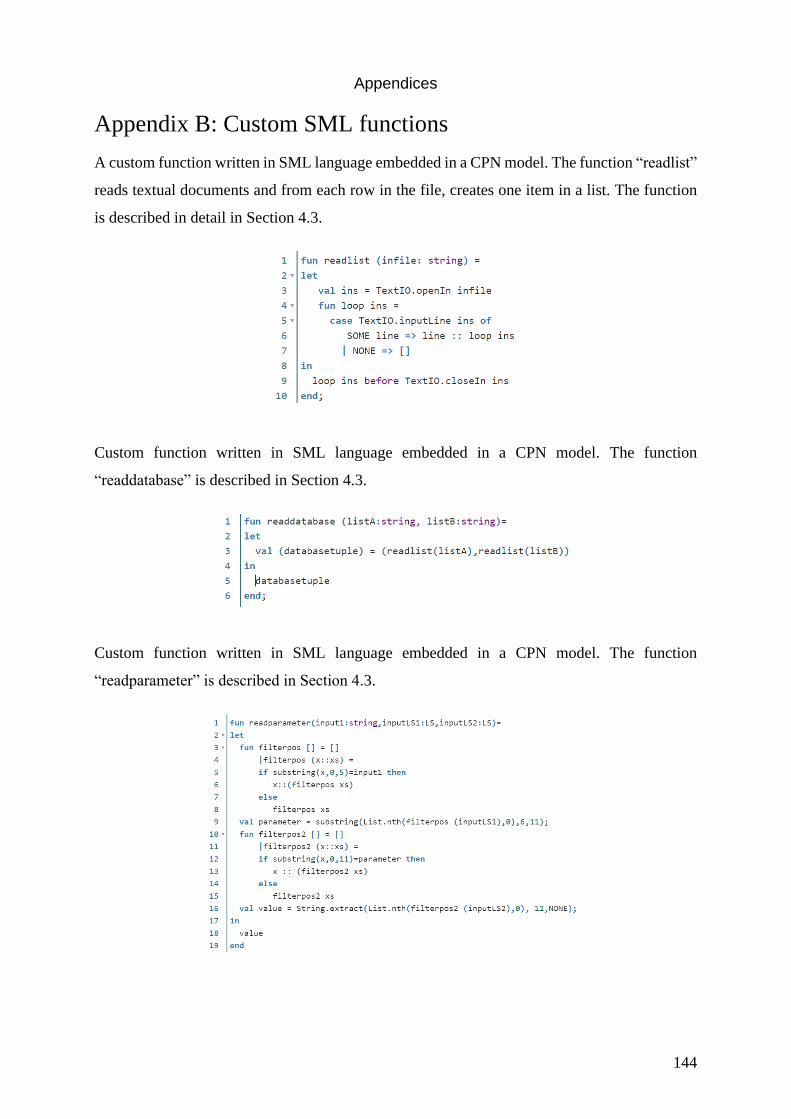
Appendices
144
Appendix B: Custom SML functions
A custom function written in SML language embedded in a CPN model. The function “readlist”
reads textual documents and from each row in the file, creates one item in a list. The function
is described in detail in Section 4.3.
Custom function written in SML language embedded in a CPN model. The function
“readdatabase” is described in Section 4.3.
Custom function written in SML language embedded in a CPN model. The function
“readparameter” is described in Section 4.3.
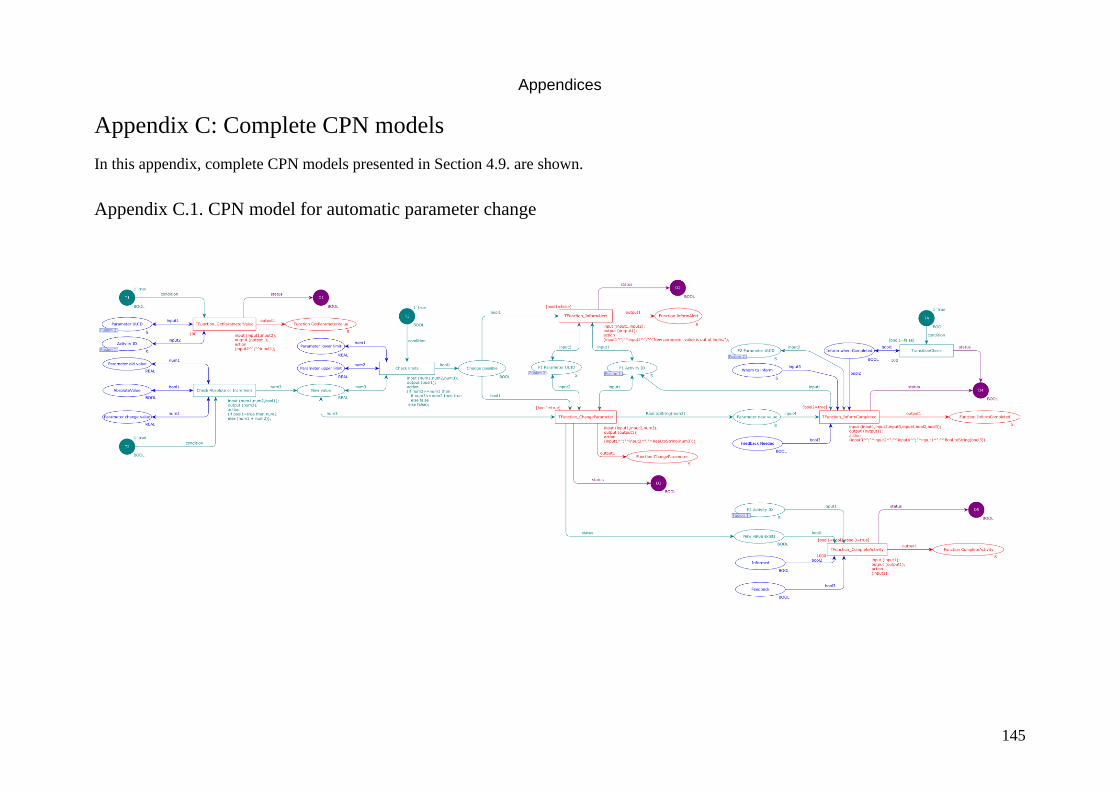
Appendices
145
Appendix C: Complete CPN models
In this appendix, complete CPN models presented in Section 4.9. are shown.
Appendix C.1. CPN model for automatic parameter change
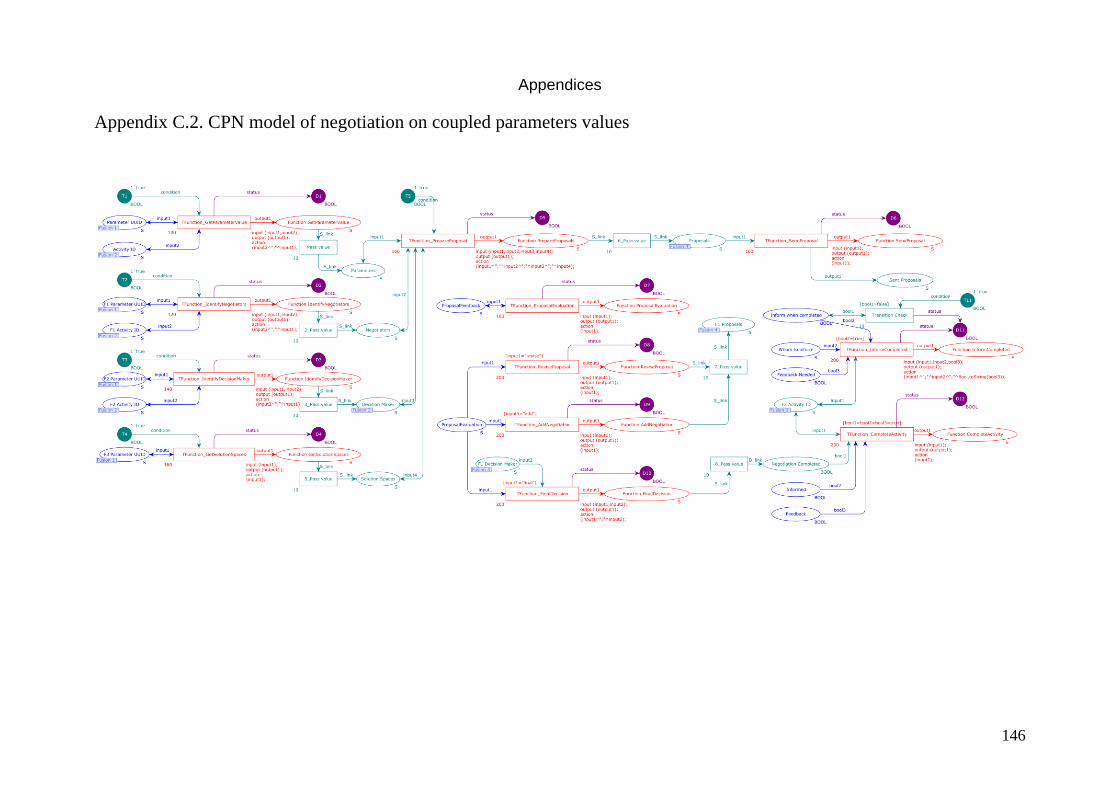
Appendices
146
Appendix C.2. CPN model of negotiation on coupled parameters values
147
BIOGRAPHY
Jasmin Juranić was born in Bjelovar, Croatia, in 1990. He attended Technical School Bjelovar,
and during his high school education, he was four times the national champion in vocational
schools competitions in the field of mechanical engineering. In 2007 he participated in the
world competition of knowledge and skills “WorldSkills 2007” in Japan, in the field of
CAD/CAM where he won “Best of Nation” medal.
In 2009 he enrolled in the study of Mechanical Engineering at the Faculty of Mechanical
Engineering and Naval Architecture, University of Zagreb (UNIZG-FSB). In 2013, he gained
a bachelor’s degree and a year later, a master’s degree (cum laude) in mechanical engineering,
specialising in Product Design and Development.
After graduation, he worked as technical support for 3D modelling software Catia and
SolidWorks at CADCAM Design Center company. In 2015 he applied for the position at the
Chair of Design and Product Development at UNIZG-FSB as a Research Assistant. In parallel,
he started his PhD study in the field of Theory of Structures. He visited the research department
of Daimler AG as a PhD intern three times throughout his doctoral research.
Besides the scientific work, he assists in teaching in courses such as European Product Global
Realisation, Computer Aided Design, Programming and algorithms and Advanced Engineering
Informatics. Before his research assistant position at FMENA he worked as an external assistant
lecturer where he held tutorials on Machine Elements.
He is a member of the Design Society. Since 2016 he actively participates in the organisation
of the DESIGN conference, a biennial event that regularly attracts more than 250 experts from
more than 30 countries around the world.

148
ŽIVOTOPIS
Jasmin Juranić rođen je u Bjelovaru 1990. godine. Pohađao je Tehničku školu Bjelovar te je
tijekom srednjoškolskog obrazovanja četiri puta bio državni prvak na natjecanjima strukovnih
škola u području strojarstva. 2007. godine sudjelovao je na svjetskom natjecanju znanja i
vještina „WorldSkills 2007“ u Japanu, u području CAD/CAM. Na natjecanju je osvojio nagradu
„Best of Nation“.
2009. godine upisuje studij strojarstva na Fakultetu strojarstva i brodogradnje, Sveučilišta u
Zagrebu (UNIZG-FSB). 2013. godine završava preddiplomski studij, a godinu dana kasnije
stekao je zvanje magistra inženjera strojarstva (cum laude) na usmjerenju Konstruiranje i razvoj
proizvoda.
Nakon studija bio je zaposlen u tvrtki CADCAM Design Center na mjestu tehničke podrške za
softvere za 3D modeliranje Catia i SolidWorks. 2015. godine prijavio se je za mjesto asistenta
na Katedri za konstruiranje i razvoj proizvoda na Sveučilištu u Zagrebu. Paralelno je upisao i
doktorski studij, smjer Teorija konstruiranja. Tijekom doktorskog studija tri puta je posjetio
istraživački odjel tvrtke Daimler AG u Njemačkoj.
Uz znanstveni rad, pomaže u izvođenju nastave na kolegijima, European Product Global
Realisation, Konstruiranje pomoću računala, Programiranje i algoritmi te Napredna inženjerska
informatika. Prije nego se zaposlio na mjestu asistenta, u nastavi je sudjelovao kao vanjski
suradnik na kolegiju Elementi konstrukcija.
Član je zajednice Design Society. Od 2016. godine aktivno sudjeluje u organizaciji
međunarodne DESIGN konferencije, koja svake dvije godine privlači više od 250 stručnjaka iz
više od 30 zemalja iz cijelog svijeta.
149
BIBLIOGRAPHY
Journal paper:
Juranić, J., Pavković, N., Naumann, T., Toepfer, N. (2019) Patterns of engineering design
collaboration and reasoning activities modelled with Coloured Petri Nets. Journal of
engineering design, 30(10-12), 563-598. https://doi:10.1080/09544828.2019.1630803
Conference papers:
Juranić, J., Pavković, N., Jurinić, D. (2020) Management of design iterations on coupled
parameters in design teamwork using multiple domain matrix and Coloured petri nets. In:
Proceedings of the 16th International Design Conference (DESIGN 2020), Cambridge
University Press, (pp. 617-626). https://doi:10.1017/dsd.2020.264
Pavković, N., Vlah, L., Juranić, J., Kuzmić, N. (2018) Coloured Petri Nets model of designers
collaboration in iterative resolving of coupled design parameters. In: Proceedings of the
15th International Design Conference (DESIGN 2018), Dubrovnik, Croatia, 21-
24.05.2018. (pp. 417-428). https://doi:10.21278/idc.2018.0182
Juranić, J., Pavković, N., Naumann, T., Marjanović, D. (2017) Modelling the design parameters
dynamics with Petri nets. In: Proceedings of the 21st International Conference on
Engineering Design (ICED 17), Vancouver, Canada, 21-25.08. 2017. (pp. 91-100).
Juranić, J., Marjanović, D., Pavković, N. Risks in product development: Advancements in
recent years. In: Proceedings of the 14th International Design Conference (DESIGN
2016), Cavtat, Croatia, 16-19.05.2018. (pp. 251-260).
Copyright © 2022 FDOKUMEN