Teaching Process and Product Design
136
ASEE ChE Summer School Workshop Teaching Process and Product Design Warren D. Seider University of Pennsylvania Ka Ming Ng Hong Kong University of Science and Technology July 2017
-
Upload
khangminh22 -
Category
Documents
-
view
0 -
download
0
Transcript of Teaching Process and Product Design

ASEE ChE Summer School Workshop
Teaching Process and Product Design
Warren D. SeiderUniversity of Pennsylvania
Ka Ming NgHong Kong University of Science and Technology
July 2017
Hour 1 W. D. Seider Focusing on Process Design.Including Product Design
Hour 2 K. M. Ng Focusing on how to teach a courseon product design and the creationof Product Design Case Studies suitable for your department
Try to participate, offer your perspectives/experiences, and suggestions
Can you find ways to get involved?
Introduction with Several Observations
Undergraduate ChE courses continue to focus on process design
Typical lectures and design projectsassume the chemical product has been selected –
concentrate on creating processesto manufacture a product
i.e., How to make a product?
Not: What to make?
i.e., product design
- to satisfy customer needs
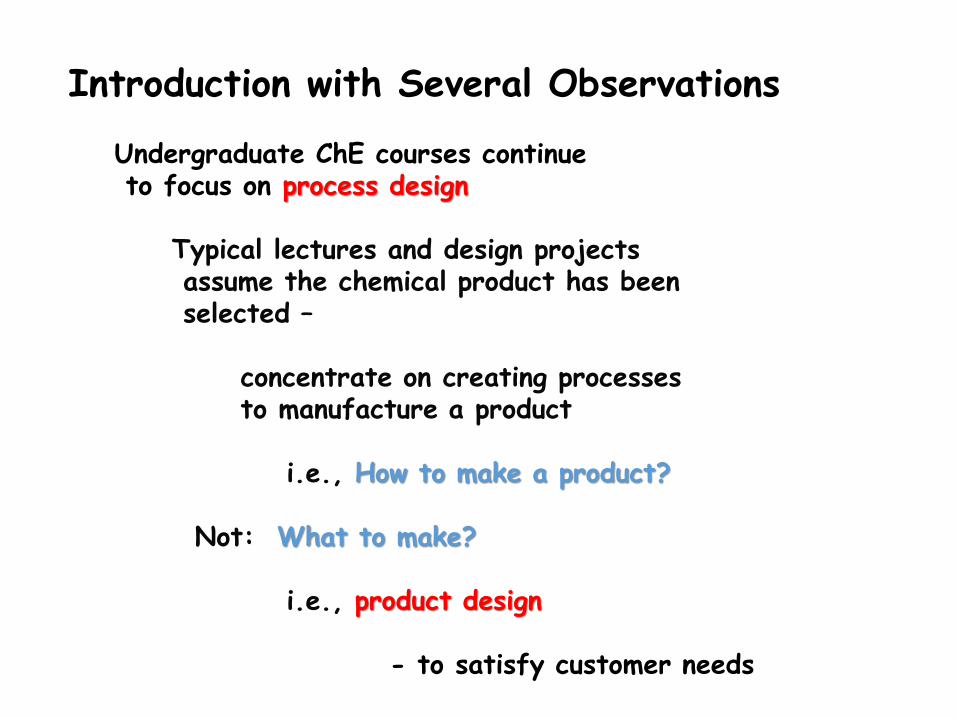
Process Design Courses
- follow engineering science coursesthat are process oriented
e.g., material and energy balancesopen-system thermodynamicsfluid mechanicsheat and mass transferseparationsunit operationschemical reactor design
Ideal and real gasesSimple phase equilibria
Newtonian fluids
Shell and tube
Equilibrium stages, simple mass transfer
Simple reaction kinetics
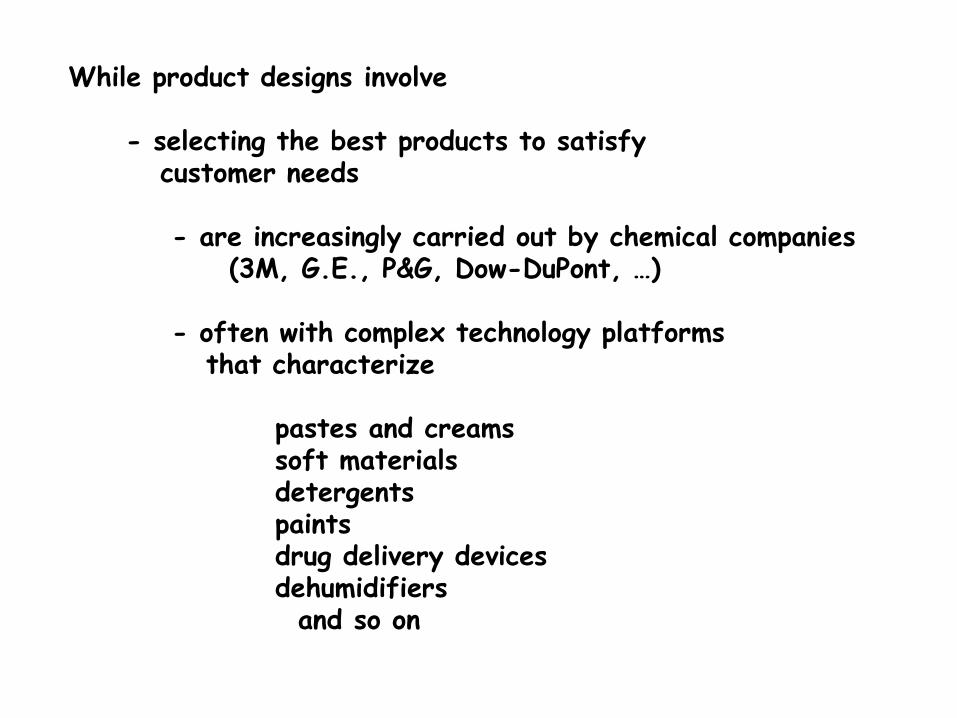
While product designs involve
- selecting the best products to satisfycustomer needs
- are increasingly carried out by chemical companies(3M, G.E., P&G, Dow-DuPont, …)
- often with complex technology platformsthat characterize
pastes and creamssoft materialsdetergentspaintsdrug delivery devicesdehumidifiersand so on
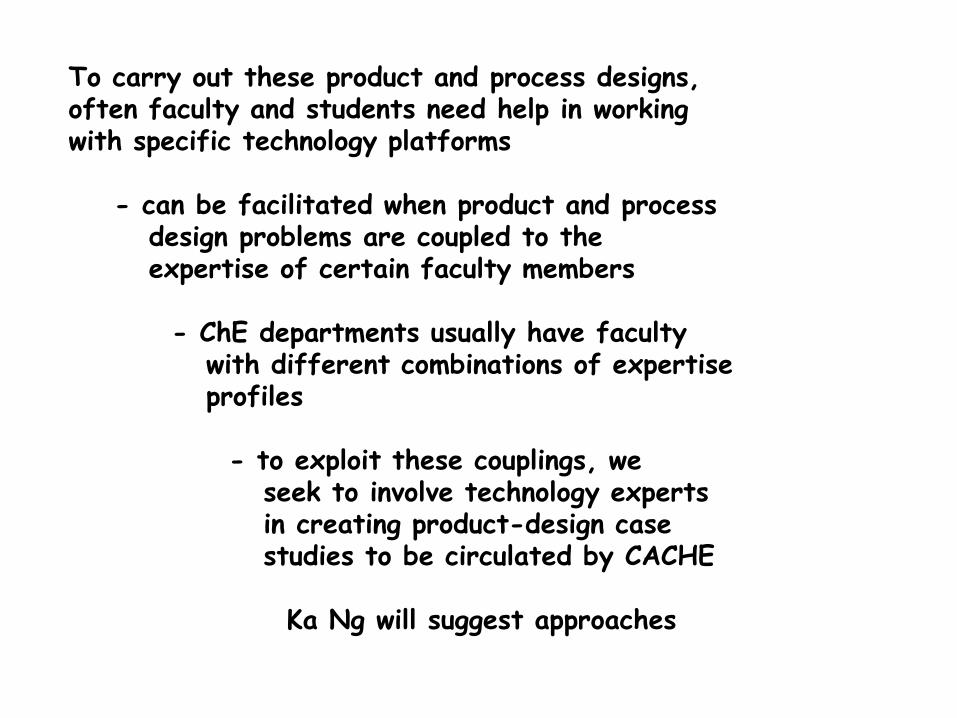
To carry out these product and process designs,often faculty and students need help in working with specific technology platforms
- can be facilitated when product and process design problems are coupled to the expertise of certain faculty members
- ChE departments usually have facultywith different combinations of expertise profiles
- to exploit these couplings, we seek to involve technology expertsin creating product-design case studies to be circulated by CACHE
Ka Ng will suggest approaches
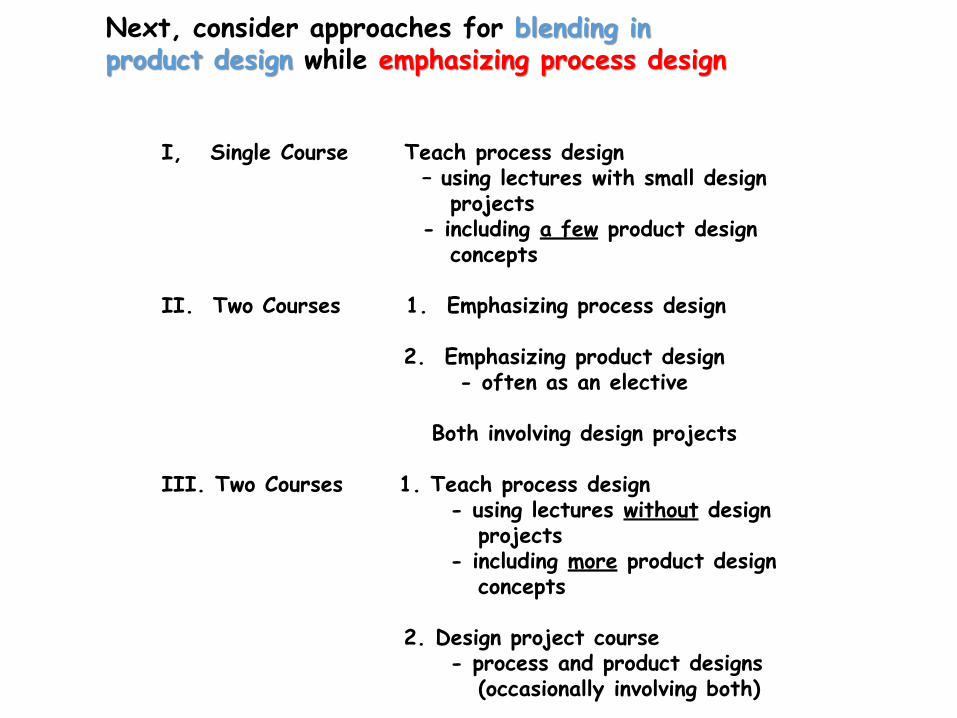
Next, consider approaches for blending in product design while emphasizing process design
I, Single Course Teach process design – using lectures with small design
projects- including a few product design
concepts
II. Two Courses 1. Emphasizing process design
2. Emphasizing product design- often as an elective
Both involving design projects
III. Two Courses 1. Teach process design- using lectures without design
projects- including more product design
concepts
2. Design project course- process and product designs
(occasionally involving both)

Type I - Difficult to emphasize process design
- while doing a design project (necessary)and introducing a few product design concepts
At Penn – Type III
- Next, consider some aspects
For many more specifics, see twoAIChE webinars on Teaching Process and Product Design
Please express your preferences/concernsin next 45 min.
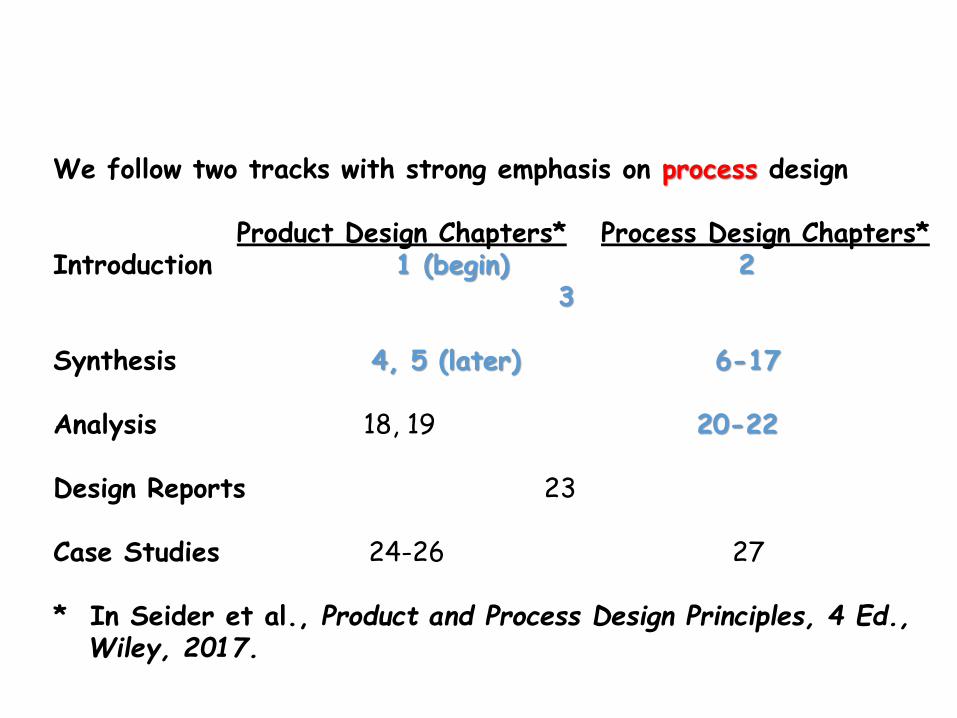
We follow two tracks with strong emphasis on process design
Product Design Chapters* Process Design Chapters*Introduction 1 (begin) 2
3
Synthesis 4, 5 (later) 6-17
Analysis 18, 19 20-22
Design Reports 23
Case Studies 24-26 27
* In Seider et al., Product and Process Design Principles, 4 Ed.,Wiley, 2017.

Introduction to Product Design (in 2 lectures) –
What to make?
Recommend – begin with the Chemical Supply Chain
11
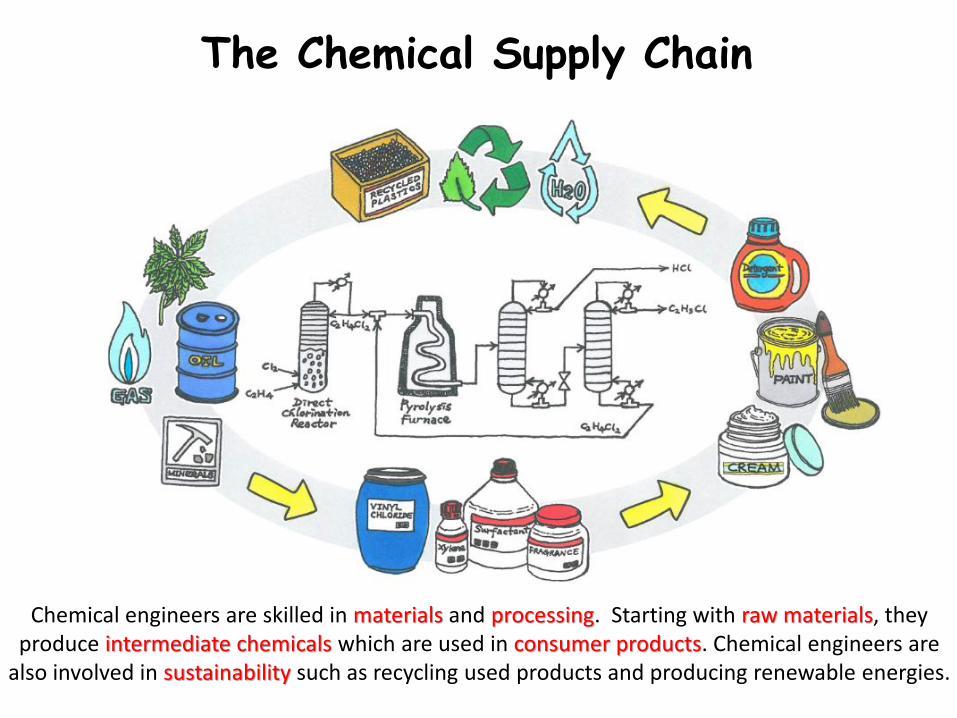
The Chemical Supply Chain
Chemical engineers are skilled in materials and processing. Starting with raw materials, they produce intermediate chemicals which are used in consumer products. Chemical engineers are
also involved in sustainability such as recycling used products and producing renewable energies.
Emphasize - There are three primary sources for all the chemicals we need in our daily lives:
• Air and water• Natural gas, petroleum and minerals• Living things, including animals and plants
Recommend – take closer look at the supply chain
13
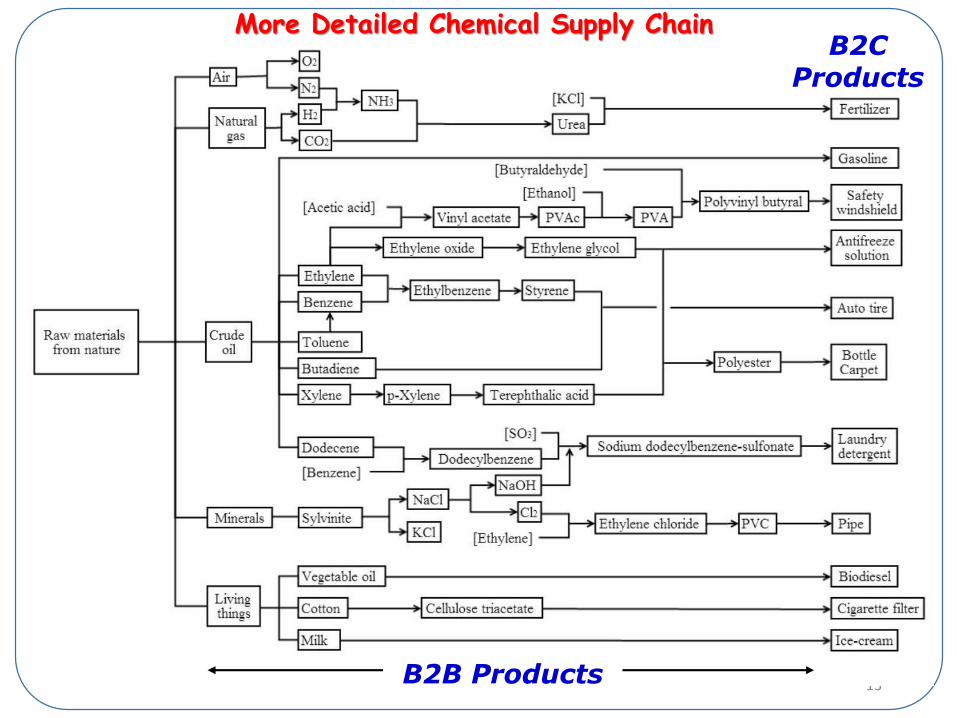
More Detailed Chemical Supply Chain
B2B Products
B2C Products
14
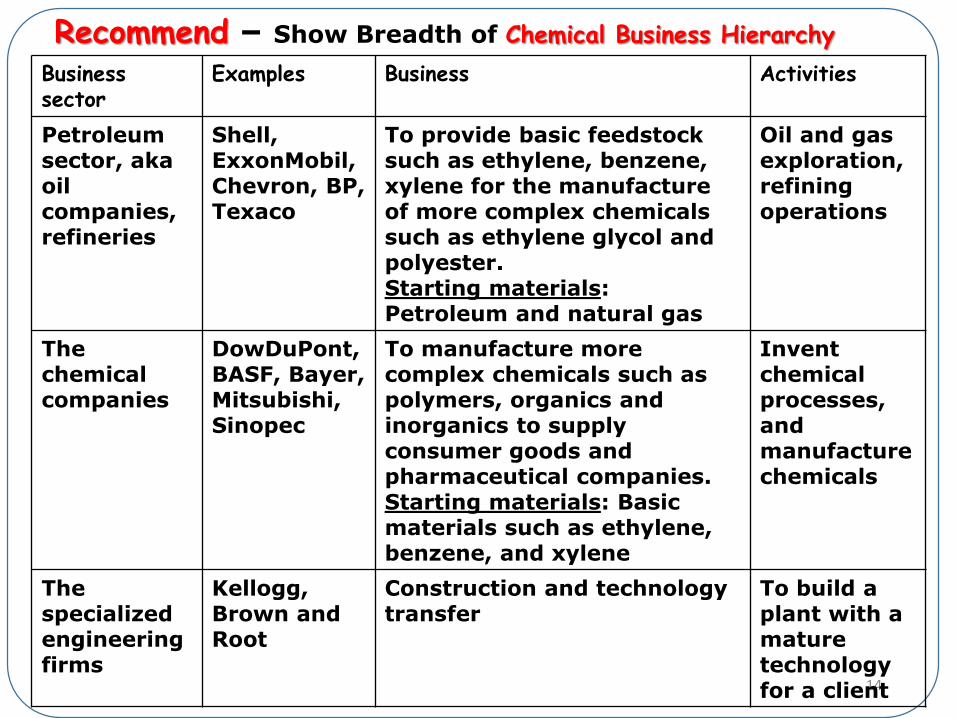
Businesssector
Examples Business Activities
Petroleum sector, aka oil companies, refineries
Shell,ExxonMobil, Chevron, BP, Texaco
To provide basic feedstock such as ethylene, benzene, xylene for the manufacture of more complex chemicals such as ethylene glycol and polyester.Starting materials: Petroleum and natural gas
Oil and gas exploration, refining operations
The chemical companies
DowDuPont, BASF, Bayer, Mitsubishi, Sinopec
To manufacture more complex chemicals such as polymers, organics and inorganics to supply consumer goods and pharmaceutical companies.Starting materials: Basic materials such as ethylene, benzene, and xylene
Invent chemical processes, and manufacturechemicals
The specialized engineering firms
Kellogg, Brown and Root
Construction and technology transfer
To build a plant with a mature technology for a client
Recommend – Show Breadth of Chemical Business Hierarchy
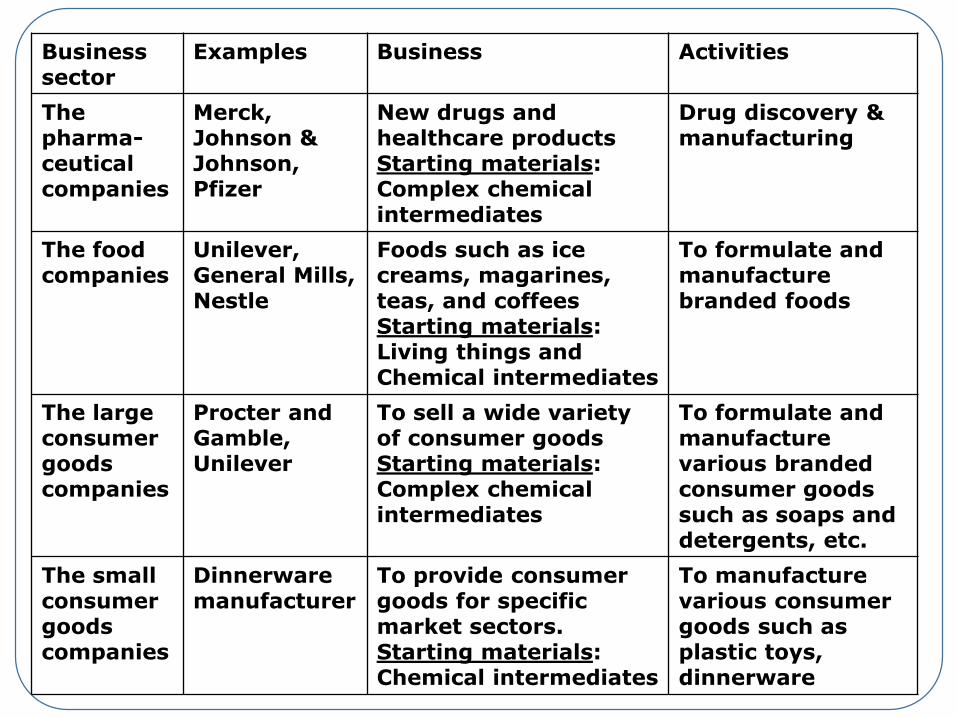
Businesssector
Examples Business Activities
The pharma-ceuticalcompanies
Merck, Johnson & Johnson, Pfizer
New drugs and healthcare products Starting materials: Complex chemical intermediates
Drug discovery & manufacturing
The food companies
Unilever, General Mills, Nestle
Foods such as ice creams, magarines, teas, and coffeesStarting materials: Living things and Chemical intermediates
To formulate and manufacture branded foods
The large consumer goods companies
Procter and Gamble, Unilever
To sell a wide variety of consumer goodsStarting materials: Complex chemical intermediates
To formulate and manufacture various branded consumer goods such as soaps and detergents, etc.
The small consumer goods companies
Dinnerware manufacturer
To provide consumer goods for specific market sectors.Starting materials: Chemical intermediates
To manufacture various consumer goods such as plastic toys, dinnerware
R
16
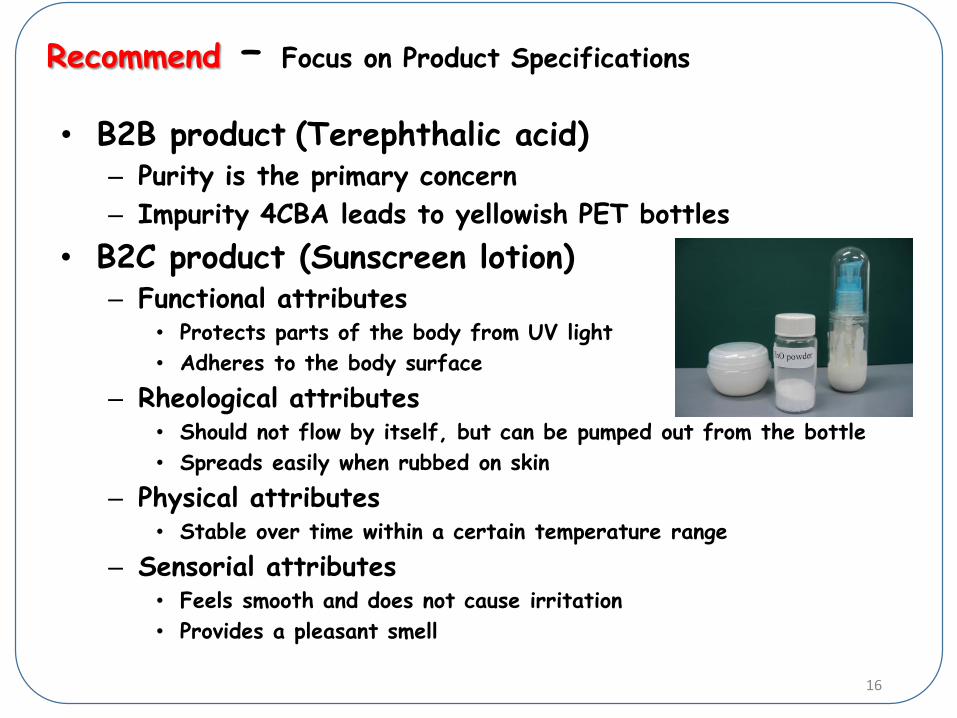
Recommend – Focus on Product Specifications
• B2B product (Terephthalic acid)– Purity is the primary concern
– Impurity 4CBA leads to yellowish PET bottles
• B2C product (Sunscreen lotion)– Functional attributes
• Protects parts of the body from UV light
• Adheres to the body surface
– Rheological attributes• Should not flow by itself, but can be pumped out from the bottle
• Spreads easily when rubbed on skin
– Physical attributes• Stable over time within a certain temperature range
– Sensorial attributes • Feels smooth and does not cause irritation
• Provides a pleasant smell
17
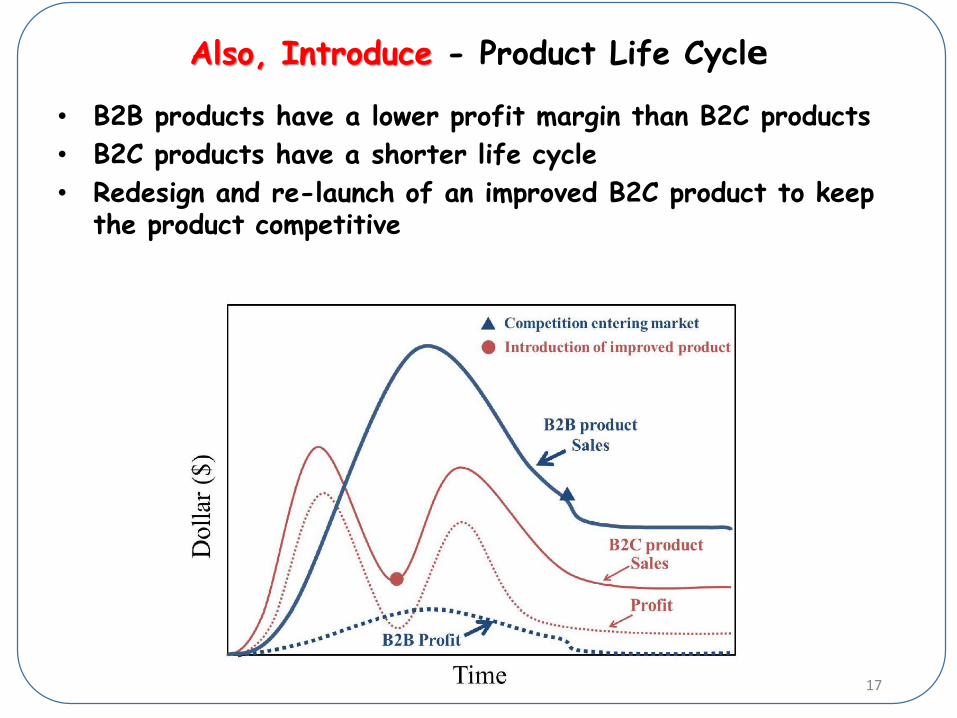
Also, Introduce - Product Life Cycle
• B2B products have a lower profit margin than B2C products
• B2C products have a shorter life cycle
• Redesign and re-launch of an improved B2C product to keep the product competitive

Introduction to Process Design (in 4 lectures) -
How to make?
Recommend – introduce the processsynthesis problem and steps to solve it –
for a typical process
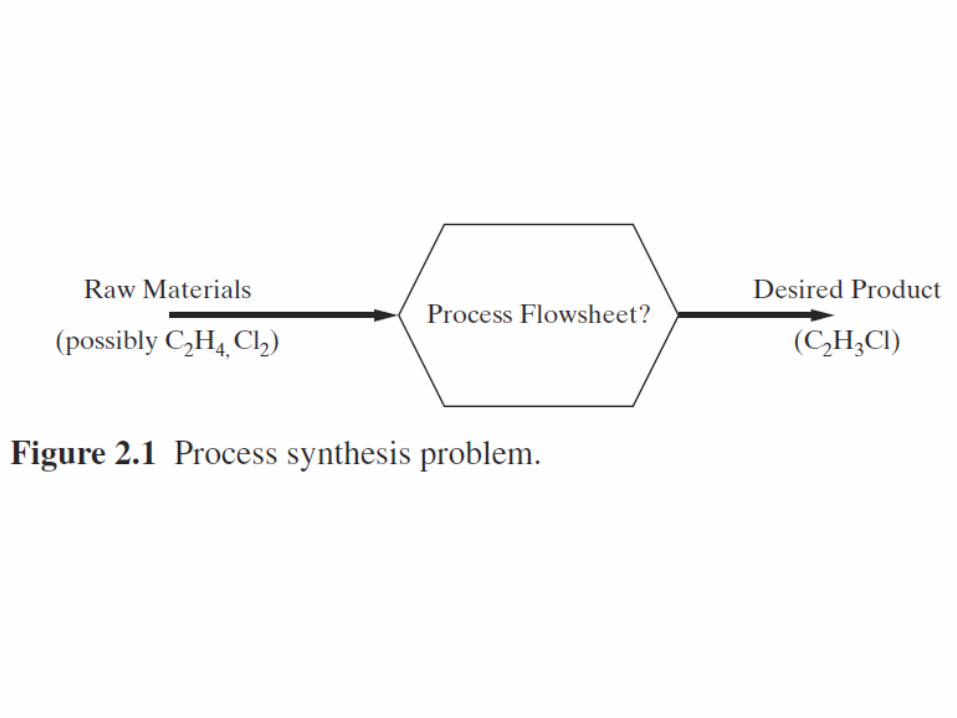
20
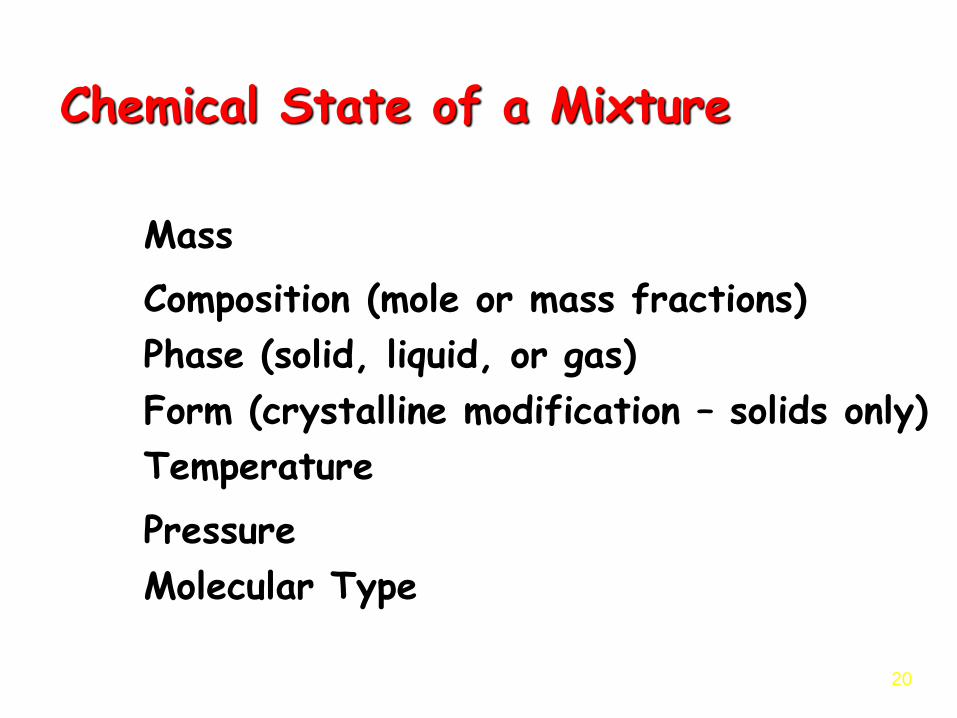
Chemical State of a Mixture
Mass
Composition (mole or mass fractions)
Phase (solid, liquid, or gas)
Temperature
Pressure
Molecular Type
Form (crystalline modification – solids only)
2121
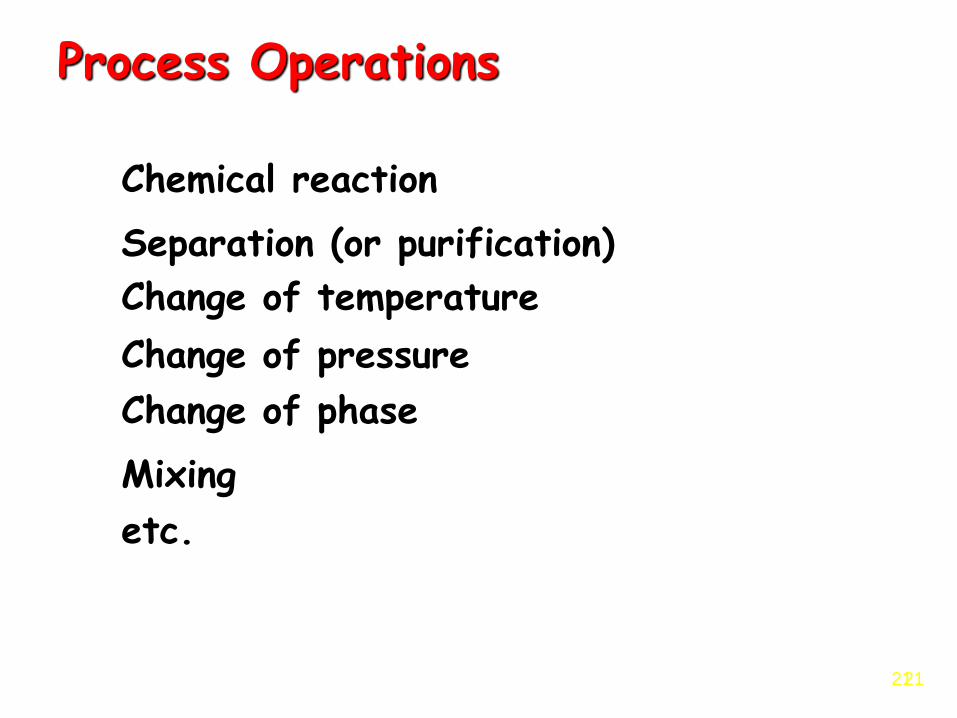
Process Operations
Chemical reaction
Separation (or purification)
Change of temperature
Change of phase
Mixing
etc.
Change of pressure
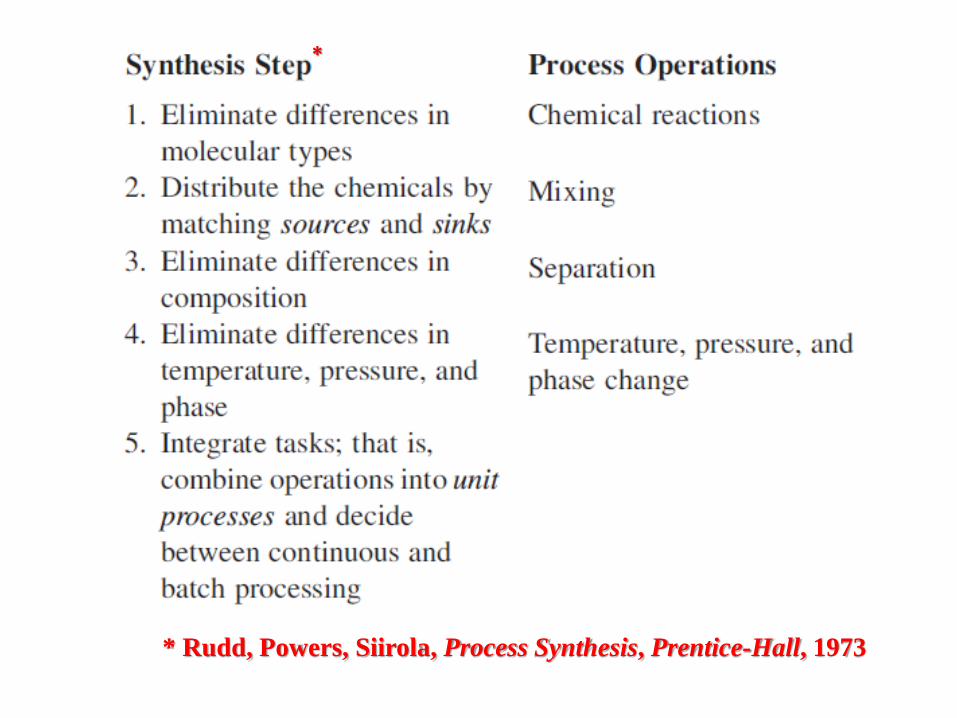
*
* Rudd, Powers, Siirola, Process Synthesis, Prentice-Hall, 1973
23
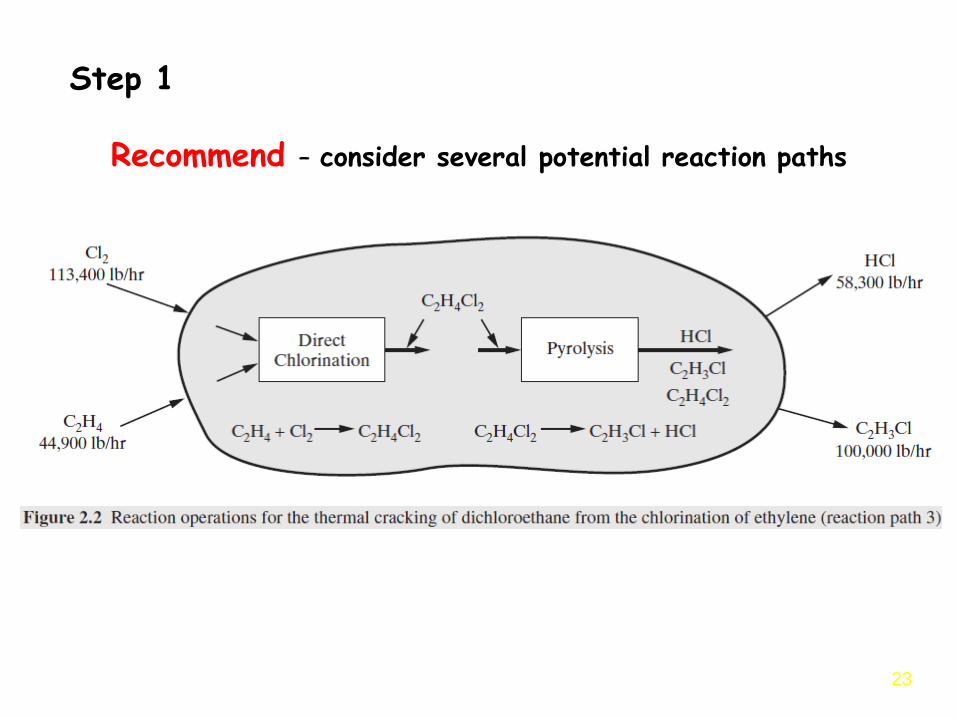
Step 1
Recommend – consider several potential reaction paths
24
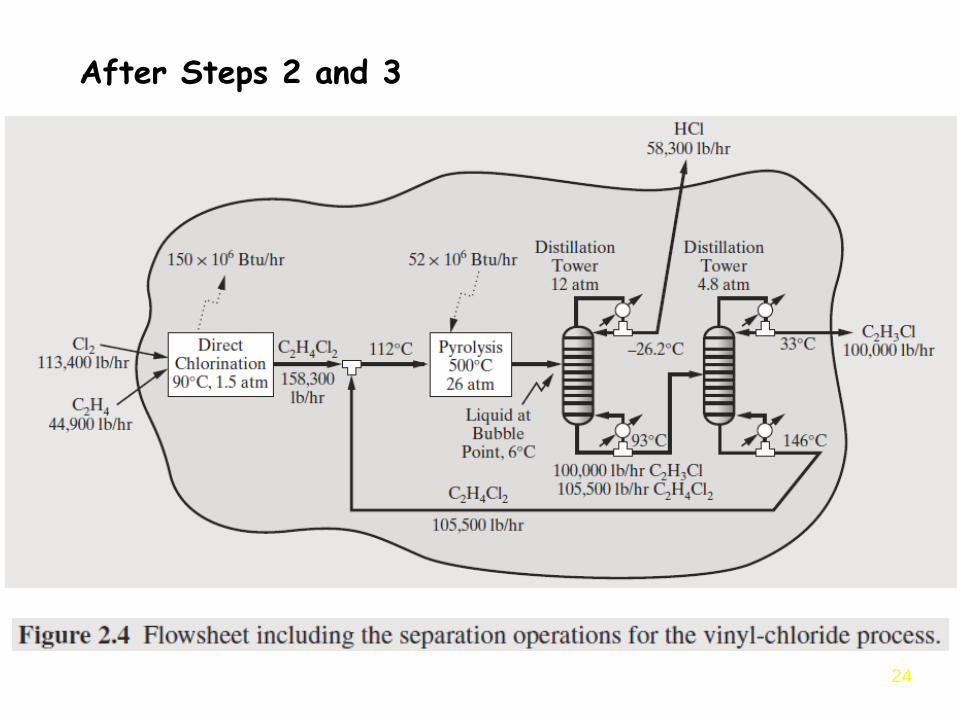
After Steps 2 and 3
25
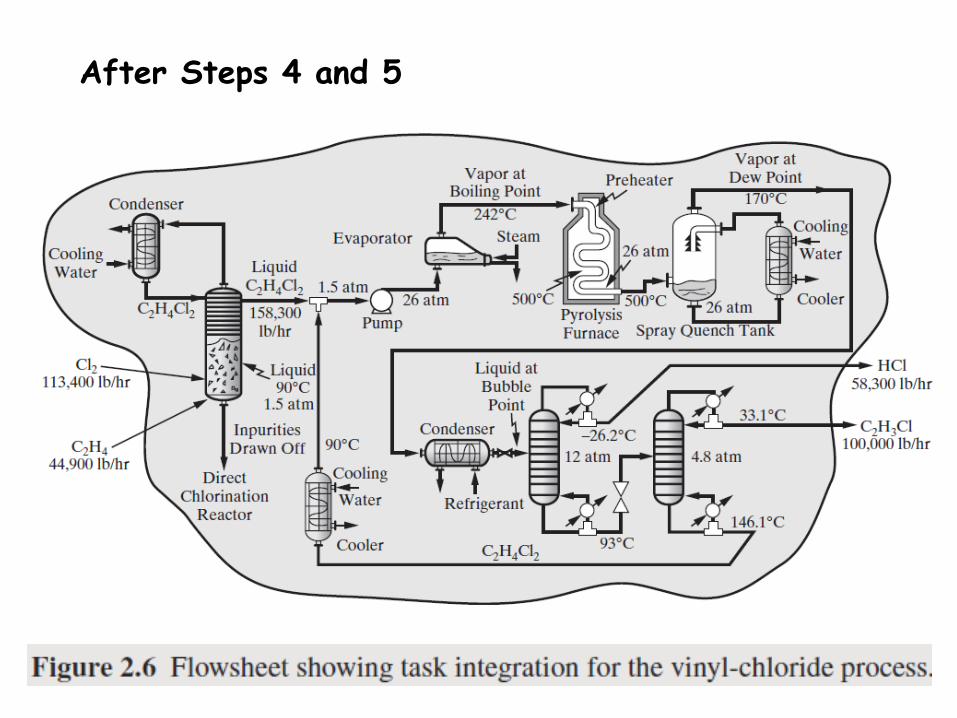
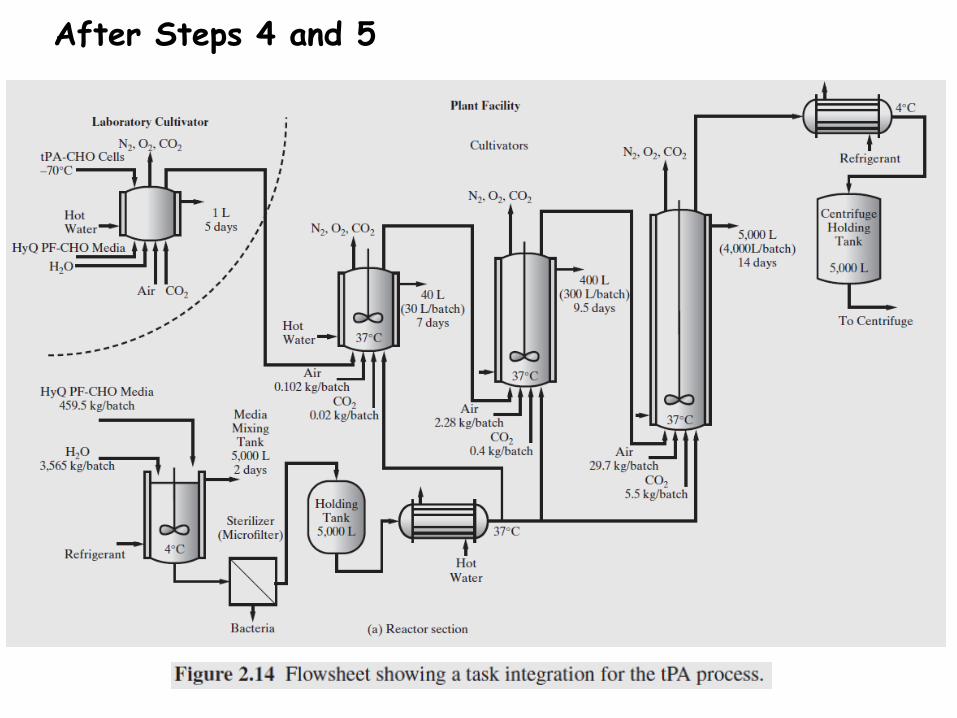
After Steps 4 and 5
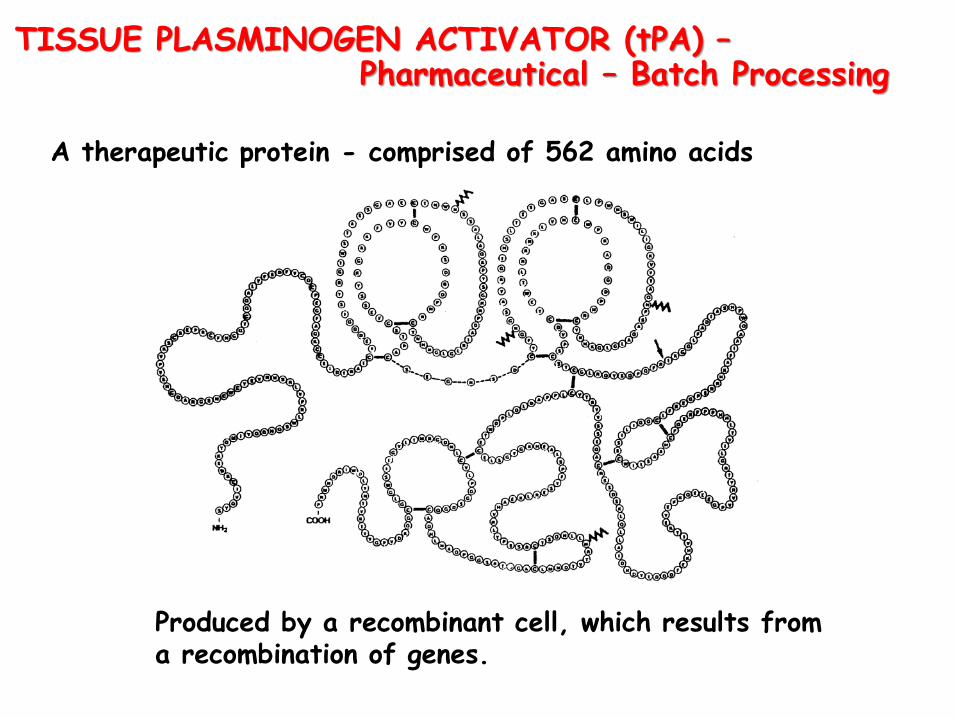
TISSUE PLASMINOGEN ACTIVATOR (tPA) –Pharmaceutical – Batch Processing
A therapeutic protein - comprised of 562 amino acids
Produced by a recombinant cell, which results froma recombination of genes.
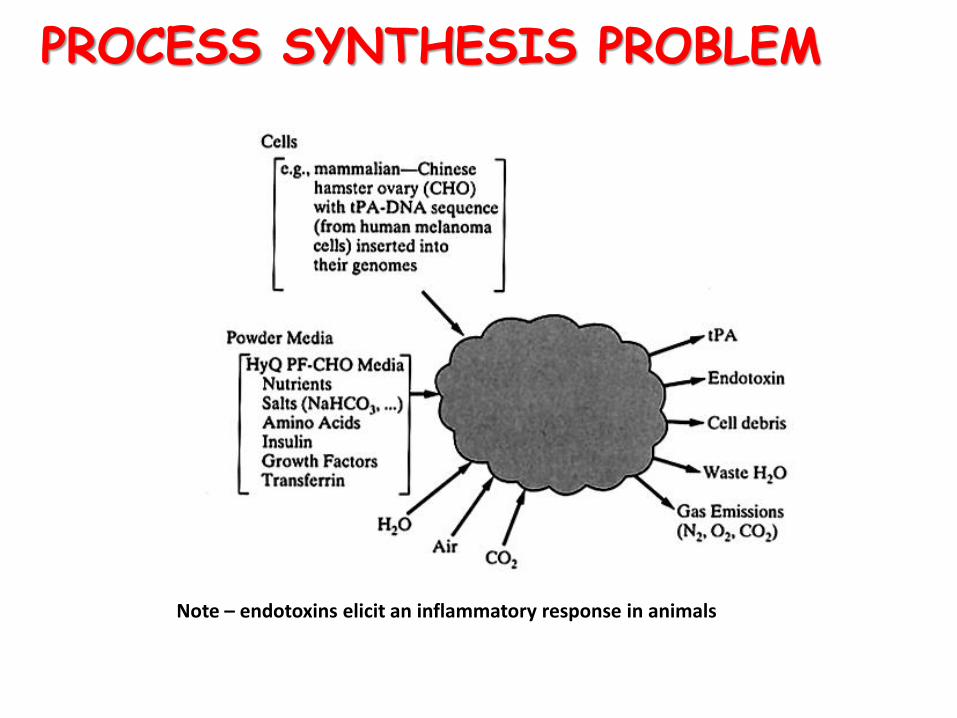
PROCESS SYNTHESIS PROBLEM
Note – endotoxins elicit an inflammatory response in animals
After Steps 4 and 5

Recommend – After introductory subjects, next focus on Improved Process Synthesis, beginning withheuristics for process synthesis
Later, as time becomes available, turn to ProductSynthesis:
Molecular and Mixture Design
Devices, Functional, and Formulated Products
Heuristics for Process Synthesis (2 lectures)
– These are general rules-of-thumb to guide process design decisions
– We do not discuss at length all of the heuristics provided in the text
– Choose a select sample to illustrate their value in process design
– Align this sequence with the Process Synthesis Steps from earlier in the semester
Simulation to Assist in Process Creation (5 lectures)
– Our course uses ASPEN as a process simulator
– We begin with a stress on mass balances
– We expand this to discuss- Degrees-of-Freedom- Design Specifications- Recycle Loops- Bubble and Dew Point (Thermo) Calculations
– We also show SUPERPRO DESIGNER for batch- This has a specific bio-process example- Batch/cycle times, Gantt chart, bottleneck ideas
Synthesis of Separation Trains (4 lectures)
– Feed Separations vs. Effluent Separations
– Use a purge stream when separation is too difficult
– The major investment and operating costs of a process will be those costs associated with the separation equipment
– Exploit a difference in phases to facilitate a split- Vapor/Liquid - Vapor/Liquid/Liquid- Vapor/Solid - Vapor/Liquid/Solid
Second Law Analysis (4 lectures)
– Ask … “how do we value material and energy streams?” … as a function of the work available from them (this motivates the idea of Availability).
– Introduce the concept of Lost Work and use this as a metric to compare different versions of a process.
– The idea of Thermodynamic Efficiency is a result of the lost work discussion.
– Use these ideas in a concrete example to evaluate a proposed refrigeration cycle process.
Heat Integration (4 lectures)
– The goal is to find the most economical way to transfer heat awayfrom the hot streams and into the cold streams for a given process.
– Distinguish between interior network (only process streams) andauxiliary network (steam / cooling water utilities).
– Use thermodynamics to identify the maximum energy recovery(MER) target. Attempt to accomplish the majority of the heattransfer using only the streams in the interior network.
– This will have a capital costs (number and size of the heatexchangers) vs. operating costs (steam / cooling water utilitydemands) situation. When fuel costs are high … the minimumannual costs will tend toward minimum utilities.
Having taught Synthesis of Process Flowsheets, consider teaching Equipment Design –
For example:
Heat Exchanger Design
Recommend – teach when not covered in heat-transfer
course – especially shell-and-tube HXs
Separation Tower Design
Recommend – for separation columns, include calculationof flooding velocities –
to estimate column diameters –
when not covered in separationscourse
Design of Pumps, Compressors, and Expanders
Recommend – for compressors, cover (review)
isentropic efficiency
Chemical Reactor Design
Recommend – for tubular reactors, use CFD (e.g., COMSOL) to show the weakness of the plug flow (perfect radial mixing) assumption
Capital Cost Estimation (in 2 lectures) -
Recommend – begin with estimation ofequipment purchase costs as afunction of equipment sizesusing graphs and simple equations
- show estimation of installation(bare module) costs
- move to estimation of totalcapital investment, CTCI
Economics / Profitability Analysis (4 lectures)
– Lectures in this section focus on issues associated with TimeValue of Money and Approximate and Rigorous ProfitabilityMeasures.
– These topics are valuable for the students in the followingsemester when they are completing their senior design projects.
– Students need to be able to appropriately estimate the relativevalue/cost of proposed long-term investments or projects.
– The “time value of money” recognizes the fact that an amountof money at the current time may not hold the same value at afuture date. The concept of interest is related to the differencebetween the future value and present value.
Product Design Synthesis (5 lectures)
Recommend – introduce during the last third of the semester as students are completingprocess design homework –
– introduce the 4 kinds of productsin sequence:
Molecular and Mixture ProductsChemical Device ProductsFunctional Products Formulated Products

For Molecular and Mixture Products
Recommend – show, by example, a typicaloptimization formulationusing group contributions
but, don’t teach optimizationtechniques – instead have students use product designsoftware; e.g., ProCAMD
- begin by reviewing property estimation using empirical group-contribution methods;e.g.,the glass-transition temperature,Tg, for a polymer repeat unit
To be continued by Ka Ng
Teaching Process and Product Design
Ka M. NgThe Hong Kong University of Science and Technology
Warren D. SeiderUniversity of Pennsylvania
Presented at the ASEE Summer School, NC State, July 30-August 3, 2017
Acknowledgment: Kelvin Fung, Danny Lewin, Bob Seader, Soemantri Widagdo, and Rafiqul Gani
My experience in teaching product design
• A course on process and product design
– Warren’s Type III 1 (but with design project)
• A course on product (and unconventional process) design
– Warren’s Type II 2
• Courses given at undergraduate and graduate level
• There is always a design project
Introduction to Product Design (in 1 lecture) Ch 1
• The chemical supply chain (Discussed by Warren earlier)
Additional points:
• Types of B2C chemical products
• B2B vs. B2C products
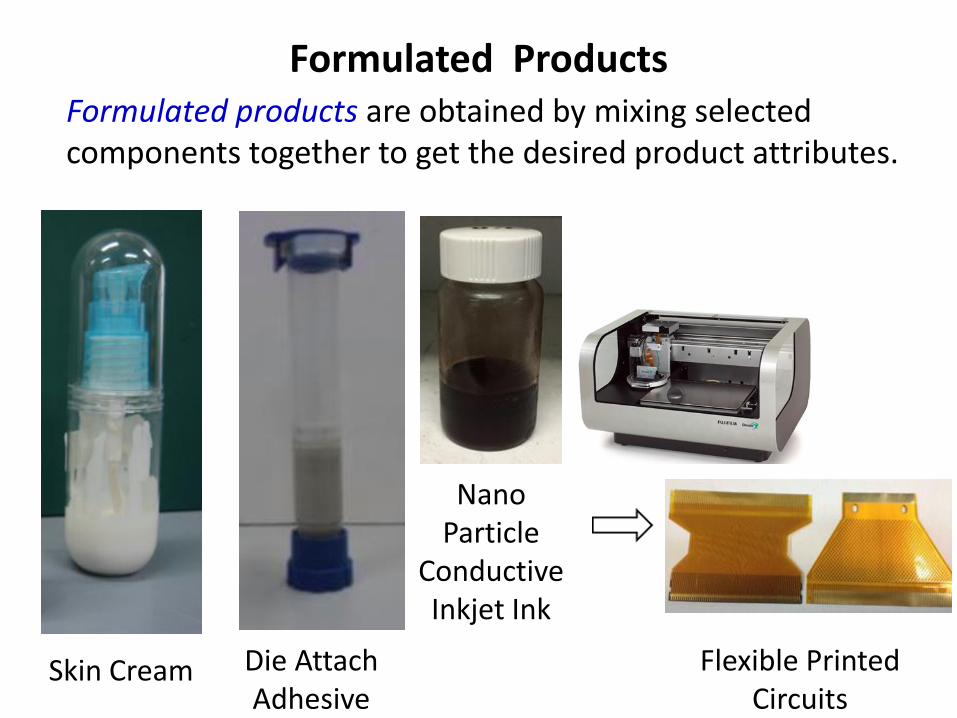
Formulated Products
Skin Cream
Nano Particle
Conductive Inkjet Ink
Formulated products are obtained by mixing selected components together to get the desired product attributes.
Die Attach Adhesive
Flexible Printed Circuits
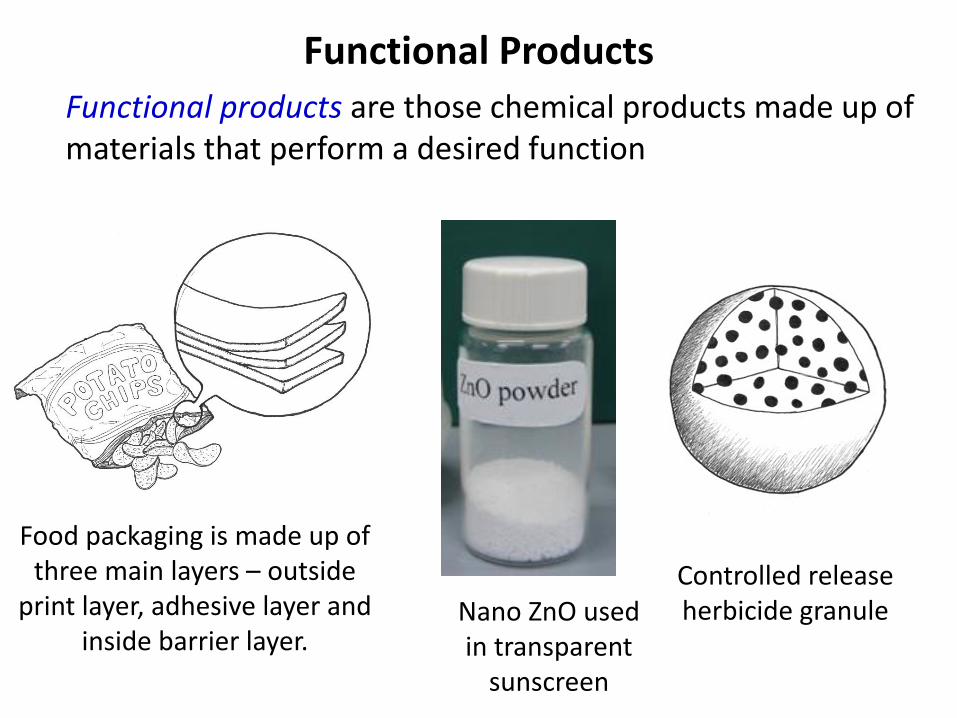
Functional Products
Food packaging is made up of three main layers – outside
print layer, adhesive layer and inside barrier layer.
Functional products are those chemical products made up of materials that perform a desired function
Controlled release herbicide granuleNano ZnO used
in transparent sunscreen
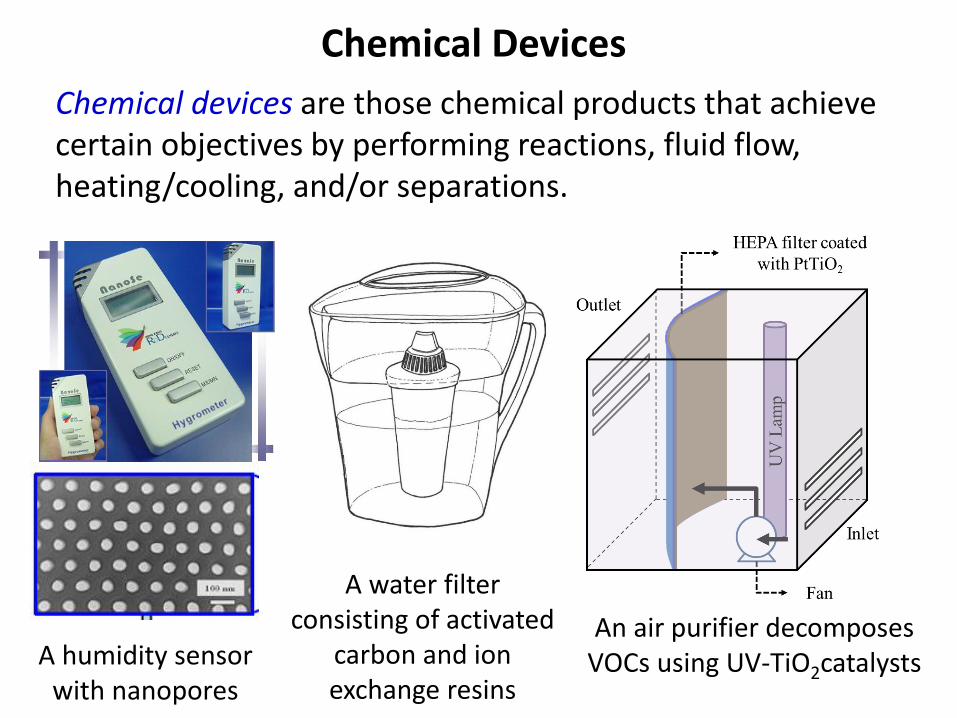
Chemical Devices
A water filter consisting of activated
carbon and ion exchange resins
Chemical devices are those chemical products that achieve certain objectives by performing reactions, fluid flow, heating/cooling, and/or separations.
An air purifier decomposes VOCs using UV-TiO2catalysts A humidity sensor
with nanopores
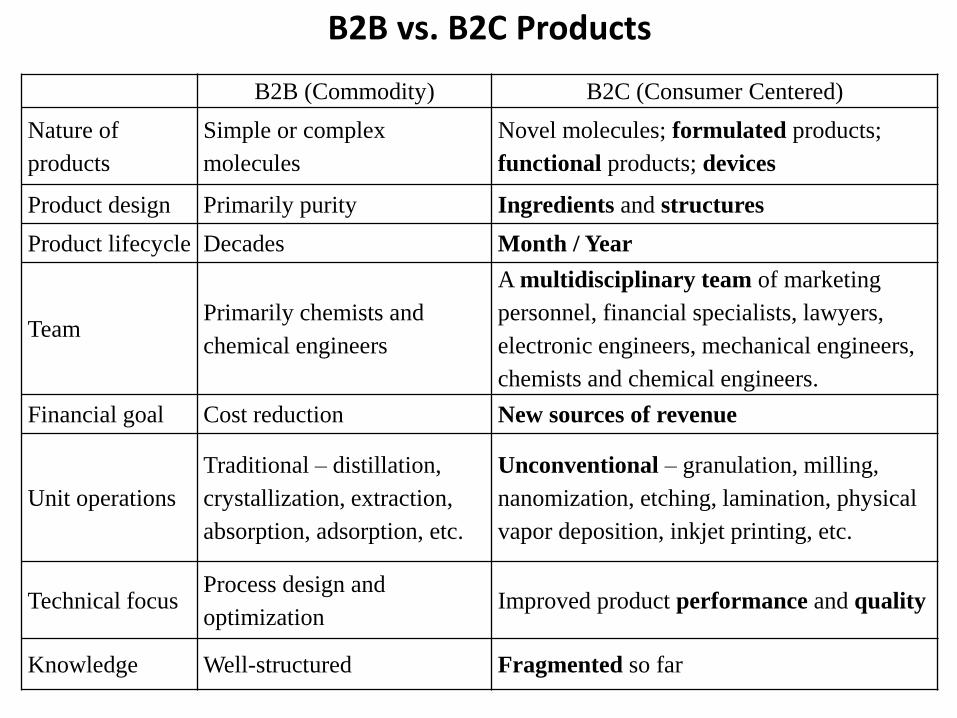
B2B vs. B2C Products
B2B (Commodity) B2C (Consumer Centered)
Nature of
products
Simple or complex
molecules
Novel molecules; formulated products;
functional products; devices
Product design Primarily purity Ingredients and structures
Product lifecycle Decades Month / Year
TeamPrimarily chemists and
chemical engineers
A multidisciplinary team of marketing
personnel, financial specialists, lawyers,
electronic engineers, mechanical engineers,
chemists and chemical engineers.
Financial goal Cost reduction New sources of revenue
Unit operations
Traditional – distillation,
crystallization, extraction,
absorption, adsorption, etc.
Unconventional – granulation, milling,
nanomization, etching, lamination, physical
vapor deposition, inkjet printing, etc.
Technical focusProcess design and
optimizationImproved product performance and quality
Knowledge Well-structured Fragmented so far
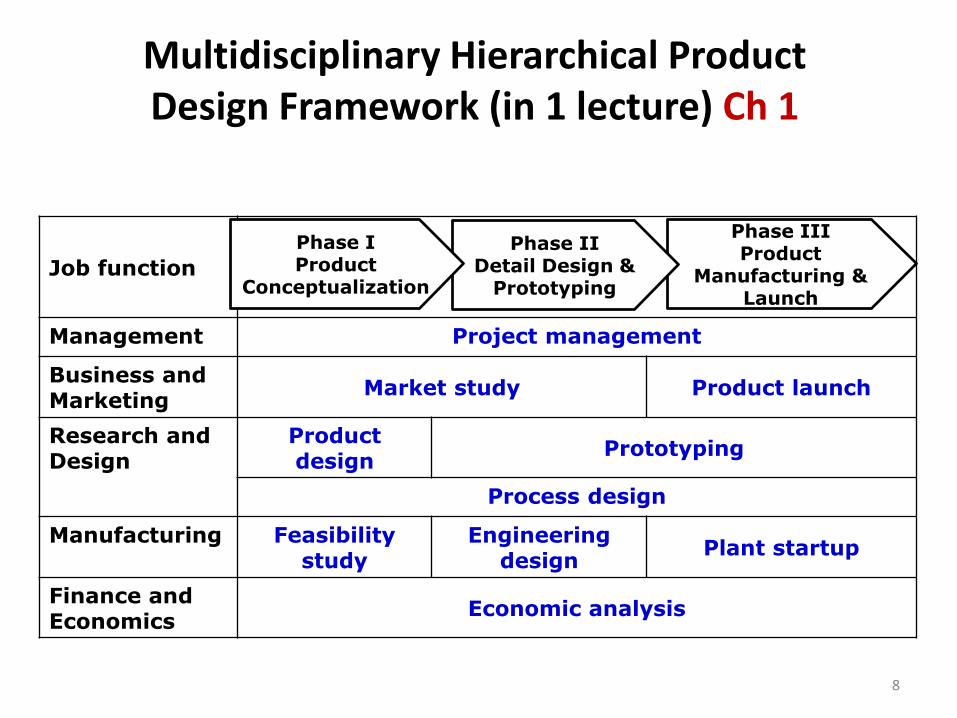
Job function
Management Project management
Business and Marketing
Market study Product launch
Research and Design
Product design
Prototyping
Process design
Manufacturing Feasibility study
Engineering design
Plant startup
Finance and Economics
Economic analysis
Multidisciplinary Hierarchical Product Design Framework (in 1 lecture) Ch 1
Phase IIIProduct
Manufacturing & Launch
Phase IIDetail Design &
Prototyping
Phase IProduct
Conceptualization
8
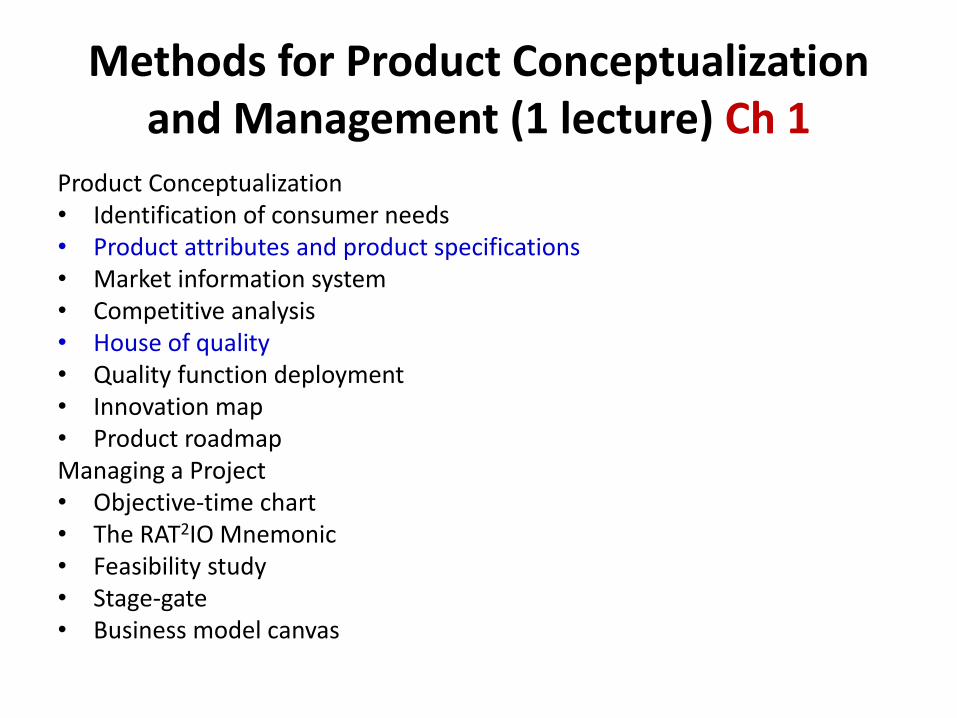
Methods for Product Conceptualization and Management (1 lecture) Ch 1
Product Conceptualization• Identification of consumer needs• Product attributes and product specifications• Market information system• Competitive analysis• House of quality• Quality function deployment• Innovation map• Product roadmapManaging a Project• Objective-time chart• The RAT2IO Mnemonic• Feasibility study• Stage-gate• Business model canvas

Translating Consumer Preferences to Technical Specifications
Attributes, yi Weight, wi
Acidity 0.0714
Sweetness 0.0714
Bitterness 0.0714
Clarity 0.1429
Color 0.0714
Brightness 0.0714
Bouquet 0.2858
Body/texture 0.1429
Finish/ aftertaste 0.0714
H = overall consumer preferencewi = weighing factor of attribute iyi = product attribute i score
yi depends on technical characteristics, xi
Thus, need yi vs. xi
Preference function:
• Wine is commonly judged based on the following attributes• The weights of each attribute (i.e. how important is this
attribute) are identified through market research
Whitnack, C., Heller, A., Frow, M.T., Kerr, S., Bagajewicz, M.J. Financial risk management in the design of products
under certainty. Comp. & Chem. Eng., 33, 1056-1066 (2009) .10
𝐻 =𝑖𝑤𝑖𝑦𝑖
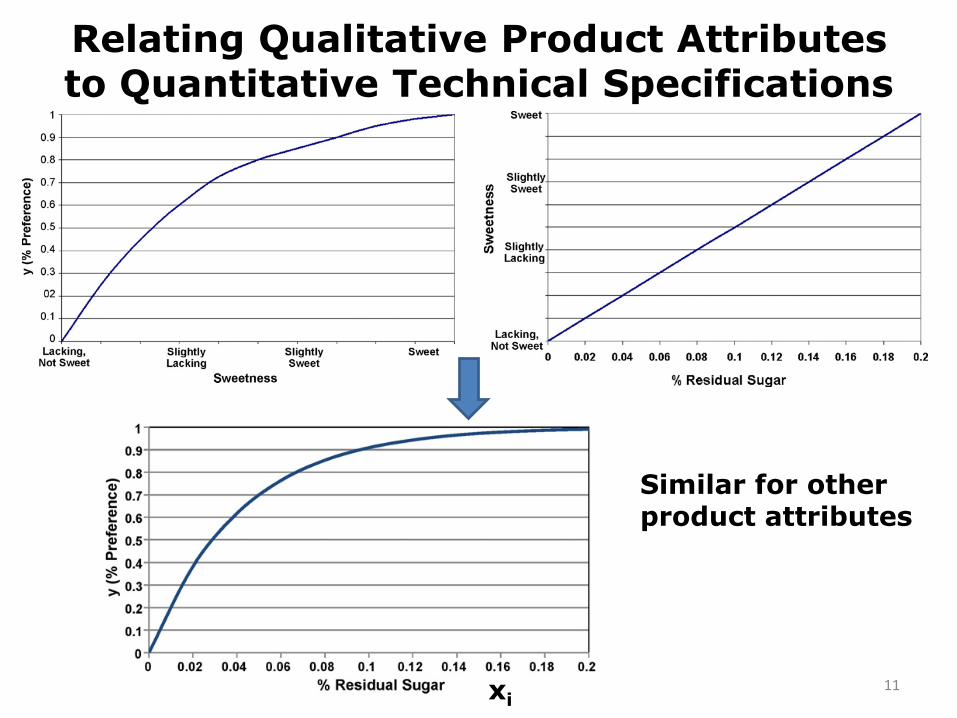
Relating Qualitative Product Attributes to Quantitative Technical Specifications
Similar for other product attributes
11xi
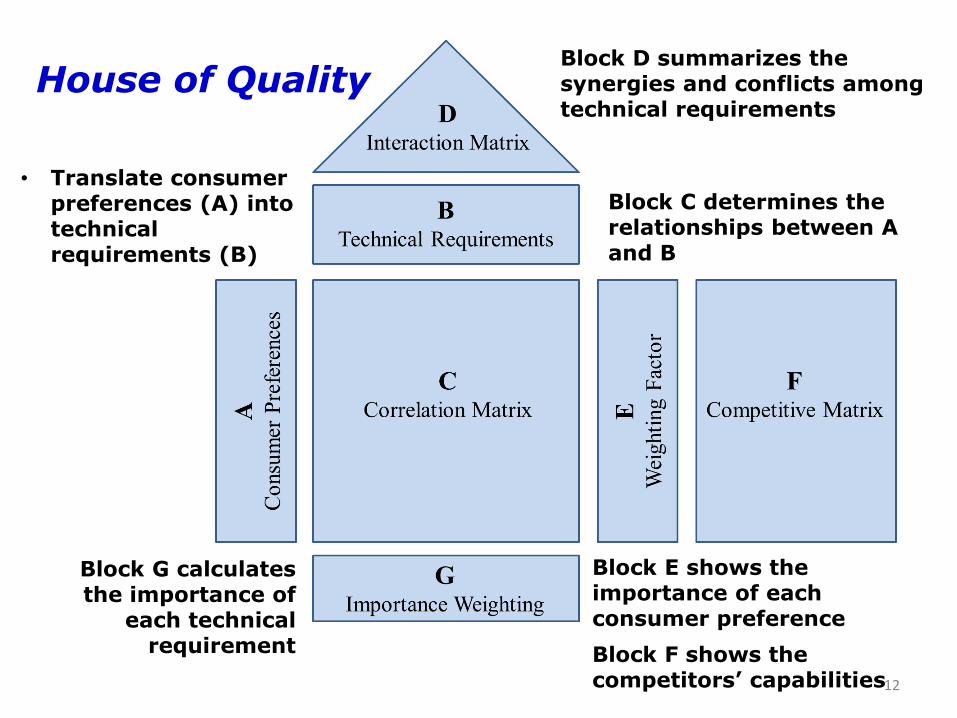
House of Quality
• Translate consumer preferences (A) into technical requirements (B)
Block C determines the relationships between A and B
Block D summarizes the synergies and conflicts among technical requirements
Block G calculates the importance of
each technical requirement Block F shows the
competitors’ capabilities
Block E shows the importance of each consumer preference
12
Devices and
Functional Products
Product Performance
Identify Key
Ingredients
Identify
Physicochemical
Phenomena for
Modelling
Identify Product
Specifications
Product
Alternatives
Chemical Engineering
Principles
• Computer-aided Tools
• Mechanistic Models
• Empirical Correlations
Formulated
Products
Product Attributes
Generate Base-Case
Formula with
Microstructure
Verify
Physicochemical
Properties
Perform
Experimental
Iterations
Product
Alternatives
• Causal Table
Novel Ingredients
• Molecular Design
Typical Ingredients
• Databases
• Rule-based Methods
Molecular Products
Product Definition • Databases
CAMD Formulation
• Databases
• Rule-based Methods
• Model-based Methods
MI(N)LP
Formulation• Optimization Software
Solution Strategy
• MI(N)LP Solvers
• Decomposition
Algorithm
Solution
Found?
Ingredient
Candidates
Y
N
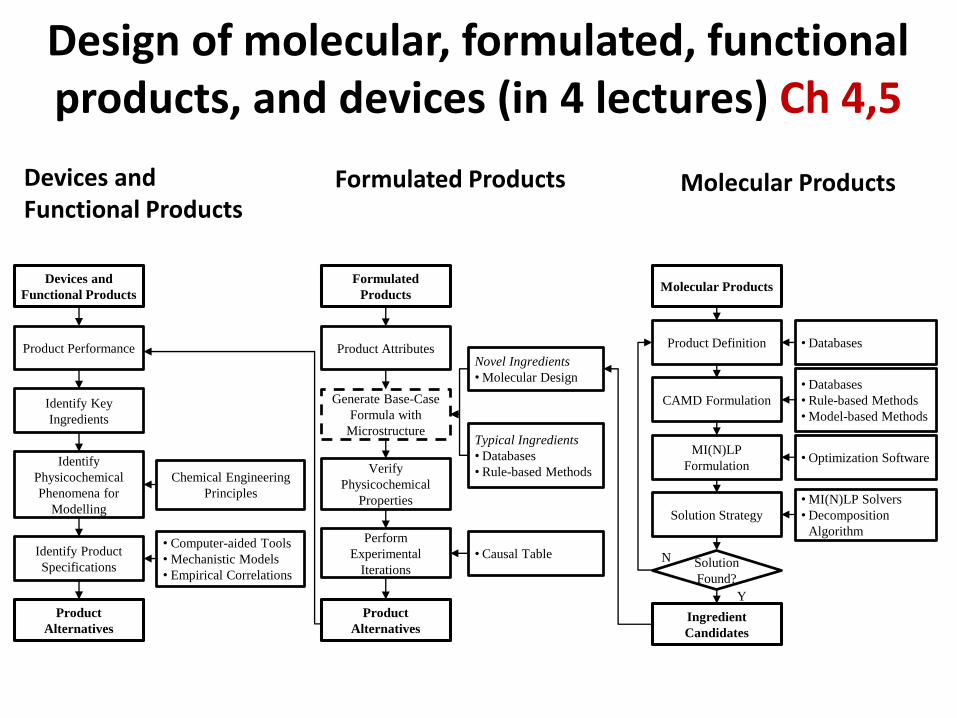
Design of molecular, formulated, functional products, and devices (in 4 lectures) Ch 4,5
Devices and Functional Products
Formulated Products Molecular Products
14
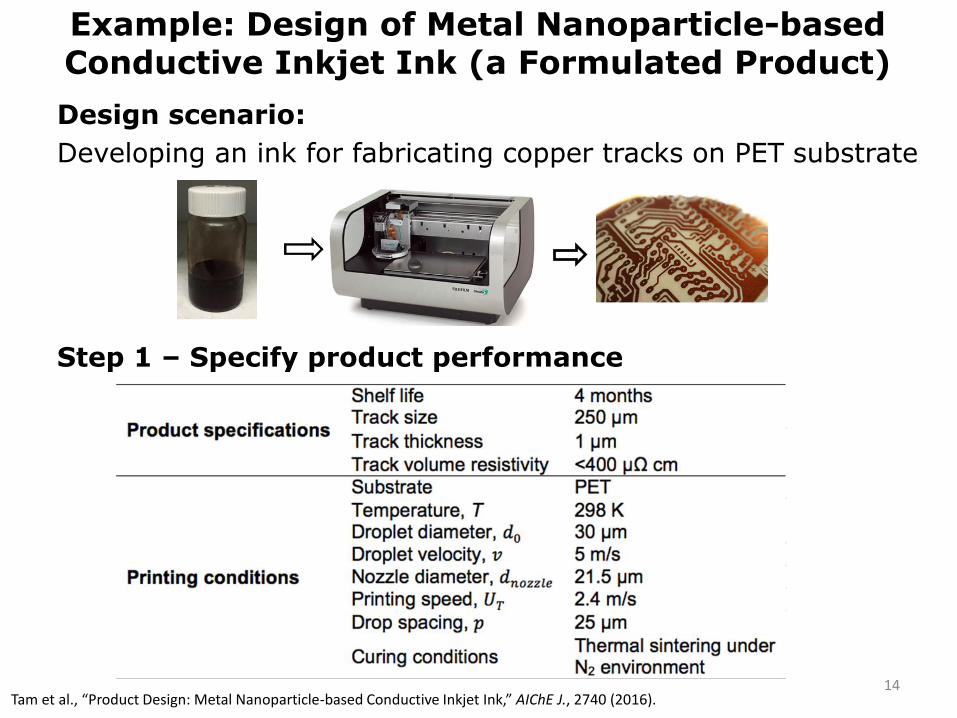
Example: Design of Metal Nanoparticle-based Conductive Inkjet Ink (a Formulated Product)
Design scenario:
Developing an ink for fabricating copper tracks on PET substrate
Step 1 – Specify product performance
Tam et al., “Product Design: Metal Nanoparticle-based Conductive Inkjet Ink,” AIChE J., 2740 (2016).
15
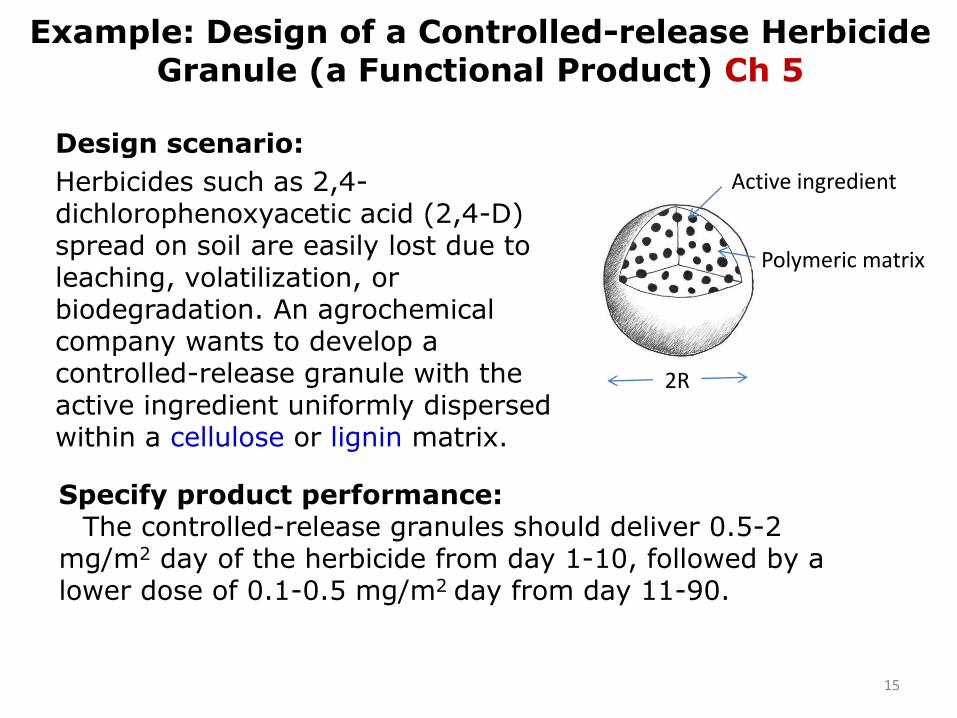
Example: Design of a Controlled-release Herbicide Granule (a Functional Product) Ch 5
Design scenario:
Herbicides such as 2,4-dichlorophenoxyacetic acid (2,4-D) spread on soil are easily lost due to leaching, volatilization, or biodegradation. An agrochemical company wants to develop a controlled-release granule with the active ingredient uniformly dispersed within a cellulose or lignin matrix.
Active ingredient
Polymeric matrix
2R
Specify product performance:The controlled-release granules should deliver 0.5-2
mg/m2 day of the herbicide from day 1-10, followed by a lower dose of 0.1-0.5 mg/m2 day from day 11-90.
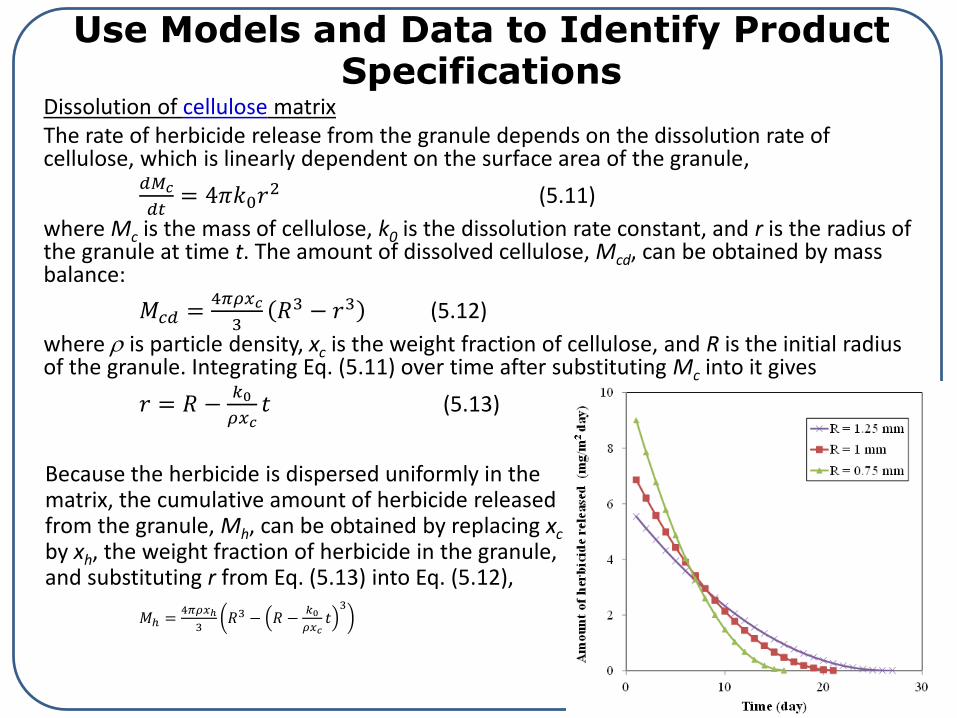
Use Models and Data to Identify Product Specifications
Dissolution of cellulose matrixThe rate of herbicide release from the granule depends on the dissolution rate of cellulose, which is linearly dependent on the surface area of the granule,
𝑑𝑀𝑐
𝑑𝑡= 4𝜋𝑘0𝑟
2 (5.11)
where Mc is the mass of cellulose, k0 is the dissolution rate constant, and r is the radius of the granule at time t. The amount of dissolved cellulose, Mcd, can be obtained by mass balance:
𝑀𝑐𝑑 =4𝜋𝜌𝑥𝑐
3𝑅3 − 𝑟3 (5.12)
where is particle density, xc is the weight fraction of cellulose, and R is the initial radius of the granule. Integrating Eq. (5.11) over time after substituting Mc into it gives
𝑟 = 𝑅 −𝑘0
𝜌𝑥𝑐𝑡 (5.13)
𝑀ℎ =4𝜋𝜌𝑥ℎ
3𝑅3 − 𝑅 −
𝑘0
𝜌𝑥𝑐𝑡
3
16
Because the herbicide is dispersed uniformly in the matrix, the cumulative amount of herbicide released from the granule, Mh, can be obtained by replacing xcby xh, the weight fraction of herbicide in the granule, and substituting r from Eq. (5.13) into Eq. (5.12),
17
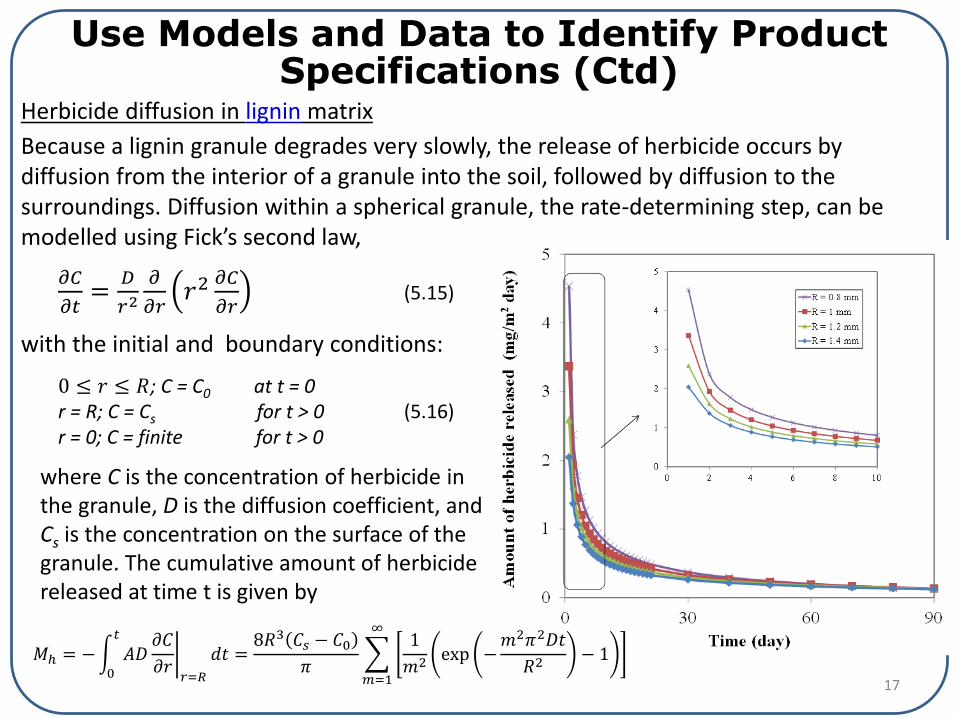
Use Models and Data to Identify Product Specifications (Ctd)
Herbicide diffusion in lignin matrix
Because a lignin granule degrades very slowly, the release of herbicide occurs by diffusion from the interior of a granule into the soil, followed by diffusion to the surroundings. Diffusion within a spherical granule, the rate-determining step, can be modelled using Fick’s second law,
𝜕𝐶
𝜕𝑡=
𝐷
𝑟2𝜕
𝜕𝑟𝑟2
𝜕𝐶
𝜕𝑟(5.15)
with the initial and boundary conditions:
0 ≤ 𝑟 ≤ 𝑅; C = C0 at t = 0r = R; C = Cs for t > 0 (5.16)r = 0; C = finite for t > 0
where C is the concentration of herbicide in the granule, D is the diffusion coefficient, and Cs is the concentration on the surface of the granule. The cumulative amount of herbicide released at time t is given by
𝑀ℎ = −න0
𝑡
𝐴𝐷 ቤ𝜕𝐶
𝜕𝑟𝑟=𝑅
𝑑𝑡 =8𝑅3 𝐶𝑠 − 𝐶0
𝜋
𝑚=1
∞1
𝑚2exp −
𝑚2𝜋2𝐷𝑡
𝑅2− 1
18
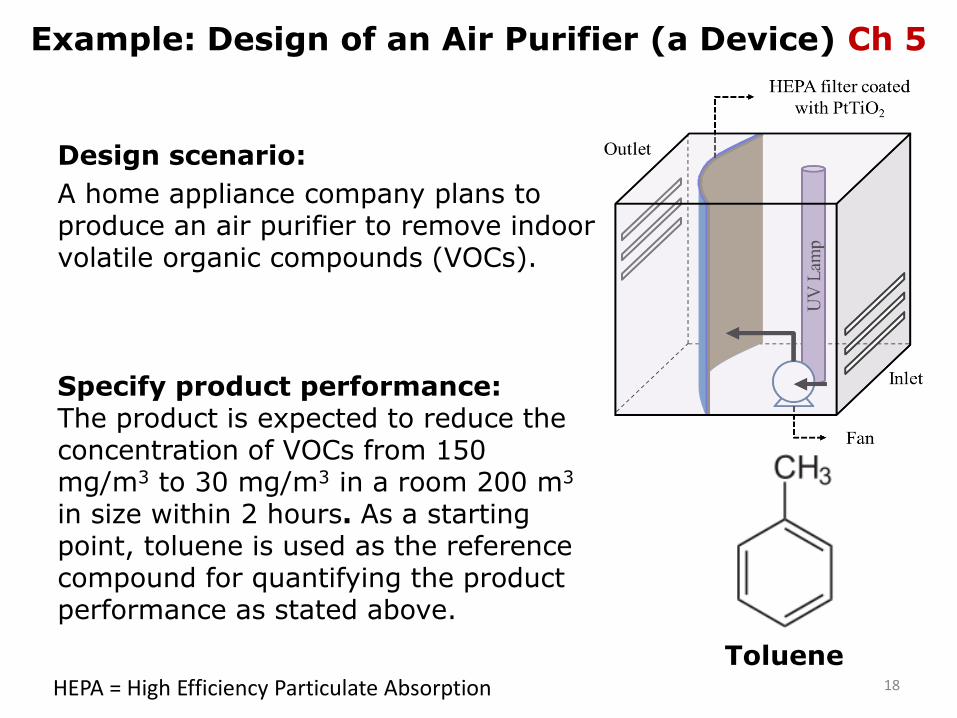
Example: Design of an Air Purifier (a Device) Ch 5
Design scenario:
A home appliance company plans to produce an air purifier to remove indoor volatile organic compounds (VOCs).
Toluene
Specify product performance:The product is expected to reduce the concentration of VOCs from 150 mg/m3 to 30 mg/m3 in a room 200 m3
in size within 2 hours. As a starting point, toluene is used as the reference compound for quantifying the product performance as stated above.
HEPA = High Efficiency Particulate Absorption
19
Use Models and Data to Determine Product Specifications (Ctd)
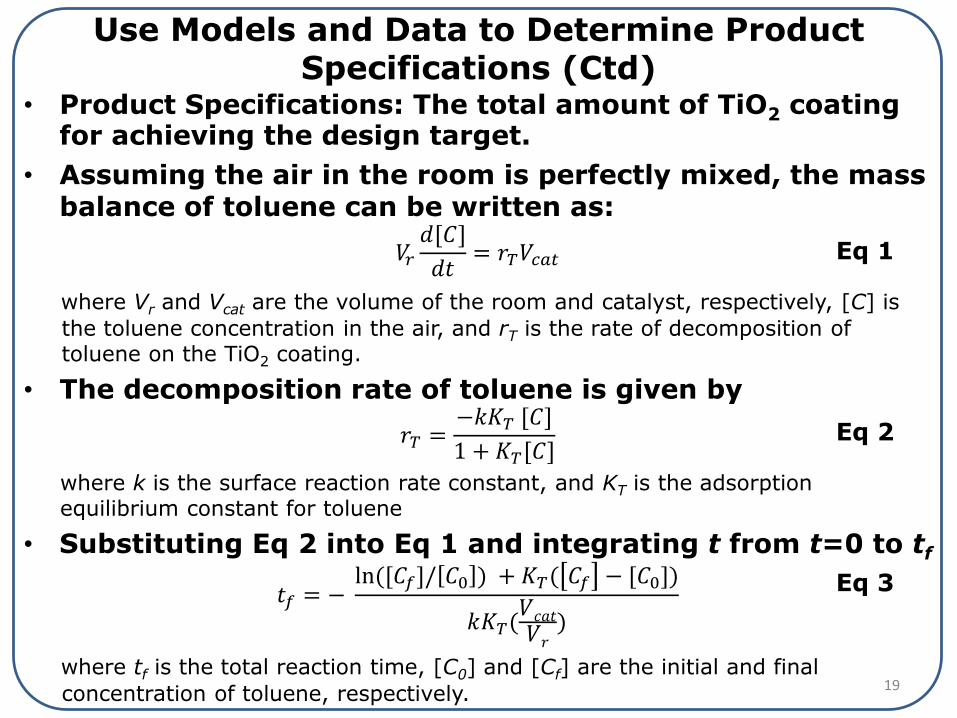
• Product Specifications: The total amount of TiO2 coating for achieving the design target.
• Assuming the air in the room is perfectly mixed, the mass balance of toluene can be written as:
𝑉𝑟𝑑[𝐶]
𝑑𝑡= 𝑟𝑇𝑉𝑐𝑎𝑡
where Vr and Vcat are the volume of the room and catalyst, respectively, [C] is
the toluene concentration in the air, and rT is the rate of decomposition of toluene on the TiO2 coating.
• The decomposition rate of toluene is given by
𝑟𝑇 =−𝑘𝐾𝑇 [𝐶]
1 + 𝐾𝑇[𝐶]
where k is the surface reaction rate constant, and KT is the adsorption equilibrium constant for toluene
• Substituting Eq 2 into Eq 1 and integrating t from t=0 to tf
𝑡𝑓 = −ln([𝐶𝑓]/ 𝐶0 ) + 𝐾𝑇( 𝐶𝑓 − [𝐶0])
𝑘𝐾𝑇(𝑉𝑐𝑎𝑡𝑉𝑟
)
where tf is the total reaction time, [C0] and [Cf] are the initial and final
concentration of toluene, respectively.
Eq 1
Eq 2
Eq 3
20
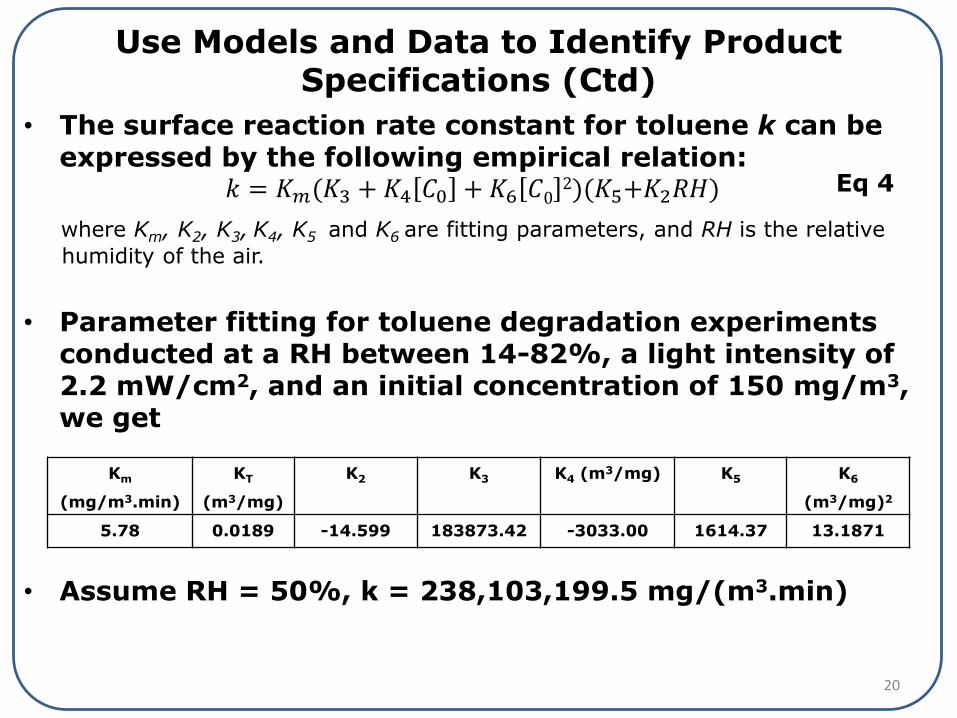
Use Models and Data to Identify Product Specifications (Ctd)
• The surface reaction rate constant for toluene k can be expressed by the following empirical relation:
𝑘 = 𝐾𝑚(𝐾3 + 𝐾4 𝐶0 + 𝐾6 𝐶02)(𝐾5+𝐾2𝑅𝐻)
where Km, K2, K3, K4, K5 and K6 are fitting parameters, and RH is the relative
humidity of the air.
• Parameter fitting for toluene degradation experiments conducted at a RH between 14-82%, a light intensity of 2.2 mW/cm2, and an initial concentration of 150 mg/m3, we get
• Assume RH = 50%, k = 238,103,199.5 mg/(m3.min)
Eq 4
Km
(mg/m3.min)
KT
(m3/mg)
K2 K3 K4 (m3/mg) K5 K6
(m3/mg)2
5.78 0.0189 -14.599 183873.42 -3033.00 1614.37 13.1871
21
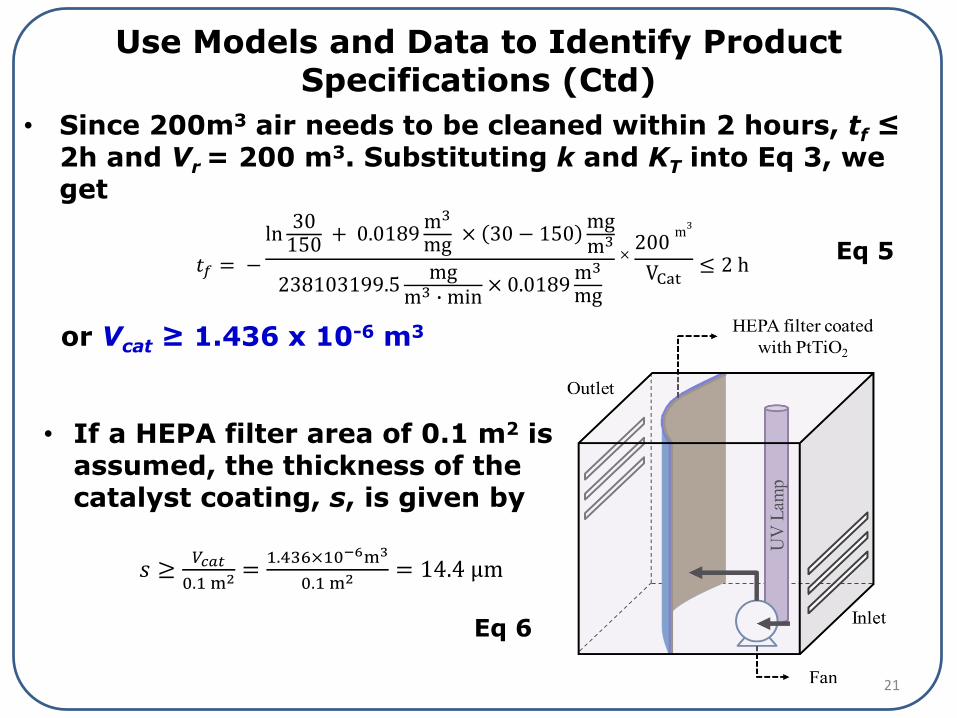
Use Models and Data to Identify Product Specifications (Ctd)
• Since 200m3 air needs to be cleaned within 2 hours, tf ≤ 2h and Vr = 200 m3. Substituting k and KT into Eq 3, we get
𝑡𝑓 = −
ln30150
+ 0.0189m3
mg× 30 − 150
mgm3
238103199.5mg
m3 ∙ min× 0.0189
m3
mg
×200
m3
VCat≤ 2 h
or Vcat ≥ 1.436 x 10⁻⁶ m3
Eq 5
Eq 6
• If a HEPA filter area of 0.1 m2 is assumed, the thickness of the catalyst coating, s, is given by
𝑠 ≥𝑉𝑐𝑎𝑡
0.1 m2 =1.436×10⁻⁶m3
0.1 m2 = 14.4 μm
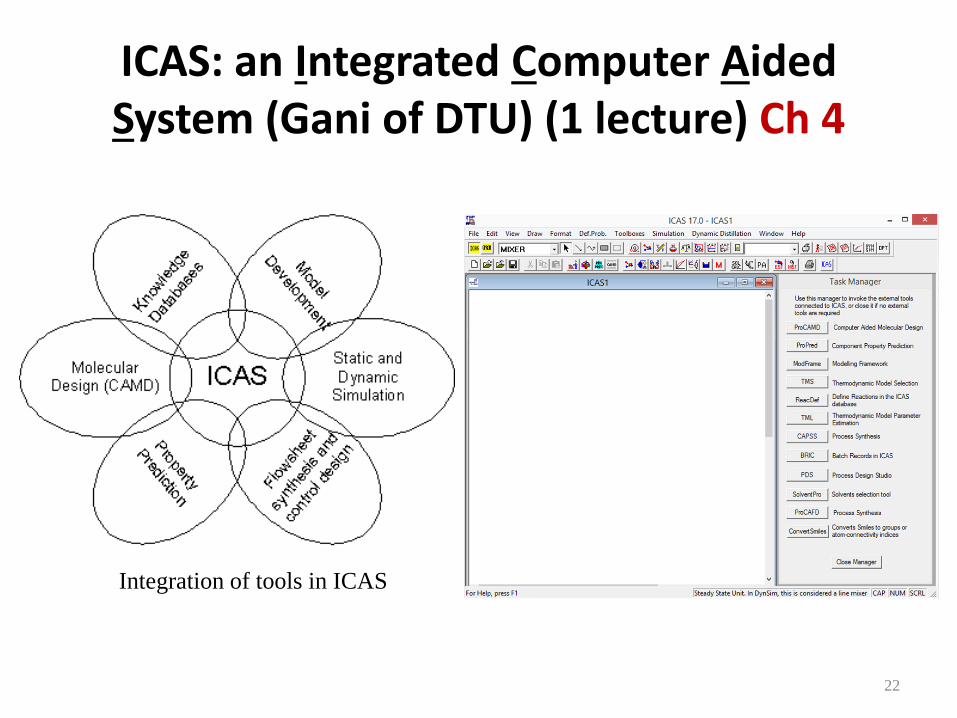
ICAS: an Integrated Computer Aided System (Gani of DTU) (1 lecture) Ch 4
22
Integration of tools in ICAS
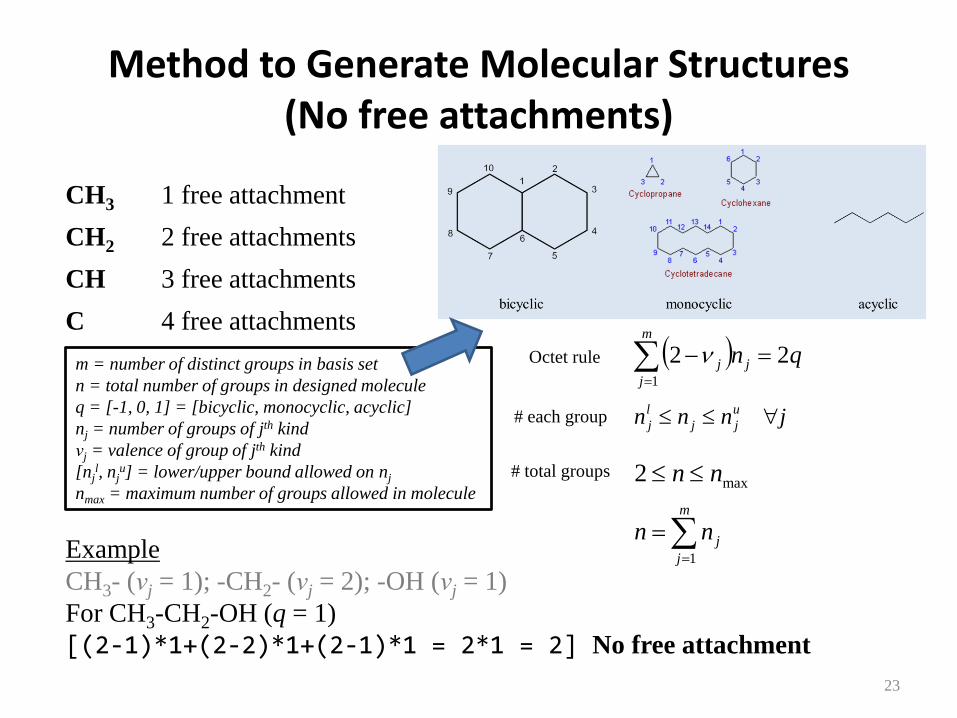
Method to Generate Molecular Structures(No free attachments)
Example
CH3- (νj = 1); -CH2- (νj = 2); -OH (νj = 1)
For CH3-CH2-OH (q = 1)
[(2-1)*1+(2-2)*1+(2-1)*1 = 2*1 = 2] No free attachment
m = number of distinct groups in basis set
n = total number of groups in designed molecule
q = [-1, 0, 1] = [bicyclic, monocyclic, acyclic]
nj = number of groups of jth kind
νj = valence of group of jth kind
[njl, nj
u] = lower/upper bound allowed on nj
nmax = maximum number of groups allowed in molecule
23
CH3 1 free attachment CH3CH2OH ? free attachments
CH2 2 free attachments -[CH2-NH]n- ? free attachments
CH 3 free attachments Cyclohexane ? free attachments
C 4 free attachments
Octet rule qnm
j
jj 221
jnnn u
jj
l
j # each group
max2 nn # total groups
m
j
jnn1
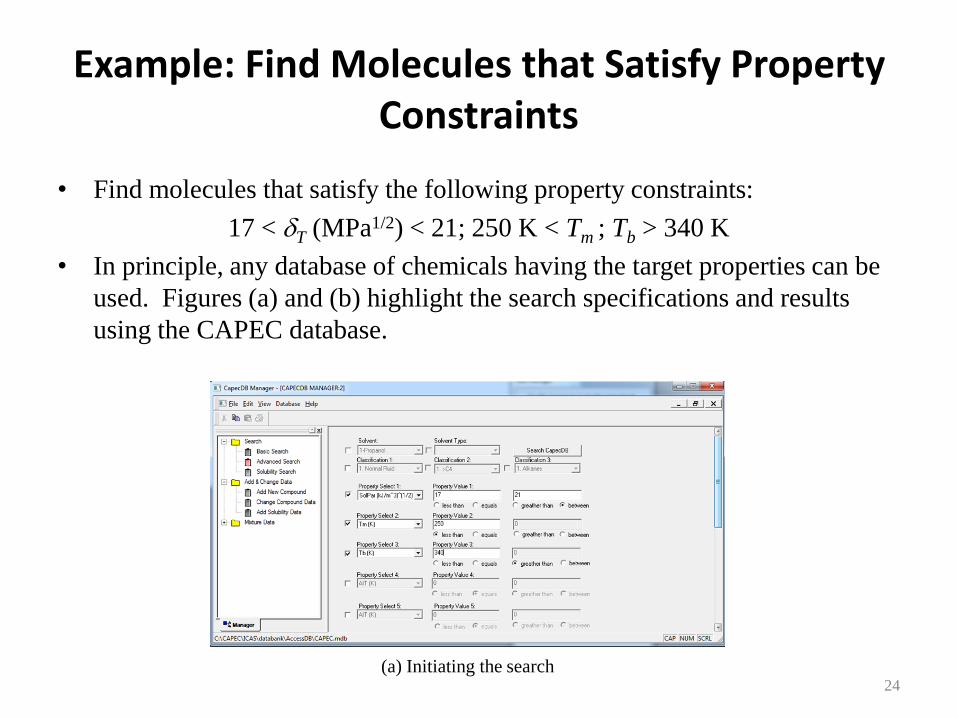
Example: Find Molecules that Satisfy Property Constraints
• Find molecules that satisfy the following property constraints:
17 < T (MPa1/2) < 21; 250 K < Tm ; Tb > 340 K
• In principle, any database of chemicals having the target properties can be
used. Figures (a) and (b) highlight the search specifications and results
using the CAPEC database.
(a) Initiating the search24
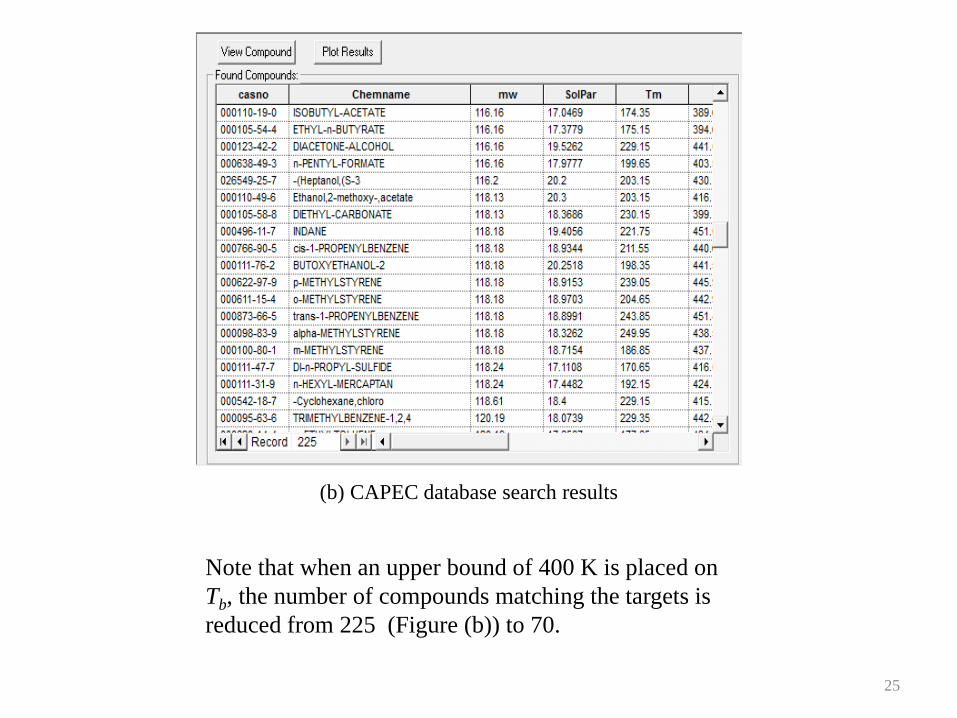
(b) CAPEC database search results
Note that when an upper bound of 400 K is placed on
Tb, the number of compounds matching the targets is
reduced from 225 (Figure (b)) to 70.
25
26
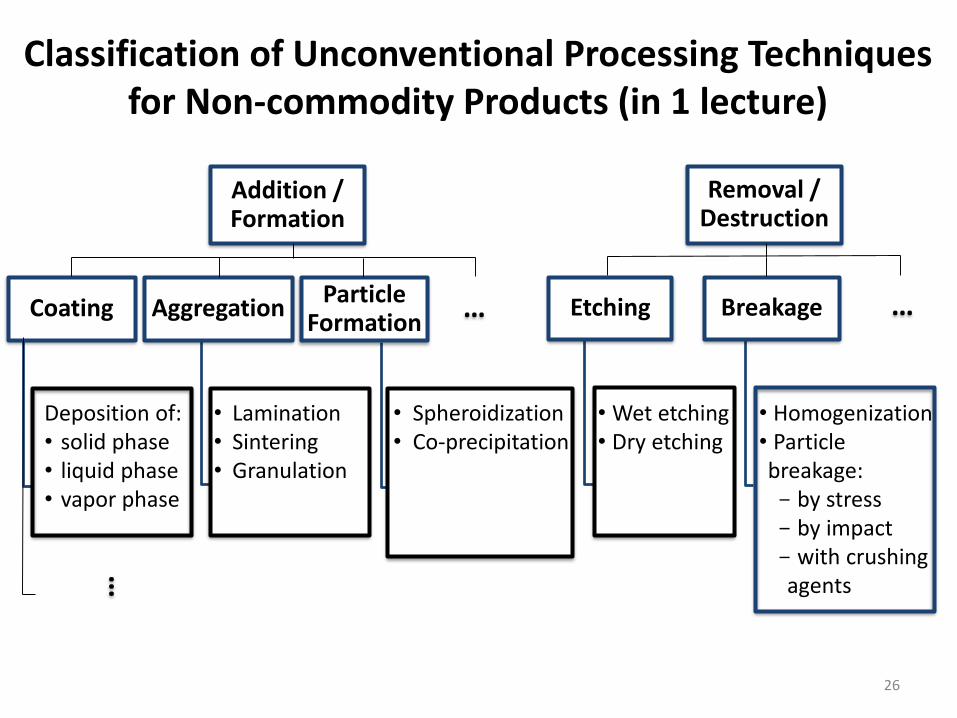
Classification of Unconventional Processing Techniques for Non-commodity Products (in 1 lecture)
Addition / Formation
Coating AggregationParticle
Formation
Removal / Destruction
Etching Breakage
Deposition of:• solid phase• liquid phase• vapor phase
• Lamination • Sintering• Granulation
• Spheroidization• Co-precipitation
• Wet etching• Dry etching
• Homogenization• Particle breakage: - by stress- by impact- with crushing agents
……
…
27
Example : A Cream Manufacturing Process Ch 5
Design scenario:
One of the requirements for a cream product is that the emulsion droplets should have a diameter smaller than 5 m to obtain a smooth cream. Develop a conceptual process design along with the key equipment characteristics and operating conditions.
The design process includes three steps:
- Process synthesis
- Selection of equipment units
- Selection of equipment operating conditions
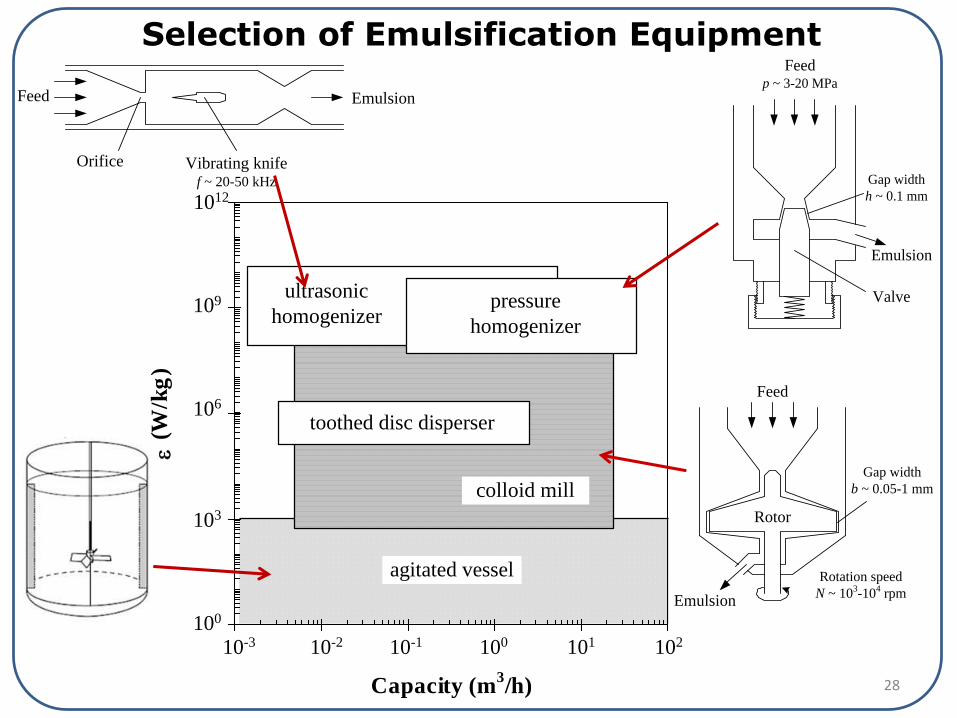
Selection of Emulsification Equipment
agitated vessel
pressure
homogenizer
colloid mill
toothed disc disperser
ultrasonic
homogenizer
100
10-3 10210110-2 10010-1
103
106
109
1012
Capacity (m3/h)
e (
W/k
g)
Feed
Emulsion
Rotation speed
N ~ 103-104 rpm
Gap width
b ~ 0.05-1 mm
Rotor
Gap width
h ~ 0.1 mm
Feedp ~ 3-20 MPa
Emulsion
Valve
EmulsionFeed
Vibrating knifef ~ 20-50 kHz
Orifice
28
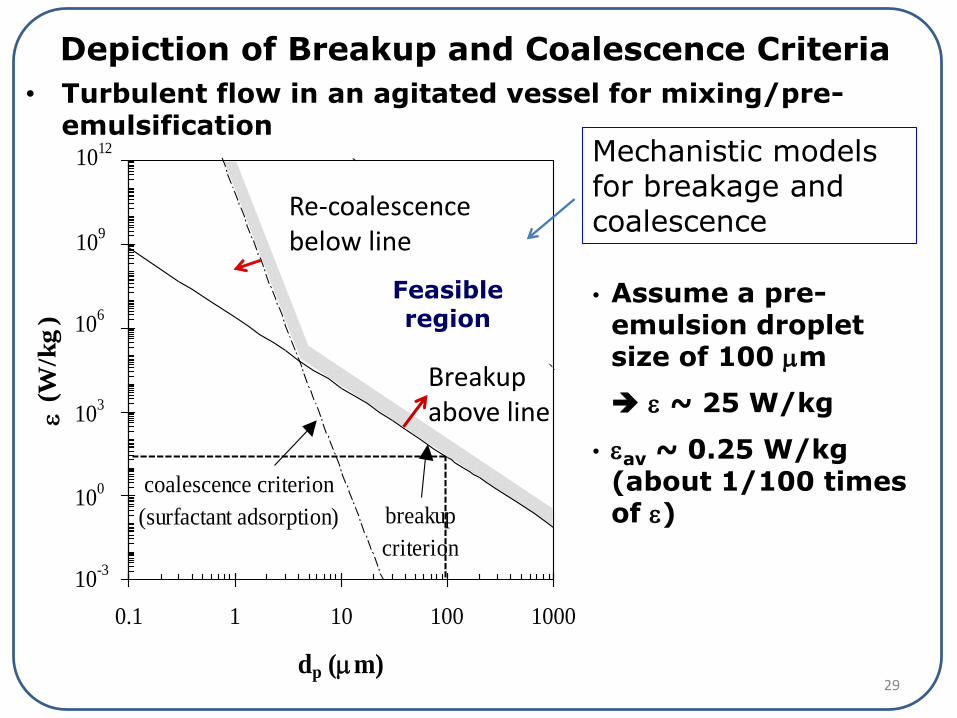
F
• Turbulent flow in an agitated vessel for mixing/pre-emulsification
Depiction of Breakup and Coalescence Criteria
• Assume a pre-emulsion droplet size of 100 m
e ~ 25 W/kg
• eav ~ 0.25 W/kg (about 1/100 times of e)
0.1 1 10 100 1000
dp (m)
e (
W/k
g)
10-3
100
103
106
109
1012
coalescence criterion
(surfactant adsorption)
coalescence
criterion
(drainage)
breakup
criterion
Breakup above line
Mechanistic models for breakage and coalescence
Re-coalescence below line
Feasible region
29
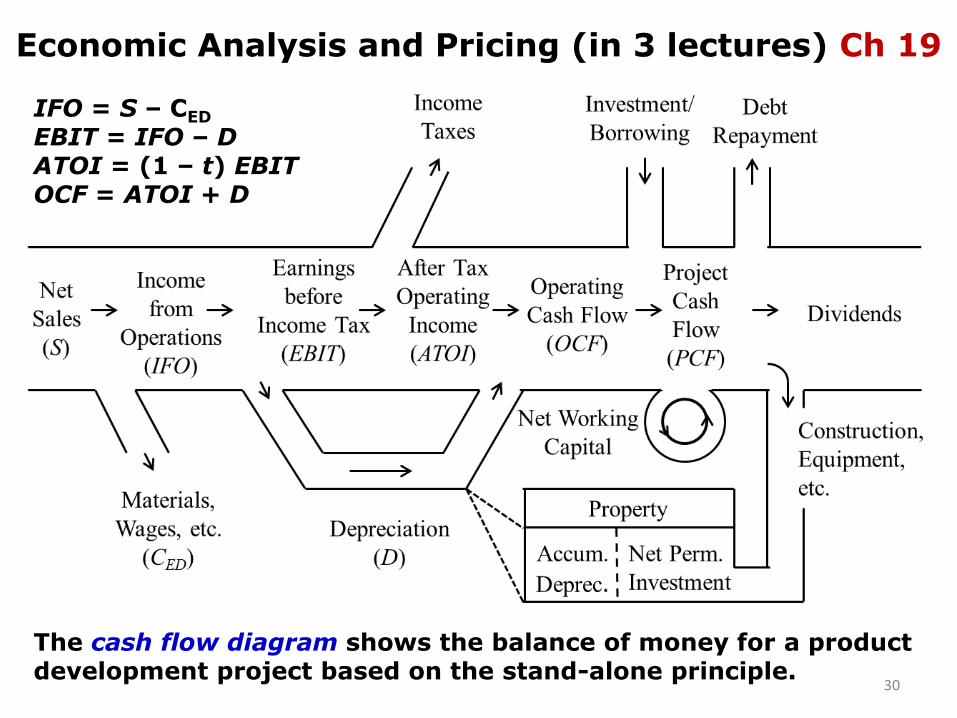
Economic Analysis and Pricing (in 3 lectures) Ch 19
The cash flow diagram shows the balance of money for a product development project based on the stand-alone principle.
IFO = S – CED
EBIT = IFO – DATOI = (1 – t) EBITOCF = ATOI + D
30
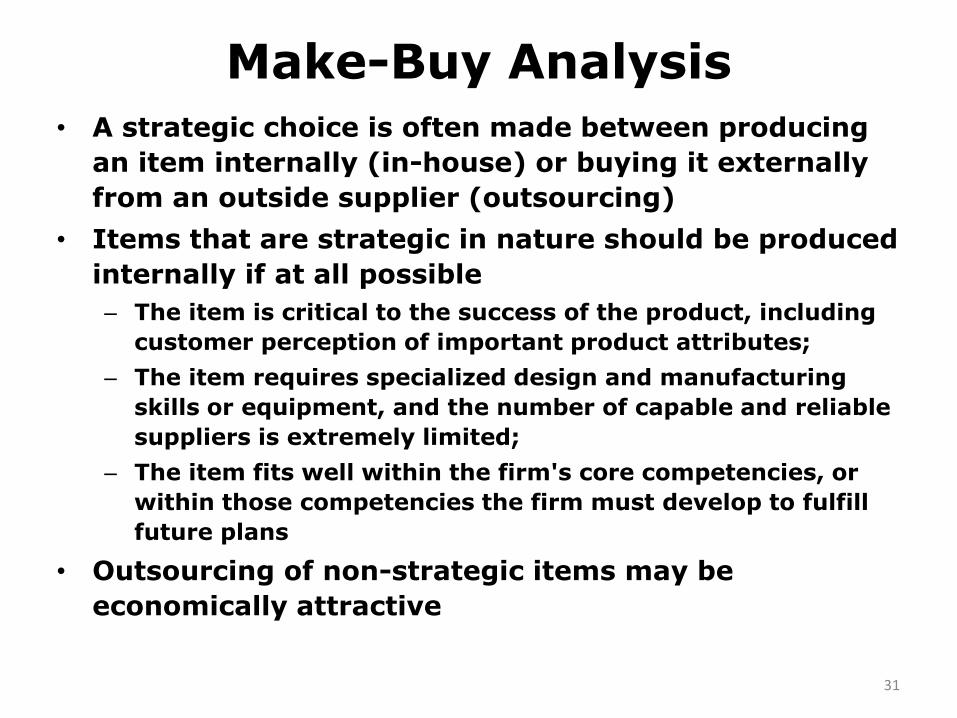
Make-Buy Analysis• A strategic choice is often made between producing
an item internally (in-house) or buying it externally
from an outside supplier (outsourcing)
• Items that are strategic in nature should be produced
internally if at all possible
– The item is critical to the success of the product, including
customer perception of important product attributes;
– The item requires specialized design and manufacturing
skills or equipment, and the number of capable and reliable
suppliers is extremely limited;
– The item fits well within the firm's core competencies, or
within those competencies the firm must develop to fulfill
future plans
• Outsourcing of non-strategic items may be
economically attractive
31
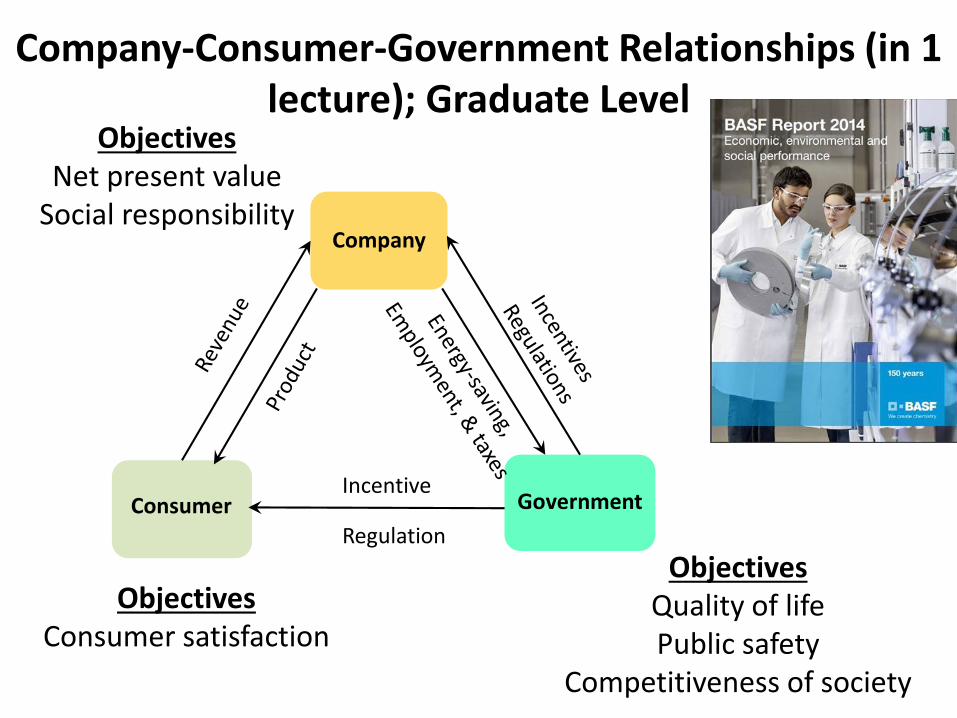
ObjectivesNet present value
Social responsibility
Company-Consumer-Government Relationships (in 1 lecture); Graduate Level
ObjectivesConsumer satisfaction
ObjectivesQuality of lifePublic safety
Competitiveness of society
Company
Consumer GovernmentIncentive
Regulation

Course Projects and Final Year Projects
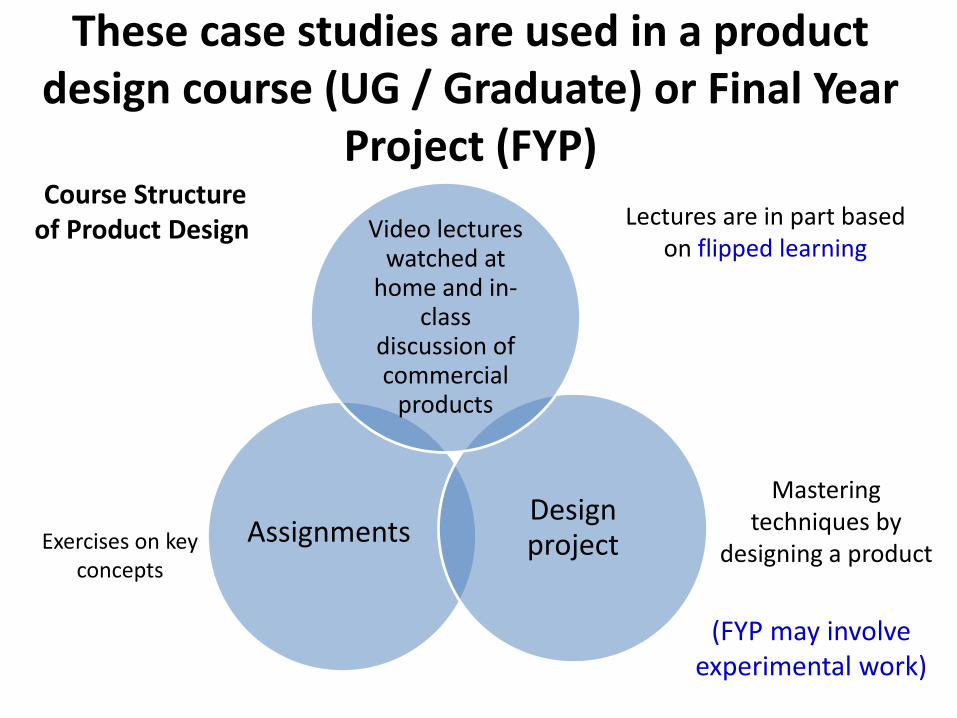
These case studies are used in a product design course (UG / Graduate) or Final Year
Project (FYP)
Design project
Video lectures watched at
home and in-class
discussion of commercial
products
AssignmentsExercises on key concepts
Mastering techniques by
designing a product
Course Structureof Product Design Lectures are in part based
on flipped learning
(FYP may involve experimental work)
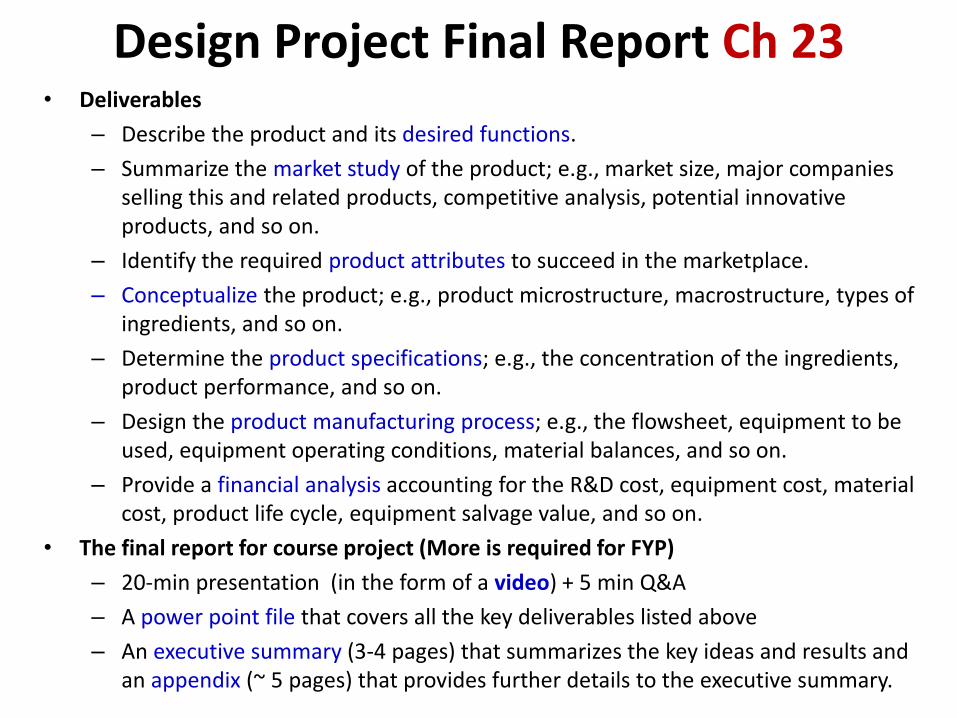
Design Project Final Report Ch 23• Deliverables
– Describe the product and its desired functions.
– Summarize the market study of the product; e.g., market size, major companies selling this and related products, competitive analysis, potential innovative products, and so on.
– Identify the required product attributes to succeed in the marketplace.
– Conceptualize the product; e.g., product microstructure, macrostructure, types of ingredients, and so on.
– Determine the product specifications; e.g., the concentration of the ingredients, product performance, and so on.
– Design the product manufacturing process; e.g., the flowsheet, equipment to be used, equipment operating conditions, material balances, and so on.
– Provide a financial analysis accounting for the R&D cost, equipment cost, material cost, product life cycle, equipment salvage value, and so on.
• The final report for course project (More is required for FYP)
– 20-min presentation (in the form of a video) + 5 min Q&A
– A power point file that covers all the key deliverables listed above
– An executive summary (3-4 pages) that summarizes the key ideas and results and an appendix (~ 5 pages) that provides further details to the executive summary.
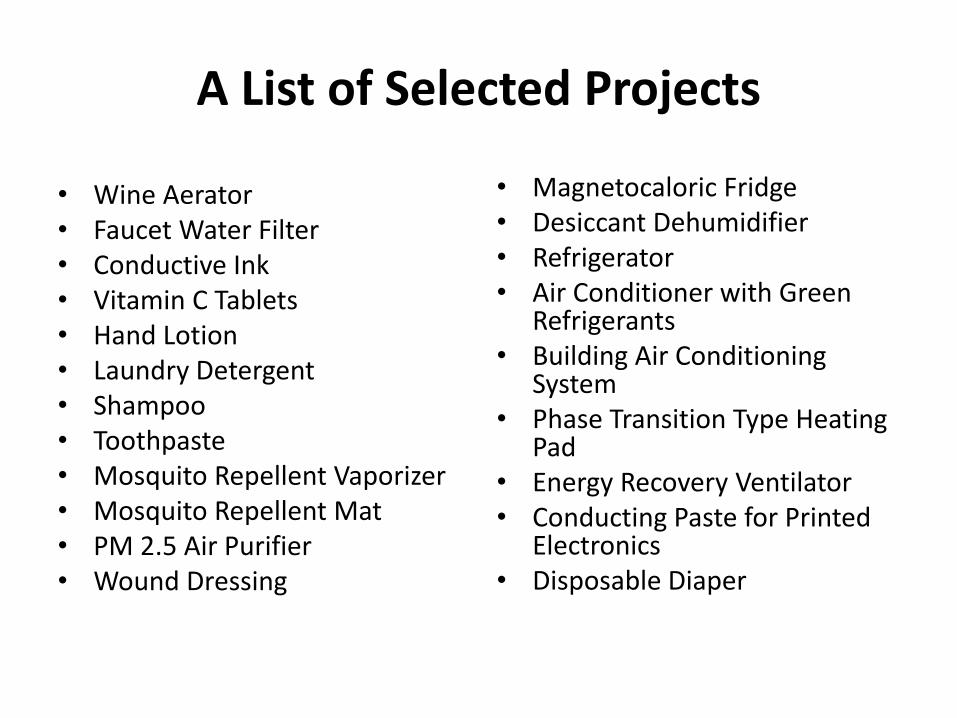
A List of Selected Projects
• Wine Aerator• Faucet Water Filter• Conductive Ink • Vitamin C Tablets• Hand Lotion• Laundry Detergent • Shampoo• Toothpaste• Mosquito Repellent Vaporizer• Mosquito Repellent Mat• PM 2.5 Air Purifier• Wound Dressing
• Magnetocaloric Fridge• Desiccant Dehumidifier• Refrigerator• Air Conditioner with Green
Refrigerants• Building Air Conditioning
System• Phase Transition Type Heating
Pad• Energy Recovery Ventilator• Conducting Paste for Printed
Electronics• Disposable Diaper
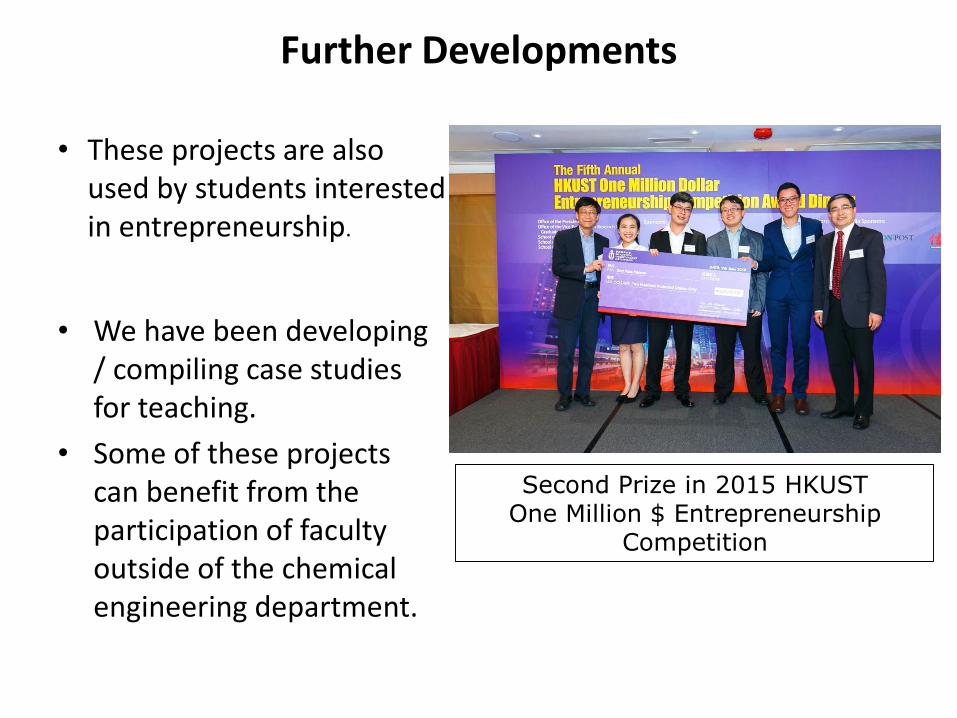
Further Developments
• We have been developing / compiling case studies for teaching.
• Some of these projects can benefit from the participation of faculty outside of the chemical engineering department.
• These projects are also used by students interested in entrepreneurship.
Second Prize in 2015 HKUSTOne Million $ Entrepreneurship
Competition
A preliminary version of this compendium is in the workshop USB.
An NSF Project to Develop Innovative Chemical Products
• These product design projects need more depth and breadth.
• This can be achieved with the help of faculty members with expertise in a research area related to a specific class of chemical products.
• Warren Seider, Tom Edgar and I plan to submit a proposal through CACHE in the Fall of 2017 to the NSF Education Division for funding to develop these case studies.
• These projects should educate students to be leaders and innovators in product design, which is being carried out increasingly by chemical companies worldwide.

Project Plan
• We will invite collaborators with relevant domain knowledge to help develop around 25 new case studies. Some can be an extension of the initial case studies prepared by student design groups at HKUST and some can be proposed by the collaborators.
• Our aim is to produce a collection of case studies, a few of which will be aligned with the expertise profiles in each chemical engineering department.
• Tentatively, the project duration will be three years.
• During the first 6 months of the project, the PIs will help refine the objectives of the proposed case studies.
• After executing the project with one or two cohorts of students over ~ two years, the design project statement and solution alternatives will be documented by the collaborator.
Project Plan (Ctd)
• ~$10,000 will be provided to each of the US faculty participants to cover costs.
• The case studies will be publicized in CACHE News and in AIChE Meeting sessions.
• They will be distributed at a small fee through CACHE, which has an extensive website (http://cache.org/) and has handled product orders in the past.
• Can you help us improve our project plans?

Contact Information
Prof. Ka Ming NGDepartment of Chemical and Biomolecular EngineeringThe Hong Kong University of Science and TechnologyHong KongEmail: [email protected]
42
PRODUCT DESIGN PROJECTS A Collection of Product Design Problem Statements and the Corresponding
Sample Solutions for Use as Final Year Projects in Chemical Engineering
JULY 12, 2017
Ka Yip FUNG and Ka Ming NG The Hong Kong University of Science and Technology
Copyright © 2017. All rights reserved. No part of this publication may be reproduced, stored in a retrieval system, or transmitted in any form or by any means, electronic, mechanical, photocopying, recording, scanning or otherwise, except as permitted under Section 107 or 108 of the
1976 United States Copyright Act, without either the prior written permission of the Publisher.
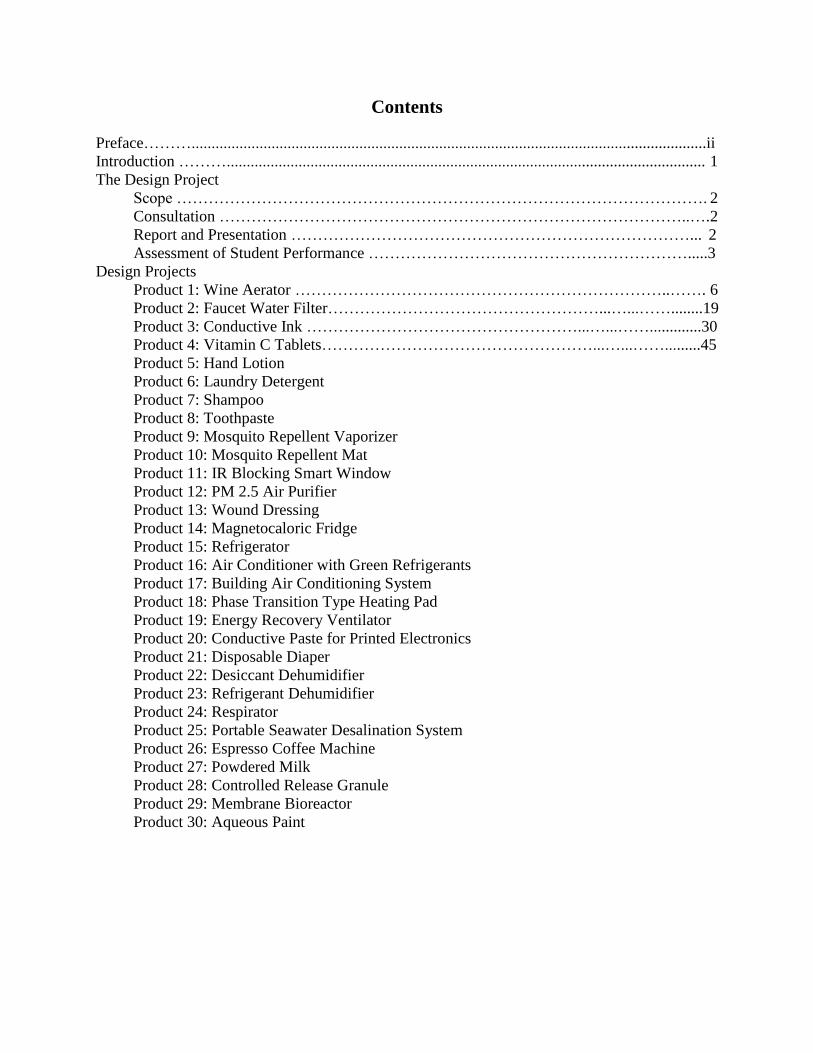
Contents
Preface……….................................................................................................................................ii
Introduction ………........................................................................................................................ 1
The Design Project
Scope ………………………………………………………………………………………. 2
Consultation ……………………………………………………………………………..…. 2
Report and Presentation …………………………………………………………………... 2
Assessment of Student Performance …………………………………………………….....3
Design Projects
Product 1: Wine Aerator ……………………………………………………………..……. 6
Product 2: Faucet Water Filter……………………………………………...…...……........19
Product 3: Conductive Ink ……………………………………………...…...…….............30
Product 4: Vitamin C Tablets……………………………………………...…...…….........45
Product 5: Hand Lotion
Product 6: Laundry Detergent
Product 7: Shampoo
Product 8: Toothpaste
Product 9: Mosquito Repellent Vaporizer
Product 10: Mosquito Repellent Mat
Product 11: IR Blocking Smart Window
Product 12: PM 2.5 Air Purifier
Product 13: Wound Dressing
Product 14: Magnetocaloric Fridge
Product 15: Refrigerator
Product 16: Air Conditioner with Green Refrigerants
Product 17: Building Air Conditioning System
Product 18: Phase Transition Type Heating Pad
Product 19: Energy Recovery Ventilator
Product 20: Conductive Paste for Printed Electronics
Product 21: Disposable Diaper
Product 22: Desiccant Dehumidifier
Product 23: Refrigerant Dehumidifier
Product 24: Respirator
Product 25: Portable Seawater Desalination System
Product 26: Espresso Coffee Machine
Product 27: Powdered Milk
Product 28: Controlled Release Granule
Product 29: Membrane Bioreactor
Product 30: Aqueous Paint
1
Introduction
Product and process design are integral tasks in the commercialization of any chemical product.
Traditional chemical engineering focuses on process design because the product under
consideration tends to be well defined and product design is not required. For these mature
products, the company owning the product competes in the marketplace by reducing product cost.
This is achieved by improving the production process or by switching to a cheaper feedstock,
which often necessitates the development of a new process. With the recent rapid changes in the
global environment, companies can no longer prosper by merely producing mature products.
Consumers demand innovative chemical products that meet their needs in their daily lives. For
these consumer products, product design is crucial. Thus, the designer has to select the proper
product ingredients and design the process to configure these ingredients in such a way that the
final product provides the desired product attributes.
Since product design has not received much attention in the chemical engineering community
until the late 90s, there are significantly fewer case studies for teaching product design than for
process design. And not surprisingly most final year projects in a typical chemical engineering
curriculum are related to process design, simulation and optimization.
The purpose of this compendium is to facilitate the expansion of chemical engineering design to
product design by providing case studies that can be used as final year product design projects.
Each case study includes a problem statement as well as references and web links guiding the
students to complete the project. Because of the open-ended nature, these design problems do not
have unique and complete solutions. Nonetheless, sample solutions are provided for some of the
design problems. Part of these solutions are the course work solutions submitted by the students
at the Hong Kong University of Science and Technology. They should be viewed with a degree
of scepticism because the solutions depend on the assumptions used in a particular design report.
Indeed, different students often come up with totally different products for the same problem
statement. For example, the design of disposable diapers was one of the design projects. One
group of students considered a product that focused on reusing part of the disposable diaper,
while another group designed a product that comes with an RFID wetness sensor.
Despite the diversity of products, the approach to product design and the issues to be considered
are the same. The students are given a list of issues to consider and have a great deal of freedom
on how the relevant issues should be addressed. Often, a group of students work as a team on a
final year design project. Advice and comments are provided to these students throughout the
project. At the end of the project, the team submits a written report and presents a power point
presentation summarizing all the main points. To guide the students to complete the design tasks
and to think about their own performance, an assessment rubric is provided to the students at the
outset.
2
The Design Project Scope
In each project, product and process design concepts and methods are used to design a specific
product. The first step is to carry out a market study to determine the market size, the desired
product attributes, and the attributes of competing products. A lot of information on various
products can be found in market analyses, company reports, and trade sites on the internet. The
second step is to conceptualize the desired product and make a decision on the desired market
share. Methods such as house of quality and business model canvas are used to keep track of the
information in this phase of the product development project. The product technical
specifications such as the active and supporting ingredients as well as the product structure
should be determined. Then, product performance is determined by model-based methods or
experiments. Throughout the entire product development process, the economic potential of the
proposed product is periodically evaluated by means of financial analysis, quantified by metrics
such as NPV and IRR.
Consultation
Meetings are scheduled with each team on a regular basis to provide comments, advice, and
resources to complete the project. Subject to necessity and availability of equipment,
experiments are performed as part of the product design project.
Report and Presentation
The project report is limited to 20 pages. It includes an executive summary (2 pages) that
summarizes the main points, the body of the report (maximum 10 pages) and an appendix
(maximum 8 pages) that provides further details to the report. The following items are addressed
in the written report:
1. Describe the product and its desired functions.
2. Summarize the market study of the product; e.g., market size, major companies selling
this and related products, competitive analysis, potential innovative products, etc.
3. Identify the required product attributes to succeed in the marketplace.
4. Conceptualize the product; e.g., product microstructure, macrostructure, types of
ingredients, and so on.
5. Determine the product specifications; e.g., the concentration of the ingredients, product
performance, etc.
6. Design the product manufacturing process; e.g., the flowsheet, equipment to be used,
equipment operating conditions, material balances, and so on.
7. Provide a financial analysis accounting for the R&D cost, equipment cost, material cost,
product life cycle, equipment salvage value, etc.
All materials and ideas borrowed from various sources such as the internet, books, and scientific
papers should be cited.
The product design team gives a 20 min powerpoint presentation in front of the entire class at the
end of the project. The presentation is followed by a Q&A session of about 10 minutes.

3
Assessment of Student Performance This is broken down as shown in the project assessment rubric. The instructor after consulting
with all members of the project team assigns a multiplying factor ranging from 0-100% to each
team member which reflects the contribution from the individual team member. The actual grade
is obtained by the project grade times the multiplying factor.
4
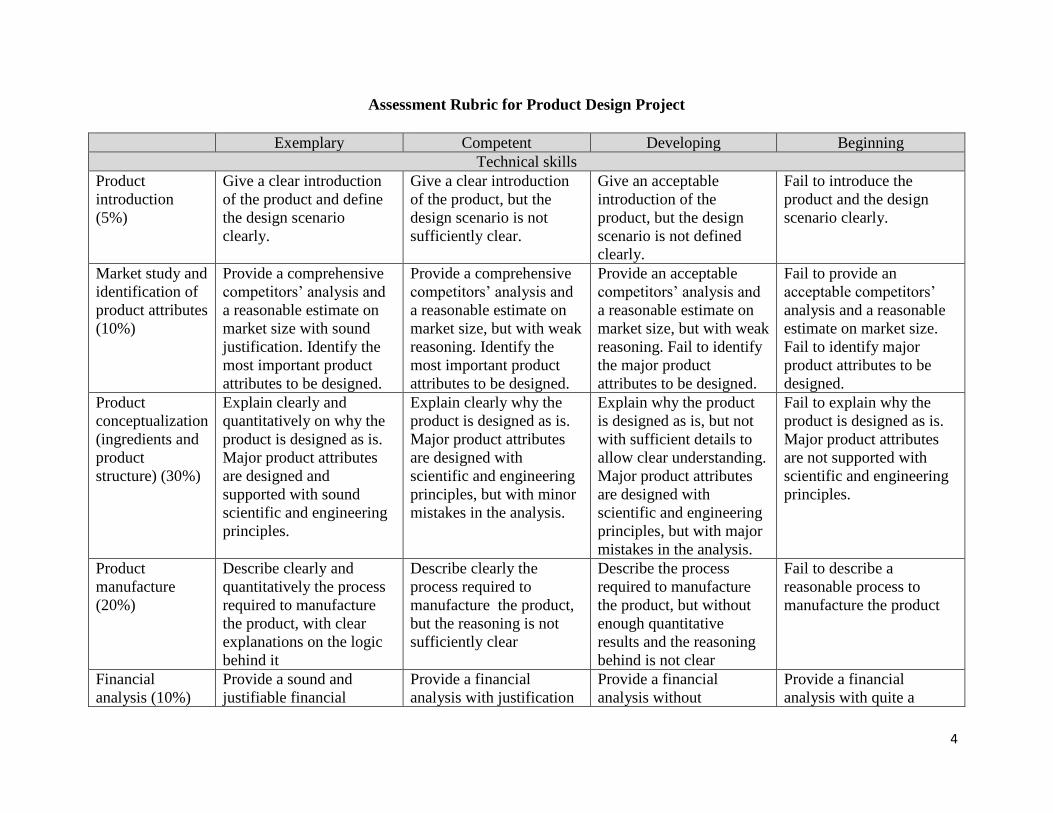
Assessment Rubric for Product Design Project
Exemplary Competent Developing Beginning
Technical skills
Product
introduction
(5%)
Give a clear introduction
of the product and define
the design scenario
clearly.
Give a clear introduction
of the product, but the
design scenario is not
sufficiently clear.
Give an acceptable
introduction of the
product, but the design
scenario is not defined
clearly.
Fail to introduce the
product and the design
scenario clearly.
Market study and
identification of
product attributes
(10%)
Provide a comprehensive
competitors’ analysis and
a reasonable estimate on
market size with sound
justification. Identify the
most important product
attributes to be designed.
Provide a comprehensive
competitors’ analysis and
a reasonable estimate on
market size, but with weak
reasoning. Identify the
most important product
attributes to be designed.
Provide an acceptable
competitors’ analysis and
a reasonable estimate on
market size, but with weak
reasoning. Fail to identify
the major product
attributes to be designed.
Fail to provide an
acceptable competitors’
analysis and a reasonable
estimate on market size.
Fail to identify major
product attributes to be
designed.
Product
conceptualization
(ingredients and
product
structure) (30%)
Explain clearly and
quantitatively on why the
product is designed as is.
Major product attributes
are designed and
supported with sound
scientific and engineering
principles.
Explain clearly why the
product is designed as is.
Major product attributes
are designed with
scientific and engineering
principles, but with minor
mistakes in the analysis.
Explain why the product
is designed as is, but not
with sufficient details to
allow clear understanding.
Major product attributes
are designed with
scientific and engineering
principles, but with major
mistakes in the analysis.
Fail to explain why the
product is designed as is.
Major product attributes
are not supported with
scientific and engineering
principles.
Product
manufacture
(20%)
Describe clearly and
quantitatively the process
required to manufacture
the product, with clear
explanations on the logic
behind it
Describe clearly the
process required to
manufacture the product,
but the reasoning is not
sufficiently clear
Describe the process
required to manufacture
the product, but without
enough quantitative
results and the reasoning
behind is not clear
Fail to describe a
reasonable process to
manufacture the product
Financial
analysis (10%)
Provide a sound and
justifiable financial
Provide a financial
analysis with justification
Provide a financial
analysis without
Provide a financial
analysis with quite a
5
analysis for most of the numbers,
but fail to justify all
parameters
justification for most of
the numbers, and
occasionally incorrect for
some calculations
number of errors and
mistakes
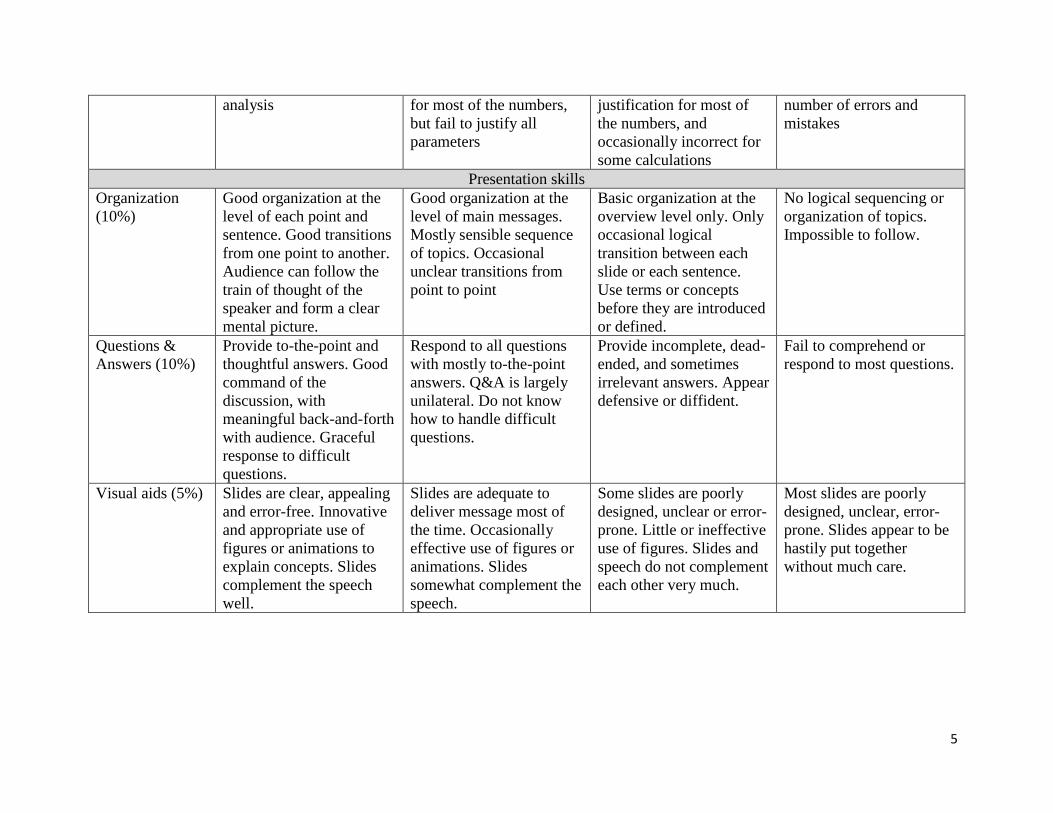
Presentation skills
Organization
(10%)
Good organization at the
level of each point and
sentence. Good transitions
from one point to another.
Audience can follow the
train of thought of the
speaker and form a clear
mental picture.
Good organization at the
level of main messages.
Mostly sensible sequence
of topics. Occasional
unclear transitions from
point to point
Basic organization at the
overview level only. Only
occasional logical
transition between each
slide or each sentence.
Use terms or concepts
before they are introduced
or defined.
No logical sequencing or
organization of topics.
Impossible to follow.
Questions &
Answers (10%)
Provide to-the-point and
thoughtful answers. Good
command of the
discussion, with
meaningful back-and-forth
with audience. Graceful
response to difficult
questions.
Respond to all questions
with mostly to-the-point
answers. Q&A is largely
unilateral. Do not know
how to handle difficult
questions.
Provide incomplete, dead-
ended, and sometimes
irrelevant answers. Appear
defensive or diffident.
Fail to comprehend or
respond to most questions.
Visual aids (5%) Slides are clear, appealing
and error-free. Innovative
and appropriate use of
figures or animations to
explain concepts. Slides
complement the speech
well.
Slides are adequate to
deliver message most of
the time. Occasionally
effective use of figures or
animations. Slides
somewhat complement the
speech.
Some slides are poorly
designed, unclear or error-
prone. Little or ineffective
use of figures. Slides and
speech do not complement
each other very much.
Most slides are poorly
designed, unclear, error-
prone. Slides appear to be
hastily put together
without much care.
6
Design Projects
Product 1: Wine Aerator
A device that mixes air with red wine to soften the tannins in the red wine
Project Statement
The term tannin refers to a class of molecules that bind relatively non-specifically to protein
molecules [Payne et al., 2009]. Tannin found in red wines binds with salivary protein, forming
protein-tannin complexes that reduce lubricity of saliva in the oral cavity, thereby creating dry
and puckering taste within the mouth, called astringent sensation. The astringency can be
softened by tannin oxidation or conventionally known as wine aging process by using wine
aerator or decanter [McRae and Kennedy, 2011].
Wine aerator is able to soften the astringent sensation of red wines, making the bouquet of lower
grade red wines comparable to that of higher grade red wines. The chemistry behind softening
wine astringency, involving the interaction of astringent agents, alcohol, sugar content in wine,
and the salivary protein in oral cavity, is complex [Smith et al., 1996; Payne et al., 2009].
Astringent agents in a wine are classified into two categories, hydrolysable and condensed tannin.
Hydrolysable tannin is incorporated during storage in wood or oak vessel and treatment with
wood or oak chip. This type of tannin readily degrades at the pH of wine, hence not giving any
astringency sensation to the wine. Condensed tannin consists of extracts from grape seeds and
skins, is stable at the pH of wine, binds with salivary protein, and is responsible for the
astringency of a red wine [Payne et al., 2009].
Wine aging is a series of oxidation process of tannins and other agents. This series of oxidation
can be catalysed by introducing a trace amount of transition metal ions [Waterhouse and Laurie,
2006] or increasing the amount of oxygen in the wine, hence increasing the rate the oxidation.
The aims of wine aerator device can be better understood after some basic understanding in red
wine making [http://www.wineanorak.com/howwineismade.htm]. Chemistry involved in tannin
oxidation may be also useful in designing a wine aerator [Fulcrand et al., 2006; Waterhouse and
Laurie, 2006].
In addition to designing a functional wine aerator, the economic viability of the product has to be
considered as well. Students are advised to perform a competitive analysis based on information
available at online trade sites such as Amazon and Alibaba as well as competitors’ company
websites. Based on the competitive analysis, students will be able to evaluate and identify key
product attributes of the wine aerator sold in the market.
Generally, wine aerator devices available in the market can be divided into two types: electrical
and non-electrical. Electrical type involves moving parts such as stirrer and bubbler whereas a
non-electrical aerator design usually involves pressure difference between wine and ambient air.
Sometimes, transition metal ions are introduced into the wine as a catalyst. Consider using basic
fluid mechanics such as the Bernoulli equation in designing a wine aerator.

7
References
Fulcrand H, Dueñas M, Salas E, Cheynier V. Phenolic reactions during winemaking and
aging. American Journal of Enology and Viticulture. 2006;57:289-297.
McRae JM, Kennedy JA. Wine and grape tannin interactions with salivary proteins and
their impact on astringency: a review of current research. Molecules. 2011;16:2348-2364.
Payne C, Bowyer PK, Herderich M, Bastian SEP. Interaction of astringent grape seed
procyanidins with oral epithelial cells. Food chemistry. 2009;115(2): 551-557.
Smith AK, June H, Noble AC. Effects of viscosity on the bitterness and astringency of
grape seed tannin. Food Quality and Preference. 1996;7(3-4):161-166.
Waterhouse AL, Laurie VF. Oxidation of wine phenolics: A critical evaluation and
hypotheses. American Journal of Enology and Viticulture. 2006;57:306-313.
http://www.wineanorak.com/howwineismade.htm (Accessed on 9 Sep, 2016)
8
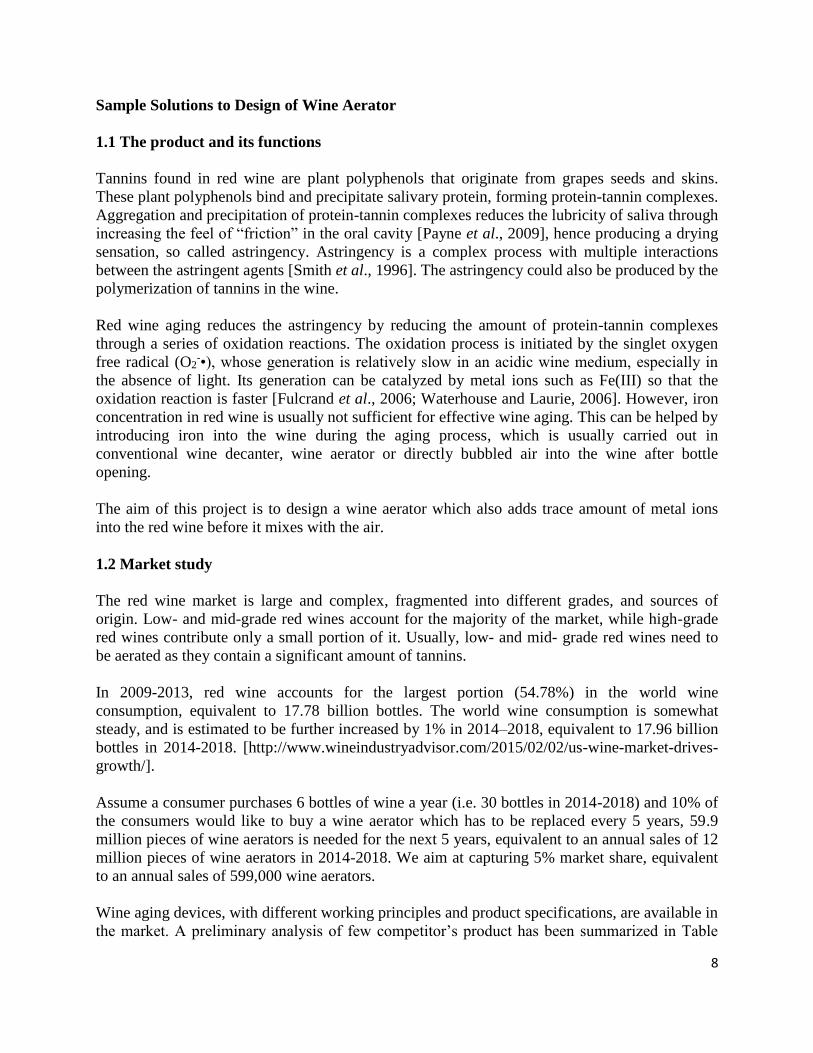
Sample Solutions to Design of Wine Aerator
1.1 The product and its functions
Tannins found in red wine are plant polyphenols that originate from grapes seeds and skins.
These plant polyphenols bind and precipitate salivary protein, forming protein-tannin complexes.
Aggregation and precipitation of protein-tannin complexes reduces the lubricity of saliva through
increasing the feel of “friction” in the oral cavity [Payne et al., 2009], hence producing a drying
sensation, so called astringency. Astringency is a complex process with multiple interactions
between the astringent agents [Smith et al., 1996]. The astringency could also be produced by the
polymerization of tannins in the wine.
Red wine aging reduces the astringency by reducing the amount of protein-tannin complexes
through a series of oxidation reactions. The oxidation process is initiated by the singlet oxygen
free radical (O2-•), whose generation is relatively slow in an acidic wine medium, especially in
the absence of light. Its generation can be catalyzed by metal ions such as Fe(III) so that the
oxidation reaction is faster [Fulcrand et al., 2006; Waterhouse and Laurie, 2006]. However, iron
concentration in red wine is usually not sufficient for effective wine aging. This can be helped by
introducing iron into the wine during the aging process, which is usually carried out in
conventional wine decanter, wine aerator or directly bubbled air into the wine after bottle
opening.
The aim of this project is to design a wine aerator which also adds trace amount of metal ions
into the red wine before it mixes with the air.
1.2 Market study
The red wine market is large and complex, fragmented into different grades, and sources of
origin. Low- and mid-grade red wines account for the majority of the market, while high-grade
red wines contribute only a small portion of it. Usually, low- and mid- grade red wines need to
be aerated as they contain a significant amount of tannins.
In 2009-2013, red wine accounts for the largest portion (54.78%) in the world wine
consumption, equivalent to 17.78 billion bottles. The world wine consumption is somewhat
steady, and is estimated to be further increased by 1% in 2014–2018, equivalent to 17.96 billion
bottles in 2014-2018. [http://www.wineindustryadvisor.com/2015/02/02/us-wine-market-drives-
growth/].
Assume a consumer purchases 6 bottles of wine a year (i.e. 30 bottles in 2014-2018) and 10% of
the consumers would like to buy a wine aerator which has to be replaced every 5 years, 59.9
million pieces of wine aerators is needed for the next 5 years, equivalent to an annual sales of 12
million pieces of wine aerators in 2014-2018. We aim at capturing 5% market share, equivalent
to an annual sales of 599,000 wine aerators.
Wine aging devices, with different working principles and product specifications, are available in
the market. A preliminary analysis of few competitor’s product has been summarized in Table
9
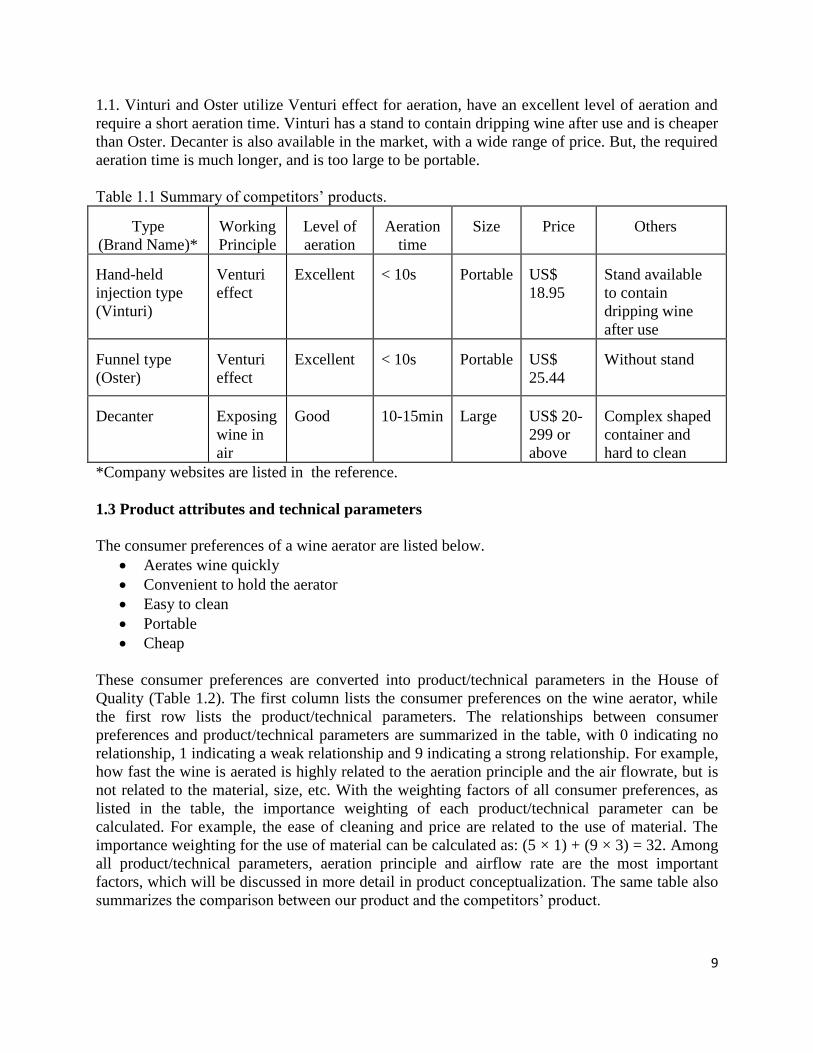
1.1. Vinturi and Oster utilize Venturi effect for aeration, have an excellent level of aeration and
require a short aeration time. Vinturi has a stand to contain dripping wine after use and is cheaper
than Oster. Decanter is also available in the market, with a wide range of price. But, the required
aeration time is much longer, and is too large to be portable.
Table 1.1 Summary of competitors’ products.
Type
(Brand Name)*
Working
Principle
Level of
aeration
Aeration
time
Size Price Others
Hand-held
injection type
(Vinturi)
Venturi
effect
Excellent < 10s Portable US$
18.95
Stand available
to contain
dripping wine
after use
Funnel type
(Oster)
Venturi
effect
Excellent < 10s Portable US$
25.44
Without stand
Decanter Exposing
wine in
air
Good 10-15min Large US$ 20-
299 or
above
Complex shaped
container and
hard to clean
*Company websites are listed in the reference.
1.3 Product attributes and technical parameters
The consumer preferences of a wine aerator are listed below.
Aerates wine quickly
Convenient to hold the aerator
Easy to clean
Portable
Cheap
These consumer preferences are converted into product/technical parameters in the House of
Quality (Table 1.2). The first column lists the consumer preferences on the wine aerator, while
the first row lists the product/technical parameters. The relationships between consumer
preferences and product/technical parameters are summarized in the table, with 0 indicating no
relationship, 1 indicating a weak relationship and 9 indicating a strong relationship. For example,
how fast the wine is aerated is highly related to the aeration principle and the air flowrate, but is
not related to the material, size, etc. With the weighting factors of all consumer preferences, as
listed in the table, the importance weighting of each product/technical parameter can be
calculated. For example, the ease of cleaning and price are related to the use of material. The
importance weighting for the use of material can be calculated as: (5 × 1) + (9 × 3) = 32. Among
all product/technical parameters, aeration principle and airflow rate are the most important
factors, which will be discussed in more detail in product conceptualization. The same table also
summarizes the comparison between our product and the competitors’ product.
10
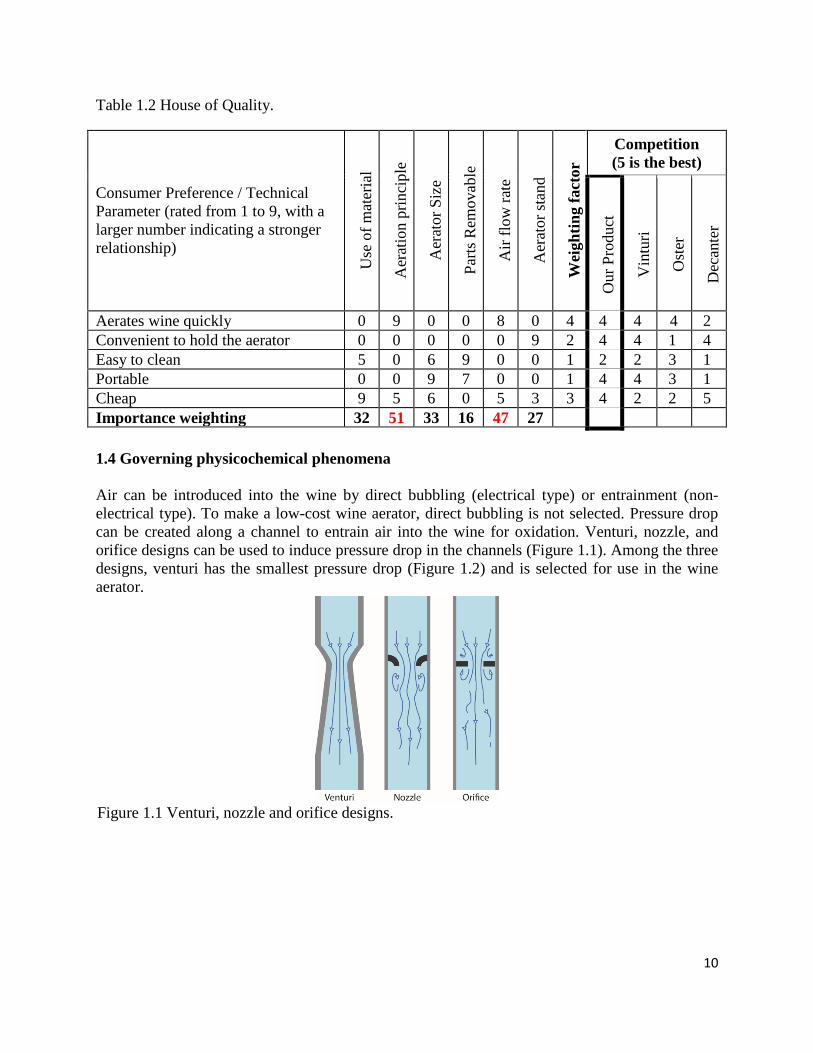
Table 1.2 House of Quality.
Consumer Preference / Technical
Parameter (rated from 1 to 9, with a
larger number indicating a stronger
relationship)
Use
of
mat
eria
l
Aer
atio
n p
rinci
ple
Aer
ator
Siz
e
Par
ts R
emovab
le
Air
flo
w r
ate
Aer
ator
stan
d
Wei
gh
tin
g f
act
or
Competition
(5 is the best)
Our
Pro
duct
Vin
turi
Ost
er
Dec
ante
r
Aerates wine quickly 0 9 0 0 8 0 4 4 4 4 2
Convenient to hold the aerator 0 0 0 0 0 9 2 4 4 1 4
Easy to clean 5 0 6 9 0 0 1 2 2 3 1
Portable 0 0 9 7 0 0 1 4 4 3 1
Cheap 9 5 6 0 5 3 3 4 2 2 5
Importance weighting 32 51 33 16 47 27
1.4 Governing physicochemical phenomena
Air can be introduced into the wine by direct bubbling (electrical type) or entrainment (non-
electrical type). To make a low-cost wine aerator, direct bubbling is not selected. Pressure drop
can be created along a channel to entrain air into the wine for oxidation. Venturi, nozzle, and
orifice designs can be used to induce pressure drop in the channels (Figure 1.1). Among the three
designs, venturi has the smallest pressure drop (Figure 1.2) and is selected for use in the wine
aerator.
Figure 1.1 Venturi, nozzle and orifice designs.
11
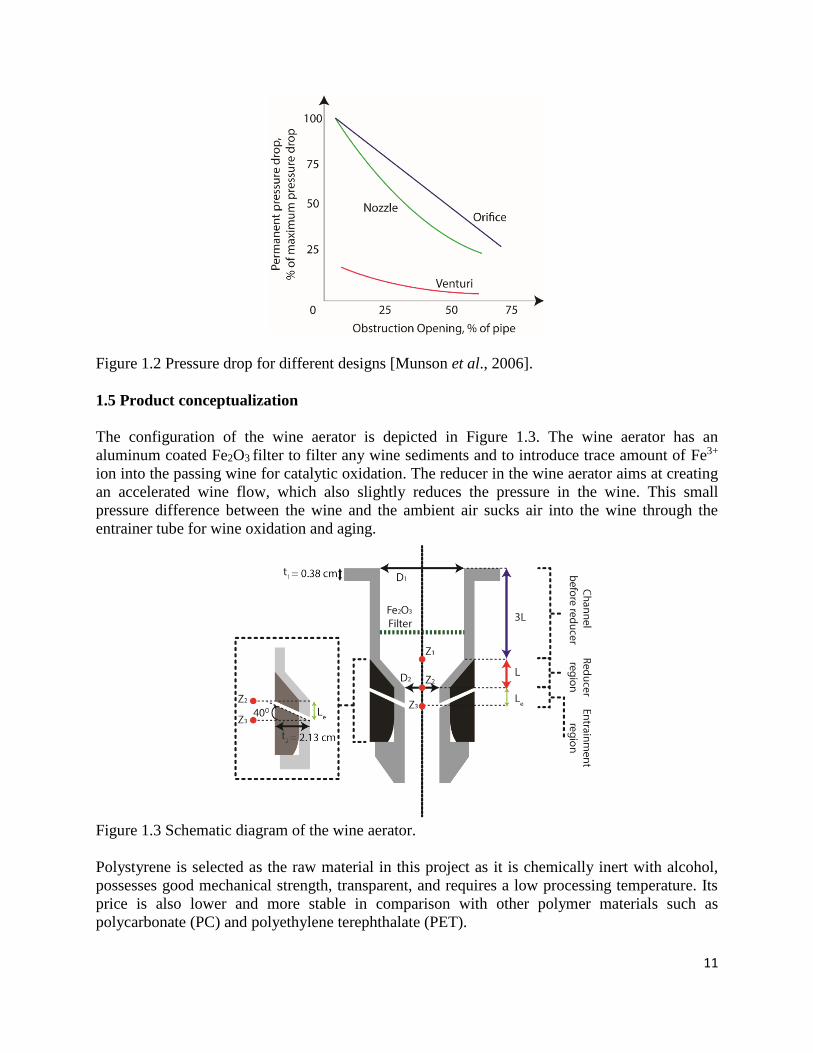
Figure 1.2 Pressure drop for different designs [Munson et al., 2006].
1.5 Product conceptualization
The configuration of the wine aerator is depicted in Figure 1.3. The wine aerator has an
aluminum coated Fe2O3 filter to filter any wine sediments and to introduce trace amount of Fe3+
ion into the passing wine for catalytic oxidation. The reducer in the wine aerator aims at creating
an accelerated wine flow, which also slightly reduces the pressure in the wine. This small
pressure difference between the wine and the ambient air sucks air into the wine through the
entrainer tube for wine oxidation and aging.
Figure 1.3 Schematic diagram of the wine aerator.
Polystyrene is selected as the raw material in this project as it is chemically inert with alcohol,
possesses good mechanical strength, transparent, and requires a low processing temperature. Its
price is also lower and more stable in comparison with other polymer materials such as
polycarbonate (PC) and polyethylene terephthalate (PET).
12
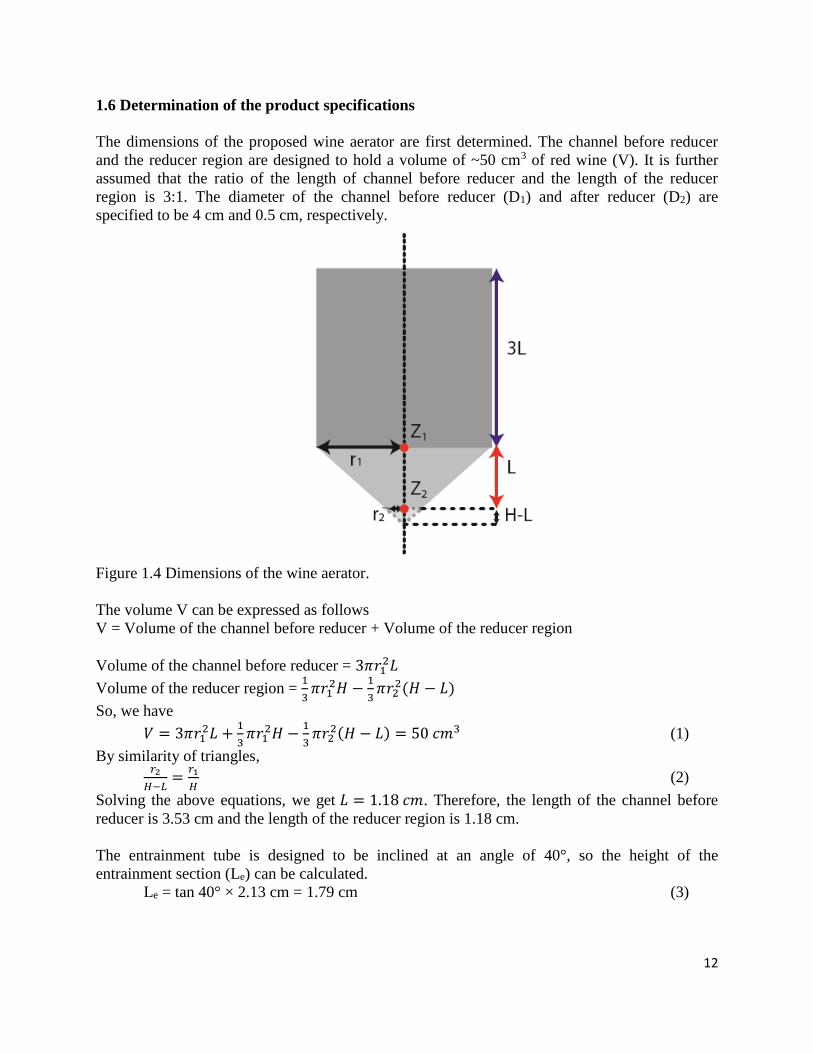
1.6 Determination of the product specifications
The dimensions of the proposed wine aerator are first determined. The channel before reducer
and the reducer region are designed to hold a volume of ~50 cm3 of red wine (V). It is further
assumed that the ratio of the length of channel before reducer and the length of the reducer
region is 3:1. The diameter of the channel before reducer (D1) and after reducer (D2) are
specified to be 4 cm and 0.5 cm, respectively.
Figure 1.4 Dimensions of the wine aerator.
The volume V can be expressed as follows
V = Volume of the channel before reducer + Volume of the reducer region
Volume of the channel before reducer = 3𝜋𝑟12𝐿
Volume of the reducer region = 1
3𝜋𝑟1
2𝐻 −1
3𝜋𝑟2
2(𝐻 − 𝐿)
So, we have
𝑉 = 3𝜋𝑟12𝐿 +
1
3𝜋𝑟1
2𝐻 −1
3𝜋𝑟2
2(𝐻 − 𝐿) = 50 𝑐𝑚3 (1)
By similarity of triangles,
𝑟2
𝐻−𝐿=
𝑟1
𝐻 (2)
Solving the above equations, we get 𝐿 = 1.18 𝑐𝑚. Therefore, the length of the channel before
reducer is 3.53 cm and the length of the reducer region is 1.18 cm.
The entrainment tube is designed to be inclined at an angle of 40°, so the height of the
entrainment section (Le) can be calculated.
Le = tan 40° × 2.13 cm = 1.79 cm (3)
13
With the aerator dimensions, Bernoulli equation can be used to calculate the amount of air being
entrained into the wine. The following assumptions are made in the calculation:
Viscous effect is negligible
Steady state flow
Incompressible flow
Applicable along streamline
Constant volumetric flowrate throughout the wine aerator
In pouring the wine through the wine aerator, the wine continues to flow down the channel and
we assume here that the wine usually fills up the reducer region only. So, by applying the
Bernoulli equation across the reducer and the entrainment section,
𝑃1 − 𝑃3 =𝜌𝑤
2(𝑣𝑤,3
2 − 𝑣𝑤,12 ) + 𝜌𝑤𝑔(𝑍3 − 𝑍1) (4)
Here, g is the gravity acceleration and equals 9.8 m/s2, w is the wine density. Note that the
subscripts 1 and 3 refer to the location before the reducer and after the entrainment section,
respectively. We assume that the wine contains an alcoholic percentage of 12.9%, so the wine
density is 1095 kg/m3 [http://winemaking.jackkeller.net/hydrom.asp].
The aerator is designed to aerate a glass of red wine (~150 cm3) in 10 s, so the volumetric
flowrate Q can be calculated as:
Q = 150 cm3/10 s = 15 cm3/s (5)
Assume constant volumetric flowrate, the wine velocity before and after the reducer region can
be calculated.
𝑄 = 𝐴1𝑣𝑤,1 = 𝐴2𝑣𝑤,2 (6)
The wine velocity before the reducer (vw,1) is
𝑣𝑤,1 = 𝑄 𝜋𝑟12⁄ = 1.2 𝑐𝑚/𝑠 (7)
Similarly, the wine velocity after the reducer (vw,2) is 76.4 cm/s. As the cross-sectional area is the
same in the entrainment section, we have vw,3 = vw,2.
With 𝑍3 − 𝑍1 = −(𝐿 + 𝐿𝑒), and after substituting all parameters,
𝑃1 − 𝑃3 = 0.853𝑘𝑔
𝑚 𝑠2 = 8.42 × 10⁻⁶𝑎𝑡𝑚 (8)
The entrainment tube is designed to suck air into the passing wine for oxidation. Bernoulli
equation can be applied to the entrained air.
𝑃2 − 𝑃3 =𝜌𝑎
2(𝑣𝑎,3
2 − 𝑣𝑎,22 ) + 𝜌𝑎𝑔(𝑍3 − 𝑍2) (9)
The pressure drop of air in the entrainment tube is same as the pressure drop in wine. So, we
have
𝜌𝑎
2(𝑣𝑎,3
2 − 𝑣𝑎,22 ) + 𝜌𝑎𝑔(𝑍3 − 𝑍2) = 8.42 × 10⁻⁶𝑎𝑡𝑚 (10)
Here, ρa is the air density at STP which equals 1.184 kg/m3 [Munson et al., 2006] and 𝑍3 − 𝑍2 =−𝐿𝑒.
By assuming the inlet air velocity (va,2) equals 0 m/s, the velocity of air sucking into the flowing
wine (va,3) is 1.34 m/s. The diameter of the entrainment tube is designed to be 0.5 cm, leading to
an air flowrate of 26.3 cm3/s, equivalent to 0.031 g of air /s or 0.0065 g of O2 /s.
14
The oxygen in air is used to oxidize tannins in wine. The reaction rate can be expressed by the
following equation.
𝑑[𝑇]
𝑑𝑡= −𝑘[𝑇][𝑂2] (11)
Here, k is the reaction rate constant and equals 2 × 10² m3 / mol s, [T] and [O2] are the
concentration of tannins and oxygen in wine. By assuming [O2] is in excess and remains constant,
the rate equation can be integrated with the boundary conditions (t = 0, [T] = [T]0; t = t, [T] = [T])
to give
[𝑇] = [𝑇]0𝑒−𝑘[𝑂2]𝑡 (12)
The initial tannins concentration [T]0 in red wine is reported to be around 200 ppm (Harbertson et
al., 2008). We assume that 1% of the inflow O2 can be dissolved into the wine for oxidation, so
that [O2] in the wine medium is:
[𝑂2] =0.0065×1%
15= 4.36
𝑔 𝑂2
𝑚3 = 0.136𝑚𝑜𝑙 𝑂2
𝑚3 (13)
Assume the reaction time is around 5 s, the fast oxidation of tannins provides almost no tannins
in the red wine ([T] = 1.48 × 10-57 ppm).
1.7 Design of product manufacturing process
With an annual sales of 599,000 wine aerators, plastic injection moulding, with relatively low
processing cost, is considered to be the most suitable processing technique to handle a relatively
large throughput.
Food grade impact-modified polystyrene is used as the raw material to produce transparent wine
aerators with moderate impact strength and glossy outer surface. No additives are added to the
process; and fillers such as glass fibres are strictly prohibited by regulations for manufacturing
components that are in contact with foods or drinks. Similarly, no regrind or reuse of defected
plastic parts is allowed for these goods.
Polystyrene resins are preheated in a hopper at 80ºC for few hours to remove any moisture. Dry
resins are then melted in the barrel of an injection machine, and the melted plastic is injected into
a mould with highly polished surface, which is important to produce wine aerator with highly
glossy surface. The hot melt is cooled by the cooling water channels running around the mould.
When the melt is solidified, the products are ejected from the mould by an ejector pin.
To design the injection moulding machine, issues such as mould size and design, ejection force,
etc. have to be considered. Detailed information can be found in polymer engineering textbooks
(Jones, 2008). The cost estimation for injection moulding machine is readily available in the
internet [http://www.custompartnet.com/estimate/injection-molding/] and is used below for
financial analysis.
1.8 Financial analysis
The financial analysis of a 5-year wine aerator product is summarized in Table 1.3. With a sales
volume of 599,000 pieces at $12.99 per piece, we have an annual sales of $7,781,010. The sales
volume is expected to be the same for the subsequent years.
15
During product development (Year -1 and 0), fixed cost includes $180,000 for office rent and
$480,000 for staff wages (per annum). After product launch, an annual advertising cost of
$200,000 is added to the fixed cost. This increases the fixed cost from $660,000 in Year -1 and 0
to $860,000 in Year 1 to 3. A development cost of $1,000,000 is spent in the first year (year -1)
for R&D and product design, which includes tooling design, prototype functional test and
regulatory test. The capital investment in Year 0 is assumed to be $50,000, and the net working
capital is assumed to be $250,000.
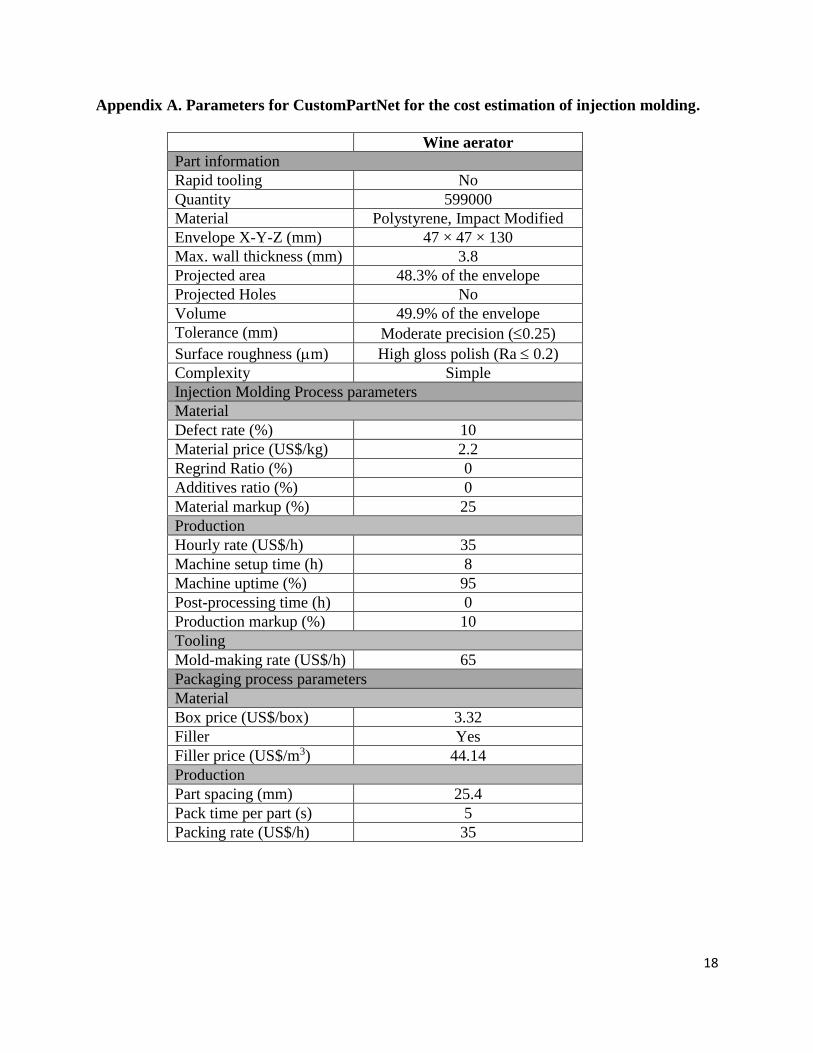
For Year 1 to 3, the variable cost includes manufacturing cost and packaging cost, which can be
estimated by an online feature-based estimator [http://www.custompartnet.com/estimate/
injection-molding/] with input parameters summarized in Appendix A. The results show that the
manufacturing cost, which includes material cost, production cost, and tooling cost, is US$ 0.699
per unit. With an unit cost of US$ 0.09 for a Fe2O3 filter, the manufacturing cost of a wine
aerator is US$ 0.708. Similarly, the packaging cost is also estimated to be US$ 0.098 per unit.
This leads to a variable cost of US$ 0.806 per unit, equivalent to US$ 482,794 per annum.
With all the cost information, income from operations (IFO), earnings before income tax (EBIT),
after tax operating income (ATOI), operating cash flow (OCF), and project cash flow (PCF) are
calculated by the following equations.
IFO = S – CED (14)
EBIT = IFO – D = S – CED – D (15)
ATOI = (1 – t) EBIT = (1 – t) (S – CED – D) (16)
OCF = ATOI + D = (1 – t) (S – CED – D) + D = (1 – t) (S – CED) + t D (17)
PCF = OCF – Development cost - Increase in NWC – Project capital spending (18)
Here, S is the sales, CED is the fixed and variable costs, D is depreciation which is assumed to be
linear depreciation over 5 years, t is tax rate which is assumed to be 40%, NWC is the net
working capital.
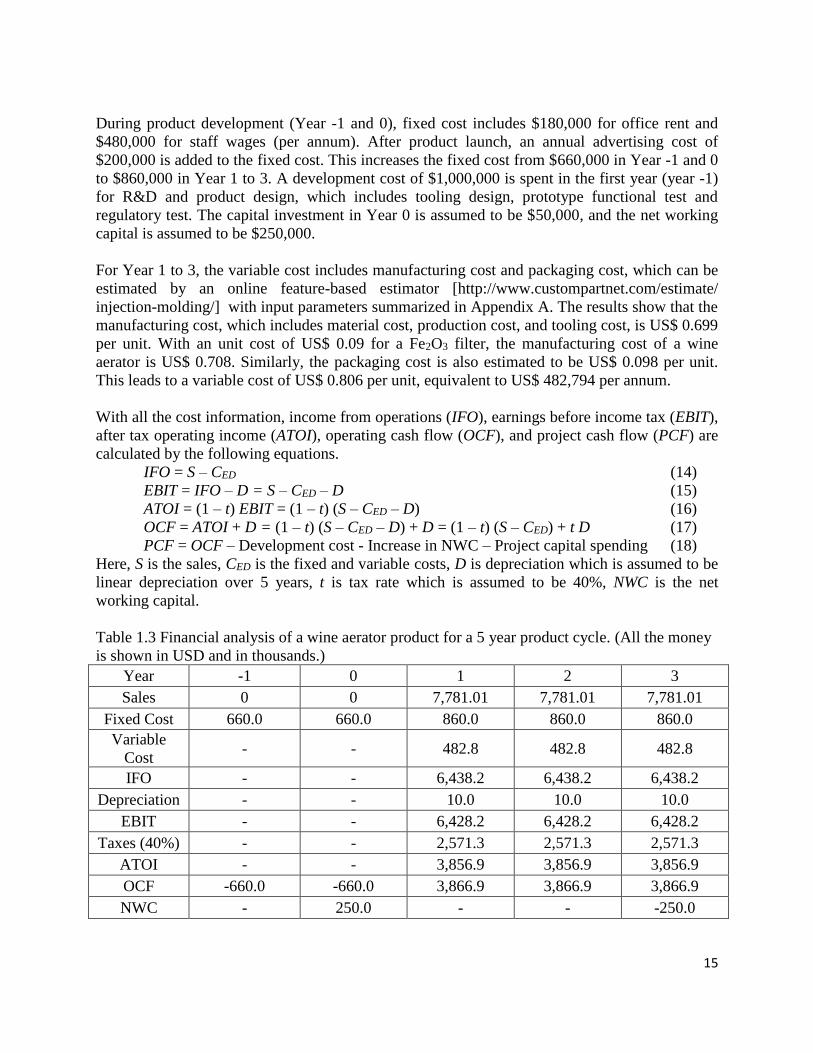
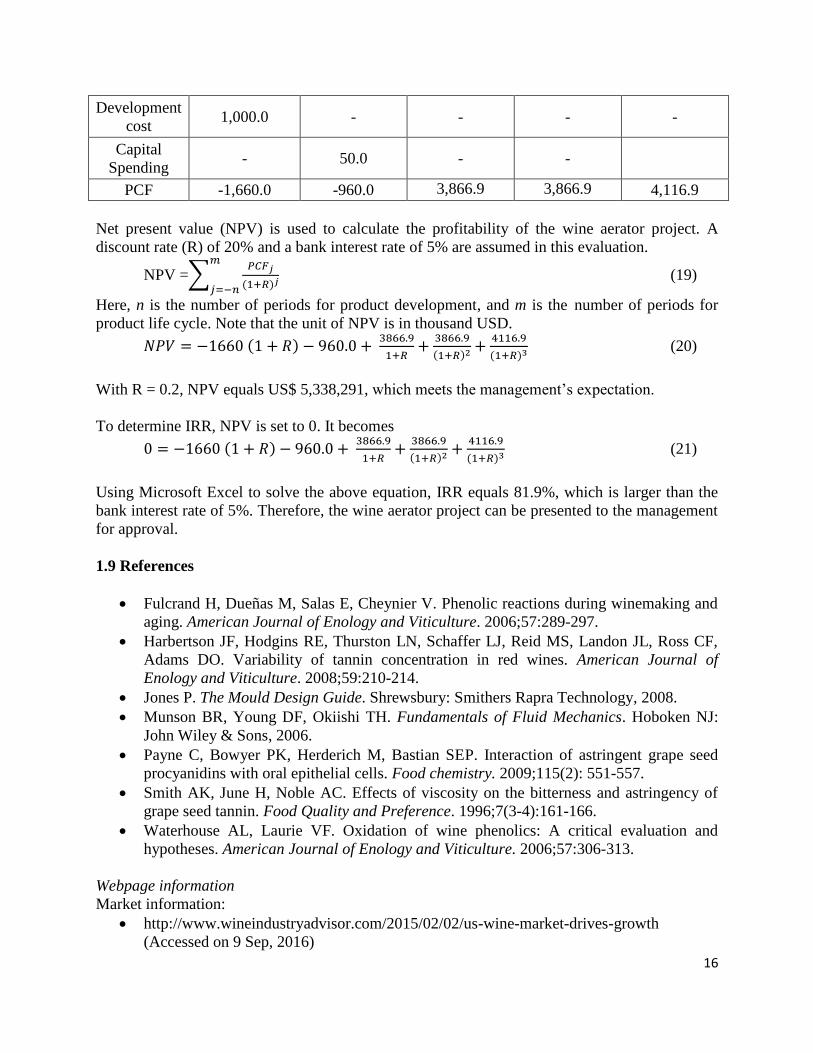
Table 1.3 Financial analysis of a wine aerator product for a 5 year product cycle. (All the money
is shown in USD and in thousands.)
Year -1 0 1 2 3
Sales 0 0 7,781.01 7,781.01 7,781.01
Fixed Cost 660.0 660.0 860.0 860.0 860.0
Variable
Cost - - 482.8 482.8 482.8
IFO - - 6,438.2 6,438.2 6,438.2
Depreciation - - 10.0 10.0 10.0
EBIT - - 6,428.2 6,428.2 6,428.2
Taxes (40%) - - 2,571.3 2,571.3 2,571.3
ATOI - - 3,856.9 3,856.9 3,856.9
OCF -660.0 -660.0 3,866.9 3,866.9 3,866.9
NWC - 250.0 - - -250.0
16
Development
cost 1,000.0 - - - -
Capital
Spending - 50.0 - -
PCF -1,660.0 -960.0 3,866.9 3,866.9 4,116.9
Net present value (NPV) is used to calculate the profitability of the wine aerator project. A
discount rate (R) of 20% and a bank interest rate of 5% are assumed in this evaluation.
NPV =∑𝑃𝐶𝐹𝑗
(1+𝑅)𝑗
𝑚
𝑗=−𝑛 (19)
Here, n is the number of periods for product development, and m is the number of periods for
product life cycle. Note that the unit of NPV is in thousand USD.
𝑁𝑃𝑉 = −1660 (1 + 𝑅) − 960.0 + 3866.9
1+𝑅+
3866.9
(1+𝑅)2+
4116.9
(1+𝑅)3 (20)
With R = 0.2, NPV equals US$ 5,338,291, which meets the management’s expectation.
To determine IRR, NPV is set to 0. It becomes
0 = −1660 (1 + 𝑅) − 960.0 + 3866.9
1+𝑅+
3866.9
(1+𝑅)2 +4116.9
(1+𝑅)3 (21)
Using Microsoft Excel to solve the above equation, IRR equals 81.9%, which is larger than the
bank interest rate of 5%. Therefore, the wine aerator project can be presented to the management
for approval.
1.9 References
Fulcrand H, Dueñas M, Salas E, Cheynier V. Phenolic reactions during winemaking and
aging. American Journal of Enology and Viticulture. 2006;57:289-297.
Harbertson JF, Hodgins RE, Thurston LN, Schaffer LJ, Reid MS, Landon JL, Ross CF,
Adams DO. Variability of tannin concentration in red wines. American Journal of
Enology and Viticulture. 2008;59:210-214.
Jones P. The Mould Design Guide. Shrewsbury: Smithers Rapra Technology, 2008.
Munson BR, Young DF, Okiishi TH. Fundamentals of Fluid Mechanics. Hoboken NJ:
John Wiley & Sons, 2006.
Payne C, Bowyer PK, Herderich M, Bastian SEP. Interaction of astringent grape seed
procyanidins with oral epithelial cells. Food chemistry. 2009;115(2): 551-557.
Smith AK, June H, Noble AC. Effects of viscosity on the bitterness and astringency of
grape seed tannin. Food Quality and Preference. 1996;7(3-4):161-166.
Waterhouse AL, Laurie VF. Oxidation of wine phenolics: A critical evaluation and
hypotheses. American Journal of Enology and Viticulture. 2006;57:306-313.
Webpage information
Market information:
http://www.wineindustryadvisor.com/2015/02/02/us-wine-market-drives-growth
(Accessed on 9 Sep, 2016)

17
Oster website - http://www.oster.com (Accessed on 9 Sep, 2016)
Vinturi website - https://www.vinturi.com/ (Accessed on 9 Sep, 2016)
Technical information:
http://winemaking.jackkeller.net/hydrom.asp (Accessed on 9 Sep, 2016)
http://www.custompartnet.com/estimate/injection-molding/ (Accessed on 9 Sep, 2016)
`
18
Appendix A. Parameters for CustomPartNet for the cost estimation of injection molding.
Wine aerator
Part information
Rapid tooling No
Quantity 599000
Material Polystyrene, Impact Modified
Envelope X-Y-Z (mm) 47 × 47 × 130
Max. wall thickness (mm) 3.8
Projected area 48.3% of the envelope
Projected Holes No
Volume 49.9% of the envelope
Tolerance (mm) Moderate precision (0.25)
Surface roughness (m) High gloss polish (Ra 0.2)
Complexity Simple
Injection Molding Process parameters
Material
Defect rate (%) 10
Material price (US$/kg) 2.2
Regrind Ratio (%) 0
Additives ratio (%) 0
Material markup (%) 25
Production
Hourly rate (US$/h) 35
Machine setup time (h) 8
Machine uptime (%) 95
Post-processing time (h) 0
Production markup (%) 10
Tooling
Mold-making rate (US$/h) 65
Packaging process parameters
Material
Box price (US$/box) 3.32
Filler Yes
Filler price (US$/m3) 44.14
Production
Part spacing (mm) 25.4
Pack time per part (s) 5
Packing rate (US$/h) 35
19
Product 2: Faucet Water Filter
A device that removes pollutants from tap water
Project Statement
A faucet water filter is a device that removes pollutants such as bacteria, organics, and heavy
metals from the tap water. Various technologies such as ultrafiltration, reverse osmosis, and
adsorption can be used for such purpose. Students are required to design a faucet water filter for
pollutants removal. They can refer to the Environmental Protection Agency (2013) for more
information on the pollutants contained in tap water and Crittenden et al. (2012) for the basic
information on water purification techniques.
Students are advised to perform a market study and a competitive analysis on the faucet water
filters. Online trade sites such as Amazon and Alibaba as well as competitor’s company website
provide such information. Examples of companies providing faucet water filters include Brita
[https://www.brita.com/intl/] and Culligan [http://www.culligan.com/]. Students should
remember that market information is always fragmented and students should not rely on a single
source of information. After the market study, the market size and the market price of the faucet
water filter can be estimated. The competitive analysis also helps the students identify the key
product attributes of the water filters. Students can also conduct a market survey to understand
which of these attributes are more important to their target customers.
With the key product attributes, students should relate them to the technical requirements of a
water filter by tools such as quality function deployment. Product form and the operating
mechanism of the water filter are decided next. Adsorption or membrane filtration theories and
models (McCabe et al. 2005) can be used to design the water filters. With the design of the water
filter, the manufacturing process is proposed next, followed by a financial analysis to determine
if the proposed product is profitable.
References
Brita’s website. https://www.brita.com/intl/ (Accessed on 9 Sep, 2016)
Crittenden JC, Trussell RR, Hand DW, Howe KJ, Tchobanoglous G. MWH’s Water
Treatment: Principles and Design 3rd ed. Hoboken NJ: John Wiley & Sons, 2012.
Culligan’s website. http://www.culligan.com/ (Accessed on 9 Sep, 2016)
Environmental Protection Agency (EPA). Drinking water contaminants – Standards and
Regulations. Retrieved from United States Environmental Protection Agency.
http://water.epa.gov/drink/contaminants/index.cfm (2013).
McCabe WL, Smith JC, Harriott P. Unit operations of chemical engineering. Boston:
McGraw-Hill, 2005.

20
Sample solutions to design of faucet water filter
2.1 The product and its functions
Organics and heavy metals are the major contaminants found in water collected from a faucet
(EPA, 2013). For example, lead was found in the tap water of few public housing estates in Hong
Kong in 2015 due to the use of lead containing solder in pipe welding (Chan and Lai, 2015).
Water filters have to install under the faucets for removing lead from drinking water. Various
pollutant removal mechanisms can be used in these faucet water filters. This project is to design
a cheap water filter that removes contaminants from tap water.
2.2 Market study
Household product companies such as Brita, Panasonic and Culligan provide faucet water filters
of various technologies such as ultrafiltration, reverse osmosis, adsorption and ion exchange
(Table 2.1). All of these filters remove more than 99% of lead from the tap water. The price
varies from US$ 23-127 which depends on the mechanism of pollutants removal and its handling
capacity. All these products produce a flowrate from 1.6 to 2.2 L/min. Note that the typical water
flowrate from a faucet is around 7.5 L/min.
Table 2.1 Commercial faucet water filters
Brand* Model Mechanism Price
(USD)
Flowrate
(L/min)
Handling
capacity (L)
Panasonic TKCJ21 Ultrafiltration $127 1.8 4000
Culligan FM-15A Carbon Adsorption $23 1.9 757
Culligan FM 25 Carbon Adsorption $25 1.9 757
Brita
Advanced
Faucet Filtration
System FF-100
Carbon and
ion-exchange resin
adsorption
$29.99 2.2 378
Philips Micro X-Pure
WP 3812
GAC and ion-exchange
resin adsorption;
membrane filtration
$90 1.6 1500
* Brand’s websites are listed in the reference
Based on market research, the desired product attributes of a water faucet purifier are
1. Contaminants removal (pathogens, metals e.g. lead, organics)
2. Low price
3. Long working life
4. Small in size
5. With a replaceable cartridge
6. With an indicator for replacing the filter cartridge
In order to understand which product attributes are more important to the customers, a survey is
conducted with the questionnaire in Appendix A. The customers are asked to give a rank for
each product attribute (1 being the least important and 5 being the most important), and the
average score �̅� is calculated as follows
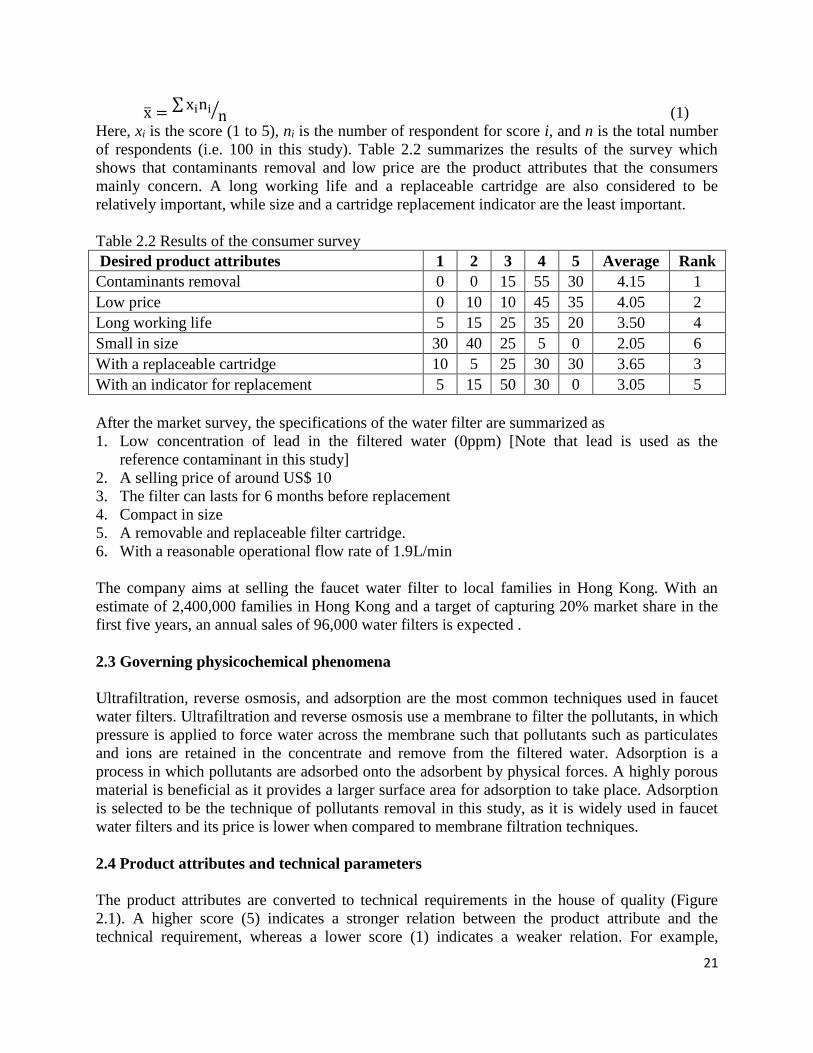
21
x̅ =∑ xini
n⁄ (1)
Here, xi is the score (1 to 5), ni is the number of respondent for score i, and n is the total number
of respondents (i.e. 100 in this study). Table 2.2 summarizes the results of the survey which
shows that contaminants removal and low price are the product attributes that the consumers
mainly concern. A long working life and a replaceable cartridge are also considered to be
relatively important, while size and a cartridge replacement indicator are the least important.
Table 2.2 Results of the consumer survey
Desired product attributes 1 2 3 4 5 Average Rank
Contaminants removal 0 0 15 55 30 4.15 1
Low price 0 10 10 45 35 4.05 2
Long working life 5 15 25 35 20 3.50 4
Small in size 30 40 25 5 0 2.05 6
With a replaceable cartridge 10 5 25 30 30 3.65 3
With an indicator for replacement 5 15 50 30 0 3.05 5
After the market survey, the specifications of the water filter are summarized as
1. Low concentration of lead in the filtered water (0ppm) [Note that lead is used as the
reference contaminant in this study]
2. A selling price of around US$ 10
3. The filter can lasts for 6 months before replacement
4. Compact in size
5. A removable and replaceable filter cartridge.
6. With a reasonable operational flow rate of 1.9L/min
The company aims at selling the faucet water filter to local families in Hong Kong. With an
estimate of 2,400,000 families in Hong Kong and a target of capturing 20% market share in the
first five years, an annual sales of 96,000 water filters is expected .
2.3 Governing physicochemical phenomena
Ultrafiltration, reverse osmosis, and adsorption are the most common techniques used in faucet
water filters. Ultrafiltration and reverse osmosis use a membrane to filter the pollutants, in which
pressure is applied to force water across the membrane such that pollutants such as particulates
and ions are retained in the concentrate and remove from the filtered water. Adsorption is a
process in which pollutants are adsorbed onto the adsorbent by physical forces. A highly porous
material is beneficial as it provides a larger surface area for adsorption to take place. Adsorption
is selected to be the technique of pollutants removal in this study, as it is widely used in faucet
water filters and its price is lower when compared to membrane filtration techniques.
2.4 Product attributes and technical parameters
The product attributes are converted to technical requirements in the house of quality (Figure
2.1). A higher score (5) indicates a stronger relation between the product attribute and the
technical requirement, whereas a lower score (1) indicates a weaker relation. For example,
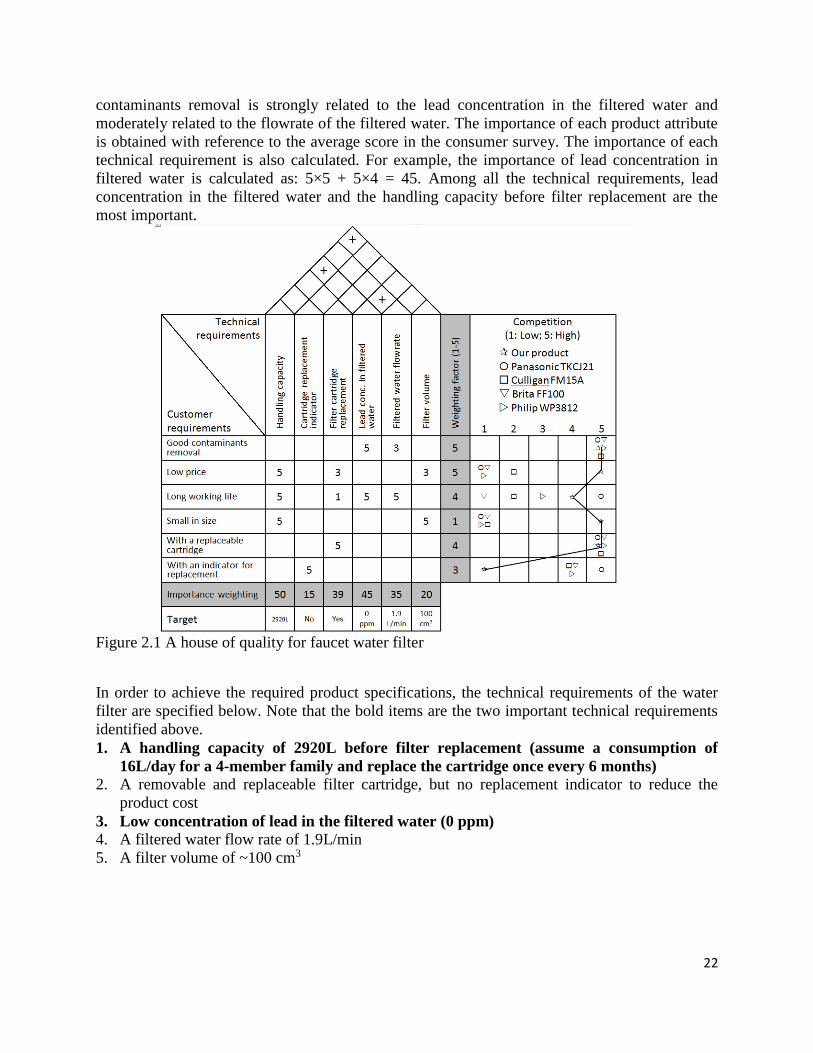
22
contaminants removal is strongly related to the lead concentration in the filtered water and
moderately related to the flowrate of the filtered water. The importance of each product attribute
is obtained with reference to the average score in the consumer survey. The importance of each
technical requirement is also calculated. For example, the importance of lead concentration in
filtered water is calculated as: 5×5 + 5×4 = 45. Among all the technical requirements, lead
concentration in the filtered water and the handling capacity before filter replacement are the
most important.
Figure 2.1 A house of quality for faucet water filter
In order to achieve the required product specifications, the technical requirements of the water
filter are specified below. Note that the bold items are the two important technical requirements
identified above.
1. A handling capacity of 2920L before filter replacement (assume a consumption of
16L/day for a 4-member family and replace the cartridge once every 6 months)
2. A removable and replaceable filter cartridge, but no replacement indicator to reduce the
product cost
3. Low concentration of lead in the filtered water (0 ppm)
4. A filtered water flow rate of 1.9L/min
5. A filter volume of ~100 cm3
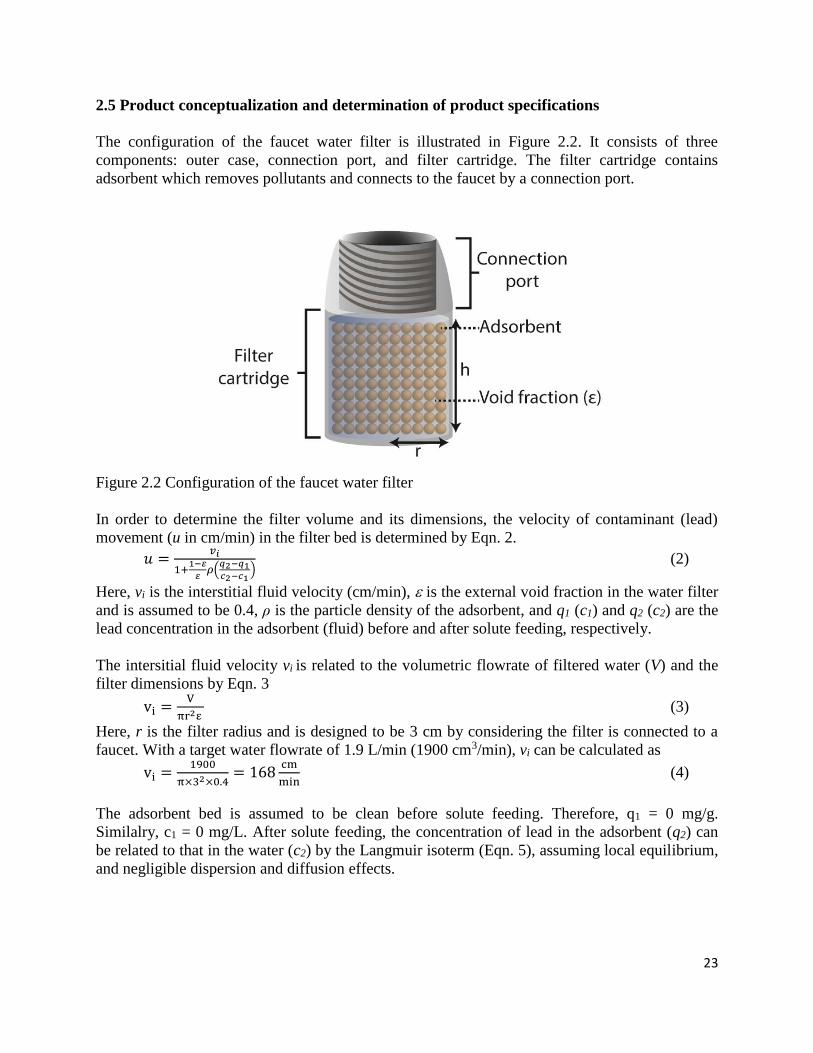
23
2.5 Product conceptualization and determination of product specifications
The configuration of the faucet water filter is illustrated in Figure 2.2. It consists of three
components: outer case, connection port, and filter cartridge. The filter cartridge contains
adsorbent which removes pollutants and connects to the faucet by a connection port.
Figure 2.2 Configuration of the faucet water filter
In order to determine the filter volume and its dimensions, the velocity of contaminant (lead)
movement (u in cm/min) in the filter bed is determined by Eqn. 2.
𝑢 =𝑣𝑖
1+1−𝜀
𝜀𝜌(
𝑞2−𝑞1𝑐2−𝑐1
) (2)
Here, vi is the interstitial fluid velocity (cm/min), is the external void fraction in the water filter
and is assumed to be 0.4, ρ is the particle density of the adsorbent, and q1 (c1) and q2 (c2) are the
lead concentration in the adsorbent (fluid) before and after solute feeding, respectively.
The intersitial fluid velocity vi is related to the volumetric flowrate of filtered water (V) and the
filter dimensions by Eqn. 3
vi =V
πr2ε (3)
Here, r is the filter radius and is designed to be 3 cm by considering the filter is connected to a
faucet. With a target water flowrate of 1.9 L/min (1900 cm3/min), vi can be calculated as
vi =1900
π×32×0.4= 168
cm
min (4)
The adsorbent bed is assumed to be clean before solute feeding. Therefore, q1 = 0 mg/g.
Similalry, c1 = 0 mg/L. After solute feeding, the concentration of lead in the adsorbent (q2) can
be related to that in the water (c2) by the Langmuir isoterm (Eqn. 5), assuming local equilibrium,
and negligible dispersion and diffusion effects.
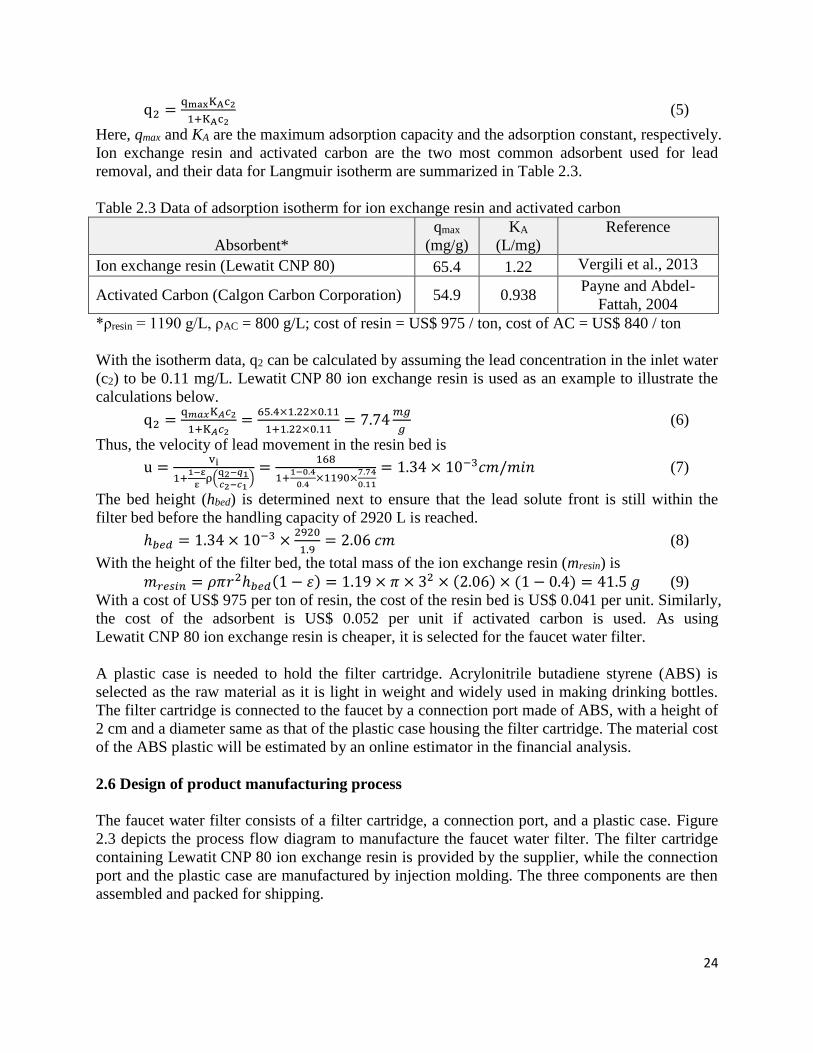
24
q2 =qmaxKAc2
1+KAc2 (5)
Here, qmax and KA are the maximum adsorption capacity and the adsorption constant, respectively.
Ion exchange resin and activated carbon are the two most common adsorbent used for lead
removal, and their data for Langmuir isotherm are summarized in Table 2.3.
Table 2.3 Data of adsorption isotherm for ion exchange resin and activated carbon
Absorbent*
qmax
(mg/g)
KA
(L/mg)
Reference
Ion exchange resin (Lewatit CNP 80) 65.4 1.22 Vergili et al., 2013
Activated Carbon (Calgon Carbon Corporation) 54.9 0.938 Payne and Abdel-
Fattah, 2004
*ρresin = 1190 g/L, ρAC = 800 g/L; cost of resin = US$ 975 / ton, cost of AC = US$ 840 / ton
With the isotherm data, q2 can be calculated by assuming the lead concentration in the inlet water
(c2) to be 0.11 mg/L. Lewatit CNP 80 ion exchange resin is used as an example to illustrate the
calculations below.
q2 =q𝑚𝑎𝑥K𝐴𝑐2
1+K𝐴𝑐2=
65.4×1.22×0.11
1+1.22×0.11= 7.74
𝑚𝑔
𝑔 (6)
Thus, the velocity of lead movement in the resin bed is
u =vi
1+1−ε
ερ(
q2−𝑞1𝑐2−𝑐1
)=
168
1+1−0.4
0.4×1190×
7.74
0.11
= 1.34 × 10⁻³𝑐𝑚/𝑚𝑖𝑛 (7)
The bed height (hbed) is determined next to ensure that the lead solute front is still within the
filter bed before the handling capacity of 2920 L is reached.
ℎ𝑏𝑒𝑑 = 1.34 × 10−3 ×2920
1.9= 2.06 𝑐𝑚 (8)
With the height of the filter bed, the total mass of the ion exchange resin (mresin) is
𝑚𝑟𝑒𝑠𝑖𝑛 = 𝜌𝜋𝑟2ℎ𝑏𝑒𝑑(1 − 𝜀) = 1.19 × 𝜋 × 32 × (2.06) × (1 − 0.4) = 41.5 𝑔 (9)
With a cost of US$ 975 per ton of resin, the cost of the resin bed is US$ 0.041 per unit. Similarly,
the cost of the adsorbent is US$ 0.052 per unit if activated carbon is used. As using
Lewatit CNP 80 ion exchange resin is cheaper, it is selected for the faucet water filter.
A plastic case is needed to hold the filter cartridge. Acrylonitrile butadiene styrene (ABS) is
selected as the raw material as it is light in weight and widely used in making drinking bottles.
The filter cartridge is connected to the faucet by a connection port made of ABS, with a height of
2 cm and a diameter same as that of the plastic case housing the filter cartridge. The material cost
of the ABS plastic will be estimated by an online estimator in the financial analysis.
2.6 Design of product manufacturing process
The faucet water filter consists of a filter cartridge, a connection port, and a plastic case. Figure
2.3 depicts the process flow diagram to manufacture the faucet water filter. The filter cartridge
containing Lewatit CNP 80 ion exchange resin is provided by the supplier, while the connection
port and the plastic case are manufactured by injection molding. The three components are then
assembled and packed for shipping.
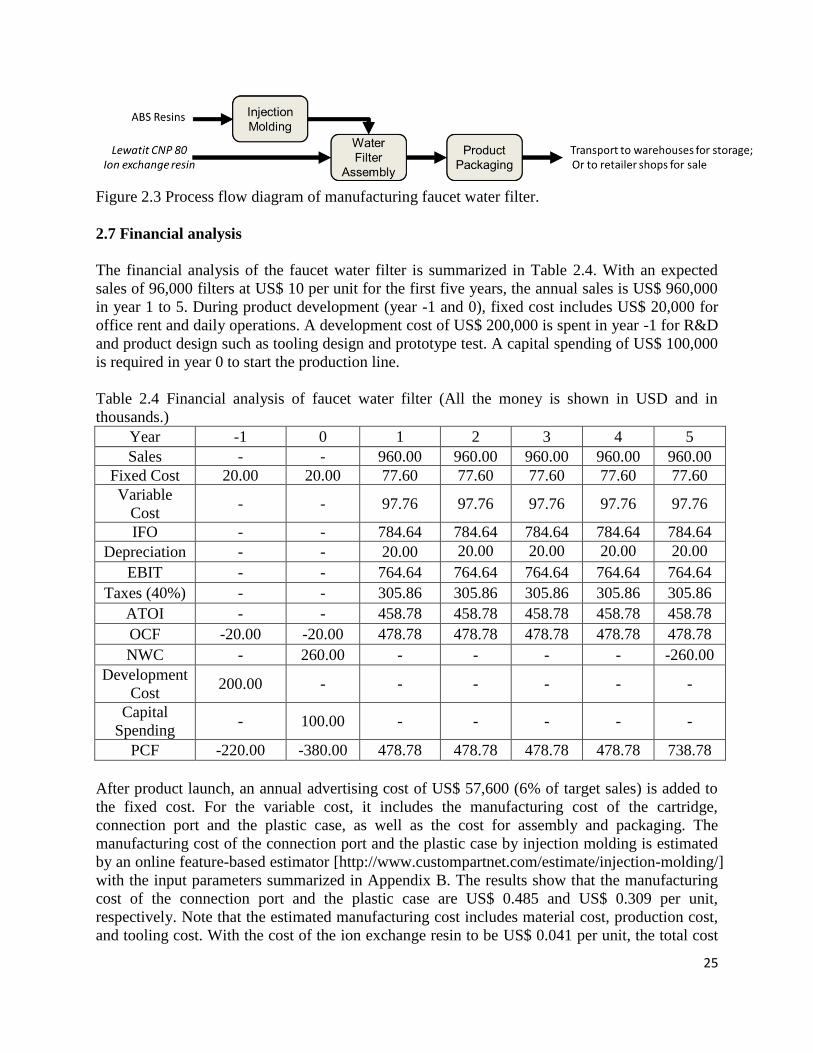
25
Figure 2.3 Process flow diagram of manufacturing faucet water filter.
2.7 Financial analysis
The financial analysis of the faucet water filter is summarized in Table 2.4. With an expected
sales of 96,000 filters at US$ 10 per unit for the first five years, the annual sales is US$ 960,000
in year 1 to 5. During product development (year -1 and 0), fixed cost includes US$ 20,000 for
office rent and daily operations. A development cost of US$ 200,000 is spent in year -1 for R&D
and product design such as tooling design and prototype test. A capital spending of US$ 100,000
is required in year 0 to start the production line.
Table 2.4 Financial analysis of faucet water filter (All the money is shown in USD and in
thousands.)
Year -1 0 1 2 3 4 5
Sales - - 960.00 960.00 960.00 960.00 960.00
Fixed Cost 20.00 20.00 77.60 77.60 77.60 77.60 77.60
Variable
Cost - - 97.76 97.76 97.76 97.76 97.76
IFO - - 784.64 784.64 784.64 784.64 784.64
Depreciation - - 20.00 20.00 20.00 20.00 20.00
EBIT - - 764.64 764.64 764.64 764.64 764.64
Taxes (40%) - - 305.86 305.86 305.86 305.86 305.86
ATOI - - 458.78 458.78 458.78 458.78 458.78
OCF -20.00 -20.00 478.78 478.78 478.78 478.78 478.78
NWC - 260.00 - - - - -260.00
Development
Cost 200.00 - - - - - -
Capital
Spending - 100.00 - - - - -
PCF -220.00 -380.00 478.78 478.78 478.78 478.78 738.78
After product launch, an annual advertising cost of US$ 57,600 (6% of target sales) is added to
the fixed cost. For the variable cost, it includes the manufacturing cost of the cartridge,
connection port and the plastic case, as well as the cost for assembly and packaging. The
manufacturing cost of the connection port and the plastic case by injection molding is estimated
by an online feature-based estimator [http://www.custompartnet.com/estimate/injection-molding/]
with the input parameters summarized in Appendix B. The results show that the manufacturing
cost of the connection port and the plastic case are US$ 0.485 and US$ 0.309 per unit,
respectively. Note that the estimated manufacturing cost includes material cost, production cost,
and tooling cost. With the cost of the ion exchange resin to be US$ 0.041 per unit, the total cost
26
of manufacturing the three components in the water filter is US$ 0.835 per unit, equivalent to
US$ 80,160 per year. For assembly the three parts in the production line, it is assumed that a
worker can assemble 4 filters in one min and the hourly wage of the worker is US$ 10. Therefore,
the cost of assembly is US$ 4,000 per year. Similarly for packaging, the same assumption on
labor requirement is used. With a unit cost of US$ 0.1 for the packaging material, the cost of
packaging is US$ 13,600 per year. Therefore, the total variable cost equals US$ 97,760 per year,
equivalent to US$ 1.02 per unit.
With all the cost information, income from operations (IFO), earnings before income tax (EBIT),
after tax operating income (ATOI), operating cash flow (OCF), and project cash flow (PCF) are
calculated by the following equations.
IFO = S – CED (10)
EBIT = IFO – D = S – CED – D (11)
ATOI = (1 – t) EBIT = (1 – t) (S – CED – D) (12)
OCF = ATOI + D = (1 – t) (S – CED – D) + D = (1 – t) (S – CED) + t D (13)
PCF = OCF – Development cost Increase in NWC – Project capital spending (14)
Here, S is the sales, CED is the fixed and variable costs, D is depreciation which is assumed to be
linear depreciation over the project period, t is tax rate which is assumed to be 40%, NWC is the
net working capital.
Net present value (NPV) is used to calculate the profitability of the water filter project, as
expressed in Eqn. 15.
𝑁𝑃𝑉 = ∑𝑃𝐶𝐹𝑗
(1+𝑅)𝑗
𝑚
𝑗=−𝑛 (15)
Here, R is the discount rate set by the management, n is the number of years for product
development, and m is the number of years of the product life. With a discount rate of 20%, NPV
equals US$ 892,345.
Similarly, internal rate of return (IRR) can be determined by setting NPV to be 0 and solve for
the discount rate R. Using Solver in Microsoft excel, IRR equals 61.2% which exceeds the 5%
bank interest rate. Therefore, the project can be presented to the management team for approval.
2.8 References
Chan G, Lai YK. Lead 80 times the safe limit found in water at Hong Kong public
housing estate where scandal broke. South China Morning Post. 12 Sep 2015.
Environmental Protection Agency (EPA). Drinking water contaminants – Standards and
Regulations. Retrieved from United States Environmental Protection Agency.
http://water.epa.gov/drink/contaminants/index.cfm (2013).
Payne KB, Abdel-Fattah TM. Adsorption of divalent lead ions by zeolites and activated
carbon: effects of pH, temperature and ionic strength. Journal of Environmental Science
and Health. 2004;39(9):2275-2291.
Vergili I, Soltobaeva G, Kaya Y, Gonder ZB, Cavus S, Gurdag G. Study of the removal
of Pb(II) using a weak acidic cation resin: kinetics, thermodynamics, equilibrium, and
breakthrough curves. Industrial & Engineering Chemistry Research. 2013;52:9227-9238.
27
Webpage information
Market information:
Panasonic: http://www.panasonic.hk/ (Accessed on 9 Sep , 2016)
Culligan: http://www.culligan.com/ (Accessed on 9 Sep , 2016)
Brita: https://www.brita.com/intl/ (Accessed on 9 Sep , 2016)
Philips: http://www.philips.com.hk (Accessed on 9 Sep , 2016)
Technical information:
http://www.custompartnet.com/estimate/injection-molding/ (Accessed on 9 Sep , 2016)
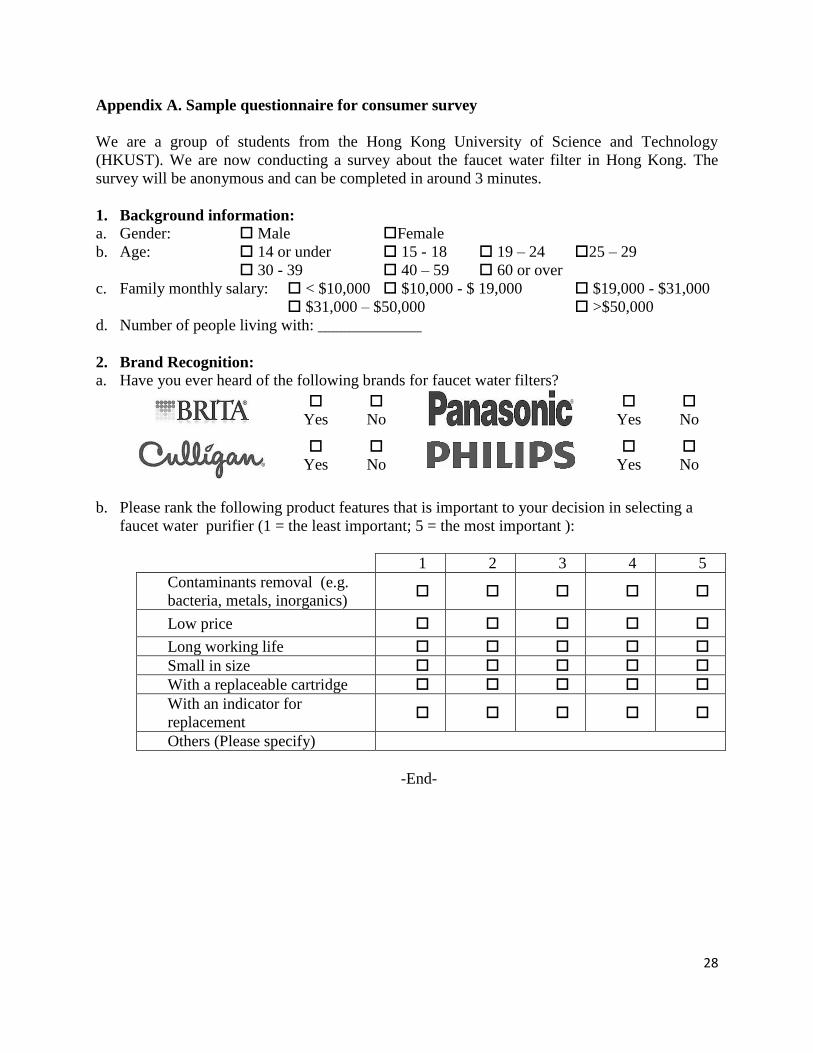
28
Appendix A. Sample questionnaire for consumer survey
We are a group of students from the Hong Kong University of Science and Technology
(HKUST). We are now conducting a survey about the faucet water filter in Hong Kong. The
survey will be anonymous and can be completed in around 3 minutes.
1. Background information:
a. Gender: Male Female
b. Age: 14 or under 15 - 18 19 – 24 25 – 29
30 - 39 40 – 59 60 or over
c. Family monthly salary: < $10,000 $10,000 - $ 19,000 $19,000 - $31,000
$31,000 – $50,000 >$50,000
d. Number of people living with: _____________
2. Brand Recognition:
a. Have you ever heard of the following brands for faucet water filters?
Yes No
Yes No
Yes No
Yes No
b. Please rank the following product features that is important to your decision in selecting a
faucet water purifier (1 = the least important; 5 = the most important ):
1 2 3 4 5
Contaminants removal (e.g.
bacteria, metals, inorganics)
Low price
Long working life
Small in size
With a replaceable cartridge
With an indicator for
replacement
Others (Please specify)
-End-
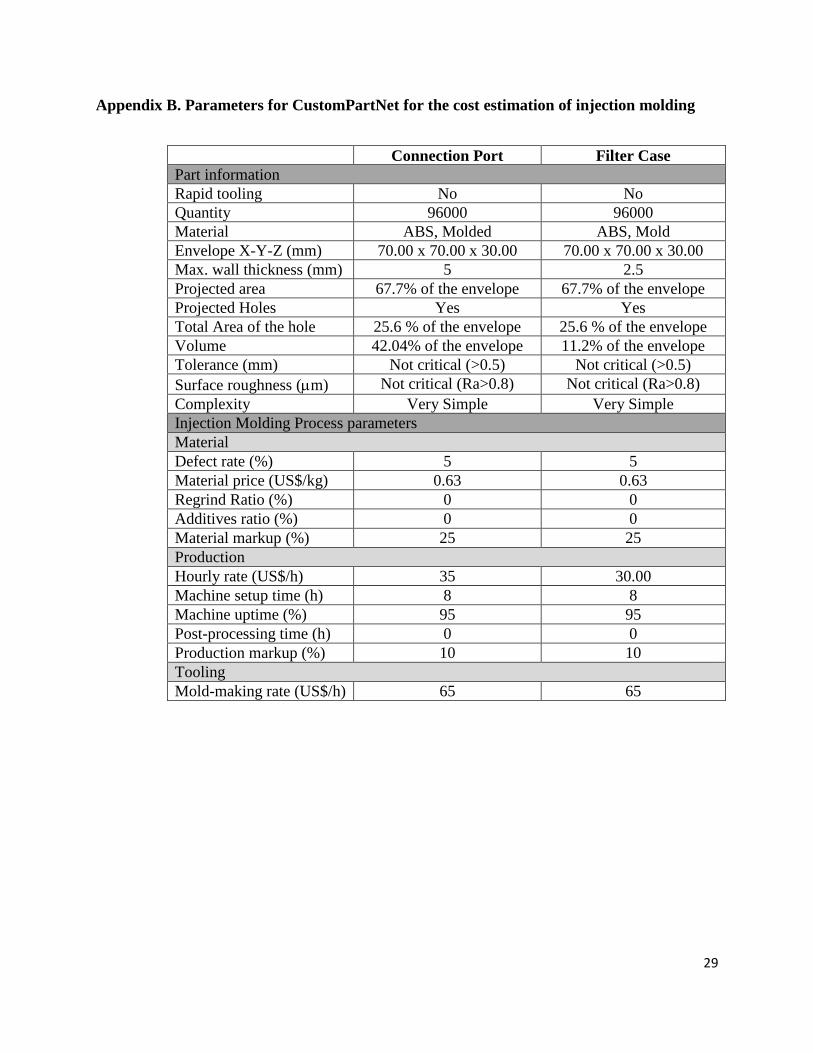
29
Appendix B. Parameters for CustomPartNet for the cost estimation of injection molding
Connection Port Filter Case
Part information
Rapid tooling No No
Quantity 96000 96000
Material ABS, Molded ABS, Mold
Envelope X-Y-Z (mm) 70.00 x 70.00 x 30.00 70.00 x 70.00 x 30.00
Max. wall thickness (mm) 5 2.5
Projected area 67.7% of the envelope 67.7% of the envelope
Projected Holes Yes Yes
Total Area of the hole 25.6 % of the envelope 25.6 % of the envelope
Volume 42.04% of the envelope 11.2% of the envelope
Tolerance (mm) Not critical (>0.5) Not critical (>0.5)
Surface roughness (m) Not critical (Ra>0.8) Not critical (Ra>0.8)
Complexity Very Simple Very Simple
Injection Molding Process parameters
Material
Defect rate (%) 5 5
Material price (US$/kg) 0.63 0.63
Regrind Ratio (%) 0 0
Additives ratio (%) 0 0
Material markup (%) 25 25
Production
Hourly rate (US$/h) 35 30.00
Machine setup time (h) 8 8
Machine uptime (%) 95 95
Post-processing time (h) 0 0
Production markup (%) 10 10
Tooling
Mold-making rate (US$/h) 65 65
30
Product 3: Conductive Inkjet Ink
A conductive ink that prints conductive tracks for printed electronics
Project Statement
Conductive ink is increasingly used in various applications in recent years, as inkjet printing is
more environmental friendly and produces less waste in fabricating printed circuit boards, as
compared to conventional vacuum deposition and lithography techniques. It can be used in drop-
on-demand inkjet printing to print conductive tracks for printed electronics, photovoltaics,
biosensors, etc.
As conductive ink and inkjet printing are not covered in a typical chemical engineering
curriculum, students are advised to first understand how inkjet printing prints conductive tracks
and the basic requirements of the conductive ink such as the required ink conductivity for
different applications. After that, a market study has to be conducted to summarize the market
size and the competing products in the market. Examples of companies producing conductive ink
include DuPont and Novacentrix. The product attributes of the conductive ink are identified from
market analysis and printing technology handbooks (Kipphan, 2001).
The identified product attributes are converted to technical parameters by methods such as House
of Quality. For example, whether droplets can be formed in the printing process depends on the
nozzle size, the ink viscosity and surface tension. The base case formula is then determined by
rule-based methods, model-based methods, database, and experiments. Students can refer to Tam
et al. (2016) and Magdassi (2010) for a database of the common ingredients in a conductive ink,
heuristics to shortlist candidates for a specific ink component, and models to select the
ingredients and determine its concentration such that the product specifications are met. After
formulating the base-case, experiments are conducted to verify the major physicochemical
properties and to print on a substrate to verify its printing performance. The formulation is then
iterated, guided by a causal tablet, to meet the product specifications. The product manufacturing
process of the conductive ink is then synthesized and a financial analysis is performed to
evaluate the profitability.
References
Kipphan H. Handbook of Print Media: Technologies and Production Methods. Berlin;
Hong Kong: Springer-Verlag, 2001.
Magdassi S. The Chemistry of Inkjet Inks. World scientific Singapore, 2010.
Tam SK, Fung KY, Poon GSH, Ng KM. Product design: Metal nanoparticle-based
conductive inkjet inks. AIChE Journal 2016;62(8):2740-2753.
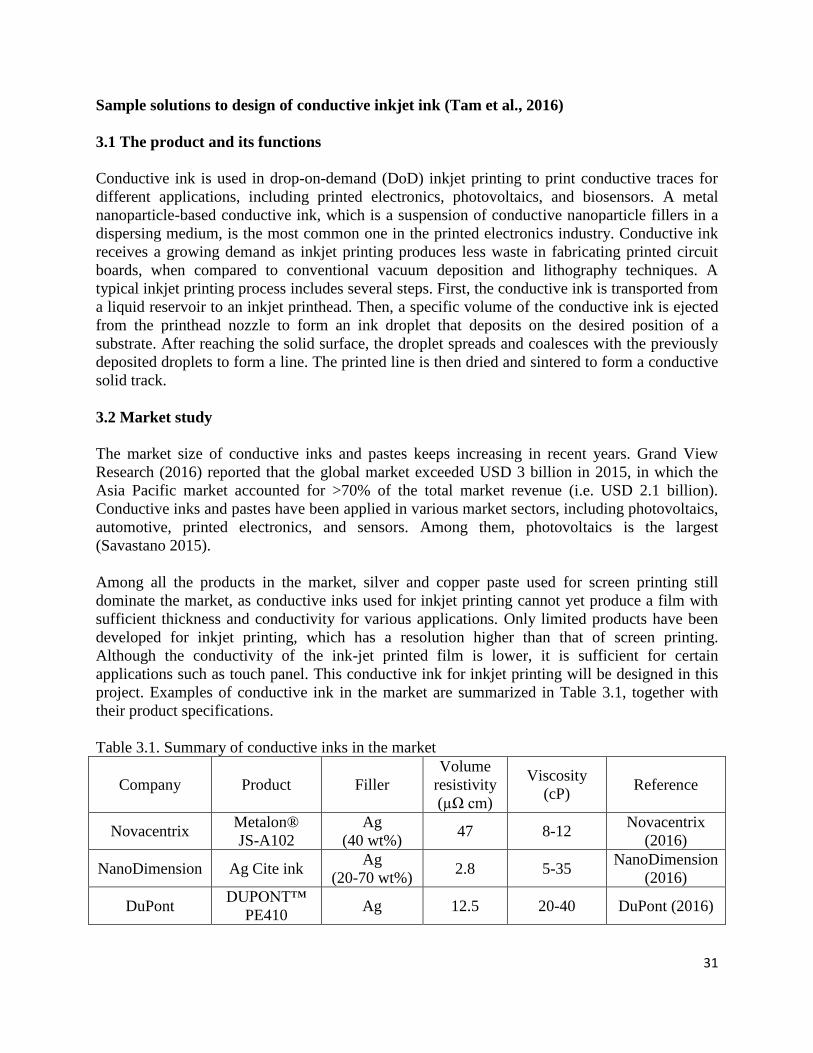
31
Sample solutions to design of conductive inkjet ink (Tam et al., 2016)
3.1 The product and its functions
Conductive ink is used in drop-on-demand (DoD) inkjet printing to print conductive traces for
different applications, including printed electronics, photovoltaics, and biosensors. A metal
nanoparticle-based conductive ink, which is a suspension of conductive nanoparticle fillers in a
dispersing medium, is the most common one in the printed electronics industry. Conductive ink
receives a growing demand as inkjet printing produces less waste in fabricating printed circuit
boards, when compared to conventional vacuum deposition and lithography techniques. A
typical inkjet printing process includes several steps. First, the conductive ink is transported from
a liquid reservoir to an inkjet printhead. Then, a specific volume of the conductive ink is ejected
from the printhead nozzle to form an ink droplet that deposits on the desired position of a
substrate. After reaching the solid surface, the droplet spreads and coalesces with the previously
deposited droplets to form a line. The printed line is then dried and sintered to form a conductive
solid track.
3.2 Market study
The market size of conductive inks and pastes keeps increasing in recent years. Grand View
Research (2016) reported that the global market exceeded USD 3 billion in 2015, in which the
Asia Pacific market accounted for >70% of the total market revenue (i.e. USD 2.1 billion).
Conductive inks and pastes have been applied in various market sectors, including photovoltaics,
automotive, printed electronics, and sensors. Among them, photovoltaics is the largest
(Savastano 2015).
Among all the products in the market, silver and copper paste used for screen printing still
dominate the market, as conductive inks used for inkjet printing cannot yet produce a film with
sufficient thickness and conductivity for various applications. Only limited products have been
developed for inkjet printing, which has a resolution higher than that of screen printing.
Although the conductivity of the ink-jet printed film is lower, it is sufficient for certain
applications such as touch panel. This conductive ink for inkjet printing will be designed in this
project. Examples of conductive ink in the market are summarized in Table 3.1, together with
their product specifications.
Table 3.1. Summary of conductive inks in the market
Company Product Filler
Volume
resistivity
(µΩ cm)
Viscosity
(cP) Reference
Novacentrix Metalon®
JS-A102
Ag
(40 wt%) 47 8-12
Novacentrix
(2016)
NanoDimension Ag Cite ink Ag
(20-70 wt%) 2.8 5-35
NanoDimension
(2016)
DuPont DUPONT™
PE410 Ag 12.5 20-40 DuPont (2016)
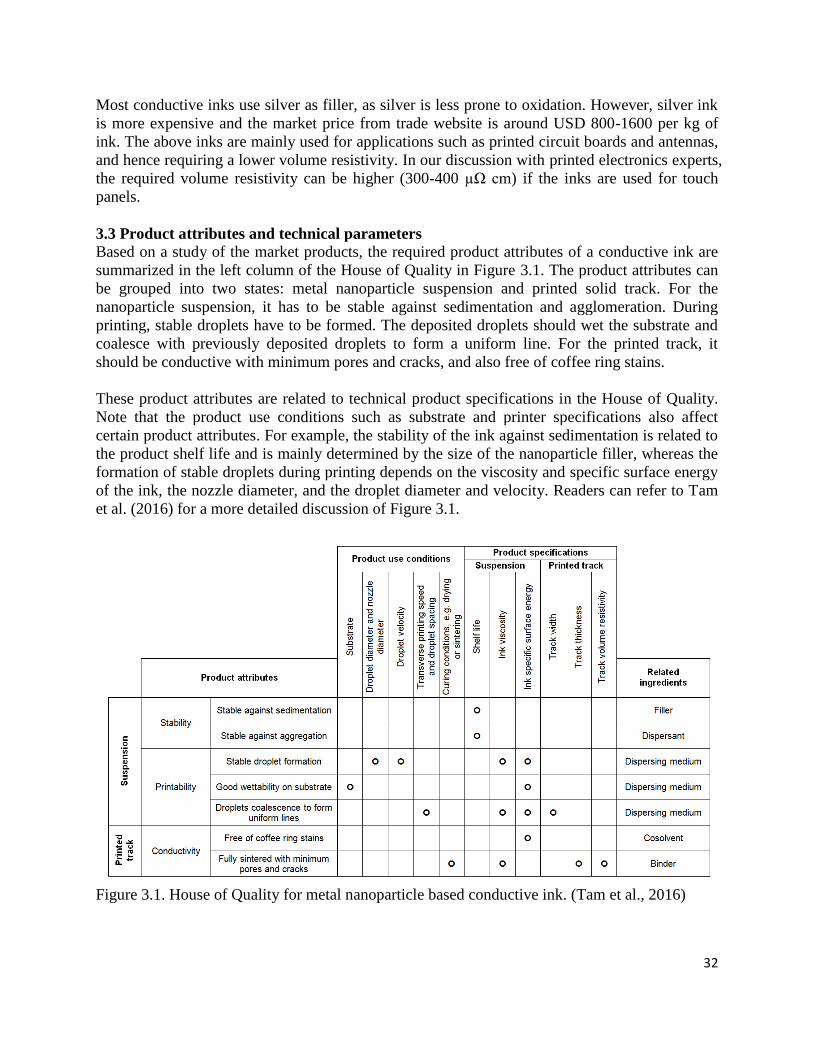
32
Most conductive inks use silver as filler, as silver is less prone to oxidation. However, silver ink
is more expensive and the market price from trade website is around USD 800-1600 per kg of
ink. The above inks are mainly used for applications such as printed circuit boards and antennas,
and hence requiring a lower volume resistivity. In our discussion with printed electronics experts,
the required volume resistivity can be higher (300-400 µΩ cm) if the inks are used for touch
panels.
3.3 Product attributes and technical parameters
Based on a study of the market products, the required product attributes of a conductive ink are
summarized in the left column of the House of Quality in Figure 3.1. The product attributes can
be grouped into two states: metal nanoparticle suspension and printed solid track. For the
nanoparticle suspension, it has to be stable against sedimentation and agglomeration. During
printing, stable droplets have to be formed. The deposited droplets should wet the substrate and
coalesce with previously deposited droplets to form a uniform line. For the printed track, it
should be conductive with minimum pores and cracks, and also free of coffee ring stains.
These product attributes are related to technical product specifications in the House of Quality.
Note that the product use conditions such as substrate and printer specifications also affect
certain product attributes. For example, the stability of the ink against sedimentation is related to
the product shelf life and is mainly determined by the size of the nanoparticle filler, whereas the
formation of stable droplets during printing depends on the viscosity and specific surface energy
of the ink, the nozzle diameter, and the droplet diameter and velocity. Readers can refer to Tam
et al. (2016) for a more detailed discussion of Figure 3.1.
Figure 3.1. House of Quality for metal nanoparticle based conductive ink. (Tam et al., 2016)
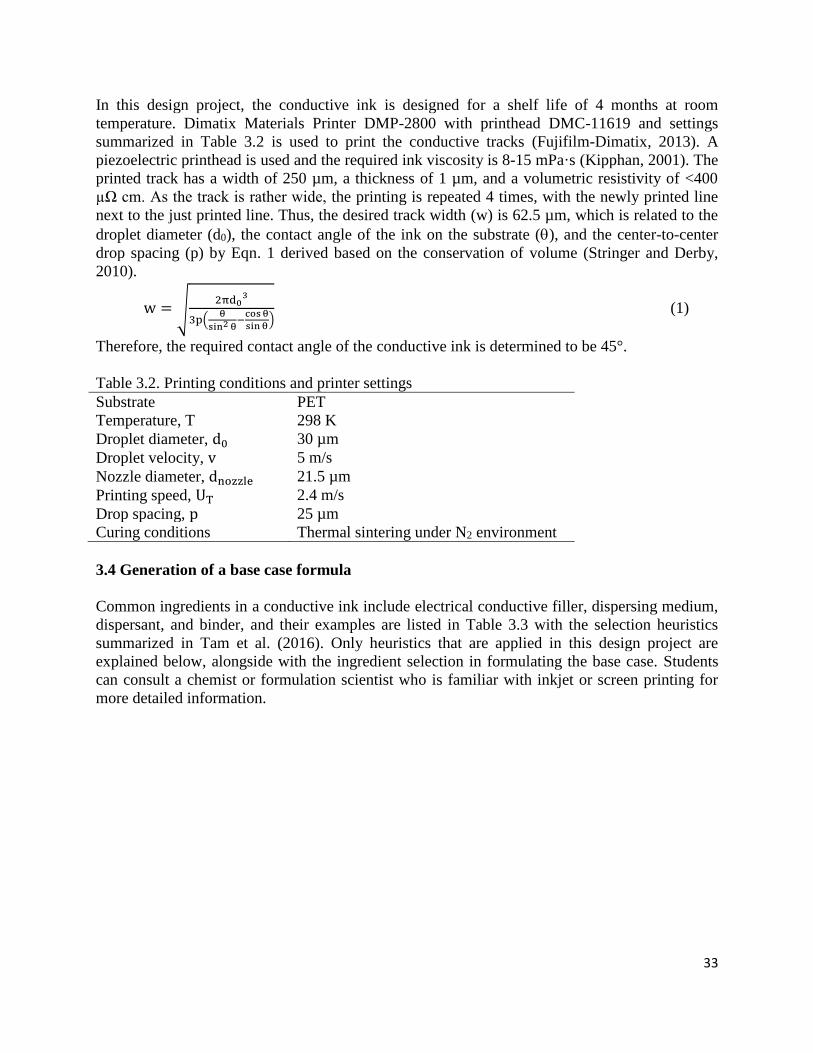
33
In this design project, the conductive ink is designed for a shelf life of 4 months at room
temperature. Dimatix Materials Printer DMP-2800 with printhead DMC-11619 and settings
summarized in Table 3.2 is used to print the conductive tracks (Fujifilm-Dimatix, 2013). A
piezoelectric printhead is used and the required ink viscosity is 8-15 mPa·s (Kipphan, 2001). The
printed track has a width of 250 µm, a thickness of 1 µm, and a volumetric resistivity of <400
µΩ cm. As the track is rather wide, the printing is repeated 4 times, with the newly printed line
next to the just printed line. Thus, the desired track width (w) is 62.5 µm, which is related to the
droplet diameter (d0), the contact angle of the ink on the substrate (), and the center-to-center
drop spacing (p) by Eqn. 1 derived based on the conservation of volume (Stringer and Derby,
2010).
w = √2πd0
3
3p(θ
sin2 θ−
cos θ
sin θ) (1)
Therefore, the required contact angle of the conductive ink is determined to be 45°.
Table 3.2. Printing conditions and printer settings
Substrate PET
Temperature, T 298 K
Droplet diameter, d0 30 µm
Droplet velocity, v 5 m/s
Nozzle diameter, dnozzle 21.5 µm
Printing speed, UT 2.4 m/s
Drop spacing, p 25 µm
Curing conditions Thermal sintering under N2 environment
3.4 Generation of a base case formula
Common ingredients in a conductive ink include electrical conductive filler, dispersing medium,
dispersant, and binder, and their examples are listed in Table 3.3 with the selection heuristics
summarized in Tam et al. (2016). Only heuristics that are applied in this design project are
explained below, alongside with the ingredient selection in formulating the base case. Students
can consult a chemist or formulation scientist who is familiar with inkjet or screen printing for
more detailed information.
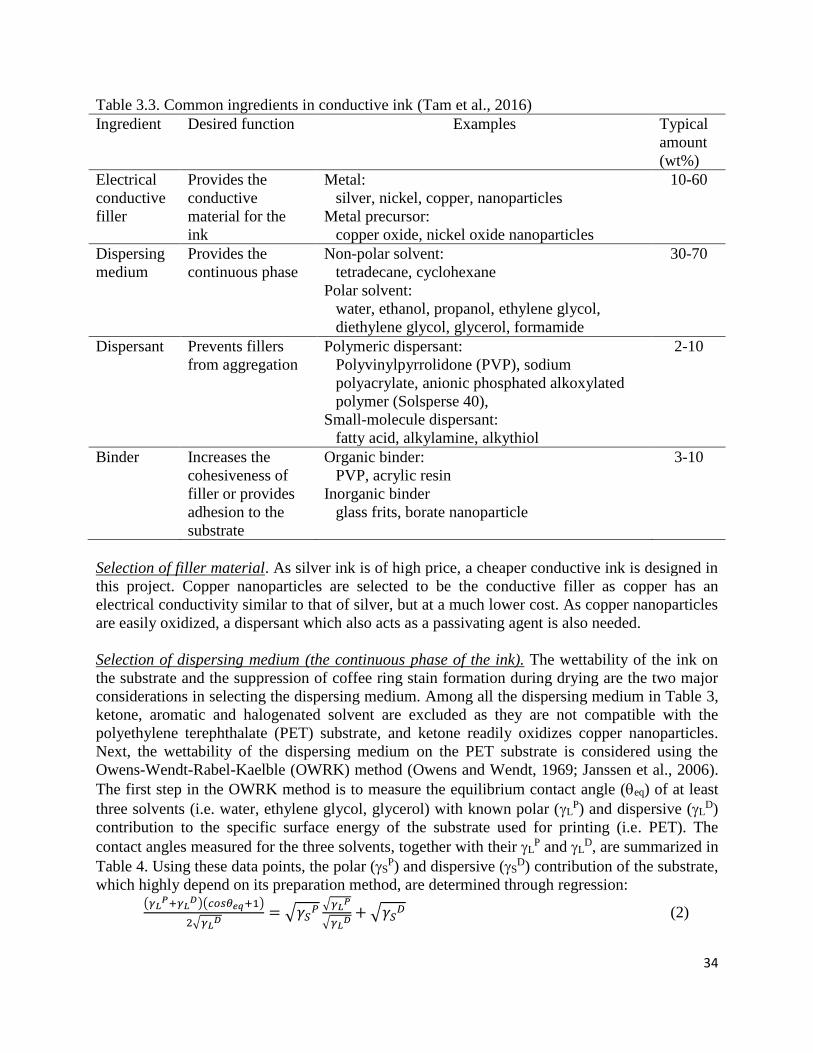
34
Table 3.3. Common ingredients in conductive ink (Tam et al., 2016)
Ingredient Desired function Examples Typical
amount
(wt%)
Electrical
conductive
filler
Provides the
conductive
material for the
ink
Metal:
silver, nickel, copper, nanoparticles
Metal precursor:
copper oxide, nickel oxide nanoparticles
10-60
Dispersing
medium
Provides the
continuous phase
Non-polar solvent:
tetradecane, cyclohexane
Polar solvent:
water, ethanol, propanol, ethylene glycol,
diethylene glycol, glycerol, formamide
30-70
Dispersant Prevents fillers
from aggregation
Polymeric dispersant:
Polyvinylpyrrolidone (PVP), sodium
polyacrylate, anionic phosphated alkoxylated
polymer (Solsperse 40),
Small-molecule dispersant:
fatty acid, alkylamine, alkythiol
2-10
Binder Increases the
cohesiveness of
filler or provides
adhesion to the
substrate
Organic binder:
PVP, acrylic resin
Inorganic binder
glass frits, borate nanoparticle
3-10
Selection of filler material. As silver ink is of high price, a cheaper conductive ink is designed in
this project. Copper nanoparticles are selected to be the conductive filler as copper has an
electrical conductivity similar to that of silver, but at a much lower cost. As copper nanoparticles
are easily oxidized, a dispersant which also acts as a passivating agent is also needed.
Selection of dispersing medium (the continuous phase of the ink). The wettability of the ink on
the substrate and the suppression of coffee ring stain formation during drying are the two major
considerations in selecting the dispersing medium. Among all the dispersing medium in Table 3,
ketone, aromatic and halogenated solvent are excluded as they are not compatible with the
polyethylene terephthalate (PET) substrate, and ketone readily oxidizes copper nanoparticles.
Next, the wettability of the dispersing medium on the PET substrate is considered using the
Owens-Wendt-Rabel-Kaelble (OWRK) method (Owens and Wendt, 1969; Janssen et al., 2006).
The first step in the OWRK method is to measure the equilibrium contact angle (eq) of at least
three solvents (i.e. water, ethylene glycol, glycerol) with known polar (LP) and dispersive (L
D)
contribution to the specific surface energy of the substrate used for printing (i.e. PET). The
contact angles measured for the three solvents, together with their LP and L
D, are summarized in
Table 4. Using these data points, the polar (SP) and dispersive (S
D) contribution of the substrate,
which highly depend on its preparation method, are determined through regression:
(𝛾𝐿
𝑃+𝛾𝐿𝐷)(𝑐𝑜𝑠𝜃𝑒𝑞+1)
2√𝛾𝐿𝐷
= √𝛾𝑆𝑃 √𝛾𝐿
𝑃
√𝛾𝐿𝐷
+ √𝛾𝑆𝐷 (2)
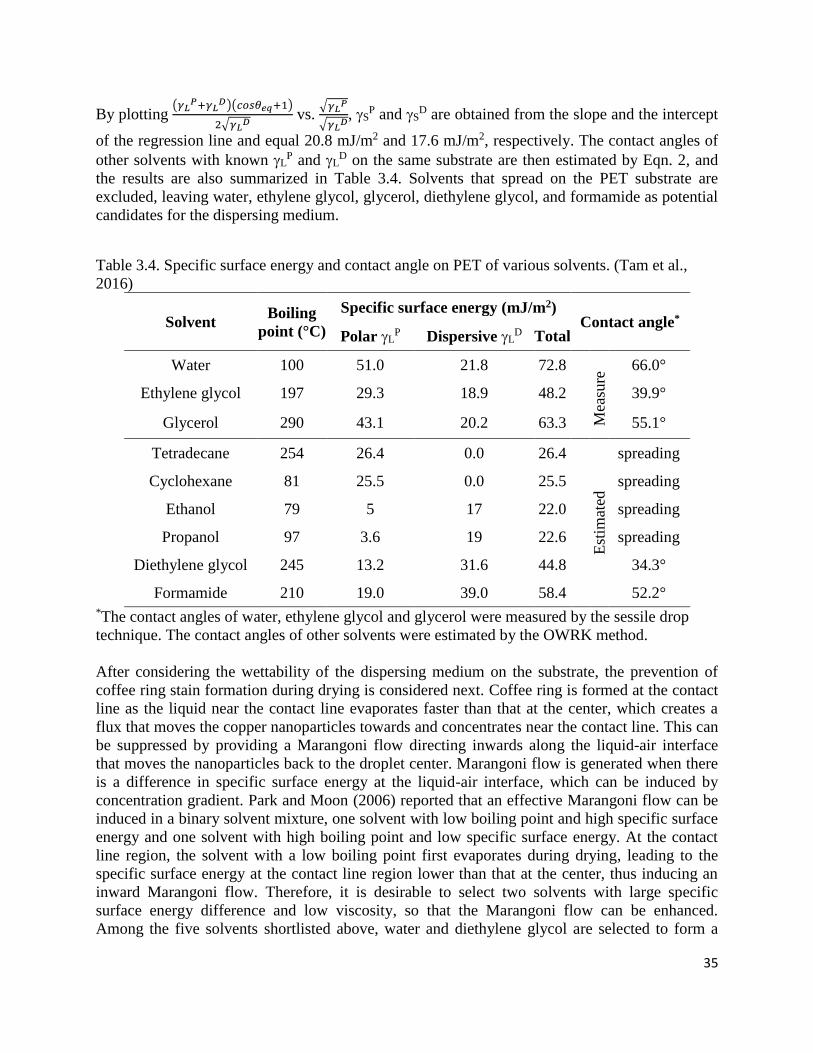
35
By plotting (𝛾𝐿
𝑃+𝛾𝐿𝐷)(𝑐𝑜𝑠𝜃𝑒𝑞+1)
2√𝛾𝐿𝐷
vs. √𝛾𝐿
𝑃
√𝛾𝐿𝐷, S
P and SD are obtained from the slope and the intercept
of the regression line and equal 20.8 mJ/m2 and 17.6 mJ/m2, respectively. The contact angles of
other solvents with known LP and L
D on the same substrate are then estimated by Eqn. 2, and
the results are also summarized in Table 3.4. Solvents that spread on the PET substrate are
excluded, leaving water, ethylene glycol, glycerol, diethylene glycol, and formamide as potential
candidates for the dispersing medium.
Table 3.4. Specific surface energy and contact angle on PET of various solvents. (Tam et al.,
2016)
Solvent Boiling
point (°C)
Specific surface energy (mJ/m2) Contact angle*
Polar LP Dispersive L
D Total
Water 100 51.0 21.8 72.8
Mea
sure
d
66.0°
Ethylene glycol 197 29.3 18.9 48.2 39.9°
Glycerol 290 43.1 20.2 63.3 55.1°
Tetradecane 254 26.4 0.0 26.4
Est
imat
ed
spreading
Cyclohexane 81 25.5 0.0 25.5 spreading
Ethanol 79 5 17 22.0 spreading
Propanol 97 3.6 19 22.6 spreading
Diethylene glycol 245 13.2 31.6 44.8 34.3°
Formamide 210 19.0 39.0 58.4 52.2° *The contact angles of water, ethylene glycol and glycerol were measured by the sessile drop
technique. The contact angles of other solvents were estimated by the OWRK method.
After considering the wettability of the dispersing medium on the substrate, the prevention of
coffee ring stain formation during drying is considered next. Coffee ring is formed at the contact
line as the liquid near the contact line evaporates faster than that at the center, which creates a
flux that moves the copper nanoparticles towards and concentrates near the contact line. This can
be suppressed by providing a Marangoni flow directing inwards along the liquid-air interface
that moves the nanoparticles back to the droplet center. Marangoni flow is generated when there
is a difference in specific surface energy at the liquid-air interface, which can be induced by
concentration gradient. Park and Moon (2006) reported that an effective Marangoni flow can be
induced in a binary solvent mixture, one solvent with low boiling point and high specific surface
energy and one solvent with high boiling point and low specific surface energy. At the contact
line region, the solvent with a low boiling point first evaporates during drying, leading to the
specific surface energy at the contact line region lower than that at the center, thus inducing an
inward Marangoni flow. Therefore, it is desirable to select two solvents with large specific
surface energy difference and low viscosity, so that the Marangoni flow can be enhanced.
Among the five solvents shortlisted above, water and diethylene glycol are selected to form a
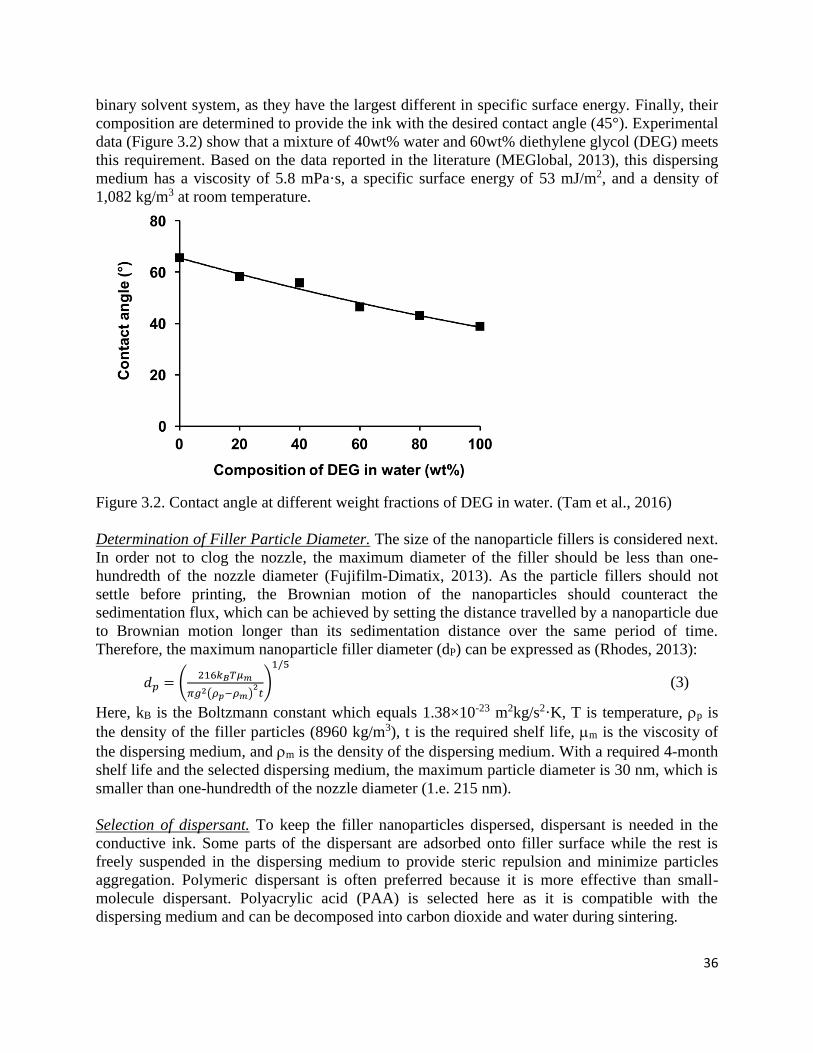
36
binary solvent system, as they have the largest different in specific surface energy. Finally, their
composition are determined to provide the ink with the desired contact angle (45°). Experimental
data (Figure 3.2) show that a mixture of 40wt% water and 60wt% diethylene glycol (DEG) meets
this requirement. Based on the data reported in the literature (MEGlobal, 2013), this dispersing
medium has a viscosity of 5.8 mPa·s, a specific surface energy of 53 mJ/m2, and a density of
1,082 kg/m3 at room temperature.
Figure 3.2. Contact angle at different weight fractions of DEG in water. (Tam et al., 2016)
Determination of Filler Particle Diameter. The size of the nanoparticle fillers is considered next.
In order not to clog the nozzle, the maximum diameter of the filler should be less than one-
hundredth of the nozzle diameter (Fujifilm-Dimatix, 2013). As the particle fillers should not
settle before printing, the Brownian motion of the nanoparticles should counteract the
sedimentation flux, which can be achieved by setting the distance travelled by a nanoparticle due
to Brownian motion longer than its sedimentation distance over the same period of time.
Therefore, the maximum nanoparticle filler diameter (dP) can be expressed as (Rhodes, 2013):
𝑑𝑝 = (216𝑘𝐵𝑇𝜇𝑚
𝜋𝑔2(𝜌𝑝−𝜌𝑚)2
𝑡)
1/5
(3)
Here, kB is the Boltzmann constant which equals 1.38×10⁻²³ m2kg/s2·K, T is temperature, p is
the density of the filler particles (8960 kg/m3), t is the required shelf life, m is the viscosity of
the dispersing medium, and m is the density of the dispersing medium. With a required 4-month
shelf life and the selected dispersing medium, the maximum particle diameter is 30 nm, which is
smaller than one-hundredth of the nozzle diameter (1.e. 215 nm).
Selection of dispersant. To keep the filler nanoparticles dispersed, dispersant is needed in the
conductive ink. Some parts of the dispersant are adsorbed onto filler surface while the rest is
freely suspended in the dispersing medium to provide steric repulsion and minimize particles
aggregation. Polymeric dispersant is often preferred because it is more effective than small-
molecule dispersant. Polyacrylic acid (PAA) is selected here as it is compatible with the
dispersing medium and can be decomposed into carbon dioxide and water during sintering.
37
The molecular weight of the dispersant is determined next to ensure that the surface adsorption
layer (adlayer) is sufficiently thick to resist particle aggregation. The interaction force among the
particles determines the required thickness of the adlayer (l). The overall interaction potential
includes the van dew Waals potential and the steric repulsion potential, and varies with the
distance between two particles. When two particles are separated by 2l, the steric repulsion is
zero and the overall interaction potential reaches a minimum (T,min) and equals the van der
Waals potential (vdW). To prevent particles aggregation, T,min has to be greater than the
Boltzmann threshold stabilization energy (−3/2𝑘𝐵𝑇) (Saunders et al., 2010):
Φ𝑇,𝑚𝑖𝑛 = Φ𝑣𝑑𝑊 ≥ −3/2𝑘𝐵𝑇 (4)
The van der Waals potential of two particles with the same size dp in a medium can be expressed
as:
Φ𝑣𝑑𝑊 = −𝐴𝑝,𝑚
6[
𝑑𝑝2
2𝐷(2𝑑𝑝+𝐷)+
𝑑𝑝2
2(𝑑𝑝+𝐷)2 + 𝑙𝑛
𝐷(2𝑑𝑝+𝐷)
(𝑑𝑝+𝐷)2 ] (5)
Here, Ap,m is the Hamaker constant of particles in the dispersing medium (water and DEG), and
can be estimated from the Hamaker constant of the particle in vacuum (Ap,v) (Anand et al., 2008):
𝐴𝑝,𝑚 ≈ [√𝐴𝑝,𝑣 − (∅𝑤√𝐴𝑤,𝑣 + ∅𝐷𝐸𝐺√𝐴𝐷𝐸𝐺,𝑣)]2 (6)
Here, w(DEG) and Aw,v (ADEG,v) are the volume fraction and the Hamaker constant of water
(DEG) in vacuum, respectively. Ap,v and Aw,v can be obtained from the literature and equal 40 ×
10-20 J (Royer et al., 2010) and 3.7 × 10⁻²⁰ J (Stokes and Evans, 1997), respectively. No
experimental data can be found for ADEG,v, which can be estimated by the Lifshitz theory and
equals 6.1 × 10⁻²⁰ J (MEGlobal, 2013). With a density of 1170 kg/m3 for DEG, the volume
fraction of water (w) and DEG (DEG) equal 0.438 and 0.562, respectively. In Eqn. 5, D is the
surface-to-surface separation between the two particles. The minimum adlayer thickness to keep
the particles dispersed can be obtained by substituting Eqn. 5 into Eqn. 4 and specifying D = 2l.
With the Harmaker constants and the particle size determined in the last step (i.e. 30 nm), the
minimum adlayer thickness is 3.48 nm. For polymeric dispersant with high molecular weight, the
adlayer thickness in nm can be related to the molecular weight of the dispersant (Mw) by an
empirical correlation (Kirby et al., 2004):
𝑙 ≈ 0.06(𝑀𝑤)0.5 (7)
Therefore, an adlayer thickness of 3.48 nm corresponds to a molecular weight of 3,364 for
polyacrylic acid.
The dispersant polyacrylic acid can also function as a passivating agent to prevent copper
from oxidation. However, sodium polyacrylate, instead of polyacrylic acid, is usually used as the
passivating agent in synthesizing copper nanoparticles. By accounting for the molecular weight
difference between polyacrylic acid and sodium polyacrylate repeating unit, the desired
molecular weight of sodium polyacrylate is 4,420. As only sodium polyacrylate of certain
molecular weight are available in the market, sodium polyacrylate with a molecular weight of
5,100, closet to the desired value, is selected. This is equivalent to a molecular weight of 3,880
for polyacrylic acid, corresponding to an adlayer thickness of 3.74 nm.
Determination of the amount of filler and dispersant. Assume the solid track after drying and
sintering has no pores and all the other ingredients are removed during sintering so that the track
contains only nanoparticle fillers, the volume fraction of nanoparticle fillers in the ink (p) equals
the volume of the solids track with the desired thickness (thickness) divided by the total volume of
droplets deposited onto the substrate.
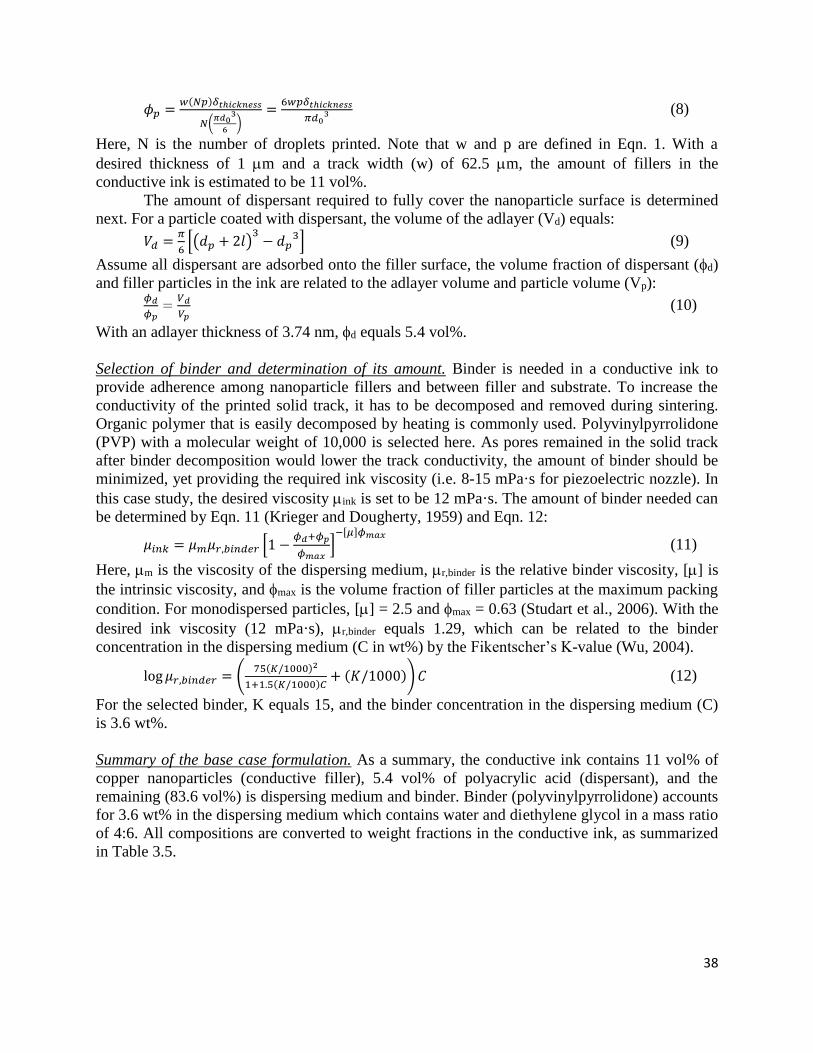
38
𝜙𝑝 =𝑤(𝑁𝑝)𝛿𝑡ℎ𝑖𝑐𝑘𝑛𝑒𝑠𝑠
𝑁(𝜋𝑑0
3
6)
=6𝑤𝑝𝛿𝑡ℎ𝑖𝑐𝑘𝑛𝑒𝑠𝑠
𝜋𝑑03 (8)
Here, N is the number of droplets printed. Note that w and p are defined in Eqn. 1. With a
desired thickness of 1 m and a track width (w) of 62.5 m, the amount of fillers in the
conductive ink is estimated to be 11 vol%.
The amount of dispersant required to fully cover the nanoparticle surface is determined
next. For a particle coated with dispersant, the volume of the adlayer (Vd) equals:
𝑉𝑑 =𝜋
6[(𝑑𝑝 + 2𝑙)
3− 𝑑𝑝
3] (9)
Assume all dispersant are adsorbed onto the filler surface, the volume fraction of dispersant (d)
and filler particles in the ink are related to the adlayer volume and particle volume (Vp):
𝜙𝑑
𝜙𝑝=
𝑉𝑑
𝑉𝑝 (10)
With an adlayer thickness of 3.74 nm, d equals 5.4 vol%.
Selection of binder and determination of its amount. Binder is needed in a conductive ink to
provide adherence among nanoparticle fillers and between filler and substrate. To increase the
conductivity of the printed solid track, it has to be decomposed and removed during sintering.
Organic polymer that is easily decomposed by heating is commonly used. Polyvinylpyrrolidone
(PVP) with a molecular weight of 10,000 is selected here. As pores remained in the solid track
after binder decomposition would lower the track conductivity, the amount of binder should be
minimized, yet providing the required ink viscosity (i.e. 8-15 mPa·s for piezoelectric nozzle). In
this case study, the desired viscosity ink is set to be 12 mPa·s. The amount of binder needed can
be determined by Eqn. 11 (Krieger and Dougherty, 1959) and Eqn. 12:
𝜇𝑖𝑛𝑘 = 𝜇𝑚𝜇𝑟,𝑏𝑖𝑛𝑑𝑒𝑟 [1 −𝜙𝑑+𝜙𝑝
𝜙𝑚𝑎𝑥]
−[𝜇]𝜙𝑚𝑎𝑥
(11)
Here, m is the viscosity of the dispersing medium, r,binder is the relative binder viscosity, [] is
the intrinsic viscosity, and max is the volume fraction of filler particles at the maximum packing
condition. For monodispersed particles, [] = 2.5 and max = 0.63 (Studart et al., 2006). With the
desired ink viscosity (12 mPa·s), r,binder equals 1.29, which can be related to the binder
concentration in the dispersing medium (C in wt%) by the Fikentscher’s K-value (Wu, 2004).
log 𝜇𝑟,𝑏𝑖𝑛𝑑𝑒𝑟 = (75(𝐾/1000)2
1+1.5(𝐾/1000)𝐶+ (𝐾/1000)) 𝐶 (12)
For the selected binder, K equals 15, and the binder concentration in the dispersing medium (C)
is 3.6 wt%.
Summary of the base case formulation. As a summary, the conductive ink contains 11 vol% of
copper nanoparticles (conductive filler), 5.4 vol% of polyacrylic acid (dispersant), and the
remaining (83.6 vol%) is dispersing medium and binder. Binder (polyvinylpyrrolidone) accounts
for 3.6 wt% in the dispersing medium which contains water and diethylene glycol in a mass ratio
of 4:6. All compositions are converted to weight fractions in the conductive ink, as summarized
in Table 3.5.
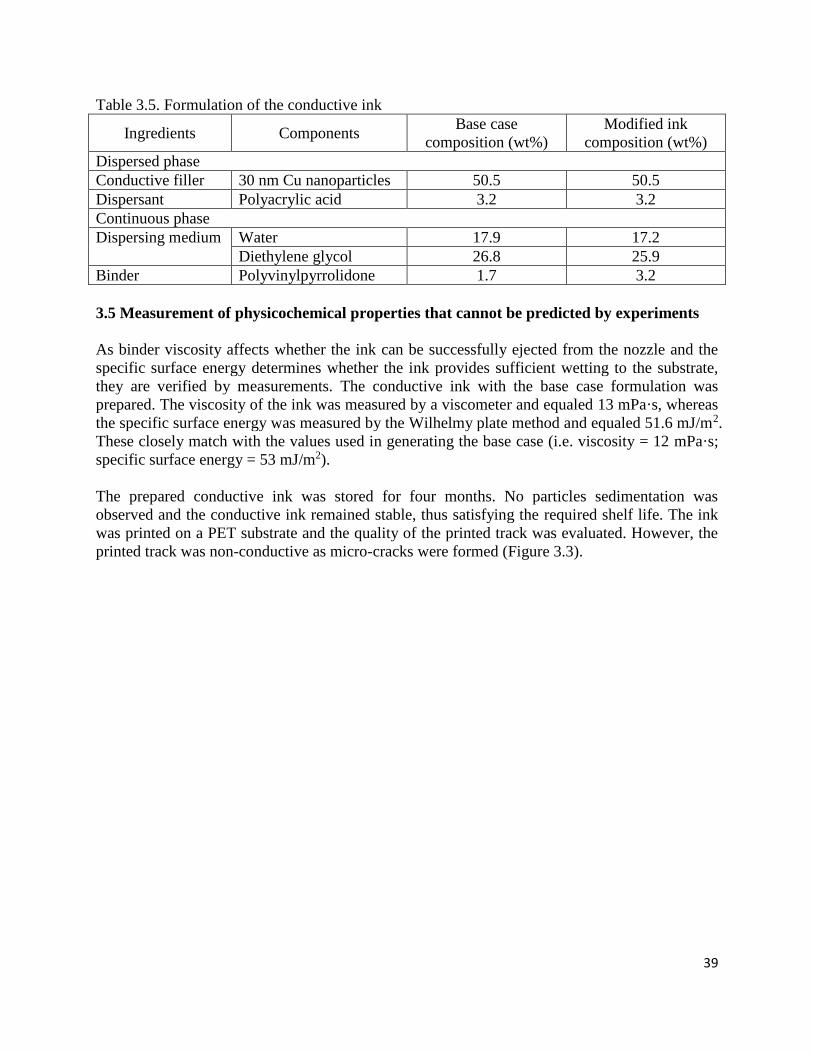
39
Table 3.5. Formulation of the conductive ink
Ingredients Components Base case
composition (wt%)
Modified ink
composition (wt%)
Dispersed phase
Conductive filler 30 nm Cu nanoparticles 50.5 50.5
Dispersant Polyacrylic acid 3.2 3.2
Continuous phase
Dispersing medium Water 17.9 17.2
Diethylene glycol 26.8 25.9
Binder Polyvinylpyrrolidone 1.7 3.2
3.5 Measurement of physicochemical properties that cannot be predicted by experiments
As binder viscosity affects whether the ink can be successfully ejected from the nozzle and the
specific surface energy determines whether the ink provides sufficient wetting to the substrate,
they are verified by measurements. The conductive ink with the base case formulation was
prepared. The viscosity of the ink was measured by a viscometer and equaled 13 mPa·s, whereas
the specific surface energy was measured by the Wilhelmy plate method and equaled 51.6 mJ/m2.
These closely match with the values used in generating the base case (i.e. viscosity = 12 mPa·s;
specific surface energy = 53 mJ/m2).
The prepared conductive ink was stored for four months. No particles sedimentation was
observed and the conductive ink remained stable, thus satisfying the required shelf life. The ink
was printed on a PET substrate and the quality of the printed track was evaluated. However, the
printed track was non-conductive as micro-cracks were formed (Figure 3.3).
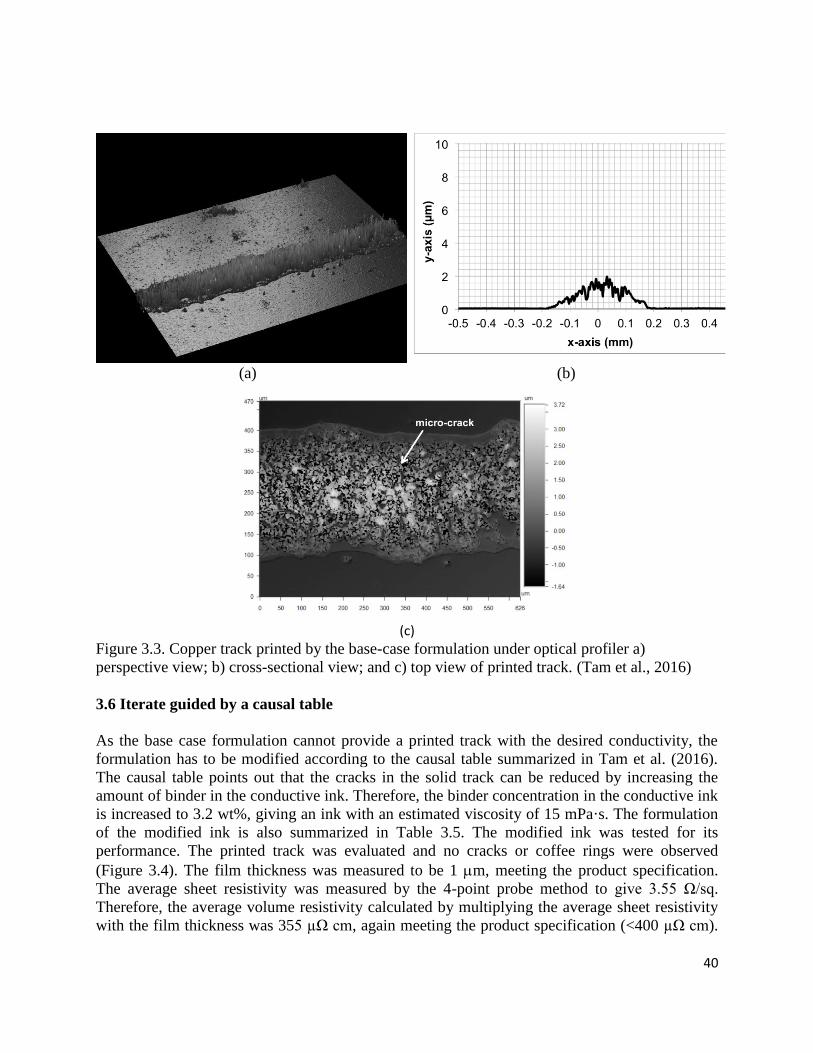
40
(a) (b)
(c)
Figure 3.3. Copper track printed by the base-case formulation under optical profiler a)
perspective view; b) cross-sectional view; and c) top view of printed track. (Tam et al., 2016)
3.6 Iterate guided by a causal table
As the base case formulation cannot provide a printed track with the desired conductivity, the
formulation has to be modified according to the causal table summarized in Tam et al. (2016).
The causal table points out that the cracks in the solid track can be reduced by increasing the
amount of binder in the conductive ink. Therefore, the binder concentration in the conductive ink
is increased to 3.2 wt%, giving an ink with an estimated viscosity of 15 mPa·s. The formulation
of the modified ink is also summarized in Table 3.5. The modified ink was tested for its
performance. The printed track was evaluated and no cracks or coffee rings were observed
(Figure 3.4). The film thickness was measured to be 1 m, meeting the product specification.
The average sheet resistivity was measured by the 4-point probe method to give 3.55 Ω/sq.
Therefore, the average volume resistivity calculated by multiplying the average sheet resistivity
with the film thickness was 355 µΩ cm, again meeting the product specification (<400 µΩ cm).
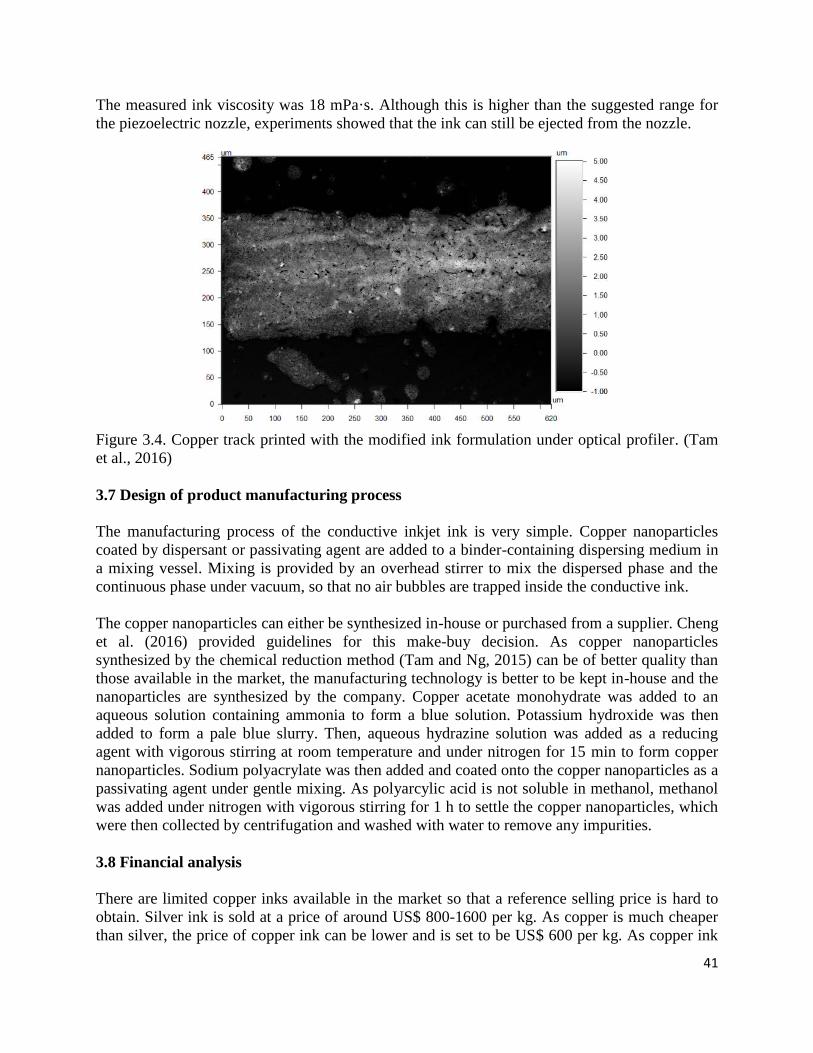
41
The measured ink viscosity was 18 mPa·s. Although this is higher than the suggested range for
the piezoelectric nozzle, experiments showed that the ink can still be ejected from the nozzle.
Figure 3.4. Copper track printed with the modified ink formulation under optical profiler. (Tam
et al., 2016)
3.7 Design of product manufacturing process
The manufacturing process of the conductive inkjet ink is very simple. Copper nanoparticles
coated by dispersant or passivating agent are added to a binder-containing dispersing medium in
a mixing vessel. Mixing is provided by an overhead stirrer to mix the dispersed phase and the
continuous phase under vacuum, so that no air bubbles are trapped inside the conductive ink.
The copper nanoparticles can either be synthesized in-house or purchased from a supplier. Cheng
et al. (2016) provided guidelines for this make-buy decision. As copper nanoparticles
synthesized by the chemical reduction method (Tam and Ng, 2015) can be of better quality than
those available in the market, the manufacturing technology is better to be kept in-house and the
nanoparticles are synthesized by the company. Copper acetate monohydrate was added to an
aqueous solution containing ammonia to form a blue solution. Potassium hydroxide was then
added to form a pale blue slurry. Then, aqueous hydrazine solution was added as a reducing
agent with vigorous stirring at room temperature and under nitrogen for 15 min to form copper
nanoparticles. Sodium polyacrylate was then added and coated onto the copper nanoparticles as a
passivating agent under gentle mixing. As polyarcylic acid is not soluble in methanol, methanol
was added under nitrogen with vigorous stirring for 1 h to settle the copper nanoparticles, which
were then collected by centrifugation and washed with water to remove any impurities.
3.8 Financial analysis
There are limited copper inks available in the market so that a reference selling price is hard to
obtain. Silver ink is sold at a price of around US$ 800-1600 per kg. As copper is much cheaper
than silver, the price of copper ink can be lower and is set to be US$ 600 per kg. As copper ink
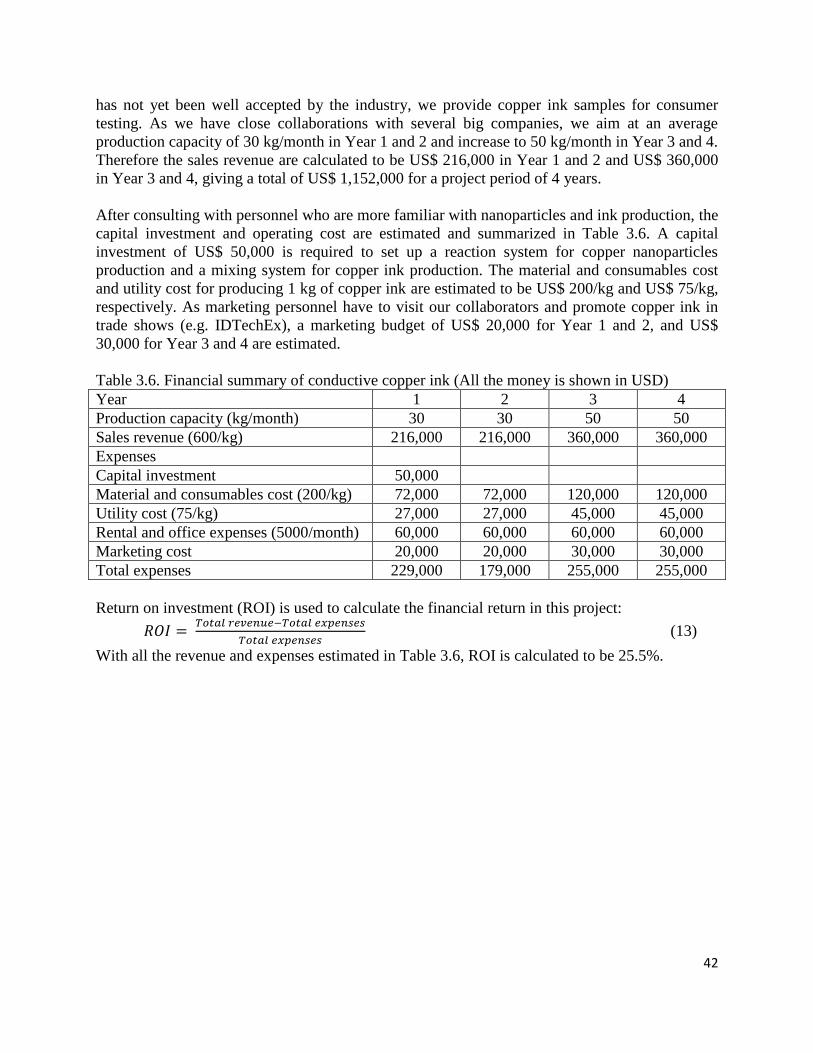
42
has not yet been well accepted by the industry, we provide copper ink samples for consumer
testing. As we have close collaborations with several big companies, we aim at an average
production capacity of 30 kg/month in Year 1 and 2 and increase to 50 kg/month in Year 3 and 4.
Therefore the sales revenue are calculated to be US$ 216,000 in Year 1 and 2 and US$ 360,000
in Year 3 and 4, giving a total of US$ 1,152,000 for a project period of 4 years.
After consulting with personnel who are more familiar with nanoparticles and ink production, the
capital investment and operating cost are estimated and summarized in Table 3.6. A capital
investment of US$ 50,000 is required to set up a reaction system for copper nanoparticles
production and a mixing system for copper ink production. The material and consumables cost
and utility cost for producing 1 kg of copper ink are estimated to be US$ 200/kg and US$ 75/kg,
respectively. As marketing personnel have to visit our collaborators and promote copper ink in
trade shows (e.g. IDTechEx), a marketing budget of US$ 20,000 for Year 1 and 2, and US$
30,000 for Year 3 and 4 are estimated.
Table 3.6. Financial summary of conductive copper ink (All the money is shown in USD)
Year 1 2 3 4
Production capacity (kg/month) 30 30 50 50
Sales revenue (600/kg) 216,000 216,000 360,000 360,000
Expenses
Capital investment 50,000
Material and consumables cost (200/kg) 72,000 72,000 120,000 120,000
Utility cost (75/kg) 27,000 27,000 45,000 45,000
Rental and office expenses (5000/month) 60,000 60,000 60,000 60,000
Marketing cost 20,000 20,000 30,000 30,000
Total expenses 229,000 179,000 255,000 255,000
Return on investment (ROI) is used to calculate the financial return in this project:
𝑅𝑂𝐼 = 𝑇𝑜𝑡𝑎𝑙 𝑟𝑒𝑣𝑒𝑛𝑢𝑒−𝑇𝑜𝑡𝑎𝑙 𝑒𝑥𝑝𝑒𝑛𝑠𝑒𝑠
𝑇𝑜𝑡𝑎𝑙 𝑒𝑥𝑝𝑒𝑛𝑠𝑒𝑠 (13)
With all the revenue and expenses estimated in Table 3.6, ROI is calculated to be 25.5%.
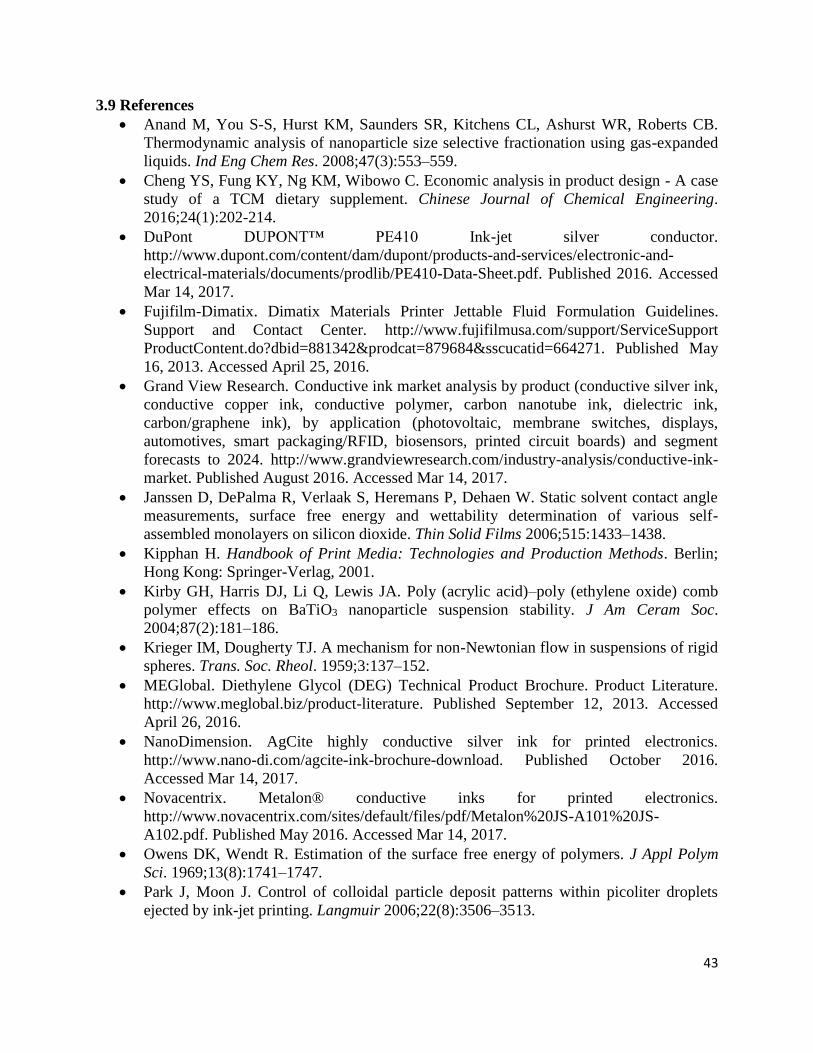
43
3.9 References
Anand M, You S-S, Hurst KM, Saunders SR, Kitchens CL, Ashurst WR, Roberts CB.
Thermodynamic analysis of nanoparticle size selective fractionation using gas-expanded
liquids. Ind Eng Chem Res. 2008;47(3):553–559.
Cheng YS, Fung KY, Ng KM, Wibowo C. Economic analysis in product design - A case
study of a TCM dietary supplement. Chinese Journal of Chemical Engineering.
2016;24(1):202-214.
DuPont DUPONT™ PE410 Ink-jet silver conductor.
http://www.dupont.com/content/dam/dupont/products-and-services/electronic-and-
electrical-materials/documents/prodlib/PE410-Data-Sheet.pdf. Published 2016. Accessed
Mar 14, 2017.
Fujifilm-Dimatix. Dimatix Materials Printer Jettable Fluid Formulation Guidelines.
Support and Contact Center. http://www.fujifilmusa.com/support/ServiceSupport
ProductContent.do?dbid=881342&prodcat=879684&sscucatid=664271. Published May
16, 2013. Accessed April 25, 2016.
Grand View Research. Conductive ink market analysis by product (conductive silver ink,
conductive copper ink, conductive polymer, carbon nanotube ink, dielectric ink,
carbon/graphene ink), by application (photovoltaic, membrane switches, displays,
automotives, smart packaging/RFID, biosensors, printed circuit boards) and segment
forecasts to 2024. http://www.grandviewresearch.com/industry-analysis/conductive-ink-
market. Published August 2016. Accessed Mar 14, 2017.
Janssen D, DePalma R, Verlaak S, Heremans P, Dehaen W. Static solvent contact angle
measurements, surface free energy and wettability determination of various self-
assembled monolayers on silicon dioxide. Thin Solid Films 2006;515:1433–1438.
Kipphan H. Handbook of Print Media: Technologies and Production Methods. Berlin;
Hong Kong: Springer-Verlag, 2001.
Kirby GH, Harris DJ, Li Q, Lewis JA. Poly (acrylic acid)–poly (ethylene oxide) comb
polymer effects on BaTiO3 nanoparticle suspension stability. J Am Ceram Soc.
2004;87(2):181–186.
Krieger IM, Dougherty TJ. A mechanism for non-Newtonian flow in suspensions of rigid
spheres. Trans. Soc. Rheol. 1959;3:137–152.
MEGlobal. Diethylene Glycol (DEG) Technical Product Brochure. Product Literature.
http://www.meglobal.biz/product-literature. Published September 12, 2013. Accessed
April 26, 2016.
NanoDimension. AgCite highly conductive silver ink for printed electronics.
http://www.nano-di.com/agcite-ink-brochure-download. Published October 2016.
Accessed Mar 14, 2017.
Novacentrix. Metalon® conductive inks for printed electronics.
http://www.novacentrix.com/sites/default/files/pdf/Metalon%20JS-A101%20JS-
A102.pdf. Published May 2016. Accessed Mar 14, 2017.
Owens DK, Wendt R. Estimation of the surface free energy of polymers. J Appl Polym
Sci. 1969;13(8):1741–1747.
Park J, Moon J. Control of colloidal particle deposit patterns within picoliter droplets
ejected by ink-jet printing. Langmuir 2006;22(8):3506–3513.
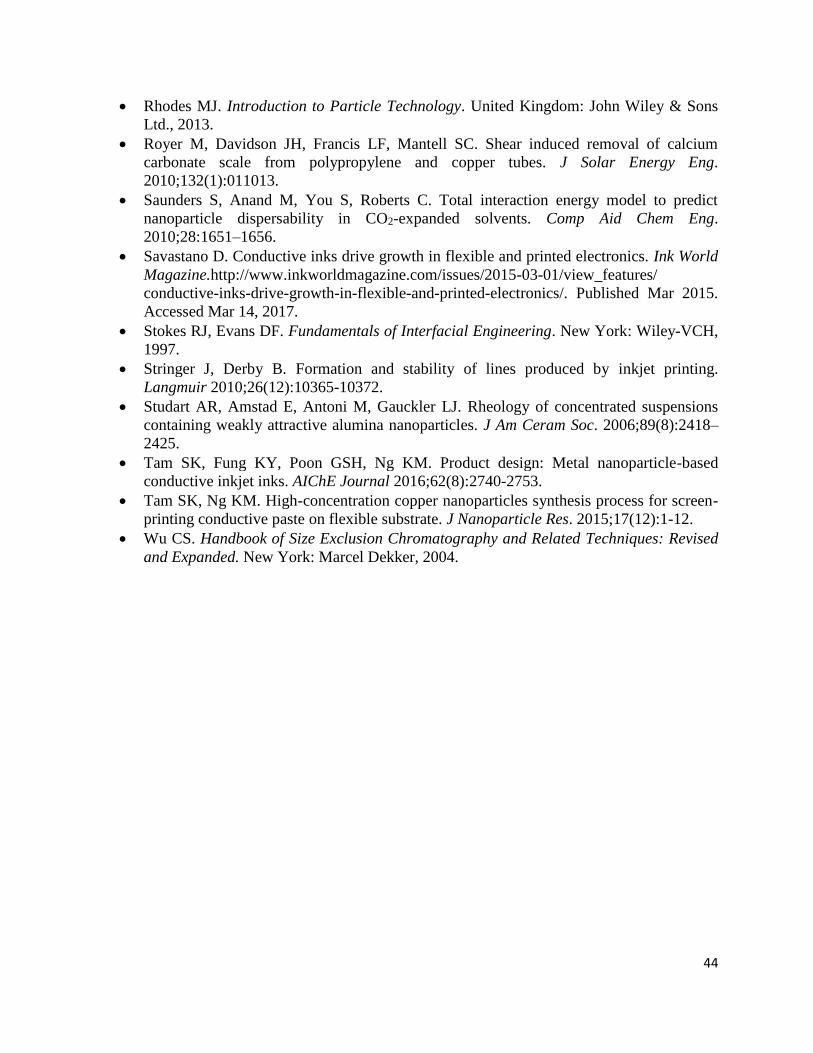
44
Rhodes MJ. Introduction to Particle Technology. United Kingdom: John Wiley & Sons
Ltd., 2013.
Royer M, Davidson JH, Francis LF, Mantell SC. Shear induced removal of calcium
carbonate scale from polypropylene and copper tubes. J Solar Energy Eng.
2010;132(1):011013.
Saunders S, Anand M, You S, Roberts C. Total interaction energy model to predict
nanoparticle dispersability in CO2-expanded solvents. Comp Aid Chem Eng.
2010;28:1651–1656.
Savastano D. Conductive inks drive growth in flexible and printed electronics. Ink World
Magazine.http://www.inkworldmagazine.com/issues/2015-03-01/view_features/
conductive-inks-drive-growth-in-flexible-and-printed-electronics/. Published Mar 2015.
Accessed Mar 14, 2017.
Stokes RJ, Evans DF. Fundamentals of Interfacial Engineering. New York: Wiley-VCH,
1997.
Stringer J, Derby B. Formation and stability of lines produced by inkjet printing.
Langmuir 2010;26(12):10365-10372.
Studart AR, Amstad E, Antoni M, Gauckler LJ. Rheology of concentrated suspensions
containing weakly attractive alumina nanoparticles. J Am Ceram Soc. 2006;89(8):2418–
2425.
Tam SK, Fung KY, Poon GSH, Ng KM. Product design: Metal nanoparticle-based
conductive inkjet inks. AIChE Journal 2016;62(8):2740-2753.
Tam SK, Ng KM. High-concentration copper nanoparticles synthesis process for screen-
printing conductive paste on flexible substrate. J Nanoparticle Res. 2015;17(12):1-12.
Wu CS. Handbook of Size Exclusion Chromatography and Related Techniques: Revised
and Expanded. New York: Marcel Dekker, 2004.
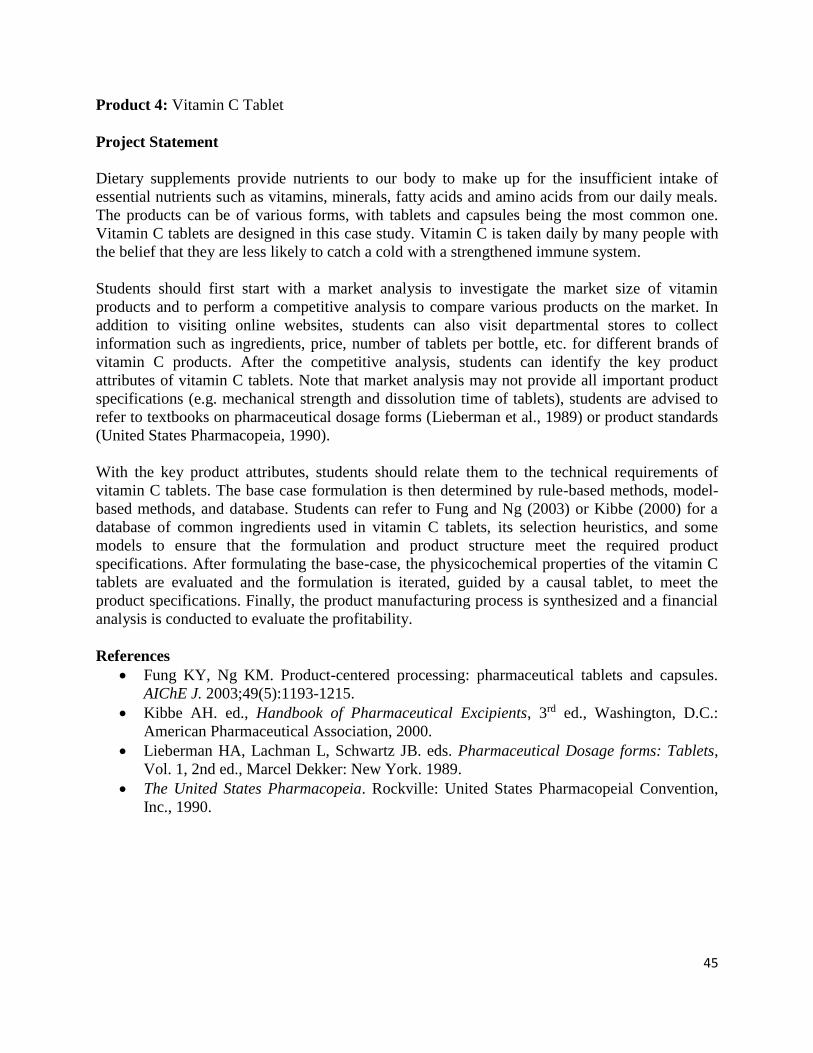
45
Product 4: Vitamin C Tablet
Project Statement
Dietary supplements provide nutrients to our body to make up for the insufficient intake of
essential nutrients such as vitamins, minerals, fatty acids and amino acids from our daily meals.
The products can be of various forms, with tablets and capsules being the most common one.
Vitamin C tablets are designed in this case study. Vitamin C is taken daily by many people with
the belief that they are less likely to catch a cold with a strengthened immune system.
Students should first start with a market analysis to investigate the market size of vitamin
products and to perform a competitive analysis to compare various products on the market. In
addition to visiting online websites, students can also visit departmental stores to collect
information such as ingredients, price, number of tablets per bottle, etc. for different brands of
vitamin C products. After the competitive analysis, students can identify the key product
attributes of vitamin C tablets. Note that market analysis may not provide all important product
specifications (e.g. mechanical strength and dissolution time of tablets), students are advised to
refer to textbooks on pharmaceutical dosage forms (Lieberman et al., 1989) or product standards
(United States Pharmacopeia, 1990).
With the key product attributes, students should relate them to the technical requirements of
vitamin C tablets. The base case formulation is then determined by rule-based methods, model-
based methods, and database. Students can refer to Fung and Ng (2003) or Kibbe (2000) for a
database of common ingredients used in vitamin C tablets, its selection heuristics, and some
models to ensure that the formulation and product structure meet the required product
specifications. After formulating the base-case, the physicochemical properties of the vitamin C
tablets are evaluated and the formulation is iterated, guided by a causal tablet, to meet the
product specifications. Finally, the product manufacturing process is synthesized and a financial
analysis is conducted to evaluate the profitability.
References
Fung KY, Ng KM. Product-centered processing: pharmaceutical tablets and capsules.
AIChE J. 2003;49(5):1193-1215.
Kibbe AH. ed., Handbook of Pharmaceutical Excipients, 3rd ed., Washington, D.C.:
American Pharmaceutical Association, 2000.
Lieberman HA, Lachman L, Schwartz JB. eds. Pharmaceutical Dosage forms: Tablets,
Vol. 1, 2nd ed., Marcel Dekker: New York. 1989.
The United States Pharmacopeia. Rockville: United States Pharmacopeial Convention,
Inc., 1990.
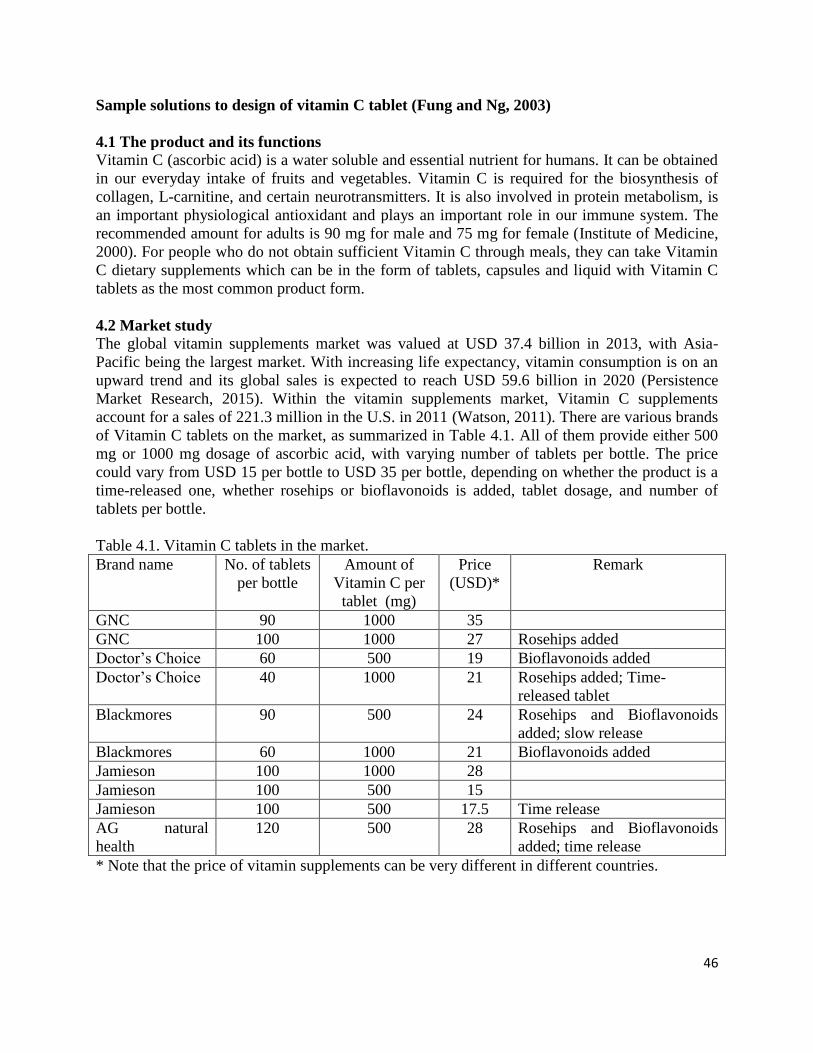
46
Sample solutions to design of vitamin C tablet (Fung and Ng, 2003)
4.1 The product and its functions
Vitamin C (ascorbic acid) is a water soluble and essential nutrient for humans. It can be obtained
in our everyday intake of fruits and vegetables. Vitamin C is required for the biosynthesis of
collagen, L-carnitine, and certain neurotransmitters. It is also involved in protein metabolism, is
an important physiological antioxidant and plays an important role in our immune system. The
recommended amount for adults is 90 mg for male and 75 mg for female (Institute of Medicine,
2000). For people who do not obtain sufficient Vitamin C through meals, they can take Vitamin
C dietary supplements which can be in the form of tablets, capsules and liquid with Vitamin C
tablets as the most common product form.
4.2 Market study
The global vitamin supplements market was valued at USD 37.4 billion in 2013, with Asia-
Pacific being the largest market. With increasing life expectancy, vitamin consumption is on an
upward trend and its global sales is expected to reach USD 59.6 billion in 2020 (Persistence
Market Research, 2015). Within the vitamin supplements market, Vitamin C supplements
account for a sales of 221.3 million in the U.S. in 2011 (Watson, 2011). There are various brands
of Vitamin C tablets on the market, as summarized in Table 4.1. All of them provide either 500
mg or 1000 mg dosage of ascorbic acid, with varying number of tablets per bottle. The price
could vary from USD 15 per bottle to USD 35 per bottle, depending on whether the product is a
time-released one, whether rosehips or bioflavonoids is added, tablet dosage, and number of
tablets per bottle.
Table 4.1. Vitamin C tablets in the market.
Brand name No. of tablets
per bottle
Amount of
Vitamin C per
tablet (mg)
Price
(USD)*
Remark
GNC 90 1000 35
GNC 100 1000 27 Rosehips added
Doctor’s Choice 60 500 19 Bioflavonoids added
Doctor’s Choice 40 1000 21 Rosehips added; Time-
released tablet
Blackmores 90 500 24 Rosehips and Bioflavonoids
added; slow release
Blackmores 60 1000 21 Bioflavonoids added
Jamieson 100 1000 28
Jamieson 100 500 15
Jamieson 100 500 17.5 Time release
AG natural
health
120 500 28 Rosehips and Bioflavonoids
added; time release
* Note that the price of vitamin supplements can be very different in different countries.
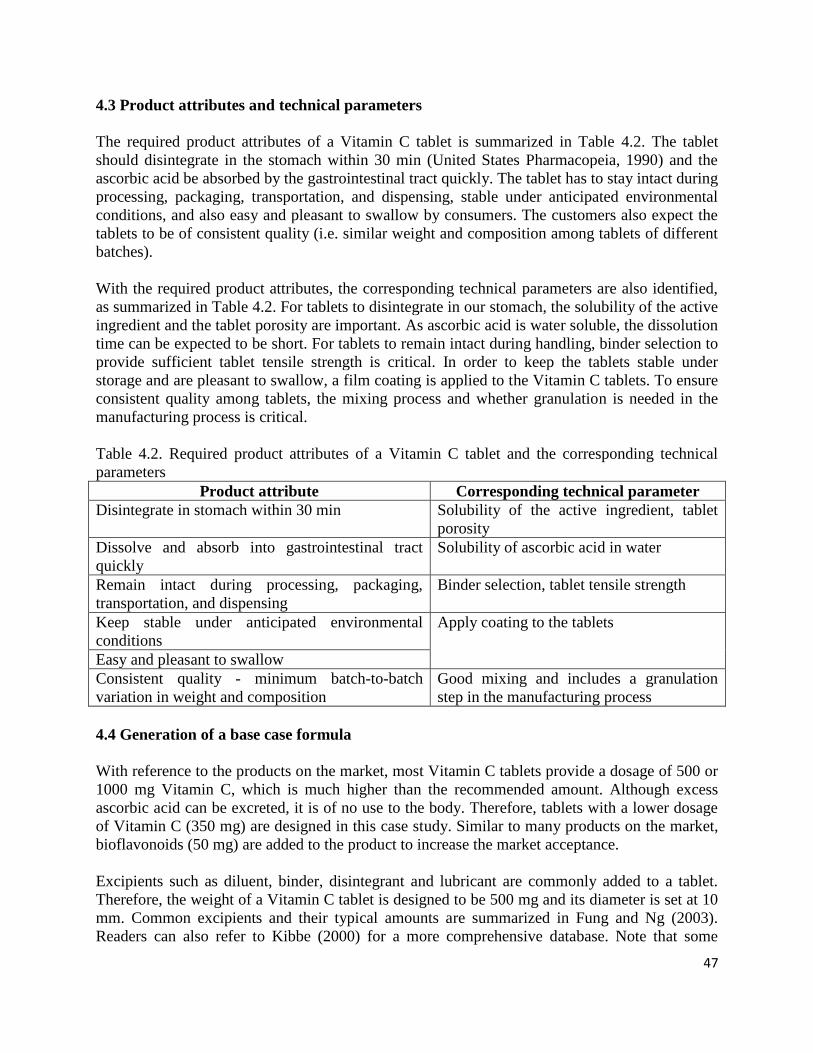
47
4.3 Product attributes and technical parameters
The required product attributes of a Vitamin C tablet is summarized in Table 4.2. The tablet
should disintegrate in the stomach within 30 min (United States Pharmacopeia, 1990) and the
ascorbic acid be absorbed by the gastrointestinal tract quickly. The tablet has to stay intact during
processing, packaging, transportation, and dispensing, stable under anticipated environmental
conditions, and also easy and pleasant to swallow by consumers. The customers also expect the
tablets to be of consistent quality (i.e. similar weight and composition among tablets of different
batches).
With the required product attributes, the corresponding technical parameters are also identified,
as summarized in Table 4.2. For tablets to disintegrate in our stomach, the solubility of the active
ingredient and the tablet porosity are important. As ascorbic acid is water soluble, the dissolution
time can be expected to be short. For tablets to remain intact during handling, binder selection to
provide sufficient tablet tensile strength is critical. In order to keep the tablets stable under
storage and are pleasant to swallow, a film coating is applied to the Vitamin C tablets. To ensure
consistent quality among tablets, the mixing process and whether granulation is needed in the
manufacturing process is critical.
Table 4.2. Required product attributes of a Vitamin C tablet and the corresponding technical
parameters
Product attribute Corresponding technical parameter
Disintegrate in stomach within 30 min Solubility of the active ingredient, tablet
porosity
Dissolve and absorb into gastrointestinal tract
quickly
Solubility of ascorbic acid in water
Remain intact during processing, packaging,
transportation, and dispensing
Binder selection, tablet tensile strength
Keep stable under anticipated environmental
conditions
Apply coating to the tablets
Easy and pleasant to swallow
Consistent quality - minimum batch-to-batch
variation in weight and composition
Good mixing and includes a granulation
step in the manufacturing process
4.4 Generation of a base case formula
With reference to the products on the market, most Vitamin C tablets provide a dosage of 500 or
1000 mg Vitamin C, which is much higher than the recommended amount. Although excess
ascorbic acid can be excreted, it is of no use to the body. Therefore, tablets with a lower dosage
of Vitamin C (350 mg) are designed in this case study. Similar to many products on the market,
bioflavonoids (50 mg) are added to the product to increase the market acceptance.
Excipients such as diluent, binder, disintegrant and lubricant are commonly added to a tablet.
Therefore, the weight of a Vitamin C tablet is designed to be 500 mg and its diameter is set at 10
mm. Common excipients and their typical amounts are summarized in Fung and Ng (2003).
Readers can also refer to Kibbe (2000) for a more comprehensive database. Note that some
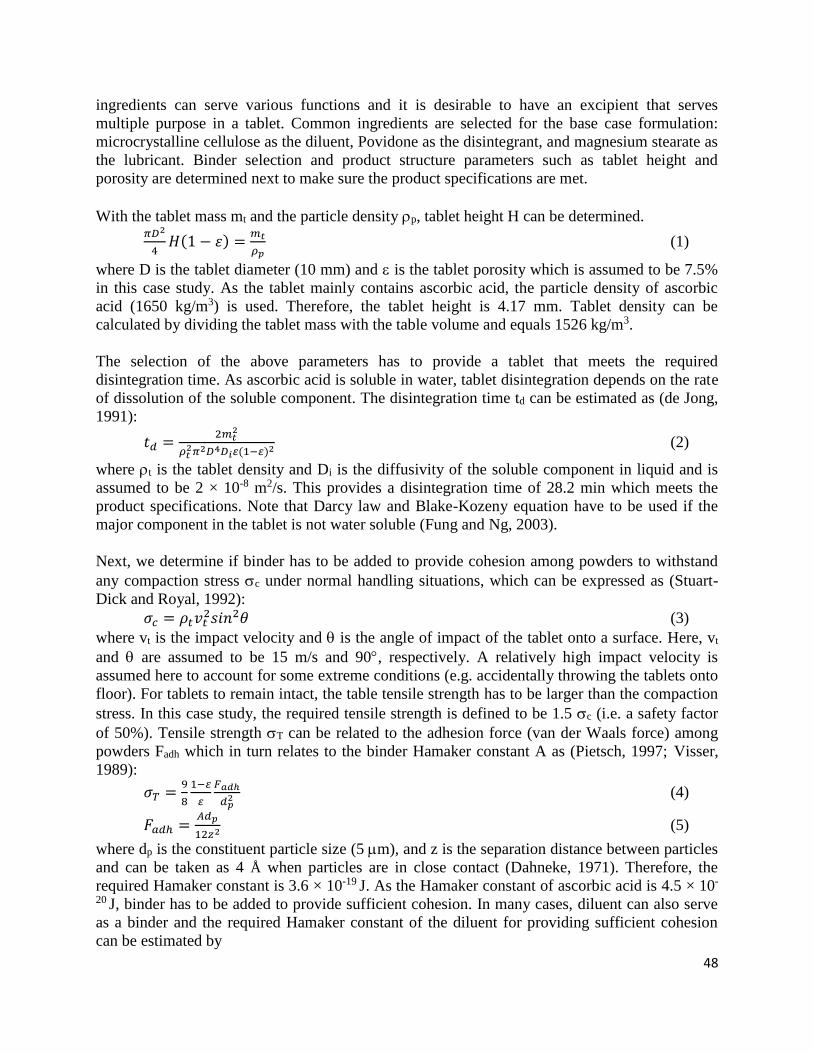
48
ingredients can serve various functions and it is desirable to have an excipient that serves
multiple purpose in a tablet. Common ingredients are selected for the base case formulation:
microcrystalline cellulose as the diluent, Povidone as the disintegrant, and magnesium stearate as
the lubricant. Binder selection and product structure parameters such as tablet height and
porosity are determined next to make sure the product specifications are met.
With the tablet mass mt and the particle density p, tablet height H can be determined.
𝜋𝐷2
4𝐻(1 − 𝜀) =
𝑚𝑡
𝜌𝑝 (1)
where D is the tablet diameter (10 mm) and is the tablet porosity which is assumed to be 7.5%
in this case study. As the tablet mainly contains ascorbic acid, the particle density of ascorbic
acid (1650 kg/m3) is used. Therefore, the tablet height is 4.17 mm. Tablet density can be
calculated by dividing the tablet mass with the table volume and equals 1526 kg/m3.
The selection of the above parameters has to provide a tablet that meets the required
disintegration time. As ascorbic acid is soluble in water, tablet disintegration depends on the rate
of dissolution of the soluble component. The disintegration time td can be estimated as (de Jong,
1991):
𝑡𝑑 =2𝑚𝑡
2
𝜌𝑡2𝜋2𝐷4𝐷𝑖 (1− )2 (2)
where t is the tablet density and Di is the diffusivity of the soluble component in liquid and is
assumed to be 2 × 10⁻⁸ m2/s. This provides a disintegration time of 28.2 min which meets the
product specifications. Note that Darcy law and Blake-Kozeny equation have to be used if the
major component in the tablet is not water soluble (Fung and Ng, 2003).
Next, we determine if binder has to be added to provide cohesion among powders to withstand
any compaction stress c under normal handling situations, which can be expressed as (Stuart-
Dick and Royal, 1992):
𝜎𝑐 = 𝜌𝑡𝑣𝑡2𝑠𝑖𝑛2𝜃 (3)
where vt is the impact velocity and is the angle of impact of the tablet onto a surface. Here, vt
and are assumed to be 15 m/s and 90, respectively. A relatively high impact velocity is
assumed here to account for some extreme conditions (e.g. accidentally throwing the tablets onto
floor). For tablets to remain intact, the table tensile strength has to be larger than the compaction
stress. In this case study, the required tensile strength is defined to be 1.5 c (i.e. a safety factor
of 50%). Tensile strength T can be related to the adhesion force (van der Waals force) among
powders Fadh which in turn relates to the binder Hamaker constant A as (Pietsch, 1997; Visser,
1989):
𝜎𝑇 =9
8
1− 𝐹𝑎𝑑ℎ
𝑑𝑝2 (4)
𝐹𝑎𝑑ℎ =𝐴𝑑𝑝
12𝑧2 (5)
where dp is the constituent particle size (5 m), and z is the separation distance between particles
and can be taken as 4 Å when particles are in close contact (Dahneke, 1971). Therefore, the
required Hamaker constant is 3.6 × 10⁻¹⁹ J. As the Hamaker constant of ascorbic acid is 4.5 × 10-
20 J, binder has to be added to provide sufficient cohesion. In many cases, diluent can also serve
as a binder and the required Hamaker constant of the diluent for providing sufficient cohesion
can be estimated by
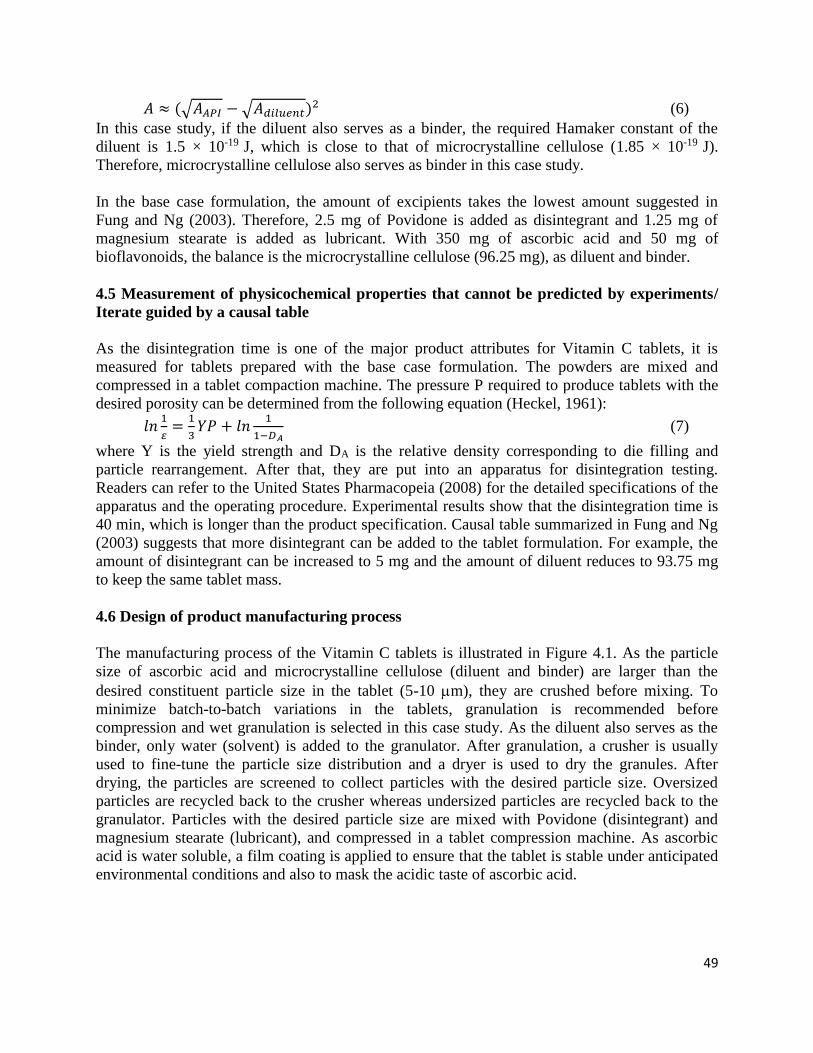
49
𝐴 ≈ (√𝐴𝐴𝑃𝐼 − √𝐴𝑑𝑖𝑙𝑢𝑒𝑛𝑡)2 (6)
In this case study, if the diluent also serves as a binder, the required Hamaker constant of the
diluent is 1.5 × 10⁻¹⁹ J, which is close to that of microcrystalline cellulose (1.85 × 10⁻¹⁹
J).
Therefore, microcrystalline cellulose also serves as binder in this case study.
In the base case formulation, the amount of excipients takes the lowest amount suggested in
Fung and Ng (2003). Therefore, 2.5 mg of Povidone is added as disintegrant and 1.25 mg of
magnesium stearate is added as lubricant. With 350 mg of ascorbic acid and 50 mg of
bioflavonoids, the balance is the microcrystalline cellulose (96.25 mg), as diluent and binder.
4.5 Measurement of physicochemical properties that cannot be predicted by experiments/
Iterate guided by a causal table
As the disintegration time is one of the major product attributes for Vitamin C tablets, it is
measured for tablets prepared with the base case formulation. The powders are mixed and
compressed in a tablet compaction machine. The pressure P required to produce tablets with the
desired porosity can be determined from the following equation (Heckel, 1961):
𝑙𝑛1
=1
3𝑌𝑃 + 𝑙𝑛
1
1−𝐷𝐴 (7)
where Y is the yield strength and DA is the relative density corresponding to die filling and
particle rearrangement. After that, they are put into an apparatus for disintegration testing.
Readers can refer to the United States Pharmacopeia (2008) for the detailed specifications of the
apparatus and the operating procedure. Experimental results show that the disintegration time is
40 min, which is longer than the product specification. Causal table summarized in Fung and Ng
(2003) suggests that more disintegrant can be added to the tablet formulation. For example, the
amount of disintegrant can be increased to 5 mg and the amount of diluent reduces to 93.75 mg
to keep the same tablet mass.
4.6 Design of product manufacturing process
The manufacturing process of the Vitamin C tablets is illustrated in Figure 4.1. As the particle
size of ascorbic acid and microcrystalline cellulose (diluent and binder) are larger than the
desired constituent particle size in the tablet (5-10 m), they are crushed before mixing. To
minimize batch-to-batch variations in the tablets, granulation is recommended before
compression and wet granulation is selected in this case study. As the diluent also serves as the
binder, only water (solvent) is added to the granulator. After granulation, a crusher is usually
used to fine-tune the particle size distribution and a dryer is used to dry the granules. After
drying, the particles are screened to collect particles with the desired particle size. Oversized
particles are recycled back to the crusher whereas undersized particles are recycled back to the
granulator. Particles with the desired particle size are mixed with Povidone (disintegrant) and
magnesium stearate (lubricant), and compressed in a tablet compression machine. As ascorbic
acid is water soluble, a film coating is applied to ensure that the tablet is stable under anticipated
environmental conditions and also to mask the acidic taste of ascorbic acid.
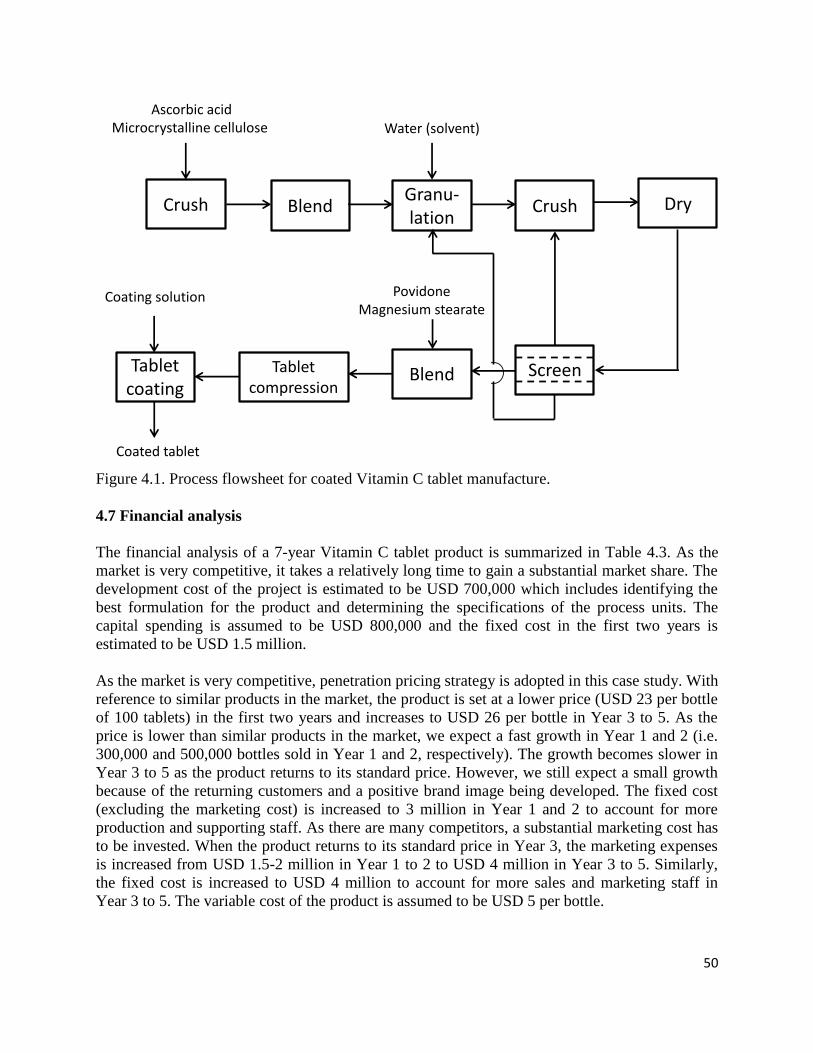
50
Figure 4.1. Process flowsheet for coated Vitamin C tablet manufacture.
4.7 Financial analysis
The financial analysis of a 7-year Vitamin C tablet product is summarized in Table 4.3. As the
market is very competitive, it takes a relatively long time to gain a substantial market share. The
development cost of the project is estimated to be USD 700,000 which includes identifying the
best formulation for the product and determining the specifications of the process units. The
capital spending is assumed to be USD 800,000 and the fixed cost in the first two years is
estimated to be USD 1.5 million.
As the market is very competitive, penetration pricing strategy is adopted in this case study. With
reference to similar products in the market, the product is set at a lower price (USD 23 per bottle
of 100 tablets) in the first two years and increases to USD 26 per bottle in Year 3 to 5. As the
price is lower than similar products in the market, we expect a fast growth in Year 1 and 2 (i.e.
300,000 and 500,000 bottles sold in Year 1 and 2, respectively). The growth becomes slower in
Year 3 to 5 as the product returns to its standard price. However, we still expect a small growth
because of the returning customers and a positive brand image being developed. The fixed cost
(excluding the marketing cost) is increased to 3 million in Year 1 and 2 to account for more
production and supporting staff. As there are many competitors, a substantial marketing cost has
to be invested. When the product returns to its standard price in Year 3, the marketing expenses
is increased from USD 1.5-2 million in Year 1 to 2 to USD 4 million in Year 3 to 5. Similarly,
the fixed cost is increased to USD 4 million to account for more sales and marketing staff in
Year 3 to 5. The variable cost of the product is assumed to be USD 5 per bottle.
Crush
Ascorbic acidMicrocrystalline cellulose
BlendGranu-lation
Water (solvent)
Crush Dry
ScreenBlend
PovidoneMagnesium stearate
Tablet compression
Tablet coating
Coating solution
Coated tablet
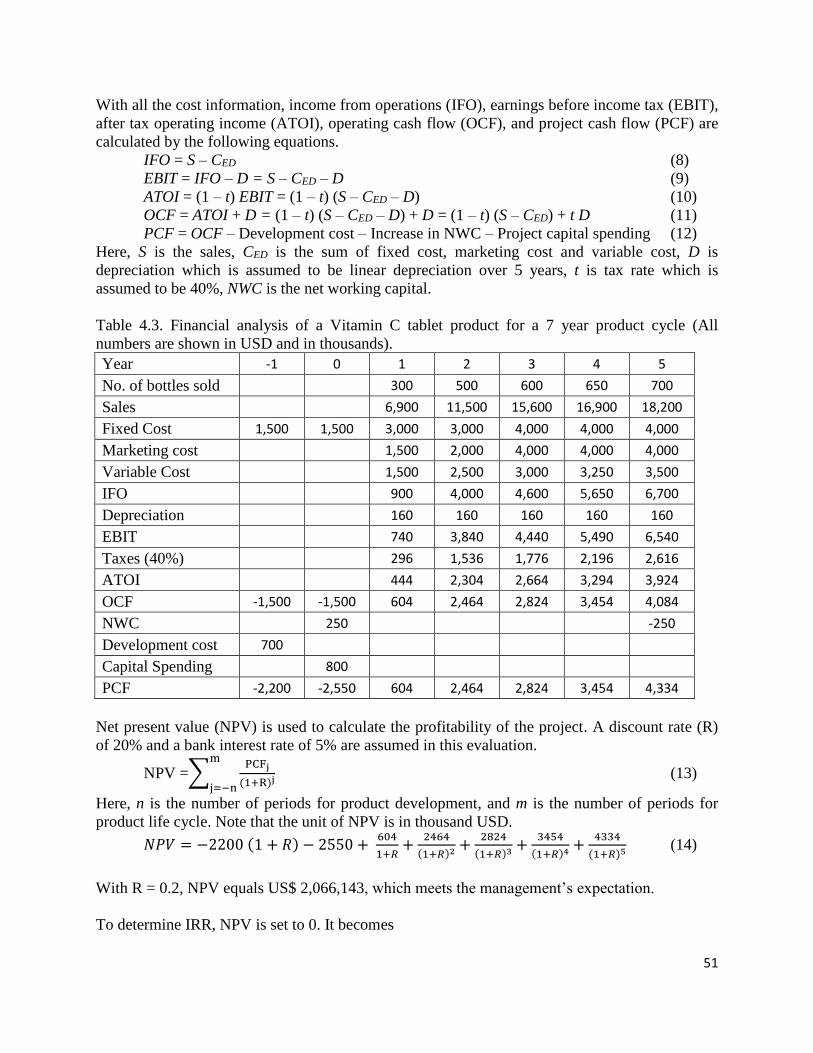
51
With all the cost information, income from operations (IFO), earnings before income tax (EBIT),
after tax operating income (ATOI), operating cash flow (OCF), and project cash flow (PCF) are
calculated by the following equations.
IFO = S – CED (8)
EBIT = IFO – D = S – CED – D (9)
ATOI = (1 – t) EBIT = (1 – t) (S – CED – D) (10)
OCF = ATOI + D = (1 – t) (S – CED – D) + D = (1 – t) (S – CED) + t D (11)
PCF = OCF – Development cost – Increase in NWC – Project capital spending (12)
Here, S is the sales, CED is the sum of fixed cost, marketing cost and variable cost, D is
depreciation which is assumed to be linear depreciation over 5 years, t is tax rate which is
assumed to be 40%, NWC is the net working capital.
Table 4.3. Financial analysis of a Vitamin C tablet product for a 7 year product cycle (All
numbers are shown in USD and in thousands).
Year -1 0 1 2 3 4 5
No. of bottles sold
300 500 600 650 700
Sales
6,900 11,500 15,600 16,900 18,200
Fixed Cost 1,500 1,500 3,000 3,000 4,000 4,000 4,000
Marketing cost
1,500 2,000 4,000 4,000 4,000
Variable Cost
1,500 2,500 3,000 3,250 3,500
IFO
900 4,000 4,600 5,650 6,700
Depreciation
160 160 160 160 160
EBIT
740 3,840 4,440 5,490 6,540
Taxes (40%)
296 1,536 1,776 2,196 2,616
ATOI
444 2,304 2,664 3,294 3,924
OCF -1,500 -1,500 604 2,464 2,824 3,454 4,084
NWC
250
-250
Development cost 700
Capital Spending
800
PCF -2,200 -2,550 604 2,464 2,824 3,454 4,334
Net present value (NPV) is used to calculate the profitability of the project. A discount rate (R)
of 20% and a bank interest rate of 5% are assumed in this evaluation.
NPV =∑PCFj
(1+R)j
m
j=−n (13)
Here, n is the number of periods for product development, and m is the number of periods for
product life cycle. Note that the unit of NPV is in thousand USD.
𝑁𝑃𝑉 = −2200 (1 + 𝑅) − 2550 + 604
1+𝑅+
2464
(1+𝑅)2+
2824
(1+𝑅)3+
3454
(1+𝑅)4+
4334
(1+𝑅)5 (14)
With R = 0.2, NPV equals US$ 2,066,143, which meets the management’s expectation.
To determine IRR, NPV is set to 0. It becomes
52
0 = −2200 (1 + 𝑅) − 2550 + 604
1+𝑅+
2464
(1+𝑅)2+
2824
(1+𝑅)3+
3454
(1+𝑅)4+
4334
(1+𝑅)5 (15)
Using Microsoft Excel to solve the above equation, IRR equals 31.1%, which is larger than the
bank interest rate of 5%. Therefore, the Vitamin C tablet project can be presented to the
management for approval.
4.8 References
Dahneke B. The capture of aerosol particles by surfaces. J. Colloid Interf. Sci.
1971;37:342.
de Jong JAH. Tablet properties as a function of the properties of granules made in a
fluidized bed process. Powder Technol. 1991;65:293.
Fung KY, Ng KM. Product-centered processing: pharmaceutical tablets and capsules.
AIChE J. 2003;49(5):1193-1215.
Heckel RW. Density-pressure relationships in powder compaction. Trans. Metal. Soc.
AIME. 1961;221:671.
Kibbe AH. ed., Handbook of Pharmaceutical Excipients, 3rd ed., Washington, D.C.:
American Pharmaceutical Association, 2000.
Institute of Medicine. Dietary Reference Intakes for Vitamin C, Vitamin E, Selenium, and
Carotenoids. Washington, DC: National Academy Press, 2000.
Persistence Market Research. Global vitamin supplements market will reach US$59.6
billion by 2020. http://www.persistencemarketresearch.com/mediarelease/global-
vitamins-supplements-market.asp. Published on Feb 19 2015. Accessed on May 22 2017.
Pietsch W. Granulate dry particulate solids by compaction and retain key powder particle
properties. Chem. Eng. Prog. 1997;93(4):24.
Stuart-Dick D, Royal TA. Design principles for chutes to handle bulk solids. Bulk Solids
Handling 1992;12:447.
The United States Pharmacopeia. Rockville: United States Pharmacopeial Convention,
Inc., 1990.
The United States Pharmacopeia. Disintegration. http://www.usp.org/sites/default/files/
usp_pdf/EN/USPNF/generalChapter701.pdf. Published on Aug 1 2008. Accessed on May
12 2017.
Visser J, An invited review: Van der Waals and other cohesive forces affecting powder
fluidization. Powder Technol. 1989;58:1.
Watson E. Vitamin C supplement sales edge up 2.8% in year to October 1.
http://www.nutraingredients-usa.com/Suppliers2/Vitamin-C-supplement-sales-edge-up-
2.8-in-year-to-October-1. Published on Nov 25 2011. Accessed on May 11 2017.