
Bile pigment excretion - The Journal of Clinical Investigation
CHAPTER
TWO
IDENTIFICATION OF COLORED-MASTERBATCHPROCESS-PARAMETER WITH GREATER
INFLUENCE ON PIGMENT DISPERSION ANDCOLOR PERCEPTION
F. Benetti, M. Buccella, A. Caciagli, N. Cozza, F. Deirmina, D.M.S. Sultan,
G. Giusti, E. Schneider, S. Tondini
Abstract
Aquafil S.p.A. has been one of the leading players in the production ofNylon 6. Over 60% of its total production is composed by the so calledsolution dyed industrial yarns. The fibers are colored through a mass pig-mentation process by the addition of Color Masterbatch during the meltspinning. From the industrial point of view, the most important problemfor the Color Masterbatch production is to maximize the tinting strengthof the color pigment. This have to be achieved by optimizing the fillers dis-persion into the polymer bulk without using the dispersing additives, thatcan show detrimental effect during melt spinning. The dispersion degree ofthe pigments is the key point of the masterbatch production process andit depends on the physical properties of pigment particles, on the processparameters involved during extrusion and on the pigment concentration incolor masterbatch. During IPSP2014, the Aquafil team of students and re-searchers worked on the realization of two models, one empirical and onetheoretical, that could reproduce and predict the tinting strength of theColor Masterbatches, starting from the production process parameters. Atthe end of the week, the two developed models were able to qualitativelyreproduce the experimental results measured on a set of MonoconcentratedColor Masterbatches, which were realized for this purpose by Aquafil duringthe event. Moreover, both models suggest that a critical production para-meter for the realization of masterbatches with optimized tinting strengthis the temperature profile of the extruder barrels.
21
22 CHAPTER 2. AQUAFIL TEAM
2.1 Introduction
Since 1969, Aquafil1 has been one of the leading players, both in Italy and glob-ally, in the production of Nylon 6: a landmark in terms of quality and productinnovation as, additionally, the Group is a leader in the research of new productionmodels for sustainable development. This commitment to research and develop-ment leads to the regular renewal of processes and products thanks to continuousinvestments of capital and knowledge.
The Group has a presence in seven countries on three continents with 14plants employing more than 2,200 people in Italy, Slovenia, Croatia, Germany,the United States, Thailand and China.
It operates through two product business units:
• BCF: production of filaments for textile floorings
• NTF: synthetic fibers used in the apparel and sports industries
Always committed to taking real measures to protect the environment, Aquafilestablished the Energy & Recycle business unit in 2008. This division is dedicatedto the promotion of the research activities and sustainable projects, for all theGroup’s activities. The mission of Aquafil is to be the leader in the productionof synthetic fibers, particularly Polyamide 6. To concentrate resources, ideas andinvestments on growth and excellence with the focus of environmental, social andcorporate sustainability.
2.1.1 Colored masterbatch production
Over 60% of the total production in Aquafil S.p.A. is composed by the so calledsolution dyed industrial yarns. The fibers are colored through a mass pigmenta-tion process by the addition of color masterbatch during the melt spinning. Theproduction of Color Masterbatch (CM) can be divided in two steps:
1. Production of Monoconcentrated Masterbatches (MM): they are obtainedintroducing one type of color pigment into the polymer matrix by an extru-sion process
2. Production of Color Masterbatches (CM): they are obtained by mixing dif-ferent kind of Monoconcentrated Masterbatches through an extrusion pro-cess, in order to reach the right color requested by the costumer.
Monoconcentrated Masterbatches are composite materials, also called concen-trates, obtained by a melt compounding process, with a high amount of pigment(5-50%wt.), higher than in the final products. Polymer matrix and one type ofcolor pigment are mixed by an extrusion process, in order to obtain a fine disper-sion of particles into the polymer. Monoconcentrated masterbatches are marketedin chips form and they are used in later production step for coloring plastic mater-ials. During extrusion two mixing phenomena occur: (i) dispersing mixing that
1Aquafil S.p.A. website: http://www.aquafil.com/
2.1. INTRODUCTION 23
breaks down the agglomerates in aggregates and primary particles and (ii) dis-tributive mixing that produces an homogeneous distribution of pigment inside thepolymeric matrix.
Color pigments used in plastic industry can be divided into two groups: in-organic and organic pigments. Their primary particles can have different shapes:cubes, platelets, needles or different irregular shapes. The primary particles of themost used pigments are composed by tiny molecular crystals, and show dimen-sions ranging from 20 to 500 nm. For this reason they are called nano colorants.Generally speaking, color pigments for plastic have to satisfy some requirements:(i) total insolubility in the polymer in which they are incorporated, (ii) easy dis-persion within the matrix, (iii) chemical stability under severe thermo-mechanicalprocessing conditions, (iv) compatibility with the other additives used, (v) nontox-icity and (vi) environmental friendliness. The most critical pigments to dispersein a polymer matrix are the organic ones and in particular the Copper Phthalo-cyanine Pigments (Blue and Green) and the Dioxazine Pigments (Violet). Thisis due to the high interface energy formed between pigment and polyamide thatthe system tends to reduce through flocculation.
2.1.2 Production process
In Aquafil S.p.A. the Monoconcentrated Masterbatches are produced through aco-rotating twin screw extruder because of its modular configurations that makesit flexible for adapting to changing tasks and material properties. The extrusionprocess is characterized by the properties of the extruder (i.e. power, L/D, thescrew geometry) and the variable parameters (i.e. screw speed, throughput rate,ampere absorption, pressure at spinneret, temperature profile) and the quality ofthe product are strongly depended on these process features.
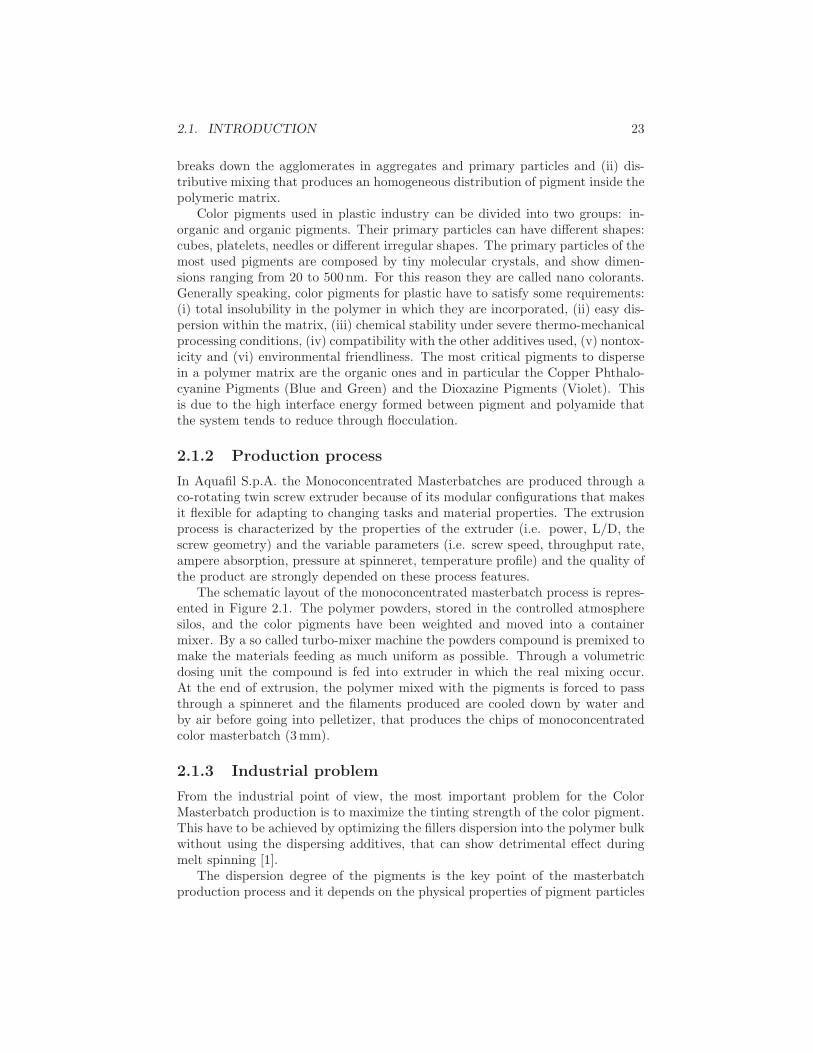
The schematic layout of the monoconcentrated masterbatch process is repres-ented in Figure 2.1. The polymer powders, stored in the controlled atmospheresilos, and the color pigments have been weighted and moved into a containermixer. By a so called turbo-mixer machine the powders compound is premixed tomake the materials feeding as much uniform as possible. Through a volumetricdosing unit the compound is fed into extruder in which the real mixing occur.At the end of extrusion, the polymer mixed with the pigments is forced to passthrough a spinneret and the filaments produced are cooled down by water andby air before going into pelletizer, that produces the chips of monoconcentratedcolor masterbatch (3mm).
2.1.3 Industrial problem
From the industrial point of view, the most important problem for the ColorMasterbatch production is to maximize the tinting strength of the color pigment.This have to be achieved by optimizing the fillers dispersion into the polymer bulkwithout using the dispersing additives, that can show detrimental effect duringmelt spinning [1].
The dispersion degree of the pigments is the key point of the masterbatchproduction process and it depends on the physical properties of pigment particles
24 CHAPTER 2. AQUAFIL TEAM
Figure 2.1: Schematic representation of monoconcentrated masterbatch production process.
(i.e. size, shape, surface properties, crystalline structure, chemical compositionof the primary crystals), on the process parameters involved during extrusion(i.e. screw speed, throughput rate, temperature profile) and on the pigmentconcentration in color masterbatch.
This problem shows an important industrial relevance because an improvementof the pigment dispersion allows to reduce the clogging phenomenon and the fil-ament breakage during melt spinning, thanks to the reduction in agglomerates’dimension. This results in an improvement of the productivity and the stabilityof the production process. Moreover, the reduction of the pigment agglomeratedimension leads to an increment of the light absorption. The consequent en-hancement of the pigment color strength allows to reduce the concentration ofthe monoconcentrated masterbatch and so to reduce the cost of production.
2.2 Experimental investigation
2.2.1 Samples production and characterization
Samples production
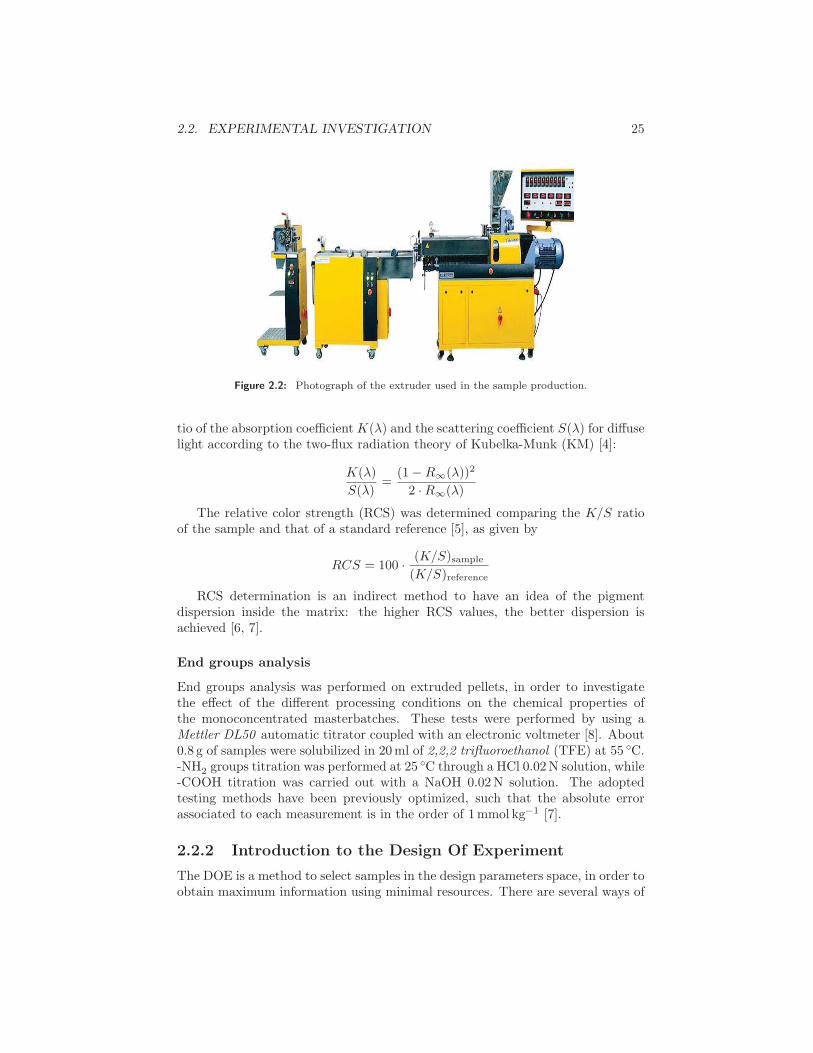
The samples were produced by using a lab scale extruder, in order to be ableto control and change all parameters during the production. In Figure 2.2 thepicture of the adopted LabTech extruder is reported.
The monoconcentrated masterbatch were obtained using different parametersin order to find the right combination that allows an increase in the color strengthof the final product. The algorithm used to find the appropriate set of parametersfor the trials is explained in detail in section 2.2.3. As a quick reference, theinterested reader can find this set in Table 2.1.
Color strength evaluation
The color strength identifies the property of a pigment to impart color to a sub-strate under specific processing conditions [2, 3]. The reflectance curves of sampleswere determined through a Hunterlab R© Colorquest XE Spectrophotometer. Themeasured reflectance of an optically infinite thick layer R∞(λ) is related to the ra-
2.2. EXPERIMENTAL INVESTIGATION 25
Figure 2.2: Photograph of the extruder used in the sample production.
tio of the absorption coefficient K(λ) and the scattering coefficient S(λ) for diffuselight according to the two-flux radiation theory of Kubelka-Munk (KM) [4]:
K(λ)
S(λ)=
(1−R∞(λ))2
2 ·R∞(λ)
The relative color strength (RCS) was determined comparing the K/S ratioof the sample and that of a standard reference [5], as given by
RCS = 100 · (K/S)sample
(K/S)reference
RCS determination is an indirect method to have an idea of the pigmentdispersion inside the matrix: the higher RCS values, the better dispersion isachieved [6, 7].
End groups analysis
End groups analysis was performed on extruded pellets, in order to investigatethe effect of the different processing conditions on the chemical properties ofthe monoconcentrated masterbatches. These tests were performed by using aMettler DL50 automatic titrator coupled with an electronic voltmeter [8]. About0.8 g of samples were solubilized in 20ml of 2,2,2 trifluoroethanol (TFE) at 55 ◦C.-NH2 groups titration was performed at 25 ◦C through a HCl 0.02N solution, while-COOH titration was carried out with a NaOH 0.02N solution. The adoptedtesting methods have been previously optimized, such that the absolute errorassociated to each measurement is in the order of 1mmol kg−1 [7].
2.2.2 Introduction to the Design Of Experiment
The DOE is a method to select samples in the design parameters space, in order toobtain maximum information using minimal resources. There are several ways of
26 CHAPTER 2. AQUAFIL TEAM
choosing an optimal sample arrangement, from which different informations canbe retreived [9]. The statistical approach to experimental design is the preferredone when meaningful conclusions have to be derived from the collected data evenif those are subject to errors and/or randomness of the input values.
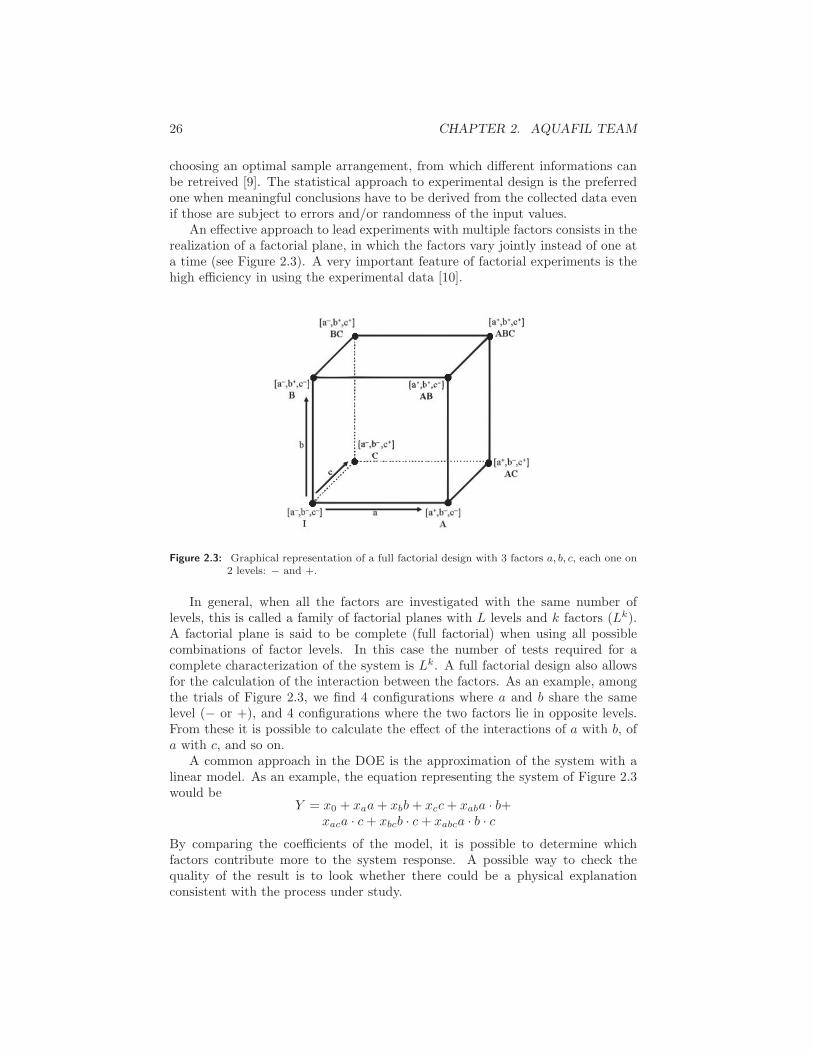
An effective approach to lead experiments with multiple factors consists in therealization of a factorial plane, in which the factors vary jointly instead of one ata time (see Figure 2.3). A very important feature of factorial experiments is thehigh efficiency in using the experimental data [10].
Figure 2.3: Graphical representation of a full factorial design with 3 factors a, b, c, each one on2 levels: − and +.
In general, when all the factors are investigated with the same number oflevels, this is called a family of factorial planes with L levels and k factors (Lk).A factorial plane is said to be complete (full factorial) when using all possiblecombinations of factor levels. In this case the number of tests required for acomplete characterization of the system is Lk. A full factorial design also allowsfor the calculation of the interaction between the factors. As an example, amongthe trials of Figure 2.3, we find 4 configurations where a and b share the samelevel (− or +), and 4 configurations where the two factors lie in opposite levels.From these it is possible to calculate the effect of the interactions of a with b, ofa with c, and so on.
A common approach in the DOE is the approximation of the system with alinear model. As an example, the equation representing the system of Figure 2.3would be
Y = x0 + xaa+ xbb+ xcc+ xaba · b+xaca · c+ xbcb · c+ xabca · b · c
By comparing the coefficients of the model, it is possible to determine whichfactors contribute more to the system response. A possible way to check thequality of the result is to look whether there could be a physical explanationconsistent with the process under study.
2.2. EXPERIMENTAL INVESTIGATION 27
When the number of involved factors increases, the number of points growsexponentially and the number of trials may not be sustainable. In such cases, itcan be helpful to use a fractional factorial design [11]. To this regard, Taguchi[12] proposed an improved DOE that simplifies and standardizes the factorial andfractional factorial designs so that the conducted experiments can produce moreconsistent results. The major contribution of the work has been in developing andusing a special set of orthogonal arrays for designing experiments. Orthogonalarrays are a set of tables of numbers, each of which can be used to lay outexperiments for a number of experimental situations. Through the orthogonalarrays, it is possible to carry out fewer fractional factorial experiments than fullfactorial experiments. Also, the relative influence of factors and interactions onthe variation of results can be identified. Through fractional factorial experiments,optimal conditions can be determined by analyzing the relative color strength(RCS) as a performance measure, employing different Statistically Process Controltools (SPC) [13]. The details of this investigation has presented in the followingsubsections.
2.2.3 Sample selection strategy
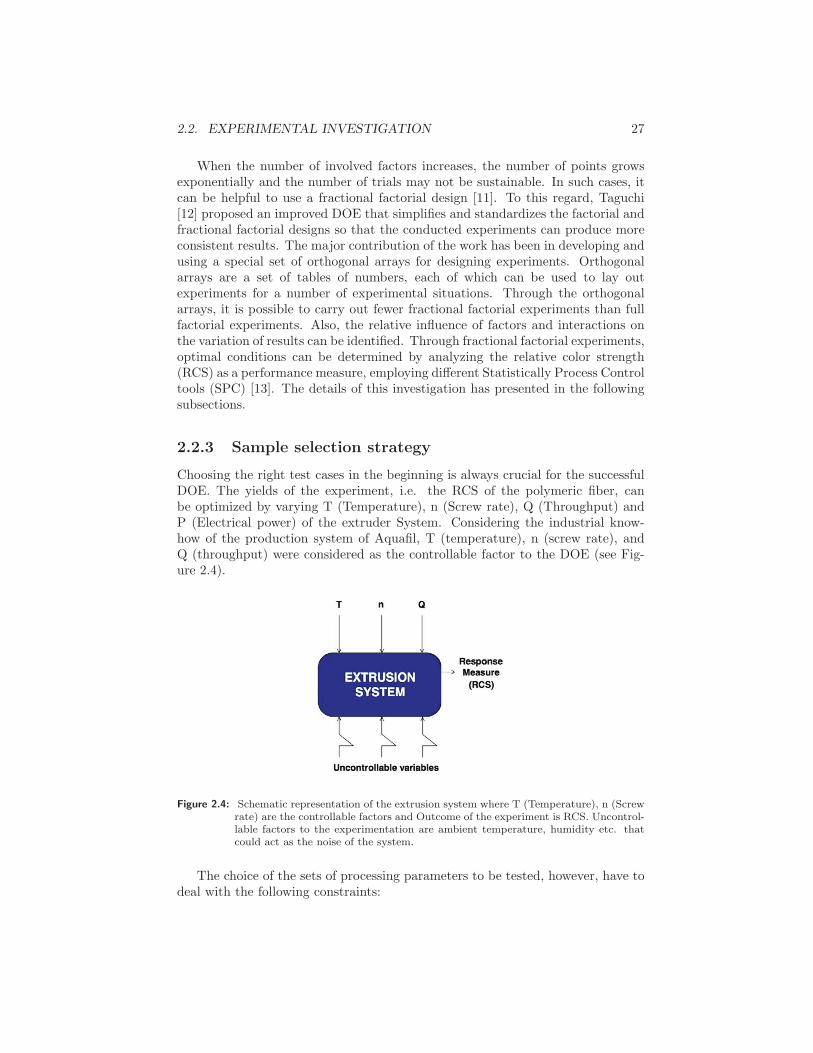
Choosing the right test cases in the beginning is always crucial for the successfulDOE. The yields of the experiment, i.e. the RCS of the polymeric fiber, canbe optimized by varying T (Temperature), n (Screw rate), Q (Throughput) andP (Electrical power) of the extruder System. Considering the industrial know-how of the production system of Aquafil, T (temperature), n (screw rate), andQ (throughput) were considered as the controllable factor to the DOE (see Fig-ure 2.4).
Figure 2.4: Schematic representation of the extrusion system where T (Temperature), n (Screwrate) are the controllable factors and Outcome of the experiment is RCS. Uncontrol-lable factors to the experimentation are ambient temperature, humidity etc. thatcould act as the noise of the system.
The choice of the sets of processing parameters to be tested, however, have todeal with the following constraints:
28 CHAPTER 2. AQUAFIL TEAM
• not feasibility of some parameters configuration in terms of outcoming product;
• inclusion of the standard working condition into the trials to be performed;
• no more than 8 measurements.
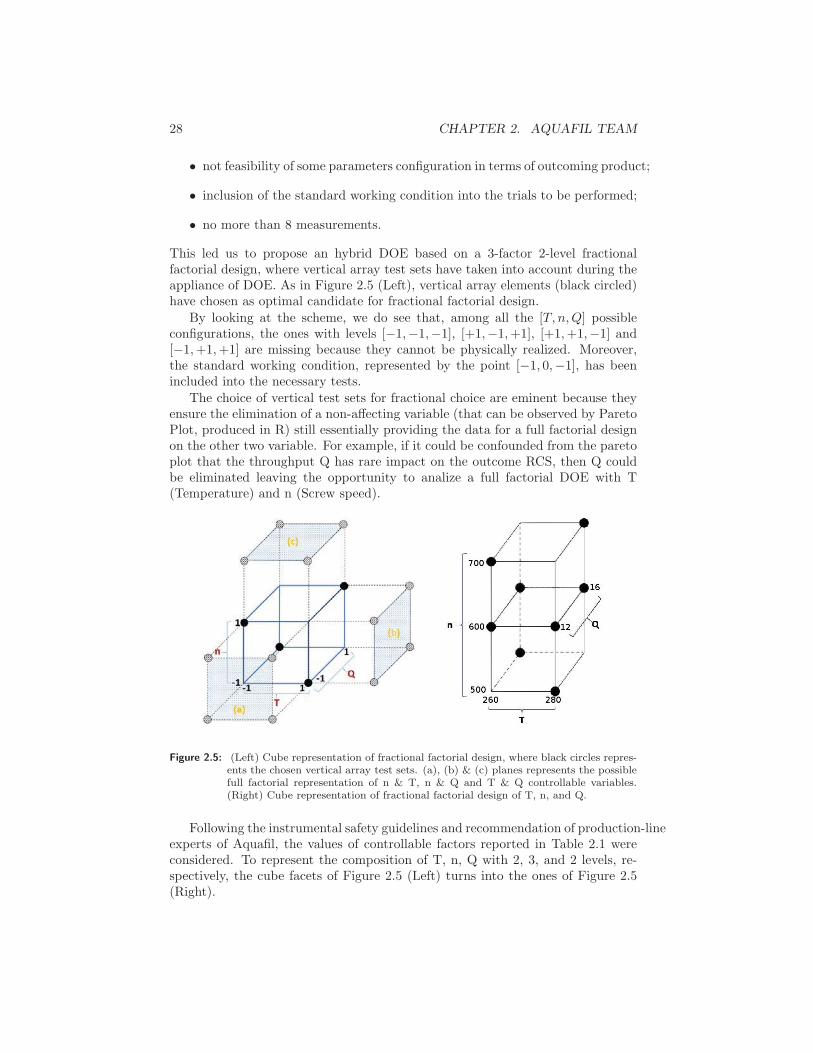
This led us to propose an hybrid DOE based on a 3-factor 2-level fractionalfactorial design, where vertical array test sets have taken into account during theappliance of DOE. As in Figure 2.5 (Left), vertical array elements (black circled)have chosen as optimal candidate for fractional factorial design.
By looking at the scheme, we do see that, among all the [T, n,Q] possibleconfigurations, the ones with levels [−1,−1,−1], [+1,−1,+1], [+1,+1,−1] and[−1,+1,+1] are missing because they cannot be physically realized. Moreover,the standard working condition, represented by the point [−1, 0,−1], has beenincluded into the necessary tests.
The choice of vertical test sets for fractional choice are eminent because theyensure the elimination of a non-affecting variable (that can be observed by ParetoPlot, produced in R) still essentially providing the data for a full factorial designon the other two variable. For example, if it could be confounded from the paretoplot that the throughput Q has rare impact on the outcome RCS, then Q couldbe eliminated leaving the opportunity to analize a full factorial DOE with T(Temperature) and n (Screw speed).
Figure 2.5: (Left) Cube representation of fractional factorial design, where black circles repres-ents the chosen vertical array test sets. (a), (b) & (c) planes represents the possiblefull factorial representation of n & T, n & Q and T & Q controllable variables.(Right) Cube representation of fractional factorial design of T, n, and Q.
Following the instrumental safety guidelines and recommendation of production-lineexperts of Aquafil, the values of controllable factors reported in Table 2.1 wereconsidered. To represent the composition of T, n, Q with 2, 3, and 2 levels, re-spectively, the cube facets of Figure 2.5 (Left) turns into the ones of Figure 2.5(Right).
2.2. EXPERIMENTAL INVESTIGATION 29
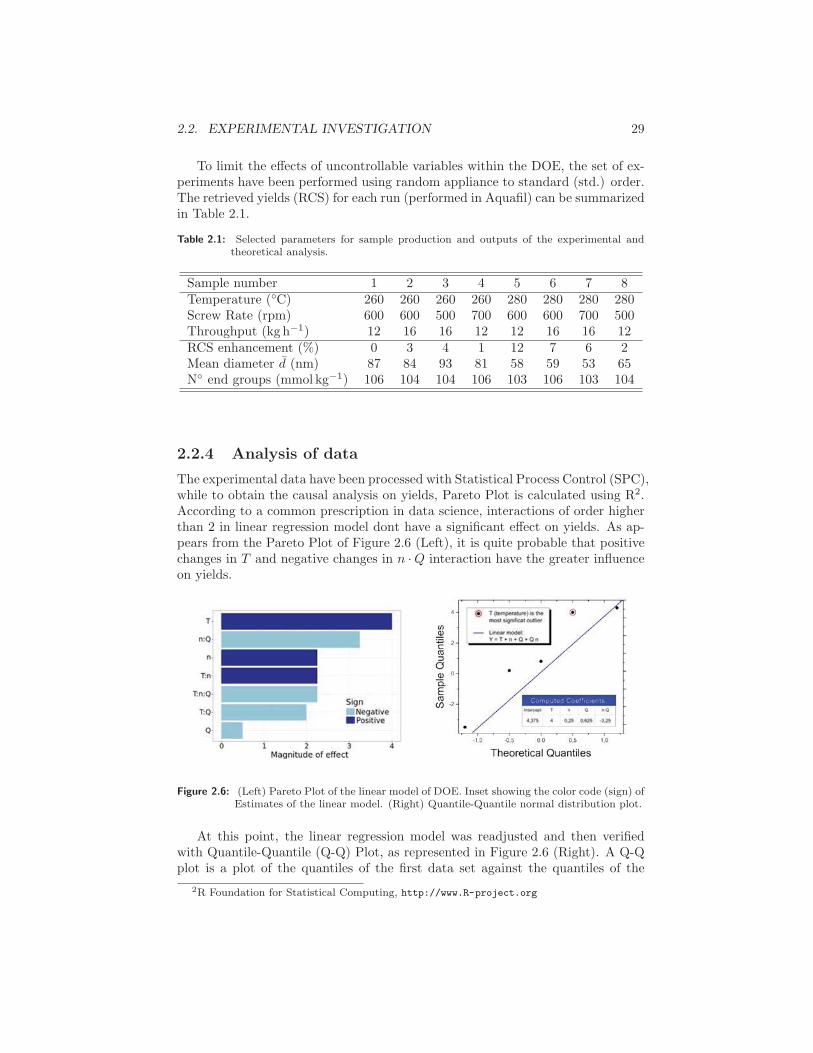
To limit the effects of uncontrollable variables within the DOE, the set of ex-periments have been performed using random appliance to standard (std.) order.The retrieved yields (RCS) for each run (performed in Aquafil) can be summarizedin Table 2.1.
Table 2.1: Selected parameters for sample production and outputs of the experimental andtheoretical analysis.
Sample number 1 2 3 4 5 6 7 8Temperature (◦C) 260 260 260 260 280 280 280 280Screw Rate (rpm) 600 600 500 700 600 600 700 500Throughput (kg h−1) 12 16 16 12 12 16 16 12RCS enhancement (%) 0 3 4 1 12 7 6 2Mean diameter d (nm) 87 84 93 81 58 59 53 65N◦ end groups (mmol kg−1) 106 104 104 106 103 106 103 104
2.2.4 Analysis of data
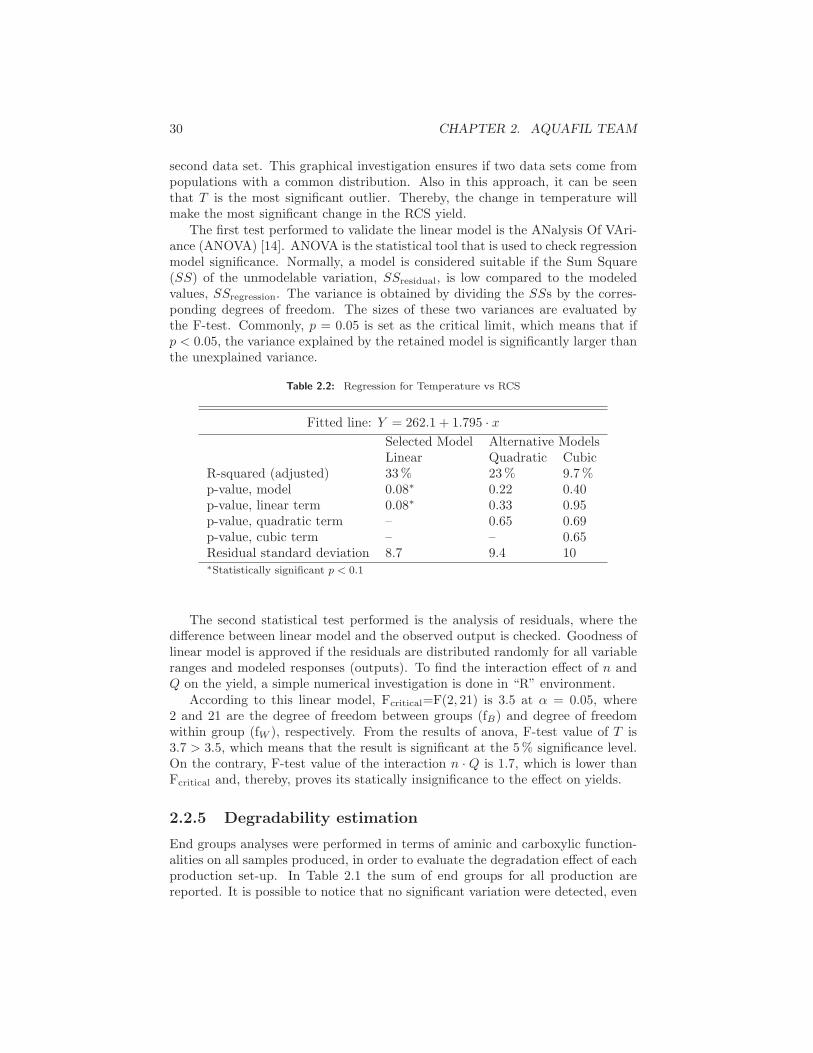
The experimental data have been processed with Statistical Process Control (SPC),while to obtain the causal analysis on yields, Pareto Plot is calculated using R2.According to a common prescription in data science, interactions of order higherthan 2 in linear regression model dont have a significant effect on yields. As ap-pears from the Pareto Plot of Figure 2.6 (Left), it is quite probable that positivechanges in T and negative changes in n ·Q interaction have the greater influenceon yields.
Figure 2.6: (Left) Pareto Plot of the linear model of DOE. Inset showing the color code (sign) ofEstimates of the linear model. (Right) Quantile-Quantile normal distribution plot.
At this point, the linear regression model was readjusted and then verifiedwith Quantile-Quantile (Q-Q) Plot, as represented in Figure 2.6 (Right). A Q-Qplot is a plot of the quantiles of the first data set against the quantiles of the
2R Foundation for Statistical Computing, http://www.R-project.org
30 CHAPTER 2. AQUAFIL TEAM
second data set. This graphical investigation ensures if two data sets come frompopulations with a common distribution. Also in this approach, it can be seenthat T is the most significant outlier. Thereby, the change in temperature willmake the most significant change in the RCS yield.
The first test performed to validate the linear model is the ANalysis Of VAri-ance (ANOVA) [14]. ANOVA is the statistical tool that is used to check regressionmodel significance. Normally, a model is considered suitable if the Sum Square(SS) of the unmodelable variation, SSresidual, is low compared to the modeledvalues, SSregression. The variance is obtained by dividing the SSs by the corres-ponding degrees of freedom. The sizes of these two variances are evaluated bythe F-test. Commonly, p = 0.05 is set as the critical limit, which means that ifp < 0.05, the variance explained by the retained model is significantly larger thanthe unexplained variance.
Table 2.2: Regression for Temperature vs RCS
Fitted line: Y = 262.1 + 1.795 · xSelected Model Alternative ModelsLinear Quadratic Cubic
R-squared (adjusted) 33% 23% 9.7%p-value, model 0.08∗ 0.22 0.40p-value, linear term 0.08∗ 0.33 0.95p-value, quadratic term – 0.65 0.69p-value, cubic term – – 0.65Residual standard deviation 8.7 9.4 10∗Statistically significant p < 0.1
The second statistical test performed is the analysis of residuals, where thedifference between linear model and the observed output is checked. Goodness oflinear model is approved if the residuals are distributed randomly for all variableranges and modeled responses (outputs). To find the interaction effect of n andQ on the yield, a simple numerical investigation is done in “R” environment.
According to this linear model, Fcritical=F(2, 21) is 3.5 at α = 0.05, where2 and 21 are the degree of freedom between groups (fB) and degree of freedomwithin group (fW ), respectively. From the results of anova, F-test value of T is3.7 > 3.5, which means that the result is significant at the 5% significance level.On the contrary, F-test value of the interaction n · Q is 1.7, which is lower thanFcritical and, thereby, proves its statically insignificance to the effect on yields.
2.2.5 Degradability estimation
End groups analyses were performed in terms of aminic and carboxylic function-alities on all samples produced, in order to evaluate the degradation effect of eachproduction set-up. In Table 2.1 the sum of end groups for all production arereported. It is possible to notice that no significant variation were detected, even
2.3. THEORETICAL MODEL 31
by using higher temperature profile during the production.
2.3 Theoretical model
2.3.1 Problem breakdown
In parallel to the experimental investigation discussed so far, we decided to addressthe problem proposed by Aquafil also from a more theoretical point of view. Theresults provided by the DOE method, in fact, are very useful, but their validityis limited to the range of the tested parameters. In this view, the development ofa theoretical model able to reproduce experimental result could provide insightinto the extrusion process.
A general model of the extrusion process is very difficult to provide, due tothe number of mechanisms involved and the complexity of the underlying physicalphenomena [15, 16]. For this reason, it is very important to reduce the problemcomplexity by highlighting from the beginning the more relevant phenomena. Oneof the most important microscopic parameters in the masterbatch is the final sizeof the agglomerates. This characteristic is empirically found to be directly relatedto the color quality of the texture. Namely, a small molecular aggregate at theend of the extrusion process results in a higher RCS value of the masterbatch.
Thus, the purpose of our theoretical model is to provide a link between theexternal macroscopic parameters directly tunable in the extrusion procedure (tem-perature T , throughput Q, and screew speed ω) and the final agglomerate size d.The goal is to identify an optimal configuration of the production parameters.
As said above, though, a complete general description of the overall process isunfeasible. We therefore chose to divide the underlying physics into two separatedomains: the macroscopic and the microscopic. In both these domains, a set ofquantities represent the input parameters and another set represent the outputones. For the macroscopic domain, the input set consists of the extruder para-meters, while the output set is represented by the melt physical attributes. Atthe microscopic level, on the contrary, the input set is now represented by themelt attributes, while the final output is the pigment cluster size.
2.3.2 Macroscopic description
In this section, we model the extruder in terms of different geometries and para-meters conditions (i.e. temperature). To simplify the treatment, we assume aconstant speed of the melt during the extrusion process, matching time of resid-ence and position in the extruder for any particle in the melt [17].
The model specifications are proper of the extrusor machine used by AquafilS.p.A, which consists of 10 sectors. The total time spent in the machine by a bunchof pigment is approximately 15 s, resulting from empirical considerations. Thus,we model the pieces of the screw by dividing the process time in 10 sections, eachlasting 1.5 s, following the assumption of a constant speed of the melt as statedabove. In each sector we consider a different screw geometry, which result in a
32 CHAPTER 2. AQUAFIL TEAM
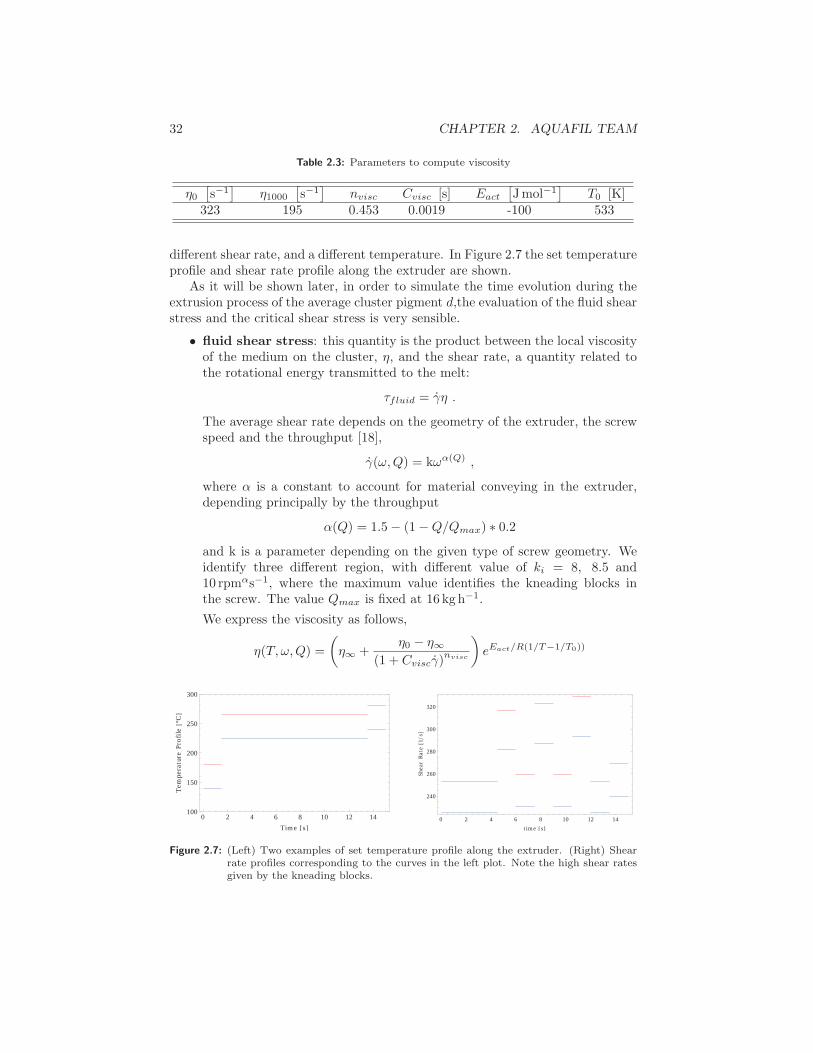
Table 2.3: Parameters to compute viscosity
η0[s−1
]η1000
[s−1
]nvisc Cvisc [s] Eact
[Jmol−1
]T0 [K]
323 195 0.453 0.0019 -100 533
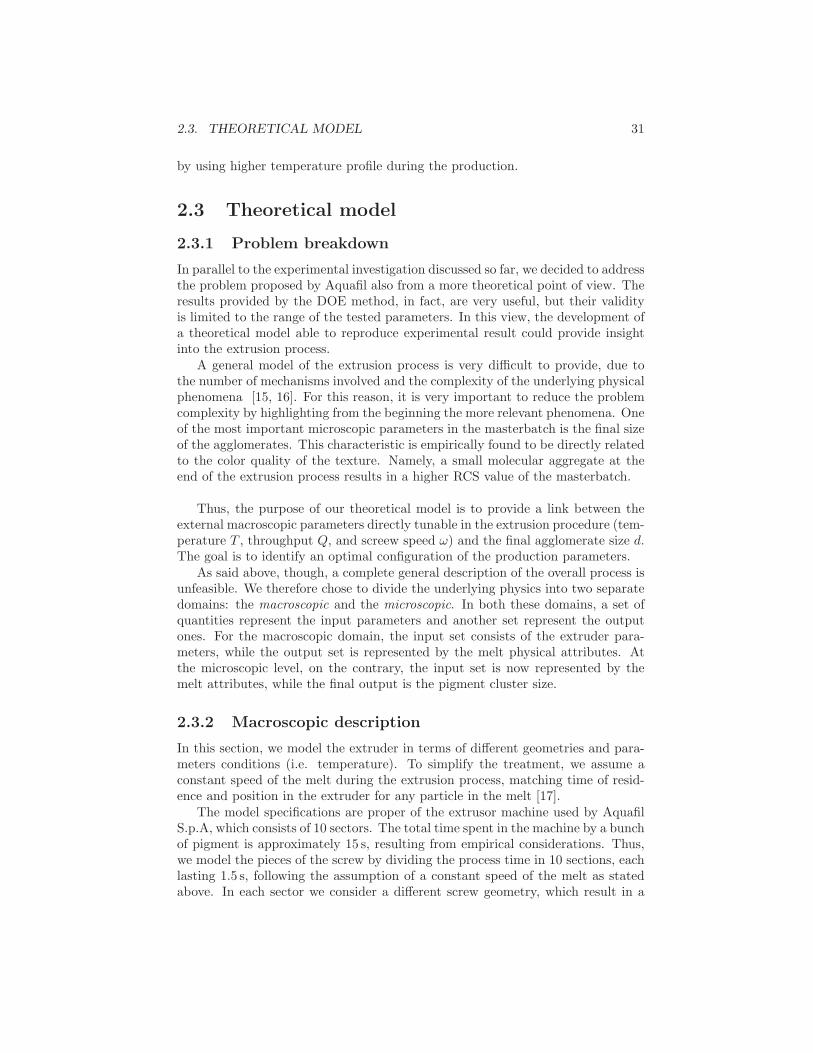
different shear rate, and a different temperature. In Figure 2.7 the set temperatureprofile and shear rate profile along the extruder are shown.
As it will be shown later, in order to simulate the time evolution during theextrusion process of the average cluster pigment d,the evaluation of the fluid shearstress and the critical shear stress is very sensible.
• fluid shear stress: this quantity is the product between the local viscosityof the medium on the cluster, η, and the shear rate, a quantity related tothe rotational energy transmitted to the melt:
τfluid = γη .
The average shear rate depends on the geometry of the extruder, the screwspeed and the throughput [18],
γ(ω,Q) = kωα(Q) ,
where α is a constant to account for material conveying in the extruder,depending principally by the throughput
α(Q) = 1.5− (1−Q/Qmax) ∗ 0.2and k is a parameter depending on the given type of screw geometry. Weidentify three different region, with different value of ki = 8, 8.5 and10 rpmαs−1, where the maximum value identifies the kneading blocks inthe screw. The value Qmax is fixed at 16 kg h−1.
We express the viscosity as follows,
η(T, ω,Q) =
(η∞ +
η0 − η∞(1 + Cviscγ)
nvisc
)eEact/R(1/T−1/T0))
0 2 4 6 8 10 12 14100
150
200
250
300
Time � s�
Tem
pera
ture
Prof
ile�°
C�
0 2 4 6 8 10 12 14
240
260
280
300
320
t ime � s�
Shea
rRa
te�1�s�
Figure 2.7: (Left) Two examples of set temperature profile along the extruder. (Right) Shearrate profiles corresponding to the curves in the left plot. Note the high shear ratesgiven by the kneading blocks.
2.3. THEORETICAL MODEL 33
450 500 550 600 650 700 750
60
70
80
90
100
Screw Speed rpm
Shea
rSt
ress
KPa
T = 220°C
T = 260°C Q = 12 kg/h
Q = 16 kg/h
220 240 260 280 30050
52
54
56
58
60
Tem perature °C
Crit
ical
Shea
rSt
ress
KPa
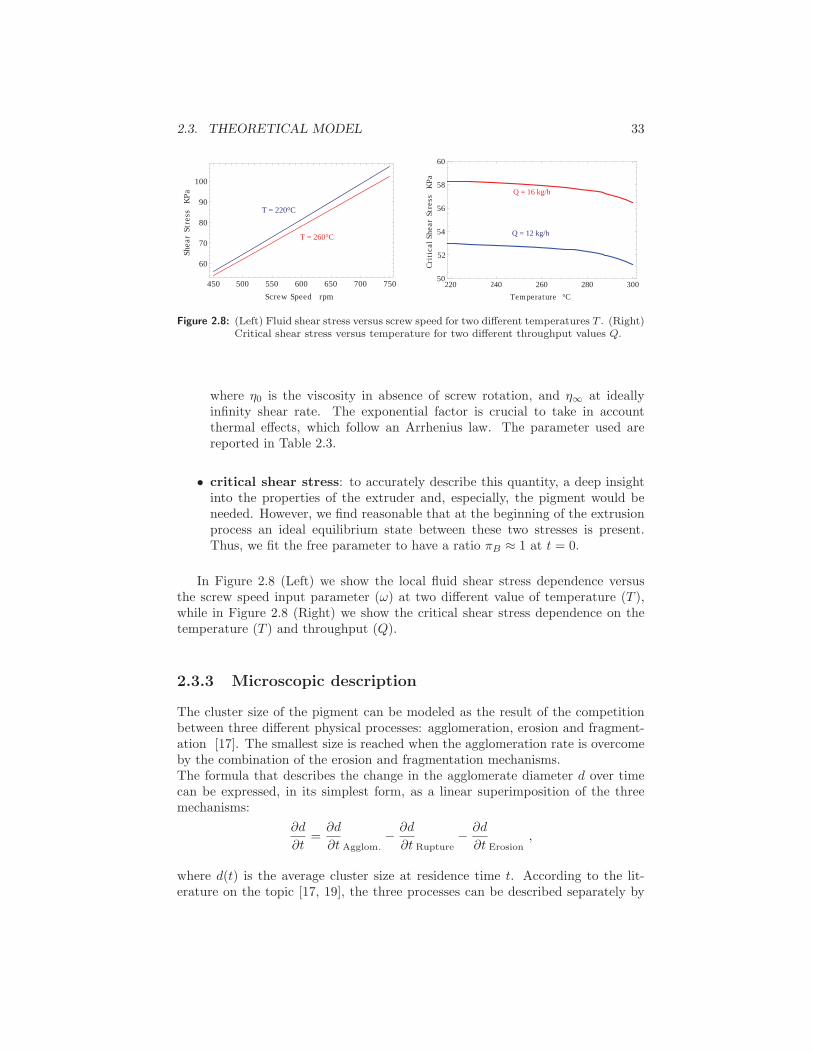
Figure 2.8: (Left) Fluid shear stress versus screw speed for two different temperatures T . (Right)Critical shear stress versus temperature for two different throughput values Q.
where η0 is the viscosity in absence of screw rotation, and η∞ at ideallyinfinity shear rate. The exponential factor is crucial to take in accountthermal effects, which follow an Arrhenius law. The parameter used arereported in Table 2.3.
• critical shear stress: to accurately describe this quantity, a deep insightinto the properties of the extruder and, especially, the pigment would beneeded. However, we find reasonable that at the beginning of the extrusionprocess an ideal equilibrium state between these two stresses is present.Thus, we fit the free parameter to have a ratio πB ≈ 1 at t = 0.
In Figure 2.8 (Left) we show the local fluid shear stress dependence versusthe screw speed input parameter (ω) at two different value of temperature (T ),while in Figure 2.8 (Right) we show the critical shear stress dependence on thetemperature (T ) and throughput (Q).
2.3.3 Microscopic description
The cluster size of the pigment can be modeled as the result of the competitionbetween three different physical processes: agglomeration, erosion and fragment-ation [17]. The smallest size is reached when the agglomeration rate is overcomeby the combination of the erosion and fragmentation mechanisms.The formula that describes the change in the agglomerate diameter d over timecan be expressed, in its simplest form, as a linear superimposition of the threemechanisms:
∂d
∂t=
∂d
∂t Agglom.− ∂d
∂t Rupture− ∂d
∂t Erosion,
where d(t) is the average cluster size at residence time t. According to the lit-erature on the topic [17, 19], the three processes can be described separately by
34 CHAPTER 2. AQUAFIL TEAM
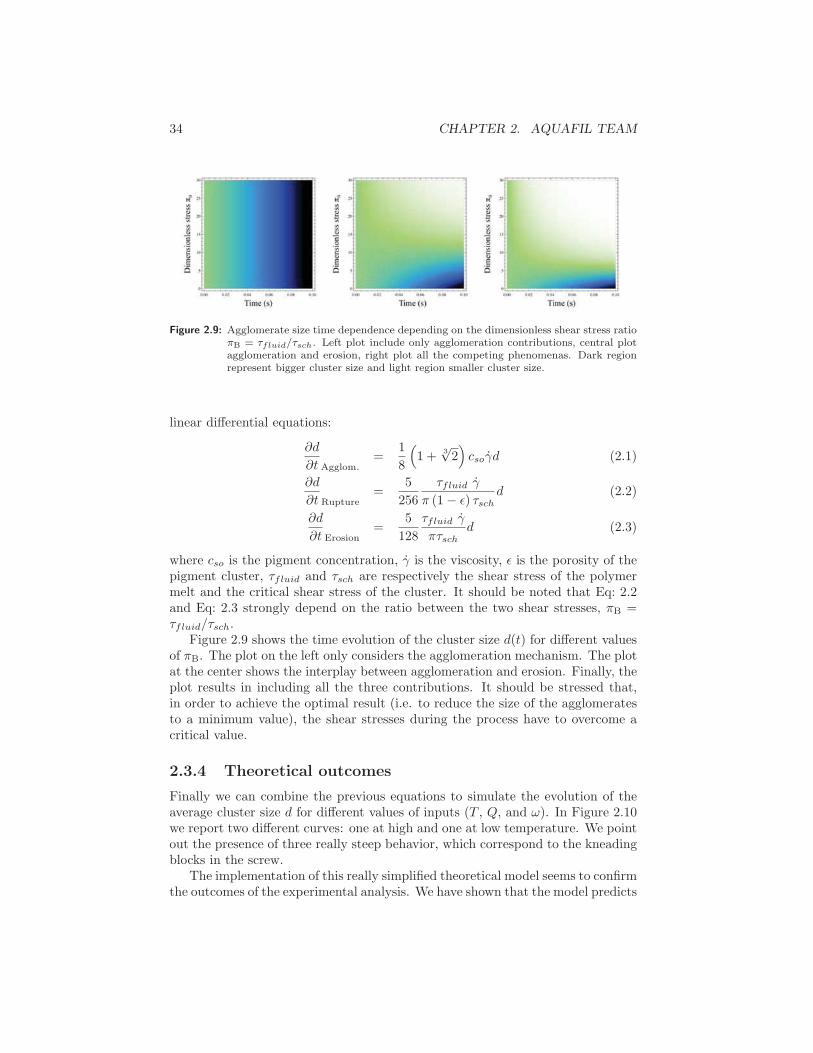
Figure 2.9: Agglomerate size time dependence depending on the dimensionless shear stress ratioπB = τfluid/τsch. Left plot include only agglomeration contributions, central plotagglomeration and erosion, right plot all the competing phenomenas. Dark regionrepresent bigger cluster size and light region smaller cluster size.
linear differential equations:
∂d
∂t Agglom.=
1
8
(1 +
3√2)csoγd (2.1)
∂d
∂t Rupture=
5
256
τfluid γ
π (1− ε) τschd (2.2)
∂d
∂t Erosion=
5
128
τfluid γ
πτschd (2.3)
where cso is the pigment concentration, γ is the viscosity, ε is the porosity of thepigment cluster, τfluid and τsch are respectively the shear stress of the polymermelt and the critical shear stress of the cluster. It should be noted that Eq: 2.2and Eq: 2.3 strongly depend on the ratio between the two shear stresses, πB =τfluid/τsch.
Figure 2.9 shows the time evolution of the cluster size d(t) for different valuesof πB. The plot on the left only considers the agglomeration mechanism. The plotat the center shows the interplay between agglomeration and erosion. Finally, theplot results in including all the three contributions. It should be stressed that,in order to achieve the optimal result (i.e. to reduce the size of the agglomeratesto a minimum value), the shear stresses during the process have to overcome acritical value.
2.3.4 Theoretical outcomes
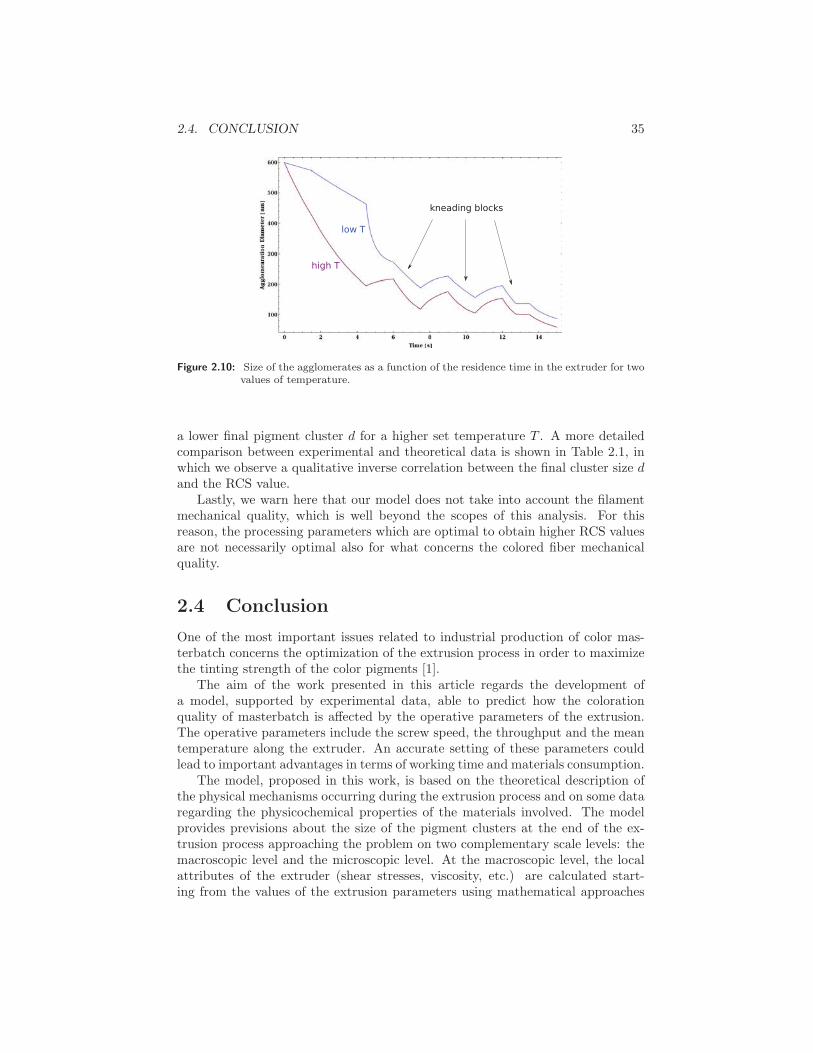
Finally we can combine the previous equations to simulate the evolution of theaverage cluster size d for different values of inputs (T , Q, and ω). In Figure 2.10we report two different curves: one at high and one at low temperature. We pointout the presence of three really steep behavior, which correspond to the kneadingblocks in the screw.
The implementation of this really simplified theoretical model seems to confirmthe outcomes of the experimental analysis. We have shown that the model predicts
2.4. CONCLUSION 35
kneading blocks
low T
high T
Figure 2.10: Size of the agglomerates as a function of the residence time in the extruder for twovalues of temperature.
a lower final pigment cluster d for a higher set temperature T . A more detailedcomparison between experimental and theoretical data is shown in Table 2.1, inwhich we observe a qualitative inverse correlation between the final cluster size dand the RCS value.
Lastly, we warn here that our model does not take into account the filamentmechanical quality, which is well beyond the scopes of this analysis. For thisreason, the processing parameters which are optimal to obtain higher RCS valuesare not necessarily optimal also for what concerns the colored fiber mechanicalquality.
2.4 Conclusion
One of the most important issues related to industrial production of color mas-terbatch concerns the optimization of the extrusion process in order to maximizethe tinting strength of the color pigments [1].
The aim of the work presented in this article regards the development ofa model, supported by experimental data, able to predict how the colorationquality of masterbatch is affected by the operative parameters of the extrusion.The operative parameters include the screw speed, the throughput and the meantemperature along the extruder. An accurate setting of these parameters couldlead to important advantages in terms of working time and materials consumption.
The model, proposed in this work, is based on the theoretical description ofthe physical mechanisms occurring during the extrusion process and on some dataregarding the physicochemical properties of the materials involved. The modelprovides previsions about the size of the pigment clusters at the end of the ex-trusion process approaching the problem on two complementary scale levels: themacroscopic level and the microscopic level. At the macroscopic level, the localattributes of the extruder (shear stresses, viscosity, etc.) are calculated start-ing from the values of the extrusion parameters using mathematical approaches
36 CHAPTER 2. AQUAFIL TEAM
provided by previous works. The so-calculated attributes and the physicochem-ical properties of the pigment materials are the inputs for the model concerningthe microscopic level. Three phenomena are considered to occur to the pigmentclusters at this level: the erosion, the fragmentation and the agglomeration of theclusters. The solution of the whole equation system provides the average diameterof the pigment clusters. The information about the size of the pigment clusterscan be directly related to the quality of the tinting strength of the pigment em-bedded into the masterbatch. In particular, lower size of the pigment clusterslead to higher coloration quality, as demonstrated in previous works.
The goodness of the theoretical model was tested by experimental measure-ments consisting in the RCS evaluation of the samples produced setting the ex-truder parameters in a realistic range of values. The RCS values are directlyproportional to the coloration quality of the samples. The RCS data were ac-quired using a spectrophotometer. Due to the cost and the time consumptionrequired the sample preparation, the choice of the parameter set for each samplewas carefully weighted. In particular, advanced techniques of Design of Experi-ment were employed in order to analyze all the space of parameters.
The results reveal a high degree of correlation between the RCS values ofthe analyzed samples and the diameters of the pigment clusters predicted by themodel. This evidence provides a confirmation of the goodness of the theoreticalmodel. It is remarkable that the mean temperature along the extruder is recog-nized as the most important parameter in the determination of the masterbatchquality for the operative range considered in this study. In particular, the highervalue of mean temperature was associated to the better results in terms of colora-tion quality. The suitability of the temperature range considered in this work wasproved by titration analysis of the terminal groups of the polymer molecules. Thedata allow excluding higher degradation of the polymer in the sample producedat higher mean temperature.
In conclusion, a reliable tool supported by experimental validation and suitablefor quality predictions was developed. The information provided by this tool couldallow the identification of the best set of parameter values in order to reach aneffective optimization of the industrial production.
Improvements of this model can be reached considering other aspects of theproduction process: the possibility to produce masterbatch by multiple extrusionprocesses and/or the insertion, into the model calculations, of the temperatureprofile along the extruded rather than the mean value only.
Other experimental techniques may be used to evaluate the accuracy of themodel. For example, microanalysis techniques, like EDAX and XPS, can provideinformation about the size of pigment cluster for a direct comparison with thetheoretical model outcomes. Preliminary considerations about the employmentof XPS analysis in this kind of studies are reported in section 2.5.
Considering the industrial relevance of masterbatch production, the modelproposed in this work can provide relevant economic benefits, although furtherstudies are required in order to provide a robust statistics supporting model reli-ability before real implementation.
2.5. ADDENDUM: XPS ANALYSIS 37
2.5 Addendum: XPS analysis
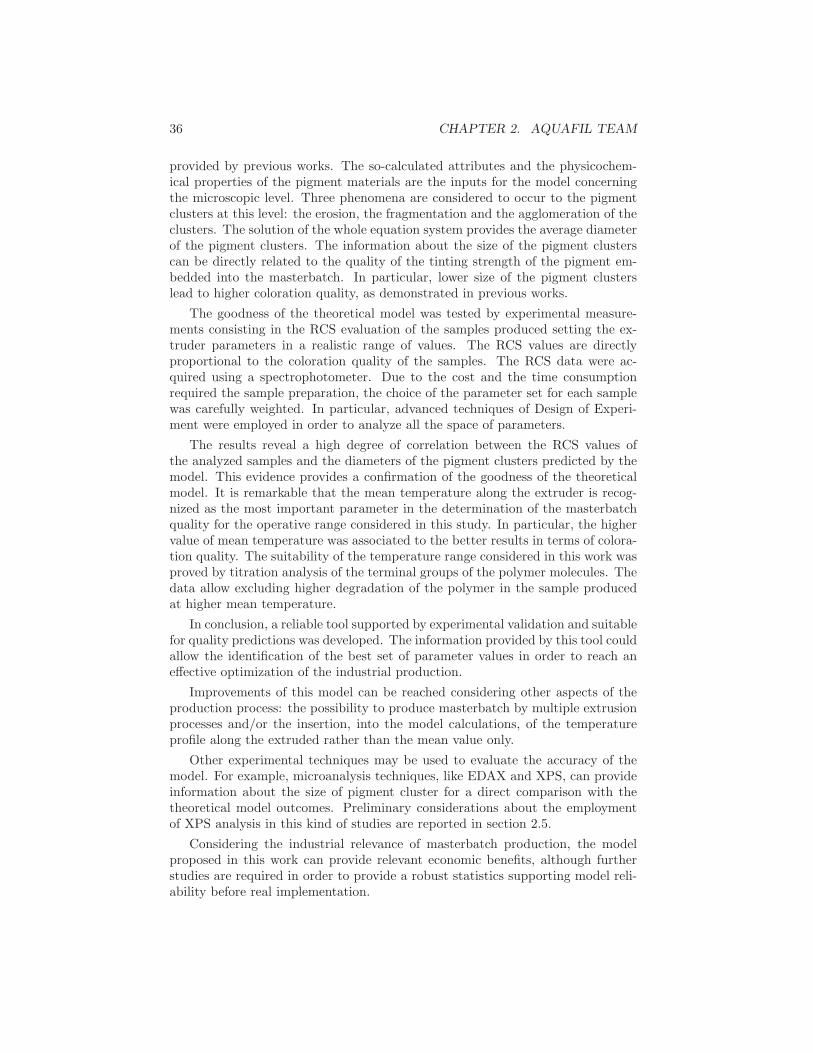
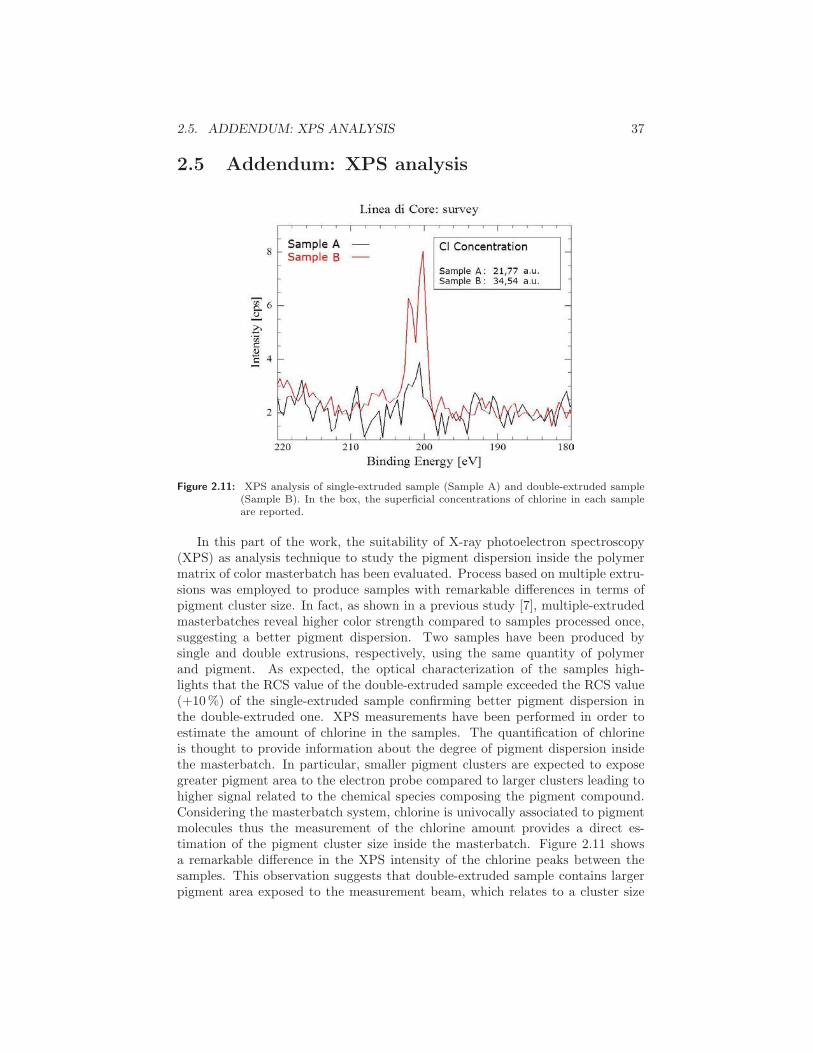
Figure 2.11: XPS analysis of single-extruded sample (Sample A) and double-extruded sample(Sample B). In the box, the superficial concentrations of chlorine in each sampleare reported.
In this part of the work, the suitability of X-ray photoelectron spectroscopy(XPS) as analysis technique to study the pigment dispersion inside the polymermatrix of color masterbatch has been evaluated. Process based on multiple extru-sions was employed to produce samples with remarkable differences in terms ofpigment cluster size. In fact, as shown in a previous study [7], multiple-extrudedmasterbatches reveal higher color strength compared to samples processed once,suggesting a better pigment dispersion. Two samples have been produced bysingle and double extrusions, respectively, using the same quantity of polymerand pigment. As expected, the optical characterization of the samples high-lights that the RCS value of the double-extruded sample exceeded the RCS value(+10%) of the single-extruded sample confirming better pigment dispersion inthe double-extruded one. XPS measurements have been performed in order toestimate the amount of chlorine in the samples. The quantification of chlorineis thought to provide information about the degree of pigment dispersion insidethe masterbatch. In particular, smaller pigment clusters are expected to exposegreater pigment area to the electron probe compared to larger clusters leading tohigher signal related to the chemical species composing the pigment compound.Considering the masterbatch system, chlorine is univocally associated to pigmentmolecules thus the measurement of the chlorine amount provides a direct es-timation of the pigment cluster size inside the masterbatch. Figure 2.11 showsa remarkable difference in the XPS intensity of the chlorine peaks between thesamples. This observation suggests that double-extruded sample contains largerpigment area exposed to the measurement beam, which relates to a cluster size
38 BIBLIOGRAPHY
lower than the single-extruded sample. Therefore, the result of this preliminaryanalysis supports the employment of XPS technique for the study of pigmentcluster size inside masterbatch in order to provide important information aboutthe outcomes of production process.
Acknowledgement
We acknowledge the technicians of Aquafil, who helped in the sample prepara-tion and characterization (RCS and chemical analysis). We also acknowledge theMateC Laboratory, from the “CMM - Centro Materiali e Microsistemi” of FBK,for the kind support and the XPS measurements.
Bibliography
[1] M. Buccella, A. Dorigato, F. Crugnola, M. Caldara, and L. Fambri. Color-ation properties and chemo-rheological characterization of a dioxazine pig-ment based monodispersed masterbatch. Journal of Applied Polymer Science,2014.
[2] H. Zollinger. Color Chemistry: Syntheses, Properties, and Applications ofOrganic Dyes and Pigments. Wiley & Sons Inc., 2003.
[3] G. A. Klein. Industrial Color Physics. Springer, 2010.
[4] I. Arino, U. Kleist, and M. Rigdahl. Color of pigmented plastics - measure-ments and predictions. Polymer Engineering & Science, 44:141–152, 2004.
[5] W. Herbst and K. Hunger. Industrial Organic Pigments: Production, Prop-erties, Applications. Wiley & Sons Inc., 2006.
[6] M. Lewin. Handbook of Fiber Chemistry. Taylor & Francis, 3rd edition, 2010.
[7] M. Buccella. Color masterbatches for polyamide 6 fibers. Optimization ofcompounding and spinning processes. Physical-chemical characterization ofindustrial products. PhD thesis, Dept. of Industrial Engineering, Universityof Trento, 2014.
[8] P. Ghosh. Polymer Science and Technology: Plastics, Rubbers, Blends andComposites. McGraw-Hill, 2001.
[9] A. C. Atkinson, A. N. Donev, and R. D. Tobias. Optimum ExperimentalDesigns, with SAS. Oxford University Press, 2007.
[10] R. L. Mason, R. F. Gunst, and J. L. Hess. Statistical design and analysis ofexperiments with applications to engineering and science. Wiley, New York,1989.
[11] M. J. Anderson and P. J. Whitcomb. DOE Simplified: Practical Tools forEffective Experimentation. Productivity Press, 2nd edition, 2007.
BIBLIOGRAPHY 39
[12] R. K. Roy. Design of experiments using the Taguchi Approach. John Wiley& Sons, Inc., 2001.
[13] D. J. Wheeler. Understanding Variation: The Key to Managing Chaos. SPCPress, 2nd edition, 2000.
[14] N. R. Draper and H. Smith. Applied Regression Analysis. Wiley, New York,2nd edition, 1981.
[15] H. Potente, M. Bastian, and J. Flecke. Design of a compounding extruder bymeans of the sigma simulation software. Advances in Polymer Technology,18:147170, 1999.
[16] H. Potente and K. Kretschmer. Simulation and evaluation of compoundingprocesses. Macromolecular Materials and Engineering, 287, 2002.
[17] J. Flecke, H. Potente, and K. Kretschmer. A physico-mathematical modelfor the dispersion process in a co-rotating intermeshing twin screw extruder.Journal of Reinforced Plastics and Composites, 21:507–515, 2002.
[18] M. Suparno, K. D. Dolan, P. K. W. NG, and J. F. Steffe. Avearage shear ratein a twin-screw extruder as a function of degree of fill, flow behavior index,screw speed and screw configuration. Journal of Food Process Engineering,34:961982, 2011.
[19] H. Potente and K. Kretschmer. Simulation and evaluation of compoundingprocesses. Macromolecular Materials and Engineering, 287:758–772, 2002.

Copyright © 2022 FDOKUMEN