design of road drainage systems - IAHR 2019
10
E-proceedings of the 38 th IAHR World Congress September 1-6, 2019, Panama City, Panama doi:10.3850/38WC092019-1620 1207 DESIGN OF ROAD DRAINAGE SYSTEMS: THE CASE STUDY OF THE RECONSTRUCTION OF THE COLLAPSED VIADUCT OVER THE POLCEVERA RIVER IN GENOA, ITALY FABRIZIO CABAS (1) , CHIARA CESALI (1) & ALESSANDRO CAPPELLI (1) (1) ITALFERR SPA, Italian State Railways Group, Rome, Italy e-mail [email protected] ABSTRACT Road and railway drainage systems must be adequately designed to avoid the occurrence of aquaplaning/hydroplaning phenomena or frost heave, thaw softening, attrition of ballast and weakening of the load bearing capacity of the track. Several methods to estimate the peak flow discharge are available in technical literature. In the paper, the well-know “Rational Method” and the “Linear Reservoir Approach”, based on the variable “water storage volume”, are analysed. Rainfall records with duration shorter than 1 hour are generally considered to estimate the designed peak flow discharge values, but these data are not always available. However, rainfall data with duration longer than 1 hour can be considered through Bell’s relationship. The procedure applied to the design of the drainage system of the new road viaduct over the Polcevera River in Genoa is described and analysed. Referring to the rainfall data available for Genoa, comparisons between the two considered methods to evaluate the peak discharge and the Rainfall-Duration-Frequency curves derived from the statistical analysis of rainfall records with duration shorter than 1 hour and Bell’s relationship (based on rainfall data with duration longer than 1 hour), for different values of the average recurrence interval (ARI), are carried out. In addition, evaluations/considerations about aquaplaning phenomena are also reported. Keywords: Road drainage systems, Rational Method, Linear Reservoir Approach, Bell’s relationship, Viaduct on Polcevera River. 1 INTRODUCTION For a road project, drainage system is designed for a specific horizontal and vertical alignment and cross- sectional detail. However, during the concept and development phases, due to design requirements (structural, alignment,…..), road alignments and cross-sectional details may change and, in turn, drainage design needs to be reviewed each time the road geometry changes, maybe also providing assistance in the fixing of the road geometry. Thus, different solutions for the road platform drainage can be adopted, according to the infrastructure characteristics. As consequence, the methods (specifically the approaches to estimate the peak discharge) and the design ARI for sizing the drainage system must be also appropriately selected. In this context, several methods to estimate the peak flow discharge are available in technical literature. Among these, the well-know “Rational Method” and the “Linear Reservoir Approach” are the most commonly adopted methods in the design of road drainage systems, as used in Italy. Referring to the new road viaduct over the Polcevera River in Genoa, comparisons between the two examined methods to evaluate the peak discharge, as well as the considerations on the choice of the design values of the peak discharge, are analysed and discussed in the paper. Particularly, the overall procedure, from the analysis of the available rainfall data to the evaluation of aquaplaning phenomena, according to design peak discharge value, is described in detail. 2 ESTIMATION OF PEAK DISCHARGE Two basic approaches to compute the design peak discharge from rainfall data are examined. The first approach is the Rational Method, which relates peak runoff to rainfall intensity through a proportionally factor; the second approach is the Linear Reservoir Method based on the variable “water storage volume”. 2.1 Rational Formula The Rational Formula is one of the most frequently used in urban hydrology methods. The formula is: , = ∙ , ∙ 3.6 [1]
-
Upload
khangminh22 -
Category
Documents
-
view
0 -
download
0
Transcript of design of road drainage systems - IAHR 2019
E-proceedings of the 38th IAHR World CongressSeptember 1-6, 2019, Panama City, Panama
doi:10.3850/38WC092019-1620
1207
DESIGN OF ROAD DRAINAGE SYSTEMS: THE CASE STUDY OF THE RECONSTRUCTION OF THE COLLAPSED VIADUCT OVER THE POLCEVERA RIVER
IN GENOA, ITALY
FABRIZIO CABAS(1), CHIARA CESALI(1)& ALESSANDRO CAPPELLI(1)
(1) ITALFERR SPA, Italian State Railways Group, Rome, Italy
e-mail [email protected]
ABSTRACT
Road and railway drainage systems must be adequately designed to avoid the occurrence of aquaplaning/hydroplaning phenomena or frost heave, thaw softening, attrition of ballast and weakening of the load bearing capacity of the track. Several methods to estimate the peak flow discharge are available in technical literature. In the paper, the well-know “Rational Method” and the “Linear Reservoir Approach”, based on the variable “water storage volume”, are analysed. Rainfall records with duration shorter than 1 hour are generally considered to estimate the designed peak flow discharge values, but these data are not always available. However, rainfall data with duration longer than 1 hour can be considered through Bell’s relationship. The procedure applied to the design of the drainage system of the new road viaduct over the Polcevera River in Genoa is described and analysed. Referring to the rainfall data available for Genoa, comparisons between the two considered methods to evaluate the peak discharge and the Rainfall-Duration-Frequency curves derived from the statistical analysis of rainfall records with duration shorter than 1 hour and Bell’s relationship (based on rainfall data with duration longer than 1 hour), for different values of the average recurrence interval (ARI), are carried out. In addition, evaluations/considerations about aquaplaning phenomena are also reported.
Keywords: Road drainage systems, Rational Method, Linear Reservoir Approach, Bell’s relationship, Viaduct on Polcevera River.
1 INTRODUCTION For a road project, drainage system is designed for a specific horizontal and vertical alignment and cross-
sectional detail. However, during the concept and development phases, due to design requirements (structural, alignment,…..), road alignments and cross-sectional details may change and, in turn, drainage design needs to be reviewed each time the road geometry changes, maybe also providing assistance in the fixing of the road geometry. Thus, different solutions for the road platform drainage can be adopted, according to the infrastructure characteristics. As consequence, the methods (specifically the approaches to estimate the peak discharge) and the design ARI for sizing the drainage system must be also appropriately selected.
In this context, several methods to estimate the peak flow discharge are available in technical literature. Among these, the well-know “Rational Method” and the “Linear Reservoir Approach” are the most commonly adopted methods in the design of road drainage systems, as used in Italy.
Referring to the new road viaduct over the Polcevera River in Genoa, comparisons between the two examined methods to evaluate the peak discharge, as well as the considerations on the choice of the design values of the peak discharge, are analysed and discussed in the paper. Particularly, the overall procedure, from the analysis of the available rainfall data to the evaluation of aquaplaning phenomena, according to design peak discharge value, is described in detail.
2 ESTIMATION OF PEAK DISCHARGE Two basic approaches to compute the design peak discharge from rainfall data are examined. The first
approach is the Rational Method, which relates peak runoff to rainfall intensity through a proportionally factor; the second approach is the Linear Reservoir Method based on the variable “water storage volume”.
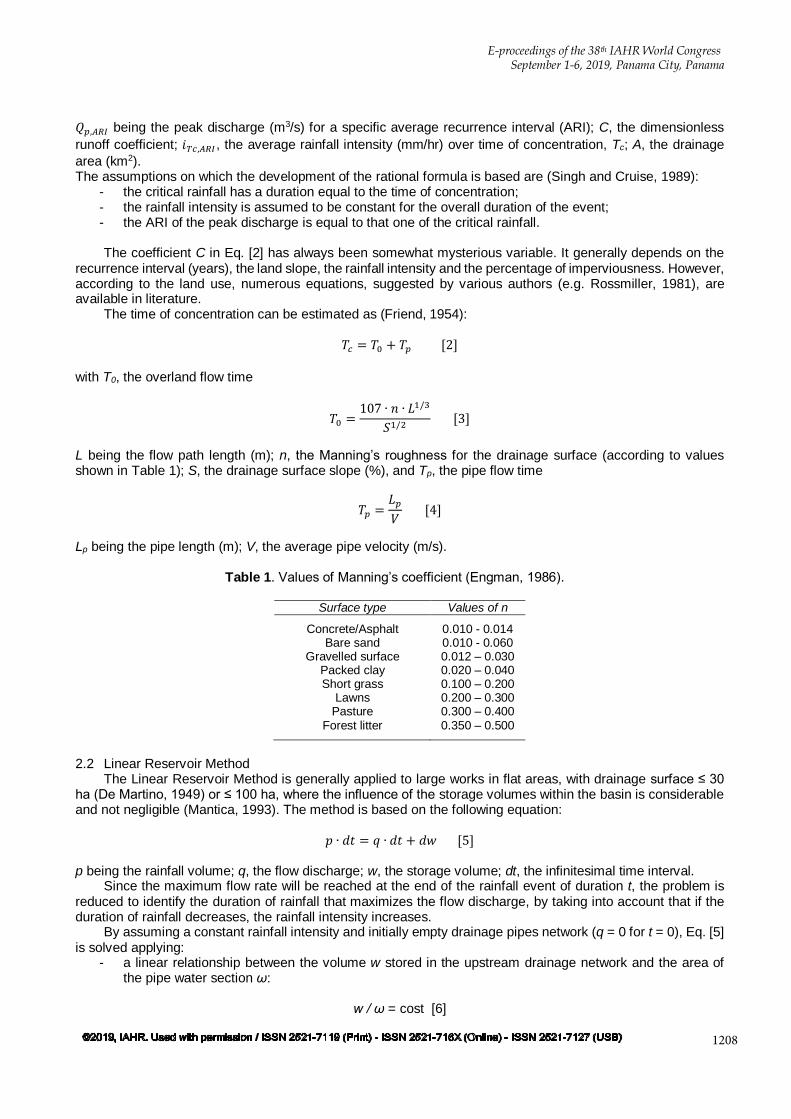
2.1 Rational Formula The Rational Formula is one of the most frequently used in urban hydrology methods. The formula is:
𝑄𝑝,𝐴𝑅𝐼 =𝐶 ∙ 𝑖𝑇𝑐,𝐴𝑅𝐼 ∙ 𝐴
3.6[1]
E-proceedings of the 38th IAHR World CongressSeptember 1-6, 2019, Panama City, Panama
1208
𝑄𝑝,𝐴𝑅𝐼 being the peak discharge (m3/s) for a specific average recurrence interval (ARI); C, the dimensionless
runoff coefficient; 𝑖𝑇𝑐,𝐴𝑅𝐼 , the average rainfall intensity (mm/hr) over time of concentration, Tc; A, the drainage
area (km2). The assumptions on which the development of the rational formula is based are (Singh and Cruise, 1989):
- the critical rainfall has a duration equal to the time of concentration;- the rainfall intensity is assumed to be constant for the overall duration of the event;- the ARI of the peak discharge is equal to that one of the critical rainfall.
The coefficient C in Eq. [2] has always been somewhat mysterious variable. It generally depends on the recurrence interval (years), the land slope, the rainfall intensity and the percentage of imperviousness. However, according to the land use, numerous equations, suggested by various authors (e.g. Rossmiller, 1981), are available in literature.
The time of concentration can be estimated as (Friend, 1954):
𝑇𝑐 = 𝑇0 + 𝑇𝑝 [2]
with T0, the overland flow time
𝑇0 =107 ∙ 𝑛 ∙ 𝐿1/3
𝑆1/2 [3]
L being the flow path length (m); n, the Manning’s roughness for the drainage surface (according to values shown in Table 1); S, the drainage surface slope (%), and Tp, the pipe flow time
𝑇𝑝 =𝐿𝑝
𝑉 [4]
Lp being the pipe length (m); V, the average pipe velocity (m/s).
Table 1. Values of Manning’s coefficient (Engman, 1986).
Surface type Values of n
Concrete/Asphalt 0.010 - 0.014 Bare sand 0.010 - 0.060
Gravelled surface 0.012 – 0.030 Packed clay 0.020 – 0.040 Short grass 0.100 – 0.200
Lawns 0.200 – 0.300 Pasture 0.300 – 0.400
Forest litter 0.350 – 0.500
2.2 Linear Reservoir Method The Linear Reservoir Method is generally applied to large works in flat areas, with drainage surface ≤ 30
ha (De Martino, 1949) or ≤ 100 ha, where the influence of the storage volumes within the basin is considerable and not negligible (Mantica, 1993). The method is based on the following equation:
𝑝 ∙ 𝑑𝑡 = 𝑞 ∙ 𝑑𝑡 + 𝑑𝑤 [5]
p being the rainfall volume; q, the flow discharge; w, the storage volume; dt, the infinitesimal time interval. Since the maximum flow rate will be reached at the end of the rainfall event of duration t, the problem is
reduced to identify the duration of rainfall that maximizes the flow discharge, by taking into account that if the duration of rainfall decreases, the rainfall intensity increases.
By assuming a constant rainfall intensity and initially empty drainage pipes network (q = 0 for t = 0), Eq. [5] is solved applying:
- a linear relationship between the volume w stored in the upstream drainage network and the area ofthe pipe water section ω:
w / ω = cost [6]

E-proceedings of the 38th IAHR World CongressSeptember 1-6, 2019, Panama City, Panama
1209
This condition, in the case of a single pipe, corresponds to the hypothesis of steady motion, while in the case of pipe network, it is based on two following additional hypotheses: 1) the several elements are filled simultaneously without the flow is obstructed; 2) the degree of filling of each element is equal to that one of the others.
- a linear relationship between the flow discharge and the area of the upstream pipe section:
q / ω = cost [7]
This relationship corresponds to the hypothesis of constant velocity in the pipe, a hypothesis quite close to real flow conditions for the generally occurred water levels in the pipe.
Under these assumptions, it is possible to write:
𝑑𝑤 = 𝑤𝑑𝑞
𝑞 [8]
and then the Eq. [5] becomes:
(𝑝 − 𝑞) ∙ 𝑑𝑡 =𝑤
𝑞𝑑𝑞 [9]
that is
(𝑝 − 𝑞) =𝑑𝑤
𝑑𝑡 [10]
The integration of Eq. [10] allows to obtain a relationship between the flow discharge and the filling time of a pipe, i.e. it allows to estimate the time interval between a null and maximum (qmax) values of the flow discharge.
Defining as the time necessary to increase the flow discharge from q = 0 to q = qmax, and trthe filling time, a
drainage pipe will be adequate if≤ tr, or on the contrary if >tr the pipe will be insufficient.
Thus, the correct design of the drainage pipe network is obtained if =tr. In this contest, the Linear Reservoir
Method becomes a design instrument; by imposing =tr, the analytical expression of the udometric coefficient u (l/s/ha) may be derived:
𝑢 = 𝑘 ∙(𝐶 ∙ 𝑎)1/𝑛
𝑤1
𝑛−1
[11]
a and n being the parameters of the Rainfall-Duration-Frequency curve; k, a parameter generally estimated as k = 2168∙n; C, the runoff coefficient. The variable w represents the specific total storage volume, defined as w = Wtot/S (Wtot = total storage volume, m3; S = drainage surface). Wtot is the sum of three terms: W1, the water volume in the pipe; W2, the water volume in the upstream pipes; W3, the so-called “small storage volumes” (e.g. water volumes accumulated in the secondary/auxiliary drainage systems or on particular surfaces).
3 ANALYSIS OF RAINFALL DATA Rainfall records with duration shorter than 1 hour (5, 10, 15, 20, 25, 30 minutes) are generally considered
to estimate the design peak flow discharge values in the sizing of road drainage systems. These data can be statistically elaborated through the Gumbel’s method; specifically, the rainfall depth (mm) corresponding to a specific ARI is expressed as:
ℎ𝐴𝑅𝐼 = ℎ̅ +𝑆ℎ
𝑆𝑁
𝑌(𝐴𝑅𝐼) −𝑆ℎ
𝑆𝑁
�̅�𝑁 [12]
h̅ being the average value of the N measured/observed rainfall depths hi (ℎ̅ =1
𝑁∑ ℎ𝑖
𝑁𝑖=1 ); 𝑆ℎ, the standard
deviation of the measured values (𝑆ℎ = √1
𝑁−1∑ (ℎ𝑖 − h̅)
2𝑁𝑖=1 ); 𝑌(𝐴𝑅𝐼), the “reduced” variable (𝑌(𝐴𝑅𝐼) =
− ln (− 𝑙𝑛 (𝐴𝑅𝐼−1
𝐴𝑅𝐼)), 𝐴𝑅𝐼 =
𝑁+1
𝑖;i = position of the i-th value of rainfall depth, according to increasing ordered
data);�̅�𝑁, the “reduced” average value (�̅�𝑁 =1
𝑁∑ 𝑌𝑖
𝑁𝑖=1 ); 𝑆𝑁, the standard deviation of the “reduced” variable (𝑆𝑁 =
√1
𝑁−1∑ (𝑌𝑖 − �̅�𝑁)2𝑁
𝑖=1 ).

E-proceedings of the 38th IAHR World CongressSeptember 1-6, 2019, Panama City, Panama
1210
For each duration (5,10,15, 20, 25, 30 minutes), defined ℎ̅and 𝑆ℎ, the parameters of Gumbel’s method may be determined:
𝑀𝑂𝐷𝐴 = ℎ̅ −𝑆ℎ
𝑆𝑁
�̅�𝑁 [13]
𝐴𝐿𝑃𝐻𝐴 =𝑆ℎ
𝑆𝑁
[14]
Through these parameters, for fixed ARI, the rainfall depth (ℎ𝐴𝑅𝐼) values are computed for each duration. By linearly interpolating the values (log(t), log(hARI)), the parameter a and n of the Rainfall-Duration-Frequency curve are derived:
ℎ𝐴𝑅𝐼,𝑡 = 𝑎(𝐴𝑅𝐼) ∙ 𝑡𝑛 [15]
Unfortunately, rainfall records with duration shorter than 1 hour are not always available. However, rainfall data with duration longer than 1 hour (appropriately elaborated through the Gumbel’s statistical method) can be considered. To apply the corresponding parameters of the Rainfall-Duration-Frequency curve to durations of rainfall event shorter than 1 hour, these data must be properly re-scaled. To this purpose, several relationships have been proposed in literature; among these, Bell’s relationship (1969) is the most commonly used formulation:
ℎ𝐴𝑅𝐼,𝑡
ℎ𝐴𝑅𝐼,𝑡=60𝑚𝑖𝑛
= (0.54 ∙ 𝑡0.25 − 0.50) [16]
ℎ𝐴𝑅𝐼,𝑡=60𝑚𝑖𝑛 being the rainfall depth corresponding to the event with duration equal to 1 hour.
4 ANALYSIS OF THE AQUAPLANING PHENOMENON The removal of water from the carriageway must be as quickly as possible to provide safety and minimum
nuisance to the travelling publics, referring to the occurrence of the aquaplaning phenomenon. To this purpose, drainage systems and road geometry must be properly designed to avoid the accumulation of water on the road platform. Referring to the drainage, continuum grid systems can be installed; regarding the road geometry, the cross slope (ST) must be appropriately designed according to the width of the road platform (WF).The aquaplaning phenomenon is generally evaluated in terms of “aquaplaning velocity”, beyond which aquaplaning occurs. For this aim, the rainfall depth on the road platform (depending on the design rainfall intensity) must be determined. The following formulation may be applied:
Macchione and Veltri (1988)
𝑦 = 0.0838 ∙ 𝐾𝑠−0.6(𝑊𝐹𝑖𝑡,𝐴𝑅𝐼)
0.6𝑆𝑇
−0.3 [17]
with y = water depth on the road platform (mm); Ks = Gauckler-Strickler’s coefficient (for concrete/asphalt surface, the recommended values are 70-100 m1/3/s). The VERT (VEhicles for Road Transport) European Project (2017)
𝑦 = 0.26 ∙ 𝐸𝑇𝐷0.4(𝑊𝐹𝑖𝑡,𝐴𝑅𝐼)
0.4
𝑃𝑔𝑒𝑜𝑑0.3 − 𝐸𝑇𝐷 + 0.3 [18]
ETD being the type of road pavement (suggested values, 0.84 – 0.92, according to adherence); Pgeod, the geodetic slope resulting from the combination of the cross and longitudinal slopes.
The water depth on the road platform (y) can be used to evaluate the small storage volumes, as previously introduced. Finally, the aquaplaning velocity(Vaq) may be determined as (Galloway, 1979):
𝑉𝑎𝑞 = 0.9143 ∙ 𝑆𝐷0.04 ∙ 𝑃𝑝0.3(𝑇𝑇𝐷 + 0.794)0.06 ∙ 𝐴 [19]
SD being the percentage of Spin Down (SD = 100% for total aquaplaning); A, a coefficient related to y; Pp, the inflating pression; TTD, the tired tread.

E-proceedings of the 38th IAHR World CongressSeptember 1-6, 2019, Panama City, Panama
1211
5 THE CASE STUDY OF THE COLLAPSED VIADUCT OVER THE POLCEVERA RIVER, IN GENOA On 14 August 2018 at 11:35 AM, a relevant portion (about 243 m) of the viaduct over the Polcevera River
(known as “Morandi Bridge”) in Genoa collapsed and 43 people died. The bridge was designed in the early 1960s by R. Morandi and opened to the public in 1967. The collapsed part of the bridge essentially comprised an individual self-standing structure spanning 171 m and two simply-supported connecting Gerber beam systems, each spanning 36 m from the self-standing structure to the adjacent portions of the bridge (Figure 1).
Figure 1. Morandi Bridge: a) overview of the collapse; b) involved structures in the collapse, i.e. tower 9 and Gerber decks (adapted from Bazzucchi et al. 2018).
The highway bridge spanning over the Polcevera River is an important, strategic, infrastructure linking Milano and Genova with the “Riviera dei Fiori” and France; currently, the road connections are very difficult. To avoid large, additional, economic losses, the new viaduct must be re-build as soon as possible.
ITALFERR Spa (Italian State Railways Group) has been chosen to develop the executive project of the new bridge, designed by the famous architect Renzo Piano (Figure 2). A new challenge for ITALFERR Spa, engineering society with years of experience in the design of railway viaducts/bridges.
Figure 2. Polcevera bridge: render of the project by Renzo Piano.
The project was developed with the constant collaboration/interactionbetweenseveral specialists (structural, hydraulic, geotechnical, environmental and industrial engineering). The main hydraulic aspects have concerned the Polcevera River and the road platform drainage system.
In this paper, the procedure to evaluate the design peak discharges of the road platform drainage system is described in detail.
5.1 Hydrological analyses
E-proceedings of the 38th IAHR World CongressSeptember 1-6, 2019, Panama City, Panama
1212
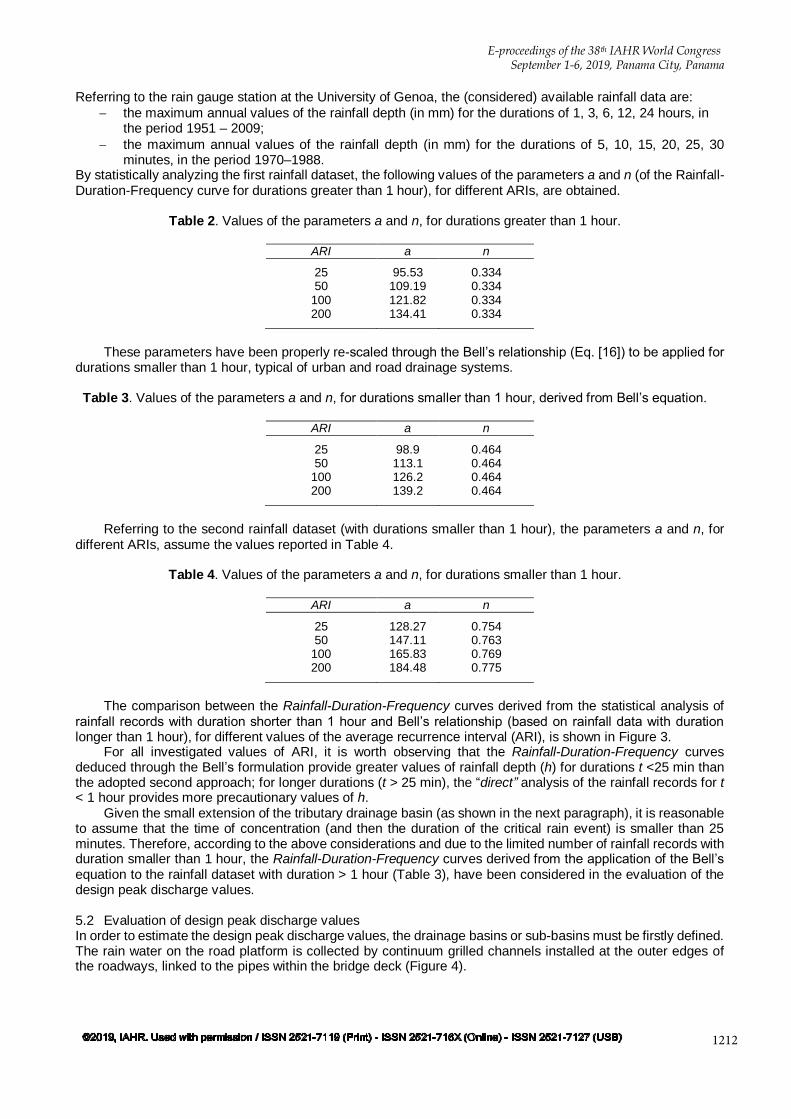
Referring to the rain gauge station at the University of Genoa, the (considered) available rainfall data are:
the maximum annual values of the rainfall depth (in mm) for the durations of 1, 3, 6, 12, 24 hours, inthe period 1951 – 2009;
the maximum annual values of the rainfall depth (in mm) for the durations of 5, 10, 15, 20, 25, 30minutes, in the period 1970–1988.
By statistically analyzing the first rainfall dataset, the following values of the parameters a and n (of the Rainfall-Duration-Frequency curve for durations greater than 1 hour), for different ARIs, are obtained.
Table 2. Values of the parameters a and n, for durations greater than 1 hour.
ARI a n
25 95.53 0.334 50 109.19 0.334
100 121.82 0.334 200 134.41 0.334
These parameters have been properly re-scaled through the Bell’s relationship (Eq. [16]) to be applied for durations smaller than 1 hour, typical of urban and road drainage systems.
Table 3. Values of the parameters a and n, for durations smaller than 1 hour, derived from Bell’s equation.
ARI a n
25 98.9 0.464 50 113.1 0.464
100 126.2 0.464 200 139.2 0.464
Referring to the second rainfall dataset (with durations smaller than 1 hour), the parameters a and n, for different ARIs, assume the values reported in Table 4.
Table 4. Values of the parameters a and n, for durations smaller than 1 hour.
ARI a n
25 128.27 0.754 50 147.11 0.763
100 165.83 0.769 200 184.48 0.775
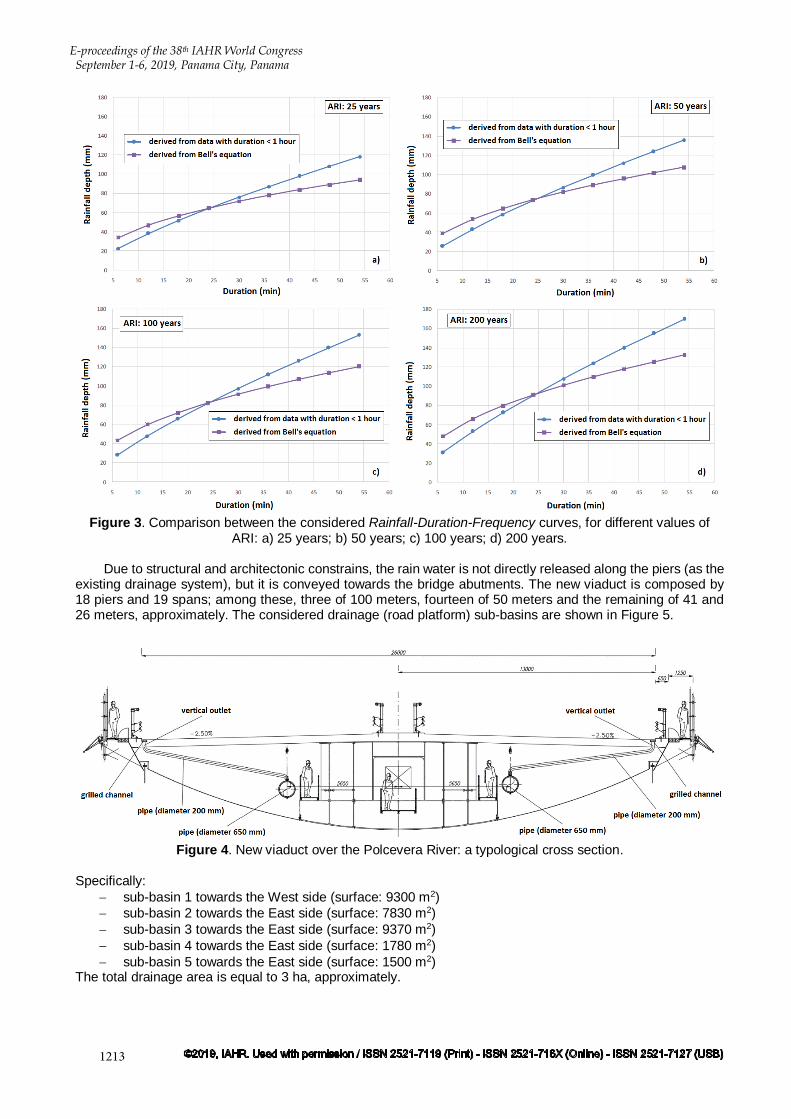
The comparison between the Rainfall-Duration-Frequency curves derived from the statistical analysis of rainfall records with duration shorter than 1 hour and Bell’s relationship (based on rainfall data with duration longer than 1 hour), for different values of the average recurrence interval (ARI), is shown in Figure 3.
For all investigated values of ARI, it is worth observing that the Rainfall-Duration-Frequency curves deduced through the Bell’s formulation provide greater values of rainfall depth (h) for durations t <25 min than the adopted second approach; for longer durations (t > 25 min), the “direct” analysis of the rainfall records for t < 1 hour provides more precautionary values of h.
Given the small extension of the tributary drainage basin (as shown in the next paragraph), it is reasonable to assume that the time of concentration (and then the duration of the critical rain event) is smaller than 25 minutes. Therefore, according to the above considerations and due to the limited number of rainfall records with duration smaller than 1 hour, the Rainfall-Duration-Frequency curves derived from the application of the Bell’s equation to the rainfall dataset with duration > 1 hour (Table 3), have been considered in the evaluation of the design peak discharge values.
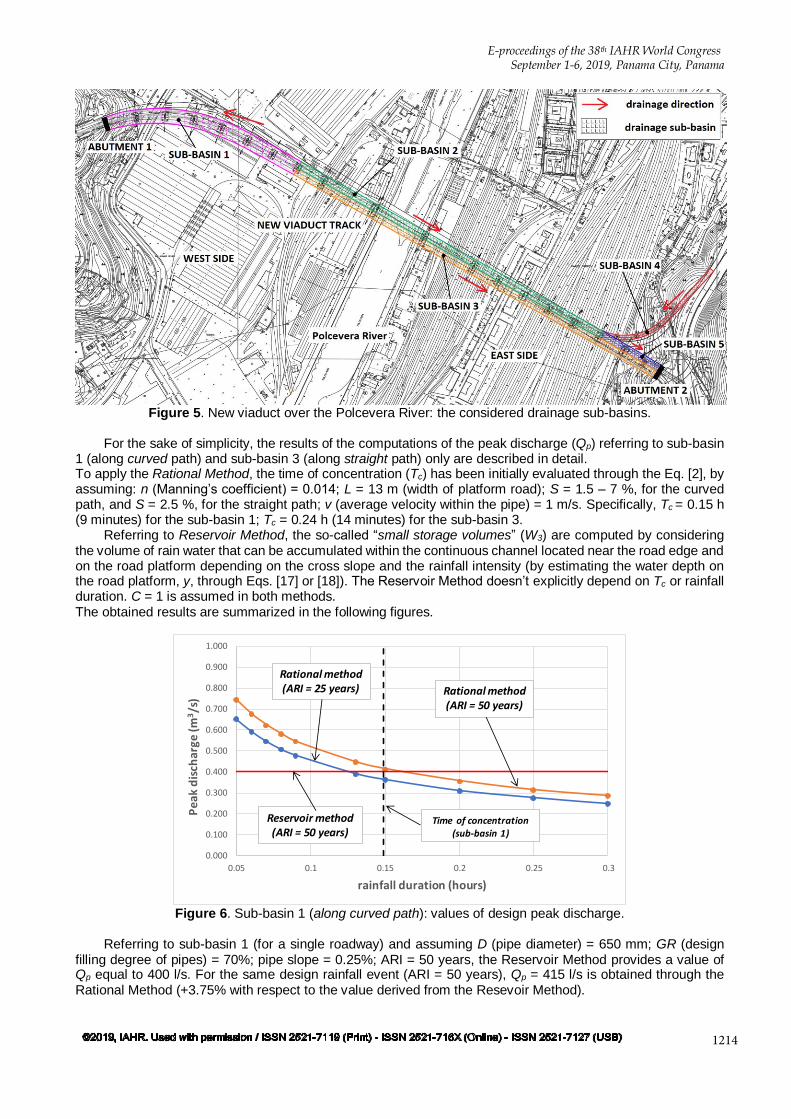
5.2 Evaluation of design peak discharge values In order to estimate the design peak discharge values, the drainage basins or sub-basins must be firstly defined. The rain water on the road platform is collected by continuum grilled channels installed at the outer edges of the roadways, linked to the pipes within the bridge deck (Figure 4).
E-proceedings of the 38th IAHR World CongressSeptember 1-6, 2019, Panama City, Panama
1213
Figure 3. Comparison between the considered Rainfall-Duration-Frequency curves, for different values of ARI: a) 25 years; b) 50 years; c) 100 years; d) 200 years.
Due to structural and architectonic constrains, the rain water is not directly released along the piers (as the existing drainage system), but it is conveyed towards the bridge abutments. The new viaduct is composed by 18 piers and 19 spans; among these, three of 100 meters, fourteen of 50 meters and the remaining of 41 and 26 meters, approximately. The considered drainage (road platform) sub-basins are shown in Figure 5.
Figure 4. New viaduct over the Polcevera River: a typological cross section.
Specifically:
sub-basin 1 towards the West side (surface: 9300 m2)
sub-basin 2 towards the East side (surface: 7830 m2)
sub-basin 3 towards the East side (surface: 9370 m2)
sub-basin 4 towards the East side (surface: 1780 m2)
sub-basin 5 towards the East side (surface: 1500 m2)The total drainage area is equal to 3 ha, approximately.
E-proceedings of the 38th IAHR World CongressSeptember 1-6, 2019, Panama City, Panama
1214
Figure 5. New viaduct over the Polcevera River: the considered drainage sub-basins.
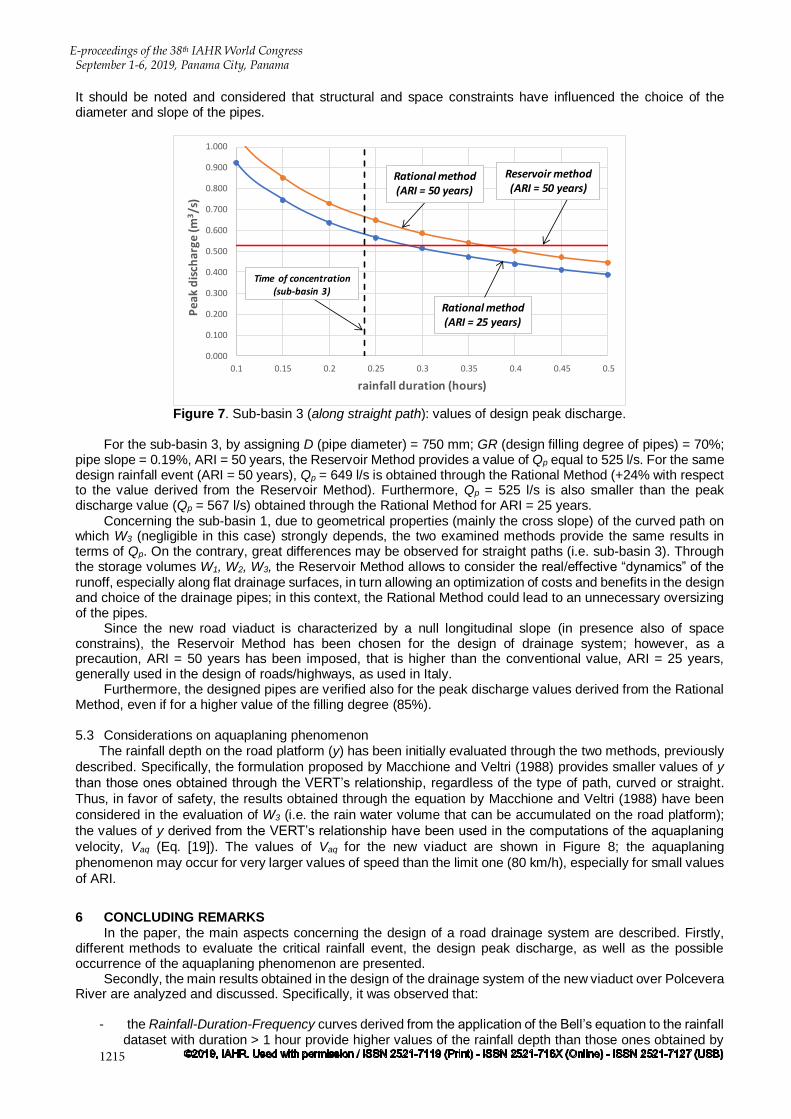
For the sake of simplicity, the results of the computations of the peak discharge (Qp) referring to sub-basin 1 (along curved path) and sub-basin 3 (along straight path) only are described in detail. To apply the Rational Method, the time of concentration (Tc) has been initially evaluated through the Eq. [2], by assuming: n (Manning’s coefficient) = 0.014; L = 13 m (width of platform road); S = 1.5 – 7 %, for the curved path, and S = 2.5 %, for the straight path; v (average velocity within the pipe) = 1 m/s. Specifically, Tc = 0.15 h (9 minutes) for the sub-basin 1; Tc = 0.24 h (14 minutes) for the sub-basin 3.
Referring to Reservoir Method, the so-called “small storage volumes” (W3) are computed by considering the volume of rain water that can be accumulated within the continuous channel located near the road edge and on the road platform depending on the cross slope and the rainfall intensity (by estimating the water depth on the road platform, y, through Eqs. [17] or [18]). The Reservoir Method doesn’t explicitly depend on Tc or rainfall duration. C = 1 is assumed in both methods. The obtained results are summarized in the following figures.
Figure 6. Sub-basin 1 (along curved path): values of design peak discharge.
Referring to sub-basin 1 (for a single roadway) and assuming D (pipe diameter) = 650 mm; GR (design filling degree of pipes) = 70%; pipe slope = 0.25%; ARI = 50 years, the Reservoir Method provides a value of Qp equal to 400 l/s. For the same design rainfall event (ARI = 50 years), Qp = 415 l/s is obtained through the Rational Method (+3.75% with respect to the value derived from the Resevoir Method).
0.000
0.100
0.200
0.300
0.400
0.500
0.600
0.700
0.800
0.900
1.000
0.05 0.1 0.15 0.2 0.25 0.3
Pe
ak d
isch
arge
(m3/s
)
rainfall duration (hours)
Rational method (ARI = 50 years)
Rational method (ARI = 25 years)
Time of concentration (sub-basin 1)
Reservoir method (ARI = 50 years)
E-proceedings of the 38th IAHR World CongressSeptember 1-6, 2019, Panama City, Panama
1215
It should be noted and considered that structural and space constraints have influenced the choice of the diameter and slope of the pipes.
Figure 7. Sub-basin 3 (along straight path): values of design peak discharge.
For the sub-basin 3, by assigning D (pipe diameter) = 750 mm; GR (design filling degree of pipes) = 70%; pipe slope = 0.19%, ARI = 50 years, the Reservoir Method provides a value of Qp equal to 525 l/s. For the same design rainfall event (ARI = 50 years), Qp = 649 l/s is obtained through the Rational Method (+24% with respect to the value derived from the Reservoir Method). Furthermore, Qp = 525 l/s is also smaller than the peak discharge value (Qp = 567 l/s) obtained through the Rational Method for ARI = 25 years.
Concerning the sub-basin 1, due to geometrical properties (mainly the cross slope) of the curved path on which W3 (negligible in this case) strongly depends, the two examined methods provide the same results in terms of Qp. On the contrary, great differences may be observed for straight paths (i.e. sub-basin 3). Through the storage volumes W1, W2, W3, the Reservoir Method allows to consider the real/effective “dynamics” of the runoff, especially along flat drainage surfaces, in turn allowing an optimization of costs and benefits in the design and choice of the drainage pipes; in this context, the Rational Method could lead to an unnecessary oversizing of the pipes.
Since the new road viaduct is characterized by a null longitudinal slope (in presence also of space constrains), the Reservoir Method has been chosen for the design of drainage system; however, as a precaution, ARI = 50 years has been imposed, that is higher than the conventional value, ARI = 25 years, generally used in the design of roads/highways, as used in Italy.
Furthermore, the designed pipes are verified also for the peak discharge values derived from the Rational Method, even if for a higher value of the filling degree (85%).
5.3 Considerations on aquaplaning phenomenon The rainfall depth on the road platform (y) has been initially evaluated through the two methods, previously
described. Specifically, the formulation proposed by Macchione and Veltri (1988) provides smaller values of y
than those ones obtained through the VERT’s relationship, regardless of the type of path, curved or straight.
Thus, in favor of safety, the results obtained through the equation by Macchione and Veltri (1988) have been
considered in the evaluation of W3 (i.e. the rain water volume that can be accumulated on the road platform);
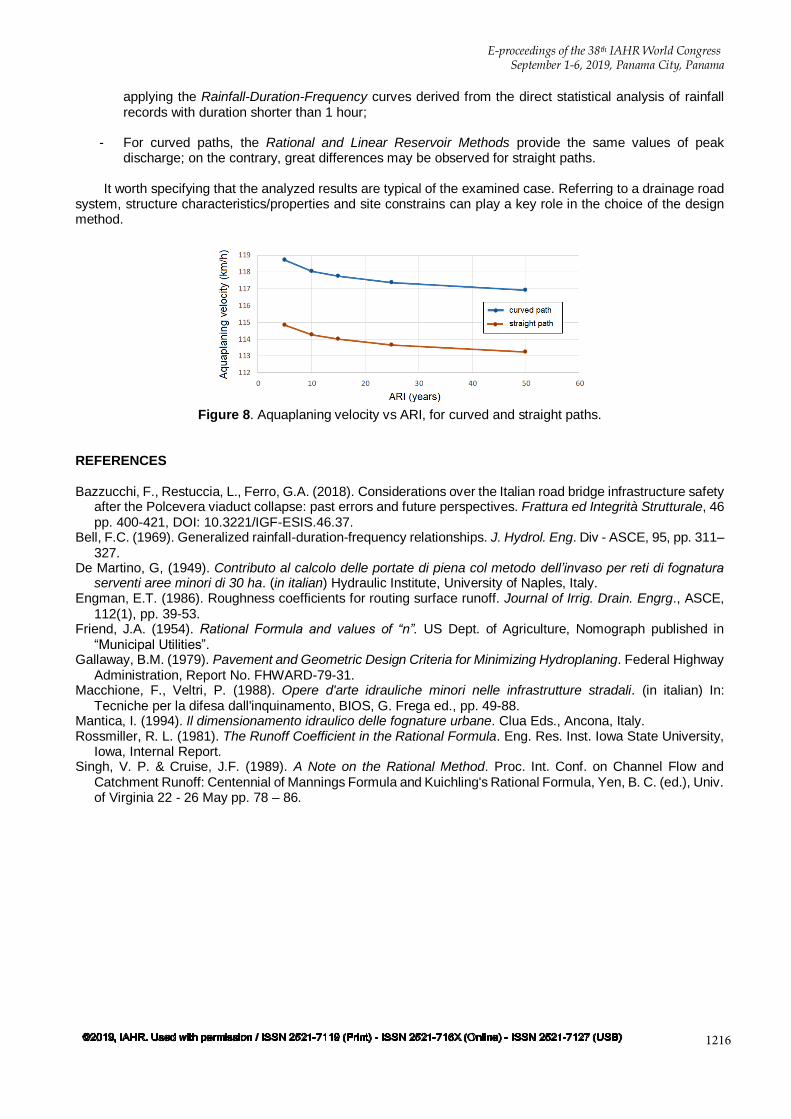
the values of y derived from the VERT’s relationship have been used in the computations of the aquaplaning
velocity, Vaq (Eq. [19]). The values of Vaq for the new viaduct are shown in Figure 8; the aquaplaning
phenomenon may occur for very larger values of speed than the limit one (80 km/h), especially for small values
of ARI.
6 CONCLUDING REMARKS In the paper, the main aspects concerning the design of a road drainage system are described. Firstly,
different methods to evaluate the critical rainfall event, the design peak discharge, as well as the possible occurrence of the aquaplaning phenomenon are presented.
Secondly, the main results obtained in the design of the drainage system of the new viaduct over Polcevera River are analyzed and discussed. Specifically, it was observed that:
- the Rainfall-Duration-Frequency curves derived from the application of the Bell’s equation to the rainfalldataset with duration > 1 hour provide higher values of the rainfall depth than those ones obtained by
0.000
0.100
0.200
0.300
0.400
0.500
0.600
0.700
0.800
0.900
1.000
0.1 0.15 0.2 0.25 0.3 0.35 0.4 0.45 0.5
Pe
ak d
isch
arge
(m3/s
)
rainfall duration (hours)
Rational method (ARI = 50 years)
Time of concentration (sub-basin 3)
Rational method (ARI = 25 years)
Reservoir method (ARI = 50 years)
E-proceedings of the 38th IAHR World CongressSeptember 1-6, 2019, Panama City, Panama
1216
applying the Rainfall-Duration-Frequency curves derived from the direct statistical analysis of rainfall records with duration shorter than 1 hour;
- For curved paths, the Rational and Linear Reservoir Methods provide the same values of peakdischarge; on the contrary, great differences may be observed for straight paths.
It worth specifying that the analyzed results are typical of the examined case. Referring to a drainage road system, structure characteristics/properties and site constrains can play a key role in the choice of the design method.
Figure 8. Aquaplaning velocity vs ARI, for curved and straight paths.
REFERENCES
Bazzucchi, F., Restuccia, L., Ferro, G.A. (2018). Considerations over the Italian road bridge infrastructure safety after the Polcevera viaduct collapse: past errors and future perspectives. Frattura ed Integrità Strutturale, 46 pp. 400-421, DOI: 10.3221/IGF-ESIS.46.37.
Bell, F.C. (1969). Generalized rainfall-duration-frequency relationships. J. Hydrol. Eng. Div - ASCE, 95, pp. 311–327.
De Martino, G, (1949). Contributo al calcolo delle portate di piena col metodo dell’invaso per reti di fognatura serventi aree minori di 30 ha. (in italian) Hydraulic Institute, University of Naples, Italy.
Engman, E.T. (1986). Roughness coefficients for routing surface runoff. Journal of Irrig. Drain. Engrg., ASCE, 112(1), pp. 39-53.
Friend, J.A. (1954). Rational Formula and values of “n”. US Dept. of Agriculture, Nomograph published in “Municipal Utilities”.
Gallaway, B.M. (1979). Pavement and Geometric Design Criteria for Minimizing Hydroplaning. Federal Highway Administration, Report No. FHWARD-79-31.
Macchione, F., Veltri, P. (1988). Opere d'arte idrauliche minori nelle infrastrutture stradali. (in italian) In: Tecniche per la difesa dall'inquinamento, BIOS, G. Frega ed., pp. 49-88.
Mantica, I. (1994). Il dimensionamento idraulico delle fognature urbane. Clua Eds., Ancona, Italy. Rossmiller, R. L. (1981). The Runoff Coefficient in the Rational Formula. Eng. Res. Inst. Iowa State University,
Iowa, Internal Report. Singh, V. P. & Cruise, J.F. (1989). A Note on the Rational Method. Proc. Int. Conf. on Channel Flow and
Catchment Runoff: Centennial of Mannings Formula and Kuichling's Rational Formula, Yen, B. C. (ed.), Univ. of Virginia 22 - 26 May pp. 78 – 86.