Design of automotive structural components using high ...
163
Missouri University of Science and Technology Missouri University of Science and Technology Scholars' Mine Scholars' Mine Center for Cold-Formed Steel Structures Library Wei-Wen Yu Center for Cold-Formed Steel Structures 01 Jan 1989 Design of automotive structural components using high strength Design of automotive structural components using high strength sheet steels the effect of strain rate on mechanical properties of sheet steels the effect of strain rate on mechanical properties of sheet steels sheet steels Maher Kassar Wei-wen Yu Missouri University of Science and Technology, [email protected] Follow this and additional works at: https://scholarsmine.mst.edu/ccfss-library Part of the Structural Engineering Commons Recommended Citation Recommended Citation Kassar, Maher and Yu, Wei-wen, "Design of automotive structural components using high strength sheet steels the effect of strain rate on mechanical properties of sheet steels" (1989). Center for Cold-Formed Steel Structures Library. 144. https://scholarsmine.mst.edu/ccfss-library/144 This Technical Report is brought to you for free and open access by Scholars' Mine. It has been accepted for inclusion in Center for Cold-Formed Steel Structures Library by an authorized administrator of Scholars' Mine. This work is protected by U. S. Copyright Law. Unauthorized use including reproduction for redistribution requires the permission of the copyright holder. For more information, please contact [email protected].
-
Upload
khangminh22 -
Category
Documents
-
view
0 -
download
0
Transcript of Design of automotive structural components using high ...

Missouri University of Science and Technology Missouri University of Science and Technology
Scholars' Mine Scholars' Mine
Center for Cold-Formed Steel Structures Library Wei-Wen Yu Center for Cold-Formed Steel Structures
01 Jan 1989
Design of automotive structural components using high strength Design of automotive structural components using high strength
sheet steels the effect of strain rate on mechanical properties of sheet steels the effect of strain rate on mechanical properties of
sheet steels sheet steels
Maher Kassar
Wei-wen Yu Missouri University of Science and Technology, [email protected]
Follow this and additional works at: https://scholarsmine.mst.edu/ccfss-library
Part of the Structural Engineering Commons
Recommended Citation Recommended Citation Kassar, Maher and Yu, Wei-wen, "Design of automotive structural components using high strength sheet steels the effect of strain rate on mechanical properties of sheet steels" (1989). Center for Cold-Formed Steel Structures Library. 144. https://scholarsmine.mst.edu/ccfss-library/144
This Technical Report is brought to you for free and open access by Scholars' Mine. It has been accepted for inclusion in Center for Cold-Formed Steel Structures Library by an authorized administrator of Scholars' Mine. This work is protected by U. S. Copyright Law. Unauthorized use including reproduction for redistribution requires the permission of the copyright holder. For more information, please contact [email protected].

Civil Engineering Study 89-2Structural Series
Eleventh Progress Report
DESIGN OF AUTOMOTIVE STRUCTURAL COMPONENTSUSING HIGH STRENGTH SHEET STEELS
THE EFFECT OF STRAIN RATE ON MECHANICAL PROPERTIES OF SHEET STEELS
by
Maher KassarResearch Assistant
Wei-Wen YuProject Director
A Research Project Sponsored by the American Iron and Steel Institute
January 1989
Department of Civil EngineeringUniversity of Missouri-Rolla
Rolla, Missouri

ii
TABLE OF CONTENTS
Page
LIST OF TABLES iv
LIST OF FIGURES vii
I. INTRODUCTION.............................................. 1
II. REVIEW OF LITERATURE..................................... 3
A. MECHANICAL PROPERTIES OF SHEET STEELS....... 3
1. Engineering Stress-Strain Curves , 3
2. True Stress-Strain Curves................ 7
B. STRAIN RATE 9
1. Strain-Rate Dynamic Testing. . . . . . . . . . . . . . . . . . . . . . . . 9
2. Effect of Strain Rate on Mechanical Properties..... 11
a. Structural Steels and High Strength Steels...... 11
b. Stainless Steels................................ 18
c. Aluminum........................................ 19
~. Strain-Rate History Effect........ 20
III. EXPERIMENTAL PROGRAM 24
A. MATERIALS 24
B. UNIAXIAL TESTS 24
1. ASTM Specifications..................... . . . . . . . . . . . 25
2. Specimens........................................... 25
3. Equipment.......................................... 26
4. Procedure.......................................... 28

TABLE OF CONTENTS (Cont.)
C. RESULTS
1. Stress-Strain Curves .
2. Mechanical Properties .
a. Yield Strength or Yield Point .
b. Ultimate Tensile Strength .
c. Ductility .
D. DISCUSSION .
1. Mechanical Properties .
a. Yield Strength or Yield Point .
b. Ultimate Tensile Strength .
2. Strain-Rate Sensitivity .
IV. CONCLUSIONS .
ACKNOWLEDGMENTS .
REFERENCES .
iii
Page
30
30
31
32
33
33
33
33
34
34
35
37
39
40

iv
LIST OF TABLES
Table
2.1
2.2
Dynamic Aspects of Mechanical Testing30 .
Experimental Techniques for High Strain Rate Testing32
Page
45
46
2.3 Values of Strain Rate Sensitivity Exponent, m, and
Constant C of Yield Strength of the Tested Materials40 46
2.4 Standard Strain Rate Sensitivity and New Strain Rate
40Parameters . . . . . . . . . . . . . . . . . . . . . . . . . . . . . . . . . . . . . . . . . . . . . . 47
2.5 Strain Rate Sensitivity for Different Microstructures
Determined by Strain Rate Jump Tests at 6.7 x 10⁻⁵
-1 -4 -1 10-3-1sec , 6.7 x 10 sec , and 6.7 x sec (Ref. 46) ... 47
3.1
3.2
Chemical Compositions of the Sheet Steels Used .
Classification of the MTS Extensometer .
48
48
3.3 MTS Transducer Ranges and the Corresponding Load,
Strain, or Displacement Values.. 49
3.4 Ramp Time 1 and the Corresponding Strain Rate . 49
3.5 Tested Mechanical Properties of 100XF Sheet Steel,
Virgin Material.. . . . . . . . . . . . . . . . . . . . . . . . . . . . . . . . . . . . . . . . . . 50
3.6 Tested Mechanical Properties of 50XF Sheet Steel,
Virgin Material '.' . . . . . . . . . 51
3.7 Tested Mechanical Properties of 50XF Sheet Steel,
2% Cold Stretched, Non-Aged Material...................... 52
3.8 Tested Mechanical Properties of SOXF Sheet Steel,
8% Cold Stretched, Non-Aged Material.................. .... 52

v
LIST OF TABLES (cont.)
Table Page
3.9 Tested Mechanical Properties of 50XF Sheet Steel,
2% Cold Stretched, Aged Material............... 53
3.10 Tested Mechanical Properties of 50XF Sheet Steel,
8% Cold Stretched, Aged Material............. .... .... ..... 53
3.11 Tested Mechanical Properties of 35XF Sheet Steel,
Virgin Material. . . . . . . . . . . . . . . . . . . . . . . . . . . . . . . . . . . . . . . . . . . 54
3.12 Tested Mechanical Properties of 35XF Sheet Steel,
2% Cold Stretched, Non-Aged Material............... 55
3.13 Tested Mechanical Properties of 35XF Sheet Steel,
8% Cold Stretched, Non-Aged Material.... 55
3.14 Tested Mechanical Properties of 35XF Sheet Steel,
2% Cold Stretched, Aged Material..................... ..... 56
3.15 Tested Mechanical Properties of 35XF Sheet Steel,
8% Cold Stretched, Aged Material , 56
3.16 Average Tested Mechanical Properties of 100XF Sheet Steel,
Longitudinal Tension, Virgin Material.. 57
3.17 Average Tested Mechanical Properties of 100XF Sheet Steel,
Transverse Tension, Virgin Material. . . . . . . . . . . . .. . . . . . . . . . 57
3.18 Average Tested Mechanical Properties of 50XF Sheet Steel,
Longitudinal Tension...................................... 58
3.19 Average Tested Mechanical Properties of 50XF Sheet Steel,
Transverse Tension. . . . . . . . . . . . . . . . . . . . . . . . . . . . . . . . . . . . . . . . 59

vi
LIST OF TABLES (Cont.)
Table Page
3.20 Average Tested Mechanical Properties of 35XF Sheet Steel,
Longitudinal Tension.. . . . . . . . . . . . . . . . . . . . . . . . . . . . . . . . . . . . 60
3.21 Average Tested Mechanical Properties of 35XF Sheet Steel,
Transverse Tension.. . . . . . . . . . . . . . . . . . . . . . . . . . . . . . . . . . . . . . 61
3.22 Ratios of Dynamic to Static Mechanical Properties for
Three Sheet Steels Based on Tables 3.16 to 3.21.......... 62
3.23 Values of Strain Rate Sensitivity m for Three Sheet
Steels Based on the Changes of the Yield Stresses at
Different Strain Rates. . . . . . . . . . . . . . . . . . . . . . . . . . . . . . . . . . . 63

vii
LIST OF FIGURES
Figure Page
2.1 24Stress-Strain Curves of Carbon Steel Sheets . 64
2.2 Determination of Yield Point for Gradual-Yielding
24Steel , . . . . . . . . . . . . . . . . . . . . . . . . . . . . . . . . . . . . . . 65
662.4
2.3 Effects of Strain Hardening and Strain Aging on Stress-
Strain Characteristics24..................... 65
Influence of Bauschinger Effect28 .
2.5 Comparison of Engineering and True Stress-Strain
25Curves " . . . . . . . . . . . . . . . . . . . . . 66
2.6 Effect of Strain Rate on Stress-Strain Curve
34for Structural Steel....................... 67
2.7 True Yield Stresses at Various Strains Versus Strain
37Rate for a Low-Carbon Steel at Room Temperature 67
2.8 True Yield Stresses at Various Strains Versus Strain
o 37 'Rate for a Low-Carbon Steel at 200 C...... 68
2.9 True Yield Stresses at Various Strains Versus Strain
o 37Rate for a Low-Carbon Steel at 400 C...... 68
2.10 True Yield Stresses at Various Strains Versus Strain
o 37Rate for a Low-Carbon Steel at 600 C...... 69
o. 0
2.11 Effect of Strain Rate at -50, 75, and 600 F on the
39Yield and Tensile Strengths of USS COR-TEN Steel 70000
2.12 Effect of Strain Rate at -50, 75, and 600 F on the
Yield and Tensile Strengths of USS TRI-TEN Steel39 ..... 71

viii
LIST OF FIGURES (Cont.)
Figure Page
2.13 Effect of Strain Rate on Mechanical Properties of a
40HSLA Steel . . . . . . . . . . . . . . . . . . . . . . . . . . . . . . . . . . . . . . . . . . . 72
2.14 Strain-Rate Changes During Tensile Test, Four Strain
-1 -2 -3 -4-1Rate Shown Are 10 , 10 ,10 ,and 10 sec
(Ref. 41).............................................. 72
2.15 Effect of Crosshead Speed on Yield Behavior and Tensile
42Strength
2.16 Stress-Strain Curves for SA-106 Carbon Steel Pipe43
73
73
2.17 The Variation of the Strain Rate Sensitivity (m-value)
With Strain Rate44. . . . . . . . . . . . . . . . . . . . . . . . . . . . . . . . . . . . . 74
2.18 Stress-Strain Curves for High Strength Steel at Varying
Strain Rate45 •.................................... _. . . . . 74
2.19 Dynamic Stress-Strain Curves for AISI Type ,304
Stainless Steel47 ...................................... 75
2.20 Dynamic Stress-Strain Diagram of AISI Type 304L
Stainless Steel47 ...................................... 75
2.21 Dynamic Stress-Strain Diagram -of AISI Type 347
Stainless Steel47 ...................................... 76
2.22 The Ambient-Temperature Yield Stress of Anneald Type
21-6-9 Stainless Steel As a Function of Strain Rate48 .. 76
2.23 Analysis of the Uniaxial Stress, Strain, and Strain Rate
Data for Aluminum 1060-049 ..... 77

ix
LIST OF FIGURES (Cont.)
Figure Page
2.24 Dynamic Yeild Stress (Minus the Static Yeild Stress)
50Versus Strain Rate for Steel......................... 78
2.25 Dynamic Yeild Stress (Minus the Static Yeild Stress)
Versus Strain Rate for Aluminum50 ...................... 78
2.26 Strain and Strain-Rate Dependence of the Flow Stress of
High-Purity Aluminum51 . . . . . . . . . . .. . . . . .... .... .. .. .. . . . 79
2.27 Strain and Strain-Rate Dependence of the Flow Stress
of Aluminum 1060-051 ................................... 79
2.28 Strain and Strain-Rate Dependence of the Flow Stress
51of Aluminum 1100-0 . . . . . . . . . . . . . . . . . . . . . . . . . . . . 79
2.29 Compression Tests on Aluminums 7075-T6 and 6061-T653 ... 80
2.30 Strain-Rate Sensitivity of Aluminum Alloys31........... 80
2.31 Cyclic Static-Dynamic-Static Loading for Aluminum52 .... 81
2.32 Cyclic Dynamic-Static-Dynamic Loading for Aluminum52 81
2.33 Cyclic Dynamic Loading for Aluminum52 . 82
2.34 Effect of Alteration of Strain Rate Upon Flow Stress
( Static-Dynamic )55................................... 83
2.35 Effect of Alteration of Strain Rate Upon Flow Stress
( Dynamic-Static )55................................... 83
2.36 Results of Constant and Incremental Strain-Rate Tests on
571020 Hot Rolled Steel (HRS) . . . . . . . . . . . . . . . . . . . . . . . . . . 84
2.37 Results of Constant and Incremental Strain-Rate Tests on
571080 Cold Rolled Steel (eRS) 84

x
LIST OF FIGURES (Cont.)
Figure Page
2.38 Tensile True Stress-True Strain Curves at Ambient
Temperature for Monotonic Loading to Fracture at a
-1 -1Strain Rate of O.OO~ sec (Curve A) and 500 sec
(Curve B), and for Quasi Static Prestraining Followed
54by Dynamic Reloading to Fracture 85
3.1 11Location of Tension and Compression Coupons 86
3.2 Nominal Dimensions of Tension Coupons Used for 100XF,
1150XF, and 35XF 87
3.3 Material Test System (MTS) 880 Used for Tension Tests.. 88
3.4 MTS 880 Test Controller and Function Generator , 89
3.5 Data Acquisition System.......................... . . . . . . . 90
3.6 Data General Graphic Display Terminal............. ..... 91
3.7 Data General MV-10000 Mini Computer............. 92
3.8a Test Setup Showing the Attachment of Extensometer...... 93
3.8b Test Setup Showing the Attachment of Extensometer...... 94
3.9 IBM PS/2 Model 30 Personal Computer with IBM Color
Plotter and NEC Pinwriter P5XL Printer......... 95
3.10 MTS 880 Automated Test System and Software Overview.... 96
3.11 MTS 880 Test Controller Servo Control Loop............. 97
3.12 Typical Test Function Generator Ramp Waveform.......... 98
3.13 Strain-Time Curve for 100XF-LT-l,(Virgin Material)..... 99
3.14 Strain-Time Curve for 100XF-LT-3,(Virgin Material)..... 100
xi
LIST OF FIGURES (Cont.)
3.18
3.17
3.15
3.16
Figure
Strain-Time Curve for 35XF-LT-7,(Virgin Material) .
Stress-Strain Curves for 100XF-LT-1. 100XF-LT-4.
and 100XF-LT-6.(Virgin Material) .
Stress-Strain Curves for 100XF-TT-2. 100XF-TT-4.
and 100XF-TT-S.(Virgin Material) ,
Stress-Strain Curves for 50XF-LT-1, SOXF-LT-4.
and 50XF-LT-9,(Virgin Material) .
3.19 Stress-Strain Curves for SOXF-TT-1, SOXF-TT-6.
Page
101
102
103
104
and 50XF-TT-9, (Virgin Material)... . . . . . . . . . . . . . . . . . . . . . 105
3.20 Stress-Strain Curves for SOXF-LT-1, SOXF-LT-4. and
SOXF-LT-S, (2% Cold-Stretched,Non-Aged Material)........ 106
3.21 Stress-Strain Curves for SOXF-TT-1 and SOXF-TT-3.
(2% Cold-Stretched. Non-Aged Material)". . . . . . . . . . . . . . . . . . 107
3.22 Stress-Strain Curves for 50XF-LT-1, 50XF-LT-4, and
SOXF-LT-6.(8% Cold-Stretched,Non-Aged Material)........ 108
3.23 Stress-Strain Curves for 50XF-TT-1 and 50XF-TT-3,
(8% Cold-Stretched. Non-Aged Material)............ 109
3.24 Stress-Strain Curves for 50XF-LT-1. SOXF-LT-3.and
50XF-LT-6. (2% Cold-Stretched. Aged Material).......... 110
3.25 Stress-Strain Curves for 50XF-TT-1 and 50XF-TT-3.
(2% Cold-Stretched, Aged Material)...... 111
3.26 Stress-Strain Curves for 50XF-LT-l. 50XF-LT-3, and
SOXF·LT-6, (8% Cold-Stretched, Aged Material).... 112

xii
LIST OF FIGURES (Cant.)
Figure Page
3.27 Stress-Strain Curves for 50XF-TT-2 and 50XF-TT-3,
(8% Cold-Stretched, Aged Material)............ 113
3.28 Stress-Strain Curves for 35XF-LT-l, 35XF-LT-4,
and 35XF-LT-9,(Virgin Material)............... 114
3.29 Stress-Strain Curves for 35XF-TT-1, 35XF-TT-4,
and 35XF-TT-5,(Virgin Material)........................ 115
3.30 Stress-Strain Curves for 35XF-LT-2, 35XF-LT-4, and
35XF-LT-5,(2% Cold-Stretched,Non-Aged Material)........ 116
3.31 Stress-Strain Curves for 35XF-TT-1 and 35XF-TT-4,
(2% Cold-Stretched,Non-Aged Material)........... 117
3.32 Stress-Strain Curves for 35XF-LT-1, 35XF-LT-3, and
35XF-LT-5,(8% Cold-Stretched,Non-Aged Material)........ 118
3.33 Stress-Strain Curves for 35XF-TT-1 and 35XF-TT-3,
(8% Cold-Stretched,Non-Aged Material)........ 119
3.34 Stress-Strain Curves for 35XF-LT-2, 35XF-LT-3, and
35XF-LT-6, (2% Cold~Stretched, Aged Material).. 120
3.35 Stress-Strain Curves for 35XF-TT-1 and 35XF-TT-3,
(2% Cold-Stretched, Aged Material) ~........ 121
3.36 Stress-Strain Curves for 35XF-LT-2, 35XF-LT-4, and
35XF-LT-6, (8% Cold-Stretched, Aged Material).......... 122
3.37 Stress-Strain Curves for 35XF-TT-1 and 35XF-TT-3,
(8% Cold-Stretched, Aged Material)..................... 123

xiii
LIST OF FIGURES (Cant.)
Figure Page
3.38 Effect of Strain Rate on the Yield Strength of 100XF
Steel in Longitudinal and Transverse Directions....... ... 124
3.39 Effect of Strain Rate on the Yield and Ultimate Strengths
of 50XF-LT Steel, (Virgin Material)...................... 125
3.40 Effect of Strain Rate on the Yield and Ultimate Strengths
of 50XF-LT Steel, (2% Cold-Stretched, Non-Aged Material).
3.41 Effect of Strain Rate on the Yield and Ultimate Strengths
of 50XF-LT Steel, (8% Cold-Stretched, Non-Aged Material).
3.42 Effect of Strain Rate on the Yield and Ultimate Strengths
of 50XF-LT Steel, (2% Cold-Stretched, Aged Material) .....
3.43 Effect of Strain Rate on the Yield and Ultimate Strengths
of 50XF-LT Steel, (8% Cold-Stretched, Aged Material) ... :.
3.44 Effect of Strain Rate on the Yield and Ultimate Strengths
126
127
128
129
of 50XF-TT Steel, (Virgin Material)..... 130
3.45 Effect of Strain Rate on the Yield and Ultimate Strengths
of 50XF-TT Steel, (2% Cold-Stretched, Non-Aged Material).
3.46 Effect of Strain Rate on the Yield and Ultimate Strengths
of 50XF-TT Steel, (8% Cold-Stretched, Non-Aged Material).
3.47 Effect of Strain Rate on the Yield and Ultimate Strengths
of 50XF-TT Steel, (2% Cold-Stretched, Aged Material) .....
3.48 Effect of Strain Rate on the Yield and Ultimate Strengths
131
132
133
of 50XF-TT Steel, (8% Cold-Stretched, Aged Material)..... 134
xiv
LIST OF FIGURES (Cant.)
Figure Page
3.49 Effect of Strain Rate on the Yield and Ultimate Strengths
of 35XF-LT Steel, (Virgin Material).................... 135
3.50 Effect of Strain Rate on the Yield and Ultimate Strengths
of 35XF-LT Steel, (2% Cold-Stretched, Non-Aged Material).
3.51 Effect of Strain Rate on the Yield and Ultimate Strengths
of 35XF-LTSteel, (8% Cold-Stretched, Non-Aged Material).
3.52 Effect of Strain Rate on the Yield and Ultimate Strengths
of 35XF-LT Steel, (2% Cold-Stretched, Aged Material) .....
3.53 Effect of Strain Rate on the Yield and Ultimate Strengths
of 35XF-LT Steel, (8% Cold-Stretched, Aged Material) .....
3.54 Effect of Strain Rate on the Yield and Ultimate Strengths
136
137
138
139
of 35XF-TT Steel, (Virgin Material).............. 140
3.55 Effect of Strain Rate on the Yield and Ultimate Strengths
of 35XF-TT Steel, (2% Cold-Stretched, Non-Aged Material).
3.56 Effect of Strain Rate on the Yield and Ultimate Strengths
of 35XF-TT Steel, (8% Cold-Stretched, Non-Aged Material).
3.57 Effect of Strain Rate on the Yield and Ultimate Strengths
of 35XF-TT Steel, (2% Cold-Stretched, Aged Material) .....
3.58 Effect of Strain Rate on the Yield and Ultimate Strengths
141
142
143
of 35XF-TT Steel, (8% Cold-Stretched, Aged Material)..... 144
3.59 Stress-Strain Curves for 50XF-LT Steel at Strain Rate of
0.0001 in. lin. Isec , . . . . . . . . . 145

xv
LIST OF FIGURES (Cont.)
Figure Page
3.60 Stress-Strain Curves for 50XF-LT Steel at Strain Rate of
0.01 in./in./sec....................................... 146
3.61 Stress-Strain Curves for 50XF-LT Steel at Strain Rate of
1.0 in./in./sec........................................ 147

1
I. INTRODUCTION
During recent years, automotive manufacturers have produced lighter
vehicles for the purpose of achieving fuel economy. To accomplish the
construction of such automobiles, high strength sheet steels with various
yield strengths up to 190 ksi have been used for auto parts and structural
1-9components
In order to provide some technical assistance for the design of such
high strength steels, the first edition of the "Guide for Preliminary
Design of Sheet Steel Automotive Structural Components" was issued by
American Iron and Steel Institute (AISI) in February 1981. 10 The use of
the Guide was discussed by Errera at the SAE International Congress and
Exposition held in Detroit, Michigan in February 19825
. In view of the
fact that the design information contained in this document can be used
only for sheet steels with yield strengths of up to 80 ksi, a research
project has been conducted at the University of Missouri-Rolla (UMR) since
1982 to study the structural strength of automotive components using high
strength sheet steels. In the first phase of the UMR program, typical
mechanical properties and representative stress-strain curves were es-
tablished by a series of static tests for different grades of sheet steels
with yield strengths ranging from 49 to 164 ksi. The second phase of the
UMR project was directed toward the web crippling strength of beam webs
and the strength of members consisting of flat and curved elements. The
11-20research findings were presented in ten progress reports In addi-
tion, the effective design widths of high strength cold-formed steel
. t d21members were also invest1ga e Some of the research results were used

2
in the first edition of the AISI Automotive Steel Design Manual published
in 198659 . This Manual brings together material properties, product
design, and manufacturing information to make the most effective use of
sheet steels with yield strengths of up to 140 ksi. The contents and use
of the Design Manual were discussed by Cowie and Lutz at the 1987 SAE
International Congress and Exposition22 - 23
Because the previous UMR studies were limited only to the tests
subject to static loads and it is well known that the yield strength,
tensile strength, and the stress-strain relationship of sheet steels are
affected by the rate of strain used for the tests, additional research
work was conducted at the University of Missouri-Rolla in 1988. This
study primarily involved the experimental determination of the dynamic
material properties of three selected sheet steels with nominal yield
strengths ranging from 35 to 100 ksi.under different strain rates. The
-4strain rates ranged from 10 to 1.0 in./in./sec. All tests were per-
formed at UMR Engineering Research Laboratory by using the new MrS 880
Test System. The test data developed from this work will be used for the
evaluation of future member tests on the design of automotive components.
This study began with a review of the available literature on
stress-strain curves of sheet steels and the effects of the strain rate
and strain rate history on the mechanical properties of sheet steels. The
literature survey is presented in Section II. Section III presents the
detailed information obtained from 124 tension tests. This Section also
discusses the strain rate effects on the mechanical properties of the
sheet steels tested. Finally, the research findings are summarized in
Section IV.

3
I I. REVIEW .OF LITERATURE
A. MECHANICAL PROPERTIES OF SHEET STEELS
1. Engineering Stress -Strain Curves. The stress -strain curve is
the relationship between the stress and the corresponding strain. For
engineering stress-strain curves, the stress, f, is measured by the
load, P , divided by the original, unreduced area, A ,a of the spec-
imen, i. e.
f = P / Ao(2.1)
The engineering strain, e, is the difference between the original,
unreduced gage length, t ,and the deformed length, t ,. divided by thea
original length, i.e.
For high strength sheet steels, the two basic types of engineering
curve is based on theThe classification of the f-e
stress-strain (f-e) curves are gradual and sharp yielding as shown in
Figure 2. 124
yielding behavior of the steel. As a general rule, hot-rolled sheet steels
tend to be sharp yielding (Figure 2.1(a)) while those sheet steels that
are cold-rolled or cold reduced in thickness are gradual yielding (Figure
2.1(b)).
Sharp yielding steels typically exhibit an upper and lower yield
point (points A and B in Figure 2.1(a), respectively). Because the upper
yield point is much more sensitive to strain rate, specimen alignment,
and shape of the tested cross-section than the lower yield point, the
lower yield point is customarily used to represent the yield stress of
b · t t statl.·c loadl.·ng25 ,26.sharp yielding sheet steels su Jec 0

4
In view of the fact that gradual yielding steels do not have such
an obvious yield point, their yield strength is defined by either an
offset method or the strain-under-load method as described in ASTM
Standard A370. The offset method consists of drawing a straight line
parallel to the initial linear portion of the f-e curve at a given strain
offset. For this study, an offset of 0.2 percent strain was chosen. Using
this method, the intersection of the straight line and the f-e curve de
fines the yield strength as shown in Figure 2.2(a)24. The strain-under-
load method defines the yield point as the stress corresponding to some
fixed value of strain. The strain usually chosen is 0.5 percent as shown
in Figure 2.2(b)24.
The slope of the linear portion of the f-e diagram is known as the
modulus of elasticity, E. The point beyond which the f-e curve becomes
nonlinear is called the proportional limit (point A in Figure 2.1(b)).
For sheet steels, whether they are gradual or sharp yielding, the pro-
portional limit may be determined by the 0.01 percent offset method in
exactly the same manner that the yield stress was defined for gradual
yielding sheet steels, except that the offset is now only 0.01 percent.
Once the specimen is strained beyond the yield point, the load car-
rying capacity of the steel continues to increase slightly in spite of
the fact that the cross-sectional area of the specimen is continually
decreasing. Since engineering stress is calculated based on the original
area, there must be some other phenomenon occuring that causes the ·in-
crease in load carrying capacity. This phenomenon is commonly referred
to as work hardening or strain hardening and may be explained by dislo-
t · h 25ca ~on t eory . The rate of strain hardening is high at the onset of

5
yielding. However, as the strain is increased, the amount of strain
hardening decreases to the point where it can no longer offset the con-
tinuous reduction of specimen area. At that point the maximum possible
stress or ultimate strength, F , is reached in the steel. Furtheru
elongation of the tensile specimen results in localized straining of a
small portion of the gage length known as necking27 The necked region
continues to decrease in area at a faster pace than the strain hardening
can keep up with which results in a decrease in the total load that the
specimen can withstand. This unloading results in all areas of the spec-
imen, other than the necked region, being unloaded back into the elastic
range while the stress in the necked area continues to increase until
25fracture .
A material property that is dependent on the strain that a material
can withstand up until fracture-is ductility. Ductility is commonly de-
fined by two methods. They are
a)
b)
total elongation (percent) = 100*( t f - to)/to' and
reduction in area (percent) = 100*(Ao-Af )/Ao
(2.3)
(2.4)
In the above equations, the f subscripts denote the values at fracture
Although standard values are usually used for to andAo ' it is important
to realize that either method of measuring ductility will give varying
25results if non-standard values of to and Ao are used .
Another important material property yet to be discussed is the ca
pability of a material to absorb energy without fracture. Energy absorp
tion is especially important in the design of structures such as
28automobile components, highway guard rails, and machinery guards For
a particular material the energy absorption is given by the area under

6
the stress-strain curve from zero loading to fracture. Therefore the
amount of absorption depends not only on the yield and ultimate strength
but on the total elongation of the material as well.
Figure 2.324
illustrates the effect on the stress-strain curve of
stressing a given sheet steel beyond the yield stress and then removing
the load before failure. As shown by curve 2 of Figure 2.3, if the load
is removed at point C along the stress-strain curve, then the unloading
path follows a line very nearly the slope of the elastic portion of the
stress-strain diagram. The elastic strain, E , recovered upon unloadinge
from point C is equal to the stress at C, f ,divided by the modulusc
of elasticity, E, or E = f IE . The permanent set or plastic strain,e c
Ep
, is represented by the line AD. Curve 3 represents the stress-strain
curve if reloading occurs immediately and Curve 4 if reloading occurs
after strain aging. It can be seen that, if the material is immediately
reloaded (Curve 3), strain hardening produces an increase in apparent
yield strength and a decrease in ductility as compared to the virgin ma-
terial. If reloading occurs after a period of time, a phenomenon known
as strain aging occurs (Curve 4) which results in an even higher value
of yield stress and tensile strength; however, the ductility decreases
even more.
If the reloading from point D is opposite the original loading (e.g.
compression instead of tension) as shown in Figure 2.428
, the new value
of the yield point G might be lower than the original yield point B. Also,
if this load is reversed so that the load is now in the original direc-
tion, the yield point H may be lower than the original yield point B. This

7
effect was observed by Johann Bauschinger, of Germany, in 1886 and is
commonly referred to as Bauschinger Effect 28.
2. True Stress-Strain Curves. The exact or true stress, 0, in a
tensile test is equal to the load, P, divided by the actual area, A, as
follows:
o = P / A (2.5)
By comparing the shape of the true and engi-
As the load increases and thus the cross-sectional area decreases, the
corresponding true stress will be greater than the engineering stress
computed for the same loading. Since there is no appreciable change in
area in the elastic range, the true and engineering stresses are practi-
cally identical. However, as the stress reaches the inelastic range, the
strain increases and thus the area decreases much more for a given stress
increase than in elastic range. Therefore, the difference between true
and engineering stresses become apparent in the inelastic range as can
be seen in Figure 2.525
neering stress-strain diagrams in the inelastic range, it can be seen that
the difference between the two curves continually increases with
increassing strain. It is also interesting to note that the true stress
steadily increases up to fracture. This type of continuous increase of
the o-e curve seems much more logical than the engineering curve because
it is difficult to imagine the stress actually decreasing in a material
that is tested from zero load to fracture.
The true stress and strain may be related to the engineering stress
and strain by assuming constancy of volume of the specimen. In other
words, the initial volume,
volume, At. Thus
At, should be equal to the instantaneous00

A i = A io 0
A = A iIi = A Ciol ( io (l+E))000
A = A 1(l+E)o
Therefore the true stress, cr, may be given as
8
(2.6)
(2.7)
cr = PIA = P (1+E)1 A = f(l+E)o . (2.8)
The true or natural strain, E', can be determined from the differ-
ential increment of strain, dE', as
dE' = dtlt
where t is the actual length to which di is added.
elongation becomes
(2.9)
The total unit
i
e' =j dill =io
In(ili ) = In( 1+E )o
(2.10)
Equations 2.8 and 2.10 obviously may be used in converting from en
gineering stress and strain to true stress and strain26
. After necking,
the above equations are not valid. Since the length changes within the
gage length are now localized in the necked region, the engineering
strain, which assumes a uniform strain over the gage length, cannot be
used to calculate the true stress and natural strain. An alternate method
for computing the true stress in the necked region is described by Hosford
and Caddel on page 53 of Ref. 25.
From inspecting the above equations for stress and strain, it can
be seen that for very small strains, such as those occuring in the elastic
range, the engineering and true stresses and strains will be practically
the same. Therefore, for properties such as yield stress and modulus of
elasticity, the engineering values should be sufficiently accurate. How-
9
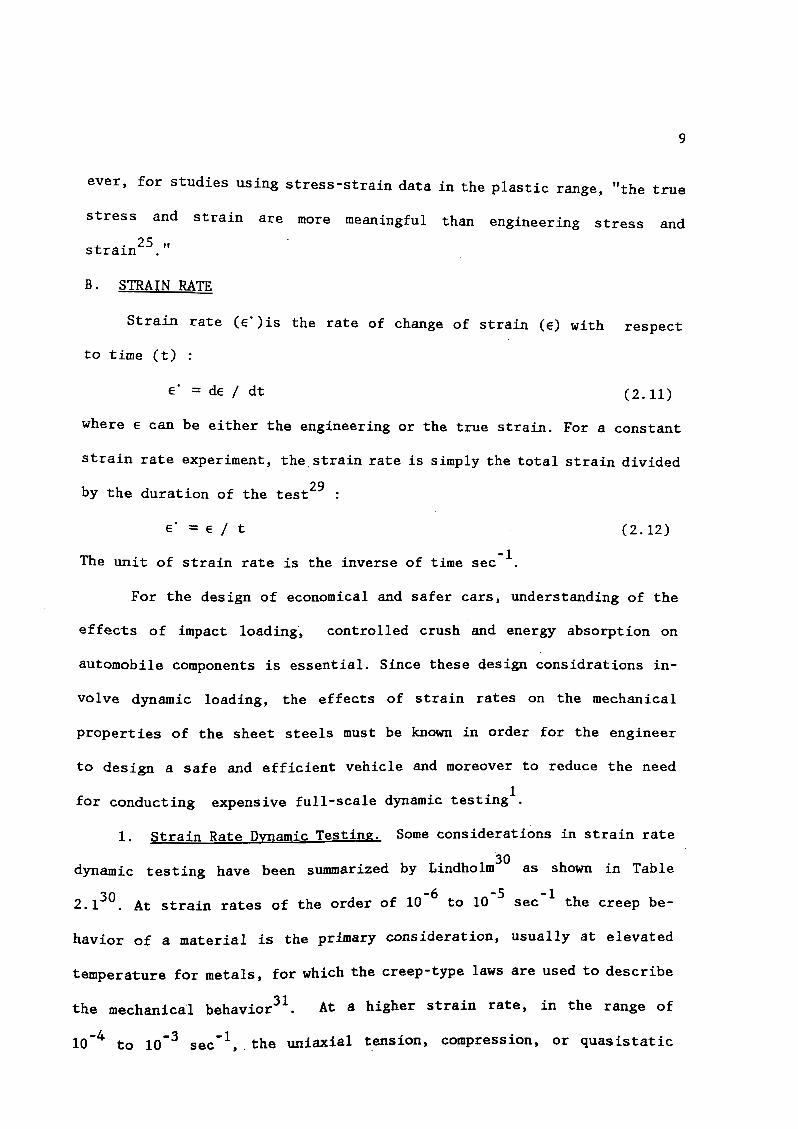
ever, for studies using stress-strain data in the plastic range, "the true
stress and strain are more meanl."ngful than . .. engl.neerl.ng stress and
strain25."
B. STRAIN RATE
Strain rate (e')is the rate of change of strain (e) with respect
to time (t)
e = de / dt (2.11)
where e can be either the engineering or the true strain. For a constant
strain rate experiment, the, strain rate is simply the total strain divided
by the duration of the test29 :
e' = e / t
The unit of strain rate is the inverse of time sec-1
(2.12)
For the design of economical and safer cars, understanding of the
effects of impact loading, controlled crush and energy absorption on
automobile components is essential. Since these design considrations in-
volve dynamic loading, the effects of strain rates on the mechanical
properties of the sheet steels must be known in order for the engineer
to design a safe and efficient vehicle and moreover to reduce the need
for conducting expensive full-scale dynamic testing1
1. Strain Rate Dynamic Testing. Some considerations in strain rate
dynamic testing have been summarized by Lindholm'30 as shown in Table
30 -6 -5 -12.1 . At strain rates of the order of 10 to 10 sec the creep be-
havior of a material is the primary consideration, usually at elevated
temperature for metals, for which the creep-type laws are used to describe
the mechanica1 behavior31
. At a higher strain rate, in the range of
10-4 to 10-3 sec-1, ,the uniaxial tension, compression, or quasistatic

10
stress-strain curve obtained from constant strain-rate-test is used to
describe the material behavior. Although the quasistatic stress-strain
curve is often treated as an inherent property of a material, it is a
valid description of the material only at the strain rate at which the
test was conducted. When higher strain rates are encountered, the stress-
strain relationships may change, and alternate testing techniques have
to be employed. Constant strain-rate tests can be performed with spe-
cialized testing apparatus at strain rates up to approximately 104
-1 -1 2 -1sec The range of strain rates from 10 to 10 sec is generally re-
ferred to as the intermediate or medium strain-rate condition. It is
within this condition that strain- rate effects first become a consider-
ation in most metals, although the magnitude of such effects may be quite
31small or even nonexistent in some cases Strain rates of 103 sec-lor
higher are generally treated as the range of high strain-rate response,
although there are no precise definitions as to strain-rate conditions
and care must be taken in evaluating the test data to note the actual
strain rates rather than the terminology. It is within the high strain-
rate condition that inertia and wave-propagation effects first become
important in interpreting experimental data. At these high rates, care
must be taken to distinguish between average values of stress and strain
and local values that may be the result of one or more high-intensity
h t · I At the stra1'n rate of 105
stress wave propagation throug a ma er1a .
sec-1 or higher, it is generally dealing with shock waves propagating
through materials that are in a state of uniaxial strain. At these very
high rates and the associated very short time scale involved,
31thermodynamic considerations become important 'Table 2.232 shows the

11
experimental techniques that are used for various strain rate conditions
in compression, tension, and shear testing. Unfortunately, there are no
standardized procedures for high strain rate tests. Many different ma-
chines, specimen configurations, and measuring devices have been used.
This makes a comparison of the test results of different investigators
difficult and often makes it impossible to compare the properties of a
group of materials since the behavior of a material is quite often in-
fluenced by the experimental conditions. It is important that the true
behavior be studied by different methods to isolate any excessive influ
ence of the technique and to verify the validity of the data33 .
2. Effect of Strain Rate on Mechanical Properties. The effect of
strain rate on mechanical properties varies for each material. These
general trends are well known, but because the magnitude of the change •
in properties with strain rate is so varied for each material, no general
quantitative theory exists that satisfactorily predicts the mechanical
b h 'd 31e avior of materials over a WI e range
For most materials, mechanical properties tend to increase at higher
strain rates. The following sections discuss the effect of strain rate
on mechanical properties of structural and high strength sheet steels,
stainless steels, and aluminum.
a. Structural Steels and High Strength Steels. The effect of the
strain rate on the mechanical behavior of mild steel has long been a
Subject of interest to researchers since the beginning of this century.
Figure 2.634 shows stress-strain curves obtained from structural steels
tested at various strain rates. Clearly, the yield strength of the mate-

12
rial increases as the strain rate increases. This is the most consistently
observed effect of strain rate on material properties.
Historically, Ludwik was the first to study the effect of the speed
of streching upon the stress at which a metal yields35 . He found a loga
rithmic relation between the stress at which a metal yields and the strain
rate as early as 1909.
In 1925, Korber and Storp compared impact tests with ordinary static
tests for various metals35 . These tests showed a considerable increase
in the yield stress in the more rapid tests.
The effect of changing the speed of deformation on various metals
were studied by Prandtl and his associates in 193235 . Their results were
in agreement with the relation found by Ludwik.
In 1937, Winlock and Leiter investigated the effect of the strain
rate upon the yielding of deep-drawing sheet stee136
. Their results showed
that the yield stress and the corresponding elongation were considerably
affected by the strain rate. The ultimate strength was also influenced
but to a smaller extent than the yield strength.
In the 1940s, Manjoine37 studied the relationships between strain
rate, temperature, and the material properties of mild steels. Figure
2.737 illustrates the true yield stresses at various strains for a low-
carbon steel at room temperature. It can be seen that between strain rates
of 10-6 sec-1 and 10-3 sec- 1 yield stress increases only by 10%. Above
the strain rate of 1.0 sec-I, however, the same increase of strain rate
doubles the yield stress. For the data shown in Figure 2.7, at every level
of strain the flow stress increases with increasing strain rate. However,,
a decrease in strain~hardening rate is exhibited at higher strain rate.

13
The results of the combined effects of strain rate and temperature at 200,
400, and 600 C are shown in Figures 2.8 to 2.1037 , respectively. At the
highest temperature of 600 C, yield strength increases with increasing
strain-rate, but strain hardening increases (rather than decreases) with
increasing strain rate. At intermediate temperatures shown in Figures
2.8 and 2.9, however, regions of negative strain rate sensitivity are
visible; that is, under certain conditions of strain, strain rate, and
temperature, the flow stresses of carbon steels decrease with an increase
in strain rate. This is in contrast with the usual strain rate effect38
.
I 1963 U · d S SIC . 39 d dn ,n1te tates tee orporat10n con ucte numerous tests
on high-strength, low-alloy steels (COR-TEN and TRI-TEN) for the purpose
of studying the effects of the strain rate and temperature on the tensile
properties of these steels. The tests were conducted at strain rates of
3 x 10⁻⁵ in./in./sec, 5 x 10⁻³ in./in./sec., and 1.0 in./in./sec at tem-
perature of -50 F, 75 F (room temperature), and 600 F. The results ob-
tained from this investigation indicated that as the strain rate was
increased at -50 F and at 75 F, the tensile strength and the 0.2 percent
offset yield strength increased as shown in Figures 2.11 and 2.1239
.
However , as the strain rate increased at 600 F, the tensile strength
decreased. The ductility of the COR-TEN steel, as measured by percent
elongation and reduction of area, did not appear to be strain-rate sen-
sitive at -50 F and room temperature, but at 600 F, the-reduction of area
for the fastest rate was higher than that for the slowest rate.The percent
elongation of the TRI-TEN steel appeared to be somewhat strain-rate de
pendent, decreasing slightly as the strain rate increased.

14
In 1974, Chatfield and Rote40 completed a comprehensive report con-
cerning the influence of strain rate on the mechanical properties of high
strength, low alloy (HSLA) steels. In this study six different HSLA
steels were tested with yield strengths ranging from 40 to 80 ksi. They
also tested three different aluminum alloys for comparison with the HSLA
steels. Approximate strain rates used were 0.008, 0.8, 8.0 and 80.
in. lin. Isec. All tests were performed at room temperature. Figure
shows the relationship between yield and tensile strengths,
uniform elongation and strain rate for a typical HSLA steel.
As can be seen from Figure 2.13, the yield and tensile strengths both
increase substantially with increasing strain rate while the uniform
elongation, which is the strain at the onset of the necking, decreases
slightly. This indicates that the total elongation is relatively inde-
pendent of strain rate. It is, therefore, expected that the absorbed en-
ergy of the HSLA steel also increases with increasing strain rates. Such
an increase in absorbed energy is obviously desirable for the automotive
components.
Based on the research findings presented in Refs. 2S and 40, the true
stress in metals may be determined by the strain rate as follows:
C e·m0=
where
a = true stress
e· = true strain rate
(2.13)
m
c
= strain rate sensitivity exponent
= material constant

15
In Equation (2.13), it is possible to determine the value of "m" from
tensile tests by changing the stra1'n t dd I d bra e su en y an y measuring the
instantaneous change in stress. This technique is illustrated in Figure
412.14 . By applying Equation (2.13) to two different strain rates and
eliminating C, 41we have
m = In( 0"2 /0"1) / In( e' 2 / e' 1 ) (2.14)
According to Hosford and Caddel25 , the magnitude of "m" for most metals
is usually between 0 and 0.03. The value of C depends on the strain rate,
temperature and the type of material25 . For a given material, the values
of C and m can be determined empirically. For example, the resulting
magnitudes of C and m obtained from Chatfield and Rote's tests are listed
in Table 2.34°. It is interesting to note from Table 2.3 that the m values
range from 0.018 to 0.056, which are slightly exceeding the range of m
values given by Hosford. As expected, the values of InC (and thus C) in-
crease as the yield strength increases. However, the m values show a
steady decrease with the increasing yield strength. An analysis of the
40results given in Table 4 of Chatfield and Rote's report seems to in-
dicate that the increase in C is offset by the decrease in m values, such
that the total increase in yield strength for a given strain rate remains
approximately the same regardless of the material strength.
Another useful relationship between the true stress and strain rate
'. - 2515 g1ven by Hosford as:
0"2 = 01 x ( e· Z/e· 1)m
where oland 0z are the true stresses corresponding
(Z.15)
to strain rate e' 1
and . , 1 Th efore if 0"1' E' 1 and m are known. then O"zE 2' respect1ve y. er ,
can be found for any desired value of e' Z'

16
If the strain rate sensitivity of a material is known as a design
parameter, the engineer may use this property to his advantage and thus
a more economical design may be obtained. For example, an automotive en-
gineer may take advantage of the increased yield point (if available)
caused by the high strain rate associated with impact when he design a
part to . th t d' t 1 d . . h f' 40Wl S an lmpac oa lng Wlt out permanent de ormatlon .
In 1982, Watanabe42 studied the yield behavior of low-carbon sheet
steels at room temperature under the strain rates of 10-4 to 10- 1 sec-1
using an Instron type machine. The results showed another break point of
the dependence of the yield stress on the strain rate of 3 x 10⁻³
sec-1
, which is different from Manjoine's strain rate of 10-1
sec-1
as shown
in Figure 2.15 42 . This means that the dependence of yield stress, yield
point elongation, and tensile strength on the strain rate in the range
of high strain rate above 3 x 10⁻³ sec- 1 is larger than that at lower
strain rates. Figure 2.15 also shows that the yield stress is more sen-
sitive to strain rate as compared with the tensile strength.
Also in 1982, Peterson, Schwabe, and Fertis43
conducted experiments
to measure the effect of strain rate on the tensile properties of SA-I06
carbon steel pipe. It was observed that the increase in the strain rate
from 4xl0 -4 to 4 sec-1 raised the yield strength by approximately 30
percent as illustrated in Figure 2.16.
d W44 f und that the strain rate sensitivity
In 1983, Sachdev an agoner 0
1 This investigationm is strongly dependent on the strain rate for stee .
included four types of steels: an interstitial free (IF) steel, a hot
rolled, plain carbon steel (HR), and two high strength steels one with a
LA) and the other with a ferriteferrite-pearlite mi~rostructure (BS

17
(2.16)
martensite (DP) microstructure. A new equation was developed to correlate
the strain-rate sensitivity and the strain rate as follows 44 :
m = b e' a
In the above equation, a and b are constants to be determined from tests.
Figure 2.1744
shows the strain-rate sensitivity index, m, for the steels
tested as a function of strain rate. The curves represent the best fits
for Equation (2.16) for the steels tested under the selected strain rate
Note that for each steel thealong with the m-values.
range. The best fit coefficients obtained from these curves are given in
Table 2.444
strain-rate sensitivity is well-characterized by the new equation.
In 1984, Meyer45 conducted tension tests on high strength sheet
steels at strain rates between 5x10⁻⁴ sec- 1 and 5xl03 sec-I. Figure 2.18
shows the stress-strain curves of the tested steel at different strain
rates. It is observed from this figure that both yield and ultimate
tensile strengths are increased with the increasing strain rate. However.-4 -1
the ductility decreased when the strain rate increased from 5xl0 sec
t 2 3 -1o xl0 sec .3
At higher strain rates above 2xl0-1
sec the material
becomes more ductile again.
Recently, Nagorka46 conducted an experimental investigation to ob-
serve the effect of microstructure and strain rate on the stage III strain
hardening and ductility of dual-phase steels. Five types of steels in-
I ld rolled normalized. martensitic.c uded in this investigation were co - ,
Table 2.546 lists the valuestempered martensitic and ferrite-carbide.,
steels studied. The m valuesof the strain rate sensitivity for the five
-5 -1in ates (6.7 x 10 sec
Were calculated for low to intermediate stra r-4
h t in rates (6.7 x 10to 6.7 x 10⁻⁴ sec-I) and intermediate to hig s ra

18
-1 -3-1sec to 6.7 x 10 sec ). Based on the m values given in this table,
Nagorka concluded that the strain rate sensitivities of various micro-
structures are the same for any given strain rate and increase with in-
creasing strain rate. These observations indicate that m is insensitive
to changes in microstructures. Also, it was concluded from this study
that the uniform elongation increases slightly with increasing strain
rate for most of the microstructures tested, whereas post-uniform
elongation increases significantly with increasing strain rate.
Another very important mechanical property is the modulus of
elasticity, E. Norris et al. state in Ref. 34 that, based on a limited
number of tests on ordinary structural carbon steel, the modulus of
Stainless Steels.b.
elasticity is unaffected by strain rates.
Albertini and Montagnani47 have conducted
tests on three austenitic stainless steels CAISI Types 304, 304L and
347) . The results of these tests are presented in Figures 2.19 to
2.2147 , which indicate an increase in yield and ultimate strengths for
all materials when the strain rate increases. However, decreases in the
total elongations are exhibited.
In 1984, Hopkinson split-bar tests were performed on Type 21-6-9
austenitic stainless steels from ambient temperature to 1023 K by Kassner
and Breithaupt48 2 4 -1These high-strain-rate tests C 10 to 10 sec ) were
compared with lower-strain-rate tests C 10-4
sec-1
). The results as
shown in Figure 2.2248 indicate that the strain-rate sensitivity of this
type of stainless steel is not strongly dependent on the strain rate. The
value of m was determined to be 0.03846 by measuring the slope of the
indicated best-fit line.

19
c. Aluminum. Structural aluminums were found to be less strain rate
sensitive than steels. Figure 2.2349 shows the data obtained for 1060-0
l' B t . -3 -1 3-1a um1num. e ween stra1n rates of 10 sec and 10 sec , the stress
at 2% plastic strain increases by less than 20%. Another contrast to the
behavior of steel as demonstrated in Fig. 2.23 is that strain hardening
increases with increasing strain rate. Reference 50 summarizes several
data sets relating to the yield stress dependence on strain rate in steel
and aluminum (Figures 2.24 and 2.2550 ). The comparison shows that for
aluminum, the effect on yield stress is less significant and occurs only
at extremely high strain rates. Note the difference in vertical scales
in Figs. 2.24 and 2.25.
A large amount of the available data has been reviewed by Lindholm
and Bessy51 The materials tested include several commercial aluminum
alloys. The data cover strain rates from 10-5 to about 103
sec-I. The
strain rate sensitivity was found to be constant over a large range of
strain rates. Figures 2.26 to 2.2851 show the effect of plastic strain
rate on the flow stress at a constant true strain and a constant tem-
perature. In some cases, rate independent behavior is observed at low
strain rates. In general, the value of m was found to increase with in-
creasing strain rate. From these figures, it can be seen that the flow
stress may be related to the strain and strain rate over the wide range
. 52of strain rates by the following equat10n
° = 0o(e) + 01 (e) log e
Wher~a~ is the stress-strain relation at unit strain rate.
~ and Maiden53 have conducted two compression tests on
·(2.17)
two types
?
of aluminums, 6061-T6. and 707S-T6. The range of the strain rates was from

20
-1 -1 530.03 sec to 560 sec Figure 2.29 shows the stress strain data of
7075-T6 at various strain rates. It is apparent from the results of these
tests that both aluminums are not senSl.'tl.'ve to th h 'he c ange l.n t e strain
rate.
Figure 2.3031
shows a method of comparing the previous investigation
data in terms of a rate-sensitivity parameter versus the static flow
stress. The parameter is the increase in flow stress from a static test
to a dynamic test at a given strain divided by the static flow stress and
the log of the difference in strain rates. It represents the percentage
increase in stress per unit of log strain rate. It is shown from this
figure that the degree of rate sensitivity is increased as material
strength is decreased, or as purity increases.
3. Strain-Rate History Effect. In addition to the effect of
strain rate on the mechanical properties of materials, the history of
loading can affect the flow stresses at a given strain and strain rate.
A number of investigators have examined the loading history to de-
termine its contribution to the mechanical behavior character-
istics. A technique that has achieved popularity over the last decade
is the jump test or more properly the incremental strain-rate test,
for which a specimen is subjected to a slow rate of loading followed by
a very high loading31rate .
Incremental as well 'as interrupted ( prestrained) tests are most
useful tools for the study of strain-rate history effects in metal,
especially if the change in strain-rate covers several orders of mag-
nitude, say from quasi-static to dynamic or vice versa, in order to

submit the
21
material in question to the most critical and demanding
d 't' 54con 1 10ns .
The early experiments involved with dynamic strain rates and in-
tended for a study of strain-rate history are those of Lindholm52 . Fig-
ures 2.31 to 522.33 show Lindholm's results for cyclic loading of
aluminum. It is evident that the stress in dynamic tests following a
static pre-loading is not equal to the stress found at the same strain
in all dynamic loading ( as shown by the dotted line) . This difference
is due to strain rate history. In addition, Lindholm wondered if the
result was influenced by the dwell-time at zero load. To investigate
this question he loaded a specimen dynamically to 8 percent strain,
unloaded, and then reloaded dynamically. The result, as shown in Fig.
2,33, shows a history effect for a dwell-time of three minutes, while
for a dwell-time of 450 micro seconds none can be seen.
Sirakashi and Usui55 tested three materials over a large range of
temperatures. J~ps in strain rate were made-3 -1
from 10 sec to four
different dynamic strain rates. Figures 2.34 and 2.3555
show the effect
of alteration of strain rate upon the flow stress on the way of straining,
In Fig. 2.34, point A is reached with a constant strain rate of 10-3
o1 3 -1
sec - . The strain rate is then changed to 10 sec . Two dotted curves
in the figure are stress strain curves with a constant strain rate. It
may be seen in the figure that the flow stress does not reach the value
at point A2
, which lies on the dotted curves with constant strain
rate of 103 sec-I, in spite of the alteration of strain rate. The same
situation may be seen in Fig. 2.35, where the strain rate is changed from
3 -110 sec to-3 -1
10 sec at point B . These results clearly show thato

22
the history of strain rate is another factor which has an effect upon
the flow stress. In other words, the flow stress will be different de-
pending upon the strain rate history, which the material has experienced,
even if strain, strain rate and temperature are all the same at the mo-
ment considered. The effect of strain rate history may be attributed to
the "memory", of strain rate which has been stored in the material,
probably as a change in structure.
The most extensive series of jump tests is probably that of Eleiche
and Campbell conducted in 197656 . These investigators tested copper,
titanium and mild steel. The tests were performed over a range of tem-
peratures and to strains up to 60% in shear. They concluded that
copper is sensitive to strain rate history, while titanium and steel are
less sensitive to history,
strain rate .
but more sensitive to direct effects of
Jump tests to higher strain rates using 1020 hot rolled steel and
1080 called rolled steel were performed by Wilson et al57
in 1979. See
Figures 2.36 and 2.3757 Both steels, 1020 hot rolled steel, and 1080
called rolled steel show a strong strain rate sensitivity and insensi-
tivity to strain rate history.
A recent experimental study of the strain rate history effect on
the tensile strength of AISI type 316 stainless steel using interrupted
testing was conducted by Eleiche, Albertini, d M.54 .
an ontagnan1 1n 1985.
True stress -true strain curves resulting from their interrupted
testing accompanied by a strain rate change from 0.004-1
to 500 sec
at various values of strain are presented in Fig. 2.3854
. Also plotted
are curves showing. the variation of the temperature rise in each

23
specimen during the corresponding dynamic deformation. The investigated
prestrain range was from 0.0047 in.jin to 0.3048 in.jin. It can be seen
from this figure that a well-defined yield point whose level is much /?higher than that reached in the quasi-static prestraining. For
small prestrains, this yield stress level is very close to the flow
stress level reached at the same strain in a test conducted entirely
at the dynamic rate (curve B in Fig. 2.38). The conclusion of this.f I'
study was that even~'~1ainless steel is known to be strain-rate y
sensitive, it has been shown that it is insensitive to strain-rate
history, within the range of strain rate covered in the tests and
at ambient temperature.

24
III. EXPERIMENTAL PROGRAM
A. MATERIALS
Currently, numerous grades of high strength sheet steels are com-
mercially available for automotive structural components 1. Two types of
sheet steels (3SXF and SOXF) were selected by members of the Task Force
on Automotive Structural Design of the AISI Automotive Applications
Committee for the purpose of studying the effect of strain rate on the
mechanical properties of high strength sheet steels and the structural
strength of cold-formed steel members subjected to dynamic loads. The
chemical compositions for these two sheet steels are listed in Table 3.1.
Also included in this table is the chemical composition of 100XF sheet
steel, which was used in the first phase of the study of automotive
structural components using high strength sheet steels. The 100XF sheet
steel was also used in the study of the effect of strain rate on the me-
chanical properties.
B. UNIAXIAL TESTS
All these three virgin materials listed in Table 3.1 were uniaxially
tested in tension in the longitudinal (parallel to the direction of
rolling) and transverse (perpendicular to the direction of rolling) di
rections under three different strain rates of 10-4 , 10-2 , and 1.0
in./in./sec. Two of the three materials (SOXF and 3SXF) were also tested
in tension in both directions to determine the combined effects of cold
stretching and strain rate. The amounts of uniform cold-stretching used
for the tests were 0.02 in./in.(20 mils) and 0.08 in./in.(80 mils). In
order to determine the combined. effects of strain rate and aging, half

25
of the coupons (non-aged coupons) were tested in an average of two days
after cold stretching operation. The remaining . half of the cold-
stretched coupons (aged coupons) were tested to failure under different
strain rates at least 30 days after cold stretching operation.
1. ASTM Specifications. All tension tests followed the procedures
outlined in the ASTM Specifications listed below:
E8-69
E83-67
E111-82
Tension Testing of Metalic Materials
Standard Method of Verification and Classification
of Extensometers
Standard Test Method for Young's Modulus, Tangent
Modulus and Chord Modulus
2. Specimens. The tensile specimens tested in the longitudinal and
transverse directions were prepared by the Machine Shop of the Department
of Civil Engineering at the University of Missouri-Rolla. The test
specimens were cut from the quarter points of the steel sheets as shown
in Figure 3.1. The sketch in Figure 3.2 shows the tensile specimen di-
mensions for the three materials (35XF, 50XF, and 100XF). A total of 124
coupons were tested in this phase of study. They are summarized in the
following 22 different cases:
Cold-StretchedCondition
Virgin Materials
Type ofMaterial
Number of CouponsUsed
Longitudinal Tension( LT )
Transverse Tension( IT )
100XF-LT 7 -e- -- ?-50XF-LT 9 ,35XF-LT 9
100XF-IT 650XF-IT 935XF-IT 6

26
Cold-Stretched Type of Number of CouponsCondition Material Used
2% Cold-StretchedNon-Aged Materials
Longitudinal Tension 50XF-LT 6( LT ) 35XF-LT 6
Transverse Tension 50XF-TT 2( TT ) 35XF-TT 4
8% Cold-StretchedNon-Aged Materials
Longitudinal Tension 50XF-LT 6( LT ) 35XF-LT 6
Transverse Tension 50XF-TT 4( TT ) 35XF-TT 4
2% Cold-StretchedAged Materials
Longitudinal Tension 50XF-LT 6( LT ) 35XF-LT 6
Transverse Tension 50XF-TT 4( TT ) 35XF-TT 4
8% Cold-StretchedAged Materials
Longitudinal Tension 50XF-LT 6( LT ) 35XF-LT 6
Transverse Tension 50XF-TT 4( TT ) 35XF-TT 4
3. Equipment. All the specimens were tested in a 110 kips MrS 880
Test System located in the UMR Engineering Research Laboratory. Figure
3.3 shows the Test System along with the remaining equipment used for
the tension tests under controlled strain rates. Other equipment used
for the tests includes the MrS controller (Fig. 3.4), the data acquisition

27
system (Fig. 3.5), Data General graphic monitor (Fig.3.6), Data General
MV-IOOOO mini computer to store and manipulate the data (Fig. 3.7), MTS
Model No. 732.25b-20 extensometer (Figs. 3.8a and 3.8b), and IBM PS/2
Model 30 personal computer with IBM color plotter and NEe Pinwriter P5XL
printer (Fig. 3.9).
An MTS extensometer with a 2-in. gage length was used to measure the
strains from zero load to failure. The classification of this extensometer
according to ASTM Designation E-83 was found to be dependent on the
extensometer range used in the tests. Table 3.2 contains the classi
fications of the four extensometer ranges according to the MTS transducer
calibration data.
The load was measured by an MTS System Model 380041-06 load cell and
associated conditioning, which was calibrated prior to testing according
to the procedure of the National Bureau of Standard.
Figure 3.10 shows the MTS 880 automated test system which consists
of four components: the load frame, the control console, the CAMAC (Com
puter Automated Measurement and Control) data acquisition, and Data Gen
eral MV -10000 computer. The testing machine is of a servohydraulic
closed-loop type. Figure 3.11 shows the simplified block diagram of the
servo control loop. The moving piston is driven by a double-action hy
draulic cylinder; so that it can operate under tension and compression.
The fluid pressure in the chamber is controlled by a servovalve. This
servovalve responds to the difference between the measured signal and
the desired signal. The signal is amplified to drive the valve so as to
remove the error. There are three main modes of operating the machine,
commonly referred to as stroke, strain, and load. Under the stroke mode,

28
the movement of the piston is the controlling variable. Under the load
mode, it is the load acting on the specimen. Under the strain mode, it
is the strain, as read from the extensometer. For each of these three
modes, different time functions can be established by the function gen-
erator to match the application needed. Tensile tests under a constant
strain rate can be made by setting a ramp function under the strain mode.
The slope of this ramp is the desired strain rate. Each of these modes
has four different ranges of operation i.e., 100%, 50%, 20%, and 10%.
Table 3.3 summarizes the transducer ranges and the corresponding load,
strain, or displacement values. The test results can be processed by the
Data General mini computer and displayed graphically as desired. The
data acquisition used in this system conforms to the CAMAC standards.
The main data acquisition module used in this system is a Kinetic Systems
Model 4022 Transient Recorder. The unit has 32 simultaneous sampling input
channels at a resolution of 12 bits. The unit is capable of acquiring sets
of data at the maximum rate of 25,000 sets of readings per second. The
recorder has a storage capacity of 1,000,000 samples. The simultaneous
sampling feature of the system eliminates the timing skew between data
points. After the data has been acquired, it is downloaded into the com-
puter for analysis. The transient recorder includes a direct readout for
" l" 't'present va ue mon.1. or.1.ng,
real-time as the test runs.
which allows the data to be displayed in
4. Procedure. Prior to testing, the dimensions of the tensile
specimens were measured to the nearest 0.001 in., cleaned with acetone,and
the gage length (2 in.) was marked in ink. The grips of the machine were
alligned by operating the machine under stroke mode. The specimen was

29
then placed in the grips such that the longitudinal axis of the specimen
coincided with the center line of the grips. The load mode was selected
to place the specimen in the grips before running the test. Next, the
extensometer was attached to the specimen such that the extensometer knife
edges lined up with the gage marks as illustrated in Figure 3.8. The
function generator was then programmed to produce the desired ramp. The
ramp function has two time values needed to be selected i.e., ramp time
1 CRT1) and ramp time 2 CRT2). See Fig. 3.12. Table 3.4 shows ramp
different
time 1 and the corresponding strain-rate value. Ramp time 2 was chosen
to give enough time to remove the extensometer and the specimen from the
load frame. Transfer from load mode to strain mode was made before the
test was started. For almost all the tests, load range 4, strain range
1, and stroke range 1 were selected. As the test proceeded, the stress
strain graph was plotted simultaneously on the graphic display terminal.
The stress and strain data were stored by the Data General computer for
later plotting and determination of mechanical properties.
A constant strain-rate is very difficult to maintain with the con
ventional testing machine especially at the high strain rate. The strain
rate was controlled electronically by the new MrS 880 Test System, which
allowed the exact strain rates to be performed without any difficulty.
Figures 3.13 to 3.15 show the strain versus time curves for
strain rates.
The cold-stretching coupons were loaded to the desired 2% strain or
8% strain by using strain as a control mode with the strain rate of 0.1
in./in./sec. The span in the MrS system controller was used to stop the
test when the desired strain is reached.
30
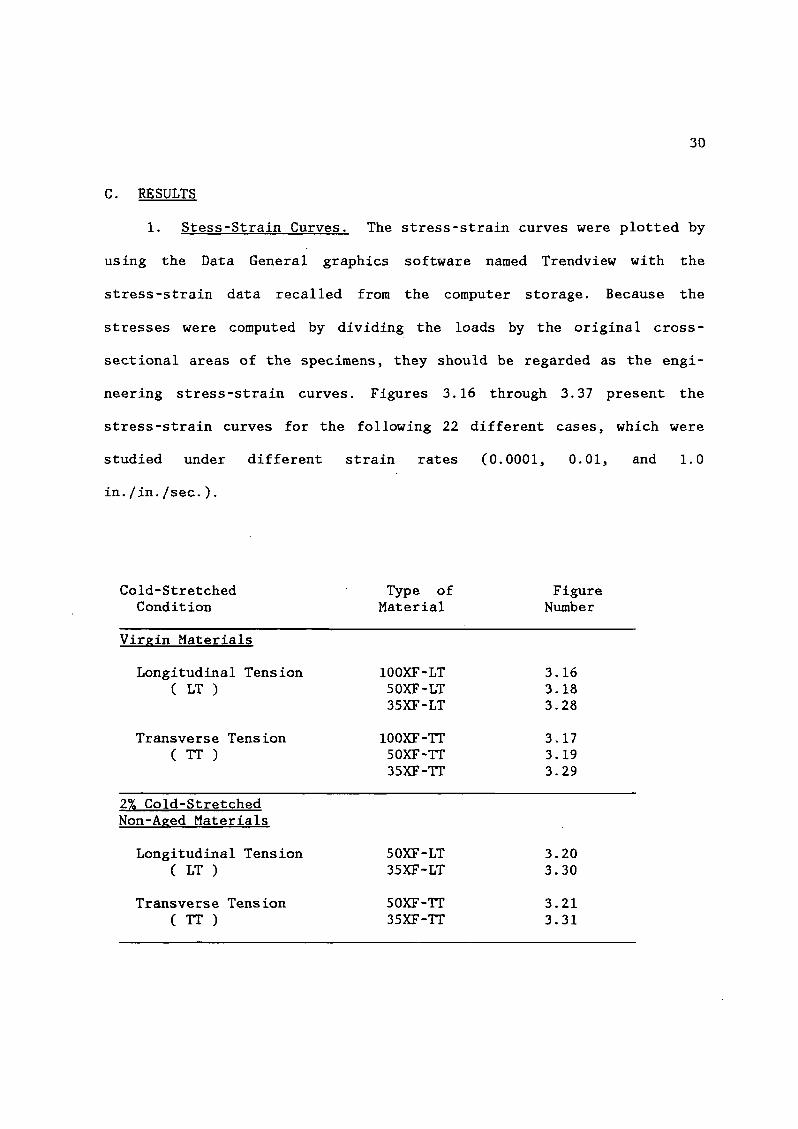
C. RESULTS
1. Stess-Strain Curves. The stress-strain curves were plotted by
using the Data General graphics software named Trendview with the
stress-strain data recalled from the computer storage. Because the
stresses were computed by dividing the loads by the original cross-
sectional areas of the specimens, they should be regarded as the engi-
neering stress-strain curves. Figures 3.16 through 3.37 present the
stress-strain curves for the following 22 different cases, which were
studied under different
in. / in. /sec. ).
strain rates (0.0001, 0.01, and 1.0
Cold-Stretched Type of FigureCondition Material Number
Virgin Materials
Longitudinal Tension 100XF-LT 3.16( LT ) 50XF-LT 3.18
35XF-LT 3.28
Transverse Tension 100XF-IT 3.17( IT ) 50XF-IT 3.19
35XF-IT 3.29
2% Cold-StretchedNon-Aged Materials
Longitudinal Tension 50XF-LT 3.20( LT ) 35XF-LT 3.30
Transverse Tension 50XF-IT 3.21( IT ) 35XF-IT 3.31

Cold-StretchedCondition
8% Cold-StretchedNon-Aged Materials
Longitudinal Tension( LT )
Transverse Tension( TT )
2% Cold-StretchedAged Materials
Longitudinal Tension( LT )
Transverse Tension( TT )
8% Cold-StretchedAged Materials
Longitudinal Tension( LT )
Transverse Tension( TT )
Type ofMaterial
50XF-LT35XF-LT
50XF-TT35XF-TT
50XF-LT35XF-LT
50XF-TT35XF-TT
50XF-LT35XF-LT
50XF-TT35XF-TT
FigureNumber
3.223.32
3.233.33
3.243.34
3.253.35
3.263.36
3.273.37
31
For the purpose of comparison, each figure includes two or three stress-
strain curves representing the test data obtained from the same material
for different strain rates. In order to study the effect of aging on the
mechanical properties of 50XF-LT steel, Figures 3.59 to 3.61 compare three
stress-strain curves for 50XF-LT steel with different amount of cold
stretching tested under a constant strain rate.
2. Mechanical Properties. The procedures used for determining the
mechanical properties of sheet steels are discussed in the subsequent
sections (Sections III.C.2.a through III.C.2.c). The mechanical proper-
ties so determined are the yield point F , the tensile strength F , andy u

32
elongation in 2-in. gage length. These tested mechanical properties are
presented in Tables 3.5 through 3.15 for each individual test. Tables 3.16
through 3.21 present the average values of the mechanical properties for
each material tested in either longitudinal tension (LT) or transverse
tension (TT), but with different amount of cold stretching (i.e., virgin
material, 2%, or 8%) under different strain rates (0.0001, 0.01, or 1.0
in. jin. jsec.).
a. Yield Strength or Yield Point. F . The method commonly used toy
determine the yield point of sheet steels depends on whether the stress-
strain curve is of the gradual or sharp-yielding type. For the types of
sheet steels tested in this phase of study, the stress-strain curves of
the 100XF and 50XF sheet steels are the sharp-yielding type, while the
stress-strain curves of the 35XF steel are the gradual-yielding type.
Because the 50XF sheet steel exhibited a considerable amount of strain
hardening, the stress-strain curves became the gradual-yielding type af-
ter the material was cold-stretched to a selected strain of either 2% or
8%.
The yield point of the sharp-yielding steel was determined as the
stress where the stress-strain curve becomes horizontal. Typical sharp
yielding stress-strain curves are shown in Figure 3.16 for the 100XF steel
in the longitudinal direction. For this case, the lower yield point is
given in Table 3.5. The same method was used to determine the yield
points included in Table 3.6 for the 50XF sheet steel.
For the gradual-yielding type stress-strain curves as shown in Fig-
ure 3.28, the yield point of 35XF steel was determined by the intersection
of the stress-strain. curve and the straight line drawn parallel to the

33
elastic portion of the stress-strain curve at an offset of 0.002 in. lin.
A Fortran 77 code was written to determine the yield points presented in
Tables 3.7 through 3.15 for the gradual-yielding type curves using the
Least Square Method.
b. Ultimate Tensile Strength, F . The ultimate tensile strength wasu
determined from each of the tension tests as the maximum stress that the
given tensile coupon could withstand before fracture. This value was
calculated by the computer for each test and is presented in Tables 3.5
through 3.15.
c. Ductility. Ductility is a very important property of high
strength sheet steels not only for the structural behavior of the member,
but also for the fabrication of the desired structural shape. In this
study, ductility was determined by the total elongation in a 2-in. gage
length. For this method, the maximum strain recorded by the computer be-
fore fracture was taken as the ductility. The maximum elongation was also
verified by placing the fractured ends of the specimen together and
measuring the distance between the gage marks.
D. DISCUSSION
The test results presented in Section III.C are discussed in this
section with an emphasis on the effects of strain rate on the mechanical
properties of sheet steels. The materials used in this experimental pro-
gram included virgin steels and steels with different amount of cold
stretching. They were tested in both longitudinal tension and transverse
tension.
1. Mechanical Properties. The test results indicate that all me-
chanical properties are affected by the strain rate and the amount of cold

stretching.
34
Table 3.22 compares the dynamic mechanical properties de-
termined at the strain rate of 1.0 in./in./sec. and the static properties
determined at the strain rate of 0.0001 in. / in. /sec. The effects of
strain rate on yield stress and tensile strength are discussed in the
following sections.
a. Yield Strength or Yield Point, F. In Table 3.22, the dynamicy
yield strength, (F )d' and the static yield strength, (F ) , are comparedy y s
by using a ratio of (Fy)d/(Fy)s. In the above expressions, (Fy)d is the
yield strength determined for the strain rate of 1.0 in./in./sec. while
(Fy) s is the yield strength determined for the strain rate of 0.0001
in./in./sec. It can be seen that for all cases, the yield strength of
sheet steel increases with the strain rate. The increases in yield
strength for the three steels studied in this investigation are: 4% for
100XF steel, 4% to 15% for SOXF steel, ·and 12% to 29% for 3SXF steel when
the strain rate increased from 0.0001 to 1.0 in./in./sec. It is observed
from this table that the increases in yield strength for the virgin ma-
terials are independent of the test direction (LT or TT). The effect of
the strain rate on yield strength decreases as the static yield stress
and/or the amount of cold stretching increases. Previous studyS8 indi-
cated that the increase in yield strength due to cold work is caused
mainly by strain hardening and strain aging. However, in the present in-
vestigation no significant increase in yield strength was observed due
to the strain aging effect. In addition, Figs. 3.24 to 3.27 show that the
strain aging has little or no effect on the type of stress-strain curve.
b. Ultimate Tensile Strength, F . Similar to the effect of strainu
rate on yield strength, the ultimate tensile strengths of sheet steels

increased with the strain rate.
35
The increases in ultimate tensile
strengths for the three materials studied in this investigation are: 4%
for 100XF steel, 7% to 11% for 50XF steel, and 13% to 18% for 35XF steel
when the strain rate increased from 0.0001 to 1.0 in./in./sec. It is
noted from Table 3.22 that the amounts of increase in ultimate tensile
strength due to the increase in strain rate are approximately the same
for both longitudinal tension and transverse tension.
2. Strain Rate Sensitivity. In the literature review the strain
rate sensitivity was discussed in Section II.B.2. For two given values
of the flow stress of a material at two different strain rates, the
strain rate sensitivty exponent m may be calculated as
m = InC 02 / 01 ) / InC e· 2 / e· 1 )
Figures 3.38 through 3.58 copmare the average values of the yield and
ultimate tensile strengths at different strain rates for different cases.
The data plotted in these figures are in terms of flow stress vs. strain
rate on a logarithmic scale. The slopes of the straight lines shown in
these figures represent the material strain rate sensitivity values,
which were calculated on the basis of the above equation and are listed
in Table 3.23 for different cases. The value of m1 was calculated for
the yield strengths corresponding to the strain rates of 0.0001
in./in./sec. and 0.01 in./in./sec., while the value of m2 was calculated
for the yield strengths corresponding to the strain rates of 0.01
in./in./sec. and 1.0 in./in./sec. Whenever only two strain rates were used
in the tests, the value of m3 was calculated for the yield strengths
corresponding to the strain rates of 0.0001 in./in./sec. and 1.0
in./in./sec. From Table 3.23, it can be seen that, in general, the value

36
of m increases as the strain rate increases. The strain rate sensitivity
decreases progressively as the static yield strength level or the amount
of cold stretching increases.

37
IV. CONCLUSIONS
In the past, high strength sheet steels with various yield strengths
up to 190 ksi have been used for auto parts and structural components for
the purpose of achieving fuel economy. In order to provide some technical
assistance for the design of automotive structural components using high
strength sheet steels, American Iron and Steel Institute published the
first edition of the "Guide for Preliminary Design of Sheet Steel Auto
motive Structural Components" in .1981 and the first edition of the "Au
tomotive Steel Design Manual" in 1986. . The latter brings together
material properties, product design, and manufacturing information to
make the most effective use of sheet steels with yield strengths of up
to 140 ksi.
In view of the fact that the available design equations were devel
oped on the basis of previous tests subject to static loads and that the
yield strength, tensile strength, and the strees-strain relationship of
sheet steels are affected by the strain rate used for the tests, addi
tional research work was conducted at the University of Missouri-Rolla
since May 1988. The objective of the work is to study the effect of strain
rate on the mechanical properties of the selected sheet steels and the
structural strengths of the cold-formed steel members when they are sub
jected to dynamic loads. The major task is to develop the needed back
ground information for improvement of the existing design procedures.
During the period from May 1988 through December 1988, progress has
been made on a study of the effect of strain rate on mechanical properties
of sheet steels. This initial work included a review of literature and

38
testing of 124 tension specimens. The literature survey is presented in
Section II. Section III contains the detailed information on the exper
imental investigation, which inculdes materials, test specimens, equip
ment, test procedure, test results and the discussion of test data.
Future research work will include the testing of compression coupons
and a study of the structural strengths of cold-formed steel stub columns
and beams subject to dynamic loads. Additional evaluation of the test data
on tensile coupons will be presented in the Twelfth Progress Report.

39
ACKNOWLEDGMENTS
The research work reported herein was conducted in the Department
of Civil Engineering at the University of Missouri-Rolla under the spon
sorship of the American' Iron and Steel Institute.
The financial assistance granted by the Institute and the technical
guidance provided by members of the Task Force on Automotive Structural
Design and the AISI Automotive Applications Committee and the AISI staff
are gratefully acknowledged. These members are: Messrs. S. J. Errera
(Chairman), J. Borchelt, R. Cary, F. L. Cheng, A. M. Davies, J. D.
Grozier, C. Haddad, A. L. Johnson, C. M. Kim, J. P. Leach, K. H. Lin, J.
N. Macadam, H. Mahmood, D. Malen, J. McDermott, P. R. Mould, J. G.
Schroth, P. G. Schurter, T. N. Seel, F. V. Slocum, R. Stevenson, and M.
T. Vecchio. An expression of thanks is also due to Mr. D. L. Douty for
his help.
All materials used in the experimental study were donated by Inland
Steel Company and LTV Steel Company.
Appreciation is expressed to Messrs. K. Haas, A. D. Johnston, J.
Tucker, and R. Hoselhorst, staff of the Department of Civil Engineering,
for their technical support. The advice provided by Dr. J. E. Minor,
Chairman of the UMR Department of Civil Engineering, is greatly appreci
ated.

"Design of AutomotiveSheet Steels", First83-1, University of
40
REFERENCES
1. American Iron and Steel Institute, "Cost-Effective Weight Reductionwith Sheet Steel", SG-631R.
2. American Iron and Steel Institute, "Sheet Steels: Automotive ProblemSolvers", Cost-Effective Weight Reductions in Parts at 1980 AISI/SAEExhibits, SG-932A.
3. American Iron and Steel Institute, "High Strength Sheet Steel SourceGUide", SG-603D.
4. American Iron and Steel Institute, "The Materials Decision", SG-834.
5. Errera, S.J., "Automotive Structural Design Using the AISI Guide",SAE Tech. Paper Ser. 820021, February 22-26, 1982.
6. American Iron and Steel Institute, "Automotive Steels: They Still DoIt Better", Cost Savings/Corrosion Protaction/Weight Reductions inComponents seen at the 1982 AISI/SAE Exhibit, SG-937.
7. International Nickel Company, Inc., "A Cost/Weight Study of 1981-1982Production Bumper Systems".
8. Levy, B.S., "Advances in Designing Ultra High Strength Steel BumperReinforcement Beams", SAE Tech. Paper Ser. 830399, February 28-March4, 1983.
9. Vecchio, M. T., "Design Analysis and Behavior of Variety of As-FormedMild and High Strength Sheet Materials in Large Deflection Bending",SAE Tech. Paper Ser. 830398, February 28-March 4, 1983.
10. American Iron and Steel Institute, "Guide for Preliminary Design ofSheet Steel Automotive Structural Components", 1981 Edition.
11. Yu, W.W., Santaputra, C., and Parks, M.B.,Structural Components Using High StrengthProgress Report, Civil Engineering StudyMissouri- Rolla, January 1983.
12. Parks, M.B. and Yu, W.W., "Design of Automotive Structural ComponentsUsing High Strength Sheet Steels: Mechanical Properties of Materials", Second Progress Report, Civil Engineering Study 83-3, University of Missouri- Rolla, August 1983.
13. Santaputra, C. and Yu, W.W., "Design of Automotive Structural Components Using High Strength Sheet Steels: Strength of Beam Webs",Third Progress Report, Civil Engineering Study 83-4, University ofMissouri- Rolla, August 1983.
14. Parks, M.B. and Yu, W.W., "Design of Automotive Structural ComponentsUsing High Strength Sheet Steels: Strength of Curved Elements andMembers Consisting of Curved Elements", Fourth Progress Report,Civil Engineering Study 83-5, University of Missouri- Rolla, August1983.

41
15. Santaputra, C. and Yu, '11.'11., "Design of Automotive Structural Components Using High Strength Sheet Steels: Structural Behaviour ofBeam Webs Subjected to Web Crippling and a Combination of Web Crippling and Bending", .Fifth Progress Report, Civil Engineering Study84-1, University of Missouri- Rolla, October 1984.
16. Parks, M.B. and Yu, '11.'11., "Design of Automotive Structural ComponentsUsing High Strength Sheet Steels: Status Report on the Study of Members Consisting of Flat and Curved Elements", Sixth Progress Report,Civil Engineering Study 84-2, University of Missouri- Rolla, October1984.
17. Parks, M. B. and Yu, W. '11., "Design of Automotive Structural ComponentsUsing High Strength Sheet Steels: Results and Evaluation of StubColumn Tests for Unstiffened Curved Elements", Seventh Progress Report, Civil Engineering Study 85-1, University of Missouri- Rolla,September 1985.
18. Santaputra, C. and Yu, '11.'11., "Design of Automotive Structural Components Using High Strength Sheet Steels: Web Crippling of ColdFormed Steel Beams", Eighth Progress Report, Civil Engineering Study86-1, University of Missouri- Rolla, August 1986.
19. Parks, M.B. and Yu, '11.'11., "Design of Automotive Structural ComponentsUsing High Strength Sheet Steels: Structural Behavior of MembersConsisting of Flat and Curved Elements", Ninth Progress Report,Civil Engineering Study 87-2, University of Missouri- Rolla, June1987.
20. Lin, S.H., Hsiao, L.E., Pan, C.L., and Yu, W.W., "Design of AutomotiveStructural Components Using High Strength Sheet Steels: StructuralStrength of Cold-Formed Steel I-Beams and Hat Sections Subjected toWeb Crippling Load", Tenth Progress Report, Civil Engineering Study88-5, University of Missouri- Rolla, June 1988.
21. Pan, L. C., "Effective Design Widths of High Strength Cold-FormedSteel Members," Ph.D. Thesis, University of Missouri-Rolla, 1987.
22. Cowie, G. 0., "The AISI Automotive Steel Design Manual", SAE Tech.Paper Ser. 870462, February 23-27, 1987.
23. Lutz, L.A., "Structural Design Using the Automotive Steel DesignManual", SAE Tech. Paper Ser. 870463, February 23-27, 1987.
24. Yu, W.W., Cold-Formed Steel Design, Wiley-Interscience, New York,1985.
25. H~sford, W.F. and Caddel, R.M., Metal Forming-Mechanics and Metallurgy, Prentice Hall, Inc., N.J., 1983, 80-84.
26. Timoshenko, S., Strength of Materials-Part II , D. Van Nostrand Company, Inc., 1956, 400-428.
27. Malvern, L.E., Introduction to the Mechanics of a Continuous Medium, Prentice Hall; Inc., 1969, 327-333.

42
28. Juvinall, R.C., Stress. Strain and Strength, McGraw-Hill Book Company, New York, (1967), 96-100.
29. Follansbee, P. S., '.'High Strain Rate Compression Testing", MetalsHandbook, American Society for Metals, Ninth Edition, Volume 8, 1985.
30. Lindholm, U. S., "Techniques in Metal Research", Vol. 5, Part 1,Wiley-Interscience, New York , 1971.
31. Zukas, J.A., Nicholas, T., Swift, H.F., Greszczuk,·L.B., and Curran,D.R., Impact Dynamics, John Wiley & Sons, New York, 1982.
32. Staker, M.R., "High Strain Rate Testing," Metals Handbook, AmericanSociety for Metals, Ninth Edition, Volume 8, 1985.
33. Kumar, S., "Introduction," Mechanical Behavior of Materials UnderDynamic Loads, U.S. Lindholm (Ed.), Springer-Verlag, New York, 1968.
34. Norris, C.H., Hansen, R.J., Holley, M.J. Jr., Biggs, J.M., Namyet,S. , and· Minami, J. K. , ~S~t~rol:u~c~t:.::u~r;.,!:a~I!:.-~D~e::.:s~J.~·gn~_;!:.;fo~ro!:-~D.:Lyn~a~m!.:!:i..:.c:.-.....!L~o~a~d~s
McGraw-Hill Book Company, 1959.
35. Davis, E.A., "The Effect of the Speed of Streching and the Rate ofLoading on the Yeilding of Mild Steel," Journal of Applied Mechanics, ASHE Transactions, Vol. 60,1938.
36. Winlock, J. and Leiter, R., "Some Factors Affecting the Plastic Deformation of Sheet and Strip Steel and Their Relation to the DeepDrawing Properties," American Society for Metals Transactions, Vol.25, 1937.
37. Manjoine, M. J., "Influence of Rate of Strain and Temperature on YieldStresses of Mild Steel," Journal of Applied Mechanics, ASME Transactions, 66, (1944).
38. Gillis, P. P., "Effect of Strain Rate on Flow Properties," MetalsHandbook, American Society for Metals, Ninth Edition, Volume 8, 1985.
39. Holt, J.M., "The Effect of Strain Rate on the Tensile Properties ofUSS COR-TEN and USS TRI-TEN High-Strength Low-Alloy Steels", UnitedStates Steel Corporation, Applied Research Center, Project Number37.12-100(2), Pittsburgh, PA., 1962.
40. Chatfield, D.A. and Rote, R.R., "Strain Rate Effects on the Propertiesof High Strength, Low Alloy Steels," SAE Tech. Paper Ser. 740177,February 25-March 1, 1974.
41. Meyers, M.A., and Chawla, K.K., Mechanical Metallurgy: Principles andApplications, Prentice-Hall, Englewood Cliffs, N.J., 1984.
42. Watanabe, T., "Effect of Strain Rate on Yield Behavior of Cold-RolledSheet Steel," Transactions of the Iron and Steel Institute of Japan, Vol. 22, 1982.

43
43. Peterson, D., Schwabe, J.E., and Fertis, D.G., "Strain Rate Effectsin SA-106 Carbon Steel Pipe," Journal of Pressure Vessel Technology, ASME Transactions, Vol. 104, February, 1982.
44. Sachdev, A.K., and W'agonar, R.H., "Uniaxial Strain Hardening at LargeStrain in Several Sheet Steels," Novel Techniques in Metal Deformation Testing , The Metallurgical Society of AlHE, 1983.
45. Meyer, L. W., "Dynamic Tens ion Studies of Strength and Formabi lityCharacteristic of a High Alloyed Steel With Respect to Thermal Activation," Mechanical Properties at High Rate of Strain , Instituteof Physics, London, No. 70, 1984.
46. Nagorka, M.S., "The Effect of Microstructure and Strain Rate on theStage III Strain Hardening and Ductility of Dual-Phase Steels," Material Science and Engineering, 94, 1987, 183-193.
47. Albertini, C. and Montagnani, M., "Testing Techniques Based on theSplit Hopkinson Bar," Mechanical Properties at High Rates of Strain, Institute of Physics, London, No.21, 1974.
48. Kassner, M.E., and Breithaupt, R.D., "The Yield Stress of Type 21-6-9Stainless Steel Over a Wide Range of Strain Rate ( 10-5-104-s- 1 )andTemperature," Mechanical Properties at High Rates of Strain, Institute of Physics, London, No.70, 1984.
49. Jones, A.H., Maiden, C.J., Green, S.J., and Chin, H., "Prediction ofElastic-Plastic Wave Profiles in Aluminum 1060-0 under UniaxialStrain Loading," Mechanical Behavior of Materials under Dynamic Loads, U. S. Lindholm (Ed ..), Springer-Verlag, New York, 1968, 96-133. .
50. Kanninen, M.F., Mukherjee, A.K., Rosenfield, A.R., and Hahn, G.T.,"The Speed of Ductile-Crack Propagation and the Dynamics of Flow inMetals, Mechanical Behavior of Materials under Dynamic Loads , U.S.Lindholm (Ed.), Springer-Verlag, New York, 1968, 96-133.
51. Lindholm, U.S. and Bessey, R.L., Technical Report AFML-TR-69-119, AirForce Materials Laboratory, Wright-Patterson Air Force Base, Ohio,1969.
52. Lindholm, U.S., n Some Experiments With the Split Hopkinson Bar,"J. Mech. Phys. Solids, Vol.12, 1964.
53. Maiden, C.J., and Green, S.~" "Compressive _~train Ret: Te~ts on S~xSelected Materials at Stra1n Rates From 10 to 10 1n./1n./sec. ,Transaction of the ASHE , Sep. 1966.
54. Eleiche, A.M., Albertini, C. and Montagnani, M., "The Influenceof Strain-Rate History on the Ambient Tensile Strength of AISI Type316 Stainless Steel," Nuclear Engineering and Design, 1985.
55. Shirakashi,Strain-RateBulletin of
Takahiro and Usui, Eiji, "Effect of Temperature andUpon Flow Stress of Metals in Compression,"
Japan Society of Precision Engineering, Vo1.4, 1970.

44
56. Eleiche, A.M. and Campbell, J.D., Tech. Rep. ARML-TR-76-90, AirForce Materials Laboratory, Wright-Patterson Air Force, 1976.
57. Wilson, M.L., Hawley, R.H. and Duffy, J., "Strain Rate and Strain Rate"History Effects in TWo Mild Steels", Brown University, Rep. NSF ENG75-18532/8, 1979.
58. Chajes, A., Britvec, S.J., and Winter, G., "Effects of Cold-Strainingon Structural Sheet Steels," Journal of the Structural Division ,Proceedings of the American Society of Civil Engineers, Vol. 89, No.ST2, April, 1963.
59. American Iron and Steel Institute, Automotive Steel Design Manual,1986 Edition.
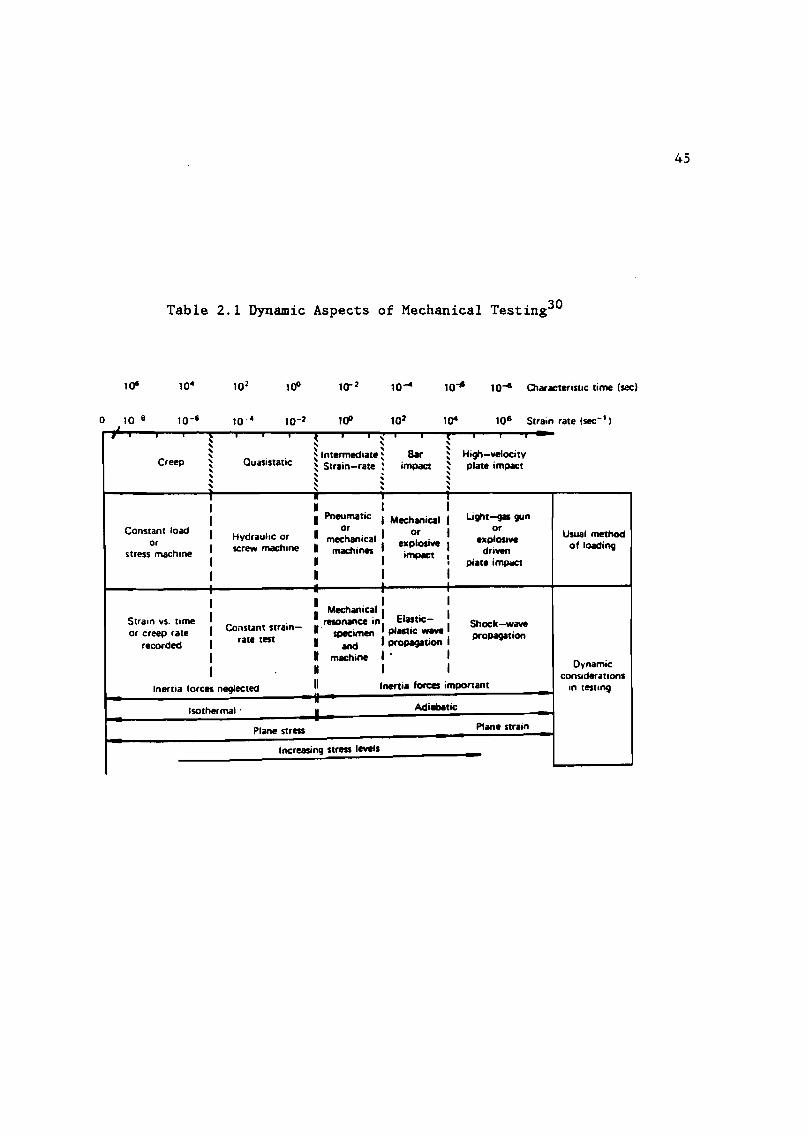
45
Table 2.1 Dynamic Aspects of Mechanical Testing30
10& 100 1()'.2 10.... 10'" 10~ Characteristic time (sec)
Isothermal .
Inertia forces neglected lnenia forces imponant
Usual methodof loading
DynamicconSIderations
In testing
10. Strain rate (sec-II
Shock-wavepropagation
Ugtlt-gal gunor
explosivedriven
plate imp;,ct
11)4
~~ High-velocity~ plate impact~,,
Adiabatic
Barimpact
.
IMechanical I
or Iexplosive IImpact I,
IPneumatic I
ormechanical I
machines III.
I Mechanical: . :I resonance in Elastlc-I- specimen I plastic _ve I• and I propagation I• machine I' IH I IU
100
~ ~, .'~ Intermechate ~
~ Strain-rate :, ., ', ,, ,II
•1I
•••
:
auasistatic
Hydraulic orscrew machine
Constant strainrate test
~,,,,,,,,,IIIIIII
Creep
Strain vs. timeor creep rate
recorded
Constant loador
stress machine
10 8
,o
Plane stress
Increasing stress levels -Plane strain

46
Table 2.2 Experimental Techniques for
High Strain Rate Testing32
Mode
Compression
Tension
Shear
Applicable StrainRate, sec- 1
s; 0.10.1 to 1000.1 to 500200 to 104
104 to 105
S; 0.10.1 to 100100 to 104
104
~ 105
s; 0.10.1 to 10010 to 1000100 to 104
103 to 104
104 to 107
Table 2.3
Testing Technique
Conventional load framesSpecial servohydraulic framesCam plasometer and drop testHopkinson pressure barTaylor impact test
Conventional load framesSpecial servohydraulic framesHopkinson pressure barExpanding ringFlyer plate
Conventional shear testSpecial servohydraulic framesTorsional impactHopkinson (Kolsky) barDouble-notch shear and punchPressure-shear plate impact
Values of Strain Rate· Sensitivity Exponent, m, and Constant
C of Yield Strength of the Tested Materials40
Material m In C
HRAK-AR 0.045 10.72223
JIRAK - Ann+TR 0.056 10.58935
HSLA-40 0.045 10.74515
HSLA-4S-1 0.035 10.94544
HSLA-4S-2 0.024 10.83534
HSLA-50 0.026 10.98135
HSLA-80-1 0.020 11. 36871
HSLA-80-2 0.018 11. 40914

Table 2.4
Standard Strain Rate Sensitivity
and New Strain Rate Parameters40
Material m b a
IF 0.011 0.039 0.150HR 0.008 0.029 0.134HSLA 0.004 0.010 0.102DP 0.003 0.013 0.149
Table 2.5
Strain Rate Sensitivity for Different Microstructures
Determined by Strain. Rate Jump Tests at 6.7 x 10⁻⁵ sec-I,
-4 -1 -3-16.7 x 10, sec ,and 6.7 x 10 sec (Ref. 46)
47
Microstructures
Cold-rolledNormalizedMartensiticTempered martensiticFerrite-carbide
mlow to intermediate
strain rate
0.0020.0020.0030.0030.003
mintermediate to high
strain rate
0.0040.0040.0050.0060.005

Table 3.1
Chemical Compositions of the Sheet Steels Used
48
AISI Thick. C Mn P S Si V Cu Al Cb ZrDesigna. in.
035XF 0.085 .070 .40 .007 .017 .08050XF 0.077 .081 .96 .017 .003 .27 .04100XF 0.062 .070 .43 .006 .023 .11 .056 .064 .08
Table 3.2
Classification of the MTS Extensometer
Range Maximum Strain Maximum Error ASTM ClassificationIn·/In. In·/In.
100% 0.50 0.00065 Between Classes B-2 and C50 % 0.25 0.00030 Between Classes B-2 andC
20 % 0.10 0.00011 Between Classes B-1 and B- 210 % 0.05 0.00002 Between Classes A and B- 1

Table 3.3
MTS Transduc~r Ranges and the Corresponding Load,
Strain, or Displacement Values
49
Transducer
Load
Strain
Stroke
Range Value
100 % 100.0 Kips50 % 50.0 Kips20 % 20.0 Kips10 % 10.0 Kips
100 % 0.50 In./ln.50 % 0.25 In./ln.20 % 0.10 In. /In.10 % 0.05 In./ln.
100 % 10.0 In.50 % 5.00 In.20 % 2.00 In.10 % 1. 00 In.
Table 3.4
Ramp Time 1 and the Corresponding Strain Rate
Ramp Time 1sec.
5000500
505
0.5
Strain Ratein./in./sec.
0.00010.0010.010.11.0

50
Table 3.5
Tested Mechanical Properties of 100XF Sheet Steel
Virgin Material
Test Strain Rate F Fu Elongation in 2-in.No. in. / in. /sec. (k~i) (ksi) Gage Length (percent)
LT-1 0.0001 122.44 122.44 9.4LT-2 0.0001 126.07 126.07 9.7LT-3 0.01 123.98 123.98 10.3LT-4 0.01 125.91 125.91 10.3LT-5 0.01 127.52 127.52 9.8LT-6 1.0 129.06 129.06LT-7 1.0 128.75 128.75
TT-l 0.0001 138.20 138.20 4.9TT-2 0.0001 137.34 137.34 4.9TT-3 0.01 140.11 140.11 6.1TT-4 0.01 139.05 139.05 4.4TT-S 1.0 144.11 144.11 8.0TT-6 1.0 143.03 143.03 5.1

51
Table 3.6
Tested Mechanical Properties of 50XF Sheet Steel
Virgin Material
Test Strain Rate F Fu Elongation in 2-in.No. in./in./sec. (k~i) (ksi) Gage Length (percent)
LT-l 0.0001 49.80 73.87 29.9LT-2 0.0001 49.39 72.54 32.0LT-3 0.0001 49.32 72.51 31.0LT-4 0.01 51. 89 75.44 27.2LT-5 0.01 50.83 74.07 27.4LT-6 0.01 52.09 75.11 26.4LT-7 1.0 54.71 79.18 26.2LT-8 1.0 54.99 79.64 25.4LT-9 1.0 54.29 77.36 25.7
TT-l 0.0001 50.38 73.73 26.8TT-2 0.0001 51.13 73.39 28.3TT-3 0.0001 50.25 73.21 24.8TT-4 0.01 54.22 75.26 25.9TT-5 0.01 52.77 74.80 26.7
TT-6 0.01 52.64 74.16 27.0
TT-7 1.0 56.21 79.86 28.3
TT-8 1.0 54.31 79.85 27.9
TT-9 1.0 56.13 80.03 27.1

Table 3.7
Tested Mechanical Properties of 50XF Sheet Steel
2% Cold Stretched, Non-Aged Material
Test Strain Rate F Fu Elongation in 2-in.No. in. / in. /sec. (k~i) (ksi) Gage Length (percent)
LT-1 0.0001 56.37 72.62 26.5LT-2 0.0001 56.44 73.41 27.5LT-3 0.01 58.46 74.81 25.4LT-4 0.01 58.88 74.20 25.7LT-5 1.0 63.19 80.58 26.1LT-6 1.0 62.16 80.06 27.9
'IT-I 0.0001 59.29 74.90 23.1'IT-2 1.0 68.48 81. 29 24.6
Table 3.8
Tested Mechanical Properties of 50XF Sheet Steel
8% Cold Stretched, Non-Aged Material
Test Strain Rate F FuElongation in 2-in.
No. in./in./sec. (k~i) (ksi) Gage Length (percent)
LT-1 0.0001 71. 22 73.73 24.6
LT-2 0.0001 71.86 73.99 23.8
LT-3 0.01 73.87 76.21 21. 6
LT-4 0.01 75.06 76.81 20.3
LT-5 1.0 77.00 80.77 21.6
LT-6 1.0 78.18 81.55 19.8
'IT-I 0.0001 72.59 74.90 20.0
'IT-2 0.0001 74.71 76.86 23.6
TT-3 1.0 77.90 82.07 19.4
TT-4 1.0 77.78 81. 94 17.5
52
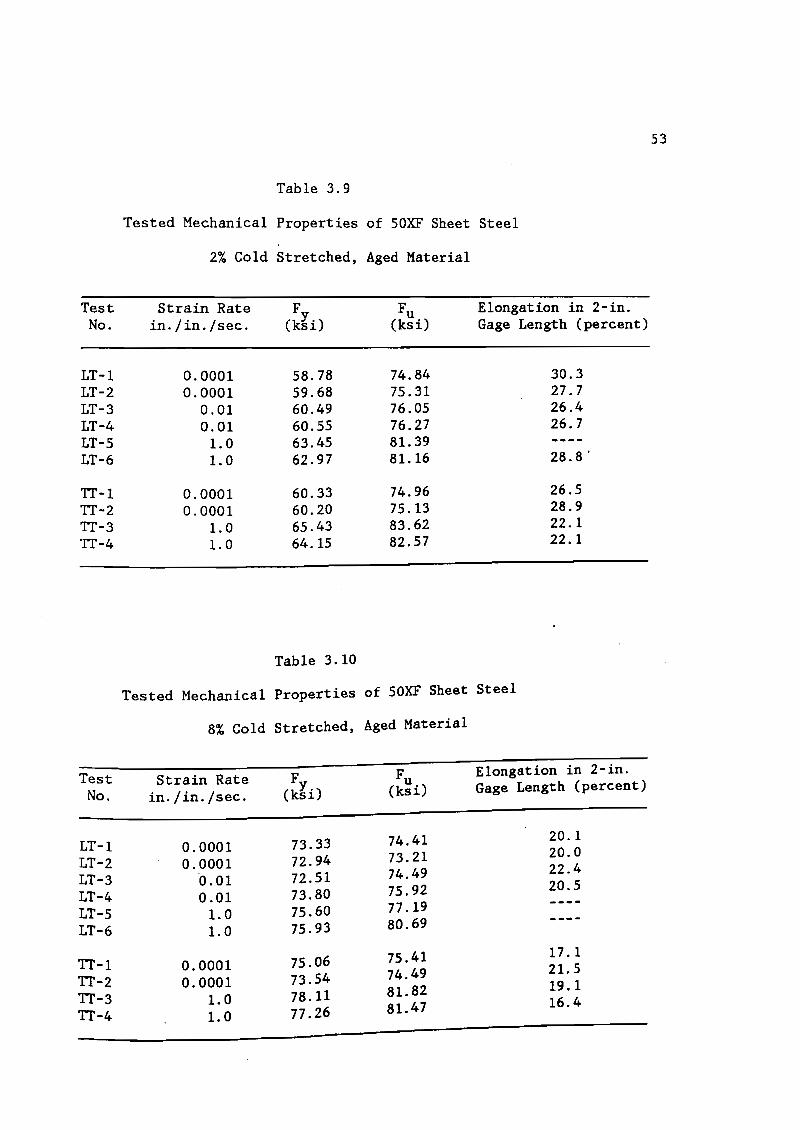
53
Table 3.9
Tested Mechanical Properties of 50XF Sheet Steel
2% Cold Stretched, Aged Material
Test Strain Rate F Fu Elongation in 2-in.No. in./in./sec. (k~i) (ksi) Gage Length (percent)
LT-l 0.0001 58.78 74.84 30.3LT-2 0.0001 59.68 75.31 27.7LT-3 0.01 60.49 76.05 26.4LT-4 0.01 60.55 76.27 26.7LT-5 1.0 63.45 81. 39LT-6 1.0 62.97 81.16 28.8'
TT-1 0.0001 60.33 74.96 26.5TT-2 0.0001 60.20 75.13 28.9TT-3 1.0 65.43 83.62 22.1TT-4 1.0 64.15 82.57 22.1
Table 3.10
Tested Mechanical Properties of 50XF Sheet Steel
8% Cold Stretched, Aged Material
Test Strain Rate F FuElongation in 2-in.
No. in./in./sec. (k~i) (ksi) Gage Length (percent)
LT-1 0.0001 73.33 74.41 20.1
LT-2 0.0001 72.94 73.21 20.0
LT-3 0.01 72.51 74.49 22.4
LT-4 73.80 75.92 20.50.01
LT-5 1.0 75.60 77 .19
LT-6 1.0 75.93 80.69
TT-1 75.06 75.41 17.10.0001 21.5
TT-2 0.0001 73.54 74.4919.1
TT-3 1.0 78.11 81.8216.4
TT-4 1.0 77.26 81.47

54
Table 3.11
Tested Mechanical Properties of 35XF Sheet Steel
Virgin Material
Test Strain Rate F Fu Elongation in 2-in.No. in./in./sec. (k~i) (ksi) Gage Length (percent)
LT-1 0.0001 32.42 49.22 39.7LT-2 0.0001 32.57 49.19 40.2LT-3 0.0001 33.63 49.64 36.7LT-4 0.01 36.42 51. 68 38.1LT-5 0.01 36.65 52.02 36.0LT-6 0.01 36.12 51.59 36.5LT-7 1.0 42.53 56.82 41.6LT-8 1.0 41. 87 56.48 40.2LT-9 1.0 42.70 56.60 40.9
TT-1 0.0001 33.53 49.41 34.9TT--2 0.0001 33.49 49.19 37.5TT-3 0.01 36.21 50.98 39.0TT-4 0.01 36.57 51.10 35.3TT-5 1.0 43.00 55.70 36.9
TT-6 1.0 43.47 56.15 34.1
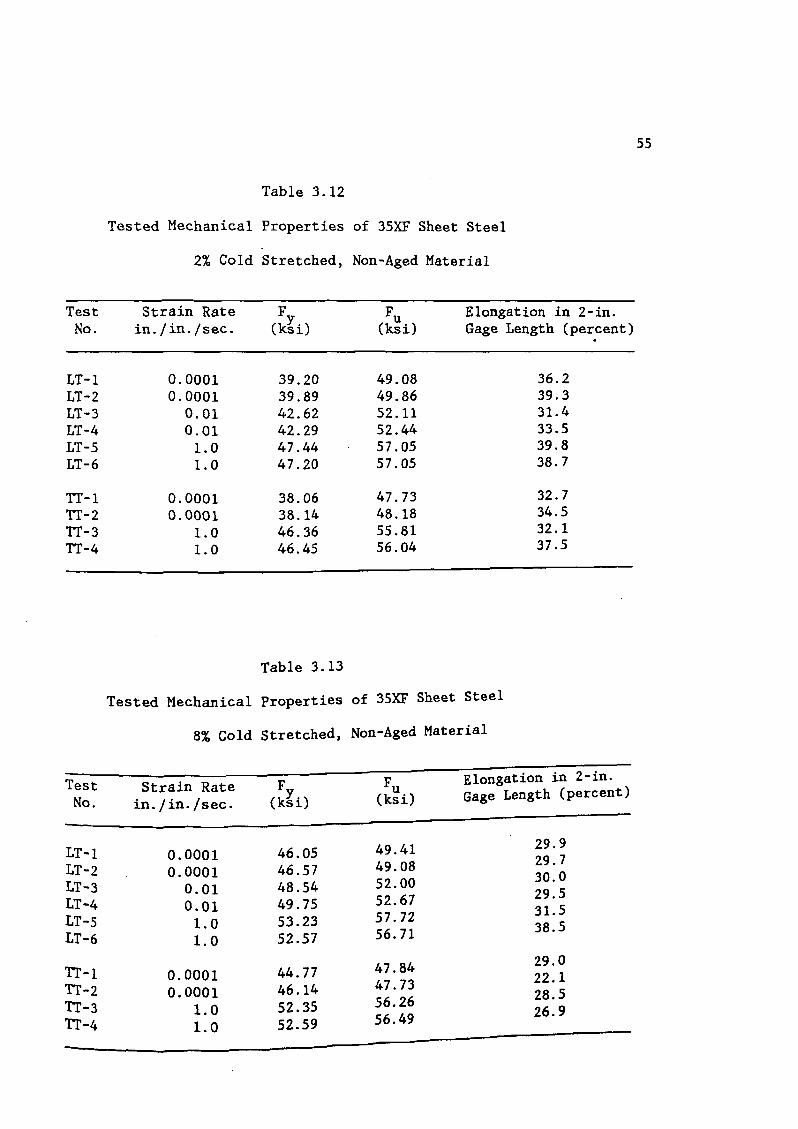
Table 3.12
Tested Mechanical Properties of 35XF Sheet Steel
2% Cold Stretched, Non-Aged Material
Test Strain Rate F Fu Elongation in 2-in.No. in. /in./sec. (k~i) (ksi) Gage Length (percent).
LT-1 0.0001 39.20 49.08 36.2LT-2 0.0001 39.89 49.86 39.3LT-3 0.01 42.62 52.11 31.4LT-4 0.01 42.29 52.44 33.5LT-5 1.0 47.44 57.05 39.8LT-6 1.0 47.20 57.05 38.7
TT-1 0.0001 38.06 47.73 32.7TT-2 0.0001 38.14 48.18 34.5TT-3 1.0 46.36 55.81 32.1TT-4 1.0 46.45 56.04 37.5
Table 3.13
Tested Mechanical Properties of 35XF Sheet Steel
8% Cold Stretched, Non-Aged Material
Test Strain Rate F FuElongation in 2-in.
No. in. / in. /sec. (k§i) (ksi) Gage Length (percent)
LT-l 0.0001 46.05 49.41 29.9
LT-2 0.0001 46.57 49.08 29.730.0
LT-3 0.01 48.54 52.0029.5
LT-4 0.01 49.75 52.6731.5
LT-S 1.0 53.23 57.7238.5
LT-6 1.0 52.57 56.71
Tr-l 44.77 47.84 29.00.0001 22.1
Tr-z 0.0001 46.14 47.7328.5
Tr-3 1.0 52.35 56.2626.9
Tr-4 1.0 52.59 56.49
55

56
Table 3.14
Tested Mechanical Properties of 35XF Sheet Steel
2% Cold Stretched, Aged Material
Test Strain Rate F Fu Elongation in 2-in.No. in./in./sec. (k~i) (ksi) Gage Length (percent)
LT-l 0.0001 40.02 49.32 31.8LT-2 0.0001 39.89 50.10 35.7LT-3 0.01 41.80 51. 77 37.3LT-4 0.01 41.25 51.16 36.1LT-5 1.0 47.52 56.91 35.9LT-6 1.0 47.28 56.80 40.9
TT-l 0.0001 38.89 48.73 29.8TT-2 0.0001 39.27 48.90 31. 8TT-3 1.0 45.02 55.78 34.3TT-4 1.0 45.23 55.34 32.6
Table 3.15
Tested Mechanical Properties of 35XF Sheet Steel
8% Cold Stretched, Aged Material
Elongation in 2-in.Test Strain Rate F FuNo. in. / in. /sec. (k~i) (ksi) Gage Length (percent)
LT-1 45.69 48.19 34.80.0001 30.7
LT-2 0.0001 46.61 49.1130.6
LT-3 0.01 48.85 51. 7430.7
LT-4 0.01 49.70 52.3432.0
LT-5 1.0 53.82 57.5231.1
LT-6 1.0 53.53 57.55
47.60 25.3IT-I 0.0001 45.25 28.7IT-2 0.0001 45.64 47.65
2.8.5IT-3 1.0 50.83 55.48 2.8.111'-4 1.0 51.25 56.01

Table 3.16
Average Tested Mechanical Properties of 100XF Sheet Steel
Longitudinal Tension, Virgin Material
Strain Rate F . Fu Elongationin. lin. Isec. (k~i) (ksi) (percent)
0.0001 124.25 124.25 9.50.01 125.80 125.80 10.21.0 128.91 128.91
Table 3.17
Average Tested Mechanical Properti~s of 100XF Sheet Steel
Transverse Tension, Virgin Material
Strain Rate F FuElongation
in·/in./sec. (k~i) (ksi) (percent)
0.0001 137.77 137.77 4.9
0.01 139.58 139.58 5.3
1.0 143.57 143.57 6.6
57

58
Table 3.18
Average Tested Mechanical Properties of 50XF Sheet Steel
Longitudinal Tension
Amount of Cold Strain Rate F Fu ElongationStretching in. lin. Isec. (k~i) (ksi) (percent)
Virgin 0.0001 49.50 72.97 31. 0Virgin 0.01 51.60 74.87 27.0Virgin 1.0 54.66 78.73 25.8
2%, Non-Aged 0.0001 56.40 73.01 27.02%, Non-Aged 0.01 58.67 74.50 25.52%, Non-Aged 1.0 62.67 80.32 27.0
8%, Non-Aged 0.0001 71.54 73.86 24.28%, Non-Aged 0.01 74.47 76.51 20.98%, Non-Aged 1.0 77.59 81.16 20.7
2%, Aged 0.0001 59.23 75.07 29.02%, Aged 0.01 60.52 76.16 26.52%, Aged 1.0 63.21 81.27 28.8
8%, Aged 0.0001 73.13 73.81 20.08%, Aged 0.01 73.15 75.20 21.58%, Aged 1.0 75.71 78.94

Table 3.19
Average Tested Mechanical Properties of 50XF Sheet Steel
Transverse Tension
Amount of Cold Strain Rate F Fu ElongationStretching in./in./sec. (k~i) (ksi) (percent)
Virgin 0.0001 50.59 73.44 26.7Virgin 0.01 53.21 74.74 26.5Virgin 1.0 55.55 79.91 27.8
2%, Non-Aged 0.0001 59.29 74.90 23.12%, Non-Aged 1.0 68.48 81. 29 24.6
B%, Non-Aged 0.0001 73.65 75.88 21.88%, Non-Aged 1.0 77.84 82.00 18.5
2%, Aged 0.0001 60.27 75.05 27.72%, Aged 1.0 64.79 83.09 22.1
B%, Aged 0.0001 74.30 74.95 19.3B%, Aged 1.0 77 .69 81.65 17.7
59

60
Table 3.20
Average Tested Mechanical Properties of 35XF Sheet Steel
Longitudinal Tension
Amount of Cold Strain Rate F Fu ElongationStretching in. lin. Isec. (k§i) (ksi) (percent)
Virgin 0.0001 32.87 49.35 38.9Virgin 0.01 36.40 51. 76 36.8Virgin 1.0 42.37 56.63 40.9
2%, Non-Aged 0.0001 39.55 49.47 37.72%, Non-Aged 0.01 42.45 52.27 32.52%, Non-Aged 1.0 47.32 57.05 39.3
8%, Non-Aged 0.0001 46.31 49.25 29.78%, Non-Aged 0.01 49.15 52.33 29.88%, Non-Aged 1.0 52.90 57.21 35.0
2%, Aged 0.0001 39.95 49.71 33.82%, Aged 0.01 41.53 51.47 36.72%, Aged 1.0 47.40 56.85 38.4
8%, Aged 0.0001 46.15 48.65 32.7
8%, Aged 0.01 49.27 52.04 30.7
8%, Aged 1.0 53.67 57.53 31.5

Table 3.21
Average Tested Mechanical Properties of 35XF Sheet Steel
Transverse Tension
Amount of Cold Strain Rate F Fu ElongationStretching in./in./sec. (k§i) (ksi) (percent)
Virgin 0.0001 33.51 49.30 36.2Virgin 0.01 36.39 51.04 37.1Virgin 1.0 43.23 55.93 35.5
2%, Non-Aged 0.0001 38.10 47.95 33.62%, Non-Aged 1.0 46.41 55.93 34.8
8%, Non-Aged 0.0001 45.45 47.79 25.68%, Non-Aged 1.0 52.47 56.37 27.7
2%, Aged 0.0001 39.08 48.81 30.82%, Aged 1.0 45.13 55.56 33.5
8%, Aged 0.0001 45.45 47.63 27.08%, Aged 1.0 51.04 55.75 28.3
61
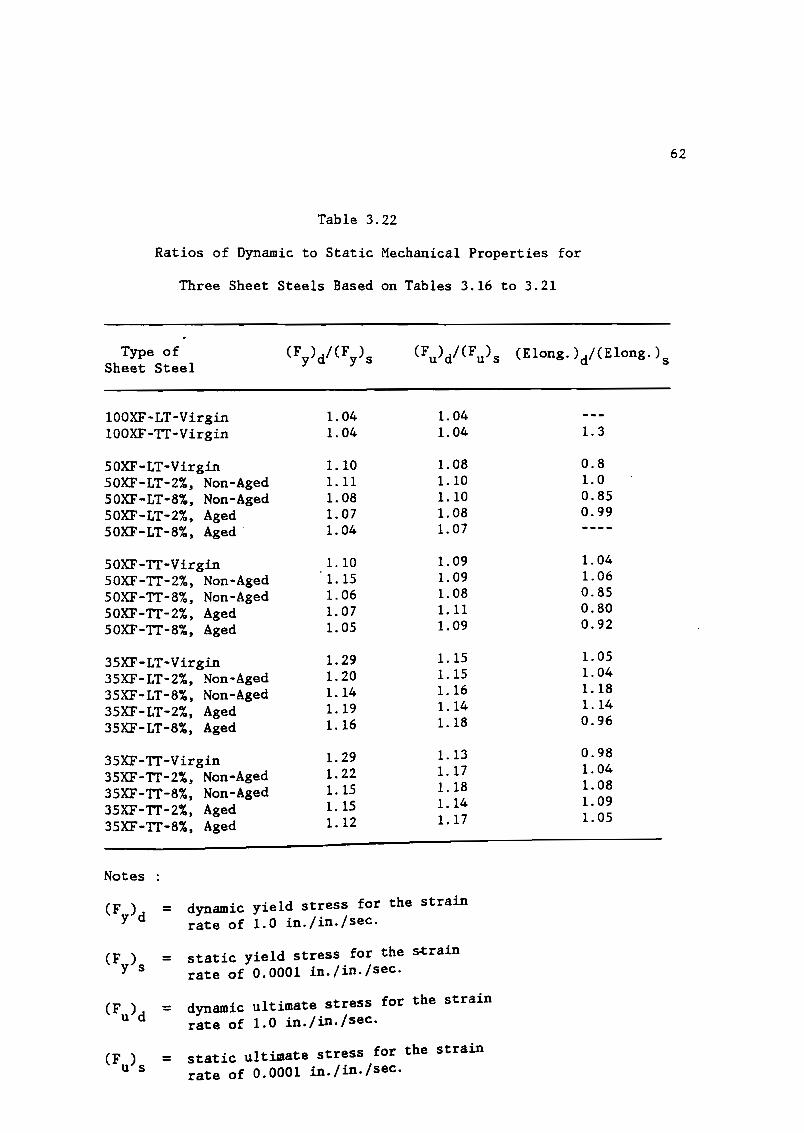
Table 3.22
Ratios of Dynamic to Static Mechanical Properties for
Three Sheet Steels Based on Tables 3.16 to 3.21
Type of (Fy)d/(Fy)s (Fu)d/(Fu)s (Elong·)d/(Elong·)sSheet Steel
100XF-LT-Virgin 1. 04 1.04100XF-TT-Virgin 1. 04 1.04 1.3
50XF-LT-Virgin 1.10 1. 08 0.850XF-LT-2%, Non-Aged 1.11 1.10 1.050XF-LT-8%, Non-Aged 1.08 1.10 0.8550XF-LT-2%, Aged 1. 07 1. 08 0.9950XF-LT-8%. Aged 1. 04 1. 07
50XF-TT-Virgin 1.10 1.09 1. 0450XF-TT-2%, Non-Aged 1.15 1. 09 1.0650XF-TT-8%. Non-Aged 1. 06 1. 08 0.8550XF-TT-2%. Aged 1. 07 1.11 0.8050XF-TT-8%, Aged 1. 05 1. 09 0.92
35XF-LT-Virgin 1.29 1.15 1. 05
35XF-LT-2%. Non-Aged 1. 20 1.15 1. 04
35XF-LT-8%, Non-Aged 1.14 1.16 1.18
35XF-LT-2%, Aged 1.19 1.14 1. 14
35XF-LT-8%. Aged 1.16 1.18 0.96
35XF-TT-Virgin 1. 29 1.13 0.98
35XF-TT-2%. Non-Aged 1. 22 1. 17 1. 04
35XF-TT-8%, Non-Aged 1.15 1.18 1. 08
35XF-TT-2%, Aged 1. 15 1.14 1. 09
35XF-TT-8%, Aged 1.12 1. 17 1. 05
62
Notes
= dynamic yield stress for the strainrate of 1.0 in./in./sec .
(Fy)s = static yield stress for the ~rain
rate of 0.0001 in./in./sec .
(Fu)d = dynamic ultimate stress for the strain
rate of 1.0 in./in./sec .
(Fu)s = static ultimate stress for the strain
rate of 0.0001 in./in./sec .

63
Table 3.23
Values of Strain Rate Sensitivity m for Three Sheet
Steels Based on the Changes of the Yield Stresses at
Different Strain Rates
Type ofSheet Steel
100XF-LT-Virgin100XF-TT-Virgin
50XF-LT-Virgin50XF-LT-2%, Non-Aged50XF-LT-8%, Non-Aged50XF-LT-2%, Aged50XF-LT-8%, Aged
50XF-TT-Virgin50XF-TT-2%, Non-Aged50XF-TT-8%, Non-Aged50XF-TT-2%, Aged50XF-TT-8%, Aged
35XF-LT-Virgin35XF-LT-2%, Non-Aged35XF-LT-8%, Non-Aged35XF-LT-2%, Aged35XF-LT-8%, Aged
35XF-TT-Virgin35XF-TT-2%, Non-Aged35XF-TT-8%, Non-Aged35XF-TT-2%, Aged35XF-TT-8%, Aged
Notes:
0.003 0.0050.003 0.006
0.009 0.0130.009 0.0140.009 0.0090.005 0.0090.000 0.008
0.011 0.009
0.022 0.0330.015 0.0230.013 0.0160.008 0.0290.014 0.018
0.018 0.037
0.0040.004
0.0110.0110.0090.0070.004
0.0100.0160.0060.0080.005
0.0270.0190.0140.0190.016
0.0280.0210.0150.0160.013
strain rate sensitivity based on the changes of yield stressbetween strain rates of 0.0001 in./in./sec. and 0.01 in./in./sec.
strain rate sensitivity based on the changes of yield stressbetween strain rates of 0.01 in./in./sec. and 1.0 in./in./sec.
strain rate sensitivity based on the changes of yield stressbetween strain rates of 0.0001 in./in./sec . and 1.0 in./in./sec.
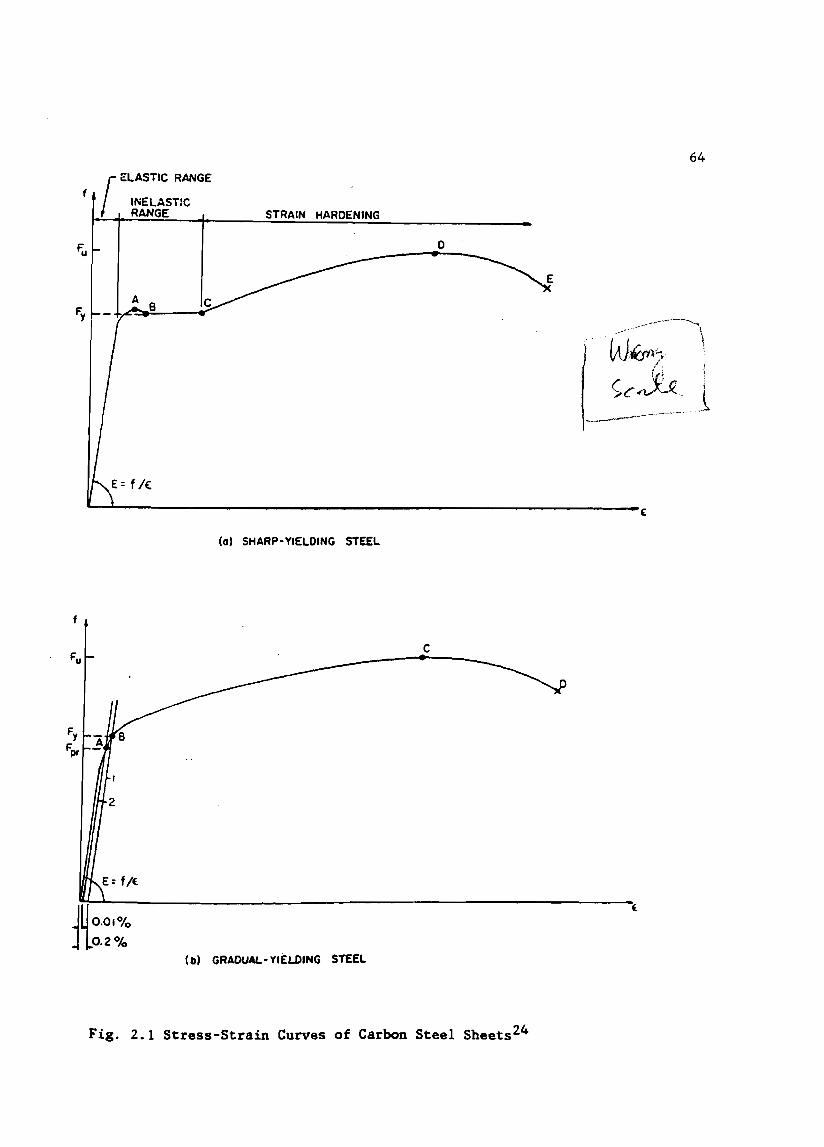
f rELASTIC RANGE
INELASTICRANGE STRAIN HARDENING
D
64
A 8
(0) SHARP-YIELDING STEEL
~/ .-- -----\Whlc--. \
~c~ 1-~~...---.------~~.".._---'-~. '.
(
2
E= fiE.
(b) GRADUAL-YIELDING STEEL
c
Fig. 2.1 Stress-Strain Curves of Carbon Steel Sheets24

65
(fJ(fJ
wa::I(fJ
LOFFSET STRAIN,€
(a) OFFSET METHOD
j I TOTAl ELONGATION STRAIN, (I- OR EXTENSION
(b) STRAIN-UNDER-LOAD METHOD
Fig. 2.2 Determination of Yield Point for Gradual-Yielding Stee124
STRAINAGING
STRAINHARDENING
Fig. 2.3 Effects of Strain Hardening and Strain Aging on Stress. . 24
Strain Character1st1cs

66
f
c
---JI-+=---~~----C
Fig. 2.4 Influence of Bauschinger Effect28
,
---,'
"_---...c...~ENGINEERING
U'IU'IlAJa::tel)
STRAIN
Fig. 2.5 Comparison of Engineering and True Stress-StrainCurves 25

67
.enen
'"a::ten
70
RATE OF STRllNI in/in. I
sec..,
~~I -,0.00001 in/in
V sec
"'"I in./in. V""iiC:u /
~.. :11J.WI J
~
....
10
0o • 12 zo
STRAIN (PER CENT)
Fig. 2.6 Effect of Strain Rate on Stress-Strain Curvefor Structural Steel34
• 100
• .. -CL 80 •~ --. 500 .-• •• 60 •• «l1 .... -- •• •• 31) 40 ::J~ 4% ..
t-.. 2lI1 Yeeld point100
20
10-· 10-· 10-2 1 IOZS . t -1tra.n ra e, S
Fig. 2. 7,~rue"~Stresses at Various Strains Versus StrainRate for a Low-Carbon Steel at Room Temperature37 ·x

68
10 -•.III
20
10 10' loJ
2DO t;:::S=:$=;~~I-r--r-...,lao Yeeld point
10-'10-.,0-'10.2,0-' 1
Serain rate. 1-1
Fig. 2.8 True ~~Stresses at Various Strains Versus StrainRate'~~~Low-Carbon Steel at ZOO·C 37
JGO ,............,.--r--r--,.~.--=11oa
~ ., J,.;.....:t.:.:.:.:.+~.....-t--t--t"-1 !~ . .: SID !~ • &: «10 ~~s;..i:iH ~
C a.c~ MI t-
.. : l-;,~~~!l~f:J~J ~10•• 10.'10-'10.1 1 10 10' 10'
• -1Stra.n rate. I
Fig. 2.9 True~ Stresses at Various Strains Versus Strain ><Rate for a Low-Carbon Steel at 400·C 37

69
•
10 10' 10'
100
•CL~..•! 300 1--..04~ ....-+--t--••::t~
Fig. 2.10 True ~~ Stresses at Various Strains Versus StrainRate '{,6~: Low-Carbon Steel at 600·C 37

10-'10-210-310-410-5
'I ' 11111111 I '.UIIJII 'I!
I IYIELD STRENGTH (0.2 'I. OFFSET)I
-50F -A , \I
75 F 0~..I II
IIJ600F0
(
v
, _' ITTr"r· '-TTENSILE STRENGTH
I"
-50 F..)J
7'51FCfl,~60
0f
)
II)
4
60
3
&0
70
80
6,
7
80
90
100
.U)enw~cn
tit..
STRAIN RATE, In./ln./sec
• 0 •Fig. 2.11 Effect of Strain Rate at -50. 75. and 600 F on theYield and Tensile Strengths of USS COR-TEN Steel39
~
o

10-110-210-310-4 .10-0
, , , 'I'"' , --.- TENSILE STRENG.TH...
1 -SOF
0
~5F
0oQ
600F,,.
~
J I 11111111 I 11111111 I I I I AYIELD STRENGTH (0.2 % OFFSET) -SOF0 I
1 I ~
75 F-0
.....600F
0
lt1
9
7
10
7
8
: 60.enen~ 81...en
STRAIN RATE, In.!In./"c
Fig. 2.12 Effect of Strain Rate at -50: 75: and 600·F on theYield and Tensile Strengths of USS TRI-TEN Steel 39
-..J....

72
100 25
50~__~~ L...-__...L.__-J ..I-__...J 0
-3.0 -Z.O -1.0 0 1.0 Z.O 3.0
LOG STRAIN RATE, Sec-I
90 ZO
... ~~
0 -(J') Z(J') 0W 15a:: ...... c(
(J') C)
~..J
10 W
~a::0La.
60 5Z::::>
Fig. 2.13 Effect of Strain Rate on MechanicalProperties of a HSLA Steel40
IIlISI 01 SfEELI_!lED
01 02
ENGINEERING $TRAIN
Fig. 2.14 Strain-Rate Changes During Tensile Test, Four Strain RatesShown Are 10-1, 10-2, 10-3, and 10.4 sec· 1(4l)

-N.
.,. E
.. E••L. ..- -til
e 'ens'" streftVCh30 -.Uppe,'~'~ l-.~
Olo-er ,iftd point ,.....- .......-J-. - -
lcf 1dCrossheod speed
73
Fig. 2.15 Effect of Crosshead Speed on YieldBehavior and Tensile Strength42
.,.-------------------,
•
.. ., t' :..~ I·t
CAl ,0 ... ~ ,,~ ,-,
Fig. 2.16 Stress-Strain Curves for SA-106 Carbon Steel Pipe43

74
;/I estimated expt'l error
o6,ofJ experimental data
- new rate law
O'------'----~----'-------J
10-5 10-4 10.3 10.2
Strain Rate, (s·11
0.024
Q) 0.016:I
o>
Fig. 2.17 The Variation of the Strain Rate Sensitivity (m-value)With Strain Rate44
1250.....--~--r---....----,
7
500
250
ste(l( X45 CrS,9 3t(lmp(lrotur(l RT
• -4a) Ep ,= 5·10 1/5
• 2b) Ep, =1 10 1/5
• 2c) EPi =5 10 Us• 3
d) Ep1 =2 10 1/5• 3eo) Ep ,=5 10 Us
10 20 E 30 .,.
Fig. 2.18 Stress-Strain Curves for High Strength Steel at VaryingStrain Rate 5

ao~........~...
o
ClI'W Strain rote
: fJSC""'• 171• 808
75
Fig. 2.19 Dynamic Stress-ftrain Curves for AISI Type 304Stainless Steel 7
Jl...~...
f... Tfj:• 140• S02
o~---rr--....,tor---"ft---~N-"--""-
Fig. 2.20 Dynamic Stress-Strain Diagra. of AISI Type 304LStainless Steel47

Strain rate
r]SC"1129827
76
O~--'"iIO:'---~20r----""30=----:"~O----::SO~
(0) EngineeillJ struin <%)
Fig. 2.21 Dynamic Stress-Strain Diagram of AISI Type 347Stainless Steel47
3.0 .--..,...--.--r--..,.-T-.....,..-r---r--'T-~...,1000
500
Fig. 2.22 The Ambient-Temperature Yield Stress of Annea1d Type 21-6-9Stainless Steel As a Function of Strain Rate48

77
10 uti W
50 S~~--1---¥::+-I4O~.....1--......_.-._.-.._......-lL-.;;;J
10-1 10-2 10-' 1
110 r--,.-.,.-.....,-..,...-r---
100
Plastic .train rate••- ,
Fig. 2.23 Analysis of the Uniaxial Stress, Strain, and Strain RateData for Aluminum 1060-0
49

78
II Mo••nd DuffyII National Physical laboratoryII Minshall" Campbell and Harding
- TtwftoPolft -uJ description
--t-----+---~~+_---___J100
oo~e--~~=-~~~::....----L-L---J 0
.,;..e;;'a..>~•;;..::scE....e;;'a'0.>'"E•c~ -lIlI.'=" ---"L.:- ..J. ...L. ..L ---=:l - 100
lli-· 10-' 10' 10" Icf
:. 14lll1r----....,:-----,.-----,-----r.,------""~ ~~~ ~
o RoMnfI4lld and Hahn
• Krafftv Winloclt.. Manjoineo Taylor
• Chalupni.• Johnson. at .,.6HatCli"ll
Sir,,", rate. S - •
Fig. 2.24 Dynamic Yield Stress (Minus the Static Yield Stress)Versus Strain Rate for SteelSO
.~;;... ;;;..::scE....e
20 ;;'tl..>-u
E•c:>-o10"10'
Slraift r.... s - •
10'
I I I
AIlIIniI_.. 16061·T6IBulchet and Karnes- IPu,. AI, Karnes and Ripperg.- IAJuminum'lindholm
0 IAI single cryst.'s' Ferguson Kumar .nd Corn-m IPure AI, Yoshida and NagacoDeduced from crack velocity data
! ..i
..I ..
I 0
•Q.
~4lllI.-..!;;-'4iiii•;,ce 2111••!;;:!l•>-.~
!c~
Fig. 2.2S Dynamic Yield Stress (Minus theS' oStatic Yield Stress)
. R "I: Al .Versus Stra1n ate Lor um1num

•
•
•-. ••••I: . :j =:1· ::
...~.:--=....----:..~_~._....J.'-- ...&.:--......:--.....J.....__._'lFig. 2.26 Strain and Strain-Rate Dependence of the
Flow Stress of High-Purity Aluminum51
.,.----......--,.--...--..,...-.....- ....a
.~.r_~.T.__.~.~--'--.'-_ ....._........-...J....._-.....Fig. 2.27 Strain and Strain-Rate Dependence of the
Flow Stress of Aluminum 1060-051
..r---..,...-_-.....,.-......,..--...---r--,
••••~------;: .
_a __ .--==:::-. _:::: .I ~ ..-!"I:--~: -1 - ~....
1 ....
',II"t'~_"""""--."=4---',--.~-~~r---:~r~~---_...
Fig. 2.28 Strain and Strain-Rate Dependence of theFlow Stress of Aluminum 1100-051
79

80
10
• 40.0" ..
• 910.0" ..
SPECIMEN: .37 S inOIA x .500 in LONG
•.009 in/in/sec
50
•.~.., o~
~4"
~.,,;I.8· COMPRESSION TESTS ON
I ALUMINUM 6061-T640 I
8
130 '
I ..13
a 2.0
20,
COMPRESSION TESTS ONALUMINUM 7075·16
100~ ..,."'-.'....,.
80 ....,r- -
~ t SPECIMEN: .375 in OIA x.... c
c 60 "........ t .500 in LONG ::2~
I 0 0.03 in/in/sec0
0 • 00 I
00 • 4.0 • -
40 ""j -'"
'" 0 D 18.0 · • '"'" I
........ DCII:
CII: • 560~
~ I • · • '"'" 0
20 '.
•°0:-+~2:--.~3-4~-!5l-+6-O:7~~8--::!9
STRAIN ~ (in/in)
o0:-+--:!2~3~~4~5l-6+--::!7:--8±--:!:9~10STRAIN ~ (in/in)
Fig. 2.29 Compression Tests on Aluminums 7075-T6 and 6061-T653
4 KARN£S/RIPP£RGER (1966)
o GREEN ET AL. (1970)
o HOLT ET AL. (1967)
9 LINOHOLMI YEAKLEY (1965)
<> LINOHOLM I BESSEY (1969)
6"4 STRAIN
01060-0
1060-001100-0
9';-'"00-0
~'-O
06061'~ ~7075-02024-0~ __
07l78-0~'-T6 2024-T3
OL--,.L.0--2J.O--30~--:4J.:O~--:50=-.&.-:6O;;.·:::~"'~0~=;80~~~;-=~o STATIC FLOW STRESS v, (KSII
010...---------------------------,
~008....- ..:CI'.2
~• 0.06
,gol)
)-
~ 004;:iiiz...,:: 002~a:
Fig. 2.30 Strain-Rate Sensitivity of Aluminum Alloys31

81
0.12 0.'6 0.20 024 0 ze O.R
1IlUl STlta* C.,ltll
008
------"'" ---"."" .... -- ._-
~~ ....if-",,' --
"/
; V I
! "el'r" .- StaTe
,
Zo,ooo
,.,000
oo
_16,001);;~....! 12,000..!lc~ 8.QOO
Fig. 2.31 Cyclic Static-Dynamic-Static Loading for A1uminum52
02OJZ 0J6 0.20,... snu- c•.,.,
0.08
----;..::-I.-
...... -.... ;. ... /" -
" .... 11- -v·....~ ....---
j ~/[(
l/~ .'ate --I
I .. oz• 0."
••000
20.000
Fig. 2.32 Cyclic Dynamic-Static-Dynamic Loading for Aluminum52

82
1---........ :.:::--~ .-r ;
1 0.'" ~ --
~\ ~--- -!/ --,....,. .. -. .
f ,,;'
,r~ - -I I
oo 004 oae OJI 0.16 010 OZ4 oze 0.32
lllUI !lTltAI. '.'IN'
Z4.QOO
4.000
-'-.000..~
::r IZ.QOO:;
Fig. 2.33 Cyclic Dynamic Loading for Aluminum52

80.-----,r-----,..---r----
'040t---Ill'41..-
°O~-~:---~~--:-:---:f.0.2 0.4 0.6 OSLOo,I. slr~n~ IE
Fig. 2.34 Effect of Alteration of Strain Rate Upon Flow Stress( Static-Dynamic )55
8O_---.---..,..--~-"?'f
20
83
0.2 010 OSLog.straift. I
O.P.
Fig. 2.35 Effect of Alteration of Strain Rate Upon Flow Stress( Dynamic-Static )55

'Cji 60
=
84
Strain 10/.)
Fig. 2.36 Results of Constant and Incremental Strain-Rate Tests on1020 Hot Rolled Steel (HRS)57
20
L......--'---'._*......---::..'::-....--::~-' 0o 10 20 30 1.0
Strain (%).
Fig. 2.37 Results of Constant and Incremental Strain-Rate Tests on1080 Cold Rolled Steel (CRS)57

1250Str8lft Rale (I") : AISI 316 H Test Temperature: 20 °C.- flrestrain
Q. • 0.0047 A , 0.004~ + 0.0162 e ' 500
"":'000 I 0.0917l: • 0.1665.,;.. • 0.2300! • 0.3048u; 750Ql::l
~
-80 sao~...~
i40 250It
ci.E•... 0 0
0.36 0.48 0.600 0.12 0.24True Strain,ft
Fig. 2.38 Tensile True Stress-True Strain Curves at Ambient Temperaturefor Monotonic Loading to Fracture at a Strain Rate of 0.004sec-1 (Curve A) and 500 sec- l (Curve B). and for Quasi 54Static Prestraining Followed by Dynamic Reloading to Fracture
85

I T Ie I I T C II T C I
T'T T T
T T 1,
T T --
T T ROLLING DIRECTION T TI T ! C I I T ! C I
I I T C I
· ..
·r- -r-
~r r ,.. r r r
h .... .... 0 !;.., .... .... .... ---..... , - .
LEGEND
LT - LONGITUDINAL TENSION,LC - LONGITUDINAL COMPRESSIONTT - TRANSVERSE TENSION
TC - TRANSVERSE COMPRESSION
•
W/4 W/4 W/4 W/4
W: WIDTH OF STEEL SHEET
2"
12"
Fig. 3.! Location of Tension and Compression Coupons!!000\

1-1/2" 1/2" OIA. HOLE
----$-----1- 12"
1-1/2"
"\\0
Fig. 3.2 Nominal Dimensions of Tension Coupons Used for IOOXF. 50XF.
and 35XF 11
00'-J

Fig. 3.3 Material Test System (MrS) 880 Used for Tension Tests
0000

Fig. 3.4 MTS 880 Test Controller and Function Generator
89

Fig. 3.5 Data Acquisition System
90

91

92

Fig. 3.8a Test Setup Showing the Attachment of Extensometer
93

Fig. 3.8b Test Setup Showing the Attachment of Extensometer
94

Fig. 3.9 IBM PS/2 Model 30 Personal Computer with IBM ColorPlotter and NEC Pinwriter P5XL Printer
\.0Ln

DATA GENERALMV/10000COMPUTER
CAMAC --.TI..._1/1111111 'H•• MAl'HIC8
TMHDYIIIW MAPHIC.
SOFTWARE
SYSTEM AND SOFTWARE OVERVIEW
CAMACDATA
ACQUISITIONtc=l -mAIN I_1/11111 .td H'
MTSCONTROLCONSOLE
ACTUATOR
~ICATION ~TW~
U8ItI' ....ITTIIN P'1IA
" IIPllCIl"IC TII.T
P'lIAT_ " -=-CAMC MODUL• .-nol...
l"_" eClOf:
avaTItN 1~1fT
CIoMAC JNTIEN'''" .-.ouT1...
P'lIAT_ " COOtl
.VaTltMJ~
_1111111. , ••
ClMUoC INTII,.,."" .-nol...
.V.TItM~
_ 1/lIIII'H
fWIlDW.... INTI""""
CAMAC CRATE
U CHIoNNlIL_oe TO DlalTM. CDNYIltTIA
............111'UNCT10N _TlIA
CCIHT-. JNTVPACIIl TO NTa
- -Ir:~ :CX;:I;- - - jo __1- _
CANAC CClHTItDU.IA
IIII
'0C'\
Fig. 3.10 MrS 880 Automated Test System and Software Overview

S,rvonl"Control Sign.1
Actuator
448.'"VaIv' Driver
448.22AC Conditioner
IXdcr 31
Displacement - I P'1Xdcr
DC Error
Displacemenl
....8.21f ore, IDC Conditioner I~ I
i IXdcr 11
....8.21~ SUlin IDC Conditioner
IXdc,21
f"dblckSllect
Analog Switch
Actl"Control
Modi
Fledback Sllect
Comm.ndS,Iact
448.17 Micro SuplrvlsedS,rvoffHdbec:k
CommandS,Iact
, I ~ I An.lot Switch
448.85Ta.. Controllerr----,ISit Point \1,.4IIIISpan 1I
Xdcr 3
448.85Tlit Controller,----------,
Xdcr 1 Actlv' IModi I--L I
Xdcr 2 :ctiv;l!Modi--Lo O......-..-+I...~...I
tIIIIL ..;,J
Protram Input fromComputer Command 'Glneratlon D,vlci
Input ProtramCommand fromProtrammer 2
Input ProgramCommand fromProgrammer 1
Fig. 3.11 MrS 880 Test Controller Servo Control Loop\0"-oJ

Strain , Percent
RT1 RT2
Time , Seconds
RT1
98
Fig. 3.12 Typical 'Test Function Generator Ramp Waveform

\0\0
1000900800700
Strain Rate = 0.0001 in./in./sec.
400 500 600Time, Seconds
300200100o
2
4
o te== I i I I I Iii iii I Iii I I i I I
8,
ercent
P 6
S 14 --I
tr 12a•
I 10n
Fig. 3.13 Strain-Time Curve for 100XF-LT-l.(Virgin Material)

I-"oo
2018161410 12Seconds
8
Time
Strain Rate = 0.01 in./in./sec.
64
S 20
t 18
r 16a· 14I
n 12
p 10
e 8
r 6ce- 4n 2t
00 2
Fig. 3.14 Strain-Time Curve for 100XF-LT-3,(Virgin Material)

30 · i
~
o~
0.40.350.3
Strain Rate = 1.0 in./in./sec.
0.25, Seconds
0.2TIme
0.150.1Oi I I I I I I I I I I I I I t
0.05
Str 25
a•I 20n
p 15
er 10ce 5nt
Fig. 3.15 Strain-Time curve for 50XF-LT-7, (Virgin Material)

III
---T--r--T I I I I I I I
......oN
.... 0.0001 in.jin.jsec.- 0.01 in.jin.jsec.-- 1.0 in.jin.jsec.
161412I I I I I ~
100XF-LT-4
6 8 10
Strain , Percent4
lOOXF-LT-6
100XF-LT-l :
2
••• 0 •••••• 0 •••• •••• •••• • 0 •••••••••• 0 •
.. .............. - -- - - -- -- - - - - - - - --
o
160150140
S 130t 120r 110e 100
90s 80s 70
60K 50S 40I 30
20100
Fig. 3.16 Stress-Strain Curves for 100XF-LT-l, 100XF-LT-4,and 100XF-LT-6,(Virgin Material)
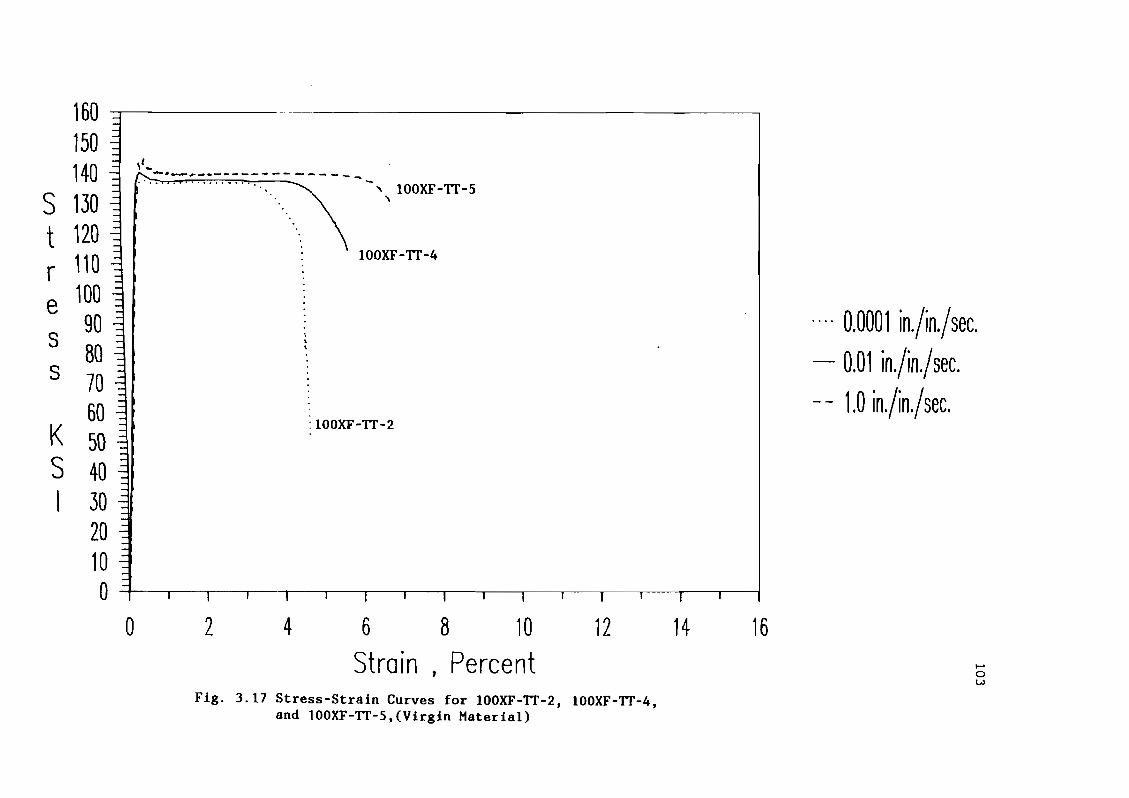
160150140 ~ ~._---------------S 130 . q"." ............... ~ -- 0,\ lOOXF-TI-5
t 120r 110 ::l ,
. 100XF-TI-4
e 100
s 90 .... 0.0001 in.jin.jsec.80
,,
s 70- 0.01 in/in/sec.
60 -- 1.0 in.jin.jsec.K 50
:100XF-TI-2
S 40I 30
20100
0 2 4 6 8 10 12 14 16Strain, Percent ~
0w
Fig. 3.17 Stress-Strain Curves for 100XF-TI-2, 100XF-TI-4,and lOOXF-TI-5,(Virgin Material)

~
o~
.... 0.0001 in.jin.jsec.- 0.01 in.jin.jsec.-- 1.0 in.jin.jsec.
50XF-LT-9
: 50XF-LT-l
50XF-LT-4
------------------~. . :..:...:....: .
4 6 8 10 12 14 16 18 20 22 24 26 28 30 32 34 36 38 40
Strain , Percent
100
90
S 80t
70re 60s ......... ,
50s
40
K 30SI 20
10
0o 2
Fig. 3.18 Stress-Strain Curves for 50XF-LT-l. 50XF-LT-4.and 50XF-LT-9.(Virgin Material)

.... 0.0001 in/in/sec.- 0.01 in/in/sec.-- 1.0 in/in/sec.
50XF-TI'-9
------------- ..............., -' ,. 50XF-TI'-6 ...,..
" .,.~ 50XF-TT-l
II I
,.1II .,"I""
40
K 30S
1
20
,,,,,II I
10
. I I •• I •iii Iiii Ii I I i II iiio I I - •.--.-r.-,-.,. -- I
i100 I
90
S 80
t 70re 60
s 50s
o 2 4 6 8 10 12 14 16 18 20 22 24 26 28 30 32 34 36 38 40
Strain J Percent ....oV1
Fig. 3.19 Stress-Strain Curves for 50XF-TI'-1. 50XF-TI'-6.and 50XF-TI'-9.(Virgin Material)
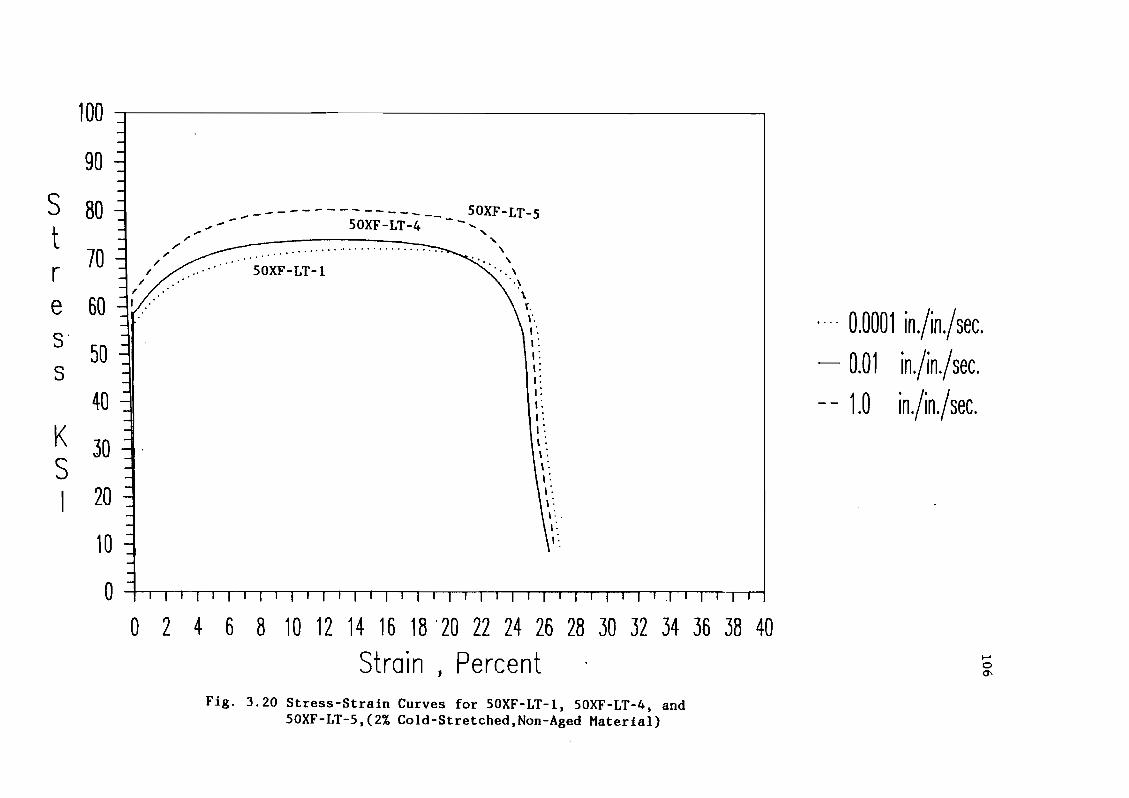
.,., 0.0001 in/in/sec.- 0.01 in/in/sec.-- 1.0 in/in/sec.
••••••• 00
•
50XF-LT-l
..".----------- -__ 550XF-LT-4 -- - _ OXF-LT-5....
"' "' \". \
", \
'~
\t,r,I'.,:1:I:,:,:,:I:,:,:\ :,:,:,',,',
\: .,:I'·
....
100
90
80"l ...
/
70 -3;'
//
//
I
60 .::tl /,'
50
40
30
20
10
0
KSI
Stres·s
o 2 4 6 8 10 12 14 16 18' 20 22 24 26 28 30 32 34 36 38 40
Strain , Percent ....o()\
Fig. 3.20 Stress-Strain Curves for 50XF-LT-l. 50XF-LT-4. and50XF-LT-5.(2% Cold-Stretched.Non-Aged Material)

.... 0.0001 in.jin.jsec.- 1.0 in.jin';sec.
\
.
..
50XF-TT-l
50XF-IT-3---------.................. - ..
• I
0-; I11I111111 r 111111111111111111111" I I" I ,
100
90
S 80t
70re 60s
50s
40
K 30SI 20
o 2 4 6 8 10 12 14 16 18 20 22 24 26 28 30 32 34 36 38 40
Strain f PercentFig. 3.21 Stress-Strain Curves for 50XF-TT-l and 50XF-TT-3,
(2% Cold-Stretched,Non-Aged Material)
.....o'-l

100
90
s 80] 50XF-LT-6~ .... ---------
t- .... _-
r 70
e 60ss
50
40KS,
~ .\\\,,,,~\ : 50XF-LT-I,I,,,,,,,,
\
50XF-LT-4
.... 0.0001 in/in/sec.- 0.01 in/in/sec.-- 1.0 in.jin.jsec.
o 2 4 6 8 10 12 14 16 18 20 22 24 26 28 30 32 34 36 38 40
Strain , PercentFig. 3.22 Stress-Strain Curves for 50XF-LT-I, 50XF-LT-4, and
50XF-LT-6, (8% Cold-Stretched,Non-Aged Material)
~
o00

100
90
S 80t
70re 60s
50s40
K 30S, 20
10
00
50XF-TT-3
._ 0 -·········.0. _0.50XF-TT-l
2 4 6 8 10 12 14 16 18 20 22 24 26 28 30 32 34 36 38 40
Strain , PercentFig. 3.23 Stress-Strain Curves for 50XF-TT-I and 50XF-TT-3,
(8% Cold-Stretched,Non-Aged Material)
.... 0.0001 in.fin.fsec.- 1.0 in.fin.fsec.
~
o\0

.... 0.0001 in/in/sec.~ 0.01 in./in.fsec. .-. - 1.0 in.fin.fs~c.
. ".... ,.'.'.
\ "., ..\ .., .., .., :, :, :, :
I :I :I :. 50XF-LT-lI .II,II
50XF-LT-3 \ ,,II •,II
SOXF-LT-6
..........................----------------,-,--- ,--
, I I I r'-', I I ( , I I , I ( I ( , , I , r",.-' , I , I 1 I I I , r I I ..'
100
90
S 80t
70re 60s
50s
40
K 30S, 20
10
0o 2 4 6 8 10 12 14 16 18 20 22 24 26 28 30 32 34 36 38 40
Strain I Percent........o
Fig. 3.24 Stress-Strain Curves for 50XF-LT-l, 50XF-LT-3, andSOXF-LT-6, (2% Cold-Stretched, Aged Material)

50XF'-Tf-3
--------
100
90
S 80 i
t70r
e 60s
50s
40
K 30S, 20
10
0
.. " _ ..
50XF-Tf-l ""
,..... .. 0.0001 in.fin.fsec.- 1.0 in.fin/sec.
o 2 4 6 8 10 12 14 16 18 20 22 24 26 28 30 32 34 36 38 40
Strain I PercentFig. 3.25 Stress-Strain Curves for 50XF-Tf-l and 50XF-Tf-3,
(2\ Cold-Stretched, Aged Material)
......
......
......

.... 0.0001 in/in/sec.- 0.01 in/in.fsec.-- 1.0 in/in/sec.
50XF-LT-3
...•
.
.
..
.SOXF-LT-l:
50XF-LT-6__ .."...... - A~""'''''",,,,,,, ""\.,J ...... " ... ¥fI
_.~""......I..
100 :rl ----------------------.I
90
70
60
50
40
K 30S
I W I
i , iii'
10
iii i • • i i •• f • • • •
i i fI Ii.I I I I Io IIIIIIII
S 80tress
o 2 4 6 8 10 12 14 16 18 20 22 24 26 28 30 32 34 36 38 40Strain , Percent ~
~
N
Fig. 3.26 Stress-Strain Curves for SOXF-LT-l. SOXF-LT-3. andSOXF-LT-6. (8~ Cold-Stretched. Aged Material)

.... 0,0001 in.jin.jsec,'- 1.0 in/in/sec.
···
50XF-IT-3
~ : ]~~~~rr~'2"~~re 60:t
S 50s
40K'S 30
I 20
100 , I
90
o Iliitiiiliiiiiiiiiiiiiiiiiiiiiiiil'I'iiil
o 2 4 6 8 10 12 14 16 18 20 22 24 26 28 30 32 34 36 38 40
Strain , PercentFig. ).27 Stress-Strain Curves for 50XF-TT-2 and 50XF-TT-3,
(8~ Cold-Stretched, Aged Material)
........w

70 i I
... "0.0001 in.jin.jsec.- 0.01 in.jin.jsec.-- 1.0 in.jin.jsec.
35XF-LT-l
-------------------,- - - - - 35XF-LT-4 "", 35XF-LT-9
,\
\\
, \. \
" \" i" I: ,: i: I: I: I: I: I: I: I: I: I: I: I" I,
I
................................................................
."
."
o t I I I I I I I I I I I I I I I I I I I I I I I I I I I I 1 I I I I I 1 1 1 I I I I' 1 I I I ITT
60St 50re 40s
s 30
K 20S
I 10
o 2 4 6 8 10 12 14 16 18 20 22 24 26 28 30 32 34 36 38 40 42" 44 46 48 50
Strain , Percent .........~
Fig, 3.28 Stress-Strain Curves for 35XF-LT-l. 35XF-LT-4.and 35XF-LT-9.(Virgin Material)

70 -- I
6035XF-TT-5S ~ __ ----_____
~-~- ~-~~-- ,... - - - 35XF-TT-4 "' ...
t 50 /~~ .................................. '\r " -,.... ..... \/ .. , \
e if...·· 35XF-TI-l .... \
.... 0.0001 in.jin.jsec.40 . . ,
in.jin.jsec.s .... . ,
- 0.01:\ 's 30 ~ : ,in.jin.jsec.
: I -- 1.0I,: ,
K 20 : ,: ,: ,S : ,: ,, : ,: ,10 : ,
-I I 1 I 1 I 1 I I I 1 , I I I I 1 I I I I i I I I I I i I I , i , I , i I I , i , I , I ,
o 2 4 6 8 10 12 14 16 18 20 22 24 26 28 30 32 34 36 38 40 42 44 46 48 50Strain , Percent ~
~
V1
Fig, 3.29 Stress-Strain Curves for 35XF-TT-l. 35XF-TT-4.and 35XF-TT-5.(Virgin Material)

70 1 I
..0'
.... 0.0001 in.fin.fsec.- 0.01 in.fin.fsec.-- 1.0 in.jin.jsec.
.......
35XF-LT-2
35XF-LT-4
3SXF-LT-S
---------------------,-- ,--- ,-- ,\
" \\
"". \'. \'. \
'. I: I: I: I: I: I: I: I: ,: ,: ,: ,:," ,: ,:,
....... - .oo- ·· OO" ..
.'
o til r IIII II II II II II IIII II II II II II II II II IIII II' r r ••• f
o 2 4 6 8 10 12 14 16 18 20 22 24 26 28 30 32 34 36 38 40 42 44 46 48 50Strain , Percent
60
10
St 50r
e 40ss 30
K 20S\
Fig. 3.30 Stress-Strain Curves for 3SXF-LT-2. 3SXF-LT-4. and3SXF-LT-S.(2\ Cold-Stretched.Non-Aged Material)

70 I I
.. .. 0.0001 in/in/sec.-- 1.0 in/in/sec.
35XF-Tf-4
35XF-Tf-l
'.
.. , ~ ..'
o " 1 1 I I I I I 1 I I I 1 I 1 I I I 1 I 1 I T I I I 1 I 1 I 1 I 1 I I I ,-,-1 I 1 I ,-rrr"-T
60St 50re 40ss 30
K 20S
I to
o 2 4 6 8 10 12 14 16 18 20 22 24 26 28 30 32 34 36 38 40 42 44 46 48 50
Strain , Percent ~
~.....
Fig. 3.31 Stress-Strain Curves for 35XF-TT-l and 35XF-TT-4,(2X Cold-Stretched,Non-Aged Material)

70 I I
.... 0.0001 in.fin.fsec.- 0.01 in.jin.jsec.-- 1.0 in.fin.jsec.
35XF~LT-3
35XF-LT-l
35XF-LT-5--------------"---- ,-- ,\
\\\\\,,,,,
I,IIII,II,,,
.. " " ..
o I 1 r I , I , I I I I , 1 , I , I , I , I I I I 1 , I , I , I , , I , I , I , I ,r' · · , · · · · I
60St 50re 40ss 30
K 20S,
o 2 4 6 8 10 12 14 16 18 20 22 24 26 28 30 32 34 36 38 40 42 44 46 48 50
Strain , Percent........00
Fla· 3.32 StrU&s-Strain Curves for JSXF-LT-l. 35XF-LT-3. and35XF-I.'T-S.(8\ Cold-Stretched.Non-Aaed "ateria})

70 • I
.... 0.0001 in.jin.jsec.- 1.0 in.jin.jsec.
35XF-IT-3
35XF-IT-l...............................................
o 'I i , , iii , Ii' , , iii , iii ii' i , iii •• , • ii' , i , •• , ••• I , , , , l
60St 50re 40ss 30
K 20S
. \ 10
o 2 4 6 8 10 12 14 16 18 20 22 24 26 28 30 32 34 36 38 40 42 44 46 48 50
Strain t PercentFig. 3.33 Stress-Strain Curves for 35XF-TT-I and 35XF-TT-3.
(8% Cold-Stretched.Non-Aged Material)
~
~
\0

.... 0.0001 in.fin.fsec.- 0.01 in.fin/sec.-- 1.0 in./in./sec.·
·······•
35XF-LT-2
•,If ••• -·············· •••••••••••••••••• ,. ••••••••.... .....
35XF-LT-6-- ........ --_ ....... ----~~ --~-
~~' ---~--35XF-LT-3 - - .... - .... ....
..........
\\\\\II,,,,,,
IIIIIIII,I,
o liiiiiiiili"'iliii"i"i'i'i"iiiii'l"""'i •• ,,1
llJ I I
60St 50re 40ss 30
K 20S, to
o 2 4 6 8 10 12 14 16 18 20 22 24 26 28 JO 32 34 36 38 40 42 44 46 48 50Strain • Percent
Fla. 3.34 Stre•• -Strain Curve. for 3SXF-LT-2. 3SXF-LT-l. and35XF-IX-6. (2' Cold-Stretched. A.ed Haterial)
....No

70 I I
.... 0.0001 in/in/sec.- 1.0 in.fin.fsec.
\
.- ..
35XF-TI-3
35XF-TT-l
.".. '
o l'iii'iliiiiiiiJI'ii.iiiiiifiiiiiiiii'iii;iiiiil'J~
60S j
t 50 ~
r ~I"e 40ss 30
K20S
I 10
o 2 4 6 8 10 12 14 16 18 20 22 24 26.28 30 32 34 36 38 40 42 44 46 48 50
Strain , PercentFig. 3.35 Stress-Strain Curves for 35XF-TT-l and 35XF-TT-3,
(2% Cold-Stretched, Aged Material)
......N......

70 I i
.... 0.0001 in.fin.fsec.- 0.01 in.fin.fsec.-- 1.0 in.~n.fsec.,I
I1II,I.l,l,I,I,
35XF-LT-6
35XF-LT-2
35XF-LT-4~~-----~~~-~~~~-~~--
........", , -, .....
o I'i.ii.li.i) ••••• ili.iiiii •• ii •• i •• ilii.iiiil.li •• '
60
10
St 50re 40ss 30
K 20S,
o 2 4 6 8 10 12 14 16 18 20 22 24 26 28 30 32 34 36 38 40 42 44 46 48 50Strain , Percent
Fig. 3.36 Stress-Strain Curves for 35XF-LT-2, 35XF-LT-4, and35XF-LT-6, (8% Cold-Stretched, Aged Material)
......NN

70 I I
35XF-TI-360
S.
t 50r
e 40s
s 30
K 20S
I 10
.... .
35XF-TI-l• ~ •••• I ••••••••••••••••••••••
.... 0.0001 in.jin./sec.- 1.0' in.jin.jsec.
o Iii' iii iii ii' iii iii iii iii iii f , Iii iii iii iii iii iii iii
o 2 4 6 8 10 12 14 16 18 20 22 24 26 28 30 32 34 36 38 40 42 44 46 48 50Strain , Percent
Fig. 3.31 Stress-Strain Curves for 35XF-TT-l and 35XF-TT-3.(8% Cold-Stretched. Aged Material)
....NU>

Fig. 3.38 Effect of Strain Rate on the Yield Strength of IOOXFSteel in Longitudinal and Transverse Directions, (Virgin Material)
.....N~
* Yield Strength, LTe- Yield Strength. IT
101
t •••••••••• ~ •••• ............. ( ..
0.001 0.01 0.1
Strain Rate, in./in./sec.0.0001
···
···
·· .· .· .· .· .·· .· .· .· .· .· .. . .
.. .. .. .. .. .. .. .. .. .. .. .. .. .. .. : '" ! : ~ : ... .... .. .. .... .. .. ... .· .· .· .
· ............. "' " :, .. , .
· .· ---
120 I I i I I I I I I I Iii I I I I I I I I I, i i
0.00001
Stre 140
ss,
k 130
s.I

90 I I
......NlJl
"* Yield Strength-e- Ultimate Strength
1010.001 0.01 0.1
Strain Rate, in./in./sec.
................................ , ..
.. .. .. .. ............................................................. f , , , ..
Fig. 3.39 Effect of Strain Rate on the Yield and Ultimate Strengthsof SOXF-LT Steel, (Virgin Material)
................ f ! ! ~ , I ..
........ __ I "'-., , ro : ! , ~ ~ ... .. .. .... .. .. .... .. .. .... .. .. ... .. .. .... .. .. .... .. .. .... .. .. .... .. .. .... .. .. .... .. .. .... .. .. ..
40--1 I Iii I II~ I II~ I II~ I II~ I III0.00001 0.0001
S 80tr
e 70ss, 60
ks 50.I

90 T1---:---:--------:---~--------.I
'* Yield Strength-e- Ultimate strength
. . ... , , , ..
............... ~ \ \ ( ; .
. . .. . .. .
: : ~ ; .
........ w ..· .· .· .: r.
St 80ress 70,
ks 60•,
N0\
1010.001 0.01 0.1
Strain Rate. in./in.1sec.0.0001
Fia. 3.40 Effect of StrAin Rate on the Yield and Ultj.ate Stren~ths
of SOXF-l,T Stee It (21. Cold-Stretcbed.Non-Aaed Haterial)
50-\ I Iii I Iii I Iii I Iii I Iii I III
0.00001

90 i •• •• I
....N......
"* Yield Strength-e Ultimate Strength
101
- 1 • I .
.
·
·
·
0.001 0.01 0.1
Strain Rate, in./in./sec.0.0001
······
Fig. 3.41 Effect of Strain Rate on the Yield and Ultimate Strengthsof 50Xf-l~ Steel, (8~ Cold-StrBtched.Non-Aged Material)
· .· . . .•······· .. ·······,············ .. ···,············· .. ··1··· : , .
................ ~ \ ~ ~ : .· .' .· . . . .· . . . ..' .· .'· ..'· . . . .· .'. .· ..'· ..'· . . . .· ..'· . . . .· .' .· . . . .· .' .
60 I : . : : :0.0000; ,., · ... · ,.; · ,.: · ..; , ·-.--l
Stre 80
ss,
k 70
s•,

90 TI --~----:-----::------------,.-------.I
'* Yield Strength-e Ultimate strength
·····
" , .········ ·. .. , ..
············ .. ·-·f··············· lll c················!······· .... ······ .. r······.,··· .. ··.··!···············,.. .. . ..· .. .. .. .... . .. .. ...... ...... .. .. . .... . .. .. .... .. . .. ..· ~ .. .. ..· .... .... .. . .. .· . .· . .· . .
.
.
~: :.................~ •••••• 'ee •••• ,.: • •••••• •• •• 0' •••••••. e •• :' ••••••••••••••• : .
. . .. . .............................. , •••• , ••••••••••• 4i ••••••• ~ ••••• , .
~ .. .. ... . ., ..· . .· . .· . .· .· .
St 80ress 70,
ks 60•,
Fig. 3.42 Effect of Strain Rate on the Yield and Illtimate Strpngthsof SOXf-(~' Sleel. (2~ Cold-Stretched, Aged Heterle})
t-oN00
1010.001 0.01 0.1
Strain Rate, in./in./sec.0.0001
50-1 I Iii I Iii I Iii I Iii I Iii I lit
0.00001 .

90 i • • i
.....N\0
"* Yield Strengthe- Ultimate Strength
1010.001 0.01 0.1
Strain Rate, in./in./sec.0.0001
Fig. 3.43 Effect of Strain Rate on the Yield and Ultimate Strengthsof 50XF-LT Steel. (81 Cold-Stretched, Aged Material)
···
·· .. .. . .·· .
·· .· .· .··.. . . .
···· .... ,·········i················!················i·· .. ,··· .. ······· .. i,···············i.·· .. ············
.. . . .................. ! , : ~ ! ~ .
.. .. .. .. .· .. . , ..· .. . .. .... .. .. .. .... .. . . .t .. • • •
.. . .. . .... . .. . ..· .. .. . ... .. . .... . .. ... . .. ... .. . ..· . . ... . . ... .. . .... . .. ... .. . .· . . .· .. .. .... . .. .· . . .
60., I "~ I II~ , III I II~ , II) I III
0.00001
Stre 80
ss,
k 70
s•I

'* Yield Strength-e Ultimate Strength
.
.
····
.. ................................................................................................................. " .... . . . .· . . ..· . . .· . .. ... .: . : *. .· * -:-~ :~ : :'.. .. . ..· . . .• .. .. • • • .. • .. • • .. • .. .. .. , t '; , .
·.. .. . . .................. , , ••••••••••••••••••••••••••••••••• t. •••••••••••• " ••• , ••••••••••••••••
II •• ..· . . .. ... . . . .... . . .. ... . . .. .· .. . . .... .. . .. ... .. .. .. .. . .. .
.
90 I : : : . : I· . .. . .... . .· .. . . .· . . . .· . . " .~ . . .· . . . .· . ... . .. ...................................................................... ,~..........•..... " .
. . . . . ... . . . .· . .. . .· . .· . .· . ., .· .
ks 50•l
St 80
res 70
st 60
Fig. 3.44 Effect of Strain Rate on the Yield and Ultimate Strengthsof 50XF-TT Steel, (Virgin Material)
....wo
1010.001 0.01 0.1
Strain Rate, in./in./sec.0.0001
40 -I I I I j I I I i I I I i I I Ii-II I I I I I I
0.00001

90 I I
....w....
'* Yield Strengthe- Ultimate Strength
101
.. II , •••• II .
···•
0.001 0.01 0.1
Strain Rate, in./in./sec.
.
.
0.0001
Fig. 3.45 Effect of Strain Rate on the Yield and Ultimate Strengthsof 50XF-rr Steel. (21 Cold-Stretcbed.Non-Aaed Haterial)
... .. . .· . . .. .···········,····!················!········· "·····I .. ·· ! ! ... .. .. ... .· . . ... . . ..· . .. .• • flo •· .· .· .· .· .· .
· .· . .................. II flo '" ••••••••••••••• II •••••••••••••••••. . .. . .· .
.. . . ........ , .. ' , , .· . .· . .· . .· . .· . .· . .· . .· . .· . .· . .· . .· . .· . .· . .· . .· . .50-1 I Iii I Iii I Iii I Iii I Iii I III
0.00001
St 80ress 70,
k 60s•I

. I,•90 1 ; :
Fig. 3.46 Effect of Strain Rate on the Yield and Ultimate Strengthsof 50Xf-rr Steel, (8X Cold-Stretched,Non-Ased Material)
....WN
'* Yield strength-e Ultimate Strength
101
... I i ..· .· .· .··
···
·······
0.001 0.01 0.1
Strain Rate, in./in.1sec.0.000\
·· . .···.···,········1 .. ···············1···············4, .· . .· .· .· .· .· ~··
··•·. ... .. . .. .........................................................................................., ... .. .. .. .... .. .. .. ... .. . , ..... .. .. .. ...... .... 't ..• to .. .. .... . .. .. .... .. .. .. .... .. .. .. ... .. .. .. .... .. .. .. ... " .. ... .. .. .... .. . .... .. . .... .. . ... .. .. ...... .. . .. . .. . .
60 -\ : : : : : II I II I I II I III I ill i I II I I I
0.00001
k 70
s•,
,
Stre 80
ss

"* Yield Strengthe- Ultimate Strength
··
·
·····
.
.
·······
·····
·····•
··
·.. .. .. ..••• •••••••••••• iiiiJIIIIiiiI , ••••••••••••••••
··.. .................. ··1···· .~., !, _ !- ! , -f- .... .. .. .. .... .. .. .. ... " .. .. ..· .. .. .. .... .. .. .. ..· .. .. . .... .. . . ..· . .· . .· . .· . ...
.• • " "' It " ..· . .· .· .· .· .
I90I· ~
A
•··St 80ress 70,
ks 60•I
Fig. 3.41 Effect of Strain Rate on the Yield and Ultimate Strengthsof 50XF-1T Steel, (2~ Cold-Stretched, Aled Haterial)
...UJUJ
1010.001 0.01 0.1
Strain Rate, in./in./sec.O.ooOt
50, , "I I 'i Ii' 'I iii I , "I Iii I
0.00001

*" Yield Strengthe- Ultimate Strength
;.................... , I" ..
··••·
···.
•·· . . .····,,··· .. ·······I················I··· .. ···.. ·····.,·i··· , ..· . ... ... ... ... ... ... .··
90 ~ ! I I·····
Stre 80
ss•k 70
s•,
Fig. 3.48 Effect of Strain Rate on the Yield and Ultimate Strengthsof 50Xf-Tr Steel, (81 Cold-Stretched, Aged Haterial)
0.0001 0.001 0.01 0.1
Strain Rate, in./in./sec.1 10
....w~

60i·· I
~
V)
VI
"* Yield Strength-e Ultimate strength
101
·- f ..
·
··
..
.
·
··
.
.
. .. .. ........ , , ,................•................
0.0001
.
.
······
0.001 0.01 0.1
Strain Rate. in./in./sec.Fig. 3.49 Effect of Strain Rate on the Yield and Ultimate Strengths
of 35XF-LT Steel. (Virgin Material)
.. .. .. .... .. .. ............................................ tit OlIo I> .... .. .. ..· .· . .· . .· . .· .· .
30' 1 i I Iii iii 'i iii t. iii iii i-l
0.00001
•
k 40
s•l
Str 50ess

"* Yield S~ength
-e Ultimate Strength
····
·····
········ . . .
'-lL~.•• ' • ••••• t·· ...•....•.•••. ~ .••........•.... ~ ! ..............•.· .. .. .· . .. ... .. . .· . .. ..· . . ... . .. .. . .. . .· .· .··
•··•·
·•···········
k 40
s•,
60
,
Stre 50
ss
Fig. 3.50 Effect of Strain R~t~ on the Yi~ld ftnd Ultimate Strengthsof 35Xf-I.T Steel. (2~ Cold-Stretched,Non-Aaed "aterial)
.....W0\
1010.001 0.01 0.1
Strain Rate, in./in./sec.0.0001
30;-- I " i , I I i I I I ii, I i I I I i I I I I
0.00001

60
Fig.3.S1 Effect of ;ll.lolill Nill., on the Yiplrl And Ultimate StrenRthRof 35XF-I.T Slee I (8X Cold-Stretc.bed.Non-Aged Haterta!)
....IN
"
'* Yield Strength-e Ultimate Strength
101
·-*·
·····
··· ·· ·· ···· ······ ·· ··· ·· ··· ··
·· .1l······,···~········· .. ··I·················
···
.
.
·..·
····..
0.001 0.01 0.1Strain Rate, in./in./sec.
0.0001
··········
····
.. . .. .. ........................................ " , , ... .. . . .... .. .. . ..· . . .. .· . .. .. .... . .. .. ..• • .. It .... .. .. ... . .... . .·····•
'tn-l ~ . I Iii I Iii I iii I III\IU I iii i Iii
0.00001
t
k40
s•,
Stre 50
ss

··.
* Yield Strengthe Ultimate Strength
··
.
.
······· - ..~
. :· . .....•.. ·t·· .. · ; ... .. II .... .. .. .... . .. ..· .. .. ..· . .· . .· . .· . .· .· .· .· .· .
.
.: ~:_--.-,~~
.........' ~ ; ! : : ... .. .. .... . .. .· . .· . .· . .· . .· . .· . .· .· .· .· .·
k 40
s•I
t
Stre 50
ss
Fia, 3,S2 Effect of Strain Rate on the Yield and Ultiaate Strenathsof 3SXF-I.T Steel. (2\ Cold-Stret.ched. Aled Katerial)
-~OD
1010.001 0.01 0.1
Strain Rate. in. lin. / sec.0.0001
30-\ 1111 I Iii I Iii I Iii I Iii I III
0.0000\

"* Yield Strengthe- Ultimate Strength
····
··· .t •••••••• , ~ ••••••••••••••••
·· ·· ···· ··· ·· ···
· .· .· .· .· .· .· .· .· .. . ... .. .. ..· .. .. .. .... .. .. .. .· .. .. .. .... .. .. .... ... .. .. .... .. .. .... .. .. .. ..· .· ... .. .. .. .... .. .. .. .... .. .. .. .... .. .. .. .. .. .. .. .. .. ... .. .. .. .. .. .. .. .. .. .. .. .. .. .. .. ... .. .. .. .. .. .. .. .. .. .. .. .. .. .. .. .. .. ... .. .. .. .. .. .. .. .. .. .. .. .. .. .. , , " .... . .. .. ... .. .. .. .... .. .. .. .... .. .. .. .... .. .. .. .... .. .. ..· .· .·
I..60 I : : 1
· . .· . .· . .· . .· .·····
k 40
s•,
t
Stre 50
ss
Fla. 3,53 Effect of StrAin Rale on thfl Yield and Ultt.ate Strengthsof 35XF-IX Steel. (81 Cold-Stretched. Aaed "atertal)
....W\D
1010.001 0.01 0.1Strain Rate, in./in./sec.
0.0001
11\, I iii iii iii , i • i. i • iiiJU i. • I
0.00001

....~o
*' Yield Strengthe- Ultimate Strength
10
·····
········
·······
,,,·
· ..' .· . . .· . . .· . . .· .'· .····
0.001 0.01 0.1 1
Strain Rate, in./in./sec.Effect of Strain Rate on the Yield and Ultiaate Strenathsof 3SXF-TT Steel, (Virain "aterial)
····
·······
0.0001
Fia. 3.54
·· .· .· . .· .· . .· . .· . .· . .· . ................. ~ ~ , : .· . .· . .· . .···
···· . .· . .· .· ... .· .................. . , , "· .··· ····
30; , "I , 'ii , 'ii , 'ii I Iii, "I
0.0000\
k 40
s•,
60
•
Stre 50
ss

* Yield Strengthe- Ultimate strength
···
···· . ...11 .• · ....•.. ·, ....•........... 1••••.••••••••••• , .· . .· . .· . .· . .· . .· . .: : ,;•···
·····
.. .. . .· , .• • It. •II • • •· . .· ... .· . .· .· -· .· -· .· .
······
·····
········
..
····
···
····
········. •• . . . .. . . . . . . . t· .··
····.•.•.. , .•••••... I· .•. II II II ••
···
· I.60 -, i i ~
..
t
k40
s•,
Str 50ess
Fla- ).~~ Effect of Strain Rate on the Yield and Ulti.ate StrenRthsof J5XF·TT Sleel, (2X Cold-Stretched.Non-A.ed "aterial)
...~...
1010.001 0.01 0.1
Strain Rate, in./in./sec.0.0001
30; I Iii I Iii I Iii I Iii I Iii 11,10.00001

....~N
*" Yield Strengthe- Ultimate Strength
101
~. ..
·····
······
0.001 0.01 0.1
Strain Rate, .in./in./sec.0.000\
····
Fig. 3.56 Effect of Strain Rato on the Yield and Ulti.ate Strengthsof 3SXF-TT Steel (8\ Cold-Sttetched.Non-A.ed "aterial)
.. .. .. .. ..••••••••••• •••• • •• • •••• • •••••••••••••••••••••••••• 1 ... .. .. .. ...... ...... .. .. .. .... .. .. .. .... .. .. .. ..... ..... .. .. .. .... .. .. .. .... ........ .. .. .. ..· . ...· .· .· .· .· .· .· .· .· ..
·· .........................~.· .· .· .
300.00001
60 I . : -. : ~ I
· .· .······
·
Stre 50
ss•
k 40
s•,

Fla· 3.57 Effect of Strain Mlttf' nn the Vi .. lrl "oti Ultimllte Stn~oglhs
of J5XF-Tr Sl~"J. (2' Cold-Stretched. AK~d "aterlal)
.....$:'W
'* Yield Strengthe Ultimate strength
10
·····
···
0.001 0.01 0.1 1
Strain Rate, in./in./sec.
·~·i················i·····IIII .... 4·····i············ .. ···i········.· .. ·· ..
0.0001
·····
········
I I • I I'U\ ; I I I I I I I I I I I I • I I •Il1U I II
0.00001
I
'k 40
·s•,
Stre 50
ss

*' Yield Strengthe Ultimate Strength
·······- , ..
··············
·······
······
····.f
····
···f··
..•............. i ...~.........•....· .· .· ..L :
· ,. .· . .60 ....1 . . . . .· . . . .· . . . .· . . .· . .· .·•·········
•
Str
50ess
Fig. 3.58 Effect of Strain Rate on the Yield and Ultimate Strengthsof 35XF-TT Steel. (8\ Cold-Stretched, Aged Haterial)
....l:l:-
101
.
.
0.001 0.01 0.1
Strain Rate, in./in./sec.0.0001
·. . ... .. .. .. .. .. .. .. .. .. .. .. .. .. .. .. ... .. .. .. .. .. .. .. .. .. '" .... .. .. .. .... .. .. .. .... .. .. .. .... .. .. .. .... .. . .. .... .. .. .. ..· . .· . .· . .· . . ·
····4 .. .
30 i I I ~ iiiIii iii iii I Iii I I I 1
0.00001
k 40
s•\

.... 50XFLT-1, VIrgin- 50XFLT-2, 2%,Aged- - 50XflT-1, 8%,Aged
·················....······.
......········
•••• :-::-:I"'t ..~ ••••••••••••••• i'.... , , ,,\\\IIIIIII,I,,,,,,,,,,
....'.......'..
•....,
I100 ~
90
S 80
t 70re 60
s 50s
40
K 30S
,,20 111
1
1'1'..1
' I , I I I\1) I I I I I I I
I I I I II , I , II I I0,.,."o 1 4 6 8 10 12 14 16 18 20 22 24 26 28 30 32 34 36 38 40
Strain t Percent'ta· 3.59 Stress-Strain Curve. for SOXELT Ste.l at Strain Rate of
0.0001 in.fin./sec. ~
~Vt

,... 50XflT-4, ~r9in
- 50XFLT-3, 2%, Aged-- 50XflT-3, 8%, Aged
,,,,,,·,··,,,.,,.
•,
,,
···.
---:::::::-:""'~:"'::-': .. """........ ....".' ".' " ,
" ,.' \
" \: \
: I' , ,,' ,,,,I,,,,,,,,,,
\\•
100 J I
70
60
50
40
K 30
S 20
, Ii II IIiiI i I
\0 I I I I I I I I I I I I ,I 1 I I I1 tit,0;-111111
90
5 80tress
o 2. 4 6 8 \0 \2 \4 16 18 20 22 24 26 28 30 32 34 36 38 40Strain t Percent
ria· 3.60 Str•••-Strain Curv•• fol' SOULT Ste.l at Strain Rate of0.01 in./in./.ec. ....
~0\

..... SOXflT-9. Virgin
- SOXflT-5. 2%, Aged
-- 50XAJ-6. 8%. Aged
-"'-""¥"'V_ .........•......•.........................• t-...'...',t."...••.
"•"-.......
1:r'----------I
80
10
60
50
40
30
, 20
\0
o I Ii ••• • • I I i I • lilill • iii• Iii Iii i I iii .ill,1
o 2. 4 6 8 \0 \2 \~ 16 18 20 22 14 26 28 30 32 34 36 J8 40Strain I Percent
Fla. 3.61 Str•••·S~t.ln Curvaa for SOXiLT St••l .t Strain Rate of1.0 tn./tn./••e. ,...
~......,