Design of an Interface for Interactive Topic Detection and Tracking
12
T. Andreasen et al. (Eds.): FQAS 2009, LNAI 5822, pp. 227–238, 2009. © Springer-Verlag Berlin Heidelberg 2009 Design of an Interface for Interactive Topic Detection and Tracking Masnizah Mohd 1 , Fabio Crestani 2 , and Ian Ruthven 1 1 University of Strathclyde, Glasgow, UK {Masnizah.Mohd,Ian.Ruthven}@cis.strath.ac.uk 2 University of Lugano, Lugano, Switzerland [email protected] Abstract. This paper presents the design of a new interface for interactive Topic Detection and Tracking (TDT) called Ievent. It is composed of 3 main views; a Cluster View, a Document View, and a Named Entity View, support- ing the user in identifying new events and tracking them in a news stream. The interface has also been designed to test the usefulness in interactive TDT of named entity recognition. We report some initial findings from a user study on the effectiveness of our novel interface. Keywords: TDT, named entity recognition, interface. 1 Introduction Topic Detection and Tracking (TDT) is a research program investigating methods for automatically organising news stories by the events that they discuss. TDT includes several evaluation tasks, each of which explores one aspect of the organisation of a continuous stream of news, including: a) splitting the stream into stories that are about a single topic (stream segmentation); b) gathering stories into groups that each discuss a single topic (link detection); c) identifying the onset of a new topic in the news (first story detection), and d) exploiting user feedback to monitor a stream of news for addi- tional stories on a specified topic (story tracking). Most previous research in TDT has concentrated primarily on the design and evaluation of algorithms to carry out the above tasks in a batch way, fully automati- cally and without the need for user interaction. Evaluation, carried out for a number of years in the context of TREC, has been almost exclusively laboratory style, without any user involvement. However we believe that TDT is very much an interactive task, since the combination of subtasks that make up the TDT task are very difficult to study in isolation, given their interdependence. Studying TDT from a user interaction perspective enables to view the TDT task in its entirety. We believe that interfaces play a vital role in interactive TDT and we set out to design a new interface for TDT that is meant to support the user in all the tasks related to TDT. One additional important result of research in TDT is the realisation of the impor- tance of Named Entities (NE) [2]. Since TDT focuses on processing news data, a natural way to organise news article is by the reported event which enquire questions
Transcript of Design of an Interface for Interactive Topic Detection and Tracking

T. Andreasen et al. (Eds.): FQAS 2009, LNAI 5822, pp. 227–238, 2009. © Springer-Verlag Berlin Heidelberg 2009
Design of an Interface for Interactive Topic Detection and Tracking
Masnizah Mohd1, Fabio Crestani2, and Ian Ruthven1
1 University of Strathclyde, Glasgow, UK {Masnizah.Mohd,Ian.Ruthven}@cis.strath.ac.uk
2 University of Lugano, Lugano, Switzerland [email protected]
Abstract. This paper presents the design of a new interface for interactive Topic Detection and Tracking (TDT) called Ievent. It is composed of 3 main views; a Cluster View, a Document View, and a Named Entity View, support-ing the user in identifying new events and tracking them in a news stream. The interface has also been designed to test the usefulness in interactive TDT of named entity recognition. We report some initial findings from a user study on the effectiveness of our novel interface.
Keywords: TDT, named entity recognition, interface.
1 Introduction
Topic Detection and Tracking (TDT) is a research program investigating methods for automatically organising news stories by the events that they discuss. TDT includes several evaluation tasks, each of which explores one aspect of the organisation of a continuous stream of news, including: a) splitting the stream into stories that are about a single topic (stream segmentation); b) gathering stories into groups that each discuss a single topic (link detection); c) identifying the onset of a new topic in the news (first story detection), and d) exploiting user feedback to monitor a stream of news for addi-tional stories on a specified topic (story tracking).
Most previous research in TDT has concentrated primarily on the design and evaluation of algorithms to carry out the above tasks in a batch way, fully automati-cally and without the need for user interaction. Evaluation, carried out for a number of years in the context of TREC, has been almost exclusively laboratory style, without any user involvement. However we believe that TDT is very much an interactive task, since the combination of subtasks that make up the TDT task are very difficult to study in isolation, given their interdependence. Studying TDT from a user interaction perspective enables to view the TDT task in its entirety. We believe that interfaces play a vital role in interactive TDT and we set out to design a new interface for TDT that is meant to support the user in all the tasks related to TDT.
One additional important result of research in TDT is the realisation of the impor-tance of Named Entities (NE) [2]. Since TDT focuses on processing news data, a natural way to organise news article is by the reported event which enquire questions
228 M. Mohd, F. Crestani, and I. Ruthven
on Who, What, Where and When. Thus NE provide important information units such as Person, Location, Organisation and Date dealt in the news. Although proved in TREC experimentation, it is not clear if the use of NE really improves the effective-ness of interactive TDT. We designed out interface to be able to display and use Named Entities in interactive TDT. Our user and task oriented evaluation will then enable not only to test the effectiveness of interactive TDT using standard ‘bag of words’ approaches, but will also enable to compare their effectiveness with ap-proaches based on the use of Named Entities in interactive TDT.
The paper is organised as follows: we start in Section 2 by presenting the related work on interactive TDT. Then, in Section 3 we describe our work on designing the Ievent interfaces. In Section 4 we present the preliminary stages of the evaluation. Finally the conclusions are reported in Section 5.
2 Interactive Topic Detection and Tracking (iTDT)
Topic Detection and Tracking (TDT) began as a technology development and evalua-tion program [2]. TDT evaluation [2] provides a standard set of news documents with a number of topics to be tracked and a list of relevant documents for each topic. Re-searchers in this area claim that technology evaluation is the main focus of TDT and does not investigate user interface issues [1]. In addition, TDT evaluation has been carried out mostly in a laboratory setting, which does not involve real users and real tasks. Thus, researchers in this area have focused on developing techniques and algo-rithm for better TDT performance and the evaluation of these algorithms is the main activity in TREC evaluation. Very few researchers worked on interfaces for TDT. We believe that an interactive TDT system does not only rely on the system performance but also on the user interaction. The importance of user interaction motivates us to design and develop a user interface for interactive TDT system. We present a novel interface design that incorporates some successful features from existing TDT inter-faces. Our interface incorporates some successful features of preview system. In the remainder of this section we describe previous TDT interfaces and motivate our de-sign for Ievent.
Event Organizer [1] is a TDT system that aims to organise a constantly updating stream of news articles by the events that are discussed in the stories. It is not only focused on the cluster detection technology but also on the user interface, employing a document view with the timeline. This is one of the best features in the user inter-face, as it indicated when an event happened. Through the interface, the system allows a user to correct the system’s errors by removing stories from clusters and creating new clusters in their profile as shown in Figure 1.
However, Event Organizer only displays terms instead of NE. We felt that user needs NE to be able to understand news in a meaningful and efficient manner. This motivated us to explore the issue of the use of named entities for interactive TDT and to provide user with a document view and a timeline.
Another related work is the TDTLighthouse system [4] that has been designed for presenting results of a search session to the user as shown in Figure 2. It provides not only a typical ranked list search result, but a visualisation of inter-document similari-ties in 2 or 3 dimensions. The visualisation presents the documents as spheres floating

Design of an Interface for Interactive Topic Detection and Tracking 229
Fig. 1. Event Organizer user interface
Fig. 2. TDTlighthouse user interface
and position them in proportion to their inter document similarity. If two documents are very similar to each other, the corresponding spheres will be closely located and the spheres that are positioned far apart indicate very different page content. Visualis-ing the cluster in sphere form is the strength of this work since this feature helps user to understand news in a relatively fast and efficient manner. User could focus on the

230 M. Mohd, F. Crestani, and I. Ruthven
relevant documents more accurately. This motivated us to visualise the cluster too and to consider also the cluster’s size and density. For example, a cluster with large size and high density indicates high number of documents and the documents are in a short period of time. In TDTLighthouse, users have to judge the relevance of docu-ments to their information needs by looking through the titles of document. We be-lieved it is better to present and label the relevant documents using NE.
The prototype system called TimeMine [5] is a TDT system that aims to detect, rank and group semantic features based on their statistical properties. It automatically generates an interactive timeline displaying the major events and uses it as a browsing interface to a document collection as shown in Figure 3. The clusters are labelled using term that consist of noun phrase or NE. The timelines are the best features in this work since they provide an effective form of presentation and a very fast graphi-cal overview of the information a corpus contains. We believed timelines are useful and have been motivated to provide this features in our interface.
Fig. 3. TimeMine user interface
In [6] an interactive graphical visualisation tool is presented for use in TDT algo-rithm development. The system uses colours to show the results of the TDT system in relation to some “ground truth”. For example, on topic stories are shown in green, misses are shown in red, and false alarms are shown in blue, as shown in Figure 4. Thus, this work is clearly directed toward the design of an interface for measuring TDT performance through the use of visualisation. In fact, this interface allows the user, for example, to easily identify the changes in the false alarm rate if the threshold changes. The system enables easy selection of system parameters settings with inter-active graphical display of the results (which can be pre-computed), as well as the standard tracking measures mentioned. For example user could change the setting of the threshold, the amount of training stories known, view the topic, the words and the statistic. The interface does not support the displaying of NE.

Design of an Interface for Interactive Topic Detection and Tracking 231
Fig. 4. Topic Tracking Visualisation tool
It was obvious that none of these related works have used a NE approach for inter-active TDT. Visualisation is a very powerful way of representing large amounts of information for rapid interpretation [3]. Timelines are a well known interface, simple and intuitive for most people to use. NE and terms produce interesting information; NE are of higher quality, but terms were more descriptive. We believe both should be used. There has been no exploration of how NE, cluster visualisation and the timeline could be effectively used together. None of the works indicated above evaluated the usability of the features introduced in the interfaces and almost none of them evalu-ated the effect of the interface on the effectiveness of the system performance.
In recent years, several efforts have been made on exploiting NE for document rep-resentation to improve TDT systems. However, our review of the state of the art of interactive TDT shows that named entities recognition has been used in document representation but few have applied it in user interface for TDT tasks. We set up to accomplish this task in our interface design.
3 Interface Design for Interactive TDT
Ievent stands for Interactive Event Tracking system. In this section we describe the design of Ievent and of the two system we used in our evaluation: Setup 1, that uses ‘bag of words’ and Setup 2 that uses NE. This section only presents graphically the interface that uses NE.
In order to carry out NE recognition we use ANNIE, an information extraction component of GATE (General Architecture for Text Engineering) which we used for its accurate entity, pronoun and nominal co-references extraction [7]. ANNIE was also chosen as an example of typical NE recognition system because it is freely avail-able to the research community and the NE types are a subset of the Message Under-standing Conferences (MUC) types [7]. ANNIE recognises the standard MUC entity

232 M. Mohd, F. Crestani, and I. Ruthven
types of Person, Location, Organisation, Date, Time, Money and Percent, plus the additional entity types Address and Identifier. ANNIE is able to recognise proper nouns, person, organisations, dates and locations improving the quality of NE recog-nition. NER in ANNIE is based on gazetteer lists and JAPE (Java Annotation Pat-terns Engine) rules.
The user interfaces has the three main views that depicted in Figure 5: a) cluster view; b) document view; and c) NE view. These views will be described in details in the following subsections.
Fig. 5. Ievent interface (Setup 2)
3.1 Cluster View
The Cluster View displays information on the size and the density of a cluster, and the 10 most frequent named entities in a cluster. The documents are clustered using Sin-gle Pass Clustering, a technique that has been proved to be reasonably effective for TDT. We measured the similarity of a document with a cluster using the standard cosine similarity. The clusters are visualised by considering the density and the size of the cluster. These are classified into 3 types of density (high, medium, and low den-sity) and 3 types of size (large, medium and small size). Cluster with large size and high density contains lots of documents where the documents appeared in a short period of time, so they are meant to represent very important events. Cluster with small size and low density, on the other hand, contains a small number of documents where the documents appeared over a long period of time, thus presenting recurring relative unimportant events as shown in Figure 6. Cluster visualisation is intended to help the user to make a rapid interpretation of a topic. It should be noticed that given the difficulty in story segmentation, sometimes a cluster with a large size and low density might indicate the presence of more than one topic in the cluster.
Cluster View
Document View
Named Entity View

Design of an Interface for Interactive Topic Detection and Tracking 233
Fig. 6. Cluster visualisation
Clusters are labelled using the 3 most frequent named entities. When user clicks on the cluster additional information on the 10 most frequent named entities in that clus-ter is presented, as shown in Figure 7. Both these features are useful in the topic track-ing and detection tasks since it gives information on the most frequent NE that occurs in the cluster.
Fig. 7. Top Named Entity in Cluster View
3.2 Document View
The Document View displays information on the document timeline, list of docu-ments and the documents contained in a cluster. The document timeline is displayed in a histogram form to show the occurrence and the document frequency for a specific date. The height of histogram indicates the number of documents that occurred on that specific date in a cluster. This feature is an attempt to support user in analysing the discourse or the information flow in a press article. Discourse analysis is a general term that includes many approaches to analyse the use of languages, and one impor-tant application of it is on news [8]. Figure 8 is an example of a timeline.
Fig. 8. Document histogram for Topic Cable Car Crash (Topic 20019). This topic has a low density of documents indicating that the documents appear over a long period of time. The documents occurred in February report on the crash itself and it took a month for the results of the investigation. The document in March refers to the investigation of the crash including the legal proceedings. Finally documents in April and May contain the hearing case in the court and the outcome from the crash.
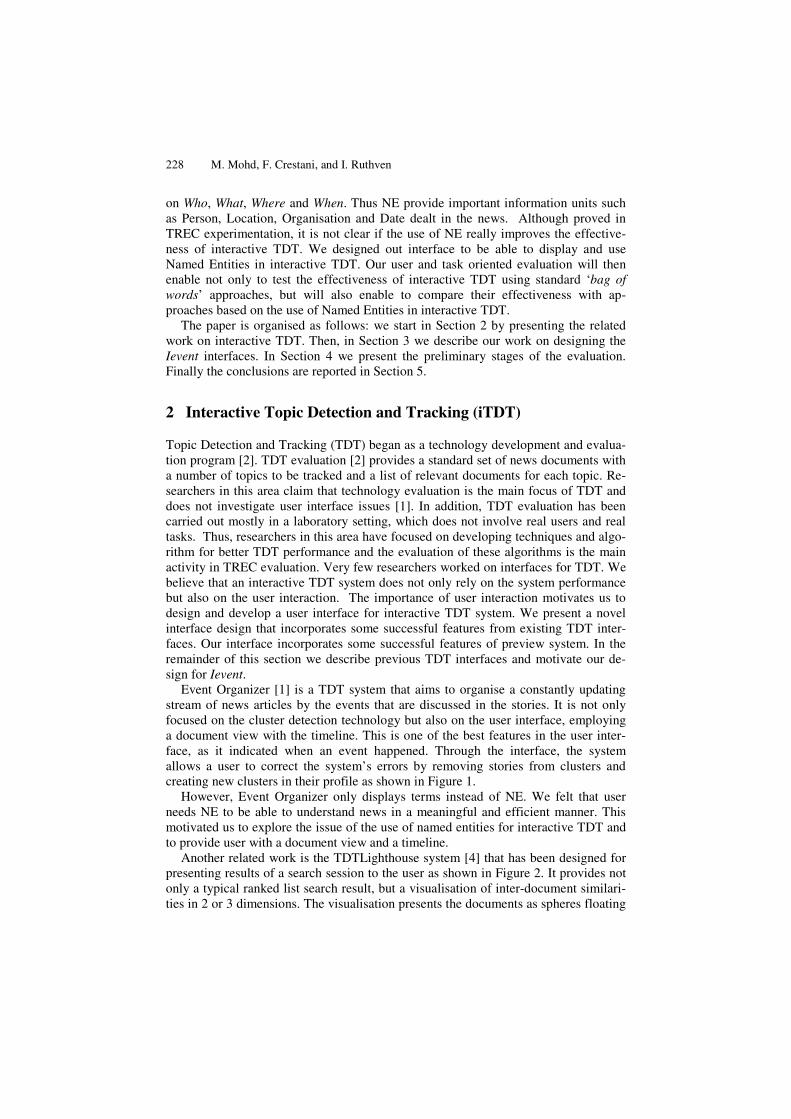
Users will also be able to see the document content and a list of documents sorted by date when they click on the document id. Figure 9 shows that NE in the document content are highlighted and when users click on one of them, other clusters that con-tain it will be highlighted too.
234 M. Mohd, F. Crestani, and I. Ruthven
Fig. 9. Document content used in Document View
Timelines are a useful way to present information that has a temporal dimension. Journalists often generate timelines to describe the course of events. We believe that automatically generated timelines could prove invaluable for navigating the results of a TDT system and for interactive topic detection. The timeline feature is offered both in the Document View and in the NE View. Users could see the occurrence of the document and named entities within the timeline in a histogram form for each cluster.
3.3 Named Entity View
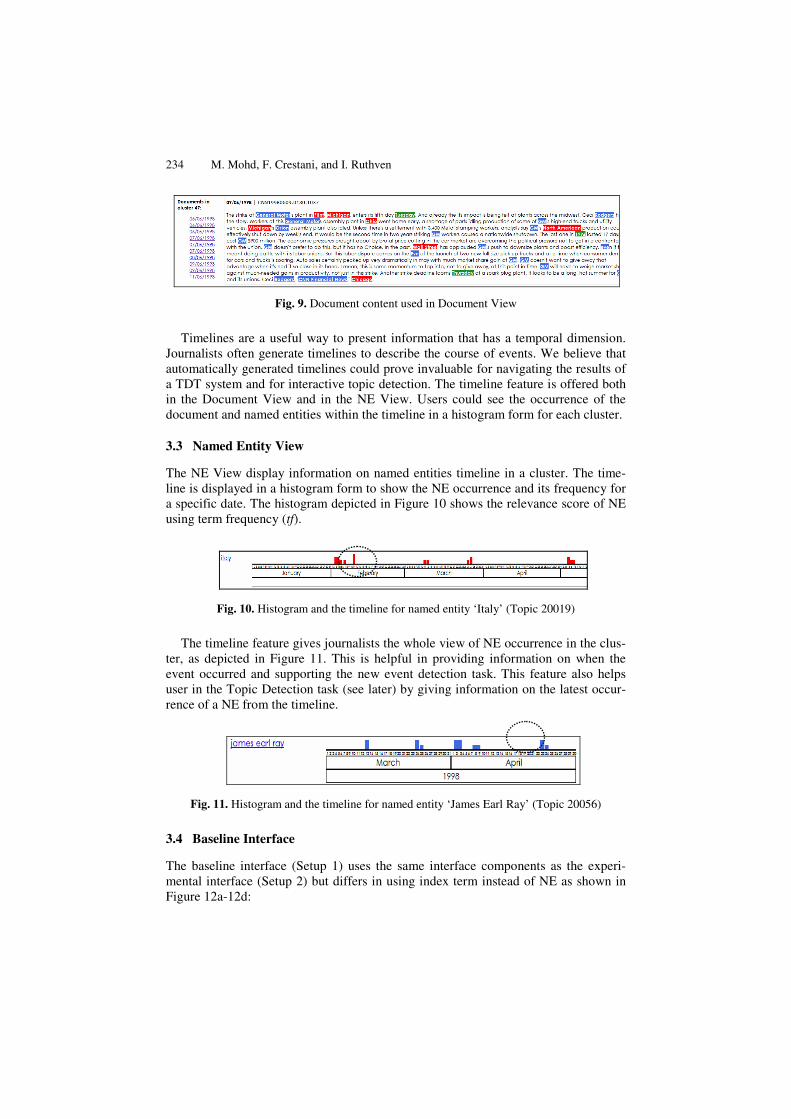
The NE View display information on named entities timeline in a cluster. The time-line is displayed in a histogram form to show the NE occurrence and its frequency for a specific date. The histogram depicted in Figure 10 shows the relevance score of NE using term frequency (tf).
Fig. 10. Histogram and the timeline for named entity ‘Italy’ (Topic 20019)
The timeline feature gives journalists the whole view of NE occurrence in the clus-ter, as depicted in Figure 11. This is helpful in providing information on when the event occurred and supporting the new event detection task. This feature also helps user in the Topic Detection task (see later) by giving information on the latest occur-rence of a NE from the timeline.
Fig. 11. Histogram and the timeline for named entity ‘James Earl Ray’ (Topic 20056)
3.4 Baseline Interface
The baseline interface (Setup 1) uses the same interface components as the experi-mental interface (Setup 2) but differs in using index term instead of NE as shown in Figure 12a-12d:

Design of an Interface for Interactive Topic Detection and Tracking 235
Fig. 12a. The keyword approach used as cluster label (Cluster View)
Fig. 12b. The keyword approach used in Top Term (Cluster View)
Fig. 12c. The document content (Document View)
Fig. 12d. The keyword approach (Term View)
Fig. 12. Features of the baseline interface The purpose of this baseline is to enable us to evaluate how well the NE approach
compares with the standard ‘bag of words’ approach in effectively helping the user to perform various TDT subtasks.
3.5 Summary
Table 1 summarises the features in Ievent in comparison with those of other systems reviewed in Section2. We want to investigate if the NE approach, cluster visualisa-tion and timeline could be effectively used together to perform the TDT tasks.
Table 1. Features comparison
Document timeline
Cluster labelling
Document visualisation
Term NE Event Organizer √ √ TDTLighthouse √ TimeMine √ √ √ Topic Tracking Visualisation √ IEvent √ √ √ √
236 M. Mohd, F. Crestani, and I. Ruthven
4 Evaluation
We are currently conducting a user and task-oriented evaluation involving the journal-ists and postgraduate students of the school of journalism As the evaluation is still being carried out, we will present here only some preliminary results.
Users were asked to perform a number of TDT subtasks, namely the topic detec-tion and the tracking tasks with the aid of the interface. We are evaluating the usabil-ity of the interface and effectiveness of the interface in the two setting indicated above (baseline and NE approach).
4.1 The Experimental Tasks
We used simulated work tasks for the evaluation of the usability and of the effective-ness of the interface. Each subject was asked to complete a number of tasks of 2 different types:
a. In the Topic Detection task, a user has to identify the topic dealt by a specific cluster. This is in line with the journalist’s task of identifying some important event that happened on a specific day.
b. In the Topic Tracking task, a user has to track the cluster that contains the identified topic and show that the system provides a sufficient amount on in-formation on the event by writing an article about a topic. This is in line with the journalist’s task of reporting news.
We evaluated the correctness of the cluster tracked in Topic Tracking task and the correctness of the topic detected in Topic Detection task by comparing the user’s response with TREC ground truth.
We evaluated user opinion on usability the features of the interfaces using a set of five semantic differentials to elicit user opinion about the different features: difficult/easy, stressful/helpful, complex/simple, frustrating/satisfying and boring/ interesting.
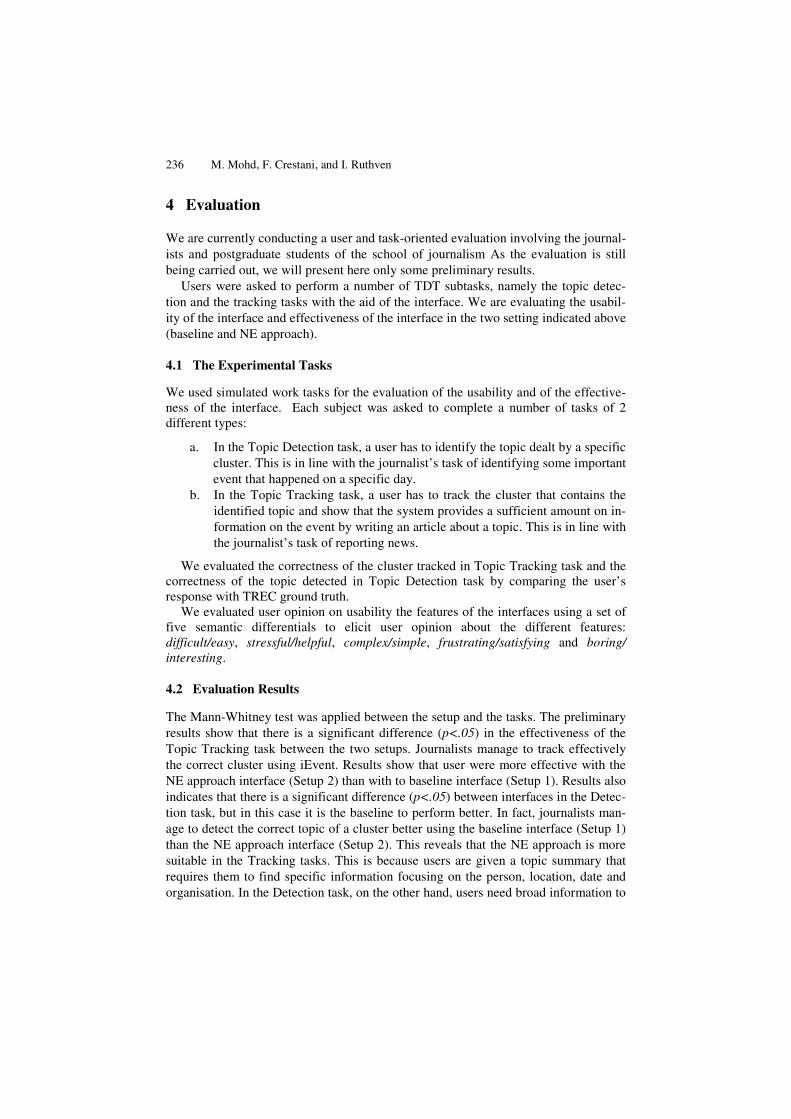
4.2 Evaluation Results
The Mann-Whitney test was applied between the setup and the tasks. The preliminary results show that there is a significant difference (p<.05) in the effectiveness of the Topic Tracking task between the two setups. Journalists manage to track effectively the correct cluster using iEvent. Results show that user were more effective with the NE approach interface (Setup 2) than with to baseline interface (Setup 1). Results also indicates that there is a significant difference (p<.05) between interfaces in the Detec-tion task, but in this case it is the baseline to perform better. In fact, journalists man-age to detect the correct topic of a cluster better using the baseline interface (Setup 1) than the NE approach interface (Setup 2). This reveals that the NE approach is more suitable in the Tracking tasks. This is because users are given a topic summary that requires them to find specific information focusing on the person, location, date and organisation. In the Detection task, on the other hand, users need broad information to

Design of an Interface for Interactive Topic Detection and Tracking 237
detect the topic, thus using the ‘bag of words’ approach (Setup 1) seems to provide an advantage.
The Man-Whitney test applied to the usability results shows that there was a sig-nificant positive difference (p<.05) between interfaces and user opinion on diffi-cult/easy, stressful/helpful and boring/interesting for the Tracking task. The NE ap-proach interface (Setup 2) shows a higher level of use and appreciation compared to the baseline interface (Setup 1). For the Detection task, on the other hand, the analysis revealed that the number of features used and their appreciation in the NE approach interface (Setup 2) is not significantly different (p>.05) to the baseline interface (Setup 1). This suggests that user treated the features in the interfaces equally when performing the Detection task. There is also no significant correlation between the easiness in detecting a topic with the features used on the interfaces (Chi-Square test, p>.05).
5 Conclusions
This paper presented a prototype interactive TDT with many novel features compared to other state of the art systems. We believed the combination of the novel features we introduced will prove to be effective and will shed some light on how professionals carry out TDT tasks.
The preliminary results of our evaluation indicate that the NE approach enhances the user interaction and enables a more effective Topic Tracking compared to a base-line system that has the same modality of interaction but does not use NE. For the Detection task the ‘jury is still out’ and the preliminary results do not allow us to say if the use of NE improves or not user’s effectiveness.
References
1. Allan, J., Harding, S., Fisher, D., Bolivar, A., Guzman-Lara, S., Amstutz, P.: Taking Topic Detection From Evaluation to Practice. In: Proceedings of the 38th Annual Hawaii interna-tional Conference on System Sciences (Hicss 2005) - Track 4, January 3-6. HICSS, vol. 4 (2005)
2. Allan, J.: Introduction to topic detection and tracking. In: Allan, J. (ed.) Topic Detection and Tracking: Event-Based information Organization. The Kluwer International Series on Information Retrieval, pp. 1–16. Kluwer Academic Publishers, Norwell (2002)
3. Leuski, A., Allan, J.: Interactive cluster visualization for information retrieval. In: Proceed-ings of ECDL 1998, pp. 535–554 (1998)
4. Leuski, A., Allan, J.: Lighthouse: Showing the Way to Relevant Information. In: Proceed-ings of the IEEE Symposium on information Visualization 2000. INFOVIS, pp. 125–129. IEEE Computer Society, Washington (2000)
5. Swan, R., Allan, J.: Automatic generation of overview timelines. In: Proceedings of the 23rd Annual international ACM SIGIR Conference on Research and Development in in-formation Retrieval, SIGIR 2000, Athens, Greece, July 24 - 28, pp. 49–56. ACM, New York (2000)

238 M. Mohd, F. Crestani, and I. Ruthven
6. Jones, G.J., Gabb, S.M.: A visualisation tool for topic tracking analysis and development. In: Proceedings of the 25th Annual international ACM SIGIR Conference on Research and Development in information Retrieval, SIGIR 2002, Tampere, Finland, August 11-15, pp. 389–390. ACM, New York (2002)
7. Cunningham, H., Maynard, D., Bontcheva, K., Tablan, V.: GATE: A Framework and Graphical Development Environment for Robust NLP Tools and Applications. In: Pro-ceedings of the 40th Anniversary Meeting of the Association for Computational Linguis-tics (ACL 2002), Philadelphia (2002)
8. Van Dijk: Discourse Analysis: Its Development and Application to the Structure of News. The Journal of Communication 33(2), 20–43 (1983)