Design of an Airborne Three-Dimensional Separation Assistance Display
14
1 Design of an Airborne Three-Dimensional Separation Assistance Display Joost Ellerbroek, Mark Visser, Stijn B. J. van Dam, Max Mulder, M. M. (Ren´ e) van Paassen, Member, IEEE Abstract—In the context of the NextGen and SESAR future airspace programmes, this paper describes a concept for an Airborne Separation Assurance (ASAS) display, that is designed to aid pilots in their task of self-separation, by visualizing the possibilities for conflict resolution that the airspace provides. This work is part of an ongoing research towards an ecological design of a separation assistance interface that can present all the relevant properties of the spatio-temporal separation problem. A work-domain analysis is described from which several perspective projections of traffic properties and travel constraints are derived. A display concept is proposed that presents heading and altitude action possibilities in a flight-path angle - track angle action space. Key issues in the current design are discussed, with recommendations for future work. Index Terms—Ecological Interface Design (EID), Airborne Separation Assurance System (ASAS), self-separation, situation awareness I. I NTRODUCTION I N today’s airspace, increasing amounts of traffic are push- ing the limits of capacity and safety. To facilitate contin- uing growth, new air-traffic management concepts are under development, which allow a more flexible use of airspace [1], [2]. These new concepts promote a shift towards airborne determination of user-preferred trajectories, where airspace capacity is expected to increase, while controller workload decreases. However, because the task of separation is shifted from the air traffic controller to the flight deck, it is expected that the pilot will need assistance to perform this task safely and efficiently. The development of a support system requires a thorough analysis of what level of automation is required to meet with the overall system demands of safety, capacity and efficiency of flight. Crucial in this analysis will be the question of how these tasks should be allocated between humans and automation, and how the human actors can interact, and share their decision-making with the automation [3]–[5]. The interaction between automation and the human actor also requires transparent functioning of the automated system. The interface should provide operators with information regarding their own performance, as well as that of the automation, so that operators’ self-confidence and trust correspond with This work has been co-financed by the European Organisation for the Safety or Air Navigation (EUROCONTROL), under its Research Grant Scheme launched in 2008, and by the Nationaal Lucht- en Ruimtevaartlaboratorium (NLR). The content of the work does not necessarily reflect the official position of EUROCONTROL or the NLR on the matter. The authors are with the Control and Simulation division of the Faculty of Aerospace Engineering, Delft University of Technology, 2629 HS Delft, The Netherlands. email: [email protected] the capabilities of the system, and promote appropriate use of automation [6]–[8]. Although several display concepts have been developed as aids in the task of self-separation [9]–[13], most current research on Airborne Separation Assurance Systems (ASAS) focuses on the development of automated systems that assist pilots with the separation task [11], [14]–[17]. Generally, these systems provide the pilot with explicit, ‘ready-to-use’ resolutions to a separation conflict. Although they lead to lower pilot workload [18], these systems also hide the cog- nition behind the resolution advisory [19]. Without additional information, such systems may lead to low situation awareness (SA): the pilot is not fully aware anymore of exactly what is going on, and is unable to reason about the functioning of the automation, and other constraints and relationships within the environment under control [20]–[22]. This may lead to inappropriate reliance on the automation, which can have a significant impact on the overall levels of safety and efficiency. Under-reliance may lead to situations where the pilot prefers manual control over an automated (valid) resolution, leading to higher operator workload, and a possible reduction in performance and safety. On the other hand, over-reliance may cause pilots to use the automation in ways for which it was not designed, or to accept resolutions even when the automation is in error [6], [23]. In the air transport domain, lack of situation awareness is currently considered to be one of the the main causes for human error, responsible for at least seventy percent of the incidents and accidents that occur [24]. As airborne separa- tion systems move towards more automation, it will become more important than ever that automation and instrumentation promote a high level of situation awareness. This leads to the fundamental question of ‘what’ needs to be presented to optimize human performance from the perspective of situation awareness [25]. In other words, how does one design for situation awareness? The work presented in this paper will employ a constraint-based approach, inspired by Ecological Interface Design (EID), a proven design paradigm from the domain of process control [26], [27], to design for SA [28], [29]. EID is a method that addresses the cognitive interaction between humans and complex socio-technical systems. Its approach to interface design gives priority to the workers environment, or ‘ecology’, focusing on how the environment poses constraints on the worker [28], [29]. Ecological displays are designed to allow for direct perception of the possibilities and constraints afforded by the work domain [30], [31]. This way, EID aims to support each level of cognitive control [32],
Transcript of Design of an Airborne Three-Dimensional Separation Assistance Display
1
Design of an Airborne Three-Dimensional
Separation Assistance DisplayJoost Ellerbroek, Mark Visser, Stijn B. J. van Dam, Max Mulder, M. M. (Rene) van Paassen, Member, IEEE
Abstract—In the context of the NextGen and SESAR futureairspace programmes, this paper describes a concept for anAirborne Separation Assurance (ASAS) display, that is designedto aid pilots in their task of self-separation, by visualizing thepossibilities for conflict resolution that the airspace provides.This work is part of an ongoing research towards an ecologicaldesign of a separation assistance interface that can presentall the relevant properties of the spatio-temporal separationproblem. A work-domain analysis is described from which severalperspective projections of traffic properties and travel constraintsare derived. A display concept is proposed that presents headingand altitude action possibilities in a flight-path angle - track angleaction space. Key issues in the current design are discussed, withrecommendations for future work.
Index Terms—Ecological Interface Design (EID), AirborneSeparation Assurance System (ASAS), self-separation, situationawareness
I. INTRODUCTION
IN today’s airspace, increasing amounts of traffic are push-
ing the limits of capacity and safety. To facilitate contin-
uing growth, new air-traffic management concepts are under
development, which allow a more flexible use of airspace [1],
[2]. These new concepts promote a shift towards airborne
determination of user-preferred trajectories, where airspace
capacity is expected to increase, while controller workload
decreases. However, because the task of separation is shifted
from the air traffic controller to the flight deck, it is expected
that the pilot will need assistance to perform this task safely
and efficiently.
The development of a support system requires a thorough
analysis of what level of automation is required to meet with
the overall system demands of safety, capacity and efficiency
of flight. Crucial in this analysis will be the question of
how these tasks should be allocated between humans and
automation, and how the human actors can interact, and
share their decision-making with the automation [3]–[5]. The
interaction between automation and the human actor also
requires transparent functioning of the automated system. The
interface should provide operators with information regarding
their own performance, as well as that of the automation,
so that operators’ self-confidence and trust correspond with
This work has been co-financed by the European Organisation for the Safetyor Air Navigation (EUROCONTROL), under its Research Grant Schemelaunched in 2008, and by the Nationaal Lucht- en Ruimtevaartlaboratorium(NLR). The content of the work does not necessarily reflect the officialposition of EUROCONTROL or the NLR on the matter.
The authors are with the Control and Simulation division of the Faculty ofAerospace Engineering, Delft University of Technology, 2629 HS Delft, TheNetherlands. email: [email protected]
the capabilities of the system, and promote appropriate use of
automation [6]–[8].
Although several display concepts have been developed
as aids in the task of self-separation [9]–[13], most current
research on Airborne Separation Assurance Systems (ASAS)
focuses on the development of automated systems that assist
pilots with the separation task [11], [14]–[17]. Generally,
these systems provide the pilot with explicit, ‘ready-to-use’
resolutions to a separation conflict. Although they lead to
lower pilot workload [18], these systems also hide the cog-
nition behind the resolution advisory [19]. Without additional
information, such systems may lead to low situation awareness
(SA): the pilot is not fully aware anymore of exactly what is
going on, and is unable to reason about the functioning of
the automation, and other constraints and relationships within
the environment under control [20]–[22]. This may lead to
inappropriate reliance on the automation, which can have a
significant impact on the overall levels of safety and efficiency.
Under-reliance may lead to situations where the pilot prefers
manual control over an automated (valid) resolution, leading
to higher operator workload, and a possible reduction in
performance and safety. On the other hand, over-reliance may
cause pilots to use the automation in ways for which it was not
designed, or to accept resolutions even when the automation
is in error [6], [23].
In the air transport domain, lack of situation awareness is
currently considered to be one of the the main causes for
human error, responsible for at least seventy percent of the
incidents and accidents that occur [24]. As airborne separa-
tion systems move towards more automation, it will become
more important than ever that automation and instrumentation
promote a high level of situation awareness. This leads to
the fundamental question of ‘what’ needs to be presented to
optimize human performance from the perspective of situation
awareness [25]. In other words, how does one design for
situation awareness? The work presented in this paper will
employ a constraint-based approach, inspired by Ecological
Interface Design (EID), a proven design paradigm from the
domain of process control [26], [27], to design for SA [28],
[29].
EID is a method that addresses the cognitive interaction
between humans and complex socio-technical systems. Its
approach to interface design gives priority to the workers
environment, or ‘ecology’, focusing on how the environment
poses constraints on the worker [28], [29]. Ecological displays
are designed to allow for direct perception of the possibilities
and constraints afforded by the work domain [30], [31]. This
way, EID aims to support each level of cognitive control [32],
2
while not forcing the operator to control at a higher level than
necessary. By visualizing hidden constraints and relationships,
ecological interfaces can transform what would otherwise be
a cognitive task, into a perceptual task.
An ecological airborne separation assistance display then,
should support pilot decision making in the task of self-
separation, rather than only providing an automated resolution.
In the domain of process control, EID had the freedom to
define a new interface for the operator. For air travel, however,
pilots already make use of an existing, natural ecology (i.e.,
the ecology of locomotion). The key in designing an airborne
separation support tool will be to not replace, but to enhance
this existing ecology, by visualizing hidden affordances∗, and
exploiting the operator’s natural adaptation to the ecology
[34]–[39].
Preceding the design of an ecological display, a thorough
analysis of the work domain is required, which should identify
functionalities, constraints, and means-end relationships within
that work domain. The main tools for this analysis are the
Abstraction Hierarchy (AH), and the Skills, Rules, Knowledge
taxonomy (SRK), both developed by Rasmussen [32], [40]. To
make the transition from a workspace analysis to an effective
interface design, functional visualizations of the affordances
and constraints in the work domain need to be derived, so
that they can be perceived and fluently transformed into goal-
directed behavior, supporting the natural coupling between
perception and action [41], [42].
This paper presents the results of a work-domain analysis
of a self-separation airspace, and a concept for a separation
assistance display. The analysis employs tools such as the
Abstraction Hierarchy to obtain a clear image of how the
work-domain shapes the affordances for a pilot in his task
of self-separation. The display concept is the third in an on-
going design process towards an integrated, three-dimensional
separation assistance interface, that presents an unambiguous,
complete view of the airspace affordances, in an unmanaged
traffic environment. The two previous concepts, the eXtended
Airborne Trajectory Planning display (X-ATP) [38], and the
Vertical Separation Assistance Display (VSAD) [39], pre-
sented maneuvering affordances in a heading-speed, and a
flight-path angle (FPA) - speed action space, respectively.
In a comparable fashion, the current concept will present
maneuvering affordances in a FPA - track angle action space.
The paper is structured as follows: the following two sec-
tions will, respectively, present the results of a work-domain
analysis, and illustrate the construction of functional visual-
isations of the constraints that followed from this analysis.
The fourth section will introduce a concept of a separation
assistance interface. The fifth section describes how the display
concept can be used in more complex conflict situations.
This paper concludes with a discussion on the key issues of
the current display concept, with recommendations for future
work.
∗James J. Gibson defined affordances as opportunities for action, providedby an object or by the environment. An affordance is considered always inrelation to the actor, and therefore dependent on the actor’s capabilities [30],[33]. For instance, with respect to an engine, air affords propulsion, but withrespect to a wing, air affords lift.
II. WORK DOMAIN ANALYSIS FOR AIRBORNE
SEPARATION
The work domain under analysis in this study is limited
to Trajectory-Based Operations (TBO) with self-separation.
These operations involve trajectory (re-)planning on the flight-
deck, in order to assure conflict-free flight in unmanaged,
i.e., self-separated airspace. In the currently proposed future
airspace concepts, the preferable mode of operation is one
where automated 4D trajectory prediction and control are
applied throughout the whole flight [2], [17], [43].
In this situation, the pilot’s task will be one of monitoring
separation, and selecting and applying resolution advisories,
provided by the automation. The pilot should, however, be
able to judge the fidelity of a proposed resolution, and be able
to intervene in case the automation fails. Good situation aware-
ness is therefore of paramount importance, and, in this study
the Abstraction Hierarchy (AH) will be employed to determine
the relevant aspects of the work domain on several levels of
abstraction. It will also serve to illustrate how the constraints
and affordances on the different levels of abstraction interact
with each other.
The abstraction hierarchy is a work-domain analysis tool
that presents a stratified, hierarchical description of the
workspace. Each stratum of the hierarchy represents the same
system, but on a different level of abstraction. The levels are
connected by means-end relationships between the adjacent
levels. Along the vertical axis, commonly five levels represent
the workspace at decreasing levels of abstraction, starting at
the top with the purpose(s) for which the system was designed,
all the way down to the spatial topology, properties, and
appearance of the components that make up the system on the
bottom level [40], [44]. In previous studies on a workspace
analysis for the air transport domain, it showed that dividing
the horizontal dimension of the AH between items “internal”,
and “external” to the ownship, provides a logical structure for
an abstraction hierarchy that describes this domain [35], [36],
[45].
A. AH for airborne separation
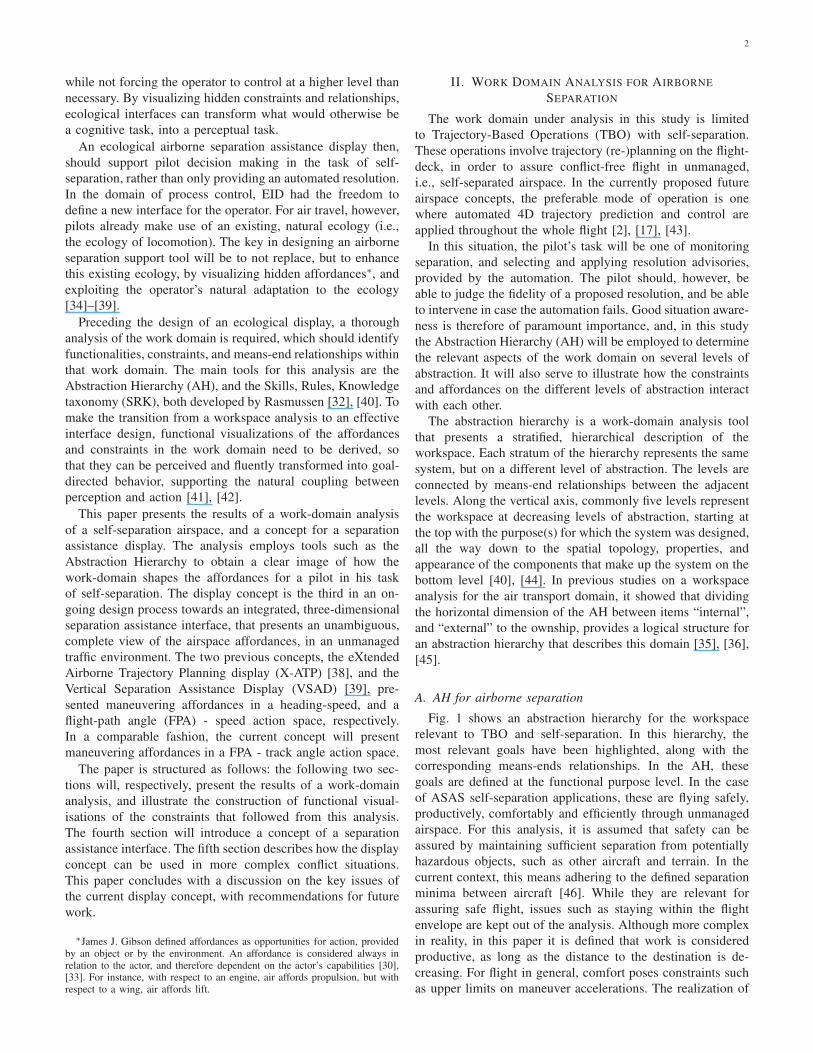
Fig. 1 shows an abstraction hierarchy for the workspace
relevant to TBO and self-separation. In this hierarchy, the
most relevant goals have been highlighted, along with the
corresponding means-ends relationships. In the AH, these
goals are defined at the functional purpose level. In the case
of ASAS self-separation applications, these are flying safely,
productively, comfortably and efficiently through unmanaged
airspace. For this analysis, it is assumed that safety can be
assured by maintaining sufficient separation from potentially
hazardous objects, such as other aircraft and terrain. In the
current context, this means adhering to the defined separation
minima between aircraft [46]. While they are relevant for
assuring safe flight, issues such as staying within the flight
envelope are kept out of the analysis. Although more complex
in reality, in this paper it is defined that work is considered
productive, as long as the distance to the destination is de-
creasing. For flight in general, comfort poses constraints such
as upper limits on maneuver accelerations. The realization of
3
“Internal” “External”
FunctionalPurpose Productivity Efficiency Comfort Safety
AbstractFunction
EnergyManagement
Principles of absoluteand relative locomotion
Separation
GeneralizedFunction
Weight, liftthrust and drag
Waypoints, Maneuvering(kinematics, dynamicsand performance)
ObstructionObstruction motion
PhysicalFunction
Control surfaces, wings,engine, fuselage, ...
Atmosphericcondition
Other trafficStationary objects
(terrain, buildings, ...)
PhysicalForm
Location and appearanceof aircraft components
Weatherproperties
Location and appearanceof other traffic
and stationary objects
Fig. 1. Abstraction Hierarchy for the Separation Assistance Display. The analysis presented in this paper focuses on three functional goals. These goals, andthe relevant means-ends relationships between levels have been highlighted in three groups in the hierarchy: (I) Productivity, (II) Efficiency, and (III) Safety.
efficiency is much more complicated, however, as it can be
defined in many ways, such as fuel efficiency, or minimum
path deviation. These constraints are beyond the scope of this
paper.
The abstract function level describes the underlying relation-
ships that govern the realization of the purposes of the system.
In the case of air travel, this level contains the general physical
laws that dictate flight, absolute and relative locomotion, and
the geometrical properties of the separation problem [45]. Al-
though for aircraft that follow a pre-defined, four-dimensional
path, aircraft intent can influence the constraints that are
derived on this level, the current study will only employ the
current states to derive these constraints. Previous studies did
incorporate the effect of intent on maneuver affordances [47],
however, this is beyond the scope of the current study.
The generalized function level describes how the functions
at the abstract function level are achieved, independent of the
actual implementation of the system. Properties such as aircraft
weight, lift, thrust and drag, and the maneuvering performance
of the aircraft all impose internal constraints on the maneuver
space of an aircraft. External obstructions further constrain
this maneuver space, and dictate the (lack of) separation. On
the bottom of the abstraction hierarchy, the physical form
and functions are described by modeling the internal layout
of aircraft components, and external airspace properties such
as other traffic, weather, and terrain. The physical function
level describes the various components, and their capabilities,
and at the physical form level the appearance and location of
components, the airspace, and other aircraft are described. The
relevant internal and external constraints which can be derived
from this abstraction hierarchy will be described in more detail
below.
In this paper, the workspace content and boundaries are
limited to trajectory planning functions in direct relation with
conflict resolution and prevention during cruise flight. Func-
tions related to aircraft control and stability, like staying within
the flight envelope, and accounting for passenger comfort, are
largely kept out of the analysis. The time horizon in which
the workspace is analyzed is determined by the applicability
of conflict management, and is approximately between 60
seconds and 10 to 20 minutes. Below 60 seconds, collision
avoidance systems like the Traffic Collision Avoidance System
II (TCAS II) must take over in order to prevent collision [48].
An upper threshold of 10 to 20 minutes is chosen because the
vast majority of conflict resolution and recovery maneuvers
take place in less than 20 minutes [17].
The scope of the current research is also restricted to the
visualization of constraints that relate to tactical maneuvering,
influences of ownship and intruder intent [47] are beyond the
scope of this paper.
B. Internal constraints
The internal aircraft constraints that are relevant for this
work domain analysis are mainly described on the abstract
function and the generalized function levels of the work
domain model. They relate to the various limitations on the
performance of the aircraft, such as bank limits, turn dynamics,
available engine power, stall, structural considerations, buffet
characteristics, and requirements on emissions and passenger
comfort. These limitations result in several constraints relevant
to the task of trajectory planning, such as maximum turn rates,
maximum and minimum operating speeds, fastest and steepest
steady climb and descent, and the steepest steady climbing and
descending turn.
Another important, although not directly perceivable con-
straining factor is the energy state of the aircraft: For an
aircraft, speed and altitude share the same energy space. The
mechanism that underlies the coordination of the controls, is
the management of the aircraft’s energy state (abstract function
level, Fig. 1). Speed and altitude are directly related to the
kinetic and potential energy of the aircraft. The total amount
4
of energy is determined by the throttle, whereas the elevator is
used to control the exchange of kinetic and potential energy.
The total energy state of an aircraft essentially determines the
affordances for maneuvering in terms of speed and altitude
[34], [36]. Together, these internal constraints determine the
part of the airspace that is reachable within a certain timespan.
C. External constraints
In unmanaged airspace, the reachable area that was defined
by the internal aircraft constraints is further constrained by
external factors, such as weather, terrain, other traffic, and
the boundaries of the unmanaged airspace. In this analysis,
the focus lies on the constraints imposed by other traffic.
Traffic constraints are shaped by a minimum horizontal and
vertical separation between any two aircraft, that should be
adhered to at all times. With common values of 5 nautical
miles horizontal, and 1,000 feet vertical separation, this results
in a three-dimensional Protected Zone (PZ): A flat, three-
dimensional disc around each aircraft, that should remain clear
of other traffic, see Fig. 2 [49], [50].
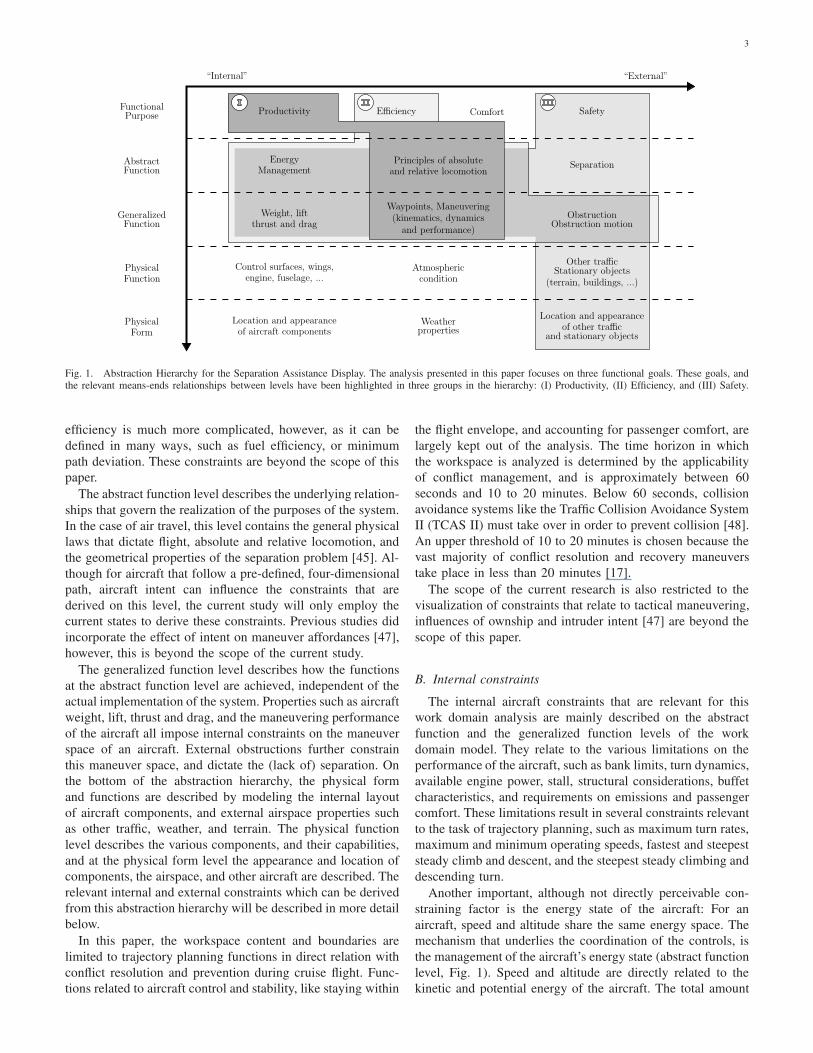
Intrusion of this space is referred to as a loss of separation.
A conflict is defined as a future loss of separation, within a
certain observation timespan (e.g., 5 minutes). In Fig. 3, a
traffic conflict is illustrated from the perspective of ownship.
This and subsequent figures depict a conflict situation between
the ownship and one intruder aircraft. Although the principles
presented in this analysis also hold for multiple intruder
aircraft [38], this paper only uses single intruder conflict
situations to illustrate the proposed concept, for the sake of
clarity. In Fig. 3, the ownship is flying with velocity Vown,
and will eventually lose separation with the intruder aircraft,
if no further action is taken. The point where separation is at
a minimum is called the Closest Point of Approach (CPA). It
can be seen that even when the ownship turns away from the
conflict location, resulting in Vnew in Fig. 3, separation can
still be lost.
This adverse effect can be eliminated by examining the
conflict situation in a relative velocity field [38], [39], [42].
Under the assumption that intruder and ownship state remain
unchanged in the near future, a conflict can be predicted using
the relative speed of ownship, with respect to the intruder
aircraft:
Vrel = Vown −Vint (1)
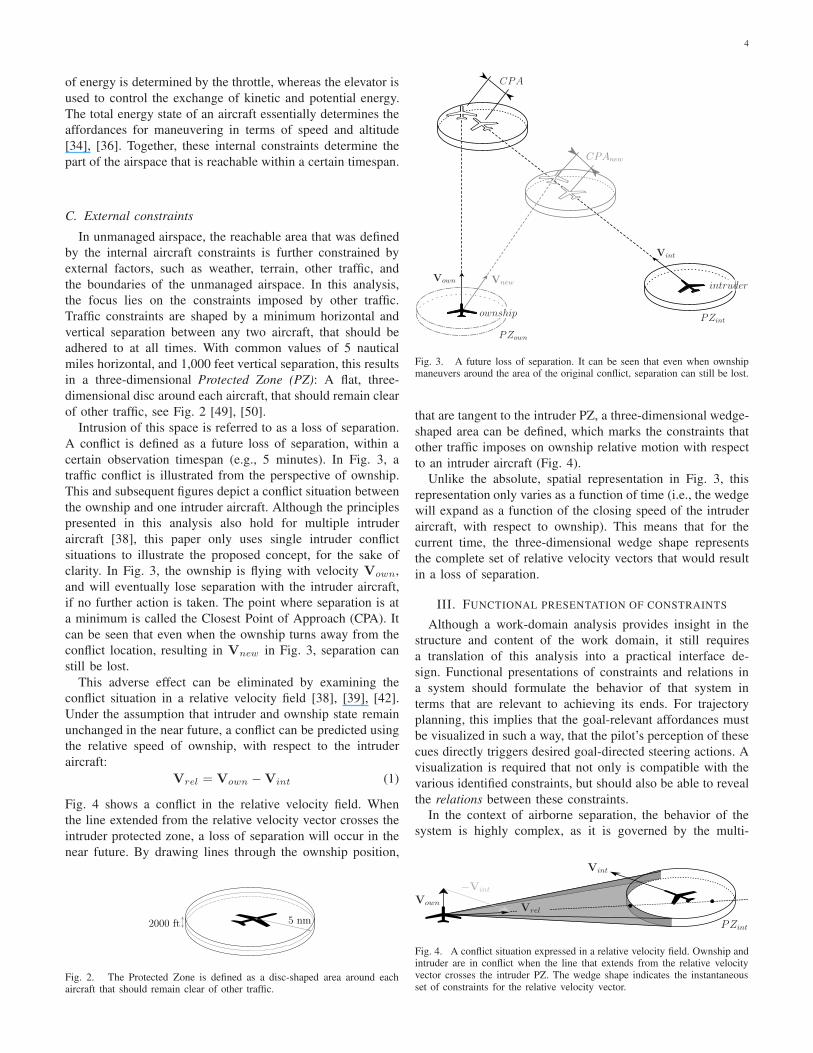
Fig. 4 shows a conflict in the relative velocity field. When
the line extended from the relative velocity vector crosses the
intruder protected zone, a loss of separation will occur in the
near future. By drawing lines through the ownship position,
2000 ft 5 nm
Fig. 2. The Protected Zone is defined as a disc-shaped area around eachaircraft that should remain clear of other traffic.
Vown
Vint
Vnew
PZown
PZintownship
intruder
CPA
CPAnew
Fig. 3. A future loss of separation. It can be seen that even when ownshipmaneuvers around the area of the original conflict, separation can still be lost.
that are tangent to the intruder PZ, a three-dimensional wedge-
shaped area can be defined, which marks the constraints that
other traffic imposes on ownship relative motion with respect
to an intruder aircraft (Fig. 4).
Unlike the absolute, spatial representation in Fig. 3, this
representation only varies as a function of time (i.e., the wedge
will expand as a function of the closing speed of the intruder
aircraft, with respect to ownship). This means that for the
current time, the three-dimensional wedge shape represents
the complete set of relative velocity vectors that would result
in a loss of separation.
III. FUNCTIONAL PRESENTATION OF CONSTRAINTS
Although a work-domain analysis provides insight in the
structure and content of the work domain, it still requires
a translation of this analysis into a practical interface de-
sign. Functional presentations of constraints and relations in
a system should formulate the behavior of that system in
terms that are relevant to achieving its ends. For trajectory
planning, this implies that the goal-relevant affordances must
be visualized in such a way, that the pilot’s perception of these
cues directly triggers desired goal-directed steering actions. A
visualization is required that not only is compatible with the
various identified constraints, but should also be able to reveal
the relations between these constraints.
In the context of airborne separation, the behavior of the
system is highly complex, as it is governed by the multi-
Vown
Vint
−Vint
Vrel
PZint
Fig. 4. A conflict situation expressed in a relative velocity field. Ownship andintruder are in conflict when the line that extends from the relative velocityvector crosses the intruder PZ. The wedge shape indicates the instantaneousset of constraints for the relative velocity vector.
5
variable, non-linear dynamics of several aircraft, moving rela-
tive to each other. Because such a system has too many degrees
of freedom to combine in a usable interface, a different de-
scription is required. This description should relate inputs that
match common flight practice, to the goals and affordances
of the system. In cruise flight, pilots control their aircraft
by manipulating velocity, track angle, and altitude settings,
using the autopilot, or by modifying the planned route in the
Flight Management System. A successful separation assistance
interface should relate these variables and their operational
limits to the affordances of the airspace.
A. Traffic constraints
Fig. 3 already illustrated that presenting conflicts in absolute
space is problematic: The closest point of approach is not
constant, as it depends on the relative motion of two aircraft.
It changes as a function of ownship and intruder velocity and
heading. Therefore, steering away from a conflict based on the
presentation in Fig. 3 will also move the CPA, and might not
resolve the conflict at all. In other words, although a conflict
presentation like the one in Fig. 3 provides the pilot with a
visualization of the affordance of ‘conflict’, it does not show
the affordance of ‘avoidance’, and is therefore an unsuitable
conflict avoidance representation [38].
With the design of a horizontal and a vertical separation
assistance display, previous studies illustrated that the affor-
dance of avoidance can be consistently represented in a relative
velocity field [38], [39] (Fig. 4). A disadvantageous aspect
of the relative velocity field, however, is that it is hard for
pilots to relate their affordances of control in absolute space,
to a velocity constraint zone expressed in relative space. In
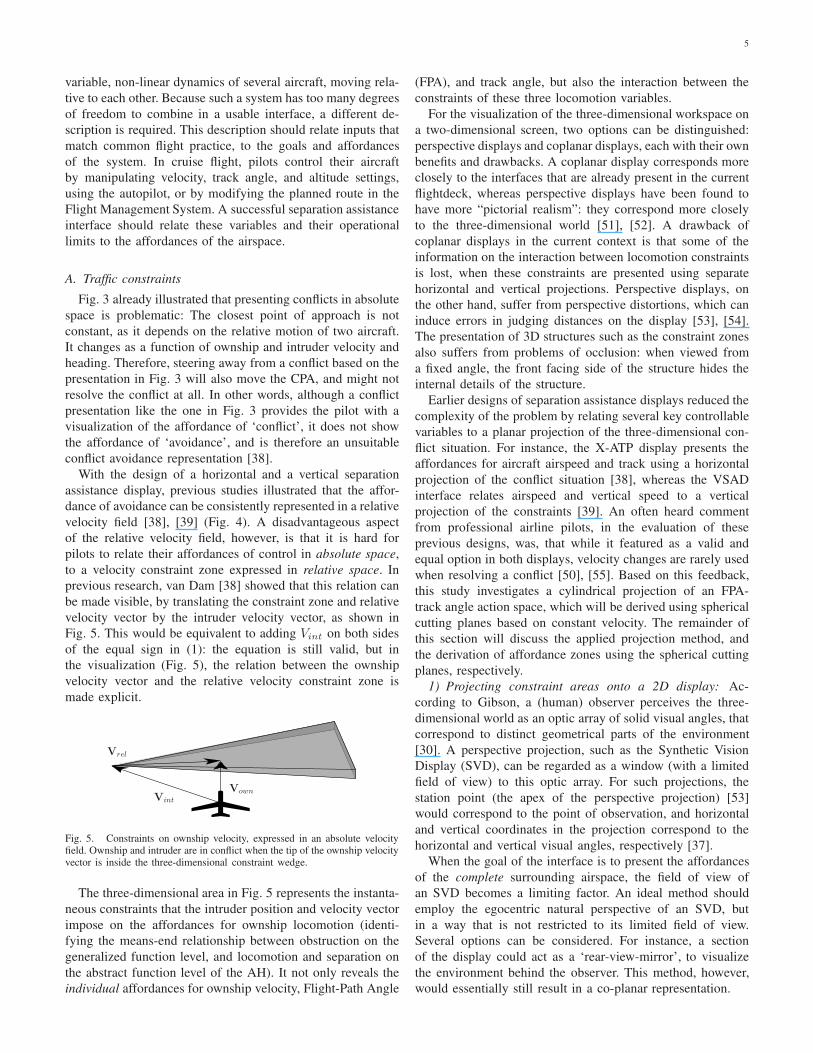
previous research, van Dam [38] showed that this relation can
be made visible, by translating the constraint zone and relative
velocity vector by the intruder velocity vector, as shown in
Fig. 5. This would be equivalent to adding Vint on both sides
of the equal sign in (1): the equation is still valid, but in
the visualization (Fig. 5), the relation between the ownship
velocity vector and the relative velocity constraint zone is
made explicit.
VownVint
Vrel
Fig. 5. Constraints on ownship velocity, expressed in an absolute velocityfield. Ownship and intruder are in conflict when the tip of the ownship velocityvector is inside the three-dimensional constraint wedge.
The three-dimensional area in Fig. 5 represents the instanta-
neous constraints that the intruder position and velocity vector
impose on the affordances for ownship locomotion (identi-
fying the means-end relationship between obstruction on the
generalized function level, and locomotion and separation on
the abstract function level of the AH). It not only reveals the
individual affordances for ownship velocity, Flight-Path Angle
(FPA), and track angle, but also the interaction between the
constraints of these three locomotion variables.
For the visualization of the three-dimensional workspace on
a two-dimensional screen, two options can be distinguished:
perspective displays and coplanar displays, each with their own
benefits and drawbacks. A coplanar display corresponds more
closely to the interfaces that are already present in the current
flightdeck, whereas perspective displays have been found to
have more “pictorial realism”: they correspond more closely
to the three-dimensional world [51], [52]. A drawback of
coplanar displays in the current context is that some of the
information on the interaction between locomotion constraints
is lost, when these constraints are presented using separate
horizontal and vertical projections. Perspective displays, on
the other hand, suffer from perspective distortions, which can
induce errors in judging distances on the display [53], [54].
The presentation of 3D structures such as the constraint zones
also suffers from problems of occlusion: when viewed from
a fixed angle, the front facing side of the structure hides the
internal details of the structure.
Earlier designs of separation assistance displays reduced the
complexity of the problem by relating several key controllable
variables to a planar projection of the three-dimensional con-
flict situation. For instance, the X-ATP display presents the
affordances for aircraft airspeed and track using a horizontal
projection of the conflict situation [38], whereas the VSAD
interface relates airspeed and vertical speed to a vertical
projection of the constraints [39]. An often heard comment
from professional airline pilots, in the evaluation of these
previous designs, was, that while it featured as a valid and
equal option in both displays, velocity changes are rarely used
when resolving a conflict [50], [55]. Based on this feedback,
this study investigates a cylindrical projection of an FPA-
track angle action space, which will be derived using spherical
cutting planes based on constant velocity. The remainder of
this section will discuss the applied projection method, and
the derivation of affordance zones using the spherical cutting
planes, respectively.
1) Projecting constraint areas onto a 2D display: Ac-
cording to Gibson, a (human) observer perceives the three-
dimensional world as an optic array of solid visual angles, that
correspond to distinct geometrical parts of the environment
[30]. A perspective projection, such as the Synthetic Vision
Display (SVD), can be regarded as a window (with a limited
field of view) to this optic array. For such projections, the
station point (the apex of the perspective projection) [53]
would correspond to the point of observation, and horizontal
and vertical coordinates in the projection correspond to the
horizontal and vertical visual angles, respectively [37].
When the goal of the interface is to present the affordances
of the complete surrounding airspace, the field of view of
an SVD becomes a limiting factor. An ideal method should
employ the egocentric natural perspective of an SVD, but
in a way that is not restricted to its limited field of view.
Several options can be considered. For instance, a section
of the display could act as a ‘rear-view-mirror’, to visualize
the environment behind the observer. This method, however,
would essentially still result in a co-planar representation.
6
Vint
Vint
V′
int
|Vown|
|Vown|
Sown
Sown
S ′
own
Dproj
ownship
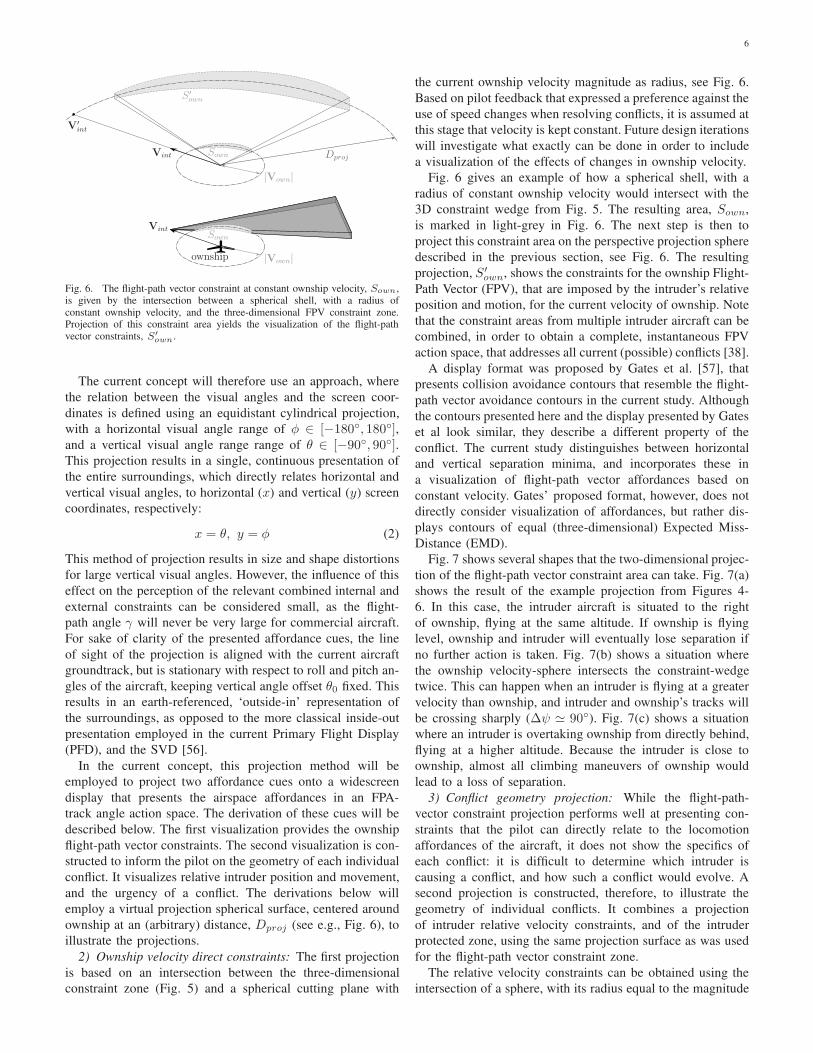
Fig. 6. The flight-path vector constraint at constant ownship velocity, Sown,is given by the intersection between a spherical shell, with a radius ofconstant ownship velocity, and the three-dimensional FPV constraint zone.Projection of this constraint area yields the visualization of the flight-pathvector constraints, S′
own.
The current concept will therefore use an approach, where
the relation between the visual angles and the screen coor-
dinates is defined using an equidistant cylindrical projection,
with a horizontal visual angle range of φ ∈ [−180◦, 180◦],and a vertical visual angle range range of θ ∈ [−90◦, 90◦].This projection results in a single, continuous presentation of
the entire surroundings, which directly relates horizontal and
vertical visual angles, to horizontal (x) and vertical (y) screen
coordinates, respectively:
x = θ, y = φ (2)
This method of projection results in size and shape distortions
for large vertical visual angles. However, the influence of this
effect on the perception of the relevant combined internal and
external constraints can be considered small, as the flight-
path angle γ will never be very large for commercial aircraft.
For sake of clarity of the presented affordance cues, the line
of sight of the projection is aligned with the current aircraft
groundtrack, but is stationary with respect to roll and pitch an-
gles of the aircraft, keeping vertical angle offset θ0 fixed. This
results in an earth-referenced, ‘outside-in’ representation of
the surroundings, as opposed to the more classical inside-out
presentation employed in the current Primary Flight Display
(PFD), and the SVD [56].
In the current concept, this projection method will be
employed to project two affordance cues onto a widescreen
display that presents the airspace affordances in an FPA-
track angle action space. The derivation of these cues will be
described below. The first visualization provides the ownship
flight-path vector constraints. The second visualization is con-
structed to inform the pilot on the geometry of each individual
conflict. It visualizes relative intruder position and movement,
and the urgency of a conflict. The derivations below will
employ a virtual projection spherical surface, centered around
ownship at an (arbitrary) distance, Dproj (see e.g., Fig. 6), to
illustrate the projections.
2) Ownship velocity direct constraints: The first projection
is based on an intersection between the three-dimensional
constraint zone (Fig. 5) and a spherical cutting plane with
the current ownship velocity magnitude as radius, see Fig. 6.
Based on pilot feedback that expressed a preference against the
use of speed changes when resolving conflicts, it is assumed at
this stage that velocity is kept constant. Future design iterations
will investigate what exactly can be done in order to include
a visualization of the effects of changes in ownship velocity.
Fig. 6 gives an example of how a spherical shell, with a
radius of constant ownship velocity would intersect with the
3D constraint wedge from Fig. 5. The resulting area, Sown,
is marked in light-grey in Fig. 6. The next step is then to
project this constraint area on the perspective projection sphere
described in the previous section, see Fig. 6. The resulting
projection, S′
own, shows the constraints for the ownship Flight-
Path Vector (FPV), that are imposed by the intruder’s relative
position and motion, for the current velocity of ownship. Note
that the constraint areas from multiple intruder aircraft can be
combined, in order to obtain a complete, instantaneous FPV
action space, that addresses all current (possible) conflicts [38].
A display format was proposed by Gates et al. [57], that
presents collision avoidance contours that resemble the flight-
path vector avoidance contours in the current study. Although
the contours presented here and the display presented by Gates
et al look similar, they describe a different property of the
conflict. The current study distinguishes between horizontal
and vertical separation minima, and incorporates these in
a visualization of flight-path vector affordances based on
constant velocity. Gates’ proposed format, however, does not
directly consider visualization of affordances, but rather dis-
plays contours of equal (three-dimensional) Expected Miss-
Distance (EMD).
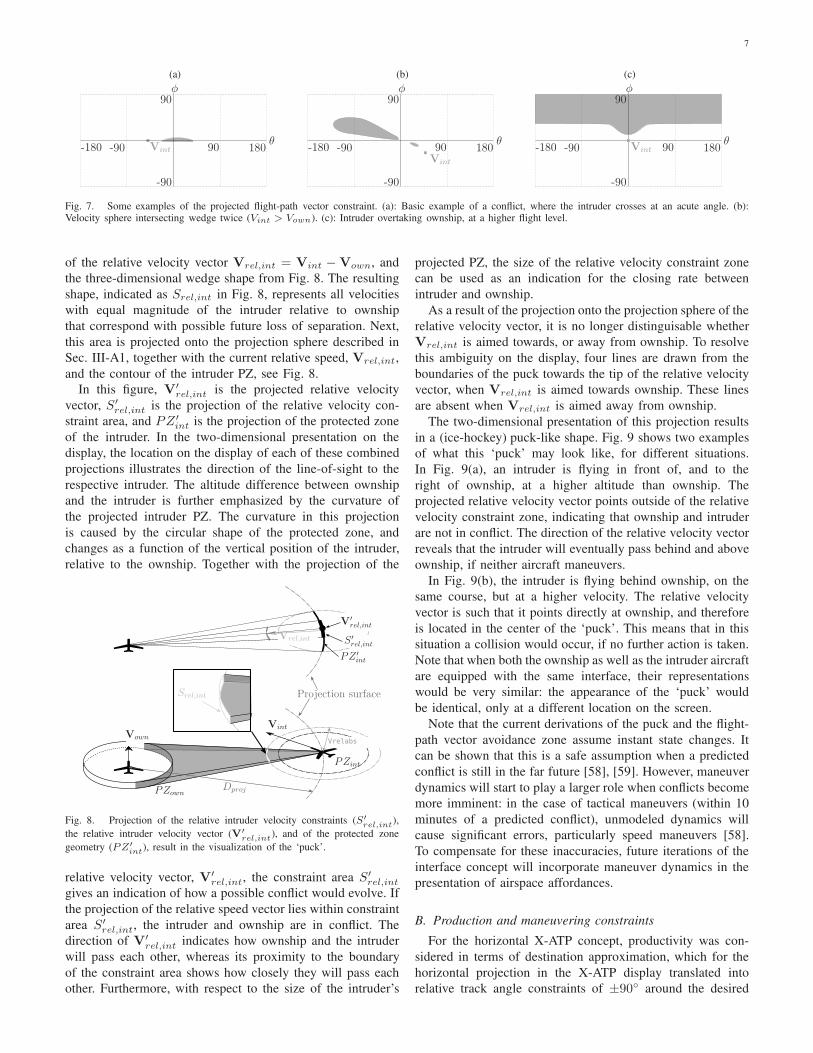
Fig. 7 shows several shapes that the two-dimensional projec-
tion of the flight-path vector constraint area can take. Fig. 7(a)
shows the result of the example projection from Figures 4-
6. In this case, the intruder aircraft is situated to the right
of ownship, flying at the same altitude. If ownship is flying
level, ownship and intruder will eventually lose separation if
no further action is taken. Fig. 7(b) shows a situation where
the ownship velocity-sphere intersects the constraint-wedge
twice. This can happen when an intruder is flying at a greater
velocity than ownship, and intruder and ownship’s tracks will
be crossing sharply (∆ψ ≃ 90◦). Fig. 7(c) shows a situation
where an intruder is overtaking ownship from directly behind,
flying at a higher altitude. Because the intruder is close to
ownship, almost all climbing maneuvers of ownship would
lead to a loss of separation.
3) Conflict geometry projection: While the flight-path-
vector constraint projection performs well at presenting con-
straints that the pilot can directly relate to the locomotion
affordances of the aircraft, it does not show the specifics of
each conflict: it is difficult to determine which intruder is
causing a conflict, and how such a conflict would evolve. A
second projection is constructed, therefore, to illustrate the
geometry of individual conflicts. It combines a projection
of intruder relative velocity constraints, and of the intruder
protected zone, using the same projection surface as was used
for the flight-path vector constraint zone.
The relative velocity constraints can be obtained using the
intersection of a sphere, with its radius equal to the magnitude
7
(a)
Vint
φ
θ
90
-90
180-180 -90 90
(b)
Vint
φ
θ
90
-90
180-180 -90 90
(c)
Vint
φ
θ
90
-90
180-180 -90 90
Fig. 7. Some examples of the projected flight-path vector constraint. (a): Basic example of a conflict, where the intruder crosses at an acute angle. (b):Velocity sphere intersecting wedge twice (Vint > Vown). (c): Intruder overtaking ownship, at a higher flight level.
of the relative velocity vector Vrel,int = Vint −Vown, and
the three-dimensional wedge shape from Fig. 8. The resulting
shape, indicated as Srel,int in Fig. 8, represents all velocities
with equal magnitude of the intruder relative to ownship
that correspond with possible future loss of separation. Next,
this area is projected onto the projection sphere described in
Sec. III-A1, together with the current relative speed, Vrel,int,
and the contour of the intruder PZ, see Fig. 8.
In this figure, V′
rel,int is the projected relative velocity
vector, S′
rel,int is the projection of the relative velocity con-
straint area, and PZ ′
int is the projection of the protected zone
of the intruder. In the two-dimensional presentation on the
display, the location on the display of each of these combined
projections illustrates the direction of the line-of-sight to the
respective intruder. The altitude difference between ownship
and the intruder is further emphasized by the curvature of
the projected intruder PZ. The curvature in this projection
is caused by the circular shape of the protected zone, and
changes as a function of the vertical position of the intruder,
relative to the ownship. Together with the projection of the
VrelabsVown
Vint
Vrel,int
V′
rel,int
PZown
Srel,int
S ′
rel,int
Projection surface
Dproj
PZint
PZ ′
int
Fig. 8. Projection of the relative intruder velocity constraints (S′
rel,int),
the relative intruder velocity vector (V′
rel,int), and of the protected zone
geometry (PZ′
int), result in the visualization of the ‘puck’.
relative velocity vector, V′
rel,int, the constraint area S′
rel,int
gives an indication of how a possible conflict would evolve. If
the projection of the relative speed vector lies within constraint
area S′
rel,int, the intruder and ownship are in conflict. The
direction of V′
rel,int indicates how ownship and the intruder
will pass each other, whereas its proximity to the boundary
of the constraint area shows how closely they will pass each
other. Furthermore, with respect to the size of the intruder’s
projected PZ, the size of the relative velocity constraint zone
can be used as an indication for the closing rate between
intruder and ownship.
As a result of the projection onto the projection sphere of the
relative velocity vector, it is no longer distinguisable whether
Vrel,int is aimed towards, or away from ownship. To resolve
this ambiguity on the display, four lines are drawn from the
boundaries of the puck towards the tip of the relative velocity
vector, when Vrel,int is aimed towards ownship. These lines
are absent when Vrel,int is aimed away from ownship.
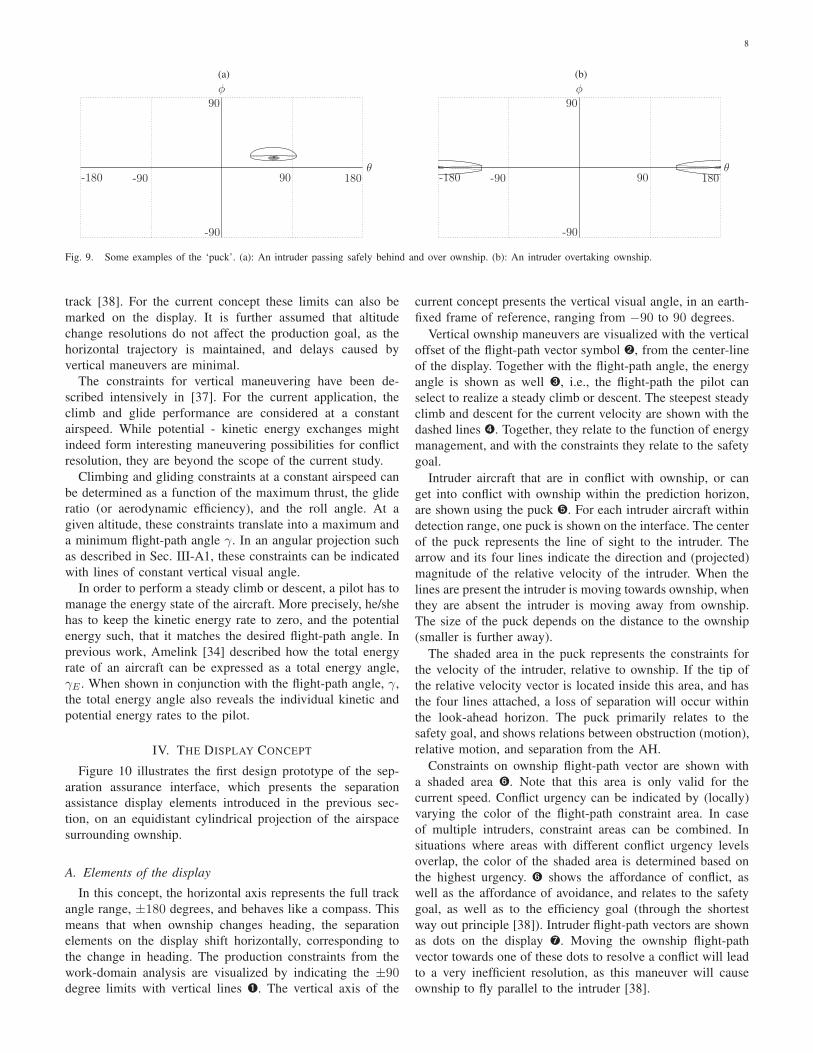
The two-dimensional presentation of this projection results
in a (ice-hockey) puck-like shape. Fig. 9 shows two examples
of what this ‘puck’ may look like, for different situations.
In Fig. 9(a), an intruder is flying in front of, and to the
right of ownship, at a higher altitude than ownship. The
projected relative velocity vector points outside of the relative
velocity constraint zone, indicating that ownship and intruder
are not in conflict. The direction of the relative velocity vector
reveals that the intruder will eventually pass behind and above
ownship, if neither aircraft maneuvers.
In Fig. 9(b), the intruder is flying behind ownship, on the
same course, but at a higher velocity. The relative velocity
vector is such that it points directly at ownship, and therefore
is located in the center of the ‘puck’. This means that in this
situation a collision would occur, if no further action is taken.
Note that when both the ownship as well as the intruder aircraft
are equipped with the same interface, their representations
would be very similar: the appearance of the ‘puck’ would
be identical, only at a different location on the screen.
Note that the current derivations of the puck and the flight-
path vector avoidance zone assume instant state changes. It
can be shown that this is a safe assumption when a predicted
conflict is still in the far future [58], [59]. However, maneuver
dynamics will start to play a larger role when conflicts become
more imminent: in the case of tactical maneuvers (within 10
minutes of a predicted conflict), unmodeled dynamics will
cause significant errors, particularly speed maneuvers [58].
To compensate for these inaccuracies, future iterations of the
interface concept will incorporate maneuver dynamics in the
presentation of airspace affordances.
B. Production and maneuvering constraints
For the horizontal X-ATP concept, productivity was con-
sidered in terms of destination approximation, which for the
horizontal projection in the X-ATP display translated into
relative track angle constraints of ±90◦ around the desired
8
(a)
φ
θ
90
-90
180-180 -90 90
(b)
φ
θ
90
-90
180-180 -90 90
Fig. 9. Some examples of the ‘puck’. (a): An intruder passing safely behind and over ownship. (b): An intruder overtaking ownship.
track [38]. For the current concept these limits can also be
marked on the display. It is further assumed that altitude
change resolutions do not affect the production goal, as the
horizontal trajectory is maintained, and delays caused by
vertical maneuvers are minimal.
The constraints for vertical maneuvering have been de-
scribed intensively in [37]. For the current application, the
climb and glide performance are considered at a constant
airspeed. While potential - kinetic energy exchanges might
indeed form interesting maneuvering possibilities for conflict
resolution, they are beyond the scope of the current study.
Climbing and gliding constraints at a constant airspeed can
be determined as a function of the maximum thrust, the glide
ratio (or aerodynamic efficiency), and the roll angle. At a
given altitude, these constraints translate into a maximum and
a minimum flight-path angle γ. In an angular projection such
as described in Sec. III-A1, these constraints can be indicated
with lines of constant vertical visual angle.
In order to perform a steady climb or descent, a pilot has to
manage the energy state of the aircraft. More precisely, he/she
has to keep the kinetic energy rate to zero, and the potential
energy such, that it matches the desired flight-path angle. In
previous work, Amelink [34] described how the total energy
rate of an aircraft can be expressed as a total energy angle,
γE . When shown in conjunction with the flight-path angle, γ,
the total energy angle also reveals the individual kinetic and
potential energy rates to the pilot.
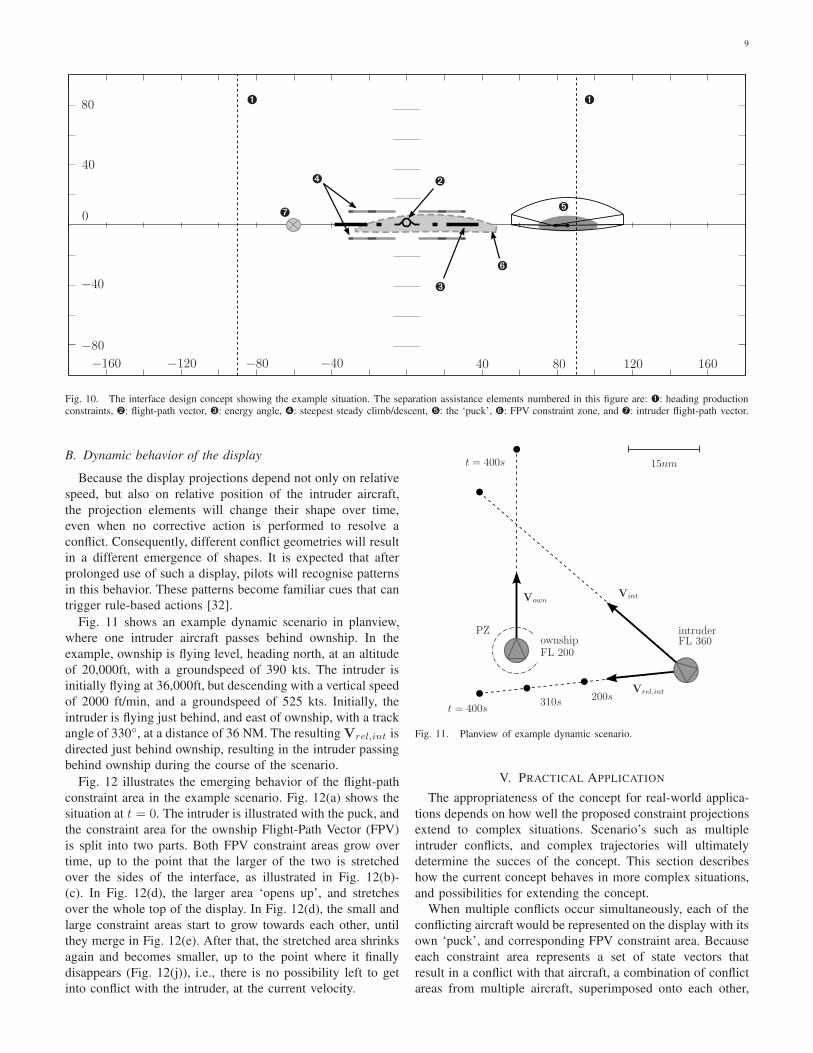
IV. THE DISPLAY CONCEPT
Figure 10 illustrates the first design prototype of the sep-
aration assurance interface, which presents the separation
assistance display elements introduced in the previous sec-
tion, on an equidistant cylindrical projection of the airspace
surrounding ownship.
A. Elements of the display
In this concept, the horizontal axis represents the full track
angle range, ±180 degrees, and behaves like a compass. This
means that when ownship changes heading, the separation
elements on the display shift horizontally, corresponding to
the change in heading. The production constraints from the
work-domain analysis are visualized by indicating the ±90degree limits with vertical lines ➊. The vertical axis of the
current concept presents the vertical visual angle, in an earth-
fixed frame of reference, ranging from −90 to 90 degrees.
Vertical ownship maneuvers are visualized with the vertical
offset of the flight-path vector symbol ➋, from the center-line
of the display. Together with the flight-path angle, the energy
angle is shown as well ➌, i.e., the flight-path the pilot can
select to realize a steady climb or descent. The steepest steady
climb and descent for the current velocity are shown with the
dashed lines ➍. Together, they relate to the function of energy
management, and with the constraints they relate to the safety
goal.
Intruder aircraft that are in conflict with ownship, or can
get into conflict with ownship within the prediction horizon,
are shown using the puck ➎. For each intruder aircraft within
detection range, one puck is shown on the interface. The center
of the puck represents the line of sight to the intruder. The
arrow and its four lines indicate the direction and (projected)
magnitude of the relative velocity of the intruder. When the
lines are present the intruder is moving towards ownship, when
they are absent the intruder is moving away from ownship.
The size of the puck depends on the distance to the ownship
(smaller is further away).
The shaded area in the puck represents the constraints for
the velocity of the intruder, relative to ownship. If the tip of
the relative velocity vector is located inside this area, and has
the four lines attached, a loss of separation will occur within
the look-ahead horizon. The puck primarily relates to the
safety goal, and shows relations between obstruction (motion),
relative motion, and separation from the AH.
Constraints on ownship flight-path vector are shown with
a shaded area ➏. Note that this area is only valid for the
current speed. Conflict urgency can be indicated by (locally)
varying the color of the flight-path constraint area. In case
of multiple intruders, constraint areas can be combined. In
situations where areas with different conflict urgency levels
overlap, the color of the shaded area is determined based on
the highest urgency. ➏ shows the affordance of conflict, as
well as the affordance of avoidance, and relates to the safety
goal, as well as to the efficiency goal (through the shortest
way out principle [38]). Intruder flight-path vectors are shown
as dots on the display ➐. Moving the ownship flight-path
vector towards one of these dots to resolve a conflict will lead
to a very inefficient resolution, as this maneuver will cause
ownship to fly parallel to the intruder [38].
9
−160 −120 −80 −40 40 80 120 160
80
40
0
−40
−80
➊➊
➋
➌
➍
➎
➏
➐
Fig. 10. The interface design concept showing the example situation. The separation assistance elements numbered in this figure are: ➊: heading productionconstraints, ➋: flight-path vector, ➌: energy angle, ➍: steepest steady climb/descent, ➎: the ‘puck’, ➏: FPV constraint zone, and ➐: intruder flight-path vector.
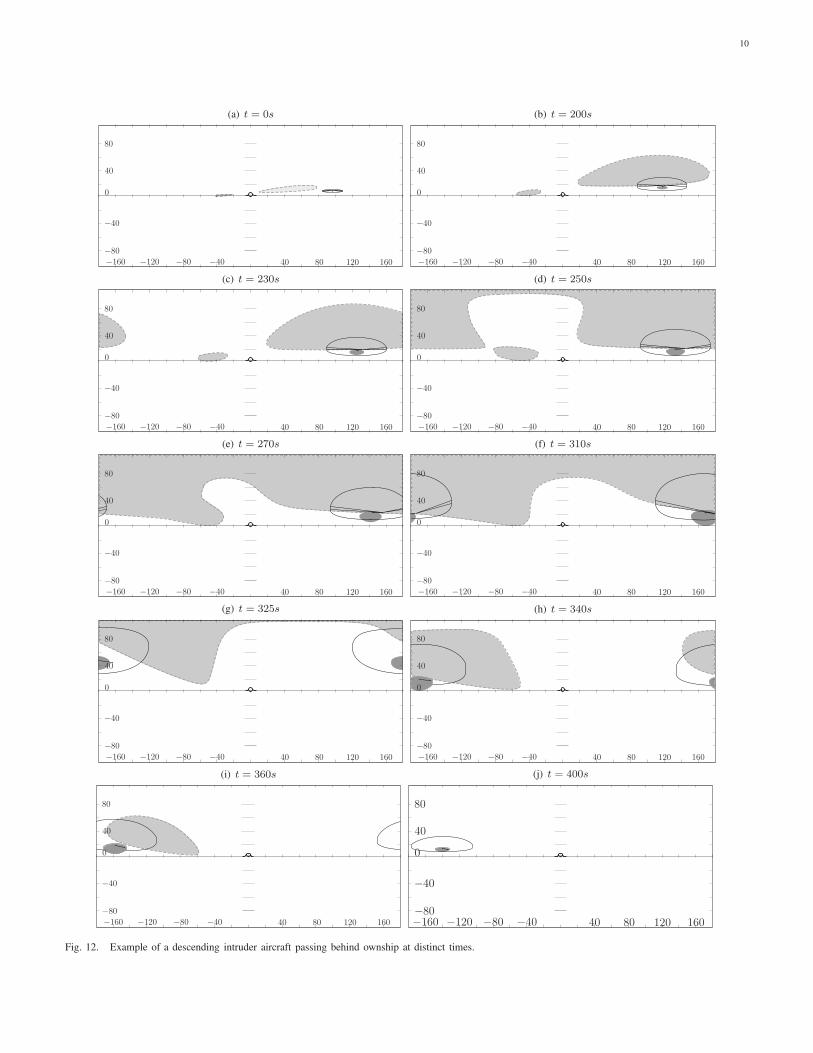
B. Dynamic behavior of the display
Because the display projections depend not only on relative
speed, but also on relative position of the intruder aircraft,
the projection elements will change their shape over time,
even when no corrective action is performed to resolve a
conflict. Consequently, different conflict geometries will result
in a different emergence of shapes. It is expected that after
prolonged use of such a display, pilots will recognise patterns
in this behavior. These patterns become familiar cues that can
trigger rule-based actions [32].
Fig. 11 shows an example dynamic scenario in planview,
where one intruder aircraft passes behind ownship. In the
example, ownship is flying level, heading north, at an altitude
of 20,000ft, with a groundspeed of 390 kts. The intruder is
initially flying at 36,000ft, but descending with a vertical speed
of 2000 ft/min, and a groundspeed of 525 kts. Initially, the
intruder is flying just behind, and east of ownship, with a track
angle of 330◦, at a distance of 36 NM. The resulting Vrel,int is
directed just behind ownship, resulting in the intruder passing
behind ownship during the course of the scenario.
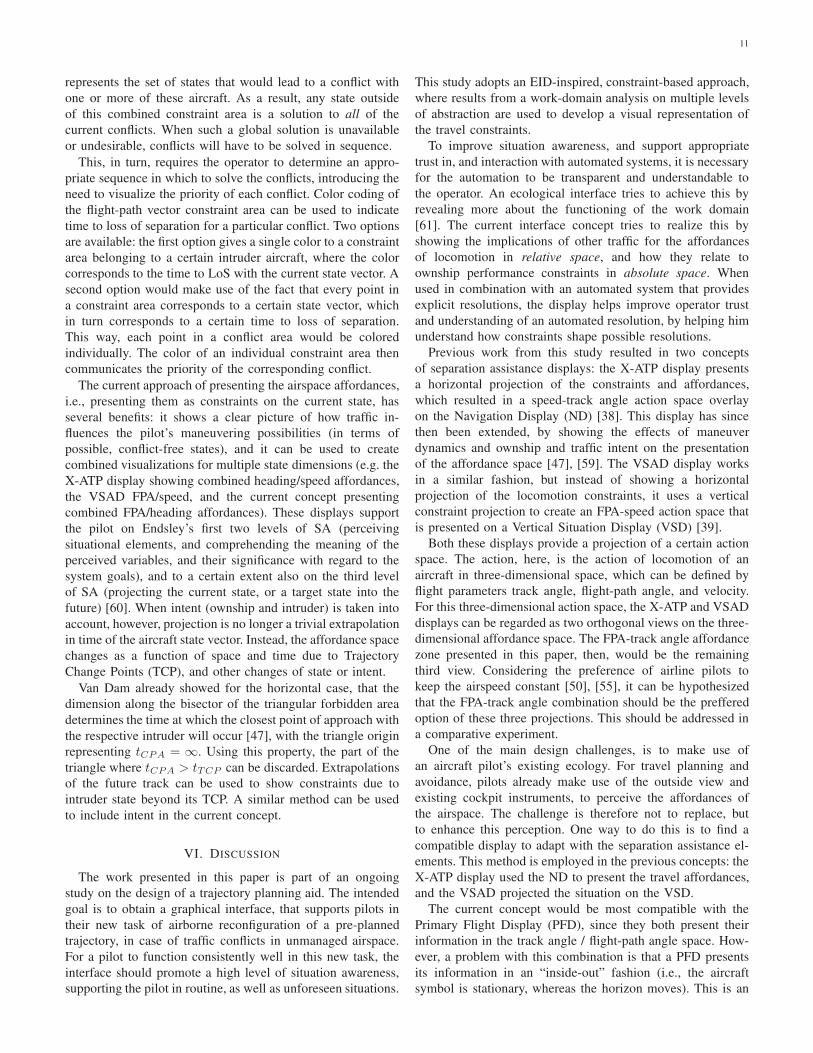
Fig. 12 illustrates the emerging behavior of the flight-path
constraint area in the example scenario. Fig. 12(a) shows the
situation at t = 0. The intruder is illustrated with the puck, and
the constraint area for the ownship Flight-Path Vector (FPV)
is split into two parts. Both FPV constraint areas grow over
time, up to the point that the larger of the two is stretched
over the sides of the interface, as illustrated in Fig. 12(b)-
(c). In Fig. 12(d), the larger area ‘opens up’, and stretches
over the whole top of the display. In Fig. 12(d), the small and
large constraint areas start to grow towards each other, until
they merge in Fig. 12(e). After that, the stretched area shrinks
again and becomes smaller, up to the point where it finally
disappears (Fig. 12(j)), i.e., there is no possibility left to get
into conflict with the intruder, at the current velocity.
t = 400s
t = 400s310s 200s
15nm
PZownshipFL 200
intruderFL 360
VownVint
Vrel,int
Fig. 11. Planview of example dynamic scenario.
V. PRACTICAL APPLICATION
The appropriateness of the concept for real-world applica-
tions depends on how well the proposed constraint projections
extend to complex situations. Scenario’s such as multiple
intruder conflicts, and complex trajectories will ultimately
determine the succes of the concept. This section describes
how the current concept behaves in more complex situations,
and possibilities for extending the concept.
When multiple conflicts occur simultaneously, each of the
conflicting aircraft would be represented on the display with its
own ‘puck’, and corresponding FPV constraint area. Because
each constraint area represents a set of state vectors that
result in a conflict with that aircraft, a combination of conflict
areas from multiple aircraft, superimposed onto each other,
10
(a) t = 0s
−160 −120 −80 −40 40 80 120 160
80
40
0
−40
−80
(b) t = 200s
−160 −120 −80 −40 40 80 120 160
80
40
0
−40
−80
(c) t = 230s
−160 −120 −80 −40 40 80 120 160
80
40
0
−40
−80
(d) t = 250s
−160 −120 −80 −40 40 80 120 160
80
40
0
−40
−80
(e) t = 270s
−160 −120 −80 −40 40 80 120 160
80
40
0
−40
−80
(f) t = 310s
−160 −120 −80 −40 40 80 120 160
80
40
0
−40
−80
(g) t = 325s
−160 −120 −80 −40 40 80 120 160
80
40
0
−40
−80
(h) t = 340s
−160 −120 −80 −40 40 80 120 160
80
40
0
−40
−80
(i) t = 360s
−160 −120 −80 −40 40 80 120 160
80
40
0
−40
−80
(j) t = 400s
−160 −120 −80 −40 40 80 120 160
80
40
0
−40
−80
Fig. 12. Example of a descending intruder aircraft passing behind ownship at distinct times.
11
represents the set of states that would lead to a conflict with
one or more of these aircraft. As a result, any state outside
of this combined constraint area is a solution to all of the
current conflicts. When such a global solution is unavailable
or undesirable, conflicts will have to be solved in sequence.
This, in turn, requires the operator to determine an appro-
priate sequence in which to solve the conflicts, introducing the
need to visualize the priority of each conflict. Color coding of
the flight-path vector constraint area can be used to indicate
time to loss of separation for a particular conflict. Two options
are available: the first option gives a single color to a constraint
area belonging to a certain intruder aircraft, where the color
corresponds to the time to LoS with the current state vector. A
second option would make use of the fact that every point in
a constraint area corresponds to a certain state vector, which
in turn corresponds to a certain time to loss of separation.
This way, each point in a conflict area would be colored
individually. The color of an individual constraint area then
communicates the priority of the corresponding conflict.
The current approach of presenting the airspace affordances,
i.e., presenting them as constraints on the current state, has
several benefits: it shows a clear picture of how traffic in-
fluences the pilot’s maneuvering possibilities (in terms of
possible, conflict-free states), and it can be used to create
combined visualizations for multiple state dimensions (e.g. the
X-ATP display showing combined heading/speed affordances,
the VSAD FPA/speed, and the current concept presenting
combined FPA/heading affordances). These displays support
the pilot on Endsley’s first two levels of SA (perceiving
situational elements, and comprehending the meaning of the
perceived variables, and their significance with regard to the
system goals), and to a certain extent also on the third level
of SA (projecting the current state, or a target state into the
future) [60]. When intent (ownship and intruder) is taken into
account, however, projection is no longer a trivial extrapolation
in time of the aircraft state vector. Instead, the affordance space
changes as a function of space and time due to Trajectory
Change Points (TCP), and other changes of state or intent.
Van Dam already showed for the horizontal case, that the
dimension along the bisector of the triangular forbidden area
determines the time at which the closest point of approach with
the respective intruder will occur [47], with the triangle origin
representing tCPA = ∞. Using this property, the part of the
triangle where tCPA > tTCP can be discarded. Extrapolations
of the future track can be used to show constraints due to
intruder state beyond its TCP. A similar method can be used
to include intent in the current concept.
VI. DISCUSSION
The work presented in this paper is part of an ongoing
study on the design of a trajectory planning aid. The intended
goal is to obtain a graphical interface, that supports pilots in
their new task of airborne reconfiguration of a pre-planned
trajectory, in case of traffic conflicts in unmanaged airspace.
For a pilot to function consistently well in this new task, the
interface should promote a high level of situation awareness,
supporting the pilot in routine, as well as unforeseen situations.
This study adopts an EID-inspired, constraint-based approach,
where results from a work-domain analysis on multiple levels
of abstraction are used to develop a visual representation of
the travel constraints.
To improve situation awareness, and support appropriate
trust in, and interaction with automated systems, it is necessary
for the automation to be transparent and understandable to
the operator. An ecological interface tries to achieve this by
revealing more about the functioning of the work domain
[61]. The current interface concept tries to realize this by
showing the implications of other traffic for the affordances
of locomotion in relative space, and how they relate to
ownship performance constraints in absolute space. When
used in combination with an automated system that provides
explicit resolutions, the display helps improve operator trust
and understanding of an automated resolution, by helping him
understand how constraints shape possible resolutions.
Previous work from this study resulted in two concepts
of separation assistance displays: the X-ATP display presents
a horizontal projection of the constraints and affordances,
which resulted in a speed-track angle action space overlay
on the Navigation Display (ND) [38]. This display has since
then been extended, by showing the effects of maneuver
dynamics and ownship and traffic intent on the presentation
of the affordance space [47], [59]. The VSAD display works
in a similar fashion, but instead of showing a horizontal
projection of the locomotion constraints, it uses a vertical
constraint projection to create an FPA-speed action space that
is presented on a Vertical Situation Display (VSD) [39].
Both these displays provide a projection of a certain action
space. The action, here, is the action of locomotion of an
aircraft in three-dimensional space, which can be defined by
flight parameters track angle, flight-path angle, and velocity.
For this three-dimensional action space, the X-ATP and VSAD
displays can be regarded as two orthogonal views on the three-
dimensional affordance space. The FPA-track angle affordance
zone presented in this paper, then, would be the remaining
third view. Considering the preference of airline pilots to
keep the airspeed constant [50], [55], it can be hypothesized
that the FPA-track angle combination should be the preffered
option of these three projections. This should be addressed in
a comparative experiment.
One of the main design challenges, is to make use of
an aircraft pilot’s existing ecology. For travel planning and
avoidance, pilots already make use of the outside view and
existing cockpit instruments, to perceive the affordances of
the airspace. The challenge is therefore not to replace, but
to enhance this perception. One way to do this is to find a
compatible display to adapt with the separation assistance el-
ements. This method is employed in the previous concepts: the
X-ATP display used the ND to present the travel affordances,
and the VSAD projected the situation on the VSD.
The current concept would be most compatible with the
Primary Flight Display (PFD), since they both present their
information in the track angle / flight-path angle space. How-
ever, a problem with this combination is that a PFD presents
its information in an “inside-out” fashion (i.e., the aircraft
symbol is stationary, whereas the horizon moves). This is an
12
unfavorable situation when separation avoidance elements are
shown on this display. Because these elements are related to
the orientation of the ownship, they will move and rotate
with the horizon, making them more difficult to interpret.
Other options would, then, be auxiliary displays such as the
Electronic Flight Bag (EFB).
A consequence of the current choice of cutting-planes is
that the visualized affordances relate to ownship motion in
terms of track angle and vertical speed changes, however, they
do not show the affordances in terms of ownship velocity.
Although pilot feedback in the evaluation experiments of the
previous concepts already indicated that velocity changes are
not preferred, and therefore rarely used when resolving con-
flicts, the ‘perfect ecological interface’ would ideally present
the affordances for all of the pilot’s maneuvering options.
Also, speed changes might be required to satisfy other goals
than safety, for instance to compensate for time deviation along
track, to adhere to time constraints at the next waypoint. In
terms of requirements following from the efficiency goal, a
pilot may for instance also consider a constant-throttle vertical
maneuver, where velocity cannot be assumed constant.
It is clear that the step from work domain analysis to
display concept is far from a trivial one, and more than one
iteration between analysis and design will be required to work
towards a fully functional, and mature design [45]. In these
iterations, concessions are unavoidable when trying to present
the behavior of a four-dimensional work-domain on a two-
dimensional surface.
REFERENCES
[1] JPDO, “Concept of Operations for the Next Generation Air Transporta-tion System, Version 2.0,” Joint Planning and Development Office, Tech.Rep., Jun. 2007.
[2] SESAR Consortium, “SESAR Definition Phase D3: The ATM TargetConcept,” Eurocontrol, Tech. Rep. DLM-0612-001-02-00, 2007.
[3] D. A. Norman, “The “Problem” of Automation: Inappropriate Feedbackand Interaction, not “Over-Automation”,” Philosophical Transactions of
the Royal Society of London, vol. 327, no. 1241, pp. 585–593, Apr.1990.
[4] N. B. Sarter and D. D. Woods, “Pilot Interaction With Cockpit Automa-tion: Operational Experiences With the Flight Management System,” The
International Journal of Aviation Psychology, vol. 2, no. 4, pp. 303–321,1992.
[5] G. Lintern, “An Affordance-Based Perspective on Human-MachineInterface Design,” Ecological Psychology, vol. 12, no. 1, pp. 65–69,2000.
[6] J. D. Lee and N. Moray, “Trust, Control Strategies and Allocation ofFunction in Human-Machine Systems,” Ergonomics, vol. 31, no. 10, pp.1243–1270, 1992.
[7] ——, “Trust, Self-Confidence, and Operators’ Adaptation to Automa-tion,” International Journal of Human-Computer Studies, vol. 40, no. 1,pp. 153–184, 1994.
[8] B. M. Muir, “Trust in Automation. 1: Theoretical Issues in the Studyof Trust and Human Intervention in Automated Systems,” Ergonomics,vol. 37, no. 11, pp. 1905–1922, 1994.
[9] C. Meckiff and P. Gibbs, “PHARE Highly Interactive Problem Solver,”Eurocontrol, Tech. Rep. 273/94, Nov. 1994.
[10] R. Azuma, H. Neely, M. Daily, and M. Correa, “Visualization ofConflicts and Resolutions in a “Free Flight” Scenario,” in Proceedings
of IEEE Visualization, 1999, pp. 433–436.[11] J. M. Hoekstra, R. N. H. W. van Gent, and R. C. J. Ruigrok, “Designing
for Safety: the Free Flight Air Traffic Management Concept,” Reliability
Engineering and System Safety, vol. 75, pp. 215–232, 2002.[12] R. Canton, M. Refai, W. W. Johnson, and V. Battiste, “Development and
Integration of Human-Centered Conflict Detection and Resolution Toolsfor Airborne Autonomous Operations,” in International Symposium on
Aviation Psychology, 2005, pp. 115–120.
[13] W. R. Knecht, “Testing a Multidimensional Nonveridical Aircraft Col-lision Avoidance System,” Human Factors, vol. 50, no. 4, pp. 565–575,2008.
[14] J. K. Kuchar and L. C. Yang, “A Review of Conflict Detectionand Resolution Modelling Methods,” IEEE Transactions on Intelligent
Transportation Systems, vol. 1, no. 4, pp. 179–189, 2000.
[15] R. Ghosh and C. J. Tomlin, “Maneuver Design for Multiple AircraftConflict Resolution,” in Proceedings of the American Control Confer-
ence, Chicago (IL), 2000, pp. 672–676.
[16] L. Pallottino, E. M. Feron, and A. Bicchi, “Conflict Resolution Problemsfor Air Traffic Management Systems Solved With Mixed Integer Pro-gramming,” IEEE Transactions on Intelligent Transportation Systems,vol. 3, no. 1, pp. 3–11, Mar. 2002.
[17] D. J. Wing, R. A. Vivona, and D. A. Roscoe, “Airborne Tactical Intent-Based Conflict Resolution Capability,” in 9th AIAA Aviation, Technology,
Integration, and Operations, 2009.
[18] J. M. Hoekstra, R. N. H. W. van Gent, and J. Groeneweg, “AirborneSeparation Assurance Validation With Multiple Humans-In-The-Loop,”in Proceedings of the 5th USA - Europe ATM Seminar, 2003.
[19] A. R. Pritchett, “Human-Computer Interaction in Aerospace,” in The
Human-Computer Interaction Handbook: Fundamentals, Evolving Tech-
nologies and Emerging Applications. Mahwah, NJ, USA: LawrenceErlbaum Associates, Inc., 2003, pp. 861–882.
[20] E. L. Wiener and R. E. Curry, “Flight-Deck Automation: Promises andProblems,” Ergonomics, vol. 23, no. 10, pp. 995–1011, 1980.
[21] L. Bainbridge, “Ironies of Automation,” in New Technology and Human
Error, J. Rasmussen, Ed. John Wiley and Sons, 1987.
[22] M. R. Endsley, “Automation and Situation Awareness,” in Automation
and Human Performance: Therory and Applications, R. Parasuramanand M. Mouloua, Eds. Hillsdale, NJ: Erlbaum Associates, 1996, pp.163–181.
[23] R. Parasuraman and V. Riley, “Humans and Automation: Use, Misuse,Disuse, Abuse,” Human Factors, vol. 39, no. 2, pp. 230–253, 1997.
[24] M. R. Endsley, B. Bolte, and D. G. Jones, Designing for situation
awareness: an approach to user centered design. Taylor and Francis,2003.
[25] J. M. Flach, M. Mulder, and M. M. van Paassen, “The Concept ofthe Situation in Psychology,” in A Cognitive Approach to Situation
Awareness: Theory and Application, S. P. Banbury and S. Tremblay,Eds. Ashgate, 2004, pp. 42–60.
[26] K. J. Vicente, “Ecological Interface Design: Progress and Challenges,”Human Factors, vol. 44, pp. 62–78, 2002.
[27] G. A. Jamieson, “Ecological Interface Design for Petrochemical ProcessControl: An Empirical Assessment,” IEEE Transactions on Systems,
Man, and Cybernetics, part A: Systems and Humans, vol. 37, no. 6,pp. 906–920, 2007.
[28] K. J. Vicente and J. Rasmussen, “Ecological Interface Design: Theoreti-cal Foundations,” IEEE Transactions on Systems, Man, and Cybernetics,vol. 22, no. 4, pp. 589–606, 1992.
[29] C. M. Burns and J. R. Hajdukiewicz, Ecological Interface Design. FL:Boca Raton: CRC Press LLC, 2004.
[30] J. J. Gibson, The Ecological Approach to Visual Perception. HoughtonMifflin, 1979.
[31] K. J. Vicente and J. Rasmussen, “The Ecology of Human-MachineSystems II: Mediating Direct-Perception in Complex Work Domains,”Ecological Psychology, vol. 2, no. 3, pp. 207–249, 1990.
[32] J. Rasmussen, “Skills, Rules, Knowledge; Signals, Signs, Symbols, andOther Distinctions in Human Performance Models,” IEEE Transactions
on Systems, Man, and Cybernetics, vol. 13, pp. 257–266, 1983.
[33] J. J. Gibson, “The Theory of Affordances,” Perceiving, Acting and
Knowing: Toward an Ecological Psychology, pp. 67–82, 1977.
[34] M. H. J. Amelink, M. Mulder, M. M. van Paassen, and J. M. Flach,“Theoretical Foundations for a Total Energy-Based Perspective Flight-Path Display,” The International Journal of Aviation Psychology, vol. 15,pp. 205–231, 2005.
[35] C. Borst, H. C. H. Suijkerbuijk, M. Mulder, and M. M. van Paassen,“Ecological Interface Design for Terrain Awareness,” International Jour-
nal of Aviation Psychology, vol. 16, no. 4, pp. 375–400, 2006.
[36] C. Borst, F. A. Sjer, M. Mulder, M. M. van Paassen, and J. A. Mulder,“Ecological Approach to Support Pilot Terrain Awareness After TotalEngine Failure,” Journal of Aircraft, vol. 45, no. 1, pp. 159–171, 2008.
[37] C. Borst, M. Mulder, and M. M. van Paassen, “Design and SimulatorEvaluation of an Ecological Synthetic Vision Display,” Journal of
Guidance, Control and Dynamics, vol. 33, no. 5, pp. 1577–1591, 2010.
[38] S. B. J. van Dam, M. Mulder, and M. M. van Paassen, “EcologicalInterface Design of a Tactical Airborne Separation Assistance Tool,”
13
IEEE Transactions on Systems, Man, and Cybernetics, part A: Systems
and Humans, vol. 38, no. 6, pp. 1221–1233, 2008.
[39] F. M. Heylen, S. B. J. van Dam, M. Mulder, and M. M. van Paassen,“Design and Evaluation of a Vertical Separation Assistance Display,”in AIAA Guidance, Navigation, and Control Conference and Exhibit,Honolulu (HI), 2008.
[40] J. Rasmussen, “The Role of Hierarchical Knowledge Representationin Decision Making and System Management,” IEEE Transactions on
Systems, Man, and Cybernetics, vol. 15, no. 2, pp. 234–243, 1985.
[41] G. Lintern, T. Waite, and D. A. Talleur, “Functional Interface Designfor the Modern Aircraft Cockpit,” The International Journal of Aviation
Psychology, vol. 9, no. 3, pp. 225–240, 1999.
[42] M. M. van Paassen, “Functions of Space and Travellers,” in Proceedings
of 18th European Annual Conference on Human Decision Making and
Manual Control. Faculty of Aerospace Engineering, Delft Universityof Technology, 1999.
[43] Radio Technical Commission for Aeronautics, “Airborne Conflict Man-agement: Application Description V2.5,” Federal Aviation Authorities,Tech. Rep. RTCA SC-186, 2002.
[44] A. M. Bisantz and K. J. Vicente, “Making the Abstraction HierarchyConcrete,” International Journal of Human-Computer Studies, vol. 40,pp. 83–117, 1994.
[45] M. M. van Paassen, M. H. J. Amelink, C. Borst, S. B. J. van Dam,and M. Mulder, “The Chicken, the Egg, the Workspace Analysis,and the Ecological Interface,” in International Symposium on Aviation
Psychology. Dayton, USA: Faculty of Aerospace Engineering, DelftUniversity of Technology, 2007.
[46] Federal Aviation Administration and Eurocontrol, “Principles of Oper-ation for the Use of Airborne Separation Assurance Systems,” FederalAviation Authorities - Eurocontrol, Tech. Rep. PO-ASAS-V7.1, 2001.
[47] S. B. J. van Dam, M. Mulder, and M. M. van Paassen, “The Use ofIntent Information in an Airborne Self-Separation Assistance DisplayDesign,” in AIAA Guidance, Navigation, and Control Conference and
Exhibit, 2009.
[48] Radio Technical Commission for Aeronautics, “Minimal OperationalPerformance Standards for Traffic Alert and Collision Avoidance System2 (TCAS2) Airborne Equipment,” Federal Aviation Authorities, Tech.Rep., 2002.
[49] ——, “Final Report of the RTCA Board of Directors’ Select Committeeon Free Flight,” RTCA, Tech. Rep., 1995.
[50] J. M. Hoekstra, “Designing for Safety: The Free Flight Air Traffic Man-agement Concept,” Ph.D. dissertation, Delft University of Technology,The Netherlands, 2001.
[51] C. D. Wickens, “The When and How of Using 2-D and 3-D Displaysfor Operational Tasks,” in Proceedings of the Human Factors and
Ergonomics Society, 2000, pp. 403–406.
[52] A. L. Alexander, C. D. Wickens, and D. H. Merwin, “Perspective andCoplanar Cockpit Displays of Traffic Information: Implications for Ma-neuver Choice, Flight Safety, and Mental Workload,” The International
Journal of Aviation Psychology, vol. 15, pp. 1–21, 2005.
[53] M. W. McGreevy and S. R. Ellis, “The Effect of Perspective Geom-etry on Judged Direction in Spatial Information Instruments,” Human
Factors, vol. 28, no. 4, pp. 439–456, 1986.
[54] M. L. Bolton and E. J. Bass, “Using Relative Position and TemporalJudgments to Identify Biases in Spatial Awareness for Synthetic VisionSystems,” The International Journal of Aviation Psychology, vol. 18,no. 2, pp. 183–206, 2008.
[55] R. Appleton, M. Mulder, and M. M. van Paassen, “Comparison ofTwo Interfaces for Supporting Pilots in Airborne Self-Separation Tasks,”in AIAA Guidance, Navigation, and Control Conference and Exhibit.Keystone (CO), USA: AIAA, 2006.
[56] S. N. Roscoe, L. Corl, and R. S. Jensen, “Flight Display DynamicsRevisited,” Human Factors, vol. 23, no. 3, pp. 341–353, Jun. 1981.
[57] D. J. Gates, E. A. Gates, M. Westcott, and N. L. Fulton, “StereoProjections of Miss Distance in Some New Cockpit Display Formats,”Journal of Aircraft, vol. 45, no. 5, pp. 1725–1735, 2008.
[58] R. A. Paielli, “Modeling Maneuver Dynamics in Air Traffic ConflictResolution,” Journal of Guidance Control and Dynamics, vol. 26, no. 3,pp. 407–415, May 2003.
[59] S. B. J. van Dam, M. Mulder, and M. M. van Paassen, “AirborneSelf-Separation Display with Turn Dynamics and Intruder Intent-Information,” in IEEE International Conference on Systems, Man and
Cybernetics. Montreal, Canada: IEEE, 2007.
[60] M. R. Endsley, “Toward a Theory of Situation Awareness in DynamicSystems,” Human Factors, vol. 37, no. 1, pp. 32–64, 1995.
[61] K. Christoffersen, C. N. Hunter, and K. J. Vicente, “A LongitudinalStudy of the Effects of Ecological Interface Design on Deep Knowl-edge,” International Journal of Human-Computer Studies, vol. 48, pp.729–762, 1998.
Joost Ellerbroek received the M.Sc. degree inaerospace engineering from the Delft University ofTechnology, Delft, The Netherlands, in 2007, wherehe is currently working toward the Ph.D. degree. HisPh.D. work concentrates on the design and validationof an interface that supports interaction with airborneseparation automation. The research presented in thispaper is part of his thesis.
Mark Visser received the M.Sc. degree (cum laude)in aerospace engineering from the Delft Universityof Technology, Delft, The Netherlands, in 2009. Hismain interests are interface design, human-machineinteraction and air traffic management. He graduatedwithin the control and simulation division on histhesis entitled “Analysis and Design of a Four-Dimensional Separation Assistance Interface”. Theresults of his work are incorporated in this paper.
Stijn B. J. van Dam received the M.Sc. degree inaerospace engineering from the Delft University ofTechnology, Delft, The Netherlands, in 2004. He iscurrently working toward obtaining the Ph.D. de-gree. His Ph.D. work concentrates on the design andvalidation of an ecological self-separation assistancedisplay in cruise flight. His research includes thedesign of ecological human-machine interfaces thatsupport for vehicle control and traffic managementin the aviation and maritime domains.
Max Mulder received the M.Sc. and Ph.D. degrees(cum laude) in aerospace engineering from the DelftUniversity of Technology, Delft, The Netherlands,in 1992 and 1999, respectively, for his work onthe cybernetics of tunnel-in-the-sky displays. He iscurrently Full Professor and Head of the Control andSimulation Division, Faculty of Aerospace Engineer-ing, Delft University of Technology. His researchinterests include cybernetics and its use in modelinghuman perception and performance, and cognitivesystems engineering and its application in the design
of “ecological” human-machine interfaces.
14
Rene M. M. van Paassen received the M.Sc.degree (cum laude) from the Delft University ofTechnology, Delft, The Netherlands, in 1988, wherehe also received the Ph.D. degree in 1994, with athesis about a neuromuscular system of the pilotsarm, for studying manual control of aircraft.
After this, he spent two years as a Brite/EuRamResearch Fellow with the University of Kassel,Kassel, Germany, with Prof. Johannsen, where heworked on the development of alternative interfacesfor process control based on functional models of the
process. During a subsequent stay with the Technical University of Denmark,he put the practical experience gained in Kassel to use in theoretical workon multilevel flow modeling. Currently, he is with the Faculty of AerospaceEngineering, Delft University of Technology, working on aircraft simulationand human-machine interaction.