Design of a Low-Cost Configurable Acoustic Sensor for the ...
20
electronics Article Design of a Low-Cost Configurable Acoustic Sensor for the Rapid Development of Sound Recognition Applications Rosa Maria Alsina-Pagès * , Marcos Hervás , Leticia Duboc and Jordi Carbassa GTM—Grup de recerca en Tecnologies Mèdia, La Salle—Universitat Ramon Llull, c/Quatre Camins, 30, 08022 Barcelona, Spain; [email protected] (M.H.); [email protected] (L.D.); [email protected] (J.C.) * Correspondence: [email protected]; Tel.: +34-932902455 Received: 14 June 2020; Accepted: 12 July 2020; Published: 17 July 2020 Abstract: Concerned about the noise pollution in urban environments, the European Commission (EC) has created an Environmental Noise Directive 2002/49/EC (END) requiring Member states to publish noise maps and noise management plans every five years for cities with a high density of inhabitants, major roads, railways and airports. The END also requires the noise pressure levels for these sources to be presented independently. Currently, data measurements and the representations of the noise pressure levels in such maps are performed semi-manually by experts. This process is time and cost consuming, as well as limited to presenting only a static picture of the noise levels. To overcome these issues, we propose the deployment of Wireless Acoustic Sensor Networks with several nodes in urban environments that can enable the generation of real-time noise level maps, as well as detect the source of the sound thanks to machine learning algorithms. In this paper, we briefly review the state of the art of the hardware used in wireless acoustic applications and propose a low-cost sensor based on an ARM cortex-A microprocessor. This node is able to process machine learning algorithms for sound source detection in-situ, allowing the deployment of highly scalable sound identification systems. Keywords: acoustic sensor; noise source classification; sound monitoring; rapid development; re-configurable; low-cost sensor; WASN 1. Introduction The number of people living in urban areas has been greater than in rural areas since 2010; with around 50.5% of the world’s population residing in towns or cities [1]. Moreover, according to the United Nations (UN), this tendency is expected to increase in the next four decades [1,2]. In order to cope with this growth, the authorities of major cities envision an evolution towards smart cities or smart regions [3,4], with a focus on improving the quality of life of urban inhabitants. Doing so requires significant changes in governance, decision-making and the development of action plans [5]. The smart city concept encompass several quality of life and health indicators; among them, the availability of digital services and the acoustic pollution [6]. The later is justified by large-scale studies in Europe that revealed severe adverse effects on the health and the life expectancy of the inhabitants of acoustically polluted environments [7,8]. In order to address these issues, the European Commission have created the Environmental Noise Directive 2002/49/EC (END) [9], in force since December 2018, and the Common Noise Assessment Methods in Europe (CNOSSOS-EU) [10]. They define, respectively, the obligations of Member States regarding the management of urban noise and common methods that they are expected to follow. In particular, the END requires Member Electronics 2020, 9, 1155; doi:10.3390/electronics9071155 www.mdpi.com/journal/electronics
-
Upload
khangminh22 -
Category
Documents
-
view
5 -
download
0
Transcript of Design of a Low-Cost Configurable Acoustic Sensor for the ...
electronics
Article
Design of a Low-Cost Configurable Acoustic Sensorfor the Rapid Development of SoundRecognition Applications
Rosa Maria Alsina-Pagès * , Marcos Hervás , Leticia Duboc and Jordi Carbassa
GTM—Grup de recerca en Tecnologies Mèdia, La Salle—Universitat Ramon Llull, c/Quatre Camins, 30,08022 Barcelona, Spain; [email protected] (M.H.); [email protected] (L.D.);[email protected] (J.C.)* Correspondence: [email protected]; Tel.: +34-932902455
Received: 14 June 2020; Accepted: 12 July 2020; Published: 17 July 2020�����������������
Abstract: Concerned about the noise pollution in urban environments, the European Commission(EC) has created an Environmental Noise Directive 2002/49/EC (END) requiring Member states topublish noise maps and noise management plans every five years for cities with a high density ofinhabitants, major roads, railways and airports. The END also requires the noise pressure levels forthese sources to be presented independently. Currently, data measurements and the representationsof the noise pressure levels in such maps are performed semi-manually by experts. This process istime and cost consuming, as well as limited to presenting only a static picture of the noise levels.To overcome these issues, we propose the deployment of Wireless Acoustic Sensor Networks withseveral nodes in urban environments that can enable the generation of real-time noise level maps,as well as detect the source of the sound thanks to machine learning algorithms. In this paper,we briefly review the state of the art of the hardware used in wireless acoustic applications andpropose a low-cost sensor based on an ARM cortex-A microprocessor. This node is able to processmachine learning algorithms for sound source detection in-situ, allowing the deployment of highlyscalable sound identification systems.
Keywords: acoustic sensor; noise source classification; sound monitoring; rapid development;re-configurable; low-cost sensor; WASN
1. Introduction
The number of people living in urban areas has been greater than in rural areas since 2010;with around 50.5% of the world’s population residing in towns or cities [1]. Moreover, according tothe United Nations (UN), this tendency is expected to increase in the next four decades [1,2]. In orderto cope with this growth, the authorities of major cities envision an evolution towards smart citiesor smart regions [3,4], with a focus on improving the quality of life of urban inhabitants. Doing sorequires significant changes in governance, decision-making and the development of action plans [5].
The smart city concept encompass several quality of life and health indicators; among them,the availability of digital services and the acoustic pollution [6]. The later is justified by large-scalestudies in Europe that revealed severe adverse effects on the health and the life expectancy of theinhabitants of acoustically polluted environments [7,8]. In order to address these issues, the EuropeanCommission have created the Environmental Noise Directive 2002/49/EC (END) [9], in force sinceDecember 2018, and the Common Noise Assessment Methods in Europe (CNOSSOS-EU) [10].They define, respectively, the obligations of Member States regarding the management of urbannoise and common methods that they are expected to follow. In particular, the END requires Member
Electronics 2020, 9, 1155; doi:10.3390/electronics9071155 www.mdpi.com/journal/electronics

Electronics 2020, 9, 1155 2 of 20
States to publish noise maps and noise management plans every five years for agglomeration of morethan 100,000 inhabitants and major roads, railways and airports. The directive, supported by the lastreports from the World Health Organization (WHO) [11], also determines that separate strategic mapsare created for road-traffic [12–14], rail-traffic [15,16], aircraft and industrial noise [17,18], showing theacoustic pressure levels of these noise sources alone. Currently, such maps are created using standardsemi-manual, expert-based procedures, which is not only time and cost consuming, but also primarilyprovide a static picture of noise levels.
The emergence of Wireless Acoustic Sensor Networks (WASNs) represents a paradigm shift inthe way the END regulatory requirements can be addressed, by enabling the generation of real-timedynamic noise maps. The difficulty with automatic map updating is that most acoustic sensors inWASNs can only measure the A-weighted equivalent noise level LAeq, without determining the sourceof the sound. Therefore, the resulting map may represent a mix of the noise sources (traffic, airplanes,people, construction works, etc.) present in the acoustic environment, not fulfilling the requirementsof the END [9], which requires a distinction of the noise source. Moreover, as shown by severalprojects developed in Europe and in America over the last years, authorities are starting to ask for thedistinction of noise sources, so that they can design more effective policies [11]. For example, in theSENSEable PISA project [19,20], authorities are not only interested in the acoustic pressure levels ofnoise, but also in distinguishing their sources to determine the relationships between certain types ofnoise and their health effects. The DYNAMAP project [21,22] also requires the distinction betweenroad traffic noise and any other kinds of noise (named Anomalous Noise Events—ANE) in orderto build real-time traffic noise maps. Finally, the Sounds of New York Project (SONYC) have alsogathered huge amounts of acoustic data from the city of New York to classify the ten most frequenttypes of noise across the city [23].
Nevertheless, most WASNs deployed in smart cities are being under-exploited. They are usuallyunable to extract all the information that urban sounds carry because their sensors cannot address morecomputations than the LAeq value calculation with a variable time span. To address this limitation,we have developed SmartSound, an acoustic event detection algorithm that can be trained, testedand deployed rapidly in a low-cost acoustic sensor designed for that purpose. SmartSound can beembedded on acoustic sensors to create truly Smart WASNs that can separate and accurately measurethe different types of sounds in a city. These networks can be deployed permanently across the cityor even temporarily in places of interest, creating unprecedented value to city administrators andbusinesses. The former can take advantage of dynamic noise maps to manage the city and to providecitizen with precise, up-to-date information on environmental noise. The later can create innovativeservices and products. For example, a high-end real estate agency may want to offer, as an addedvalue to its customers, a characterization of the sound landscape around the properties in its catalogue.The first prototype deployed of SmartSound technology was applied successfully to the two pilotareas of the DYNAMAP project [21], the urban area of Milan [24] and the suburban area of Rome [25].In that situation, the SmartSound technology was adapted to apply a binary classification betweenthe sounds belonging to Road Traffic Noise (RTN) and all the other sound sources, called AnomalousNoise Events (ANE) [26], but SmartSound can also support multiclass classifiers [27].
This paper describes the design of a configurable low-cost acoustic sensor to enable the creationof Smart WASNs and the rapid development of sound identification solutions that take advantageof these networks. Most of the previously described initiatives mainly evaluate the LAeq, and someof them also include the detection of a certain type of events. Our goal is to widen this scope andimprove the design stage of any WASN with any final noise source detection requirement. For thispurpose, and in order to identify the sources of sound, the sensor proposal supports sound captureand real-time processing of acoustic data, WIFI and 3G connectivity, as well as integration with Sentilo(an Internet of Things -IoT- platform) and SmartSense (an internal R&D platform for the developmentof rapid prototypes of the SmartSound technology). The later allows on-the-fly configuration of the
Electronics 2020, 9, 1155 3 of 20
sensor’s sampling frequency and data precision, of processing algorithms, and the choice to whetherto receive samples of audio files with variable length.
This paper is structured as follows: Section 2 briefly describes the context of this developmentand the state of the art of acoustic urban sensing projects. Section 3 explains the proposed architecturefor a Smart WASN and lists the system requirements. Section 4 describes the elements that make upthe sensor. Finally, Section 5 discusses the implications of our design and concludes the paper.
2. Background and Related Work
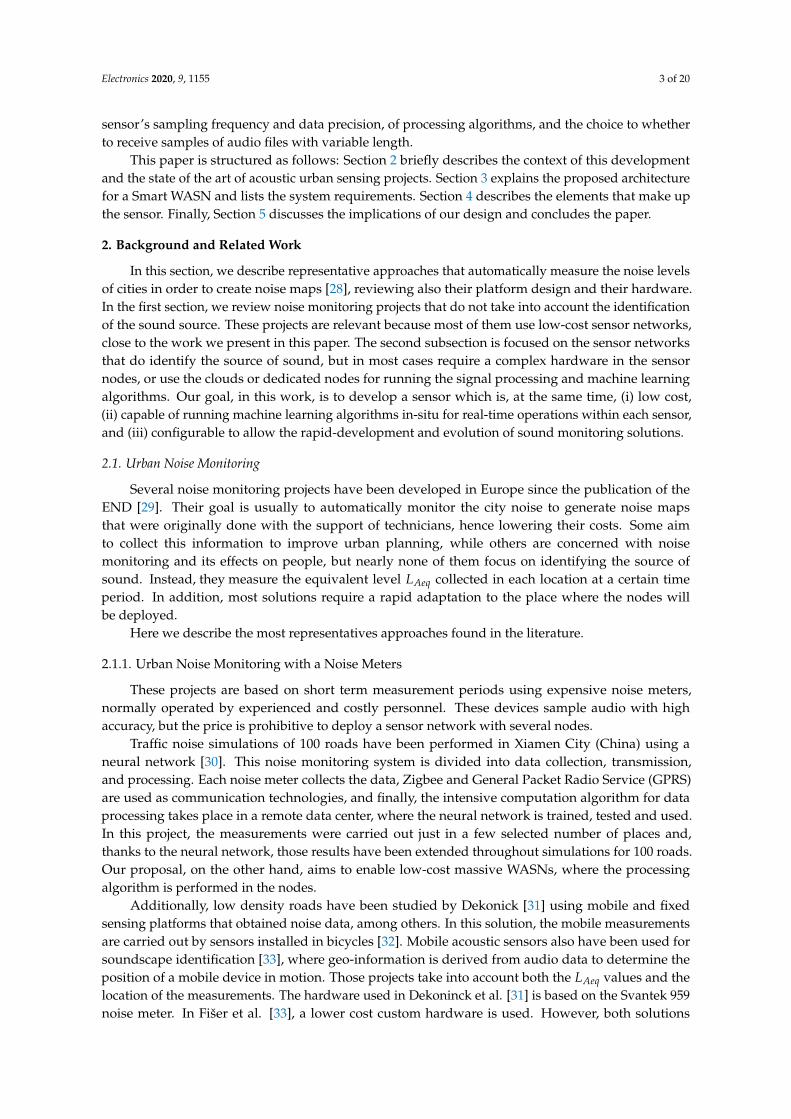
In this section, we describe representative approaches that automatically measure the noise levelsof cities in order to create noise maps [28], reviewing also their platform design and their hardware.In the first section, we review noise monitoring projects that do not take into account the identificationof the sound source. These projects are relevant because most of them use low-cost sensor networks,close to the work we present in this paper. The second subsection is focused on the sensor networksthat do identify the source of sound, but in most cases require a complex hardware in the sensornodes, or use the clouds or dedicated nodes for running the signal processing and machine learningalgorithms. Our goal, in this work, is to develop a sensor which is, at the same time, (i) low cost,(ii) capable of running machine learning algorithms in-situ for real-time operations within each sensor,and (iii) configurable to allow the rapid-development and evolution of sound monitoring solutions.
2.1. Urban Noise Monitoring
Several noise monitoring projects have been developed in Europe since the publication of theEND [29]. Their goal is usually to automatically monitor the city noise to generate noise mapsthat were originally done with the support of technicians, hence lowering their costs. Some aimto collect this information to improve urban planning, while others are concerned with noisemonitoring and its effects on people, but nearly none of them focus on identifying the source ofsound. Instead, they measure the equivalent level LAeq collected in each location at a certain timeperiod. In addition, most solutions require a rapid adaptation to the place where the nodes willbe deployed.
Here we describe the most representatives approaches found in the literature.
2.1.1. Urban Noise Monitoring with a Noise Meters
These projects are based on short term measurement periods using expensive noise meters,normally operated by experienced and costly personnel. These devices sample audio with highaccuracy, but the price is prohibitive to deploy a sensor network with several nodes.
Traffic noise simulations of 100 roads have been performed in Xiamen City (China) using aneural network [30]. This noise monitoring system is divided into data collection, transmission,and processing. Each noise meter collects the data, Zigbee and General Packet Radio Service (GPRS)are used as communication technologies, and finally, the intensive computation algorithm for dataprocessing takes place in a remote data center, where the neural network is trained, tested and used.In this project, the measurements were carried out just in a few selected number of places and,thanks to the neural network, those results have been extended throughout simulations for 100 roads.Our proposal, on the other hand, aims to enable low-cost massive WASNs, where the processingalgorithm is performed in the nodes.
Additionally, low density roads have been studied by Dekonick [31] using mobile and fixedsensing platforms that obtained noise data, among others. In this solution, the mobile measurementsare carried out by sensors installed in bicycles [32]. Mobile acoustic sensors also have been used forsoundscape identification [33], where geo-information is derived from audio data to determine theposition of a mobile device in motion. Those projects take into account both the LAeq values and thelocation of the measurements. The hardware used in Dekoninck et al. [31] is based on the Svantek 959noise meter. In Fišer et al. [33], a lower cost custom hardware is used. However, both solutions

Electronics 2020, 9, 1155 4 of 20
are more expensive than our proposal, making them prohibitively to deploy across networks with amassive number of nodes. Moreover, the mobile systems are also limited by the battery life since themeasurement nodes are mobile.
2.1.2. WASNs for Urban Noise Monitoring
These projects use a low-capacity single board with a low-cost sound card and microphones.These solutions have the lower cost amongst the other noise measurement projects. However, they arelimited to data acquisition, simple equivalent level calculations at a certain time span (such asthe computation of the LAeq), and/or transmission of the results to a remote server due to its lowprocessing capabilities.
Filipponi et al. [34] evaluated what is the most suitable wireless protocol to communicate thenodes in noise monitoring applications in terms of power consumption. In this work, the powerconsumption are measured in the wireless devices, which are the Tmote Sky [35] (a prototypingplatform with a cost of 77e) and the Tmote Invent (a platform from Moteiv Corp). Tmote Sky andTmote Invent are ultra low power wireless modules for use in sensor networks, monitoring applications,and rapid application prototyping. They are based on a low power 8 MHz Texas Instruments’ MSP430microcontroller, provided with several peripherals such as ADCs, DACs and sensors. These modulesare suitable to deploy a WASN to sense and transmit information, but their processing capacity is low;hence they cannot process a sound recognition algorithm in situ nor transmit the RAW audio data of aWASN with a high number of sensors.
The IDEA (Intelligent Distributed Environmental Assessment) project presents a WASNbased on cheap consumer electronic nodes and a high performance server. More concretely,Botteldooren et al. [36] depicts a new wireless infrastructure for sound recognition networks in urbanapplications. Within the same project context, Domínguez et al. [37] presents an active self-testingsystem to validate the microphones of the nodes, which have a cost of 50e. Finally, Bell andGalatioto [38] describes a WASN of 50 nodes, where the LAeq is obtained in the node and is transmittedto the remote server to be further processed. The hardware used is a custom mote, which is a low-costsensor based on a simple microcontroller for low capacity processing.
2.2. WASNs with Sound Source Detection
This section summarizes the main hardware platforms in the scientific literature that includessound source detection. They aim to evaluate the equivalent level Leq, with some sensors alsoincorporating machine learning algorithms for filtering the results (while others run such algorithmsin the cloud). Some of these projects also require a high-cost sensor design to compute the requiredalgorithms. Our proposal focuses not only in the real-time acoustic features evaluation, but also in thesound source identification locally within a low-cost flexible sensor.
Paulo et al. [39] built a low-cost monitoring system to analyze the urban sound environment.This system identifies and detects events, as well as the direction of the source of these sounds.The system is based on the FIWARE platform, which is an open initiative for creating an environmentfor the wave of digitization brought by recent internet technologies. The main processing unit usedin this work is the Intel Edison embedded system [40], which costs around 90e, and requires afour-microphone structure. The FI-Sonic project [41] has processed and analyzed audio signals alsousing a WASN based on the FIWARE platform. This project aims to deploy low-cost technologiesto capture sound with Class I microphones and the direction of the source with accelerometers,interconnecting the WASN with other stakeholders in the Smart City. This system seeks to processthe audio in-situ and transmit the results remotely to the cloud, but the cost of the Edison platform ismuch higher than our proposal, as it will be explained in Section 4.6, where only the microprocessorplatform costs about 90e and other expensive components should be added, such as microphone,3G module, power supply unit, etc.

Electronics 2020, 9, 1155 5 of 20
The SONYC (Sounds Of New York City) [42] project monitors and describes the urban acousticenvironment of New York City. It implements a smart, low-cost, static acoustic sensing network basedon several consumer hardware (e.g., mini-PC devices and Microelectromechanical systems (MEMS)microphones), working at a sampling frequency of 44.1 kHz using 16 bit audio data. More concretely,the core of its platform [43] is the single board Tronsmart MK908ii mini PC, which was priced at50 USD on August 2015. With a 1.6 GHz quad core processor, 2 GB of RAM, 8 GB flash storage,USB I/O, and Wi-Fi connectivity, this platform could allow complex processing of digital signal onthe devices, alleviating the need to transmit large amounts of audio data for centralized processing.These acoustic sensor nodes can be deployed in varied urban locations for a long period of time inorder to collect longitudinal urban acoustic data for changing policies and developing action plans;also in the same project, Bello et al. [23] developed a representative dataset with data gathered from the56 sensors deployed in different neighbourhoods of New York, identifying the ten different commonurban sound sources that were highly frequent in areas with urban noise complaints. Nevertheless,in the SONYC project, sensors do not identify the source of the sounds in real-time and in-situ; insteadthis work is conducted off-line in the central servers of the project. The algorithms are trained usingthe Urbansound dataset, which was created by artificially mixing the events coming from Freesoundwith the background noise collected in the project [44]. The use of consumer platforms reduces thetime and cost of development, but constraints the connectivity only to USB subsystems such as soundacquisition (microphones) or GPRS and WIFI communications, which increases the total cost of theplatform, possibly making it prohibitive when the number of sensors in the network is very high.
Achieving a good trade-off between cost and accuracy is also the core idea of the WASN designedin the DYNAMAP project [21,45], which identifies the sound sources in the sensor by means ofthe ANED algorithm [26]. However, it only distinguishes between road traffic noise and any otherAnomalous Noise Events (ANEs). This project deployed pilot WASNs in the Italian cities of Rome [25]and Milan [24] to evaluate the noise impact of road infrastructures in suburban and urban areas,respectively. The WASNs deployed in DYNAMAP are hybrid, combining two types of sensors [45]:(i) High-capacity ARM-based sensors that use signal processing techniques to analyze and processthe acoustic signals within the nodes, and (ii) low-capacity µController (µC)-based sensors, whichdespite less computational capabilities maximize the coverage of the network, as their solar panelsallow for greater flexibility in terms of sensor positioning. Our approach differs as it proposes low-costsensor nodes with enough computational capacity to run improved machine learning algorithms fora more accurate detection of the sound source in each situation under test. While the low-capacityµC is the lower cost solution, it is not able to process the sound recognition algorithms used in oursolution. On the other hand, while the high capacity sensors in DYNAMAP are able to process thesound recognition algorithm with a similar cost, the time to market and the cost of the custom platformdevelopment is much higher than in our proposal, which takes advantage of custom subsystemsto build the sensor, which in terms of hardware, simply connect a Raspberry Pi with peripherals.The development of a custom hardware requires a huge effort in terms of human resources and timeto design the schematics, the printed circuit boards (PCB), testing and validating the system, whichincreases the time to market and the cost.
3. System Description
In this section, we define the architecture for a smart WASN; that is, a WASN capable of identifyingthe source of noise events and, consequently, providing an more accurate measurement of the differentnoise types. In order to make the WASN scalable, we designed it as a distributed intelligent system inwhich smart acoustic sensors (i) capture the audio, (ii) process the audio frames to obtain the labelof the noise event using a machine learning algorithms, and (iii) send this information to a remoteserver. The transmitted data are the acoustic pressure level (Leq), the label of the acoustic event, and itstimestamp. Finally, the output of this processing is plotted with Sentilo, an IoT platform that we usefor representing the audio information on the different locations.

Electronics 2020, 9, 1155 6 of 20
3.1. Description of the WASN Architecture
The aforementioned system is made up of two elements: (i) The wireless acoustic sensors and(ii) the remote server, shown in Figure 1. The sensors run the SmartSound technology, which is a set ofdata intensive algorithms for processing audio frames and for classifying noise events (see Section 3.2);while the remote server stores the Leq and output of these processing algorithms, as well as allows theremote configuration of the sensors through the SmartSense platform, which is a research tool for therapid development of sensor-based solutions (see Section 3.3).
Distributing the intelligence for noise source identification among sensors, allows us to deploy aWASN of any number of nodes. Moreover, it lowers the requirements on the wireless network andenhances privacy because this system only sends the label and the Leq of the recorded audio frame everysecond, instead of sending the acoustic RAW data at 48 ksps. This architecture, therefore, requiresthe smart acoustic sensors to have sufficient computing capability to process all this information.In order to evaluate the trade-off between performance and cost to design such a sensor, we carriedout a comparison of the computing platforms in embedded systems. This comparison is detailed inSection 4.
Classifier.py
Raspberry pi
Python_stream.py
Structure of Data
AC/DC Converter
Microphone
AC Connector
5V
230V ACPowerAudioDigital DataRF
Legend
3G Module Raspberry Pi 3
I2S Peripheral
Adafruit Microphone I2S
Structure of Data
Pyaudio .wav Wave Pickle
Pickle
Structure of Data
Numpy
Sentinelo.py
SocketUART
Sentinel
Adafruit Fona
Remote ServersUrban Area
Smart Wireless Audio Sensor running the SmartSound technology
Remote Server with Sentilo and the SmartSense platform
3G
WIFI
Classifier.py
Raspberry pi
Python_stream.py
I2S Peripheral
Adafruit Microphone I2SPyaudio Config.dat
Numpy
Sentilo.py
REST APIUART
Adafruit FONA 3G
3G
Socket
WIFI
WIFI
Sentilo
Figure 1. Elements of the Wireless Acoustic Sensor Network (WASN) architecture to capture the audio,process it and send it to a remote server for monitoring the soundscape of an urban area.
3.2. The SmartSound Technology
The SmartSound technology is a sound recognition system that listens to an audio stream anduses signal processing and machine learning algorithms to identify, for each acoustic event, its typeand absolute measurements. Figure 2 represents how SmartSound can be embedded in sensors atstrategic points within the cities and send information to servers for various purposes.
The technology is based on supervised learning, which consists of two main processes, as shownin Figure 3: (i) Signal feature extraction, and (ii) noise event identification. The signal feature extractionprocess obtains a features set representing the acoustic characteristics of the noise signal. Subsequently,a feature vector is computed upon each frame, thus obtaining a compact representation of the signal.Then a supervised learning system is trained with multiple samples of noise events recorded in thereal environment. As a result of this training process, the system is capable of distinguishing betweendifferent types of Anonymous Noise Events (ANE), thus being able to label new incoming noisesamples as belonging to different noise sources. Examples of ANEs are the sound of people, car,motorcycle, bell, etc.

Electronics 2020, 9, 1155 7 of 20
Figure 2. SmartSound performing on a Smart WASN.
Figure 3. SmartSound on a WASN node.
3.3. The SmartSense Platform
The SmartSense platform is a research and development tool used by the Research Group on MediaTechnology (GTM) of La Salle, University Ramon Llull. The platform allows the rapid developmentof proofs-of-concept of the SmartSound technology. It enables the GTM researchers to develop thecore of distinct applications by combining pre-programmed signal processing and machine learningalgorithms and to deploy them in remote sensors. While these applications are intended to carry out theprocessing entirely within the sensor (for privacy and bandwidth reasons), during their development,researchers may choose to receive samples of audio data of varied sizes when certain ANEs aredetected to double check the classification of the noise events. Finally, the researchers can use theplatform to remotely configure several options on the sensor, as explained in Section 3.4.

Electronics 2020, 9, 1155 8 of 20
3.4. Sensor Requirements
To handle all features described above, the smart acoustic sensor must fulfill the followingrequirements:
• Price: For some time, accurate acoustic sensors based on noise meter commonly found in WASNscost thousands of euros, see class/type 1 and 2 microphones on Section 4.2. Such high costs limitthe number of nodes and, consequently, the coverage of of the network that city administratorscan deploy. We envision smart WASNs deployed permanently across the entire city, as well astemporarily in points of interest by both by the public administration and private businesses.Therefore, low-cost is an essential requirement of our sensor.
• Processing capacity: The sensor should be able to run the SmartSound technology to identify thesource of noise events by processing an audio stream in real-time.
• Storage capacity: The storage requirement is negligible due to the fact that, for privacy, the audiois deleted as soon as it is processed and the label is obtained. This requires very little storage.
• Microphone: The sensor should be able to analyse raw audio signal and identify the sources ofnoise that are audible to human ear. Therefore, it should ideally support an operating frequencyin the range of 20 Hz to 20 kHz.
• Power Supply: We assume that the services to be developed by our research group based onWASNs are not critical and that sensors will be located in strategic places with Alternate Current(AC) power supply from the city, such as light posts and buildings facades. Therefore, for thisfirst version of the sensor does not require battery for a power backup system.
• Wireless communications: The sensor should be able to send the results of the processing toa server and to an IoT platform for visualization; as well as allow on-the-fly configuration ofparameters and the replacement of processing algorithms. For such, both WIFI and 3G shouldbe supported.
• Outdoors exposure: The device has to operate outdoors for long periods of time during whichit will be exposed to winds and rains. Therefore, it requires effective protection against adverseatmospheric conditions.
• Re-configurable: The researchers can configure the sampling frequency (up to 48kHz) and the dataprecision of the sensor (16 or 32 bits per sample), replace processing algorithms on-the-fly andrequest audio samples of varied sizes when ANEs of interest are detected. These configurationswill be adjusted to develop and test the proof-of-concept applications.
4. Smart Acoustic Sensor Design
This section describes the elements that make up the smart acoustic sensor. We report thehardware components used, and finally, we also briefly describe the main characteristics of thedeveloped software.
4.1. Computing Platform
Nowadays, an embedded system’s core can be based on microcontrollers, microprocessors,Field Programmable Gate Arrays (FPGAs), Digital Signal Processors (DSPs) and Application-SpecificIntegrated Circuits (ASICs) [46] or even High Performance Computing (HPC) devices, such as GPUs.
Embedded systems are mostly based on ARM architectures, which implements threedifferent versions: (i) Cortex-A—application processor cores for a performance-intensive systems,(ii) Cortex-R—high-performance cores for real-time applications and (iii) Cortex-M—microcontrollercores for a wide range of embedded applications.
Table 1 shows some computing platforms used in the literature, some of which are presented inSection 2. We can observe that several different architectures have been used, such as a proprietary 8or 16 bit Reduced Instruction Set Computer (RISC), an ARM cortex-M, an ARM cortex-A and a 32-bit×86, depending on the final application or systems requirements.

Electronics 2020, 9, 1155 9 of 20
Table 1. Available platforms in the literature.
Platform Architecture Manufacturer Model Frequency Features Price(CORE) (MHz) (e)
Tmote Sky [34] 16-bit RISC TI MSP430F1611 48 TinyOS 2.x & ContikiOS 77Waspmote 8-bit RISC Atmel ATmega1281 14.74 16xWireless tech., SD Card 228Mica2 mote [47] 8-bit RISC Atmel Atmega128L 8–16 ISM Bands -MicaZ [48] 8-bit RISC Atmel Atmega128L 8–16 IEEE 802.15.4 -PC Engines ALIX 3d3 [37] x86 AMD Geode LX800 500 Linux, Windows XP 83Raspberry Pi [48] ARM11 (Cortex-A) Broadcom BCM2835 700 Ethernet, SD Card, Linux 24RFD22301 [49] ARM Cortex-M0 RFDigital R25 16 BLE Module 17BMD-200 (Rigado) [49] ARM Cortex-M0 Nordic Semi. nRF51822 16 BLE Module 16Spark Core [49] ARM Cortex-M3 ST STM32F103x8 72 WiFi 34
An Operating System (OS) such as linux would allow a much easier approach to implementthe aforementioned requirements. For this reason, we have chosen a low-cost embedded platformthat allows us to run a linux distribution OS with all the drivers required to control the hardwarementioned above.
A Raspberry Pi 3, supplied with a 1.2 GHz 64-bit quad-core ARM Cortex-A53 CPU, has beenchosen because it is a commonly used platform for low cost applications, as it has a cost ofapproximately 30e. It has been increasingly used in the last years by researchers, universities andamateur engineers; all this community behind it are creating and documenting device drivers, tutorials,examples of applications, etc. Moreover, the Raspberry Pi 3 matches our requirements becausethis platform is distributed with a Bluetooth Low Energy (BLE) and a WiFi modules for wirelesscommunications.
4.2. Microphone
The acquisition circuit and the microphone compose the acoustic acquisition data subsystem.Usually, the selection criteria for microphones are frequency range, with flat frequency responseand high sensitivity. In fact, IEC 61672 defines two classes of sound level meters according to thetightness of the error tolerances, where class 1 microphones have a wider frequency range with lesserror tolerance than class 2 (see Table 2). This applies to the measurement instruments and also tothe calibrator.
Table 2. Tolerances of error (in dB) for classes 1 and 2 which are frequency dependant.
Frequency Band 16 Hz 20 Hz 1000 Hz 10,000 Hz 16,000 Hz
Class 1 2.5, −4.5 ±2.5 ±1.1 2.6, −3.6 3.5, −17Class 2 5.5, −Inf. ±3.5 ±1.4 5.6, −Inf. 6, −Inf.
However, we also have to take into consideration the trade-off between performance and cost,since keeping the cost low is one of our main requirements.
Table 3 shows some acoustic acquisition systems found in the literature. This table containslow-cost microphone capsules, high-performance microphone capsules, embedded microphones withpre-amplifiers and embedded microphones with pre-amplifiers and an outdoor kit, respectively.

Electronics 2020, 9, 1155 10 of 20
Table 3. A list of some commercial microphones found in the literature. This list is made of capsules,whole microphones, microphones with an outdoor kit and microphones with an outdoor kit andoutdoor case.
ID Type Microphone Sensitivity Frequency Price(dBre 1V Pa−1) Range (e)
Adafruit I2S MEMS Microphone—SPH0645LM4H MEM −42 dB 50 Hz to 15 kHz 6.95KEEG1542PBL-A [37] Electret −42 dB 180 Hz to 20 kHz 2.39FG-23329-P07 [37] Electret −37 dB 100 Hz to 10 kHz 24.19CMA-4544PF-W Electret −44 dB 20 Hz to 20 kHz 0.68BL-1994 Piezoelectric −49 dB 20 Hz to 10 kHz 106BL-3497 Piezoelectric −49 dB 20 Hz to 10 kHz 98
Svantek 959 (GRAS 40AE 1/2”) [50]GRAS 40AE 1/2” Electret −26 dB 3.15 Hz to 20 kHz 953CESVA SC-310CESVA C-130 Electret −35 dB 10 Hz to 20 kHz -CESVA C-250 Electret −27 dB 10 Hz to 20 kHz -Behringer ECM8000 Electret −37 dB 215 Hz to 20 kHz 62
G.R.A.S. 41AC-2 Outdoor Microphone Electret −26 dB 3.15 Hz to 20 kHz 2800Class 2—PCE-428 Electret −28 dB 20 Hz to 12.5 kHz 1960Class 1—PCE-430 Electret −28 dB 3 Hz to 20 kHz 1070Class 1—PCE-432 Electret −28 dB 3 Hz to 20 kHz 2260
Outdoor Sound Level Meter Kit PCE-428-EKIT Electret −26 dB 3.15 to 20 kHz 4380Outdoor Sound Level Meter Kit PCE-430-EKIT Electret −28 dB 3 Hz to 20 kHz 5230Outdoor Sound Level Meter Kit PCE-432-EKIT Electret −28 dB 3 Hz to 20 kHz 5640WPK1710-Outdoor kit-Type 1-NoiseMeters Electret - - 5980WPK1720-Outdoor kit-Type 2-NoiseMeters Electret - - 5140M2230-WP-Outdoor kit + Basic Case-NTi audio Electret - 5 Hz to 20 kHz -
We have developed the acoustic acquisition system based on the Adafruit I2S MEMS MicrophoneBreakout–SPH0645LM4H measuring microphone, this device exhibits a good trade-off betweenperformance and price, presenting a flat frequency response as we can see in Figure 4. This microphonehas a cost of 6.95e and a bandwidth between 50 Hz and 16 kHz. Despite the bandwidth being slightlylower than our initial ambitions (between 20 Hz and 20 kHz), this sensor is very affordable and upto 16 kHz includes most of the regular audible sounds that we are interested in. During the study,we reduced the requirements of the sensor because, on the one hand, it made the sensor cheaper,and on the other hand, the fact that the sound pressure level is usually measured in octaves, it worksin the range between 31.5 Hz and 16,000 Hz, and the tails of this range are highly attenuated by theA-weight filter. It should be noted that the sensor does not meet the requirements for class 1 andclass 2 tolerances for frequencies below 50 Hz, because frequency response has a gain lower than−5 dB instead of −3 dB. Nevertheless, the gain provided by the manufacturer (Figure 4) also depictsthat the requirements for class 1 and class 2 are fulfilled in the frequency range between 60 Hz and16,000 Hz (see Table 2 and Figure 4). On the other hand, the microphone selected for the designof the sensor (Adafruit I2S MEMS Microphone Breakout) exhibits a lower sensibility (−42 dB) thanclass 1 or class 2 microphone which are in range between −26 dB and −28 dB, as we can observe inTable 3. This means that audios with low sound pressure level may not be noticed. However, the aimof this platform is to measure relevant sound pressure level sounds and to detect the source of thoseundesirable noises.
Finally, the signal will be captured, processed and transmitted remotely by the Raspberry Pi 3platform. Currently, we are working on the adaptation of the microphone to outdoors environments,because the commercial solutions based on sound level meter have a prohibitive price for ourapplication. To demonstrate it, complete outdoor microphones are depicted in Table 3 and outdoorkits (microphones are not included) in Table 4.

Electronics 2020, 9, 1155 11 of 20
Figure 4. Typical free field response normalized to 1 kHz (data collected from [51]).
Table 4. A list of commercial outdoor kits to adapt existing microphones (microphones are not included).
Outdoor Kit Manufacturer Price (e)
Outdoor Sound Monitor Kit PCE-4xx-EKIT PCE 3500WPK-OPT—Outdoor Noise Kit for Optimus Green Sound Level Meter NoiseMeters 2280WK2—The heavy-duty option for longer-term noise monitoring Pulsar Instruments 2570
4.3. Power Supply
The device will be powered by connecting to the AC mains of the city, a common practice whendeploying urban devices [52]. In order to power all the electronic components inside it, an AlternateCurrent to Direct Current (AC-DC) converter is used: The TT Electronics—IoT Solutions SGS-15-5.This Power Supply Unit (PSU) offers one output with fixed voltage: It has a 3 A at 5 V output witha total power of 15 W. This ratings fits our application, since the two components that require morepower are the Microprocessor Unit (MPU) with 2.5 A at 5 V and the 3G module, which can be poweredat 5 V and has a maximum power consumption during transmission of 2 W. These power requirementsare shown in Table 5. Moreover, this PSU has a small footprint size (2.30 × 3.34 inches), which makesit suitable to be integrated in the box and leaves enough room for the other components.
Table 5. Summary of the power requirements of the system.
Device Voltage Max. Current
Raspberry Pi 3 5 V 2.5 A3G Module 5 V 400 mA
4.4. Wireless Communications
An important feature of this device is the wireless communication to connect to the IoT platform,to send the results of the processing and data samples to the SmartSense server, and to allow theremote configuration of the sensor (which also reduces human effort and cost).
The device supports both WiFi (module included in the Raspberry Pi 3) for urban locations whereBarcelona WiFi is available [53] and 3G (external module from Adafruit) for other cases.
As the Raspberry Pi 3 already contains a WiFi module, only the 3G functionality has beenadded using an Adafruit board. The FONA 3G Cellular Breakout was used, as this board offersa Quad-band 850 MHz Global System for Mobile Communications (GSM), a 900 MHz ExtendedGSM (EGSM), a 1800 MHz Digital Cellular System (DCS), a 1900 MHz Personal CommunicationsService (PCS)—connect onto any global GSM network with any 2G Subscriber Identity Module (SIM).AT command with a UART interface can be used to configure and control it with 300, 600, 1200,4800, 9600, 19,200, 38,400, 57,600, 115,200, 230 k, 461 k, 961 k, 3.2 M, 3.7 M and 4.0 Mbps. This boardalso contains a Global Positioning System (GPS) module, which may be useful to confirm the sensorposition in the city and ensure it matches with the right identifier.

Electronics 2020, 9, 1155 12 of 20
4.5. Boxing
As this sensor will be placed outdoors, it should be protected by a box with an InternationalProtection (IP) rating [54] of 65. This IP rating indicates that the box protects the system againsthazardous events and the ingress of solid foreign objects. A rating of 6 means “No ingress of dust;complete protection against contact”. Whilst the second digit represents the protection of the equipmentinside the enclosure against harmful ingress of water, with a rating of 6 meaning “Water projectedin powerful jets (12.5 mm nozzle) against the enclosure from any direction shall have no harmfuleffects”. An enclosure such as BUD industries PNR-2601-C can be used, which has a price of 10.31e,however a further analysis have to be conducted to select the most suitable option depending on thecharacteristics of the project such as thermal and humidity isolation, size, price, etc.
4.6. Sensor Proposal
In summary, the MPU proposed is the Raspberry Pi 3, which includes BLE, Wifi and also an OSbased on linux. Its power supply, a SGS-15-5, is able to provide up to 15 W at low cost. The microphone,SPH0645LM4H, has a bandwidth between 50 Hz and 15 kHz at a very low cost. Finally, the 3G modulecan be removed to save money when a Wi-Fi network is available.
All these components are summarized in Table 6, along with their prices. The total cost of thesensor is therefore around 139e.
Table 6. Final components that comprise the presented device in this work.
Function Component Specifications Cost (e)
MPU Raspberry Pi 3 4x ARM Cortex-A53, 1.2 GHz 35PSU TT Electronics-IoT Solutions: SGS-15-5 5V@3A, 15 W 7.02
MicrophoneAdafruit I2S MEMS Microphone
Breakout-SPH0645LM4H Measuring microphone 6.95
3G Module Adafruit FONA 3G CellularUMTS/HSDPA, WCDMA + HSDPA,
AT commands 80
Box Bud industries PNR-2601-C IP65, polycarbonate 10.31
Total 139.28
The simplified block diagram in Figure 5 depicts the main hardware components and how theyrelate to each other. Figure 6 shows a photo of the sensor.
AC/DC Converter
Microphone
AC Connector
5V
230V ACPowerAudioDigital DataRF
Legend
3G Module Raspberry Pi 3
Figure 5. Block Diagram of the platform including its main hardware components.

Electronics 2020, 9, 1155 13 of 20
Figure 6. Picture of the smart sensor.
4.7. Software Implementation
The software of this smart wireless acoustic sensor has been implemented in Python due to thehuge documentation and libraries available online. The algorithm is basically comprised by the threemain tasks shown in Figure 7: (i) Acquisition of audio frames, (ii) classification of the source of soundand, finally, (iii) the transfer of the results to Sentilo and the SmartSense platform. This algorithm has aresource consumption of CPU between 55% and 75% and a RAM memory of 8.5%.
The Python_Stream.py captures the RAW audio provided by the microphone through an I2Sprotocol. The data acquisition can be configured remotely modifying the file Config.dat thanks tothe Socket.py library. The configuration parameters are the (i) frequency sampling, (ii) the numberof bits of each sample, (iii) the data frame size of the audio and (iv) the wireless communication.These parameters, as well as the machine learning algorithms themselves, can be configured remotelyfrom the SmartSense platform. The Classifier.py uses the model previously trained for labeling theaudio; the inputs of this task are the raw audio data and the configuration parameters. This task alsocomputes the Leq and obtains the timestamp. Finally, the algorithm grasps the label, the Leq and thetimestamp to prepare a data frame and send it wirelessly to the remote server throughout WiFi or 3G.
Classifier.py
Raspberry pi
Python_stream.py
Structure of Data
AC/DC Converter
Microphone
AC Connector
5V
230V ACPowerAudioDigital DataRF
Legend
3G Module Raspberry Pi 3
I2S Peripheral
Adafruit Microphone I2S
Structure of Data
Pyaudio .wav Wave Pickle
Pickle
Structure of Data
Numpy
Sentinelo.py
SocketUART
Sentinel
Adafruit Fona
Remote ServersUrban Area
Smart Audio Sensor with wireless connectivity
Remote Server with Sentilo
3G
WIFI
Classifier.py
Raspberry pi
Python_stream.py
I2S Peripheral
Adafruit Microphone I2SPyaudio Config.dat
Numpy
Sentilo.py
REST APIUART
Adafruit FONA 3G
3G
Socket
WIFI
WIFI
Sentilo
Figure 7. Data path and software dependencies of the proposed system.
4.8. Preliminary Results of Data Acquisition
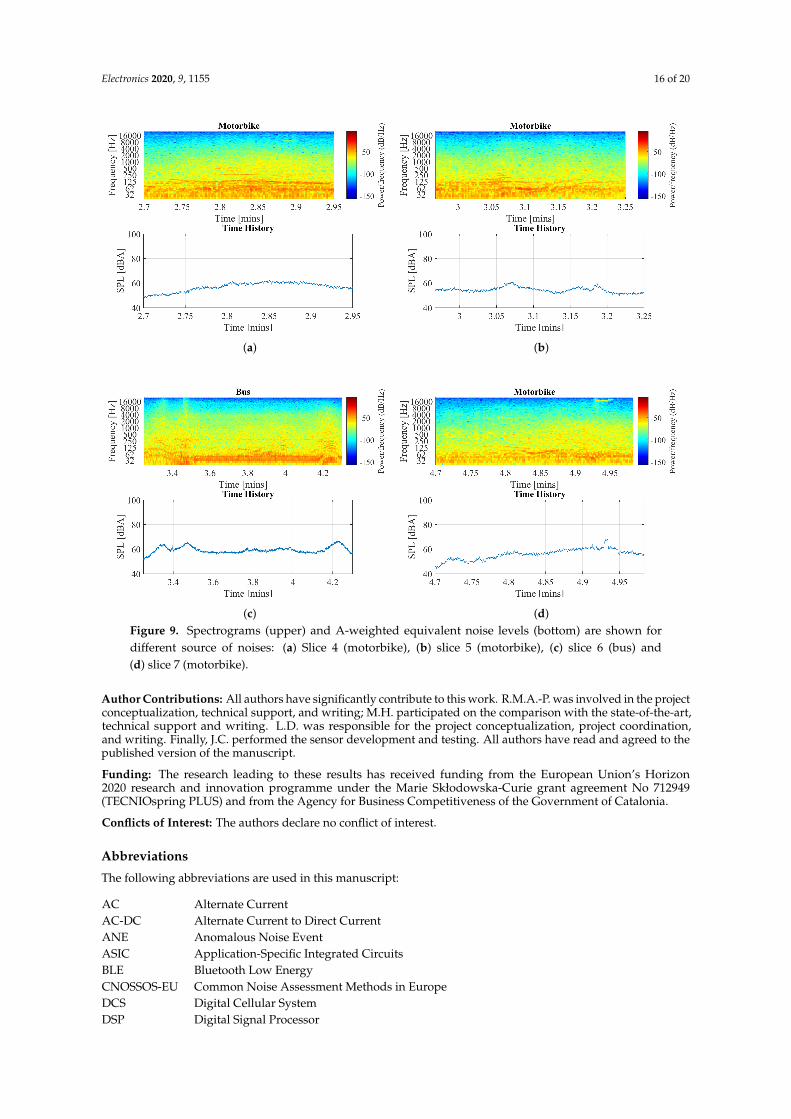
Currently, we have performed preliminary measurements in the street in Netherlands at 32and 48 ksps to evaluate the data acquisition subsystem. Figure 8a depicts the spectrogram andthe A-weighted equivalent noise levels of 5 min of sound acquired at 48 ksps in the Netherlands.Independent sources of sounds have been identified and highlighted to show how they exhibitdifferences both in time and frequency. These sounds spectrograms with another sensor can be foundin [55,56], where a class II microphone was used to conduct the acquisition of the sounds. The analysisof characteristic sounds such as a siren and a motorbike depicts that they have the same spectrum andtime distribution, despite them having been collected in different cities. Therefore, we have validatedthe ability to capture these sounds with the SPH0645LM4H low-cost microphone.

Electronics 2020, 9, 1155 14 of 20
Finally, this simple experiment shows the system fulfills most of our original requirements:
• Processing capacity: The sensor was capable of sampling, storage and transmit data in this test.However, more intensive tests have to be conducted to analyse the performance of the wholerecognition system. More concretely, of the sound recognition algorithms for a long period of timein order to evaluate the results in real-operation.
• Microphone: The audio has been sampled at 48 ksps with 18 bits. Moreover, the sensor provides aflat frequency response in the commonly used bands with A-weighted filtering, between 31.5 Hzand 16,000 Hz, which includes most of the regular audible sounds that interests us. Finally,the sensor has a high SNR of 65 dB(A) [51] and a quantization noise of 108 dB.
• Wireless communications: The data has been sent to the remote server throughout theWI-FI connectivity.
• Re-configurable: The tests have been conducted at 32 and 48 ksps with a precision of 16 bitsper sample.
(a) (b)
(c) (d)Figure 8. Spectrograms (upper) and A-weighted equivalent noise levels (bottom) are shown fordifferent source of noises: (a) 5 min of audio capture at 48 ksps in Netherlands, (b) slice 1 (motorbike),(c) slice 2 (motorbike and bus), (d) slice 3 (a siren—police or ambulance).

Electronics 2020, 9, 1155 15 of 20
5. Conclusions
In this work, we have reviewed several hardware architectures and devices used in WASNsapplications. These platforms have been analyzed to study the suitability for our applicationconsidering their strengths and weaknesses.
The main goal of this work is describing a low-cost configurable acoustic sensor that can bedeployed rapidly and easily in any city to create smart WASNs. The sensor includes a quad-core ARMCortex-A53 CPU, Wi-Fi and 3G connectivity, a box with an IP of 65 and an acoustic acquisition system.The later supports a lower frequency range (50 Hz to 15 kHz) than we initially aimed for, but allows usto measure the Leq measurement and to run SmartSound algorithms [26,27] to most urban sounds weare interested in. The total cost of the sensor is only 139e, and it is extremely easy to assemble anddeploy. As such, it can be used to create truly smart WASNs, capable of identifying and more preciselymeasuring the different sources of noise in a city. With that, we hope to enable the development of anumber of smart city services that exploit the rich information that can be extracted from sound.
Additionally, the sensor has been specially designed to be used with the SmartSense platform.As such, it allows a number of configurations to facilitate the development and testing ofproof-of-concept applications of the SmartSound technology, enabling fast data collection and teston-site for any environment. On-the-fly configurations include the sample frequency, the data precision,the processing algorithms, and the choice of sending audio samples with the classification of anomalousnoise events.
This sensor does not provide a large storage capacity to save raw data, mainly because storagecapacity was not a requirement, and we avoided adding a large one to keep the price as low aspossible. Moreover, the system has not been provided with an external rechargeable battery, so itneeds be connected to the power grid uninterruptedly, which makes it suitable for urban and suburbanscenarios, and not so much for remote sensing. Finally, the system has been conceived to transfer smallquantities of data, e.g., the Leq values and the labels of the acoustic events instead of raw data. As aresult, it does not overload the WASN when it is deployed withing many sensors and it can betterprotect the citizen privacy in urban environments.
We plan to test the sensor in the near future in two different environments and with twodifferent purposes:
• Taking our university campus as a SmartCampus living lab, we first plan to install a small WASNjust outside the student residence, which is next to the university restaurant, a basketball courtand a football field. The aim is to test the sensors and its integration with the SmartSense platformin a nearby, yet real environment for classifying the sources of noise around the student residence.
• At a second stage, we plan to install the sensor in the center of Barcelona, in a neighborhoodthat has both high-traffic and restaurants/bars. The goal is to analyse the noise during differenttimes of the day and over a longer period of time to discriminate how much of it is caused by thetraffic and leisure activities. According to our contacts in Barcelona city council, complains fromneighbours in such areas are common, which noise originated from people/music on bars, peopleaccessing leisure zones/venues and traffic. However, it can be difficult for them to create effectiveplans if they do not understand the distribution of these noise sources.
We expect that these tests will allow us to perform an initial evaluation of the suitability of thesensor for our purposes (i.e., the creation of smart WASNs and the the rapid development of soundrecognition applications). Currently, we have evaluated the spectrogram of a 5 min record collected at48 ksps in the Netherlands as is depicted in Figures 8 and 9, where the spectrograms differ both intime and frequency for different noise sources.
Electronics 2020, 9, 1155 16 of 20
(a) (b)
(c) (d)Figure 9. Spectrograms (upper) and A-weighted equivalent noise levels (bottom) are shown fordifferent source of noises: (a) Slice 4 (motorbike), (b) slice 5 (motorbike), (c) slice 6 (bus) and(d) slice 7 (motorbike).
Author Contributions: All authors have significantly contribute to this work. R.M.A.-P. was involved in the projectconceptualization, technical support, and writing; M.H. participated on the comparison with the state-of-the-art,technical support and writing. L.D. was responsible for the project conceptualization, project coordination,and writing. Finally, J.C. performed the sensor development and testing. All authors have read and agreed to thepublished version of the manuscript.
Funding: The research leading to these results has received funding from the European Union’s Horizon2020 research and innovation programme under the Marie Skłodowska-Curie grant agreement No 712949(TECNIOspring PLUS) and from the Agency for Business Competitiveness of the Government of Catalonia.
Conflicts of Interest: The authors declare no conflict of interest.
Abbreviations
The following abbreviations are used in this manuscript:
AC Alternate CurrentAC-DC Alternate Current to Direct CurrentANE Anomalous Noise EventASIC Application-Specific Integrated CircuitsBLE Bluetooth Low EnergyCNOSSOS-EU Common Noise Assessment Methods in EuropeDCS Digital Cellular SystemDSP Digital Signal Processor

Electronics 2020, 9, 1155 17 of 20
EC European CommissionEND Environmental Noise DirectiveEU European UnionEGSM Extended GSMFPGA Field Programmable Gate ArrayGPRS General Packet Radio ServiceGSM Global System for Mobile CommunicationsGPS Global Positioning SystemGTM Research Group on Media TechnologyHDD Hard Drive DiskHPC High Performance ComputingIEC International Electrotechnical CommissionIDEA Intelligent Distributed Environmental AssessmentIoT Internet of ThingsISO International Organization for StandardizationIP International ProtectionMEMS Microelectromechanical systemsMPU MicroProcessor UnitµC µControllerOS Operating SystemPCB Printed Circuit BoardPCS Personal Communications ServicePSU Power Supply UnitRISC Reduced Instruction Set ComputerRTN Road Traffic NoiseSIM Subscriber Identity ModuleSONYC Sounds of New York ProjectUN United NationsWASN Wireless Acoustic Sensor NetworksWHO World Health Organization
References
1. Mundi, I. World Demographics Profile. Available online: http://www.indexmundi.com/world/demographics_profile.html (accessed on 20 June 2017).
2. United Nations, Department of Economic and Social Affairs, Population Division. World Population 2015.Available online: https://esa.un.org/unpd/wpp/Publications/Files/World_Population_2015_Wallchart.pdf(accessed on 20 February 2016).
3. Morandi, C.; Rolando, A.; Di Vita, S. From Smart City to Smart Region: Digital Services for an Internet of Places;Springer: Berlin/Heidelberg, Germany, 2016.
4. Fira de Barcelona. Smart City Expo World Congress, Report 2015. Available online: http://media.firabcn.es/content/S078016/docs/Report_SCWC2015.pdf (accessed on 20 February 2016).
5. Bouskela, M.; Casseb, M.; Bassi, S.; De Luca, C.; Facchina, M. La ruta hacia las Smart Cities: Migrando deuna gestión tradicional a la ciudad inteligente. In Monografía del BID (Sector de Cambio Climático y DesarrolloSostenible. División de Viviendas y Desarrollo Urbano); IDB-MG-454; Banco Interamericano de Desarrollo:Washington, DC, USA, 2016.
6. Ripoll, A.; Bäckman, A. State of the Art of Noise Mapping in Europe; Internal Report; European Topic Centre:Barcelona, Spain, 2005.
7. European Environment Agency. The European Environment, State and Outlook 2010 (Sythesis). 2010.Available online: http://www.eea.europa.eu/soer/synthesis/synthesis (accessed on 20 February 2016).
8. Cik, M.; Lienhart, M.; Lercher, P. Analysis of Psychoacoustic and Vibration-Related Parameters to Track theReasons for Health Complaints after the Introduction of New Tramways. Appl. Sci. 2016, 6, 398. [CrossRef]

Electronics 2020, 9, 1155 18 of 20
9. Cox, P.; Palou, J. Directive 2002/49/EC of the European Parliament and of the Council of 25 June 2002Relating to the Assessment and Management of Environmental Noise-Declaration by the Commission in theConciliation Committee on the Directive Relating to the Assessment and Management of EnvironmentalNoise (END). Off. J. Eur. Communities 2002, 189, 2002.
10. European Commission, Joint Research Centre—Institute for Health and Consumer Protection. CommonNoise Assessment Methods in Europe (CNOSSOS-EU) for Strategic Noise Mapping Following Environmental NoiseDirective 2002/49/EC; European Comission: Brussels, Belgium, 2012.
11. World Health Organization. Environmental Noise Guidelines for the European Region; Technical Report; WorldHealth Organization: Geneva, Switzerland, 2018.
12. Cueto, J.L.; Petrovici, A.M.; Hernández, R.; Fernández, F. Analysis of the impact of bus signal priority onurban noise. Acta Acust. United Acust. 2017, 103, 561–573. [CrossRef]
13. Morley, D.; De Hoogh, K.; Fecht, D.; Fabbri, F.; Bell, M.; Goodman, P.; Elliott, P.; Hodgson, S.; Hansell, A.;Gulliver, J. International scale implementation of the CNOSSOS-EU road traffic noise prediction model forepidemiological studies. Environ. Pollut. 2015, 206, 332–341. [CrossRef]
14. Ruiz-Padillo, A.; Ruiz, D.P.; Torija, A.J.; Ramos-Ridao, Á. Selection of suitable alternatives to reduce theenvironmental impact of road traffic noise using a fuzzy multi-criteria decision model. Environ. ImpactAssess. Rev. 2016, 61, 8–18. [CrossRef]
15. Licitra, G.; Fredianelli, L.; Petri, D.; Vigotti, M.A. Annoyance evaluation due to overall railway noise andvibration in Pisa urban areas. Sci. Total Environ. 2016, 568, 1315–1325. [CrossRef]
16. Bunn, F.; Zannin, P.H.T. Assessment of railway noise in an urban setting. Appl. Acoust. 2016, 104, 16–23.[CrossRef]
17. Iglesias-Merchan, C.; Diaz-Balteiro, L.; Soliño, M. Transportation planning and quiet natural areaspreservation: Aircraft overflights noise assessment in a National Park. Transp. Res. Part D Transp. Environ.2015, 41, 1–12. [CrossRef]
18. Gagliardi, P.; Fredianelli, L.; Simonetti, D.; Licitra, G. ADS-B system as a useful tool for testing and redrawingnoise management strategies at Pisa Airport. Acta Acust. United Acust. 2017, 103, 543–551. [CrossRef]
19. Progetto SENSEable PISA. Sensing The City. Description of the Project. Available online: http://senseable.it/(accessed on 20 February 2016).
20. Nencini, L.; De Rosa, P.; Ascari, E.; Vinci, B.; Alexeeva, N. SENSEable Pisa: A wireless sensor network forreal-time noise mapping. In Proceedings of the EURONOISE, Prague, Czech Republic, 10–13 June 2012;pp. 10–13.
21. Sevillano, X.; Socoró, J.C.; Alías, F.; Bellucci, P.; Peruzzi, L.; Radaelli, S.; Coppi, P.; Nencini, L.; Cerniglia, A.;Bisceglie, A.; et al. DYNAMAP—Development of low cost sensors networks for real time noise mapping.Noise Mapp. 2016, 3, 172–189. [CrossRef]
22. Alías, F.; Alsina-Pagcs, R.M.; Orga, F.; Socoró, J.C. Detection of Anomalous Noise Events for Real-TimeRoad-Traffic Noise Mapping: The Dynamap’s project case study. Noise Mapp. 2018, 5, 71–85. [CrossRef]
23. Bello, J.P.; Silva, C.; Nov, O.; Dubois, R.L.; Arora, A.; Salamon, J.; Mydlarz, C.; Doraiswamy, H. SONYC:A System for Monitoring, Analyzing, and Mitigating Urban Noise Pollution. Commun. ACM 2019, 62, 68–77.[CrossRef]
24. Zambon, G.; Benocci, R.; Bisceglie, A.; Roman, H.E.; Bellucci, P. The LIFE DYNAMAP project: Towards aprocedure for dynamic noise mapping in urban areas. Appl. Acoust. 2016, 124, 52–60. [CrossRef]
25. Bellucci, P.; Peruzzi, L.; Zambon, G. LIFE DYNAMAP project: The case study of Rome. Appl. Acoust. 2017,117, 193–206. [CrossRef]
26. Socoró, J.C.; Alías, F.; Alsina-Pagès, R.M. An Anomalous Noise Events Detector for Dynamic Road TrafficNoise Mapping in Real-Life Urban and Suburban Environments. Sensors 2017, 17, 2323. [CrossRef] [PubMed]
27. Alsina-Pagès, R.M.; Navarro, J.; Alías, F.; Hervás, M. homesound: Real-time audio event detection basedon high performance computing for behaviour and surveillance remote monitoring. Sensors 2017, 17, 854.[CrossRef] [PubMed]
28. Basten, T.; Wessels, P. An overview of sensor networks for environmental noise monitoring. In Proceedingsof the 21st International Congress on Sound and Vibration, ICSV 21, Beijing, China, 13–17 July 2014.
29. EU. Directive 2002/49/EC of the European Parliament and the Council of 25 June 2002 relating to theassessment and management of environmental noise. Off. J. Eur. Communities 2002, L189, 12–25.

Electronics 2020, 9, 1155 19 of 20
30. Wang, C.; Chen, G.; Dong, R.; Wang, H. Traffic noise monitoring and simulation research in Xiamen Citybased on the Environmental Internet of Things. Int. J. Sustain. Dev. World Ecol. 2013, 20, 248–253. [CrossRef]
31. Dekoninck, L.; Botteldooren, D.; Int Panis, L. Sound sensor network based assessment of traffic, noise, andair pollution. In Proceedings of the 10th European Congress and Exposition on Noise Control Engineering(Euronoise 2015), Maastricht, The Netherlands, 31 May–3 June 2015; pp. 2321–2326.
32. Dekoninck, L.; Botteldooren, D.; Panis, L.I.; Hankey, S.; Jain, G.; Karthik, S.; Marshall, J. Applicability of anoise-based model to estimate in-traffic exposure to black carbon and particle number concentrations indifferent cultures. Environ. Int. 2015, 74, 89–98. [CrossRef]
33. Fišer, M.; Pokorny, F.B.; Graf, F. Acoustic Geo-sensing Using Sequential Monte Carlo Filtering. In Proceedingsof the 6th Congress of the Alps Adria Acoustics Association, Graz, Austria, 16–17 October 2014.
34. Filipponi, L.; Santini, S.; Vitaletti, A. Data collection in wireless sensor networks for noise pollutionmonitoring. In Proceedings of the International Conference on Distributed Computing in Sensor Systems,Santorini Island, Greece, 11–14 June 2008; pp. 492–497.
35. Moteiv Corporation. tmote Sky: Low Power Wireless Sensor Module. Available online: http://www.crew-project.eu/sites/default/files/tmote-sky-datasheet.pdf (accessed on 19 May 2020).
36. Botteldooren, D.; De Coensel, B.; Oldoni, D.; Van Renterghem, T.; Dauwe, S. Sound monitoring networks newstyle. In Proceedings of the Acoustics 2011: Breaking New Ground: Annual Conference of the AustralianAcoustical Society, Goald Coast, Australia, 2–4 November 2011; pp. 1–5.
37. Domínguez, F.; Cuong, N.T.; Reinoso, F.; Touhafi, A.; Steenhaut, K. Active self-testing noise measurementsensors for large-scale environmental sensor networks. Sensors 2013, 13, 17241–17264. [CrossRef]
38. Bell, M.C.; Galatioto, F. Novel wireless pervasive sensor network to improve the understanding of noise instreet canyons. Appl. Acoust. 2013, 74, 169–180. [CrossRef]
39. Paulo, J.; Fazenda, P.; Oliveira, T.; Carvalho, C.; Felix, M. Framework to monitor sound events in the citysupported by the FIWARE platform. In Proceedings of the 46o Congreso Español de Acústica, Valencia,Spain, 21–23 October 2015; pp. 21–23.
40. Intel R© Edison Compute Module: Hardware Guide. Available online: https://www.intel.com/content/dam/support/us/en/documents/edison/sb/edison-module_HG_331189.pdf (accessed on 19 May 2020).
41. Paulo, J.; Fazenda, P.; Oliveira, T.; Casaleiro, J. Continuos sound analysis in urban environments supportedby FIWARE platform. In Proceedings of the EuroRegio2016/TecniAcústica, Porto, Portugal, 13–15 June 2016;Volume 16, pp. 1–10.
42. Project, S. SONYC: Sounds of New York City. Available online: https://wp.nyu.edu/sonyc/ (accessed on19 May 2020).
43. Mydlarz, C.; Salamon, J.; Bello, J.P. The implementation of low-cost urban acoustic monitoring devices.Appl. Acoust. 2017, 117, 207–218. [CrossRef]
44. Salamon, J.; Jacoby, C.; Bello, J.P. A Dataset and Taxonomy for Urban Sound Research. In Proceedings ofthe 22nd ACM International Conference on Multimedia, Orlando, FL, USA, 3–7 November 2014; ACM:New York, NY, USA, 2014; pp. 1041–1044. [CrossRef]
45. Nencini, L. DYNAMAP monitoring network hardware development. In Proceedings of the 22ndInternational Congress on Sound and Vibration, Florence, Italy, 12–16 July 2015; pp. 12–16.
46. Malinowski, A.; Yu, H. Comparison of embedded system design for industrial applications. IEEE Trans.Ind. Inform. 2011, 7, 244–254. [CrossRef]
47. Simon, G.; Maróti, M.; Lédeczi, Á.; Balogh, G.; Kusy, B.; Nádas, A.; Pap, G.; Sallai, J.; Frampton, K. Sensornetwork-based countersniper system. In Proceedings of the 2nd International Conference on EmbeddedNetworked Sensor Systems, Baltimore, MD, USA, 3–5 November 2004; pp. 1–12.
48. Segura-Garcia, J.; Felici-Castell, S.; Perez-Solano, J.J.; Cobos, M.; Navarro, J.M. Low-cost alternatives forurban noise nuisance monitoring using wireless sensor networks. IEEE Sens. J. 2015, 15, 836–844. [CrossRef]
49. Hughes, J.; Yan, J.; Soga, K. Development of wireless sensor network using bluetooth low energy (BLE) forconstruction noise monitoring. Int. J. Smart Sens. Intell. Syst. 2015, 8, 1379–1405. [CrossRef]
50. Can, A.; Dekoninck, L.; Botteldooren, D. Measurement network for urban noise assessment: Comparison ofmobile measurements and spatial interpolation approaches. Appl. Acoust. 2014, 83, 32–39. [CrossRef]
51. knowles.com. SPH0645LM4H-B (Datasheet). Available online: https://www.knowles.com/docs/default-source/model-downloads/sph0645lm4h-b-datasheet-rev-c.pdf?Status=Master&sfvrsn=c1bf77b1_4 (accessedon 3 June 2020).
Electronics 2020, 9, 1155 20 of 20
52. Mietlicki, F.; Gaudibert, P.; Vincent, B. HARMONICA project (HARMOnised Noise Information forCitizens and Authorities). In Proceedings of the INTER-NOISE and NOISE-CON Congress and ConferenceProceedings, New York, NY, USA, 19–22 August 2012; Volume 2012, pp. 7238–7249.
53. Ajuntament.Barcelona.Cat. Wifi Barcelona. Available online: https://ajuntament.barcelona.cat/barcelonawifi/es/welcome.html (accessed on 15 June 2020).
54. ANSI. Degrees of Protection Provided by Enclosures (IP Code) (Identical National Adoption); ANSI: New York, NY,USA, 2004.
55. Alsina-Pagès, R.M.; Alías, F.; Socoró, J.C.; Orga, F.; Benocci, R.; Zambon, G. Anomalous events removal forautomated traffic noise maps generation. Appl. Acoust. 2019, 151, 183–192. [CrossRef]
56. Alías, F.; Socoró, J.C. Description of anomalous noise events for reliable dynamic traffic noise mapping inreal-life urban and suburban soundscapes. Appl. Sci. 2017, 7, 146. [CrossRef]
c© 2020 by the authors. Licensee MDPI, Basel, Switzerland. This article is an open accessarticle distributed under the terms and conditions of the Creative Commons Attribution(CC BY) license (http://creativecommons.org/licenses/by/4.0/).