Design Manual for Management of Solid By-Products from ...
306
DOUMCI22118-3942 (DE95000037) Dsbibuhn Categories UC-103, UC-105, UC-109, and UC-110 Design Manual for Management of Solid By-Products from Advanced Coal Technologies Topical Report Work Performed Under Contract No.: DE-AC2 1 -86MC22 1 1 8 For U.S. Department of Energy Office of Fossil Energy Morgantown Energy Technology Center P.O. Box 880 Morgantown, West Virginia 26507-0880 BY Radian Corporation 850 1 Mopac Boulevard P. 0. Box 2 0 1 0 8 8 Austin, Texas 78720-1 088
-
Upload
khangminh22 -
Category
Documents
-
view
2 -
download
0
Transcript of Design Manual for Management of Solid By-Products from ...

DOUMCI22118-3942 (DE95000037)
Dsbibuhn Categories UC-103, UC-105, UC-109, and UC-110
Design Manual for Management of Solid By-Products from Advanced Coal
Technologies
Topical Report
Work Performed Under Contract No.: DE-AC2 1 -86MC22 1 1 8
For U.S. Department of Energy
Office of Fossil Energy Morgantown Energy Technology Center
P.O. Box 880 Morgantown, West Virginia 26507-0880
BY Radian Corporation
850 1 Mopac Boulevard P. 0. Box 201088
Austin, Texas 78720-1 088

DOE/MC/22 1 1 8-3942 (DE95000037)
Design Manual for Management of Solid By-Products from Advanced Coal Technologies
Topica1 Report
October 1994
Work Performed Under Contract No.: DE-AC2 1 -86MC22 1 1 8
For U.S. Department of Energy Office of Fossil Energy Morgantown Energy Technology Center Morgantown, West Virginia
BY Radian Corporation Austin, Texas
DISCLAIMER
This report was prepared as an account of work sponsored by an agency of the United States Government. Neither the United States Government nor any agency thereof, nor any of their employees, makes any warranty, express or implied, or assumes any legal liability or responsibility for the accuracy, completeness, or usefulness of any information, apparatus, product, or process disclosed, or represents that its use would not infringe privately owned rights. Reference herein to any specific commercial product, process, or service by trade name, trademark, manufacturer, or otherwise does not necessarily constitute or imply its endorsement, recommendation, or favoring by the United States Government or any agency thereof. The views and opinions of authors expressed herein do not necessarily state or reflect those of the United States Government or any agency thereof.
Tbis report has been reproduced directly from the best available copy.
Available to DOE and DOE contractors from the Office of Scientific and Technical Information, 175 Oak Ridge Turnpike, Oak Ridge, TN 37831; prices available at (615) 576-8401.
Available to the public from the National Technical Information Service, U.S. Department of Commerce, 5285 Porl Royal Road, Springfield, VA 22161; phone orders accepted at (703) 487-4650.
DISCLAIMER
Portions of this document may be illegible in electronic image products. Images are produced from the best available original document.
I
/Table of Contents
Page
1.0 INTRODUCTION ................................................... 1
1.1 1.2 1.3 1.4 1.5
Background .................................................. 1 Project Objectives .............................................. 3 Management Alternatives ......................................... 3 Report Organization ............................................ 8 Citations ................................................... 10
2.0 ADVANCED COAL TECHNOLOGY DESCRlpTIONS ....................... 13
2.1 2.2 2.3 2.4 2.5 2.6 2.7
Furnace Sorbent Injection (FSI) ................................... 13 Atmospheric Fluidized Bed Combustion (AFBC) ....................... 13 Calcium Spray Drying .......................................... 16 Pressurized Fluidized Bed Combustion (PFBC) ......................... 16 Dry Sodium and Calcium In-Duct Injection ........................... 16 Coal Gasification ............................................. 16 Citations ................................................... 20
3.0 PROPERTIES OF ADVANCED COAL TECHNOLOGY BY-PRODUCTS .......... 23
3.1
3.2
3.3 3.4 3.5 3.6 3.7 3.8
Characterization of FSI By-products ................................ 25 3.1.1 Physical Properties of FSI Ash .............................. 26 3.1.2 FSI Ash Chemistry ....................................... 26 3.1.3 FSI Ash Leachate ........................................ 29 3.1.4 FSI Ash Mineralogy ...................................... 32 3.1.5 Handling and Transport Considerations ......................... 33 AFBC By-product Characteristics .................................. 33 3.2.1 Physical Properties of AFBC Ash ............................ 34 3.2.2 AFBCAshChemistry ..................................... 34 3.2.3 AFBC Ash Leachate ..................................... 37 3.2.4 AFBC Ash Mineralogy .................................... 38 3.2.5 Transport and Handling Considerations ......................... 39 Calcium Spray-Dryer By-product characteristics ....................... 39 Pressurized Fluidized Bed Combustion By-product Characteristics . . . . . . . . . . . 40 Dry Sodium In-Duct Injection By-products ........................... 43 Dry Calcium In-Duct Injection By-product Characteristics ................. 44 Coal Gasification Slag Characteristics ............................... 45 Citations ................................................... 47
ii

TABLE OF CONTENTS (Continued)
4.0 REGULATORY REVIEW ............................................ 49
4.1 4.2
Federal Regulatory History of Wastes from the Combustion of Coal . . . . . . . . . . 49 General Overview of the Current Federal Regulatory Program . . . . . . . . . . . . . . 53 4.2.1
4.2.2 Part 258 Criteria for Municipal Solid Waste Landfills .............. 54 4.3 State Regulations ............................................. 57
4.3.1 Georgia ............................................... 58 4.3.2 Pennsylvania ........................................... 72 4.3.3 Illinois ............................................... 72
4.4 Local Regulations ............................................. 75 4.5 Regulatory Summary ........................................... 75 4.6 Citations ................................................... 76
Part 257 Criteria for Classification of Solid Waste Disposal Facilities ....................................... 54
5.0 SITE SELECTION AND PERMITTING ................................... 77
5.1 Site Selection ................................................ 77 5.1.1 Siting Criteria .......................................... 78 5.1.2 DataCollection ......................................... 82
5.2.1 Number and Types of Permits ............................... 83 5.2.2 Permitting Strategies ..................................... 86 5.2.3 Public Hearing Process .................................... 88
5.3 Citations ................................................... 88
5.2 Permitting .................................................. 83
6.0 COMPONENTS AND EQUIPMENT ..................................... 89
6.1 Disposal Facility Components ..................................... 89 6.1.1 Typical.Landfil1 Configurations .............................. 89 6.1.2 Stormwater Management ................................... 93 6.1.3 Erosion Control ......................................... 97 6.1.4 Groundwater Monitoring Systems ............................ 102 6.1.5 Miscellaneous Support Facilities ............................. 112 Materials Handling and Transport .................................. 116 6.2.1 By-product Storage ...................................... 116 6.2.2 By-product Transportation Alternatives ......................... 118
6.3.1 Storage Equipment ....................................... 123 6.3.2 Material Transfer Equipment ................................ 124 6.3.3
6.3.5 Processed Material Transportation Options ...................... 141
6.2
6.3 Material Processing at the Disposal Site .............................. 119
By-product Hydration Equipment ............................. 135 6.3.4 By-product Pelletization System ............................. 139
... lll

TABLE OF CONTENTS (Continued)
Page
6.4
6.5
Case Study System ............................................ 141 6.4.1 Process Equipment ....................................... 142 6.4.2 Construction Procedures ................................... 144 6.4.3 Lessons Learned ........................................ 145 Citations ................................................... 146
7.0 MANAGEMENT ALTERNATIVES ..................................... 147
7.1
7.2
7.3
7.4
7.5 7.6
Alternative 1Traditional Landfill Containment Systems ................. 151 7.1.1 Containment System Design ................................ 151 7.1.2 Level of By-product Processing Required Before Disposal . . . . . . . . . . . 157 7.1.3 Economic Analysis of Alternative 1 ........................... 157 Alternative 2-Reduced Requirement Landfill Designs ................... 158 7.2.1 Reduced Requirement Containment Systems ..................... 159 7.2.2 Use of By-product Material as a Barrier Layer . . . . . . . . . . . . . . . . . . . 161 7.2.3 Economic Analysis of Alternative 2 ........................... 165 Alternative 3-By-product Stacking Disposal Methods ................... 167 7.3.1 StackDesign ........................................... 167 7.3.2 Stack Operation ......................................... 171 Alternative "Mine Reclamation and Backfill Uses ..................... 171 7.4.1 Mining and By-product Disposal Techniques .................... 173 7.4.2 Required Design Information ................................ 173 7.4.3 Economic Analysis ....................................... 177 Alternative 5-By-product Reuse Options ............................ 178 Citations ................................................... 181
8.0 PERFORMANCE-BASED DESIGN PROCESS .............................. 183
8.1
8.2
8.3
Performance-Based Design Demonstration ............................ 184 8.1.1 Determination of Leachate Quality ............................ 185 8.1.2 Determine Leachate Quantity ............................... 189 8.1.3 Fate and Transport of Leachate Constituents ..................... 192
8.2.1
8.2.3 Regulatory Requirements .................................. 199 8.2.4 Demonstration Example ................................... 201 Citations ................................................... 210
DesignExample .............................................. 194 Characteristics of the Example By-product Landfill ................ 194
8.2.2 Characteristics of the Proposed By-product Material ............... 199
iv
TABLE OF CONTENTS (Continued)
Page
9.0 RESULTS AND CONCLUSIONS FROM CASE STUDIES . . . . . . . . . . . . . . . . . . . . . 211
9.1
9.2
9.3
Conceptual Model of Landfill Behavior . . . . . . . . . . . . . . . . . . . . . . . . . . . . . . 21 1 9.1.1 Weathering and Changes in Mineralogy, Physical, and
Chemical Properties . . . . . . . . . . . . . . . . . . . . . . . . . . . . . . . . . . . . . . 212 9.1.2 Leachate Generation and Attenuation . . . . . . . . . . . . . . . , . . . . . . . . . . 216 9.1.3 Behavior of Other Advanced Coal Technology By-products . . . . . . . . . . 218 Data from Landfill Test Cells . . . . . . . . . . . . . . . . . . . . . . . . . . . . . . . . . . . . . 221 9.2.1 Colorado Site Results . . . . . . . . . . . . . . . . . . . . . . . . . . . . . . . . . . . . . 221 9.2.2 Ohio Site Results . . . . . . . . . . . . . . . . . . . . . . . . . . . . . . . . . . . . . . . . 224 9.2.3 Illinois Site Results . . . . . . . . . . . . . . . . . . . . . . . . . . . . . . . . . . . . . . 235 Citations ................................................... 244
APPENDIX A HELP Model-Recharge Estimate
APPENDIX B HELP M o d e l a p e n Landfill
APPENDIX C MULTIMED Model Results-Open Landfill
APPENDIX D HELP Model-Closed Landfill
APPENDIX E MULTIMED Model Results-Closed Landfill
V

List of Figures
1
Page
Alternative 1Traditional Landfill Containment Systems ........................ 6
Alternative 2-Reduced Requirement Landfill Systems ......................... - 7
Alternative 3-Typical By-product Stacking Method ........................... 9
Possible By-product Utilization Options ................................... 10
Report Organization Flow Diagram ....................................... 11
Furnace Sorbent Injection Diagram ....................................... Atmospheric Fluidized Bed Combustion Diagram ............................. Calcium Spray-Dryer Diagram .......................................... 17
9 Pressurized Fluidized Bed Combustion .................................... 18
10 CalciudSodium In-Duct Injection Diagram ................................. 19
11 Gasification Combined Cycle Diagram ................................... 21
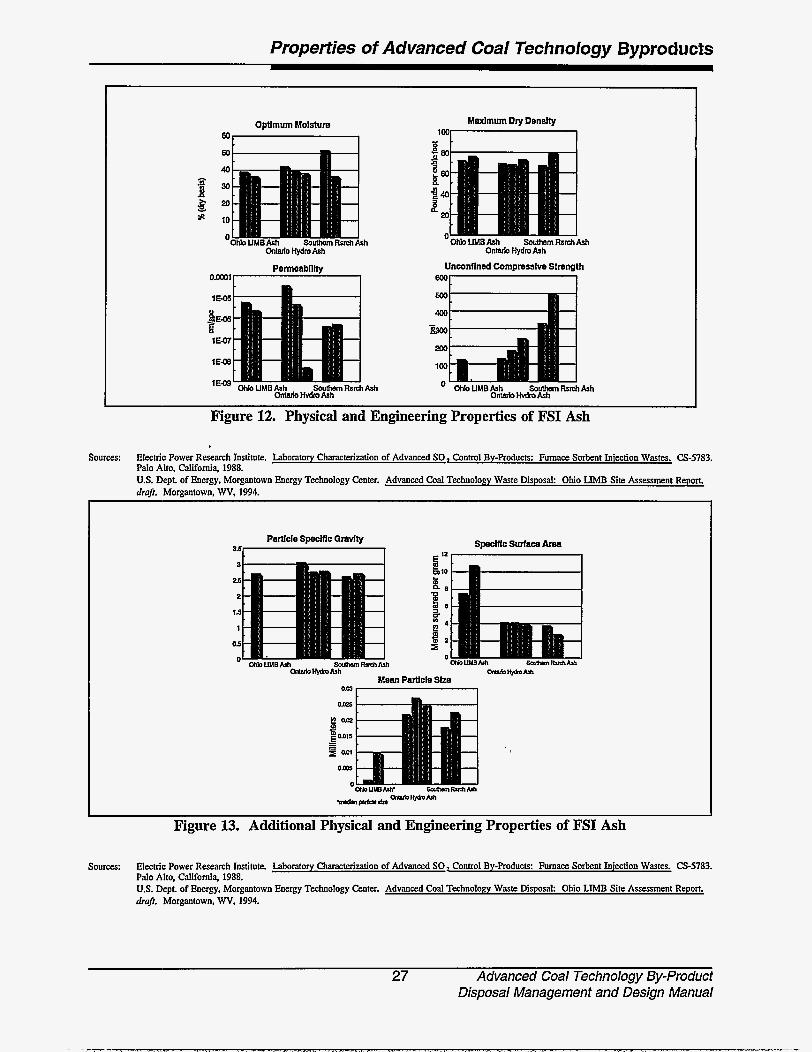
12 Physical and Engineering Properties of FSI Ash .............................. 27
14
15
13
14
15
Additional Physical and Engineering Properties of FSI Ash ...................... Range of Reported EP Leachate Compositions for FSI Ash ...................... Additional Ranges of EP Leachate Compositions for FSI Ash ....................
27
30
31
16 XRD Mineralogy of Conditioned and Unconditioned FSI Ash Samples . . . . . . . . . . . . . 32
Physical and Engineering Properties of AFBC Ash ............................ 35
Additional Physical and Engineering Properties of AFBC Ash .................... 35
XRD Mineralogy of CFBC and BFBC By-products ........................... 39
XRD Mineralogy of PFBC By-Products ................................... 42
17
18
19
20

LIST OF FIGURES (Continued)
Page
21 Regulations Governing Advanced Coal By-product Disposal ..................... 49
22 RCRA Bevill Status of Coal Combustion Wastes ............................. 51
23 States Included in the Regulatory Review .................................. 58
24 Disposal Area Site Design Process ....................................... 77
25 Site Evaluation Criteria ............................................... 79
26 Decision Process for Completing Required Permit Applications . . . . . . . . . . . . . . . . . . . 83
27
28
29
30
31
32
33
34
35
36
37
38
39
40
Typical Solid Waste Permitting Process ................................... 87
Heaped and Valley Landfill Configurations ................................. 90
Side-Hill Landfill Configuration ......................................... 91
General Guidelines for Top and Side Slope Configurations ...................... 92
Rainfall and Runoff Erosivity Index. R .................................... 100
SlopeEffectChart .................................................. 103
Leachate Migration Processes and a Typical Monitoring System . . . . . . . . . . . . . . . . . . 105
Typical Plan for Determining Magnitude and Direction of the Hydraulic Gradient .................................................. 106
Representative Ranges of Saturated Hydraulic-Conductivity Values for Geologic Materials .................................................. 110
Typical Monitor Well Construction ....................................... 111
Porous-Cup Lysimeter Design .......................................... 113
Pan Lysimeter Design ................................................ 114 1
Material Handling Processes Howchart .................................... 116
Examples of Storage Silos and Hoppers ................................... 117
V i i
LIST OF FIGURES (Continued)
41
42
43
44
45
46
47
48
49
50
51
52
53
54
55
56
57
58
59
60
61
Page
Guidelines for Selecting a Transport Mode Based Upon Particle Size . . . . . . . . . . . . . . . 120
Guidelines for Selecting a Transport Mode Based Upon Flow Rate
Guidelines for Selecting a Transport Mode Based Upon Distance
. . . . . . . . . . . . . . . . 121
. . . . . . . . . . . . . . . . . 122
Approximate Capital Costs for the Various Transfer Alternatives Based Upon Capacities ............................................... 125
Illustrations of Dilute Phase Pneumatic Conveyors ............................ 126
Illustrations of Dense Phase Pneumatic Conveyors ............................ 128
Illustration of an Air-Activated Gravity Conveyor ............................ 129
Illustration of a Belt Conveyor .......................................... 130
Illustration of a Screw Conveyor ........................................ 131
Illustration of Various Types of Chain Conveyors ............................ 133
Illustration of a Vibrating Conveyor ...................................... 134
Illustration of a Bucket Elevator ......................................... 135
Processing Equipment Suitable to Hydrate By-product Materials . . . . . . . . . . . . . . . . . . 137
Pelletizing Systems .................................................. 140
Equipment Components Used During Case Study ............................. 143
Construction Procedures for Case Study . . . . : .............................. 145
Summary of General Design Requirements for the Five Alternatives
Typical Industrial Landfill Containment System .............................. 149
Reduced Requirements Landfill Design .................................... 150
Containment Layer Description ......................................... 152
Cover Layer Assessment .............................................. 153
. . . . . . . . . . . . . . . 148
viii
LIST OF FIGURES (Continued)
Page
62 Arid Area Cover Layer Assessment ...................................... 154
63 Leachate Collection System Plan View and Typical Section ..................... 156
64 Reduced Requirement Containment System Options ........................... 160
65 Standard Proctor Curve Developed During Pre-Construction Study . . . . . . . . . . . . . . . . . 162
66 Strength Gain During Pre-Construction Study ............................... 163
67 Upstream Stack Construction Method ..................................... 168
68 Typical Stack Design ................................................ 170
69 Disposal of By-product in Area Surface Mine ............................... 174
70
71
Disposal of By-product in Contour Surface Mine ............................. 175
Methods Used in Demonstrating a Performance-Based Design .................... 186
72 Landfill Water Balance ............................................... 190
73 Plan View of Proposed Landfill ......................................... 197
74 Detail of Landfill Shape Cover Design .................................... 198
75 Demonstration Procedure for an Active Landfill .............................. 202
76 Closed 200-Acre Landfill Scenario Model .................................. 207
77 Conceptual Model for Hydration and Weathering of Calcium-Based Advanced Technology By-products ...................................... 213
78 Average Physical Properties of Core Samples from the Colorado Test Cell ............................................................ 223
79
80
Mineralogy of Core Samples Collected from the Colorado Test Cell
Leachates of Colorado Ash Cores ........................................ 225
............... 224
Concentration Trends. for the RCRA Trace Metals in Deionized Water
ix
.... rr.- -. ...... ............ . < $ 1 . i . . \ J .P ...... .... L , , . . . 4 . .I ,. .... . ' r . ........ . . . . . . . . . .. . . . -_._. -.-
LIST OF FIGURES (Continued)
Page
81
82
83
84
85
86
87
88
89
90
91
92
93
94
95
Average Physical Properties of Ohio Ash Core Samples ........................ 227
Fracturing in the North Cell ............................................ 229
Fracturing in the South Cell ............................................ 229
Field Permeameter Results from the Ohio Test Site ........................... 230
X-ray Diffraction Mineralogy of Ash Cores from the Ohio Test Cells . . . . . . . . . . . . . . 230
Average Concentrations of Selected Analytes in ASTM Deionized Water Leachates of the Initial Ash Composite and Quarterly and Annual Core Samples from the Ohio North Cell ....................................... 232
Chemistry of Pore Waters from the North Cell .............................. 232
Average Trace Element Concentrations in North Cell Lysimeters and Deionized Water Leachates of Core Samples for Each Sampling Event . . . . . . . . . . . . . 233
Groundwater Quality at the Ohio Site ..................................... 234
Average Physical Properties of Illinois Cell 1 Core Samples ..................... 236
Field Permeability Measurements from Illinois Cell 1 .......................... 238
X-ray Diffraction Mineralogy of Illinois Cell 1 Ash Cores ...................... 239
Comparison of the Major Element Chemistry of Average ASTM Deionized Water Leachates of Ash Core and Average Lysimeter Samples Collected in Six Month Intervals ........................................ 241
Average Trace Metal Concentrations in Cell 1 Pore Waters and Deionized Water Leachates of Core Samples ............................. 242
Concentration Trends of the Four Species in the Shallow Groundwater that are Affected by Leachate Migration from Illinois Cell 1 ..................... 243

I 1
Page
Advanced Coal Technologies ............................................ 2
Implementing Strategies for By-product Management ........................... 4
Handling and Disposal Goals Related to By-product Properties . . . . . . . . . . . . . . . . . . . 24
Bulk Chemistry of FSI Fly Ash ......................................... 28
8
9
Major Element Chemistry of FSI Ash ..................................... 28
Minor and Trace Element Chemistry of FSI Ash ............................. 29
Bulk Chemistry of AFBC Ash .......................................... 36
AFBC Major Element Chemistry ........................................ 36
AFBC Minor and Trace Element Chemistry ................................ 37
10 EP Leachates of AFBC ............................................... 38
11 PFBC Major Element Chemistry ........................................ 41
12 PFBC Minor and Trace Element Chemistry ................................. 41
13 Physical and Engineering Properties of Sodium-Injection Ash .................... 43
14 EP Leachates of Coal Gasification Slag ................................... 46
15 Crystalline Phases in Gasification Ash .................................... 46
16 Summary of Subtitle D Part 258 Criteria ................................... 56
17 Summary of Select Current State Coal Combustion Waste Regulations .............. 59
18 Summary of Georgia’s Solid Waste Criteria ................................ 70
19 Summary of Requirements for a Pennsylvania Class II Residual Waste Landfill .......................................................... 73
20 Summary of Requirements for a Pennsylvania Class III Residual Waste Landfill .......................................................... 74
xi

LIST OF TABLES (Continued)
Page
21
22
23
24
25
26
27
28
29
30
31
32
33
34
35
36
37
38
39
40
41
Typical Permits or Regulatory Actions Required for Nonhazardous SolidWasteDisposal ................................................ 84
Typical Information Required in a Solid Waste Permit Application
References for Hydraulic Design ........................................ 94
Approximate Values of Factor K for USDA Textural Classes .................... 101
. . . . . . . . . . . . . . . . 85
Factor C for Permanent Pasture. Range. and Idle Land ......................... 101
P Factors for Contouring. Contour Stripcropping and Terracing . . . . . . . . . . . . . . . . . . . 102
Summary of Methods to Measure Hydraulic Conductivity Values in the Field and Laboratory ................................................. 108
Suggested Haul Road Design Criteria ..................................... 115
Compacted Clay vs . Geomembrane Liners .................................. 155
Strength and Permeability Results for Both Mix Types ......................... 166
Mining for Advanced Coal Technology By-products
Reuse Options for Advanced Coal Technology By-products ..................... 179
.......................... 172
Chemicals of Concern Listed in RCRA Subtitle D. Part 258 ..................... 184
HELPParameters ................................................... 193
MULTlMED Parameters .............................................. 195
Typical FBC By-product Characteristics ................................... 199
Listed Chemicals of Concern ........................................... 200
Pre-Construction Groundwater Recharge Rate ............................... 204
HELP for Modeling Open Landfill ....................................... 205
MULTIMEDforOpenCell ............................................ 206
HELP for Modeling Closed Landfill Cell .................................. 208
xii
._ .. - .......... I ..
LIST OF TABLES (Continued)
Page
42 Estimated Leachate Contribution to COC Concentrations at Point of Compliance ............................................... 209
43 Theoretical Mineralization Potential and Chemical Water Demand of Advanced Coal Combustion By-products .................................. 214
44 Management Issues for Various Advanced Coal Technologies .................... 220
45 Colorado Site Hydrologic Budget Simulation Results for Long-Term (20-Year) Simulation, Average Values .................................... 222
46 Ohio Site Hydrologic Budget Simulation Results for Long-Term (20-Year) Simulation, Average Values .................................... 227
... XUI

Acronyms, Abbreviations, and Units of Measure
I 1
Acronyms and Abbreviations
ACT Advanced Coal Technology
AEP
ALJ Administrative Law Judge
American Electric Power Service Corporation
AFBC
ASTM
BFBC
CFBC
co
co 2
COC
DAF
EP
EPN
ESP
ET
FBC
FFC
FGD
Atmospheric Fluidized Bed Combustion
American Society for Testing and Materials
Bubbling Fluidized Bed Combustion
Circulating Fluidized Bed Combustion
Carbon Monoxide
Carbon Dioxide
Chemical of Concern
Dilution-Attenuation Factor
Extraction Procedure (Toxicity Test)
Electric Power Research Institute
Electrostatic Precipitator
Evapotranspiration
Fluidized Bed Combustion
Fossil Fuel Combustion
Hue Gas Desulfurization
xiv

ACRONYMS, ABBREVIATIONS, AND UNITS OF MEASURE (Continued)
Acronyms and Abbreviations (Continued)
FSI
H2
HE
HELP
HiV
HSW
IDP
IGCC
LIMB
MCL
MSWLF
MULTWIED
MWe
N2
NO,
NDP
NOA
NOD
Furnace Sorbent Injection
Hydrogen
Hearing Examiner
Hydrologic Evaluation of Landfill Performance (Computer Model)
Horizontal to Vertical
Hazardous and Solid Waste Amendments of 1984
Interval Draft Permit
Integrated Gasification Combined Cycle
Limestone Injection Multistage Burners
Maximum Contaminant Level (Safe Drinking Water Act)
Municipal Solid Waste Landfill
Multimedia Exposure Assessment (Computer) Model
Megawatt Electric
Nitrogen
Nitrogen Oxide
Notice of Draft Permit
Notice of Application
Notice of Deficiency
ACRONYMS, ABBREVIATIONS, AND UNITS OF MEASURE (Continued)
Acronyms and Abbreviations (Continued)
NOR
NPDM
OSHA
P
PA
PAH
PCB
PFA
PFBC
PFD
POC
PVC
R
RCRA
RTC
S
scs SEM
Notice of Receipt
National Pollutant Discharge Elimination System
Occupational Safety and Health Administration
Precipitation
Permit Application
Polycyclic Aromatic Hydrocarbon
Polychlorinated Biphenyl
Pulverized Coal Fly Ash
Pressurized Fluidized Bed Combustion
Proposal for Decision
Point of Compliance
Polyvinyl Chloride
Surface Runoff Volume
Resource Conservation and Recovery Act
Report to Congress
By-product Moisture Storage Volume
U.S. Soil Conservation Service
Scanning Electron Microscope
xvi
ACRONYMS, ABBREVIATIONS, AND UNITS OF MEASURE (Continued)
Acronyms and Abbreviations (Continued)
sox SQG
TCLP
TDS
TIC
TNRCC
TS
ucs
Sulfur Oxide
Small-Quantity Generator
Toxicity Characteristic Leaching Procedure
Total Dissolved Solids
Total Inorganic Carbon
Texas Natural Resource Conservation Commission
Technical Summary
Unconfined Compressive Strength
USDA
U.S. EPA
USGS United States Geologic Survey
USLE
XRD X-Ray Diffraction
Units of Measure
cm/s Centimeter@) per Second
"C Degrees Celsius
ft3 Cubic Foot (Feet)
g/cc Gram(s) per Cubic Centimeter I
idyr Inch(es) per Year
United States Department of Agriculture
United States Environmental Protection Agency
Universal Soil Loss Equation (USDA)

ACRONYMS, ABBREVIATIONS, AND UNITS OF MEASURE (Continued)
Units of Measure (Continued)
lb Pound@)
lblft ’ m 2 Square Meter(s)
m 2/g
mg/g Milligram(s) per Gram
m a Milligram(s) per Liter
mm Millimeter( s)
Pound(s) per Cubic Foot (pcf)
Square Meter(s) per Gram
d Y r Meter(s) per Year
PCf
psi
rpm Revolution(s) per Minute
wt Weight
Pound(s) per Cubic Foot (lb/ft ’)
Pound(s) per Square Inch (lb/in ’)
xviii
- -.

1 Introduction
1.1 Background
Advanced coal technologies encompass a wide range of processes designed to convert coal into energy in a cleaner, more efficient manner. These processes target new approaches to coal combustion, gas cleanup, or coal conversion prior to combustion. The technologies addressed in this document include all types of fluidized bed combustion (FBC), furnace or duct injection dry scrubbing, spray drying, coal gasification, and fuel cell processes. Refer to Table 1 for a listing and brief description of each. All these processes represent emerging technologies that may improve the efficiency or environmental performance of conventional pulverized coal combustion technology with standard wet limestone flue gas desulfurization.
Developing coal conversion technologies have faced major obstacles in the area of by-product management. The materials generated by advanced coal combustion technologies have not been studied as extensively as conventional coal combustion by-products. Management practices for advanced technology by-products have not been standardized and their regulatory status has not been finalized. Earlier studies of advanced coal by-products 2i 3p focused on laboratory characterization of the materials. Although material characterization is an important f i s t step toward defining the regulatory status of these materials in disposal settings, and in identifying suitable reuse opportunities, characterization alone will not support a comprehensive management strategy. This project has developed several management strategies based on field trials of small-scale landfills in an earlier phase of the project, as
well as on published and unpublished sources detailing regulatory issues, current industry practice, and reuse opportunities.
The success or failure of a by-product management strategy will be largely deter- mined by physical and chemical interactions between the by-products and the environment in which they are reused or disposed of. The physical and chemical behavior of interest is influenced by weathering and leaching, ground- water transport and attenuation, and many other phenomena. Landfii behavior must ultimately comply with by-product disposal and groundwater protection regulations. Reuse options may also be subject to a wide variety of codes and standards, depending on the particular reuse identified and the location and market sector targeted.
Advanced coal by-products typically are classified as industrial solid wastes which are regulated at the state level. Most state solid waste regulations specify that composite liner and cap systems should be included in the design of a disposal facility. However, most state regulatory agencies will also reduce these standard requirements if the facility can demonstrate that an alternative design will not adversely affect the environment.
Most state approvals are pre-construc- tion approvals. This means that the applicant must assure the agency that the state criteria will be met, usually by providing technically based predictions of future performance. How- ever, predictions are best developed on the basis of previous experience, and little long- term field experience with advanced coal by- products has been available before this project.
1 Advanced Coal Technology By-product Disposal Management and Design Manual
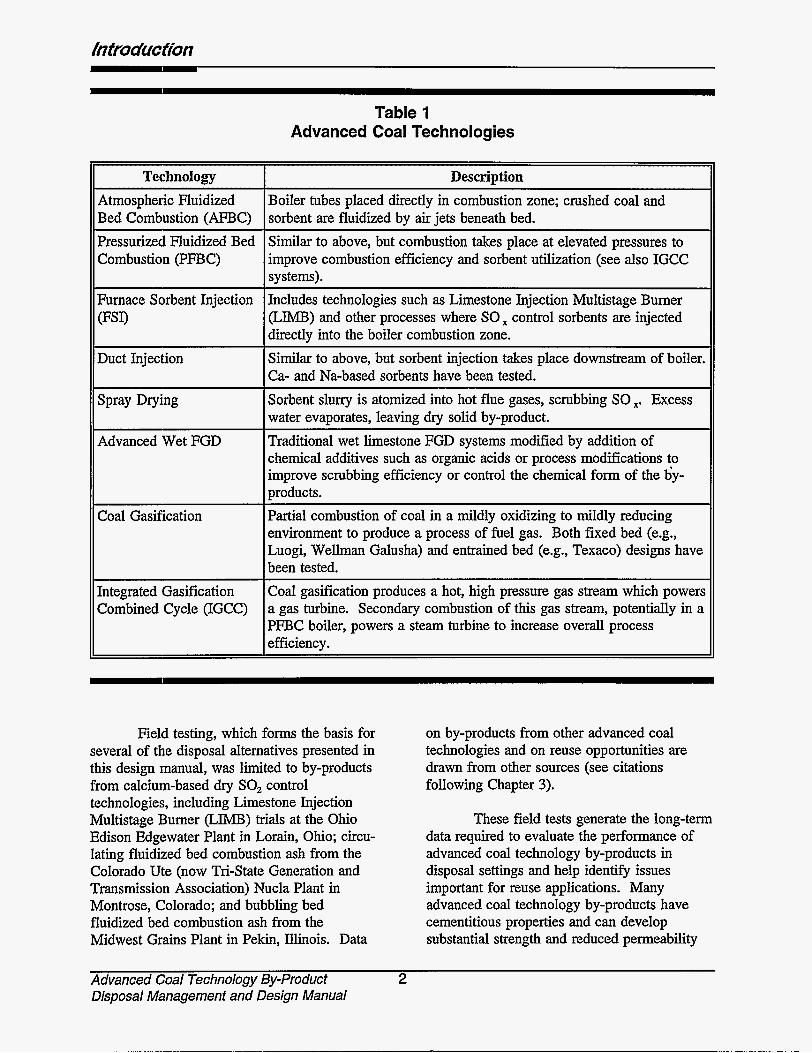
Table 1 Advanced Coal Technologies
Spray Drying
Technology
Sorbent slurry is atomized into hot flue gases, scrubbing SO x. Excess water evaporates, leaving dry solid by-product.
Atmospheric Fluidized Bed Combustion (AFBC)
Description Boiler tubes placed directly in combustion zone; crushed coal and sorbent are fluidized by air jets beneath bed.
Pressurized Fluidized Bed Combustion (PFE3C)
Similar to above, but combustion takes place at elevated pressures to improve combustion efficiency and sorbent utilization (see also IGCC systems).
Furnace Sorbent Injection PSI)
Duct Injection
Includes technologies such as Limestone Injection Multistage Burner (LIMB) and other processes where SO control sorbents are injected directly into the boiler combustion zone. Similar to above, but sorbent injection takes place downstream of boiler. Ca- and Na-based sorbents have been tested.
Advanced Wet FGD
Coal Gasification
Traditional wet limestone FGD systems modified by addition of chemical additives such as organic acids or process modifications to improve scrubbing efficiency or control the chemical form of the by- products. Partial combustion of coal in a mildly oxidizing to mildly reducing environment to produce a process of fuel gas. Both fixed bed (e.g., Luogi, Wellman Galusha) and entrained bed (e.g., Texaco) designs have been tested.
Integrated Gasification Combined Cycle (IGCC)
Coal gasification produces a hot, high pressure gas stream which powers a gas turbine. Secondary combustion of this gas stream, potentially in a PFBC boiler, powers a steam turbine to increase overall process efficiency.
Field testing, which forms the basis for several of the disposal alternatives presented in this design manual, was limited to by-products from calcium-based dry SO, control technologies, including Limestone Injection Multistage Burner (LIMB) trials at the Ohio Edison Edgewater Plant in Lorain, Ohio; circu- lating fluidized bed combustion ash from the Colorado Ute (now Tri-State Generation and Transmission Association) Nucla Plant in Montrose, Colorado; and bubbling bed fluidized bed combustion ash from the Midwest Grains Plant in Pekin, Illinois. Data
on by-products from other advanced coal technologies and on reuse opportunities are drawn from other sources (see citations following Chapter 3).
These field tests generate the long-term data required to evaluate the performance of advanced coal technology by-products in disposal settings and help identify issues important for reuse applications. Many advanced coal technology by-products have cementitious properties and can develop substantial strength and reduced permeability
Advanced Coal Technology By-product 2 Disposal Management and Design Manual

on exposure to water. These self-hardening characteristics are attractive to landfill designers, since they can be used to minimize infiltration and leachate production. Such characteristics are also attractive to engineers seeking low-cost materials for road bases, structural fills, embankments, and as replacement for low- to medium-strength Portland cement concrete. However, before this project, little field data have been available to evaluate the durability of the materials under continuous exposure to the environment.
introduction
1.2 Project Objectives
The overall objective of this research program is to develop guidelines for the management of by-products from advanced coal combustion processes. At the inception of the project this overall goal was divided into the following three broad areas of application for field data: 1) as input to predictive models; 2) as input to develop design guidelines; and 3) as evidence of material behavior in the disposal environment. Since that time (1986), the regulatory climate has changed: source reduction and waste minimization are now key components of any by-product management strategy. Therefore, we have added reuse considerations to this design manual.
Field results from the five test cases examined under this project, together with results from other ongoing research, provide a basis for predictive modeling of the long-term performance of some advanced coal by- products on exposure to ambient environmental conditions. This predictive capability is useful to designers of disposal facilities and large- volume reuse applications, and the designers, managers, operators, and staffs of regulatory agencies who must evaluate proposed facilities.
This manual is intended to provide a reference database and development plan for designing, permitting, and operating facilities where advanced coal technology by-products are managed. The design guidelines and case studies presented in this report are intended to
be used for informational purposes only; proposed reuse or disposal plans should be evaluated for each site individually.
Finally, it is hoped that the test program described in this manual and in previous reports on the individual test sites will serve as a model for collecting and interpreting data to be used in the permitting process. In the course of the study many different monitoring techniques were evaluated. Although some techniques performed as expected, many proved to be poorly suited to particular materials or site conditions (see discussion in Chapter 9).
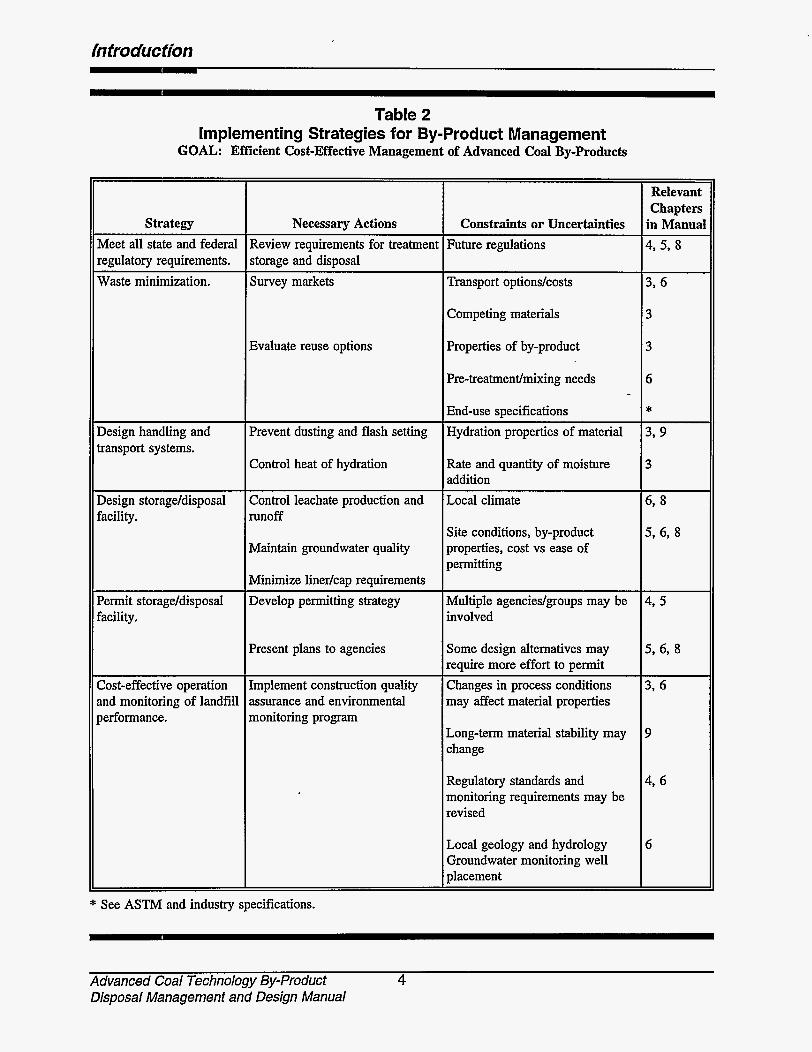
Table 2 illustrates how the overall goals and strategies described in this manual fit with the actions necessary to effectively manage advanced coal by-products. It also shows how the project goals and strategies mesh with the constraints and uncertainties involved in developing and operating a by- product management facility over a design lifetime of 30 years or more. For each subject, relevant chapters of this design manual are indicated.
1.3 Management Alternatives
The management alternatives discussed in this design manual include both disposal and reuse options. The disposal alternatives are based on a review of representative state and federal regulations and on field experience from a number of small-scale landfills constructed in an earlier phase of this project. Experience with these landfii test cases provided the basis for developing the three basic design alternatives for facilities handling the final disposal of advanced coal by-products which are discussed in this manual. Reuse alternatives include both beneficial uses of raw by-products in large-volume applications, such as mine remediation and reuse of processed by- products in higher-value, lower-volume manufactured products.
3 Advanced Coal Technology By-product Disposal Management and Design Manual
/n froduc fion
Table 2 Implementing Strategies for By-Product Management
GOAL: Efficient Cost-Effective Management of Advanced Coal By-products
Strategy Meet all state and federal regulatory requirements. Waste minimization.
Design handling and xansport systems.
Design storageldisposal Facility.
Permit storageldisposal racility.
2ost-effective operation md monitoring of landfill ierformance.
Necessary Actions Review requirements for treatment ;torage and disposal Survey markets
3valuate reuse options
?revent dusting and flash setting
2ontrol heat of hydration
Zontrol leachate production and unoff
vlaintain groundwater quality
vlinimize linerlcap requirements levelop permitting strategy
?resent plans to agencies
inplement construction quality asurance and environmental nonitoring program
* See ASTM and industry specifications.
Constraints or Uncertainties Future regulations
Transport optionslcosts
Competing materials
Properties of by-product
Pre-treatmentlmixing needs
End-use specifications Hydration properties of material
Rate and quantity of moisture addition Local climate
Site conditions, by-product properties, cost vs ease of permitting
Multiple agencieslgroups may be involved
Some design alternatives may require more effort to permit Changes in process conditions may affect material properties
Long-term material stability may change
Regulatory standards and monitoring requirements may be revised
Local geology and hydrology Groundwater monitoring well placement
Relevant Chapters
in Manual 4, 5, 8
3, 6
3
3
6
* 3, 9
3
6, 8
5, 6, 8
4 7 5
5, 6, 8
3, 6
9
4, 6
6
Advanced Coal Technology By-product 4 Disposal Management and Design Manual

Introduction
The design alternatives presented in this manual are intended to give the reader information covering a broad range of options. This broad focus is necessary because of the diverse state regulations that currently govern the disposal of advanced coal by-products and the variety of possible beneficial uses of the materials. The following basic design alternatives are discussed in this manual:
t Alternative 1Traditional Landfill Containment System Designs;
F Alternative 2-Reduced Requirements Landfill Designs;
F Alternative 3-By-product Stacking Disposal
F Alternative 5-By-product Reuse Options.
Alternatives 1 through 3 correspond to the basic landfiil classifications typically listed in state industrial solid waste regulations governing advanced coal by-product disposal. For example, most states specify that certain design elements be included in the design of an industrial solid waste landfill. These design elements typically include composite cap, liner, and leachate collection systems. However, most state regulators will reduce these standard requirements if the facility operator can demonstrate that an alternative design will provide equivalent protection of the environment. Methods used to make these demonstrations are discussed in Chapter 8 of this design manual.
State regulatory agencies also have reduced requirements for by-product disposal if it can be classified as a beneficial use (e.g., mine reclamation, structural fill). In fact, some states exempt such uses from the permitting process to encourage industry to fiid beneficial uses for this type of material. Where by- product materials are reused in manufactured
products which are not directly placed in the environment, other types of certification may be required, such as compliance with American Society for Testing and Materials (ASTM) standards, product quality specifications, or building codes.
Each alternative is discussed in detail in Chapter 7; however, brief overviews of the alternatives appear below.
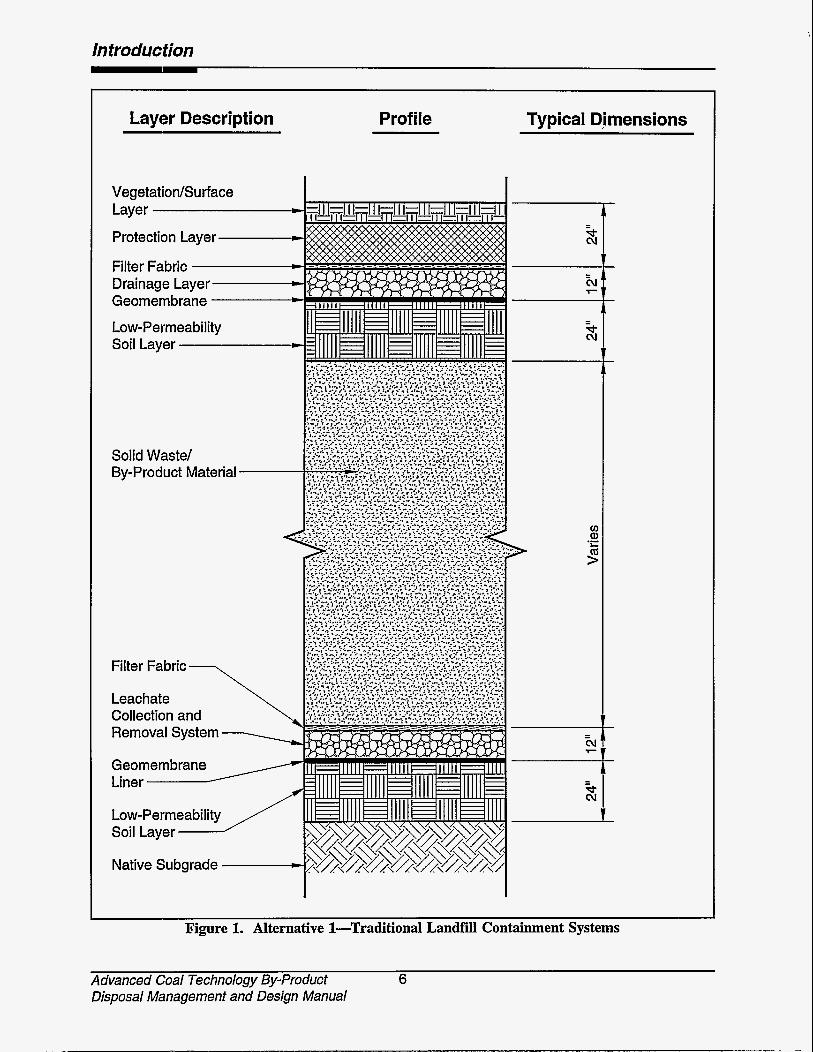
Alternative 1 includes the design ele- ments that most states require for traditional industrial solid waste landfills. However, these regulations cover a broad range of industrial wastes which, in most cases, are considered to have a higher degree of hazard than advanced coal by-products. An example of the design elements that are typically required at an industrial solid waste facility are shown in Figure 1. This is a general figure derived from regulations from several states; design requirements vary greatly from state to state. The complex linedeachate collection system in this design makes Alternative 1 the high-cost, low-liability alternative.
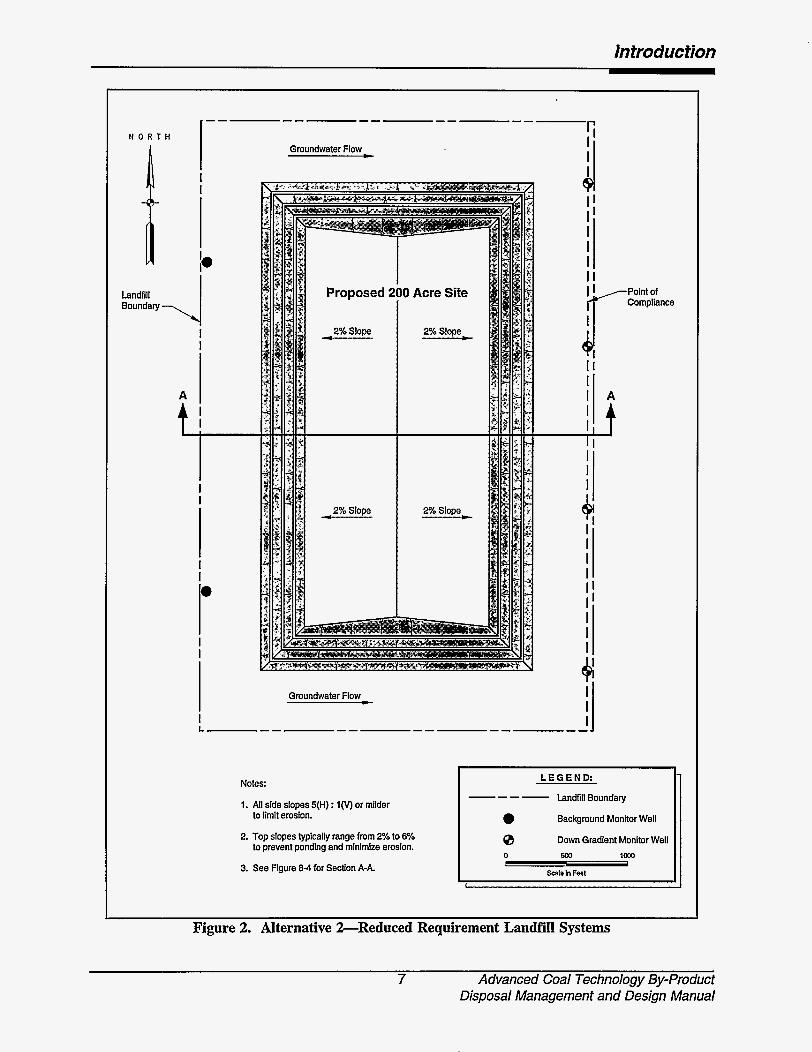
Alternative 2 takes advantage of reduced design requirements accepted by many states. This alternative is supported by the laboratory and field research carried out as an earlier part of this project (see Chapter 9) which provided data on site conditions and by- product types generally suitable for these disposal facility designs. The effect of elim- inating other design elements such as leachate collection and groundwater monitoring systems is discussed in Chapter 7. Alternative 2 may contain several variations on the facility shown in Figure 2. Most states allow a reduction in the number and type of design elements speci- fied in their basic industrial solid waste landfillhequirements if it'can be demonstrated that the design modifications will provide equivalent protection of environmental resources. For most types of advanced coal by-products, reduced requirements will include eliminating or reducing the leachate collection liner and final cover system requirements.
5 Advanced Coal Technology By-product Disposal Management and Design Manual
In froducfion
Layer Description
VeaetatiotdSurface
Profile Typical Dimensions
Figure 1. Alternative 1-Traditional Landfill Containment Systems
Advanced Coal Technology By-product 6 Disposal Management and Design Manual
Introduction
N o i T H I i -4 Landfill
Boundary
I I
I
D
Groundwater Flow
Proposed 2
I ' I I
) I I I I I I
1 I I
I I I
4 I
$I I I I
I I I I I;
4
I I I
Groundwater Flow
Notes:
1. All side slopes 5(H) : 1 0 or milder
2. Top slopes lypically range from 2% to 6% to prevent ponding and minimize erosion.
to limit erosion.
3. See Figure 8-4 for Section A-A.
Point of /Compliance
A
f
L E G END:
Landfill Boundary ---- a Background Monitor Well
0 Down Gradient Monitor Well 0 Ky) ¶Do0
Scale h Feet
Figure 2. Alternative >Reduced Requirement Landfii Systems
7 Advanced Coal Technology By-product Disposal Management and Design Manual

Introduction
This alternative takes advantage of the cementitious properties of some advanced coal combustion by-products and by-product mixtures to limit leachate production.
The costs of this alternative may be substantially lower than for facilities designed with standard containment systems, but additional engineering and environmental characterization of the by-product and site may be required to limit potential liability.
Alternative 3 (by-product stacking method) is patterned after a method of disposal typically associated with by-product gypsum from the phosphate fertilizer industry. As opposed to the previous alternatives, Alterna- tive 3 discusses a "wet" disposal technique. In this method, illustrated in Figure 3, an earthen starter dike is fust constructed around a lined sedimentation pond and stacking area. By- product is then pumped to the sedimentation pond in slurry form, usually 15 to 20% solids, and allowed to settle and drain. Process water is decanted and returned to the plant. Once sufficient sediments build up within the pond, the material is excavated with a dragline to raise the perimeter dikes of the stack. The process of sedimentation, excavation, and raising of the perimeter dikes continues regularly during the active life of the stack.
Alternative 4 discusses by-product uses deemed beneficial, mine applications, including mine reclamation, and mine backfill. This alternative has the capacity'to manage large volumes of by-product for a low cost and can take advantage of back-haul transport by rail or truck lines that deliver feed coal to the plant.
Alternative 5 discusses by-product reuse in other industrial applications. Several reuse alternatives have been proposed over the years, particularly for FBC by-products. Suggested applications, listed in Figure 4, range from use of the by-product as a lime and nutrient source for agriculture and mining reclamation to use in the production of I
construction products and materials such as cement, concrete, and structural blocks. Additional uses range from neutralization and stabilization of acidic waste sludges to materials recovery. Few of these options have been demonstrated to be both technically and commercially viable on a large scale. Some options have the potential to use only small volumes of by-products and do not offer realistic management alternatives, although they may provide revenues to help offset disposal costs. A detailed investigation of each of these alternatives is beyond the scope of this manual. Selected applications that can use moderate to large volumes of material andthat have a performance record from demonstration projects are evaluated.
1.4 Report Organization
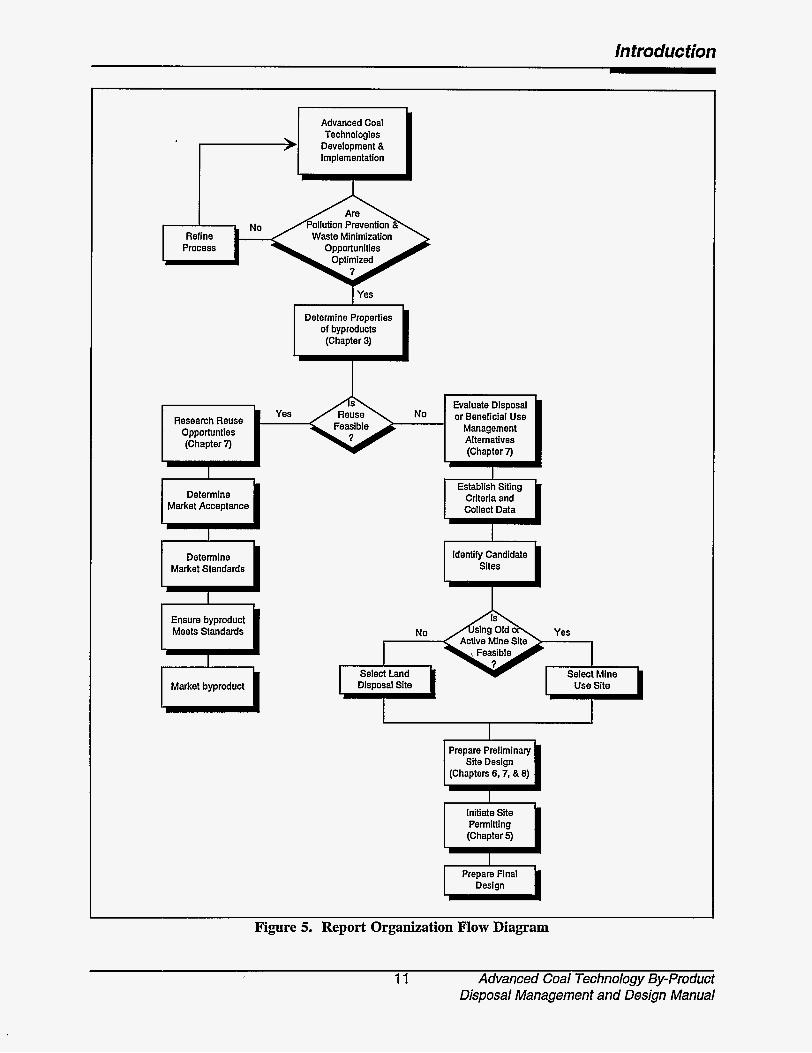
The flowchart shown in Figure 5 illustrates how this report might be used to develop a waste management strategy and how waste management fits into the overall process of technology development. The advanced coal technologies are briefly defined and described in Chapter 2. Simplified process schematics and information on the develop- mental status of each technology considered in the body of the report are provided.
The physical and chemical properties of advanced coal by-products are discussed in Chapter 3. This chapter includes a discussion of process conditions and other variables that affect the properties of the by-products. Handling and conditioning alternatives are briefly described.
Chapter 4 includes a regulatory sum- mary that discusses both existing and proposed federal regulations that affect coal combustion by-products in general and advanced coal tech- nology wastes in particular as they apply to the design alternatives. A detailed review of the current and proposed regulations was con- ducted for three major coal-producing states. Summary information is provided on regula- tions in several other coal producing states.
Advanced Coal Technology By-product 8 Disposal Management and Design Manual

introduction
A L
I - - - I [ Active ~
Pond
I I
Decant Structures
I I--_.,
Site Plan
A A -Clay
Starter Dike
-Clay Exterior Dike
Clay Exterior
Dike7 Horizontal Discharge
Pipe 7 Active Divider Drained Pond Dike Pond
I l l Clay Starter Dike f ,-Perimeter Ditch
Liner J -Fixed Vertical Riser Type Decant Stuctures
Cross-Section A - A
Figure 3. Alternative >Typical By-product Stacking Method
9 Advanced Coal Technology By-product Disposal Management and Design Manual

timing Agent Mine and Reclamation Soil Amendment Nutrient Source
I Construction Materials
Cement Production Road Bases Masonry Units Synthetic Aggregate Polymer Fills Mining BacMili
Acid Neutmlization s0 ,Coml Liners Acid Mine Drainage
Treabnent
Figure 4. Possible By-product Utilization Options
Site selection and permitting are dis- 2. Electric Power Research Institute. cussed in Chapter 5. Chapter 6 dis&sses man- agement facility components and equipment, including runoff and erosion controls, ground- water monitoring systems, support facilities and equipment to store, transport, and process by- product materials. A detailed evaluation of each design alternative is included in Chapter 7, including a discussion of design elements, permitting, construction and operating procedures, and economic feasibility. Chapter 8 contains a case study applying computer techniques to develop a performance-based design. Chapter 9 presents the results and conclusions from the test cell case studies.
1.5 Citations
1. Electric Power Research Institute. EPRI CS-2559. Landfill Disposal of Limestone Dual Alkali Hue Gas Desulfurization Waste. Palo Alto, California, 1982.
3.
4.
EPRI CS-3715. Composition and Leaching of FBC Wastes at the Alliance Test Facility. Palo Alto, California, 1984.
Electric Power Research Institute. EPRI GS-6439. Long-Term Leaching Tests with Coal Gasification SlaE. Palo Alto, California, 1989.
U.S. Environmental Protection Agency, Industrial Environmental Research Laboratory. Proiect Summary: Assessment of Huidized-Bed Combustion Solid Wastes for Land Disposal. Research Triangle Park, North Carolina, 1983.
Advanced Coal Technology By-product 10 Disposal Management and Design Manual
In froducfion
Advanced Coal Technologies
Development & Implementation
Waste Minimization Process
Research Reuse Opporhmties (Chapter 7)
Determine Market Acceptance
I Determine Market Standards
Ensure byproduct Meets Standards
I
Market byproduct U
Yes
Determine Properties of byproducts (Chapter 3)
Evaluate Disposal No or Beneficial Use
Management Alternatives (Chapter 7) -
I Establish Siting
Criteria and Collect Data
Prepare Preliminary Site Design
Permitting
Figure 5. Report Organization Flow Diagram
11 Advanced Coal Technology By-product Disposal Management and Design Manual

This Page Intentionally Left Blank
12
. . . . , . , , . . -.. . . - --.. I. . . . . . , I ,... I . . - _ . . . .

2 Advanced Coal Technology Descriptions
I . ,,
This chapter gives a general overview of some of the more common advanced coal technologies, with an emphasis on furnace sorbent (lime or limestone) injection and atmospheric fluidized bed combustion. Summary information on pressurized fluidized bed combustion, calcium spray drying, dry sodium- and calcium-duct injection, and coal gasification technologies is also included. The purpose of this chapter is not to provide a complete survey of advanced coal technology processes, but rather to give general process information on the various technologies.
2.1 Furnace Sorbent Injection FSI)
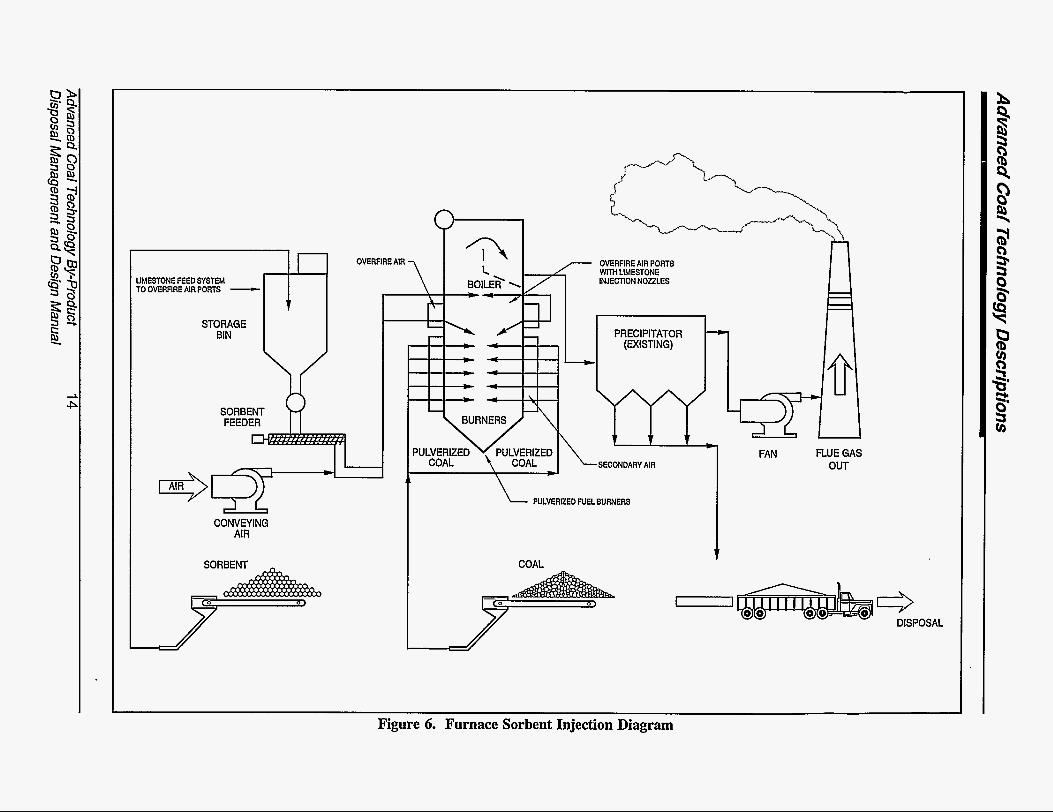
FSI technology involves the injection of a powdered sorbent, either lime or limestone, directly into the combustion zone of the boiler along with the pulverized coal. Injection may be through separate nozzles or by mixed feed through one set of nozzles. In the boiler, the calcium-based sorbent mixes with SO, to form calcium-sulfate or -sulfite compounds. By injecting sorbent in the combustion zone, the residence time is longer than for downstream injection, increasing SO, removal from the flue gas. The amount of SO, removal achieved depends on the type of sorbent used and on the degree of mixing between pulverized coal and sorbent in the boiler '. The unspent sorbent and reaction products are then collected along with the coal ash in conventional particulate control systems. A schematic diagram of the FSI process is shown in Figure 6.
FSI technology can be retrofit relatively easily and inexpensively on existing
boilers, and can be used in conjunction with other retrofit technologies such as multi-phase burners. Lime or limestone injection multi- phase burner (LIMB) systems are used to decrease both SO, and NO, emissions simultaneously.
Currently, only one plant employing FSI technology is in full operation: the Cherokee Plant, a 350-megawatt plant located in Denver, Colorado, operated by Public Service Company of Colorado.
2.2 Atmospheric Fluidized Bed Combustion (AFBC)
AFBC is an advanced coal technology that reduces SO, emissions by introducing a coarsely crushed alkaline sorbent, usually limestone, into the combustion zone. High- velocity air is forced into the boiler, suspend- ing and mixing the sorbent and coal during combustion. The primary heat tubes in AFBC boilers are located within the fluidized combustion bed, increasing the efficiency of heat transfer and allowing the coal to be burned at lower temperatures than those encountered in conventional coal combustion, limiting the formation of NO, compounds. Figure 7 is a schematic diagram of the AFBC process.
During combustion, the limestone is calcined to lime, which reacts with SO, generated from sulfur in the coal to produce calcium sulfate. The calcium sulfate and any unreacted sorbent are removed along with the coal ash, either as bed drain material or as fly ash captured using conventional particulate control systems.
13 Advanced Coal Technology By-Product Disposal Management and Design Manual
STORAGE
SORBENT FEEDER
CONVEYING AIR
SORBENT -
7 I PULVERIZED FUEL BURNERS
COAL
FLUE GAS OUT
0 DISPOSAL
Figure 6. Furnace Sorbent Injection Diagram

COAL
COAL AND SORBENT HANDLING
CYCLONE COLLECTOR
ESP OR FABRIC FILTER IA I
I -L ’ I I I n \ r rn i i ni JLFUR y 7 7 ~uiviruunuq UNSPENT
SORBENT
l==r m BOTTOM ASH
DISPOSAL
AIR INJECTORS 1
A FAN
I STEAM
STEAM TURBINE GENERATOR ELECTRIC POWER
Figure 7. Atmospheric Fluidized Bed Combustion Diagram
Advanced Coal Technology Descriptions
Several utilities currently operate AFBC plants, ranging from 25 to 200 megawatts. The Nucla (Colorado), Shawnee (Kentucky), TNP One and Two (Texas), and Tacoma Two (Washington) plants all have at least one operational unit using AFBC technology. Wisconsin Electric and Power currently has three 200-megawatt AFBC units planned for its Oak Creek NE Plant. Many industrial AFBC units are also in operation.
2.3 Calcium Spray Drying
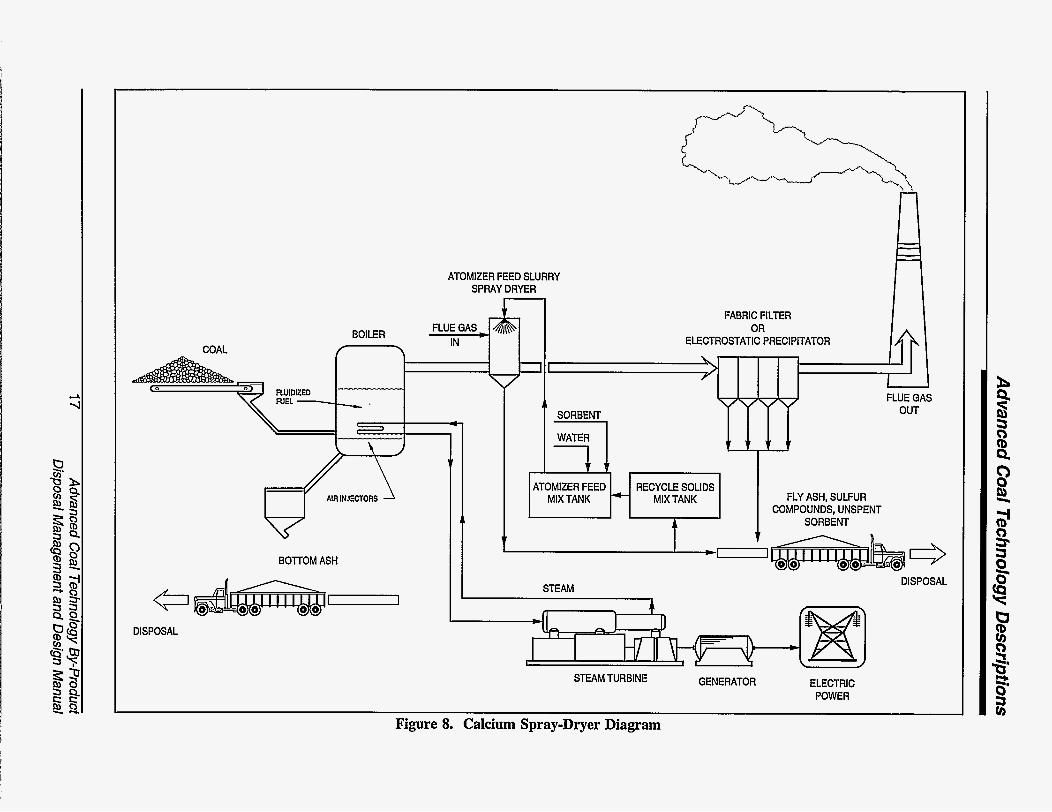
Spray-dryer systems introduce an atom- ized slurry of alkaline sorbent, usually slaked (hydrated) lime, into the hot flue gas. The lime reacts with the SO, in the flue gas to form calcium sulfate and sulfite particles that are removed by fabric filters or ESPs. Although the sorbent is introduced as a slurry, it is dried in the hot gas stream resulting in a dry waste material. Figure 8 shows a schematic diagram of the calcium spray drying process.
2.4 Pressurized Fluidized Bed Combustion (PFBC)
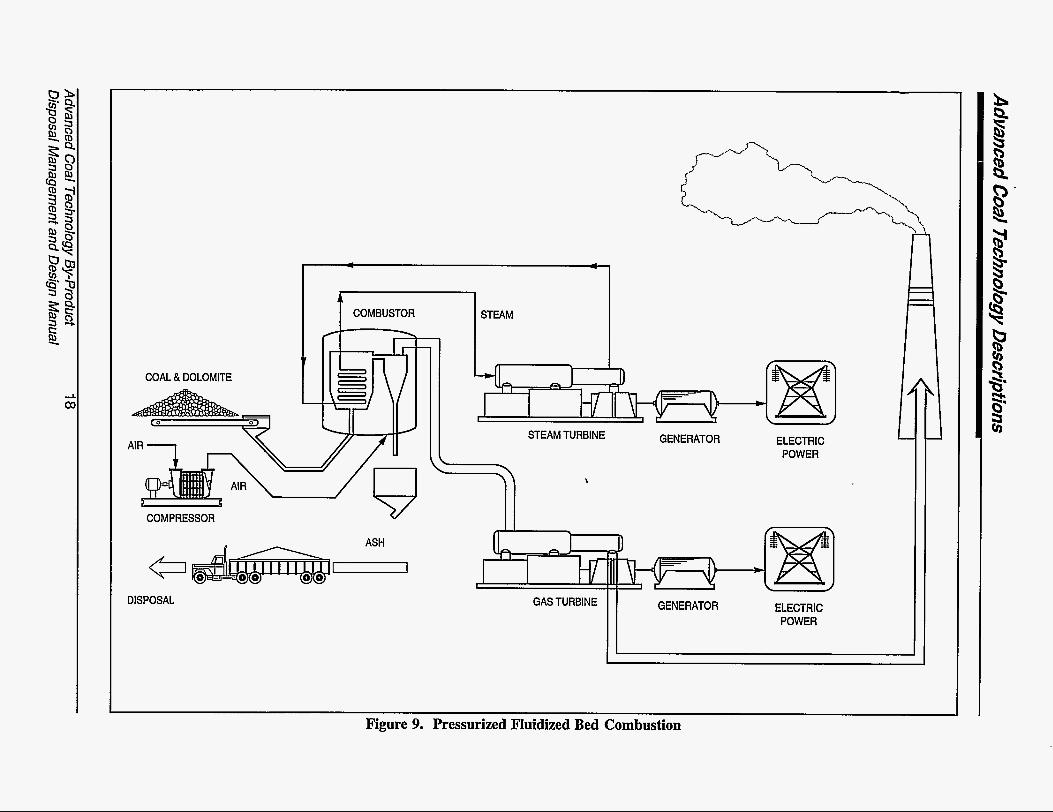
Three types of PFBC technology are now in development: bubbling, circulating, and second generation. Figure 9 shows a diagram of a generalized PFBC system. PFBC systems are similar to AFBC systems, except that combustion takes place at pressures of 10 to 16 atmospheres. The increased pressure of the system allows combustion to take place at lower temperatures and in a more compact bed while maintaining overall thermal efficiency. Under the combustion conditions in PFBC boilers, the sorbent is not generally calcined to lime. Increased residence times and greater fuel flexibility are two of the benefits of PFBC. PFBC has the potential to be used as a retrofit technology ’.
In the United States, seven PFBC demonstration systems are either on-line or in the planning or construction stage. Ohio Power’s Tidd Plant in Brilliant, Ohio, is the fiist full-scale PFBC system (70-We) in the
country. Two 340-MWe PFBC plants are currently in the planning stage; one will be in West Virginia, the other in Jap-an.
2.5 Dry Sodium and Calcium In- Duct Injection
This SO, control process involves the injection of a sodium- or calcium-based sorbent directly into the flue gas downstream of the boiler. The process is generally the same whether a sodium- or calcium-based sorbent is used. Figure 10 is a schematic diagram of an in-duct injection system. Common sodium- injection sorbents are sodium carbonate, bicarbonate, or sesquicarbonate; calcium-injec- tion systems generally use lime or hydrated (slaked) lime. Steam or a fine mist of water may also be injected with the sorbent to improve the SO, removal efficiency ’. The reaction products and unspent sorbent are then removed along with the coal ash by conventional methods.
2.6 Coal Gasification
Several different coal gasification technologies have been developed, including fiied-bed, entrained-bed, fluidized-bed, atmospheric, and pressurized designs. Most of these systems employ the same basic chemical steps of devolatilization in a reducing atmosphere and combustion in an oxidizing atmosphere to convert the coal into a gaseous fuel. In many gasifiers these two processes occur sequentially as the coal moves through the gasifier. In fixed bed designs, coal feeds into the top of the gasifier, where heat from the combustion zone lower in the reactor dries and devolatilizes it. In the reducing atmosphere in this portion of the gasifier, the gas extracted form the coal consists of hydrogen, carbon monoxide, methane, nitrogen, carbon dioxide, and steam4. As the devolatilized coal continues to move through the gasifier, it reaches the combustion zone in the lower portion of the reactor. Here air (or oxygen) and steam are fed in through a grate, producing high-temperature-combustion of the remaining
Advanced Coal Technology By-product 16 Disposal Management and Design Manual
- 4
\ I AIR INJECTORS
ATOMIZER FEED SLURRY SPRAYDRYER
FABRIC FILTER
ELECTROSTATIC PRECIPITATOR
FLY ASH, SULFUR COMPOUNDS, UNSPENT
SORBENT
BOllOM ASH
U
DISPOSAL
STEAM DISPOSAL
GENERATOR ELECTRIC STEAM TURBINE POWER
Figure 8. Calcium Spray-Dryer Diagram
COAL & DOLOMITE
1 COMBUSTOR
COMPRESSOR v
DISPOSAL
7 STEAM TURBINE I GENERATOR ELECTRIC
POWER L
GAS TURBINE GENERATOR ELECTRIC POWER
Figure 9. Pressurized Fluidized Bed Combustion

Advanced Coal Technology Descriptions
I I I I I
z E 8
I ’ \
19 Advanced Coal Technology By-Product Disposal Management and Design Manual

Advanced Coal Technohgy Descriptions
carbon in the coal. In many cases, the combustion temperatures are high enough (ca 1600°C) to produce a molten slag from the coal ash fractions.
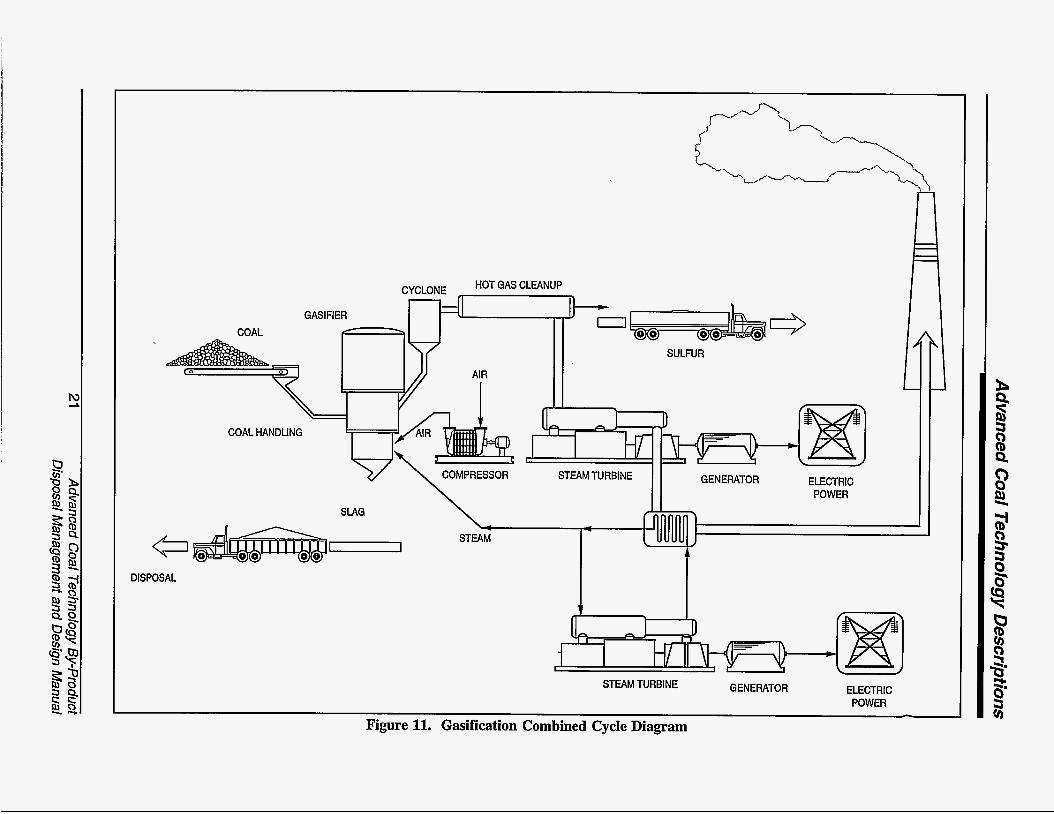
The fuel gas derived from the gasification is treated to remove particulate matter and condensible hydrocarbons before further use. Sulfur in the fuel gas may be removed as elemental sulfur by selective catalytic reduction, or it may be scrubbed from the combustion gases after the fuel gas is burned by using a PFBC system or other SO control technology. If hot-gas cleanup procedures are used in conjunction with a pressurized gasifier design, the fuel gases may by used to drive a gas turbine downstream from the gasifier and then be combusted to power a secondary steam turbine in an integrated coal gasification combined-cycle (IGCC) operation, as shown in the schematic in Figure 11. IGCC systems have the potential for significantly higher thermal efficiencies than standard coal-fired steam-electric power plants.
Currently, 11 coal gasification plants are operating worldwide; five of these are in the U.S. Approximately 64 gasification plants are either in the planning or construction stage throughout the world. Fifty-five of these 64 will be used to produce electricity; the remainder are used for chemical production. The United States has the greatest number of coal gasification plants in the planning or construction phase, with 15; the People's Republic of China is currently planning or building eight.
2.7 Citations
1. Electric Power Research Institute. EPRI CS-5783. Laboratory Character- ization of Advanced SO, Control By- Products: Furnace Sorbent Injection Wastes. Palo Alto, California, 1988.
2. Dellefield, R.J. T h e Systems and the Developmental Targets for PFBC." In: Proceedings of the Coal-Fired Power Systems 93-Advances in IGCC and PFBC Review Meeting. U.S. Department of Energy, Office of Fossil Energy, Morgantown Energy Technology Center, Morgantown, West Virginia, 1993. pp. 103-120.
3. Electric Power Research Institute. EPRI GS-6622. Laboratory Character- ization of Advanced SO, Control By- Products: Dry Sodium and Calcium In-Duct Iniection Wastes. Palo Alto,
. California, 1989.
4. Electric Power Research Institute. EPRI EA-2867. Comparison of Solid Wastes from Coal Combustion and Pilot Coal-Gasification Plants. Palo Alto, California, 1983.
Advanced Coal Technology By-product 20 Disposal Management and Design Manual
I HOT GAS CLEANUP CYCLONE
D- O GASIFIER
SULFUR
COAL HANDLING r STEAM TURBINE I I GENERATOR ELECTRIC
POWER SLAG \
DISPOSAL
STEAM TURBINE GENERATOR ELECTRIC POWER -
Figure 11. Gasification Combined Cycle Diagram

This Page Intentionally Left Blank
22
3 Properties of Advanced Coal Tech nology By-Products
This chapter provides a general overview of the physical, chemical, and mineralogical characteristics of by-products from some of the more common advanced coal technologies, with an emphasis on furnace sorbent (lime or limestone) injection (FSI) and atmospheric fluidized bed combustion (AFBC). Summary information on by-products of pressurized fluidized bed combustion (PFJ3C), calcium spray drying, dry sodium and calcium injection, and coal gasification technologies is also included.
This manual does not intend to provide a complete survey of the chemical and physical properties of advanced coal technology by- products reported in the literature, but rather to provide some general information that may be used to predict the behavior of landfilled mat- erials. For the sake of consistency, emphasis was placed on presenting data generated by known and comparable methods. Other reports are available that provide the results of more exhaustive literature searches for this type of information '.
There are several important differences between the by-products of conventional coal combustion and those from advanced coal technologies. The most important of these are the differences in the physical properties, chemical properties, and volume. Differences in the physical and chemical properties are particularly important because they affect by- product reactivity, stability, and leachate production. These differences mean that the management methods used for the by-products of conventional coal combustion may not be suitable for the by-products of advanced coal technologies.
There is great variability in the reported characteristics of by-products from advanced coal burning processes, even among by-products derived from the same general process. The chemical and physical character- istics of the by-products are strongly influenced by the operating conditions and the type of coal burned at each facility. Therefore, the information presented in this chapter should be used as a general guide in predicting by- product characteristics.
The determination of physical, chemical, and mineralogical properties of the by-product will allow the utility operator to answer several important questions:
t How should the by-product be handled- or water-conditioned (i.e., will dusting, heat generation, or flash-setting be a problem)?
How will the by-product behave once it is landfilled? Is the by-product likely to swell, fracture, or produce excess leachate?
Will the by-product meet the appropriate regulations? Does it pose a long-term liability?
Additional important questions are: "What is the approximate volume of by-product that will be generated?" and "Does a reuse option exist for the by-product?" Table 3 relates handling and disposal goals to the various physical, chemical, and mineralogical properties of advanced coal technology by-products and summarizes the variables that affect by-product behavior.
23 Advanced Coal Technology By-product Disposal Management and Design Manual

P!wperf,s of Advanced Coal Technology Byproducfs
Table 3 Handling and Disposal Goals Related to By-Product Properties
Goal:
Strategy:
Design handling and transport systems to: 1) save money and resources, and 2) meet environmental and safety needs. Use material properties to select best design.
Necessary Action Determine transport md storage rolumes. Determine wetting ind dusting Iehavior.
Properties (Methods) Explanation ,Coal composition .Sorbent addition rate
C o a l type and/or required scrubbing efficiency may change, affecting by-product volume.
,Mineralogy
,Particle size (ASTM D 422) ,Particle specific gravity (ASTM D 854)
I ,By-product will consist of ash, reacted reap;ent, and unused reagent. ,Particle size, shape, and density may all affect dusting potential.
,Heat of hydration (ASTM C 110)
,Available lime index (ASTM C 25)
,Truck beds may be damaged by high temperatures. ,Large amounts of unreacted lime may increase moisture demand and heat production upon water addition, and may increase flash-set potential.
>oak Design storage and disposaI facility to: I) saye money and resources, and 2) meet environmental and safety needs.
strategy: Use material properties to select best desip Necessary Action letermine disposal rolumes.
lptimize material roperties for lisposal
'redict nvironmental ,ehavior.
- - - ProDerties fMethods)
,Properties affecting potential for reuse such as strength, mineralogy, etc. Coa l composition .Sorbent addition rate
,Maximum dry density (ASTM D 698)
,Optimum moisture content (ASTM D698) ,Unconfined compressive strength (ASTM D 2166) FMineralog y ,Permeability (ASTM D 2434) ,Dimensional stability (ASTM C 490) +Leachability (TCLP) ,Permeability
Explanation ,By-product utilization may reduce disposal volume. ,Coal type and/or required scrubbing efficiency may change, affecting by-product volume. *Determine as-built, mass-to-volume relationshin ,Material properties constrain design specifications including height, slope, sedimentation pond size, etc. ,Site-specific conditions, including climate, topography, and proximity to populations may also influence design. ,Additional testing may be required by the state. ,Data may be used as input to predictive modeling. .Site-specific conditions, inchding climate, topography, and proximity to populations may also influence design.
Advanced Coal Technology By-product 24 Disposal Management and Design Manual

Properties of Advanced Coal Technology Byproducfs
The properties of many calcium- and sodium-based advanced coal technology by- products can change significantly with expo- sure to water as both short-term and long-term reactions take place. The amount of heat generated by the by-products is largely deter- mined by the water reactivity of sorbent materials. Excess sorbent contained in by- products from dry calcium- and sodium-based advanced coal technologies, such as AFBC and FSI, contributes considerable chemical reactivity to these materials.
In these processes, sorbent is introduced into the combustion zone at high temperatures. The calcium or sodium carbonate sorbent is converted to the oxide. Calcium and sodium oxides are highly reactive, rapidly forming hydroxides in the presence of water and releasing considerable amounts of heat. Calcium and sodium hydroxides also contribute to a high by-product pH. In contrast, sorbent injected into ducts down- stream from the boiler, either in powder (duct inject) or mist (spray dryer) form, experiences lower temperatures. These processes generally convert less sorbent to the oxide form, producing a less reactive, less alkaline by- product.
Many advanced coal technologies produce a larger quantity of solid combustion by-product per unit of energy than does conventional coal combustion. The potential increase in volume is caused by the collection of reacted and unreacted sorbent material along with coal ash in processes such as AFBC, FSI, and other dry sorbent technologies. Other advanced coal technologies, such as coal gasification, may actually produce smaller by- product volumes per unit of energy produced relative to conventional coal combustion. Factors including the required scrubbing efficiency, sorbent injection rate, and the sorbent-to-sulfur ratio influence the amounts of reacted and unreacted sorbent present in by- products from dry sorbent technologies.
Potential increases in by-product volume may be offset if reuse markets can be developed for advanced coal technology by- products. However, the perspective of this manual is that reuse options will augment, rather than replace, landfill disposal as the primary by-product management strategy. Chapter 7, Sections 7.4 and 7.5 discuss the reuse options for these materials.
Facilities that manage several by- product streams (i.e., fly ash, bottom ash, cyclone ash) may choose to composite the materials or to manage them separately. For facilities that composite several by-products, it is important to note that consistent blending of these materials and stable operating conditions enable better prediction of the characteristics of the by-products. This in turn will lead to more reliable behavior of the landfiiled materials.
The remainder of this chapter describes the properties of as-produced by-products from several advanced coal technologies. Chapter 9 provides more detail on long-term weathering reactions that can affect advanced coal technology by-products continuously exposed to the environment in disposal or reuse settings.
3.1 Characterization of FSI By-products
FSI technology involves the injection of a powdered sorbent, either lime or limestone, into the boiler where it scrubs acid gases from the flue gas. The unspent sorbent and reaction products are then collected along with the coal ash in conventional particulate control systems. FSI technology can be retrofit relatively easily and inexpensively on existing boilers. It can be used in conjunction with other retrofit technologies such as multiphase burners. Lime or limestone injection multi- phase burner (LlMl3) systems are used to decrease both SO, and NO, emissions simultaneously.
25 Advanced Coal Technology By-product Disposal Management and Design Manual
Properties of Advanced Coal Technology Byproducts
3.1. I Physical Properfies of FSI Ash
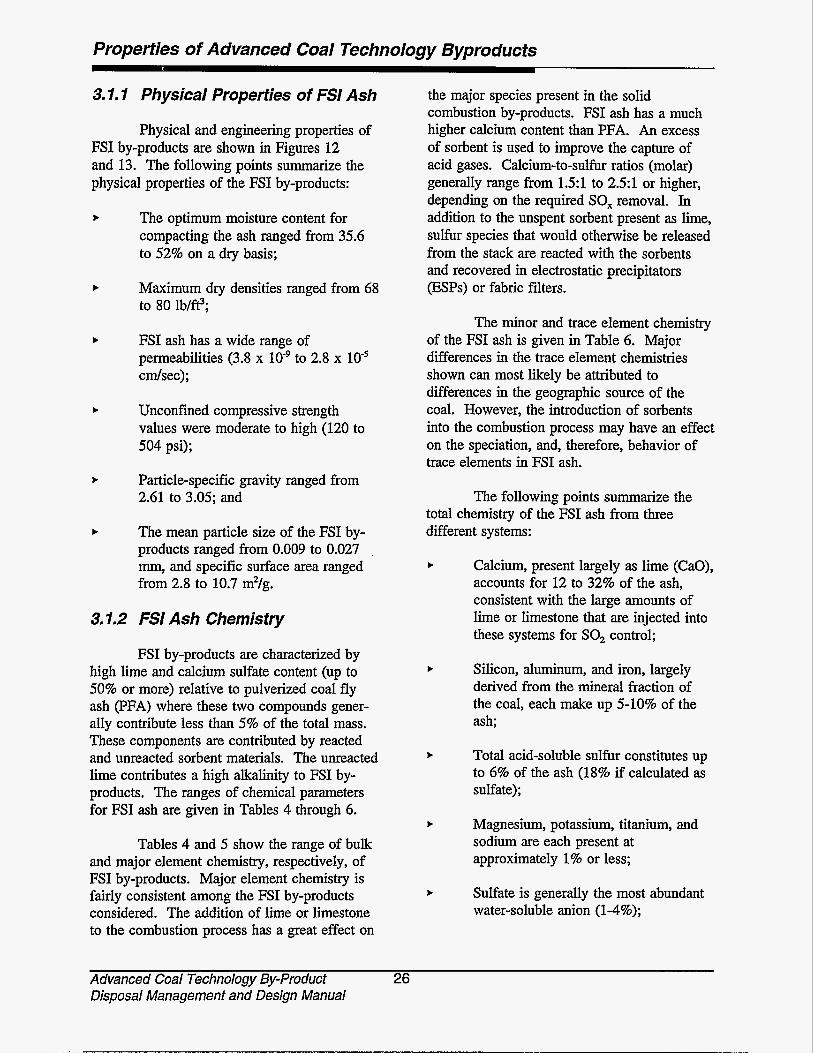
Physical and engineering properties of FSI by-products are shown in Figures 12 and 13. The following points summarize the physical properties of the FSI by-products:
t The optimum moisture content for compacting the ash ranged from 35.6 to 52% on a dry basis;
t Maximum dry densities ranged from 68 to 80 Ib/ft?;
t FSI ash has a wide range of permeabilities (3.8 x 10'' to 2.8 x cdsec);
t Unconfined compressive strength values were moderate to high (120 to 504 psi);
t Particle-specific gravity ranged from 2.61 to 3.05; and
t The mean particle size of the FSI by- products ranged from 0.009 to 0.027 mm, and specific surface area ranged from 2.8 to 10.7 m2/g.
3.1.2 FSI Ash Chemistry
FSI by-products are characterized by high lime and calcium sulfate content (up to 50% or more) relative to pulverized coal fly ash (PFA) where these two compounds gener- ally contribute less than 5% of the total mass. These components are contributed by reacted and unreacted sorbent materials. The unreacted lime contributes a high alkalinity to FSI by- products. The ranges of chemical parameters for FSI ash are given in Tables 4 through 6.
Tables 4 and 5 show the range of bulk and major element chemistry, respectively, of FSI by-products. Major element chemistry is fairly consistent among the FSI by-products considered. The addition of lime or limestone to the combustion process has a great effect on
the major species present in the solid combustion by-products. FSI ash has a much higher calcium content than PFA. An excess of sorbent is used to improve the capture of acid gases. Calcium-to-sulfur ratios (molar) generally range from 1.5:l to 2.51 or higher, depending on the required SO, removal. In addition to the unspent sorbent present as lime, sulfur species that would otherwise be released from the stack are reacted with the sorbents and recovered in electrostatic precipitators (ESPs) or fabric fdters.
The minor and trace element chemistry of the FSI ash is given in Table 6. Major differences in the trace element chemistries shown can most likely be attributed to differences in the geographic source of the coal. However, the introduction of sorbents into the combustion process may have an effect on the speciation, and, therefore, behavior of trace elements in FSI ash.
The following points summarize the total chemistry of the FSI ash from three different systems:
Calcium, present largely as lime (CaO), accounts for 12 to 32% of the ash, consistent with the large amounts of lime or limestone that are injected into these systems for SO, control;
Silicon, aluminum, and iron, largely derived from the mineral fraction of the coal, each make up 5-10% of the ash;
Total acid-soluble sulfur constitutes up to 6% of the ash (18% if calculated as sulfate);
Magnesium, potassium, titanium, and sodium are each present at approximately 1% or less;
Sulfate is generally the most abundant water-soluble anion (1-4%);
Advanced Coal Technology By-product 26 Disposal Management and Design Manual
Properties of Advanced Coal Technology Byproducts
OpUmum Molstun? Mlaxlmum Dry Denstty '-1 I -- 1 I 3 w E m
rn
Lw 40 - 3 3 0
20 D " * 10
OOhb UMBAch Southem Rrrdl Ash 'OhbUMBAsh SwthemRsnhAsh Onkuio Hydm Ash Ontarb HydmAsh
Unconfined Compmlve Strength 600-
Figure 12. Physical and Engineering Properties of FSI Ash
Sources: Electric Power Research Institute. Laboratory Characterization of Advanced SO Control By-Products: Furnace Sorbent Injection Wastes. CS-5783. Palo Alto, California, 1988. U.S. Dept. of Energy, Morgantown Energy Technology Center. Advanced Coal Technology Waste Disposal: Ohio LIMB Site Assessment Report. drafi. Morgantown, WV, 1994.
Specific surface Area
SzAlanRmdlm
-mrb. I
Figure 13. Additional Physical and Engineering Properties of FSI Ash
Sources: Electric Power Research Institute. Laboratory Charaeterization of Advanced SO, Control By-Products: Furnace Sorbent Iniection Wastes. (3-5783. Palo Alto, California, 1988. U.S. Dept. of Energy, Morgantown Energy Technology Center. Advanced Coal Technology Waste Disposal: Ohio LIMB Site Assessment Report. druft. Morgantown, WV, 1994.
27 Advanced Coal Technology By-product Disposal Management and Design Manual
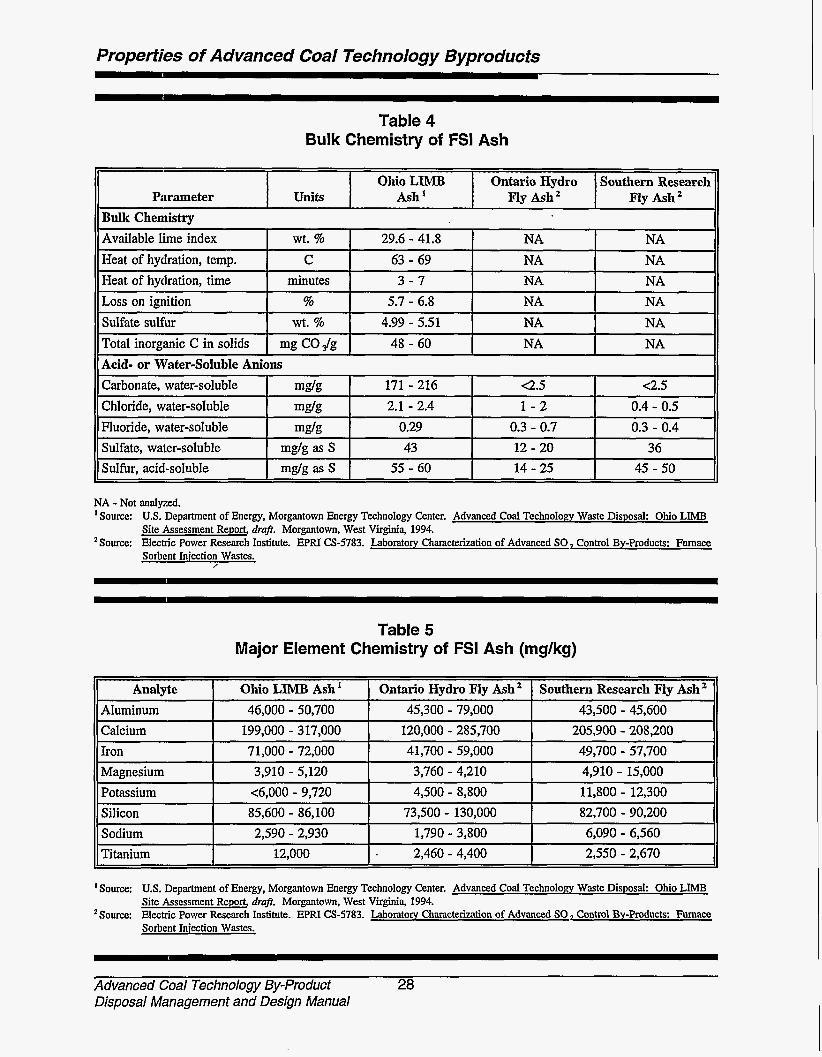
Properties of Advanced Coal Technology Byproducts
Analyte Ohio LIMB Ash Aluminum 46,000 - 50,700 Calcium 199,000 - 317,000 Iron 71,000 - 72,000 Magnesium 3,910 - 5,120
Table 4 Bulk Chemistry of FSI Ash
Ontario Hydro Ply Ash Southern Research J3y Ash 45,300 - 79,000
120,000 - 285,700 41,700 - 59,000 3,760 - 4,210
43,500 - 45,600 205,900 - 208,200 49,700 - 57,700 4,910 - 15,000
NA - Not analyzed. I Source: U.S. Department of Energy, Morgantown Energy Technology Center. Advanced Coal Technology Waste Disposal: Ohio LIMB
Site Assessment Report, dru$, Morgantown. West Virginia, 1994. 'Source: Electric Power Research Institute. EPRI CS-5783. Laboratory Characterization of Advanced SO, Control By-products: Furnace
Sorbent Iniection Wastes. ,'
Table 5 Major Element Chemistry of FSI Ash (mg/kg)
II Potassium I ~6.000 - 9,720 I 4,500 - 8,800 I 11,800 - 12,300 II II Silicon I 85,600 - 86.100 I 73,500 - 130,000 I 82,700 - 90,200 II 11 Sodium I 2.590 - 2.930 I 1,790 - 3,800 I 6,090 - 6,560 II 11 Titanium I 12,000 I . 2,460 - 4,400 I 2,550 - 2,670 II I Source: U.S. Department of Energy, Morgantown Energy Technology Center. Advanced Coal Technology Waste Disposal: Ohio LIMB
Site Assessment Report, dr&. Morgantown, West Virginia, 1994. *Source: Electric Power Research Institute. EPRI (3-5783. Laboratory Characterization of Advanced SO, Control By-Products: Furnace
Sorbent Injection Wastes.
Advanced Coal Technology By-product 28 Disposal Management and Design Manual
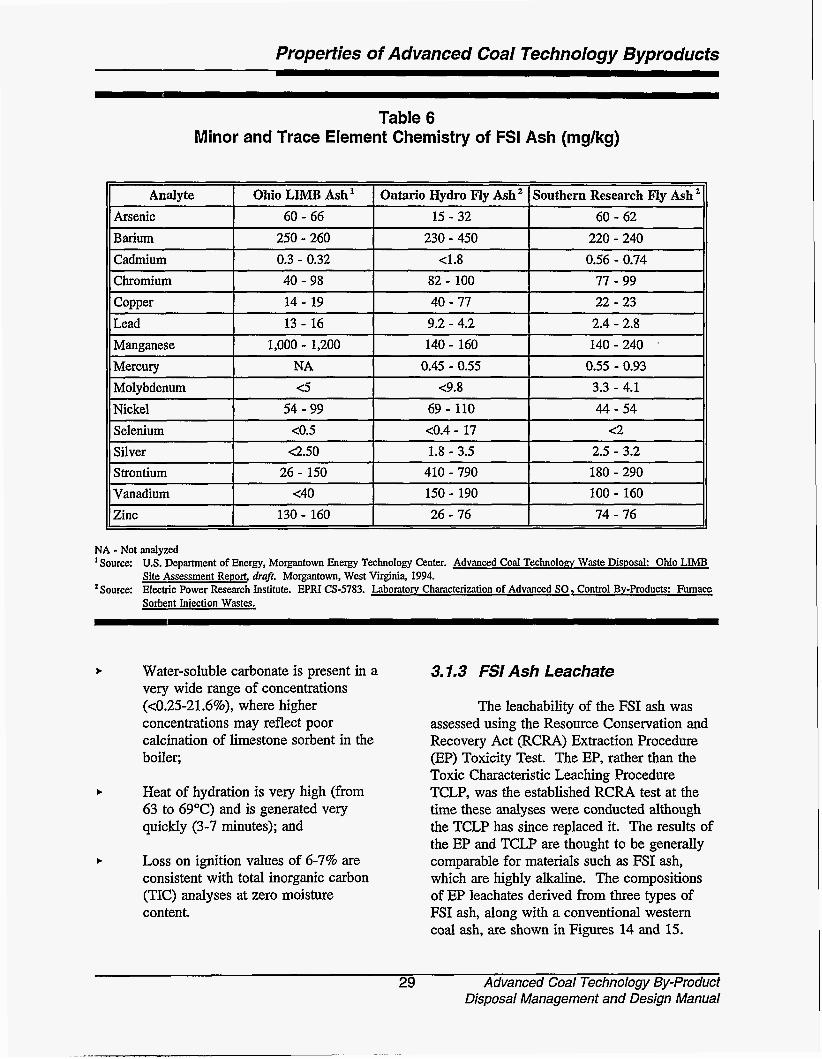
Properties of Advanced Coal Technology Byproducfs
Arsenic Barium
~ ~ ~~
Table 6 Minor and Trace Element Chemistry of FSI Ash (mgkg)
60 - 66 15 - 32 60 - 62 250 - 260 230 - 450 220 - 240
Analyte I Ohio LlMB Ash' I Ontario Hydro FIy Ash2 I Southern Research Ry Ash *
Chromium Comer
40 - 98 82 - 100 77 - 99 14 - 19 40 - 77 22 - 23
Cadmium I 0.3 - 0.32 I c1.8 I 0.56 - 0.74
Lead Manganese Mercurv
13 - 16 9.2 - 4.2 2.4 - 2.8 1,000 - 1,200 140 - 160 140 - 240 '
NA 0.45 - 0.55 0.55 - 0.93 Molybdenum Nickel Selenium
c5 c9.8 3.3 - 4.1 54 - 99 69 - 110 44 - 54
COS ~ 0 . 4 - 17 4 2
Silver Strontium Vanadium Zinc
NA - Not a n a l y d ' Source: U.S. Department of Energy, Morgantown Energy Technology Center. Advanced Coal Technology Waste Disposal: Ohio LIMB Site Assessment Report, draft. Morgantown, West Virginia, 1994.
'Source: Electric Power Research Institute. EPRI CS-5783. Laboratory Characterization of Advanced SO, Control By-products: Furnace Sorbent Injection Wastes.
C2.50 1.8 - 3.5 2.5 - 3.2 26 - 150 410 - 790 180 - 290
c40 150 - 190 100 - 160 130 - 160 26 - 76 74 - 76
t Water-soluble carbonate is present in a very wide range of concentrations (<0.25-21.6%), where higher concentrations may reflect poor calcination of limestone sorbent in the boiler;
t Heat of hydration is very high (from 63 to 69°C) and is generated very quickly (3-7 minutes); and
t Loss on ignition values of 6-7% are consistent with total inorganic carbon (TIC) analyses at zero moisture content.
3.1.3 FSI Ash Leachate
The leachability of the FSI ash was assessed using the Resource Conservation and Recovery Act (RCRA) Extraction Procedure (EP) Toxicity Test. The EP, rather than the Toxic Characteristic Leaching Procedure TCLP, was the established RCRA test at the time these analyses were conducted although the TCLP has since replaced it. The results of the EP and TCLP are thought to be generally comparable for materials such as FSI ash, which are highly alkaline. The compositions of EP leachates derived from three types of FSI ash, along with a conventional western coal ash, are shown in Figures 14 and 15.
29 Advanced Coal Technology By-product Disposal Management and Design Manual

Properties of Advanced Coal Technology Byproducts
6 0.8 5 0.6 8 0.4 c 3 0 2
w -
Arsenic Barium RCRA Umit = 5 m g L RCRA Umit = 100 m g L
0.05 1 1.4 I 1 I
" Ohio UMBAsh Southern Rsrch Ash
1 1 I I 1 Southern RsrchAsh 01
Ohio UMB Ash Ontarlo Hydro Ash Western Coal Ash OntarloHydroAsh WesternCoalAsh
Cadmium Chromium RCRA Umlt = 1 m g L RCRA Umit = 5 mgR
O.(MR I I I
0.005 5 0.004
::: 0" 0.001
0 Ohio LIMB Ash Southern Rsrch Ash
Ontario Hydro Ash Western Coal Ash
0 - 0.05 "
Southem Rsrch Ash ~
Ohio UMBAsh Ontarlo Hydro Ash Western Coal Ash
Range ofvalues reported . q,522B-%%+ Range ofvalues reported 0 Single value above detection limit below detection limit
Figure 14. Range of Reported EP Leachate Compositions for FSI Ash
Sources: Electric Power Research Institute. EPRI (3-5783. Laboratory Characterization of Advanced SO, Control By-products: Furnace Sorbent Iniection Wastes. U.S. Department of Energy, Morgantown Energy Technology Center. Advanced Coal Technology Waste Disposal: Ohio LIMB Site Assessment Report, druj?. Morgantown, West Virginia, 1994.
Advanced Coal Technology By-product 6 30 Disposal Management and Design Manual
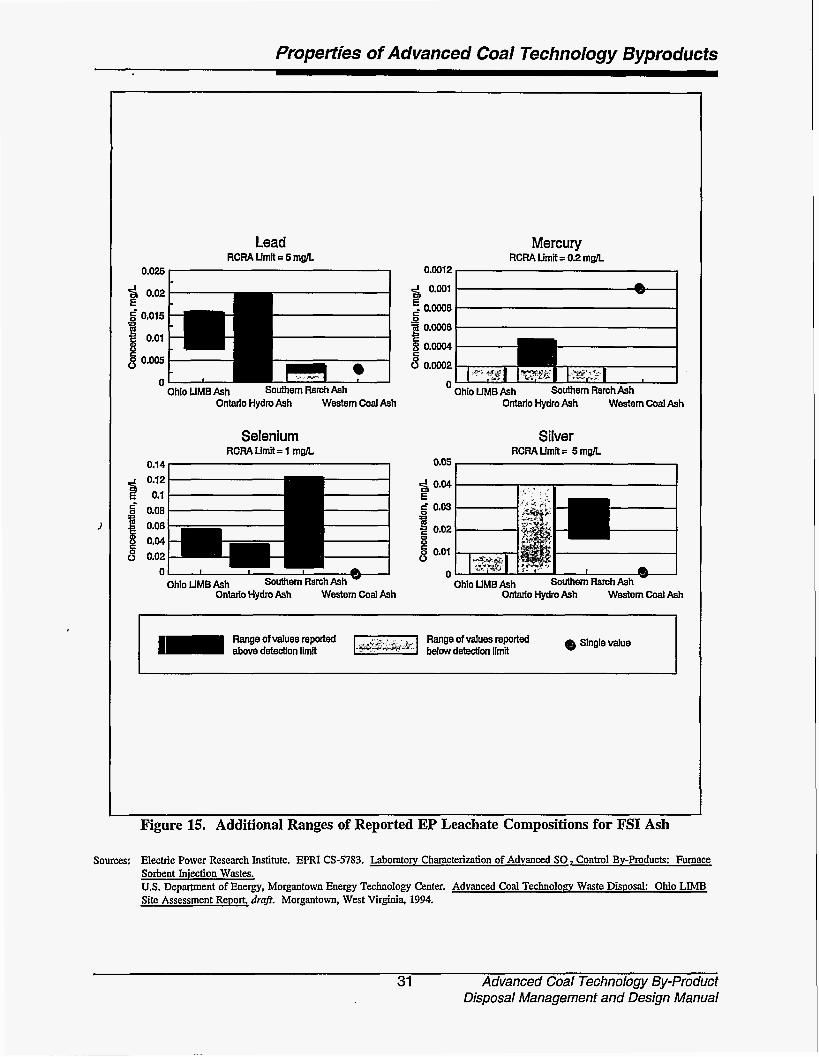
Properties of Advanced Coal Technology Byproducfs
I
Lead RCRA Umit = 5 mgh
0.025 I
Ohio UMB Ash Southern Rsrch Ash Ontarlo Hydro Ash Western Coal Ash
Selenium RCRA umit = 1 mgh
0.14 1
+ 0.12 E 0.1 6 0.08
0" 0.02 r:
0 I
Ohio LIMB Ash Southern Rsrch Ash Ontarlo Hydro Ash Wastern coal Ash
Mercury RCRA Limit = 0 2 rngh
0.0012
.& 0.001
$0.0008
@ 0.0006
" Ohio UMBAsh Southern Rsrch Ash OntarloHydroAsh WesternCoalAsh
Silver RCRA Umit = 5 mgR
0.05 I + 0.04
g 0.03 E
g 0.02
s' 0.01 8
n " Ohio UMBAsh SouthernRsrchAsh - Ontarlo Hydro Ash Western Coal Ash
Figure15 Additional Ranges of Reported EP Leachate Compositions for FSI Ash
Sources: Electric Power Research Institute. EPRI -4783. Laboratory Chamcterization of Advanced SO, Control By-Products: Furnace Sorbent Injection Wastes. U.S. Department of Energy, Morgantown Energy Technology Center. Advanced Coal Technology Waste Disposal: Ohio LIMB Site Assessment Report, d@. Morgantown, West Virginia, 1994.
31 Advanced Coal Technology By-product Disposal Management and Design Manual
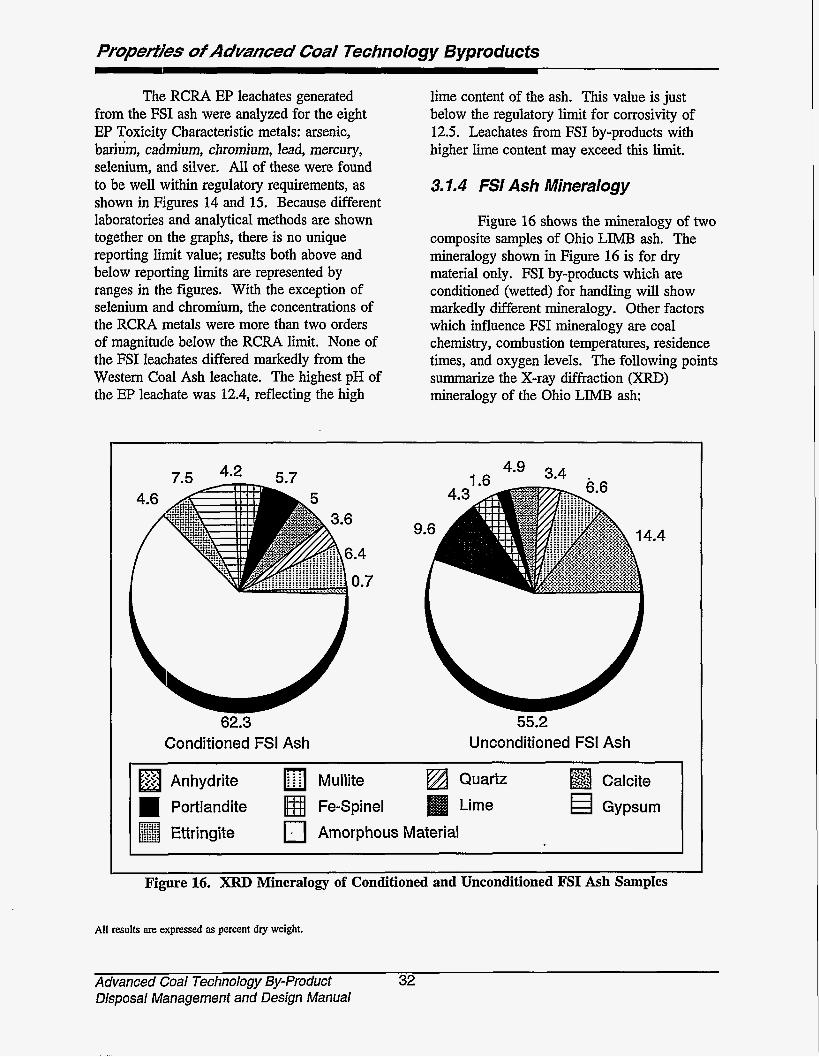
Properties of Advanced Coal Technology Byproducts
The RCRA EP leachates generated from the FSI ash were analyzed for the eight EP Toxicity Characteristic metals: arsenic, barium, cadmium, chromium, lead, mercury, selenium, and silver. All of these were found to be well within regulatory requirements, as shown in Figures 14 and 15. Because different laboratories and analytical methods are shown together on the graphs, there is no unique reporting limit value; results both above and below reporting limits are represented by ranges in the figures. With the exception of selenium and chromium, the concentrations of the RCRA metals were more than two orders of magnitude below the RCRA limit. None of the FSI leachates differed markedly from the Western Coal Ash leachate. The highest pH of the EP leachate was 12.4, reflecting the high
lime content of the ash. This value is just below the regulatory limit for corrosivity of 12.5. Leachates from FSI by-products with higher lime content may exceed this limit.
3.1.4 FSI Ash Mineralogy
Figure 16 shows the mineralogy of two composite samples of Ohio LIMB ash. The mineralogy shown in Figure 16 is for dry material only. FSI by-products which are conditioned (wetted) for handling will show markedly different mineralogy. Other factors which influence FSI mineralogy are coal chemistry, combustion temperatures, residence times, and oxygen levels. The following points summarize the X-ray diffraction (XRD) mineralogy of the Ohio LIMB ash:
7.5 4-2 5.7
L 62.3
Conditioned FSI Ash 55.2
Unconditioned FSI Ash
Anhydrite Mullite Quartz Calcite Portlandite Fe-Spinel Lime Gypsum Ettringite Amorphous Material
Figure 16. XRD Mineralogy of Conditioned and Unconditioned FSI Ash Samples
All results are expressed as percent dry weight.
Advanced Coal Technology By-product 32 Disposal Management and Design Manual
Properfies of Advanced Coal Technology Byproducts
c
F
F
F
The crystalline mineralogy of the FSI ash samples is dominated by anhydrite, a by-product of SO, removal;
Lime and calcite, the unreacted sorbent materials, also make up a significant portion of the FSI by-product;
Quartz, mullite, and Fe-spinel, coal- derived minerals that are essentially unreactive in the disposal environment, are present in both samples; and
Both of the samples contain over 50% amorphous and glassy materials, which do not produce a clear diffraction pattern.
Significant mineralogical differences were noted for the Ontario Hydro and Southern Research Institute FSI ashes. Lime made up more than half of the crystalline species in the Ontario Hydro ash, reflecting low sorbent utilization '. The Southern Research Institute ash contained 15-50% lime. The Ontario Hydro ash contained significantly less anhy- drite (5-15%) than the Southern Research Institute ash (15-50%). These data agree with the lower total sulfur content of the Ontario Hydro ash and probably reflect differences in the sulfur content of the coal being burned. The Ca:S ratio of the Ontario Hydro fuel was approximately 3:l; the Ca:S ratio of @e Southern Research Institute fuel was approximately 2: 1.
3.1.5 Handling and Transport Considerations
Heat production, swelling, self- hardening and high pH values are the characteristics of FSI by-products that may have an effect on handling and transport (handling and transport alternatives are presented in Chapter 7). These problems should not arise if the by-products are kept dry during all stages of handling; however, dry handling may present problems with dusting because of the generally small particle size of
the reacted and unreacted sorbents. The addition of small amounts of water may be useful in controlling dusting if the appropriate precautions are taken. Water addition should take place where heat generation will not cause problems, and flash-setting must be prevented. If transport distances are small, conditioning should cause few problems. Pelletizing FSI wastes may also be considered to reduce dusting problems while maintaining the by- product in a dry state.
Another consideration for handling and transport systems is the increased volume of by-product. Whereas conventional coal combustion produces primarily fly ash and bottom ash, FSI systems produce these solids plus reacted and unreacted sorbent materials and scrubbed sulfur compounds. Increased storage and transport equipment capacity may be required.
3.2 AFBC By-product Characteristics
Atmospheric fluidized bed combustion (AFBC) is an advanced coal technology which reduces SO, emissions by introducing the pulverized coal and an alkaline sorbent, usually limestone, into the combustion zone. During combustion, high-velocity air is forced into the combustor, suspending and mixing the coal and limestone during combustion. The limestone is calcined to lime, which reacts with SO, gen- erated during combustion to produce calcium sulfate. This reduces SO, emissions to the atmosphere and eliminates the need for a separate flue gas desulfurization system.
Since many coal types can be used in an AFBC system, AFBC by-products have a wide range of chemical and physical properties. Differences in operating parameters also will influence the propertjes of AFBC by-products. The by-product characteristics of the two main types of AFBC-circulating fluidized bed combustion (CFBC) and bubbling fluidized bed combustion (BFBC)-produce wastes which are very similar. The composition of the coal
33 Advanced Coal Technology By-product Disposal Management and Design Manual
Propertjes of Advanced Coal Technology Byproducts
and the operating conditions play a larger role in determining the characteristics of these by- products than the type of AFBC unit. However, there are differences between the Go systems which do result in different waste characteristics. The main differences between CFBC and BFBC that affect waste characteristics are 4:
- Shear strengths are low to moderate (from 34 to 302 psi)
- Unconfined compressive strength (UCS) values are widely variable (from 54 to 1,360 psi), especially for fly ash (70 to 1,360 psi);
t BFBC systems operate at lower temperatures than CFBC systems, affecting the mineralogy of the ash; and
t BFBC units have lower velocities and greater mean particle size than CFBC units, resulting in a longer residence time in a well-defined bed.
3.2. I Physical Properfies of AFBC Ash
The physical and engineering properties of AFBC by-product are given in Figures 17 and 18. In general, the physical properties of the cyclone ash are generally more similar to those of the fly ash than to those of the bottom ash. The following points summarize the physical properties of the different AFBC ash types:
t Optimum moisture is generally lower for bottom ash (20 to 32%) than for fly ash and cyclone ash (35 to 50%).
t Maximum dry density is significantly higher for bottom ash (approximately 90 Ib/ft 3, than for fly ash and cyclone ash (approximately 70 lb/ft 3).
t Reported permeabilities of AFBC ash ranged from 10 bottom ash permeability consistently lower than that of fly ash.
to 10 -4 cndsec, with
t Strengths are adequate for landfill construction and may be sufficient for some construction applications:
t Hy ash and cyclone ash have a smaller mean particle size than bottom ash and have a greater specific surface area; and
t Particle-specific gravities ranged from 2.39 to 3.10 (with fly ash being the lightest and bottom ash the heaviest).
3.2.2 AFBC Ash Chemistry
The bulk and major element chemistry of AFBC by-products reported in the literature is shown in Tables 7 and 8, respectively. The introduction of limestone to the bed has a sig- nificant effect on the major element chemistry of the AFBC ash. High concentrations of cal- cium from the sorbent and sulfur compounds from the scrubbed SO, characterize these by- products.
Table 9 gives the ranges of minor and trace element concentrations in AFBC ash. The geographic source and type of coal are the major influences on the trace element com- position of AFBC by-products. However, the presence of sorbent-related compounds can affect the speciation, and, therefore, the solubility of trace elements in the ash (see Chapter 3, Section 3.2.3).
The following points summarize the total chemistry of AFBC by-products:
t Calcium, silicon, aluminum, iron, magnesium, potassium, and sodium are the major chemical components of AFBC by-products;
Advanced Coal Technology By-product Disposal Management and Design Manual

PrupeHies of Advanced Coal Technology Byproducts
7 o.ooo1
1 1Eo6
lE48
1E-10
FlyAsh BoUomAshcycloneAsh Ccmposile 1E-12
Bouom Ash canposile Ash
Unconfined Compressive Strength
1200
Figure 17. Physical and Engineering Properties of AFBC Ash Sources: Characterization of Atmospheric Fluidized-Bed Combustion By-Products, for presentation at the 83rd Annual AWMA Meeting and Exhibition,
Pirtshnreh. PA. LYYO.
Bottom Ash Composite Ash BottomAsh Mean Partlcle Slze
-.. 0.6
0 5
i 0.4
I 0.3 5 02
0.1
0 W b h c y d o ~ ~
rh Ash
Figure 18. Additional Physical and Engineering Properties of AFBC Ash Sources: Characterization of Atmospheric Fluidized-Bed Combustion By-Products. for presentation at the 83rd Annual AWMA Meeting and Exhibition,
US. Department of Energy, Grand Forks Energy Technology Center. Chemical and Physical Characterization of Western Low-Rank Coal Waste Materials. Part 2: B -Products from an Atmo heric Fluidized Bed Com usuon stem. ran or D.S. Department of %nergy, Morgantown b e g Technology Center. Z S t u Z o t C i r r ~ ~ ~ ~ e d ~ ~ ~ ~ ~ ~ ~ ~ ~ ~ ~ ~ n , \W. 1994.
F m 9 0 .
35 Advanced Coal Technology By-product Disposal Management and Design Manual

Fropeflies of Advanced Coaf Technology Byproducts
Heat of hydration, temp.
Loss on ignition Heat of hydration, time
Sulfate sulfur Total inorganic C in solids
Table 7 Bulk Chemistry of AFBC Ash
C 21 - 55 11 - 38 58 34 - 37 minutes 40 4 NA NA
9% 8.7 1.2 NA 19 wt. 96 1.93 3.5 NA NA
mg CO,/g 0.444 1.329 NA 38
Parameter I Units I Fly Ash I Bottom Ash I CycIone Ash I Composite Ash Bulk Chemistry
ChlorideTwater-soluble Fluoride, water-soluble Sulfate. water-soluble
11 Available lime index I wt. 9% I 6.8 I 7.4 I NA I 26 II
<E- 0.85 ~
mdlg 0.5 - 0.6 ~0 .01 - 0.2 0.3 mgfg 0.2 - 0.4 ~0.05 - 0.015 0.3 0.01 - 0.2
m d g a s S 14-56 14.5 - 21 55 2.5 - 25
Calcium Iron Magnesium
i Potassium Silicon Sodium Titanium
Carbonate, water-soluble I mg/g I 0.7 - 45 I 4 . 5 - 60 I 4 . 5 I e3 - 10 11
68,000 - 161,700 13,000 - 120,000 2,900 - 24,000 2,500 - 8,020 600 - 216,000 490 - 30,000 1,200 - 2,360
Sulfur, acid-soluble I mg/gasS I 20-69 I 26-50 1 80 I 36-53 11 NA - Not anal+ Sources: Characterization of Atmospheric Fluidized-Bed Combustion By-products. for presentation at the 83rd Annual AWMA Meeting and Exhibition,
' , . S . b , e ~ ~ ~ n ~ ~ ~ E n e r g y , Grand Forks Energy Technology Center. Chemical and Physical Characterization of Western Low-Rank Coal Waste Materiak. Part 2 B -Products from an Atmo heric Fluidized Bed Com ustion stem. 'ran or , D.S. Depamnent of inergy. Morgantown her: Technology Center. Z S t u Z o f Circ%!eed'hh:d&J? GG:t%n, WV. 1994. Previously unpublished data from this study.
itts ur ,
Table 8 AFBC Major Element Chemistry (mg/kg)
Parameter I RYAsh Aluminum I24,OOO - 126,000
Bottom Ash I Cyclone Ash 7,200 - 94,100 I 19,300
105,000 - 321,900 I 219,900 5,700 - 37,900 I 46,200 2,700 - 5,660 I 2,860 500 - 10,500 3,230
3,200 - 203,000 37,200 240 - 3,250 430 - 3,600 890
Composite Ash -iGiGzdl 254,000 - 279,500 11
16,000 - 59,900 11 3,240 - 14,000 11 3,010 - 8,700 11
Sources: Characterization of Atmospheric Fluidized-Bed Combustion By-Products, for presentation at the 83rd Annual AWMA Meeting and Exhibition, m f Energy, Grand Forks Energy Technology Center. Chemical and Physical Characterization of Western Low-Rank Coal Waste Materials. Part 2: B -Products from an Atmo heric Fluidized Bed Com ustion stem. 'ran or , US. Depamnent of i n i c % - h ! k d ' h h : & ? ;&%k, WV. 1994. Previously unpublished data from this study.
ltts ur , , 0.
Advanced Coal Technology By-product 36 Disposal Management and Design Manual
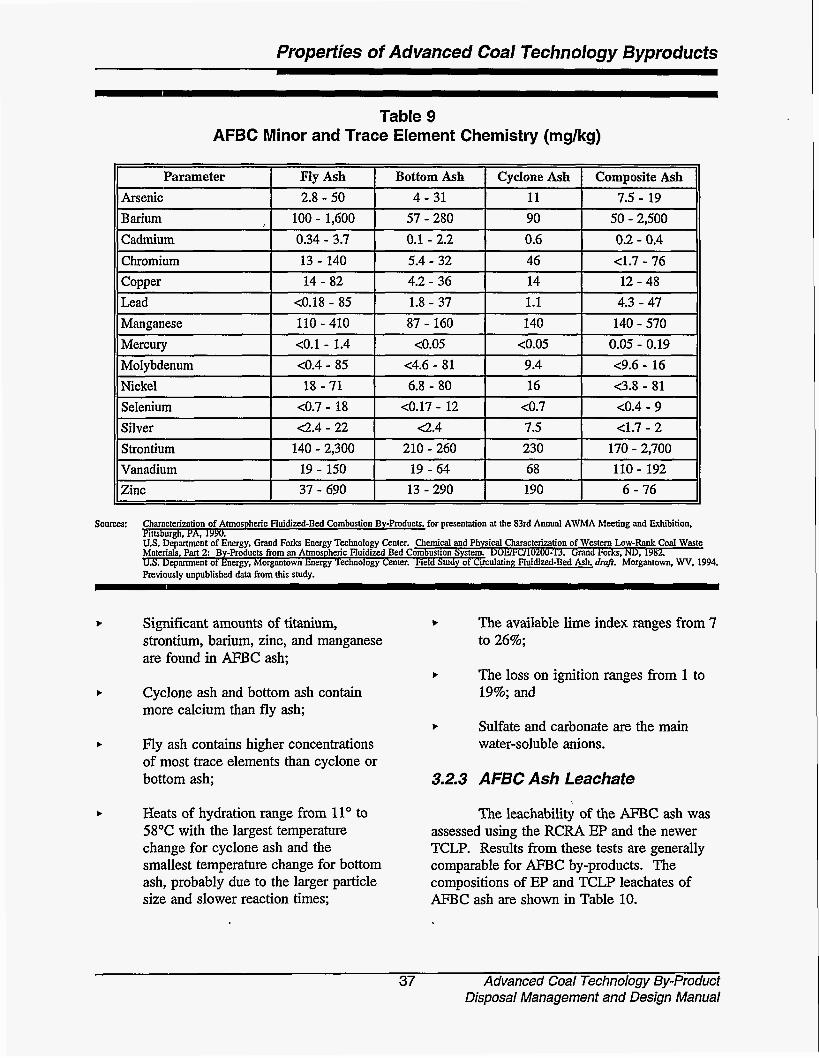
Properties of Advanced Coal Technology Byproducfs
Parameter Arsenic
Table 9 AFBC Minor and Trace Element Chemistry (mg/kg)
Fly Ash Bottom Ash Cyclone Ash Composite Ash 2.8 - 50 4 - 31 11 7.5 - 19
Strontium Vanadium Zinc
, I 100- 1,600 I 57-280 I 90 I 50 - 2,500 11
140 - 2,300 210 - 260 230 170 - 2,700 19 - 150 19 - 64 68 110 - 192 37 - 690 13 - 290 190 6 - 76
t Significant amounts of titanium, t The available lime index ranges from 7 strontium, barium, zinc, and manganese are found in AFBC ash;
to 26%;
The loss on ignition ranges from 1 to t
t Cyclone ash and bottom ash contain 19%; and more calcium than fly ash;
t Sulfate and carbonate are the main t Hy ash contains higher concentrations water-soluble anions.
of most trace elements than cyclone or bottom ash; 3.2.3 A FBC Ash Leachate
t Heats of hydration range from 11" to 58°C with the largest temperature change for cyclone ash and the smallest temperature change for bottom ash, probably due to the larger particle size and slower reaction times;
The leachability of the AFBC ash was assessed using the RCRA EP and the newer TCLP. Results from these tests are generally comparable for AFBC by-products. The compositions of EP and TCLP leachates of AFBC ash are shown in Table 10.
37 Advanced Coal Technology By-product Disposal Management and Design Manual

Properffees of Advanced Coal Technology Byproducfs
Lead ~0.002 - 0.4 c0.002 Mercury ~0.0002 - 0.0005 ~0.0002 Selenium <0.005 - 0.25 <0.005 I
Table 10 EP Leachates of AFBC (mg/L)
<0.0002 c0.0002 0.001 c0.003 <0.03 0.018
Analyte Fly Ash Bottom Ash
~0.0005 - 0.3 c0.005
CycIone Ash c0.003 0.18
<0.0005 0.055
<0.002 II Chromium I c0.01 - 0.13 I c0.01 - 0.13
Conventional Composite Ash Western CoaI Ash
<0.005 0.008 0.15 - 14 0.377 <0.008 0.002
0.016 - 0.083 0.078 ~0.002 - 0.013 0.003
Silver PH
~0.01 - 0.06 <0.01 - 0.2 0.34 CO. 1 0.001 5.5 - 12.1 11.6 - 12.4 12.2 11.7 - 12.4 NA
The EP and TCLP leachates were analyzed for eight regulated metals: arsenic, barium, cadmium, chromium, lead, mercury, selenium, and silver. All of these elements were found in concentrations below regulatory levels and were similar to EP leachates from conventional western coal ash, which are shown for comparison. The highest pH of the AFBC leachate was 12.4, reflecting the high lime content of the ash. This value is just below the regulatory threshold of 12.5 for corrosivity . 3.2.4 AFBC Ash Mineralogy
The mineralogy of AFBC ash by XRD analysis is shown in Figure 19. Differences in firing temperatures and moisture content of the ash will significantly affect the mineralogy. Certain minerals, such as mullite, form only at temperatures above approximately 1000°C. The formation of mullite generally reflects the presence of hot spots in the bed, or anomalously high combustion temperatures.
Samples of AFBC by-product which have been wetted (e.g., for dust control) will form hydrous minerals, which will decrease the available moisture content and may cause self- cementation. The results shown in Figure 19 are for dry material only.
The following points summarize the mineralogy of AFBC ash:
t Quartz and anhydrite are the main ciystalline species;
t CFBC ash contains significant amounts of mullite, possibly reflecting the higher temperatures of CFBC systems, while BFBC ash contains more calcite and portlandite;
t Between 50 and 65% of the ash is amorphous or glassy material, which does not produce a clear diffraction pattern;
Advanced Coal Technology By-Product 38 Disposal Management and Design Manual
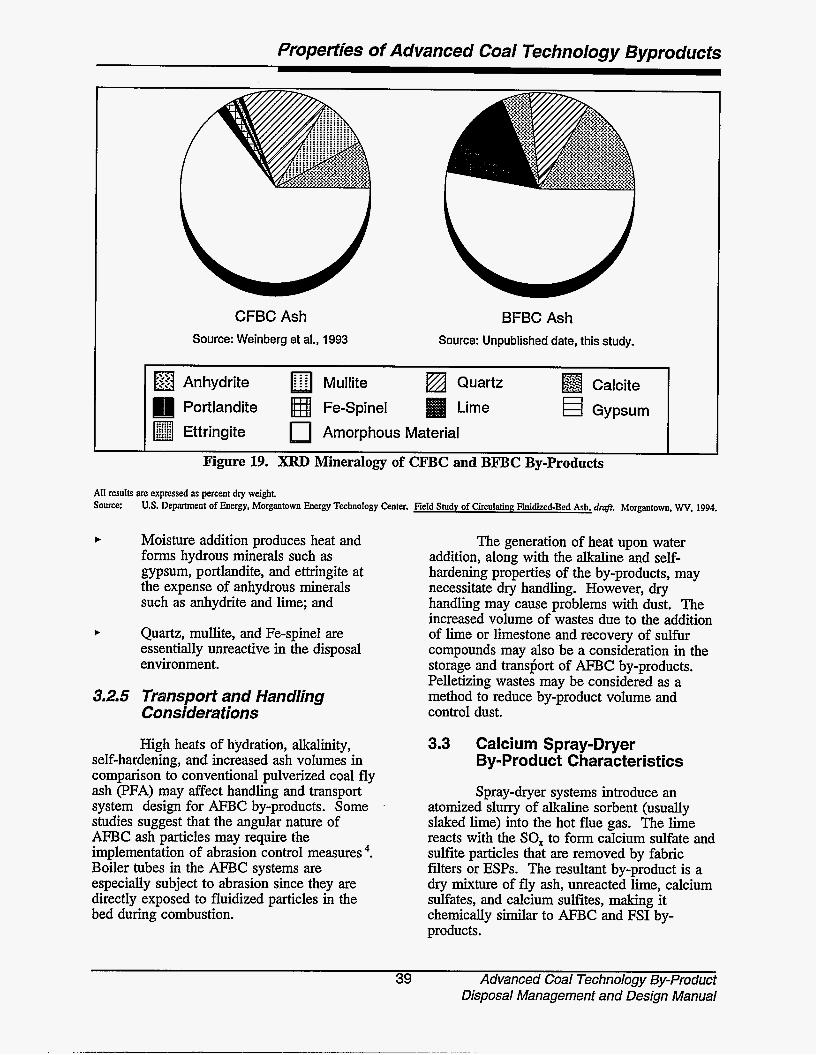
Properties of Advanced Coal Technology Byproducis
CFBC Ash BFBC Ash Source: Weinberg et al., 1993 Source: Unpublished date, this study.
Calcite I Anhydrite Mullite Quartz Fe-Spinel Lime Amorphous Material
Portlandite Ettringite
I
Figure 19. XRD Mineralogy of CFBC and BFBC By-products
AI1 results are expressed as percent dry weight, Source: US. Department of Energy, Morgantown Energy Technology Center.
t
Moisture addition produces heat and forms hydrous minerals such as gypsum, portlandite, and ettringite at the expense of anhydrous minerals such as anhydrite and lime; and
Quartz, mullite, and Fe-spinel are essentially unreactive in the disposal environment.
3.2.5 Transport and Handling Considera fions
High heats of hydration, alkalinity, self-hardening, and increased ash volumes in comparison to conventional pulverized coal fly ash (PFA) may affect handling and transport system design for AFBC by-products. Some studies suggest that the angular nature of APBC ash particles may require the implementation of abrasion control measures '. Boiler tubes in the APBC systems are especially subject to abrasion since they are directly exposed to fluidized particles in the bed during combustion.
Reld Study of Circulating Fluidized-Bed Ash. draji. Morgantown, WV. 1994.
The generation of heat upon water addition, along with the alkaline and self- hardening properties of the by-products, may necessitate dry handling. However, dry handling may cause problems with dust. The increased volume of wastes due to the addition of lime or limestone and recovery of sulfur compounds may also be a consideration in the storage and transfiort of AFBC by-products. Pelletizing wastes may be considered as a method to reduce by-product volume and control dust.
3.3 Calcium Spray-Dryer By-Product Characteristics
Spray-dryer systems introduce an atomized slurry of alkaline sorbent (usually slaked lime) into the hot flue gas. The lime reacts with the SO, to form calcium sulfate and sulfite particles that are removed by fabric filters or ESPs. The resultant by-product is a dry mixture of fly ash, unreacted lime, calcium sulfates, and calcium sulfites, making it chemically similar to AFBC and FSI by- products.
39 Advanced Coal Technology By-product Disposal Management and Design Manual
Properfs of Advanced Coal Technology Byproducts
Physical characteristics of spray dryer by-products are similar to those for conventional fly ash. The following points summarize the physical and chemical characteristics of spray dryer ash ':
products, is controlled primarily by the trace element composition of the coal being burned.
One study of spray dryer by-product leachates found that all samples were non- hazardous according to EP toxicity character- istics s. The pH of EP leachates from calcium spray dryer ash is generally lower than those of AFBC and FSI ash, with the exception of some AFBC fly ash samples. The spray dryer EP leachate pH values range from 7.65 to 12.0, beneath the regulatory limit for corrosivity of 12.5.
b Optimum moisture ranges from 16 to 38 percent;
t Maximum dry density is much lower than for AFBC or FSI ash (from 70 to 100 lb/ft 3);
b Mean particle size ranges from 0.016 to 0.045 mm, and specific surface area ranges from 1.64 to 7.47 m2/g;
Mineralogy of calcium spray dryer ash differs from AFBC and FSI ash most notably in the absence of calcium sulfate minerals (anhydrite or gypsum). Only one of eight samples investigated contained gypsum (from 5-15%) and none were found to contain anhydrite. Presumably, the scrubbed sulfur is present in the amorphous fraction of the ash. Due to the introduction of slaked (hydrated) lime to the system, portlandite [Ca(OH)J was the dominant calcium-bearing mineral in over half the samples.
t Particle specific gravity ranges from 2.29 to 2.80;
Permeability is low-from lo-' to cdsec; and
t
t Unconfined compressive strength (with optimum moisture and 7-day cure) is highly variable-from 54 to 684 psi.
Calcium is the most abundant major element in spray dryer by-products. The sulfur content of the ash depends on the sulfur content of the coal burned and the efficiency of the SO, removal process. The following points summarize the major element chemistry of spray dryer by-products ':
The lower heats of hydration and pH may make calcium spray dryer ash slightly easier to handle and store than AFBC and FSI ash. As with AFBC and FSI systems, increased by-product volume results from the addition of sorbent and the removal of SO, from flue gas. Other than the need to handle increased volumes, equipment designed for the handling and transport of conventional fly ash should be suitable for use with calcium spray dryer ash.
b Calcium content of the ash ranges from approximately 14 to 22 percent;
b Other major elements, present in amounts from greater than 0.5 to 12%, are silicon, aluminum, iron, magnesium, and sodium;
3.4 Pressurized Fluidized Bed Combustion By-product Characteristics
t Acid-soluble (total) sulfur ranged from 4-7% and sulfite, rather than sulfate, is the dominant species; and
PFBC systems are similar to AFBC systems, except that combustion takes place at pressures of 10 to 16 atmospheres. The increased pressure of the system allows combustion to take place at lower temperatures and in a more compact bed. Under the combustion conditions in PFBC boilers, the sorbent is not generally calcined to lime. Increased residence times and greater fuel flexibility are two of the benefits of PFBC. PFBC may be used as a retrofit technology. Only one PFBC demonstration plant is
b Heats of hydration are relatively low (< 30°C), because most of the lime that is not consumed up in SO, removal is present as CaOH.
The minor element chemistry of spray dryer by-products, like that of AFBC and FSI by-
Advanced Coal Technology By-product 40 Disposal Management and Design Manual

Propetfles of Advanced Coal Technology Byproducts
Anal* Aluminum Calcium Iron Magnesium Potassium
currently operating in the United States-the American Electric Power Service Corporation (AEP) Tidd Plant in Brilliant, Ohio. The following discussion on PFBC by-product is based on an ash sample from this plant.
PF'BC Ash 39,300
175,300 5 1,700
106,400 5.000
The engineering and physical properties of PFBC ash do not indicate any potential engineering problems associated with landfilling this material. The following points summarize the available data6:
Silicon Sodium
b
72,400 10,300
b
Analyte Arsenic Barium Cadmium Chromium Copper
b
PFBC Ash 1.9
2,000 1.9
36.9 52.5
t
t
UCS values are in the same range as those reported for FSI and FBC by- products-approximately 200 to 1100 psi following a 7-day cure;
Maximum dry density of PFBC by- product was found to be higher, at 112 lb/ft?, than for AFBC or FSI ash;
Particle density for PFBC by-product was measured at 2.92 g/cm3 for bottom ash and 2.70 g/cm3 for cyclone ash;
Particle size of PFBC cyclone ash fell primarily in the silt range (0.002 to 0.05 mm), whereas the bulk of the PFBC bottom ash particles were found to be greater than 0.25 mm; and
Specific surface area was significantly lower for PFBC bottom ash (1.28 m"/g) than for PFBC cyclone ash (6.50 m"/g).
The major element chemistry of the PFBC by-product is dominated by calcium and magnesium, at 17.5 and 10.6%, respectively. This magnesium concentration is approximately one to two orders of magnitude higher than in AFBC and FSI ash. The reason for these high levels of magnesium is the use, in this case, of dolomite [CaMg(CO,)J in place of lime or limestone as the sorbent. Other major elements, shown in Table 11, are similar in concentration to those in AFBC and FSI by- products.
Minor and trace elements, shown in Table 12, are also generally within the ranges given for AFBC and FSI ash and, again, are probably strongly dependent on the chemistry of the coal. The flexibility of PFBC systems with regard to fuel suggests that the trace
element composition of PFBC by-products may be highly variable.
Table 11 PFBC Major Element Chemistry
( W W
U.S. Department of Energy, Office of Fossil Energy, Morgantown Energy Technology Center. "Land Application Uses of Pressurized Fluidized-Bed Combustion (FPBC) Ash." In:
Table 12 PFBC Minor and Trace Element
C hem is t ry (m g/kg )
Lead I 16.0 11 Molybdenum I 6.6 11 Nickel I 52.1 11
II Selenium I 5.6 11 II Zinc I 74.0 11
US. Department of Energy, Office of Fossil Energy, Morgantown Energy Technology Center. "Land Application Uses of Pressurized Fluidized-Bed Combustion FPBO Ash." In: hoceedinks of the Coal-Fii Power S$ste&-bcAd&xs in mc l p . an
. .
41 Advanced Coal Technology By-product Disposal Management and Design Manual

Properties of Advanced Coal Technology Byproducts
An EPA study * conducted deionized- water leaching experiments and concluded that cadmium, manganese, sulfate, and total dis- solved solids (TDS) may pose leaching pro- blems for PFBC landfills. Elevated levels of sulfate (3136 and 5154 m a ) and TDS (1699 and 1569 mg/L) were also reported in ASTM leachates in a recent study 6, but cadmium and manganese concentrations were below detec- tion limits. None of the EP trace metals analyzed in these samples were found to exceed primary drinking water standards in either ASTM or TCLP leachates of PFBC by- product, and the concentrations of all eight
The mineralogy of PFBC by-products is shown in Figure 20. The mineralogy of these samples differs markedly from the miner- alogy of AFBC and FSI by-products. Anhy- drite still makes up a major portion of the crystalline material (21 to 46%) and calcite is present in significant amounts in cyclone and bottom ash. However, dolomite (unspent sor- bent) makes up 17-24% of the ash. Periclase (MgO), a mineral formed by the reaction of dolomite at an elevated temperature and pressure [CaMg(CO,),+CaCO,+MgO+COJ is also present at 14 and 27% in cyclone and bottom ash, respectively. Lime is present in
elements were several orders of magnitude lower than the RCRA limits. The ASTM (deionized water) leachate pH was measured at 11.42 for cyclone ash and 11.77 for bottom ash.
small amounts (4%) inthe bottomkh. The remainder of the PFBC by-product is amorphous material (Le., fly ash).
46%
7
Fly Ash (one sample)
27% 11%
1
Cyclone Ash Bottom Ash (average of three samples) (average of two samples)
Figure 20. XRD Mineralogy of PFBC By-Products
AI1 results are expressed as percent dry weight. Source: US. Department of Energy, Offace of Fossil Energy, Morgantown Energy Technology Center. “Land Application Uses of Pressurized Fluidized-Bed
Combustion (PFBC) Ash.” In: Proceedings of the Coal-Fd Power Systems 93-Advances in IGCC and PFBC Review Meeting. Morgantown, WV. 1993. pp. 103-120. 1993.
Advanced Coal Technology By-product 42 Disposal Management and Design Manual

Properties of Advanced Coal Technology Byproducts
The presence of only small amounts of lime in the PFBC by-products will produce lower heats of hydration relative to AFBC and FSI by-products. Lower leachate pH may also cause fewer problems with corrosion and may increase the stability of some chemical elements which are mobilized at elevated pH.
3.5 Dry Sodium In-Duct Injection By-Products
This SO, control process involves injection of a sodium-based sorbent directly into the flue gas downstream of the boiler. The particulate matter is then collected by conventional methods.
The physical and engineering properties of two sodium-injection by-products are shown in Table 13. Optimum moisture and maximum dry density are very low relative to FSI and AFBC by-products. Although mean particle size is fairly small compared to most of the FSI and AFBC ash samples, specific surface area is also low, suggesting less porous particles. Particle specific gravities are lower
than the values reported for FSI and AFBC ash. Permeability of the sodium-injection ash was similar to FSI and AFBC ash. UCS varied by an order of magnitude for the two sodium- injection samples, from 26 to 268 psi. Because of its high solubility, sodium-injection ash will experience considerable deterioration in its engineering properties when exposed to moisture.
The sodium-injection by-products contain more sodium and less calcium than AFBC and FSI by-products. By-products from two sodium-injection test facilities, one using nahcolite (NaHCO,) and the other using trona (Na,$O,*NaHCO3.2H,O) as sorbents, were investigated7. Chemical analysis of the by- products from these two facilities gave the following results:
b
b
Silicon (12-16%) and aluminum (8%) were the most abundant elements;
Sodium concentrations were 5-9 percent;
Table 13 Physical and Engineering Properties of Sodium-Injection Ash
Source: Electric Power Research Institute. EPRI GS-6622. Laboratory Characterization of Advanced SO, Control By-Products: Dry Sodium and Calcium In-Duct Injection Wastes.
43 Advanced Coal Technology By-product Disposal Management and Design Manual
Properfr'es of Advanced Coa/ Technology Byproducfs
b
b
b
Calcium concentrations were about 3%, generally an order of magnitude less than FSI and AFBC by-products;
Total sulfur makes up 3.1 to 4.8% of the ash;
Water-soluble sulfate ranges from 2.7 to 3.7% as sulfur;
Water-soluble carbonate was present at 3.0 and 4.5%; and
Heat of hydration was between 30 and 40°C.
Minor element chemistry of the sodium- injection by-products did not differ significantly from the compositions reported for FSI and AFBC by-products.
Sodium-injection by-product leachates may have extremely high total dissolved solids concentrations, owing to the high solubility of most of the sodium compounds they contain. EP leachates from the sodium-injection materials contained higher levels of arsenic than the AFBC and FSI ash, even though total arsenic levels were not higher. This may indicate the presence of a more soluble species of arsenic in the sodium-injection ash. Other elements in the EP leachates were present at similar or lower concentrations than in FSI or AFBC leachates. None of the concentrations exceeded RCRA levels. The pH values reported for the two samples varied significantly: 8.7 for the trona-based ash and 4.95 for the nahcolite-based ash. These relatively low pH values reflect good utilization of the sorbent.
The mineralogy of the crystalline fraction of the two sodium-injection by- products was qualitatively determined by XRD. Lime, mullite, and quartz were the species documented in both samples. In addition to these minerals, mirabilite (Na,SO ,dOH ,O), nahcolite (NaHCO,), and thenardite (Na$O,) were tentatively identified in one or both of the samples. All of these sodium minerals are soluble, and would be expected to leach rapidly from the ash7.
Although dry handling of sodium- injection ash may be desirable to avoid
generating heat and potentially corrosive leachate, the small mean particle size of this waste suggests that dusting may be a problem. The low density of the material, along with increased by-product generation (fly ash plus sorbent plus removed sulfur) may result in a significantly higher volume of material to transport and store.
3.6 Dry Calcium In-Duct Injection BylProduct Characteristics
Dry calcium in-duct injection is similar to sodium injection (described in Chapter 3, Section 3.4.3), but uses calcium-based sorbents such as lime or hydrated lime. The handling and disposal properties of the by-products should be similar to those of an FSI system. The physical and chemical properties data below are from an in-duct injection system using hydrated lime as a sorbent '.
The physical and engineering properties of the calcium-injection ash are not significantly different from those reported for other advanced coal by-products. Like the sodium-injection ash, the calcium-injection ash has a lower maximum dry density and particle specific gravity than the AFBC and FSI by- products. Values for optimum moisture, permeability, UCS, specific surface area, and mean particle size are all within the ranges given for AFBC and FSI by-products.
The chemistry of the calcium-injection by-product is similar to that of other advanced coal processes that utilize calcium-based sorbents. Calcium is the dominant element, with sulfur, aluminum, iron, magnesium, potassium, sodium, and titanium also making up a significant portion of the ash. The heat of hydration of this sample was relatively low-approximately 30°C. Minor element composition of calcium-injection ash would not be expected to be significantly different from those reported for AFBC or FSI ash.
The chemistry of EP leachates derived from the calcium-injection ash does not differ significantly from the chemistry of AFBC and FSI ash leachates. Concentrations of the eight RCRA metals are well within regulatory limits. At 12.4, the pH is just below the regulatory threshold of 12.5 for corrosivity.
Advanced Coal Technology By-product 44 Disposal Management and Design Manual
_ _ ..... . . . - - ..-.-- , -- , . - . .._ . . I _ . . . . . . .

PropeHies of Advanced Coal Technology Byproducfs
Since sorbent is injected into relatively cool combustion gases in this technology, there is less opportunity for reaction between coal ash glass and sorbent to form reactive mineral phases. Quartz and portlandite were the only two minerals identified in a sample from a calcium-injection system that used hydrated lime as the sorbent. This is comparable to the mineralogy of ash from a calcium spray dryer system, another very similar technology.
As with the sodium-injection by- products, the main transport, storage, and handling concern is likely to be the increased volume of by-product produced by this technology.
3.7 Coal Gasification Slag Characteristics The process of coal gasification
converts coal to a gaseous fuel. The main by- products of the coal gasification process are char or tars, slag or bottom ash, and sulfur in either elemental or sulfate form. Several reuse options exist for elemental sulfur in the agricultural and chemical industries; landfilling of elemental sulfur is considered unlikely. Sulfate sulfur, scrubbed by an FBC boiler or another SO control technology, is discussed in detail under those technologies. Char and tars are generally recycled to the combustor; slag, or bottom ash, is the most voluminous by- product of coal gasification. The following discussion centers on slag characteristics.
The physical and chemical properties of the coal gasification by-product are largely dependent on the type of coal burned and the combustion process. Some coal gasifiers produce ash whereas others fire the coal at a higher temperature so that the ash fuses to slag. Both types of by-product generally differ from other advanced coal combustion by-products due to the lack of sorbent addition during combustion. Fluidized bed gasifiers do feature sorbent addition in the combustion zone. Detailed treatment of all types of gasifiers is beyond the scope of this report. A Gas Research Institute study described the physical and chemical properties of several different ashes from fixed-bed gasification of
lignite. An EPRI study lo investigated the differences between by-product from slagging- bottom gasification and conventional coal combustion, both burning Pittsburgh coal. The following paragraphs refer to these reports.
For both types of coal gasification by- product, the mean particle size is much larger than for FSI or AFBC ash. The mean particle size for the slag sample was measured at 1.6 mm; from 49 to 73 weight percent of the ash particles was greater than 2 mm. The surface area of the sla was found to be significantly
products and, as would be expected, the hydraulic conductivity of the slag is very high (3.5 x 1O-l cdsec). Specific gravity of the slag (2.82) is within the range reported for AFBC and FSI by-products, but much higher than the calcium- or sodium-injection by- products. No surface area, hydraulic conductivity, or specific gravity data were reported for the gasification ash samples.
the coal gasification process suggests that the major element chemistry of the by-products will more closely resemble conventional coal ash than that of other clean coal technologies. Compared to FSI and AFBC by-products, the calcium content reported for the coal gasification slag is very low and other major elements are relatively high. However, the calcium content reported for gasification ash samples was relatively high and fell within the range of concentrations reported for FSI and AFBC ash. As with other coal combustion by- products, the minor element chemistry of coal gasification slag is strongly dependent on the minor element chemistry of the coal from which it is derived. For the most part, the ‘trace element concentrations reported for the coal gasification by-products resemble those of conventional combustion ash.
lower (0.56 m B /g) than the AFBC and FSI by-
The absence of any sorbent material in
RCRA EP leachate data for coal gasification slag are given in Table 14. Although the RCRA metal concentrations are below regulatory limits, they are generally higher than those for AFBC and FSI, especially for the elements arsenic, barium, and chromium. The pH of the slag leachate is 5.0, which is much more acidic than most of the
45 Advanced Coal Technology By-product Disposal Management and Design Manual
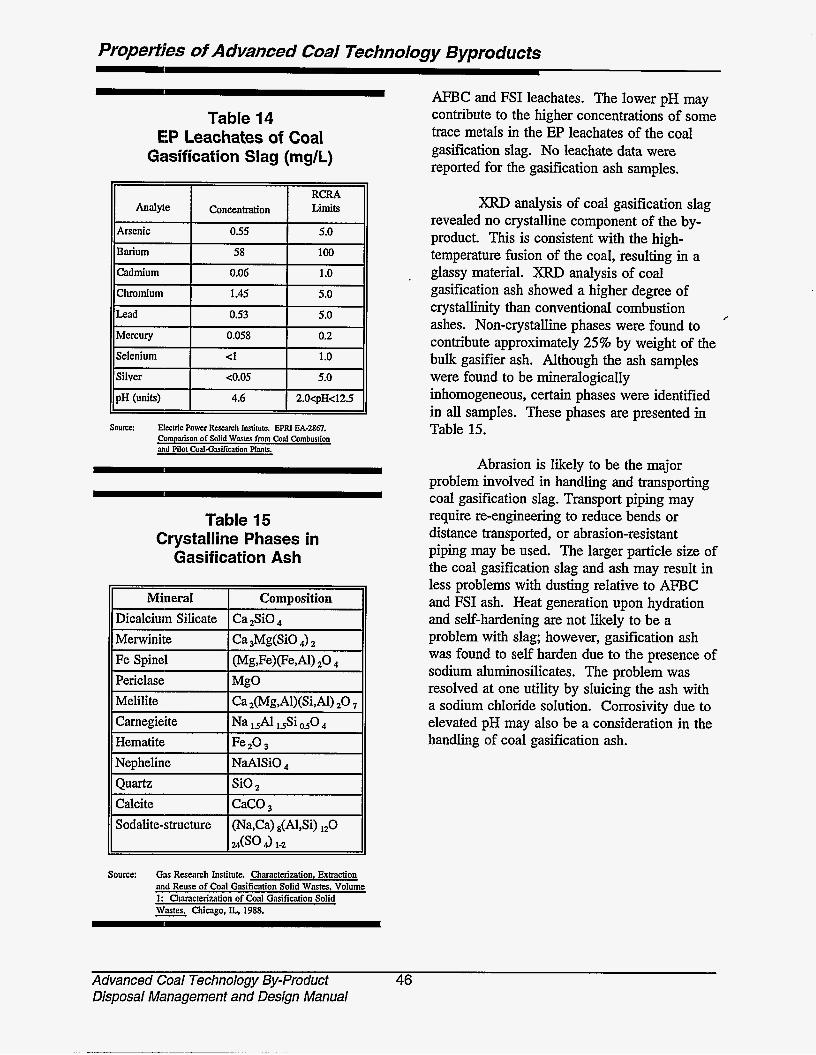
Properties of Advanced CoaJ Technology Byproducts
Analyle RCRA
Concentration Limits
11 Arsenic I 0.55 I 5.0 11 Barium
Cadmium
Chromium
Lead
Mercury
Selenium
58 100
0.06 1 .o 1.45 5.0
0.53 5.0
0.058 0.2
<I 1 .o Silver
pH (units)
Table 15 Crystalline Phases in
Gasification Ash
c0.05 5.0
4.6 2.OqH42.5
Mineral Dicalcium Silicate
Melilite Carnegieite Hematite Nepheline
Calcite
Composition Ca,SiO
Sodalite-structure (Na,Ca) 8(Al,Si) ,,O I =(so 4) 1-2
Source: Gas Reswch Institute. Characterization, Exfraction and Reuse of Coal Gasification Solid Wastes. Volume 1: Characterization of Coal Gasification Solid - wastes. Chicago, IL., 1988.
AFBC and FSI leachates. The lower pH may contribute to the higher concentrations of some trace metals in the EP leachates of the coal gasification slag. No leachate data were reported for the gasification ash samples.
XRD analysis of coal gasification slag revealed no crystalline component of the by- product. This is consistent with the high- temperature fusion of the coal, resulting in a glassy material. XRD analysis of coal gasification ash showed a higher degree of crystallinity than conventional combustion ashes. Non-crystalline phases were found to contribute approximately 25% by weight of the bulk gasifier ash. Although the ash samples were found to be mineralogically inhomogeneous, certain phases were identified in all samples. These phases are presented in Table 15.
/
Abrasion is likely to be the major problem involved in handling and transporting coal gasification slag. Transport piping may require re-engineering to reduce bends or distance transported, or abrasion-resistant piping may be used. The larger particle size of the coal gasification slag and ash may result in less problems with dusting relative to AFBC and FSI ash. Heat generation upon hydration and self-hardening are not likely to be a problem with slag; however, gasification ash was found to self harden due to the presence of sodium aluminosilicates. The problem was resolved at one utility by sluicing the ash with a sodium chloride solution. Corrosivity due to elevated pH may also be a consideration in the handling of coal gasification ash.
Advanced Coal Technology By-product 46 Disposal Management and Design Manual
PropeHies of Advanced Coal Technology Byproducts
3.8 Citations
1. Electric Power Research Institute. EPRI CS-5076. Management of Solid By-products from Advanced SO Control Systems. Palo Alto, California, 1987.
2. Electric Power Research Institute. EPRI CS-5783. Laboratory Characterization of Advanced SO Control By-products: Furnace Sorbent Injection Wastes. Palo Alto, California, 1988.
3. U.S. Department of Energy, Morgantown Energy Technology Center. Advanced Coal Technology Waste Disposal: Ohio LIMB Site Assessment Report, dray?. Morgantown, West Virginia, 1994.
4.
5.
6.
Characterization of Atmospheric Fluidized-Bed Combustion By- Products, for presentation at the 83rd Annual AWMA Meeting and Exhibition, Pittsburgh, Pennsylvania, 1990.
Electric Power Research Institute. EPRI CS-5782. Laboratory Characterization of Advanced SO, Control By-products: Spray Dryer Wastes. Palo Alto, California, 1988.
U.S. Department of Energy, Office of Fossil Energy, Morgantown Energy Technology Center. "Land Application Uses of Pressurized Huidized-Bed Combustion (PFBC) Ash." In: Proceedings of the Coal-Fired Power Systems 93--Advances in IGCC and PFBC Review Meetinrr, Morgantown, West Virginia, 1993. pp. 103-120. 1993.
7.
8.
9.
10.
Electric Power Research Institute. EPRI GS-6622. Laboratory Characterization of Advanced SO, Control By-products: Dry Sodium and Calcium In-Duct Iniection Wastes. Palo Alto, California, 1989.
U.S. Environmental Protection Agency. Laboratory and Field Studies of Pressurized FBC Waste Leachate Generation and Attenuation: Technical Note. 214-338-11. April, 1980.
Gas Research Institute. Characterization, Extraction and Reuse of Coal Gasification Solid Wastes, Volume 1: Characterization of Coal Gasification Solid Wastes. Chicago, Illinois, 1988.
Electric Power Research Institute. EPRI EA-2867. Comparison of Solid Wastes from Coal Combustion and Pilot Coal-Gasification Plants. Palo Alto, California, 1983.
47 Advanced Coal Technology By-product Disposal Management and Design Manual

This Page Intentionally Left Blank
48
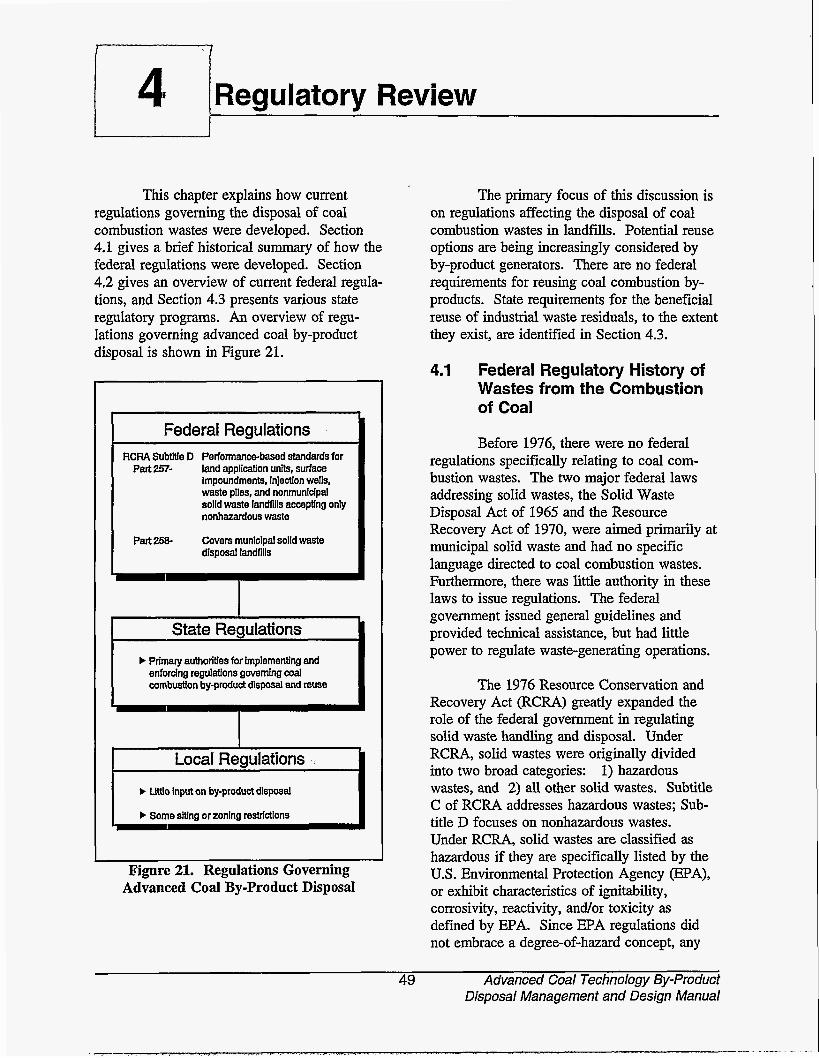
41 I Regulatory Review
Local Regulations b Uttlo input on by-product disposal
b Some siting or zoning restrictions -
I J
This chapter explains how current regulations governing the disposal of coal combustion wastes were developed. Section 4.1 gives a brief historical summary of how the federal regulations were developed. Section 4,2 gives an overview of current federal regula- tions, and Section 4.3 presents various state regulatory programs. An overview of regu- lations governing advanced coal by-product disposal is shown in Figure 21.
Federal Regulations RCRA Subtitle D Performancebased standards for
land application units, surface Impoundments, Injection wells, waste plies, and nonmunldpal solid waste landfills accepting only nonhazardous waste
Covers municipal solid waste disposal landfills
Part 257-
Part 25E
State Regulations b Primary authorities for Implementing and
enfordng regulations governing coal combustion by-product disposal and reuse
Figure 21. Regulations Governing Advanced Coal By-product Disposal
The primary focus of this discussion is on regulations affecting the disposal of coal combustion wastes in landfills. Potential reuse options are being increasingly considered by by-product generators. There are no federal requirements for reusing coal combustion by- products. State requirements for the beneficial reuse of industrial waste residuals, to the extent they exist, are identified in Section 4.3.
4.1 Federal Regulatory History of Wastes from the Combustion of Coal
Before 1976, there were no federal regulations specifically relating to coal com- bustion wastes. The two major federal laws addressing solid wastes, the Solid Waste Disposal Act of 1965 and the Resource Recovery Act of 1970, were aimed primarily i municipal solid waste and had no specific language directed to coal combustion wastes. Furthermore, there was little authority in these laws to issue regulations. The federal government issued general guidelines and provided technical assistance, but had little power to regulate waste-generating operations.
The 1976 Resource Conservation and Recovery Act (RCRA) greatly expanded the role of the federal government in regulating solid waste handling and disposal. Under RCRA, solid wastes were originally divided into two broad categories: 1) hazardous wastes, and 2) all other solid wastes. Subtitle C of RCRA addresses hazardous wastes; Sub- title D focuses on nonhazardous wastes. Under RCRA, solid wastes are classified as hazardous if they are specifically listed by the US. Environmental Protection Agency (EPA), or exhibit characteristics of ignitability, corrosivity, reactivity, and/or toxicity as defined by EPA. Since EPA regulations did not embrace a degree-of-hazard concept, any
49 Advanced Coal Technology By-product Disposal Management and Design Manual

Reguatmy Review
waste qualifying as hazardous would be subject to stringent management restrictions. Recog- nizing the cost implications for certain high- volume wastes and anticipating imminent RCRA reauthorization addressing this issue, EPA created a third "special waste'' category for low-hazard residuals, which were so desig- nated on the basis of testing by generating source. Wastes within this category were excluded from regulation as hazardous wastes under RCRA Subtitle C. The regulatory exemption, however, was not universal: several states, which can implement programs that are more stringent than the federal govern- ment's, require generators of special waste to test for the RCRA characteristics to determine whether it is hazardous waste.
A provision of the Solid Waste Disposal Act Amendments, enacted in October 1980, temporarily exempted from regulation as Subtitle C hazardous wastes certain high- volume wastes generated primarily from the combustion of coal or other fossil fuels, pending completion of an EPA Report to Congress (RTC) and a subsequent regulatory determination of whether such regulation is warranted. (One provision, the "Bevill exemption," is named after the sponsoring Congressman.) Specifically, EPA was directed to conduct a detailed and comprehensive study and submit an RTC on the adverse effects on human health and the environment, if any, from the disposal and utilization of fly ash, bottom ash, boiler slag, and flue dust ("large- volume wastes"), and other by-product materials generated primarily from the combustion of coal or other fossil fuels ("low- volume wastes"). [Low-volume wastes are within the Bevill exemption only if they are co-managed with large volume waste. Low- volume wastes that are independently managed are not and never have been within the scope of the Bevill exemption, and are, therefore, subject to RCRA Subtitle C if they exhibit a hazardous characteristic.] A flow chart describing waste classification under the Bevill exemption is presented in Figure 22.
With the Hazardous and Solid Waste Amendments of 1984 (HSWA), Congress legis- lated greater flexibility into the waste manage- ment program for high-volume wastes by authorizing EPA to promulgate management requirements for fossil fuel combustion (FFC) wastes that were less restrictive than manage- ment standards for hazardous wastes, as long as human health and the environment were protected. Under the amendments, if EPA determined that any wastes from FFC should be regulated as hazardous, the agency could relax certain stringent requirements of the Subtitle C program to consider the special characteristics of the wastes, the practical difficulties of implementing the standards, and site-specific characteristics.
EPA submitted the RTC in February 1988.', summarizing its analysis of the poten- tial effects of the four large-volume wastes, as well as data on other wastestreams typically generated in lower volumes ("low-volume wastes") by coal-fired utilities. [The report identified low-volume wastes generated by coal-fired electric utilities (e.g., boiler blowdown, cooling tower blowdown, coal pile runoff, boiler cleaning wastes) that may exhibit the corrosivity and toxicity hazardous waste characteristics and are typically mixed with, co-disposed, or co-treated with the four large- volume wastes. EPA indicated that additional study of low-volume wastes was warranted.] The report, however, addressed only wastes from the combustion of coal by electric utili- ties, and deferred to a later date study of the disposal and utilization of wastes generated by oil- and gas-fired utilities, as well as coal combustion in industries other than the electric utility industry. EPA was primarily concerned with the potential for waste leachate causing groundwater contamination at utility waste management facilities. On the basis of its analysis, EPA indicated that the four large- volume wastes are generally nonhazardous. EPA determined that leachate concentrations of three metals (cadmium, chromium, and arsenic) were occasionally detected above the toxicity
Advanced Coal Technology By-product 50 Disposal Management and Design Manual

Regulatory Review
SubJCa Io RCRA SuMiUcDlSIak HW Rcguldon
i
I S
I Figure 22. RCRA Bevill Status of Coal Combustion Wastes
51 Advanced Coal Technology By-Product Disposal Management and Design Manual

Regu/aory Re view
characteristic regulatory levels in ash or sludge samples. EPA also determined that the migra- tion of potentially hazardous constituents from utility waste disposal sites resulted in few exceedances of primary drinking water stan- dards downgradient from the sites and that exceedances of surface water quality standards were of low magnitude. This information, coupled with findings that exposure routes were unlikely and that current waste management practices appeared adequate, led EPA to tentatively recommend in the RTC that the four large-volume wastes remain exempt from Subtitle C regulation.
EPA was to issue the final regulatory determination within six months after the RTC. After missing that deadline, EPA was sued and agreed to complete the determination for FFC wastes in two phases: 1) a regulatory determination for fly ash waste, bottom ash waste, slag waste, and flue gas emission control waste (high-volume wastes) would be finalized by August 2, 1993; and 2) for all remaining wastes (low-volume wastes), EPA would complete further studies by September 30, 1997, and issue a final regulatory deter- mination by April 1, 1998.
After receiving public comments on the RTC, collection of supplemental data, and subsequent analysis, EPA published a final regulatory determination on August 9, 1993, concluding that, except for fluidized bed combustion (FBC) wastes as explained below, regulation as hazardous waste under Subtitle C is inappropriate for the four waste streams studied because of the limited risks they pose and the existence of adequate state and federal regulatory programs. The determination, effective September 2, 1993, applies only to the large-volume wastes generated by coal- fired units at steam electric utility power plants, including independent power producers not engaged in other industrial activity, as long as the wastes are managed separately from other FBC wastes.
Therefore, while the four large-volume wastes generated by coal-fired electric utilities (and certain independent power producers) are permanently exempt from Subtitle C regulation by EPA's August 9, 1993 regulatory deter- mination, the following wastes are not covered by the determination:
Large-volume wastes &e., fly ash, bottom ash, boiler slag, or flue gas emission control wastes) that are mixed with, co-disposed, co-treated, or other- wise co-managed with low-volume wastes generated in conjunction with the combustion of coal or other fossil fuels (e.g., boiler blowdown discharged to a large-volume waste impoundment, oil ash disposed of in a large-volume landfill).
Wastes generated while co-firing coal and other materials. (However, if the other material is hazardous waste, the residue continues to remain exempt from Subtitle C regulation as long as 50% of the feed is coal and the residue passes a two-part test specified in the boiler and industrial furnace rules in 40 CFR Part 266, Subpart H.)
Large-volume wastes generated by utilities with units firing fossil fuels other than coal.
Large-volume wastes generated by non-utility boilers burning any type of fossil fuel.
Large- and low-volume wastes from FBC units.
Low-volume wastes.
These wastes are now assigned to the category of "remaining wastes" that will continue to be temporarily exempt from Subtitle C regulation until at least April 1, 1998, when EPA will make its final determination of whether hazardous waste
Advanced Coal Technology By-product 52 Disposal Management and Design Manual

Regulatory Review
regulation is warranted for the "remaining wastes." In the interim, these wastes will continue to be regulated as nonhazardous waste by individual states under RCRA Subtitle D and state solid waste laws, resulting in substantial variation in applicable requirements. mote that the large-volume wastes from coal- fired utilities covered by the August 1993 final regulatory determination will be regulated by the same authorities (Le., Subtitle D or state) as the wastes just listed, but the exemption for the listed wastes is temporary, pending the later determination by EPA.]
4.2 General Overview of the Current Federal Regulatory Program
Subtitle D of RCRA establishes a framework for the control and management of nonhazardous solid waste. The federal role is limited; the responsibility for planning and implementing solid waste programs under Subtitle D rests principally with state and local governments. The federal government provides: 1) technical assistance to states; and 2) general regulatory direction to state and local governments by mandating minimum federal standards contained in 40 CFR 256, 257, and 258. State plans for managing solid waste are required to be developed and submitted to EPA for approval under federal guidelines found at 40 CFR 256. State and local governments have the option to implement solid waste management programs that are more stringent than those specified by the federal criteria.
Minimum technical standards for solid waste disposal facilities are contained in 40 CFR 257, Criteria for Classification Solid Waste Disposal Facilities and Practices ', and a recently promulgated and subsequently amended 40 CFR 258, Criteria for Municipal Solid Waste Landfills '. Part 257 was first promulgated in 1979 under Subtitle D authority; Part 258 was developed in response to a provision in the Hazardous and Solid Waste Amendments (HSWA) of 1984 that
directed EPA to revise the Part 257 criteria for the subset of facilities that "may receive hazardous household wastes or hazardous wastes from (RCRA) conditionally exempt small quantity generators (SQGs)." [Con- ditionally exempt small quantity generators generate 1100 kilograms (about 200 pounds or 25 gallons) of nonacute hazardous waste and/or 11 kilogram (about 2 pounds) of acute hazardous waste in a calendar month. This waste may be disposed of in a hazardous waste facility or municipal or industrial solid waste facility.] EPA identified the scope of the HSWA mandate to include: 1) municipal solid waste landfills (MSWLFs); and 2) some industrial solid waste disposal facilities and certain other Subtitle D facilities which may receive conditionally exempt SQG hazardous waste. EPA is undertaking revisions to the Part 257 criteria in two phases: the first phase, the establishment of a new Part 258 addressing MSWLFs, is completed; the second phase, which is under development at the agency, must address other Subtitle D facilities, such as noncommercial nonhazardous waste landfills that accept small quantities of hazardous waste (such as industrial landfills that accept hazardous waste). Pursuant to a judicial consent decree, the second phase Subtitle D regulations must be proposed by EPA by May 15, 1995, and promulgated by July 1, 1996. The new Part 258, establishing minimum national criteria for the location, design, operation, cleanup, and closure of MSWLFs, is far more comprehensive than Part 257 and may be representative of how EPA will approach the second phase regulation of nonmunicipal industrial disposal facilities that accept hazardous waste.
Part 257 applies to all facilities (landfills, surface impoundments, land applica- tion units, and waste piles) used for disposal of all types of solid waste (municipal, industrial, commercial, agricultural, mining, and oil and gas waste) regulated under Subtitle D, with certain exceptions. One of those exceptions is for any municipal solid waste landfii unit subject to the new Part 258. Part 258 contains
53 Advanced Coal Technology By-Product Disposal Management and Design Manual

Regulaiory Review
minimum criteria that apply to landfills that receive household waste (even though the landfills may accept other types of waste as well, i.e., commercial and industrial hazardous waste, nonhazardous sludge). Therefore, a nonmunicipal (i.e., industrial) landfill that accepts only nonhazardous waste is subject to Part 257.
The criteria of Parts 257 and 258 are used to determine which solid waste facilities and practices may adversely affect human health or the environment. Facilities that do not meet the specified criteria in Part 257 and Part 258 are considered "open dumps" for purposes of state solid waste management planning. Under RCRA and its regulations, there is a ban on ''open dumping"; new open dumps are prohibited and existing open dumps are required to be upgraded or closed.
4.2. I Papt 257 Criferia for Classificafion of Solid Wasfe Disposal Facilities
Part 257 contains general environ- mental siting and performance standards for affected solid waste disposal facilities that address the following areas: 1) floodplains; 2) endangered species; 3) surface water; 4) groundwater; 5) land application; 6) disease; 7) air; and 8) safety. A brief description of these standards appears below.
1) Facilities or practices in floodplains must not interfere with the floodplain or result in carrying away of solid waste so as to present a hazard to human life, wildlife, or land or water resources.
2) Facilities or practices must not cause or contribute to the taking of any endan- gered or threatened species or result in the destruction or adverse modification of the critical habitats of these species.
3) Facilities must not cause an unauthor- ized discharge of pollutants or dredged
or fill material to waters of the United States, and facilities or practices must not cause unauthorized non-point source pollution of such waters.
Facilities or practices must not cause or contribute to exceedances of the Safe Drinking Water Act Maximum Contaminant Levels (MCLs) in an underground drinking water source beyond the solid waste unit boundary or beyond an alternative boundary specified by the State.
Facilities or practices involving the application of waste to land used for producing food crops must meet certain restrictions about the concentrations of cadmium and polychlorinated biphenyls (PCBs) contained in the wastes.
Facilities or practices must implement appropriate disease vector controls, such as the periodic application of cover material.
Facilities or practices must not openly burn solid waste (with specified excep- tions) and must comply with applicable provisions of State Implementation Plans developed under section 110 of the Clean Air Act.
Facilities or practices must control explosive gases, fies, bird hazards to aircraft, and public access to the site.
Parf 258 Criteria for Municipal Solid Wasfe Landfills
Part 258 prescribes siting restrictions, design standards, operating criteria, ground- water monitoring and corrective action require- ments, and closure/post-closure standards for municipal solid waste landfills. States receiving authorization to implement their own programs will have more flexibility in program implementation, such as adopting standards to meet more site-specific conditions. To receive
Advanced Coal Technology By-product 54 Disposal Management and Design Manual
Regulatory Review
authorization, states must establish municipal solid waste landfill (MSWLQ permit programs. Strict compliance with federal standards will be required in states without approved programs. Most provisions of the Part 258 criteria were effective for most MSWLF units on October 9, 1993. A brief list of the Part 258 criteria is presented in Table 16.
Since the original promulgation of Part 258 in October 1991, EPA was sued, in 1992, by two environmental groups. The suit was based, in part, on two allegations: 1) the 1991 rule, which exempted small MSWLFs from groundwater monitoring requirements, conflicted with the statutory mandate to require such monitoring at &l landfills; and 2) in issuing the October 1991, Part 258 rule for only MSWLFs, EPA failed to carry out the statutory mandate that EPA promulgate revi- sions to Part 257 @e., issue Part 258) addressing &l "facilities that may receive hazardous household wastes or hazardous wastes from small quantity generators," which would also include nonmunicipal Subtitle D facilities such as industrial landfills that receive small quantities of hazardous waste. mote that Congress had established a statutory deadline of March 31, 1988, for EPA to issue revised regulations.]
In its May 7, 1993, opinion4, the court agreed that the statute does mandate groundwater monitoring at all Subtitle D facilities, vacated that part of the small landfill exemption, and required EPA to revise the rule so that "small" MSWLFs are not exempt from groundwater monitoring requirements. EPA published a regulatory amendment to that effect on October 1, 1993.
Furthermore, the court agreed that EPA was required to complete, by the deadline in the statute (which had already passed), rule- making revisions for all facilities noted in 2) above, and not just MSWLFs (the "second
phase" of the revisions to Part 257 previously mentioned). However, the court did not rule on that claim, asserting that the district court, rather than-the court of appeals, had jurisdic- tion. Note that, at a minimum, EPA has to promulgate by July 1, 1996, a rule addressing the limited universe of nonmunicipal (e.g., industrial) facilities that receive small quantities of hazardous waste. The rule could, but is not required to address, for example, an industrial landfill that accepts only non- hazardous waste. The scope of the rule is undetermined at this point. If it does not address nonmunicipal nonhazardous waste fac- ilities, they would still be regulated by the environmental performance standards of Part 257.
As evidenced by the above discussion, the federal regulatory history of Subtitle D facilities and wastes is checkered and reveals a trend toward stricter regulation. In past negotiations over RCRA reauthorization, congressional attempts have been made to increase the stringency of Subtitle D requirements by making them similar to the Subtitle C hazardous waste management scheme. In addition, with promulgation of more burdensome Part 258 regulations and judicial sentiment affirming that a Subtitle D management program for certain nonmunicipal industrial waste facilities is statutorily required, it is likely that the federal minimum criteria for industrial solid waste facilities receiving small quantities of hazardous waste will be more like Subtitle C hazardous waste requirements than Part 258 requirements. If the scope of the future regulation encompasses industrial nonhazardous waste facilities (even though it is not required to do so), states will be required to follow suit. Upcoming RCRA reauthoriza- tion debate is likely to include a discussion of risk-based approaches to facility engineering and design, as well as other changes to the current system of numerical performance standards.
55 - Advanced Coal Technology By-product Disposal Management and Design Manual
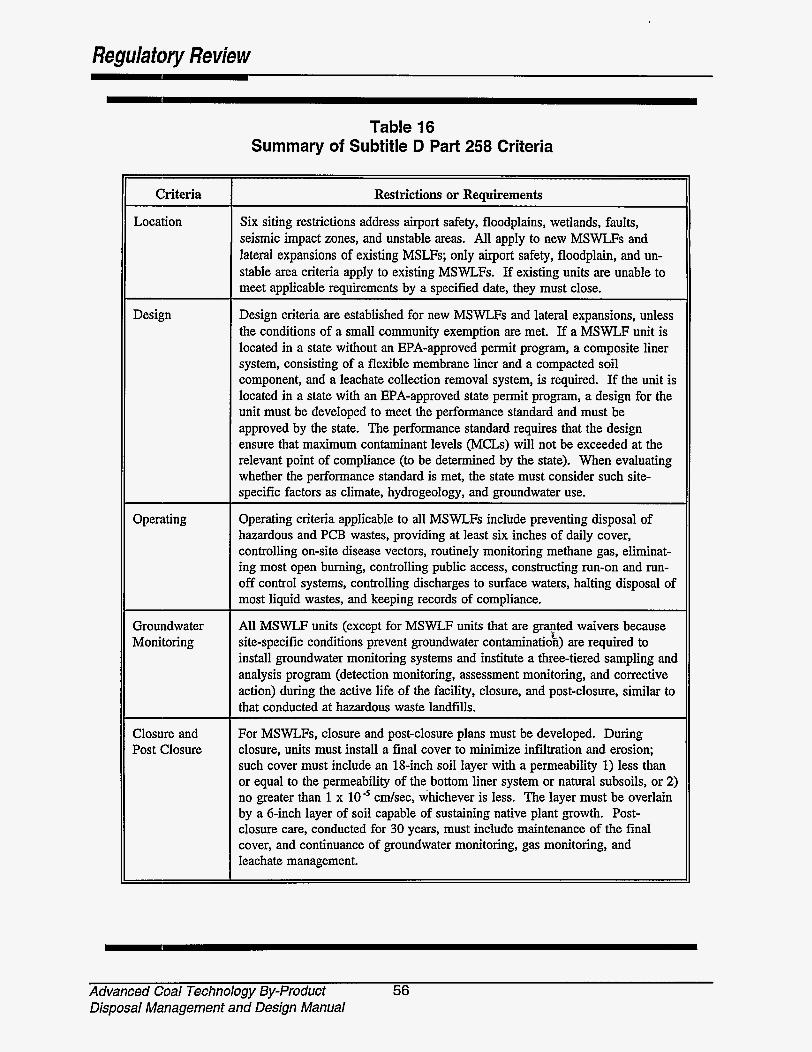
Reguhfory Review
Criteria
Location
Design
Operating
Groundwater Monitoring
Closure and Post Closure
Table 16 Summary of Subtitle D Part 258 Criteria
Restrictions or Requirements
Six siting restrictions address airport safety, floodplains, wetlands, faults, seismic impact zones, and unstable areas. All apply to new MSWLFs and lateral expansions of existing MSLFs; only airport safety, floodplain, and un- stable area criteria apply to existing MSWLFs. If existing units are unable to meet applicable requirements by a specified date, they must close.
Design criteria are established for new MSWLFs and lateral expansions, unless the conditions of a small community exemption are met. If a MSWLF unit is located in a state without an EPA-approved permit program, a composite liner system, consisting of a flexible membrane liner and a compacted soil component, and a leachate collection removal system, is required. If the unit is located in a state with an EPA-approved state permit program, a design for the unit must be developed to meet the performance standard and must be approved by the state. The performance standard requires that the design ensure that maximum contaminant levels (MCLs) will not be exceeded at the relevant point of compliance (to be determined by the state). When evaluating whether the performance standard is met, the state must consider such site- specific factors as climate, hydrogeology, and groundwater use.
Operating criteria applicable to all MSWLFs include preventing disposal of hazardous and PCB wastes, providing at least six inches of daily cover, controlling on-site disease vectors, routinely monitoring methane gas, eliminat- ing most open burning, controlling public access, constructing run-on and run- off control systems, controlling discharges to surface waters, halting disposal of most liquid wastes, and keeping records of compliance.
All MSWLF units (except for MSWLF units that are granted waivers because site-specific conditions prevent groundwater contamination) are required to install groundwater monitoring systems and institute a three-tiered sampling and analysis program (detection monitoring, assessment monitoring, and corrective action) during the active life of the facility, closure, and post-closure, similar to that conducted at hazardous waste landfills.
-r
For MSWLFs, closure and post-closure plans must be developed. During closure, units must install a final cover to minimize infiltration and erosion; such cover must include an 18-inch soil layer with a permeability 1) less than or equal to the permeability of the bottom liner system or natural subsoils, or 2) no greater than 1 x lo5 cdsec, whichever is less. The layer must be overlain by a 6-inch layer of soil capable of sustaining native plant growth. Post- closure care, conducted for 30 years, must include maintenance of the final cover, and continuance of groundwater monitoring, gas monitoring, and leachate management.
Advanced Coal Technology By-product 56 Disposal Management and Design Manual
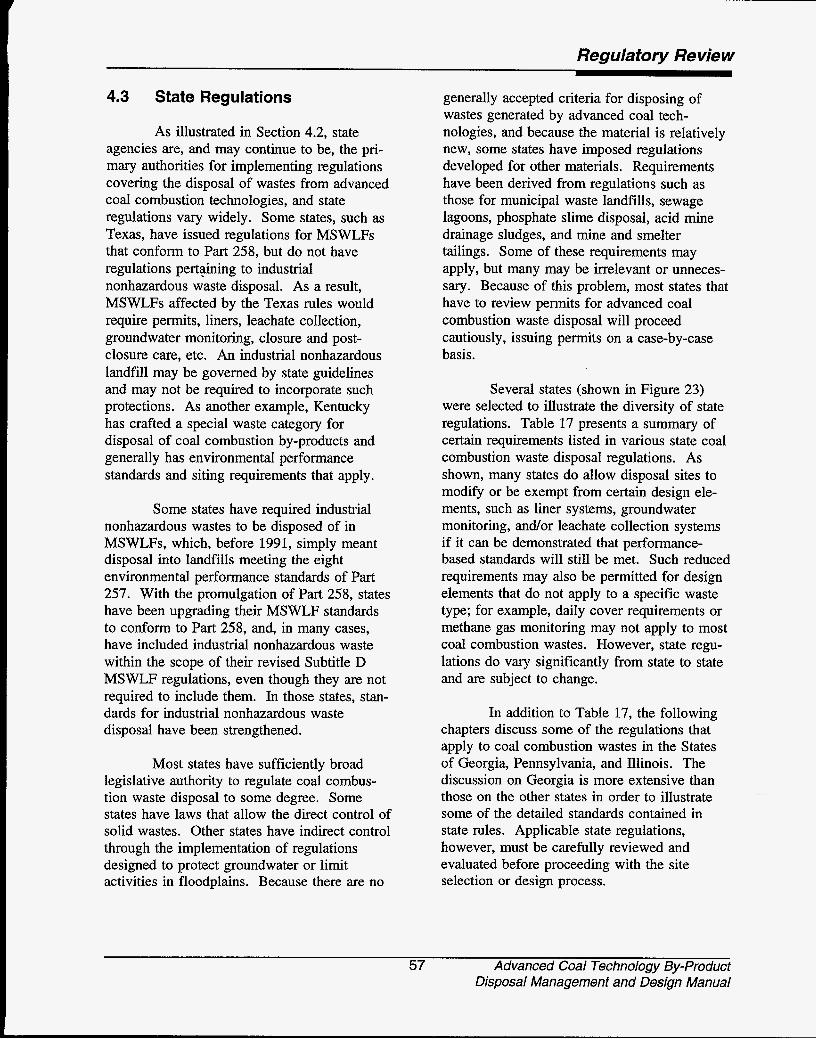
Regulatory Review
4.3 State Regulations
As illustrated in Section 4.2, state agencies are, and may continue to be, the pri- mary authorities for implementing regulations covering the disposal of wastes from advanced coal combustion technologies, and state regulations vary widely. Some states, such as Texas, have issued regulations for MSWLFs that conform to Part 258, but do not have regulations pertgning to industrial nonhazardous waste disposal. As a result, MSWLFs affected by the Texas rules would require permits, liners, leachate collection, groundwater monitoring, closure and post- closure care, etc. An industrial nonhazardous landfill may be governed by state guidelines and may not be required to incorporate such protections. As another example, Kentucky has crafted a special waste category for disposal of coal combustion by-products and generally has environmental performance standards and siting requirements that apply.
Some states have required industrial nonhazardous wastes to be disposed of in MSWLFs, which, before 1991, simply meant disposal into landfills meeting the eight environmental performance standards of Part 257. With the promulgation of Part 258, states have been upgrading their MSWLF standards to conform to Part 258, and, in many cases, have included industrial nonhazardous waste within the scope of their revised Subtitle D MSWLF regulations, even though they are not required to include them. In those states, stan- dards for industrial nonhazardous waste disposal have been strengthened.
Most states have sufficiently broad legislative authority to regulate coal combus- tion waste disposal to some degree. Some states have laws that allow the direct control of solid wastes. Other states have indirect control through the implementation of regulations designed to protect groundwater or limit activities in floodplains. Because there are no
generally accepted criteria for disposing of wastes generated by advanced coal tech- nologies, and because the material is relatively new, some states have imposed regulations developed for other materials. Requirements have been derived from regulations such as those for municipal waste landfills, sewage lagoons, phosphate slime disposal, acid mine drainage sludges, and mine and smelter tailings. Some of these requirements may apply, but many may be irrelevant or unneces- sary. Because of this problem, most states that have to review permits for advanced coal combustion waste disposal will proceed cautiously, issuing permits on a case-by-case basis.
Several states (shown in Figure 23) were selected to illustrate the diversity of state regulations. Table 17 presents a summary of certain requirements listed in various state coal combustion waste disposal regulations. As shown, many states do allow disposal sites to modify or be exempt from certain design ele- ments, such as liner systems, groundwater monitoring, and/or leachate collection systems if it can be demonstrated that performance- based standards will still be met. Such reduced requirements may also be permitted for design elements that do not apply to a specific waste type; for example, daily cover requirements or methane gas monitoring may not apply to most coal combustion wastes. However, state regu- lations do vary significantly from state to state and are subject to change.
In addition to Table 17, the following chapters discuss some of the regulations that apply to coal combustion wastes in the States of Georgia, Pennsylvania, and Illinois. The discussion on Georgia is more extensive than those on the other states in order to illustrate some of the detailed standards contained in state rules. Applicable state regulations, however, must be carefully reviewed and evaluated before proceeding with the site selection or design process.
57 Advanced Coal Technology By-product Disposal Management and Design Manual
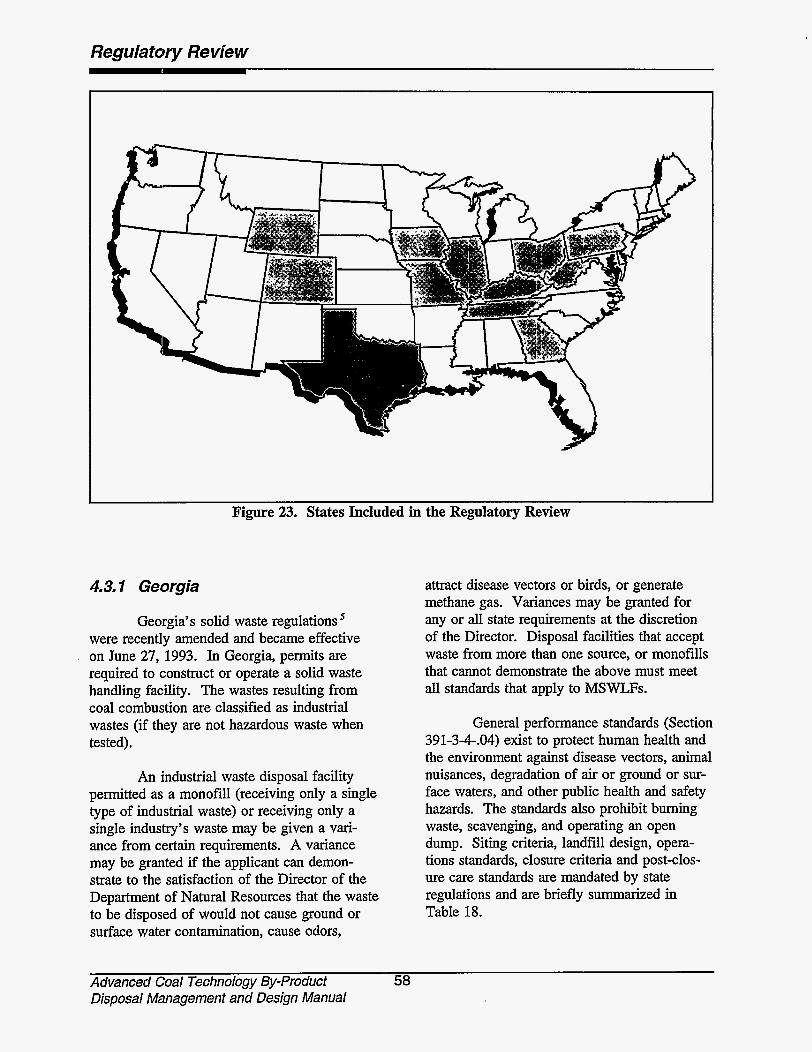
Regulatory Re view
Figure 23. States Included in the Regulatory Review
4.3.1 Georgia
Georgia’s solid waste regulations were recently amended and became effective on June 27, 1993. In Georgia, permits are required to construct or operate a solid waste handling facility. The wastes resulting from coal combustion are classified as industrial wastes (if they are not hazardous waste when tested).
An industrial waste disposal facility permitted as a monofill (receiving only a single type of industrial waste) or receiving only a single industry’s waste may be given a vari- ance from certain requirements. A variance may be granted if the applicant can demon- strate to the satisfaction of the Director of the Department of Natural Resources that the waste to be disposed of would not cause ground or surface water contamination, cause odors,
attract disease vectors or birds, or generate methane gas. Variances may be granted for any or all state requirements at the discretion of the Director. Disposal facilities that accept waste from more than one source, or monofills that cannot demonstrate the above must meet all standards that apply to MSWLFs.
General performance standards (Section 391-3-4.04) exist to protect human health and the environment against disease vectors, animal nuisances, degradation of air or ground or sur- face waters, and other public health and safety hazards. The standards also prohibit burning waste, scavenging, and operating an open dump. Siting criteria, landfill design, opera- tions standards, closure criteria and post-clos- ure care standards are mandated by state regulations and are briefly summarized in Table 18.
Advanced Coal Technology By-product 58 Disposal Management and Design Manual
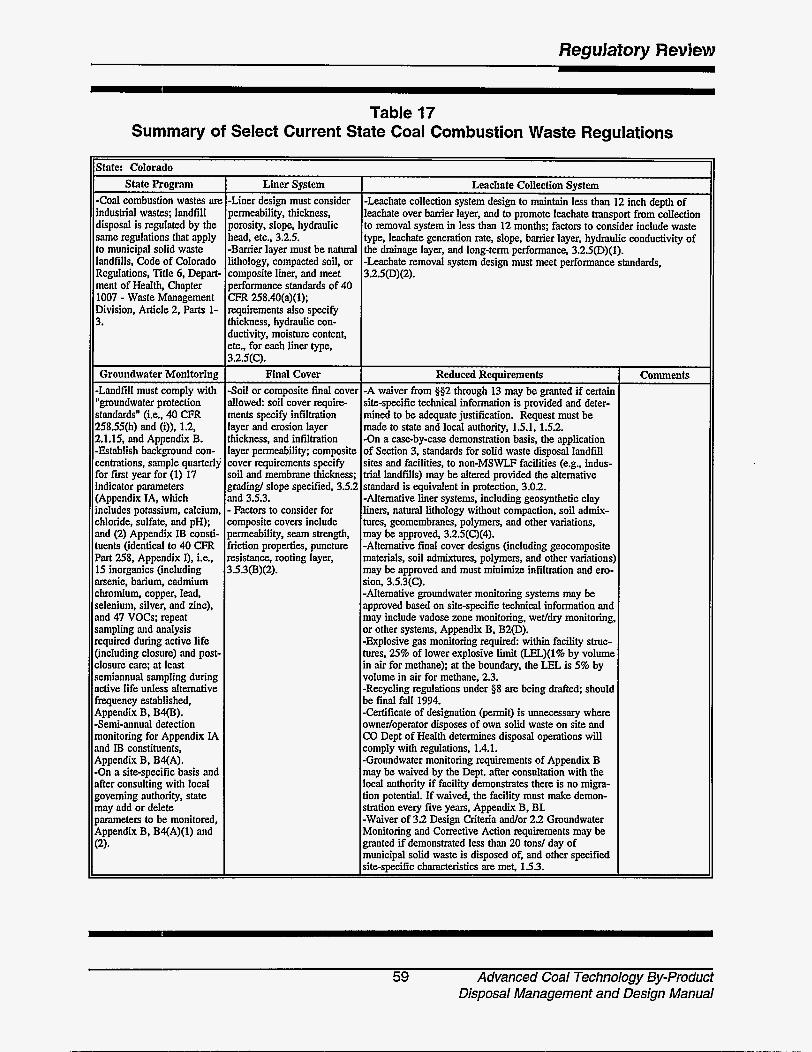
Reg u Jaf ory Review
-Coal combustion wastes are industrial wastes; landfill disposal is regulated by the same regulations that apply to municipal solid waste landfills, Code of Colorado Regulations, Title 6, Depart- ment of Health, Chapter 1007 - Waste Management Division, Article 2, Parts 1- 3.
Table 17 Summary of Select Current State Coal Combustion Waste Regulations
-Liner design must consider permeability, thickness, porosity, slope, hydraulic head, etc., 3.2.5. -Barrier layer must be natural lithology, compacted soil, or composite liner, and meet performance standards of 40 CFR 258.40(a)(l); requirements also specify thickness, hydraulic con- ductivity, moisture content, etc.. for each liner type, 3.2.563.
State: Colorado State Program I Liner Svstem
Groundwater Monitoring -Landfill must comply with "groundwater protection standards" (i.e., 40 CFR 258.55(h) and (i)), 1.2, 2.1.15, and Appendix B. -Establish background con- centrations, sample quarterly for first year for (1) 17 indicator panmeters (Appendix IA, which includes potassium, calcium, chloride, sulfate, and pH); and (2) Appendix IB consti- tuents (identical to 40 CFR Part 258, Appendix I), Le.. 15 inorganics (including arsenic, barium, cadmium chromium, copper, lead, selenium, silver, and zinc), and 47 VOCs; repeat sampling and analysis required during active life (including closure) and post- closure care; at least semiannual sampling during active life unless alternative frequency established, Appendix B, B4(B). -Semi-annual detection monitoring for Appendix IA and IB constituents, Appendix B, B4(A). -On a sitespecific basis and after consulting with local governing authority, state may add or delete panmeters to be monitored, Appendix B, B4(A)(1) and (2).
Final Cover -Soil or composite final cove1 allowed: soil cover require- ments specify infiltration layer and erosion layer thickness, and infiltration layer permeability; composite cover requirements specify soil and membrane thickness; grading/ slope specified, 3.5.2 and 3.5.3. - Factors to consider for composite covers include permeability, seam strength, friction properties, puncture resistance, rooting layer. 3.5.3@)(2).
Leachate Collection System -Leachate collection system design to maintain less than 12 inch depth of Leachate over barrier layer, and to promote leachate transport from collection to removal system in less than 12 months; factors to consider include waste type, leachate generation rate, slope, barrier layer. hydraulic conductivity of the drainage layer, and long-term performance. 3.2.5@)(1). -Leachate removal system design must meet performance standards, 3.2.5@)(2).
Reduced Requirements -A waiver from 582 through 13 may be m t e d if certain site-specific technical infokation is proGded and deter- mined to be adequate justification. Request must be made to state and local authority, 1.5.1. 1.5.2. -On a case-by-case demonstration basis, the application of Section 3. standards for solid waste disposal landfill sites and facilities, to non-MSWLF facilities (e.g., indus- trial landfills) may be altered provided the alternative standard is equivalent in protection. 3.0.2. Alternative liner systems, including geosynthetic clay liners, natural lithology without compaction, soil admix- -, geomembranes, polymers, and other variations, may be approved, 3.2.5(C)(4). -Alternative final cover designs (including geocomposite materials, soil admixtures, polymers, and other variations) may be approved and must minimize infiltration and ero- ;ion, 3.5.3(C). Alternative groundwater monitoring systems may be ipproved based on site-specific technical information and nay include vadose zone monitoring, wet/dry monitoring, ir other systems, Appendix B. B2@). .Explosive gas monitoring required: within facility strut- ures, 25% of lower explosive limit (LEL)(l% by volume n air for methane); at the boundary, the LJZL is 5% by folume in air for methane, 2.3. .Recycling regulations under $8 are being drafted; shouId ie final fall 1994. Certificate of designation (permit) is unnecessary where iwnerloperator disposes of own solid waste on site and 20 Dept of Health determines disposal operations will :omply with regulations. 1.4.1. ,Groundwater monitoring requirements of Appendix B nay be waived by the Dept. after consultation with the ocal authority if facility demonstrates there is no migra- ion potential. If waived, the facility must make demon- ;tration every five years, Appendix B. BI. .Waiver of 3.2 Design Criteria and/or 2.2 Groundwater Monitoring and Corrective Action requirements may be yanted if demonstrated less than 20 tons/ day of nunicipal solid waste is disposed of, and other specified ;ite-specific characteristics are met, 1.5.3.
Comments
59 Advanced Coal Technology By-product Disposal Management and Design Manual
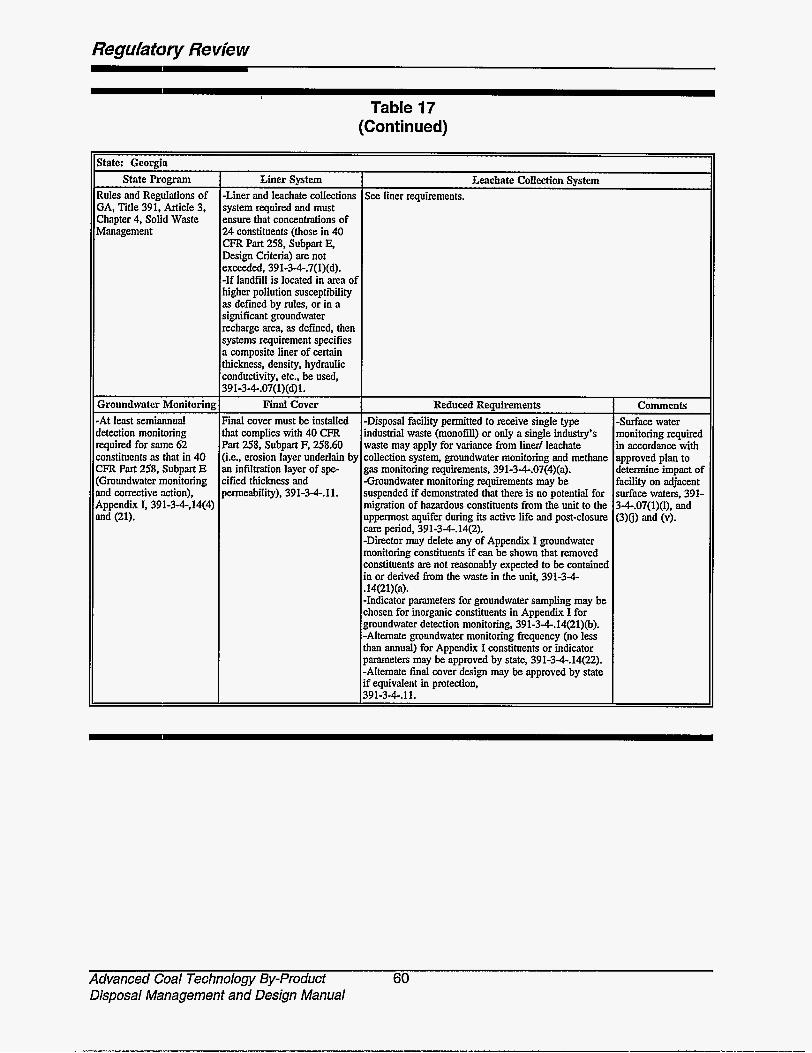
Regufatory Re view
Reduced Requirements -Disposal facility permitted to receive single type industrial waste (monofill) or only a single industry's waste may apply for variance from h e r / leachate collection system, groundwater monitoring and methane gas monitoring requirements, 391-34.07(4)(a). -Groundwater monitoring requirements may be suspended if demonstrated that there is no potential for migration of hazardous constituents from the unit to the
Table 17 (Continued)
Comments Surface water monitoring required in accordance with approved plan to determine impact of facility on adjacent surface waters, 391- 34.07(1)(1), and
itate: Georgia State P r o g m
tules and Regulations of :A, Title 391. Article 3, 2hapter 4, Solid Waste vlanagement
>roundwafer Monitoring At least semiannual letection monitoring equired for same 62 onstituents as that in 40 F R Part 258, Subpart E Groundwater monitoring nd corrective action), ippendix I, 391-34,14(4) nd (21).
Liner System Liner and leachate collections ystem required and must nsure that concentrations of A constituents (those in 40 FR Part 258, Subpart E, Iesign Criteria) are not xceeded, 391-34.7(1)(d). [f landfill is located in area of igher pollution susceptibility s defmed by rules, or in a ignificant groundwater :charge area, as defined, then ystems requirement specifies composite liner of certain
lickness, density, hydraulic onductivity, etc., be used, 91-34.07(1Md)I.
~~~
Final Cover inal cover must be installed iat complies with 40 CFR 'art 258, Subpart F, 258.60 i.e., erosion layer underlain by n infiltration layer of spe- ified thickness and ermeability), 391-34.11.
Leachate Collection System iee liner requixements.
uppermost aquifer during its active life and post-closure care period, 391-34.14(2). -Director may delete any of Appendix I groundwater monitoring constituents if can be shown that removed constituents are not reasonably expected to be contained in or derived from the waste in the unit, 391-34 .14(21)(a). -Indicator parameters for groundwater sampling may be chosen for inorganic constituents in Appendix I for groundwater detection monitoring, 391-34.14(21)(b). -Alternate groundwater monitoring frequency (no less than annual) for Appendix I constituents or indicator parameters may be approved by state, 391-34.14(22). -Alternate final cover design may be approved by state if equivalent in protection, 391-34.11.
Advanced Coal Technology By-product 60 Disposal Management and Design Manual
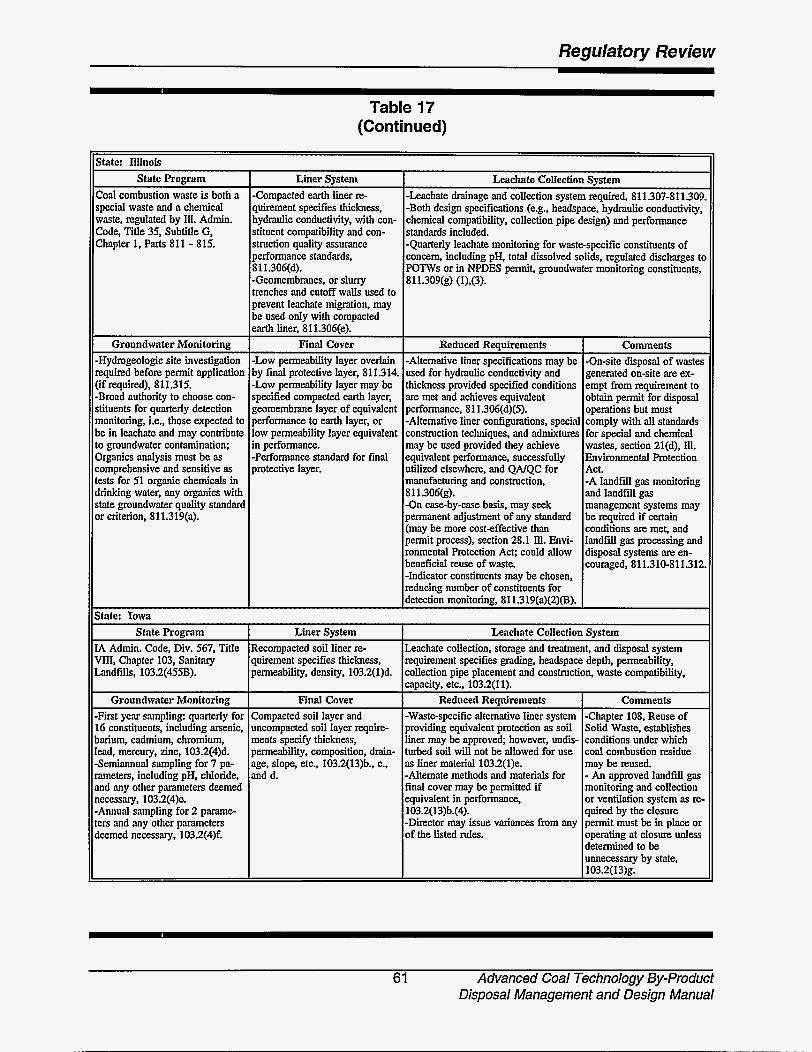
Regulatory Review
Liner System -Compacted earth liner re- quirement specifies thickness, hydraulic conductivity, with con- stituent compatibility and con- struction quality assurance performance standards, 8 11.306(d). -Geomembranes, or sluny trenches and cutoff walls used to prevent leachate migration, may be used only with compacted earth liner, 811.306(e).
Final Cover
Table 17 (Continued)
Leachate ColIection System -Leachate drainage and collection system required, 811.307-811.305 -Both design specifications (e.g., headspace, hydraulic conductivity, chemical compatibility, collection pipe design) and performance standards included. -Quarterly leachate monitoring for waste-specific constituents of concern, including pH. total dissolved solids, regulated discharges tl POTWs or in NPDES permit, groundwater monitoring constituents, 811.309(g) (1),(3).
Reduced Requirements I Comments
itate: Illinoa State Program
-Low permeability layer overlain by final protective layer, 811.314. -Low permeability layer may be specified compacted earth layer, geomembrane layer of equivalent performance to earth layer, or low permeability layer equivalent in performance. -Performance standard for final protective layer.
loal combustion waste is both a pecial waste and a chemical vaste, regulated by 111. Admin. :ode, Title 35, Subtitle G, 2hapter 1, Parts 811 - 815.
-Alternative liner specifications may be used for hydraulic conductivity and thickness provided specified conditions are met and achieves equivalent performance, 811.306(d)(5). -Alternative liner configurations, special construction techniques, and admixtures may be used provided they achieve equivalent performance, successfully utilized elsewhere, and QNQC for manufacturing and construction, 811.306k). -On case-by-case basis, may seek permanent adjustment of any standard (may be more cost-effective than permit process), section 28.1 Ill. Envi- ronmental Protection Act; could allow beneficial reuse of waste. -Indicator constituents may be chosen, reducing number of constituents for detection monitoring, 811.319(a)(2)(B).
Groundwater Monitoring Hydrogeologic site investigation equired before permit application if required), 811.315. Broad authority to choose con- tituents for quarterly detection nonitoring, Le., those expected to ie in leachate and may contribute D groundwater contamination; Irganics analysis must be as omprehensive and sensitive as sts for 51 organic chemicals in 'rinking water, any organics with tate groundwater quality standard lr criterion, 811.319(a).
-Waste-specific alternative liner system providing equivalent protection as soil liner may be approved; however, undis- turbed soil will not be allowed for use as liner material 103.2(l)e. -Alternate methods and materials for final cover may be permitted if equivalent in performance.
~ 103.2(13)b.(4). i-Director may issue variances from any of the listed rules.
-Chapter 108. Reuse of Solid Waste, establishes conditions under which coal combustion residue may be reused. - An approved landfill gas monitoring and collection or ventilation system as re quired by the closure permit must be in place or operating at closure unless determined to be unnecessarv bv state.
-On-site disposal of waste: generated on-site are ex- empt from requirement to obtain permit for disposal operations but must comply with all standards for special and chemical wastes, section 21(d), Ill. Environmental Protection Act. -A landfill gas monitoring and landfill gas management systems may be required if certain conditions are met, and landfill gas processing and disposal systems are en- couraged, 811.310-81 1.31:
Itate: Iowa Statc Program
A Admin. Code, Div. 567, Title UII, Chapter 103, Sanitary mdfills, 103.2(455B).
Liner System Recompacted soil liner re- quirement specifies thickness, permeability. density, 103.2(l)d.
Leachate Collection System Leachate collection, storage and treatment, and disposal system requirement specifies grading, headspace depth, permeability, collection pipe placement and construction, waste compatibility,
Groundwater Monitoring I Final Cover I Reduced Requirements I Commenfs First year sampling: quarterly for 6 constituents, including arsenic, arium, cadmium, chromium, xd, mercury, zinc, 103.2(4)d. Semiannual sampling for 7 pa- meters, including pH, chloride, nd any other parameters deemed ecessary, 103.2(4)e. Annual sampling for 2 parame :rs and any other parameters eemed necessary, 103.2(4)f.
Compacted soil layer and uncompacted soil layer require- ments specify thickness, permeability. composition, drain- age, slope, etc.. 1032(13)b., c.. and d.
I I 1103.2(13);
61 Advanced Coal Technology By-product Disposal Management and Design Manual

Regulafory Review
State Program -Coal combustion byproducts (see definition in 401 Kentucky Administrative Regulations (KAR) 45010, Sec. l(4)) are special wastes regulated by Kentucky special waste regulations (401 KAR 30 and 45). -To be designated special waste, among other criteria, levels of waste constituents must be - e: arsenic 0.05 mgL; barium 1.0 mgL; cad- mium 0.01 mgL; hexavalent chromium 0.05 mgL; lead 0.05 m a ; mercury 0.002 mgL; nitrate 10.0 mgL; selenium 0.01 mgL; and silver 0.05 mg/L, 401 KAR 45210, Sec. 2. -Main thrust of special waste regulations is to demonstrate compliance with environmental performance standards of 401 KAR 30:031 and Siting Requirements for Special Waste Landfills) of 401 KAR 45130 401 KAR 45110; technical requirements for special waste landfills are found in 401 KAR 4 5 03C (Obtaining a special waste site or facility permit) and 401 KAR 45:llO (Technical and operating requirements for special waste landfills). I
Table 17 (Continued)
Groundwater Monitoring Final Cover
IlState: Kentucky
Reduced Requirements Comments
Liner System -Compatibility with waste and permeability of liner must be consid- ered, if a liner is re- quired. Liner shall en- sure containment of waste on site and com- pliance with 401 KAR 30031,401 KAR 45110 Secs. l(1) and (4).
-Groundwater monitoring system shall accurately analyze groundwater quality and characterize regional and local groundwater flow and flow systems, 401 KAR 45160 Sec. 2. -Baseline groundwater quality characterization parameters are specified for special waste landfills used solely for disposal of coal combustion byproducts, and include chloride, pH, copper, nickel, zinc, arsenic, cadmium, lead, mercury, selenium, calcium, potassium, and sulfate, 401 KAR 45160 Sa. 7(2). -Semiannual monitoring is required for special waste landfills used solely for disposal of coal combustion byproducts. Parameters include chloride, pH, and copper. Monitoring of additional parameters may be required based on a significant increase from baseline characterization, 401 KAR 45160 Sec. WW) (4.
II
-Closure plan must be -If the following operations are submitted that includes common to an industry, are not in a closure design violation of 401 KAR 30:031. do specifying function and not pose a threat to human health design of final cover or environment, and meet other considering type and conditions specified in d e . then amount of waste, they may be deemed to have a mobility and migration special waste permit by rule with- expected of waste or out having to submit permit appli- leachate constituents, cation: site characteristics, cli- *Person who beneficially reuses matic conditions, cha- coal combustion byproducts as an racteristics of cover ingredient or substitute ingredient material, including its in manufacturing of products, in- chemical and physical cluding cement, concrete, paint, composition, erodibility, and plastics, antiskid material. . slope stability, final sur- highway base course, structural fill, face contours, thickness, blasting grit, or roofing granules, porosity, permeability, 401 KAR 45:060 Sec. l(7); slope, length of run of -0wnerloperator of a facility slope, type of vegetatior that disposes of coal combustion on cover, geology and fly ash, bottom ash, and scrubber soil profiles. and surface sludge in active mining operation and subsurface provided ownerloperator has a min. hydrology, 401 KAR ing permit under KY Revised
Statutes Ch. 350 that includes
See performance criteria listed under liner system.
Leachate Collection System -Design of leachate control system must consider physical characteristics of waste, climatic conditions of specific location, and volume of leachate, 401 KAR 45:llO Sec. l(7).
Advanced Coal Technology By-product 62 Disposal Management and Design Manual
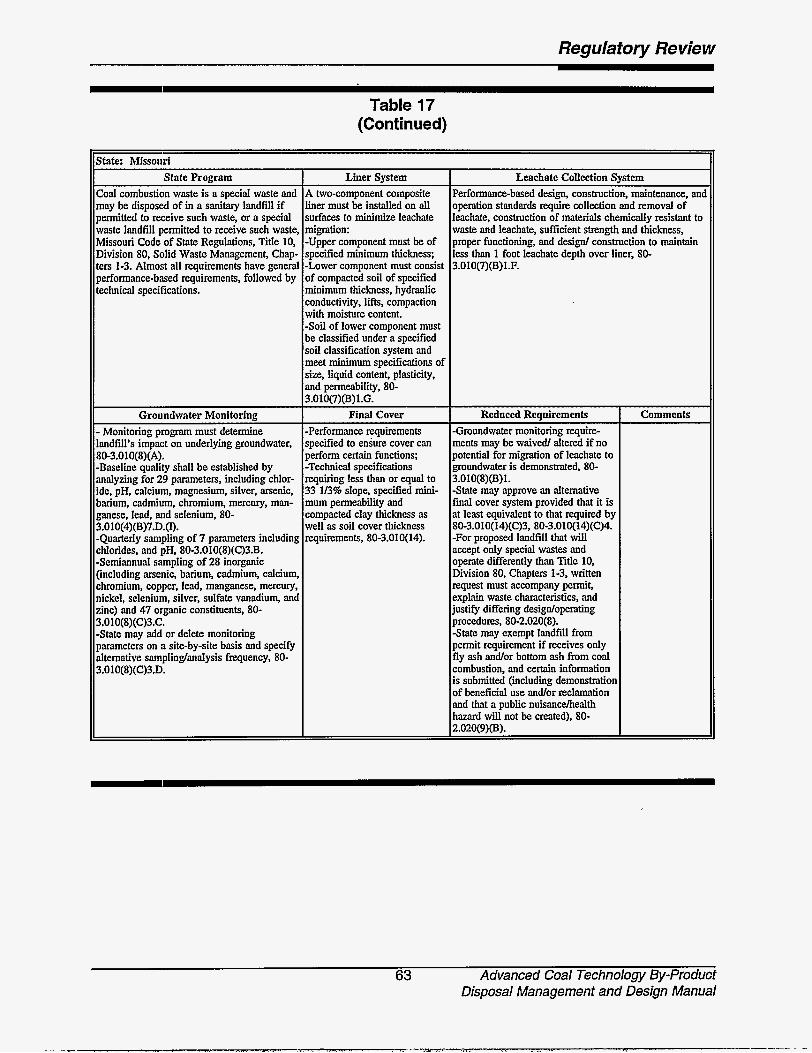
Regdatory Review
Table 17 (Continued)
itate: Missouri State Program
:oal combustion waste is a special waste and nay be disposed of in a sanitary landfill if iermitted to receive such waste, or a special vaste landfill permitted to receive such waste, dissouri Code of State Regulations, Title 10, Xvision 80, Solid Waste Management, Chap- ers 1-3. Almost all requirements have general ierformance-based requirements, followed by echnical specifications.
Groundwater Monitoring Monitoring program must determine
andfill's impact on underlying groundwater,
Baseline quality shall be established by malyzing for 29 parameters, including chlor- de, pH, calcium, magnesium, silver, arsenic, iarium, cadmium, chromium, mercury, man- :anese, lead, and selenium, 80- 1.010(4)(B)7.D.(l). Quarterly sampling of 7 parameters including :hlorides, and pH, 80-3.010(8)(C)3.B. Semiannual sampling of 28 inorganic including arsenic, barium, cadmium, calcium, :hromium, copper, lead, manganese, mercury, iickel, selenium, silver, sulfate vanadium, and :inc) and 47 organic constituents, 80- 1.010(8)(C)3.C. State may add or delete monitoring iarameters on a site-by-site basis and specify llternative samplinglanalysis frequency, 80- 1.010(8)(C)3.D.
I0-3.010(8)(A).
Liner System i two-component composite iner must be installed on all urfaces to minimize leachate nigration: Upper component must be of pecified m i n i u m thickness; Lower component must consist if compacted soil of specified ninimum thickness, hydraulic :onductivity, lifts, compaction vith moisture content. Soil of lower component must le classified under a specified oil classification system and neet min ium specifications of ize, liquid content, plasticity, Ind permeability. 80- LOlOCIKB~1.G.
Final Cover Performance requirements pecified to ensure cover can ierform certain functions; Technical specifications equiring less than or equal to 13 1/3% slope, specified mini- num permeability and ompacted clay thickncss as vel1 as soil cover thickness equirements, 80-3.010(14).
Leachate Collection System 'erformance-based design, construction, maintenance, and ,peration standards require collection and removal of xchate, construction of materials c h e m i d y resistant to mte and leachate, sufficient strength and thickness, #roper functioning, and design/ construction to maintain IS than 1 foot leachate depth over liner, 80- .010(7)(B)l.F.
Reduced Requirements Groundwater monitoring require- nents may be waived/ altered if no Notential for migration of leachate to ;roundwater is demonstrated, 80- .010(8)(B)1. State may approve an alternative inal cover system provided that it is t least equivalent to that required by
For proposed landfill that will ccept only special wastes and lperate differently than Title 10, Xvision 80, Chapters 1-3, written quest must accompany permit, xplain waste characteristics, and ustify differing designloperating
State may exempt landfill from termit requirement if receives only ly ash andlor bottom ash from coal ombustion. and certain information 3 submitted (including demonstratior If beneficial use andlor reclamation nd that a public nuisancelhealth lazard will not be created), 80- ..020(9)1B).
0-3.010(14)(C)3, 80-3.010(14)(C)4.
lr~cedure~, 80-2.020(8).
Comments
63 Advanced Coal Technology By-product Disposal Management and Design Manual

Regulatory Review
Reduced Requirements Comments Policy 4.07: Certain beneficial uses do Policy 4.07: not require approval of the Division of requires a Water Pollution Control, p. 5. permit to - RWLF: install, air -Alternatives to certain liner requirements permit to may be used if demonstrated each lift operate, and will have a permeability of 1 x 10” unless cmlsec, 3745-30-07(C)(l)Q. exempted for -To allow for alternate technologies, acceptable
Table 17 (Continued)
alternate liner thickness may be approved beneficial if equivalent in protection, 3745-30- uses, a 07(C)(l)(i). (NPDES
t to waste and leachate, be allow no more than negli-
er by a cushion layer, 3745-
table addresses Policy 4.07 and ual waste landfill requirements.
. .. -To allow for alternate technologies, permit to be alternate design that does not incorporate issued by OH a geomembrane may be approved for EPA for dis-
posal sites fox Class II landfill if equivalent in protection, 3745-30-07(C)(2)(e). nontoxic -Alternate list of groundwater quality flyhottom parameters to be monitored may be ash, p.1. approved if equivalent in protection, E 3745-30-08@)(2). -Post-closure -Alternative materials and/or thickness care period for soil banier and vegetative layers of for Class I1 is cap system may be approved, 3745-30- 20 years; for 090(3). Class III is 15 -Variance from any provisions may be years. 3745- approved by state if adequate 30-10(A)(2) justification submitted, 3745-30-15@). and (3).
including requirements (1) not to locate over an unconsolidated aquifer capable of yielding greater than 100 gdmin to a well within 1,OOO feet of waste placement limits, and (2) provide an isolation distance between the uppermost aquifer and liner bottom no less than 5 feet of insitu or added geo- logical material acceptable to state and not exceeding inaximum permeability of 1 x 10” cmlsec., pp. 2-4. R W P r
vegetative cover, final grade of 2-25%. RWLF: -Recompacted soil liner requirements specify lift thickness and permeability, clod size, soil particle size, compaction density, moisture content, slope, and erosion rate, 3745-30-090(3). -Soil vegetative layer of thickness such that top of the recompacted soil banier layer is below frost depth, 3745-30- 090(3).
-
- - . . __ . - -Quarterly baseline monitoring for 1 year for 29 parameters including pH, sulfate, calcium, arsenic, barium, cad- mium, chromium, lead, mercury, selenium, silver, chloride, and manganese, 3745-30-08@)(3). -After first year, semiannual sampling for 7 parameters, including pH, sulfate, and calcium, 3745-30-08(D)(4). -After first year, annual sampling for 17 parameters, including arsenic, barium, cadmium, chromium, lead, mercury, selenium, silver, chloride, and manganese, 3745-30-08@)(5).
Leachate Collection System Policy 4.07: Underdrain system for disposal area, with contaminated drainage dmcted to a wastewater treatment facility, p. 4. RWLF: -Performance-based design standards to contain and collect leachate, function without clogging, prevent crushingldamage to components, and be chemically resistant, 3745-30-07(C)(3)
-Leachate level limited in areas other than lift stations to 1-foot maximum and granular material used for drainage must have permeability no less than 1 x 10” cdsec, 3745-30-07(C)(3)(b). -Leachate conveyance or storage structure outside limits of waste placement must be as protective as landfill and be monitored, if required, have spill containment for storage tanks, double-casing for leachate pipelines, and have at least one week storage capacity, using design assumptions simulating a final cap system, 3745-30- 07(c)(3)(f).
-
(a).(c)-(e).
Advanced Coal Technology By-product 64 Disposal Management and Design Manual
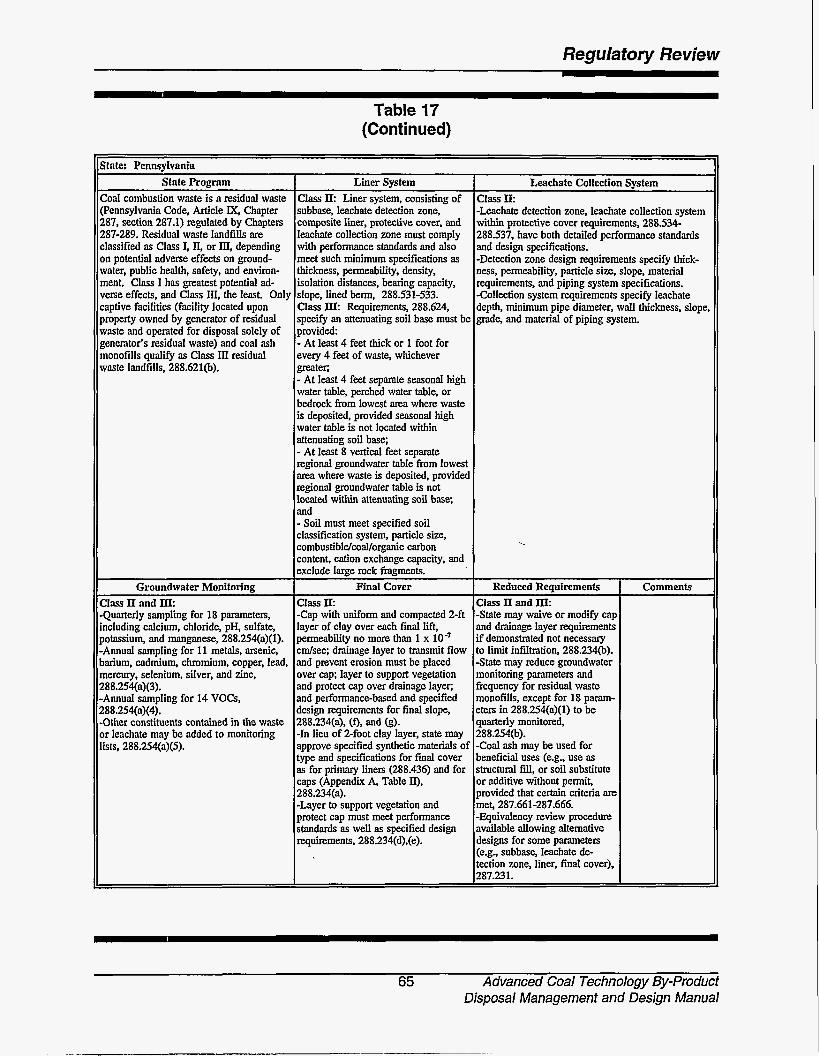
Regulatory Review
Slate Prognm Coal combustion waste is a residual waste (Pennsylvania Code, Article IX, Chapter 287, section 287.1) regulated by Chapters 287-289. Residual waste landfills are classified as Class I, 11, or In, depending on potential adverse effects on ground- water, public health, safety, and environ- ment. Class I has greatest potential ad- verse effects, and Class 111, the least. Only captive facilities (facility located upon property owned by gcnerator of residual waste and ooented for disoosal solely of
Table 17 (Con t i n ued)
Liner System I Leachate Collection System Class Ik Liner system, consisting of subbase, leachate detection zone, composite liner, protective cover. and leachate collection zone must comply with performance standards and also meet such minimum specifications as thickness, permeability, density, isolation distances, bearing capacity, slope, lined berm, 288.531-533. Class IIk Requirements, 288.624, specify an attenuating soil base must be provided:
generator's residual wastej and coal &h monofills qualify as Class III residual waste landfills, 288.621@).
Class Ik -Leachate detection zone, leachate collection system within protective cover requirements, 288.534- 288.537, have both detailed performance standards and design specifications. -Detection zone design requirements specify thick- ness, permeability, particle size. slope. material requirements, and piping system specifications. -Collection system requirements specify leachate depth, m i n i u m pipe diameter, wall thickness. slope, grade, and material of piping system.
At least 4 feet thick or 1 foot for every 4 feet of waste, whichever greater; - At least 4 feet separate seasonal high water table. perched water table, or bedrock from lowest area where waste is deposited, provided seasonal high water table is not located within attenuating soil base; - At least 8 vesical feet separate regional groundwater table from lowest area where waste is deposited, provided regional groundwater table is not located within attenuating soil base; and - Soil must meet specified soil classification system, particle size, combustibldcoaUorganic carbon content, cation exchange capacity, and exclude large rock fragments.
Eass II a n d m -Quarterly sampling for 18 parameters, including calcium, chloride, pH, sulfate, potassium, and manganese, 288.254(a)(l). -Annual sampling for 11 metals, arsenic, barium, cadmium, chromium, copper, lead, mercury. selenium, silver, and zinc, 288.254(@(3). -Annual sampling for 14 VOCs, 288.254(a)(4). -Other constituents contained in the waste or leachate may be added to monitoring lists, 288.254(a)(5).
Class II: -Cap with uniform and compacted 2-ft layer of clay over each final lift, permeability no more than 1 x lo-' cdsec; drainage layer to transmit flow and prevent erosion must be placed over cap; layer to support vegetation and protect cap over drainage layer, and performancebased and specified design requirements for final slope, 288.234(a), (f). and (s). -In lieu of 2-foot clay layer, state may approve specified synthetic materials of type and specifications for final cover as for primary liners (288.436) and for
I
Class 11 and IIL -State may waive or modify caI and drainage layer requirements if demonstrated not necessary to l i t infiltration. 288.234(b). -State may reduce groundwater monitoring parameters and frequency for residual waste monofills, except for 18 param- eters in 288.254(a)(l) to be quarterly monitored. 288.254(b). -Coal ash may be used for beneficial uses (e.g., use as structural fill, or soil substitute or additive without permit, provided that certain criteria are met, 287.661-287.666. -Equivalency review procedure available allowing alternative designs for some parameters (e.g., subbase, leachate de- tection zone, liner, final cover), 287.231.
Comments
65 Advanced Coal Technology By-product Disposal Management and Design Manual

Regulatory Review
for 14 indicato; panmeters and annually,-for 23 VOCs, 1200-1-7.04(7)(a)4.
-Same requirements as Class I Landfills, except not required to perform analysis for 23 VOC's unless specifically required by state 1200-1-7.04(7)(b)l. -State may require analysis for other water quality parameters and other parameters cha. racteristic of waste to be disposed, 1200-1- 7.04(7) @)4. -Develop and submit a groundwater quality assessment plan, 1200-1-7.04(7)(b)5.
Class I1 Landfills (1200-1-7.04(7)(b)
Table 17
Coal combustion waste is both a special waste and an industrial waste regulated by Tenn. Solid Waste Processing and Disposal regulations, Chapter 1200-1-7. Sections -.01 through -.08, and may be disposed of in either a Class I (Le., a sanitary landfill) or Class I1 (i.e., landfill receiving wastes, including industrial wastes, generated by one or more industridmanufacturing plants).
(Continued)
IlState: Tennessee
-Liner system performance standards for compatibility, strength, and thick- ness must be met in all cases, 1200- 1-7.04(4)(a)l. -Compacted earth h e r requirement specifies thickness and allows use of admixtures and special construction techniques with thickness restriction, 1200-1-7.04(4)(a)3.(i). -Geomembrane liners may be used only with compacted earth liner; re- quirements specify thickness, hydraulic conductivity, compatibility, and strength, 1200-1-7.04(4)(a)3.(ii). -Geologic buffer of specified thickness and placement (or equiva- lent in performance) must underly hers , 1200-1-7.04(4)(a)2.
State Prognun 1 Liner Svstem
Class I Landfills (1200-1-7.04(7)(a) -Quarterly baseline monitoring, for 1 year for 14 indicator parameters (including calcium, chloride, manganese, potassium, and pH) and 9 inorganics (including arsenic barium, cadmium, chromium, lead, mercury,
-Final cover design must minimize liquids migration, minimize main- tenance, promote drainage, etc., 1200-1-7-.04(4)(a)5. -Compacted final cover material (e.g., soil) requirements specify minimum
Groundwater Monitoring
falent to percolation volume &ugh iottom h e r meeting specified mini- num design standards, 1200-1- '.04(8)(c)3.
Leachate Collection System Leachate collectionlremoval system performance tandards address compatibility. strength, thickness, esign andlor operational standards to protect against quipment mishandling, leachate depth, and collectio Zervoir construction, capacity, and sampling, 1200- -7.04(4)(a)4., 6.. and 7.
Reduced Requirements Utemate liners may be used if yivalent in performance, and mufacturing QNQC is implemented, 200-1-7.04(4)(a)3.(). ?roundwater monitoring requirements lay be reduced or eliminated for a 'lass 11 facility if it is demonstrated kat, due to the nature of the waste or peration, facility will not generate armful leachate in significant quanti-
iny standard may be waived by the ate if the operator can demonstrate ,rat it is inapplicable, inappropriate, or nnecessary, or alternative standards or quirements ~IE equivalent, 1200-1-7- ,I(%. A coal ash fill area is deemed to have permit by rule (i.e., is not subject to ennit application procedures provided iat, among many other restrictions:
The coal ash is flyhottom ash rom fossil fuel combustion;
Disposal is limited to use of ash as ght weight aggregate, road base and ubbase materials;
Ash is in engineered structure or sed in activities before site evelopment (e.g., structural fill, soil tabilkation). or other Dept-approved S a ;
There is compliance with location nd design (e.g., geologic buffer, rainage) requirements to prevent water ontamination,1200-1-7-.02( l)(c)l.(ii).
=, 1200-1-7.04(7)(b).
Commenb
Advanced Coal Technology By-product 66 Disposal Management and Design Manual
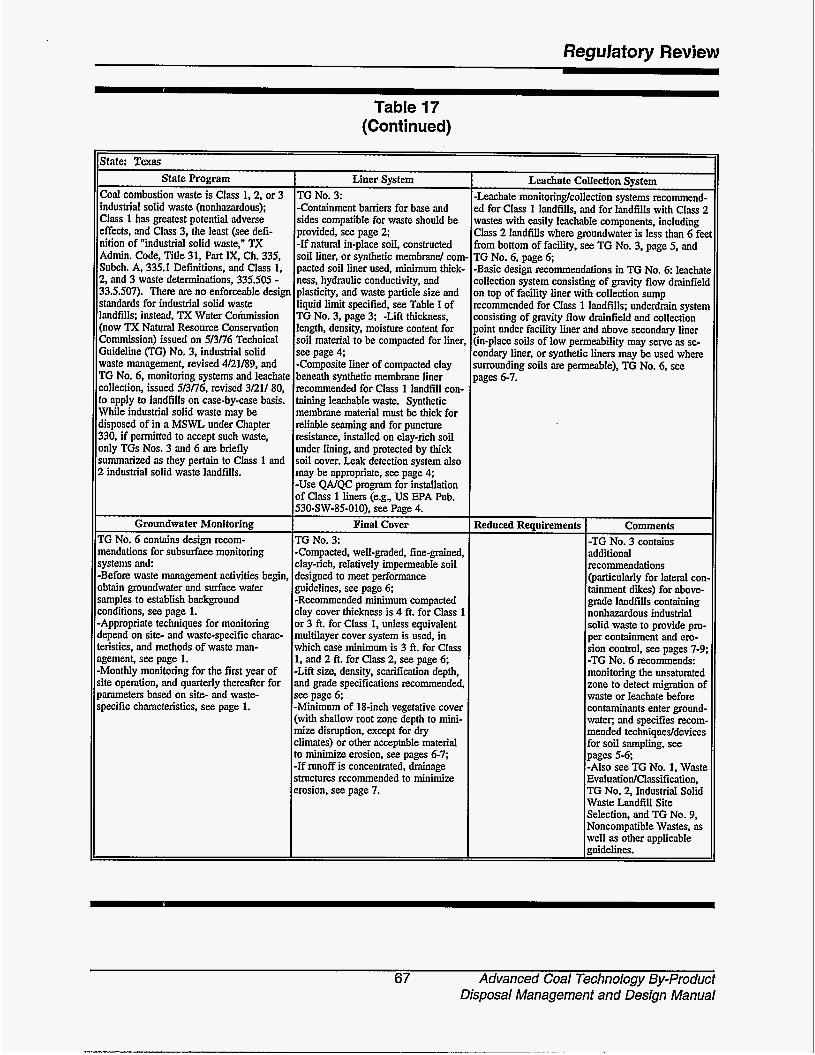
Regulatory Review
State Program loal combustion waste is Class 1.2, or 3 ndustrial solid waste (nonhazardous); :lass 1 has greatest potential adverse Iffects, and Class 3, the least (see defi- iition of "industrial solid waste," TX Ldmin. Code, Title 31, Part E, Ch. 335, lubch. A, 335.1 Definitions, and Class 1, !, and 3 waste determinations, 335.505 - 13.5.507). There are no enforceable design tandards for industrial solid waste mdfills; instead, TX Water CoMss ion now TX Natural Resource Conservation !ommission) issued on 5/3/76 Technical iuideline (TG) No. 3, industrial solid
Table 17 (Continued)
TG No. 3: -Containment barriers for base and sides compatible for waste should be provided, see page 2; -If natural in-place soil, constructed soil liner, or synthetic membrane/ com. pacted soil liner used, minimum thick- ness, hydraulic conductivity, and plasticity, and waste particle size and liquid limit specified, see Table I of TG No. 3, page 3; -Lift thickness, length, density, moisture content for soil material to be compacted for liner, see page 4;
itate: Texas
mte management, revised 4/21/89, and 'G No. 6, monitoring systems and leachate ollection, issued 5/3/76, revised 3/21/ 80, > apply to landfills on case-by-case basis. Vhile industrial solid waste may be isposed of in a MSWL under Chapter 30, if permitted to accept such waste, nly TGs Nos. 3 and 6 are briefly ummarized as they pertain to Class 1 and industrial solid waste landfills.
Groundwater Monitoring
Liner Svstem
-Composite liner of compacted clay beneath synthetic membrane liner recommended for Class 1 landfill con- taining leachable waste. Synthetic membrane material must be thick for reliable seaming and for puncture resistance, installed on clay-rich soil under lining, and protected by thick soil cover. Leak detection system also may be appropriate, see page 4; -Use QNQC program for installation of Class 1 liners (e.g., US EPA Pub. 530-SW-85-010), see Page 4.
Final Cover Reduced Requirements comments -TG No. 3 contains additional recommendations @articularly for lateral con- tainment dikes) for above- grade landfills containing nonhazardous industrial solid waste to provide pro- per containment and ero- sion control, see pages 7-9; -TG No. 6 recommends: monitoring the unsaturated zone to detect migration of waste or leachate before contaminants enter ground- water; and specifies recom- mended techniqueddevices for soil sampling, see pages 5-6; -Also see TG No. 1. Waste EvaluatiodClassification, TG No. 2, Industrial Solid Waste Landfill Site Selection, and TG No. 9. Noncompatible Wastes, as well as other applicable guidelines.
see page 6; -Minimum of 18-inch vegetative cover (with shallow root zone depth to mini- mize disruption, except for dry climates) or other acceptable material to minimize erosion, see pages 6-7; -If xunoff is concentrated, drainage structures recommended to miniize erosion, see page 7.
'G No. 6 contains design recom- iendations for subsurface monitoring ystems and: 3efore waste management activities begin, btain groundwater and surface water unples to establish background mditions, see page 1. Sppropriate techniques for monitoring epend on site- and waste-specific charac- Iristics, and methods of waste man- zement, see page 1.
I
TG No. 3: -Compacted, well-graded, fine-grained, clay-rich, relatively impermeable soil designed to meet performance guidelines, see page 6; -Recommended minimum compacted clay cover thickness is 4 ft. for Class 1 or 3 ft. for Class 1, unless equivalent multilayer cover system is used, in which case miniium is 3 ft. for Class 1, and 2 ft. for Class 2, see page 6;
Leachate Collection System -Leachate monitoringlcollection systems recommend- ed for Class 1 landfills, and for landfills with Class 2 wastes with easily leachable components, including Class 2 landfills where groundwater is less than 6 fee from bottom of facility, see TG No. 3, page 5, and TG No. 6, page 6; -Basic design recommendations in TG No. 6 leachatc collection system consisting of gravity flow drainfeld on top of facility liner with collection sump recommended for Class 1 landfills; underdrain system consisting of gravity flow drainfield and collection point under facility liner and above secondary liner (in-place soils of low permeability may serve as se- condary liner, or synthetic liners may be used where surrounding soils are permeable), TG No. 6, see pages 6-7.
67 Advanced Coal Technology By-product Disposal Management and Design Manual

Regulatory Review
Coal combustion by-products are regulated under WV Code of State Regulations, Title 47, Legislative Rules, Series 38, Solid Waste Management Regulations, 47-38-1 through 47-38-6. Facilities that dis- pose of coal combustion wastes are designated as Class F solid waste facilities and regulated under 47- 38-55. While only landfill requirements are summarized here, coal combustion by-products are nlso allowed to go to solid waste disposal surface impoundments (see 5.5.2.a.E. - 5.5.2.a.H.).
Groundwater Monitoring
Table 17 (Continued)
Liner system must consist of clay having specified thickness, permeabidity, and standard Proctor density, and a 60 mil synthetic liner must be installed on top of the compacted clay liner, 5.5.2.a.A.
Final Cover
State: West Yirginia State Program I Liner System
Baseline and quarterly sampling for a combination of 29 parameters including: pH, calcium, manganese, chloride, sulfate, arsenic, copper, nickel, selenium, zinc, barium, mercury, total and hexavalent chro- mium, lead, molybdenum, cadmi- um, and vanadium (parameters to be monitored should be submitted as p u t of permit application and depends on waste types which are reasonably expected to be present), 4.11.1.d. and 4.11.2.b.
Final cover of specified grade must consist oE -One-foot layer of a material with high hy- draulic conductivity placed on refuse mass to facilitate gas control; -Clay cap of specified thickness and per- meability placed over each final lift in 6-inch lifts; a cap of synthetic material may be approved; -Drainage layer of spe- cified thickness and permeability to transmit flow and prevent erosion placed over cap; -Compact soil layer of specified thickness to support vegetation placed over drainage layer, 8
the State, 5.5.2.c.A. - Alternate liner system design may be used if meets minimum specifications: clay thickness, permeabidity, and density; an appropriate groundwater interceptor drainage system, also serving as a leachate detection system, must be
Leachate Collecfion System
combustion byproducts do not require a permit: use in manufacturing another product 'or used as a substitute for a product or natural resource; use for the extraction or recovery of materials contained within the
- Leachate collection system must be a perforated pipe system on top of the synthetic liner and meet design specifications for the drainage layer thickness and permeability. The drainage layer, which can consist of bottom ash, shall be the protective cover for the synthetic liner. 5.5.2.a.A.
- Semiannual sampling of leachate for 19 parameters, including arsenic, barium, cadmium, calcium, chloride, total and hexavalent chromium, lead, manganese, sulfate, zinc, and any other parameters specified by State, 5.5.2.c.A.
installed under clay h e r ; an appropriate leachate collection system, which can be
I Comments I - Certain beneficial uses of coal
coal combustion byproduct; used as a stabilizationlsolidification
bottom ash, of specified permeability, must be installed on top of compacted clay liner, but may not be used in major domestic use aquifer areas. major alluvial aquifers, or karst regions, 5.52.a.B. - Other liner systems may be approved on case-by-case basis, based on waste
asphalt or cdncretesurfaces; use as anti-skid material (for bottom ash or boiler slag only), 5.5.2.d. (Note: Use of coal combustion byproducts as structural fill and soil amendment will be con- sidered in future rulemakings.)
agent for other wastes; use iunder the authority of the WV Department of Energy; use as pipe bedding or as a composite liner drainage layer, use as daily or intermediate cover for a Class A. B or C solid waste facility;
g.5.1. I
and groundwater protection, 5.5.2.a.C. -State may waivdmodify final cover requirements based upon waste type, facility, site characteristics, and engineer- ing judgment, 6.1.l.a. - Waivedmodifications may be requested for requirements in 5.5.1.a (from 5 3, Solid Waste Facility and Permitting Requirements) and 5.5.1.b (from certain $ 4 , Landfill Standards, e.g., gas monitoring) based on site- soecific conditions and information,
Advanced Coal Technology By-product 68 Disposal Management and Design Manual
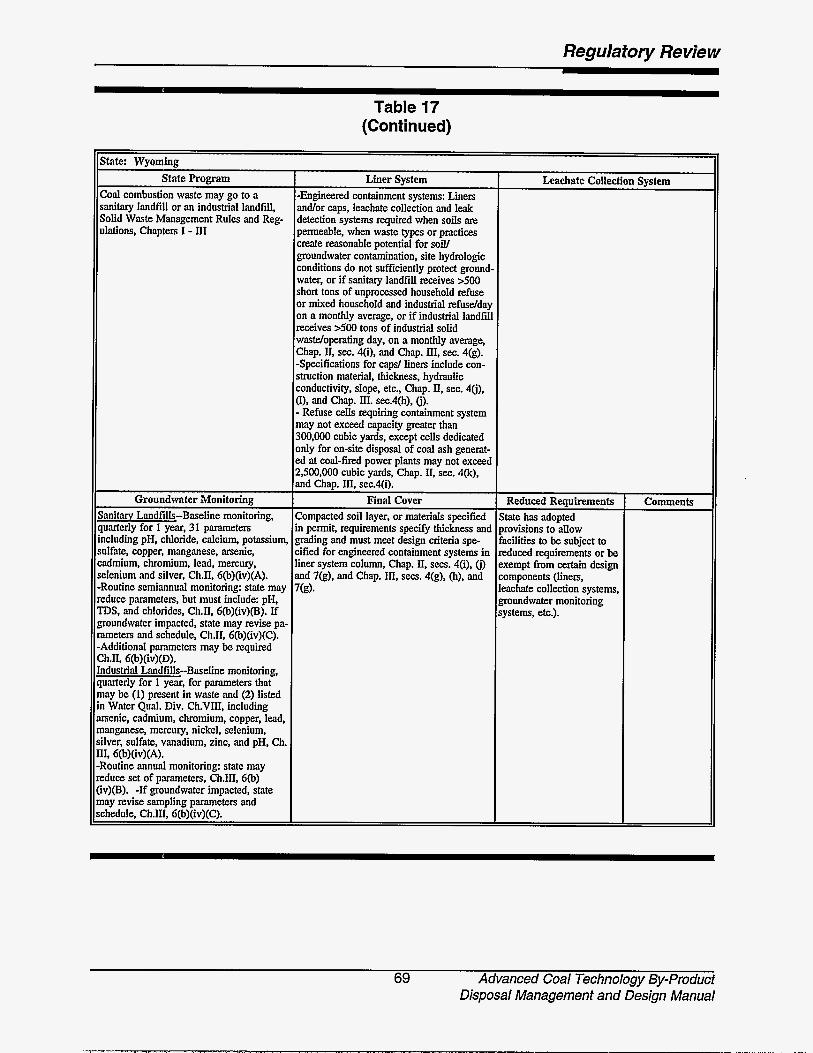
Regulatory Review
- . . . State Program
Coal combustion waste may go to a sanitary landfill or an industrial landfill, Solid Waste Management Rules and Reg- ulations, Chapters I - III
Table 17
V i e r System -Engineered containment systems: Liners andlor caps, leachate collection and leak detection systems required when soils are permeable, when waste types or practices create reasonable potential for soil/ groundwater contamination, site hydrologic conditions do not sufficiently protect ground- water, or if sanitary landfill receives >500 short tons of unprocessed household refuse or mixed household and industrial refuselday on a monthly average, or if industrial landfill receives >500 tons of industrial solid wasteloperating day, on a monthly average, Chap. II, sec. qi), and Chap. HI, sec. 4(g). -Specifications for caps/ liners include con- struction material, thickness, hydraulic conductivity, slope, etc., Chap. II, sec. 4(j), 0). and Chap. III. sec.qh), (j). - Refuse cells requiring containment system may not exceed capacity greater than 300,000 cubic yards, except cells dedicated only for on-site disposal of coal ash generat- ed at coal-fired power plants may not exceed 2,500,000 cubic yards, Chap. 11, sec. 4&).
(Continued)
Itstate: Wvomine
Sanitary Landfills-Baseline monitoring, quarterly for 1 year, 31 parameters including pH, chloride, calcium, potassium, sulfate, copper, manganese, arsenic, cadmium, chromium, lead, mercury, selenium and silver, Ch.II, 6(b)(iv)(A). -Routine semiannual monitoring: state may reduce Parameters, but must include: pH, TDS. and chlorides, Ch.II, 6(b)(iv)(B). If groundwater impacted, state may revise pa- rameters and schedule, Ch.11, 6(b)(iv)(C). -Additional parameters may be required Ch.11, 6(b)(iv)@). Industrial Landfills-Baseline monitoring, quarterly for 1 year, for parameters that may be (1) present in waste and (2) listed in Water Qual. Div. Ch.VIII, including arsenic, cadmium, chromium, copper, lead, manganese, mercury, nickel, selenium, silver, sulfate, vanadium, zinc, and pH. Ch. 111, 6(b)(iv)(A). -Routine annual monitoring: state may reduce set of parameters, Ch.III, 6(b) (iv)(B). -If groundwater impacted, state may revise sampling parameters and schedule, Ch.III, 6(b)(iv)(C).
1 . . I
Compacted soil layer, or materials specified State has adopted in permit, requirements specify thickness and provisions to allow grading and must meet design criteria spe- facilities to be subject to cified for engineered containment systems in reduced requirements or be h e r system column, Chap. II, secs. 4(i), (j) exempt from certain design and 7(g), and Chap. III, secs. 4(g), (h). and components (liners. 7(g). leachate collection systems,
groundwater monitoring systems, etc.).
land Cham III. seC.4fi).
Leachate Collection System
Comments
69 Advanced Coal Technology By-product Disposal Management and Design Manual

Regulatory Review
Criteria Siting
Design
Table 18 Summary of Georgia's Solid Waste Criteria
Restrictions/Requireinents The site must conform to all local zoning/land use ordinances and must not be located in the 100-year floodplain unless the flow of the 100-year flood and storage capacity of the flood- plain is not restricted, and a washout of solid waste must not occur. A facility must not locate in a wetland unless permitted to do so. New landfill units and lateral expansions of existing landfills: must not locate within 200 feet of a fault that has had displacement in Holocene time unless demonstrated that an alter- native setback distance is protective; must not locate in seismic impact zones, unless demon- strated that the design of all containment structures can resist the maximum horizontal accel- eration in lithified earth material. All landfills located in unstable areas must demonstrate that the integrity of the structural components of each unit will not be disrupted. All solid waste handling facilities must perform a hydrological assessment evaluating speci- fied factors and must have an assessment report prepared addressing all applicable siting criteria. New disposal facilities or lateral expansions of existing facilities that accept waste from more than one source, or new monofills (or lateral expansions) that are required to meet MSWLF standards may not be located within 10,000 feet of any airport runway end used by turbojet aircraft or within 5,000 feet or any airport runway end used by only piston-type air- craft. If existing units are located within the above distances to airports, a demonstration must be made that the units do not pose a bird hazard to aircraft. Existing units that are not permitted as monofills or are permitted to accept waste from more than one industry must close by October 9, 1996, and conduct post-closure care activities if they cannot comply with the airport, floodplain, or unstable area restrictions listed above. Industrial waste landfills permitted to receive only a singe type of industrial waste (monofill) or permitted to receive only a single industry's waste must comply with siting criteria con- tained in "Criteria for Performing Site Acceptability Studies for Solid Waste Landfills in Georgia," Circular 14, Appendix A. This appendix basically requires classification of waste streams into one of three classification--low potential, moderate potential, and high potential- -that are generally determined based on the potential for groundwater contamination and the presence of putrescible waste. Landfills must provide at least a 200-foot buffer between the waste disposal boundary and the property line, and at least a 500-foot buffer between the waste disposal boundary and any occupied dwelling and its domestic water supply well, if any. Site survey control must be provided to ensure that landfill operations occur only on per- mitted lands. Appropriate sediment and erosion control measures or devices must direct surface runoff from disturbed areas, with sediment basins designed to handle both the hydraulic loading for the 25-year, 24-hour storm and the sediment loading from the drainage basin for the life of the site; also, runoff must flow through permanent sediment control impoundments that regulate discharges. Final grading not less than 3% nor greater than 33% must ensure stability, control erosion and runoff, allow vegetation of cover material, minimize percolation of precipitation, and meet closure requirements.
Advanced Coal Technology By-product 70 Disposal Management and Design Manual

Regula fory Review
Criteria Design (Continued)
Operations
Closure & Post-Closure Care
Table 18 (Continued)
Res trictions/Requirements Except for industrial waste landfills permitted as a monofill or receiving only a single indus- try’s waste that are granted a variance from the following requirements, landfills must com- ply with the following:
0 A liner and leachate collection system must be installed and constructed to ensure that specified MCLs will not be exceeded in the uppermost aquifer at the relevant point of compliance, as defined in the regulations. If the landfill is located in an area of higher pollution susceptibility or in a significant groundwater recharge area, more stringent design requirements apply (composite liner and leachate collection specifications).
At least once each operating day, disposed solid waste must be covered with six inches of earthen material or alternative approved materials.
0 To ensure that methane gas generated by the landfill does not exceed specified limits, a routine methane monitoring program must be established in accordance with the regulations,
specifications and a three-tiered sampling and analysis program (detection monitor- ing, assessment monitoring, and corrective action) must be implemented.
0 A groundwater monitoring system must be installed in accordance with detailed
0 A surface water monitoring plan to determine the impact of the facility on all adja-
Unauthorized access around the site must be prevented and access to vehicles must cent surface waters must be included.
be provided and maintained. 0
0 Disturbed areas exposed for more than three months must be vegetated within two weeks of final cover placement.
0 A detailed sequence of filling the site must be provided to minimize drainage and ,
’ access problems.
0 At least one day’s quantity of cover material must be maintained within 200 ft. of the working face for fire protection.
0 The design must provide for closure and post-closure care in accordance with appli- cable regulations.
0 A uniform compacted layer of clean earth cover at least one foot in depth must be placed over each portion of any intermediate lift following completion of that lift.
The closure and post-closure care requirements of 40 CFR 258 (described above under Chapter 4.2.2 for the federal regulatory program) apply to landfills.
71 Advanced Coal Technology By-product Disposal Management and Design Manual
Regulatory Review
4.3.2 Pennsylvania
Comprehensive revisions to Pennsylvania residual waste landfill manage- ment regulations were published on July 4, 19926. If they do not meet the criteria of hazardous waste, coal combustion wastes are classified in Pennsylvania as "residual waste"; standards exist specific to "residual waste landfills," and a permit must be obtained before operating such a facility. mote that coal ash may be used for beneficial uses (e.g., as structural fill, or as a soil substitute or additive) without a permit, if certain criteria specified by the state are met. (See $9 287.661 - 287.666.)] Three types of residual waste landfills are identified: Class I, involv- ing the disposal of residual waste with the greatest potentially adverse effects on ground- water and having the greatest potential impact on public health, safety, and the environment; Class II, representing intermediate degrees of such potentially adverse effects and impacts; and Class III, representing the least potentially adverse effects and impacts. Detailed operat- ing requirements7 apply to all classes of land- fills and address daily operations (e.g., access control, air quality protection, nuisance control, unloading), cover and revegetation, water quality protection and monitoring, gas control and monitoring, and closure/post-closure. In addition to application requirements that pertain to all landfills (e.g., requirement to conduct an extensive site analysis), there are additional requirements for each class of landfill*. Generally, a landfill's classification depends on the characterization of the waste to be disposed of and the characteristics of the landfill site. For the purpose of summarizing the state requirements, it is assumed that coal combustion waste would be disposed of at a Class II or III landfill. [If more than one type of waste contaminant is identified in the chemical and leaching analyses, the waste must be disposed of at the most protective class of facility required.] The criteria for these disposal facilities are listed in Tables 19 and 20, respectively '.
4.3.3 Illinois
Illinois Solid and Special Waste Management regulations lo were amended in 1990. Unless classified as hazardous waste, coal combustion wastes are both special wastes and chemical wastes according to the regula- . tions. Special waste means any hazardous waste, industrial process waste, or pollution control waste that has not been declassified. A chemical waste is a non-putrescible solid whose characteristics are such that any contaminated leachate is expected to be formed by chemical or physical processes, rather than by biological processes, and no gas is expected to be formed as a result.
Section 21(d) of the Illinois Environmental Protection Act exempts from permit requirements persons conducting on-site disposal operations for wastes generated by that person's own activities; however, $ 815.101(a) of the regulations requires an on- site disposal operation to file an initial facility report that includes information about the loca- tion and the disposal practices at the facility. The information is the same as that required of other facilities applying for a permit. Consequently, an on-site disposal facility would not be required to obtain a permit for its operations, but it still must comply with the standards specified for special wastes and chemical wastes in Illinois.
Standards specific to special wastes disposed of in landfills, found in Subpart D, $3 811.401-811.406, address manifesting, waste profile identification records, and record- keeping requirements ll. General provisions for all new landfills apply to location, surface water drainage (runoff from disturbed areas, and the diversion of runoff from undisturbed areas), survey and boundary controls, compaction, daily cover, operations, open burning, controls on dust, noise, and disease and nuisance vectors, litter and fire measures, salvaging, closure, and post-closure. Briefly, facilities must meet requirements under the federal Wild and Scenic Rivers Act, must not
Advanced Coal Technology By-product 72 Disposal Management and Design Manual
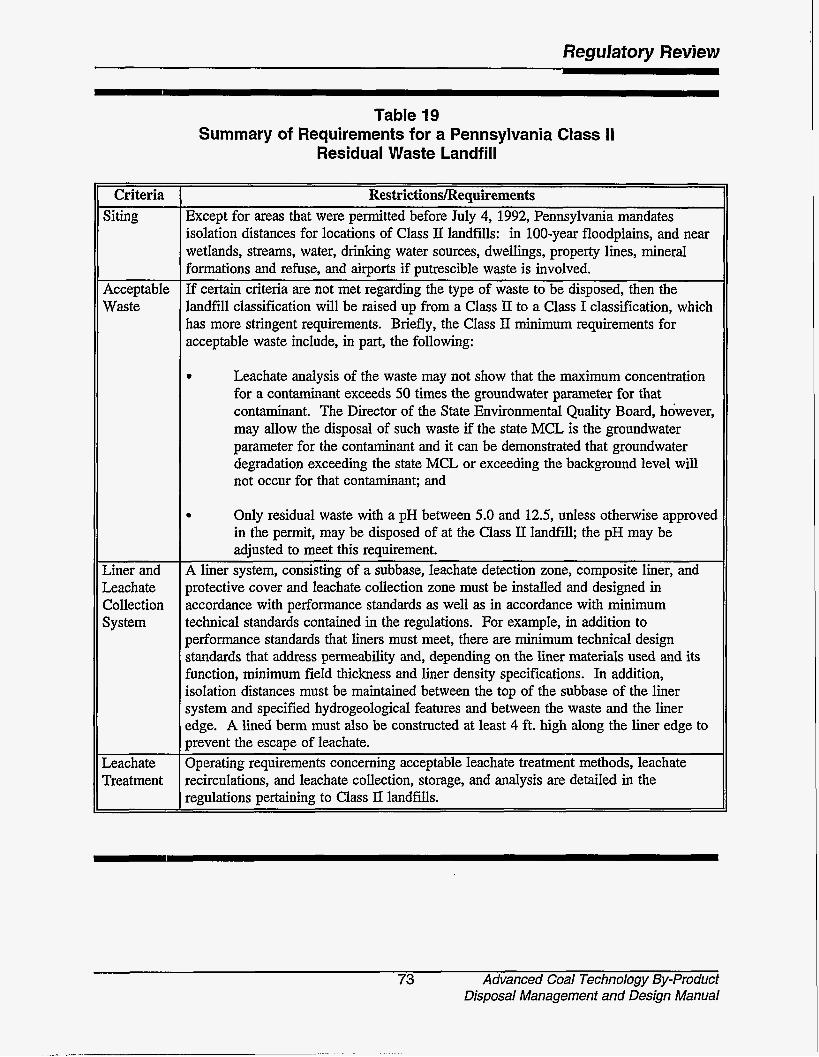
Regulatory Review
Criteria Siting
Acceptable Waste
Liner and Leachate C'ollection System
Leachate rreatment
~
Table 19 Summary of Requirements for a Pennsylvania Class II
Residual Waste Landfill
Restr ictiondRequirements Except for areas that were permitted before July 4, 1992, Pennsylvania mandates isolation distances for locations of Class 11 landfills: in 100-year floodplains, and near wetlands, streams, water, drinking water sources, dwellings, property lines, mineral formations and refuse, and airports if putrescible waste is involved. If certain criteria are not met regarding the type of waste to be disposed, then the landfill classification will be raised up from a Class II to a Class I classification, which has more stringent requirements. Briefly, the Class 11 minimum requirements for acceptable waste include, in part, the following:
0 Leachate analysis of the waste may not show that the maximum concentration for a contaminant exceeds 50 times the groundwater parameter for that contaminant. The Director of the State Environmental Quality Board, however, may allow the disposal of such waste if the state MCL is the groundwater parameter for the contaminant and it can be demonstrated that groundwater degradation exceeding the state MCL or exceeding the background level will not occur for that contaminant; and
0 Only residual waste with a pH between 5.0 and 12.5, unless otherwise approved in the permit, may be disposed of at the Class 11 landfill; the pH may be adjusted to meet this requirement.
A liner system, consisting of a subbase, leachate detection zone, composite liner, and protective cover and leachate collection zone must be installed and designed in accordance with performance standards as well as in accordance with minimum technical standards contained in the regulations. For example, in addition to performance standards that liners must meet, there are minimum technical design standards that address permeability and, depending on the liner materials used and its function, minimum field thickness and liner density specifications. In addition, isolation distances must be maintained between the top of the subbase of the liner system and specified hydrogeological features and between the waste and the liner edge. A lined berm must also be constructed at least 4 ft. high along the liner edge to prevent the escape of leachate. Operating requirements concerning acceptable leachate treatment methods, leachate recirculations, and leachate collection, storage, and analysis are detailed in the remlations pertaining to Class 11 landfills.
73 Advanced Coal Technology By-product Disposal Management and Design Manual

Regulatory Re view
Criteria Siting Acceptable Waste
Attenuating Soil Base
Table 20 Summary of Requirements for a Pennsylvania Class 111
Residual Waste Landfill
Restrictionsmequirements Siting criteria for Class III landfills are identical to those for Class II landfills. [f certain criteria are not met regarding the type of waste to be disposed, then the Landfill classification will be raised up from a Class III to a Class II classification, which has more stringent requirements. Some of the minimum requirements for acceptable wastes include:
0 Leachate analysis of the waste may not show that the maximum concentration for metals and other cations exceeds 25 times the groundwater parameter for a contaminant, or for any other contaminant, exceeds the groundwater parameter for that contaminant.
0 Disposal of a waste at the Class 111 landfill is prohibited if 1) the Department of Natural Resources requires its disposal at a Class II facility because monitoring data indicate migration of the waste or its contaminants or analyses cannot predict the leachability of the waste; or 2) groundwater degradation at one or more monitoring points exceeds the degradation at those same points that would occur if the facility were a Class II landfill.
0 The waste must have a pH between 5.5 and 9.5, unless otherwise approved in the permit; the pH may be adjusted to meet this requirement.
0 The waste may not have a petroleum-based oil and grease content that exceeds 1% by dry weight.
0 The waste and its leachate must be attenuated by the soil under the disposal area and must not react with other waste to adversely affect the ability of the attenuating soil to prevent degradation of the groundwater.
Minimum technical standards for the physical attributes of the attenuating soil base and its placement at the disposal areas are specified to protect groundwater. The requirements address such parameters as soil texture, soil composition and size, and cation exchange capacity.
Advanced Coal Technology By-product 74 Disposal Management and Design Manual
Regulafory Review
restrict the flow of storm waters in a 100-year floodplain, and are subject to restrictions on locating near areas of historic and archaeo- logical significance, and areas that are nature preserves or where endangered species exist. Other significant general provisions require a uniform daily cover of at least 6 inches to be placed on all exposed waste, as well as compliance with performance standards con- cerning the size and slope of the working face and post-closure maintenance standards.
More detailed standards for chemical waste landfills are found in Subpart C, $0 811.301 - 811.323. Siting restrictions establish isolation distances from aquifers, roads, occupied dwellings, schools, hospitals, and aircraft runways. To ensure the structural integrity of disposal units, standards prescribe performance criteria for foundation and mass stability analyses, and foundation construction. All units must be equipped with leachate drainage, collection, and management systems and a compacted earth liner, for which there are regulatory performance and technical standards. Liner configurations other tpan those specified, special construction techniques, and admixtures may be used as long as the alternative has been successfully used or demonstrated and provides performance at least equivalent to the regulatory requirements. Landfill gas monitoring systems are required if putrescible wastes are disposed of in the unit, and landfill gas management systems are required if methane gas is detected or leachate is recycled. A one-foot intermediate cover is required on waste and the final cover system must consist of a low-permeability layer over- lain by a final protective layer constructed in accordance with the regulations (e.g., for the low-permeability layer, a minimum three-foot thickness and permeability of 1 x loa cdsec).
A three-phase hydrogeologic site investigation is required to perform a ground- water impact assessment and establish a groundwater monitoring system. Standards for
the design, construction, and operation of groundwater monitoring systems, as well as for three-tiered (detection and assessment monitoring and remedial action) groundwater monitoring programs are also prescribed in detail. Finally, owners of chemical waste land- fills must comply with standards addressing waste placement, final slope and stabilization design and construction, and a waste load checking program.
4.4 Local Regulations
Local regulations are imposed primarily through zoning ordinances that restrict siting and that may require a license to construct and operate. Although these factors are relatively minor with respect to design con- siderations, they should not be viewed lightly. Local opposition to siting is often exercised through zoning ordinances and has become a major impediment to new disposal facilities.
4.5 Regulatory Summary
Unless wastes generated by advanced coal technologies are RCRA Subtitle C hazardous wastes (because they exhibit pH equal to or in excess of 12.5 or because they leach concentrations of certain constituents in excess of toxicity Characteristic regulatory levels), they will probably be classified and disposed of as nonhazardous solid wastes. Although federal solid waste regulations affect coal combustion waste management and disposal, states are the primary regulators of Subtitle D nonhazardous industrial waste.
As illustrated above, the states do vary in their requirements; however, the trend is clearly toward stricter standards. Such standards may include compliance with either landfdl performance standards or the installation of liner and leachate collection systems. Operating requirements, groundwater monitoring programs that include corrective action requirements, and closure and post- closure standards may also be specified.
75 Advanced Coal Technology By-Product Disposal Management and Design Manual

Regulatory Re view
In many states, Fegulatory provisions allow either the use of alternative specifications or variances for such requirements as liners, .cover systems, etc., as long as a demonstration can be made that the variance or alternative is protective of human health and the environ- ment. The burden of proof is on the disposal facility.
Where state permits or approvals are required for landfiil construction and operation, contact with regulatory agencies should be initiated as soon as possible if permit variances are sought. This will allow adequate time for negotiation and development of technical data to support an alternative landfill design incorporating a reduced level of engineered controls.
4.6 Citations
1.
2.
United States Environmental Protection Agency, Report to Congress, Wastes from the Combustion of Coal by Electric Utility Power Plants, EPN530- SW-88-002, February 1988.
56 Federal Register 50978 (October 9, 1991).
3.
4.
5.
6.
7.
8.
9.
10.
11.
58 Federal Register 51536 (October 1, 1993).
Sierra Club v. U.S. EPA, 992 F.2d 337 (D.C. Cir. 1993).
Rules and Regulations of the State of Georgia, Title 391, Article 3, Chapter 4, Solid Waste Management Rules.
Pennsylvania Code, Chapters 287-289.
Pennsylvania Code, Chapter 288, Subchapter C, $0 288.201 - 288.292.
Pennsylvania Code, Chapter 288, Subchapters D - F, $0 288.401 - 288.625.
Pennsylvania Code, Chapter 288, Subchapters E-F, $0 288.501-288.557 and $5 288.601-288.625.
Illinois Administrative Code, Title 35, Subtitle G, Chapter 1, Parts 807 - 815.
Illinois Administrative Code, Subpart D: Management of Special Wastes At Landfills, $0 811.401 - 811.406.
Advanced Coal Technology By-product 76 Disposal Management and Design Manual
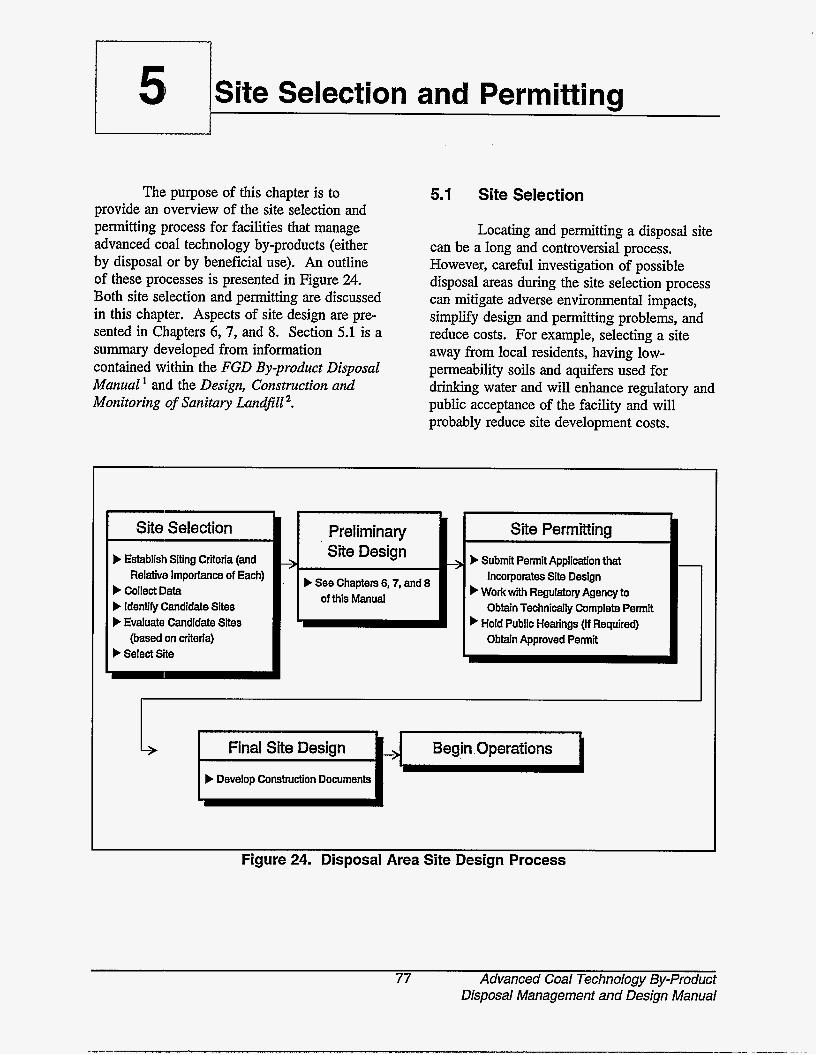
5 Site Selection and Permitting
The purpose of this chapter is to provide an overview of the site selection and permitting process for facilities that manage advanced coal technology by-products (either by disposal or by beneficial use). An outline of these processes is presented in Figure 24. Both site selection and permitting are discussed in this chapter. Aspects of site design are pre- sented in Chapters 6, 7, and 8. Section 5.1 is a summary developed from information contained within the FGD By-product Disposal Manual and the Design, Construction and Monitoring of Sanitary Landfill '.
5.1 Site Selection
Locating and permitting a disposal site can be a long and controversial process. However, careful investigation of possible disposal areas during the site selection process can mitigate adverse environmental impacts, simplify design and permitting problems, and reduce costs. For example, selecting a site away from local residents, having low- permeability soils and aquifers used for drinking water and will enhance regulatory and public acceptance of the facility and will probably reduce site development costs.
Site Selection
b Establish Siting Criteria (and
b Collect Data b Identify Candidate Sites b Evaluate Candidate Sies
(based on criteria) b Select Site
RdativQ Importance of Each)
Preliminary Site Design
b See Chapters 6,7, and 8 of this Manual
Site Permitting
b Submit Permit Applicahon that Incorporates Site Design
b Work with Regulatory Agency to Obtain Technically Complete Pennit
b Hold Public Hearings (If Required) Obtain Approved Permit
1 Final Site Design Begin Operations b Develop Construction Documents
rn
Figure 24. Disposal Area Site Design Process
77 Advanced Coal Technology By-product Disposal Management and Design Manual
Site Selection and Permitting
Siting a new disposal facility generally is required in the following cases:
t A new station (at a previously undeveloped site) that is to be equipped with boilers that use advanced coal technology (ACT);
t An existing station being equipped with a new unit;
t An existing station being retrofit with a new ACT boiler; and
t An existing station equipped with ACT boilers that has exhausted its existing disposal area.
For new stations, disposal area siting should be an integral part of the overall power plant siting process. Many new stations are in fact "mine-mouth" facilities where the generating station is co-located with, or within a few miles of, the coal source. Therefore, returning the by-products to backfill the cavities created by coal removal should be considered. Whether or not the new station is a "mine mouth" facility, combining power plant and disposal area siting eliminates the need for a separate siting study and reduces the distances wastes will be transported. However, because of the amount of land required, on-site disposal is not always possible; although it definitely should be considered, particularly for new generating stations.
For existing stations, siting a new disposal area should begin years before the area is needed. Four to six years may be necessary to identify, investigate, procure, design, permit, and develop a new disposal area. Therefore, once a need for additional disposal capacity is identified, siting the facility should begin.
The process of selecting a disposal site should be carried out at a level of detail appro- priate for the situation. A rigorous search is preferable but not always necessary if the
utility has a good knowledge of local condi- tions and potential sites. The familiarity of utility personnel with the area will be an important asset when beginning the siting process at an existing plant. Their experience at the plant has probably acquainted them with potential disposal sites near the vicinity of the plant.
The magnitude of the task of selecting a site is given perspective by envisioning the quantities of by-product material to be generated during the operating life of the power plant. This concept helps to underscore the importance of minimizing the distance between the disposal site and the power plant.
Properly carrying out the site selection process may require a multi-disciplinary team competent in the fields of engineering and environmental science, socioeconomics, political science, and land-use planning. The initial steps of the site selection process (siting criteria and data collection) are discussed in the following two sections. Once siting criteria have been established and data have been collected, candidate sites can be selected and evaluated. Then the final site can be selected.
5.1. I Siting Criteria
Siting criteria (or factors) can be divided into four broad categories: engineer- ing, environmental, economic, and political and regulatory. The major criteria within each of these categories are shown in Figure 25 and discussed in the following sections. Note that these criteria are generalized; applicable state regulations should be consulted for more specific criteria.
Engineering Criteria
b Physical size-Sufficient acreage must be provided to accommodate the by- product material and related facilities for the design period (usually the life of the plant). Where possible, the active disposal area should be
Advanced Coal Technology By-product 78 Disposal Management and Design Manual
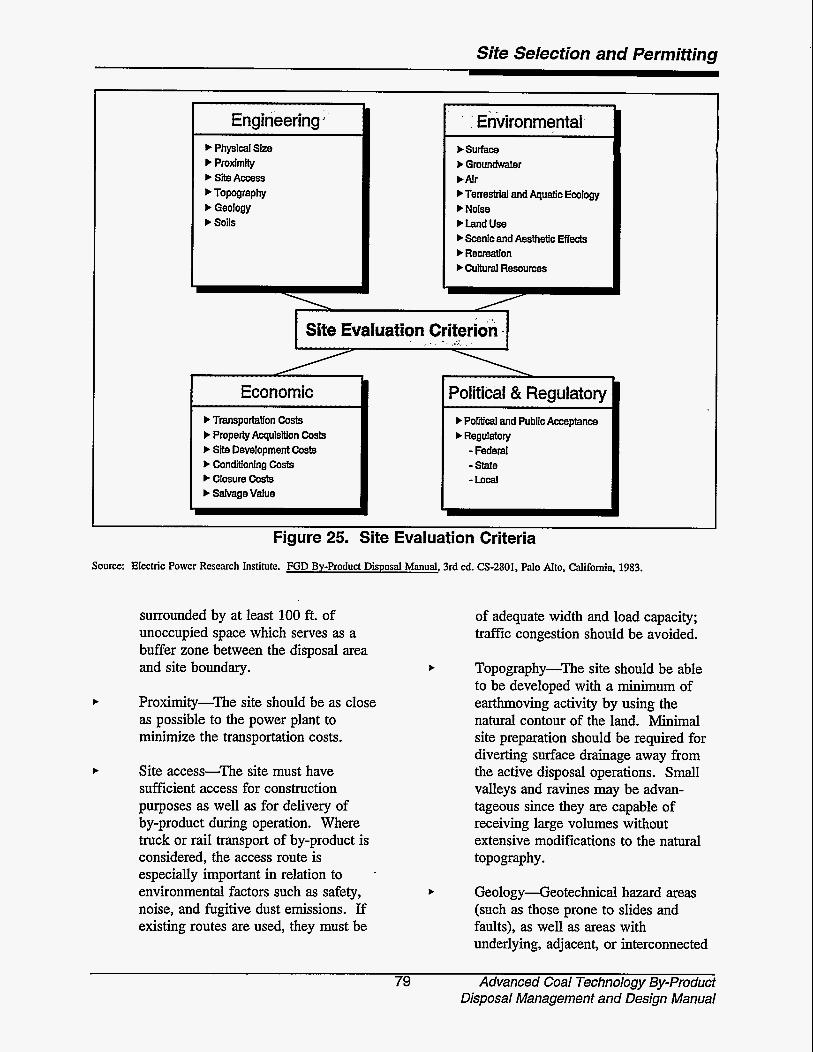
Site Selection and Permitting
Engineering * b Physical Sie b Proximity b Site Access b Topography b Geology b Soils
Environmental b surface b Groundwater b Air bTenestn'al and Aquatic Ecology b Noise b land Use b Scenic and Aesthetic Effects b Recreab'on b Cultural Resources
Site Evaluation Criterion - _ I .,
Economic b Transportation Costs b Property Acquisition Costs b Site Development Costs b Conditloning Costs b Closure Costs b Sahrage Value
Figure 25. Site Evaluation Criteria Source: Electric Power Research Institute. FGD By-product Disposal Manual, 3rd ed. CS-2801, Palo Alto. California, 1983.
b
b
surrounded by at least 100 ft. of unoccupied space which serves as a buffer zone between the disposal area and site boundary.
Proximity-The site should be as close as possible to the power plant to minimize the transportation costs.
Site access-The site must have sufficient access for construction purposes as well as for delivery of by-product during operation. Where truck or rail transport of by-product is considered, the access route is especially important in relation to environmental factors such as safety, noise, and fugitive dust emissions. If existing routes are used, they must be
b
Political & Regulatory b Political and Public Acceptance b Regulatory
- Federal -State -Local
of adequate width and load capacity; traffic congestion should be avoided.
Topography-The site should be able to be developed with a minimum of earthmoving activity by using the natural contour of the land. Minimal site preparation should be required for diverting surface drainage away from the active disposal operations. Small valleys and ravines may be advan- tageous since they are capable of receiving large volumes without extensive modifications to the natural topography.
Geology-Geotechnical hazard areas (such as those prone to slides and faults), as well as areas with underlying, adjacent, or interconnected
79 Advanced Coal Technology By-product Disposal Management and Design Manual
Site Selection and Permitting
mines, quarries, sinkholes or solution cavities should be avoided. The strength of the underlying strata should be capable of supporting any of the necessary surface structures.
t Soils-There should be an adequate depth of soil between the base of the disposal area and groundwater. The availability of sufficient clay material for use as a low-permeability in situ or remolded liner is also important. Suitable construction materials for dikes, berms, and final cover should be available on site. The final cover material should be capable of inhibiting water flow and of developing a good stand of vegetation, if growing conditions permit.
Environmental Criteria
In general, environmental criteria are not as rigid as engineering criteria. However, environmental factors are equally or more important since they may affect the ultimate acceptance or rejection of the site and must be considered for all potential candidate sites. Environmental factors that should be considered include:
t Surface Water-The site should be located outside the 100-year flood plain to prevent inundation. Locations near surface water (rivers, creeks, ponds, swamps, wetlands, seeps, and springs) should be avoided whenever possible.
t Groundw ater-Groundwater contamination is less likely to occur where there is sufficient depth between the bottom of the landfi and the historical seasonal high groundwater table. Preventing contamination is par- ticularly important where the site overlies an aquifer which is either potentially or presently used as a water supply. The potential effect on water supplies, both groundwater and surface
water, should be considered in the site location. In addition, the site’s effect on groundwater quantity and quality should be minimized by locating away from groundwater recharge areas.
Air-Wind intensity and direction should be considered, particularly with regard to minimizing the effects of fugitive emissions from dry transport and disposal.
Terrestrial and Aquatic Ecology-The alteration of any unique habitat should be avoided. Detrimental effects on any rare or endangered species (resident or migratory) must be prevented.
Noise-The local effects of transporta- tion (truck or rail traffic), construction, and operation should be minimized.
Land Use-Populated areas and areas of conflicting land use, such as parks, nature preserves, wilderness areas, and airports, should be avoided. The use of potential farm and timber land should be minimized. The site should have the capability for beneficial land use at the termination of disposal operations.
Scenic and Aesthetic Effects-Sites should be visually isolated as much as possible. Visual effects should be minimized by maintaining natural barr- iers such as a ridge of ground or a belt of trees. The presence of such natural barriers may preclude the need for constructing artificial screening devices.
Cultural Resources-Unique archaeo- logical, historical, and paleontological areas should be avoided. A thorough archaeological investigation should be performed at each site.
Advanced Coal Technology By-product 80 Disposal Management and Design Manual
Site Selection and Permitting
Many of the criteria listed above can be satisfied by selecting a disposal site in an isolated area. The desirability of isolation, however, must be balanced against the increased cost (longer transport distance) often necessary to obtain isolation.
Economic Criteria
Project costs are always an important criterion which should be considered in evaluating alternative sites.
t
t
t
t
t
t
t
Transportation Costs-Consider the distance by-products will be transported. The major cost consideration in site selection is locating the disposal site as close to the generating station as possible so as to minimize transport costs.
Property Acquisition Costs-Consider actual land costs plus indirect costs such as legal fees, realtor costs, and related items.
Site Development Costs-Consider factors relating to site development and construction such as excavation, grading, and new roads.
Conditioning Costs-Consider on-site availability of clay, gravel, and other construction materials.
Closure Costs-Consider the expense of the final covering of the site and preparing it for subsequent land use.
Post-Closure Costs-Cost of main- taining and monitoring the site during the post-closure period, which may extend 30 years after closure.
Salvage Value-Consider the value of land after the site is closed.
In addition to the listed factors, another consideration is the past use of the site. Select
a site that has a low potential for being contaminated by previous activity. The need to monitor the site will lead to discovery and subsequent liability.
Political and Regulatory Criteria
Political and Public Acceptam+ Political acceptance means acceptance by local elected representatives such as county commissioners, town councils, local planning commissions, mayors, and supervisors. These individuals often wield considerable influence locally and can stop projects by various means, both direct (such as refusing to grant a zoning variance or preventing the transfer of property, or enacting a non-disposal ordinance) and indirect (using personal persuasion and influence to block property transfer). Public acceptance means acceptance by the public at large, including special interest groups such as sportsman clubs, nature clubs, and environmental groups.
When evaluating candidate sites, the generating station should anticipate and avoid areas and issues which are locally sensitive. Many of these relate to the environmental criteria mentioned earlier. It is important, for example, to avoid siting near parks and recrea- tion areas, unique historical and archaeological sites, and similar areas of local concern in order to gain political and public acceptance.
Political acceptance and public acceptance may not always be the same thing. It is possible for elected officials to act in a way which they perceive to be in the public interest, allowing a project to proceed, while a sector of the public-at-large feels the project should not proceed because of a damage to its interest. It may not be possible to satisfy all these interests, for they are sometimes conflicting. However, in the site selection and evaluation process, it is best to anticipate what the opposing forces are likely to be. If these forces cannot be avoided, negotiations may succeed in reducing opposition at some increase in cost by implementing additional
81 Advanced Coal Technology By-Product Disposal Management and Design Manual
Site Selection and Permitting
mitigating measures. Mitigating measures might include additional engineered controls to protect groundwater or prevent dusting, improved access roads, or even set-asides of land to compensate for development in certain ecologically sensitive areas.
In many cases, it is necessary to conduct a public information and public relations program concurrent with the site selection process to win political and public acceptance of the project. Both are necessary in order to proceed effectively with the project.
Regulatory Requirements-The expansion of an existing site may be made without undue difficulty because the agencies (and the general public) have become conditioned to the presence of a disposal operation. However, a new site may present greater problems because of the intrusion of an operation into a new area. Whatever the situation, it is generally advisable, as a first step, to identify and contact the relevant regulatory agencies to determine the permitting and monitoring requirements. It will be neces- sary for a new disposal area to meet permitting conditions, so these conditions should be deter- mined early. The potential for reduction of certain permit requirements should be deter- mined early in the process also, so that sufficient time is available for whatever design studies may be required. Early contacts with agency staff may also bring to light areas of concern that need to be addressed and overcome before the permits can be successfully processed.
Topographic Maps
The topography of the area indicates low and high areas, natural surface water drainage pattern, streams, and wetlands. A topographic map will help find sites that are not on natural surface water drainages or within a wetland. Topography may also indicate potential groundwater recharge or discharge zones which may be subject to more stringent regulations. Local land uses are also typically shown on topographic maps.
Land Use Plans
These plans are useful when delinea- ting areas with definite zoning restrictions. There may be restrictions on the use of agri- cultural land or on the use of forest land for landfill purposes. These maps are used to delineate possible sites that are sufficiently far away from inhabitations and to satisfy zoning criteria within the search area.
Transportation Maps
These maps, which indicate roads, railways, and locations of airports, are used to determine the transportation needs when devel- oping a site. If clay needs to be hauled from a distant source for constructing a liner for a site, for example, these maps may be used to esti- mate the hauling distance. Allowable axle loads on roads leading to a potential site must be studied to find out whether any road improvement will be necessary.
Sources of Wafer 5.1.2 Data Collection
As much information as possible should be gathered to support the evaluation of each candidate site. A brief discussion of some data sources and planning tools are listed below '.
Information or maps on local sources and uses of water are not always readily available. However, once potential areas are delineated, the water use in those areas must be investigated. A plan detailing the following items should be developed: private and public wells indicating the capacity of each well; major and minor drinking water supply line(s); water intake located on surface water bodies; and open wells. A safe distance (2,000 feet or
Advanced Coal Technology By-product 82 Disposal Management and Design Manual
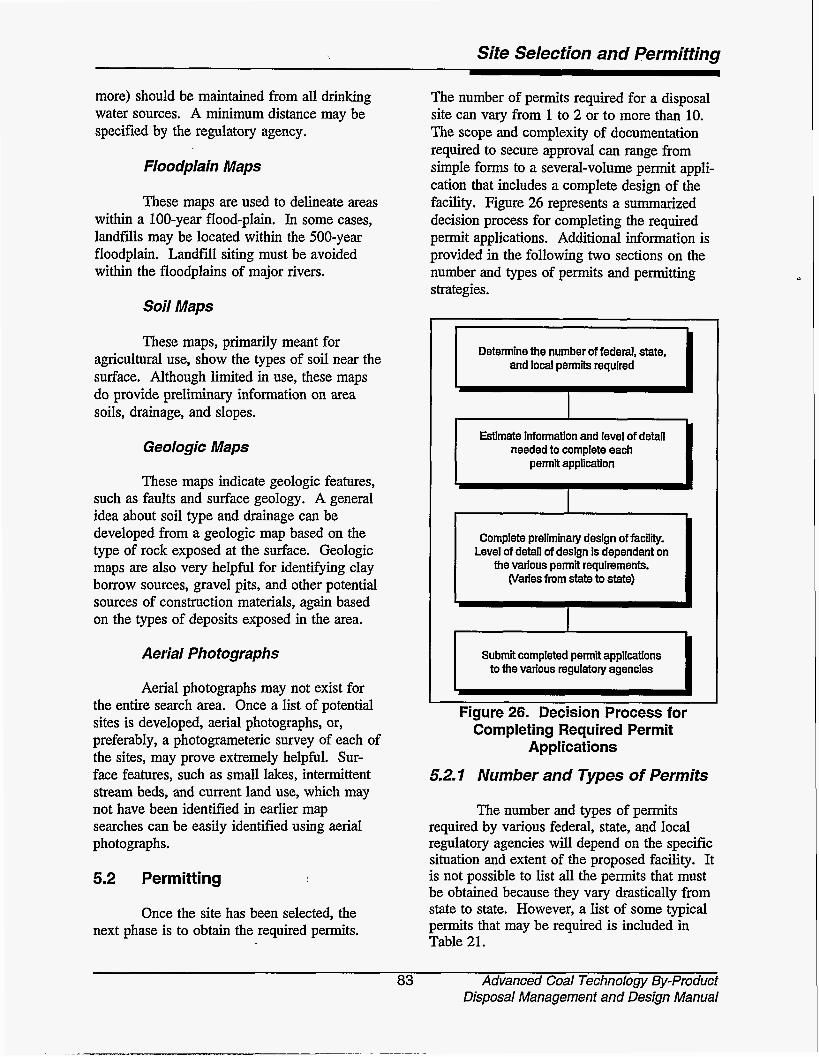
Sife Selection and Permitting
more) should be maintained from all drinking water sources. A minimum distance may be specified by the regulatory agency.
Floodplain Maps
These maps are used to delineate areas within a 100-year flood-plain. In some cases, landfills may be located within the 500-year floodplain. Landfill siting must be avoided within the floodplains of major rivers.
Soil Maps
These maps, primarily meant for agricultural use, show the types of soil near the surface. Although limited in use, these maps do provide preliminary information on area soils, drainage, and slopes.
Geologic Maps
These maps indicate geologic features, such as faults and surface geology. A general idea about soil type and drainage can be developed from a geologic map based on the type of rock exposed at the surface. Geologic maps are also very helpful for identifying clay borrow sources, gravel pits, and other potential sources of construction materials, again based on the types of deposits exposed in the area.
Aerial Photographs
Aerial photographs may not exist for the entire search area. Once a list of potential sites is developed, aerial photographs, or, preferably, a photogrameteric survey of each of the sites, may prove extremely helpful. Sur- face features, such as small lakes, intermittent stream beds, and current land use, which may not have been identified in earlier map searches can be easily identified using aerial photographs.
5.2 Permitting
Once the site has been selected, the next phase is to obtain the required permits.
The number of permits required for a disposal site can vary from 1 to 2 or to more than 10. The scope and complexity of documentation required to secure approval can range from simple forms to a several-volume permit appli- cation that includes a complete design of the facility. Figure 26 represents a summarized decision process for completing the required permit applications. Additional information is provided in the following two sections on the number and types of permits and permitting strategies.
I Determine the number of federal, state, and local permits required
Estimate Information and needed to complete each
permit application
Complete preliminary design of facility. Level of detail of design Is dependant on
the various permit requirements. (Varies from state to state)
I I Submit completed permit applications
to the various regulatory agencies
Figure 26. Decision Process for Completing Required Permit
Applications
5.2.1 Number and Types of Permits
The number and types of permits required by various federal, state, and local regulatory agencies will depend on the specific situation and extent of the proposed facility. It is not possible to list all the permits that must be obtained because they vary drastically from state to state. However, a list of some typical permits that may be required is included in Table 21.
83 Advanced Coal Technology By-product Disposal Management and Design Manual
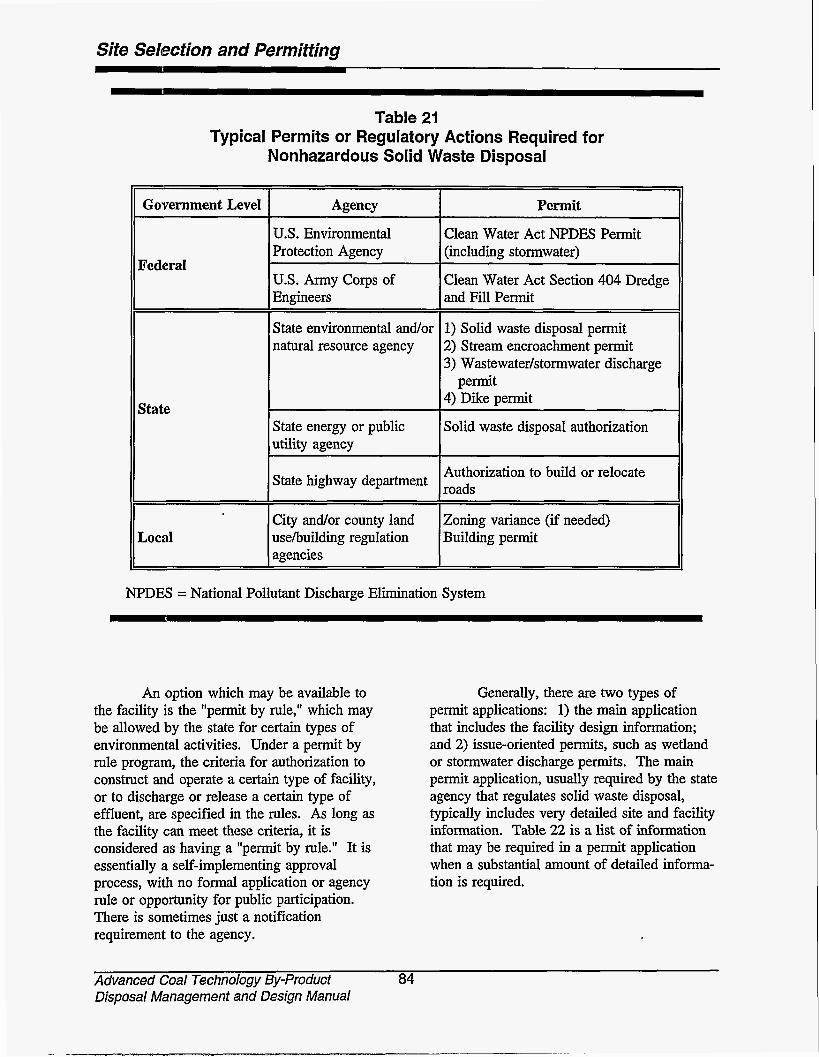
Sife Selecfion and Permiffing
State energy or public utility agency
Table 21 Typical Permits or Regulatory Actions Required for
Nonhazardous Solid Waste Disposal
Solid waste disposal authorization
Government Level L Federal
State
Local City and/or county land usebuilding regulation agencies
Agency 1 Permit
Zoning variance (if needed) Building permit
U.S. Environmental Protection Agency
Clean Water Act NPDEiS Permit (including stormwater)
U.S. Army corps of Engineers
~~ ~
Clean Water Act Section 404 Dredge and Fill Permit
State environmental and/or natural resource agency
1) Solid waste disposal permit 2) Stream encroachment permit 3) Wastewater/stormwater discharge
4) Dike permit permit
Authorization to build or relocate State highway department roads I
NPDES = National Pollutant Discharge Elimination System
An option which may be available to the facility is the "permit by rule," which may be allowed by the state for certain types of environmental activities. Under a permit by rule program, the criteria for authorization to construct and operate a certain type of facility, or to discharge or release a certain type of effluent, are specified in the rules. As long as the facility can meet these criteria, it is considered as having a ''permit by rule." It is essentially a self-implementing approval process, with no formal application or agency rule or opportunity for public participation. There is sometimes just a notification requirement to the agency.
Generally, there are two types of permit applications: 1) the main application that includes the facility design information; and 2) issue-oriented permits, such as wetland or stormwater discharge permits. The main permit application, usually required by the state agency that regulates solid waste disposal, typically includes very detailed site and facility information. Table 22 is a list of information that may be required in a permit application when a substantial amount of detailed informa- tion is required.
Advanced Coal Technology By-product 84 Disposal Management and Design Manual
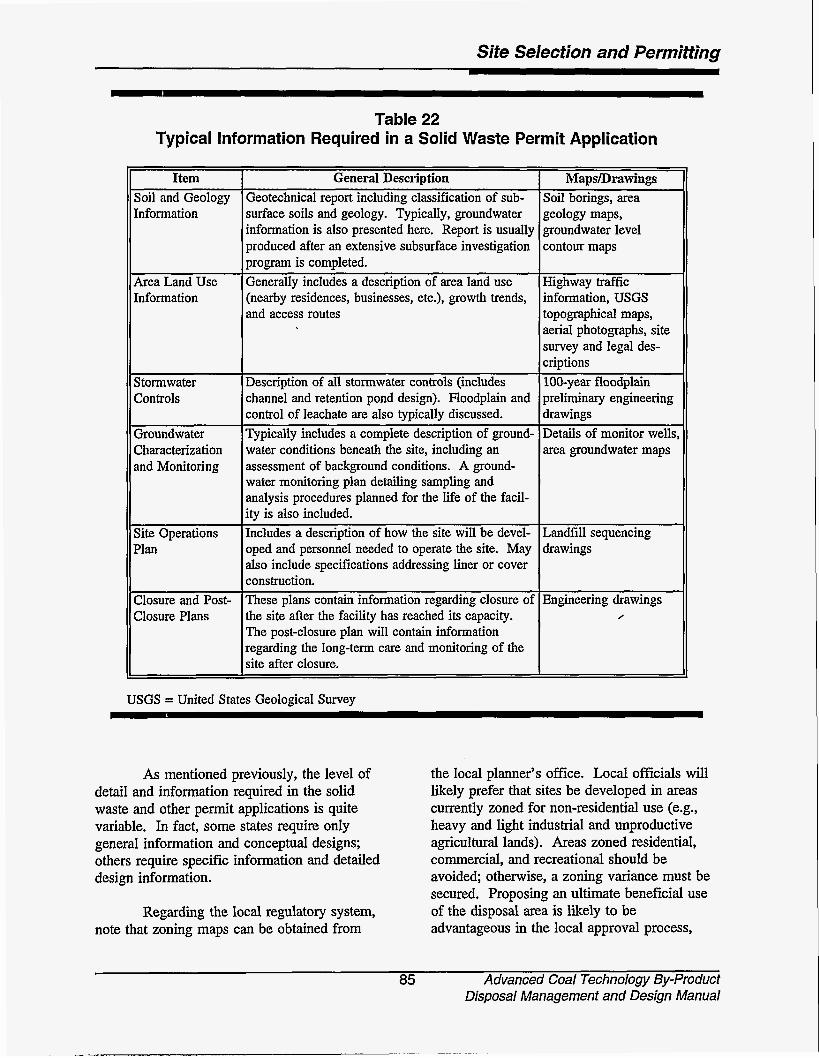
Site Selection and Permitting
Item Soil and Geology Information
Area Land Use Information
Table 22 Typical Information Required in a Solid Waste Permit Application
General Description Geotechnical report including classification of sub- surface soils and geology. Typically, groundwater information is also presented here. Report is usually produced after an extensive subsurface investigation program is completed. Generally includes a description of area land use (nearby residences, businesses, etc.), growth trends,
The post-closure plan will contain information regarding the long-term care and monitoring of the
, site after closure. L
I
S tormwater Controls
Groundwater Characterization and Monitoring
I Description of all stormwater controls (includes
Site Operations Plan
Closure and Post- Closure Plans
USGS = United Stal :s Geological Survey
Maps/Drawings Soil borings, area geology maps, groundwater level contour maps
Highway traffic information, USGS topographical maps, aerial photographs, site survey and legal des- criptions 100-year floodplain preliminary engineering drawings Details of monitor wells, area groundwater maps
Landfill sequencing drawings
Engineering drawings /
As mentioned previously, the level of detail and information required in the solid waste and other permit applications is quite variable. In fact, some states require only general information and conceptual designs; others require specific information and detailed design information.
Regarding the local regulatory system, note that zoning maps can be obtained from
the local planner's off'ice. Local officials will likely prefer that sites be developed in areas currently zoned for non-residential use (e.g., heavy and light industrial and unproductive agricultural lands). Areas zoned residential, commercial, and recreational should be avoided; otherwise, a zoning variance must be secured. Proposing an ultimate beneficial use of the disposal area is likely to be advantageous in the local approval process,
85 Advanced Coal Technology By-Product Disposal Management and Design Manual
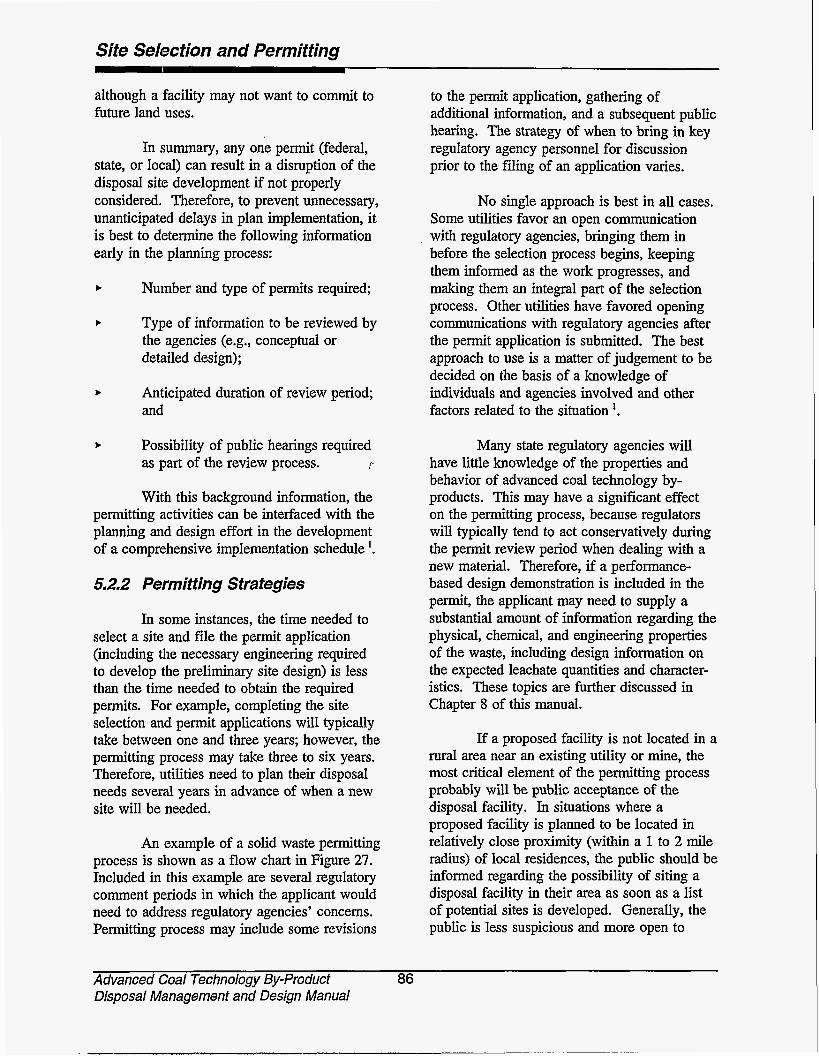
Site Selection and Permitting
although a facility may not want to commit to future land uses.
In summary, any one permit (federal, state, or local) can result in a disruption of the disposal site development if not properly considered. Therefore, to prevent unnecessary, unanticipated delays in plan implementation, it is best to determine the following information early in the planning process:
F Number and type of permits required;
F Type of information to be reviewed by the agencies (e.g., conceptual or detailed design);
F Anticipated duration of review period; and
t Possibility of public hearings required as part of the review process. i'
With this background information, the permitting activities can be interfaced with the planning and design effort in the development of a comprehensive implementation schedule '. 5.2.2 Permitting Sfrafegies
In some instances, the time needed to select a site and f i e the permit application (including the necessary engineering required to develop the preliminary site design) is less than the time needed to obtain the required permits. For example, completing the site selection and permit applications will typically take between one and three years; however, the permitting process may take three to six years. Therefore, utilities need to plan their disposal needs several years in advance of when a new site will be needed.
An example of a solid waste permitting process is shown as a flow chart in Figure 27. Included in this example are several regulatory comment periods in which the applicant would need to address regulatory agencies' concerns. Permitting process may include some revisions
to the permit application, gathering of additional information, and a subsequent public hearing. The strategy of when to bring in key regulatory agency personnel for discussion prior to the fiiing of an application varies.
No single approach is best in all cases. Some utilities favor an open communication with regulatory agencies, bringing them in before the selection process begins, keeping them informed as the work progresses, and making them an integral part of the selection process. Other utilities have favored opening communications with regulatory agencies after the permit application is submitted. The best approach to use is a matter of judgement to be decided on the basis of a knowledge of individuals and agencies involved and other factors related to the situation '.
Many state regulatory agencies will have little knowledge of the properties and behavior of advanced coal technology by- products. This may have a significant effect on the permitting process, because regulators will typically tend to act conservatively during the permit review period when dealing with a new material. Therefore, if a performance- based design demonstration is included in the permit, the applicant may need to supply a substantial amount of information regarding the physical, chemical, and engineering properties of the waste, including design information on the expected leachate quantities and character- istics. These topics are further discussed in Chapter 8 of this manual.
If a proposed facility is not located in a rural area near an existing utility or mine, the most critical element of the permitting process probably will be public acceptance of the disposal facility. In situations where a proposed facility is planned to be located in relatively close proximity (within a 1 to 2 mile radius) of local residences, the public should be informed regarding the possibility of siting a disposal facility in their area as soon as a list of potential sites is developed. Generally, the public is less suspicious and more open to
Advanced Coal Technology By-product 86 Disposal Management and Design Manual

II
permit Appllcalon(PA)
Rodcved
NoUccof NOR Sent > I O A p p l l ~ - PA Asslgncd Rcvlcw for PA PALosg~bIn
R d p l ( N 0 R )
CNeIaar InLowlPaper > AdmlnlmaUvcly --J Sent 10 IoPubllsh - tohjecl =$. Adminimnllvc . byRlcClKk -h
Englnecr Complc(cncss Complete andAslgned - a
Number
Public MefUng- All New M u
andfofhcndments 11 Requested
<
I- 30 Dayr
Tefhnlwl Rcvlew Oulsldc Agency Rcvlew
Figure 27. Typical Solid Waste Permitting Process
RcmmmcnbUon 10 Gnnl Permil
InlUal DnR PA Perm11 (IDP).
Complianceand 3 Teehnlwl Summaries RepVal by Agency
IDP Clrculakd NOUCC Of DIIIII for NoUcc of Publlc lo Applicant, Flnal Dran Permit P d t (NDP) or H d n g H d n g Sent to Public sm, RevlCW 3 Repyed and Sen1 3 AppUwUon (NOA) 7 AppllcantloPubllsh H d n g 3 andComment
Agcndes for Review IO ChlclClKk Scntur AppllcantTo and Send Io Hcld - I-
PubllShK'S
k n t IO
4 PubUc Hwring Roeess
EXCCPUON Answers IO Agency MoUon for Rcplles lo Hcvlngs Clorlng - ~ e ~ n g * Gmnts or ExcepUON * DcnlcsPmlt * IOPFD * Closing ExnmlnK *
Puguments Issues PFD Arguments *
Site Selection and Permitting
discussion if they are informed by the owner rather than getting the news from other sources.
A site may be technically acceptable to regulators and economically acceptable to the generating station, but it may be strongly opposed by the public or environmental groups within the public. The k o t in my backyard" sentiment is typically high initially. However, with proper public information programs and discussion, it can be overcome in some cases. Residents around the proposed site may be more inclined to cooperate if the utility listens to their concerns and considers them when designing and operating the site.
It is interesting that, whereas regulators are typically concerned with protecting surface and groundwater quality, the public is gener- ally more concerned with noise, dust, odor, increased traffic volume, and a reduction in property values.
5.2.3 Public Hearing Process
By law in every state and at the federal level, persons who may be affected by a proposed waste disposal site must be notified of the proposed construction and have the right to comment on the proposal and/or request a formal public hearing. Notice to affected persons is typically required to be provided by the applicant upon submittal of the application to the regulatory agency, when the agency issues a draft permit, or both. Notice is provided by mail to adjacent land owners and to the general public through publication in a local newspaper.
A public hearing, if requested, is a formal, trial-like proceeding before a state administrative law judge (ALJ) or hearings examiner (HE). The applicant has the burden of proof to demonstrate that the technical criteria of the applicable permitting rules are adequately addressed in the application. Evidence is presented through testimony of sworn witnesses, and all parties are usually
represented by attorneys. At the conclusion of the hearing process, the ALJ or HE prepares a proposal for decision (PFD) that recommends granting or denying the permit. The PFD is then presented to the governing body of the state agency who makes the final decision. Any party unhappy with the final decision may then appeal to state district court.
The public hearing process will typically delay the project from approximately 4 to 8 months. Therefore, it is usually to an applicant's advantage to anticipate potential local opposition and initiate an effective public relations campaign.
5.3 Citations
1. Electric Power Research Institute. FGD Bv-Product Disposal Manual, 3rd ed. CS-2801. Palo Alto, California, 1983.
2. Bagchi, Amalendu. Design, Construction, and Monitoring of Sanitary Landfill. John Wiley & Sons, New York, 1990.
Advanced Coal Technology By-product 88 Disposal Management and Design Manual

Components and Equipment
Basic management system design components, equipment, and design guidelines are discussed in this chapter. These design elements will generally be required for oper- ation of any land disposal facility or temporary by-product stockpile where materials are trans- ported, processed, or stored. This chapter covers components common to disposal facili- ties and equipment which may be used for either land disposal or beneficial useheuse facilities (such as for handling, transport, or processing). Finally, a brief description of materials handling and processing procedures used in construction and operation of landfill test cells at one site studied as part of this project is provided as a case study.
6.1 Disposal Facility Components
There are several features that are common to each of the landfill disposal alter- natives discussed in Chapter 1. These features include: landfill configurations, stormwater management, erosion control, groundwater monitoring systems, and miscellaneous support facilities (access roads, fencing, etc.). These features are presented in the following five sections.
6.1. I Typical Landfill Configurations
The critical factors involved with the selection of a configuration for an above-grade landfiil are capacity, topography, erosion control, and management of stormwater. Landfill configurations are typically classified as either heaped, valley or sidehill. However, configurations of by-product material fills are typically more complex for mine reclamation and backfill. Additional information specific to mine applications will be presented in
Chapter 7. The three main landfill classifications are further defined below.
Heaped Fill-The simplest and most straightforward landfill configuration to design is the heaped above-grade fill shown in Figure 28. This type of landfill is typically used in areas where the terrain is level. Slope stability and site preparation problems are usually minimal with this configuration because of its flexibility. For example, if the by-product material is determined to have low shear strength the steepness of the side slopes can be reduced in order to achieve a stable fill. This configuration can also easily be modified to accommodate erosion control measures and containment system designs. A heaped landfill configuration, however, does not blend in with the surrounding level terrain and is highly visible. For this reason, surrounding communities may find this method more objectionable than types of fill construction '.
Valley FU-The most common type of landfill in hilly terrain is a valley fill, also shown in Figure 28. Since valleys are natural avenues for surface runoff and, in non-arid regions commonly have springs along the side slopes, control of surface water and groundwater may be necessary in these areas. It is important to direct surface runoff water under or around the fill to avoid impounding water and to help control erosion and possible contamination of runoff water (surface water controls are discussed in more detail in the following subsection). Similarly, valleys that contain perennial springs should be avoided during the site selection process to reduce leachate generation and slope stability problems. In general, site preparation is more difficult with valley fills than with other landfill configurations '.
89 Advanced Coal Technology By-product Disposal Management and Design Manual

Componenfs and Equipmenf
Plan View
\ Plan View
Cross-Section A-A’ Cross-Section B-B’
Figure 28. Heaped and Valley Landfiil Configurations I
Side-Hill Fill-In hilly or gently sloping terrain, side-hill construction as shown in Figure 29 is often possible. The fill may be constructed along the side of a hill or valley. Properly constructed, side-hill f i ls may blend well with the existing terrain and may also provide valuable property when reclaimed. Site preparation and slope stability con- siderations may be more complex than with heaped fills; however, this can be addressed through proper engineering
Additional considerations that affect each of these basic landfiil configurations include slope stability, stormwater control, and erosion control. Examples of how erosion and stormwater controls affect landfill configuration are shown in Figure 30. These two items will be discussed further in Sections 6.1.2 and 6.1.3.
Slope instability is a necessary consideration for all coal combustion by- product disposal areas. Stability is influenced by physical waste properties such as waste density, strength, degree of saturation, effective cohesion, effective angle of shearing resistance, and behavior during shearing (dilettante versus densifying); site conditions including geo- technical characteristics of the in-place foundation material and potential for seismic shaking; and geometric factors such as the heights and outslopes (or slope angles) of embankments ’. Many advanced coal technology by-products exhibit initial cementation which increases slope stability significantly. However, the physical properties may deteriorate over a period of months to years with exposure to the environment. Safety factors for slope stability which are calculated based on initial strength development may be misleading.
Advanced Coal Technology By-product 90 Disposal Management and Design Manual
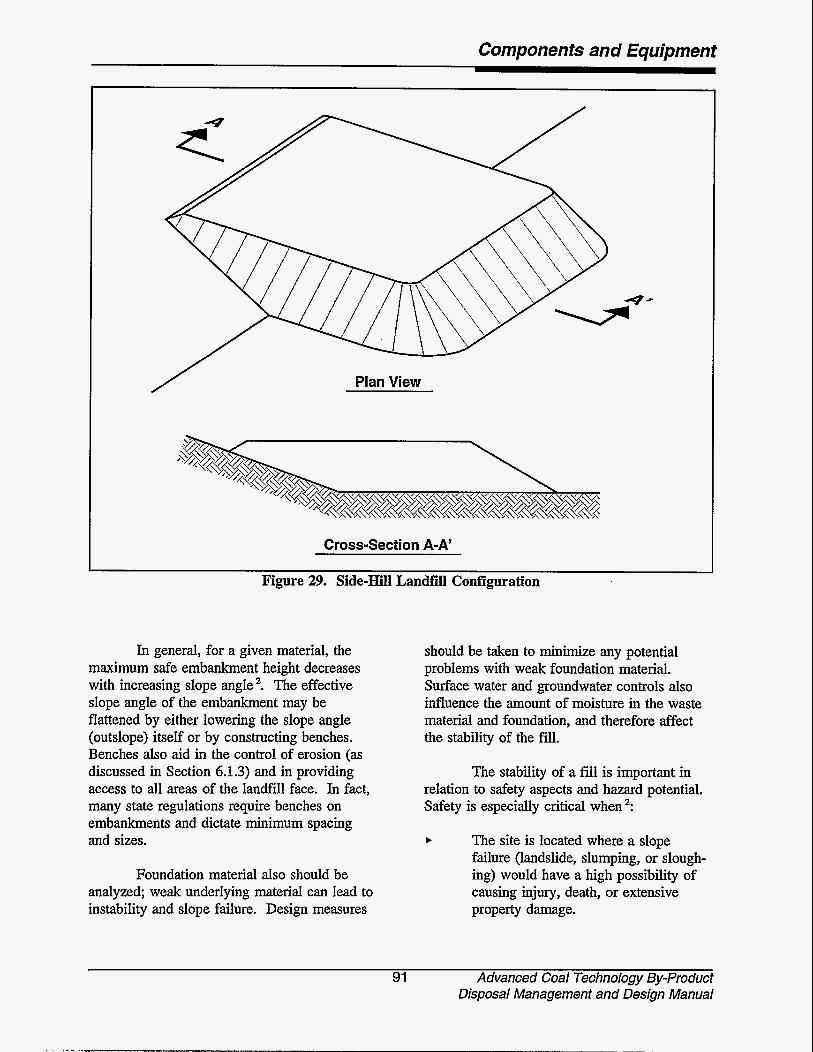
Components and Equipment
Cross-Section A-A’
Figure 29. Side-Hill Landfill Configuration
In general, for a given material, the maximum safe embankment height decreases with increasing slope angle2. The effective slope angle of the embankment may be flattened by either lowering the slope angle (outslope) itself or by constructing benches. Benches also aid in the control of erosion (as discussed in Section 6.1.3) and in providing access to all areas of the landfill face. In fact, many state regulations require benches on embankments and dictate minimum spacing and sizes.
Foundation material also should be analyzed; weak underlying material can lead to instability and slope failure. Design measures
should be taken to minimize any potential problems with weak foundation material. Surface water and groundwater controls also influence the amount of moisture in the waste material and foundation, and therefore affect the stability of the fill.
The stability of a fill is important in relation to safety aspects and hazard potential. Safety is especially critical when2:
The site is located where a slope failure (landslide, slumping, or slough- ing) would have a high possibility of causing injury, death, or extensive property damage.
91 Advanced Coal Technology By-product Disposal Management and Design Manual

Top Grades are Usually Between 2% and 6% to Promote Drainage and Decrease Percolation /-
/ J
Final Cover Erosion Control Layer /- /
Slope Typically Varies from 2H:lV to 6H:lV
k /-
Note: Slope configuration usually determined through the use of the USDA's Universal Soil Loss Equation.
Typical Vertical Distance Between Benches Varies from 15' to 40'
Figure 30. General Guidelines for Top and Side Slope Configurations
Components and Equipment
t The site is located adjacent to a stream where significant sloughing or movement of the embankment could block or restrict stream flow, creating a temporary impoundment which could release a floodwave upon breaching.
t The site is staged in such a manner that the potential exists to unexpectedly impound water during some stage of development, despite the existence of an underlying drainage system. This unanticipated accumulation of water could structurally weaken the fill to the point where slumping or sloughing results.
When a landfill is designed and permitted, some type of stability analysis must be performed to show that outslopes are stable. The result of this analysis is a calculated "factor of safety." Most regulatory agencies specify a minimum factor of safety that must be demonstrated; this factor of safety can vary depending upon the agency involved. The calculated factor of safety can be increased by the following measures 2:
Flattening the outslope of landfill embankments. This can be done by either reducing the slopes of the landfill itself or by adding benches.
Improving landfill foundation conditions.
Constructing a granular underdrain system beneath the landfill to ensure that pore water pressure will not adversely affect stability.
Sloping the top of landfill for drainage and constructing diversion channels at the perimeter to minimize surface water entering the landfill.
6.1.2 Storm water Management
An important factor in the construction of any landfill is the stormwater controls that will be utilized at the site. The development of a stormwater management plan for the life of the site is usually required in most solid waste permit applications. The development of a landfill can be thought of as a long-term construction project which typically takes 20 to 30 years to complete. Therefore, it is impor- tant to consider what stormwater management measures will be needed as site development progresses. The design of a stormwater man- agement system is usually a very complex task and is dependent upon individual site char- acteristics. Therefore, the objective of this section is to provide the reader with an over- view of the design criteria and stormwater control techniques common to landfills. Additional design information can be obtained from the reference list provided in Table 23.
Stormwater runoff volumes calculated on the basis of soil characteristics may not adequately represent runoff from the active portions of an advanced coal technology by- product landfill. Field results and calculations (see Chapters 8 and 9) indicate that runoff may account for a very small percentage of the landfi water balance, even under quite wet conditions.
As with most landfill design elements, the design criteria set forth by regulatory agencies vary from state to state; however, a few of the general criteria are listed below.
t A facility should generally be located outside the boundaries of the 100 year flood plain unless it can be demonstrated that flow from the 100 year flood and storage capacity of the floodplain are not restricted.
93 Advanced Coal Technology By-product Disposal Management and Design Manual
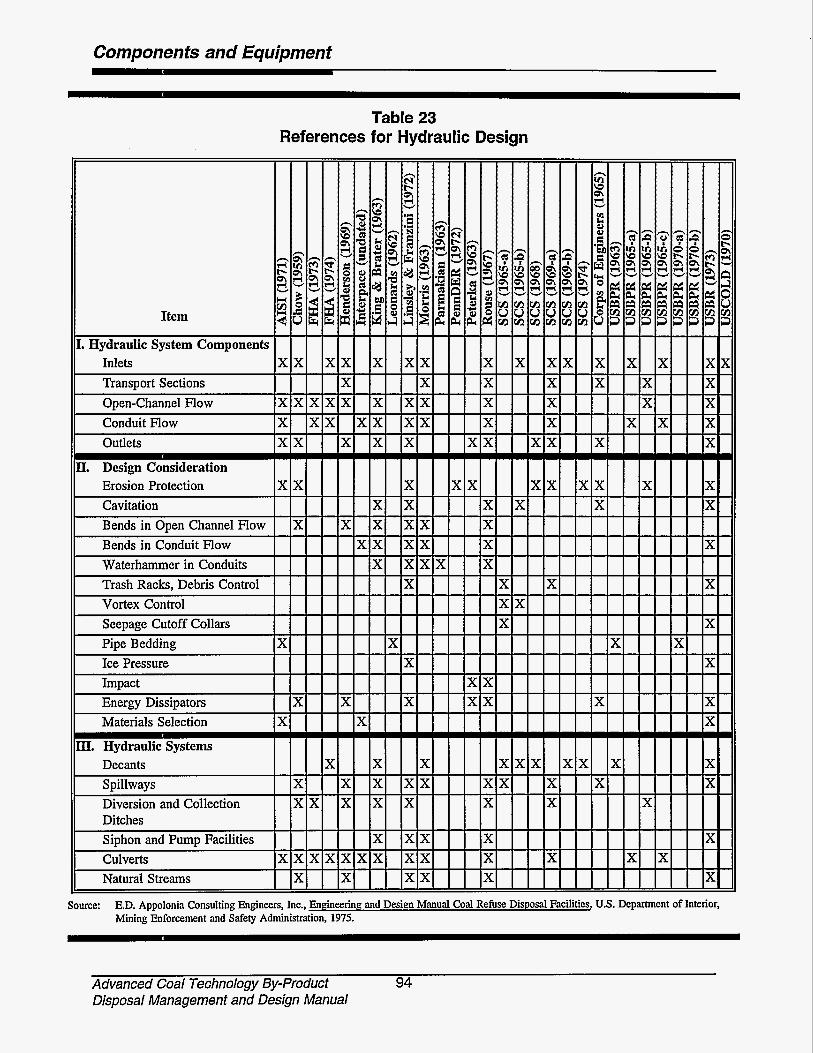
Componenfs and Equipmenf
Table 23 References for Hydraulic Design
I. Hydraulic System Components lxlxl lxlx
11 Transport Sections Open-Channel Flow Conduit Flow Outlets
I II. Design Consideration
Erosion Protection X # X
Waterhammer in Conduits
Materials Selection
III. Hydraulic Systems c Spillways Decants
Diversion and Collection 11 Ditches 11 Siuhon and Pump Facilities
Culverts Natural Streams
Source: E.D. Appolonia Consulting Engineers, Inc., Engineering and Design Manual Coal Refuse Disposal Facilities, U.S. Department of Interior. Mining Enforcement and Safety Administration, 1975.
Advanced Coal Technology By-product 94 Disposal Management and Design Manual
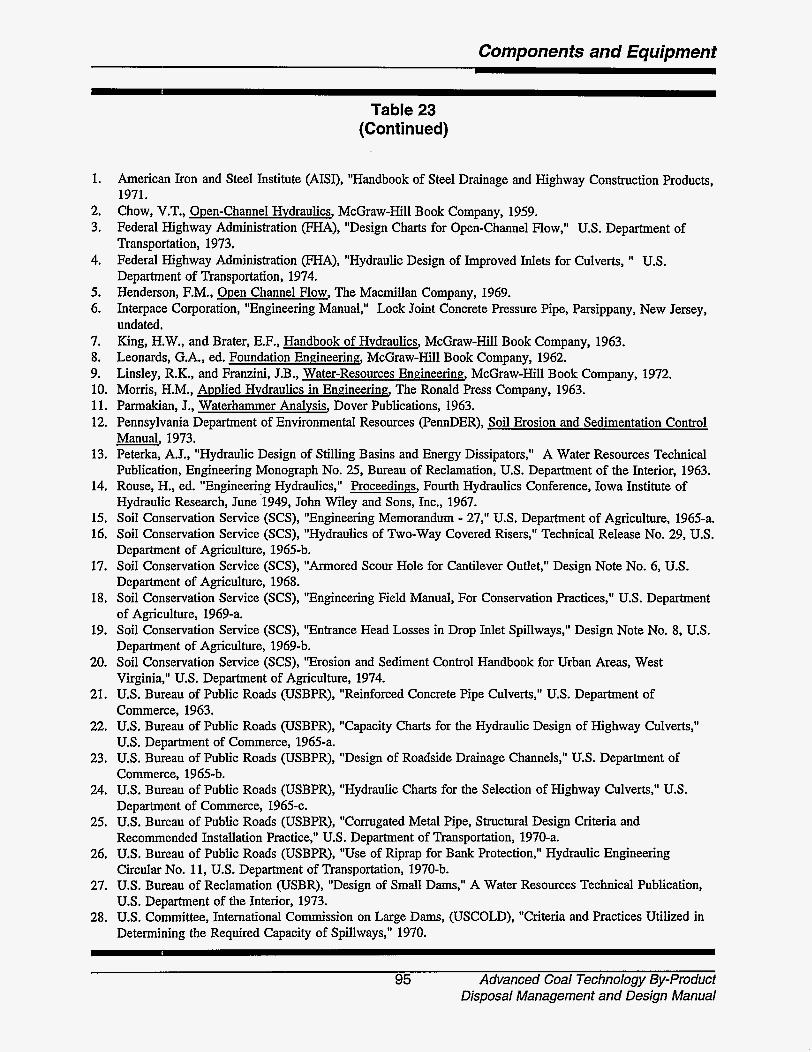
Components and Equipment
1.
2. 3.
4.
5. 6.
7. 8. 9. 10. 11. 12.
13.
14.
15. 16.
17.
18.
19.
20.
21.
22.
23.
24.
25.
26.
27.
28.
Table 23 (Continued)
American Iron and Steel Institute (AISI), "Handbook of Steel Drainage and Highway Construction Products, 1971. Chow, V.T., Open-Channel Hydraulics, McGraw-Hill Book Company, 1959. Federal Highway Administration (FHA), "Design Charts for Open-Channel Flow," U.S. Department of Transportation, 1973. Federal Highway Administration (FHA), "Hydraulic Design of Improved Inlets for Culverts, 'I U.S. Department of Transportation, 1974. Henderson, F.M., Open Channel Flow, The Macmillan Company, 1969. Interpace Corporation, "Engineering Manual," Lock Joint Concrete Pressure Pipe, Parsippany, New Jersey, undated. King, H.W., and Brater, E.F., Handbook of Hydraulics, McGraw-Hill Book Company, 1963. Leonards, G.A., ed. Foundation Engineering, McGraw-Hill Book Company, 1962. Linsley, R.K., and Franzini, J.B., Water-Resources Engineerin% McGraw-Hill Book Company, 1972. Morris, H.M., Applied Hydraulics in Engineering, The Ronald Press Company, 1963. Parmakian, J., Waterhammer Analysis, Dover Publications, 1963. Pennsylvania Department of Environmental Resources (FennDER), Soil Erosion and Sedimentation Control Manual, 1973. Peterka, A.J., "Hydraulic Design of Stilling Basins and Energy Dissipators," A Water Resources Technical Publication, Engineering Monograph No. 25, Bureau of Reclamation, U.S. Department of the Interior, 1963. Rouse, H., ed. "Engineering Hydraulics," Proceedings, Fourth Hydraulics Conference, Iowa Institute of Hydraulic Research, June '1949, John Wiley and Sons, Inc., 1967. Soil Conservation Service (SCS), "Engineering Memorandum - 27," US. Department of Agriculture, 1965-a. Soil Conservation Service (SCS), "Hydraulics of Two-way Covered Risers," Technical Release No. 29, U.S. Department of Agriculture, 1965-b. Soil Conservation Service (SCS), "Armored Scour Hole for Cantilever Outlet," Design Note No. 6, U.S. Department of Agriculture, 1968. Soil Conservation Service (SCS), "Engineering Field Manual, For conservation Practices," U.S. Department of Agriculture, 1969-a. Soil Conservation Service (SCS), "Entrance Head Losses in Drop Inlet Spillways," Design Note No. 8, US. Department of Agriculture, 1969-b. Soil Conservation Service (SCS), "Erosion and Sediment Control Handbook for Urban Areas, West Virginia," U.S. Department of Agriculture, 1974. U.S. Bureau of Public Roads (USBPR), "Reinforced Concrete Pipe Culverts," U.S. Department of Commerce, 1963. U.S. Bureau of Public Roads (USBPR), "Capacity Charts for the Hydraulic Design of Highway Culverts," U.S. Department of Commerce, 1965-a. U.S. Bureau of Public Roads (USBPR), "Design of Roadside Drainage Channels," U.S. Department of Commerce, 1965-b. U.S. Bureau of Public Roads (USBPR), "Hydraulic Charts for the Selection of Highway Culverts," U.S. Department of Commerce, 1965-c. U.S. Bureau of Public Roads (USBPR), "Corrugated Metal Pipe, Structural Design Criteria and Recommended Installation Practice," U.S. Department of Transportation, 1970-a. U.S. Bureau of Public Roads (USBPR), "Use of Riprap for Bank Protection," Hydraulic Engineering Circular No. 11, U.S. Department of Transportation, 1970-b. U.S. Bureau of Reclamation (USBR), "Design of Small Dams," A Water Resources Technical Publication, U.S. Department of the Interior, 1973. U.S. Committee, International Commission on Large Dams, (USCOLD), "Criteria and Practices Utilized in Determining the Required Capacity of Spillways," 1970.
95 Advanced Coal Technology By-product Disposal Management and Design Manual

Components and Equipment
Drainage that flows onto the site from surrounding areas should be diverted around the perimeter of the site before disposal activities begin.
Development of the site should not cause a significant change to area drainage patterns. This guideline is imposed by some states to protect structures that are located upstream and downstream of the disposal facility.
Run-off that is produced from precipitation that falls directly on active disposal areas should be diverted to a sediment basin. Typically, these basins are designed to handle runoff from the 25-year, %hour storm event.
Channels that convey stormwater from the facility to the sediment or detention pond are typically designed to handle runoff produced from a 25 year storm event.
Off-Site Run-on Protection
Protection from off-site run-on is generally provided at disposal facilities to limit the quantity of stormwater that flows into the internal drainage system of a landfill. Run-on protection is advantageous to facility operations because it limits the quantity of water that flows through the facility, thereby decreasing the size of any required sedimentation or detention pond (discussed further in the following subchapter). Diversion berms and drainage channels are typically used to prevent off-site drainage from entering the landfil. The height of the perimeter berms or capacity of the drainage channels is determined by analyzing the surrounding watershed area and estimating design flows. A variety of com- puter programs are available to assist the design professional in evaluating and designing these systems. Stormwater run-on control measures are typically designed to prevent flow from the 100-year storm event from entering the facility.
In some cases, existing creeks or streams may need to be relocated to allow site development. This may require major permitting, design, and construction efforts; however, for an otherwise acceptable site, the problems with relocating a small stream usually are not major. Stream location subsystems must be specified to safely pass runoff from a design storm (usually 100-year frequency) as detailed above. The frequency of the specified storm usually is a function of drainage area size and hazard potential '.
On-Site Stormwater Management
On-site stormwater management involves managing all precipitation that falls within the boundaries of the perimeter diversion berms and channels. If possible, it is advantageous to separate this stormwater into the following two categories:
b Precipitation that falls directly on the active portion of the landfill and comes in contact with the by-product material is typically defined as "contaminated" water; and
t Precipitation that falls on natural ground or closed areas and does not come into direct contact with by- product material is typically defiied as "clean" water.
Contaminated water (as defined above) is usually channeled to sedimentation ponds for clarification before discharging. National Pol- lutant Discharge Elimination System (NPDES) permits are usually required for sedimentation discharge points. If it is anticipated that "contaminated" surface water runoff will need to be treated (e.g., if treatment for the removal of metals will be required) before discharge, the cost to operate the disposal facility will increase substantially. As an alternative to treatment (if required), conveying the runoff discharge to the plant for use or treatment and disposal should be considered. Another option is to use this runoff water to hydrate and
Advanced Coal Technology By-product 96 Disposal Management and Design Manual
Components and Equipment
condition the by-product material before disposal.
Sedimentation ponds usually are sized to hold the runoff from a specified precipita- tion event (typically the 25-year, %-hour storm event) and to provide adequate detention time for runoff. The sedimentation pond should be designed to perform in the following manner.
b Promote sedimentation of suspended solids carried by the runoff from the disposal area.
b Allow passage of extreme storm events without structural damage to embank- ments (i.e., emergency spillways).
b Include capability for pond dewatering to accommodate subsequent storm events and to enable removal of accumulated solids in the pond. Depending on the regulations, solids removal may be required when accumulation reaches anywhere from 25% to 70% of design capacity2.
Runoff that does not come into contact with by-product material will also need to be managed according to applicable regulations. Typically "clean" stormwater is managed by one of the methods listed below.
b Channel the runoff to a "clean" detention pond. This pond is separate from the sedimentation pond; however, it is designed following the same cri- teria and methods listed above for a sedimentation pond. The purpose of the detention pond is to provide tem- porary or long-term storage of excess runoff that occurs as a result of the development of the site. This may be required to protect downstream or upstream structures or developments. In addition, regulators may require a detention pond to collect erosion that may occur from areas that have received final cover.
97
b No detention of "clean" runoff. In some cases a detention pond may not be needed or required, allowing clean runoff to directly flow off-site. Under this option, care must be taken, during the development of the site, to ensure that the active area is completely segre- gated from the undeveloped or closed areas.
6.1.3 Erosion Control
As with other major design elements, most state regulatory agencies require adequate design information from the facility operator to show how erosion and soil loss from the final cover material will be minimized. Erosion controls include the use of appropriate side slopes, vegetation, and structural erosion con- trol measures. These erosion control elements, as well as a summary of how to use the Uni- versal Soil Loss Equation to analyze specific designs, are discussed in the following subchapters.
Establishment of the Vegetation Layer
A well established vegetated cover not only improves the appearance of the disposal site, but also controls erosion of the final cover material. The vegetation layer is typically de- fined as 18 to 24 inches of topsoil and a grass layer. The purpose of this layer (with respect to erosion control only) is to provide for the long-term erosional stability of the landfills slopes after the site is closed. The topsoil layer should be specified to achieve the fol- lowing three items:
b Provide enough thickness to retain an adequate supply of water and nutrients in the specified root zone for the vegetation;
b Provide sufficient plant density to minimize cover soil erosion; and
Advanced Coal Technology By-product Disposal Management and Design Manual
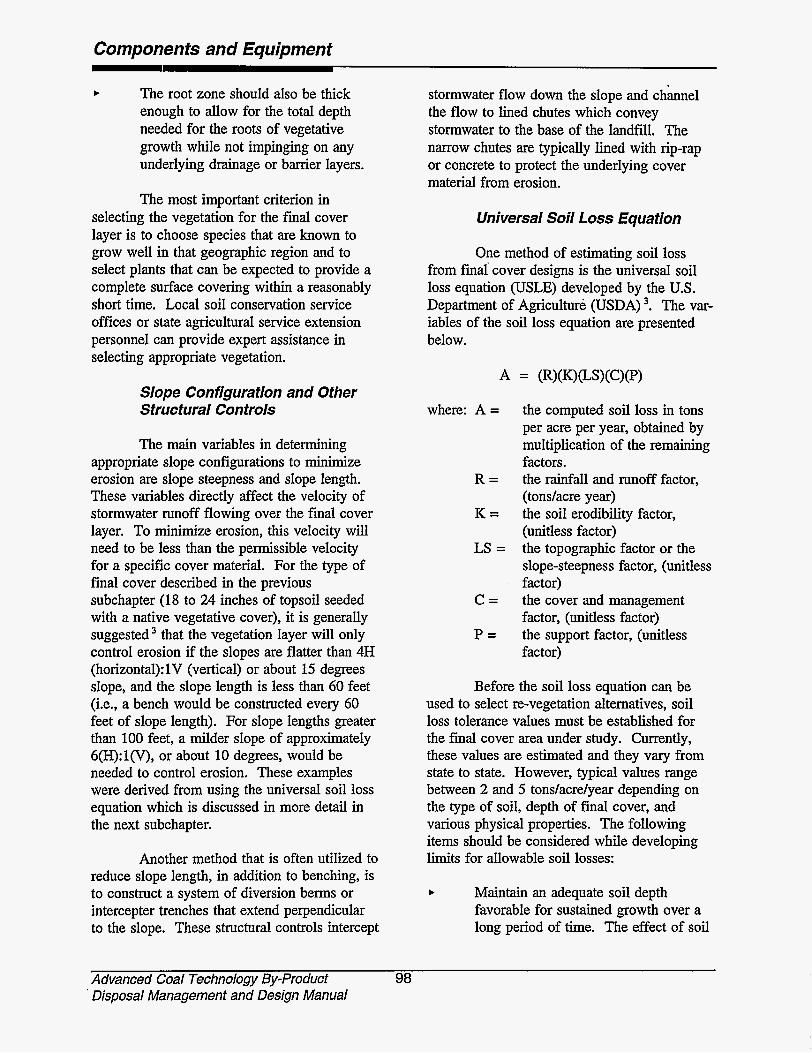
Componenfs and Equipmenf
b The root zone should also be thick enough to allow for the total depth needed for the roots of vegetative growth while not impinging on any underlying drainage or barrier layers.
The most important criterion in selecting the vegetation for the final cover layer is to choose species that are known to grow well in that geographic region and to select plants that can be expected to provide a complete surface covering within a reasonably short time. Local soil conservation service offices or state agricultural service extension personnel can provide expert assistance in selecting appropriate vegetation.
Slope Configuration and Other Structural Controls
The main variables in determining appropriate slope configurations to minimize erosion are slope steepness and slope length. These variables directly affect the velocity of stormwater runoff flowing over the final cover layer. To minimize erosion, this velocity will need to be less than the permissible velocity for a specific cover material. For the type of final cover described in the previous subchapter (18 to 24 inches of topsoil seeded with a native vegetative cover), it is generally suggested that the vegetation layer will only control erosion if the slopes are flatter than 4H (horizonta1):lV (vertical) or about 15 degrees slope, and the slope length is less than 60 feet (i.e., a bench would be constructed every 60 feet of slope length). For slope lengths greater than 100 feet, a milder slope of approximately 6(H):l(V), or about 10 degrees, would be needed to control erosion. These examples were derived from using the universal soil loss equation which is discussed in more detail in the next subchapter.
Another method that is often utilized to reduce slope length, in addition to benching, is to construct a system of diversion berms or intercepter trenches that extend perpendicular to the slope. These structural controls intercept
stormwater flow down the slope and channel the flow to lined chutes which convey stormwater to the base of the landfill. The narrow chutes are typically lined with rip-rap or concrete to protect the underlying cover material from erosion.
Universal Soil Loss Equation
One method of estimating soil loss from final- cover designs is the universal soil loss equation (USLE) developed by the U.S. Department of Agriculture (USDA) '. The var- iables of the soil loss equation are presented below.
where: A =
R =
K =
LS =
C =
P =
the computed soil loss in tons per acre per year, obtained by multiplication of the remaining factors. the rainfall and runoff factor, (tondacre year) the soil erodibility factor, (unitless factor) the topographic factor or the slope-steepness factor, (unitless factor) the cover and management factor, (unitless factor) the support factor, (unitless factor)
Before the soil loss equation can be used to select re-vegetation alternatives, soil loss tolerance values must be established for the final cover area under study. Currently, these values are estimated and they vary from state to state. However, typical values range between 2 and 5 tons/acre/year depending on the type of soil, depth of final cover, and various physical properties. The following items should be considered while developing limits for allowable soil losses:
b Maintain an adequate soil depth favorable for sustained growth over a long period of time. The effect of soil
Advanced Coal Technology By-product 98 ' Disposal Management and Design Manual

Components and Equipment
erosion on vegetative productivity should be considered for the anticipated mixed soil materials under consideration.
t Soil losses should be held below those that cause serious rilling and gully development.
t Soil losses should be held below those causing serious siltation in waterways, terrace channels, drainage ditches, road ditches, etc.
t Erosion causes seeding losses and poor crop stands through washouts, siltation, or loss of plant nutrients. Soil losses should be kept below the point where this becomes a serious problem.
Soil losses in excess of tolerance levels affect the maintenance, cost, and effectiveness of surface water control structures such as open ditches, reten- tion ponds, and other structures affected by sediment.
t
t It should be kept in mind that the soil- loss equation gives the soil loss for a particular soil cover and slope-length revegetation system. Soil loss mea- surements for a given soil cover, slope- length, and rainfall intensities can also be made directly in the field. Such measurements may help establish actual soil losses under the site-specific cover and slope-length conditions and can serve as a field demonstration to verify the validity of applicable USLE or configuration design parameters.
The variables of the soil loss equation are detailed below:
The rainfall factor (R) is a numerical value which expresses the capacity of the locally expected rainfall to erode soil from an unprotected (fallow) field. The factor R in the USLE can be calculated empirically from climato-
logical data. For average annual soil loss determinations, however, R can be obtained directly from Figure 31.
Soil Erodibility Factor (K) is a mea- sure of the inherent erodibility of a given soil. Values for K typically range from 0.10 to 0.45 with high-sand and high-clay content soils having low- er values and high-silt content soils having higher values. Long-term plot studies under natural rainfall have pro- duced K values generalized in Table 24 for the USDA designated soil types. Estimated K values can also be ob- tained from local U.S. Soil Conserva- tion Service (SCS) data or USDNSCS soil survey reports.
The Cover and Management Factor (C) in the USLE is the ratio of soil loss from land cropped under specified conditions to that clean-tilled, continu- ous fallow. Therefore, C combines effects of vegetation, crop sequence, management, and agronomic (as op- posed to engineering) erosion-control practices. On landfills, freshly covered and without vegetation or special ero- sion-reducing procedures of cover placement, C will usually be about unity. Where there is vegetative cover or significant amounts of gravel, roots, or plant residues or cultural practices which increase infiltration ,and reduce runoff velocity, C is much less than unity. Estimated C values from Table 25 for anticipated cover manage- ment can be used. However, these values should be adjusted with seasonal or annual changes that may occur in percent cover and plant density. For most landfills, C values from the top row (no appreciable canopy) are most appropriate. The C-factor is perhaps the most important USLE factor because it represents conditions that can be managed most easily to reduce erosion.
99 Advanced Coal Technology By-product Disposal Management and Design Manual
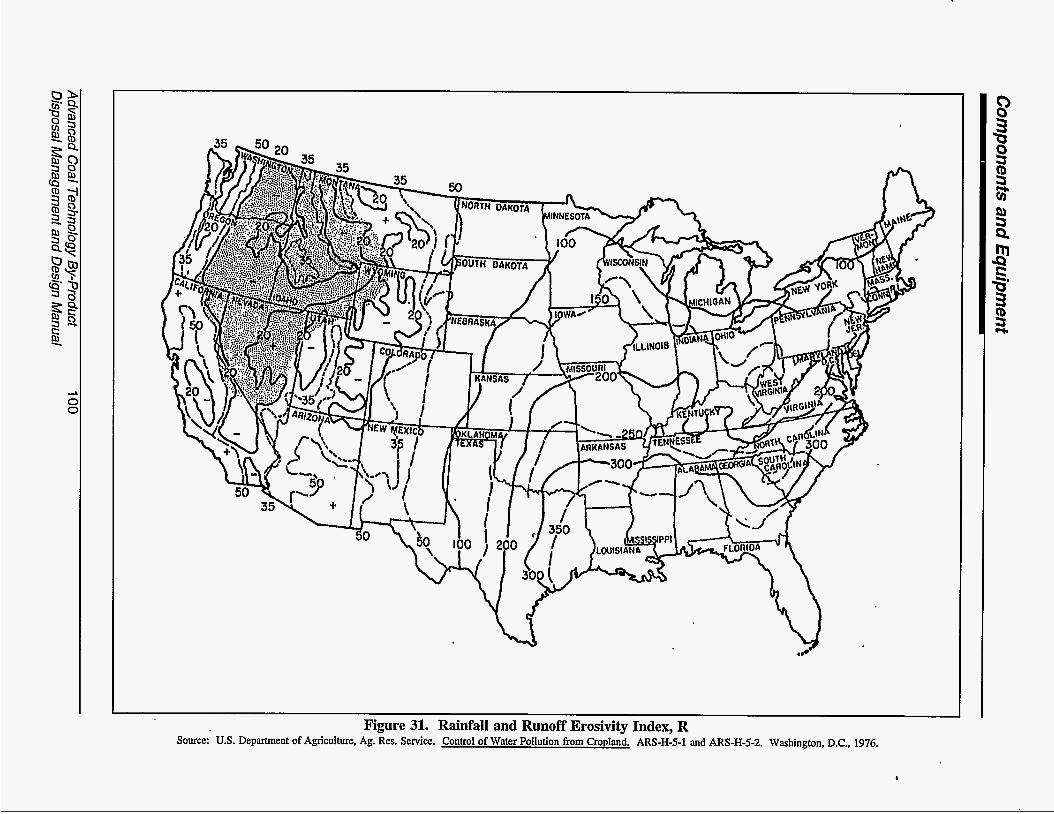
Figure 31. Rainfall and Runoff Erosivity Index, R Source: U.S. Department of Agriculture, Ag. Res. Service. Control of Water Pollution from Cropland. ARS-H-5-1 and ARS-H-5-2. Washington, D.C., 1976.

Components and Equipment
Texture Class Sand Fine Sand Very Fine Sand
Loamy Sand Loamy Fine Sand Loamy Very Fine Sand
Organic Matter Content < O S % 2% 4%
K K K 0.05 0.03 0.02 0.16 0.14 0.10 0.42 0.36 0.28
0.12 0.10 0.08 0.24 0.20 0.16 0.44 0.38 0.30
Sandy Loam Fine Sandy Loam Very Fine Sandy Loam
0.27 0.24 0.19 0.35 0.30 0.24 0.47 0.41 0.33
' The values shown are estimated averages of broad ranges of specific-soil values. When a texture is near the borderline of two texture classes, use the average of the two K values. Source: U.S. Department of Agriculture, Ag. Res. Service. Control of Water Pollution from Cropland. ARS-H-5-1 and ARS-H-5-2. Washington, D.C., 1976.
Loam Silt Loam Silt Sandy Clay Loam Clay Loam
Sandy Clay Silty Clay
Silty Clay Loam
Clay
Table 25 Factor C for Permanent Pasture, Range, and Idle Land'
height of 20 inches
0.38 0.32 0.29 0.48 0.42 0.33 0.60 0.52 0.42 0.27 0.25 0.21 0.28 0.25 0.21 0.37 0.32 0.26 0.14 0.13 0.12 0.25 0.23 0.19
0-13 - 0.29
Source: United States Department of Agriculture, Agriculture Handbook Number 537 'The listed C values assume that the vegetation and mulch are randomly distributed over the entire area *Canopy height is measured as the average fall height of water drips falling fiom the canopy to the ground. Canopy effect is inversely proportional to drop fall height and is negligible if fall height exceeds 33 feet. 'Portions of total-area surface that would be hidden from view by canopy in a vertical projection (a bird's-eye view).
101 Advanced Coal Technology By-product Disposal Management and Design Manual
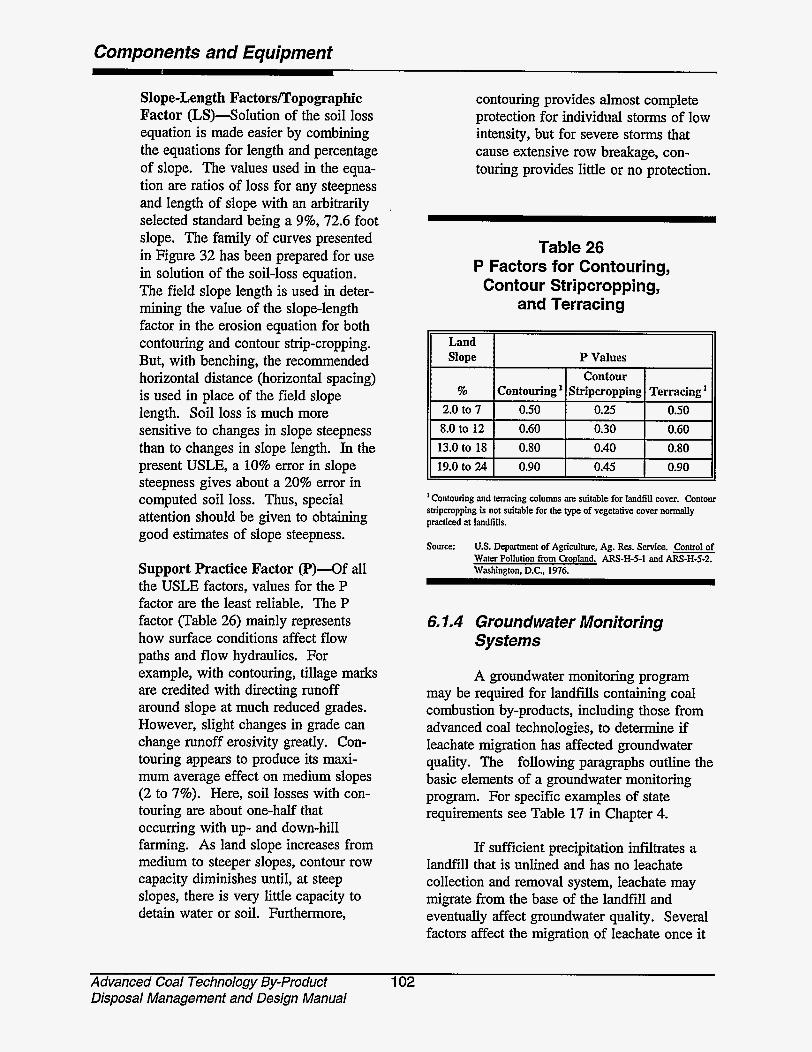
Components and Equipment
Slope-Length Factors/Topographic Factor (LS)-Solution of the soil loss equation is made easier by combining the equations for length and percentage of slope. The values used in the equa- tion are ratios of loss for any steepness and length of slope with an arbitrarily selected standard being a 9%, 72.6 foot slope. The family of curves presented in Figure 32 has been prepared for use in solution of the soil-loss equation. The field slope length is used in deter- mining the value of the slope-length factor in the erosion equation for both contouring and contour strip-cropping. But, with benching, the recommended horizontal distance (horizontal spacing) is used in place of the field slope length. Soil loss is much more sensitive to changes in slope steepness than to changes in slope length. In the present USLE, a 10% error in slope steepness gives about a 20% error in computed soil loss. Thus, special attention should be given to obtaining good estimates of slope steepness.
Support Practice Factor @)-Of all the USLE factors, values for the P factor are the least reliable. The P factor (Table 26) mainly represents how surface conditions affect flow paths and flow hydraulics. For example, with contouring, tillage marks are credited with directing runoff around slope at much reduced grades. However, slight changes in grade can change runoff erosivity greatly. Con- touring appears to produce its maxi- mum average effect on medium slopes (2 to 7%). Here, soil losses with con- touring are about one-half that occurring with up- and down-hill farming. As land slope increases from medium to steeper slopes, contour row capacity diminishes until, at steep slopes, there is very little capacity to detain water or soil. Furthermore,
contouring provides almost complete protection for individual storms of low intensity, but for severe storms that cause extensive row breakage, con- touring provides little or no protection.
Table 26 P Factors for Contouring,
Contour Stripcropping, and Terracing
' Contouring and tenacing columns are suitable for landfill cover. Contour stripcropping is not suitable for the type of vegetative cover normally practiced at landfills.
Source: US. Department of Agriculture, Ag. Res. Service. Control of Water Pollution from Cropland. ARS-H-5-1 and AM-H-5-2. Washington. D.C.. 1976.
6.1.4 Groundwater Moniforing Systems
A groundwater monitoring program may be required for landfills containing coal combustion by-products, including those from advanced coal technologies, to determine if leachate migration has affected groundwater quality. The following paragraphs outline the basic elements of a groundwater monitoring program. For specific examples of state requirements see Table 17 in Chapter 4.
If sufficient precipitation infiltrates a landfiil that is unlined and has no leachate collection and removal system, leachate may migrate from the base of the landfill and eventually affect groundwater quality. Several factors affect the migration of leachate once it
Advanced Coal Technology By-product 102 Disposal Management and Design Manual

TOPOGRAPHIC FACTOR -LS
P 0
07 0
-P 0 0
c3) 0 0
Y 0
juawd!nbg pue sjuauodwo2

Componenfs and Equipment
leaves the base of the landfill. If the landfill is situated so that its base is above the water table, the leachate must migrate through the vadose (unsaturated) zone before it can affect groundwater quality. In the vadose zone, the movement of the leachate is driven by gravity and capillary action. Clays, organic matter, and oxides and hydroxides of iron and manganese may attenuate certain chemical species in the leachate. Other species are unlikely to attenuate and continue to migrate with the leachate front. Upon hitting the saturated zone, the leachate is physically transported by the groundwater flow. Attenuation on soil particles may continue to take place. Dispersion, or the movement of solutes from an area of high concentration to areas of low concentration, also affects the movement of leachate components in groundwater. Generally, leachate constituents from an above-ground landfill will be concentrated at the top of the uppermost aquifer. A properly planned and implemented groundwater monitoring program can allow the utility operator to track the movement of landfill leachate and provide input to predictive models. Figure 33 shows a schematic diagram of the leachate migration process and a typical monitoring system.
Groundwater Flow Direction and Rate
The first step to implementing a groundwater monitoring program is to determine the depth to groundwater and the horizontal component of flow. This is necessary to predict the path of potential leachate migration. A general idea of the direction of groundwater flow, or hydraulic gradient, can be obtained by observing the site topography, aerial photographs, and topographic maps. However, small-scale topographic features and subsurface geology, such as fractures or abandoned stream channels, can have a major affect on the direction of flow on a local scale. It is more accurate to use direct observation of water levels in observation wells or piezometers to
calculate the hydraulic gradient. For this approach, a minimum of three wells or piezometers are necessary to define flow. After determining the static water level in each well, the water levels are contoured to define the potentiometric surface. The horizontal hydraulic gradient is perpendicular to the contours that define this surface. Figure 34 shows schematically the relationship between measured water levels, the piezometric surface, and groundwater flow. Determinations of horizontal hydraulic gradient should be made at different times throughout the year to determine if there are seasonal affects on groundwater flow.
Groundwater may also have a vertical component of flow. A cluster of observation wells or piezometers, screened at different depths, can be used to determine the vertical hydraulic gradient. These wells can be installed in separate-but closely spaced-borings, or multiple wells can be installed in one boring.
After determining the direction of groundwater flow, it may be desirable to also calculate a flow rate for use in groundwater flow or leachate migration models. Darcy's Law defines the velocity of groundwater flow, or specific discharge, by the following equation:
where: v = velocity of groundwater flow in units of length/time e/"); and hydraulic gradient (LL, or unitless).
K = hydraulic conductivity (LIT);
i =
By convention, the hydraulic gradient, or change in hydraulic head over change in distance, is negative, so the specific discharge is a positive value.
Hydraulic conductivity, sometimes referred to as the coefficient of permeability,
Advanced Coal Technology By-product 104 Disposal Management and Design Manual
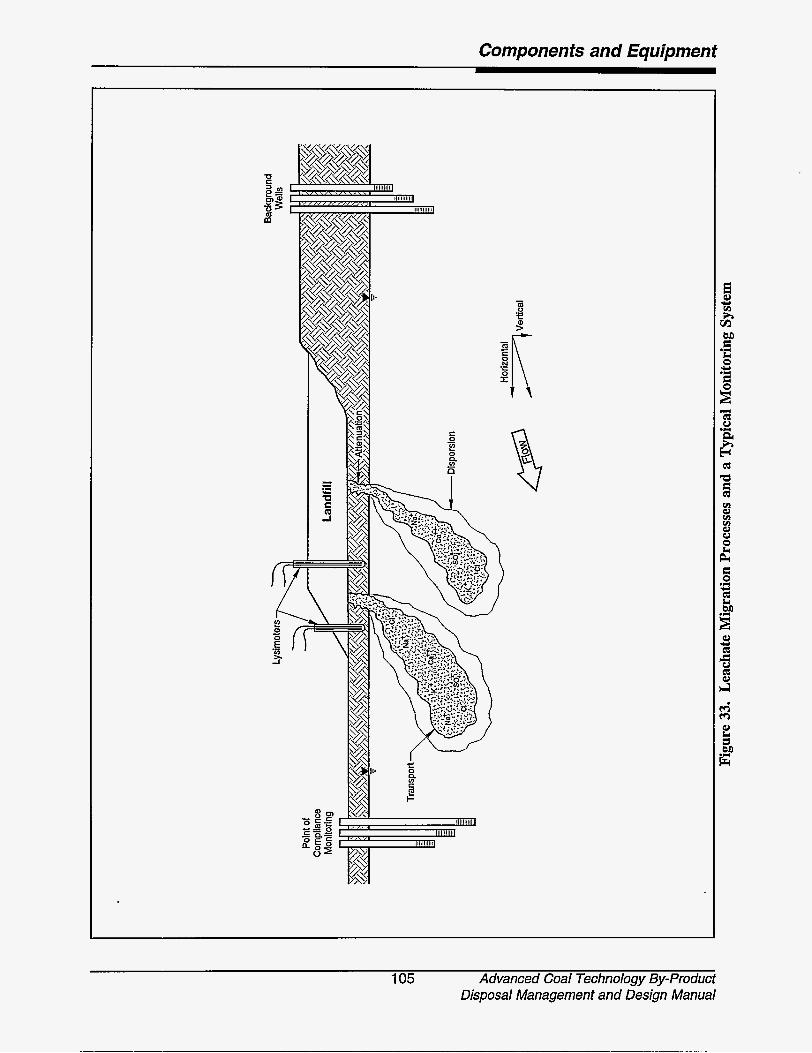
Components and Equipment
105 Advanced Coal Technology By-product Disposal Management and Design Manual

Components and Equipment
Contour
Direction of Gradient
Well C Plan View 220 fi. msl No Scale
B msl
Well A ,-Ground Surface
Profile Change in Piezometric Head - Ah Distance AI I (Hydraulic Gradient) = - - = 0.0167
Not to Scale
Figure 34. Typical Plan for Determining Magnitude and Direction of the Hydraulic Gradient
Advanced Coal Technology By-product 106 Disposal Management and Design Manual
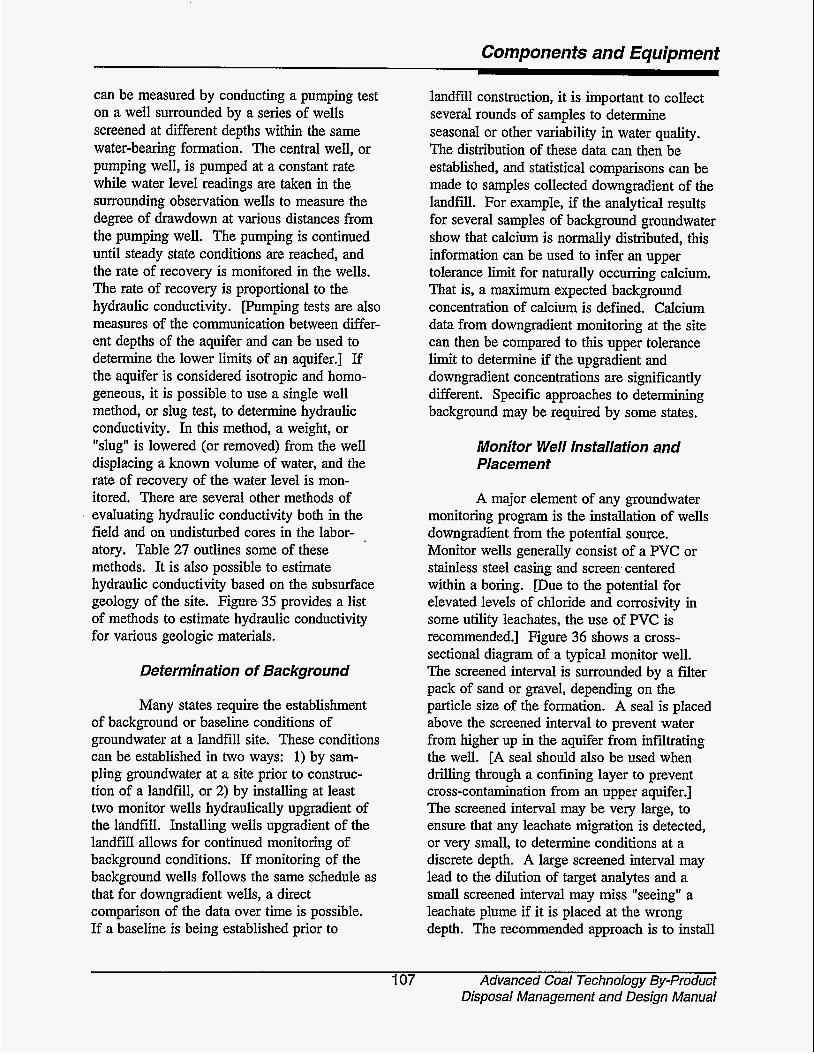
Components and Equipment
can be measured by conducting a pumping test on a well surrounded by a series of wells screened at different depths within the same water-bearing formation. The central well, or pumping well, is pumped at a constant rate while water level readings are taken in the surrounding observation wells to measure the degree of drawdown at various distances from the pumping well. The pumping is continued until steady state conditions are reached, and the rate of recovery is monitored in the wells. The rate of recovery is proportional to the hydraulic conductivity. [Pumping tests are also measures of the communication between differ- ent depths of the aquifer and can be used to determine the lower limits of an aquifer.] If the aquifer is considered isotropic and homo- geneous, it is possible to use a single well method, or slug test, to determine hydraulic conductivity. In this method, a weight, or "slug" is lowered (or removed) from the well displacing a known volume of water, and the rate of recovery of the water level is mon- itored. There are several other methods of evaluating hydraulic conductivity both in the field and on undisturbed cores in the labor- atory. Table 27 outlines some of these methods. It is also possible to estimate hydraulic conductivity based on the subsurface geology of the site. Figure 35 provides a list of methods to estimate hydraulic conductivity for various geologic materials.
Determination of Background
Many states require the establishment of background or baseline conditions of groundwater at a landfill site. These conditions can be established in two ways: 1) by Sam- pling groundwater at a site prior to construc- tion of a landfill, or 2) by installing at least two monitor wells hydraulically upgradient of the landfill. Installing wells upgradient of the landfill allows for continued monitoring of background conditions. If monitoring of the background wells follows the same schedule as that for downgradient wells, a direct comparison of the data over time is possible. If a baseline is being established prior to
landfill construction, it is important to collect several rounds of samples to determine seasonal or other variability in water quality. The distribution of these data can then be established, and statistical comparisons can be made to samples collected downgradient of the landfill. For example, if the analytical results for several samples of background groundwater show that calcium is normally distributed, this information can be used to infer an upper tolerance limit for naturally occurring calcium. That is, a maximum expected background concentration of calcium is defined. Calcium data from downgradient monitoring at the site can then be compared to this upper tolerance limit to determine if the upgradient and downgradient concentrations are significantly different. Specific approaches to determining background may be required by some states.
Monitor Well Installation and Placement
A major element of any groundwater monitoring program is the installation of wells downgradient from the potential source. Monitor wells generally consist of a PVC or stainless steel casing and screen centered within a boring. [Due to the potential for elevated levels of chloride and corrosivity in some utility leachates, the use of PVC is recommended.] Figure 36 shows a cross- sectional diagram of a typical monitor well. The screened interval is surrounded by a filter pack of sand or gravel, depending on the particle size of the formation. A seal is placed above the screened interval to prevent water from higher up in the aquifer from infiltrating the well. [A seal should also be used when drilling through a confining layer to prevent cross-contamination from an upper aquifer.] The screened interval may be very large, to ensure that any leachate migration is detected, or very small, to determine conditions at a discrete depth. A large screened interval may lead to the dilution of target analytes and a small screened interval may m i s s "seeing" a leachate plume if it is placed at the wrong depth. The recommended approach is to install
107 Advanced Coal Technology By-product Disposal Management and Design Manual

Componenfs and Equipment
Slug Test
Pumping Test
Table 27 Summary of Methods to Measure Hydraulic Conductivity Values
in the Field and Laboratory
Confined aquifers with fully-penetrating wells screened along the entire aquifer Hvorslev, 1951 thickness. Singlewell test for wells not intended for sampling. Bouwer and Rice,
1976 Lohman, 1972 Bureau of Complex multiple-well test’ for confined or unconfined aquifers with fully or
Laboratory method to determine sample hydraulic conductivity within a range from 1.0 cdsec to 10” cdsec.
partially penetrating wells. Used for wide range of aquifer permeabilities. Test wells can be used for sampling. Tests a relatively large volume of the aquifer.
~~ ~ ~
Laboratory method to determine sample hydraulic conductivity within a range from 10” cdsec to io” cdsec.
Unsaturated
Borehole Infiltration
Guelph Permeameter
Klute and Dirksen, 1986
Air-Entry Permeameter ll Instantaneous Profile
Crust-Imposed
Sprinkler- Imposed
Parameter Identification
Empirical Equations
Field method in open or partially cased borehole. Most commonly used method. Includes a relatively large volume of porous media in test.
Field method in open, small-diameter borehole (>5 sm). Relatively fast method (5 to 60 minutes) requiring small volume of water. K,, K(yr) and sorptivity are measured simultaneously. Many boreholes and tests may be required to fully represent heterogeneities of porous media. Field method. Test performed in cylinder which is driven into porous media. Small volume of material tested, hence, many tests may be needed. Fast, simple method requiring little water (10 L). Field or lab method. Field method measures vertical K(8, yr) during drainage. Measurement of moisture content and hydraulic head needs to be rapid and non destructive to sample. Commonly used method and reasonably accurate.
Field method. Measure vertical K(yr) during wetting portion of hysteresis loop. Labor and time intensive. Field method. Larger sample area than for crust method. Useful only for relatively high moisture contents.
Results of one field or lab test are used by a numerical approximation method to develop K(8), K(yr), and yr (8) over a wide range of 8 and yr. Relatively fast method, however, unique solutions are usually not attainable. Each empirical equation has its own application based upon the assumptions of the equation. Relatively fast technique.
Bouwer, 1978 Stephens and Neuman, 1982a, b, c, Amoozegar and Wafrick, 1986 Reynolds and Elrick, 1986
Bouwer, 1966
Bouma, Baker, and Veneman, 1974 Klute and Dirksen, 1986 Green, Ahuja, and Chong, 1986 Green, Ahuja and Chong, 1986
Zachmann et al., 1981a, 1981b, 1982 Kool et al., 1985 Brooks-Corey, 1964 Van Genuchten, 1980 Mualem, 1986
Advanced Coal Technology By-product 108 Disposal Management and Design Manual

Componenis and Equipment
Table 27 (Continued)
Source: Electric Power Research Institute. EPRI EN-6637. Techniques to Develop Data for Hydrogeochemical Models. Palo Alto, California, 1989.
References: Amoozegar, A. and A.W. Warrick. "Hydraulic Conductivity of Saturated Soils: Field Methods." In A. Klute (4.) Methods of Soil Analysis, Part 1. Madison, WI: Soil Science Society of America, Agronomy Monograph No. 9 (2nd ed.). 1986, pp. 799-824.
Bouma, J., F.G. Baker, and P.L.M. Veneman. "Measurement of Water Movement in Soil Pedons Above the Water Table." University of Wisconsin, Extension Geological and Natural History Survey, Information Circular No. 27, 1974.
Bouwer, H., "Rapid Field Measurement Air Entry Value and Hydraulic Conductivity of Soil as Significant Parameters in Flow System Analysis." Water Resources Research 2279-738, 1966.
Bouwer. H., Groundwater Hydrology. New York, N.Y.: McGraw, Inc.. 1978.
Bouwer, H., and R.C. Rice. "A Slug Test for Determiniig Hydraulic Conductivity of Unconfined Aquifers with Completely or Partially Penetrating Wells." Water Resources Research 12(3):423-428, 1976.
Brooks, R.H., and A.T. Corey. "Hydraulic Properties of Porous Media" Fort Collins, C O Colorado State University, Hydrology Paper 3, 1964.
Bureau of Reclamation. Groundwater Manual, a Water Resources Technical Publication. Washington, D.C.: Bureau of Recl'amation, US. Government Printing Office, 1977.
Driscoll, F.G. Groundwater and Wells. Second Edition. St. Paul, MN: Johnson Division, 1986.
Green, R.E., L.R. Ahuja, and S.K. Chong. "Hydraulic Conductivity, Diffusitivty, and Sorptivity of Unsaturated Soils - Field Methods." In A. Klute (ed.) methods of Soil Analysis. Part 1. Madison, WI: Soil Science Society of America, Agronomy Monograph No. 9 (2nd ed.), 1986, pp. 771-798.
Hvorslev, J.V. "Time Lag and Soil Permeability in Ground Water Observations." Vicksburg, MS: U.S. Army Corps of Engineers, Waterways Experiment Station Bulletin No. 36, 1951.
Klute, A., and C. Dirksen. "Hydraulic Conductivity and Diffusivity: Laboratory Methods." In A. Klute (ed.) Methods of Soil Analysis, Part 1. Madison, WI: Soil Science Society of America, Agronomy Monograph No. 9 (2nd ed.), 1986, pp. 687-734.
Kool, J.B., J.C. Parker, and M.T. Van Genuchten. "Determining Soil Hydraulic Properties from One-Step Outflow Experiments by Parameter Estimation: I. Theory and Numerical Studies." Soil Sic. SOC. Am. J. 49:1348-1354. 1985.
Lohman, S.W. "Groundwater Hydraulics." U.S. Geological Survey Professional Paper 708. Washington, D C US. Government Printing Office, 1972 (reprinted in 1975 and 1979).
Mualem, Y. "A New Model for Predicting the Hydraulic Conductivity of Unsaturated Porous Media" Water Resow. Res.
Reynolds, W.D., and D.E. Elrick. "A Method for Simultaneous In Situ Measurement in the Vadose Zone of Field Saturated Hydraulic Conductivity, Sorptivity and the Conductivity-Pressure Head Relationship." Ground Water Monitoring Review 6(1):86- 95, 1986.
12593-622, 1976.
Stephens, D.B.. and S.P. Neuman. "Vadose Zone Permeability Tests: Summary." J. Hydraulics Div. ASCE 198(HY5):623-639, 19823.
Stephens, D.B., and S.P. Neuman. "Vadose Zone Permeability: Steady State Results." J. Hydraulics Div. ASCE 198(HY5):640- 659. 1982b.
Stephens, D.B., and S.P. Neuman. "Vadose Zone Permeability: Unsteady Flow." J. Hydraulics Div. ASCE 198(HY5):660-677, 1982c.
Van Genuchten, M.T. "A Closed Form Equation for Predicting the Hydraulic Conductivity of Unsaturated Soils." Soil Sci. SOC. - Am. J. 44:892-989, 1980.
Zachmann, D.W., P.C. DuChateau, and A. Klute. "The Calibration of the Richards Flow Equation for a Draining Column by Parameter Identification." Soil Sci. SOC. Am. J. 451012-1015. 1981a
Zachmann, D.W.. P.C. DuChateau, and A. Klute. "The Estimation of Soil Hydraulic Properties from Inflow Data." In V. Singh (ed.) Proc. of the Symposium on Rainfall-Runoff Modeling. Littleton, Co: Mississippi State University Resources Pub., 1981b,
Zachmann, D.W., P.C. DuChateau, and A. Klute. "Simultaneous Approximation of Water Capacity and Soil Conductivity by Parameter Identification." Soil Sci. 134157-163, 1982.
pp. 173-180.
109 Advanced Coal Technology By-product Disposal Management and Design Manual

-1 -1 C
K ft./day
cmlsec.
io5 io4 i o 3 io2 i o 1 I IO-' 10" 10" io4 IOP 10"
io3 io2 i o 1 I 10-l IO-^ 10-~ io4 IO-^ Idi I
karstic limestone and dolomite, vesicular basalt
sandstone, limestone and fractured igneous and
metamorphic rocks
shale and mudstone
massive igneous and metamorphic rocks
gravels
I I sands
silts
I clay
Figure 35. Representative Ranges of Saturated Hydraulic-Conductivity Values for Geologic Materials (Adapted from Freeze, R.A., and J.A. Cherry. Groundwater. Prentice-Hall, Inc., Englewood Cliffs, NJ, 1979.)
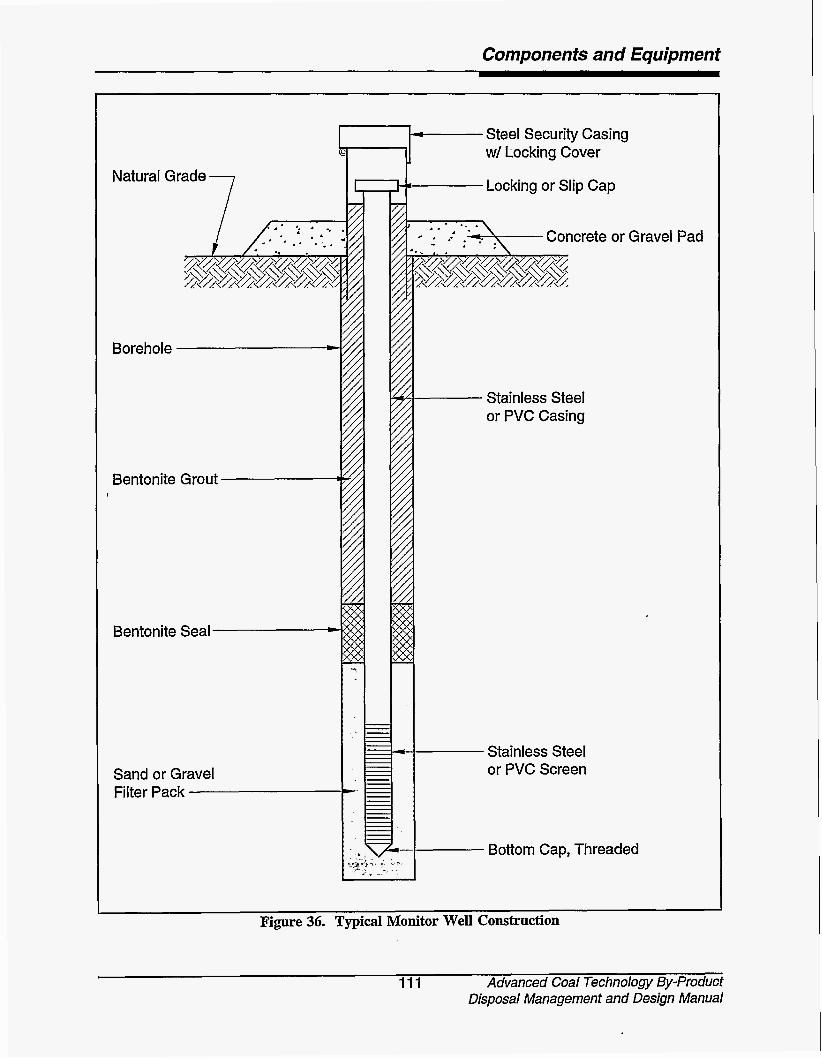
Components and Equipment
7 Natural Grade
Borehole -
Bentonite Grout I
Bentonite Seal -
Sand or Gravel Filter Pack
Steel Security Casing w/ Locking Cover
Locking or Slip Cap
Concrete or
Stainless Steel or PVC Casing
Gravel
Stainless Steel or PVC Screen
Bottom Cap, Threaded
Pad
Figure 36. Typical Monitor Well Construction
111 Advanced Coal Technology By-product Disposal Management and Design Manual
Components and Equipment
a cluster of monitor wells, each screened at a different discrete interval, especially if con- ditions of perched groundwater or strong vertical hydraulic gradients are anticipated.
The location and screened intervals of the monitor wells will be determined by the local hydrogeology, and by using horizontal and vertical gradients to predict the path of leachate migration. In general, the farthest downgradient well cluster should be placed at the point of compliance, or the downgradient property boundary. Additional clusters of monitor wells may be placed upgradient of the point of compliance as an "early warning system." Figure 33, previously presented, shows a potential placement scheme for monitor wells at a landfill site.
The Monitoring Program
Several states have regulations that dictate the frequency of groundwater moni- toring and the analytical methods for landfill sites. Table 17 in Chapter 4 gives examples of the monitoring frequency and minimum analyte list required by some states. The Toxicity Characteristic Leaching Procedure (TCLP) @PA Method 1311) may be required to esti- mate the composition of leachate from a spec- ific advanced coal technology by-product and to determine its regulatory status. This method involves the leaching of a solid for 18 hours using a weak acid solution in a ratio of 1:20 so1id:liquid. The leachate is then analyzed for a variety of organic compounds and inorganic elements, using EPA SW846 methods.
Chapter 3 provides a discussion of the solid and leachate compositions of several types of advanced coal technology by-products, and may be helpful in putting together a list of potential analytes to be monitored if one is not dictated by state regulations. Much informa- tion can be gained from monitoring for a few water quality parameters, such as pH (EPA method SW9040), total dissolved solids (TDS) (EPA 160.1), and alkalinity (SM 403). In general, the major elements that occur in
leachates from advanced coal process by- products are dictated by the sorbent. For example, if a calcium-based sorbent such as lime or limestone is used, calcium will dominate the major element chemistry of the by-product. Sulfate, the result of SO removal, is almost always present in advanced coal technology by-products in high concen- trations. Trace metals, whose concentrations are usually dictated by the composition of the fuel source, also need to be monitored in most states. The eight RCRA elements that are generally monitored are arsenic, barium, cadmium, chromium, lead, mercury, selenium, and silver. Monitoring for some of these species may be waived if the by-products can be demonstrated to contain negligible concen- trations of these elements.
Pore water Monitoring
In addition to groundwater monitoring, it may be advantageous to monitor potential leachate migration through the vadose zone. The installation of lysimeters at the base of the landfill will allow the monitoring of leachate from the earliest point of generation, and pro- vide input for leachate migration models. If no leachate collection system is installed, this may be accomplished with a porous cup or pan lysimeter. Pan lysimeters must be installed during landfill construction, whereas porous cup lysimeters may be installed at any time. However, pan lysimeters monitor a larger area and are generally more reliable. Figures 37 and 38 are schematic diagrams of these types of lysimeters.
6.1.5 Miscellaneous Support Facilities
There are several support facilities that are needed at any disposal facility and it is im- portant not to overlook these facilities during the planning or design phase. These facilities are discussed in the following subsections.
Advanced Coal Technology By-product 112 Disposal Management and Design Manual

Components and Equipment
Leachate Collection Line \
Cover Soil
/- PressureNacuum Line
4 Stopper
- Riser
' Ash Material
' Ash Backfill
Bentonite Seal
Undisturbed Soil
Natural Soil Backfill
Porous Cup
I Figure 37. Porous-Cup Lysimeter Design
113 Advanced Coal Technology By-product Disposal Management and Design Manual
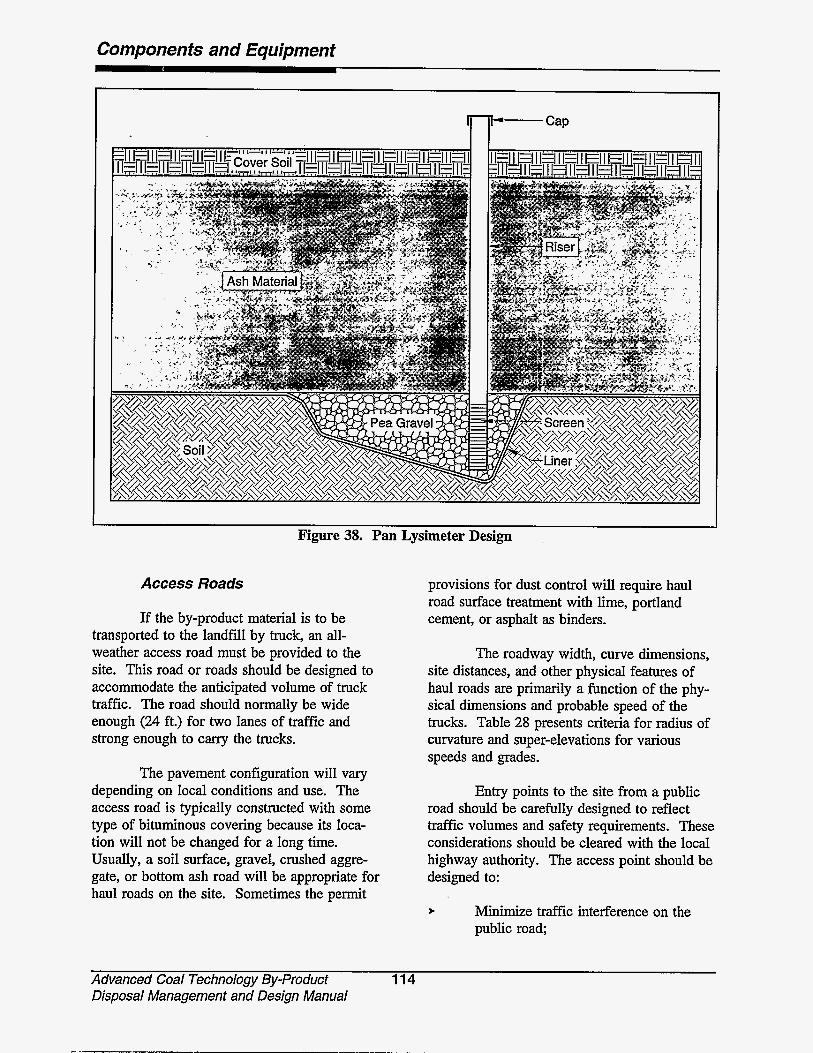
Components and Equipmenf
Figure 38. Pan Lysimeter Design
Access Roads
If the by-product material is to be transported to the landfill by truck, an all- weather access road must be provided to the site. This road or roads should be designed to accommodate the anticipated volume of truck traffic. The road should normally be wide enough (24 ft.) for two lanes of traffic and strong enough to carry the trucks.
The pavement configuration will vary depending on local conditions and use. The access road is typically constructed with some type of bituminous covering because its loca- tion will not be changed for a long time. Usually, a soil surface, gravel, crushed aggre- gate, or bottom ash road will be appropriate for haul roads on the site. Sometimes the permit
provisions for dust control will require haul road surface treatment with lime, portland cement, or asphalt as binders.
The roadway width, curve dimensions, site distances, and other physical features of haul roads are primarily a function of the phy- sical dimensions and probable speed of the trucks. Table 28 presents criteria for radius of curvature and super-elevations for various speeds and grades.
Entry points to the site from a public road should be carefully designed to reflect traffic volumes and safety requirements. These considerations should be cleared with the local highway authority. The access point should be designed to:
t Minimize traffk interference on the public road;
Advanced Coal Technology By-product 114 Disposal Management and Design Manual
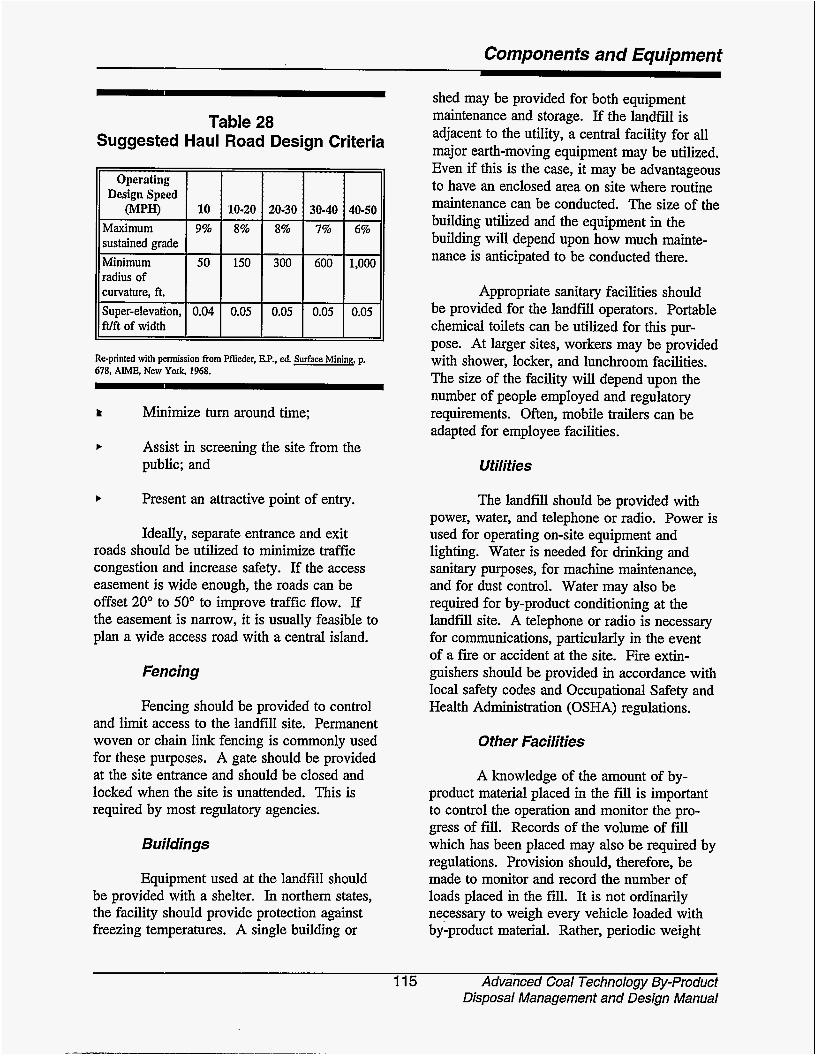
Components and Equipment
Table 28 Suggested Haul Road Design Criteria
Operating 11 Dez&p&eed Maximum
Minimum radius of
Super-elevation, ft/ft of width
Re-printed with permission from Pflieder, E.P., ed. Surface Mining, p. 678, AIME, New York, 1968.
Minimize turn around time;
F Assist in screening the site from the public; and
F Present an attractive point of entry.
Ideally, separate entrance and exit roads should be utilized to minimize traffic congestion and increase safety. If the access easement is wide enough, the roads can be offset 20" to 50" to improve traffic flow. If the easement is narrow, it is usually feasible to plan a wide access road with a central island.
Fencing
Fencing should be provided to control and limit access to the landfill site. Permanent woven or chain link fencing is commonly used for these purposes. A gate should be provided at the site entrance and should be closed and locked when the site is unattended. This is required by most regulatory agencies.
Buildings
Equipment used at the landfill should be provided with a shelter. In northern states, the facility should provide protection against freezing temperatures. A single building or
shed may be provided for both equipment maintenance and storage. If the landfill is adjacent to the utility, a central facility for all major earth-moving equipment may be utilized. Even if this is the case, it may be advantageous to have an enclosed area on site where routine maintenance can be conducted. The size of the building utilhed and the equipment in the building will depend upon how much mainte- nance is anticipated to be conducted there.
Appropriate sanitary facilities should be provided for the landfill operators. Portable chemical toilets can be utilized for this pur- pose. At larger sites, workers may be provided with shower, locker, and lunchroom facilities. The size of the facility will depend upon the number of people employed and regulatory requirements. Often, mobile trailers can be adapted for employee facilities.
Utilities
The landfill should be provided with power, water, and telephone or radio. Power is used for operating on-site equipment and lighting. Water is needed for drinking and sanitary purposes, for machine maintenance, and for dust control. Water may also be required for by-product conditioning at the landfill site. A telephone or radio is necessary for communications, particularly in the event of a fire or accident at the site. Fire extin- guishers should be provided in accordance with local safety codes and Occupational Safety and Health Administration (OSHA) regulations.
Other Facilities
A knowledge of the amount of by- product material placed in the fill is important to control the operation and monitor the pro- gress of fill. Records of the volume of fill which has been placed may also be required by regulations. Provision should, therefore, be made to monitor and record the number of loads placed in the fa. It is not ordinarily necessary to weigh every vehicle loaded with by-product material. Rather, periodic weight
115 Advanced Coal Technology By-product Disposal Management and Design Manual

Components and Equipment
Storage at By-Product Generator
surveys will usually suffice to monitor by- product volume and density. Scales already available at the utility, such as those used for weighing coal vehicles, are often suitable. If these are not available, portable scales can be used periodically. The scales should be large enough to weigh the largest transport vehicle and simultaneously weigh all axles.
By-Product Transport to Disposal Site 6.2 Materials Handling and
Transport
The previous sections of this chapter have all dealt with disposal facility issues. Equally important both from an economic and a technical standpoint are material handing and transport issues. These issues, such as material storage at the generating plant and trans- portation to the disposal site, should not be overlooked during the site selection, design, or permitting phases of a disposal facility. Both of these issues are discussed in the following sections. The materials handling processes that will be presented in this section and in Section 6.3 are listed in Figure 39.
6.2. I By-Product Storage
After by-products from advanced coal technologies are produced, they are usually stored temporarily prior to transport to the disposal site. A typical storage facility consists of enclosed vessels called bins or silos. Silos can either be cylindrical or rectangular in shape; both types having a lower converging chamber referred to as a hopper (although some silos are flat bottomed) as shown in Figure 40. The cost of a silo depends upon capacity. For a silo compatible with pneumatic transfer systems (which includes a dust collector and loading pipes), the (1994) price can range from $10,000 (for 8,000 ft3) to $20,000 (for 12,000 ft ’). Factors that affect the design of a storage vessel are listed below:
t By-product flow properties (which may vary with moisture content, temperat- ure, compacting pressure, and storage time);
t
Material (By-product and Water) Storage at the Disposal Sie
Material Transferfrom Storage to Processing Equipment
Discussed in Sedion 6.3
Material Processing systems
I Transport of Processed Material I to Disposal Area
Figure 39. Material Handling Processes Flowchart
Vessel configuration (which includes the size and shape of the bin or silo);
Hopper geometry (which includes the size and shape of the hopper along with the side wall angle); and
Materials of construction.
Advanced Coal Technology By-product 116 Disposal Management and Design Manual
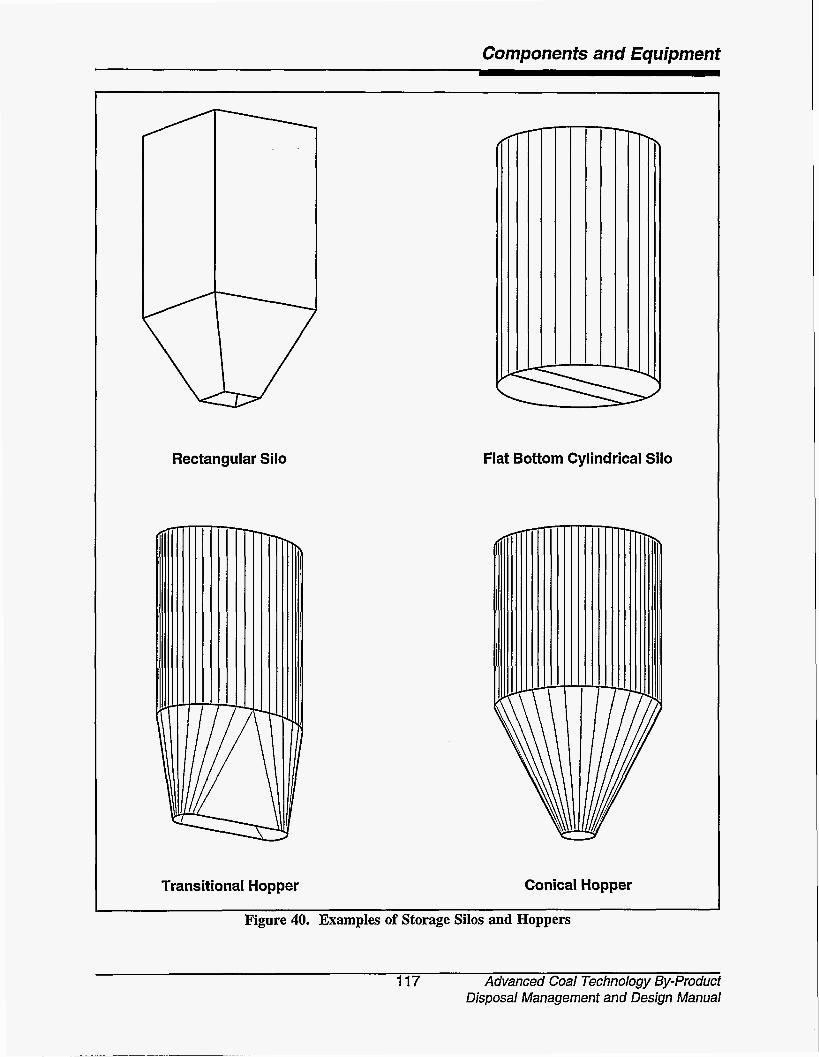
Components and Equipment
Rectangular Silo Flat Bottom Cylindrical Silo
\
U
Transitional Hopper Conical Hopper
Figure 40. Examples of Storage Silos and Hoppers
117 Advanced Coal Technology By-product Disposal Management and Design Manual
Components and Equipmenf
In order to determine the flow pro- perties of the by-product material, direct shear and controlled strain tests must be performed. From these tests, the following characteristics can be determined bulk density, effective angle of internal friction during flow, angle of internal friction during incipient flow, kinematic angle of wall friction, and uncon- fined yield strength. If these tests are conducted while taking into account the flow properties listed above, the results can be used to determine proper hopper geometry and outlet size for steady discharge from the storage vessel.
If the outlet is not properly sized, rat-holing and arching may occur. Rat-holing or piping occurs when a stable stagnant chan- nel forms above the outlet and prevents the complete discharge of material. This condition decreases the effective storage volume and contributes to erratic flow patterns. Arching occurs when a stable dome of material forms above the outlet, preventing additional material from discharging. This disrupts flow and, when the arch is broken, could possibly damage equipment due to the impact of the mass and associated high-air pressure ’.
To improve flow characteristics from the vessel, flow activators may be used. These include aeration devices and vibrators. Aera- tion devices, such as stones or pads, are placed within the hopper section of the vessel along the interior walls. When dry air flows through the device, the material adjacent to the wall is aerated making it more fluid; hence, flow char- acteristics are improved. Vibrators can be used in several ways such as on hopper extensions, discharge feeders, and hopper walls. In order to prevent the packing of solids, vibrators should be used cautiously and only when the obstruction that disrupts steady flow can be cleared. The vibrators should be operated only long enough to resume steady flow.
Another consideration for storage fac- ility design is capacity, which is a function of the rate of by-product production and rate of disposal. Using the maximum average peak by-product production rate, the facility should have the capacity to store all by-product produced during the longest possible period in which disposal operations cease (such as holiday weekends or during transportation equipment failure).
Because of potential exothermic hydra- tion reactions and self-hardening of some types of by-product material, moisture must be excluded while the by-products are stored. The storage vessel should maintain water-tight integrity during all anticipated weather conditions.
6.2.2 By-product Transportation Alternatives
The by-product material will need to be transported from the storage facility to the disposal site. Again, due to the self-hardening characteristics of some by-products, intrusion of moisture may cause fouling of transfer lines or may limit the effectiveness of the means of transportation (due to material caking on side- walls and floors). Therefore, pretreatment of by-product materials having self-hardening characteristics with water to reduce fugitive dust emissions during transportation is not recommended unless several engineering concerns have been addressed. The transport distance should be minimal if freshly conditioned by-product, which may set up during transport, is hauled in bulk containers. The transportation vehicle must be able to withstand the extreme temperatures which may result from the exothermic hydration reaction, and a means to wash down sidewalls, floors, etc., of the transportation vehicle should be available at the disposal site where off-loading occurs.
Transportation of the dry by-product to the disposal site may be accomplished by several means, the selection of which is
Advanced Coal Technology By-product 118 Disposal Management and Design Manual
Components and Equipment
dependent upon availability, distance to the site, and topography. The by-product production rate and particle size may also affect the choice of transport systems. Because capital and operating costs for the trans- portation system may be a substantial portion of the total waste management cost, consid- erable attention should be given to its selection and design. Potential transportation alter- natives are listed below.
t
t
t
t
t
Trucks such as dump or pneumatic (if conditioning with water occurs prior to transport, dump trucks are required);
Railroads;
Barges;
Belt conveyors (the by-products must be less than 300°F and dust suppression measures must be taken);
Pneumatic conveyors; and
Aerial trams (metal box cars attached to a supported haul cable).
Currently, the most common means of transporting by-products is by truck, which typically is the most flexible and practical alternative when considering the nature of landfill operations. Railroads, on the other hand, may be an economical alternative if haul distances are great and rail-haul routes are available. Likewise, barges may be feasible if haul distances are great (over 100 miles) and if the plant and disposal sites are located on navigable waterways. If, however, the distance to the disposal site is minimal, conveyors or trams may be feasible (provided that dust suppression measures are taken).
The three following figures show the relevant differences between the alternatives with regard to distance from plant to disposal site, by-product production rate, and particle size. Figure 41 provides general guidelines for selecting a transport mode based upon particle
size. It should be noted that due to the fine particle size of the by-products, transport modes that do not totally enclose the by- products during transport may cause a dusting problem. If the anticipated by-product flow rate is known, Figure 42 will assist in the selection of an appropriate transport system. Figure 43 provides general guidelines for selecting a transport mode relative to distance from generating station to disposal area. Specific site conditions may affect rates significantly. The distance serviceable by the various transport modes may also be affected by site conditions.
6.3 Material Processing at the Disposal Site
Material handling and processing at the disposal facility is another important item in achieving a technically and economically feasible by-product management plan. Several potential operational, human health, and environmental problems are associated with the storage, transfer, and processing of some types of by-product materials. Among these concerns are fugitive dust emissions, high initial temperature of the material, and temperature increases due to exothermic reac- tions. As noted in Chapter 3, some uncondi- tioned by-products contain high levels of caustic material, therefore, inhalation or dermal contact must be minimized. For these reasons, the design of material handling systems that l i t exposure to by-product material is critical.
The discussion of materials handling at the disposal site will be limited to dry disposal (dry in comparison to transporting the waste in slurry form). Handling and disposal of slurried (or wet) by-product material are discussed in Section 7.3. Even though the methods to handle this material are considered "dry," this type of by-product material is typically hydrated before disposal to improve the material's physical and chemical properties, as well as aid in placement and compaction of the material in the disposal facility. The procedures and equipment used in the storage,
119 Advanced Coal Technology By-product Disposal Management and Design Manual

Components and Equipment
I I I
Approximate Approximate Bed Material
Waste Particle Particle Size Range Size Range
A V \
Char and Fly Ash Waste
A /
1 Barge i j I I
1
I
I I
I
1
I
I I Aerial Tram I
1 I I 1 1 1 1 1 1 I 1 1 1 1 1 1 1 I 1 1 I
I
I I I
0.005 0.01 0.1 1.0 iiiil i 3 6 12 24
1 I 1 Belt Conveyor 1
- Millimeters
Particle Size
Note: The Lower limits shown for belt conveyors, barges, and aerial trams are applicable for dry material. The moisture content and bulk density of the material being conveyed will influence (lower) these lower limits.
Figure 41. Guidelines for Selecting a Transport Mode Based Upon Particle Size
Reprinted with permission from Electric Power Research Institute. EPRI CS-6053. Atmospheric Fluidized-Bed Combustion Waste Management Design Guidelines.
Advanced Coal Technology By-product 120 Disposal Management and Design Manual
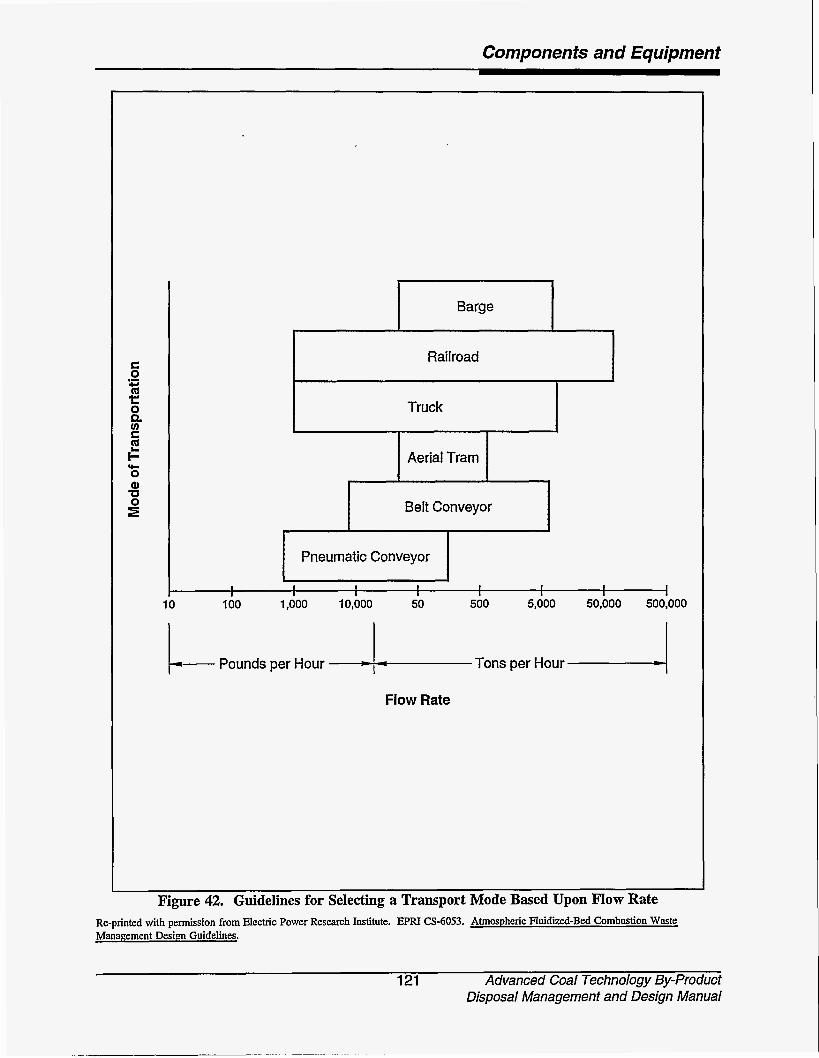
Components and Equipment
Barge
Railroad
Truck
Aerial Tram
Belt Conveyor
Pneumatic Conveyor
I I I 1 I 1 1 I I 1 1 I 1 1 I
100 1,000 10,000 50 500 5,000 50,000 500,000
Pounds per Hour
Flow Rate
Figure 42. Guidelines for Selecting a Transport Mode Based Upon Flow Rate Re-printed with permission from Electric Power Research Institute. EPRI CS-6053. Atmospheric Fluidized-Bed Combustion Waste Management Design Guidelines.
121 Advanced Coal Technology By-Product Disposal Management and Design Manual
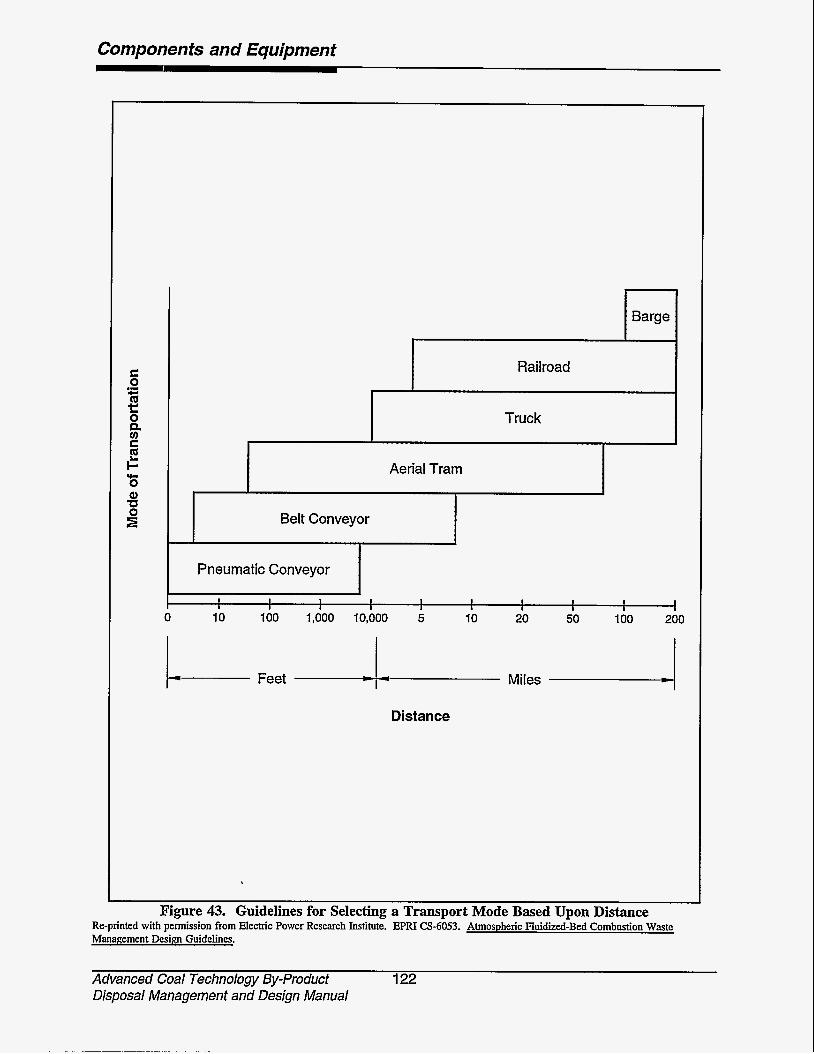
Components and Equipment
Barge
Railroad
Truck
Aerial Tram
Belt Conveyor
Pneumatic Conveyor
I I 1 I 1 1 1 I I I I 1 1 I 1 I I
- Feet -4- Miles -4 Distance
Figure 43. Guidelines for Selecting a Transport Mode Based Upon Distance Re-printed with permission from Electric Power Research Institute. EPRI CS-6053. Atmospheric Fluidized-Bed Combustion Waste Management Design Guidelines.
Advanced Coal Technology By-product 122 Disposal Management and Design Manual
Components and Equipment
transfer, and processing of by-product materials at the disposal facility are discussed in the following subsections. These processes are further illustrated in a discussion of the construction procedures employed at one of the test cells constructed in support of this design manual (Section 6.4).
t
b
6.3. I Sforage Equipmenf
Equipment necessary for the temporary storage of by-product materials and water at a disposal site (before being transferred to the processing equipment) are:
t
t
By-product silos (cylindrical or rectangular); and
Water tanks (if a water supply is not available at the site).
By-product Storage
Silos (see Figure 40, previously presented) used at the disposal site temporarily store the dry by-products which are transported from the generating plant. The by-product material is transferred, as needed, from the silos to the disposal-site processing (hydration) equipment. The costs and design considera- tions for these storage silos are similar to those discussed in Section 6.2.1. If, however, hydra- tion of the by-product material is to occur at the generating plant, storage silos at the disposal site are not necessary. This is an option only if the distance from the plant to the disposal site is minimal and the total residence time of hydrated by-products in the transport vehicles is less than the time it takes them to set into an adherent mass. In addition, a wash- down facility should be provided in order to remove residual hydrated by-products from the transport vehicle bed (which is usually un- necessary if the by-products are transported dry) *
The storage silos should have enough capacity to ensure continuous disposal opera- tions. Factors which effect capacity include:
Plant maximum average by-product production rate;
Disposal rate (taking into consideration the work week schedule and hours of operations); and
Rate and capacity of transportation (including down time for equipment failure and maintenance).
When determining the type and design of the storage silos, several factors should be addressed: ash flow properties, vessel configuration, hopper geometry, and materials of construction. As stated in Section 6.2.1, a direct shear and controlled strain test should be performed on the by-products in order to determine the characteristics which affect flow. If these tests are conducted while taking into account flow property variances of materials stored at the disposal site, the results can be used to determine proper hopper geometry and outlet size for steady discharge from the stor- age vessel. If, however, the hopper is ,improperly designed, rat-holing and arching may occur.
Also, consideration must be given to the prevention of moisture intrusion while the ash is stored. Due to exothermic hydration reactions and the self-hardening nature of most advanced coal technology by-product material, the storage vessel should maintain water-tight integrity during all anticipated weather conditions.
Water Storage
If a water supply is not available at the disposal site, water storage is necessary. Tank materials range from steel to plastic. The capacity of the water storage system depends on the same factors as by-product storage and, in addition, the percent of water by weight necessary to achieve the required hydration. The cost of a typical large covered steel storage tank depends upon capacity and can range from $42,000 for a 21,000-gallon tank to
123 Advanced Coal Technology By-product Disposal Management and Design Manual
Components and Equipment
$71,000 for a 126,000-gallon tank. For plastic tanks, prices can range from $1,200 for a 2,000-gallon tank to $12,000 for a 12,000- gallon tank.
6.3.2 Material Transfer Equipment
Transferring the stored by-product material from the storage silos to the process- ing equipment is accomplished using equipment consisting of both feeder and con- veyor components. These components are intimately related and typically are selected and designed as one subsystem. If the distance from the storage facility to the mixing system is minimal (such as may be the case at a disposal site), one component may serve as both the feeder and conveyor. If the mixing equipment is located directly underneath the storage vessel, only a feeder is necessary. This will control the rate in which material is delivered to the mixing equipment.
The transfer system should be sized on the basis of the by-product production rate, disposal rate, and mixing rate. Conveyors and feeders should be able to transfer, at a minimum, enough material to supply the mixing equipment while operating at peak capacity (which depends upon plant maximum by-product production rate and the operating schedule of the disposal site). Equipment selected should also be constructed of materials able to withstand the abrasive nature of the by- products.
Conveyors typically are the major components of the transfer subsystem and may be either pneumatic or mechanical. Descriptions of the conveying alternatives and feeders considered feasible for this type of material are summarized in the following subchapters. Approximate capital costs for the various alternatives based upon capacities are presented in Figure 44. This figure does not reflect operating costs, which may be significant.
Pneumatic Conveyors
Pneumatic conveyors transport dry, free-flowing, granular material in suspension within a pipe or duct by means of a high- velocity airstream (dilute phase transport) or by the energy of expanding compressed air within a comparatively dense column of fluidized or aerated material (dense phase transport). Another means uses compressed air to fluidize material residing on an inclined surface allow- ing gravity to influence transport. Capacities for the various types of pneumatic conveyors range from less than 100 pounds per hour to 200 tons per hour; the respective price range is between $12,000 and $300,000 per 50 ft of length.
Dilute Phase--This type of pneumatic conveying system uses large volumes of high velocity, low pressure (45 psig) air to trans- port solids. Within the transporting airstream, the solids to air ratio is low. This type of system can operate using negative pressure, positive pressure, or a combination of the two. Refer to Figure 45 for illustrations.
For the Negative Pressure System (vacuum), material is drawn into the conveying line (or material transport pipe), fluidized, and transported by a high-velocity airstream established by a vacuum pump (or exhauster) which is commonly a positive displacement or centrifugal blower. Upon reaching the fiial destination, the material is separated from the air and deposited into the storage vessel.
For the Positive Pressure System, a high velocity air stream is established in the conveying line by a blower. Material is withdrawn from a storage vessel by gravity, mechanical conveyors, or low air pressure (ie., blow tank), and delivered to an airlock feeder or outlet valve. From there, it is fed into the air stream and transported via pipeline to the discharge points, where it is separated from the transporting air.
Advanced Coal Technology By-product Disposal Management and Design Manual
1 24

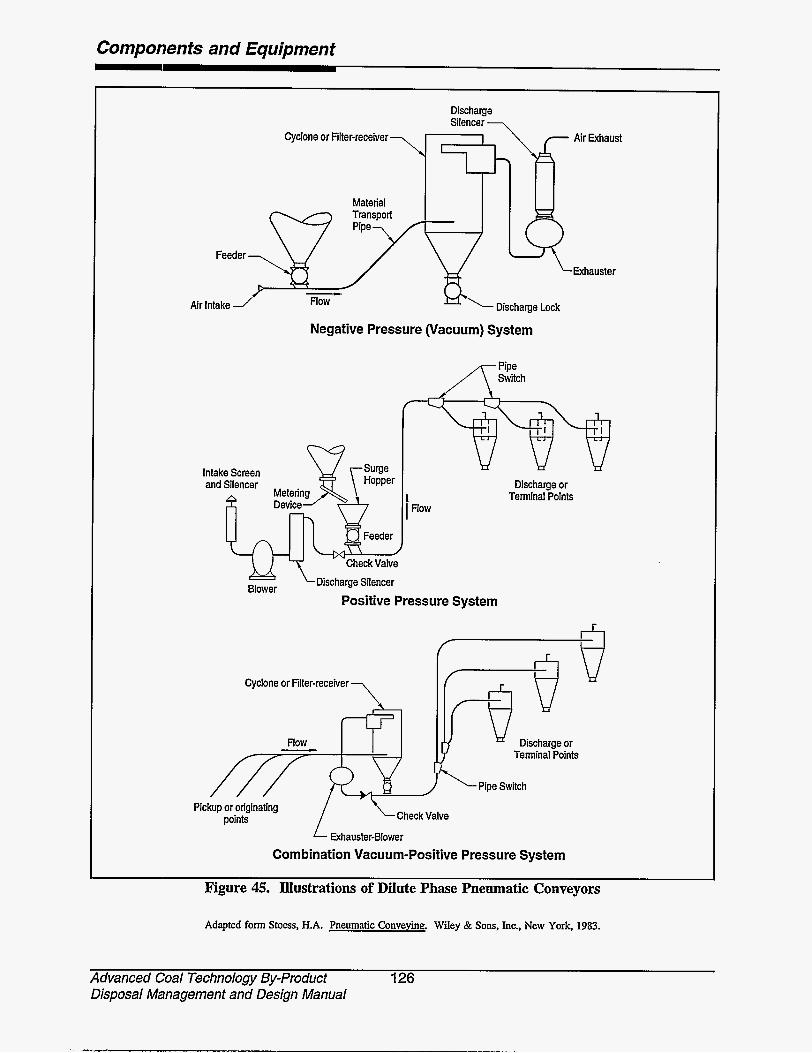
Components and Equipment
Feeder
\
Material
Discharge Si I en c e r
Air Exhaust Cyclone or Filter-receiver -., ,
- Air Intake Flow Discharge Lock
Negative Pressure (vacuum) System
k x h a u s t e r
Intake Screen and Silencer Hopper
Device
Feeder
Discharge or Terminal Points
b i s c h a r g e Silencer Blower Positive Pressure System
Cyclone or Filter-receiver
flow - .
Check Valve
Combination Vacuum-Positive Pressure System Exhauster-Blower
Pickup or originating points
Figure 45. Illustrations of Dilute Phase Pneumatic Conveyors
Adapted form Stoss, H.A. Pneumatic Conveying. Wiley & Sons, Inc., New York, 1983.
Advanced Coal Technology By-Product 126 Disposal Management and Design Manual

Components and Equipment
The Combination System (negative and positive pressure) draws material into the con- veying line via negative pressure (developed by an exhauster/blower) and deposited into a vessel such as a cyclone receiver. The air stream developed by the exhausterhlower is filtered and then used to pressurize a con- veying line which transports the material to the final discharge points. (A separate blower may be used to pressurize the line.)
Dense Phase-This type of pneumatic conveying system uses high pressure air (typi- cally >15 psig) to transport solids. Within the transporting airstream, the solids-to-air ratio is high. Two types of dense pfiase systems are the pulse phase system (or slug flow) and the air mixing system (which uses a fluid solids pump). Refer to Figure 46 for illustrations.
In the Pulse Phase System (slug flow), air is used to fluidize the material within a blow tank (which is located beneath the storage bin) and to pressurize that tank to assist in the discharge of the material. After the outlet valve is opened, the material is forced under pressure into the conveying line. An air knife regulates the material flow using pulses of air. This produces a series of cohesive masses separated by intervals of compressed air. The pressure between these masses (or slugs) is maintained by air jets in the line.
The Air Mixing System uses a fluid solids pump (also called a Fuller-Kinyon pump) equipped with a differential-pitch impeller screw which compresses the material prior to being introduced into a mixing cham- ber. There, the material is aerated by the introduction of compressed air. The fluidized material is then conveyed through the transport line by the continuing action of the impeller and the energy of the expanding air.
Air Activated Gravity Conveyor (Air Slide)-This type of conveying system uses an inclined channel which is equipped with an air- permeable porous material forming the bottom.
An air plenum under the porous material supplies air to the entire length. The channel is sloped; therefore, the material fluidized by the air flows under the influence of gravity. Refer to Figure 47.
Mechanical Conveyors
These types of conveyors use mechan- ical means (such as belts, screws, chains, vibrators, and buckets) to transport materials. Following is a description of some of the var- ious mechanical conveyors available including costs and capacities.
Belt Conveyor-An endless belt (in the form of a loop) travels on top of idlers/rollers arranged in a trough on the carrying side and flat on the returdbottom side. The driving unit moves one or more pulleys which, in turn, move the belt. Material is conveyed in the trough on the belt as shown in Figure 48. Capacities can range from 150 tons per hour to 640 tons per hour; the respec- tive costs per 50-€t length range from approx- imately $20,000 to $30,000.
Screw Conveyor-Metal flights, consisting of a long-pitch plate-steel helix mounted on a shaft or spindle, are carried in bearings within a U-shaped trough or pipe. As the flight rotates, the material fed to it is moved forward by the thrust of the lower part of the helix and is discharged through openings in the trougWpipe bottom or at the end. A diagram of a typical screw conveyor is shown in Figure 49. System costs for a 50-ft length can range from $9,000 (55 tons per hour) to $20,000 (250 tons per hour).
Chain Conveyor-A continuous heavy steel chain, which forms a loop, travels within an open or enclosed casing or trough, with the bottom side of the chain supported by the casinghough. The chain transmits pull from the driving unit. Bulk material may be carried directly on the chain, on special attachments fitted to the chain, or may be slid forward by the chain or attachments. Three types of chain
1 27 Advanced Coal Technology By-product Disposal Management and Design Manual
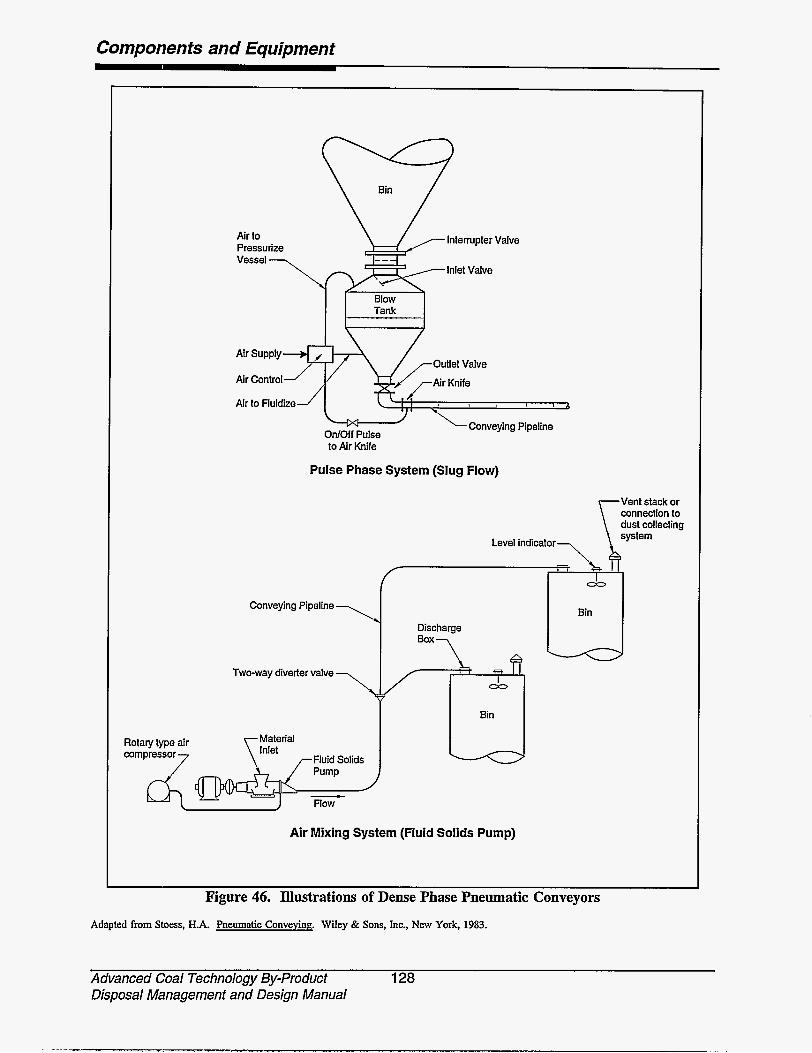
Components and Equipment
Air to Pressurize
to Air Knife
Pulse Phase System (Slug Flow)
Conveying Pipeline
Two-way diverter valve
Material Inlet
Pump
Flow __c
Air Mixing System (Fluid Sol ids Pump)
Rotary type air compressor 7
Figure 46. Illustrations of Dense Phase Pneumatic Conveyors
Adapted from Stoas, H.A. Pneumatic Conveying. Wiley & Sons, Inc., New York, 1983.
Advanced Coal Technology By-Product 128 Disposal Management and Design Manual
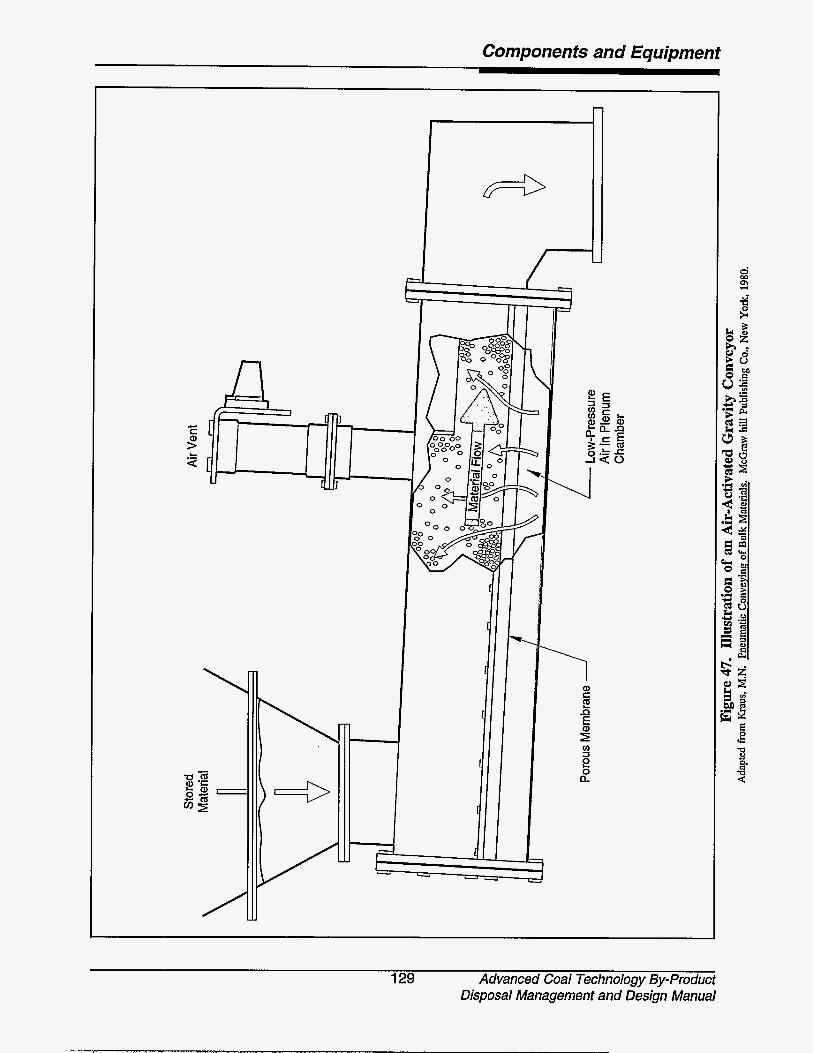
Components and Equipment
L .- a
L
129 Advanced Coal Technology By-product Disposal Management and Design Manual
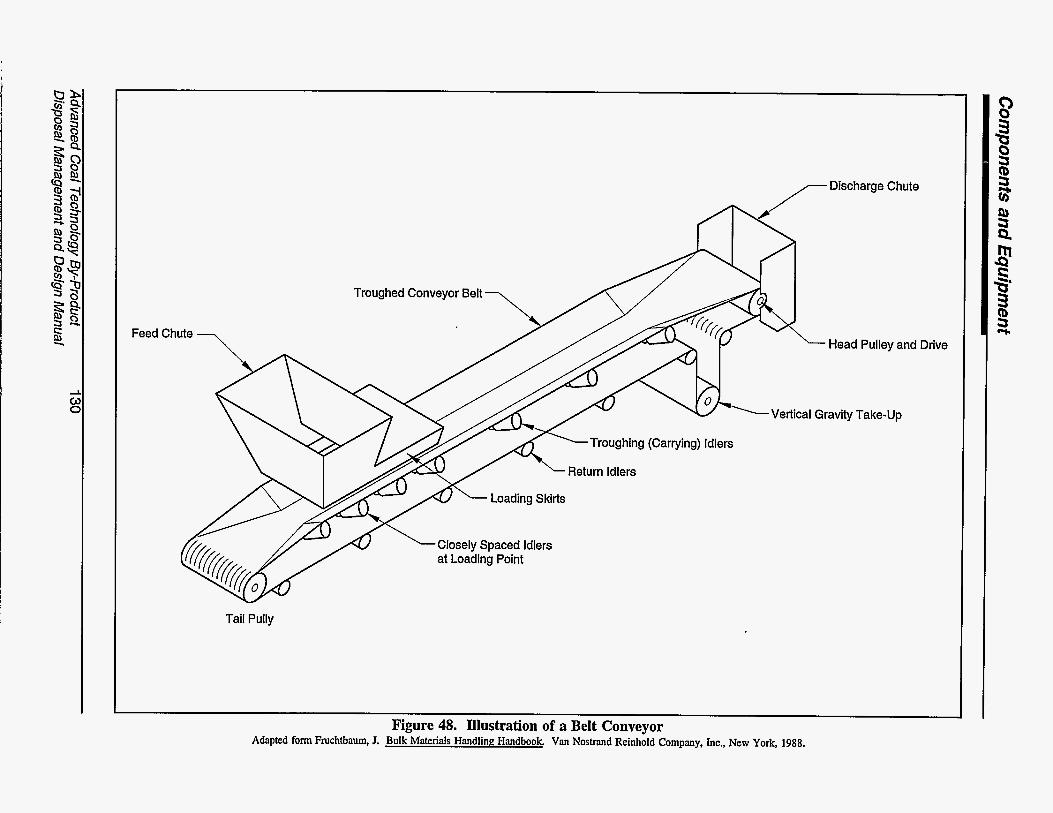
C C
Feed
Discharge Chute
Troughed Conveyor Belt
Head Pulley and
Vertical Gravity Take-up
Troughing (Carrying) Idlers
Drive
Tail Pully
Figure 48. Illustration of a Belt Conveyor Adapted form Fruchtbaum, J. Bulk Materials Handling Handbook. Van Nostrand Reinhold Company, Inc., New York, 1988.
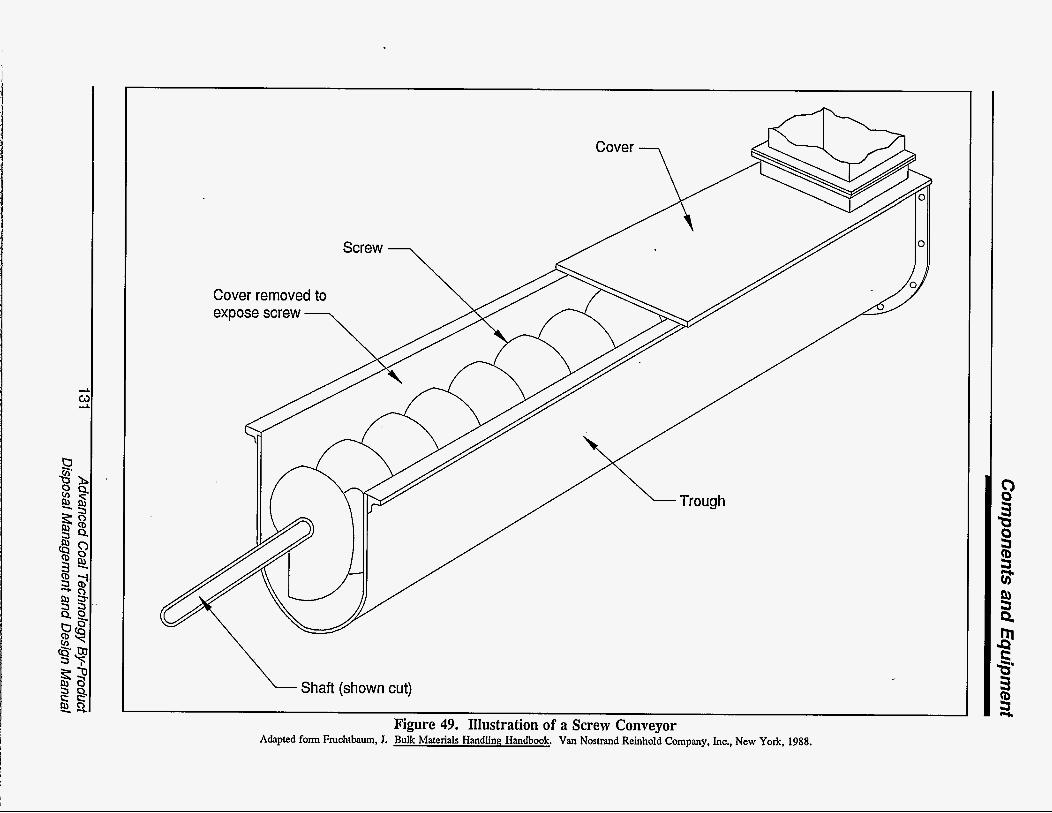
Cover removed to expose screw --,
\
Figure 49. Illustration of a Screw Conveyor Adapted form Fruchtbaum, J. Bulk Materials Handling Handbook. Van Nostrand Reinhold Company, Inc., New York, 1988.
Components and Equipmenf
conveyors are drag, en-masse, and flight. Refer to Figure 50 for illustrations. Drag chain conveyors use an endless chain without attachments to drag material through the trough. En-masse conveyors consist of a series of skeleton or solid flights mounted on a chain which travels within a closely fitted enclosure. A flight conveyor has a series of flights attached to the chain which push the material through the trough. System costs for a 50-ft length can range from $30,000 (20 tons per hour) to $100,000 (200 tons per hour).
Vibrating Conveyor (Oscillating)-A horizontal trough, mounted on inclined reactor legs and supported by a spring system, is vibrated/oscillated by a direct-connected eccentric arm, rotating eccentric weights, an electromagnet, or a pneumatic or hydraulic cylinder. This motion, which propels the par- ticles upward and forward, conveys the mater- ial in a uniform, continuous flow. An illustra- tion of the process is shown in Figure 51. Approximate costs for this type of conveying system can range from $20,000 to $40,000 per 50-ft length. Capacities up to 25 tons per hour perform best with materials larger than 100 mesh; however, light duty systems do not con- vey fine materials (less than 100 mesh) well.
Bucket Elevator-A series of buckets are mounted on an endless chain or belt. Material is fed into the buckets at the boot (bottom) terminal, conveyed upward, then discharged by passing over the head wheel at the top. The entire mechanism is usually enclosed in a casing. Refer to Figure 52. Prices range from $9,000 (14 tons per hour) to $17,000 (150 tons per hour) per 50-fi length.
Feeders
Feeders are short conveyors or other devices used to take material from the bottom of the storage vessel and transfer it at a con- trolled rate to the conveyor or mixing equip- ment. Types of feeders considered feasible for coal combustion by-products are discussed below.
Rotary-This type of feeder consists primarily of a shaft with radial paddles or rotors which form pockets designed to suit the characteristics of the material to be fed. A rotary feeder can be used to regulate material flow by controlling the throughput of material volumetrically or by providing an air pressure seal between the feed source and the pressurized transport line. The latter type, referred to as an airlock feeder, is used on pneumatic conveying systems. If a rotary feeder is selected, special consideration must be given to the abrasive nature of the by- products (such as selecting one made of abrasion-resistant materials).
Airlock and Gate-These types of feeders are used to regulate the discharge of material from equipment operating under a pressure differential (such as pneumatic systems). The types of equipment available include rotary airlock feeders (discussed previ- ously), double-door discharge gates, and flap valves. The double-door discharge gate uses the space between the doors as an airlock. The flap valve consists of a weighted flap held in place by the operating pressure of the conveying line. When the weight of the collected material overcomes the seating pressure, the flap opens and material is discharged.
Screw-Screw feeders are similar to screw conveyors in that they use a helix to transport material volumetrically from a bin operating with little or no pressure differential between inlet and outlet. Screw feeders are typically used with mechanical transport system; however, specially adapted screw conveyors can be used with pneumatic systems.
Belt or Chain-Similar to a belt conveyor, this feeder uses a belt or chain to withdraw material from the storage bin. Weigh decks or weigh idlers may be employed to meter flow gravimetrically.
Vibrating-This type of feeder, like the vibrating conveyor, uses vibration to trans
Advanced Coal Technology By-product 132 Disposal Management and Design Manual
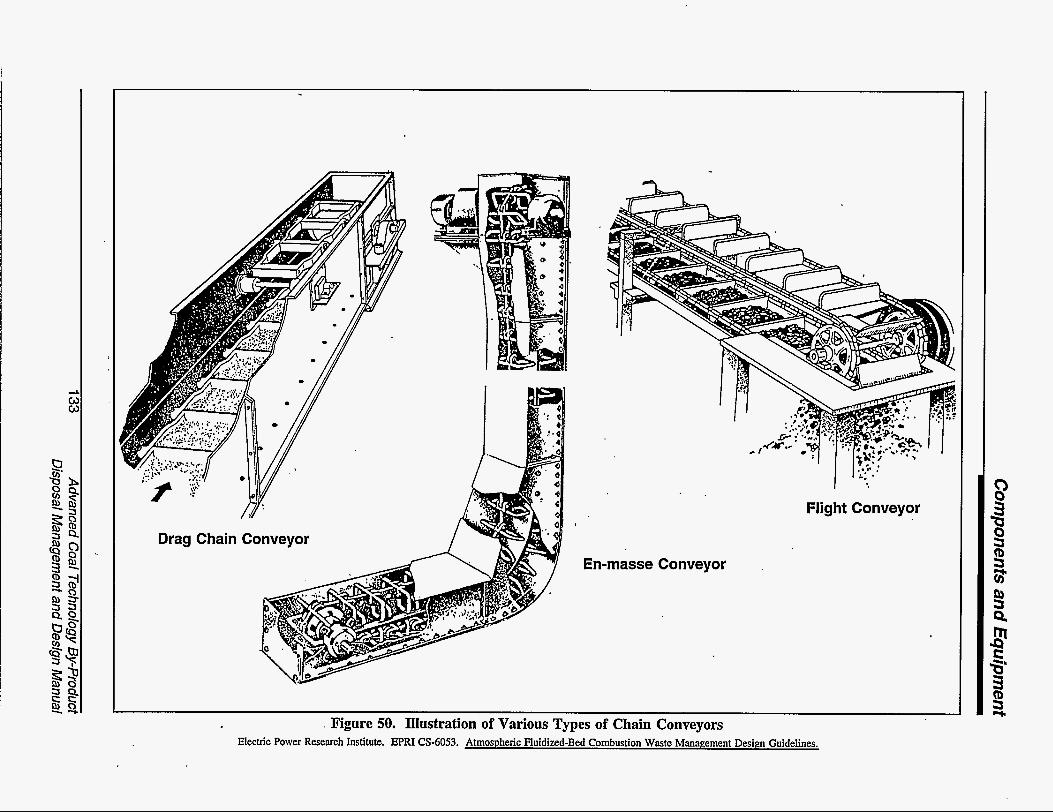
Drag Chain Conveyor
. Figure 50. Illustration of Various Types of Chain Conveyors Electric Power Research Institute. EPRI CS-6053. Atmospheric Fluidized-Bed Combustion Waste Management D a i m Guidelines.

Figure 51. Illustration of a Vibrating Conveyor Adapted from Fruchtbaum, J. Bulk Materials Handling Handbook. Van Nostrand Reinhold Company Inc., New York, 1988.
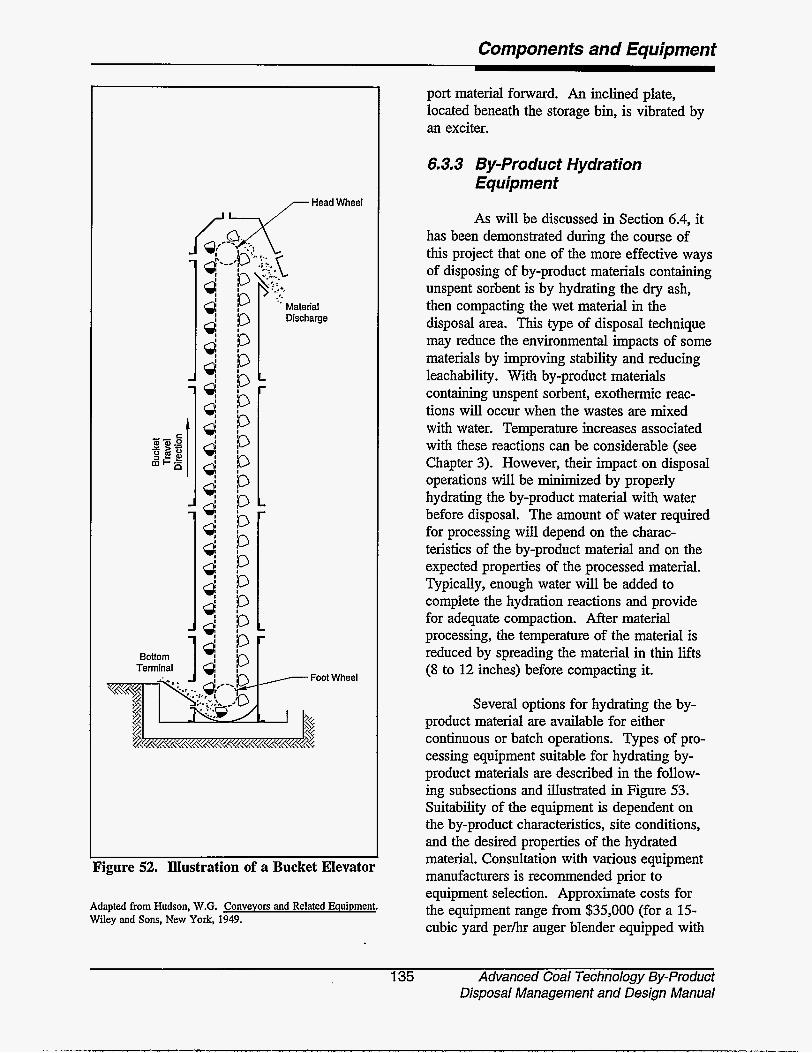
Components and Equipment
port material forward. An inclined plate, located beneath the storage bin, is vibrated by an exciter.
7 Head Wheel
Wheel
'igure 52. Illustration of a Bucket Elevator
Adapted from Hudson, W.G. Conveyors and Related Equipment. Wiley and Sons, New York, 1949.
6.3.3 By-Product Hydration Equipment
As will be discussed in Section 6.4, it has been demonstrated during the course of this project that one of the more effective ways of disposing of by-product materials containing unspent sorbent is by hydrating the dry ash, then compacting the wet material in the disposal area. This type of disposal technique may reduce the environmental impacts of some materials by improving stability and reducing leachability. With by-product materials containing unspent sorbent, exothermic reac- tions will occur when the wastes are mixed with water. Temperature increases associated with these reactions can be considerable (see Chapter 3). However, their impact on disposal operations will be minimized by properly hydrating the by-product material with water before disposal. The amount of water required for processing will depend on the charac- teristics of the by-product material and on the expected properties of the processed material. Typically, enough water will be added to complete the hydration reactions and provide for adequate compaction. After material processing, the temperature of the material is reduced by spreading the material in thin lifts (8 to 12 inches) before compacting it.
Several options for hydrating the by- product material are available for either continuous or batch operations. Types of pro- cessing equipment suitable for hydrating by- product materials are described in the follow- ing subsections and illustrated in Figure 53. Suitability of the equipment is dependent on the by-product characteristics, site conditions, and the desired properties of the hydrated material. Consultation with various equipment manufacturers is recommended prior to equipment selection. Approximate costs for the equipment range from $35,000 (for a 15- cubic yard p e r k auger blender equipped with
135 Advanced Coal Technology By-product Disposal Management and Design Manual

Componenis and Equipment
an integral feed system) to $150,000 (for a sophisticated 300-cubic yard perhr turbine mixer). The required size of the mixing equipment depends on the maximum average by-product production rate and the operating schedule of the disposal site.
Continuous Mixers
These mixers typically have a mixing chamber or trough into which material is fed and water is injected. The action of blades or paddles (which may be static or dynamic), mix and discharge the material in a continuous process. Several types of continuous mixers are described below.
Horizontal Drum Mixer-This type of mixer consists of a rotating mixing drum and a screw conveyor (which is contained within and runs up the center of the mixing drum). The material travels from the inlet through a screw conveyor to the mixing drum. There it is moistened by a series of spray nozzles. As the material travels toward the discharge end (lower end) of the drum, it is agitated by the combined action of the rotating drum and a stationary scrapper. A production rate of up to 50 cubic yards per hour is possible. Due to the short residence time of the material within the mixing drum and the hard-to-wet nature of some by-products, low mixing efficiencies may result. Therefore, prior to selecting this type of mixer, a test should be performed to determine if the mixing efficiency is acceptable with respect to the disposal option selected.
Vertical Mixer-This mixer consists of three chambers: an upper feeding chamber, a metering chamber, and a lower conical mixing chamber. The material flows from the feeding chamber to the metering chamber. Flow out of the metering chamber to the mixing chamber is regulated by a rotating cone at the base of the metering chamber. Water is injected into the material via high pressure water nozzles as it descends into the mixing chamber. To prevent build up and direct flow
toward the outlet, a pair of rotating scraping arms travel along the interior of the mixing chamber walls. A production rate of up to 250 cubic yards per hour is possible. As with the drum mixer, the vertical mixer has a short residence time. Therefore, a test to demonstrate mixing efficiencies should be performed to determine suitability.
Auger Blender-This type of mixer consists of single helical blending auger housed in a trough or tube. Material is introduced into the base of the housing by a feeding mechanism and carried forward by the auger. Water is injected into the housing and is mixed with the material by action of the rotating auger. A production rate of up to 120 cubic yards per hour can be achieved.
Horizontal Pug M i l l a n e or two shafts are housed within a horizontal cylindri- cal chamber or trough. The shaft(s) are fitted with short heavy cutting paddles/ blades which extend radially outward. Material is fed into the chamber at one end where water is injected. The material is mixed and pushed forward by the blades, then discharged from the opposite end at the bottom. Production rates can range between 10 to 200 cubic yards per hour depending upon the size of the mill.
Plow Blender-This is similar to a pug mill; however, this type of mixer uses plow shaped blades rather than cutting paddles. The plows are attached to either one or two shafts (depending on the size) which rotate and mix the material. Production rates as high as 200 cubic yards per hour are possible.
Compulsory Mixer-This type of mixer is also similar to a pug mill. A compul- sory mixer has a horizontal chamber housing two counter-rotating shafts with radial arms with flat pitched ends which push the material forward as it is being mixed. For continuous operation, material is fed into the chamber from the top of one end where water is also injected. The material is mixed, and then discharged from the bottom at the opposite
Advanced Coal Technology By-product 136 Disposal Management and Design Manual
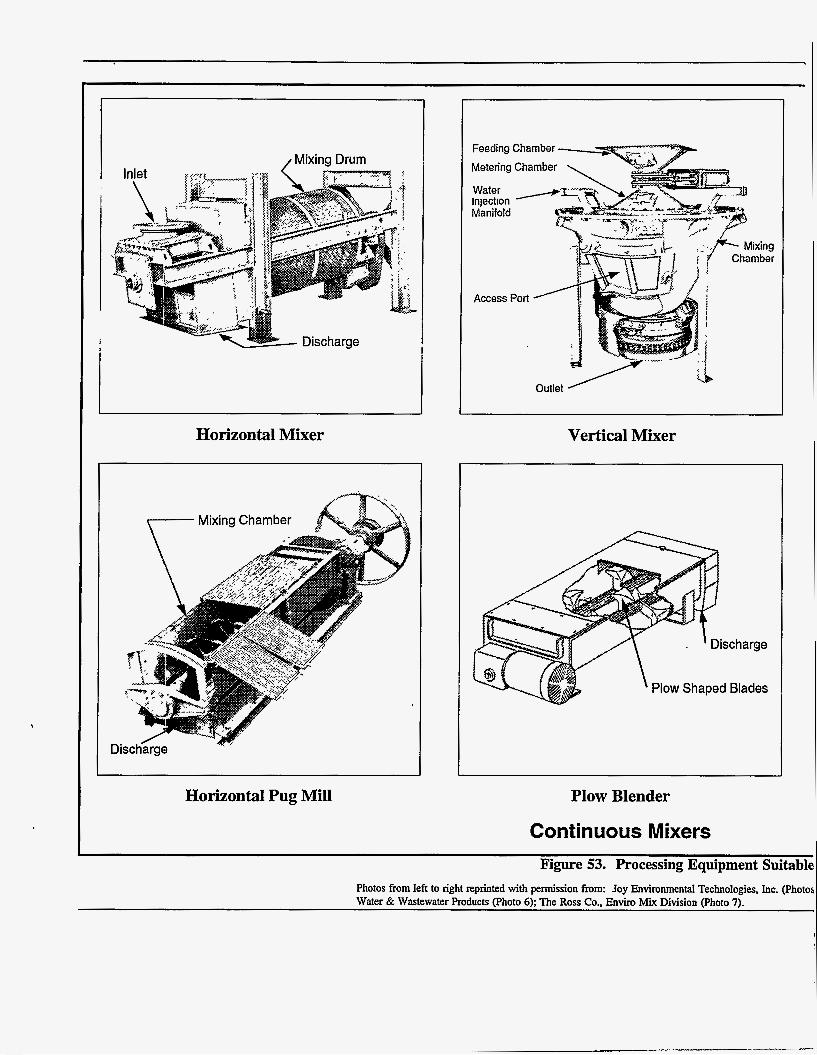
1 Mixing Drum I i
Horizontal Mixer
Metering Chamber
Vertical Mixer
Plow S h a p e d Blades
Horizontal Pug Mill Plow Blender
Continuous Mixers Figure 53. Processing Equipment Suitable
Photos from left to right reprinted with permission from: Joy Environmental Technologies. Inc. (Photos Water & Wastewater Products (Photo 6); The Ross Co.. Enviro Mix Division (Photo 7).
1

Components and Equipment
I Material intake
Discharge
Auger Mixer
Compulsory Mixer
)r Hydrate By-product Materials
with Spiral Blades
P
Spiral Mixer
- Leg with Moldboard Within Circular Trough
Turbine Mixer
Batch Mixers
and 2); Mixer Systems, Inc. (Photos 4 and 8); J.C. Stele & Sons (Photo 5); LeopoId
137 Advanced Coal Technology By-product Disposal Management and Design Manual
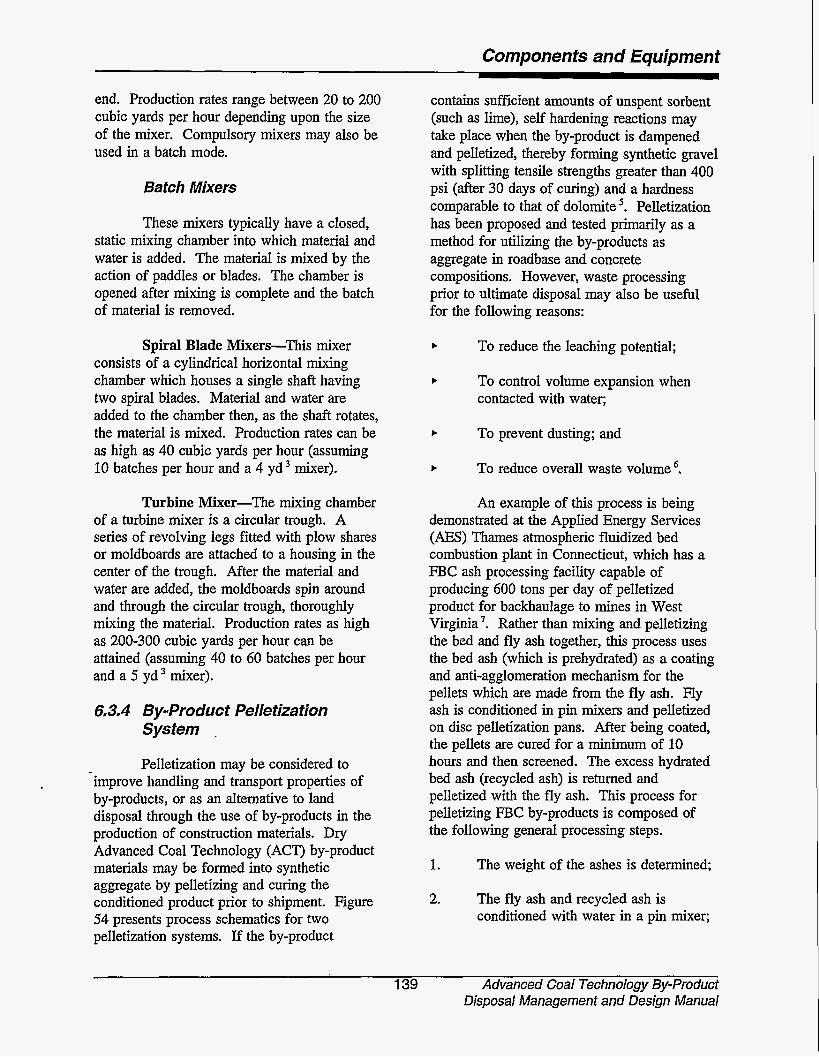
Components and Equipmenf
end. Production rates range between 20 to 200 cubic yards per hour depending upon the size of the mixer. Compulsory mixers may also be used in a batch mode.
Ba fch Mixers
These mixers typically have a closed, static mixing chamber into which material and water is added. The material is mixed by the action of paddles or blades. The chamber is opened after mixing is complete and the batch of material is removed.
Spiral Blade Mixers-This mixer consists of a cylindrical horizontal mixing chamber which houses a single shaft having two spiral blades. Material and water are added to the chamber then, as the shaft rotates, the material is mixed. Production rates can be as high as 40 cubic yards per hour (assuming 10 batches per hour and a 4 yd3 mixer).
Turbine Mixer-The mixing chamber of a turbine mixer is a circular trough. A series of revolving legs fitted with plow shares or moldboards are attached to a housing in the center of the trough. After the material and water are added, the moldboards spin around and through the circular trough, thoroughly mixing the material. Production rates as high as 200-300 cubic yards per hour can be attained (assuming 40 to 60 batches per hour and a 5 yd3 mixer).
6.3.4 By-product Pelletization System .
Pelletization may be considered to improve handling and transport properties of by-products, or as an alternative to land disposal through the use of by-products in the production of construction materials. Dry Advanced Coal Technology (ACT) by-product materials may be formed into synthetic aggregate by pelletizing and curing the conditioned product prior to shipment. Figure 54 presents process schematics for two pelletization systems. If the by-product
contains sufficient amounts of unspent sorbent (such as lime), self hardening reactions may take place when the by-product is dampened and pelletized, thereby forming synthetic gravel with splitting tensile strengths greater than 400 psi (after 30 days of curing) and a hardness comparable to that of dolomite '. Pelletization has been proposed and tested primarily as a method for utilizing the by-products as aggregate in roadbase and concrete compositions. However, waste processing prior to ultimate disposal may also be useful for the following reasons:
b
b
b
b
To reduce the leaching potential;
To control volume expansion when contacted with water;
To prevent dusting; and
To reduce overall waste volume '. An example of this process is being
demonstrated at the Applied Energy Services (AES) Thames atmospheric fluidized bed combustion plant in Connecticut, which has a FBC ash processing facility capable of producing 600 tons per day of pelletized product for backhaulage to mines in West Virginia7. Rather than mixing and pelletizing the bed and fly ash together, this process uses the bed ash (which is prehydrated) as a coating and anti-agglomeration mechanism for the pellets which are made from the fly ash. Fly ash is conditioned in pin mixers and pelletized on disc pelletization pans. After being coated, the pellets are cured for a minimum of 10 hours and then screened. The excess hydrated bed ash (recycled ash) is returned and pelletized with the fly ash. This process for pelletizing FBC by-products is composed of the following general processing steps.
1.
2.
The weight of the ashes is determined;
The fly ash and recycled ash is conditioned with water in a pin mixer;
139 Advanced Coal Technology By-product Disposal Management and Design Manual
Componenis and Equipment
I
Pellet Screen
Storage
I I I Water
Storage Silo
m-til Bed Ash Hydrator I Pin Mixer, 1 I
Pellet Coating
Pellet Curing
Silo
System Using Pelletizing Pan I Byproduct Storage
Bin wl Airslide
r w a t e r
A i r 1 -, Double Blade Mixer
- Pellet
Conveyor Screen I
Pelletized By-product
System Using Pellet Mill I
Figure 54. Pelletizing Systems
Advanced Coal Technology By-product 140 Disposal Management and Design Manual
Componenfs and Equipmenf
.
3.
4.
5.
The conditioned ash is agglomerated on a pelletizing pan with water to form green pellets;
The pellets are then coated with hydrated bed ash upon discharge from the pelletizing pans;
Once coated, the pellets are transferred to a curing chamber and allowed to cure overnight;
6. The cured pellets and coating material are transferred to a screening area where the excess coating, smaller than 10 mesh, is removed and conveyed to a recycled ash storage area; and finally The material larger than the screen size is transferred out as the pelletized product ready for transport.
7.
Another means of pelletizing dry FGD by-products is accomplished under pressure, using special dies (within pellet mills) with a small percentage of water added as a binder (refer again to Figure 54). The amount of water added for conditioning prior to pellet- ization depends upon by-product character- istics. Generally, at lower water contents, more friction is produced in the pellet mill, resulting in higher densities. However, when the moisture content is too low, the friction in the die becomes so high that the pellet mill may plug.
6.3.5 Processed Material Transportation Options
After the by-product material is processed and discharged from the mixing equipment, it needs to be transported to the disposal area. Transportation equipment suit- ability should be evaluated on the basis of the distance to the disposal area from the mixing equipment, the terrain, and the production rate. Several transportation alternatives are listed below.
Dump Truck
Dump trucks generally provide a suit- able mode for transporting the processed mater- ial to the disposal area. However, considera- tion must be given to how the trucks will be loaded (if not directly fed by the processing equipment discharge), the route in which the trucks will travel, how many trucks will be needed, what capacity will optimize efficiency, and how the dumped load will be spread out over the disposal cell. Typical transport rates (assuming round trip travel is approximately 1000 feet) can range from 240 to 800 cubic yards per day per truck.
Front End Loader
Front end loaders can be used to spread material over cell area or to load dump trucks (if necessary). Typical transport rates can range from 360 to 1480 cubic yards per day per loader.
Belt Conveyor
If the material needs to be transported a short distance (such from the processing equipment to the transportation means), a belt conveyor may be used. Capacities for belt conveyors can range from 150 tons per hour to 640 tons per hour.
6.4 Case Study System
A case study was performed to demon- strate the effectiveness of disposing of by- product materials (containing unspent sorbent) by hydration and placement in a landfill. During the case study, an integrated by- product processing system was operated and evaluated. The study, conducted at the Freeman United Mine site (near Canton, Illinois), involved the construction of two landfii test cells: one to test a by-product mixture hydrated for flowability, the other to test a mixture hydrated for compactability. Results from this Illinois test site are presented in Chapter 9, Section 9.2.3. Fluidized bed
141 Advanced Coal Technology By-product Disposal Management and Design Manual
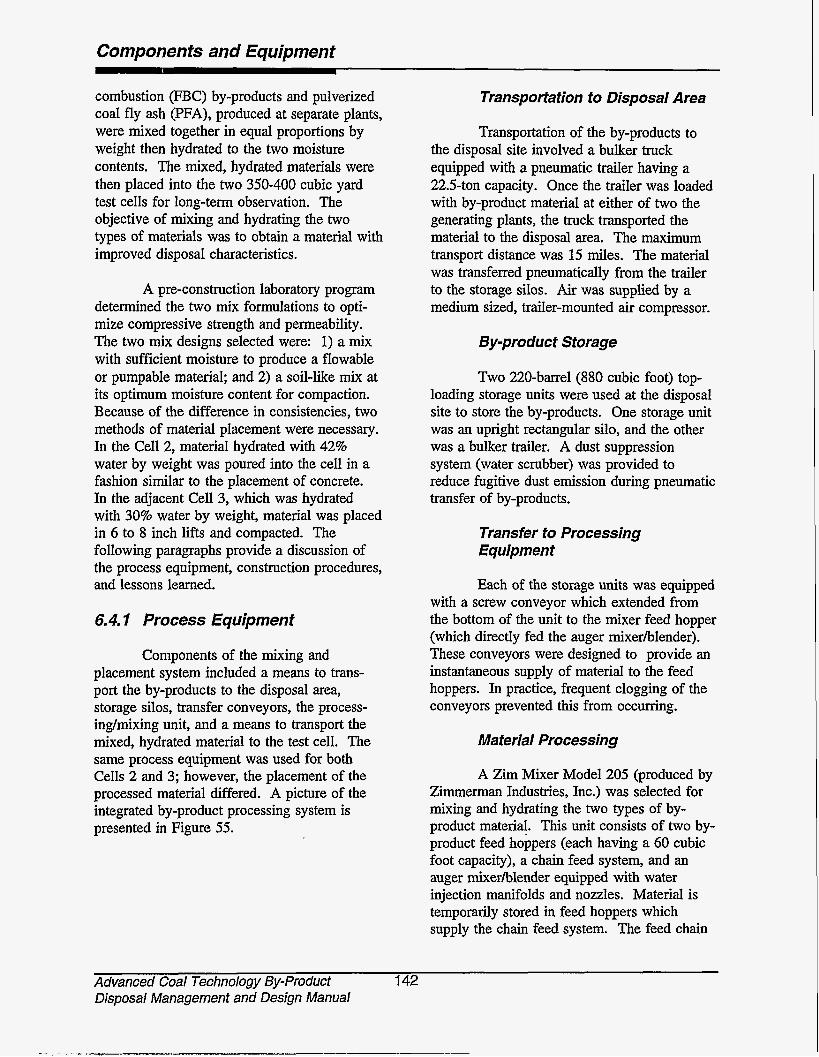
Components and Equipment
combustion (FBC) by-products and pulverized coal fly ash (PFA), produced at separate plants, were mixed together in equal proportions by weight then hydrated to the two moisture contents. The mixed, hydrated materials were then placed into the two 350-400 cubic yard test cells for long-term observation. The objective of mixing and hydrating the two types of materials was to obtain a material with improved disposal characteristics.
A pre-construction laboratory program determined the two mix formulations to opti- mize compressive strength and permeability. The two mix designs selected were: 1) a mix with sufficient moisture to produce a flowable or pumpable material; and 2) a soil-like mix at its optimum moisture content for compaction. Because of the difference in consistencies, two methods of material placement were necessary. In the Cell 2, material hydrated with 42% water by weight was poured into the cell in a fashion similar to the placement of concrete. In the adjacent Cell 3, which was hydrated with 30% water by weight, material was placed in 6 to 8 inch lifts and compacted. The following paragraphs provide a discussion of the process equipment, construction procedures, and lessons learned.
6,4.1 Process Equipment
Components of the mixing and placement system included a means to trans- port the by-products to the disposal area, storage silos, transfer conveyors, the process- inghixing unit, and a means to transport the mixed, hydrated material to the test cell. The same process equipment was used for both Cells 2 and 3; however, the placement of the processed material differed. A picture of the integrated by-product processing system is presented in Figure 55.
Transporfa tion to Disposal Area
Transportation of the by-products to the disposal site involved a bulker truck equipped with a pneumatic trailer having a 22.5-ton capacity. Once the trailer was loaded with by-product material at either of two the generating plants, the truck transported the material to the disposal area. The maximum transport distance was 15 miles. The material was transferred pneumatically from the trailer to the storage silos. Air was supplied by a medium sized, trailer-mounted air compressor.
By-product Storage
Two 220-barrel (880 cubic foot) top- loading storage units were used at the disposal site to store the by-products. One storage unit was an upright rectangular silo, and the other was a bulker trailer. A dust suppression system (water scrubber) was provided to reduce fugitive dust emission during pneumatic transfer of by-products.
Transfer to Processing Equipment
Each of the storage units was equipped with a screw conveyor which extended from the bottom of the unit to the mixer feed hopper (which directly fed the auger mixerblender). These conveyors were designed to provide an instantaneous supply of material to the feed hoppers. In practice, frequent clogging of the conveyors prevented this from occurring.
Material Processing
A Zim Mixer Model 205 (produced by Zimmerman Industries, Inc.) was selected for mixing and hydrating the two types of by- product material. This unit consists of two by- product feed hoppers (each having a 60 cubic foot capacity), a chain feed system, and an auger mixerblender equipped with water injection manifolds and nozzles. Material is temporarily stored in feed hoppers which supply the chain feed system. The feed chain
Advanced Coal Technology By-product Disposal Management and Design Manual
1 42
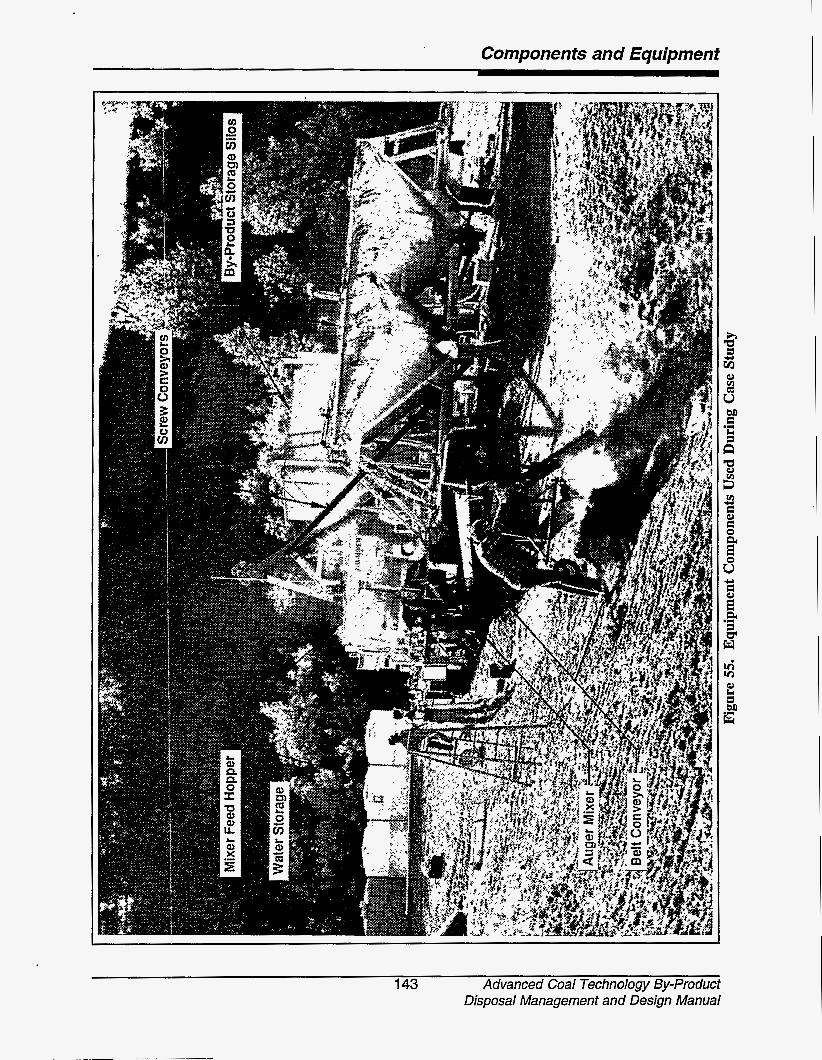
Components and Equipment
143 Advanced Coal Technology By-product Disposal Management and Design Manual
Components and Equipment
(similar to a flight chain conveyor/feeder) delivers material volumetrically to the inlet of the auger mixing chamber. Once mixed and hydrated, the material is discharged. The Model 205 has a theoretical capacity of 11 tons per hour; however, due to material supply problems and periodic equipment clogging, a rate of only 50 to 60 tons per day was achieved.
Placement of Processed Material in the Cell
After mixing and hydrating, the material was discharged onto a 5 0 4 belt conveyor which discharged into a 3/4 cubic yard backhoe bucket. The backhoe then placed the material into the cell area. For Cell 3, the backhoe heaped material at several locations in the cell, then a D-6 caterpillar bulldozer spread it out into 6- to 8-inch-thick lifts. A loose vibrating roller/compactor was used then to compact the lifts. In Cell 2, the material was poured into the cell without compaction, similar to the placement of concrete.
6.4.2 Construction Procedures
Prior to any material being placed into the cells, the base of the cell was graded and compacted. Once the base was prepared, the material was placed into the cells as described above. Figure 56 contains photographs of several of the construction procedures used in the case study.
In order to assure construction quality, a materials testing program was conducted throughout construction operations. The program consisted of testing to determine optimum moisture content, in-situ moisture content, density, and unconfined compressive strength of the as-placed materials. Specific tests included:
t Three Standard Proctor tests (ASTM D698) performed during construction activities of the South Cell to determine optimum moisture content;
t Three types of as-placed moisture content tests performed periodically: Oven-Dry (ASTM D2216), Speedy Moisture Kit (ASTM D4944), and Nuclear Density Test (ASTM D2922);
t The nuclear density method (ASTM D2922) used to determine in-place wet density of Cell 3 material after compaction; and
t Two types of unconfined compressive strength (UCS) tests. A pocket pen- trometer was used to estimate the UCS of material between placement and 7 days. The breaking strength of prepared cylinders, ASTM D2166, was used to estimate UCS between 7 days and 1 year after placement for materials from both test cells.
6.4.3 Lessons Learned
The case study demonstrated that laboratory simulations and results could be duplicated under field conditions, and provided valuable insight into by-product processing.
One of the first lessons learned was that the screw conveyors used to transfer material from the storage units to the feed hoppers were not properly adjusted for the f i e particle size of the by-product material. Apparently, the speed at which the conveyors turned was too slow to effectively transfer the material up the casing. We increased the conveyor speed and solved this particular problem.
Another problem with material delivery was noticed in the feed hopper and chain feed system interface of the Zim Mixer. Apparently, arching or rat-holing was occurring within feed hoppers (possibly due to improper hopper geometry or sidewall slope). This inhibited continuous flow to the feed chain. The problem was partially resolved by periodically agitating the material within the feed hoppers via an internal rotating agitation
Advanced Coal Technology By-product 144 Disposal Management and Design Manual

Components and Equipment
Compaction.
Quality control (density, moisture content) testing of compaction.
Placing additional material upon compacted lift.
Figure 56. Construction Procedures for Case Study
145 Advanced Coal Technology By-product Disposal Management and Design Manual

Components and Equipment
arm, by vibrators mounted on the exterior of the hoppers, and by manually stirring the material with a long metal rod. Proper hopper geometry should be researched and imple- mented in order to avoid this type of problem.
During material transfer from the pneumatic trailer to the storage units, it became apparent that the dust suppression system (water scrubber) was inadequate. For materials with a high dusting potential, a baghouse filter should be used, similar to that used in conjunction with dry cement transfer operations.
While processing operations were in progress, the feed hoppers had to be re- supplied periodically via the screw conveyors. This was accomplished by manually starting and stopping the electric drive units on each of the conveyors. However, if the conveyors were left running after the feed hoppers had been filled, the conveyor casing would backfiil and clog. To prevent this from occurring, feed hoppers should be equipped with a level switch to shut off the conveyor once the hopper is full.
The auger mixerblender worked well; both types of by-product materials were effectively mixed and hydrated. For larger scale operations, the feed system should be ' modified, but the general configuration could remain the same. However, a more efficient method of placing the processed material into the disposal cell area would be required for full-scale operation.
6.5 Citations
1. Electric Power Research Institute. EPRI CS-2801. FGD By-product Disposal Manual, Third Edition. Palo Alto, California, 1983.
2.
3.
4.
5.
6.
7.
Electric Power Research Institute. EPRI CS-6053. Atmospheric Fluidized-Bed Combustion Waste Management Design Guidelines. Palo Alto, California, 1988.
U.S. Department of Agriculture, Ag. Res. Service. Control of Water Pollution from Cropland. ARS-H-5-1 and ARS-H-5-2. Washington, D.C., 1976.
Ibid.
Donnelly, J.R., E.S. Tons, and W. C. Webster, "Synthetic Gravel from Dry Flue Gas Desulfurization End- Products." In: The Challenge of Change: Proceedings of the Sixth International Ash Utilization Symposium, pp. 187-207, Reno, Nevada, March 7-10, 1982. DOE/METC-82-52.
Electric Power Research Institute. EPRI CS-1765. Recovery, Utilization, and Disposal of Solid Byproducts Generated by Dry Flue Gas Desulfurization Systems: State of the Art and Research Needs. Palo Alto, California, 1981.
Bland, A.E., R. Cox, A. Rowen, E.R. Lichty, and R.A. Schumann, "Pelletization as an Ash Management Option for CFBC Ash Handling and Utilization." In: Proceedings of the 1993 International Conference on Fluidized Bed Combustion, pp. 1341- 1350, San Diego, California. May 9-13, 1993.
Advanced Coal Technology By-product 146 Disposal Management and Design Manual
Management Alternatives 1
This chapter presents five management alternatives that were derived from a review of current state practices and industrial solid waste regulations (see Chapter 1). These five alternatives can be divided into two broad categories: land disposal and beneficial use and reuse.
Land Disposal:
t
t
F
Alternative 1Traditional Landfill Containment Systems;
Alternative 2-Reduced Requirement Landfill Designs;
Alternative 3-By-product Stacking Disposal Methods;
Beneficial Use and Reuse:
t
t
Alternative "Mine Reclamation and Backfill1 Uses; and
Alternative 5-By-product Reuse Options.
The main function of this chapter is. to provide industry officials, regulatory agencies, and other interested parties with a common understanding of by-product management methods and also to provide general guidance in the development of these alternatives (with emphasis on land disposal options and mine reclamationhackfill uses). Figure 57 summar- izes the general design requirements and con- siderations for the first four alternatives discussed in this chapter. For the fifth alternative, several reuse options are listed and the results of a case study are presented illustrating a potential market for advanced coal technology by-products.
'.
For the land disposal alternatives, the main regulatory focus is upon the protection of groundwater. Therefore, the control and mini- mization of leachate production is a critical element in the design of these facilities. Because of these factors and due to the fact that most by-product material is currently man- aged in a dry state (although hydration of the material occurs at the disposal site), the major- ity of disposal alternatives discussed in this chapter will be restricted to dry state type (in contrast to wet disposal in impoundments). Alternative 3, on the other hand, encompasses wet disposal methods traditionally associated with gypsum stacks, and is presented to pro- vide the reader with a broad range of disposal alternatives.
The general methodology for the disposal of by-product material (as presented in this manual) is based on hydrating the dry material (which typically contains significant quantities of unspent sorbent, such as quick- lime), then placing this hydrated by-product material in the disposal facility. As the hydration reaction goes to completion, cementing of the material occurs due to the formation of gypsum, calcite, and ettringite. As shown in the construction and monitoring of the test filis constructed during the course of this project, this construction procedure gener- ally results in a cemented material which pro- duces a leachate that contains a low level of regulated contaminants (see Chapter 9). The information obtained from these test fills was also used in the development of Alternatives 1 through 3.
Alternatives 1 through 4 employ this hydration process prior to the by-products being placed into the landfill, stack, or mine. However, subtle differences exist between the alternatives. The difference between Alternatives 1 (Figure 58) and 2 (Figure 59) is
1 47 Advanced Coal Technology By-product Disposal Management and Design Manual
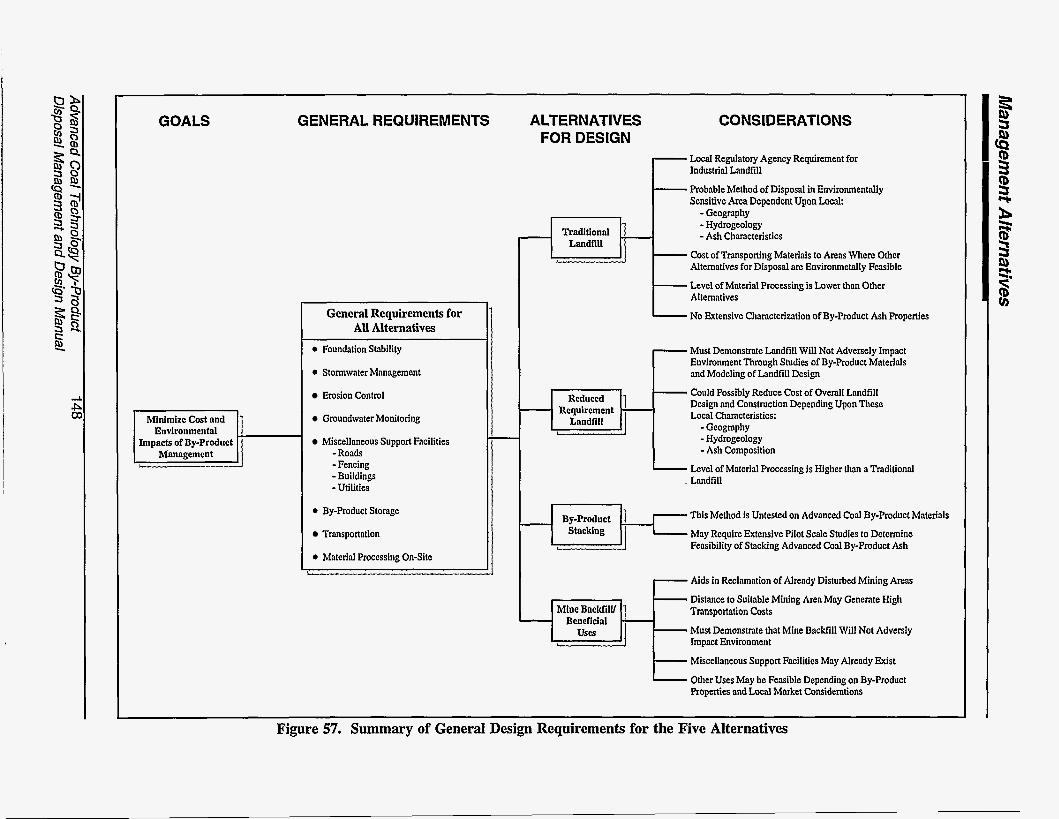
GOALS GENERAL REQUIREMENTS ALTERNATIVES FOR DESIGN
Minimize Cost and Environmental
Impacts of By-product Managemcnt
1 General Requirements for All Alternatives
0 Foundation Stability
0 Stormwater Management
Erosion Control
Groundwater Monitoring
Miscellaneous Support Facilities -Roads - Fencing - Buildings -Utilities
0 By-product Storage
Transportation
0 Material Processing On-Site
CONSIDERATIONS
- Local Regulatory Agency Requirement for
- Probable Method of Disposal in Environmentally Industrial Landfill
Sensitive Area Dependent Upon Local: - Geography - Hydrogeology -Ash Chilncteristics
- Cost of Transporting Materials to Areas Where Other Alternatives for Disposal are Environmetally Feasible
- Level of Material Processing is Lower than Other Alternatives
- No Extensive Characterization of By-product Ash Properties
Must Demonstrate Landfill Will Not Adversely Impact Environment Through Studies of By-product Materials r and Modeling of Landfill Design Could Possibly Reduce Cost of Overall Landfill Design and Construction Depending UponThese Local Characteristics: - Geography - Hydrogeology
Requirement
- Ash C&npo%ion Level of Material Processing is Higher than a Traditionnl Landfill
By-product This Method is Untested on Advanced Coal By-product Materials May Require Extensive Pilot Scnle Studies to Determine Feasibility of Stacking Advanced Coal By-product Ash
Aids in Reclamation of Already Disturbed Mining Areas Distance to Suitable Mining Area May Generate High Transportation Costs Must Demonstrate that Mine Backfill Will Not Adversly Impact Environment Miscellaneous Support Facilities May Already Exist Other Uses May be Feasible Depending on By-product Properties and Local Market Considerations
Beneficial
Figure 57. Summary of General Design Requirements for the Five Alternatives

Management Alternatives
Layer Description Profile Typical Dimensions
- 3 - - cv .r
Geomembrane - - 8
Solid Waste/ By-product Material
Collection and - - cv F-
Geomembrane - 3
(II a .- z >
Figure 58. Typical Industrial Landfill Containment System
J 149 Advanced Coal Technology By-product Disposal Management and Design Manual

Managemenf Alfernafives
* *
* * *
* * *
* * *
*
Plan View
I I Figure 59. Reduced Requirements Landfill Design
the varying degrees of protection required by the governing regulatory agency. Some state agencies may force a facility to include all the standard containment system design elements required in their industrial solid waste regulations (Alternative 1). However, other state agencies may offer exemptions or variances from some of the more costly design elements (liners, .groundwater monitoring requirements, etc.) if facilities can demonstrate that their particular design will not adversely impact the environment (Alternative 2) or will meet regulatory performance standards. Alternative 4 has developed as a result of exemptions most states offer to by-product material handlers that can show that the material is being beneficially reused (mine reclamation, mine backfii, and treatment of acid mine drainage). In fact, some states exempt most beneficial reuses of by-product material from the permitting process altogether.
However, it should be noted that this alternative is very similar to the first two alternatives insofar as material handling, mixing, and material properties are concerned. These alternatives are discussed in detail in the following sections. Design elements that are common to most of these alternatives (such as landfill configuration, surface water controls, groundwater monitoring systems, and process- ing equipment) are discussed in Chapter 6.
An alternative to disposal is reuse of the by-products (Alternative 5) as construction materials or possibly soil amendments for agricultural applications. A case study for one such reuse option, the manufacture of masonry block, has been conducted. The results suggest that certain by-product materials can attain sufficient strength for use in structural applications. This case study is presented in Section 7.5.
Advanced Coal Technology By-product 150 Disposal Management and Design Manual
Management Alternatives
7.1 Alternative I-Traditional Landfill Containment Systems
Alternative 1 is presented to give the reader an idea of the type of requirements most state regulatory agencies specify for industrial solid waste landfills. As noted in Chapter 4 (Regulatory Requirements), most states classify by-products from advanced coal processes as industrial solid waste. However, most state regulatory agencies have developed industrial solid waste regulations to cover a broad range of solid waste materials which typically are more likely to have a negative impact on the environment than by-products from advanced coal technology processes. Therefore, the type of containment systems specified for this alternative are more complex than has typically been considered for coal combustion products in the past. However, there is a general trend toward more stringent regulations and more complex containment systems (such as those presented in this alternative) for coal combustion by-products, and this trend is expected to continue.
An example of the containment system typically required at an industrial solid waste landfill is shown in Figure 58. This is a general figure derived from reviewing regulations from’several states (it should be noted that proposed designs may vary greatly from state to state). Each layer of the containment system shown in Figure 58 will be discussed in the following section. Subsequent subsections will discuss the level of by-product processing required before disposal, site development, and the economics of Alter- native 1.
7.1. I Containment System Design
Landfill containment systems, like the example containment system shown in Figure 60, are designed to meet the following three criteria:
t Minimize infiltration of stormwater;
t Collect and remove leachate produced by the landfill; and
t Prevent leachate from migrating off- site.
A description of each layer of this example containment system is presented in Figure 60. As noted earlier, requirements for industrial solid waste landfill containment systems vary from state to state. However, the major elements (e.g. cover soil, barrier layers, and leachate collection systems) are typically included.by all states. The major containment system elements are further discussed below.
Cover Soil
The two basic layers of the cover soil are the surface layer and the protective layer. The surface layer is typically composed of topsoil or a layer of soil that can sustain vegetation. However, in some arid areas, a cobble surface layer may be more appropriate if vegetation cannot be established. The advantages and disadvantages of each surface layer type are listed in Figures 61 and 62.
The protective layer is generally composed of on-site soils or locally obtained general fill. The main functions of this layer are listed below:
t Store water that has infiltrated into the cover until the water is later removed by evapotranspiration;
t Minimize the possibility of human intrusion into the landfill;
t Protect the underlying layers in the cover system from excessive wetting/drying (which may cause cracking); and
t Protect underlying layers in the cover system from freezing (which could also cause cracking).
151 Advanced Coal Technology By-product Disposal Management and Design Manual

Layer Usual Materials General Considerations Profile Primary Function(s)
1. Surface Layer
Topsoil (Humid Site); Cobbles (Arid Site); Geosynthetic Erosion Control Systems
Promote Vegetative Growth (Most Covers): Promote Evapotranspiration; Prevent Erosion
Surface Layer for Control of Water and/or Wind Erosion is Always Required
2. Protection Layer
Store Water; Protect Underlying Layers from Intrusion by Plants, Animals, and Humans; Protect Barrier Layer from Desiccation and Freeze/ Thaw; Maintain Stability
Drain Away Infiltrating Water to Minimize Barrier Layer Contact and To Dissipate Seepage Forces
Minimize Infiltration of Water Into Waste
Mixed Soils; Cobbles Some Form of Protective Layer is Always Required; Surface Layer and Protective Layer May Be Combined Into a Single 'Cover Soil" Layer
3. Drainage Layer
Sands; Gravels; Geotextiles; Geonets; Geocomposites
Drainage Layer is Optional; Necessary Only Where Excessive Water Passes Through Protection Layer or Seepage Forces are Excessive
4. Barrier Layer
Compacted Clay Liners; Geomembranes; Geosynthetic Clay Liners
Barrier Layer is Usually Required; May Not Be Needed at Extremely Arid Sites
5. By-product Material
By-product Material Should Provide Enough Strenth to Support Cover Layers and Ensure Stability of an Above Ground Fill
6. Leachate Collection and Removal System
Collect and Remove Leachate Produced from Landfill
Sands; Gravels; Geotextiles; Geonets; Geocomposites. Perforated Pipe to Drain Leachate to Sumps is Also Needed
Some Form of Leachate Collection System is Usually Required; May Not Be Needed at Arid Sites
7. Barrier Layer
Prevent Leachate from Migrating Off-Site
Materials and Thickness of Barrier Layers is Usually Specified by State Regulatory Agencies
Compacted Clay Liners; Geomembranes; Geosynthetic Clay Uners
Figure 60. Containment Layer Description
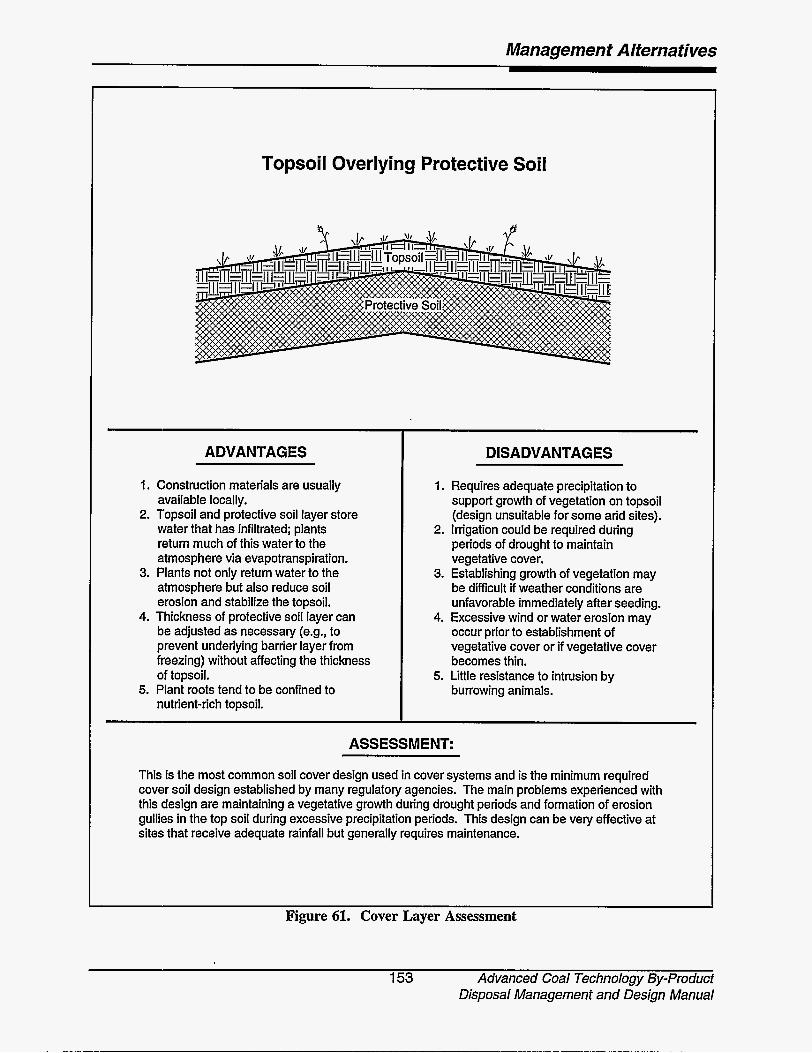
Management Alternatives
Topsoil Overlying Protective Soil
ADVANTAGES
1. Construction materials are usually available locally.
2. Topsoil and protective soil layer store water that has infiltrated; plants return much of this water to the atmosphere via evapotranspiration.
3. Plants not only return water to the atmosphere but also reduce soil erosion and stabilize the topsoil.
4. Thickness of protective soil layer can be adjusted as necessary (e.g., to prevent underlying barrier layer from freezing) without affecting the thickness of topsoil.
5. Plant roots tend to be confined to nutrient-rich topsoil.
DISADVANTAGES
1. Requires adequate precipitation to support growth of vegetation on topsoil (design unsuitable for some and sites).
2. Irrigation could be required during periods of drought to maintain vegetative cover.
3. Establishing growth of vegetation may be difficult if weather conditions are unfavorable immediately after seeding.
4. Excessive wind or water erosion may occur prior to establishment of vegetative cover or if vegetative cover becomes thin.
burrowing animals. 5. Little resistance to intrusion by
ASSESSMENT:
This is the most common soil cover design used in cover systems and is the minimum required cover soil design established by many regulatory agencies. The main problems experienced with this design are maintaining a vegetative growth during drought periods and formation of erosion gullies in the top soil during excessive precipitation periods. This design can be very effective at sites that receive adequate rainfall but generally requires maintenance.
Figure 61. Cover Layer Assessment
153 Advanced Coal Technology By-product Disposal Management and Design Manual

Management Alternatives
Cobbles Over Protective Soil
ADVANTAGES
1. No need to establish or maintain vegetative growth (particularly advantagous for arid sites or sites subject to periodic long droughts).
2. Cobbles provide protection from wind or water erosion; effectiveness of cobbles not dependent upon maintenance of vegetative growth.
3. Cobbles may minimize penetration from burrowing animals if rocks are of adequate size.
4. Cobbles minimize growth of plants with deep roots that could penetrate underlying barrier layers.
DISADVANTAGES
1. Cobbles must be adequately large to resist washout; materials may not be readily available locally.
2. Minimal evaporation of water from underlying soil (cobbles allow water to percolate downward but insulate soil from surface evaporation).
3. Wind-blown materials may fill voids between cobbles; deeply-rooted plant growth may eventually become established and require maintenance.
4. Stability concerns for steep slopes.
ASSESSMENT:
This design is usually considered only for and sites. Provided problems with burrowing animals and lack of water evaporation from protective soil layer are not too serious, this design may be the most appropriate one for and sites.
Figure 62. Arid Area Cover Layer Assessment
Advanced Coal Technology By-product 154 Disposal Management and Design Manual
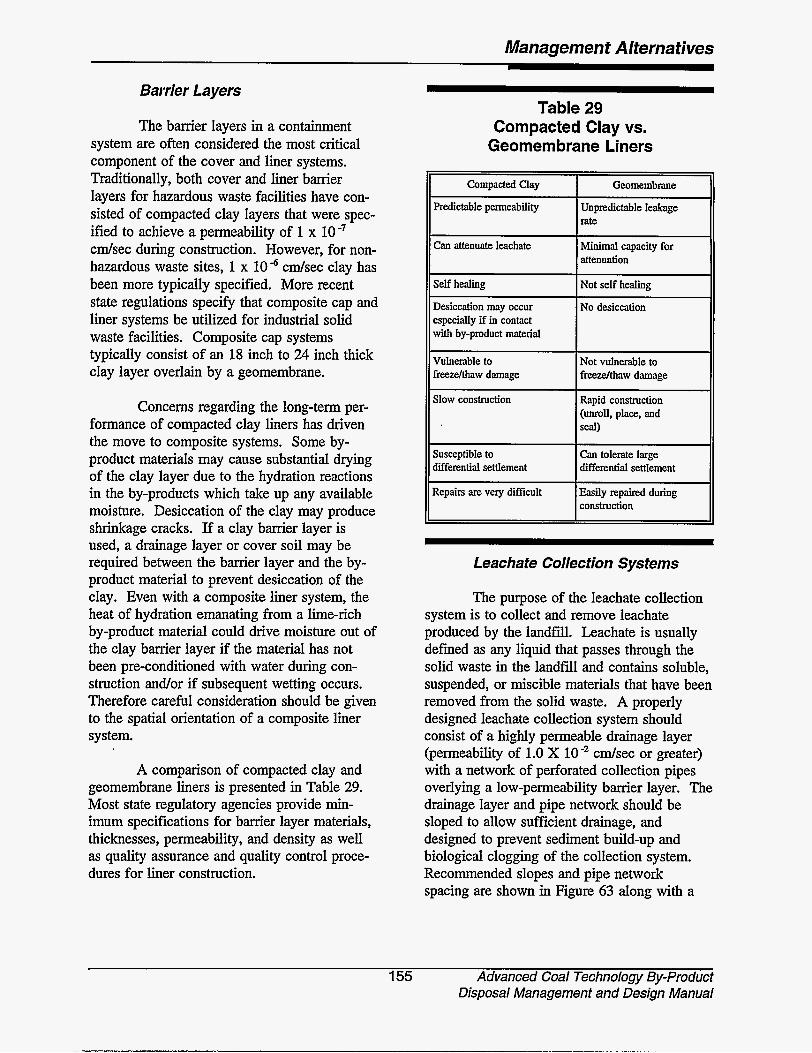
Management Alternatives
Compacted Clay
Predictable permeability
Can attenuate leachate
Self healiig
Desiccation may occur especially if in contact with by-product material
Vulnerable to freeze-lthaw damage
Slow construction
Barrier Layers
Geomembmne
Unpredictable leakage rate
Minimal capacity for attenuation
Not self healiig
No desiccation
Not vulnerable to freedthaw damage
Rapid construction (unroll. place, and seal)
The barrier layers in a containment system are often considered the most critical component of the cover and liner systems. Traditionally, both cover and liner barrier layers for hazardous waste facilities have con- sisted of compacted clay layers that were spec- ified to achieve a permeability of 1 x 10 -' c d s e c during construction. However, for non- hazardous waste sites, 1 x lod cdsec clay has been more typically specified. More recent state regulations specify that composite cap and liner systems be utilized for industrial solid waste facilities. Composite cap systems typically consist of an 18 inch to 24 inch thick clay layer overlain by a geomembrane.
Concerns regarding the long-term per- formance of compacted clay liners has driven the move to composite systems. Some by- product materials may cause substantial drying of the clay layer due to the hydration reactions in the by-products which take up any available moisture. Desiccation of the clay may produce shrinkage cracks. If a clay barrier layer is used, a drainage layer or cover soil may be required between the barrier layer and the by- product material to prevent desiccation of the clay. Even with a composite liner system, the heat of hydration emanating from a lime-rich by-product material could drive moisture out of the clay barrier layer if the material has not been pre-conditioned with water during con- struction andlor if subsequent wetting occurs. Therefore careful consideration should be given to the spatial orientation of a composite liner system.
A comparison of compacted clay and geomembrane liners is presented in Table 29. Most state regulatory agencies provide min- imum specifications for barrier layer materials, thicknesses, permeability, and density as well as quality assurance and quality control proce- dures for liner construction.
Table 29 Compacted Clay vs.
Geomembrane Liners
Can tolerate large I differential settlement Susceptible to differential settlement II
W i l y repaired during I construction Repairs are very difficult II
Leachate Collection Systems
The purpose of the leachate collection system is to collect and remove leachate produced by the landfill. Leachate is usually defined as any liquid that passes through the solid waste in the landfill and contains soluble, suspended, or miscible materials that have been removed from the solid waste. A properly designed leachate collection system should consist of a highly permeable drainage layer (permeability of 1.0 X 10" c d s e c or greater) with a network of perforated collection pipes overlying a low-permeability barrier layer. The drainage layer and pipe network should be sloped to allow sufficient drainage, and designed to prevent sediment build-up and biological clogging of the collection system. Recommended slopes and pipe network spacing are shown in Figure 63 along with a
155 Advanced Coal Technology By-product Disposal Management and Design Manual
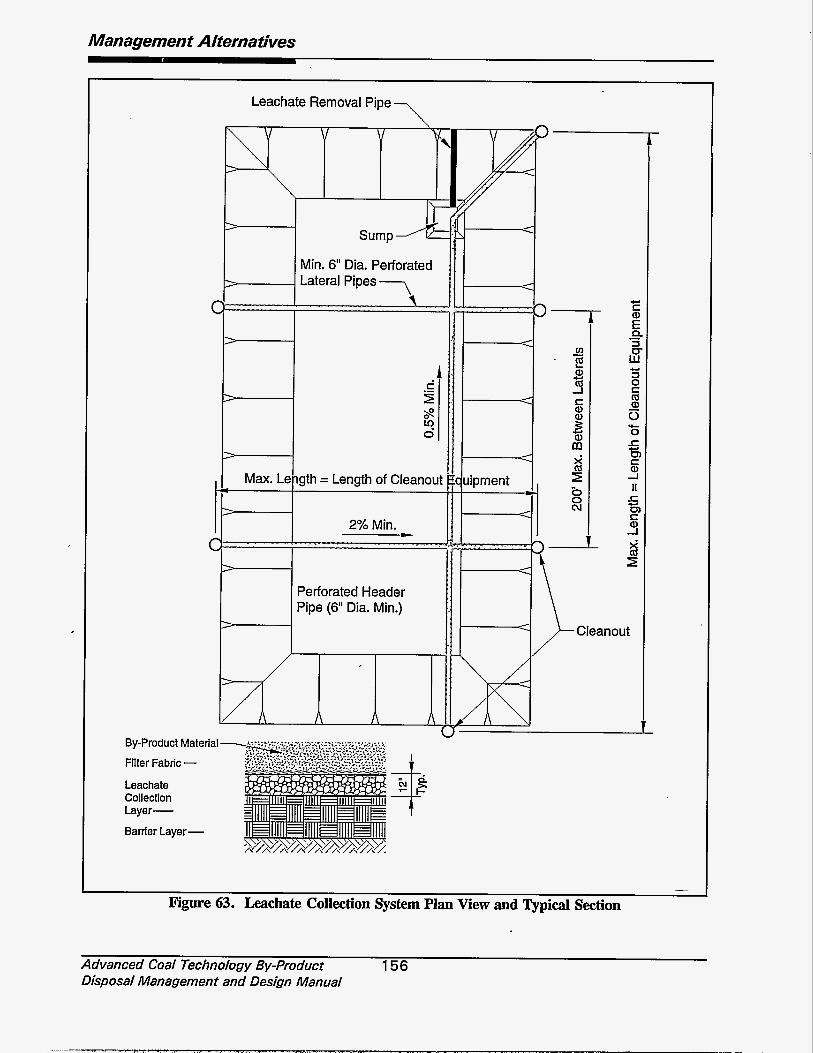
Managernen t Alferna fives
\ Leachate Removal Pipe
By-product Material - Filter Fabric - Leachate Collection Layer-
Barrier Layer-
~
Figure 63. Leachate Collection System Plan View and 'J[srpical Section
Advanced Coal Technology By-Product 156 Disposal Management and Design Manual

Management Alternatives
typical cross-section of a leachate collection layer. The fiter fabric is needed to allow the passage of leachate and yet retain the fine- grained materials that may be present in the by-product or protective cover. Additional criteria associated with materials used in the leachate collection system include the following:
For Alternative 1, the material could either be disposed of dry or in a slurry form. The only criterion here is that if the landfill will be constructed above grade, the by-product material will need to have sufficient strength to ensure the stability of the fill and to support the cap system. A secondary concern is the amount of dust created by the ash and the associated health concerns if the material is disposed of dry. Both of these concerns could be overcome by some level of processing or hydration of the by-product material before or after disposal in the landfill. This could be accomplished by the methods discussed in Section 6.3 or by adding moisture to the dry material with a water truck as it is placed in the landfill.
t Materials should be chemically resistant to the leachate;
Materials should possess sufficient strength and thickness to prevent collapse under the pressures exerted by overlying by-product material and any equipment used at the site; and
t
The leachate collection system should be designed to function through the life of the site and post-closure period without extensive maintenance.
7.1.3 Economic Analysis of Alternative I
t
The overall design, construction, and operating costs for an Alternative 1 landfill can be broken out according to costs for each of the following tasks:
b Limestone aggregate should be avoided in leachate collection systems for landfills containing sulfate-rich by- product materials because of potential reaction with leachate.
b Site selection;
t Public relations; As with the barrier layers, most state
agencies list specific criteria for leachate collection systems in their applicable regulations.
Permittihg;
By-product material characterization;
7.1.2 Level of By-Product Processing Required Before Disposal
Design;
t Construction;
One advantage of the traditional containment system, as included in Alternative 1, is that the by-product material does not need much processing before disposal because of the protection offered by the complex containment system. Other alternatives that depend on the properties of the by-product material to ensure the protection of the environment do not have this luxury.
Facility operation; t
b By-product ash transportation; and
t By-product ash processing.
Costs associated with site selection, public relations and permitting can vary between $100,000 and $800,000 depending upon the level of public acceptance, regulatory requirements, and time required to approve a
157 Advanced Coal Technology By-product Disposal Management and Design Manual
Management Alternatives
site (which can take from 4 to 6 years from site selection to permit approval for a trad- itional landfill system). However, by choosing to build a traditional landfill containment system, the financial burden of these tasks may be reduced because of the proven protection that this type of landfil offers to the environment.
By-product material characterization includes stability and leachate testing. The leachate testing effort for a traditional landfill is minimal compared to other alternatives because of the extensive engineering controls provided by the Alternative 1 containment system. The cost of characterization, as well as other preliminary engineering costs, is associated with permitting and site selection.
Design, construction, and facility operation costs depend on the volume and stability of the by-product material after processing, and on the degree of processing which may be necessary. Once the character- istics of the by-product that will enter the landfill have been established, design para- meters can be molded to minimize the cost of construction and operation, while maintaining protection of the environment. Initial construction costs include leachate collection and treatment facilities, monitoring wells, and surface water runoff collection. These costs range from $750,000 to $1,000,000, depending on the size of the landfill. Cell construction will vary between $200,000 and $300,000 per acre.
By-product transportation and processing are also dependant upon the charac- teristics of the ash. The utilization of a tradi- tional landfill containment system instead of the other alternatives will, however, require less processing of the fiil material because of the protective qualities of the landfill design. Transportation and processing equipment and costs are discussed in greater detail in Chapter 6.
Although Alternative 1 is more expensive in terms of initial construction than the other alternatives, overall cost savings might be realized. If it is necessary to place the landfill in a location where extensive testing and public hearings are anticipated for permitting, building such a traditional landfill containment system may be more economically feasible than other types of disposal alter- natives. This is possible because of the potential reductions in the costs of site selection, permitting, by-product character- ization, and material processing associated with the standard landfill design.
7.2 Alternative 2-Reduced Requirement Landfill Designs
Alternative 2 is derived from the first alternative; the difference is that the properties of the processed by-product material are used advantageously to reduce the extent of the con- tainment system required for Alternative 1, while still providing a similar level of protec- tion to the environment. The case studies in Chapter 9 were developed to demonstrate the viability of this alternative. The results from the test cells, composed of by-product material with a varying degree of processing, generally demonstrate the adequacy of a limited containment system.
Earlier work completed for this project has shown (in laboratory and field situations) that processed fluidized bed combustion (FBC) and limestone injection multistage burners (LIMB) by-product materials possess physical properties such as low permeability (ranging from 1 x strength (500 to 1500 psi); and low contaminant concentrations in the leachate potentially suitable for a reduced requirement landfill design. Most state regulatory agencies allow an applicant to demonstrate that a proposed design will provide equivalent protection to the environment when compared to the state’s standard design requirements. If such a demonstration is accepted, considerable disposal cost reductions may be realized.
to 1 x lo-* cdsec); high
Advanced Coal Technology By-product 158 Disposal Management and Design Manual

Managemen f Alfernafives
In this section, typical reduced requirement disposal alternatives are discussed; the suitability of each alternative will depend on the characteristics of the by-product to be disposed. Obviously, the number of alter- natives that could fall under this category are endless and depend greatly upon site-specific criteria such as area geology, depth to groundwater, climate, etc. However, the containment systems shown in Figure 64 are typical of reduced requirement landfill designs. The methods used to demonstrate the adequacy of a selected design are presented in Chapter 8. This section presents information on typical reduced requirement landfiil configurations, the level of by-product processing required before disposal, the use of by-product material as a barrier layer, and the economic impacts of the alternative.
7.2. I Reduced Requirement Containment Systems
The reduced requirement containment systems described in this section take advan- tage of the self-cementing and/or pozzolanic properties of many advanced coal technology by-products which may be suitable for barrier layer construction, serving as a supplement to either the liner or the cover. These cementitious properties have been demonstrated for FBC by-products from several sources, and may be generally applicable to coal combustion by-products containkg significant amounts of lime. However, the performance of individual by-products and the suitability of by-products from other types of advanced coal technologies for barrier layer construction must be evaluated on an individual basis.
The primary objectives of any con- tainment system are to protect and preserve both surface water and groundwater quality. Surface water controls have been discussed in detail in Section 6.1.2, so the discussion in this section will concentrate on the protection of groundwater. To protect groundwater, a land- fill containment system should be designed to adequately minimize, collect and contain
leachate from a landfill. A containment system for this alternative can be divided into the following three basic components:
Soil cover;
Processed by-product; and
Liner system.
The level of by-product processing can be the most critical v , ~ a b l e affecting a pro- posed design. The level of processing is defined as the amount of effort needed to handle, mix or blend, hydrate, and place by- product material in the disposal facility. As noted in Figure 64, previously presented, there are two levels of effort discussed in the pro- cessing of by-product material.
Processed by-products used for liner and cover barrier layers are referred to as processed by-product and fly ash material. Processed FBC and fly ash mixtures have been shown in laboratory and field-scale tests to have physical properties (e.g., low permeability and high strength) that may meet the perfor- mance requirements of a standard barrier layer. However, the long-term performance of such mixtures has not been adequately documented. Examples of mixes and testing programs to demonstrate the adequacy of this type of material for use as a barrier layer are further discussed in Section 7.2.2 and in Chapter 8.
Minimally processed by-product mat- erial is defined, for the purposes of this report, as a material that has undergone some pro- cessing (i.e., hydration, mixing, and possible compaction); however, the material has not been processed to the degree described above. Minimally processed by-product material gene- rally makes up the majority of the body of the landfill. In this case, no special requirements would be specified for the material except that it possess adequate strength to support the cap material and also that it remain stable. In most
159 Advanced Coal Technology By-product Disposal Management and Design Manual

Management Alternatives
(v S 0 - c. 4
L
B 0 -
i E 0 .- c. 4
Advanced Coal Technology By-product 160 Disposal Management and Design Manual
Management Alternatives
cases this minimal processing will simply mean adding the minimum amount of water required to control dusting to the dry material and placing it in the landfill.
Minimally processed by-product may serve a secondary function during landfill construction by absorbing rainfall incident on the landfill. Precipitation may be taken up by continuing hydration reactions, minimizing the amount of leachate which is generated.
The containment system options, shown in Figure 64, are generally arranged from the system that provides the most protection (Option 1) to the option that pro- vides the least amount of protection (Option 5). However, each of these options may be appli- cable in certain situations. For example, Option 5 may be applicable for some arid (less than 25 inches of annual precipitation) areas of the country because of the minimal threat of leachate production. Option 1 may be better suited to areas that receive a substantial amount of precipitation. Options 1 and 3 are similar to the more standard containment system designs presented in Alternative 1. The main difference between these specific alter- natives is that processed by-product material is used for a barrier layer in Options 1 and 3 instead of the compacted clay layers used in Alternative 1. Options 1 and 4 rely on a flexible membrane liner as part of the cap to minimize leachate production. Option 2 calls for a high level of material processing for the entire body of by-product, as well as a soil cover, to minimize leachate production. One common component of each of these alterna- tives is that a vegetated soil cover is provided to ensure surface water quality, protect the waste material from erosion, and minimize infiltration by promoting evapotranspiration.
I
As noted earlier, the design of an adequate containment system depends greatly upon site-specific criteria such as the local geology, depth to groundwater, and climate. Design procedures will be discussed in more detail in Chapter 8.
7.2.2 Use of By-Product Material as a Barrier Layer
As discussed in the previous section, several of the reduced requirement options presented as part of Alternative 2 involve the use of by-product material as a barrier layer. Information gathered from this project and other research projects indicates that certain types of advanced coal technology by-product material may be suitable for use as barriers if processed correctly. The information in this section is also intended to give the reader a general understanding of what may be required to demonstrate the performance of a landfill barrier layer composed of by-product material. For example, the construction of a test pad may be required by some state regulatory agencies to demonstrate the effectiveness of a by-product barrier layer. A test pad should be designed to demonstrate the construction techniques that will be used to build a barrier layer. Subsequent monitoring demonstrates its performance as a barrier layer. The monitoring program mainly consists of permeability testing; however, other properties of the material may also be tested, including the strength and leaching potential of the by- product material.
Two test pads were constructed during this project (as previously described in Section 6.4) to investigate potential mix designs, barrier layer quality assurance testing, and construction techniques. An overview of the information gathered during the construction and monitoring of the test pads is presented in this section. More detailed information can be found in Chapter 9.
Pre-Construction f aboratory Testing Program
The objective of the two Illinois test pads (or cells) was to produce a material possessing a permeability of no greater than 1 x 10 cdsec. This is the permeability value typically used by regulatory agencies to define a barrier layer. However, a barrier layer may
161 Advanced Coal Technology By-product Disposal Management and Design Manual
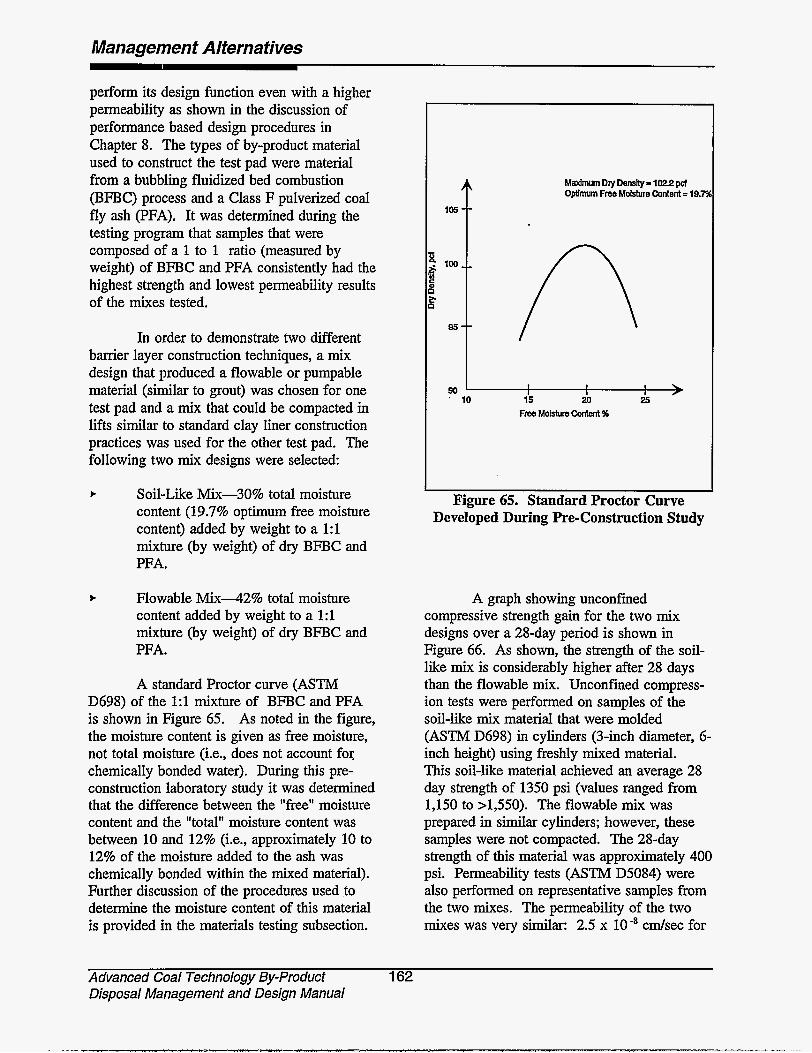
Management Alternatives
A 105 --
loo _ _
95 --
90
perform its design function even with a higher permeability as shown in the discussion of performance based design procedures in Chapter 8. The types of by-product material used to construct the test pad were material from a bubbling fluidized bed combustion (BFBC) process and a Class F pulverized coal fly ash (PFA). It was determined during the testing program that samples that were composed of a 1 to 1 ratio (measured by weight) of BFBC and PFA consistently had the highest strength and lowest permeability results of the mixes tested.
I 1 I 1 I 1 >
In order to demonstrate two different barrier layer construction techniques, a mix design that produced a flowable or pumpable material (similar to grout) was chosen for one test pad and a mix that could be compacted in lifts similar to standard clay liner construction practices was used for the other test pad. The following two mix designs were selected:
b Soil-Like Mix-30% total moisture content (19.7% optimum free moisture content) added by weight to a 1:l mixture (by weight) of dry BFBC and PFA.
t Flowable M i x 4 2 % total moisture content added by weight to a 1:l mixture (by weight) of dry BFBC and PFA.
A standard Proctor curve (ASTM D698) of the 1:l mixture of BFBC and PFA is shown in Figure 65. As noted in the figure, the moisture content is given as free moisture, not total moisture (i.e., does not account for chemically bonded water). During this pre- construction laboratory study it was determined that the difference between the "free" moisture content and the "total" moisture content was between 10 and 12% (i.e., approximately 10 to 12% of the moisture added to the ash was chemically bonded within the mixed material). Further discussion of the procedures used to determine the moisture content of this material is provided in the materials testing subsection.
M d m u m Dry Density- 1022 pcf Optlmum Free Moisture Content = 19.7
Figure 65. Standard Proctor Curve Developed During Pre-Construction Study
A graph showing unconfined compressive strength gain for the two mix designs over a 28-day period is shown in Figure 66. As shown, the strength of the soil- like mix is considerably higher after 28 days than the flowable mix. Unconfined compress- ion tests were performed on samples of the soil-like mix material that were molded (ASTM D698) in cylinders (3-inch diameter, 6- inch height) using freshly mixed material. This soil-like material achieved an average 28 day strength of 1350 psi (values ranged from 1,150 to >1,550). The flowable mix was prepared in similar cylinders; however, these samples were not compacted. The 28-day strength of this material was approximately 400 psi. Permeability tests (ASTM D5084) were also performed on representative samples from the two mixes. The permeability of the two mixes was very similar: 2.5 x 10 -* c d s e c for
Advanced Coal Technology By-product 162 Disposal Management and Design Manual
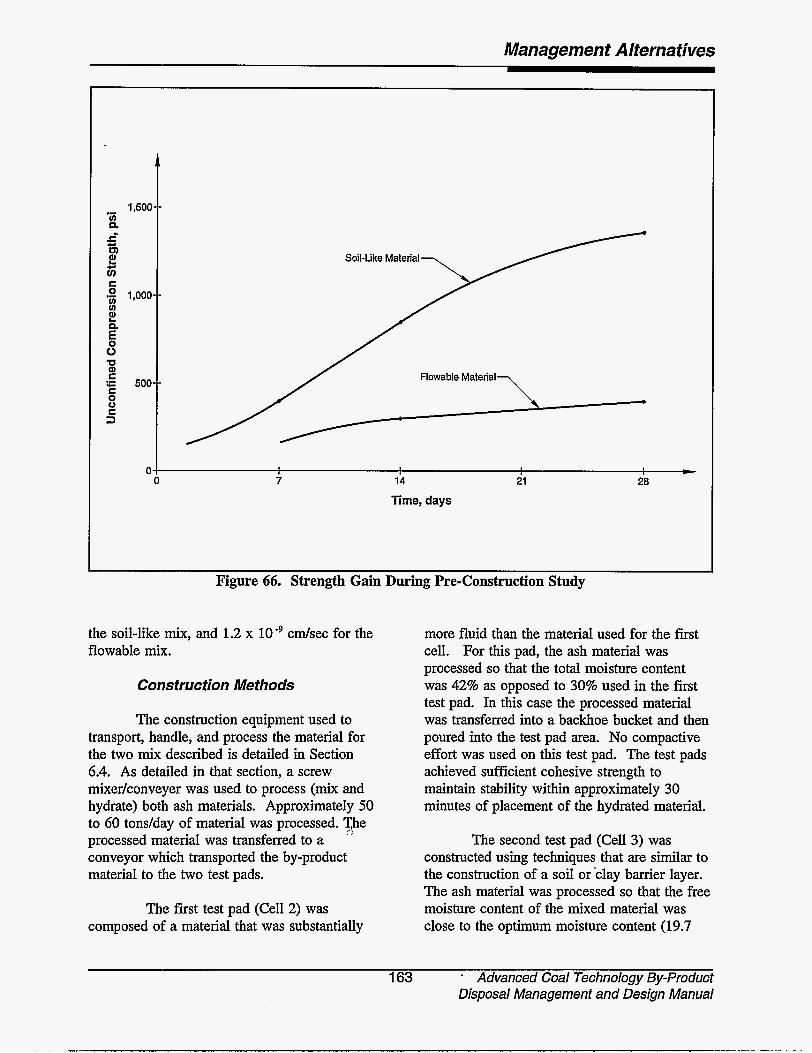
Management A lferna fives
1,500 0-
u) a z 2 tj
.A 1,000
h s
Is)
S
u)
0 m aI S c 500 E 0 0 E 3
.-
0,
Soil-Like Material
Flowable Material
- 7 14 21 28
Time, days
Figure 66. Strength Gain During Pre-Construction Study
the soil-like mix, and 1.2 x lo-’ cdsec for the flowable mix. cell. For this pad, the ash material was
more fluid than the material used for the first
processed so that the total moisture content was 42% as opposed to 30% used in the first test pad. In this case the processed material
Construction Methods
The construction equipment used to transport, handle, and process the material for the two mix described is detailed in Section 6.4. As detailed in that section, a screw mixer/conveyer was used to process (mix and hydrate) both ash materials. Approximately 50 to 60 tons/day of material was processed. The processed material was transferred to a conveyor which transported the by-product material to the two test pads.
i>
The first test pad (Cell 2) was composed of a material that was substantially
was transferred into a backhoe bucket and then poured into the test pad area. No compactive effort was used on this test pad. The test pads achieved sufficient cohesive strength to maintain stability within approximately 30 minutes of placement of the hydrated material.
The second test pad (Cell 3) was constructed using techniques that are similar to the construction of a soil or ‘clay barrier layer. The ash material was processed so that the free moisture content of the mixed material was close to the optimum moisture content (19.7
163 . Advanced Coal Technology By-product Disposal Management and Design Manual
Management Aliernaiives
percent). After the material was discharged to the pad location, the material was distributed in 6- to 8-inch thick lifts over the pad area (70 feet by 30 feet). Each lift was then compacted by a vibrating smooth drum roller.
Materials Testing Program. During Construction
The objective of the materials testing program during the test pad construction was to assure compliance with the design specifica- tions established by the pre-construction testing program. This testing also helped to establish baseline physical and chemical properties that will be used to assess the long-term performance of the two test pads. The following subsections provide a discussion of the test methods used to quantify the physical properties of the by-product material during construction. For additional information, refer to Section 9.2.3.
Standard Proctor (ASTM D698)-The Standard Proctor test was performed for the first test pad (soil-like mix) to determine compaction density and its relationship to moisture content, and also to monitor the as-placed compaction density in relation to the pre-construction study (refer back to Figure 65). The average optimum free moisture content for the as-placed material was 22.1%, the average maximum dry density was 88.1 pcf (the most reliable values are 22.6% and 90.7 pcf). Both the as-placed and pre- construction Proctor tests were performed using a modified oven-dry method to obtain the moisture content. The oven temperature was reduced from 105°C to 50°C to ensure that the chemically bonded water was not driven off as specified in the ASTM method for materials containing gypsum (CaS04.21-I;?O). However, during one as-placed Proctor test, the moisture content was determined using ASTM D4944 (Speedy Moisture Test using calcium carbide). The Speedy test was also the method used in the field to determine moisture content (see next subsection) of the processed by-product material.
Moisture Content-The following three techniques were used to determine the moisture content of the processed by-product material:
Modified ASTM D2216-Oven-dry at 50°C;
ASTM D4944-Speedy Moisture Kit; and
ASTM D2922-Nuclear Moisture- Density Test.
Of the three techniques used, the speedy moisture kit provided the most consis- tent, reliable, and quickest results. The nuclear moisture-density test generally responds to both free and chemically bound water, and may require extensive, site-specific calibration to allow direct comparison with other types of moisture content measurements.
.
The general procedure for determining moisture content by means of a Speedy Kit or calcium carbide gas moisture tester is to place a certain weight of processed by-product material together with a certain amount of calcium carbide reagent into the apparatus and shake the tester vigorously with a rotating motion. The calcium carbide reacts with the free moisture within the ash. A simple dial reading is then made, which gives the percent moisture by wet weight of by-product, which can then be converted to percent moisture by dry weight of by-product. This procedure was used throughout the construction of both test pads. A few oven-dry tests were used to verify the Speedy tests during the construction of the first test pad. Generally, the results of the oven-dry tests were within 10% of the Speedy tests.
As stated earlier, approximately 30% of water (total moisture by weight) was added to the material placed in the first test pad (soil- like mix). Generally, the free moisture content during compaction ranged from 19 to 25 percent. Optimum from the pre-construction
Advanced Coal Technology By-product 164 Disposal Management and Design Manual
/
Managemenf Alternatives
Proctor was 19.7%, 22.1% from the as-placed. For the second test pad (flowable mix), 42% total moisture by weight was added to the dry ash material during mixing. After the flowable material had been placed in the cell and gained some strength (approximately 30 minutes) the moisture content had changed to approximately 28 to 29% free water as determined by the Speedy moisture kit. These results indicate that more complete hydration of the by- products was achieved in the second mix, with 13 to 14% water bound by hydration, as opposed to 5 to 11% in the first mix.
Density (ASTM D2922)-The nuclear density method was used to determine the in- place wet density of the first test pad material after compaction. The wet density was converted to dry density using the Speedy moisture content. Generally, over 100% of the as-placed Standard Proctor compaction (90.7 pcf) was achieved on the material in this test pad (soil-like mix). This was mainly due to the largeheavy compaction equipment used. Dry densities after compaction ranged from 90.2 pcf to 104.2 pcf.
Unconfined Compressive Strength (ASTM D2166)--Samples of the mix types were taken during construction of both test pads and tested for unconfined compressive strength (UCS) after 7, 14, and 28 days; at 4 months; and at 8 to 10 months (Table 7-2). UCS tests were performed on cylinders formed (ASTM D698) in molds (3" diameter, 6" height) using processed material as it was placed. When compared to the pre- construction study, the as-placed material had similar early strengths and further increases in strength over time. For the soil-like material, the 28 day UCS was between 1120 and 1620 psi. For the flowable material (which was not compacted within the molds), 28 day UCS was between 760 and 790 psi.
During construction, strengths of the by-product mixes were measured using a pocket penetro'meter immediately after placement in the test pad. The compacted soil-
like material yielded strengths of 14 to 35 psi. Pocket penetrometer tests performed on the flowable material, approximately 30 minutes after placement, indicated strengths of less than 7 psi. However, the material did not slough when a vertical cut was made through the placed material. The strength approximately 24 hours after placement ranged from 20 psi to 35 psi.
Core samples from the two mix test pads were also tested for strength and permeability. These results indicate that the field performance of the compacted soil-like mix was generally similar to that predicted by the pre-construction study of the cylinders prepared from the as-placed mixture but cured in a controlled environment. Four months after placement, core samples of the compacted soil- like mix had an average strength of 1980 psi and an average permeability of 2.2 x 10 cdsec. The core samples from the flowable mix test cell indicate that this mixture has experienced rapid weathering in the field environment. The laboratory-cured cylinders indicate potential strengths of over 3000 psi, and a permeability of 2.0 x contrast the field cores averaged only 400 psi strength and a permeability of 8.2 x lo5 cdsec, as shown in Table 30.
cdsec; in
Permeability (ASTM D5084)-The results of the permeability tests for both mix types are listed in Table 30, which includes both pre-construction and field test data. The cylinders for the permeability tests were prepared generally according to the methods described above for the UCS tests.
7.2.3 Economic Analysis of Alternative 2
The cost considerations for a reduced requirement landfii similar to those for Alternative 1 can be broken out according to the following categories:
F Site selection;
165 Advanced Coal Technology By-product Disposal Management and Design Manual

Managemen f Alfernafives
Table 30 Strength and Permeability Results for Both Mix Types
Test Strength (psi) Permeability (cdsec)
Soil-Like I Flowable SoS-Lie I Flowable Preconstruction Cylinders, 1150 - >1550 400 2.5 x lo-’ 1.2 x 1 0 - 9 28 days Field Molded Cylinders, 1120 - 1620 760 - 790 5.16 x 10⁻⁷ 2.67 x 28 days Field Molded Cylinders, 1564 1163 Not analyzed Not analyzed 4 months
8-10 months
4 months (average) (1 890) (400) 4.6 x 10⁻⁷ 2.5 x 10” (8.2 x lo5)
Field Molded Cylinders, 5000 3257 1.5 x lo6 2.0 x 10⁻⁷
Field Core Samples, range at 935 - 2389 156 - 1114 4.4 x - 2.5 x 10⁻⁷ -
(2.2 x lo”)
b
t
Public relations;
Permitting;
By-product material characterization;
Design;
Construction;
Facility operation;
By-product transportation; and
By-product processing.
Depending upon the geology, hydro- geology, and local political climate of the proposed site, the costs associated with the first four factors listed above can vary greatly. Because this alternative does not have an extensive performance record, as do the traditional landfill containment systems, public opposition and regulatory scrutiny may be greater. Since the processed by-product
material is used as a barrier to infiltrating precipitation, extensive characterization of the material‘s properties may be required. This will be necessary to demonstrate to local regulatory agencies and the community that leachate and runoff from the proposed landfill will not adversely affect the surrounding environment. It is also possible that more research will be required in the design phase since this technology is not as widely accepted. Costs associated with these four tasks could range between $300,000 and $1,000,000.
Design, construction, and operation of the reduced requirement landfill may be 15 to 25% less expensive than the traditional landfill because of the reduction in liners and the absence of a leachate collection system. For a traditional landfill these costs are estimated to be between $750,000 and $1,000,000 for startup, and another $200,000 per acre. Transportation costs are dependent upon the distance between the landfill and the generating plant. Transportation options are discussed in detail in Section 6.2.2. The processing of the
Advanced Coal Technology By-product 166 Disposal Management and Design Manual
Management Alfernafives
ash will be extensive for the reduced permeability cap and liner, but those costs should generally be less than for synthetic or clay liners. The actual fill material may also have to undergo more processing for a reduced requirement landfill since the design may require it to be of a specified permeability. Processing options are discussed in detail in Section 6.3.
If the local geology and hydrology support it, and the regulators and surrounding community are receptive to an innovative design, a reduced requirement landfill can be the least expensive method of disposal. On the other hand, the costs of design, testing and permitting delays may make this type of landfill more expensive than any of the other three alternatives presented in this section, if significant regulatory or community opposition develops.
7.3 Alternative 3-By-product Stacking Disposal Methods
As opposed to the previous alterna- tives, Alternative 3 discusses a wet disposal technique. In this case, wet is defined as mixing enough water with the by-product material to create a flowable slurry containing approximately 10 to 15% solids. In some instances, wet disposal can simplify material handling practices. In place of conditioning and processing components and equipment (such as vehicle loading facilities, transport vehicles, and bulldozers, graders, and rollers for material placement), material handling can be accomplished with a slurry pump, a pipeline to the stacking area, and a dragline. It should be noted that wet disposal techniques were not a focus of the field portion of this project; however, this alternative is presented to familiarize the reader with a broad range of disposal alternatives.
The stacking disposal method refers to a method of disposal traditionally associated with waste gypsum produced by the phosphate fertilizer industry. The following subsections
present an overview of the gypsum stacking disposal technique developed from information contained within the FGD Bv-Product Disposal Manual By-product stacks offer several advantages over simple impoundments. Because stacks are typically constructed above- ground, stream diversions and run-on water management problems often associated with impoundments are avoided. Stacks are also easier to site, since no natural depressions or excavations are required. Stacks may also provide more efficient use of available land since they can be built up to a uniform height. Finally, stacks typically generate less leachate than impoundments since surface water and precipitation tend to infiltrate less on their raised surface.
Gypsum stacks similar to that described here are in use for FGD by-product management at several utility sites including the advanced Chiyoda Thoroughbred-121 FGD system funded in part through the Department of Energy Clean Coal Technology program at Georgia Power Company’s Plant Yates.
7.3.1 Stack Design
The most economical stacking method is the upstream method of construction. In this method, shown in Figure 67, an earthen starter dike is first constructed to form a sedimenta- tion pond and stacking area over a lined exca- vation covering the planned area of the stack. By-product is then pumped to the sedimen- tation pond in slurry form, usually at 15 to 20% solids, and allowed to settle and drain. Process water is decanted and returned to the plant. Once sufficient sediments buildup within the pond, the material is excavated with a dragline to raise the perimeter dikes of the stack. The process of sedimentation, excavation, and raising of the perimeter dikes continues on a regular basis during the active life of the stack.
The experience gained from the operation and performance of phosphate gypsum an.d FGD sludge stacks can be used in
167 Advanced Coal Technology By-Product Disposal Management and Design Manual
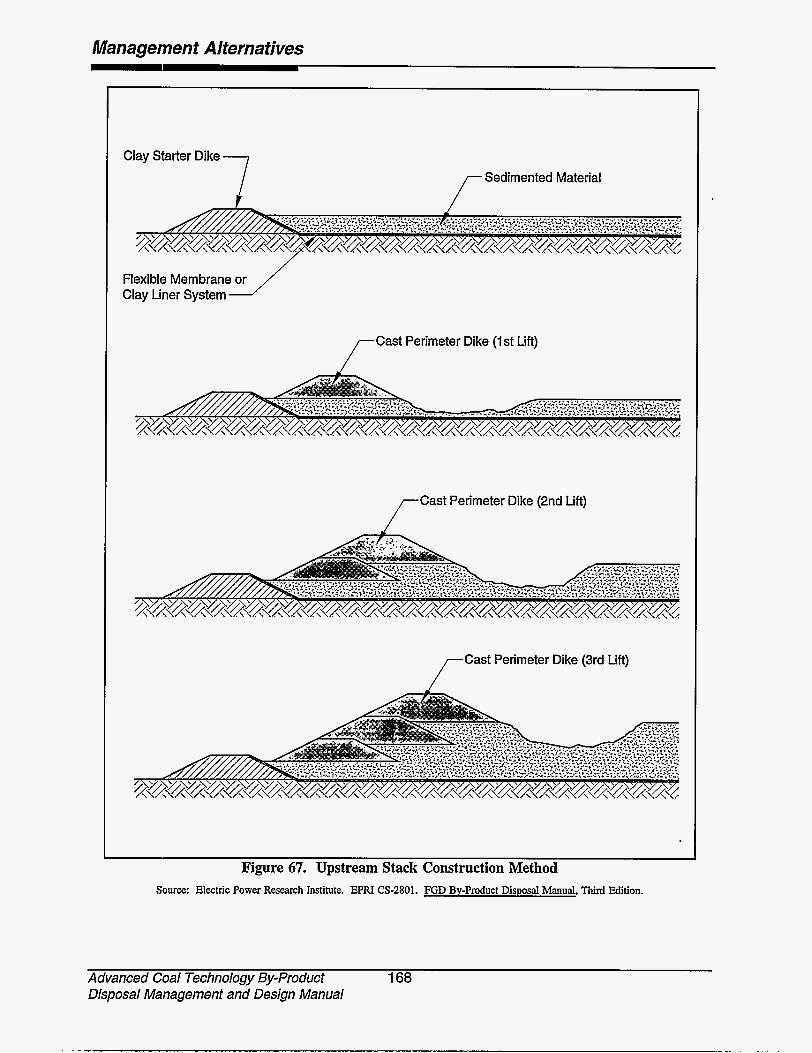
Managemen f A lferna fives
7 Clay Starter Dike ,- Sedimented Material
Flexible Membrane or Clay Liner System
,-Cast Perimeter Dike (1st Lift)
,-Cast Perimeter Dike (2nd Lift)
Cast Perimeter Dike (3rd Lift) r
Figure 67. Upstream Stack Construction Method Source: Electric Power Research Institute. EPRI CS-2801. FGD By-product Disposal Manual, Third Edition.
Advanced Coal Technology By-product 168 Disposal Management and Design Manual
Management Alternatives
planning other by-product material stack disposal operations. An illustration of a typical stack design is shown in Figure 68. The specific features included in this shck are discussed below.
In plan, the stack is usually a squdre or a rectangle with a two to one length to width ratio. Ideally, a circular shape would give the minimum length of perimeter dike enclosing a given area. If a divider dike is included to separate the stack into two ponds the difference in length of dike between a square and circular stack is only 7 percent. Some type of liner system will generally be required to control off-site migration of leachate from the stacks or pond.
The area of the gypsum stack should be selected to allow raising the perimeter dikes approximately 5 to 8 feet per year. For a typical central Florida phosphate fertilizer plant where the production rate of gypsum is 2,700 to 5,500 tons per day, gypsum stacks have been proportioned for 11 to 170 tons per day per acre.
The gypsum stack is normally divided into at least two ponds. This allows one pond to drain while the other pond is in use. The dragline can then excavate gypsum from the drained pond to raise the perimeter dike. The divider dike typically runs parallel to one side of the stack and divides the stack into ponds of approximately equal size.
The process water surge pond is built around the perimeter of the stack. The exterior dike forming the surge pond has sufficient freeboard to contain water stored on top of the stack in the event of accidental spillage. The surge capacity of the pond is typically designed to contain 1.5 times a 25-year, %-hour storm on the watershed of the pond with no storage on the stack. Freeboard clearance above the maximum fluid level in the pond can vary from 3 to 5 feet and is normally governed by state and local regulations.
A clay starter dike is shown in the illustration and is preferred if suitable clay material is available. Sand dikes are commonly used in Florida, but must be pro- tected against piping, erosion, and seepage. Stacks used for disposal of coal combustion by-products will generally include a liner system which will provide this protection. The starter dike should be constructed to a crest width of 20 feet to allow easy operation of construction equipment and should not be covered with gypsum when the stack is raised. The starter dike should be high enough to allow sufficient gypsum to sediment within the stacking area for excavation and raising of the f i s t lift of the perimeter dike. A starter dike height of 8 feet, allowing sedimentation of 5 feet of gypsum and 3 feet of freeboard, is usually sufficient.
Fixed vertical riser decant structures are shown in the center of the stack near the divider dike. This allows finer material to settle at the center of the stack and coarser material around the perimeter of the stack. This is not an essential feature; however, it does eliminate the problems of trying to use soft, fine, and wet material in construction of the perimeter dikes.
Planning of a gypsum stack and process water return system is important in the engineering design. The process constraints and climatic constraints must be initially established. The process constraints may include an estimate of gypsum production, the planned life of the plant and stack, and in-flow and out-flow process water quantities and water temperatures. Climatic conditions must be considered because they influence the process constraints. Both heat balance and water balance analyses are influenced by climatic conditions. If the plant is located in climates where severely cold winters occur, the effects of freezing on the design of the gypsum stack and process water return system, as well as the effect on limiting the construction season, must be considered.
169 Advanced Coal Technology By-product Disposal Management and Design Manual

Management Alternatives
I I I I I I I > Y Y Y Y Y Y y=%\ 4 h h h h
1
I I
I
I - - - I I Active 1 Pond I I I 1 Decant I Structures
1 I ' I
l-,,, " V V
~
d 7 Y Y Y Y Y Y, Perimeter Ditch and Surge Pond
\\\ \
/ / / /
Y Y Y
Site Plan
Clay Exterior Horizontal Discharge
Active Divider Drained Po,nd
D i r Po,nd
Clay Starter Dike
rPerimeter Ditch
Liner-' -Fixed Vertical Riser Type Decant Stuctures
Cross-section A - A
Figure 68. Typical Stack Design
Advanced Coal Technology By-product 170 Disposal Management and Design Manual

Management Alternatives
Once the process constraints and climatic constraints have been established, the size of the gypsum stack and process water return system can be estimated. The area required for the gypsum stack is related to the quantity of gypsum produced and design height of the stack. The height may be controlled by foundation conditions if a soft foundation underlies the stack. Otherwise, the height may be controlled by pumping considerations or even aesthetic considerations. Wind erosion and dusting may also become more severe as the stack height increases. Final cover and closure procedures for a by-product stack are similar to those discussed for landfills under Alternatives 1 and 2.
7.3.2 Sfack Operation
The two most important considerations in the operation of a stack are the retention of fie-grained material within the stack and the characteristics of the material deposited around the peripheiy of the stack. If sufficient detention time is not provided within the ponded area on top of the stack, complete clarification will not occur and the finer particles will discharge through the spillway and sediment within the surge pond. This problem has occurred at several phosphate gypsum stacks and required the dredging of fie-grained gypsum from the surge pond.
Although finer-grained material can often be cast to raise the perimeter dikes, the lower permeability of f i e materials does not allow drainage to occur as quickly as with coarser-grained material. Consequently, it is more difficult and time-consuming to use the finer material to raise the stack. For this reason, it is desirable to deposit the coarser material around the perimeter of the stack.
It is possible to operate a stack so that the coarser material is always deposited around the perimeter of the stack while simultaneously providing sufficient retention time for .the finer particles to settle within the interior of the stack. This is accomplished by using an
elevated ditch to carry the material around the perimeter of the stack and to create a ponded area within the interior of the stack.
The disposed-of material is generally cast to raise the perimeter dikes using a drag- line. The cast material is then shaped to form a road on the crest of the dike using a bulldozer. In some cases, a bulldozer has been used to both raise and shape the perimeter dikes. In both cases, it is desirable to allow the elevated ditch to drain prior to raising the stack, although it is often possible, using the dragline, to raise the stack without draining the disposal area.
7.4 Alternative &Mine Reclamation and Backfill Uses
Options for by-product management considered beneficial include mine reclamation, backfiil, and (to a lesser degree) acid mine drainage treatment. For issues affecting the implementation of these options, refer to Table 31. Mine reclamation and backfill applications are very similar to the options presented as part of Alternative 2; however, they can be considered beneficial uses because the by-products perform useful functions. Alternative 4, which may be considered for both active or abandoned surface and underground mines, is appealing because by- products are returned to their point of origin. In many cases, coal contracts are negotiated that stipulate a mine to accept back-hauled combustion by-products.
Currently, underground mine disposal is used to dispose of coal mining wastes and to reduce the effects of mine subsidence. However, underground disposal will require more specialized equipment, more intense coordination efforts, and will be more expensive than surface disposal. Since most facilities using advanced coal technologies use bituminous or subbituminous coal from surface mines, or are located in areas with nearby surface mines, active surface mines appear to be the most attractive alternative for mine
171 Advanced Coal Technology By-product Disposal Management and Design Manual
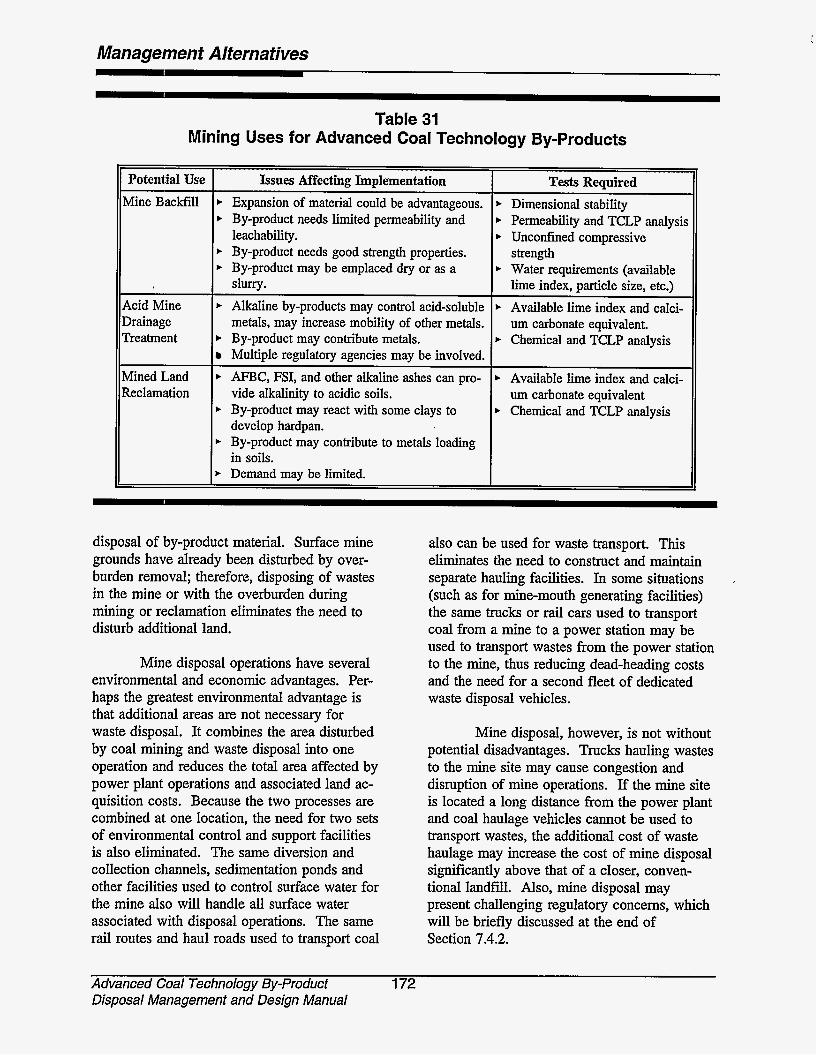
Management A lternatives
Table 31 Mining Uses for Advanced Coal Technology By-Products
Potential Use Mine BacKill
Acid Mine Drainage Treatment
Mined Land Reclamation
Issues Affecting Implementation Tests Required b Expansion of material could be advantageous. b Dimensional stability t By-product needs limited permeability and b Permeability and TCLP analysis
leachability. b Unconfined compressive b By-product needs good strength properties. strength b By-product may be emplaced dry or as a b Water requirements (available
slurry. lime index, particle size, etc.) b Alkaline by-products may control acid-soluble Available lime index and calci-
metals, may increase mobility of other metals. um carbonate equivalent. b By-product may contribute metals. b Chemical and TCLP analysis
Multiple regulatory agencies may be involved. b AFBC, FSI, and other alkaline ashes can pro- b Available lime index and calci-
vide alkalinity to acidic soils. um carbonate equivalent b By-product may react with some clays to b Chemical and TCLP analysis
develop hardpan. b By-product may contribute to metals loading
in soils. b Demand may be limited.
disposal of by-product material. Surface mine grounds have already been disturbed by over- burden removal; therefore, disposing of wastes in the mine or with the overburden during mining or reclamation eliminates the need to disturb additional land.
Mine disposal operations have several environmental and economic advantages. Per- haps the greatest environmental advantage is that additional areas are not necessary for waste disposal. It combines the area disturbed by coal mining and waste disposal into one operation and reduces the total area affected by power plant operations and associated land ac- quisition costs. Because the two processes are combined at one location, the need for two sets of environmental control and support facilities is also eliminated. The same diversion and collection channels, sedimentation ponds and other facilities used to control surface water for the mine also will handle all surface water associated with disposal operations. The same rail routes and haul roads used to transport coal
also can be used for waste transport. This eliminates the need to construct and maintain separate hauling facilities. In some situations (such as for mine-mouth generating facilities) the same trucks or rail cars used to transport coal from a mine to a power station may be used to transport wastes from the power station to the mine, thus reducing dead-heading costs and the need for a second fleet of dedicated waste disposal vehicles.
I
Mine disposal, however, is not without potential disadvantages. Trucks hauling wastes to the mine site may cause congestion and disruption of mine operations. If the mine site is located a long distance from the power plant and coal haulage vehicles cannot be used to transport wastes, the additional cost of waste haulage may increase the cost of mine disposal significantly above that of a closer, conven- tional landfill. Also, mine disposal may present challenging regulatory concerns, which will be briefly discussed at the end of Section 7.4.2.
Advanced Coal Technology By-product 172 Disposal Management and Design Manual
Management Alternatives
7.4.1 Mining and By-Producf Disposal Techniques
The techniques used to dispose of by- product material in old or active mine sites are very similar to the techniques used to place this material in a landfill. The main difference (other than regulatory issues) is that disposal activities will need to be incorporated into the overall mine operation and reclamation plan in order to minimize disruption of routine mine operations. The following two subsections present a description of two disposal techniques which might be used in surface mines.
Area Surface Mining and Disposal
Surface mining in the relatively flat terrain common to midwestern and western coal fields is known as area surface mining. A typical area surface mine disposal operation is illustrated by Figure 69. In an area surface mining operation, long strip pit cuts are opened with a dragline or power shovel to remove overburden from the coal seam. The overburden is cast aside in long piles parallel to the strip pit in areas where coal has been previously extracted. The coal is then extracted from the strip pit and loaded into trucks which haul it to a power station, rail terminal, or other destination. This process is repeated as mining progresses through the coal field. In this type of surface mining operation, by-product can be disposed of either in the pit bottom, as shown in Figure 7-13, or in the vee- notches of the spoil.
Contour Surface Mining and Disposal
Surface mining on steep slopes common to the Appalachian coal fields is known as contour mining because the strip cuts follow the contour lines of hillsides. In older mines the removed overburden was dumped downhill. Successive cuts were made into the hillside until overburden depths made it
uneconomical to continue. The mine was then abandoned and no reclamation work was conducted. Because of the adverse envi- ronmental impacts created, contour mining techniques have changed. Newer methods include "haul back" or "block mining." In these methods the overburden is placed behind the active mine area and the area is returned approximately to its original contour. Cross sections showing the development of a typical contour surface mine and disposal operation are shown in Figure 70. Another recently developed method is ''mountain top removal" in which the entire cap of overburden on a hill is removed and placed in the upper part of an adjacent valley. With these types of surface mining techniques waste can be intermixed with spoil material. Both mine spoil and wastes are hauled by trucks and intermixed as they are placed.
7.4.2 Required Design lnformafion
Design of a mine disposal operation is similar to that for a conventional landfill in that it requires a thorough knowledge of waste quantities to be generated, waste material properties, the proposed mine plan, general site conditions, and regulatory requirements. These topics are discussed in the following subsection.
Waste Quantities Generated
By-product quantities to be generated must be estimated in order to determine how much by-product will have to be disposed of in the mine. The amount (volume) of by-product disposed of in a mine, in most cases, must not exceed the amount of coal removed. The purpose of surface mine reclamation is to return the mined terrain to its original contour or to topographic configurations similar to the original terrain. Returning large quantities of coal by-products to the mine could create problems given this reclamation constraint. Another factor to be considered when estimating quantities of backfill is that the expansion of overburden during removal and
1 73 Advanced Coal Technology By-product Disposal Management and Design Manual

Management Alternatives
/
\ S W
E $ 9 0 -0
- 3 0.
d
Advanced Coal Technology By-product 1 74 Disposal Management and Design Manual
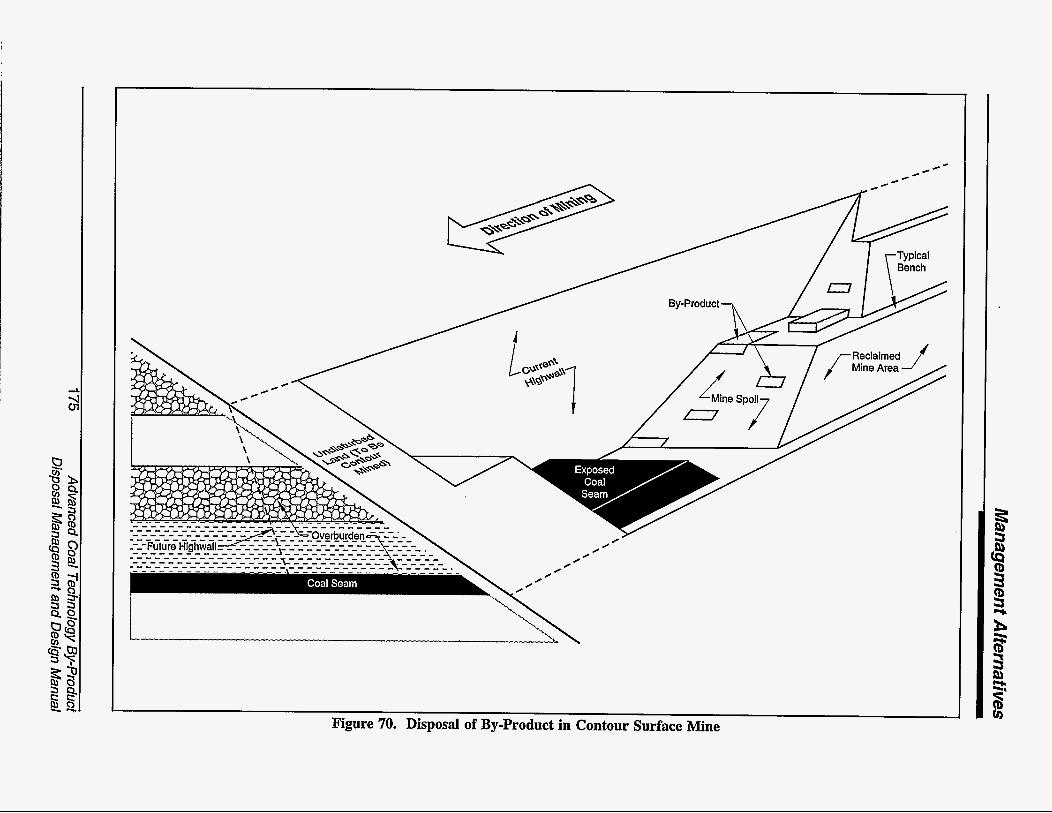
Figure 70. Disposal of By-product in Contour Surface Mine
Management A lfernaiives
reclamation creates additional volume. Since coal ash is typically only 10-15% of the coal by weight, the return of by-products to the mine site of its origin should not cause disruption of mining activities, or produce a problem with excessive backfill.
By-Product Properfies
To prepare a mine disposal plan, detailed data concerning the following by- product properties are required: strength, per- meability, leachate quality, and hydration pro- perties. These parameters are discussed in Chapter 3 for a variety of by-product types. The strength parameters are important especi- ally if the by-product is weaker than the overburden spoil. Weak by-product material can adversely affect stability, particularly in pit bottom disposal. This potential problem can be reduced by placing the material on the side of the strip pit farthest from the highwall (against the newly created spoil bank). This provides a region where no by-product exists when the next cut is taken, and overburden is dumped on the by-product. Low permeability by-product also can disrupt future groundwater recharge if spread continuously over a large area in pit bottom disposal. This problem, however, can be mitigated by placing the by- product in rows sandwiched between mine spoil as described previously. Leachate quantity and quality are important in deter- mining whether or not the by-product can be placed in a mine without adverse environmen- tal impact. Easily eroded by-product material may require additional protective measures to minimize surface water contamination. By- products containing significant quantities of quicklime and/or anhydrous calcium sulfate such as Atmospheric Fluidized Bed Combus- tion (AFBC) ash should be preconditioned with water prior to disposal to complete any hydra- tion reactions that otherwise could occur at the disposal site (similar to procedures described in Alternative 2). Excessive heat generation after disposal could create operating problems and impact codisposed materials if the materials are not adequately conditioned with water.
Proposed Mine Plan
The mine plan, detailing how the surface mine will be operated in conjunction with disposal activities, is critical in developing a mine by-product disposal operation. Waste disposal should not interfere with mining activities. Alterations may be required in the mine plan so that both operations can be conducted simultaneously with minimal interferences.
Site Conditions
Information concerning proposed conditions of the site after reclamation should be obtained. At a minimum, this information should include the final grading contour plan, and an estimate of the post reclamation groundwater conditions including location, flow direction and quality, and buffering and attenuation capabilities of the overburden. For example, tests conducted for disposal sites at lignite mines in North Dakota indicated that mine overburden materials had the capacity to neutralize alkaline solutions to some degree. These tests also indicated that waste disposal in the saturated zone was more likely to cause groundwater contamination. By estimating the post-reclamation site conditions, an assessment of possible adverse impacts can be made and appropriate steps taken to minimize those impacts. For example, prediction of the post- closure water table elevation would allow the operators to place the by-product high enough out of the groundwater so that leachate would be attenuated and neutralized by the overburden.
Regulatory Requirements
If the by-product material is used in mine reclamation, the regulatory agency may exempt the applicant from obtaining a solid waste permit if it can be demonstrated that the disposal method will not have adverse effects upon the environment. In many states, this regulatory agency would be the statemining agency rather than the environmental agency;
Advanced Coal Technology By-product 176 Disposal Management and Design Manual
Management Alternatives
however, in some instances mine disposal may be subject to joint regulation.
In anticipation of widening use of advanced coal technologies, several coal- producing and coal-using states have developed special regulations pertaining to mine reclama- tion using by-product from coal burning operations. The resulting requirements are often included in the mine permitting process for facilities planning to accept by-product. These requirements can include the following elements:
t Additional ground water monitoring;
t Modified facility operations plan;
t Additional insurancehonding requirements; and
t Detailed physical and chemical characterization of the by-product.
By-product placement is typically restricted to portions of the mine above the water table.
7.4.3 Economic Analysis
Mine disposal of advanced coal technology by-products has not been widely practiced to date; therefore, a quantitative economical analysis is difficult. However, tasks (similar to those for the other disposal alternatives) which affect the cost of a mine disposal operation can be qualitatively evaluated. These tasks are:
t Site Selection;
t Public Relations;
t Permitting;
t By-product Characterization;
b Design;
b Construction;
t Operation;
b Transportation; and
b Processing.
Mine application has several environmental advantages over other disposal alternatives previously mentioned. For this reason, public relations and permitting should typically progress with less difficulty. The primary environmental advantage is that less land will have to be disturbed. Because of this, the potential for environmental degrada- tion is greatly reduced. In addition, the mine reclamation will more closely approach the original contours of the land because of the additional fill material.
Permitting is often less complicated for mine disposal than for landfill disposal because of the elimination of a separate landfiil opera- ting permit. Additional requirements to standard mining procedures have to be met, but when compared to obtaining separate permits for mining and disposal facilities, the combined permit eliminates repetitious reporting, as well as the need to geologically characterize two separate areas for pre- and post-closure scenarios. In general, states that produce coal and bum it for energy have set up provisions to reduce some restrictive compliance monitoring requirements if it can be proven that the mine/disposal facility will not adversely effect the environment during operation and after closure.
Material characterization and pro- cessing required for mine disposal is similar to that for the reduced requirement landfill. This is necessary to demonstrate that the processed material will support overburden soil and also to verify that leachate and runoff from the proposed mine site will not adversely affect the surrounding environment.
177 Advanced Coal Technology By-product Disposal Management and Design Manual
Managemenf Alternatives
Because the two processes are com- bined at one location, the need for two sets of environmental control and support facilities is also eliminated. Therefore, the effort spent on design, construction, and operation will be significantly less than for a traditional or reduced requirement landfill. Mining equip- ment may have to be augmented to handle the by-product placement; however, the added cost of the equipment augmentation will be less than acquiring and maintaining a fleet of machinery necessary to operate a separate disposal facility.
The cost of transportation can significantly be reduced compared to other disposal alternatives. This is due to the possibility that haul routes and equipment used to transport coal also can be used for waste transport. This eliminates the need to construct and maintain separate hauling facilities. In some situations (such as for mine-mouth generating facilities) the same trucks or rail cars used to transport coal from a mine to a generating station may be used to transport wastes from the station to the mine, thus reducing dead-heading costs and the need for a second fleet of dedicated waste disposal vehicles.
7.5 Alternative 5-By-product Reuse Options
Due to the self-cementing nature of many advanced coal by-products, a manage- ment alternative to disposal may be to market the by-products for reuse. Table 32 lists a number of reuse options ranging from a lime and nutrient source for agriculture and mining reclamation; to the production of construction products and materials such as cement, con- crete, and structural blocks; from neutralization and stabilization of acidic waste sludges; to materials recovery. Marketing reuse options for advanced coal by-products can offer the generating plant a potential management alternative. However, few of these options have been demonstrated to be both technically and commercially viable for large volumes of
by-product material. Some options only have the potential to utilize small volumes of by- products; therefore, they may not offer a realistic management alternative to disposal. These options do, however, offer potential revenue sources. In addition, incentives for viable reuse programs may exist for both suppliers and users of advanced coal technology by-products in the form of "green products" specifications established by the government. .
By-product properties important to reuse applications include the compressive and shear strengths, permeability, shrink swell properties, resistance to weathering, leach- ability, and other properties included in the discussion of the disposal properties of advanced coal by-products in Chapter 3. Other important qualities for reuse include market acceptance, by-product standardization, conformance with accepted product quality standards for the materials they are replacing, and potential interactions with other materials in the reuse setting. Table 32 lists a number of potential uses in three different broad market areas, along with specific issues affecting the implementation of these reuse applications and the testing which might be required to resolve these issues. Not included in Table 32 are broader issues, such as the resistance to use of a "wastett product, reluctance to try new sources or suppliers, and the economics of competing materials. These qualities are not discussed in this manual, and must often be addressed on a case-by-case basis. As advanced coal technologies are more widely implemented the by-products will become more widely available and better understood by industry and regulators alike. If the by- products can consistently meet standards for product quality, this may lead to wider reuse markets.
Selected applications have proven to be able to utilize moderate to large volumes of material while compiling a successful performance record from demonstration projects. Structural block manufacture, for
Advanced Coal Technology By-Product Disposal Management and Design Manual
1 78
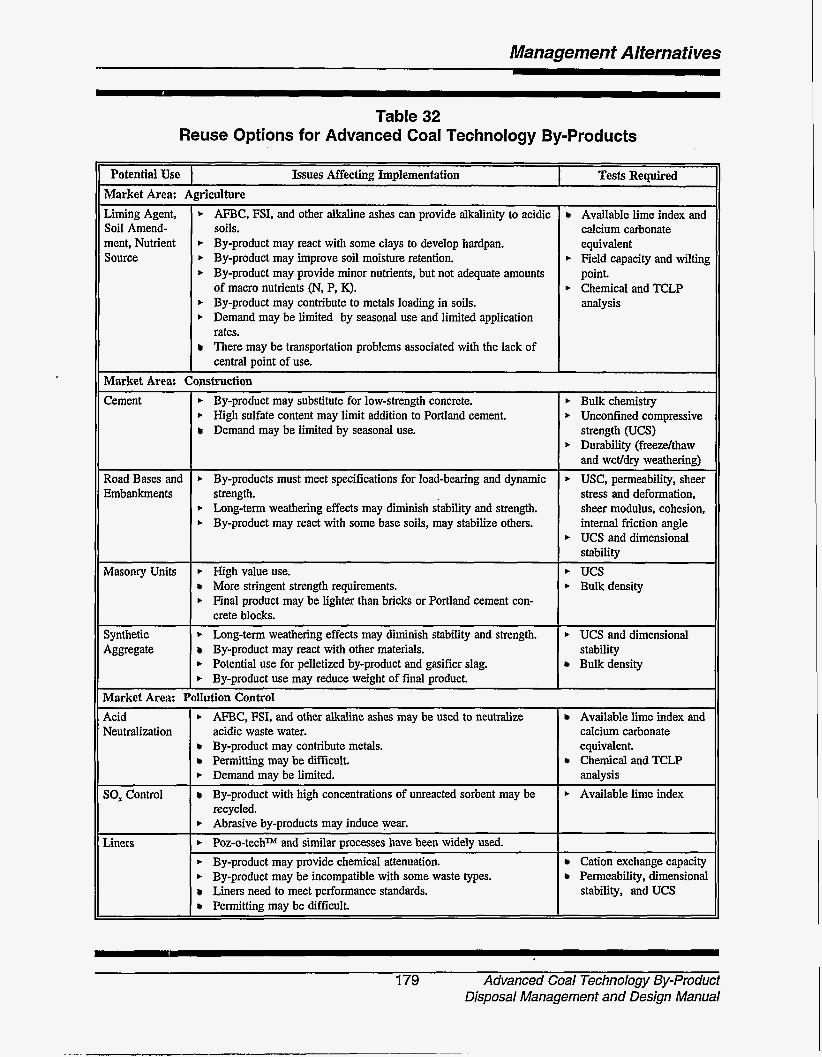
Managemen i Aliernatives
1 Liming Agent, Soil Amend- ment, Nutrient Source
Table 32 Reuse Options for Advanced Coal Technology By-Products
. AFBC, FSI, and other alkaline ashes can provide alkalinity to acidic soils. calcium carbonate . By-product may react with some clays to develop hardpan. . By-product may improve soil moisture retention. . Field capacity and wilting . By-product may provide minor nutrients, but not adequate amounts of macro nutrients (N, P, K). . Chemical and TCLP . By-product may contribute to metals loading in soils. analysis . Demand may be limited by seasonal use and limited application rates. There may be transportation problems associated with the lack of central point of use.
Available lime index and
equivalent
point.
. By-products must meet specifications for load-bearing and dynamic Road Bases and Embankments
. Bulkchemistry . Unconfined compressive strength (UCS)
b Durability (freezehaw and wet/dry weathering) . USC, permeability, sheer
Masonry Units r Aggregate Synthetic
Acid Neutralization
SO, Control
. AFBC, FSI, and other alkaline ashes may be used to neutralize acidic waste water. calcium carbonate
Available lime index and
Liners . Poz-o-techm and similar processes have been widely used. . By-product may provide chemical attenuation.
. By-product may substitute for low-strength concrete. . High sulfate content may limit addition to Portland cement. Demand may be limited by seasonal use.
equivalent.
analysis Chemical and TCLP
. Available lime index
Cation exchange capacity . By-product may be incompatible with some waste types. Liners need to meet performance standards. Permitting may be difficult.
. High value use. More stringent strength requirements. . Final product may be lighter than bricks or Portland cement con- crete blocks. . Long-term weathering effects may diminish stability and strength. By-product may react with other materials. . Potential use for pelletized by-product and gasifier slag. . By-product use may reduce weight of final product.
Permeability, dimensional stability, and UCS
' stress and deformation, 1 sheer modulus, cohesion,
internal friction angle . UCS and dimensional
' ucs . Bulkdensity
1 stability
. UCS and dimensional stability Bulkdensity
By-product may contribute metals. Permitting may be difficult. . Demand mav be limited. By-product with high concentrations of unreacted sorbent may be recycled. . Abrasive bv-uroducts mav induce wear.
179 Advanced Coal Technology By-product Disposal Management and Design Manual
Management Alternatives
example, is representative of a reuse opportunity which involves other industry sectors to produce an end product which must compete in open markets; it also serves to illustrate all of the elements of a successful reuse market development. However, strategies for developing, testing, and marketing reuse in the form of manufacturing applications are beyond the scope of this manual. The perspective of this report is that this form of reuse will augment, rather than replace, landfill disposal as the primary by- product management strategy.
Masonry block manufacture has been proposed as a possible market for advanced coal technology by-products. Several studies conducted over a period of nearly 15 years have suggested that mixtures of AFBC by- product and PFA can attain sufficient strength for use in structural applications ' 1 3* '. In combination these materials form a ''cementless concrete" which owes its strength to ettringite mineralization rather than the calcium silicate and calcium aluminate minerals in ordinary Portland cement. These studies identified several technical barriers to successful commercialization of cementless concrete products, including unpredictable swelling during cure, slow development of maximum strength, and potential loss of strength following prolonged exposure to water.
Additional research conducted by Wormser Development Co., conducted under a Small Business Innovative Research (SBIR) grant from DOE, produced prototype masonry units with high strength and negligible swelling, avoiding the major obstacles to commercial development of cementless concrete structural units identified in earlier studies. A proprietary FBC ash hydrator is key to Wormser's process, since complete hydra- tion of lime and gypsum in the raw ash is required to eliminate unpredictable swell during curing. Because FBCRFA mixtures are fine grained and readily molded, the Wormser
process has the potential to make structural blocks with more precise dimensions than traditional cemenvaggregate blocks if swelling during cure can be avoided. The potential .
improvement in manufacturing precision introduces the possibility for tongue-and- groove designs and thinner joints between the blocks. These features would allow the blocks to be aligned easily and joined with flexible adhesives, rather than cement-based mortar. Substantial reductions in installation costs and improvements in structural strength could be realized if these features were successfully implemented.
Wormser Development Co. designed a testing program to address remaining technical, manufacturing, economic, and regulatory issues related to commercializing cementless concrete block manufacture. A four-year testing program was planned to provide all data required for product acceptance under industry standards and federal, state, and local building codes. Technical issues remaining to be addressed under this program included long- term stability in the presence of water and atmospheric carbon dioxide, and compatibility with other construction materials. More thorough documentation of the strength characteristics, fire-retardency, freeze-thaw durability, and other material properties was also planned. Some changes in the manufacturing process typically used for concrete blocks would also be required for production of cementless block; several manufacturers expressed an interest in working with Wormser Development Co. to refine process conditions. An initial economic analysis of cementless concrete block manu- facture, based on pilot plant data, found a unit cost similar to standard concrete block and substantially lower installation costs, because of the self aligning features of the blocks. The high value of the cementless blocks was esti- mated to more than offset disposal costs, and could, under favorable circumstances, provide a source of revenue from the FBC by-products.
Advanced Coal Technology By-product 180 Disposal Management and Design Manual

Management Alternatives
There are no current plans to proceed with testing and commercial development of the cementless concrete blocks. The long lead time required for testing and certification of new products, and the lack of additional funding for the project caused the project to be abandoned. The information developed in this effort remains instructive for other groups seeking to commercialize processes involving reuse of advanced coal technology by-products, as it illustrates both technical and market barriers to product development.
3. Bland, A.E., 1987, "Utilization of fluid- bed combustion ash in construction applications," Pittsburgh Coal Conference, Pittsburgh, PA.
Dearborn Environmental Consulting Group, 1988, "Utilization potential of CFBC residue in construction applications," prepared for CANMET Energy, Mines and Resources, Canada. DEGC File No. S10-608, Mississauga, Ontario, Canada.)
4.
7.6
1.
2.
Citations
Electric Power Research Institute. EPRI CS-2801. FGD By-product Disposal Manual, Third Edition. Palo Alto, California, 1983.
Minnick, L.J., 1982, "Development of potential uses for the residues fiom fluidized-bed combustion processes; Final Report covering results of research program and recommended practices for potential users," NTIS DOE/EET/10415-T6.
181 Advanced Coal Technology By-product Disposal Management and Design Manual
This Page Intentionally Left Blank
182
Performance-Based Design I I * I
The intent of this chapter is to help utility personnel and design professionals evaluate performance standards for a proposed disposal facility and to provide a general overview of the performance-based design process. As discussed in Chapter 4, most states regulate by-products from advanced coal technologies as industrial solid wastes. Typically, these regulations are written to cover a broad range of industrial wastes. Therefore, most states include specific design features such as composite liners and cap systems with leachate collection. Fortunately, most state regulations also provide exemptions, waivers, or reduced-requirement landfill designs if the applicant can demonstrate that the proposed design will meet applicable performance stan- dards without adverse environmental impact.
The objective of applying the perfor- mance-based design process to a proposed disposal facility is to quantify how the facility will affect groundwater quality or, in a broader sense, human health and the environment. To quantify the effects of the disposal facility, the following information is required:
t Estimated quality of leachate produced from the by-product material;
t Potential for leachate production and infiltration into the groundwater; and
t Anticipated fate and transport of chemicals of concern from the landfill to the point of compliance (typically defined as the boundary of the disposal facility).
The first information required for a performance-based design is whether the
leachate concentrations of the chemicals of concern (COCs) exceed regulatory values. The COCs vary from state to state; however, an example of some typical maximum contami- nant level (MCL) values are listed in Table 33. This table is reproduced from Subtitle D, Part 258, of the Resource Conservation and Recovery Act (RCRA). In general, Advanced Coal Technology (ACT) by-products do not contain measurable amounts of any organic species listed. Most states also reserve the right to add constituents to this list, depending on the type of material that will be placed in the disposal facility.
If it is determined that leachate from the by-product material does exceed the MCL for any COCs listed for the specific state, the demonstration will take on an added dimension. In some cases if the MCLs are exceeded by a large amount (typically a factor of loo), it may be determined that the advanced coal technology by-products exhibit RCRA Subtitle C hazardous characteristics and are subject to stringent regulation. If the MCL for any COC is exceeded, even by a smaller amount, there will be a need to predict the fate and transport of the COC from the landfill to the point of compliance. The following performance-based design topics will be expanded upon in the following two sections:
b Performance-Based Design Demonstration (8.1)-Various methods used to determine how the facility will affect groundwater quality are discussed, including leachate studies, methods to determine leachate generation, and fate and transport of leachate constituents.
183 Advanced Coal Technology By-product Disposal Management and Design Manual
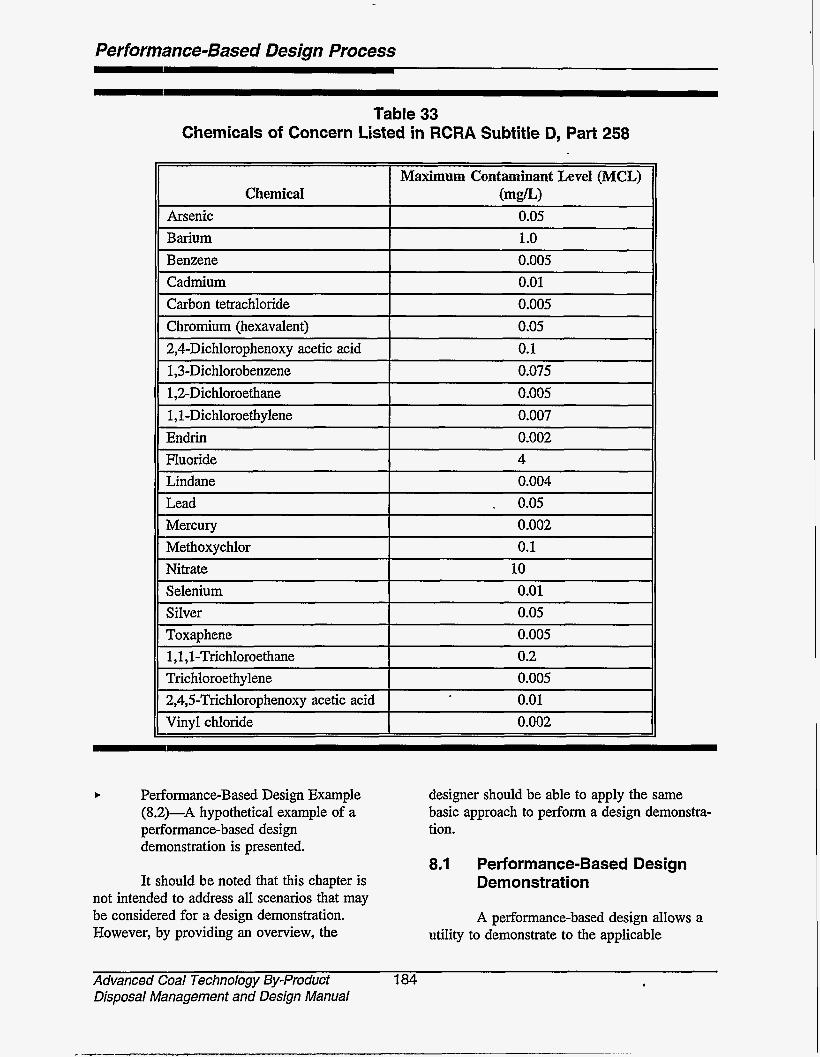
Performance-Based Design Process
Table 33 Chemicals of Concern Listed in RCRA Subtitle D, Part 258
Performance-Based Design Example (8.2)-A hypothetical example of a performance-based design demonstration is presented.
It should be noted that this chapter is not intended to address all scenarios that may be considered for a design demonstration. However, by providing an overview, the
designer should be able to apply the same basic approach to perform a design demonstra- tion.
8.1 Performance-Based Design Demonstration
A performance-based design allows a utility to demonstrate to the applicable
Advanced Coal Technology By-product 184 Disposal Management and Design Manual
Performance-Based Design Process
regulatory agency that a proposed method of by-product disposal will not affect groundwater quality or other environmental resources, despite changes to the agency's specified design. Because this design standard is performance-based, there are an unlimited number of design alternatives and methods to demonstrate that the selected alternative meets the applicable state standards. The intent of this section is to provide a general overview of some of the more common methods used to quantify landfill performance. The four basic components of a performance-based design demonstration are shown in Figure 71. The first step (the determination of regulatory requirements) is discussed in Chapter 4. Steps 2 through 4 are discussed below. The discussion focuses on groundwater protection, since this is the primary concern of most landfill regulations.
8.1. I Deferminaiion of Leachate Qualiiy (Sfep 2, Figure 71)
Leachate is defined as any liquid that has passed through or emerged from solid waste and which contains soluble, suspended, or miscible materials removed from such wastes '. Typically, if it can be shown or demonstrated that the chemical concentrations associated with leachate produced by the by- product material are below all applicable MCLs, then the design performance demonstration can be considered complete.
For example, if a utility shows, through leaching tests and data from similar facilities, that the concentrations of all chemicals of concern in the leachate are less than all applicable MCLs, then, typically, the utility will not have to determine leachate quantity (Step 3-Figure 71) or predict the fate and transport of any COCs (Step &Figure 71). Unfortunately, obtaining representative values of leachate chemical concentrations for a proposed facility can be difficult due to the uncertainty of by-product composition, the lack
of prior experience with advanced coal technology by-products, and changes in the leaching potential of the by-products over time (see Chapter 9).
The following sections will outline procedures for predicting leachate chemical concentrations from advanced coal by-products. In addition, factors that influence leachate quality will be presented along with typical values obtained from the field-scale test cells constructed as part of this project.
Factors Affecting Leachate Quality
In most operations, several factors affect the composition of the by-product material and subsequently affect leachate quality. The main factors that affect by- product composition include:
t
Coal composition;
Sorbent loading; and
Facility operating conditions.
The coal is the source of many potentially leachable COCs, primarily trace metals such as arsenic, cadmium, chromium, lead, and selenium. Major analytes associated with the coal, such as sulfate, chloride, and total dissolved solids (TDS), may also be regulated in some states. Coal composition varies significantly on a regional basis as well as between individual mines, and even between loads from a single mine. Some COCs may be associated with the coal matrix itself, while others are associated with clays, pyrites, and other mineral matter commonly found in coal. Changes in coal source or coal cleaning practices can change the abundance of COCs found in the combustion by-products and may change the leachable concentrations of these chemicals as well.
185 Advanced Coal Technology By-product Disposal Management and Design Manual
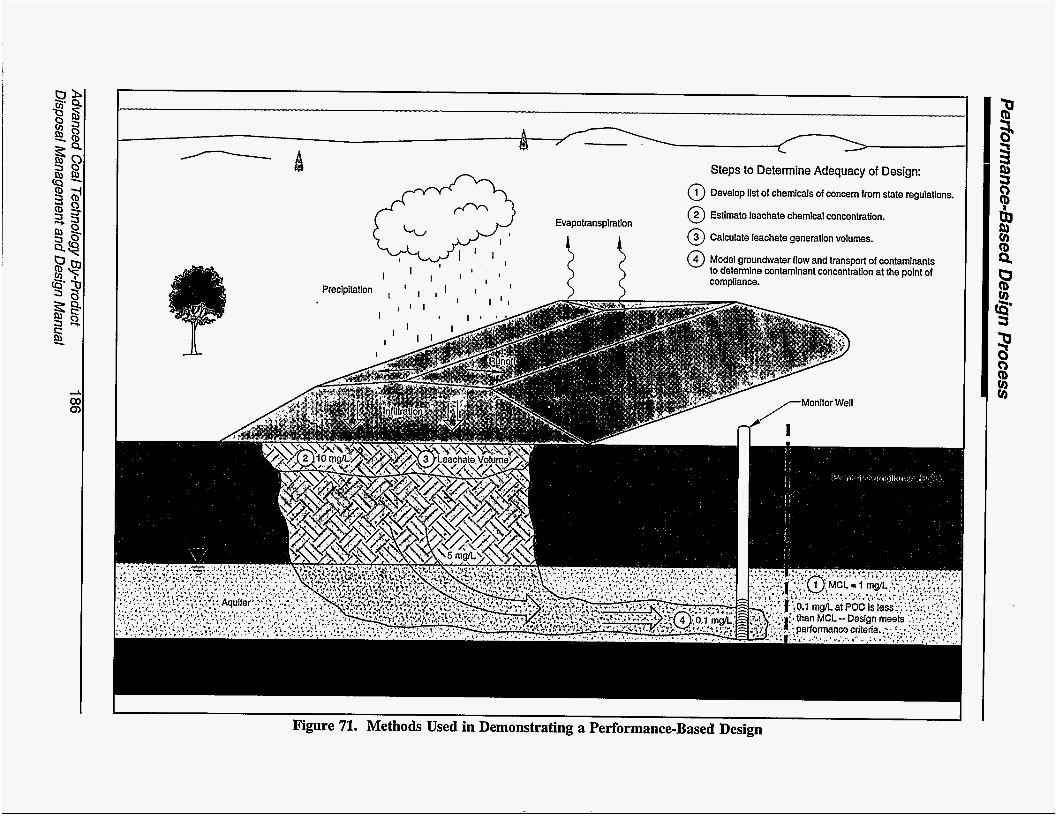
Steps to Determine Adequacy of Design:
0 Develop list of chemicals of concern from state regulations.
@ Estimate leachate chemical concentration.
@ Calculate leachate generation volumes.
@ Model groundwater flow and transport of contaminants to determine contaminant concentration at the point of
Evapotranspiration
I ' 1 I ' I compliance. Precipitation I I 1 , I I
Figure 71. Methods Used in Demonstrating a Performance-Based Design

Performance-Based Design Process
The sorbent used for SO control is the second major component of the combustion by- products, following the coal ash. The sorbent may also contribute to the concentrations of some chemicals of concern. More importantly, sodium- and calcium-based sorbents typically contribute considerable alkalinity to the combustion by-products. In extreme cases the alkalinity may be so high that the by-product fails the RCRA corrosivity criteria (pH>12.5), leading to regulation under Subtitle C. In general, the high alkalinity of most advanced coal combustion by-products can affect the leachability of many COCs; some elements are more mobile at higher pH values, while others may be fixed in the solid phase. Changes in the sorbent loading rate may alter the leachate pH, leading to changes in the leachable concentrations of COCs.
Facility operating conditions, including codsorbent ratios, combustion temperature, residence time in the combustion zone, and SO and particulate collection efficiencies, can affect the composition and leachability of the combustion by-products. The balance of coal and sorbent inputs controls the overall composition of the by-products, as discussed above. Combustion temperature and residence time influence the form of the by-product. Higher temperatures or longer residence times can promote formation of glassy or slag material from the coal ash and can also "hard- burn," or render unreactive, some sorbent reaction products. The efficiency of particulate and SO removal systems affects the size distribution and chemical composition of the by-products, which may in turn affect their leachability.
Leachate Quality Prediction
This section presents a methodology for predicting leachate quality for combustion by-products from facilities that use advanced coal technologies. The three basic methods for predicting leachate quality are as follows:
t
t
Use information from a similar, existing facility. Care should be taken to ensure that the coal source, boiler type, ash collection, and disposal operation are similar to those of the proposed facility.
Perform laboratory leaching experiments that are conducted on simulated waste material or waste material from a similar facility as described above.
Construct a field-scale test cell similar to the test cells described in Chapter 9 of this manual. Test cells need to be monitored for leachate production and leachate quality for a period of months to several years before the final results of the demonstration can be obtained.
As mentioned previously, the determination of leachate quality is the most critical factor in a performance-based design demonstration. If the generator can demon- strate that leachate chemical concentrations are below applicable MCLs, the alternatives for the disposal facility design are numerous.
Regulatory agencies may require a combination of these methods to demonstrate leachate quality before approval of a performance-based design. Tn addition, regulatory agencies are likely to require periodic demonstrations of leachate quality during the life of the landfill to verify the assumptions regarding leachate quality made during the design phase.
Leachate Tests
Two types of tests can be used to evaluate the leachability of advanced coal by- products. Batch leaching processes are relatively quick, inexpensive, and simple tests which are highly reproducible in a single laboratory. Column leaching is more time-
187 Advanced Coal Technology By-product Disposal Management and Design Manual
Performance-Based Design Process
consuming and costly, but it can provide infor- mation on the leaching characteristics of a waste under various conditions designed to more closely represent actual landfill condi- tions than is possible with batch tests.
The Toxicity Characteristic Leaching Procedure (TCLP) is the batch test used for regulatory determination of the status of wastes under RCRA and many state programs. It uses parameters which are not necessarily specific for the particular type of by-product being evaluated, nor indicative of actual conditions of the disposal site. However, it is generally required by regulators and provides an initial indication of the leaching characteristics of the by-product ,
A column study has the ability to simulate the saturated or unsaturated flow and vertical segregation of materials occurring in a landfill or IandfilVliner system. It can also provide information on how leachate changes as it moves through a landfill or liner. One laboratory procedure for column leaching is American Society Testing and Materials (ASTM) D4874, "Standard Test Method for Leaching Solid Waste in a Column Apparatus." It provides a method for generating aqueous leachates from materials in a saturated upgradient flow. Many other column test configurations are possible.
There are a number of chemical and physical parameters which affect the leach- ability of solids when using batch leaching procedures. The chemical parameters are associated with the type of extracting solution used and include solution pH and the presence of complex-forming ions. Physical parameters also influence the leachability of solids. These variables include:
t
t
Sample preparation (grinding);
Solid-to-liquid ratio;
t
Contact time between leaching phase and solids; and
Method of agitation or mixing.
The pH of the extracting fluid is one of the most important factors which influences the solubility of many of the trace elements. The TCLP uses extraction fluids which are buffered with acetic acid to pH 2.88 and 4.93. A screening test is used to determine which extraction fluid to use based on the acidity or alkalinity of the solids to be leached. Deion- ized water is used as the leaching fluid in the ASTM D4874 column leaching test. Deionized water at neutral pH may be a more appropriate leachant than dilute acid solutions in a solid waste landfill. Other leaching fluids may be selected to model specific landfill conditions.
Complexation or chelation of species present in the solids by ions contained in the extraction or leaching solution can also affect leaching behavior. The TCLP extraction fluid is formulated to represent municipal landfill leachate containing organic acids as complexing agents. These acids are not generally present in utility waste monofills. The deionized water. used for some column leaching tests contains no complexing agents. This provides a more realistic leaching medium for typical coal combustion by-product landfills. *
Physical parameters also determine the leachability of the solids. Grinding can increase the surface area of a given mass of material, increasing contact with the leaching fluid. Pelletized material, on the other hand, has much lower surface area than typical unprocessed combustion by-products. A uniform particle size is conducive to obtaining more reproducible samples and results. Solids for TCLP extraction must be reduced in size to pass a 9.5-mm (3/8-inch) sieve. Columns are usually packed with material to standard or field density without any particle size reduction.
Advanced Coal Technology By-product 188 Disposal Management and Design Manual

Performance-Based Design Process
The liquid-to-solid ratio utilized in batch tests and the volume of leachate perco- lated through solids in a column can significantly influence the concentration of constituents in the liquid phase. High liquid- to-solid ratios often will dilute out the concentrations of trace species. The liquid-to- solid ratio typically found in utility solid waste landfills is quite low, especially early in a landfill's lifespan. The TCLP uses a fairly high 20:l ratio, while the leachate volume collected in a column study will depend on such factors as rainfall, permeability, climate, and site characteristics which are being modeled by the test.
Contact time is important in determining leachability. The contact time should be long enough to allow species to approach chemical equilibrium. Batch tests, such as the TCLP, are usually based on an 18- hour extraction time. The contact time of the leachate in a column study should be long enough to approach actual disposal conditions, generally a period of several months. Compaction effort, column permeability and the hydraulic head are among the variables affecting residence time of leaching solution with the solids in column studies.
The agitation technique used in the batch tests should be chosen to maximize solifliquid contact without causing particle or container abrasion. Agitation is needed to avoid concentration gradients in the leachate in contact with the solids. 'Adequate mixing is achieved in the TCLP by a circular rotation at 33 rpm. Column studies utilize percolation of the liquid to contact the solids rather than agitation.
In summary, the general advantages of batch leaching are simplicity, low cost, reproducibility, and a short testing period. The major disadvantage is that they do not model the dynamic flow regime found in actual disposal conditions. Column studies have an advantage over batch leaching in their ability to simulate the flow and vertical segregation of
materials occurring in an actual landfill or disposal site. They can be operated successfully to provide reproducible data on leaching tendencies of solids and attenuation capacity of various soils or substrates. However, column studies have disadvantages including greater expense and length of the testing period.
8.1.2 Defermine Leachafe Quanfify (Sfep 3, Figure 7 7 )
The next step in the performance-based design process is to estimate or predict the quantity of leachate produced by the landfill during operation and after landfill closure. As mentioned earlier, this step may not be needed if the applicant can demonstrate to the regula- tors that any leachate produced by the by- product stored in the landfill will not adversely affect the environment. The quantity of leachate which can be produced is directly related to precipitation. In some parts of the country the potential for leachate generation is minimal due to the relatively low amounts of precipitation. Generally, if a landfill is located in an area that receives less than 20 or 25 inches of annual average precipitation, then leachate production will be minimal from that site. This was demonstrated at the Colorado test cell (see Chapter 9). Over a three-year period, this site has yielded little or no leachate (average annual rainfall at this site is 11 inches).
Landfill Water Balance
Figure 72 shows a typical water balance for a landfill. Of the precipitation that falls on the site, a portion runs off, some is lost through evapotranspiration (loss of water through the uptake by vegetation and subsequent evaporation) and the remainder percolates through the fill. Water percolating through the fill will eventually leave as leachate unless it is chemically or physically trapped by the by-product material. The portion of precipitation which runs off or is evaporated may vary considerably from one
189 Advanced Coal Technology By-product Disposal Management and Design Manual
. ... -. , .
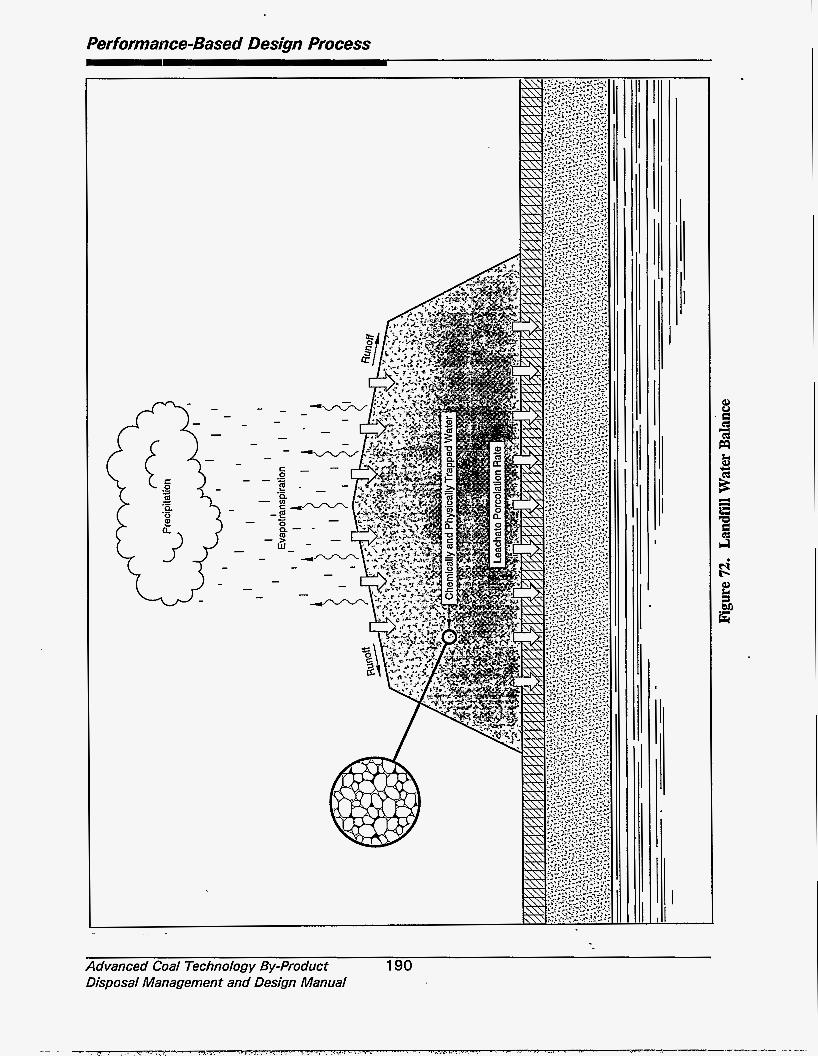
Performance-Based Design Process
Advanced Coal Technology By-Product 190 Disposal Management and Design Manual

Performance-Based Design Process
site to another, depending upon site-specific conditions. Important factors influencing water loss include surface slope, type of vegetative cover, permeability of the barrier layers and by-product material, climate variables (temperature, humidity, wind) and disposal site management procedures '.
The basic water balance equation for landfills is presented below 3:
Leachate Volume = P - ET - R - S
P = Precipitation ET = Evapotranspiration R = Surface Runoff Volume S = By-product moisture storage
volume
The ultimate amount of leachate depends on the amount of rain water that infil- trates the subsurface soils. As mentioned above, precipitation, evapotranspiration, surface runoff, and storage volume are all factors affecting the amount of leachate that will reach the ground below the by-product material. By properly planning the design and location of a landfill, one can greatly reduce the amount of leachate that reaches the groundwater below the facility. Precipitation is dependent solely upon the geographical location of the landfill, which may or may not be a reasonably changeable parameter. The other three parameters, however, can be manipulated in the design and operations of the landfill to minimize the amount of leachate. As mentioned earlier, evapotranspiration is a factor of evaporation from the cover soil surface and transpiration from the surface soil by plant life. Maintaining a healthy vegetative cover allows a large percentage of the rainfall to be taken up by plant roots and evaporated into the atmosphere, keeping it from ever entering the fill. Another design technique that will aid in minimizing infiltration is properly sloping the cover soil. By mildly sloping the surface layer, rainfall from heavier precipitation events will drain from the landfill surface before it infiltrates into the covering soil. The third
parameter, moisture storage, can be manipulated by operation to minimize leachate ' production. Freshly placed FBC by-product ash traps large quantities of moisture in its pore space and in the formation of hydrous minerals. After a certain amount of time, which is dependent on the volume of available moisture and the volume of ash, the properties of the ash change and trap less moisture. Therefore, by manipulating the thickness of the lifts and the frequency of adding new lifts, the water that infiltrates into the ash can be kept from leaching into the groundwater by trapping it indefinitely in the fill material.
Hydrologic Evaluation of Landfill Performance (HELP) Model
The HELP program was developed by the U.S. Army Engineer Waterways Experi- ment Station, Vicksburg, Mississippi, for the U.S. Environmental Protection Agency @PA), Hazardous Waste Engineering Research Laboratory, Cincinnati, Ohio, in response to needs identified by the EPA Office of Solid Waste, Washington, D.C. Several other leach- ate models exist; however, HELP is generally the standard for modeling landfill leachate production.
The HELP model is a quasi-two- dimensional hydrologic model simulating daily water movement into, through, and out of landfill systems. It is capable of modeling the effects of covers, liners, and leachate collection systems as well as other natural and man-made soil conditions. As part of the solution, HELP calculates a hydrologic water budget for the system which includes estimates of surface runoff, evapotranspiration, lateral drainage to collection systems, percolation through liners, changes in soil moisture storage, and average depth of saturation in the surface liners.
The HELP model computes runoff by the Soil Conservation Service (SCS) runoff curve number method. Evaporation is evaluated by the modified Penman method. Flow through soil and any waste-layers is
191 Advanced Coal Technology, By-product Disposal Management and Design Manual
Performance-Based Design Process
assumed to be Darcian, and it does not account for potential flow through preferential flow pathways such as cracks or fractures4.
Input requirements for the HELP model include daily climatological data, soil characteristics, and design characteristics. Daily precipitation data may be user-specified, selected from a historical database that the model contains, or generated stochastically from default or user-specified mean monthly temperature and solar radiation data. Input values for the leaf area index and evaporative zone depth are also required. Among the soil properties that the model requires are the porosity, field capacity, wilting point, hydraulic conductivity, and initial moisture content. All of the parameters necessary for input are further defined in Table 34.
HELP generates a variety of useful output. The program is simple and quick to run. The model can be run several times, varying the design parameters to fmd the landfill and cap structure which best controls the leachate percolating into the groundwater.
8.1.3 Fafe and Transport of Leachate Constituents (Step 4, Figure 71)
Leachate exiting the bottom of a land- fill generally tends to travel via gravity into the subsurface soils and may ultimately reach groundwater. Some of the constituents which are transported in the leachate may become lodged in the subsurface soil and never reach the water table. The remaining constituents, diluted by the volume and flow of the ground- water, are transported in the groundwater. Again, some of these contaminants, dependent on the aquifer chemistry and soil type, may become lodged in the aquifer materials and be effectively removed from the groundwater. Those constituents that remain in the ground- water continue to be diluted and disposed of as they are transported farther away from the landfill. The point of compliance (POC) is a designated monitoring well, or series of
monitoring wells, typically placed along the downgradient edge of the landfill facility's property boundary. The concentrations of the COCs are monitored for compliance with permit conditions at that point. Because of the natural filtering and dilution that occurs along the path of the leachate and groundwater, the concentration of constituents that reach the POC is typically much smaller than that immediately below the landfill.
Multimedia Exposure Assessment Model (MULTIMED)
MuLTlMED is a multimedia exposure assessment model that can predict contaminant concentrations at groundwater receptors at the water table beneath a landfill or at various locations in an aquifer downgradient of a landfill5. MuLTlMED can implement the exact analytical solutions to unsaturated and saturated flow transport equations based on a relatively small number of parameters. The program is composed of a set of modules, some of which interact with each other, and some of which communicate only with the main controlling module. This feature allows one to choose and model only the particular contaminant migration pathways that are of concern to the user.
The output of MuLTlMED lists the input parameters and the simulated "concen- tration after saturated zone model." This concentration is the amount of a constituent that the model predicts will be present at the point of compliance, based on the input parameters. If the input parameter for "initial concentration at landfill" is 1, then the reci- procal of the predicted concentration at the point-of-compliance monitoring well is the dilution-attenuation factor (DAF). This is the factor by which the concentration is predicted to decrease between the bottom of the landfill and the point of compliance. For a given chemical in a given landfill, the DAF calculated by W T I M E D can be applied to any input concentration of interest to predict the point of compliance concentration.
Advanced Coal Technology By-product 192 Disposal Management and Design Manual
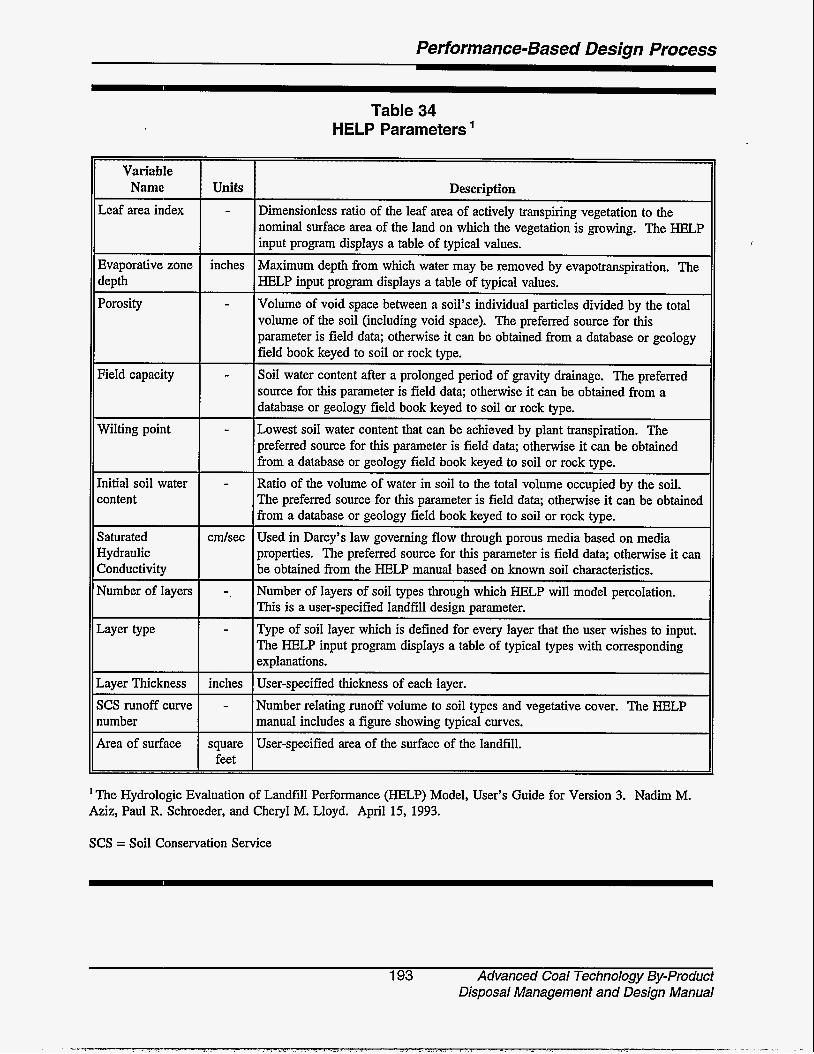
Performance-Based Design Process
Variable Name Units
Leaf area index -
Evaporative zone inches depth Porosity -
Field capacity -
Wilting point -
Initial soil water - content
Saturated c d s e c Hydraulic Conductivity Number of layers -.
Layer type -
Layer Thickness inches
Table 34 HELP Parameters ‘
Description Dimensionless ratio of the leaf area of actively transpiring vegetation to the nominal surface area of the land on which the vegetation is growing. The HELP input program displays a table of typical values. Maximum depth from which water may be removed by evapotranspiration. The HELP input program displays a table of typical values. Volume of void space between a soil’s individual particles divided by the total volume of the soil (including void space). The preferred source for this parameter is field data; otherwise it can be obtained from a database or geology field book keyed to soil or rock type. Soil water content after a prolonged period of gravity drainage. The preferred source for this parameter is field data; otherwise it can be obtained from a database or geology field book keyed to soil or rock type. Lowest soil water content that can be achieved by plant transpiration. The preferred source for this parameter is field data; otherwise it can be obtained from a database or geology field book keyed to soil or rock type. Ratio of the volume of water in soil to the total volume occupied by the soil. The preferred source for this parameter is field data; otherwise it can be obtained from a database or geology field book keyed to soil or rock type. Used in Darcy’s law governing flow through porous media based on media properties. The preferred source for this parameter is field data; otherwise it can be obtained from the HELP manual based on known soil characteristics. Number of layers of soil types through which HELP will model percolation. This is a user-specified landfill design parameter. Type of soil layer which is defined for every layer that the user wishes to input. The HELP input program displays a table of typical types with corresponding explanations. User-specified thickness of each laver.
SCS runoff curve number Area of surface
- Number relating runoff volume to soil types and vegetative cover. The HELP manual includes a figure showing typical curves.
square User-specified area of the surface of the landfill. feet
’ The Hydrologic Evaluation of Landfill Performance (HELP) Model, User’s Guide for Version 3. Nadim M. b i z , Paul R. Schroeder, and Cheryl M. Lloyd. April 15, 1993.
SCS = Soil Conservation Service
193 Advanced Coal Technology By-product Disposal Management and Design Manual
Performance-Based Design Process
For the purpose of the example presented in Section 8.2, only the saturated zone module is used. The source plane for the saturated zone module is the vertical plane that intersects the downgradient edge of the facility perpendicular to the direction of groundwater flow. The module predicts the concentration of contaminants at the point of compliance, given hydrogeological parameters describing the aquifer the position of the well screen (in three-dimensional space), and the input con- taminant concentrations. Table 35 lists all of the parameters used by this module and gives a brief explanation of each.
A program called PREMED is used to input data to MULTIh4ED. PREMED is a menu-driven stand-alone program that allows the user to easily build a MULTIMED input file. Once the input file is complete, the MULTIMED program can be executed.
8.2 Design Example
An example performance-based design will be developed in this section to further illustrate the methods used to make a design demonstration. In this example, a fictional midwestern utility is in the process of converting its plant to a fluidized bed combus- tion (FBC) process. As part of the system conversion, the utility is preparing a solid waste permit application to allow the disposal of FBC by-product material on a 200-acre site near its facility. The proposed landfill will be an aerial or above-ground fill similar to the examples presented in Alternative 2, discussed in Section 7.1. In this case, state industrial solid waste regulations call for a complex composite liner and cover system unless the applicant can demonstrate that its specific design will provide adequate protection of the environment. The proposed design, as well as other characteristics of the site and the by- products, and an explanation of the demonstra- tion are presented in the following sections.
8.2. I Characteristics of fhe Example By-product Landfill
The hypothetical proposed site is located in the midwestern United States in an area that receives about 36 inches of rainfall per year. A plan view and section of the com- pleted by-product landfii are shown in Figures 73 and 74. During the preliminary phase of this example project, the permit applicant con- cluded that the planned landfill would not require the standard cover and cap system (as specified in the regulations) to effectively protect surface and groundwater quality. This decision was based on several factors, includ- ing the results of a leachate testing program that showed that leachate from the proposed FBC by-product material would probably not exceed the specified MCLs listed in the state regulations. In addition, a continuous, 10-foot- thick layer of silty clay material with a low hydraulic conductivity separates the groundwater from the by-product material.
The landfi shape and cover design are detailed in Figure 74. As shown, the landfill will be approximately 60 feet high, and the final cover will include a barrier layer of 24 inches of low-permeability by-product material. This material will consist of a blend of FBC by-product and pulverized coal fly ash (PFA) that is hydrated and compacted in 6-inch-thick lifts. During the preliminary design phase of this example project, laboratory studies showed that this blended and compacted material could achieve a permeability of less than 2 x 10 cdsec. An additional 24 inches of soil that will support native vegetation (top soil) will overlay the barrie; layer and will be seeded. In this case, groundwater is found approximately 20 feet below existing ground surface and flows to the east, with a gradient of .006 Wft. The facility will be operated so that only 10 acres are "open" or uncovered at any one time. The remaining areas will be either undisturbed land or completed cells where final cover or temporary cover has been placed.
Advanced Coal Technology By-product 194 Disposal Management and Design Manual
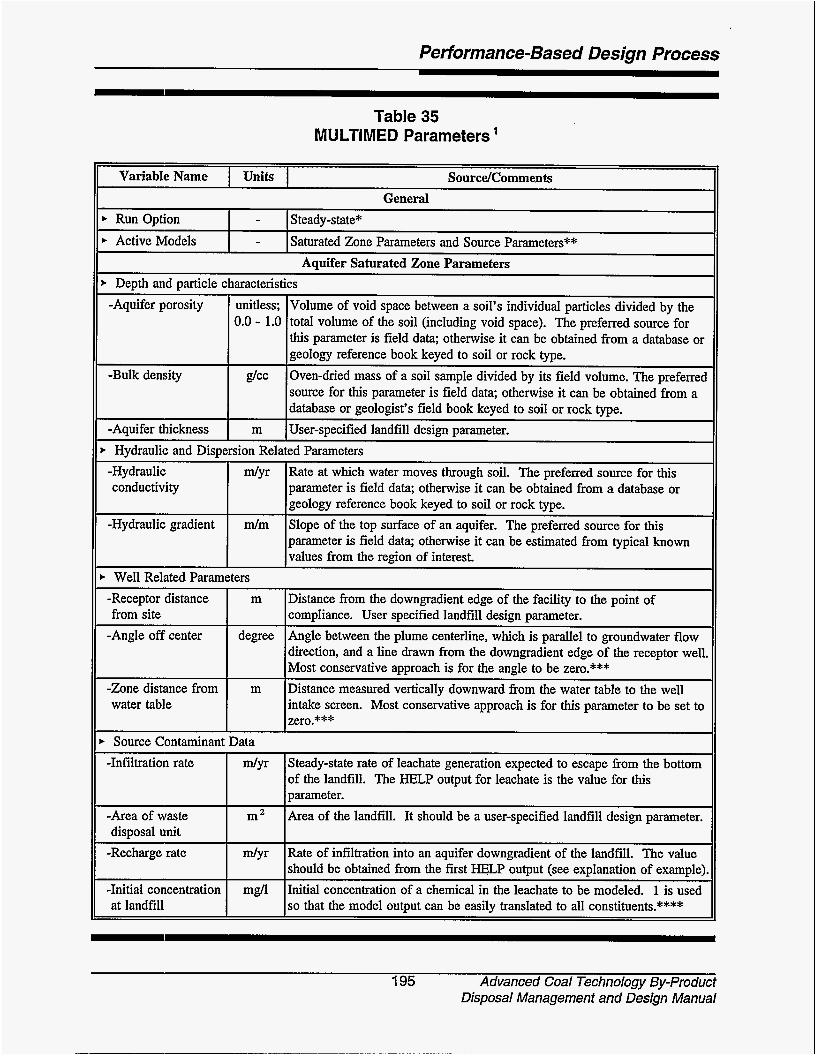
Performance-Based Design Process
VariabIe Name I Units I SourcelComments
Run Option - Steadystate* General
t Active Models - Saturated Zone Parameters and Source Parameters** Aquifer Saturated Zone Parameters
t Depth and particle characteristics -Aquifer porosity unitless; Volume of void space between a soil’s individual particles divided by the
0.0 - 1.0 total volume of the soil (including void space). The preferred source for this parameter is field data; otherwise it can be obtained from a database or geology reference book keyed to soil or rock type. Oven-dried mass of a soil sample divided by its field volume. The preferred source for this parameter is field data; otherwise it can be obtained from a database or geologist’s field book keyed to soil or rock type.
-Bulk density g/cc
-Aquifer thickness m User-specified landfill design parameter.
-Hydraulic conductivity
t Hydraulic and Dispersion Related Parameters
d y r Rate at which water moves through soil. The preferred source for this parameter is field data; otherwise it can be obtained from a database or geology reference book keyed to soil or rock type. Slope of the top surface of an aquifer. The preferred source for this parameter is field data; otherwise it can be estimated from typical known
, -Hydraulic gradient d m
Table 35 MULTIMED Parameters ’
-Receptor distance from site
-Angle off center
-Zone distance from water table
m Distance from the downgradient edge of the facility to the point of compliance. User specified landfill design parameter.
degree Angle between the plume centerline, which is parallel to groundwater flow direction, and a line drawn from the downgradient edge of the receptor well, Most conservative approach is for the angle to be zero.*** Distance measured vertically downward from the water table to the well intake screen. Most conservative approach is for this parameter to be set to zero.***
m
195 Advanced Coal Technology By-product Disposal Management and Design Manual
-Infiltration rate
-Area of waste disposal unit
-Recharge rate
-Initial concentration at landfill
d y r Steady-state rate of leachate generation expected to escape from the bottom of the landfill. The HELP output for leachate is the value for this parameter. Area of the landfill. It should be a user-specified landfill design parameter.
Rate of infiltration into an aquifer downgradient of the landfill. The value should be obtained from the first HELP output (see explanation of example) Initial concentration of a chemical in the leachate to be modeled. 1 is used so that the model output can be easily translated to all constituents.****
m 2
d y r
mg/l
Performance-Based Design Process
Table 35 (Continued)
’ The information in this table was mostly paraphrased from the U.S. EPA publication, User Manual Supplement: Usinn MULTlMED to Evaluate Subtitle D Landfill Designs, February 1993.
*
**
***
****
Using the steady-state model simplifies the modeling greatly by reducing the number of parameters. Using steady-state is also the more conservative approach.
By excluding biodegradation from the simulation, the unsaturated zone can be omitted for the steady-state case. Modeling only the saturated flow is a simpler, more conservative approach to modeling the leachate transport.
Environmentally conservative estimates of the effectiveness of a landfill require the well to be located at the top of the aquifer along a line drawn parallel to the groundwater flow direction and perpendicular to the downgradient edge of the facility, intersecting that edge at its midpoint.
A single MULTIMED simulation can account for all constituents for which the source term and which decay at the same rate (steady-state source and zero attenuation in the example case) (0). In this case the expected input concentration of each MCL constituent is divided by the DAF from a single MULTIMED simulation to determine the constituent’s expected concentration at the point of compliance.
Advanced Coal Technology By-product 196 Disposal Management and Design Manual
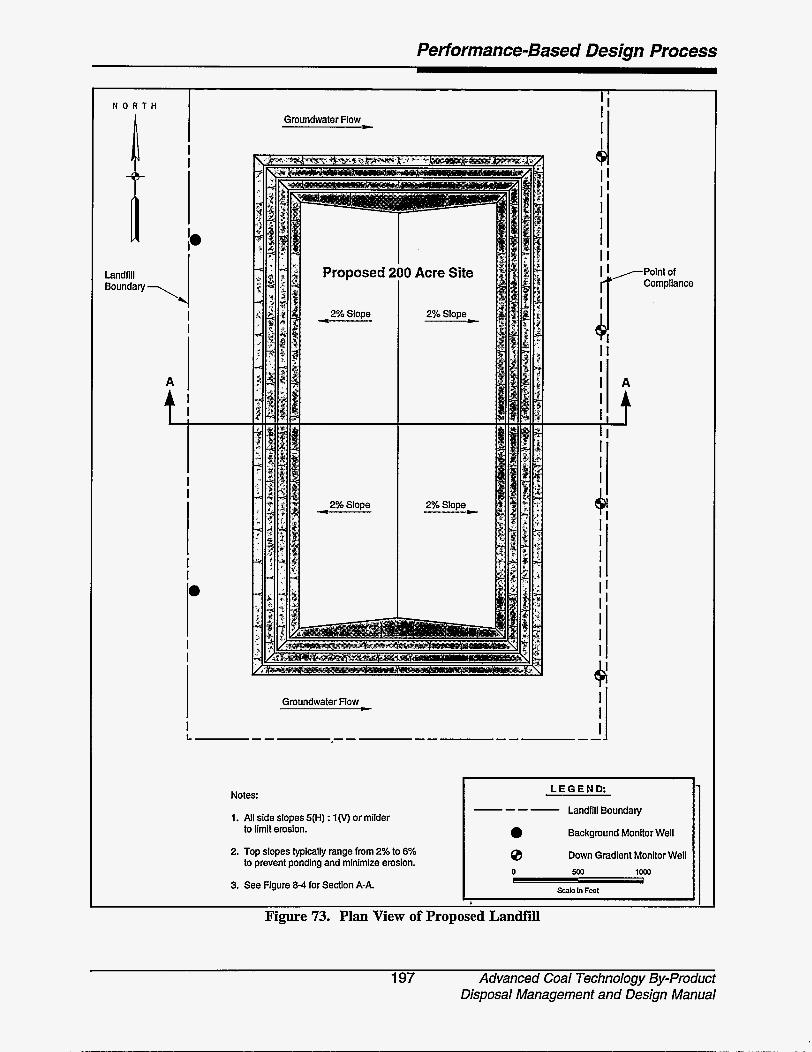
Performance-Based Design Process
A
t
Groundwater Flow
Notes:
1. All side slopes 5(H) : I (V) or milder to limit erosion.
2. Top slopes typically range from 2% to 6% to prevent ponding and minimize erosion.
3. See Figure 8-4 for Section A-A.
1 L E G E N D :
Landfill Boundary ---- 0 Background Monitor Well I I 0 Down Gradient Monitor Well I I 0 5M) 1OW
Scab in Feet I I
Figure 73. Plan View of Proposed Landfill
197 Advanced Coal Technology By-product Disposal Management and Design Manual
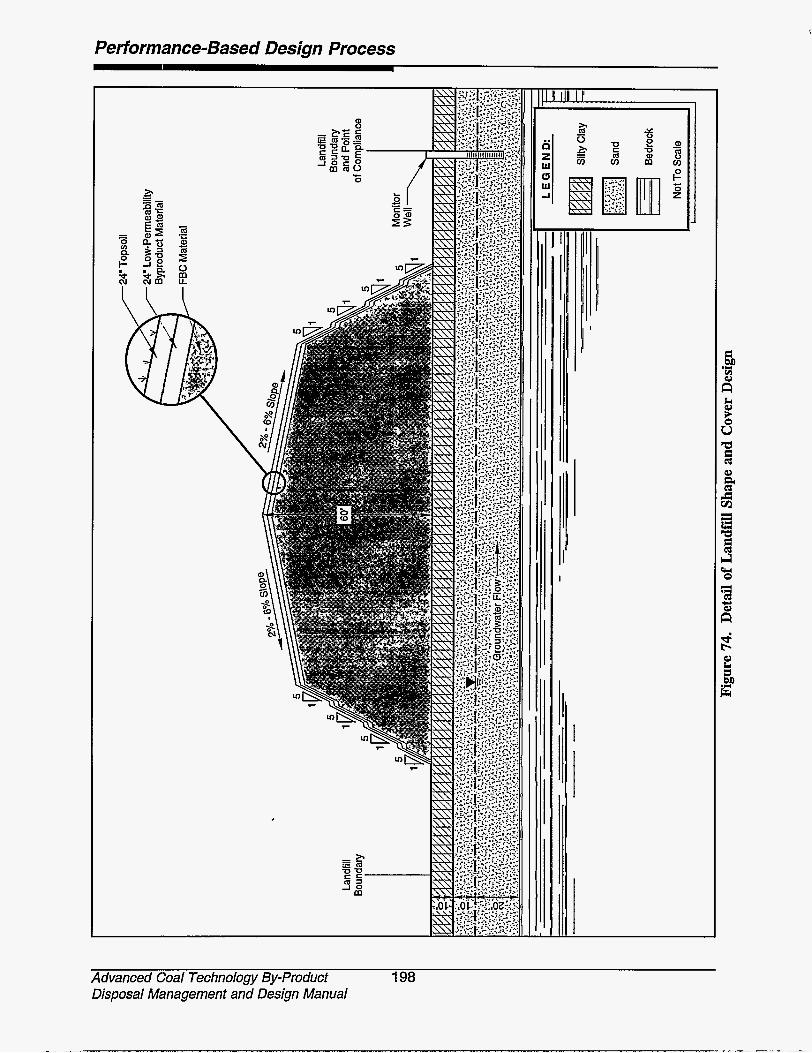
Performance-Based Design Process
I I
9 '
Advanced Coal Technology By-product 198 Disposal Management and Design Manual
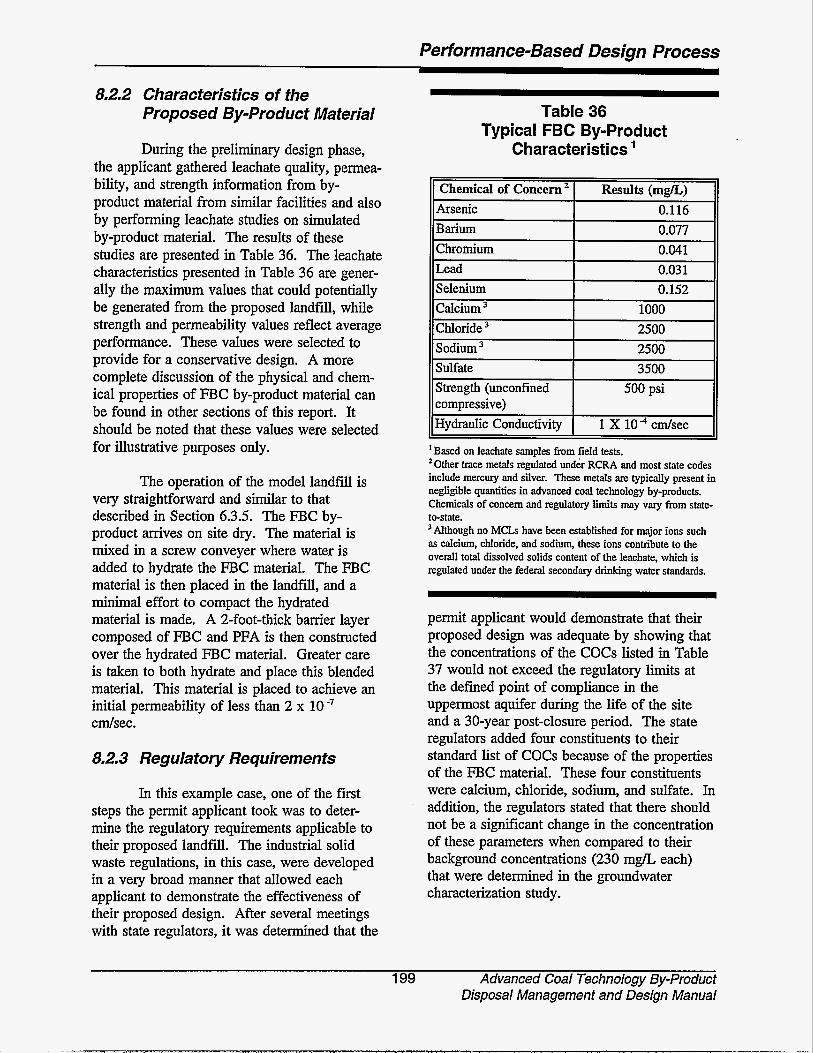
Performance-Based Design Process
8.2.2 Characteristics of the PrQposed By-product Material
During the preliminary design phase, the applicant gathered leachate quality, permea- bility, and strength information from by- product material from similar facilities and also by performing leachate studies on simulated by-product material. The results of these studies are presented in Table 36. The leachate characteristics presented in Table 36 are gener- ally the maximum values that could potentially be generated from the proposed landfill, while strength and permeability values reflect average performance. These values were selected to provide for a conservative design. A more complete discussion of the physical and chem- ical properties of FBC by-product material can be found in other sections of this report. It should be noted that these values were selected for illustrative purposes only.
The operation of the model landfill is very straightforward and similar to that described in Section 6.3.5. The FBC by- product arrives on site dry. The material is mixed in a screw conveyer where water is added to hydrate the FBC material. The FBC material is then placed in the landfi, and a minimal effort to compact the hydrated material is made. A 2-foot-thick barrier layer composed of FBC and PFA is then constructed over the hydrated FBC material. Greater care is taken to both hydrate and place this blended material. This material is placed to achieve an initial permeability of less than 2 x 10 cdsec.
8.2.3 Regulatory Requirements
In this example case, one of the first steps the permit applicant took was to deter- mine the regulatory requirements applicable to their proposed landfill. The industrial solid waste regulations, in this case, were developed in a very broad manner that allowed each applicant to demonstrate the effectiveness of their proposed design. After several meetings with state regulators, it was determined that the
Table 36 Typical FBC By-product
Characteristics '
' Based on leachate samples from field tests. 'Other trace metals regulated under RCRA and most state codes include mercury and silver. These metals are typically present in negligible quantities in advanced coal technology by-products. Chemicals of concern and regulatory limits may vary from state- to-state. Although no MCLs have been established for major ions such as calcium, chloride, and sodium, these ions contribute to the overall total dissolved solids content of the leachate, which is regulated under the federal secondary drinking water standards.
permit applicant would demonstrate that their proposed design was adequate by showing that the concentrations of the COCs listed in Table 37 would not exceed the regulatory limits at the defined point of compliance in the uppermost aquifer during the life of the site and a 30-year post-closure period. The state regulators added four constituents to their standard list of COCs because of the properties of the FBC material. These four constituents were calcium, chloride, sodium, and sulfate. In addition, the regulators stated that there should not be a significant change in the concentration of these parameters when compared to their background concentrations (230 mg/L each) that were determined in the groundwater characterization study.
199 Advanced Coal Technology By-product Disposal Management and Design Manual
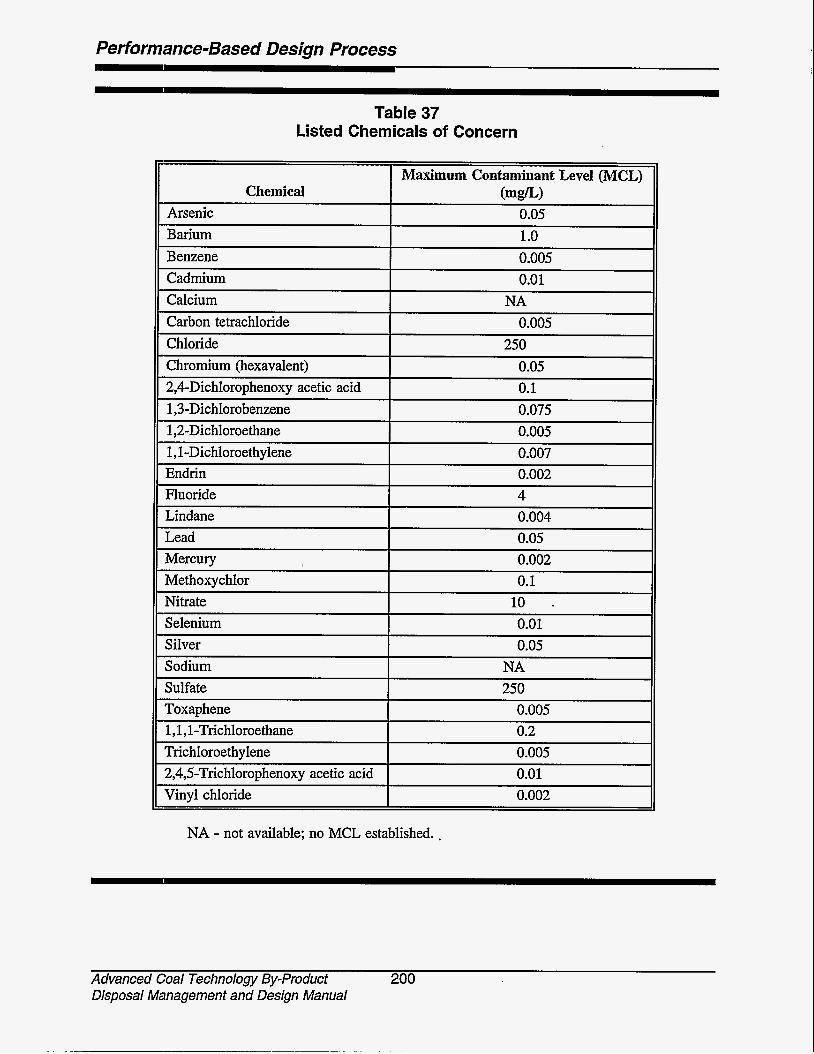
Performance-Based Design Process
Lindane Lead Mercury I
Methoxychlor
Table 37 Listed Chemicals of Concern
0.004 0.05 0.002 0.1
I 11 Fluoride I 4 II
Nitrate Selenium Silver
10 . 0.01 0.05
Sodium Sulfate
NA 250
Toxaphene l,l,l-Trichloroethane Trichloroethylene
0.005 0.2 0.005
NA - not available; no MCL established. .
2,4,5-Trichlorophenoxy acetic acid Vinyl chloride
Advanced Coal Technology By-product 200 Disposal Management and Design Manual
0.01 0.002
Performance-Based Design Process
8.2.4 Demonstration Example
After the regulatory requirements were established, the permit applicant was ready to proceed with the demonstration. In summary, the goal was to show that the MCL concen- trations of the listed COCs would not be exceeded at the point of compliance (down- gradient monitor wells) due to the landfill operations. This requires that the following two situations be simulated:
1) Active portion of the landfill: The active portion of the landfill is defined as the area that is receiving FBC material and is not covered. For this facility, it is assumed that no more than 10 acres will be active at any time. Other landfil areas will either be closed or not used while this 10-acre area is in operation.
After landfill closure: This situation involves modeling the landfill after it has been completely filed an& final cover has been placed over the entire facility. Typically, state regulations require a facility to continue mon- itoring a closed facility for a period of 30 years after closure.
The computer programs HELP and MULTIMED were selected to demonstrate the effectiveness of the landfil design. This demonstration will consist of the following four-step process for both the active and closed landfill situations discussed above:
3)
Calculate the normal groundwater recharge rate using HELP;
Calculate the leachate production or percolation from the landfil using HELP;
Calculate the DAF using MULTIMED; and
4) Calculate the predicted concentrations of COC at the point of compliance (downgradient monitor wells) using the DAF.
To perform this demonstration using these two computer models several assump- tions are needed. As discussed previously, some of these assumptions are intrinsic to HELP and MULTIMED; however, some assumptions are also needed to describe the geologic setting, landfill operations, etc. It is usually advantageous to make conservative assumptions to compensate for the inadequa- cies of the computer programs. For example, in this case it is assumed that the unsaturated zone (i.e., silty clay and sand layers) does not exist. Therefore, one major attenuation mechanism of the COCs is not accounted for in the computer model. This greatly simplifies the analysis and also builds in an extra safety factor to the design. This demonstration process is further developed in the following sections.
Active Landfill
As mentioned earlier, for this facility only 10 acres will be active at any given time. Typically the open, active landfa will be the "worst case" situation as far as leachate production is concerned; however, by placing the FBC material in lifts (as described previously), the amount of leachate is greatly reduced because of the moisture-retaining properties of the material. Infiltration into the FBC material will be much greater during operations than after the final cover is constructed. But new material can retain most of that early infiltration if it is placed with a low initial moisture content. Therefore, by balancing the thickness of the lift and the frequency of adding new lifts with the amount of rainfall, one can almost eliminate leachate production prior to cell closure. Figure 75 depicts a typical section of the active landfil and further illustrates the demonstration procedure. A detailed description of the
201 Advanced Coal Technology By-product Disposal Management and Design Manual
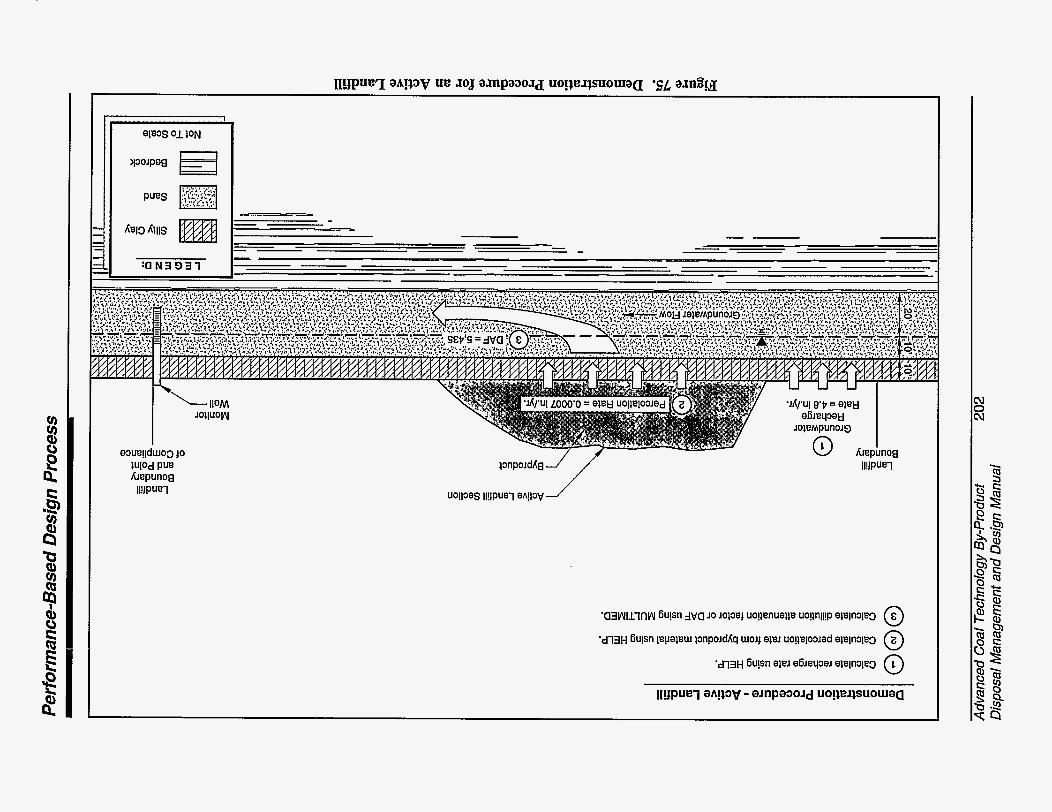
N 3 N
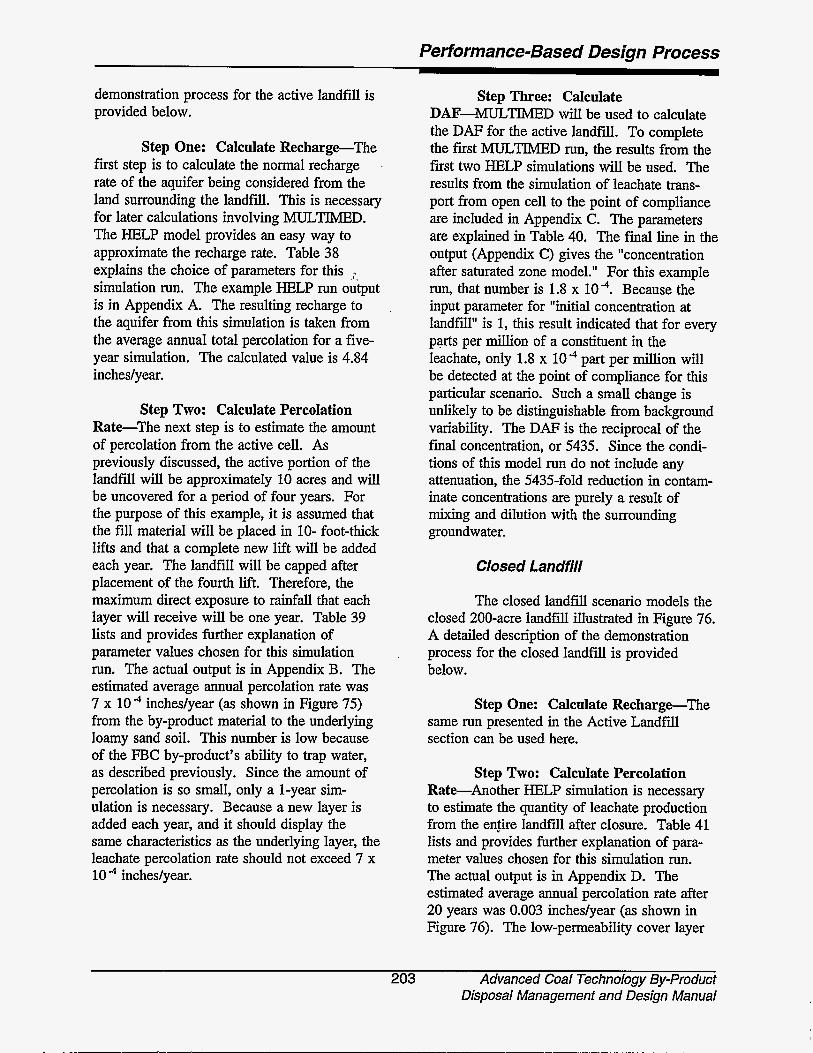
Performance-Based Design Process
demonstration process for the active landfi is provided below.
Step One: Calculate Recharge-The first step is to calculate the normal recharge . rate of the aquifer being considered from the land surrounding the landfill. This is necessary for later calculations involving MULTIMED. The HELP model provides an easy way to approximate the recharge rate. Table 38 explains the choice of parameters for this ,?,
simulation run. The example HELP run output is in Appendix A. The resulting recharge to the aquifer from this simulation is taken from the average annual total percolation for a five- year simulation. The calculated value is 4.84 incheslyear.
Step Two: Calculate Percolation Rate-The next step is to estimate the amount of percolation from the active cell. As previously discussed, the active portion of the landfill will be approximately 10 acres and will be uncovered for a period of four years. For the purpose of this example, it is assumed that the fill material will be placed in 10- foot-thick lifts and that a complete new lift will be added each year. The landfill will be capped after placement of the fourth lift. Therefore, the maximum direct exposure to rainfall that each layer will receive will be one year. Table 39 lists and provides further explanation of parameter values chosen for this simulation run. The actual output is in Appendix B. The estimated average annual percolation rate was 7 x lo4 inchedyear (as shown in Figure 75) from the by-product material to the underlying loamy sand soil. This number is low because of the FBC by-product's ability to trap water, as described previously. Since the amount of percolation is so small, only a l-year sim- ulation is necessary. Because a new layer is added each year, and it should display the same characteristics as the underlying layer, the leachate percolation rate should not exceed 7 x 10 inchedyear.
Step Three: Calculate DAF--MULTIMED will be used to calculate the DAF for the active landfill. To complete the first MULTIMED run, the results from the first two HELP simulations will be used. The results from the simulation of leachate trans- port from open cell to the point of compliance are included in Appendix C. The parameters are explained in Table 40. The final line in the output (Appendix C) gives the "concentration after saturated zone model." For this example run, that number is 1.8 x lo4. Because the input parameter for "initial concentration at landfill" is 1, this result indicated that for every p w s per million of a constituent in the leachate, only 1.8 x lo4 part per million will be detected at the point of compliance for this particular scenario. Such a small change is unlikely to be distinguishable from background variability. The DAF is the reciprocal of the final concentration, or 5435. Since the condi- tions of this model run do not include any attenuation, the 5435-fold reduction in contam- inate concentrations are purely a result of mixing and dilution with the surrounding groundwater.
Closed Landfill
The closed landfill scenario models the closed 200-acre landfill illustrated in Figure 76. A detailed description of the demonstration process for the closed landfill is provided below.
Step One: Calculate Recharge-The same run presented in the Active Landfii section can be used here.
Step Two: Calculate Percolation Rate-Another HELP simulation is necessary to estimate the quantity of leachate production from the eneke landfii after closure. Table 41 lists and provides further explanation of para- meter values chosen for this simulation run. The actual output is in Appendix D. The estimated average annual percolation rate after 20 years was 0.003 incheslyear (as shown in Figure 76). The low-permeability cover layer
203 Advanced Coal Technology By-product Disposal Management and Design Manual
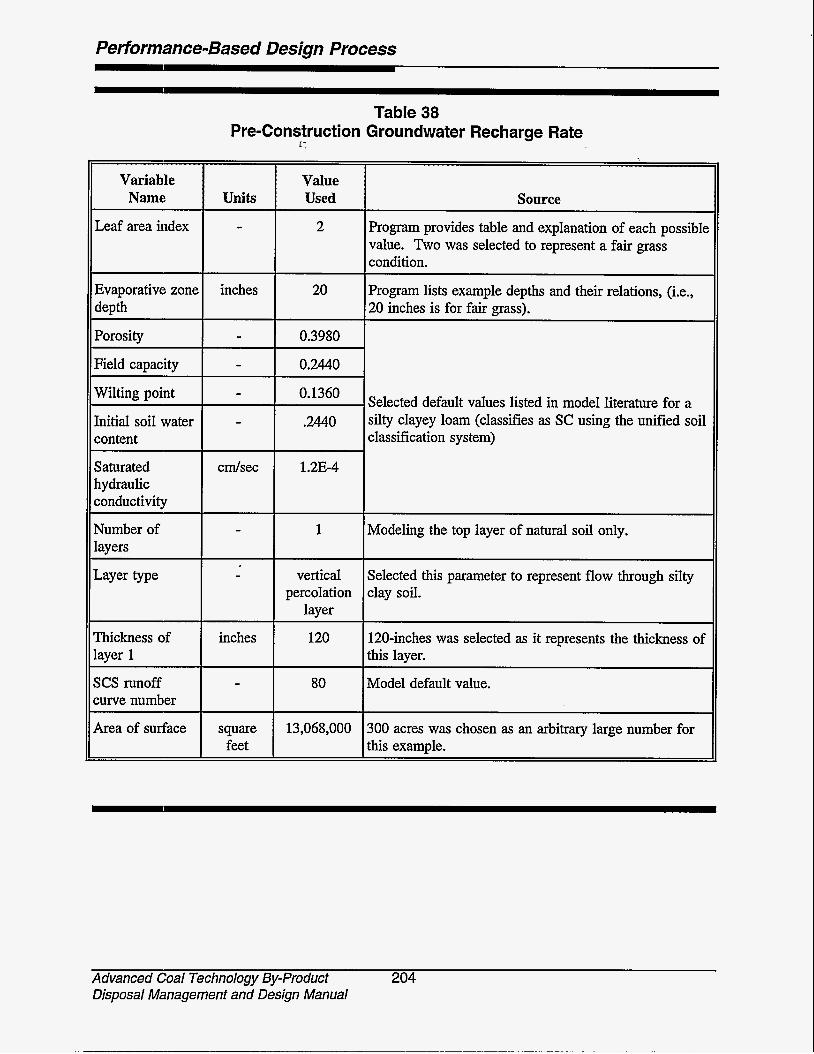
Performance-Based Design Process
-
Table 38 Pre-Construction Groundwater Recharge Rate
2
VariabIe Value Name I Units 1 Used
~- -
cdsec
Leaf area index
0.1360
.2440
1.2E-4
-
Evaporative zone inches depth I I 2o
vertical percolation
layer
Porosity I - I 0.3980
Field capacity I - I 0.2440
Wilting point
Initial soil water content
Saturated hydraulic zonduc tivity
Number of layers
Layer type
- I '
I inches I 120 I'hickness of layer 1
SCS runoff 1 f;et 1 80 :urve number
kea of surface square 13,068,000
Source
Program provides table and explanation of each possible value. Two was selected to represent a fair grass condition.
Program lists example depths and their relations, (i.e., 20 inches is for fair grass).
Selected default values listed in model literature for a silty clayey loam (classifies as SC using the unified soil classification system)
Modeling the top layer of natural soil only.
Selected this parameter to represent flow through silty clay soil.
120-inches was selected as it represents the thickness of this layer.
Model default value.
300 acres was chosen as an arbitrary large number for this example.
Advanced Coal Technology By-Product 204 Disposal Management and Design Manual
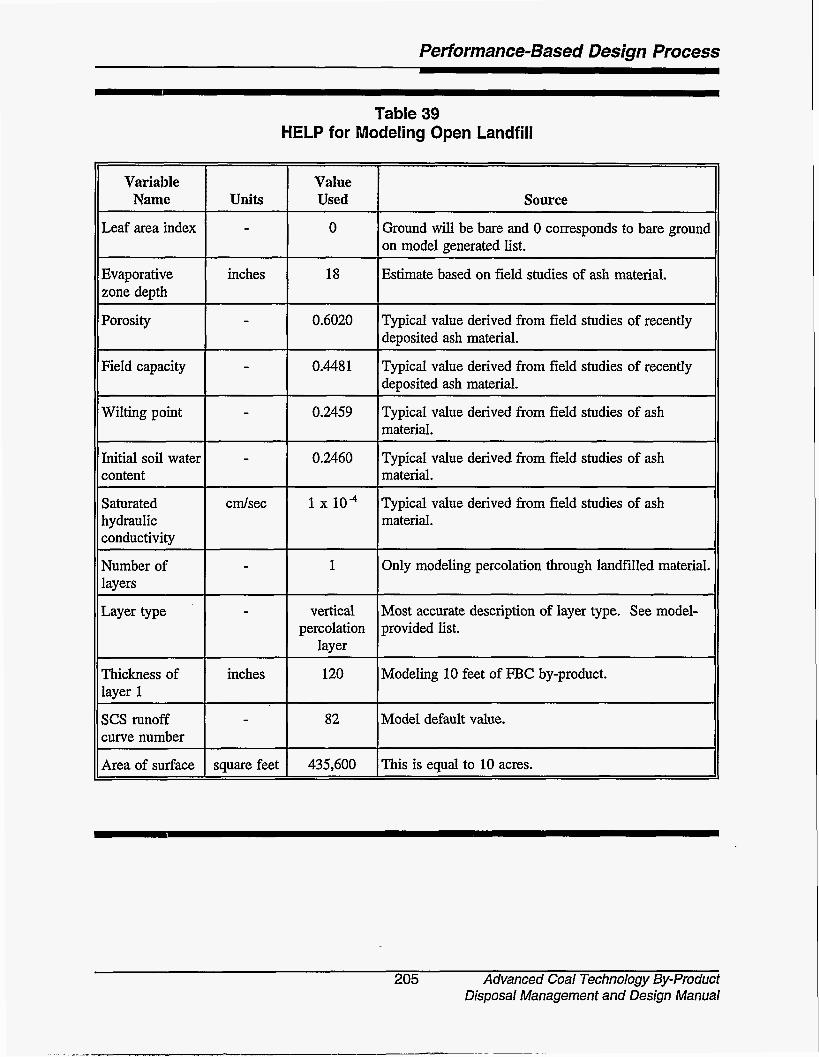
Performance-Based Design Process
Variable Name Units
Table 39 HELP for Modeling Open Landfill
Value Used Source
Leaf area index
Evaporative zone depth
Porosity
Field capacity
Wilting point
Initial soil water content
Saturated hydraulic conductivity
-
inches
-
-
-
-
c d s e c
Ground will be bare and 0 corresponds to bare ground O I on model generated list.
Estimate based on field studies of ash material. l8 I
Typical value derived from field studies of recently o.6020 I deposited ash material.
0.4481 1 Typical value derived from field studies of recently deposited ash material.
0.2459 I Typical value derived from field studies of ash material.
0.2460 I Typical value derived from field studies of ash material.
1 x lo4 Typical value derived from field studies of ash material.
Number of layers
Layer type
1
vertical percolation
layer
I inches I 120 Thickness of layer 1
Only modeling percolation through landfilled material.
Most accurate description of layer type. See model- provided list.
~~~ ~~ ~
Modeling 10 feet of FBC by-product. ~ ~ _ _ _
SCS runoff 1 - 1 82 IModel default value. curve number
Area of surface I square feet I 435,600 IThis is equal to 10 acres.
205 Advanced Coal Technology By-product Disposal Management and Design Manual
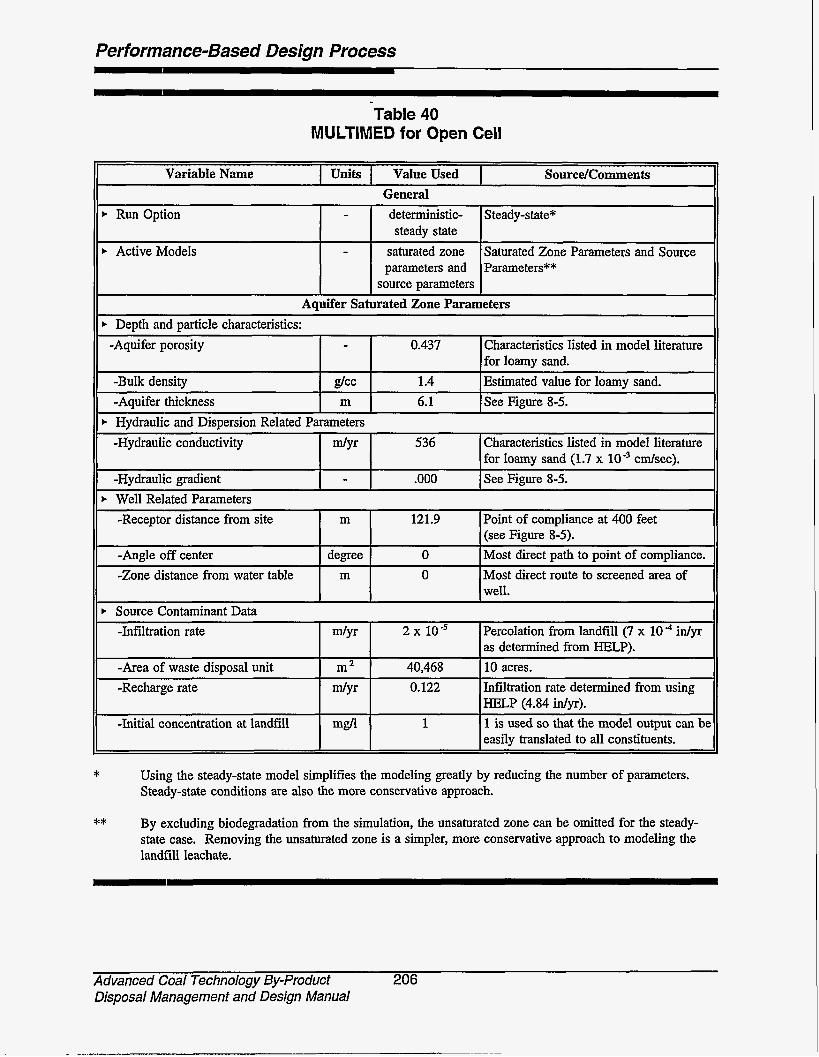
Performance-Based Design Process
b Run Option
Table 40 MULTIMED for Open Cell
- deterministic- Steady-state* steady state
-Aquifer porosity
-Bulk density -Aquifer thickness
11 b Active Models
- 0.437 Characteristics listed in model literature for loamy sand.
m 6.1 See Figure 8-5. d c c 1.4 Estimated value for loamy sand.
II
-Hydraulic conductivity
-Hydraulic gradient
saturated zone parameters and Parameters**
Saturated Zone Parameters and Source 1 - 1 I
dYr 536 Characteristics listed in model literature for loamy sand (1.7 x 10” cdsec).
- .ooo See Figure 8-5.
-Receptor distance from site
-Angle off center -Zone distance from water table
m 121.9 Point of compliance at 400 feet (see Figure 8-5).
degree 0 Most direct path to point of compliance. m 0 Most direct route to screened area of
well.
*
-Infiltration rate
-Area of waste disposal unit -Recharge rate
-Initial concentration at landfill
Using the steady-state model simplifies the modeling greatly by reducing the number of parameters. Steady-state conditions are also the more conservative approach.
dYr 2 x Percolation from landfill (7 x lo4 idyr
m 2 40,468 10 acres. dYr 0.122 Infiltration rate determined from using
msll
as determined from HELP).
HELP (4.84 idyr). 1 is used so that the model output can be easily translated to all constituents.
1
** By excluding biodegradation from the simulation, the unsaturated zone can be omitted for the steady- state case. Removing the unsaturated zone is a simpler, more conservative approach to modeling the landfill leachate.
Advanced Coal Technology By-product 206 Disposal Management and Design Manual
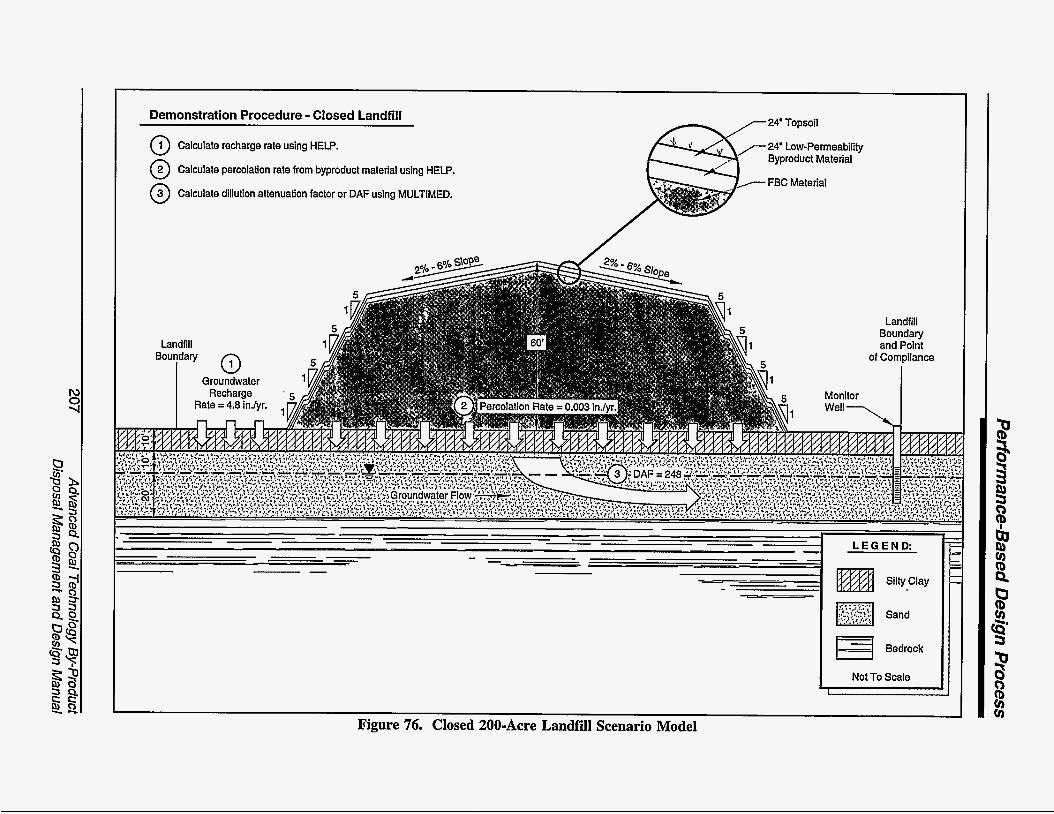
Demonstration Procedure - Closed Landfill
@ Calculate recharge rate using HELP.
@ Calculate percolation rate from byproduct material using HELP.
@ Calculate dillution attenuation factor or DAF using MULTIMED.
Landfill Boundary I O
24' Topsoil
24' Low-Permeability Byproduct Material
FBC Material
5 1
Landfill Boundary and Point
of Compliance
I LEGEND:
I Silty Clay
,.,... I .... .. . L,' :.. , E] Sand
17 Bedrock
Not To Scale
Figure 76. Closed 200-Acre Landfiil Scenario Model

Performance-Based Design Process
Source Simulating soil cover, Low-permeability by-product material, and FBC by-product. Two corresponds to fair grass in model explanation. Typical value derived from field studies of ash material. Selected default values listed in model literature for a silty clayey loam (classifies as SC using the unfired soil classification system; Selected default values listed in model literature for a silty clayey loam (classifies as SC using the unfired soil classification system; Selected default values listed in model literature for a silty clayey ,loam (classifies as SC using the unfired soil classification system:
,
Table 41 HELP for Modeling Closed Landfill Cell
Variable Name
Value Units Used
I - I 3 IlNumber of Layers
Field capacity
I 1
IrLeaf area index 1 - 1 2
- 0.2440
IIEvaporative zone depth I inches I 20
Initial soil water content
I - I 0*3980 Cover material: porosity II
- 0.2440 I - I 0-1360
I( Wilting point
Saturated hydraulic conductivity Thickness of layer 1 SCS runoff curve number Low-permeability cover: - 11 porosity I I 0*4300
0.3660 0.2800
IIThickness of layer 2 1 inches I 24
I - I 0.5876 Landfill material: I( porosity
IlField capacity I - I 0.3566 Wilting point 0.2459 Initial soil water content 0.2460 Saturated Hydraulic Conductivity
IlThickness of layer 3 I inches I 480 11 Area of surface square 8,712,000 I feet I
Advanced Coal Technology By-product 208 Disposal Management and Design Manual

Performance-Based Design Process
and surface slope of the completed landfill prevent most rainfall from entering the landfill. However, the percolation rate is higher than the active cell percolation even though actual infiltration is lower. The FBC material's properties stabilize after absorbing several years of infiltration. Therefore, the infiltration into the landfill material is less likely to be trapped and will pass through as leachate.
Step Three: Calculate DAF-MULTIMED will be used to mlculate the DAF for the closed landfill. The only parameters that change between the open cell run and this one are the "infiltration rate" and the "area of waste disposal unit," which are listed in Table 41. For the second simulation, the infiltration rate is taken from the closed landfill HELP results (0.003 idyr), and the landfill size is the full 200 acres. This MULTIMED run is shown in Appendix E. The resulting concentration at the point of
compliance from this MULTIMED simulation for a closed cell is 4 x 10 -3. Therefore, for every part per million of a constituent in the leachate from a closed cell, approximately 4 x l o 3 parts per million will be detected at the point of compliance for this particular scenario. The DAF is the reciprocal of the final concentration, or 248.
Conclusions
Table 42 presents the constituent concentrations at the point of compliance on the basis of DAFs calculated in these two scenarios. Even though the approach to modeling the active and closed versions of the landfill was conservative, all the COCs were estimated to be under the regulatory limits. These scenarios illustrate that groundwater can be protected using simple engineering measures without the use of complex cap and liner systems specified in most state industrial solid waste regulations.
Table 42 Estimated Leachate Contribution to COC Concentrations
at Point of Compliance (mg/L)
* Secondary MCLs listed in 40 CFR Part 143. ** Assuming background concentration of 230, total of leachate plus background should not exceed 250.
209 Advanced Coal Technology By-product Disposal Management and Design Manual
Performance-Based Design Process
The models also illustrate that in many instances groundwater contamination by advanced coal technology by-products may consist primarily of common chemical compounds regulated under the total dissolved solids (TDS), chloride, or sulfate MCLs under federal secondary drinking water standards, rather than specific toxic metals such as arsenic, chromium, or cadmium. Furthermore, the models used above assume a constant source concentration over the entire 20-year period considered. In reality, the concentrations of many of the common salts which create the high TDS leachate decline rapidly in the first few years after landfill construction (see Chapter 9), reducing the long- term contaminant loading.
Finally, it should be mentioned that field tests suggest that low-permeability by- product liners, such as the FBCPFA cap described in this scenario, may not maintain a permeability as low as the 2 X 10 c d s e c value used in the model over their entire design lifetime. Increased linerkap permeability will tend to increase infiltration and reduce the DAF. Field tests of FBCPFA materials are continuing.
8.3 Citations
1.
2.
3.
4.
5.
56 Federal Register 50978 (October 9, 1991).
Electric Power Research Institute. EPRI CS-2801. FGD By-product Disposal Manual, Third Edition. Palo Alto, California, 1983.
Bagchi, Amalendu. Desim Construction, and Monitoring of Sanitary Landfill. John Wiley & Sons, New York, 1990.
U.S. Environmental Protection Agency. The Hydrologic Evaluation of Landfill Performance (HELP) Model, Vol. II, Doc. for Version 1. EpA1530-SW-84- 101. Cincinnati, Ohio, 1984.
U.S. Environmental Protection Agency. User Manual Supplement: Usinr: MULTlMED to Evaluate Subtitle D Landfill Desims. Cincinnati, Ohio, 1993.
Advanced Coal Technology By-product 21 0 Disposal Management and Design Manual
Results and Conclusions from Case Studies
This chapter summarizes the results from the field testing program conducted from 1989 through 1994 at test sites located in Colorado, Ohio, and Illinois. Each site consisted of one or more landfill test cells constructed with dry lime-based SO , control by-products. The sites were monitored to assess constructability, changes in by-product characteristics over time, and environmental performance. This chapter consists of a conceptual model of the behavior of the materials in the test cells in terms of cement formation, weathering, leaching, and migration of regulated constituents, and a compilation of summary data describing the performance of each of the test cases.
The conceptual model of landfill behavior developed in the first part of this chapter is limited to materials initially containing some mixture of coal ash, lime, and calcium sulfate/sulfite, since these are the basic components of the dry, lime-based SO, control by-products included in the field study. Some discussion of the probable behavior of other types of advanced coal technology by-products, based on the initial characterization data from Chapter 3, is included at he end of this section. The data on transport and attenuation of dissolved constituents contained in the landfill leachate are likewise site-specific, and while they may represent general trends they should not be applied to other sites without further testing.
The second portion of this chapter discusses the field results from the six landfill test cells at the three test sites. The con- structioxi of these test cells generally followed the construction scenario detailed under Option 5 of Alternative 2 discussed in Chapter 7. The minimal design and engineering specifications
of this option result in "worst case" results in these test cases; the amounts of water infiltrating the landfill test cells far exceeds what could be expected in a landfill constructed with a cap engineered to exclude water, and the leachate volumes affecting the groundwater are much greater than for landfills constructed with any sort of linerfleachate collection system. The changes in physical and chemical properties of the landfilled materials themselves are also much more rapid than would be expected for a landfill designed to exclude water. On the other hand, full-scale landfills will require continued monitoring for approximately ten times as long the test cells constructed for this project, given the standard thirty-year post-closure bonding period.
9.1 Conceptual Model of Landfill Behavior
M e r construction of a landfill with advanced coal technology by-products, natural forces will tend to gradually alter the initial state of the landfill. The weathering of the landfill materials represents a general trend toward chemical equilibrium with the surface environment. Dry, calcium-based SO , control by-products have a high reactivity with water, and can undergo rapid initial reactions as a result of water added during construction activities. These reactions can lead to sub- stantial changes in the physical properties of the landfill materials over a time period of months to years, especially if additional water is available. The physical changes can in turn affect the continued weathering of the landfill, including the quantity and quality of leachate produced from the landfill. Leachate per- colating from the base of the landfill may migrate downgradient with the groundwater.
21 1 Advanced Coal Technology By-product Disposal Management and Design Manual

Results and Conclusions from Case Studies
As it migrates, leachate may undergo further reactions and dispersion. Transported leachate may eventually affect the concentrations of regulated species at point-of-compliance moni- toring locations.
The conceptual model developed on the basis of field observations made under this project attempts to address all of the elements related to landfill performance, from landfill construction to permit compliance monitoring.
9.1. I Weathering and Changes in Mineral, Physical, and Chemical Properties
Weathering of advanced coal technology by-product landfills is primarily caused by the actions of water infiltrating from the surface of the landfill. Surface erosion by wind or water is a secondary problem which is easily controlled through proper maintenance. In contrast to the cementitious reactions which occur after initial wetting and compaction of these materials, long-term exposure to water generally has a deleterious effect.
Water added during the landfill construction to aid placement and compaction initiates cementitious reactions, forming calcium hydroxide, gypsum, and ettringite. Over the course of the initial 30 to 90 days, these reactions increase the load-bearing strength of the materials and reduce permea- bility in comparison with the freshly placed materials. Long-term exposure to water reverses these trends and can gradually reduce the material to a loose, friable state. The rate and extent of the weathering depends on the initial composition of the by-products, how they are placed in the landfill, and the total amount of water which infiltrates the landfill. The process of cementation and weathering is shown schematically in Figure 77.
The initial composition of the by- products will affect the extent of mineralization reactions which occur. In many cases the amount of water added during construction will
not be enough to satisfy the long-term chemical water demand. In general, either the initial free lime content [CaO plus Ca(0H) J or the sulfate content of the ash will limit the total amount of water which can be incor- porated into the solid in the long term, as shown in Table 43. Following initial con- struction, additional water infiltrating the landfill will first be partitioned into additional cement-forming minerals. Additional cement formation can produce further increases in load-bearing strength and decreases in perme- ability beyond the 30 to 90 day values, how- ever, if the initial cementation has formed the compacted materials into a rigid structure, and if sufficient quantities of additional cements are created, fracturing and expansion may occur.
Fractures can reduce the load-bearing strength of the landfilled materials and may present structural problems depending on their location and the design slope and height of the landfill. Fractures also provide a channel for infiltration of additional water into an un- capped landfill. During a heavy rain, surface water can move rapidly along fractures and penetrate beyond the zone of evapotranspira- tion, increasing the fraction of incident rainwater that becomes leachate.
Standard tests for expansion such as American Society for Testing and Materials (ASTM) C-490 can provide an indication of the expansive potential of a given material. The test may require over a year to complete however, since expansion occurs after initial set of the materials and is slow. In addition, there are not enough data available to predict the correlation between expansion seen in the standard test and expansion in a landfill setting. The compressive forces exerted by overlying by-products and soils may tend to reduce the expansion but there is no standardized test or rule of thumb to quantify this effect.
If fracturing does not occur, continued growth of ettringite and other cementing minerals may continue to increase material
Advanced Coal Technology By-product 21 2 Disposal Management and Design Manual
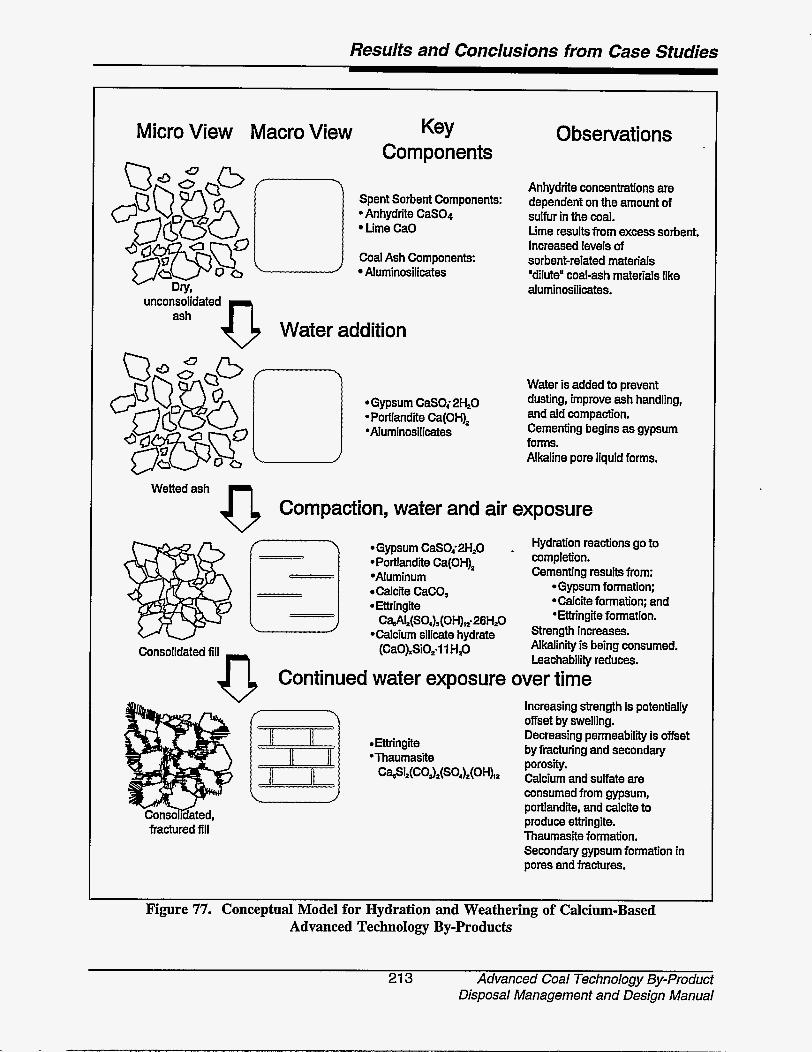
Results and Conclusions from Case Studies
Micro View Macro View
unconsolidated n
Key Components
Spent Sorbent Components: -Anhydrite Cas04
time CaO
Coal Ash Components: Aluminosilicates
ash
i ) Water addition
*Gypsum CaSO; 2H20 *Portlandfie Ca(0W2 *Aluminosilicates
Observations
Anhydrite concentrations are dependent on the amount of sulfur in the coal. time results from excess sorbent. Increased levels of sorbent-related materials 'dilute" coal-ash materials like aluminosilicates.
Water is added to prevent dusting, improve ash handling, and aid compaction. Cementing begins as gypsum forms. Alkaline pore liquid forms.
Wettedash i ) Compaction, water and air exposure
Consolidated fill
0 Continued
*Gypsum CaSOi2H20 *Portlandfie Ca(OH), *Aluminum Calcite CaCO,
*Ettnhgite
*Calcium silicate hydrate C ~ Z ( ~ O ~ ) ~ ( O ~ ~ ~ * ~ ~ H ~ O
(Ca0)SiO2-11 H,O
water exposure
Hydration reactions go to completion. Cementing results from:
-Gypsum formation; *Calcite formation; and 'Ettringite formation.
Strength increases. Alkalinity is being consumed. Leachability reduces.
over time Increasing strength is potentially offset by swelling. Decreasing permeability is offset
porosity.
consumed from gypsum, portlandite, and calcite to produce ettn'ngite. Thaumasite formation. Secondary gypsum formation in pores and fractures.
*Ettringite by fracturing and secondary 'Thaumasite c~i2(c0~2(s04)2(0~2 Calcium and suvate are
fractured fill
Figure 77. Conceptual Model for Hydration and Weathering of Calcium-Based Advanced Technology By-Products
21 3 Advanced Coal Technology By-product Disposal Management and Design Manual
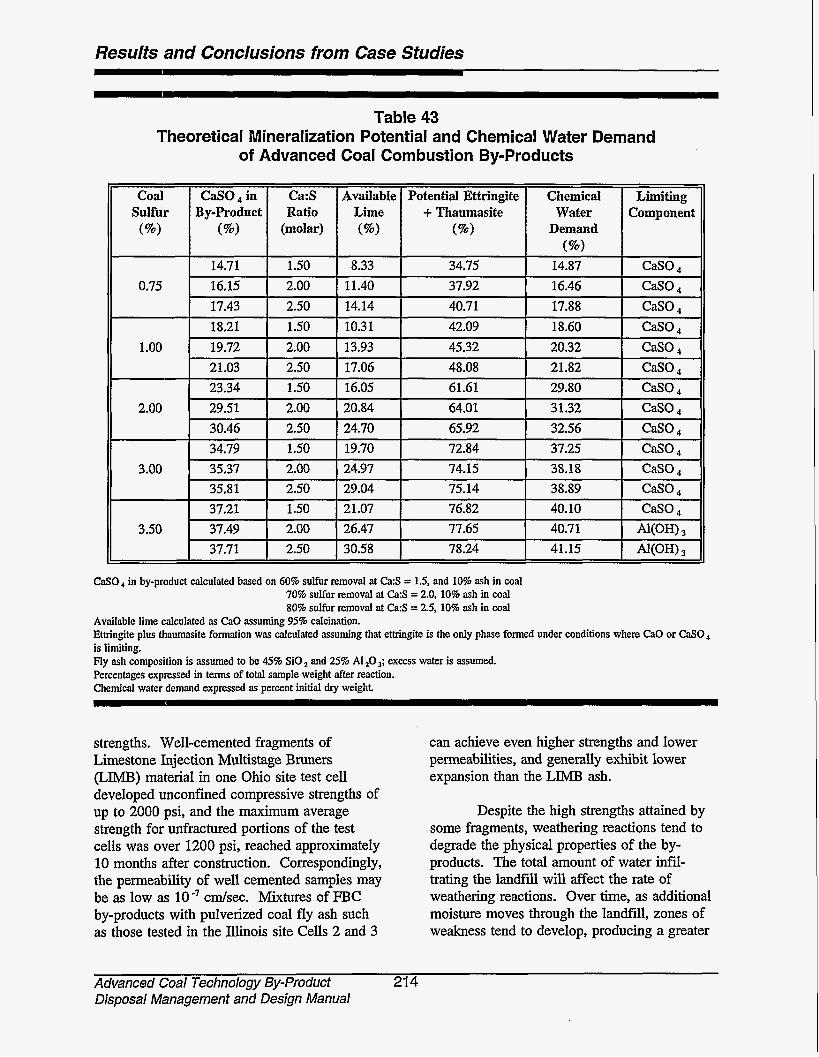
Results and Conclusions from Case Studies
Table 43 Theoretical Mineralization Potential and Chemical Water Demand
of Advanced Coal Combustion By-products
CdO, in by-product calculated based on 60% sulfur removal at Ca:S = 1.5, and 10% ash in coal 70% sulfur removal at Ca:S = 2.0, 10% ash in coal 80% sulfur removal at Ca:S = 2.5,10% ash in coal
Available lime calculated as CaO assuming 95% calcination. Ettringite plus thaumasite formation was calculated assuming that ettringite is the only phase formed under conditions where CaO or &SO4 is limiting. Fly ash composition is assumed to be 45% Si0 and 25% AI zO 3; excess water is assumed. Percentages expressed in terms of total sample weight after reaction. Chemical water demand expressed as percent initial dry weight.
strengths. Well-cemented fragments of Limestone Injection Multistage Bruners (LIMB) material in one Ohio site test cell developed unconfined compressive strengths of up to 2000 psi, and the maximum average strength for unfractured portions of the test cells was over 1200 psi, reached approximately 10 months after construction. Correspondingly, the permeability of well cemented samples may be as low as 10 cdsec. Mixtures of EBC by-products with pulverized coal fly ash such as those tested in the Illinois site Cells 2 and 3
can achieve even higher strengths and lower permeabilities, and generally exhibit lower expansion than the LIMB ash.
Despite the high strengths attained by some fragments, weathering reactions tend to degrade the physical properties of the by- products. The total amount of water infil- trating the landfill will affect the rate of weathering reactions. Over time, as additional moisture moves through the landfill, zones of weakness tend to develop, producing a greater
Advanced Coal Technology By-Product Disposal Management and Design Manual
21 4

Results and Conclusions from Case Studies
spread of values in unconfined compressive strength tests and increased permeabilities in core samples. Over time, fracturing and dissolution may make the physical properties of advanced coal by-products resemble those of soils, rather than cemented materials '. Two factors which are implicated in these continued changes in physical properties are 1) the development of large secondary pores, and 2) the growth of the mineral thaumasite.
Secondary pores develop as surface water with initially low dissolved solids con- centrations moves through the landfill and leaches out soluble species. Rainwater is gene- rally slightly acidic and ettringite is stable only at pH values greater than about 10, so ettringite breaks down along fractures carrying per- colating water, leaving a lining of gypsum. Residual portlandite is also subject to dis- solution. As the number and size of secondary pores increases the permeability also increases. The growth of secondary pores is directly related to the volume of soluble material removed, and thus the amount of water which moves through the landfill.
The secondary pores not only provide additional channels for the rapid movement of water through the landfill, but may also significantly affect the composition of the leachate produced from the test cell. Since pores rapidly become lined with gypsum, the percolating water experiences an environment significantly different from the bulk com- position of the landfill, which may consist primarily of ettringite, thaumasite, gypsum, and portlandite. Equilibrium chemistry suggests that the leachate from gypsum-lined pores will have a much lower pH, lower total dissolved solids, and higher calcium concentration than samples from the bulk material, which are in contact with a non-equilibrium assemblage including portlandite, calcite, and ettringite. This assemblage tends to increase the pH and depress the calcium concentration of the solution. Low calcium concentrations can cause the concentrations of sulfate and other ions to increase dramatically since they are
linked through the solubility properties of gypsum and other solid phases.
Continued weathering of lime-based advanced coal technology by-products can also result in thaumasite formation. The mineral thaumasite, which is structurally similar to ettringite, can form instead of ettringite when sufficient carbonate and silicate are present in solution. Thaumasite formation is associated with decreased strength and increased permeability of the landfill materials. The mechanisms for these effects of thaumasite formation are unclear, although the flat, matted habit of thaumasite may provide planes of cleavage whereas the ettringite needles provide an interlocked, three-dimensional network.
In the LIMB test cells where it was found, thaumasite formation was first noted approximately one year after construction. No significant amounts of thaumasite have been detected in any FBC test cells. The amount of soluble silicate glass present in FBC residues may be insufficient to form detectable amounts of thaumasite. The delay in thaumasite formation may be due to the cooler tem- peratures following the first winter of exposure and the availability of dissolved carbonate. Some authors suggest that thaumasite forms only at temperatures below 15°C '. The first detection of thaumasite in the Ohio test cells occurred following the first winter when the temperature was 15°C or less throughout the test cells.
The carbonate required for thaumasite formation may be derived from calcium carbonate present in the initial ash or from CO
absorbed from the atmosphere. Only a small amount of carbonate is required to form thaumasite; the dissolution of approximately 2 weight percent calcite supplies enough car- bonate to form 30 weight percent thaumasite, based on the nominal formula for pure end- member thaumasite. Semi-quantitative x-ray diffraction analyses suggest that a loss of calcite of this magnitude accompanied the formation of thaumasite in the LIMB test cells
21 5 Advanced Coal Technology By-product Disposal Management and Design Manual

Results and Conclusions from Case Studies
although this is near the limit of quantification for the method. Scanning electron microscope (SEW micrographs of landfill cores also show dissolution pits on calcite grains, again indicating that calcite became undersaturated in the test cells and could have served as a source of carbonate for thaumasite formation.
Respiration in the root zone of vegetation established on the soil cover approximately one year after test cell construc- tion may also have supplied some dissolved carbonate to the test cells. Although there is no clear correlation between thaumasite abund- ance and proximity to the soil cover, thauma- site is found largely along fracture surfaces which represent pathways for the movement of percolating water. This mode of occurrence suggests that an external source of carbonate may be important to thaumasite formation as well as the calcite contained in the ash.
In the long term, additional weathering of ettringite and thaumasite is likely. The details of the ettringite and thaumasite alteration are not well understood at present, but will be affected by both equilibrium and kinetic effects. Both of these minerals are stable only at alkaline pHs. The excess free . lime which is present in most lime-based SO control by-products will buffer the pH of the bulk material at pH 12 to 12.5, but as calcium hydroxide is dissolved away, first near larger pores and fractures and then in the bulk material, ettringite and thaumasite will be subject to attack. By-products containing higher concentrations of calcium sulfate relative to lime, reflecting a higher Ca utiliza- tion value, may be totally depleted of free lime following ettringite and thaumasite formation. Without lime to buffer the pH, these materials may be subject to more rapid weathering.
Rain water and soil pore waters carrying dissolved C 0 2 are slightly acidic and will gradually alter ettringite and thaumasite into a mixture of common soil minerals including gypsum, calcite, and aluminum and silicon oxides or hydroxides. Despite these
equilibrium constraints, ettringite and thaumas- ite may persist as metastable phases for a con- siderable period of time because of kinetic barriers. Altered ettringite and thaumasite will not simply dissolve away, and the alteration products may retain the physical shape of the original crystals despite chemical and mineralogical changes. The long-term strength and stability of soils derived from an altered ettringitekhaumasite assemblage has not been determined, and the time scale required to complete these mineralogical changes is unknown.
More details of the weathering process and mineralogical transformations of the landfiied materials in specific field examples are provided in Section 9.2.
9.1.2 Leachate Generation and Attenuation
The lime-based advanced coal technology by-products examined in the field study initially were able to absorb large amounts of water without producing leachate. The combination of chemical reactions which bind water into the solids and the microporous structure of the bulk material allow large amounts of water to be held without drainage. In some samples the field capacity was near 100% on a dry weight basis. The high field capacity of these materials may allow all or most of the rainfall incident on the landfill during its uncovered construction phase to be stored without drainage. If run-on controls and an engineered cap system are included in the final design little or no leachate may be produced even in relatively wet environments.
In the field test cells constructed for this project, the cover soils were engineered to support a vegetative cover and minimize erosion, but not to exclude water. With this type of cap and with continued exposure to precipitation, in most disposal environments the field capacity of the materials is eventually reached and leachate drainage begins. The amount of leachate generated under these
Advanced Coal Technology By-product Disposal Management and Design Manual
21 6

Results and Conclusions from Case Studies
minimally engineered conditions depends on the amount of water percolating past the zone of evapotranspiration, generally the uppermost one to two feet of the cover soil. Under the site conditions in Illinois and Ohio this resulted in an average of approximately 20% of the . incident rainfall percolating through the test cells and emerging from the base of the landfill as leachate.
The test cells constructed for this project represent a worst-case scenario in terms of leachate volume produced. As discussed in Chapter 8, leachate production can be reduced by increasing evapotranspiration, increasing surface runoff, providing lateral drainage, or by including a low permeability barrier layer in the cap design. Measures which increase evapotranspiration include better vegetation and slower percolation of water past the root zone. Runoff can be increased by increasing the surface slope of the completed landfill or by reducing the permeability of the surface layer. Lateral drainage is created when a permeable layer overlies a less permeable zone with ade- quate slope. Low permeability barriers can consist of compacted clay or clay amended native soil, or synthetic membrane liners.
Leachate production models such as the Hydrologic Evaluation of Landfill Per- formance (HELP) model4 (refer to Chapter 8) are common tools used to guide regulatory requirements for landfill design and operation. Because of the unique properties of lime-based advanced coal combustion by-products, these models should be used with care. Default values derived from non-reactive soil materials or pulverized coal fly ash may not apply to advanced coal combustion by-products. More specialized leaching models, such as the FOWLW’ code developed by the Electric Power Research Institute (EPRI), may better represent the leaching of advanced coal by- products. The reactive potential of the materials must also be accounted for in predicting the amount of free water which will be produced as leachate. Fractures and other discontinuities in the material properties of the
landfill are also not accounted for in most models, and can contribute significantly to the overall bias of the results.
Leachate quality is related to the initial composition of the materials placed in the landfill, the extent of subsequent reactions in the landfill, and the amount of leachate that is produced. The initial composition of the landfiil materials places certain limits on leachate composition. For example, materials with a very low concentration of a particular trace element generally will not produce leachate with high concentrations of that element unless it is strongly partitioned into the liquid phase. Likewise, materials which do not contain free lime or other alkalis will not have an elevated pH.
Reactions that change the mineralogy of the landfilled materials can have a profound effect on their solubility and on leachate quality. In addition, trace species leachability can be changed by mineralogical reactions, as some species are strongly bound to newly formed solids. Research has shown that many trace metals (i.e., arsenic, boron, and selenium) can be removed from solution into ettringite- structure minerals under some circumstances ‘.
Leachate volume is inversely proportional to leachate concentrations for many common ions that are not controlled by solubility. If only a small amount of leachate is generated, it will contain relatively high con- centrations of the most soluble species. After a large amount of leachate has been produced, the concentrations of many species are significantly reduced as the most soluble species are washed out ’.
The transport and dispersion of landfill leachate in the vadose zone below the landfill and in the shallow groundwater downgradient of the source area can be modeled with a variety of codes of varying complexity. Water movement in the unsaturated and saturated zones can be evaluated using models such as
21 7 Advanced Coal Technology By-product Disposal Management and Design Manual

Results and Conclusions from Case Studies
HELP and MULTIMED ', which are discussed in Chapter 8 of this manual, or other independently developed models such as EPRI's FOWL 5, MYGRT or FASTCHEM lo models. Site-specific and by-product-specific data may be required for model input and, depending on the variability of the hydrogeological conditions at a particular site and the amount of data available, model predictions may be possible only within broad limits. Regulatory requirements should be checked before any site modeling is initiated.
Chemical reactions that immobilize some leachate components can take place in the soils or groundwater as the leachate encounters changing conditions of pH, oxi- dation-reduction potential, temperature, and the presence of other chemical components in the soils or groundwater. In general, these reactions either retard the rate of transport of dissolved species relative to the rate of transport of the water itself through reversible reactions or reduce the dissolved concentrations of some species by means of irreversible reac- tions. Reversible reactions may include surface adsorption and/or cation exchange reactions that have a limited capacity to fix leachate components. Cationic species, and polyvalent metals in particular, are generally more highly retarded than anions or uncharged species since they are more strongly bound to cation exchange sites on clay minerals. Precipitation reactions are the most important irreversible reaction mechanism; precipitation can provide an essentially unlimited sink for certain species under stable subsurface conditions.
A number of models are available to predict transport on the basis of more or less sophisticated chemical codes. Most models do not treat geochemical reactions mechanistically (the EPRI FASTCHEM model is an exception), but use overall "retardation factors" to represent all processes of precipitation and adsorption. Accurate mechanistic modeling requires a considerable amount of site-specific data as input for both the chemistry and
hydrogeology of the landfill area. Localized variations in aquifer properties such as discontinuous bedding, fractures or faults, and oxidation-reduction boundaries are common and complicate both physical and chemical modeling. Although models should not be relied upon for precise estimates of contaminant concentrations in groundwater or plume migration rates, they can be very useful for applications such as siting compliance monitoring locations and determining critical design sensitivities.
Anions, and particularly highly soluble species such as chloride, are useful as early indicators of leachate migration from landfills since they generally travel faster in groundwater than the trace metals which are the primary regulatory focus. Although com- pliance monitoring often does not require measurement of these species, early warning of any problems may reduce the need for corrective action, justifying the additional monitoring expenses.
The data on leachate generation and contaminant migration gathered during the field testing associated with this project are described in greater detail with specific examples from the field test cases in Sections 9.2 and 9.3.
9.1.3 Behavior of Other Advanced Coal Technology By-products
The weathering of other types of advanced coal technology by-products can follow quite different pathways than those discussed for calcium-based SO control systems. The different technologies can be grouped according to whether the coal ash fractions and the sulfudsorbent fractions are managed separately or together and according to the sulfur removal technology employed. These two variables determine the range of chemical components present in the by-product stream and their mineral form. These initial conditions play a large role in determining type of reactions which will occur following
Advanced Coal Technology By-product Disposal Management and Design Manual
21 8

Resulfs and Conclusions from Case Sfudies
disposal and the appropriate landfill design criteria. Table 44 summarizes the different weathering reactions and by-product management issues for a range of advanced coal technologies.
Ash from pressurized fluidized bed combustion (PFBC) is similar to the materials used in this field study; although the amount of free lime contained in PFBC ash is much lower than in atmospheric fluidized bed combustion (AEQC) ash, essentially the same suite of minerals is initially present, although if dolomite or dolomite limestone is used as the sorbent, magnesium oxide will be present in the ash 12. Similar reactions to form gypsum and ettringite are likely. The lower initial lime content will limit the amount of ettringite which can form and may lead to more rapid dissolution of these minerals since the pH is not as well buffered. In the short term, heat generation on wetting and expansion because of ettringite formation will probably not be important considerations with PFBC ash.
Sodium injection shares many characteristics with the LIMB process included in this field study; however, the landfill behavior of the two types of by-products is likely to be quite different. Sodium injection by-products do not contain any calcium in addition to that which is contained in the mineral fraction of the coal. In the case of coals producing class F fly ash, the amount of calcium may be too low to permit formation of significant amounts of ettringite or thaumasite as suggested by the low strengths reported for prepared samples of sodium injection by- products 13. The low liquid limit and the high solubility of sodium injection by-products suggest that severe stability problems may result from exposure to any significant amounts of water. Poor leachate quality, primarily from the dissolution of highly soluble sodium sulfates, is also a major concern with sodium injection by-products. Highly alkaline, sulfate- rich leachates from sodium injection by- product landfills may cause ettringite precipitation if they interact with calcium
alumino-silicate minerals beneath the landfii.
By-products from advanced wet FGD and spray-drier technologies differ from the materials considered in the field study in that the mineral portions of the coal are typically managed separately from the flue-gas desulfur- ization by-products. Coal ash associated with these processes is typical of pulverized coal fly ash and has been discussed extensively in other publications 14* 15.
The by-products from advanced FGD systems differ from traditional FGD sludge primarily as a result of additives, typically organic acids, which are added to the system to improve SO removal efficiency and sludge handling characteristics. Although these additives do not generally affect the mineral composition of the FGD by-products, additives may affect the utilization potential and disposal characteristics of the materials. Some additives may result in by-product gypsum that does not meet established criteria for reuse in con- struction materials or agriculture although results from an internal proprietary study at Radian Corporation suggest that this is not a major concern 16. Organic acids subject to bio- logical decomposition will increase the chemical and biological oxygen demand of the waste and may result in anaerobic conditions. Under anaerobic conditions, sulfate or sulfite in the FGD sludge may be reduced to sulfide, potentially creating hydrogen sulfide gas.
The by-products of coal gasification generally include the mineral components of the feed coal and elemental sulfur recovered from the gasified fraction. The elemental sulfur is generally marketed for reuse rather than disposed of and represents no special handling problems. The coal ash fraction resulting from gasification is significantly different from the coal ash resulting from pulverized coal combustion. Gasification is carried out under reduced or only partially oxidized conditions; the minerals in the coal are not fully converted to the oxide form and
21 9 Advanced Coal Technology By-product Disposal Management and Design Manual

Results and Conclusions from Case Studies
Potential Reactions
Table 44 Management Issues for Various Advanced Coal Technologies
Potential Management Issues Technology
AFBC
Anhydrite hydration Magnesium oxide hydration
LIMB
Elevated TDS and trace metals in leachate PFBC
High solubility sodium salts
Gasification
Alkaline leachate Elevated TDS and trace metals in leachate Cementitious reactions similar to LIMB ash if combined with class F fly ash
Rapid leaching and strength loss after initial set High leachate pH; may be above 12.5 Elevated TDS and trace metals in leachate
Advanced Wet FGD
Spray- Dryers
Sodium Injection
Lime hydration Anhydrite hydration Ettringite formation
Lime hydration Anhydrite hydration Ettringite and thaumasite for- mation
Heat generation on initial hydration Dusting during dry handling/transport Premature set during wet transport Swelling and dimensional instability possible High leachate pH, possibly over 12.5 Elevated TDS and trace metals in leachate
Largely inert glass
Additives may chelate metals Additives may create reduced sulfur compounds
Possible mobilization of PAHs and reduced car- bon species Trace metal mobilization in leachate Leachate pH may be alkaline or acidic
H 2S production Organic acids may mobilize trace metals Additives may make by-products less attractive for utilization. I High chemical oxygen demand
I
Possible ettringite/ thaumasite formation
TDS = Total Dissolved Solids FGD = Hue Gas Desulfurization PAH = Polycyclic Aromatic Hydrocarbon
Advanced Coal Technology By-product 220 Disposal Management and Design Manual
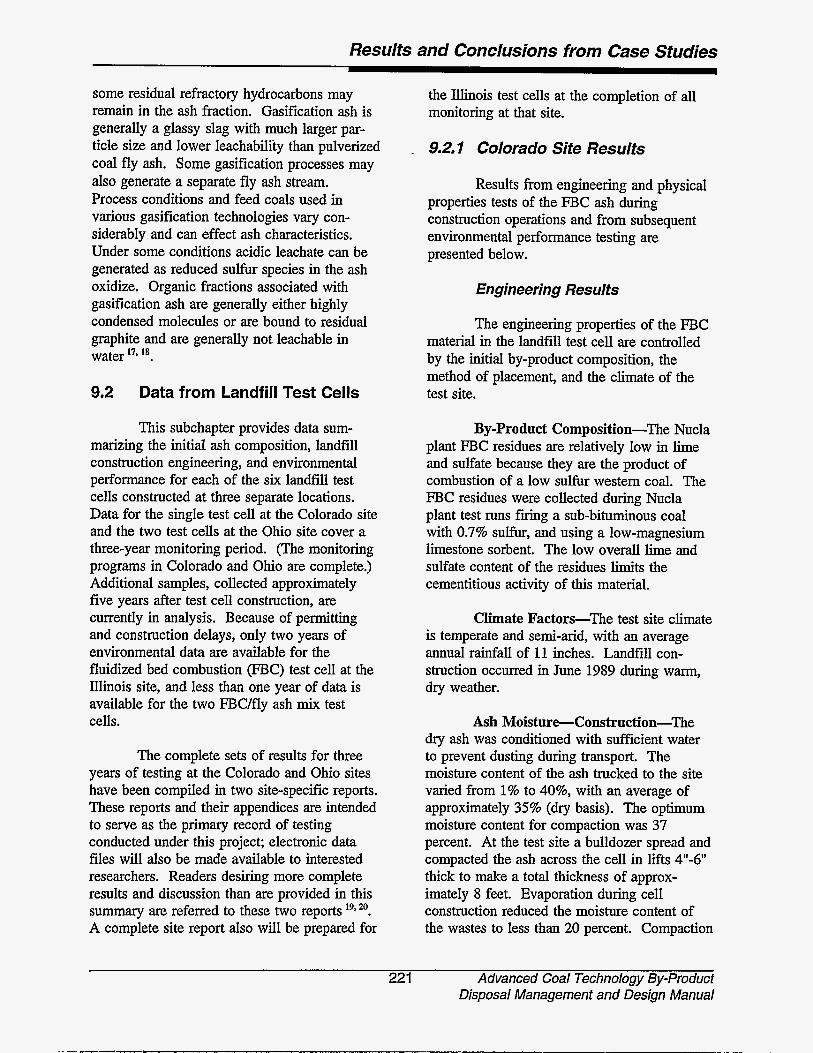
Resulis and Conclusions from Case Studies
some residual refractory hydrocarbons may remain in the ash fraction. Gasification ash is generally a glassy slag with much larger par- ticle size and lower leachability than pulverized coal fly ash. Some gasification processes may also generate a separate fly ash stream. Process conditions and feed coals used in various gasification technologies vary con- siderably and can effect ash characteristics. Under some conditions acidic leachate can be generated as reduced sulfur species in the ash oxidize. Organic fractions associated with gasification ash are generally either highly condensed molecules or are bound to residual graphite and are generally not leachable in water 17* Is.
9.2 Data from Landfill Test Cells
This subchapter provides data sum- marizing the initial ash composition, landfill construction engineering, and environmental performance for each of the six landfill test cells constructed at three separate locations. Data for the single test cell at the Colorado site and the two test cells at the Ohio site cover a three-year monitoring period. (The monitoring programs in Colorado and Ohio are complete.) Additional samples, collected approximately five years after test cell construction, are currently in analysis. Because of permitting and construction delays, only two years of environmental data are available for the fluidized bed combustion (FBC) test cell at the Illinois site, and less than one year of data is available for the two FBC/fly ash mix test cells.
The complete sets of results for three years of testing at the Colorado and Ohio sites have been compiled in two site-specific reports. These reports and their appendices are intended to serve as the primary record of testing conducted under this project; electronic data files will also be made available to interested researchers. Readers desiring more complete results and discussion than are provided in this summary are referred to these two reports m. A complete site report also will be prepared for
the Illinois test cells at the completion of all monitoring at that site.
- 9.2.1 Colorado Site Results
Results from engineering and physical properties tests of the FBC ash during construction operations and from subsequent environmental performance testing are presented below.
Engineering Results
The engineering properties of the FBC material in the landfill test cell are controlled by the initial by-product composition, the method of placement, and the climate of the test site.
By-product Composition-The Nucla plant FBC residues are relatively low in lime and sulfate because they are the product of combustion of a low sulfur western coal. The FBC residues were collected during Nucla plant test runs firing a sub-bituminous coal with 0.7% sulfur, and using a low-magnesium limestone sorbent. The low overall lime and sulfate content of the residues limits the cementitious activity of this material.
Climate Factors-The test site climate is temperate and semi-arid, with an average annual rainfall of 11 inches. Landfill con- struction occurred in June 1989 during warm, dry weather.
Ash Moisture-Construction-The dry ash was conditioned with sufficient water to prevent dusting during transport. The moisture content of the ash trucked to the site varied from 1% to 40%, with an average of approximately 35% (dry basis). The optimum moisture content for compaction was 37 percent. At the test site a bulldozer spread and compacted the ash across the cell in lifts 4"-6" thick to make a total thickness of approx- imately 8 feet. Evaporation during cell construction reduced the moisture content of the wastes to less than 20 percent. Compaction
221 Advanced Coal Technology By-product Disposal Management and Design Manual

Results and Conclusions from Case Studies
Precipitation Runoff Evapotranspiration Percolation Change in Water Storage
during construction resulted in a dry density of 52 Ib/ft 3, only 65% of the maximum dry density (Proctor density) of 78.6 Ib/ft3 for the fly ashhottom ash mix placed in the test cell.
7.94 100.00 0.00 0.00 7.634 96.12 0.00 0.00 0.308 3.88
Ash Moisture-Long-Term-The moisture content of the landfilled FBC residues has increased 3% to 4% per year as shown in the top left graph in Figure 78. The present moisture content is well below the field capacity of the materials, and no drainage of leachate has occurred. Analysis of laboratory- generated leachates from soils underlying the test cell indicate that no leachate migration has occurred. If the current trend of increasing moisture continues, the moisture content would theoretically reach saturation, at approximately 52%, and some leachate drainage may begin to occur. Long term predictions using the HELP model suggest that the current trend will not continue, and that no drainage will occur over the next 20 years. The results of the model simulation are shown in Table 45. The rainfall value used for the long term model run is based on data from Grand Junction Colorado, and is somewhat lower than the average measured rainfall at the test site.
Table 45 Colorado Site Hydrologic Budget
Simulation Results for Long-Term (20-Year) Simulation,
Average Values
Inches of Parameter
Ash Permeability-The permeation of water through the materials of the test cell is largely controlled by the presence of fractures. Permeability estimates from the literature for indurated FBC materials were two to three orders of magnitude lower than measured values. This is a result of the fractures and the variable nature of the landfilled material. The landfill permeability was measured both on core samples and by using an in situ permea- meter, as shown in the upper right graph in Figure 78. Mean core permeabilities increased steadily over time, although individual measurements vary considerably. In situ permeability measurements, that are considered more reliable, remained relatively constant during the three years of field monitoring. In situ measurements vary less since a larger volume of material is tested, thus averaging out the variability introduced by small fractures. The predicted correlation between decreased permeability and pozzolanic activity appears to hold true at the microstructural scale based on SEM observations of the materials.
Load-Bearing Strength-The average compressive strength of the landfilled materials has not changed significantly over the course of the three years of monitoring. Initial strength development was greater in some portions of the landfill than in others. The variability in strength measurements increased during the monitoring period. The bottom graph in Figure 78 shows results of strength tests on core samples from the test cell. According to the results of microstructural analysis, strength development appears to correlate with ettringite growth in zones accessible to percolating water.
Environmental Measurements and Long-Term Monitoring Data
Environmental data collected at the test site included information on runoff volumes and runoff water quality, changes in ash miner- alogy, and ash leachability.
Advanced Coal Technology By-product 222 Disposal Management and Design Manual
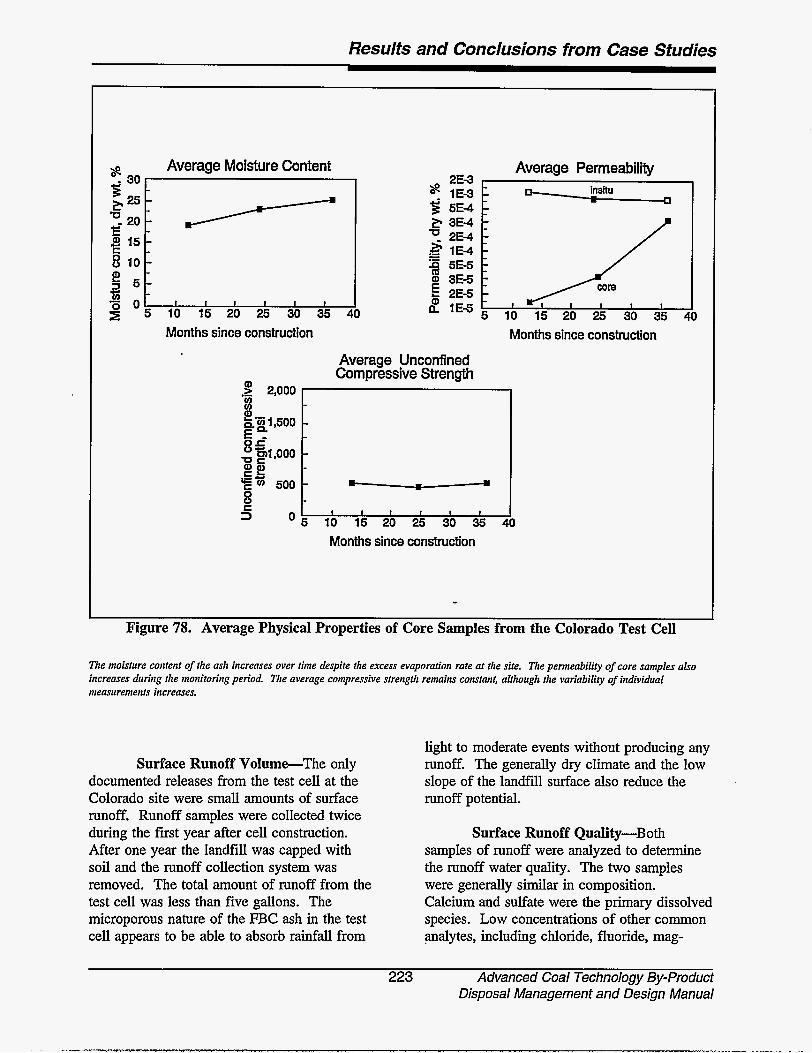
Results and Conclusions from Case Studies
Average Moisture Content
i c 8 15
.- 8 ' 5 10 15 20 25 30 35 1
Months since construction
Average Permeability
I $ 5E-4
Months since construction Average Unconfined Compressive Strength
O b l b l b 20 2; io & 40
Months since consttuction
Figure 78. Average Physical Properties of Core Samples from the Colorado Test Cell
The moisture content of the ash increases over time despite the excess evaporation rate at the site. The permeability of core samples also increases during the monitoring period. The average compressive strength remains constant, although the variability of individual measurements increases.
Surface Runoff Volume-The only documented releases from the test cell at the Colorado site were small amounts of surface runoff. Runoff samples were collected twice during the first year after cell construction. After one year the landfill was capped with soil and the runoff collection system was removed. The total amount of runoff from the test cell was less than five gallons. The microporous nature of the FBC ash in the test cell appears to be able to absorb rainfall from
light to moderate events without producing any runoff. The generally dry climate and the low slope of the landfill surface also reduce the runoff potential.
Surface Runoff Quality-Both samples of runoff were analyzed to determine the runoff water quality. The two samples were generally similar in composition. Calcium and sulfate were the primary dissolved species. Low concentrations of other common galytes, including chloride, fluoride, mag-
223 Advanced Coal Technology By-product Disposal Management and Design Manual
Results and Conclusions from Case Studies
nesium, and sodium, were also present. The pH was between 8 and 9. These results suggest that runoff occurs primarily during heavy rainfall events and that the resulting runoff is a dilute calcium sulfate solution with low alkalinity and moderate pH.
Landfiil Mineralogy-Significant changes in mineral composition of the FBC ash occurred during the three years of monitoring. The changes in concentrations of selected reactive phases are shown in Figure 79. The concentration of the mineral anhydrite declines as it is converted to gypsum and ettringite in the presence of water, while calcite is initially formed via the carbonation of hydrated lime and later broken down and converted to other species. These compositional changes generally follow the conceptual model of FBC hydration presented earlier in this chapter. The amounts of mineral growth are consistent with the moderate cementation observed in the test cell.
bo Colorado Mineralogy
“ - 0 10 20 30 40 9 Months Since Consbudion
o * n Gypsum Anhydrite Calcite EtbingHe
Figure 79. Mineralogy of Core Samples Collected from the Colorado Test Cell
Values shown represent averages for all samples collected during each time interval. Ettringite and gypsum progressively increase in abundance as the ash hydrates. Anhydrite and calcite are consumed
Leachability Test Results-Mineralogical changes in the FBC ash have contributed to changes in the leach- able concentrations of major and trace analytes in the ash. Calcium and sulfate concentrations drop from approximately 1100 and 1300 mg/L, respectively, in the initial ash leachate to 500 and 800 mg/L in the leachate from samples collected after three years exposure. The leachability of the trace element barium also drops sharply in between the initial ash and the weathered samples collected from the test cell, as shown in Figure 80. Molybdenum and zinc show a similar distribution. Other trace ele- ments exhibit different patterns of mobilization or fixation. Lead, arsenic, chromium, and silver have similar leachability in both the initial ash and the weathered samples, while selenium and vanadium concentrations are higher in leachate from weathered samples than in leachate of the fresh ash. Even elements such as selenium and vanadium, which are mobilized relative to the initial ash, have soluble concentrations well below regulatory limits.
9.2.2 Ohio Site Results
Results from engineering and physical properties tests of the LIMB ash during con- struction operations and from environmental performance testing are presented below. Results from both test cells are presented together except in some instances where the data are very similar and only one set of results is shown for clarity. The North Cell, which was constructed first, contains LIMB ash wetted only to control dusting. The South Cell contains LIMB ash wetted to optimum mois- ture for compaction and placed with a target density of 95% of the maximum dry density.
Engineering Results
The engineering properties of the LIMB material in the landfill test cells are controlled by the initial by-product
Advanced Coal Technology By-product 224 Disposal Management and Design Manual

Results and Conclusions from Case Studies
Arsenic Dectection limit = 0.005 mgA
0.05
s 0.04
6 0.03 - E 2
- E
= 0.02 -
0 I I I I I 1
0 6 12 18 24 30 36 Months Since Construction
Chromium Dectection limit = 0.01 m g h
0.05 I s 0.04 -
E
0 6 12 18 24 30 36 Months Since Construction
Selenium Dectection limit = 0.005 mgA
40.025 - E i 0.02:
G '0.015 1 0.01 -
60.005 ?- 0 I I I I I I
0 6 12 , 18 24 30 36 Months Since Construction
Barium Decteaion limit = 0.01 mgA
0.12 c
0' I I I I I 1
0 6 12 18 24 30 36 Months Since Construction
Lead Dectection limit = 0.003 mg/L
0.02 [
3 0.015 i 0 3 0.01
s L
5 0.005
Months Since Construction
Silver Dectection limit = 0.01 m&
E
0 , 0 6 12 18 24 30 36
Montfis Since Construction
Figure 80. Concentration Trends for the RCRA Trace Metals in Deionized Water Leachates of Colorado Ash Cores
The leachable concentration of each element in the fresh ash is also shown for reference (dashed line). Core leachate data represents an average for all samples for each time interval. Values below the analytical detection limit were considered equal to the detection limit. Other trace metals follow similar distributions; molybdenum and zinc (not shown) behave in the same fashion as barium, while the vanadium distribution (not shown) is similar to selenium.
225 Advanced Coal Technology By-product Disposal Management and Design Manual
. . --I
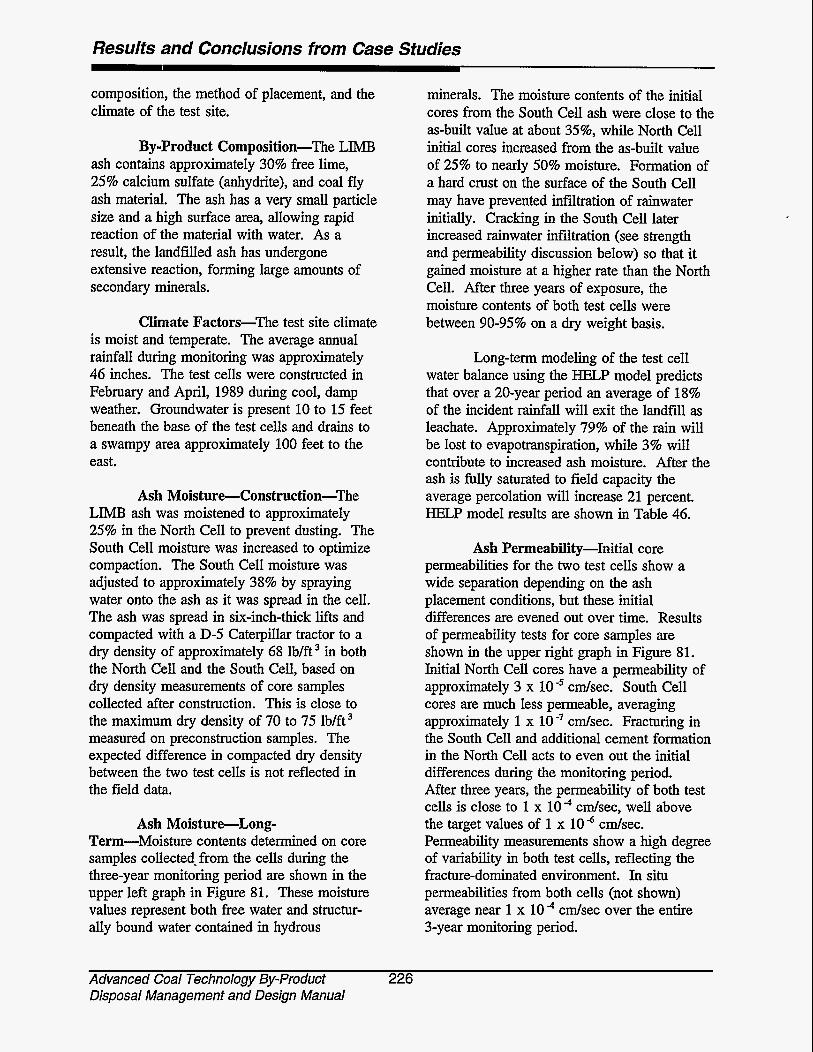
Results and Conclusions from Case Studies
composition, the method of placement, and the climate of the test site.
By-product Composition-The LIMB ash contains approximately 30% free lime, 25% calcium sulfate (anhydrite), and coal fly ash material. The ash has a very small particle size and a high surface area, allowing rapid reaction of the material with water. As a result, the landfilled ash has undergone extensive reaction, forming large amounts of secondary minerals.
Climate Factors-The test site climate is moist and temperate. The average annual rainfall during monitoring was approximately 46 inches. The test cells were constructed in February and April, 1989 during cool, damp weather. Groundwater is present 10 to 15 feet beneath the base of the test cells and drains to a swampy area approximately 100 feet to the east.
Ash Moisture-Construction-The LIMB ash was moistened to approximately 25% in the North Cell to prevent dusting. The South Cell moisture was increased to optimize compaction. The South Cell moisture was adjusted to approximately 38% by spraying water onto the ash as it was spread in the cell. The ash was spread in six-inch-thick lifts and compacted with a D-5 Caterpillar tractor to a dry density of approximately 68 lb/ft in both the North Cell and the South Cell, based on dry density measurements of core samples collected after construction. This is close to the maximum dry density of 70 to 75 Ib/€t3 measured on preconstruction samples. The expected difference in compacted dry density between the two test cells is not reflected in the field data.
Ash Moisture-Long- Term-Moisture contents determined on core samples collected. from the cells during the three-year monitoring period are shown in the upper left graph in Figure 81. These moisture values represent both free water and structur- ally bound water contained in hydrous
minerals. The moisture contents of the initial cores from the South Cell ash were close to the as-built value at about 35%, while North Cell initial cores increased from the as-built value of 25% to nearly 50% moisture. Formation of a hard crust on the surface of the South Cell may have prevented infiitration of rainwater initially. Cracking in the South Cell later increased rainwater infiltration (see strength and permeability discussion below) so that it gained moisture at a higher rate than the North Cell. After three years of exposure, the moisture contents of both test cells were between 90-95% on a dry weight basis.
Long-term modeling of the test cell water balance using the HELP model predicts that over a 20-year period an average of 18% of the incident rainfall will exit the landfill as leachate. Approximately 79% of the rain will be lost to evapotranspiration, while 3% will contribute to increased ash moisture. After the ash is fully saturated to field capacity the average percolation will increase 21 percent. HELP model results are shown in Table 46.
Ash Permeability-Initial core permeabilities for the two test cells show a wide separation depending on the ash placement conditions, but these initial differences are evened out over time. Results of permeability tests for core samples are shown in the upper right graph in Figure 81. Initial North Cell cores have a permeability of approximateIy 3 x IO” cdsec. south Cell cores are much less permeable, averaging approximately 1 x 10 -7 cdsec. Fracturing in the South Cell and additional cement formation in the North Cell acts to even out the initial differences during the monitoring period. After three years, the permeability of both test cells is close to 1 x lo4 cdsec, well above the target values of 1 x lod cm/sec. Permeability measurements show a high degree of variability in both test cells, reflecting the fracture-dominated environment. In situ permeabilities from both cells (not shown) average near 1 x 10 c d s e c over the entire 3-year monitoring period.
Advanced Coal Technology By-product 226 Disposal Management and Design Manual
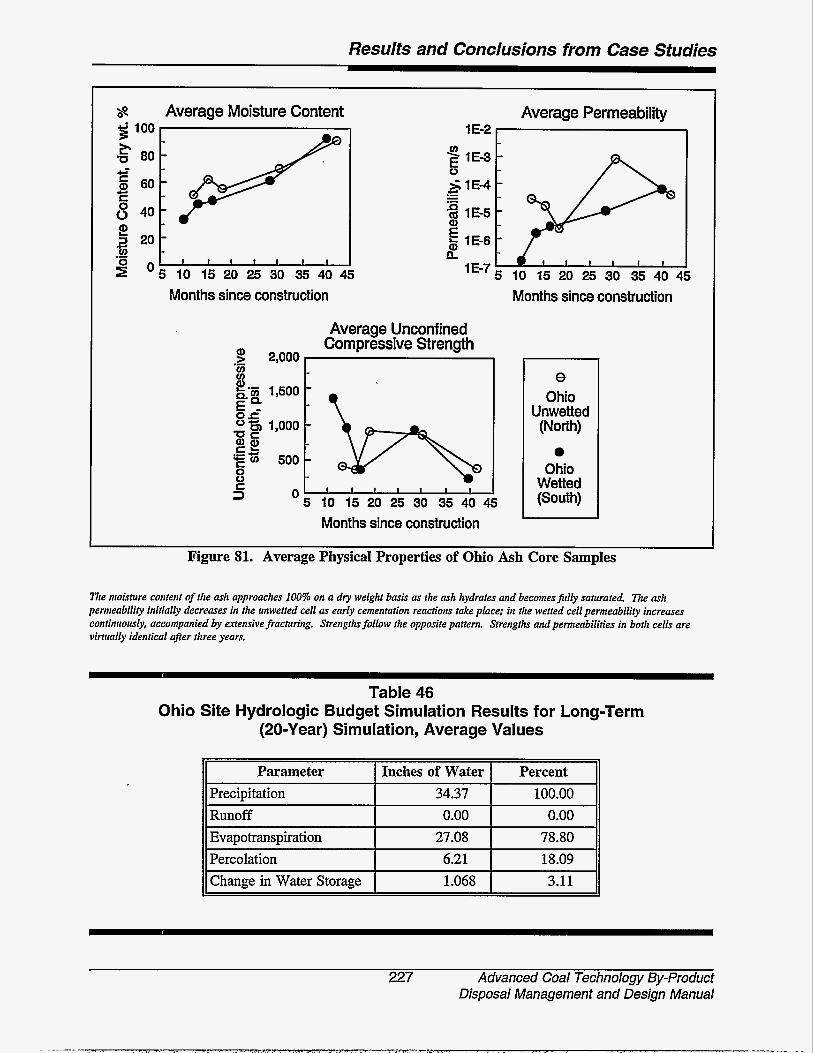
Results and Conclusions from Case Sfudies
Parameter Precipitation
8 Average Moisture Content
Inches of Water Percent 34.37 100.00
.- 2 o s 10 15 20 25 30 35 40 4
Months since construction
Runoff Evapotranspiration
2,000
1,500
1,000
500
0
0.00 0.00 27.08 78.80
Average Permeability 1E-2 I
Percolation Change in Water Storage
10 15 20 25 30 35 40 45 Months since construction
6.21 18.09 1.068 3.11
Average Unconfined Compressive Strength
5 10 15 20 25 30 35 40 45 Months since construction
e Ohio
Unwetted (North)
0 Ohio
Welted (SoUw
Figure 81. Average Physical Properties of Ohio Ash Core Samples
The moisture conient of the ash approaches 100% on a dry weight basis as the ash hydrates and becomes fully saturated The ash permeability initially decreases in the unweited cell as early cementaiion reactions take place; in ihe wetted cell permeability increases coniinuously, accompanied by extensive fracturing. Strengths follow the opposite pattern. Strengihs and permeabilities in both cells are virtually identical afler three years.
Table 46 Ohio Site Hydrologic Budget Simulation Results for Long-Term
(20-Year) Simulation, Average Values
227 Advanced Coal Technology By-product Disposal Management and Design Manual
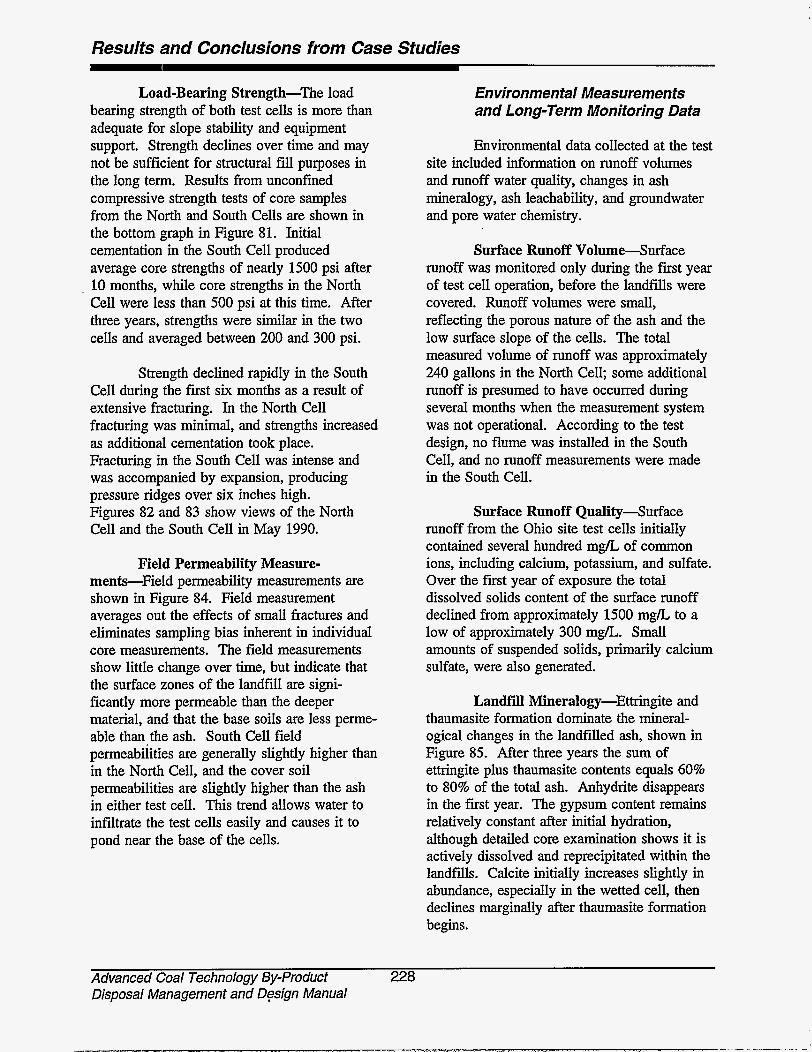
Resulfs and Conclusions from Case Sfudies
Load-Bearing Strength-The load bearing strength of both test cells is more than adequate for slope stability and equipment support. Strength declines over time and may not be sufficient for structural fill purposes in the long term. Results from unconfined compressive strength tests of core samples from the North and South Cells are shown in the bottom graph in Figure 81. Initial cementation in the South Cell produced average core strengths of nearly 1500 psi after
, 10 months, while core strengths in the North Cell were less than 500 psi at this time. After three years, strengths were similar in the two cells and averaged between 200 and 300 psi.
Strength declined rapidly in the South Cell during the first six months as a result of extensive fracturing. In the North Cell fracturing was minimal, and strengths increased as additional cementation took place. Fracturing in the South Cell was intense and was accompanied by expansion, producing pressure ridges over six inches high. Figures 82 and 83 show views of the North Cell and the South Cell in May 1990.
Field Permeability Measure- ments-Field permeability measurements are shown in Figure 84. Field measurement averages out the effects of small fractures and eliminates sampling bias inherent in individual core measurements. The field measurements show little change over time, but indicate that the surface zones of the landfill are signi- ficantly more permeable than the deeper material, and that the base soils are less perme- able than the ash. South Cell field permeabihies are generally slightly higher than in the North Cell, and the cover soil permeabilities are slightly higher than the ash in either test cell. This trend allows water to infiltrate the test cells easily and causes it to pond near the base of the cells.
Environmental Measurements and Long-Term Monitoring Data
Environmental data collected at the test site included information on runoff volumes and runoff water quality, changes in ash mineralogy, ash leachability, and groundwater and pore water chemistry.
Surface Runoff Volume43urface runoff was monitored only during the first year of test cell operation, before the landfills were covered. Runoff volumes were small, reflecting the porous nature of the ash and the low surface slope of the cells. The total measured volume of runoff was approximately 240 gallons in the North Cell; some additional runoff is presumed to have occurred during several months when the measurement system was not operational. According to the test design, no flume was installed in the South Cell, and no runoff measurements were made in the South Cell.
Surface Runoff Quality-Surface runoff from the Ohio site test cells initially contained several hundred mg/L of common ions, including calcium, potassium, and sulfate. Over the first year of exposure the total dissolved solids content of the surface runoff declined from approximately 1500 mg/L to a low of approximately 300 mg/L. Small amounts of suspended solids, primarily calcium sulfate, were also generated.
Landfill Mineralogy-Ettringite and thaumasite formation dominate the mineral- ogical changes in the landfilled ash, shown in Figure 85. After three years the sum of ettringite plus thaumasite contents equals 60% to 80% of the total ash. Anhydrite disappears in the first year. The gypsum content remains relatively constant after initial hydration, although detailed core examination shows it is actively dissolved and reprecipitated within the landfills. Calcite initially increases slightly in abundance, especially in the wetted cell, then declines marginally after thaumasite formation begins.
Advanced Coal Technology By-Product 228 Disposal Management and Design Manual
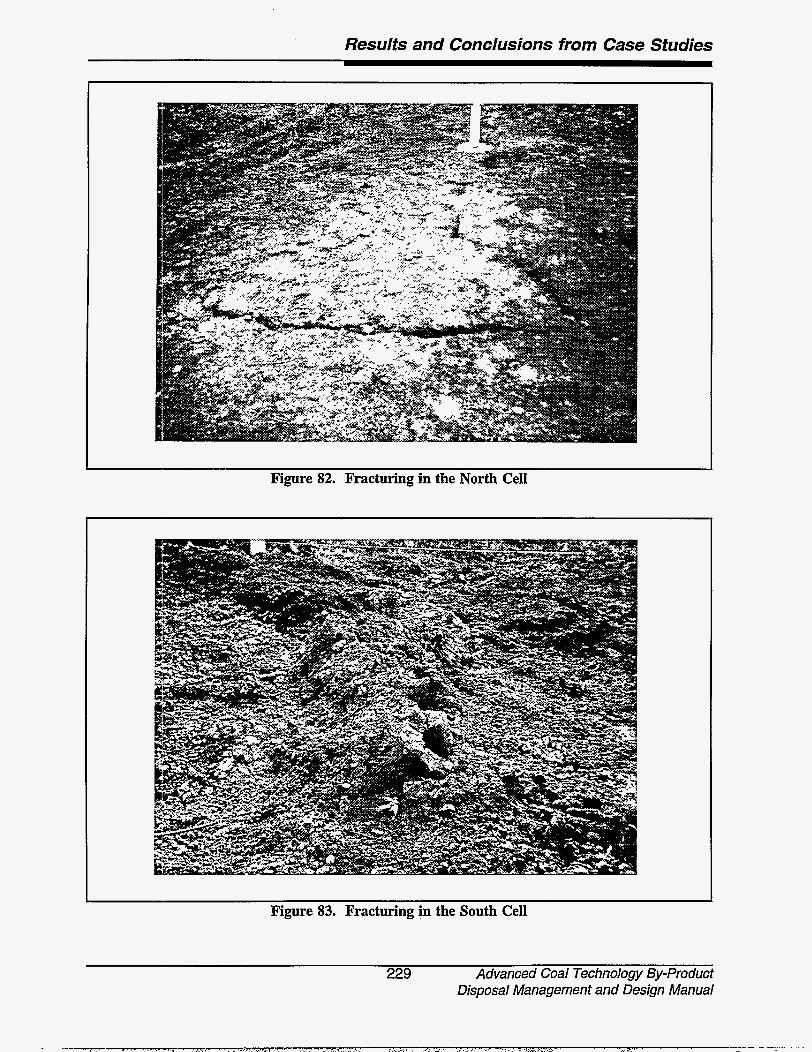
Results and Conclusions from Case Studies
Figure 82. Fracturing in the North Cell
I Figure 83. Fracturing in the South Cell
229 Advanced Coal Technology By-product Disposal Management and Design Manual
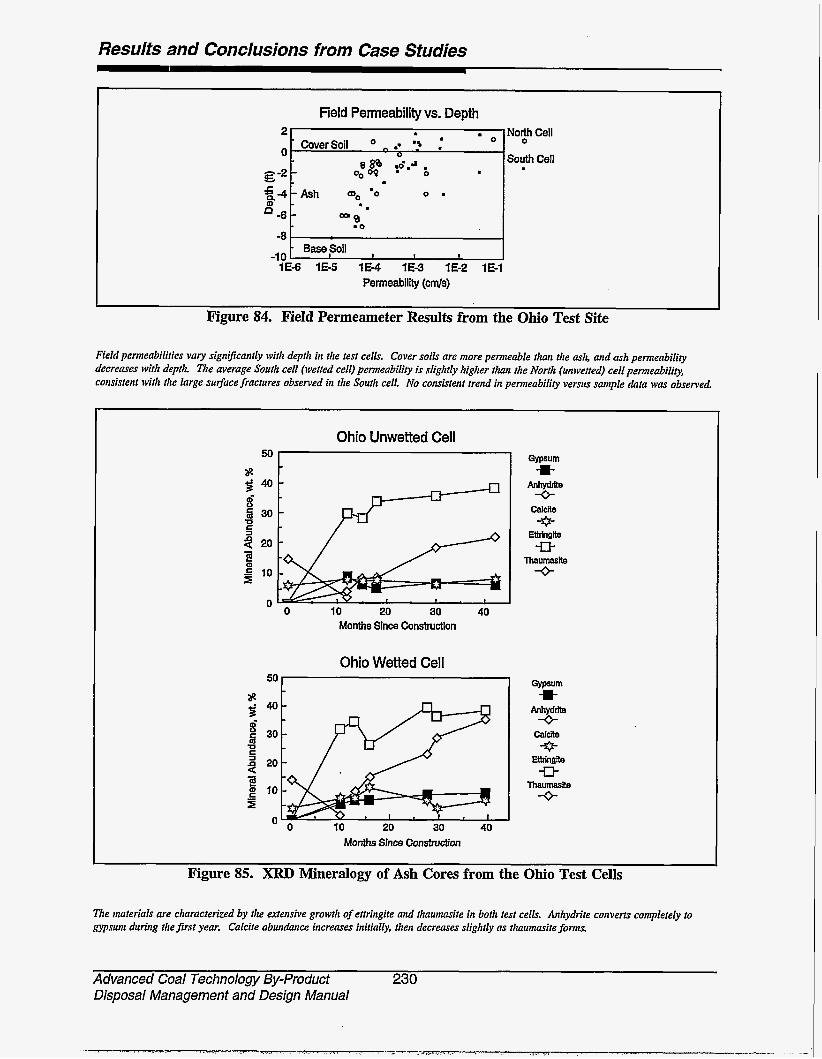
Results and Conclusions from Case Studies
Field Permeability vs. Depth
0 .
Base Soil -1 0 I I I
IE-6 1E-5 1E-4 1E3 IE-2 lE-'
south cell
Permeability (cmls)
Figure 84. Field Permeameter Results from the Ohio Test Site
Field permeabilities vary significantly with depth in the test cells. Cover soils are more permeable than the ash, and ash permeability decreases with depth. The average South cell (wetted cell) permeability is slightly higher than the North (univetted) cell permeability, consistent with the large sulface fractures observed in the South cell. No consistent trend in permeability versus sample data was observed
Ohio Unwetted Cell
$ 4 0 ei s 30 U I= z 20 z .E 10 I
O O 10 20 30 40 Months Slnce Constructlon
Ohio Wetted Cell 50 I Gypsum a-
Th Calcite
Months Since Construction
Figure 85. XRD Mineralogy of Ash Cores from the Ohio Test Cells
The materials are characterized by the extensive growth of ettringite and thaumasite in both test cells. Anhydrite converts completely to gypsum during the first year. Calcite abundance increases initially, then decreases slightly as thaumasite forms.
Advanced Coal Technology By-product 230 Disposal Management and Design Manual
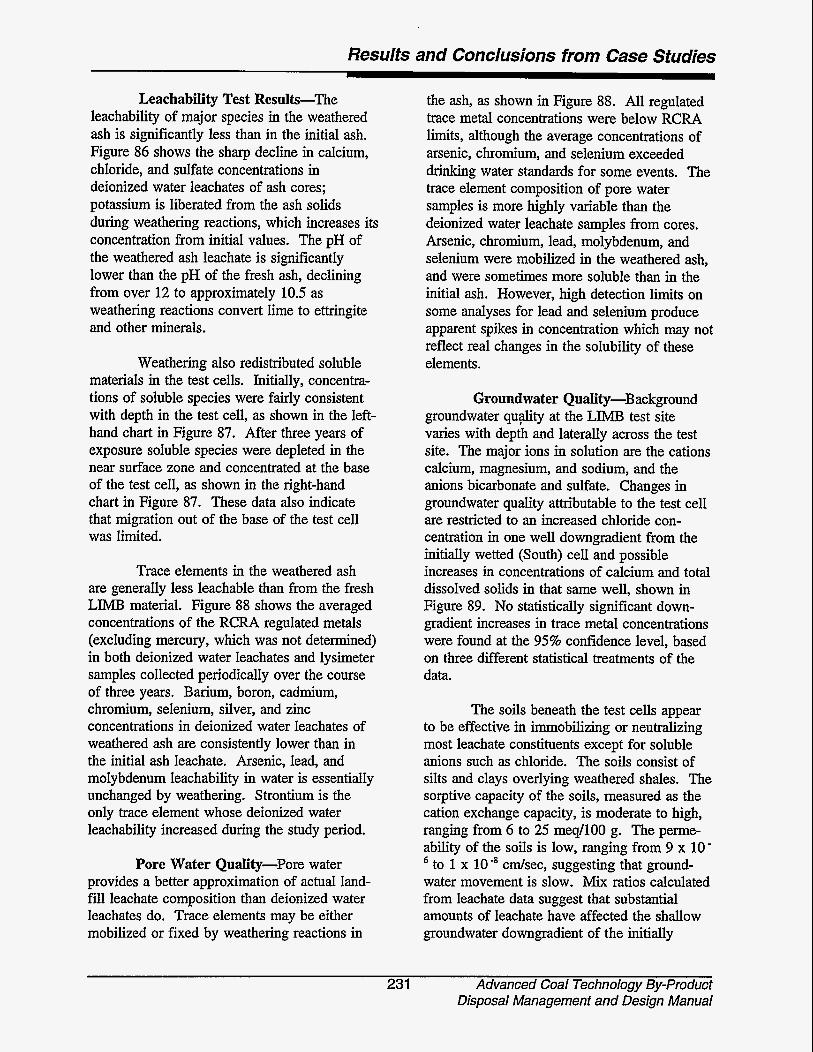
Results and Conclusions from Case Studies
Leachability Test Results-The leachability of major species in the weathered ash is significantly less than in the initial ash. Figure 86 shows the sharp decline in calcium, chloride, and sulfate concentrations in deionized water leachates of ash cores; potassium is liberated from the ash solids during weathering reactions, which increases its concentration from initial values. The pH of the weathered ash leachate is significantly lower than the pH of the fresh ash, declining from over 12 to approximately 10.5 as weathering reactions convert lime to ettringite and other minerals.
Weathering also redistributed soluble materials in the test cells. Initially, concentra- tions of soluble species were fairly consistent with depth in the test cell, as shown in the left- hand chart in Figure 87. After three years of exposure soluble species were depleted in the near surface zone and concentrated at the base of the test cell, as shown in the right-hand chart in Figure 87. These data also indicate that migration out of the base of the test cell was limited.
Trace elements in the weathered ash are generally less leachable than from the fresh LIMB material. Figure 88 shows the averaged concentrations of the RCRA regulated metals (excluding mercury, which was not determined) in both deionized water leachates and lysimeter samples collected periodically over the course of three years. Barium, boron, cadmium, chromium, selenium, silver, and zinc concentrations in deionized water leachates of weathered ash are consistently lower than in the initial ash leachate. Arsenic, lead, and molybdenum leachability in water is essentially unchanged by weathering. Strontium is the only trace element whose deionized water leachability increased during the study period.
Pore Water Quality-Pore water provides a better approximation of actual land- fiil leachate composition than deionized water leachates do. Trace elements may be either mobilized or fixed by weathering reactions in
the ash, as shown in Figure 88. All regulated trace metal concentrations were below RCRA limits, although the average concentrations of arsenic, chromium, and selenium exceeded drinking water standards for some events. The trace element composition of pore water samples is more highly variable than the deionized water leachate samples from cores. Arsenic, chromium, lead, molybdenum, and selenium were mobilized in the weathered ash, and were sometimes more soluble than in the initial ash. However, high detection limits on some analyses for lead and selenium produce apparent spikes in concentration which may not reflect real changes in the solubility of these elements.
Groundwater Quality-Background groundwater qu@y at the LIMB test site varies with depth and laterally across the test site. The major ions in solution are the cations calcium, magnesium, and sodium, and the anions bicarbonate and sulfate. Changes in groundwater quality attributable to the test cell are restricted to an increased chloride con- centration in one well downgradient from the initially wetted (South) cell and possible increases in concentrations of calcium and total dissolved solids in that same well, shown in Figure 89. No statistically significant down- gradient increases in trace metal concentrations were found at the 95% confidence level, based on three different statistical treatments of the data.
The soils beneath the test cells appear to be effective in immobilizing or neutralizing most leachate constituents except for soluble anions such as chloride. The soils consist of silts and clays overlying weathered shales. The sorptive capacity of the soils, measured as the cation exchange capacity, is moderate to high, ranging from 6 to 25 meq/lOO g. The perme- ability of the soils is low, ranging from 9 x 10 -
to 1 x lo-' cdsec, suggesting that ground- water movement is slow. Mix ratios calculated from leachate data suggest that substantial amounts of leachate have affected the shallow groundwater downgradient of the initially
231 Advanced Coal Technology By-product Disposal Management and Design Manual

Resulis and Conclusions from Case Studies
Calcium Chloride Potasium Sulfale
0 Initial Ash E 12monlhs 0 30months 8 months H 18 months 0 42 months
I Figure 86. Average Concentrations of Selected Analytes in ASTM Deionized Water Leachates o
the Initial Ash Composite and Core Samples from the Ohio North Cell
Leachable concentrations of calcium, chloride, and sulfate in cores are lower than in thefresh ash, reflecting mineralogical changes in the material. Potassium is freed by alkaline attack on f ly ash glass, and collects in solution. South cell trends are similar.
N Cell Aug - Dec 1990
12 - .- 0 5,000 10,000 15,000
Concentration, mgL
N Cell Jan - Aug 1992
0 5,000 10,000 If Concentration, mgR
I00
Figure 87. Chemistry of Pore Waters from the North Cell
Where more than one sample was available from a given depth for the time period shown the results were averaged, although in some cases the values shown represent a single analysis. The major soluble species were present in equal concentrations over the vertical profile of the test cell after the first year (left graph). Weathering resulted in movement of soluble species to the base of the test cell after three years (right graph).
Advanced Coal Technology By-product 232 Disposal Management and Design Manual
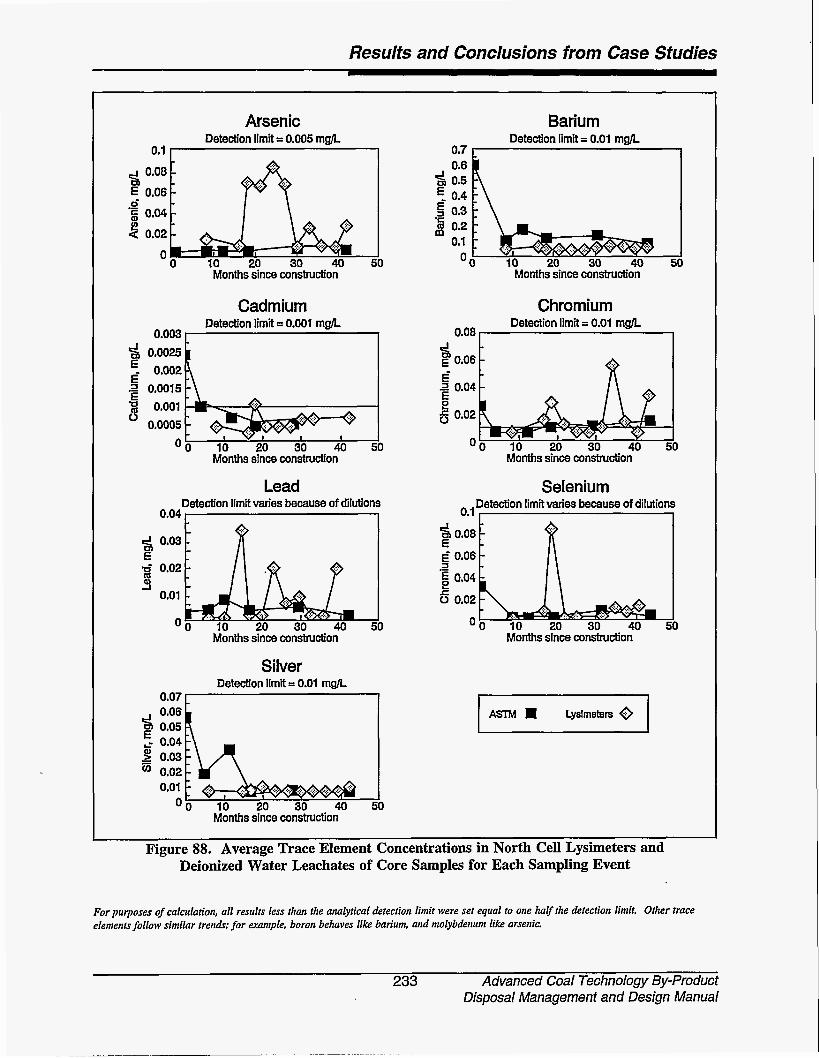
Resulfs and Conclusions from Case Sfudies
Arsenic Detection limit = 0.005 mgR.
$ 0.08
2 0.02
E 0.06 0' - 5 0.04
'0 10 20 30 40 50
Cadmium Detection limit = 0.001 mgh
0.003 + 0,0025 E 0.002
B Omool
i 0,0015
0.0005
'0 10 20 30 40 50 Months since construction
Lead Detection limit m - e s because of dilutions
0.04 I I
g 0.03
3- 0.02 E
0.01 3
'0 10 20 30 40 50 Months since construction
Silver Detection limit = 0.01 msR
U.Ul L
Barium Detection limit = 0.01 mgh
0.6 Om' I '$j 0.5 E 0.4
0.3 z 0.2 rn
0.1
-
'0 10 20 30 40 50 Months since construction
Chromium Detection limit = 0.01 mgh
-I 0 . 0 8 L 2 0.06 i 2 0.04 E E 6 0.02
'0 10 20 30 40 f Months since construction
Selenium - Detection l imi tmks because of dilutions
2 0.08 1 6 0.02
'0 10 20 30 40 50 Months since construction
t
2 0.03
'0 10 20 30 40 Months since construction
Figure 88. Average Trace Element Concentrations in North Cell Lysimeters and Deionized Water Leachates of Core Samples for Each Sampling Event
For purposes of calculation, all results less than the analytical detection limit were set equal to one half the detection limit. Other trace elements follow similar trenrls; for example, boron behaves like barium, and molybdenum like arsenic.
233 Advanced Coal Technology By-product Disposal Management and Design Manual
____ ~~ ~~~

Results and Conclusions from Case Studies
4 160
E140 g120
.$I00 g 80
E40 3 60 20
Calcium
....... - ............... I
A - - r" / - : -=-
I 1 I I
0 10 20 30 40 Months Since Construction
S5" E400 2300: z 0 2 0 0
" 1 0 0 1 r
0
Sodium 250
\
: I
.................. /
/ - 0
m u.
sa :.;./ \A(yy =I -0
v)
.- 0 100 ................. *e
50 3 0 10 20 30 40
Months Since Conmction
Chloride 600 I
Alkalinity
Total Dissolved Solids
0 10 20 30 40 Months Since Construction
Sulfate
, . - 0 . . ..... .\ ..-
I 6; E 700 B m $00 W400
300 I I I I
0 IO 20 30 40 Months Since Construction
c- A I ' \
DG north
DG south
Upgradient
.... -- -
Figure 89. Groundwater Quality at the Ohio Site
The seven species shown in the graphs were identified as having significant statistical diperences in upgradient and downgradient concentrations. Only the increase in chloride concentration is clearly linked to leachate from the South cell.
Advanced Coal Technology By-product 234 Disposal Management and Design Manual
Results and Conclusions from Case Studies
wetted cell, and may account for as much as 50% of the water sampled from that location. The water table elevation and groundwater flow direction varied over the course of the study in response to rainwater recharge of the shallow aquifer and seasonal effects. Changing groundwater flow and leachate composition prevented average mix ratios and relative retardation factors for other solutes from being calculated.
9.2.3 Illinois Site Results
Illinois Cell 1 was constructed from bubbling fluidized bed combustion (BFBC) ash wetted and compacted in place. Cells 2 and 3 were constructed approximately 2 years later from a mixture of BFBC ash and pulverized coal fly ash (PFA) in a 1:l ratio. In Cell 2 this mixture, which was soil-like, was compacted in place at optimum moisture, while in Cell 3 the
' mixture was placed as a flowable mix. (Construction procedures for Cells 2 and 3, referred to as the South and North Cells respectively, are presented in Section 6.4.) Results from engineering and physical properties tests of the BFBC ash and BFBC/- PFA mixes during construction operations and from subsequent environmental performance testing are presented below. Results from all three test cells are presented where available; in most instances only Cell 1 results are complete enough for presentation.
Engineering Results
The engineering properties of the BFBC and BFBC/fly ash materials in the landfill test cells are controlled by the initial by-product composition, the method of place- ment, and the climate of the test site.
By-product Composition-The BFBC ash contains approximately 26% free lime, 48% calcium sulfate, and coal fly ash material. The free lime and sulfate content of this ash are at the high end of the expected range of compositions for BFBC ash. The ash has a rapid reaction with water, producing a high
heat of hydration. The fly ash used in Cells 2 and 3 is a class F ash from the combustion of Illinois #5 coal.
Climate Factors-The test site climate is moist and temperate. The average annual rainfall during monitoring was 42.6 inches. Groundwater surfaces during some portions of the year in a wetland area and drainage ditch south and west from the downgradient end of the test cells. Test cell 1 was constructed over the fall and spring of 1990-1991 during cool, damp weather. Cells 2 and 3 were constructed during May, 1993.
Ash Moisture-Construction-To aid compaction, the BFBC ash was moistened to approximately 26.5% in Cell 1 by spraying water onto the ash as it was spread in the cell. The ash was spread in six-inch-thick lifts and compacted with a D-5 Caterpillar tractor to a target dry density of approximately 80 lb/ft3. Materials for Cell 2 were mixed in an auger mixer and blended with 30% water (total moisture content) to provide a free moisture content (as placed) ranging from 19% to 25%, compared with the optimum moisture content of 19.7% determined in pre-construction tests and 22.6% determined by Proctor tests per- formed on as-placed material. The measured in-place dry density ranged between 90.2 and 104.2 lb/ft3, compared to a maximum dry density of 90.7 lb/ft3 measured on field- molded samples. Cell 2 core samples had a dry density between 83 and 93 lb/ft after oven drying at 100°C. Cell 3 materials were mixed in the same fashion as Cell 2, but using 42% added water to allow the mixture to be placed as a grout. Dry densities of Cell 3 core samples ranged from 57 to 70.6 lb/ft after oven drying at 100°C.
Ash Moisture-Long- Term-Moisture contents determined on core samples collected from Cell 1 during initial two years of the monitoring period are shown in the upper left graph in Figure 90. These moisture values represent both free water and structurally bound water contained in hydrous
235 Advanced Coal Technology By-product Disposal Management and Design Manual

Results and Conclusions from Case Sfudies
U) 5E-4- 2 2E-4- \
1 E 4
4 2 ~ - 5 Ql lE-5-
5E-6- P. 2E-6-
35E-51 -
8 Average Moisture Content
, n . -..* .-*-------a
1 1 I .- 2.2 5 20; O O 10 20 30 2
Months Since Construction
500
400
300
200
100
0
Average Unconfined Compressive Strength
Months Since Construction
Figure 90. Average Physical Properties of Illinois Cell 1 (FBC ash only) Core Samples
The moisture content increased rapidly as the ash hydrated and saturated. The Permeability has not changed signijicantly, the initial permeability of this test cell is similar to thejinal values at the other sites after three years of weathering. The average strength of the ash has declined steadily from over 300 psi to less than 50 psi.
minerals. Moisture content monitoring for Cells 2 and 3 is still in prel&ary stages and the results are not reported.
Long-term modeling of the test cell water balance using the HELP model is not completed for the Illinois site. Runoff volumes from Cell 1 have been negligible, as at the Ohio and Colorado sites, and infiltration rates comparable to those at the Ohio site are anticipated. Cell 2 runoff volumes are much larger, and infiltration is anticipated to be reduced correspondingly.
Ash Permeabdity-Initial laboratory permeability tests of the materials in the three test cells varied from lo9 c d s e c to lo-'' cdsec depending on the ash mixture and placement conditions. Measurements on core samples collected from the test cells show much higher permeabilities. Results of permeability tests for Cell 1 core samples are shown in the upper right graph in Figure 90. Cell 1 core permeabilities average approxi- mately 2 x 10 -5 cdsec, while initial cores from Cells 2 and 3 average 2.2 x 10 and 8.2 x IO-3 cdsec, respectively.
Advanced Coal Technology By-product 236 Disposal Management and Design Manual

Results and Conclusions from Case Studies
Load-Bearing Strength-The load- bearing strengths of all three test cells are more than adequate for slope stability and equipment support, but tend to decrease over time and may not be sufficient for structural fiil purposes in the long term. Results from unconfined compressive strength tests of core samples from Cell 1 are shown in the bottom graph in Figure 90. Initial cementation produced average core strengths of approxi- mately 350 psi after 4 months. After 10 months, average strengths declined to approxi- mately 200 psi. After two years, strengths averaged under 50 psi.
1
Results from strength tests of core samples from Cells 2 and 3 are available only for the first year of monitoring. Early strengths (4 months) average nearly 1900 psi in Cell 2 and approximately 400 psi in Cell 3. These results compare with strengths obtained from field-molded laboratory-cured (for 4 months) specimens of the ash mixtures prepared at optimum moisture (soil-like mix) and as a slurry at 9% above optimum moisture (flowable mix). For the soil mix, a strength of approximately 1550 was obtained; for the flowable mix, a strength of approximately 1150 was obtained. The Cell 3 mix developed a compressive strength of less than 7 psi 30 minutes after placement (as measured by a pocket penetrometer), but would maintain a vertical cut without slump at that time. After 24 hours the Cell 3 mix had a compressive strength of between 20 to 35 psi.
Environmental Measurements and Long-Term Monitoring Data
Environmental data collected at the test site included information on runoff volumes and quality, changes in ash mineralogy, ash leachability, and groundwater and pore water chemistry.
Surface Runoff Volume-Surface runoff was monitored only during the first year of test cell operation, before the landfills were covered. Runoff volumes in Cell 1 were small, reflecting the porous nature of the ash and the low surface slope of the cell. The Cell 2 runoff volume was much larger since the initial permeability of Cell 2 materials was lower. The total measured volume of runoff was approximately 700 gallons in Cell 1 and 1400 gallons in Cell 2. The flumes in both test cells were washed out during heavy rains shortly after construction. The volume of runoff lost during this incident is unknown. Runoff volumes were not measured in Cell 3.
Surface Runoff Quality-Surface runoff from Illinois Cell 1 was sampled during the first year of monitoring. Surface water samples were dilute calcium sulfate solutions with a pH between 7 and 9. Other species including silicon, magnesium, sodium, chloride, strontium, and barium (in order of decreasing abundance) were detected in small amounts in most samples. Total dissolved solids were less than 1000 mg/L, and total suspended solids were less than 30 mg/L.
No expansion has been noted at any of the Illinois test cells. Laboratory tests (ASTM C-490) for linear expansion on Cell 2 and 3 mixtures found less than 1% expansion under the test conditions.
Field Permeability Measure- ments-Field permeability measurements from Illinois Cell 1 are shown in Figure 91. The results indicate a moderate decrease in perme- ability over time and a general trend of decreasing permeability with depth within the test cell.
Landfill Mineralogy-Ettringite and gypsum formation dominate the mineralogical changes in the landfilled ash, shown in Figure 92. Anhydrite and lime are quickly hydrated to gypsum and portlandite. The abundance of gypsum and portlandite has gradually declined over time while other mineral abundances have remained constant, suggesting portlandite and gypsum dissolution. Ettringite formation is not as extensive as at the Ohio site, and no thaumasite formation was detected during the
237 Advanced Coal Technology By-product Disposal Management and Design Manual
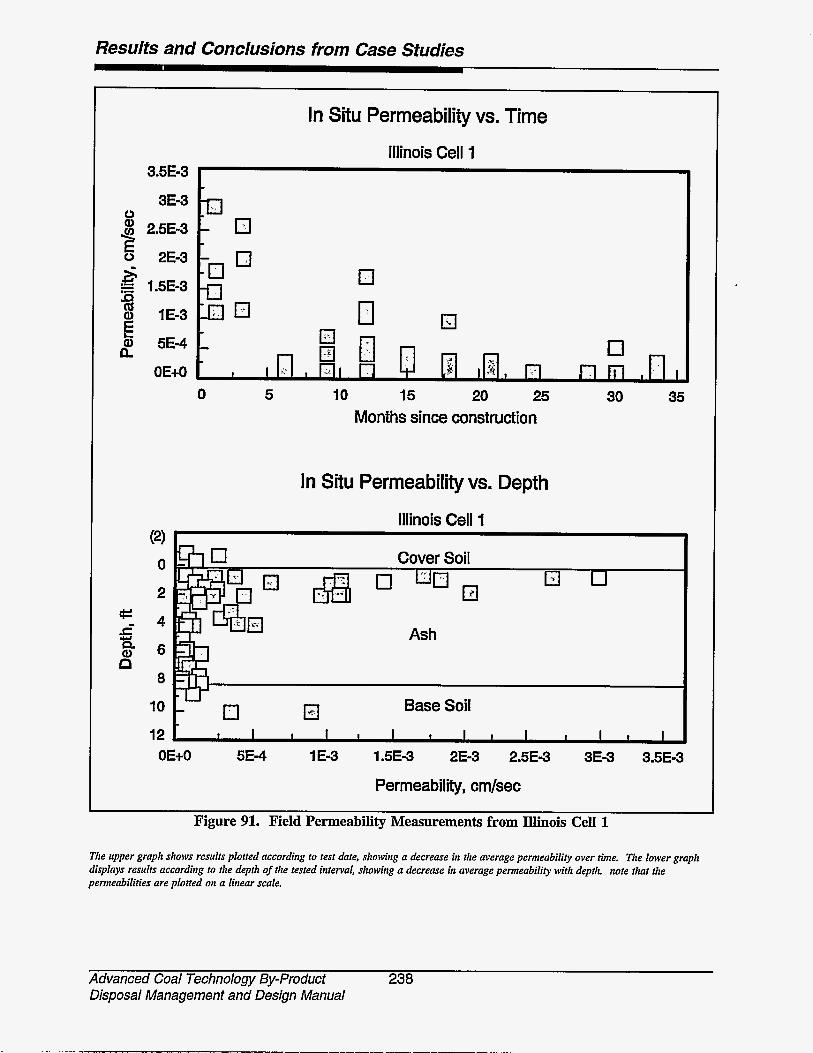
Results and Conclusions from Case Studies
In Situ Permeability vs. Time
3.5E-3
3E-3
$ 2.5E-3
0 2E-3
0
z 1.5E-3
5 8 1E-3 E L
5E-4 2 OEtO
Illinois Cell 1
0 5 10 15 20 25 Months since construction
In Situ Permeability vs. Depth
Illinois Cell 1
30 35
Ash
OE+O 5E-4 1 E-3 1.5E-3 2E-3 2.5E-3 3E-3 3.5E-3
I Permeability, crn/sec I
Figure 91. Field Permeability Measurements from Illinois Cell 1
The upper graph shows results plotted according to test date, showing a decrease in the average permeability over time. The lower graph displays results according to the depth of the tested interval, showing a decrease in average permeability with depth. note that the permeabilities are plotted on a linear scale.
Advanced Coal Technology By-product 238 Disposal Management and Design Manual
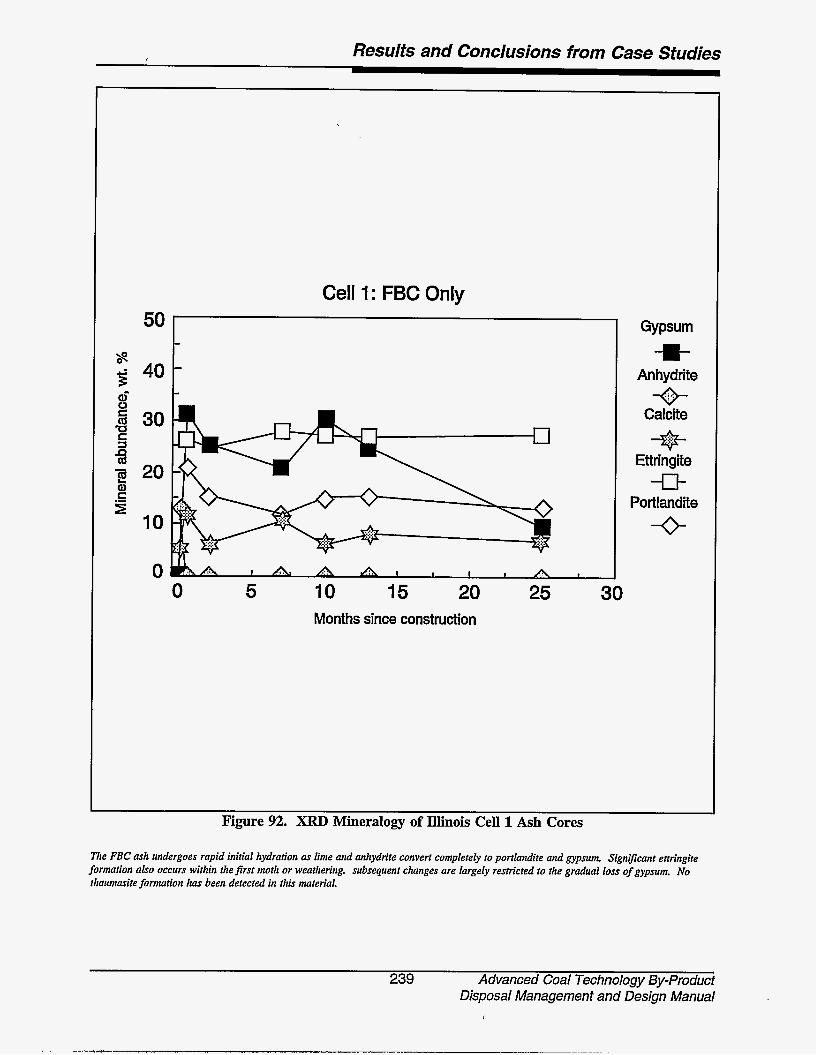
Resulis and Conclusions from Case Studies /
Cell 1: FBC Only
40
30
20
10
0 0 5 10 15 20
Months since construction 25 30
Gypsum
Anhydrite
Calcite
Ettringite
Portlandite
-B- + + U
-0-
Figure 92. XRD Mineralogy of Illinois Cell 1 Ash Cores
The FBC ash undergoes rapid initial hydration as lime and anhydrite convert completely to portlandite and gypsum. Significant enringite formation also occurs within the first moth or weathering. subsequent changes are Iargely restricted to the gradual loss of gypsum. No tliaumasite formation has been detected in this material.
239 Advanced Coal Technology By-product Disposal Management and Design Manual
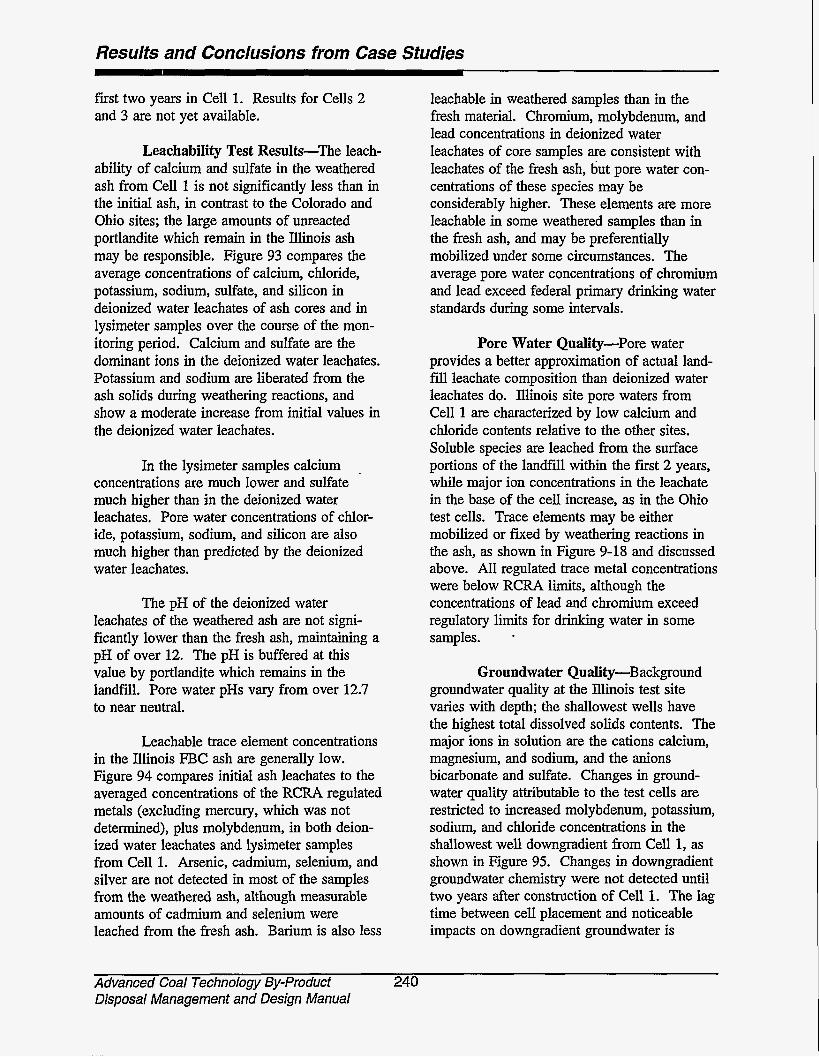
Results and Conclusions from Case Studies
first two years in Cell 1. Results for Cells 2 and 3 are not yet available.
Leachability Test Results-The leach- ability of calcium and sulfate in the weathered ash from Cell 1 is not significantly less than in the initial ash, in contrast to the Colorado and Ohio sites; the large amounts of unreacted portlandite which remain in the Illinois ash may be responsible. Figure 93 compares the average concentrations of calcium, chloride, potassium, sodium, sulfate, and silicon in deionized water leachates of ash cores and in lysimeter samples over the course of the mon- itoring period. Calcium and sulfate are the dominant ions in the deionized water leachates. Potassium and sodium are liberated from the ash solids during weathering reactions, and show a moderate increase from initial values in the deionized water leachates.
In the lysimeter samples calcium concentrations are much lower and sulfate much higher than in the deionized water leachates. Pore water concentrations of chlor- ide, potassium, sodium, and silicon are also much higher than predicted by the deionized water leachates.
The pH of the deionized water leachates of the weathered ash are not signi- ficantly lower than the fresh ash, maintaining a pH of over 12. The pH is buffered at this value by portlandite which remains in the landfill. Pore water pHs vary from over 12.7 to near neutral.
Leachable trace element concentrations in the Illinois FBC ash are generally low. Figure 94 compares initial ash leachates to the averaged concentrations of the RCRA regulated metals (excluding mercury, which was not determined), plus molybdenum, in both deion- ized water leachates and lysimeter samples from Cell 1. Arsenic, cadmium, selenium, and silver are not detected in most of the samples from the weathered ash, although measurable amounts of cadmium and selenium were leached from the fresh ash. Barium is also less
leachable in weathered samples than in the fresh material. Chromium, molybdenum, and lead concentrations in deionized water leachates of core samples are consistent with leachates of the fresh ash, but pore water con- centrations of these species may be considerably higher. These elements are more leachable in some weathered samples than in the fresh ash, and may be preferentially mobilized under some circumstances. The average pore water concentrations of chromium and lead exceed federal primary drinking water standards during some intervals.
Pore Water Quality-Pore water provides a better approximation of actual land- fill leachate composition than deionized water leachates do. Illinois site pore waters from Cell 1 are characterized by low calcium and chloride contents relative to the other sites. Soluble species are leached from the surface portions of the landfill within the first 2 years, while major ion concentrations in the leachate in the base of the cell increase, as in the Ohio test cells. Trace elements may be either mobilized or fixed by weathering reactions in the ash, as shown in Figure 9-18 and discussed above. All regulated trace metal concentrations were below RCRA limits, although the concentrations of lead and chromium exceed regulatory limits for drinking water in some samples. *
Groundwater Quality-Background groundwater quality at the Illinois test site varies with depth; the shallowest wells have the highest total dissolved solids contents. The major ions in solution are the cations calcium, magnesium, and sodium, and the anions bicarbonate and sulfate. Changes in ground- water quality attributable to the test cells are restricted to increased molybdenum, potassium, sodium, and chloride concentrations in the shallowest well downgradient from Cell 1, as shown in Figure 95. Changes in downgradient groundwater chemistry were not detected until two years after construction of Cell 1. The lag time between cell placement and noticeable impacts on downgradient groundwater is
Advanced Coal Technology By-product 240 Disposal Management and Design Manual
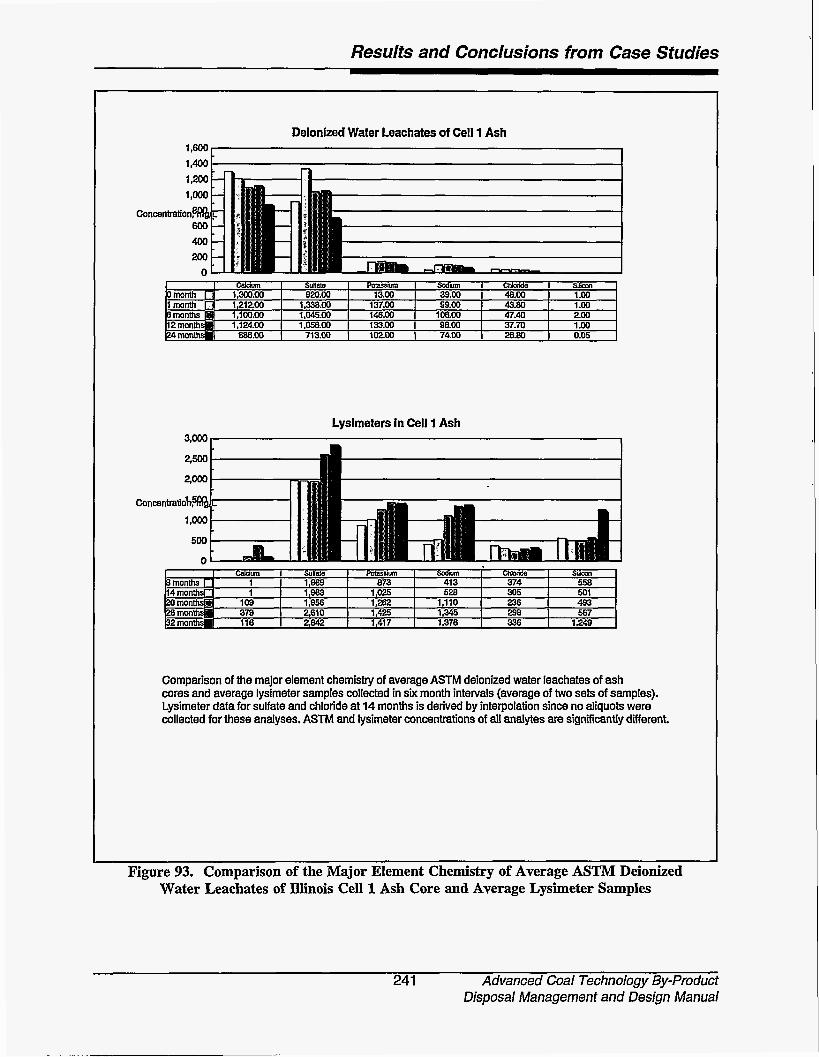
Resulis and Conclusions from Case Studies
Deionized Water Leachates of Cell 1 Ash
.) .-- 1.200 . n
Concentration!
400 200
Lysimeters in Cell 1 Ash
Comparison of the major element chemisby of average ASTM deionized water leachates of a s h cores and average lysimeter samples collected in six month intervals (average of two sets of samples). Lysimeter data for sulfate and chloride at 14 months is derived by interpolation since no aliquots were collected for these analyses. ASTM and lysimeter concentrations of all andytes are significantly different.
Figure 93. Comparison of the Major Element Chemistry of Average ASTM Deionized Water Leachates of Illinois Cell 1 Ash Core and Average Lysimeter Samples
241 Advanced Coal Technology By-product Disposal Management and Design Manual
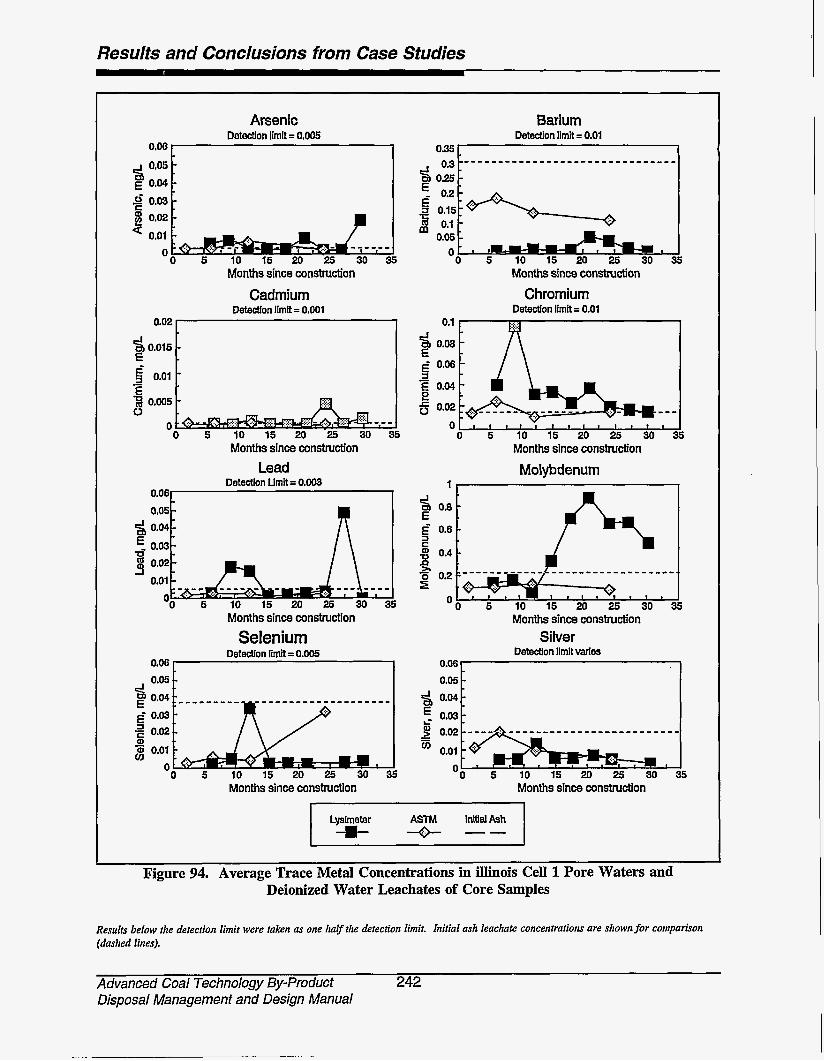
Results and Conclusions from Case Studies
0.06 s 0.05
.g 0.03 E 0.w
- - - -
Months since construction Cadmium
0.02 I 1 Detectlon llmk = 0.001
0.015 1 g 0.01 - E 3 0.005 0
0 0 5 10 1 5 2 0 25 3 0 3 5
Months since construction Lead
Detectlon Umit = 0.003 U.UO
0.05 -
Months since construction Selenium
o.oB Detedion limit = 0.005 , 0.05
Months since consbuction
Barium Detection limit = 0.01
0.35 c d 0.25
5 0.1 .Z 0.15
0.05 m
' 0 5 10 15 20 25 30 I Months since construction
Chromium Detection limit = 0.01
0 1 1 1 1 1 1 1 1 1 1 1 1 1
0 5 10 15 20 25 30 35 Months since construction Molybdenum
i s 0.8 E
0
f i Months since construction
Detectlon limit varies Silver
& :::I E 0.03
Months since construction
Lysimeter _.-
Figure 94. Average Trace Metal Concentrations in illinois Cell 1 Pore Waters and Deionized Water Leachates of Core Samples
Results below the detection limit were taken as one half the detection limit. Initial ash leachate concentrations are shown for comparison (dashed lines).
Advanced Coal Technology By-product 242 Disposal Management and Design Manual
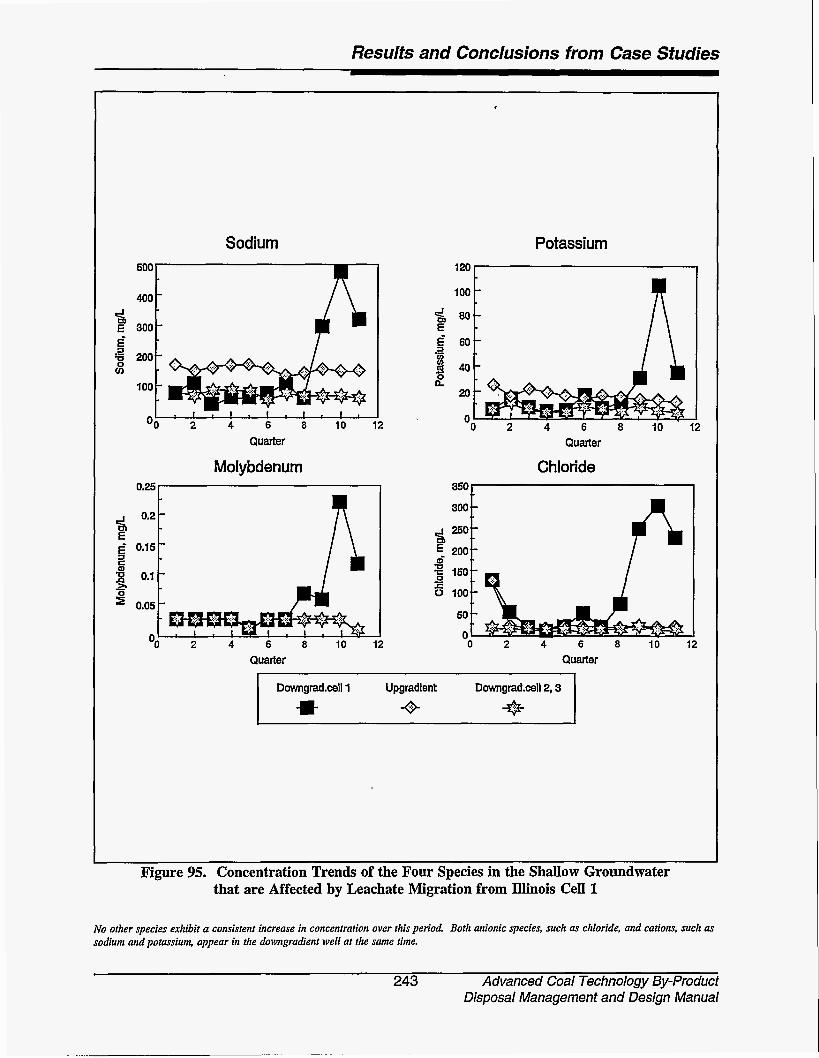
Results and Conclusions from Case Studies
U , W
0.2
E E' 0.15
sh g 0.1 2
0.05
Sodium
sa E 300
- - -
,
Potassium
x -. H n S 4 O
20
n 6 8 10 12
Quarter
Molybdenum
I z 2 4 6 8 10 12
Quarter
2 6 0 1 I \
"0 2 4 6 8 1 0 ' 1 2 Quarter
Chloride 8AJU I I
E 200 6
150 2 0 100
50 n - 0 2 4 6 8 10 12
Quarter
Downgrad.cell1 Upgradlent Downgrad.cell2,3 * Q *
Figure 95. Concentration Trends of the Four Species in the Shallow Groundwater that are Affected by Leachate Migration from Illinois Cell 1
No other species exhibit a consistent increase in concentration over this period. Both anionic species, such as chloride, and cations, such as sodium and potassium, appear in the downgradient well at the same time.
243 Advanced Coal Technology By-product Disposal Management and Design Manual
Results and Conclusions from Case Studies
contributed to by three separate processes. First, the test cell took nearly a year to reach saturation; second, the leachate had to percolate through the unsaturated sediments beneath the test cell; and third, the leachate was dispersed in the groundwater and transported to the well. The results from downgradient groundwater monitoring will be used to estimate site-speci- fic and analyte-specific attenuation factors for use with predictive modeling efforts once three years of monitoring is completed at this site.
9.3 Citations
1. Hopkins T. and T. Beckhar, Kentucky Transportation Center, University of Kentucky. Unpublished report, presented September 1, 1993, University of Kentucky Center for Applied Energy Research, 1st Annual Conference on Ettringite.
2. Georgiou, D.N., R.K. Kissel, and G.G. ROSS, 1990. "Geotechnical Characteristics and Landfilling of CFBC Residue." In: Proceedings of the 1989 International Conference on Fluidized Bed Combustion. American Society of Mechanical Engineers, New York, New York. pp. 849-856. 1991.
3. KolIman, H., G. Strubel, and F. Trost, 1977. "Reaction Mechanisms in the Formation of Expansion Nuclei in Lime-Gypsum Plasters .I' Zement-Kalk- Gips, 30:24-228.
6.
7.
8.
9.
10.
11. 4. P.R. Schroeder, A.C. Gibson, and M.D.
Smolen, The Hydrological Evaluation of Landfiil Performance (HELP1 Model, U.S. Environmental Protection Agency, Office of Solid Waste, Report NO. EPA/DF-85/001bY 1985.
P. Kumarthasan, G.J. McCarthy, D.J. Hassett et al., 1989. "Oxyanion Substituted Ettringites: Synthesis and Characterization and Their Potential Role in Immobilizing As, By Cr, Se, and V." In Proceedings of the 1989 Symposium on Fly Ash and Coal Conversion B y-Products: Characterization, Utilization and Disposal; Materials Research Society Symposium Proceedings, Vol. 178.
Electric Power Research Institute. EPRI CS-5783. "Laboratory Characterization of Advanced SO Control By-products: Furnace Sorbent Injection Wastes." May 1988.
Allison, T.L., 1993. "User Manual Supplement: Using MULTIMED to Evaluate Subtitle D Landfill Designs." USEPA, Office of Solid Waste.
Electric Power Research Institute. EPRI EN-653 1. " M Y G R F Version 2.0: An IBM Code for Simulating Migration of Organic and Inorganic Chemicals in Groundwater (Users Manual)." October, 1989.
Electric Power Research Institute.
Package Volume 1: Overview and Application to a Chemical Transport Problem." 1989.
EPRI EA-5870. "FASTCHEMm
Dryden, R.T., 1993. "PCFB Environmental Performance and Efficiency, The Pyropower Perspective." In Bank, D.L. (ed) "Proc. Coal-Fired Power Systems 93-- Advances in IGCC and PFBC Rev. Mtg.," Morgantown WV, 1 June 28- 30, 1993. DOE #DI93000289.
5. Electric Power Research Institute. EPRI EA-5742-CCM. "The Fossil Fuel Combustion Waste Leaching (FOWLm) Code: Version 1 Users Man~al." EPRI EA-5742-CCM.
Advanced Coal Technology By-product 244 Disposal Management and Design Manual

Results and Conclusions from Case Studies
12.
13.
14.
15.
16.
17,
18.
Dick, W.A., et al., 1993. "Plant Growth and Soil Property Responses to Additions of Dry Flue Gas Desulfurization B y-Products." In proC. 1993 SO, Control Symposium. Boston, MA, August 24-27.
Electric Power Research Institute. EPRI GS-6622. "Laboratory Characterization of Advanced SO Control By-Products: Dry Sodium and Calcium In-Duct Injection Wastes." December, 1989.
Mattigod, S.V., et al., 1990. "Geo- chemical Factors Controlling the Mobilization of Inorganic Constituents from Fossil Fuel Combustion Residues: I. Review of the Major Elements." J- Environ. Qual. 19:188-201.
Warren, C.J., andM.J. Dudas, 1988. "Leaching Behavior of Selected Trace Elements in Chemically Weathered Alkaline Fly Ash." The Science of the Total Environment, 77 (1988) 299-246.
Huyck, K. A., G.S. Tatum, and D.P. DeKraker. "Management of Flue Gas Desulfurization (FGD) By-products with System Additives," 1993. Unpublished report.
Gas Research Institute, 1988. Characterization, Extraction, and Reuse of Coal Gasification Solid Wastes. Volume 1. Gas Research Institute Report: GRI 86/0203.
Electric Power Research Institute. EPRI GS-6439. Long-Term Leaching Tests with Coal Gasification SlaK. 1988.
19.
20.
Weinberg, A., B.J. Coel, and R.D. Butler. "Advanced Coal Technology Waste Disposal: Colorado CFBC Site Assessment Report." Unpublished report prepared for USDOE, Morgan- town Energy Technology Center.
Weinberg, A., R.H. Petrini, and R.D. Butler. "Advanced Coal Technology Waste Disposal: Ohio LIMB Site Assessment Report." Unpublished report prepared for USDOE, Morgantown Energy Technology Center.
245 Advanced Coal Technology By-Product Disposal Management and Design Manual

This Page Intentionally Left Blank
246
APPENDIX A HELP Model-Recharge Estimate
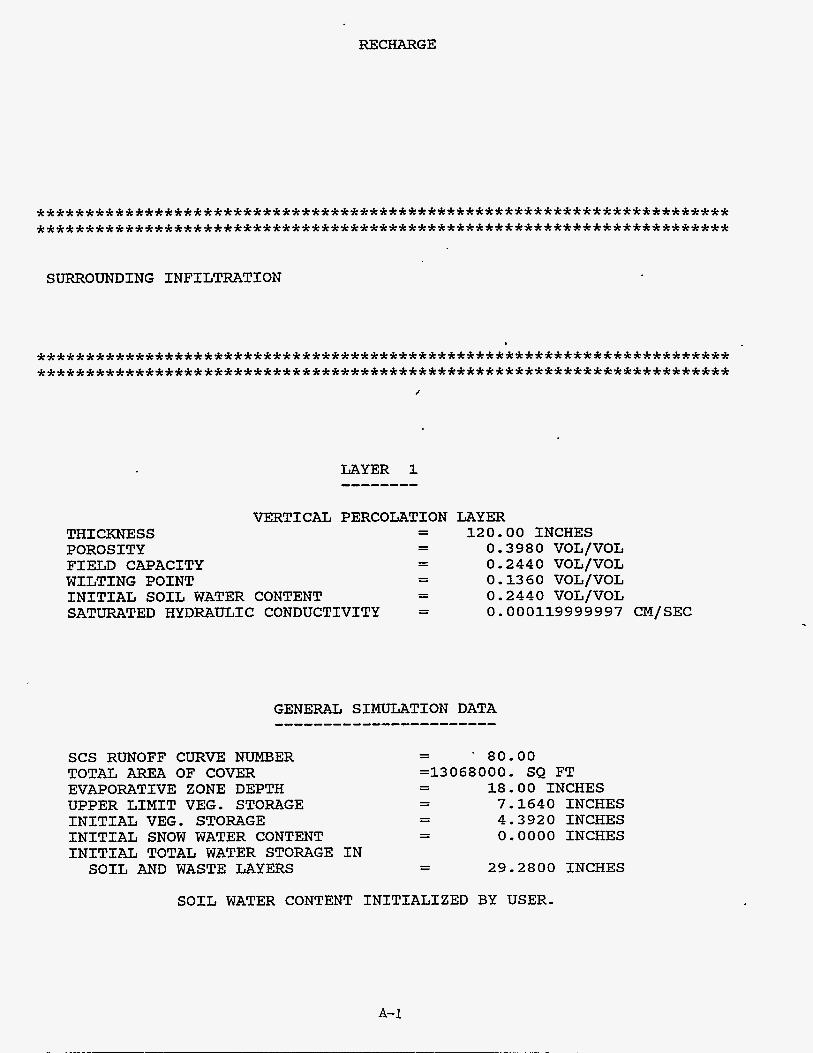
RECHARGE
. . . . . . . . . . . . . . . . . . . . . . . . . . . . . . . . . . . . . . . . . . . . . . . . . . . . . . . . . . . . . . . . . . . . . . . . . . . . . . . . . . . . . . . . . . . . . . . . . . . . . . . . . . . . . . . . . . . . . . . . . . . . . . . . . . . . . . . . . . . . . .
SURROUNDING INFILTRATION
. . . . . . . . . . . . . . . . . . . . . . . . . . . . . . . . . . . . . . . . . . . . . . . . . . . . . . . . . . . . . . . . . . . . . . . . . . . . . . . . . . . . . . . . . . . . . . . . . . . . . . . . . . . . . . . . . . . . . . . . . . . . . . . . . . . . . . . . . . . . . .
LAYER 1 --------
THICKNESS POROSITY FIELD CAPACITY WILTING POINT INITIAL SOIL WATER CONTENT SATURATED HYDRAULIC CONDUCTIVITY
VERTICAL PERCOLATION LAYER 120,OO INCHES - -
- - 0.3980 VOL/VOL - - 0.2440 VOL/VOL - - 0.13 60 VOL/VOL - - 0.2440 VOL/VOL - - 0.000119999997 CM/SEC
GENERAL SIMULATION DATA ....................... SCS RUNOFF CURVE NUMBER TOTAL AREA OF COVER EVAPORATIVE ZONE DEPTH UPPER LIMIT VEG. STORAGE INITIAL VEG. STORAGE INITIAL SNOW WATER CONTENT INITIAL TOTAL WATER STORAGE IN SOIL AND WASTE LAYERS
- - ' 80.00 =13068000. SQ FT
18.00 INCHES - - 7.1640 INCHES 4,3920 INCHES 0,0000 INCHES
- - - - - -
29,2800 INCHES
SOIL WATER CONTENT INITIALIZED BY USER.

RECHARGE
CLIMATOLOGICAL DATA ------------------- SYNTHETIC RAINFALL WITH SYNTHETIC DAILY TEMPERATURES AND SOLAR RADIATION FOR CHICAGO ILLINOIS
MAXIMUM LEAF AREA INDEX = 0.00 START OF GROWING SEASON (=IAN DATE) = 128 END OF GROWING SEASON (JULIAN DATE) = 282
NORMAL MEAN MONTHLY TEMPERATURES, DEGREES FAHRENHEIT
21.40 26.00 36.00 48.80 59 . 10 68.60 73.00 71.90 64.70 53 . 50 39.80 27.70
JAN/JUL FEB/AUG MAR/SEP APR/OCT MAY/NOV JUN/DEC
PRECIPITATION ------------- TOTALS
STD. DEVIATIONS
RUNOFF ------ TOTALS
STD. DEVIATIONS
EVAPOTRANSPIRATION
TOTALS
1.48 4.87
1.11 4.14
0 . 079 0.584
0.177 1.145
0.693 3.405
0.94 4.08
0.49 1.48
0.000 0.173
0.000 0.234
1.247 3.723
2.71 3.42
1.35 1.49
0.008 0.009
0.011 0.013
2.398 2.826
- 4.37 2.66
1.39 1.29
0.012 0,031
0.016 0.047
3.625 2.427
2.49 2.38
0.99 0.25
0,002 0.001
0.005 0.001
3.180 1.109
4.60 2.04
1.67 0.65
0.137 0.005
0.170 0.011
4.116 0.857
A-2

RECHARGE
STD. DEVIATIONS 0.280 0,208 0.289 0.343 1.436 1.294 2.567 0.950 1.292 0.820 0.398 0.326
PERCOLATION FROM LAYER 1 ......................... TOTALS 0.4258 0.3891 0,4906 0.4963 0,4271 0.3357
0.4102 0.4504 0.3682 0.3344 0,3141 0.3951
STD. DEVIATIONS 0.2746 0.2587 0,3296 0,3978 0.2755 0.1866 0,2654 0,3566 0.2773 0.2328 0.1656. 0.1861
. . . . . . . . . . . . . . . . . . . . . . . . . . . . . . . . . . . . . . . . . . . . . . . . . . . . . . . . . . . . . . . . . . . . . . .
. . . . . . . . . . . . . . . . . . . . . . . . . . . . . . . . . . . . . . . . . . . . . . . . . . . . . . . . . . . . . . . . . . . . . . . c
AVERAGE ANNUAL TOTALS h (STD. DEVIATIONS) FOR YEARS 1 THROUGH 5 ....................................................................... (INCHES) (CU.. FT.) PERCENT ---------------- ----------- -------
PRECIPITATION 36.03 ( 6.599) 39234496 . 100 . 00 RUNOFF 1.042 ( 1.228) 1135027 . 2.89
EVAPOTRANSPIRATION 29.607 ( 4.465) 32241940.
PERCOLATION FROM LAYER 1 4.8371 ( 2.7763) 5267646.
82 . 18 13 . 43
CHANGE IN WATER STORAGE 0.542 ( 1.259) 589876. 1.50
******************I****************************************************
. . . . . . . . . . . . . . . . . . . . . . . . . . . . . . . . . . . . . . . . . . . . . . . . . . . . . . . . . . . . . . . . . . . . . . .
RUNOFF 2 . 287 2490288.5
PERCOLATION FROM LAYER 1
SNOW WATER
0.0412 44857.5
1.02 1112927.0
A-3

RECHARGE
MAXIMUM VEG, SOIL WATER (VOL/VOL) 0.3640
MINIMUM VEG. SOIL WATER ,(VOL/VOL) 0,1345
. . . . . . . . . . . . . . . . . . . . . . . . . . . . . . . . . . . . . . . . . . . . . . . . . . . . . . . . . . . . . . . . . . . . . . .
. . . . . . . . . . . . . . . . . . . . . . . . . . . . . . . . . . . . . . . . . . . . . . . . . . . . . . . . . . . . . . . . . . . . . . .
SNOW WATER 0.00
. . . . . . . . . . . . . . . . . . . . . . . . . . . . . . . . . . . . . . . . . . . . . . . . . . . . . . . . . . . . . . . . . . . . . . . . . . . . . . . . . . . . . . . . . . . . . . . . . . . . . . . . . . . . . . . . . . . . . . . . . . . . . . . . . . . . . . . . . . . . . .
A-4

APPENDIX B HELP Model-Open Landfill

FIRST YEAR - OPEN CELL
. . . . . . . . . . . . . . . . . . . . . . . . . . . . . . . . . . . . . . . . . . . . . . . . . . . . . . . . . . . . . . . . . . . . . . . . . . . . . . . . . . . . . . . . . . . . . . . . . . . . . . . . . . . . . . . . . . . . . . . . . . . . . . . . . . . . . . . . . . . . . .
OPEN LANDFILL
. . . . . . . . . . . . . . . . . . . . . . . . . . . . . . . . . . . . . . . . . . . . . . . . . . . . . . . . . . . . . . . . . . . . . . . . . . . . . . . . . . . . . . . . . . . . . . . . . . . . . . . . . . . . . . . . . . . . . . . . . . . . . . . . . . . . . . . . . . . . . . . c
LAYER 1
THICKNESS POROSITY FIELD CAPACITY WILTING POINT INITIAL SOIL WATER CONTENT SATURATED HYDRAULIC CONDUCTIVITY
-
VERTICAL PERCOLATION LAYER 120.00 INCHES - -
- - 0.6020 VOL/VOL 0.4481 VOL/VOL 0.2459 VOL/VOL 0.2460 VOL/VOL 0.000099999997 CM/SEC
- - - - - - - -
GENERAL SIMULATION DATA
SCS RUNOFF CURVE NUMBER TOTAL AREA OF COVER EVAPORATIVE ZONE DEPTH POTENTIAL RUNOFF FRACTION UPPER LIMIT VEG. STORAGE INITIAL VEG. STORAGE INITIAL SNOW WATER CONTENT INITIAL TOTAL WATER STORAGE IN SOIL AND WASTE LAYERS
82.00 = 435600. SQ FT
18.00 INCHES 1.000000 10.8360 INCHES 4.4280 INCHES 0.0000 INCHES
29.5200 INCHES
- -
- - - - - - - - - -
- -
SOIL WATER CONTENT INITIALIZED BY USER.
B- 1
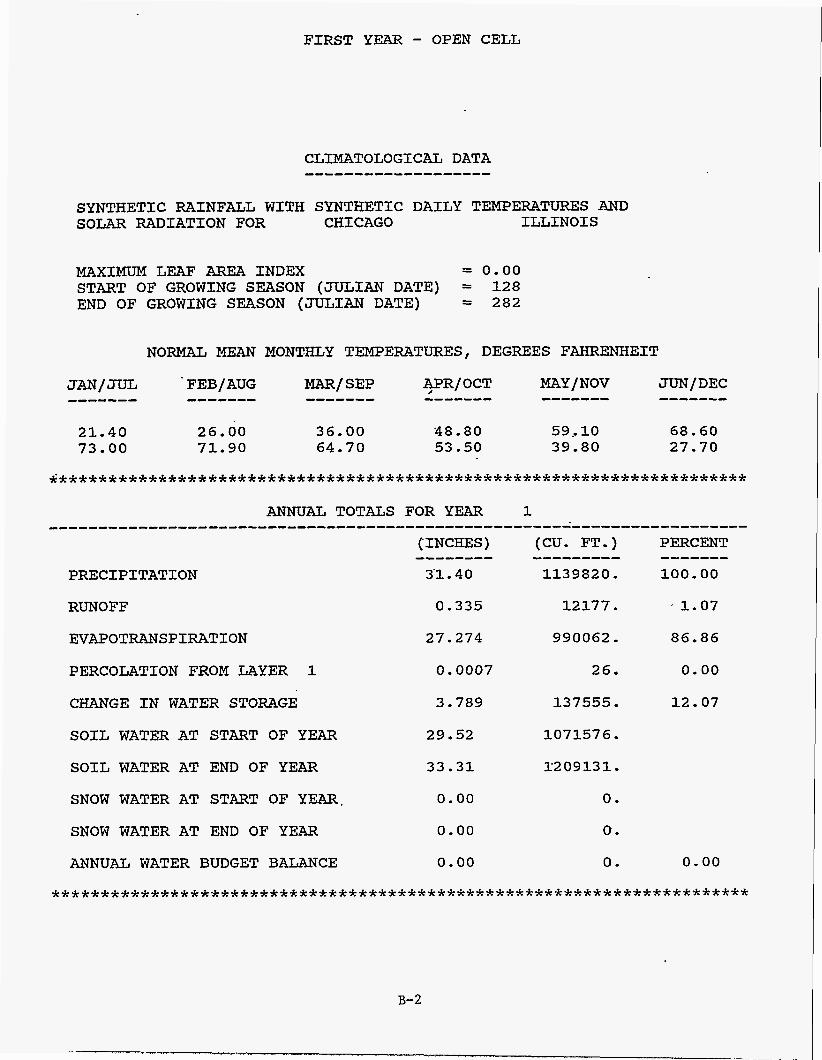
FIRST YEAR - OPEN CELL
CLIMATOLOGICAL DATA ------------------- SYNTHETIC RAINFALL WITH SYNTHETIC DAILY TEMPERATURES AND SOLAR RADIATION FOR CHICAGO ILLINOIS
MAXIMUM LEAF AREA INDEX = 0.00 START OF GROWING SEASON ( JULIAN DATE) = 128 END OF GROWING SEASON (JULIAN DATE) = 282
21.40 26.00 36.00 '48.80 59,lO 68 . 60 73.00 71.90 64.70 53.50 39.80 27.70
. . . . . . . . . . . . . . . . . . . . . . . . . . . . . . . . . . . . . . . . . . . . . . . . . . . . . . . . . . . . . . . . . . . . . . . ANNUAL TOTALS FOR YEAR 1
PRECIPITATION
RUNOFF
EVAPOTRANSPIRATION
PERCOLATION FROM LAYER 1
CHANGE IN WATER STORAGE
SOIL WATER AT START OF YEAR
SOIL WATER AT END OF YEAR
SNOW WATER AT START OF YEAR.
SNOW WATER AT END OF YEAR
ANNUAL WATER BUDGET BALANCE
CINCHES)
31.40 --------
0.335
27.274
0.0007
3.789
29.52
33.31
0.00
0.00
0.00
12177.
990062.
26.
137555 . 1071576.
1'209 1 3 1.
0.
0.
0.
PERCENT
100.00
1.07
86.86
0.00
12.07
-------
0.00
. . . . . . . . . . . . . . . . . . . . . . . . . . . . . . . . . . . . . . . . . . . . . . . . . . . . . . . . . . . . . . . . . . . . . . .
B-2

FIRST YEAR - OPEN CELL
PRECIPITATION ------------- TOTALS 0.74
4.68 0.68 3.35
2.17 2.86
3.39 2.46
1.77 2.22
4.41 2.67
STD. DEVIATIONS 9.00 0.00
0.00 0.00
0.00 0.00
0.00 0.00
0.00 0.00
0.00 0.00
RUNOFF ------ TOTALS 0.000
0.000 0.000 0.000 0.007 0.191
0.000 0.001 0,136 0.000
0.000 0.000
0.000 0.000 0.000 0.000
0.000 0.000
0.000 0.000
STD. DEVIATIONS 0.000 0.000 0.000 0.000
EVAPOTRANSPIRATION
1.130 1.917 2-729 4.727 2.171 2.868
1.560 0.997
4.970 0.858
TOTALS 0.292 3.055
0.000 0.000
STD. DEVIATIONS 0.000 0.000 0.000 0.000 0.000 0.000
0.000 0.000
0.000 0.000
0.0001 0.0001 0.0001 0.0001 0.OOOl 0.0001 0.0001 0.0001 0.0001 0.0001
STD. DEVIATIONS 0.0000 0.0000 0.0000 0.0000 0.0000 0.0000 0.0000 0.0000 0.0000 0.0000
0.0000 0.0000
. . . . . . . . . . . . . . . . . . . . . . . . . . . . . . . . . . . . . . . . . . . . . . . . . . . . . . . . . . . . . . . . . . . . . . .
. . . . . . . . . . . . . . . . . . . . . . . . . . . . . . . . . . . . . . . . . . . . . . . . . . . . . . . . . . . . . . . . . . . . . . . 1 AVERAGE ANNUAL TOTALS & (STD. DEVIATIONS) FOR YEARS 1 THROUGH

FIRST YEAR - OPEN CELL
RUNOFF 0.335 ( 0.000) 12177 . 1.07
EVAPOTRANSPIRATION 27.274 ( 0.000) 990062. 86.86
PERCOLATION FROM LAYER 1 0.0007 ( 0,0000) 26. 0.00
CHANGE IN WATER STORAGE 3.789 ( 0.000) 137555. 12.07
. . . . . . . . . . . . . . . . . . . . . . . . . . . . . . . . . . . . . . . . . . . . . . . . . . . . . . . . . . . . . . . . . . . . . . .
/ . . . . . . . . . . . . . . . . . . . . . . . . . . . . . . . . . . . . . . . . . . . . . . . . . . . . . . . . . . . . . . . . . . . . . . .
PRECIPITATION
RUNOFF
PERCOLATION
SNOW WATER
FROM LAYER
(INCHES) .
1.64
0.136
--------
1 0.0000
1.02
-
(CU. FT.)
59532 . 0 4945 . 0
0.1
37097.6
- - - - - - - - -
MAXIMUM VEG. SOIL WATER (VOL/VOL) 0 . 4470 MINIMUM VEG. SOIL WATER (VOL/VOL) 0.2455
. . . . . . . . . . . . . . . . . . . . . . . . . . . . . . . . . . . . . . . . . . . . . . . . . . . . . . . . . . . . . . . . . . . . . . .
. . . . . . . . . . . . . . . . . . . . . . . . . . . . . . . . . . . . . . . . . . . . . . . . . . . . . . . . . . . . . . . . . . . . . . .
B-4
FIRST YEAR - OPEN CELL
SNOW WATER 0.00

APPENDIX C MULTIMED Model Results-Open Landfill
I
* V a w t3 4
a 0 H
I 3 V w B 0 p: I4
GI 4 i3 a W c a 0 p: H
3 R w
m
t;
I3 z El c m m w CR m 4
w d
m 0 I4
x w
GI w R 0
c
4
a H
w z H
B GI 5 c
h
rl cn cn rl
. rl 0
r i
a W
B w 2
c- 1

I
FIRST YEAR - OPEN CELL
1 Run options
SAMPLE
RUN Chemical simulated is DEFAULT CHEMICAL
Option Chosen Saturated zone model Run was DETERMIN InfilCration input by user Run was steady-state Reject runs if Y coordinate outeide plume Reject riins if 2 coordinate outside plume Gauasian source used in saturated zone model 1 I \
CHEMICAL SPECIFIC VARIABLES’
. . . . . . . . . . . . . . . . . . . . . . . . . . . . . . . . . . . . . . . . . . . . . . . . . . . . . . . . . . . . . . . . . . . . . . . . . . . . . . . . . . . . . . . . . . . . . . . . . . . . . . . . . . . . . . . . . . . . . . . . DISTRIBUTION PARAMETERS LIMITS
MEAN STD DEV MIN MAX VARIABLE NAME UNITS
. . . . . . . . . . . . . . . . . . . . . . . . . . . . . . . . . . . Solid phase decay coefficient Dissolved phase decay coefficient Overall chemical decay coefficient Acid catalyzed hydrolysis rate Neutral hydrolysis rate constant Base catalyzed hydrolysis rate Reference temperature
- - - - - - - - - - - - - - - - - -999. -999. -999. 0.000Et00
0.000E+00 * 0.000Et00
25.0
-__ - - -____- - - - -________ I________________
-999. 0.000Et00 0.100Etll -999. 0.000Et00 0.100Etll -999. 0.000Et00 O.lOOE+ll -999. 0.000Et00 -999. -999. 0.000Et00 -999. -999. 0.000Et00 -999. -999. 0.000Et00 100.
t
Page 2
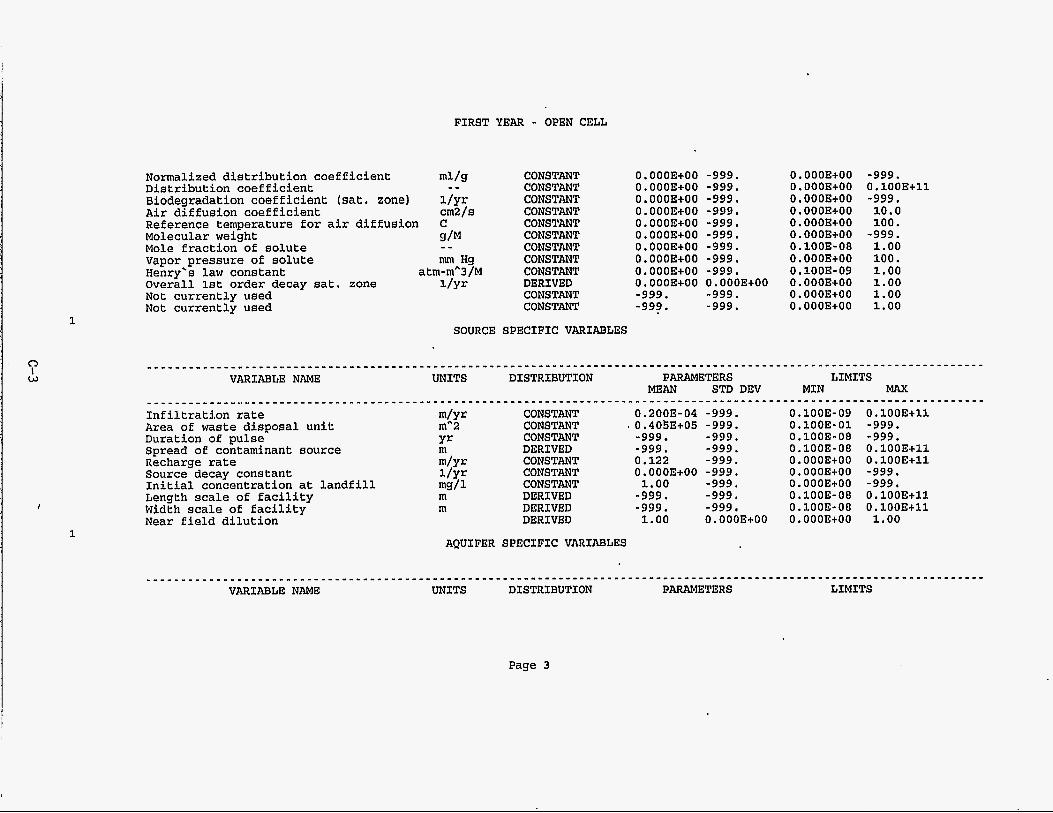
FIRST YEAR - OPEN CELL
Normalized distribution coefficient ml/g Distribution coefficient _ _ Biodegradation coefficient (sat. zone) l/yr Air diffusion coefficient cm2/s Reference temperature for air diffusion Molecular weight S/M Mole fraction of solute _ _ Vapor pressure of solute Henry's law constant Overall 1st order decay sat. zone l/yr Not currently used Not currently used
C
mrn Hg a tm- m^3 /M
CONSTANT CONSTANT CONSTANT CONSTANT CONSTANT CONSTANT CONSTANT CONSTANT CONSTANT DERIVED CONSTANT CONSTANT
0.000Et00 -999. 0.000E+00 -999. 0.000Et00 -999. 0.000E+00 -999. 0.000Et00 -999. 0.000E+00 -999. 0.000E+00 -999. 0.000Et00 -999. 0.000E+00 -999. 0.000E+00 O.OOOE+OO -999. -999. -999. -999.
O.OOOE+OO O.OOOE+OO 0.000Et00 O.OOOE+OO O.OOOE+OO O.OOOE+OO
O.OOOE+OO
O.OOOE+OO O.OOOE+OO O.OOOE+OO
0.100E-08
0.100E-09
-999. O.lOOE+ll -999. 10.0 100. -999. 1.00 100. 1.00 1.00 1.00 1.00
SOURCE SPECIFIC VARIABLES
VARIABLE NAME
- - _ _ _ _ _ _ - _ _ - " . , . . _ _ - - - - - - - - - - - - - - - - - - - - - - - - Infiltration rate Area of waste disposal unit Duration of pulse Spread of contaminant source Recharge rate Source decay constant Initial concentration at landfill Length scale of facility Width scale of facility Near field dilution
UNITS DISTRIBUTION PARAMETERS LIMITS MEAN STD DEV MIN MAX
_ _ _ _ _ _ _ - _ ^ _ ^ _ _ _ _ _ _ _ _ - - - - - - - - - - - - - - - - - - - - - - - - - - - - -
m/yr CONSTANT 0.200E-04 -999. m-2 CONSTANT .0.40!53+05 -999.
CONSTANT -999. -999. m DERIVED -999. -999. Yr
m/yr CONSTANT 0.122 -999. CONSTANT 0.000E+00 -999.
mg/l CONSTANT 1.00 -999. l/Yr
m DERIVED -999. -999. m DERIVED -999. -999
DERIVED 1.00 0.000E+00
AQUIFER SPECIFIC VARIABLES
- - - - - . . - - - - - - 0.100E-09 0.100E-01 0.100E-08 0.100E-08 0.000E+00 0. OOOEtOO O.OOOE+OO 0.100E-08 0.100E-08 0.000E+00
- - - - - - - - - - - - - - - - - - O,lOOE+ll -999. -999. 0.100E+ll 0.100Et11 -999. -999 * 0.100E+ll OI1OOE+ll 1.00
Page 3
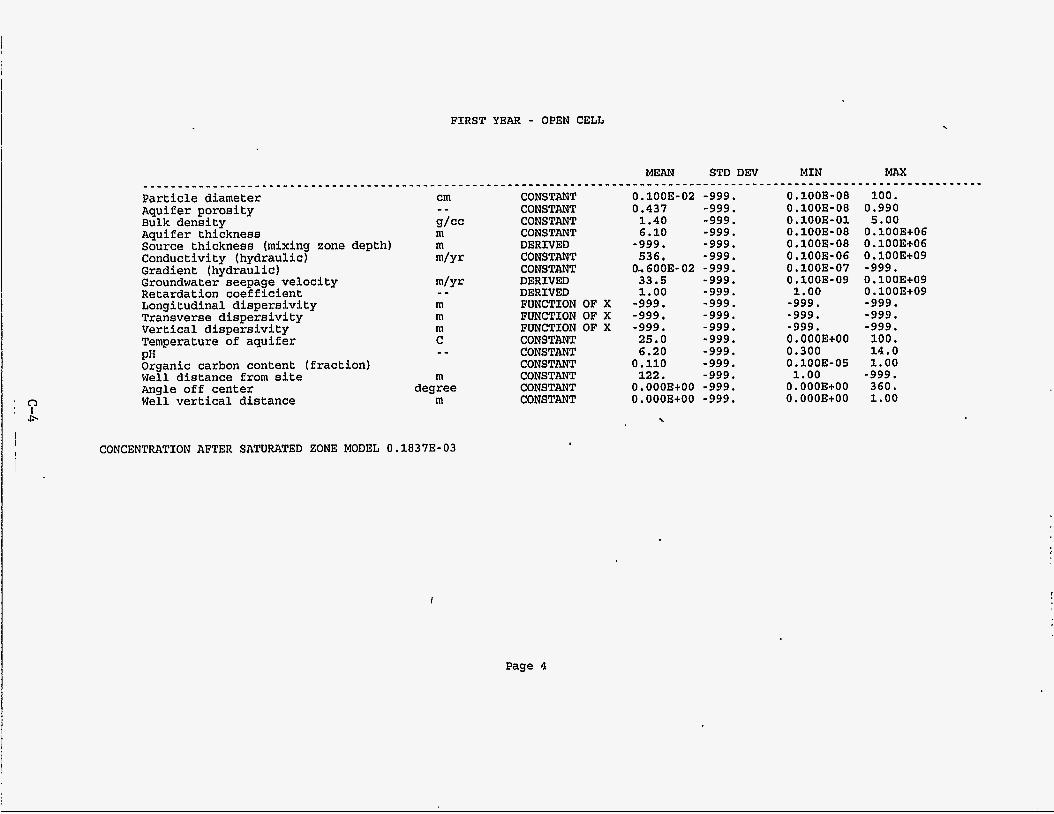
i
' I c-
~
!
!
FIRST YEAR - OPEN CELL
Particle diameter Aquifer porosity Bulk density Aquifer thickness Source thickness (mixing zone Conductivity (hydraulic) Gradient (hydraulic) Groundwater seepage Velocity Retardation coefficient Longitudinal dispersivity Transverse dispersivity Vertical dispersivity Temperature of aquifer
depth)
PH Organic carbon content (fraction) Well distance from site Angle off center Well vertical distance
CONSTANT CONSTANT CONSTANT CONSTANT DERIVED CONSTANT CONSTANT DERIVED DER I V E D FUNCTION OF X FUNCTION OF X FUNCTION OF X CONSTANT CONSTANT CONSTANT CONSTANT CONSTANT CONSTANT
0.100E-02 -999. 0.437 -999. 1.40 -999. 6.10 -999. -999. -999. 536. -999.
0- 600E- 02 -999. 33.5 -999. 1.00 -999. -999. -999. -999, -999. -999. -999. 25.0 -999. 6.20 -999. 0.110 -999. 122. -999.
0.000E+00 -999. 0.000E+00 -999.
0.100E-08 0.100E-08 0.100E-01 0.100E- 08 0.100E-08 0.100E-06 0.100E-07 0.100E-09 1.00 -999. -999. -999. O.OOOE+OO 0.300
1.00 0.1OOE-05
O.OOOE+OO 0.000Et00
100. 0.990 5.00 0.100E+06 0.100E+06 0.100E+09 -999. 0.100Et09 0.100Et09 -999. -999. -999. 100. 14.0 1.00 -999. 360. 1.00
CONCENTRATION AFTER SATURATED ZONE MODEL 0.18373-03
Page 4
APPENDIX D HELP Model-Closed Landfill

..... I -... - . . . . . - . . . . . . .
CLOSED LANDFILL
. . . . . . . . . . . . . . . . . . . . . . . . . . . . . . . . . . . . . . . . . . . . . . . . . . . . . . . . . . . . . . . . . . . . . . . . . . . . . . . . . . . . . . . . . . . . . . . . . . . . . . . . . . . . . . . . . . . . . . . . . . . . . . . . . . . . . . . . . . . . . .
CLOSED LANDFILL
. . . . . . . . . . . . . . . . . . . . . . . . . . . . . . . . . . . . . . . . . . . . . . . . . . . . . . . . . . . . . . . . . . . . . . . . . . . . . . . . . . . . . . . . . . . . . . . . . . . . . . . . . . . . . . . . . . . . . . . . . . . . . . . . . . . . . . . . . . . . . . j
. LAYER 1 -------- VERTICAL PERCOLATION LAYER
24-00 INCHES - - 0.3980 VOL/VOL 0.2440 VOL/VOL 0 . 1360 VOL/VOL 0.2440 VOL/VOL 0,000119999997 CM/SEC
- - THICKNESS POROSITY FIELD CAPACITY WILTING POINT INITIAL SOIL WATER CONTENT SATURATED HYDRAULIC CONDUCTIVITY
- - - - - - - -
LAYER 2
VERTICAL PERCOLATION LAYER 24.00 INCHES - - 0.4300 VOL/VOL 0.3660 VOL/VOL 0.2800 VOL/VOL 0.2460 VOL/VOL 0.000000200000 CM/SEC
- - THICKNESS . POROSITY FIELD CAPACITY WILTING POINT INITIAL SOIL WATER CONTENT SATURATED HYDRAULIC CONDUCTIVITY
- - - - - - - -
LAYER 3
D- 1
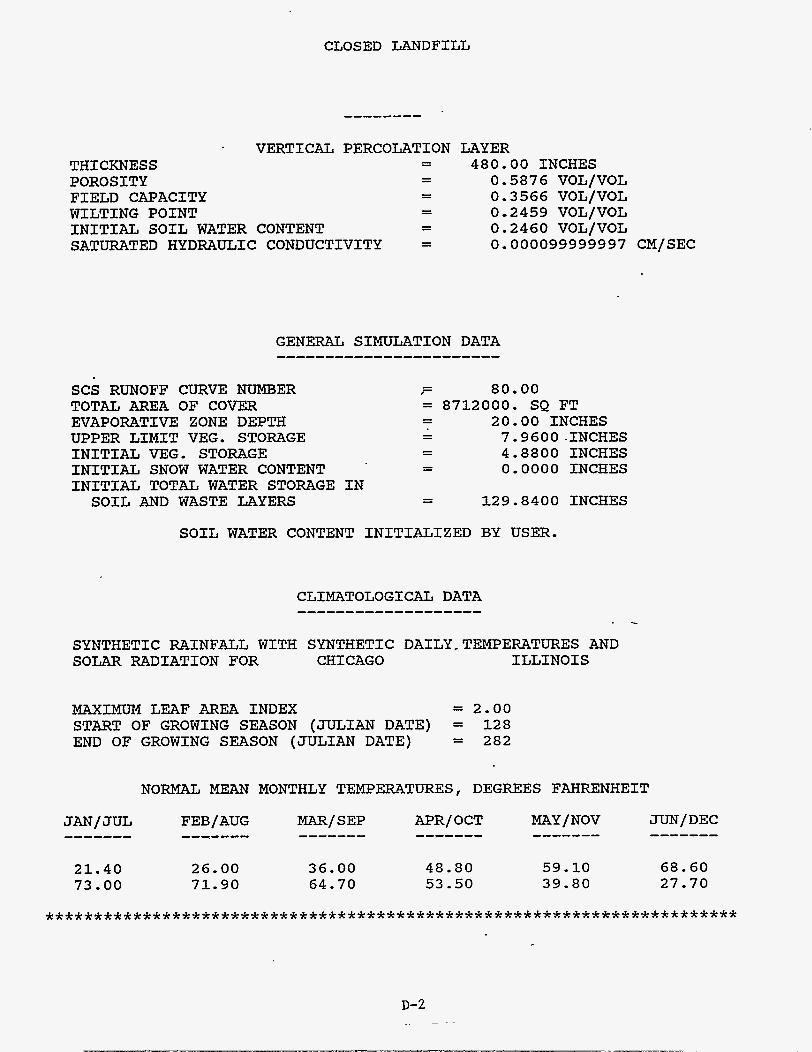
CLOSED LANDFILL
THICKNESS POROSITY FIELD CAPACITY WILTING POINT INITIAL SOIL WATER CONTENT SATURATED HYDRAULIC CONDUCTIVITY
VERTICAL PERCOLATION LAYER 480.00 INCHES - -
0.5876 VOL/VOL - - 0.3566 VOL/VOL
0.2459 VOL/VOL - - 0.2460 VOL/VOL - - 0.000099999997 CM/SEC
- -
- -
GENERAL SIMULATION DATA ....................... SCS RUNOFF CURVE NUMBER TOTAL AREA OF COVER EVAPORATIVE ZONE DEPTH UPPER LIMIT VEG. STORAGE INITIAL VEG. STORAGE INITIAL SNOW WATER CONTENT INITIAL TOTAL WATER STORAGE IN SOIL AND WASTE LAYERS
80.00
20.00 INCHES
- ,- = 8712000. SQ FT - -
7.9600 .INCHES 4.8800 INCHES 0.0000 INCHES
- - - - - -
129.8400 INCHES
SOIL WATER CONTENT INITIALIZED BY USER.
. -
SYNTHETIC RAINFALL WITH SYNTHETIC DAILY,TEMPERATURES AND SOLAR RADIATION FOR CHICAGO ILLINOIS
MAXIMUM LEAF AREA INDEX = 2.00 START OF GROWING SEASON (JULIAN DATE) = 128 END OF GROWING SEASON (JULIAN DATE) = 282
NORMAL MEAN MONTHLY TEMPERATURES, DEGREES FAHRENHEIT
21.40 73.00
26.00 71.90
36.00 64.70
48.80 53.50
59.10 39.80
68.60 27.70
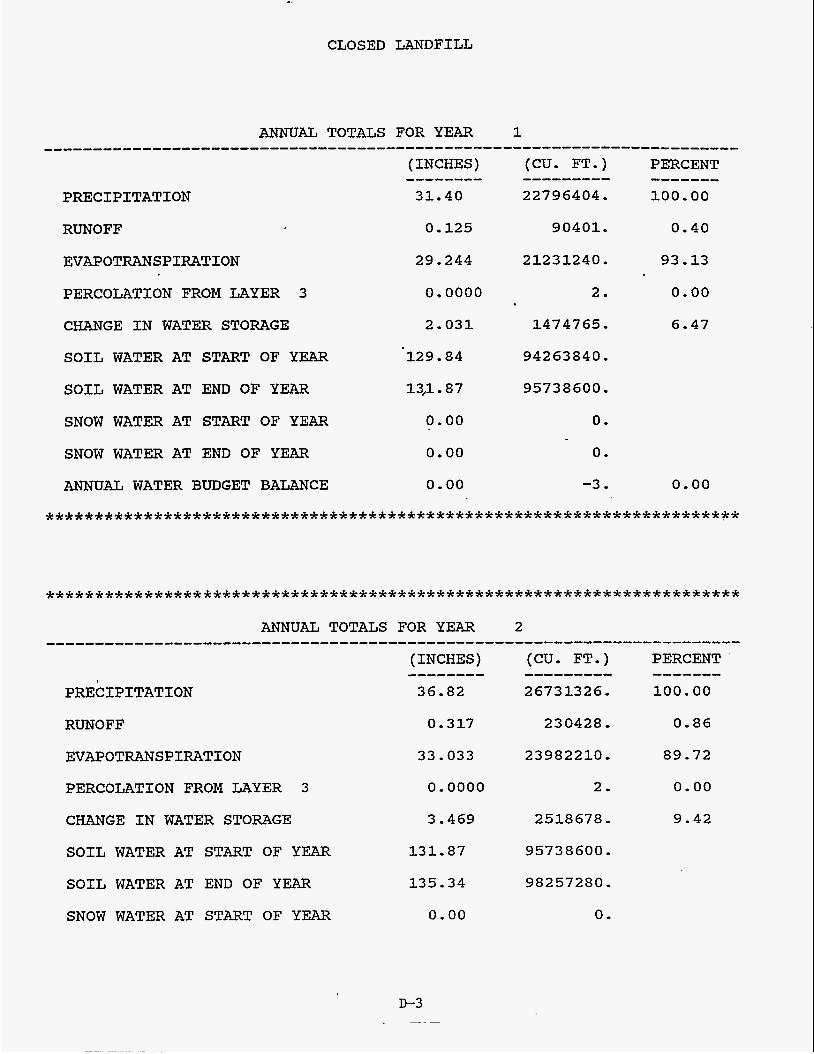
-_
CLOSED LANDFILL
ANNUAL TOTALS FOR YEAR 1
PRECIPITATION
RUNOFF
EVAPOTRANSPIRATION
PERCOLATION FROM LAYER 3
CHANGE IN WATER STORAGE
SOIL WATER AT START OF YEAR
SOIL WATER AT END OF YEAR
SNOW WATER AT START OF YEAR
SNOW WATER AT END OF YEAR
ANNUAL WATER BUDGET BALANCE
(INCHES) (CU. FT.) ~ ~~
31.40
0.125
29.244
0.0000
2.031
129.84
13,l . 87 0.00
0.00
0.00
22796404,
90401.
21231240.
2.
1474765.
94263840.
95738600.
0.
0,
-3.
PERCENT
100 . 00 -------
0.40
93.13
0.00
6.47
0.00
. . . . . . . . . . . . . . . . . . . . . . . . . . . . . . . . . . . . . . . . . . . . . . . . . . . . . . . . . . . . . . . . . . . . . . .
PRECIPITATION
RUNOFF
EVAPOTRANSPIRATION
PERCOLATION FROM LAYER 3
CHANGE IN WATER STORAGE
SOIL WATER AT START OF YEAR
SOIL WATER AT END OF YEAR
SNOW WATER AT START OF YEAR
36.82
0.317
33.033
0.0000
3.469
131.87
135.34
0.00
2 673 13 2 6. 100.00
230428. 0.86
23982210. 89.72
2. 0.00
2518678. 9.42
95738600.
98257280.
0.

-- . . . . ._. .. . ... . ._. . . .
CLOSED LANDFILL
SNOW WATER AT END OF YEAR 0.00
ANNUAL WATER BUDGET BALANCE 0.00
0,
7. 0.00
RUNOFF z 4.653 3377918. 10.15
EVAPOTRANSPIRATION 38.772 28148494 . 84.62
PERCOLATION FROM LAYER 3 . 0.0000 2. 0.00
CHANGE IN. WATER STORAGE 2.395 1738925. 5.23
SOIL WATER AT START OF YEAR 135 . 34 98257280.
SOIL WATER AT END OF YEAR 137.35 99712744.
SNOW WATER AT START OF YEAR 0.00 0.
0.39 283458. - SNOW WATER AT END OF YEAR ANNUAL WATER BUDGET BALANCE 0.00 -22 . 0.00
. . . . . . . . . . . . . . . . . . . . . . . . . . . . . . . . . . . . . . . . . . . . . . . . . . . . . . . . . . . . . . . . . . . . . . .
. . . . . . . . . . . . . . . . . . . . . . . . . . . . . . . . . . . . . . . . . . . . . . . . . . . . . . . . . . . . . . . . . . . . . . . ANNUAL TOTALS FOR YEAR 4
----------------------------------------------------------------,-------
(INCHES) (CU. FT.) PERCENT -------- --------- ------- PRECIPITATION 28.66 20807166. 10.0.00
RUNOFF 1.635 1187170 . 5.71
D-4
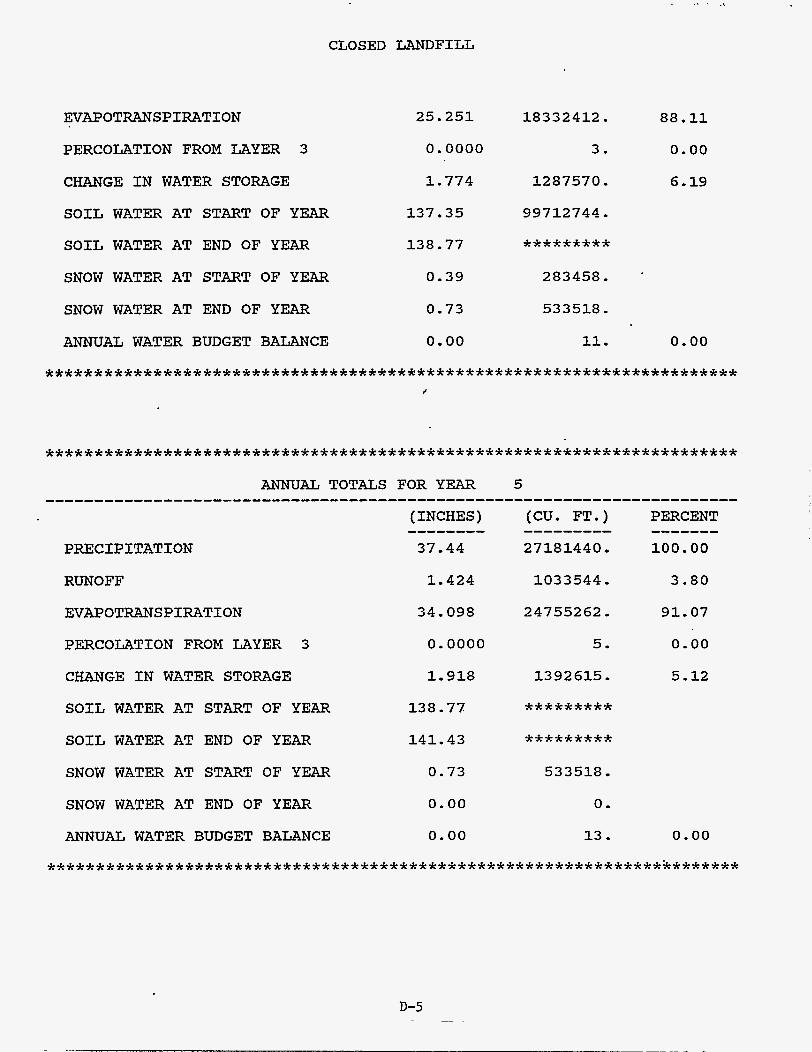
CLOSED LANDFILL
EVAPOTRANSPIRATION 25.251 18332412. 88 . 11 0.00
6.19
PERCOLATION FROM LAYER 3 0.0000 3.
1287570.
99712744.
********* 283458.
533518.
11 .
CHANGE IN WATER STORAGE
SOIL WATER AT START OF YEAR
1.774
137 . 35 138.77
0.39
0.73
0.00
SOIL WATER AT END OF YEAR
SNOW WATER AT START OF YEAR
SNOW WATER AT END OF YEAR
ANNUAL WATER BUDGET BALANCE 0.00
. . . . . . . . . . . . . . . . . . . . . . . . . . . . . . . . . . . . . . . . . . . . . . . . . . . . . . . . . . . . . . . . . . . . . . . c
. . . . . . . . . . . . . . . . . . . . . . . . . . . . . . . . . . . . . . . . . . . . . . . . . . . . . . . . . . . . . . . . . . . . . . .
PRECIPITATION
RUNOFF
EVAPOTRANSPIRATION
PERCOLATION FROM LAYER 3
CHANGE IN WATER STORAGE
SOIL WATER AT START OF YEAR
1.424 1033544. 3.80
34.098 24755262. 91.07
0.0000 5. 0.00
1.918 1392615. 5.12
138 . 77 ********* 141.43 ********* SOIL WATER AT END OF YEAR
SNOW WATER AT START OF YEAR 0.73 533518.
SNOW WATER AT END OF YEAR 0.00 0.
ANNUAL WATER BUDGET BALANCE 0.00 13. 0.00
. . . . . . . . . . . . . . . . . . . . . . . . . . . . . . . . . . . . . . . . . . . . . . . . . . . . . . . . . . . . . . . . . . . . . . .
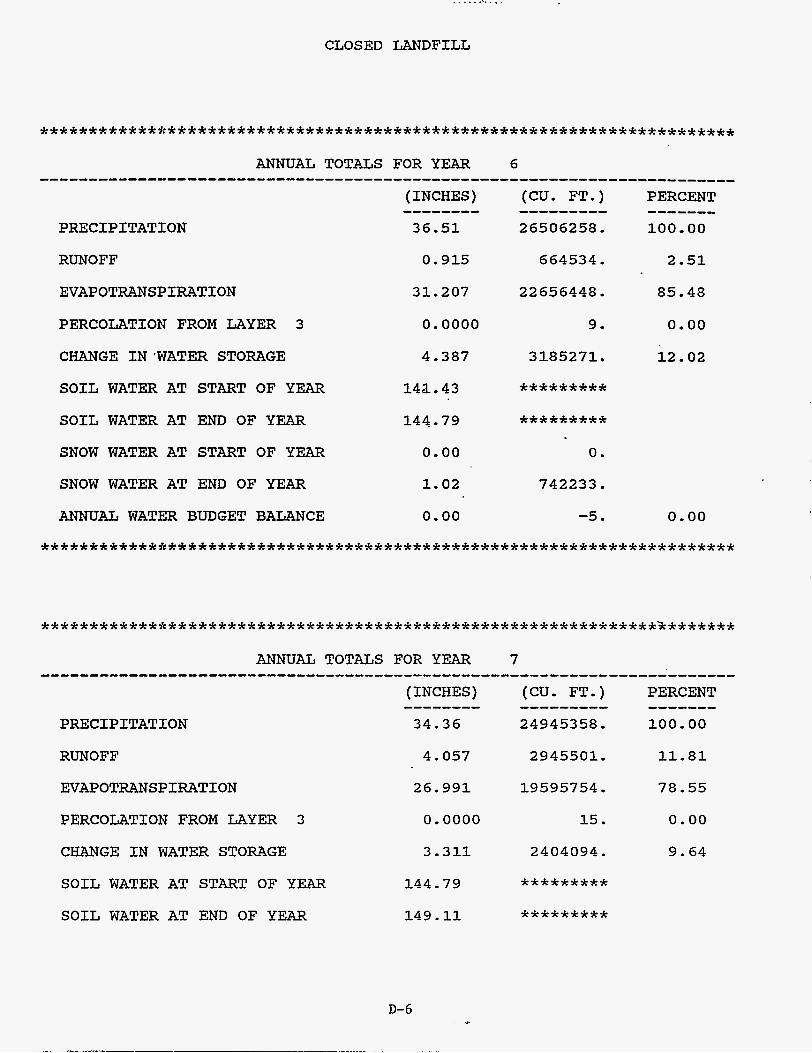
. . . . . ... . . .
CLOSED LANDFILL
ANNUAL TOTALS FOR YEAR 6 ....................................................................... (INCHES) (CU. FT.) PERCENT -------- --------- - - - - - - -
PRECIPITATION 36.51 26506258 . 100 . 00 RUNOFF 0.915 664534. 2.51
EVAPOTRANSPIRATION 31.207 22656448. 85 . 48 PERCOLATION FROM LAYER 3 0.0000 9. 0.00
CHANGE IN ‘WATER STORAGE 4.387 3185271. 12 . 02 SOIL WATER AT START OF YEAR 14d. 43 ********* SOIL WATER AT END OF YEAR 144.79 ********* SNOW WATER AT START OF YEAR 0.00 0.
SNOW WATER AT END OF YEAR 1.02 742233.
ANNUAL WATER BUDGET BALANCE 0.00 -5. 0.00
* * * * * * * * * * * *~t * * *~*** * * * * * * * * * * * * * * * * * * * * * * * * * * * * * * * * * * * * * * * * * * * * * * * * * * *
ANNUAL TOTALS FOR YEAR 7
RUNOFF 4.057 2945501. 11.81
EVAPOTRANSPIRATION 26.991 19595754, 78.55
PERCOLATION FROM LAYER 3 0.0000 15. 0.00
CHANGE IN WATER STORAGE 3.311 2404094. 9.64
SOIL WATER AT START OF YEAR 144.79 ********* SOIL WATER AT END OF YEAR 149.11 *********
D-6
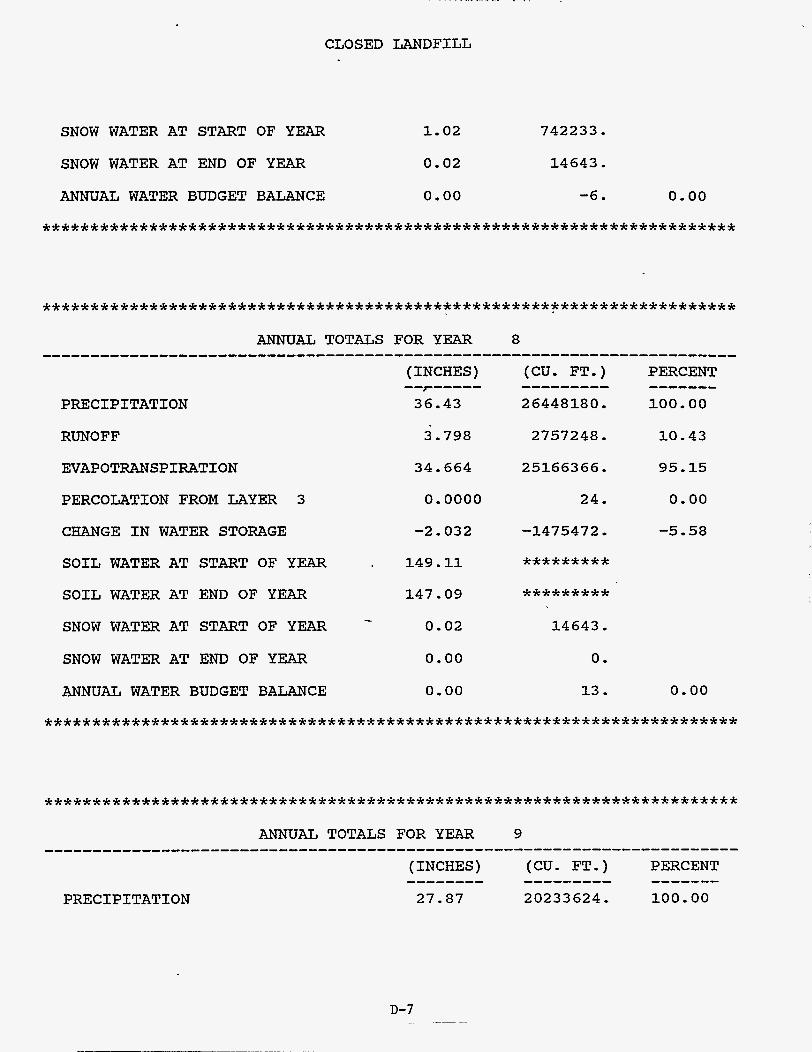
CLOSED LANDFILL
SNOW WATER AT START OF YEAR 1.02 742233.
SNOW WATER AT END OF YEAR 0.02 14643.
ANNUAL WATER BUDGET BALANCE 0.00 -6. 0.00
. . . . . . . . . . . . . . . . . . . . . . . . . . . . . . . . . . . . . . . . . . . . . . . . . . . . . . . . . . . . . . . . . . . . . . .
. . . . . . . . . . . . . . . . . . . . . . . . . . . . . . . . . . . . . . . . . . . . . . . . . . . . . . . . . . . . . . . . . . . . . . . ANNUAL TOTALS FOR YEAR 8
PRECIPITATION
RUNOFF
EVAPOTRANSPIRATION
PERCOLATION FROM LAYER 3
CHANGE IN WATER STORAGE
SOIL WATER AT START OF YEAR
SOIL WATER AT END OF YEAR
SNOW WATER AT START OF YEAR -
(INCHES) (CU. FT.) PERCENT
36.43 26448180. 100.00 --------- ------- r----- --
3.798
34 . 664 0.0000
-2 . 032 . 149.11
147.09
0.02
2757248.
25166366.
24 . -1475472 . ********.A:
********* 14643.
10.43
95 . 15 0.00
-5.58
SNOW WATER AT END OF YEAR 0.00 0.
ANNUAL WATER BUDGET BALANCE 0.00 13 . 0.00
. . . . . . . . . . . . . . . . . . . . . . . . . . . . . . . . . . . . . . . . . . . . . . . . . . . . . . . . . . . . . . . . . . . . . . .
. . . . . . . . . . . . . . . . . . . . . . . . . . . . . . . . . . . . . . . . . . . . . . . . . . . . . . . . . . . . . . . . . . . . . . .
PRECIPITATION
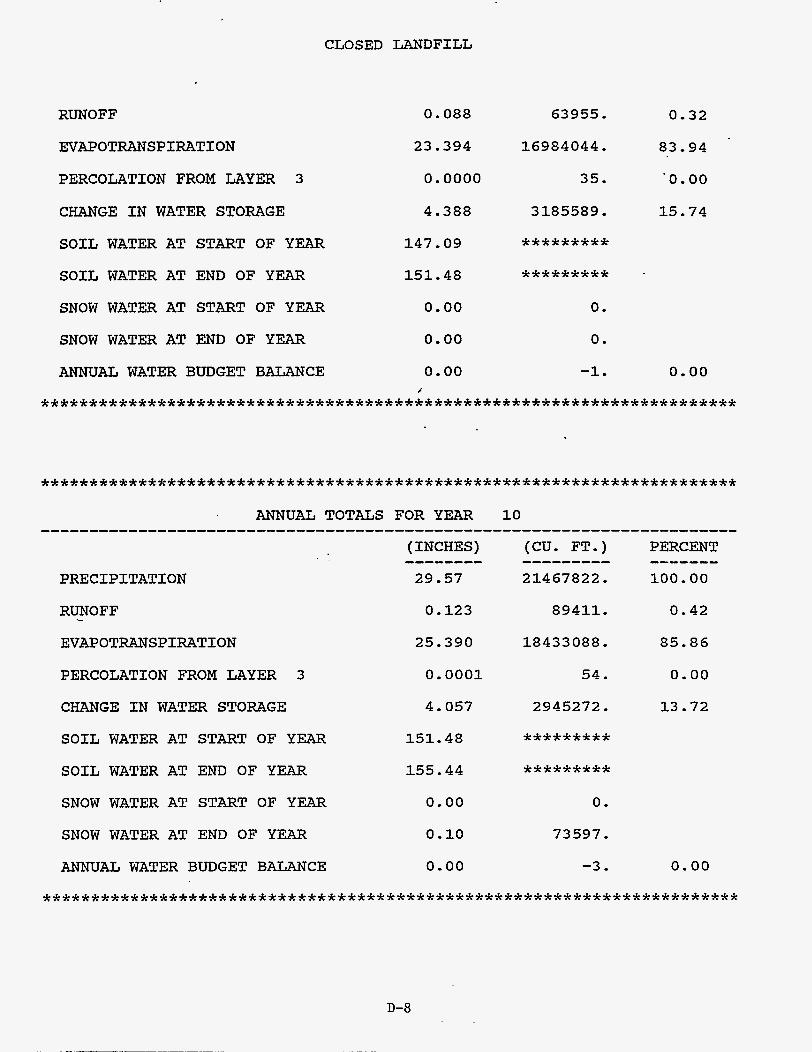
CLOSED LANDFILL
RUNOFF
EVAPOTRANSPIRATION
PERCOLATION FROM LAYER 3
CHANGE IN WATER STORAGE
SOIL WATER AT START OF YEAR
SOIL WATER AT END OF YEAR
SNOW WATER AT START OF YEAR
SNOW WATER AT END OF YEAR
0.088
23.394
0.0000
4.388
147.09
151.48
0.00
0.00
63955.
16984044.
35.
3185589.
********* *********
0.
0.
0.32
83.94
‘0.00
15.74
ANNUAL WATER BUDGET BALANCE 0.00 -1. 0.00 /
* * * * * * * * * * * * ~ C * * * ~ * * * * * * * * * * * * * * * * * * * * * * * * * * * * * * * * * * * * * * * * * * * * * * * * * * * * * *
. . . . . . . . . . . . . . . . . . . . . . . . . . . . . . . . . . . . . . . . . . . . . . . . . . . . . . . . . . . . . . . . . . . . . . .
PRECIPITATION
RUNOFF
EVAPOTRANSPIRATION
PERCOLATION FROM LAYER 3
CHANGE IN WATER STORAGE
SOIL WATER AT START OF YEAR
SOIL WATER AT END OF YEAR
SNOW WATER AT START OF YEAR 0.00 0.
SNOW WATER AT END OF YEAR 0.10 73597.
ANNUAL WATER BUDGET BALANCE 0.00 -3. 0.00
-
. . . . . . . . . . . . . . . . . . . . . . . . . . . . . . . . . . . . . . . . . . . . . . . . . . . . . . . . . . . . . . . . . . . . . . .
0.123 89411. 0.42
25.390 18433088. 85.86
0.0001 54. 0.00
4.057 2945272. 13.72
151.48 ********* 155.44 *********
D-8

CLOSED LANDFILL
ANNUAL TOTALS FOR YEAR 11 ....................................................................... (INCHES) (CU. FT.) PERCENT -------- --------- - - - - - - -
. 32.17 23355424. 100.00
3.744 2718194. 11.64
PRECIPITATION
RUNOFF
EVAPOTRANSPIRATION 29.628 21510012 . 92.10
PERCOLATION FROM LAYER 3 0.0001 83. 0.00.
-3.74 CHANGE IN WATER STORAGE -,a-.202 -872867.
SOIL WATER AT START OF YEAR
SOIL WATER AT END OF YEAR
155.44
154.34
********* *********
SNOW WATER AT START OF YEAR 0.10 73597 . SNOW WATER AT END OF YEAR 0.00 0.
ANNUAL WATER BUDGET BALANCE 0.00 0. 0.00
. . . . . . . . . . . . . . . . . . . . . . . . . . . . . . . . . . . . . . . . . . . . . . . . . . . . . . . . . . . . . . . . . . . . . . .
. . . . . . . . . . . . . . . . . . . . . . . . . . . . . . . . . . . . . . . . . . . . . . . . . . . . . . . . . . . . . . . . . . . . . . .
PRECIPITATION
RUNOFF
EVAPOTRANSPIRATION
PERCOLATION FROM LAYER 3
CHANGE IN WATER STORAGE
SOIL WATER AT START OF YEAR
0.710 515323 . 2.06
30;674 22269022. 89.04
0.0002 123. 0.00
3.066 2226224. 8.90
154.34 *********
D-9
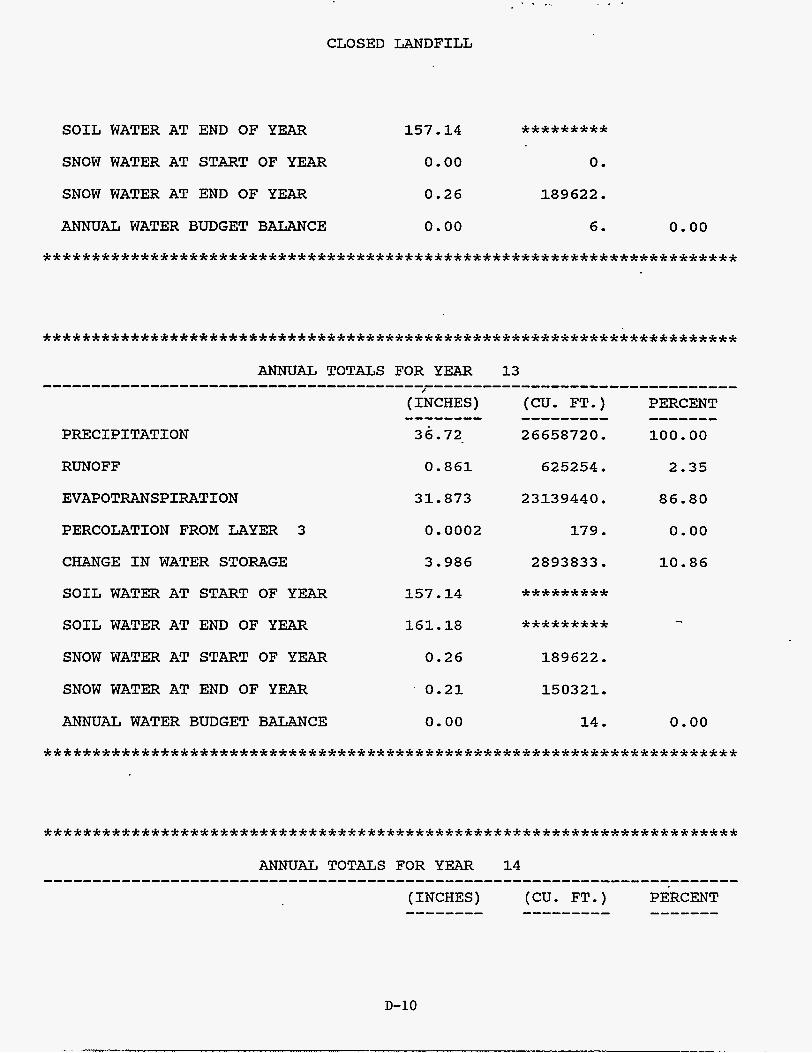
. . ... , _
CLOSED LANDFILL
SOIL WATER AT END OF YEAR 157 . 14 ********* SNOW WATER AT START OF YEAR 0.00 0.
SNOW WATER AT END OF YEAR 0.26 189622 . ANNUAL WATER BUDGET BALANCE 0.00 6. 0.00
. . . . . . . . . . . . . . . . . . . . . . . . . . . . . . . . . . . . . . . . . . . . . . . . . . . . . . . . . . . . . . . . . . . . . . .
. . . . . . . . . . . . . . . . . . . . . . . . . . . . . . . . . . . . . . . . . . . . . . . . . . . . . . . . . . . . . . . . . . . . . . .
RUNOFF 0.861 625254 . 2.35
EVAPOTRANSPIRATION 31.873 23139440. 86.80
PERCOLATION FROM LAYER 3 0 . 0002 179 . 0.00
CHANGE IN WATER STORAGE 3.986 2893833 . 10.86
SOIL WATER AT START OF YEAR 157 . 14 ********* - SOIL WATER AT END OF YEAR 161.18 *********
SNOW WATER AT START OF YEAR 0.26 189622.
SNOW WATER AT END OF YEAR ' 0.21 150321.
ANNUAL WATER BUDGET BALANCE 0.00 14. 0.00
. . . . . . . . . . . . . . . . . . . . . . . . . . . . . . . . . . . . . . . . . . . . . . . . . . . . . . . . . . . . . . . . . . . . . . .
. . . . . . . . . . . . . . . . . . . . . . . . . . . . . . . . . . . . . . . . . . . . . . . . . . . . . . . . . . . . . . . . . . . . . . . ANNUAL TOTALS FOR YEAR 14
D-10
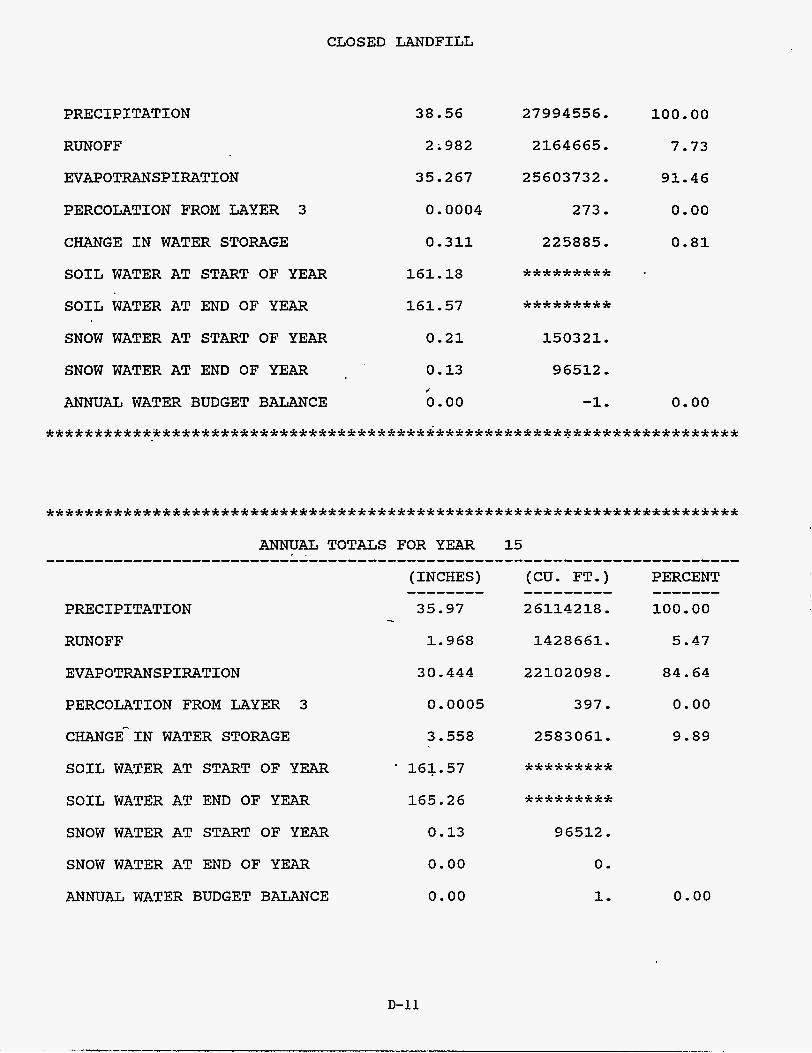
CLOSED LANDFILL
PRECIPITATION
RUNOFF
38.56 27994556 . 100,oo
2.982 2164665 . 7.73
EVAPOTRANSPIRATION 35.267 25603732 , 91.46
PERCOLATION FROM LAYER 3 0.0004 273. 0.00
CHANGE IN WATER STORAGE 0.311 225885 . 0.81
SOIL WATER AT START OF YEAR 161.18 ********* SOIL WATER AT END OF YEAR 161.57 ********* SNOW WATER AT START OF YEAR 0.21 150321,
SNOW WATER AT END OF YEAR 0.13 96512.
ANNUAL WATER BUDGET BALANCE 0,oo -1 , 0.00 c
. . . . . . . . . . . . . . . . . . . . . . . . . . . . . . . . . . . . . . . . . . . . . . . . . . . . . . . . . . . . . . . . . . . . . . . ANNUAL TOTALS FOR YEAR 15 . , .......................................................................
(INCHES) (CU. FT.) PERCENT
35.97 26114218. 100.00 PRECIPITATION
RUNOFF 1,968 1428661. 5.47
-------- --------- - - - - - - - -
EVAPOTRANSPIRATION 30.444 22102098. 84 , 64
PERCOLATION FROM LAYER 3 0.0005 397 . 0.00
CHANGE- IN WATER STORAGE 3,558 2583061. 9.89
SOIL WATER AT START OF YEAR * 161.57 ********* SOIL WATER AT END OF YEAR 165.26 ********* SNOW WATER AT START OF YEAR 0.13 96512 . SNOW WATER AT END OF YEAR 0.00 0.
ANNUAL WATER BUDGET BALANCE 0.00 1, 0.00
D-11
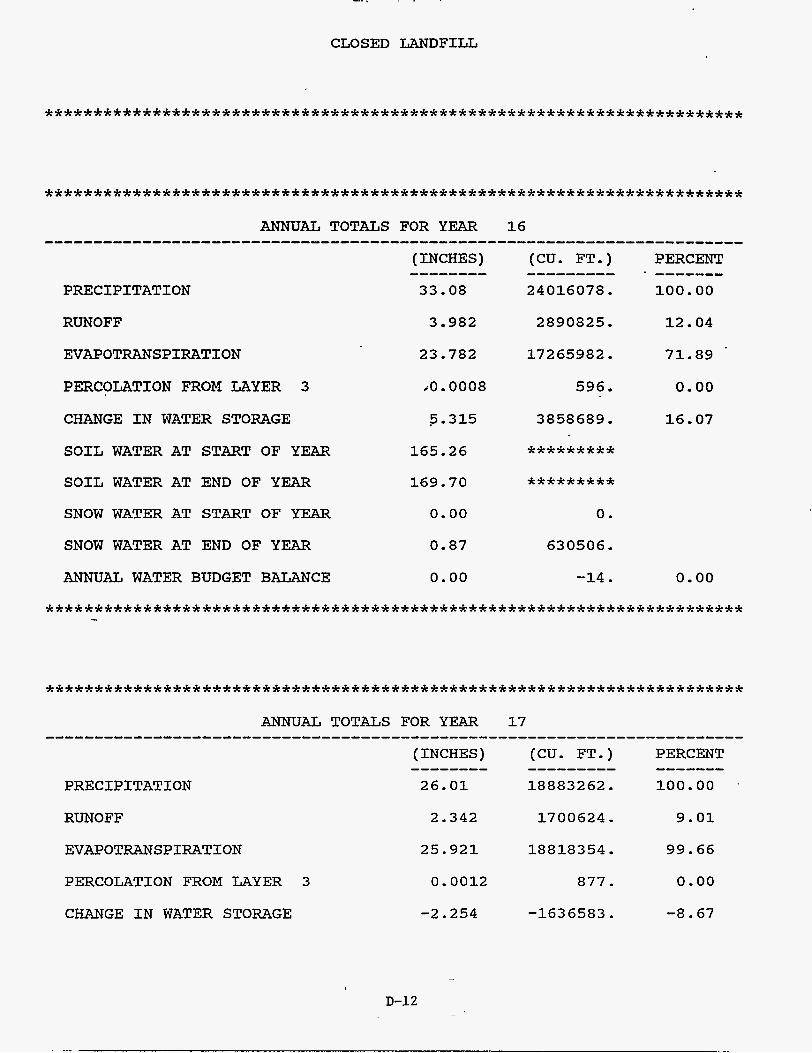
. ..-. . . .
CLOSED LANDFILL
. . . . . . . . . . . . . . . . . . . . . . . . . . . . . . . . . . . . . . . . . . . . . . . . . . . . . . . . . . . . . . . . . . . . . . .
. . . . . . . . . . . . . . . . . . . . . . . . . . . . . . . . . . . . . . . . . . . . . . . . . . . . . . . . . . . . . . . . . . . . . . .
PRECIPITATION
RUNOFF
EVAPOTRANSPIRATION
PERCOLATION FROM LAYER 3
3 982 2890825. 12.04
23.782 17265982. 71.89
c0.0008 596. 0.00
CHANGE IN WATER STORAGE 5.315 3858689. 16 . 07 SOIL WATER AT START OF YEAR 165.26 ********* SOIL WATER AT END OF YEAR 169.70 ********* SNOW WATER AT START OF YEAR 0.00 0.
SNOW WATER AT END OF YEAR 0.87 630506.
ANNUAL WATER BUDGET BALANCE 0.00 -14. 0.00
. . . . . . . . . . . . . . . . . . . . . . . . . . . . . . . . . . . . . . . . . . . . . . . . . . . . . . . . . . . . . . . . . . . . . . . -
. . . . . . . . . . . . . . . . . . . . . . . . . . . . . . . . . . . . . . . . . . . . . . . . . . . . . . . . . . . . . . . . . . . . . . .
RUNOFF 2.342 1700624. 9.01
EVAPOTRANSPIRATION 25.921 18818354 . 99.66
PERCOLATION FROM LAYER 3 0.0012 877. 0-00
CHANGE IN WATER STORAGE -2.254 -1636583. -8.67

. ... - ...... . _...,. . . . . 1 ,
. CLOSED LANDFILL
SOIL WATER AT START OF YEAR 169.70 ********* SOIL WATER AT END OF YEAR 168 . 03 ********* SNOW WATER AT START OF YEAR 0.87 630506.
SNOW WATER AT END OF YEAR 0.29 212933.
ANNUAL WATER BUDGET BALANCE 0.00 -11 . 0.00
. . . . . . . . . . . . . . . . . . . . . . . . . . . . . . . . . . . . . . . . . . . . . . . . . . . . . . . . . . . . . . . . . . . . . . .
. . . . . . . . . . . . . . . . . . . . . . . . . . . . . . . . . . . . . . . . . . . . . . . . . . . . . . . . . . . . . . . . . . . . . . .
RUNOFF 0.426 309446. 1.26
EVAPOTRANSPIRATION 31.968 23208870. 94.25
PERCOLATION FROM LAYER 3 0.0017 1199. 0.00
CHANGE IN WATER STORAGE 1.524 1106395. 4.49
SOIL WATER AT START OF YEAR 168.03 ********* SOIL WATER AT END OF YEAR 169.47 ********* SNOW WATER AT START OF YEAR 0.29 212933.
SNOW WATER AT END OF YEAR 0.38 273433.
ANNUAL WATER BUDGET BALANCE 0.00 17. 0.00
. . . . . . . . . . . . . . . . . . . . . . . . . . . . . . . . . . . . . . . . . . . . . . . . . . . . . . . . . . . . . . . . . . . . . . .
D-13
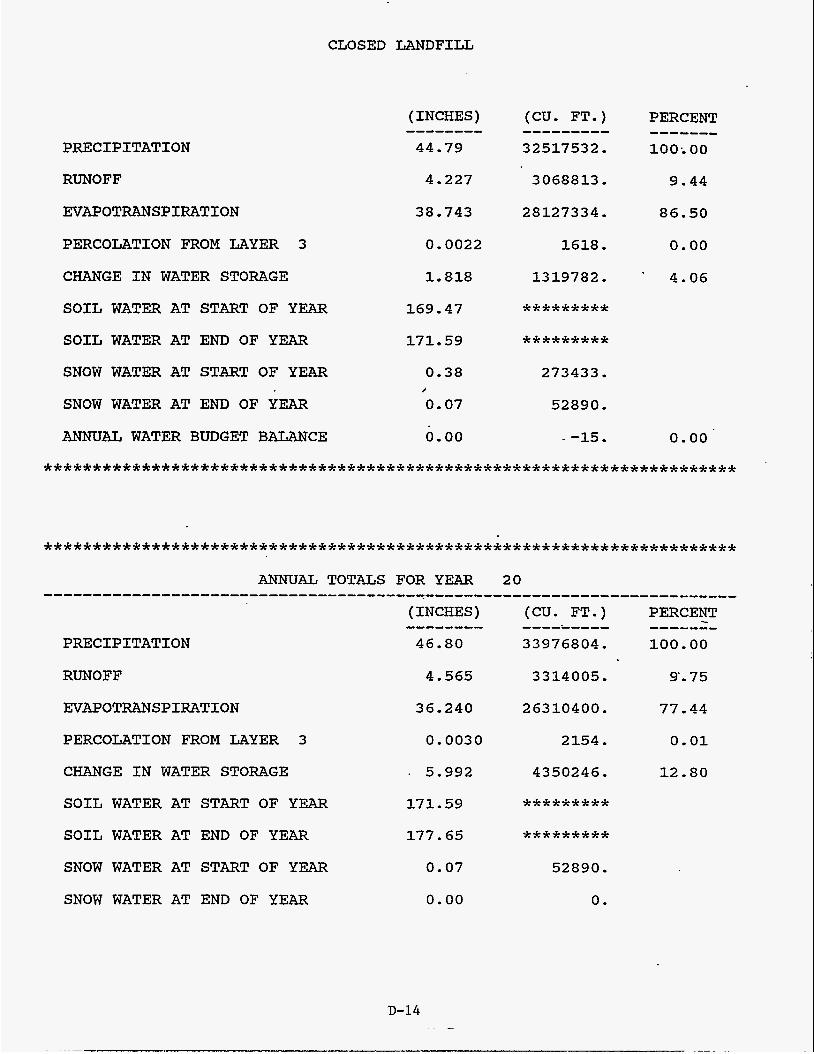
CLOSED LANDFILL
PRECIPITATION
RUNOFF 4.227 3068813 . 9.44
EVAPOTRANSPIRATION 38 . 743 28127334. 86.50
PERCOLATION FROM LAYER 3 0.0022 1618. 0.00
CHANGE IN WATER STORAGE 1.818 1319782. . 4.06
SOIL WATER AT START OF YEAR 169.47 ********* SOIL WATER AT END OF YEAR 171.59 ********* SNOW WATER AT START OF YEAR 0.38 273433.
SNOW WATER AT END OF YEAR 0.07 52890.
ANNUAL WATER BUDGET BALANCE 0.00 - -15. 0.00
c
. . . . . . . . . . . . . . . . . . . . . . . . . . . . . . . . . . . . . . . . . . . . . . . . . . . . . . . . . . . . . . . . . . . . . . .
. . . . . . . . . . . . . . . . . . . . . . . . . . . . . . . . . . . . . . . . . . . . . . . . . . . . . . . . . . . . . . . . . . . . . . . ANNUAL TOTALS FOR YEAR 20 .......................................................................
PERCENT (CU. FT.) - ------- (INCHES) -------- --------- PRECIPITATION 46.80 33976804. 100.00
RUNOFF
EVAPOTRANSPIRATION
PERCOLATION FROM LAYER 3
CHANGE IN WATER STORAGE
SOIL WATER AT START OF YEAR
SOIL WATER AT END OF YEAR
SNOW WATER AT START OF YEAR
SNOW WATER AT END OF YEAR
4.565
36.240
0.0030
. 5.992
171.59
177.65
0.07
0.00
3314005. 9’. 75
26310400 . 77.44
2154. 0.01
4350246. 12.80
********* *********
52890.
0.
D-14
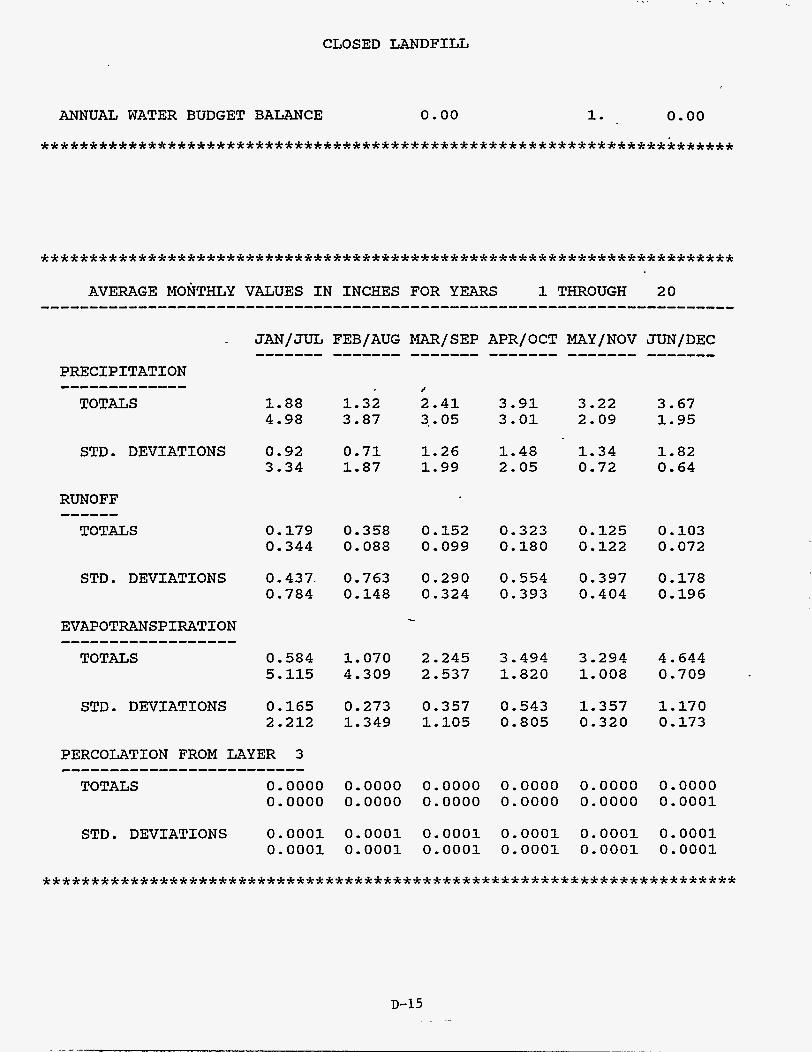
CLOSED LANDFILL
ANNUAL WATER BUDGET BALANCE 0.00 1. 0.00
. . . . . . . . . . . . . . . . . . . . . . . . . . . . . . . . . . . . . . . . . . . . . . . . . . . . . . . . . . . . . . . . . . . . . . .
. . . . . . . . . . . . . . . . . . . . . . . . . . . . . . . . . . . . . . . . . . . . . . . . . . . . . . . . . . . . . . . . . . . . . . . AVERAGE MONTHLY VALUES IN INCHES FOR YEARS 1 THROUGH 20
PRECIPITATION ------------- TOTALS
/
2.41 3. . 05 1.88
4.98 1.32 3.87
3.91 3.01
3.22 2.09
3.67 1.95
0.71 1.87
1.48 1-34 2.05 0.72
STD . DEVIATIONS 0.92 3.34
1.26 1.99
1.82 0.64
RUNOFF ------ TOTALS 0.179 0.358 0.152
0.344 0.088 0.099 0.323 0.180
0.125 0.122
0.103 0.072
STD. DEVIATIONS 0.437. 0.784
0.763 0.290 0.148 0.324
0.554 0.393
0.397 0.404
0.178 0.196
EVAPOTRANSPIRATION
0.584 5.115
1.070 2.245 4.309 2.537
3.494 1.820
3.294 1,008
4 . 644 0.709
STD. DEVIATIONS 0.165 2.212
0.273 0.357 1.349 1.105
0 . 543 0.805
1,357 0.320
1.170 0 . 173
0.0000 0.0000 0.0000 0.0000 0.0000 0.0000 0.0000 0.0000 0.0000 0.0001
STD. DEVIATIONS 0.0001 0.0001
0.0001 0.0001 0.0001 0.0001 0.0001 0.0001 0.0001 0.0001 0.0001 0.0001
D-15
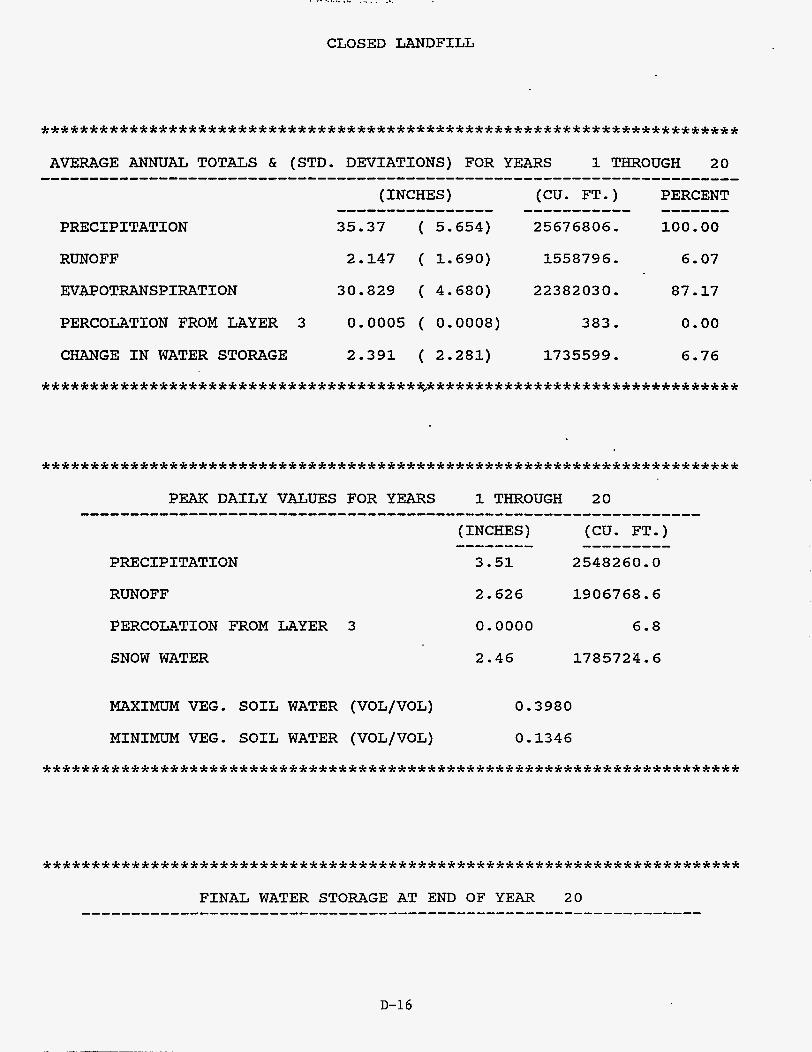
. .. ...... ... ... . . .._
CLOSED LANDFILL
PRECIPITATION
RUNOFF
EVAPOTRANSPIRATION
PERCOLATION FROM LAYER 3
CHANGE IN WATER STORAGE
2,147 ( 1,690)
30.829 ( 4.680)
0.0005 ( 0.0008)
2,391 ( 2.281)
1558796.
22382030.
383 ,
1735599.
6.07
87.17
0.00
6,76
PEAK DAILY VALUES FOR YEARS 1 THROUGH 20
PRECIPITATION
RUNOFF
PERCOLATION FROM LAYER 3
SNOW WATER
2.626
0.0000
2.46
1906768 , 6
6.8
1785724 . 6
MAXIMUM VEG. SOIL WATER (VOL/VOL) 0.3980
MINIMUM VEG. SOIL WATER (VOL/VOL) 0,1346
. . . . . . . . . . . . . . . . . . . . . . . . . . . . . . . . . . . . . . . . . . . . . . . . . . . . . . . . . . . . . . . . . . . . . . .
. . . . . . . . . . . . . . . . . . . . . . . . . . . . . . . . . . . . . . . . . . . . . . . . . . . . . . . . . . . . . . . . . . . . . . .
D-16

CLOSED LANDFILL
2
3
SNOW WATER
10 . 32 157.83
0.00
(VOL/VOL)
0.3961
0.4300
0.3288
. . . . . . . . . . . . . . . . . . . . . . . . . . . . . . . . . . . . . . . . . . . . . . . . . . . . . . . . . . . . . . . . . . . . . . . . . . . . . . . . . . . . . . . . . . . . . . . . . . . . . . . . . . . . . . . . . . . . . . . . . . . . . . . . . . . . . . . . . . . . . .
c
D-17

APPENDIX E MULTIMED Model Results-Closed Landfill

CLOSED LANDFILL
1
U.S. E N V I R O N M E N T A L P R O T E C T I O N A G E N C Y
E X P O S U R E A S S E S S M E N T
M U L T I M E D I A M O D E L
MULTIMED (Version 1.01, June 1991)
i ’!
Page 1
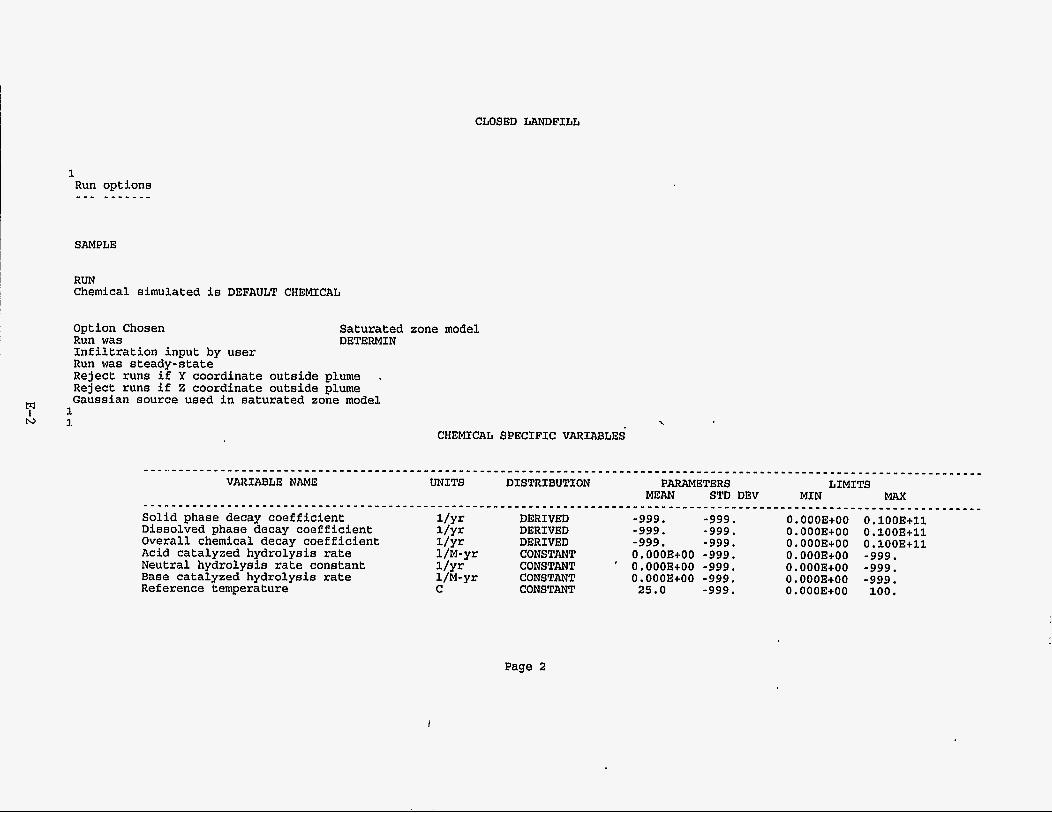
M I N
CLOSED LANDFILL
1 Run options ..-- - - - - - - -
SAMPLE
RUN Chemical simulated is DEFAULT CHEMICAL
Saturated zone model DETERMIN
Option Chosen Run was Infiltration input by user Run was steady-state Reject runs if Y coordinate outside plume . Reject runs if 2 coordinate outside plume Gaussian source used in saturated zone model 1 3.
CHEMICAL SPECIFIC VARIABLES
___ . .___ - -_____- - - -______________________- - - - - - - - - - - - - - - - - - - - - - - - - - - - - - - - - - - - - - - - - - - - - - - - - - - - - - - - - - - - - - - - - - - - - - - - - - - - - - - - PARAMETERS LIMITS VARIABLE NAME UNITS DISTRIBUTION
MEAN STD DEV MIN MAX . . . . . . . . . . . . . . . . . . . . . . . . . . . . . . . . . . . . . . . . . . . . . . . . . . . . . . . . . . . . . . . . . . . . . . . . . . . . . . . . . . . . . . . . . . . . . . . . . . . . . . . . . . . . . . . . . . . . . . . . Solid phase decay coefficient l/yr DERIVED -999. -999. 0.000E+00 O.lOOE+ll Dissolved phase decay coefficient l / Y r DERIVED -999. -999. O.OOOE+OO O.lOOE+ll Overall chemical decay coefficient l/yr DERIVED -999. -999. O.OOOE+OO O.lOOE+ll Acid catalyzed hydrolysis rate l/M-yr
Reference temperature C CONSTANT 25.0 -999. O.OOOE+OO 100.
CONSTANT O.OOOE+OO -999. 0.000E+00 -999. Neutral hydrolysis rate constant l/yr CONSTANT ' 0.000Et00 -999. O.OOOE+OO -999. Base catalyzed hydrolysis rate l/M-yr CONSTANT O.OOOE+OO -999. O.OOOE+OO -999.
Page 2

1
1
Normalized distribution coefficiellt Distribution coefficient Biodegradation coefficient (sat. zone) Air diffusion coefficient Reference temperature for air diffusion Molecular weight Mole fraction of solute Vapor pressure of solute Henry's law constant Overall 1st order decay sat. zone Not currently used Not currently used
at
CLOSED LANDFILL
CONSTANT CONSTANT CONSTANT CONSTANT CONSTANT CONSTANT CONSTANT CONSTANT CONSTANT DERIVED CONSTANT CONSTANT
SOURCE SPECIFIC VARIABLES
0.000E+00 -999. 0.000E+00 -999. 0.000E+00 -999. O.OOOE+OO -999. 0.000Et00 -999. O.OOOE+OO -999. O.OOOE+OO -999. O.OOOE+OO -999. 0.000E+00 -999. 0.000E+00 0.000E+00 -999. -999. -999. -999.
O.OOOE+OO O.OOOE+OO O.OOOE+OO O.OOOE+OO O.OOOE+OO 0.000E+00
0.000E+00
O.OOOE+OO O.OOOE+OO O.OOOE+OO
0.100E-08
0.100E-09
-999. 0.100E+ll -999. 10.0 100. -999. 1.00 100. 1.00 1.00 1.00 1.00
VARIABLE NAME UNITS
_.. . ._---_________________________________------- Infiltration rate m/yr Area of waste disposal unit Duration of pulse I yr Spread of contaminant source m Recharge rate m / w Source decay constant l/yr Initial concentration at landfill mg/l Length scale of facility m Width scale of facility m Near field dilution
m"2
DISTRIBUTION
. . - - - - - - - - - - - * - - - - - CONSTANT CONSTANT CONSTANT DERIVED CONSTANT CONSTANT CONSTANT DER 1 V E D DERIVED DERIVED
PARAMETERS LIMITS MEAN STD DEV MIN MAX
0.760E-04 -999. 0.100E-09 0.100E+11 , 0.80OE+06 -999. 0.100E-01 -999. -999. -999. 0.100E-08 -999. -999. -999 0.100E-08 O.lOOE+ll
O.OOOE+OO -999. O.OOOE+OO -999. 1.00 -999. 0,00OE+00 -999 -999. -999. 0.100E-08 O.lOOE+ll -999. -999. 0.100E-08 0.100E+11
. . . . . . . . . . . . . . . . . . . . . . . . . . . . . . . . . . . . . . . . . . . . . . . . .
0.122 -999. 0.000E+00 0.100Etll
1.00 0.000E+00 0.000E+00 1.00
- - - - - -
AQUIFER SPECIFIC VARIABLES
Page 3
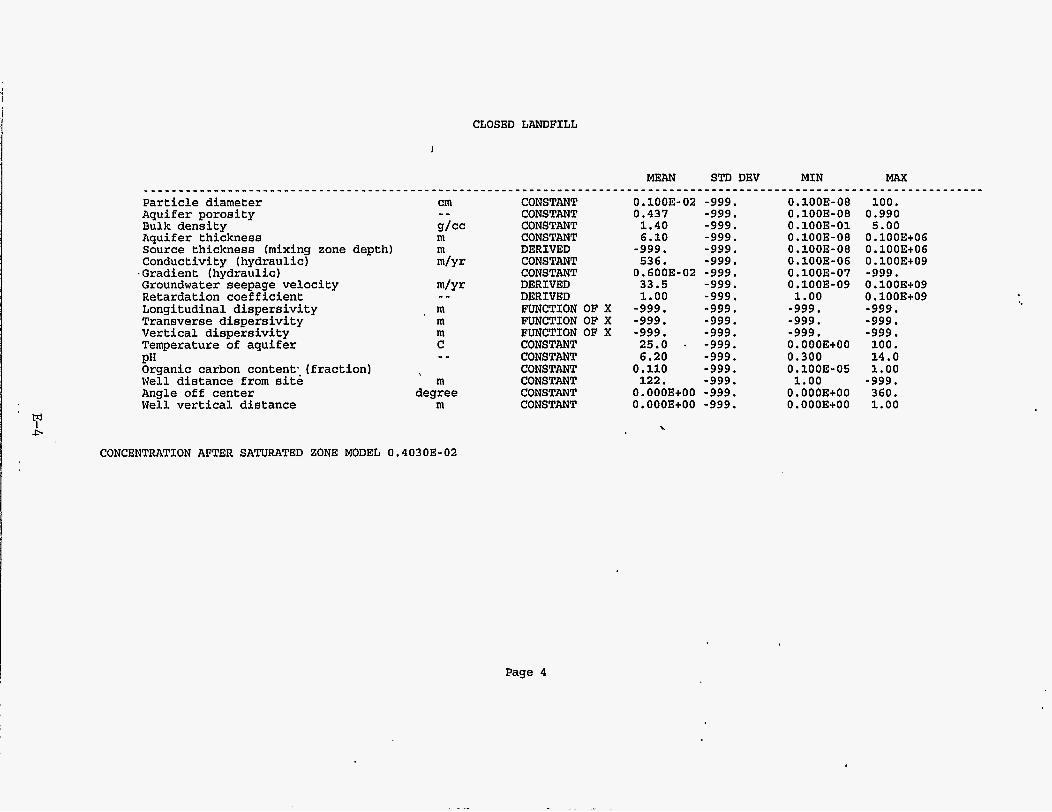
CLOSED LANDFILL
I
Particle diameter Aquifer porosity Bulk density Aquifer thickness Source thickness (mixing zone depth) Conductivity (hydraulic) .Gradient (hydraulic) Groundwater seepage velocity Retardation coefficient Longitudinal dispersivity Transverse dispersivity Vertical dispersivity Temperature of aquifer
Organic carbon content: (fraction) Well distance from site Angle off center Well vertical distance
P*
CONSTANT CONSTANT CONSTANT CONSTANT DERIVED CONSTANT CONSTANT DERIVED DER I V E D FUNCTION OF X FUNCTION OF X FUNCTION OF X CONSTANT CONSTANT CONSTANT CONSTANT CONSTANT CONSTANT
0.100E-02 -999. 0.437 -999. 1.40 -999. 6.10 -999. -999. -999. 536. -999. 0.600E-02 -999. 33.5 -999. 1.00 -999. -999. -999. -999. -999. -999. -999. 25.0 * -999. 6.20 -999. 0.110 -999. 122, -999.
O.OOOE+OO -999. O.OOOE+OO -999.
8
CONCENTRATION AFTER SATURATED ZONE MODEL 0,40303-02
0.100E-08 0.100E-08 0.100E-01 0.100E-08 0.100E-08 0.100E-06 0.100E-07 0.100E-09 1.00 -999. -999. -999. 0,00OE+00 0,300 0.100E-05 1.00 O.OOOE+OO O.OOOE+OO
100. 0.990 5.00 0.100E+06 0.100E+06 0.100E+O9 -999. Oa100E+09 0.100E+O9 -999. -999. -999. 100. 14.0 1.00 -999. 360. 1.00
Page 4