Design indicators for better accommodation environments in hospitals: Inpatients’ perceptions
17
Loughborough University Institutional Repository Design indicators for better accommodation environments in hospitals: inpatients’ perceptions This item was submitted to Loughborough University’s Institutional Repository by the/an author. Citation: ZHAO, Y. and MOURSHED, M., 2012. Design indicators for better accommodation environments in hospitals: inpatients’ perceptions. Intelligent Buildings International, 4 (4), pp. 199-215. Additional Information: • This is an Author’s Accepted Manuscript of an article published in Intelli- gent Buildings International, 2012, [ c Taylor & Francis], available online at: http://www.tandfonline.com/doi/abs/10.1080/17508975.2012.701186 Metadata Record: https://dspace.lboro.ac.uk/2134/9876 Version: Accepted for publication Publisher: c Taylor and Francis Please cite the published version.
Transcript of Design indicators for better accommodation environments in hospitals: Inpatients’ perceptions
Loughborough UniversityInstitutional Repository
Design indicators forbetter accommodation
environments in hospitals:inpatients’ perceptions
This item was submitted to Loughborough University’s Institutional Repositoryby the/an author.
Citation: ZHAO, Y. and MOURSHED, M., 2012. Design indicators for betteraccommodation environments in hospitals: inpatients’ perceptions. IntelligentBuildings International, 4 (4), pp. 199-215.
Additional Information:
• This is an Author’s Accepted Manuscript of an article published in Intelli-gent Buildings International, 2012, [ c© Taylor & Francis], available onlineat: http://www.tandfonline.com/doi/abs/10.1080/17508975.2012.701186
Metadata Record: https://dspace.lboro.ac.uk/2134/9876
Version: Accepted for publication
Publisher: c© Taylor and Francis
Please cite the published version.
This item was submitted to Loughborough’s Institutional Repository (https://dspace.lboro.ac.uk/) by the author and is made available under the
following Creative Commons Licence conditions.
For the full text of this licence, please go to: http://creativecommons.org/licenses/by-nc-nd/2.5/
1
Design indicators for better accommodation environments in hospitals: Inpatients’ perceptions
Yisong Zhao, Monjur Mourshed* Building Energy Research Group, School of Civil and Building Engineering
Loughborough University, Loughborough, Leicestershire LE11 3TU
Abstract
Several studies have found an association between the physical environment and human health and wellbeing that resulted in the postulation of the idea of evidence-based and patient-centred design of healthcare facilities. The key challenge is that most of the underpinning research for the evidence base is context specific, the use of which in building design is complex, mainly because of the difficulties associated with the disaggregation of findings from the context. On the other hand, integrating patients’ perspectives requires an understanding of the relative importance of design indicators, which the existing evidence base lacks to a large extent. This research was aimed at overcoming these limitations by investigating users’ perception of the importance of key design indicators in enhancing their accommodation environments in hospitals. A 19-item structured questionnaire was used to gather inpatients' views on a 5-point scale, in two Chinese hospitals. A principal component analysis (PCA) resulted in five constructed dimensions with appropriate reliability and validity (Cronbach’s alpha=0.888). The item, design for cleanliness, was ranked as most important, closely followed by environmental and safety design indicators. The item, entertainment facilities, was ranked lowest. The indicator, pleasant exterior view had the second lowest mean score, followed by the item, ability to customise the space. Age, accommodation type and previous experience of hospitalisation accounted for statistically significant differences in perceptions of importance of various constructed design dimensions.
Keywords: Healthcare design, design indicator, evidence-based design, users’ needs
1 Introduction
Healthcare expenditures represent a significant share of a nation’s gross domestic product (GDP). For example, overall healthcare spending in the United States in 2009 was close to US$ 2.5 trillion and accounted for 17.6% of GDP, 31% of which was spent on hospital care (CMS, 2011). The figure in 2008 was 16.0%, 11.2%, 8.7% and 8.1% for the United States, France, United Kingdom and Japan, respectively (OECD, 2010). It is projected that healthcare spending will continue to rise and will outpace the growth in the general economy of some countries (Belohlav et al., 2010). Greater budgetary pressure, ageing population and increased expectations of quality of care call for a rethinking in the way care is delivered. Physical environments comprising buildings and ancillary facilities, in which care takes place, are a major part of this healthcare regeneration process.
Research has found strong association between human health and wellbeing and the physical environment, in which a person lives or receives treatment (Chu et al., 2004; Devlin and Arneill, 2003; Diez Roux, 2001; Dijkstra et al., 2006; Douglas and Douglas, 2005; Fottler et al., 2000; Ulrich et al., 2008; Whitehouse et al., 2001). It is generally acknowledged that patients’ accommodation should provide a safe environment where they spend most of their time during their stay in a hospital. An increasing body of research on accommodation environment sought to enhance patients’ experience and the delivery of care. This includes but not limited to, the explorations of relationships between healthcare design and patient safety (Birnbach et al., 2010; Clarkson et al., 2004; Joseph and Rashid,
* Corresponding author. Email: [email protected] Web: http://monjur.mourshed.org/
2
2007; Reiling et al., 2004) and adverse effects of the physical environment on various healthcare indicators. Such indicators included: job satisfaction (Tyson et al., 2002), staff turnover (Aiken et al., 2008; Applebaum et al., 2010), patient satisfaction (Douglas and Douglas, 2005; Stern et al., 2003) and patient privacy and dignity (Thrall, 2005). A well-designed, well laid-out, spacious and well-decorated accommodation environment is considered to significantly benefit both patient wellbeing and staff performance (Lorenz, 2007; Mroczek et al., 2005; Pattison and Robertson, 1996).
The acknowledgement of this link by the wider community has resulted in the postulation of the idea of evidence-based and patient-centred design of healthcare facilities (Ulrich et al., 2008). The cornerstone of evidence-based design (EBD) is the evidence-base, which is generated from credible research in architecture, environmental psychology, neuroscience and behavioural economics. The key challenge for integrating EBD in the design and operation of healthcare buildings is that much of the underpinning research is contextual; i.e. related to the quality or effectiveness of care in a specific setting such as a hospital or a treatment. The applications of such findings in buildings are challenging, mainly because of the difficulty in disaggregating the findings from the contexts of care or physical setting. In addition, the effects of the physical environment in the existing evidence base are hidden behind various physical, physiological and psychological variables, which need to be translated to design indicators or variables before using for decision-making. Such translations are not always straightforward and not without the loss of semantics and utility.
On the other hand, the patient-centred approach of care delivery requires that patients’ perspectives are considered in all aspects of care - from care planning and treatment (Robinson and Thomson, 2001) to the design and operation of buildings (Smith et al., 1995). This is partly because of the role physical environments play on patient healing outcomes and partly because of the market oriented nature of the healthcare sector where organisations are now in a position to attract patients, resulting in a much greater emphasis on the provision of patient-centred care (Stern et al., 2003) and architectural design of the facilities (Reiling, 2006). Patients’ perception and feedback about the physical environment include what they think are important to them, what matters to them and what supports their healthcare experience. Such source of information is very important in screening for problems and in developing an effective plan of action for quality improvement in healthcare organisations (Stern et al., 2003). Patients’ participation also provides meaningful information for healthcare designers and architects to go beyond their own limited experience with the built environment of a particular healthcare facility. They can accordingly make an effort to shape and/or reshape the healing environment to realise the desired outcomes of perceived service quality (Fottler et al., 2000).
The pre-condition for the patient-centred design and operation of healthcare buildings is that patients’ perception of the importance of various design indicators are captured in a usable format. In most countries, patients’ views are collected using quality of care questionnaires and are often linked to a care or treatment they received beforehand. The physical design of healthcare environments is recognised as important (Hutton and Richardson, 1995) in these evaluations but often only a few dimensions, if any, related to physical environments are considered. Patients’ perceptions of physical environment dimensions relevant to the design and operation of buildings are thus less explored in the existing literature.
Recognising the above gaps, this research was aimed at investigating patients’ expectations in the building design process and their perception of the relative importance of design indicators. A 19-item structured questionnaire was conducted among inpatients in two hospitals in Qingdao, China. In terms of the user group, hospital inpatients were considered in this research. This is because of the fact that there is a greater impact of the physical environment on inpatients’ health and wellbeing than other patient groups such as outpatients who experience the healthcare environment occasionally. In addition, the number of admission episodes is significant in most countries. For example, between July 2010 and June 2011, there were 14.8 million finished admission episodes (FAEs) in the UK, of which 5.3 million were emergency admissions (HES, 2011). The surveyed hospitals in Qingdao had more than 100,000 inpatients admitted during 2009, the year in which the reported survey took place.
3
Hospital design has traditionally focused on the needs of staff and care providers, accommodating little needs of patients (Sweeney, 2008). The other objective was, therefore, to develop an inpatient questionnaire that could reliably and validly assess and represent inpatients’ expectations in the building design process.
The rest of the paper is organised as follows. The methods applied in this paper for the development of the instrument and survey administration are discussed. Descriptive and statistical analyses of the obtained data are discussed next, followed by a contextual discussion. The article ends with a discussion on the limitations of this research, future directions and concluding remarks.
2 Methodology
2.1 Questionnaire development
The development of the questionnaire was based on an extensive review of literature. The review was conducted on the aspects related to: the design of patient accommodation environments; patients’ opinions on physical environments in quality of care surveys; and the research on environmental psychology that looked at the relationship between physical environment and patient health and wellbeing, in particular patient outcomes. Keyword searches were conducted on the following databases: Pubmed, ScienceDirect, Web of Science, Scopus, Ovid MEDLINE, the Cochraine Library and Design and Applied Arts Index. This enabled the first-step filtering of literature, which were refined further with keyword searches that were related to the scope and methods; e.g. inpatient accommodation, questionnaire, survey, physical environment, perception, opinion and perspective. Non-electronic sources were also consulted to identify potential sources for inclusion in the review. The filtered sources, from both electronic and non-electronic, were first categorised based on their adopted methods and findings. Relevant design indicators were identified from this systematic review of literature.
Nine inpatients were interviewed to explore their general perception of the accommodation environment in one of the participating hospitals. A focus group (one-hour session) involving two inpatients, two care providers (nursing staff) and one administrative staff was conducted. In both the focus group and interviews, the objective was to compare the findings of the literature review with participants’ perception of the impact of the accommodation environment on patient health and wellbeing. Finally, a draft questionnaire was designed based on the identified design factors from the extensive literature review and consultations with patients and staff.
The draft questionnaire was then piloted among 18 inpatients to analyse the appropriateness and comprehension of the items and testify the validity of the questions. Participants were asked to complete the questionnaires and give comments on any deficiencies of the content of the questionnaire, other potential sources of perceptions and significance of each item. The pilot study resulted in the final questionnaire with improved content validity.
The final structure of the questionnaire included 19 questions to rate the importance of design indicators for the accommodation environment. Respondents were asked to rate their perception of an item on a Likert type response balanced scale, ranging from 1 to 5 (1 = Least important, 2 = Unimportant, 3 = Neither important nor unimportant, 4 = Important, and 5 = Most Important), a higher score indicating a higher level of perception of the importance of the item. Demographic variables such as age, gender and inpatient status were requested from the participants. Data regarding admission times and familiarity of the environment were also recorded. Design factors that were translated into 19 questions are given in Table 1, along with brief descriptions of their impacts and sources.
2.2 Ethical consideration
A two-stage ethical approval was obtained for this study. First, an ethical approval was obtained from the UK academic institution where the authors were based. Second, the research committees of the two participating hospitals gave approval to the study.
4
Table 1: Design factors, their description and key sources.
Design factor Impact Ability to customise the space
Space has been suggested as more than static passive vessel for actions to take place; its characteristics impose limitations (e.g. degrees of privacy) whilst also facilitating interactions (González-Santos, 2011).
Adequate illumination Adequate illumination, artificial and natural lighting combined, is required to perform visual tasks and for patient safety (Shikder et al., 2011).
Adequate sitting area for visitors
Involvement or interaction with family during a patient’s hospitalisation can affect patient outcomes (Powers and Rubenstein, 1999); hence the need for adequate sitting area for visitors.
Availability of natural light
Light, especially daylight impacts on visual performance and psychological state of a person by regulating the circadian rhythm, which has impacts on patient outcomes (Ulrich, 1984).
A thermally comfortable environment
A thermally comfortable environment helps maintain normothermia and decrease patient anxiety (Wagnmer et al., 2006).
Cleanliness The design of the building and constituent spaces are linked with cleanliness (PwC, 2004). Surface characteristics affect infection control (Dancer, 2011).
Entertainment facilities Supplement of entertainment facilities will help to build a patient-centred environment that increases patient satisfaction (Schweitzer et al., 2004).
En-suite bathroom En-suite bathroom is better for privacy (van de Glind et al., 2007), hygiene (Tyson et al., 2002), as well as for better isolation and lower infection risk (Panagea et al., 2005).
Location and orientation of the room
Poor location and orientation of the room may result in a poor way-finding system and may contribute to increased patient stress and dissatisfaction (Zimring, 1990).
Measures to prevent patient falls
Environmental and organisational factors have links with patient falls (Hernandez and Miller, 1986).
Noise The level of ambient noise has strong links with patient outcomes. High levels of noise have been found to hinder patients’ recovery and influence their physical and psychological health (Wiese and Wang, 2011).
Number of patients in a room
Roommate assignment can affect patient anxiety and stress (Chaudhury et al., 2005).
Pleasant exterior view Views to the outside are manifested as positive emotional and physiological changes leading to stress reduction or restorative benefits (Ulrich, 1984).
Privacy from other patients and staff
Patient privacy is an essential guiding principle of the staff-patient relationship (Flegel and Lant, 1998). If conversations are overheard, patients may perceive it to be a breach of privacy (Karro et al., 2005).
Proximity to nursing staff Closer proximity to nursing staff has impact on patient-provider communication (Johnson et al, 2004), which influence patients’ satisfaction.
Proximity to service delivery points
Proximity to nurses’ station is essential for patients’ safety and wellbeing as it saves nurses’ walking time. Long distance has a negative impact on nursing performance (PwC, 2004).
Proximity to social facilities
Studies have indicated that social support reduces stress and improves patient recovery outcome (Ulrich et al., 2004).
Spaciousness and furniture layout
Perception of spaciousness has effects on patient satisfaction and staff performance (O’Neil, 1994).
Unpleasant smell Defined as poor air quality and freshness, which may increase the risk of nosocomial infection (WHO, 2002).
2.3 Sampling and data collection
The study was conducted among inpatients admitted in two Chinese hospitals in Qingdao, a coastal city in East China. At the time of the survey, the two hospitals employed approximately 5900 staff and had around 4000 beds in total. One of the hospitals is affiliated with a medical college and the other one is the largest general hospital in the city. Due to their size, facilities, volume of staff and patients, the two participating hospitals can be considered as representative of Chinese public urban hospitals. Respondents were selected at random from different departments to participate in the survey. Some inpatients were excluded from participation because of their physical and psychological state resulting from the illness for which they were admitted in the hospital. All participants were over 18 years old and they were communicated in writing, through an introduction to the survey section, that this survey was voluntary and the confidentiality of the data would be maintained. In this section, the purpose of the questionnaire is clearly outlined and all participants were asked to answer the questions based on
5
their perception of general healthcare environment rather than the surveyed hospital they were staying at.
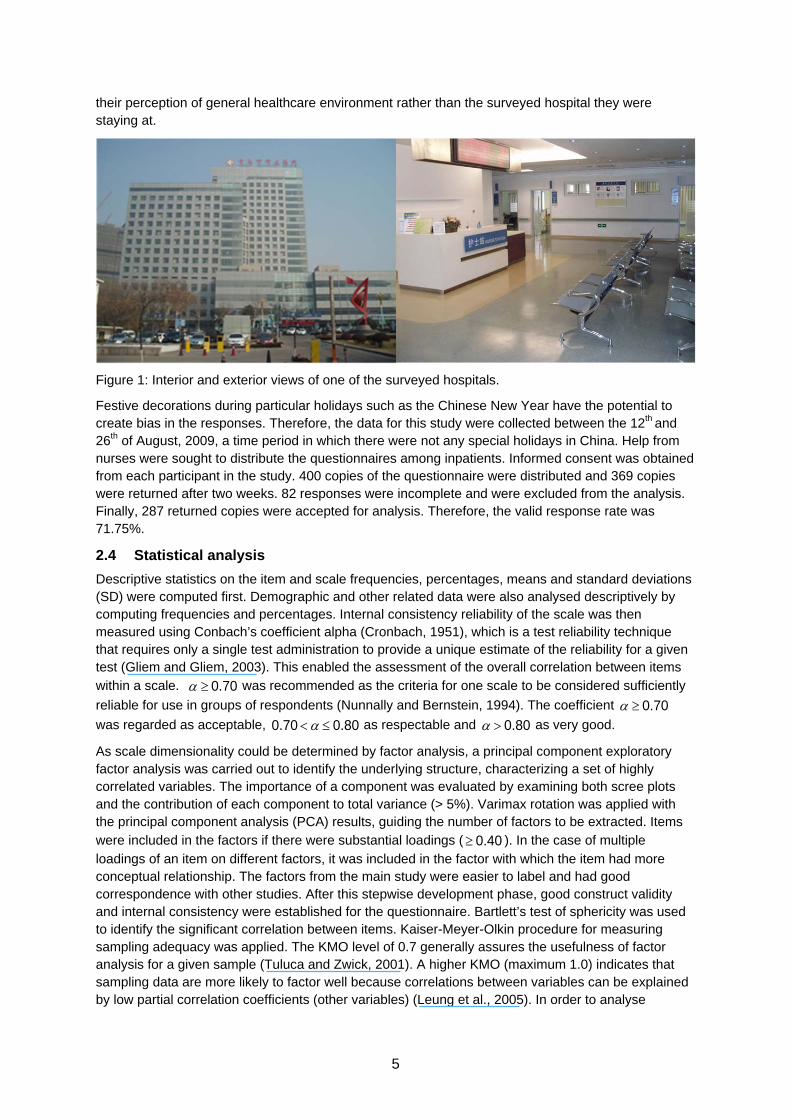
Figure 1: Interior and exterior views of one of the surveyed hospitals.
Festive decorations during particular holidays such as the Chinese New Year have the potential to create bias in the responses. Therefore, the data for this study were collected between the 12th and 26th of August, 2009, a time period in which there were not any special holidays in China. Help from nurses were sought to distribute the questionnaires among inpatients. Informed consent was obtained from each participant in the study. 400 copies of the questionnaire were distributed and 369 copies were returned after two weeks. 82 responses were incomplete and were excluded from the analysis. Finally, 287 returned copies were accepted for analysis. Therefore, the valid response rate was 71.75%.
2.4 Statistical analysis
Descriptive statistics on the item and scale frequencies, percentages, means and standard deviations (SD) were computed first. Demographic and other related data were also analysed descriptively by computing frequencies and percentages. Internal consistency reliability of the scale was then measured using Conbach’s coefficient alpha (Cronbach, 1951), which is a test reliability technique that requires only a single test administration to provide a unique estimate of the reliability for a given test (Gliem and Gliem, 2003). This enabled the assessment of the overall correlation between items within a scale. 0.70 was recommended as the criteria for one scale to be considered sufficiently
reliable for use in groups of respondents (Nunnally and Bernstein, 1994). The coefficient 0.70
was regarded as acceptable, 0.70 0.80 as respectable and 0.80 as very good.
As scale dimensionality could be determined by factor analysis, a principal component exploratory factor analysis was carried out to identify the underlying structure, characterizing a set of highly correlated variables. The importance of a component was evaluated by examining both scree plots and the contribution of each component to total variance (> 5%). Varimax rotation was applied with the principal component analysis (PCA) results, guiding the number of factors to be extracted. Items were included in the factors if there were substantial loadings ( 0.40 ). In the case of multiple
loadings of an item on different factors, it was included in the factor with which the item had more conceptual relationship. The factors from the main study were easier to label and had good correspondence with other studies. After this stepwise development phase, good construct validity and internal consistency were established for the questionnaire. Bartlett’s test of sphericity was used to identify the significant correlation between items. Kaiser-Meyer-Olkin procedure for measuring sampling adequacy was applied. The KMO level of 0.7 generally assures the usefulness of factor analysis for a given sample (Tuluca and Zwick, 2001). A higher KMO (maximum 1.0) indicates that sampling data are more likely to factor well because correlations between variables can be explained by low partial correlation coefficients (other variables) (Leung et al., 2005). In order to analyse
6
demographic effects and relationships among constructed dimensions, chi-square and non-parametric tests were employed. Statistically significant differences in perception based on gender, admission/patient type and the requirement of a chaperon were tested via Mann-Whitney U test. Kruskal-Wallis test with p 0.05 was used to analyse the differences between age groups (18-25,
26-35, 36-50 and >50 years), number of hospitalisation times (1-2, 3-4, 5-10, >10 times), number of wards previously stayed (0, 1, 2, 3 and >3) and number of visits to the hospital (1-2, 3-4, 5-10 and >10 times). Mann-Whitney U-test with a reduced p-value ( p 0.01) was used as a post hoc test to
avoid the risk of finding significant differences by chance (Bland and Altman, 1995). Statistical analyses have been performed with PASW Statistics version 18.0 for Windows (IBM, 2010).
3 Results and findings
3.1 Respondents’ characteristics
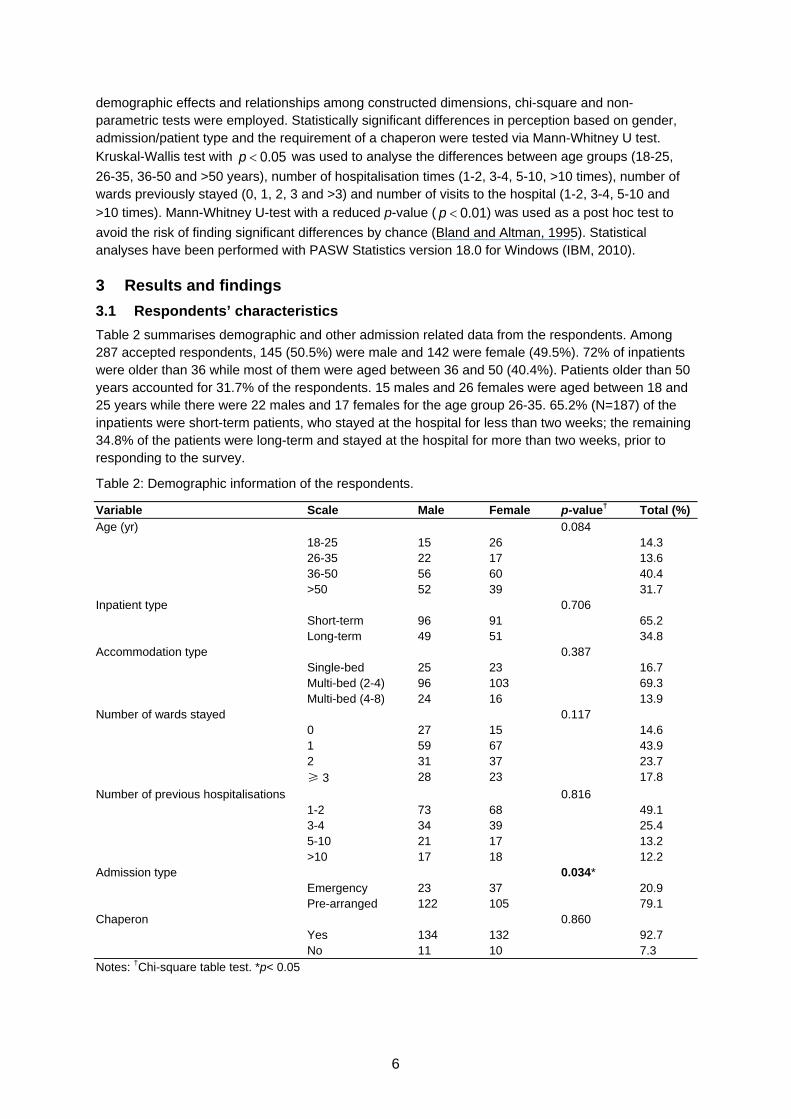
Table 2 summarises demographic and other admission related data from the respondents. Among 287 accepted respondents, 145 (50.5%) were male and 142 were female (49.5%). 72% of inpatients were older than 36 while most of them were aged between 36 and 50 (40.4%). Patients older than 50 years accounted for 31.7% of the respondents. 15 males and 26 females were aged between 18 and 25 years while there were 22 males and 17 females for the age group 26-35. 65.2% (N=187) of the inpatients were short-term patients, who stayed at the hospital for less than two weeks; the remaining 34.8% of the patients were long-term and stayed at the hospital for more than two weeks, prior to responding to the survey.
Table 2: Demographic information of the respondents.
Variable Scale Male Female p-value† Total (%)
Age (yr) 0.084 18-25 15 26 14.3 26-35 22 17 13.6 36-50 56 60 40.4 >50 52 39 31.7
Inpatient type 0.706 Short-term 96 91 65.2 Long-term 49 51 34.8
Accommodation type 0.387 Single-bed 25 23 16.7 Multi-bed (2-4) 96 103 69.3 Multi-bed (4-8) 24 16 13.9
Number of wards stayed 0.117 0 27 15 14.6 1 59 67 43.9 2 31 37 23.7 ≥ 3 28 23 17.8
Number of previous hospitalisations 0.816 1-2 73 68 49.1 3-4 34 39 25.4 5-10 21 17 13.2 >10 17 18 12.2
Admission type 0.034* Emergency 23 37 20.9 Pre-arranged 122 105 79.1
Chaperon 0.860 Yes 134 132 92.7 No 11 10 7.3
Notes: †Chi-square table test. *p< 0.05
7
69.3% of the patients (199) were staying in a multi-bed ward with a capacity of 2-4 persons. Single occupancy was at 16.7%, while 13.9% of the respondents stayed at multi-bed wards with a capacity of 4-8 persons. 14.6% of the respondents were first time inpatients; i.e. they did not stay at a different ward previously. Patients, who stayed at one or two different wards previously, accounted for 67.6% of the respondents. In contrast, 17.8% of the respondents had stayed in three or more wards in the hospitals prior to being at the surveyed ward. Nearly half of the respondents (49.1%) were hospitalised in the hospital only once or twice. 25.4% and 13.2% inpatients were hospitalised between 3-4 and 5-10 times respectively. 12.2% of the inpatients were quite familiar with the accommodation environment as they had been to the hospital for more than 10 times. Most of the inpatients (92.7%) welcomed chaperons during their stay at the hospital. Only 7.3% of the respondents said no to a chaperon. Majority of the admissions were pre-arranged at 79.1%, while 20.9% were emergency.
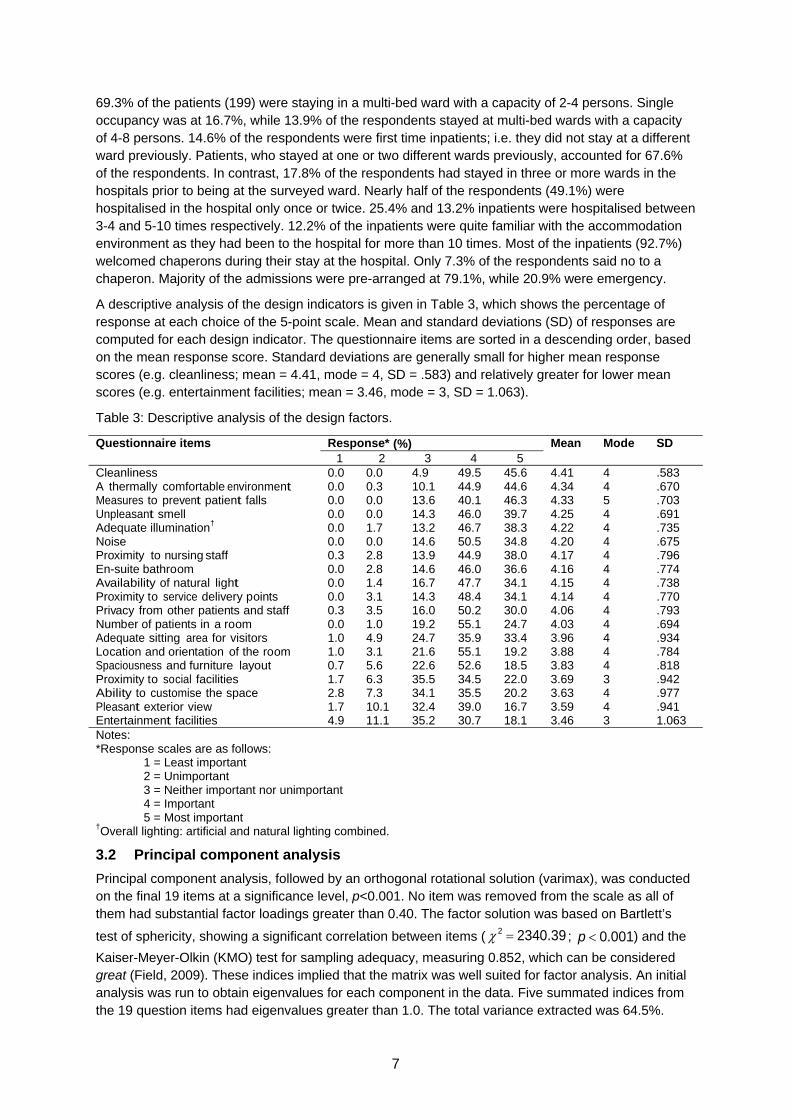
A descriptive analysis of the design indicators is given in Table 3, which shows the percentage of response at each choice of the 5-point scale. Mean and standard deviations (SD) of responses are computed for each design indicator. The questionnaire items are sorted in a descending order, based on the mean response score. Standard deviations are generally small for higher mean response scores (e.g. cleanliness; mean = 4.41, mode = 4, SD = .583) and relatively greater for lower mean scores (e.g. entertainment facilities; mean = 3.46, mode = 3, SD = 1.063).
Table 3: Descriptive analysis of the design factors.
Questionnaire items Response* (%) Mean Mode SD1 2 3 4 5
Cleanliness 0.0 0.0 4.9 49.5 45.6 4.41 4 .583A thermally comfortable environment 0.0 0.3 10.1 44.9 44.6 4.34 4 .670Measures to prevent patient falls 0.0 0.0 13.6 40.1 46.3 4.33 5 .703Unpleasant smell 0.0 0.0 14.3 46.0 39.7 4.25 4 .691Adequate illumination† 0.0 1.7 13.2 46.7 38.3 4.22 4 .735Noise 0.0 0.0 14.6 50.5 34.8 4.20 4 .675Proximity to nursing staff 0.3 2.8 13.9 44.9 38.0 4.17 4 .796En-suite bathroom 0.0 2.8 14.6 46.0 36.6 4.16 4 .774Availability of natural light 0.0 1.4 16.7 47.7 34.1 4.15 4 .738Proximity to service delivery points 0.0 3.1 14.3 48.4 34.1 4.14 4 .770Privacy from other patients and staff 0.3 3.5 16.0 50.2 30.0 4.06 4 .793Number of patients in a room 0.0 1.0 19.2 55.1 24.7 4.03 4 .694Adequate sitting area for visitors 1.0 4.9 24.7 35.9 33.4 3.96 4 .934Location and orientation of the room 1.0 3.1 21.6 55.1 19.2 3.88 4 .784Spaciousness and furniture layout 0.7 5.6 22.6 52.6 18.5 3.83 4 .818Proximity to social facilities 1.7 6.3 35.5 34.5 22.0 3.69 3 .942Ability to customise the space 2.8 7.3 34.1 35.5 20.2 3.63 4 .977Pleasant exterior view 1.7 10.1 32.4 39.0 16.7 3.59 4 .941Entertainment facilities 4.9 11.1 35.2 30.7 18.1 3.46 3 1.063Notes: *Response scales are as follows: 1 = Least important 2 = Unimportant 3 = Neither important nor unimportant 4 = Important 5 = Most important †Overall lighting: artificial and natural lighting combined.
3.2 Principal component analysis
Principal component analysis, followed by an orthogonal rotational solution (varimax), was conducted on the final 19 items at a significance level, p<0.001. No item was removed from the scale as all of them had substantial factor loadings greater than 0.40. The factor solution was based on Bartlett’s
test of sphericity, showing a significant correlation between items ( ; ) and the
Kaiser-Meyer-Olkin (KMO) test for sampling adequacy, measuring 0.852, which can be considered great (Field, 2009). These indices implied that the matrix was well suited for factor analysis. An initial analysis was run to obtain eigenvalues for each component in the data. Five summated indices from the 19 question items had eigenvalues greater than 1.0. The total variance extracted was 64.5%.
2 2340.39 p 0.001
8
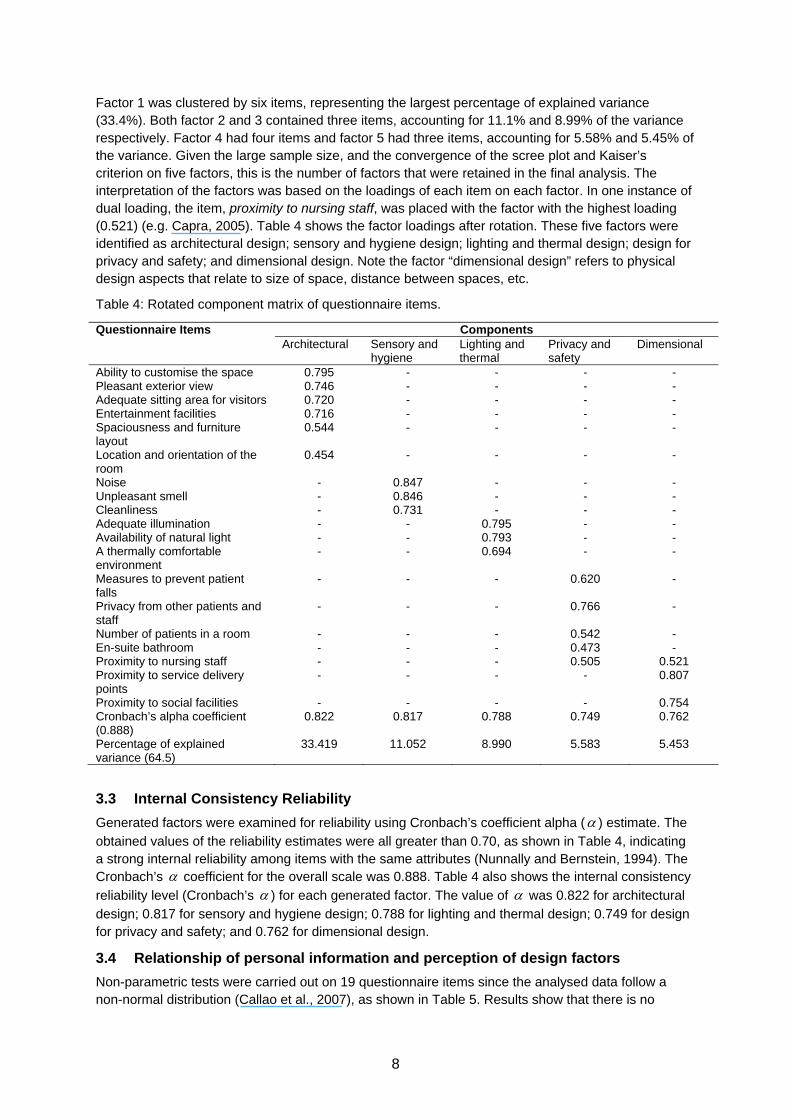
Factor 1 was clustered by six items, representing the largest percentage of explained variance (33.4%). Both factor 2 and 3 contained three items, accounting for 11.1% and 8.99% of the variance respectively. Factor 4 had four items and factor 5 had three items, accounting for 5.58% and 5.45% of the variance. Given the large sample size, and the convergence of the scree plot and Kaiser’s criterion on five factors, this is the number of factors that were retained in the final analysis. The interpretation of the factors was based on the loadings of each item on each factor. In one instance of dual loading, the item, proximity to nursing staff, was placed with the factor with the highest loading (0.521) (e.g. Capra, 2005). Table 4 shows the factor loadings after rotation. These five factors were identified as architectural design; sensory and hygiene design; lighting and thermal design; design for privacy and safety; and dimensional design. Note the factor “dimensional design” refers to physical design aspects that relate to size of space, distance between spaces, etc.
Table 4: Rotated component matrix of questionnaire items.
Questionnaire Items ComponentsArchitectural Sensory and
hygiene Lighting and thermal
Privacy and safety
Dimensional
Ability to customise the space 0.795 - - - -Pleasant exterior view 0.746 - - - -Adequate sitting area for visitors 0.720 - - - -Entertainment facilities 0.716 - - - -Spaciousness and furniture layout
0.544 - - - -
Location and orientation of the room
0.454 - - - -
Noise - 0.847 - - -Unpleasant smell - 0.846 - - -Cleanliness - 0.731 - - -Adequate illumination - - 0.795 - -Availability of natural light - - 0.793 - -A thermally comfortable environment
- - 0.694 - -
Measures to prevent patient falls
- - - 0.620 -
Privacy from other patients and staff
- - - 0.766 -
Number of patients in a room - - - 0.542 -En-suite bathroom - - - 0.473 -Proximity to nursing staff - - - 0.505 0.521Proximity to service delivery points
- - - - 0.807
Proximity to social facilities - - - - 0.754Cronbach’s alpha coefficient (0.888)
0.822 0.817 0.788 0.749 0.762
Percentage of explained variance (64.5)
33.419 11.052 8.990 5.583 5.453
3.3 Internal Consistency Reliability
Generated factors were examined for reliability using Cronbach’s coefficient alpha ( ) estimate. The
obtained values of the reliability estimates were all greater than 0.70, as shown in Table 4, indicating a strong internal reliability among items with the same attributes (Nunnally and Bernstein, 1994). The Cronbach’s coefficient for the overall scale was 0.888. Table 4 also shows the internal consistency
reliability level (Cronbach’s ) for each generated factor. The value of was 0.822 for architectural
design; 0.817 for sensory and hygiene design; 0.788 for lighting and thermal design; 0.749 for design for privacy and safety; and 0.762 for dimensional design.
3.4 Relationship of personal information and perception of design factors
Non-parametric tests were carried out on 19 questionnaire items since the analysed data follow a non-normal distribution (Callao et al., 2007), as shown in Table 5. Results show that there is no
9
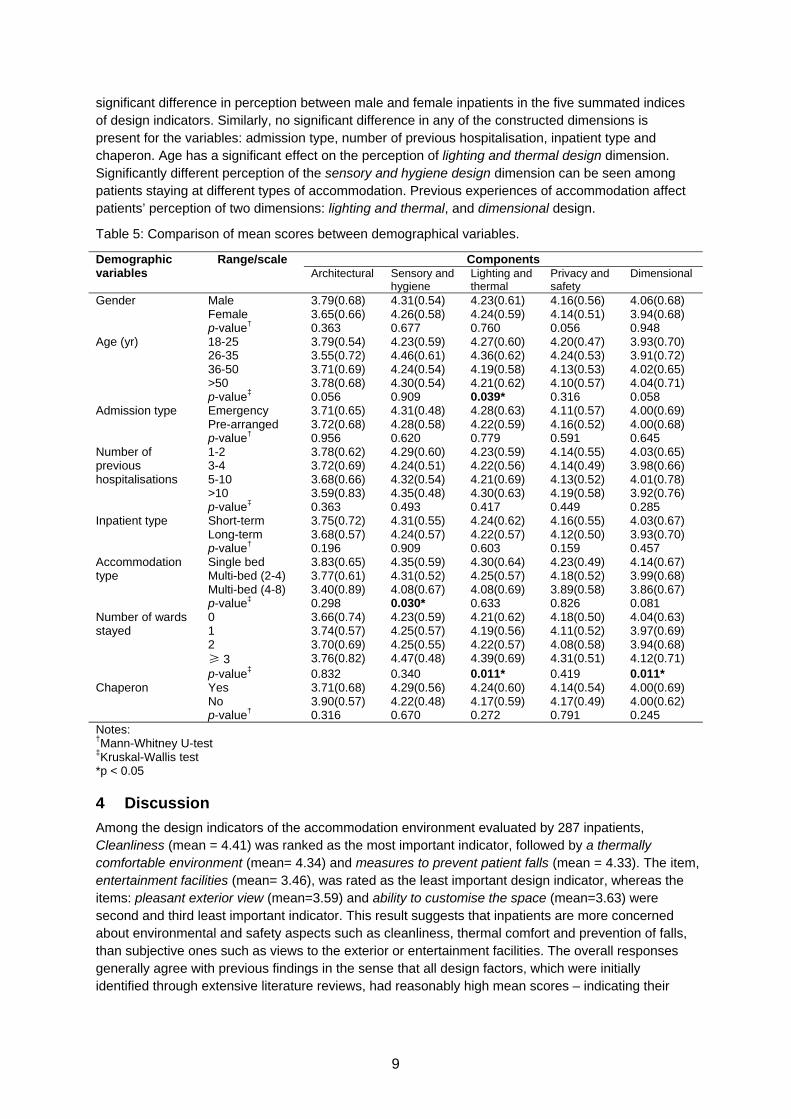
significant difference in perception between male and female inpatients in the five summated indices of design indicators. Similarly, no significant difference in any of the constructed dimensions is present for the variables: admission type, number of previous hospitalisation, inpatient type and chaperon. Age has a significant effect on the perception of lighting and thermal design dimension. Significantly different perception of the sensory and hygiene design dimension can be seen among patients staying at different types of accommodation. Previous experiences of accommodation affect patients’ perception of two dimensions: lighting and thermal, and dimensional design.
Table 5: Comparison of mean scores between demographical variables.
Demographic variables
Range/scale ComponentsArchitectural Sensory and
hygiene Lighting and thermal
Privacy and safety
Dimensional
Gender Male 3.79(0.68) 4.31(0.54) 4.23(0.61) 4.16(0.56) 4.06(0.68) Female 3.65(0.66) 4.26(0.58) 4.24(0.59) 4.14(0.51) 3.94(0.68) p-value† 0.363 0.677 0.760 0.056 0.948
Age (yr) 18-25 3.79(0.54) 4.23(0.59) 4.27(0.60) 4.20(0.47) 3.93(0.70) 26-35 3.55(0.72) 4.46(0.61) 4.36(0.62) 4.24(0.53) 3.91(0.72) 36-50 3.71(0.69) 4.24(0.54) 4.19(0.58) 4.13(0.53) 4.02(0.65) >50 3.78(0.68) 4.30(0.54) 4.21(0.62) 4.10(0.57) 4.04(0.71) p-value‡ 0.056 0.909 0.039* 0.316 0.058
Admission type Emergency 3.71(0.65) 4.31(0.48) 4.28(0.63) 4.11(0.57) 4.00(0.69) Pre-arranged 3.72(0.68) 4.28(0.58) 4.22(0.59) 4.16(0.52) 4.00(0.68) p-value† 0.956 0.620 0.779 0.591 0.645
Number of previous hospitalisations
1-2 3.78(0.62) 4.29(0.60) 4.23(0.59) 4.14(0.55) 4.03(0.65) 3-4 3.72(0.69) 4.24(0.51) 4.22(0.56) 4.14(0.49) 3.98(0.66) 5-10 3.68(0.66) 4.32(0.54) 4.21(0.69) 4.13(0.52) 4.01(0.78) >10 3.59(0.83) 4.35(0.48) 4.30(0.63) 4.19(0.58) 3.92(0.76) p-value‡ 0.363 0.493 0.417 0.449 0.285
Inpatient type Short-term 3.75(0.72) 4.31(0.55) 4.24(0.62) 4.16(0.55) 4.03(0.67) Long-term 3.68(0.57) 4.24(0.57) 4.22(0.57) 4.12(0.50) 3.93(0.70) p-value† 0.196 0.909 0.603 0.159 0.457
Accommodation type
Single bed 3.83(0.65) 4.35(0.59) 4.30(0.64) 4.23(0.49) 4.14(0.67) Multi-bed (2-4) 3.77(0.61) 4.31(0.52) 4.25(0.57) 4.18(0.52) 3.99(0.68) Multi-bed (4-8) 3.40(0.89) 4.08(0.67) 4.08(0.69) 3.89(0.58) 3.86(0.67) p-value‡ 0.298 0.030* 0.633 0.826 0.081
Number of wards stayed
0 3.66(0.74) 4.23(0.59) 4.21(0.62) 4.18(0.50) 4.04(0.63) 1 3.74(0.57) 4.25(0.57) 4.19(0.56) 4.11(0.52) 3.97(0.69) 2 3.70(0.69) 4.25(0.55) 4.22(0.57) 4.08(0.58) 3.94(0.68) ≥ 3 3.76(0.82) 4.47(0.48) 4.39(0.69) 4.31(0.51) 4.12(0.71) p-value‡ 0.832 0.340 0.011* 0.419 0.011*
Chaperon Yes 3.71(0.68) 4.29(0.56) 4.24(0.60) 4.14(0.54) 4.00(0.69) No 3.90(0.57) 4.22(0.48) 4.17(0.59) 4.17(0.49) 4.00(0.62) p-value† 0.316 0.670 0.272 0.791 0.245
Notes: †Mann-Whitney U-test ‡Kruskal-Wallis test *p < 0.05
4 Discussion
Among the design indicators of the accommodation environment evaluated by 287 inpatients, Cleanliness (mean = 4.41) was ranked as the most important indicator, followed by a thermally comfortable environment (mean= 4.34) and measures to prevent patient falls (mean = 4.33). The item, entertainment facilities (mean= 3.46), was rated as the least important design indicator, whereas the items: pleasant exterior view (mean=3.59) and ability to customise the space (mean=3.63) were second and third least important indicator. This result suggests that inpatients are more concerned about environmental and safety aspects such as cleanliness, thermal comfort and prevention of falls, than subjective ones such as views to the exterior or entertainment facilities. The overall responses generally agree with previous findings in the sense that all design factors, which were initially identified through extensive literature reviews, had reasonably high mean scores – indicating their
10
importance to inpatients. 12 out of 19 items had mean scores higher than 4 (= important) and the remaining 7 had mean scores higher than 3 (= neither important nor unimportant).
There were greater percentages of older inpatients among the respondents (see Table 2). Patients aged 36-50 years and older than 50 years accounted for 40.4% and 31.7% of the respondents respectively. This distribution, although appears biased towards older patients, is representative of hospitalisation patterns in most countries. As an example, hospitalisation rates for patients of age 65 years and older in the United States were significantly higher than the rates for the younger groups. Patients aged 65 and older accounted for 37% of hospitalisations and 43% of hospital days (Hall et al., 2010). No significant difference in perception based on age was found for the constructed dimensions, except for lighting and thermal design. Respondents aged between 26 and 35 thought that lighting and thermal design factor was important (mean score = 4.36), more than the other age groups. Evidence suggests that as we grow older, our visual abilities decrease – so does our tolerance to variations in the luminous environment (Shikder et al., 2011). Designing thermal and luminous environments for older people, therefore, need to consider various physical and psychological factors.
Admission type and number of previous hospitalisation did not significantly affect inpatients’ response on the importance of design factors. However, short-term (< 2 weeks of hospitalisation) patients considered all constructed design dimensions to be more important than the long-term (> 2 weeks of hospitalisation) patients. It may due to the fact that long-term patients had more time than short-term patients to adapt themselves with the hospital environment, resulting in differing perceptions.
There is a significant difference in perception based on accommodation type for the sensory and hygiene design factor, comprising three design indicators: cleanliness, noise and unpleasant smell. Inpatients who stayed in single-patient rooms considered these three design indicators to be more important than those in multi-bed wards. This correlation between accommodation type and sensory and hygiene design factor is an important finding because of the fact that single-patient accommodation has become a popular option in the domain of hospital design in recent times (Chaudhury et al., 2005; Lawson and Phiri, 2000; NHS Estates, 2001). Patients’ preference for single rooms may be due to their wish to be close to their partners and family while being hospitalised or may simply be due to their own preference for privacy. Other interesting observation is that mean scores on all constructed PCA factors by patients staying at single-bed accommodation were higher than patients in other accommodation types. In the Chinese context, patients who stay in single-patient rooms are often more financially able than those who choose to stay in multi-bed wards. This may contribute to their higher expectations from the physical environment in hospitals and the significant correlation with sensory and hygiene design factor. Other feature of single-patient rooms is that the isolation from other patients contributes to the reduction in nosocomial infections, compared to multi-bed wards (van de Glind et al., 2007). On the other hand, single-patient accommodation is not appropriate for all types of patients, in particular for those who need an opportunity to interact and communicate with others for their recovery.
Opportunity for adaptation may be another contributing factor in differing perceptions. Single-patient rooms are better in creating an isolated environment by reducing the ambient noise level. Patients in multi-bed wards are subjected to more noise than those in single-patient rooms; therefore, their tolerance levels may be higher. However, it should be noted that research has found links with higher noise levels in wards and poor sleep quality and sleeplessness in daytime, affecting patients’ health outcomes (Freedman et al., 1999). It is widely acknowledged that sound levels higher than 55 dBA brings disturbing effect (Beranek, 1971). Many studies suggest that the exceedance of the recommended level of ambient sound levels is common (Busch-Vishniac et al., 2005; Souter and Wilson, 1986), resulting in increased stress among patients. However, the relationship between accommodation type and perception is complex, involving many social and psychological parameters. Further research is needed to fully understand this.
Significant difference was found in patients’ perception of both the lighting and thermal design and dimensional design factors, based on their previous hospitalisation experience. Patients, who
11
previously stayed at three or more wards, thought that the lighting and thermal design factor was more important (mean score = 4.39) than others who previously stayed at less than three wards. They also considered the dimensional design factor to be more important (mean score = 4.12) than others. One such dimensional design indicator is the proximity to service delivery points such as nursing stations, which is important for ensuring the quality of care and patients’ wellbeing. Nurses are frontline caregivers in a hospital and depending on the design of a healthcare facility, they may be required to walk considerable distances during their shifts. An investigation into the nursing practices in 36 hospital surgery units has found that individual nurses travelled between 1 and 5 miles per 10-hour daytime shift (Hendrich et al., 2008). General consensus is that this travelling needs to be reduced through careful hospital design. In short, this research has found statistically significant difference in perception of the importance of design factors based on patients’ previous experience of hospitalisation.
Mean scores from male inpatients were higher than females in most of the PCA factors, except lighting and thermal design, in which mean score from male participants was 4.23, compared to 4.24 by females.
The results of the principal component analysis showed that the five constructed factors generally had good internal consistency, even if those factors comprised only three items. This multidimensional structure matches the findings from previous investigations on patient satisfaction, the closely related topic of research to the one described here (Douglas and Douglas, 2004; Hutton and Richardson, 1995). This research also confirms the hypothesis, from a Chinese perspective, that there exists a positive relationship between patients’ perception and their overall evaluation of the role of physical environments in their care. This points toward greater criterion validity within this instrument.
This study also explored inpatients’ perception of design factors related to privacy and safety. Principal component analysis suggested that five items (see Table 4) contributed to this constructed factor: measures to prevent patient falls; privacy from other patients and staff; number of patients in a room; en-suite bathroom and proximity to nursing staff. The last item, proximity to nursing staff, was the only item with dual loading of 0.505 and 0.521 in two factors, privacy and safety and dimensional respectively. In both cases, the loadings were significant and higher than 0.40, indicating the importance of the item. However, considering the differences in loadings, the item was clustered with the dimensional design factor, leaving the privacy and safety factor with four items. The reason the item is kept is because of the fact that the item is a very important dimensional design aspect for efficient and safe delivery of care.
5 Research limitations and future directions
First, there are differences in healthcare in urban and rural communities in China, because of the unbalanced development of healthcare infrastructure. This study focused on urban hospitals and research findings may not be representative of the overall Chinese situation in every aspect. The differences, if any, or similarities can be the subject of future investigations.
Second, the study did not include respondents younger than 18 years. The views presented by inpatients in this study are, therefore, of adults. This is not so much a limitation but a conscious decision, primarily because of the cognitive and attitudinal differences between children and adults, and also because of the differences in interior design and decoration in children and adult accommodations, which have the potential to introduce bias. Future studies can investigate children’s perception and compare findings with this study.
Third, further demographic variables such as income, educational background, etc. could have been incorporated, even though the literature did not suggest a strong association between these variables and the perception of or satisfaction with the built environment. In this study, the questionnaire was conducted among inpatients, who were already in a vulnerable condition due to their illness. Therefore, the research team decided to keep the questionnaire succinct and relevant. Also, because
12
of the cultural preferences, some respondents would have felt that the answers to questions on income were too private to give.
Fourth, it is necessary to point out that differences may exist in perception between Chinese respondents and the rest of the world, although such differences may be minimal because the design and operation of major healthcare facilities such as medical college hospitals are more universal than other types of buildings. Nevertheless, validation is a continuous process and further studies are required to confirm these results in different countries and contexts. So, there is a need to replicate findings using confirmatory statistical methods.
Fifth, responses may be different among currently hospitalised patients and respondents who were hospitalised some time ago. The reason may be due to the fact that while currently hospitalised patients can respond from experiences in the immediate past (days or weeks), previously hospitalised patients, on the other hand, have to recall their experiences from a distant past, which may as well affect their perception.
Sixth, this research did not explore why cleanliness was perceived highly by the respondents. The general environment in both hospitals appeared clean and discussions with the management suggested that infection control in both hospitals were well within national and World Health Organisation (WHO) guidelines. Qingdao (where the surveyed hospitals are based) residents are well aware of the link between pollution and its atmospheric effects through increased occurrences of acid rain, which led to several successful policy interventions to reduce the concentration of ambient particles and SO2, ultimately resulting in a significant reduction of harmful particles such as PM2.5 in the urban atmosphere (Hu et al, 2002). This awareness may have led to higher expectation of the physical environment by the residents. A high expectation of cleanliness may be linked with culture and aspiration of the Chinese for better air quality in indoor and outdoor environments.
6 Conclusion
Previous attempts at generating evidence base on the association between physical environments and patients’ health and wellbeing focused mostly patient or user satisfaction from the perspective of quality of care in a specific context. The dimensions of these contexts, such as patient experience, interaction with care providers, etc., made it challenging to use the evidence base in design decision-making. This research was aimed at addressing this gap by exploring context-neutral perspectives of inpatients on the importance of key design indicators for the design of accommodation environments.
Based on the opinions of sample patients and care providers, and an extensive literature review of design indicators that were linked with patient health and wellbeing, this study developed a 19-item self-completed questionnaire to explore inpatients’ views on a 5-point scale. Descriptive and principal component analyses were conducted on the collected questionnaire data. Non-parametric tests were conducted to identify if there were any significant differences in perception of the constructed PCA factors based on demographic information. A relatively good response rate indicates that this questionnaire can be used for extracting inpatients views on the importance of design indicators. The instrument has undergone a rigorous process of testing for reliability and validity, supporting its application as a measure of patient perception. The core scales are supported by the results of the factor analysis. PCA confirmed the hypothesised dimensional structure of the questionnaire yielding five factors. The high levels of internal consistency reliability suggest that the items comprising these hypothesised scales are sufficiently related.
Among the investigated design indicators, design for cleanliness was ranked as the most important, followed by a thermally comfortable environment, measures to prevent falls, unpleasant smell, adequate illumination and noise – all with mean scores above 4.20, indicating that they are high on the agenda for inpatients. All of these six factors were part of the two constructed dimensions: sensory and hygiene, and lighting and thermal. In other words, respondents considered conventional environmental design factors to be highly important, more than architectural or dimensional design factors. The lowest ranked item was entertainment facilities, followed by pleasant exterior view and
13
ability to customise the space. All three had mean scores above 3.46 and were part of architectural design factor, indicating that although the factors were at the bottom of the list, the respondents considered them to be important, but not as important as the environmental design factor.
The study highlighted the importance of environmental design indicators to hospital inpatients. However, there were significant differences between perceptions of different groups of inpatients. Inpatients, aged between 26 and 35, considered lighting and thermal to be more important than the other age groups. Patients, who stayed at single-patient accommodation considered sensory and hygiene design indicators (cleanliness, noise and unpleasant smell) to be more important than the patients from multi-bed accommodations. Previous experience of hospitalisation resulted in differences in perception. Mean summated scores by patients who previously stayed at 3 or more wards were higher in lighting and thermal and dimension design factors than the patients who had less hospitalisation experience.
The findings from this research are important for integrating patients’ perception in the design process. However, further research is needed to validate and confirm these results in different geographic regions.
References
Aiken, L.H., Clarke, S.P., Sloane, D.M., Lake, E.T. and Cheney, T., 2008, ‘Effects of hospital care environment on patient mortality and nurse outcomes’, The Journal of Nursing Administration 38, 223-229.
Applebaum, D., Fowler, S., Fiedler, N., Osinubi, O. and Robson, M., 2010, ‘The impact of environmental factors on nursing stress, job satisfaction, and turnover intention’, The Journal of Nursing Administration 40, 323-328.
Belohlav, J.A., Cook, L.S., Olson, J.R. and Drehmer, D.E., 2010, ‘Core Values in Hospitals: A Comparative Study’, Quality Management Journal 17, 36-50.
Beranek, L.L., 1971, Noise and Vibration Control, New York: McGraw Hill.
Birnbach, D.J., Nevo, I., Scheinman, S.R., Fitzpatrick, M., Shekhter, I. and Lombard, J.L., 2010, ‘Patient safety begins with proper planning: A quantitative method to improve hospital design’, Quality and Safety in Health Care 19, 462 -465.
Bland, J.M. and Altman, D.G., 1995, ‘Multiple significance tests: The Bonferroni method’, British Medical Journal 310, 170.
Bodur, S., Ozdemir, Y.E. and Kara, F., 2002, ‘Outpatient satisfaction with health services in urban areas’, Turkish Journal of Medicine Science 32, 409-414.
Boland, R.J., 1978, ‘The Process and Product of System Design’, Management Science 24, 887-898.
Busch-Vishniac, I., West, J.E., Barnhill, C., Hunter, T., Orellana, D. and Chivukula, R., 2005, ‘Noise levels in Johns Hopkins Hospital’, Journal of the Acoustical Society of America 118(6), 3629-3645.
Callao, S., Jarne, J.I. and Laínez, J.A., 2007, ‘Adoption of IFRS in Spain: Effect on the comparability and relevance of financial reporting’, Journal of International Accounting, Auditing and Taxation16, 148–78.
Capra, M.G., 2005, ‘Factor Analysis of Card Sort Data: An Alternative to Hierarchical Cluster Analysis’, Human Factors and Ergonomics Society Annual Meeting Proceedings 49, 691-695.
Chaudhury, H., Mahmood, A. and Valente, M., 2005, ‘Advantages and Disadvantages of Single-Versus Multiple-Occupancy Rooms in Acute Care Environments’, Environment and Behavior 37, 760 -786.
Chu, A., Thorne, A. and Guite, H., 2004, ‘The impact on mental well-being of the urban and physical environment: An assessment of the evidence’, Journal of Public Mental Health 3, 17-32.
Clarkson, P.J., Ward, J., Buckle, P., Stubbs, D. and Coleman, R., 2004, ‘Design for Patient Safety: A Review of the Effectiveness of Design in the UK Health Service’, ASME Conference Proceedings 2004, 443-452.
CMS, 2011, National Health Expenditure Data, Baltimore: Centers for Medicare and Medicaid Services (CMS), http://www.cms.gov/
Cronbach, L., 1951, ‘Coefficient alpha and the internal structure of tests’, Psychometrika 16, 297-334.
Dancer, S. J., 2011, ‘Hospital cleaning in the 21st century’, European Journal of Clinical Microbiology & Infectious Diseases, 30, 1473–1481.
Devlin, A.S. and Arneill, A.B., 2003, ‘Health Care Environments and Patient Outcomes’, Environment and Behavior 35, 665 -694.
Diez Roux, A.V., 2001, ‘Investigating Neighborhood and Area Effects on Health’, American Journal of Public Health 91, 1783-1789.
14
Dijkstra, K., Pieterse, M. and Pruyn, A., 2006, ‘Physical environmental stimuli that turn healthcare facilities into healing environments through psychologically mediated effects: systematic review’, Journal of Advanced Nursing 56, 166-181.
Douglas, C.H. and Douglas, M.R., 2004, ‘Patient‐friendly hospital environments: exploring the patients’ perspective’, Health Expectations 7, 61-73.
Douglas, C.H. and Douglas, M.R., 2005, ‘Patient-centred improvements in health-care built environments: perspectives and design indicators’, Health Expectations 8, 264-276.
Field, A.P., 2009, Discovering Statistics Using SPSS, London, SAGE Publications Ltd.
Flegel, K.M. and Lant, M., 1998, ‘Sound privacy for patients’, Canadian Medical Association Journal, 158(5), 613-614.
Fottler, M.D., Ford, R.C., Roberts, V. and Ford, E.W., 2000, ‘Creating a healing environment: The importance of the service setting in the new consumer-oriented healthcare system’, Journal of Healthcare Management 45, 91-106.
Freedman, N., Kotzer, N. and Schwab, R., 1999, ‘Patient Perception of Sleep Quality and Etiology of Sleep Disruption in the Intensive Care Unit’. American Journal of Respiratory and Critical Care Medicine 159(4), 1155–62.
Gliem, J.A. and Gliem R.R., 2003, ‘Calculating, Interpreting, And Reporting Cronbach’s Alpha Reliability Coefficient For Likert-Type Scales’, Midwest Research-to-Practice Conference in Adult, Continuing, and Community Education, http://hdl.handle.net/1805/344.
González-Santos, S.P., 2011, ‘Space, structure and social dynamics within the clinical setting: Two case studies of assisted reproduction in Mexico City’, Health & Place 17(1) 166-174.
van de Glind, I., de Roode, S. and Goossensen, A., 2007, ‘Do patients in hospitals benefit from single rooms? A literature review’, Health Policy 84, 153-161.
Hall, M.J., DeFrances, C.J., Williams, S.N., Golosinskiy, A. and Schwartzman, A., 2010, National Hospital Discharge Survey: 2007 Summary, Atlanta: Centers for Disease Control and Prevention.
Hendrich, A., Chow, M.P., Skierczynski, B.A. and Lu, Z., 2008, ‘A 36-Hospital Time and Motion Study: How Do Medical Surgical Nurses Spend Their Time?’, Permanente Journal 12(3), 25-34.
Hernandez, M. and Miller, J., 1986, ‘How to reduce falls’, Geriatric Nursing (New York, N.Y.), 7(2), 97-102.
HES, 2011, Monthly inpatient data, Hospital Episode Statistics (HES) online, URL http://www.hesonline.nhs.uk/Ease/ContentServer?siteID=1937&categoryID=1122
Hu, M., He, L-Y., Zhang, Y-H., Wang, Min., Pyo Kim, Yong. And Moon, K.C., 2002, ‘Seasonal variation of ionic species in fine particles at Qingdao, China’, Atmospheric Environment 36, 5853–9.
Hutton, J.D. and Richardson, L.D., 1995, ‘Healthscapes: The role of the facility and physical environment on consumer attitudes, satisfaction, quality assessments, and behaviors’, Health Care Management Review 20, 48-61.
IBM, 2010, Predictive Analytics Software (PASW) Statistics [computer software], Somers: International Business Machines (IBM).Jenkinson, C., Coulter, A. and Bruster, S., 2002, ‘The Picker Patient Experience Questionnaire: Development and validation using data from in-patient surveys in five countries’, International Journal for Quality in Health Care 14, 353 -358.
Johnson, R.L., Roter, D., Powe, N.R. and Cooper L.A., 2004, ‘Patient Race/Ethnicity and Quality of Patient–Physician Communication During Medical Visits’, American Journal of Public Health, 94(12), 2084-2090.
Joseph, A. and Rashid, M., 2007, ‘The architecture of safety: hospital design’, Current Opinion in Critical Care 13, 714-719.
Karro, J., Dent, A.W. and Farish, S., 2005, ‘Patient perceptions of privacy infringements in an emergency department’, Emergency Medicine Australasia, 17(2),117-123.
Leung, T., Wong, G., Ko, F., Lam, C. and Fok, T., 2005, ‘Clinical and atopic parameters and airway inflammatory markers in childhood asthma: a factor analysis’, Thorax 60, 822–6.
Lawson, B. and Phiri, M., 2000, ‘Hospital design. Room for improvement’, The Health Service Journal 110, 24-26.
Lorenz, S.G., 2007, ‘The potential of the patient room to promote healing and well-being in patients and nurses: An integrative review of the research’, Holistic Nursing Practice 21, 263-277.
Mroczek, J., Mikitarian, G., Vieira, E.K. and Rotarius, T., 2005, ‘Hospital design and staff perceptions: An exploratory analysis’, Health Care Manager 24, 233-244.
NHS Estates, 2001, Enhancing Privacy and Dignity: Achieving Single Sex Accommodation, Stationery Office Books.
Nunnally, J. and Bernstein, I., 1994, Psychometric Theory., 3rd ed. McGraw-Hill, New York.
OECD, 2010, OECD Health Data: OECD Health Statistics, Paris: Organisation for Economic Co-operation and Development.
15
O’Neill, M. J., 1994, ‘Work space adjustability, storage, and enclosure as predictors of employee reactions and performance’, Environment and Behavior, 26, 504 –526.
Panagea, S., Winstanley, C., Walshaw, M.J., Ledson, M.J., Hart, C.A., 2005, ‘Environmental contamination with an epidemic strain of Pseudomonas aeruginosa in a Liverpool cystic fibrosis centre, and study of its survival on dry surfaces’, Journal of Hospital Infection, 59(2), 102-107.
Pattison, H.M. and Robertson, C.E., 1996, ‘The effect of ward design on the well-being of post-operative patients’, Journal of Advanced Nursing 23, 820-826.
Powers, K.S. and Rubenstein, J.S., 1999, ‘Family Presence During Invasive Procedures in the Pediatric Intensive Care Unit: A Prospective Study’. Archives of Pediatrics & Adolescent Medicine, 153 (9), 955-958.
PwC, 2004, ‘The role of hospital design in the recruitment, retention and per- formance of NHS nurses in England’, London: Commission for Architecture and the Built Environment (CABE) and PricewaterhouseCoopers LLP.
Reiling, J.G., 2006, ‘Safe design of healthcare facilities’, Quality & Safety in Health Care 15, 34-40.
Reiling, J.G., Knutzen, B.L., Wallen, T.K., McCullough, S., Miller, R. and Chernos, S., 2004, ‘Enhancing the traditional hospital design process: a focus on patient safety’, Joint Commission Journal on Quality and Safety 30, 115-124.
Robinson, A. and Thomson, R., 2001, ‘Variability in patient preferences for participating in medical decision making: Implication for the use of decision support tools’, Quality and Safety in Health Care 10, 34-38.
Schweitzer, M., Gilpin, L. and Frampton, S., 2004, ‘Healing spaces: elements of environmental design that make an impact on health’, Journal of Alternative and Complementary Medicine10(1), 71-83.
Shikder, S., Mourshed, M. and Price, A., 2011, ‘Therapeutic lighting design for the elderly: A review’, Perspectives in Public Health, DOI: 10.1177/1757913911422288.
Smith, J.A., Scammon, D.L. and Beck, S.L., 1995, ‘Using patient focus groups for new patient services’, The Joint Commission Journal on Quality Improvement 21, 22-31.
Souter, R.L. and Wilson, J.A., 1986, ‘Does hospital noise disturb patients?’, British Medical Journal 292, 305.
Stern, A., Leventhal, Macrae, S., Gerteis, M., Harrison, T., Fowler, E., Edgman-Levitan, S., Walker, J. and Ruga, W., 2003, ‘Understanding the consumer perspective to improve design quality’, Architectural and Planning Research 20, 16-28.
Sweeney, B.A., 2008, ‘The ecology of the patient experience: Physical environments, patient-staff interactions, staff behaviors, and quality of care’, unpublished master thesis, Cornell University.
Thrall, T.H., 2005, ‘Design with dignity’, Hospitals & Health Networks 79, 48-52.
Tuluca, S.A. and Zwick B., 2001, ‘The Effects of the Asian Crisis on Global Equity Markets’, Financial Review 36, 125–42.
Tyson, G.A., Lambert, G. and Beattie, L., 2002, ‘The impact of ward design on the behaviour, occupational satisfaction and well-being of psychiatric nurses’, International Journal of Mental Health Nursing 11, 94-102.
Ulrich, R.S., 1984, ‘View through a window may influence recovery from surgery’, Science, 224, 420–421.
Ulrich, R.S., Zimring, C., Quan, X., Joseph, A., & Choudhary, R., 2004, ‘The Role of the physical environment in the hospital of the 21st century: A Once- in-a-lifetime opportunity’, Martinez: The Center for Health Design.
Ulrich, R.S., Zimring, C., Zhu, X., DuBose, J., Seo, H., Choi, Y., Quan, X. and Joseph, A., 2008, ‘A review of the research literature on evidence based healthcare design (part I)’, Health Environments Research and Design 1, 61-125.
Wagner, D., Byrne, M. and Kolcaba, K., 2006, ‘Effects of Comfort Warming on Preoperative Patients’, AORN 84(3), 427-448.
Whitehouse, S., Varni, J.W., Seid, M., Cooper-Marcus, C., Ensberg, M.J., Jacobs, J.R. and Mehlenbeck, R.S., 2001, ‘Evaluating a children’s hospital garden environment: Utilization and consumer satisfaction’, Journal of Environmental Psychology 21, 301-314.
WHO, 2002, ‘Prevention of hospital-acquired infections’, Geneva: World Health Organization.
Wiese, C. and Wang, L., 2011, ‘Measured levels of hospital noise before, during, and after renovation of a hospital wing, and a survey of resulting patient perception’, Architectural Engineering -- Faculty Publications, Available at: http://digitalcommons.unl.edu/archengfacpub/44.
Zimring, C., 1990, ‘The cost of confusion: Non-monetary and monetary cost of the Emory University hospital wayfinding system’, Atlanta: Georgia Institute of Technology.