
Accommodation of voice parameters in dialogue
128
Institut f¨ ur Maschinelle Sprachverarbeitung Universit¨ at Stuttgart Pfaffenwaldring 5b D-70569 Stuttgart Accommodation of voice parameters in dialogue Melanie Hoffmann Masterarbeit Pr¨ ufer: Prof. Dr. Grzegorz Dogil Betreuerin: Dr. Natalie Lewandowski Beginn der Arbeit: 28. Februar 2014 Ende der Arbeit: 31. Juli 2014
-
Upload
uni-stuttgart -
Category
Documents
-
view
1 -
download
0
Transcript of Accommodation of voice parameters in dialogue

Institut fur Maschinelle SprachverarbeitungUniversitat StuttgartPfaffenwaldring 5bD-70569 Stuttgart
Accommodation of voice parameters in dialogue
Melanie HoffmannMasterarbeit
Prufer: Prof. Dr. Grzegorz DogilBetreuerin: Dr. Natalie Lewandowski
Beginn der Arbeit: 28. Februar 2014Ende der Arbeit: 31. Juli 2014

Eigenstandigkeitserklarung
Hiermit versichere ich,
• dass ich die vorliegende Arbeit selbststandig verfasst habe,
• dass ich keine anderen als die angegebenen Quellen benutzt und allewortlich oder sinngemaß aus anderen Werken ubernommenen Aussagenals solche gekennzeichnet habe,
• dass die eingereichte Arbeit weder vollstandig noch in wesentlichen TeilenGegenstand eines anderen Prufungsverfahrens gewesen ist,
• dass ich die Arbeit weder vollstandig noch in Teilen bereits veroffentlichthabe und
• dass das elektronische Exemplar mit den anderen Exemplaren uberein-stimmt.
Stuttgart, den 31. Juli 2014
Melanie Hoffmann
3

Acknowledgements
Ich mochte gerne meiner Betreuerin Natalie Lewandowski danken - dafur, dassihre Tur immer offen stand, wenn ich Fragen hatte, fur ihre Geduld und Zeitund fur ihre sehr hilfreichen Kommentare und Tipps. Eine bessere Berteuerinkann man sich kaum wunschen!
A huge thank you goes to Charlie P., who read through my work. I’m sure hemade it more joyful to read.
Ich mochte außerdem meinen Eltern danken. Danke, dass ihr immer an michglaubt und fur eure Unterstutzung! Papa - danke, fur die vielen hifreichenGesprache. Mama - danke fur das Umsorgen und fur das Versprechen unserergemeinsamen Reise! Ich freue mich sehr darauf.
Lieben Dank auch an Jan W. fur das viele Mut zusprechen und Gluck wunschen,nicht nur in Bezug auf diese Arbeit. Du warst eine große Unterstutzung.
4

Contents
Abstract 13
1 Introduction 15
2 Accommodation in dialogue 172.1 Communication Accommodation Theory . . . . . . . . . . . . . 172.2 Phonetic convergence . . . . . . . . . . . . . . . . . . . . . . . . 22
3 The perception of voice 273.1 Listeners’ judgements from voice perception . . . . . . . . . . . 28
3.1.1 Physical characteristics of the speaker . . . . . . . . . . . 283.1.2 Psychological characteristics of the speaker . . . . . . . . 313.1.3 Social characteristics of the speaker . . . . . . . . . . . . 35
3.2 Voice and exemplar theory . . . . . . . . . . . . . . . . . . . . . 37
4 Method 434.1 The Praat Voice Report . . . . . . . . . . . . . . . . . . . . . . 434.2 Corpus analysis . . . . . . . . . . . . . . . . . . . . . . . . . . . 46
5 Results 515.1 Analysis 1 - Individual speakers . . . . . . . . . . . . . . . . . . 525.2 Analysis 2 - Speaker F . . . . . . . . . . . . . . . . . . . . . . . 565.3 Analysis 3 - Position in dialogue . . . . . . . . . . . . . . . . . . 58
6 Discussion 656.1 Discussion of method . . . . . . . . . . . . . . . . . . . . . . . . 656.2 Discussion of results . . . . . . . . . . . . . . . . . . . . . . . . 69
6.2.1 Discussion of Analysis 1 - Individual speakers . . . . . . 696.2.2 Discussion of Analysis 2 - Speaker F . . . . . . . . . . . 726.2.3 Discussion of Analysis 3 - Position in dialogue . . . . . . 73
6.3 Changes in fundamental frequency . . . . . . . . . . . . . . . . 746.4 Temporal aspects . . . . . . . . . . . . . . . . . . . . . . . . . . 756.5 Engagement . . . . . . . . . . . . . . . . . . . . . . . . . . . . . 76
7 Conclusion and Outlook 77
Bibliography 79
5

Contents
Appendices 95
A Outliers - Individual speakers 97
B Outliers - speaker F 99
C Results of Analysis 1 - Individual speakers 101C.1 Dialogue A-F . . . . . . . . . . . . . . . . . . . . . . . . . . . . 101C.2 Dialogue C-F . . . . . . . . . . . . . . . . . . . . . . . . . . . . 103C.3 Dialogue H-F . . . . . . . . . . . . . . . . . . . . . . . . . . . . 105C.4 Dialogue J-F . . . . . . . . . . . . . . . . . . . . . . . . . . . . . 107C.5 Dialogue K-F . . . . . . . . . . . . . . . . . . . . . . . . . . . . 109
D Results of Analysis 3 - Position in dialogue 111D.1 Dialogue A-F . . . . . . . . . . . . . . . . . . . . . . . . . . . . 111D.2 Dialogue D-F . . . . . . . . . . . . . . . . . . . . . . . . . . . . 115D.3 Dialogue H-F . . . . . . . . . . . . . . . . . . . . . . . . . . . . 118D.4 Dialogue J-F . . . . . . . . . . . . . . . . . . . . . . . . . . . . . 122D.5 Dialogue K-F . . . . . . . . . . . . . . . . . . . . . . . . . . . . 125
6

List of Tables
3.1 Possible judgements from the perception of voice. . . . . . . . . 293.2 Relations between acoustic parameters and emotions. . . . . . . 31
4.1 Sum of outliers - Individual speakers. . . . . . . . . . . . . . . . 494.2 Sum of outliers - Speaker F. . . . . . . . . . . . . . . . . . . . . 49
5.1 Paired samples statistics, Analysis 1- Speaker D. . . . . . . . . . 525.2 Paired t-tests, Analysis 1 - Speaker D. . . . . . . . . . . . . . . 535.3 Paired samples statistics, Analysis 1 - Speaker F. . . . . . . . . 535.4 Results of the paired t-tests, Analysis 1 - Speaker F. . . . . . . . 545.5 Summary of Analysis 1 - Dialogue D-F. . . . . . . . . . . . . . . 545.6 Summary of Analysis 1. . . . . . . . . . . . . . . . . . . . . . . 555.7 Paired samples statistics, Analysis 2 - Speaker F. . . . . . . . . 575.8 Paired t-tests, Analysis 2 - Speaker F. . . . . . . . . . . . . . . . 575.9 Summary of Analysis 2 - Speaker F. . . . . . . . . . . . . . . . . 575.10 Descriptive statistics, Analysis 3, Dialogue C-F, F0 Mean. . . . 585.11 Results of ANOVA of Analysis 3, Dialogue C-F, F0 Mean. . . . 595.12 Descriptive statistics, Analysis 3, Dialogue C-F, F0 SD. . . . . . 595.13 Results of ANOVA of Analysis 3, Dialogue C-F, F0 SD. . . . . . 595.14 Descriptive statistics, Analysis 3, Dialogue C-F, F0 Min . . . . . 605.15 Results of ANOVA of Analysis 3, Dialogue C-F, F0 Min. . . . . 605.16 Descriptive statistics, Analysis 3, Dialogue C-F, F0 Max. . . . . 615.17 Results of ANOVA of Analysis 3, Dialogue C-F, F0 Max. . . . . 615.18 Descriptive statistics, Analysis 3, Dialogue C-F, jitter. . . . . . . 615.19 Results of ANOVA of Analysis 3, Dialogue C-F, jitter. . . . . . 625.20 Descriptive statistics, Analysis 3, Dialogue C-F, shimmer. . . . . 625.21 Results of ANOVA of Analysis 3, Dialogue C-F, shimmer. . . . 635.22 Descriptive statistics, Analysis 3, Dialogue C-F, HNR. . . . . . . 635.23 Results of ANOVA of Analysis 3, Dialogue C-F, HNR. . . . . . 635.24 Summary of Analysis 3 - Position in dialogue . . . . . . . . . . . 64
6.1 Mean and standard deviation for jitter, shimmer and HNR. . . . 68
7


List of Figures
2.1 Interactive Alignment Model. . . . . . . . . . . . . . . . . . . . 242.2 Hybrid model of convergence. . . . . . . . . . . . . . . . . . . . 25
3.1 Perception-production loop in exemplar theory. . . . . . . . . . 41
4.1 Perturbation: jitter and shimmer. . . . . . . . . . . . . . . . . . 454.2 Dialogues of speaker F. . . . . . . . . . . . . . . . . . . . . . . . 474.3 Boxplot, outliers F0 Min. . . . . . . . . . . . . . . . . . . . . . . 48
6.1 Error of measurement for F0 Min in Praat. . . . . . . . . . . . . 666.2 Error of measurement for F0 Max in Praat. . . . . . . . . . . . 66
9


List of Abbreviations
ANOVA Analysis of varianceCAT Communication Accommodation TheoryCNN Cable News NetworkF0 Mean Mean fundamental frequencyF0 Min Minimum of the fundamental frequencyF0 Max Maximum of the fundamental frequencyGeCo German conversations corpusHNR Harmonics-to-noise ratioIAM Interactive Alignment ModelIQ Intelligence quotientMDVP Multi-Dimensional Voice ProgramNHR Noise-to-harmonics ratioRP Received pronunciationSAT Speech Accommodation TheorySD Standard deviationStd. Error Mean Standard Error MeanVOT Voice onset time
11


Abstract
Communication, according to Communication Accommodation Theory, is de-
pendent on social and situational factors. Due to the emotional states, the
amount of attention paid, the impression of the conversational partner and
the situation, speakers can become more similar or more dissimilar towards
their conversational partner in behaviour and speech, or they can even main-
tain their own style.
The aim of the present thesis was to investigate phonetic convergence, de-
fined as the increasing acoustic similarity of speech, in parameters of voice. The
intention was to identify those voice parameters that are sensitive to changes
due to accommodation towards the conversational partner.
Samples from six different dialogues of the GeCo corpus [SL13, SLD14], con-
sisting of German spontaneous speech of female speakers, were extracted from
the first and the last five minutes. Each sample was analysed for parameters of
voice (mean, minimum, maximum and standard deviation of the fundamental
frequency, jitter, shimmer and harmonics-to-noise ratio) using the Praat Voice
Report [BW14]. Evaluations of the results were made with paired t-tests and
ANOVAs. Additionally, ratings of the speakers for their conversational partner
about social attractiveness and competence were included in the evaluation of
the outcome.
Results revealed that the individual speakers changed on different voice pa-
rameters. Thus it can be assumed that accommodation is not a fully automatic
process, but is also dependent on the situation, on the conversational partner
and on speaker’s individual characteristics. Furthermore, analyses indicate
that parameters of the fundamental frequency are sensitive towards accom-
modation. Tendencies for convergence, divergence and maintenance of the
results were partly confirmed by speakers’ ratings about social attractiveness
and competence.
13


1 Introduction
Whenever we perceive the voice of another person, whether while reading, chat-
ting, screaming or even whispering, we draw information about the speaker.
We can make statements, about whether the person is male or female, if he
or she is young or old, in which mood or emotional states he or she is, if he
or she is ill and where he or she is from. The impressions we have are not
necessarily correct, but nevertheless lead to the drawing of an “auditory face”
[BFB04], that allows to recognize individuals, emotional states and aspects of
personality and heritage.
We can adjust our voice, according to the perceived acoustic parameters of
our conversational partner’s voice and the information that we draw from it.
The Communication Accommodation Theory (Chapter 2.1), referring
to behaviour which includes speech, states that convergence (becoming more
similar to the conversational partner), divergence (becoming more dissimilar to
the conversational partner) and maintenance (persisting in one’s own original
style) are socially motivated. Thereby we can define and express the social
distance to our conversational partner.
Phonetic convergence (Chapter 2.2) then refers to the acoustic charac-
teristics of the increasing similarity of speech. Speakers hereby adopt the
acoustic-phonetic features of the conversational partner. When dealing with
phonetic convergence the question arises, to what extent is convergence con-
trollable and conscious to the speaker? The Interactive Alignment Model
proposes that the link of perception and production is directly coupled and
that convergence is thus mostly automatic. This has been criticized due to
the fact that divergence and maintenance would not be possible since speakers
would only be able to converge to their conversational partner. A hybrid model
then assumes that convergence is driven automatically, but can be influenced
through various factors, including the speaker, the conversational partner and
the situation.
15
1 Introduction
Chapter 3, The perception of voice, deals with different speaker charac-
teristics that listeners can draw from the perception of voices. Their judge-
ments do not have to be necessarily correct, but nevertheless they are made,
as about physical, psychological and also social characteristics of the speaker.
These details and pieces of information about the speaker are stored together
with acoustic and lexical information in the mind of the listener. In order to
converge towards the conversational partner listeners have to remember and
reuse this information. This process can be well explained by Exemplar The-
ory, which proposes that every stimulus, such as different voice parameters,
can be stored in mind as a detailed trace and can then serve as the basis of
recognition and production.
The methods used in the present thesis are presented in Chapter 4, Method.
There, the Praat Voice Report is presented including the voice parameters
investigated: the mean, standard deviation, minimum and maximum of the
fundamental frequency as well as jitter, shimmer and the harmonics-to-noise
ratio. The corpus used is the GeCo corpus, which consists of dialogues of
about 25 minutes of spontaneous speech of female German native speakers.
In Chapter 5, which describes the Results, three different analyses were
conducted with the help of SPPS, using paired t-tests and ANOVAs. The first
analysis investigates the speakers’ individual differences within the dialogues,
the second investigates differences for one speaker participating in all six dia-
logues and the third sheds light on differences in the voice parameters when
comparing beginning and end points of the dialogues.
In the Discussion (Chapter 6) the results of the individual analyses are
discussed. For the first analyses, the analysis of the individual speakers, the
speakers’ ratings about their conversational partners’ social attractiveness and
competence were included. Chapter 7, Conclusion and outlook, summa-
rizes the findings and provides an outlook to future investigations concerning
phonetic convergence.
16

2 Accommodation in dialogue
In the interaction of dialogue partners processes of accommodation can occur,
including adjustments in the direction of the conversational partner. Commu-
nication Accommodation Theory (CAT), described in Chapter 2.1, gives ex-
planations and speakers’ motivations for variation in behaviour and in speech.
Phonetic convergence, see Chapter 2.2, refers to listeners’ perception of an
acoustic signal that can be broken down to a set of features, which can be
reused in production. In addition, the degree of automaticity of convergence
is examined with the help of the Interactive Alignment Model and a hybrid
model.
2.1 Communication Accommodation Theory
Communication is context-sensitive: people tend to speak differently depend-
ing on conversational partners, e.g. colleagues, one’s parents or children. Con-
nections and relationships between humans are very complex and “suited in
an array of dynamic human features and personal attributes, such as experi-
ences, developmental process, and social and personal identity orientations”
[PG08, p. 25]. The assumption, according to Communication Accommodation
Theory (CAT), is that interpersonal and intergroup relationships are mediated
and maintained through communication [GG98].
CAT was proposed in the 1970s named Speech Accommodation Theory
(SAT) [Gil73]. The theory thereby focussed on motivations of speakers that
cause individuals to change speech behaviour [Gil73, GTB73]. The expansion
of the scope, including relational, contextual and identity processes in inter-
action, then lead to a redefinition of the theory to Communication Accom-
modation Theory, which combines the areas of social psychology, sociology,
sociolinguistics and communication [SGLP01]. CAT proposes that speakers
17

2 Accommodation in dialogue
use verbal as well as non-verbal communication to achieve a desired social dis-
tance between themselves and the conversational partners [SGLP01, PG04].
In other words, parameters like use of language, quality of voice, gestures, pos-
ture, body movements, physical proximity, eye contact and facial expressions
can be used to emphasize or reduce the social distance to the conversational
partner and can express social status differences, ethnic and group boundaries
as well as role or norm-specific behaviours [SGLP01, p. 34]. Therefore the
process of accommodation is assumed to be complex and context-sensitive.
Accommodation could be proved for diverse dimensions in verbal and non-
verbal behaviour. Individuals’ behaviour during interaction becomes similar;
for example foot shaking and face touching [CB99], facial expressions, smiling
and gestures [GO06, p. 295]. Also information density is found to become
more similar during dialogue [AJL87]. For verbal behaviour, accommodation
becomes, for example, obvious by the length, duration and frequency of pauses
[GH82, JF70], the duration of utterances [GH82, JF70], for accent [BG77] and
backchannels [SL12].
The goals of CAT are explaining speakers’ linguistic and behavioural choices,
in which ways speakers adjust their speech towards their conversational partner
and also in what ways speech is perceived, evaluated and reacted to [GG13].
In order to create, reduce or maintain social distance speakers use different
strategies, namely convergence, divergence and maintenance.
1. Convergence
Convergence describes a speaker’s adjustment of his or her speaking style
and behaviour to become more similar or synchronous to a conversa-
tional partner [SGLP01]. Therefore individuals adopt each other’s com-
municative behaviour and thus reduce the social distance. Convergence
“is typically associated with affiliation, social approval, compliance, and
communication effectiveness” [PG08, p. 19].
2. Divergence
During the process of divergence, speakers accentuate their individual
distinctiveness [BG77] and emphasize the differences between self and
other [GOG05, SGLP01]. Hereby they display antipathy and social dis-
approval for the conversational partner [SGLP01].
3. Maintenance
The strategy of maintenance of “attempted non-convergence and non-
18

2.1 Communication Accommodation Theory
divergence” [SGLP01, p. 35] describes the behaviour in which a person
persists in his or her original style. The communication behaviour of the
conversational partner is thereby not regarded by the speaker [GOG05].
Reasons for this might be the substantiation of the speaker’s identity or
autonomy without emphasizing it or another possibility might be a lack
of sensitivity [GO06, p. 297]. Maintenance is often regarded similar to
divergence [GO06].
Like divergence, the process of overaccommodation can have a negative ef-
fect for communication [PG08, p. 19]. Overaccommodation is defined as “a
category if miscommunication in which a participant perceives a speaker to
exceed the sociolinguistic behaviours deemed necessary for synchronized in-
teraction” [SGLP01, p. 38]. An example of overaccommodation is patronizing
speech (e.g. nurses speech to elderly clients [EN93] or medical students talking
to patients with disabilities [DBSA11]). Speech then consists of simplified use
of vocabulary and grammar and slow enunciation [PG08, p. 19].
Conversely underaccommodation “specifies communication environments where
speakers do not afford their listeners adequate rights or space in conversational
interaction” [CJ97, p. 243]. Thus a speaker is perceived as not interested in
the conversation or not willing to exert effort for it [SGLP01].
Another strategy similar to divergence is speech complementarity [SGLP01,
GCC91]. Thereby speech is modified in a way which “accentuates valued soci-
olinguistic differences between interlocutors occupying different roles” [SGLP01,
p. 35]. An example for that is a study by Hogg in which men and women
changed speech behaviour during dialogue with each other [Hog85]. Men were
likely to use more masculine sounding voices and women were likely to use
a more female and soft sounding voice than they did in dialogues in which
the conversational partners were of the same sex. This phenomenon can be
explained by traditional sex-role ideologies [GCC91]. A women for example
might try to gain a man’s approval and wants to seem attractive to him and
thus uses a soft voice, but still she might converge to his dialect and/or other
parameters. Thus convergence can be accompanied by speech complementar-
ity.
Accommodation can occur in several dimensions as unimodal or multimodal
accommodation [SGLP01]. Unimodal accommodation describes a change of
only one layer, whereas multimodal accommodation occurs on several layers.
19

2 Accommodation in dialogue
Additionally, accommodation can occur to different degrees, partial (interac-
tion partners converge slightly to each other) or full (behaviour of interaction
partners matches exactly) [SGLP01]. Interactions can also be symmetrical
or asymmetrical [SGLP01, p. 37]. Symmetrical accommodation describes an
interaction in which interaction partners behave equally (e.g. two previously
unknown people that come to be workmates [GP75, p. 177]), whereas in
asymmetrical interaction partners do not (e.g. job candidate and interviewer
[GP75, p. 176]). Additionally, the direction of accommodation can be described
[SGLP01]. Unidirectional accommodation describes the process in which only
one interaction partner accommodates in his or her behaviour, mutual accom-
modation means that both interaction partners accommodate.
Another important distinction is whether convergence or divergence are di-
rected upwards or downwards [GP75, SGLP01, GO06]. Upward convergence
occurs when one speaker adapts the prestige speech patterns of his conver-
sational partner and thus becomes more similar to him or her. Gregory and
Webster, for example, found that the pitch of voice of Larry King, the talk show
host on the CNN (Cabel News Network) Larry King Live talk show, was found
to be an indicator for the social status of his guests [GW96]. While Larry King
would converge to high-status guests, lower-status guests tend to converge to
him. Contrary, downwards convergence implies that one conversational part-
ner converges to the other who possesses less prestigious patterns. Azuma
found occurrence of downwards convergence in speeches of Japan’s emperor
Hirohito after the Pacific War [Azu97]1. Upward divergence then “can be in-
terpreted as indicating the sender’s desire to appear superior to the receiver in
social status and competence” [GP75, p. 178]. Hence the speaker wants to be
recognized as having a higher social status. Also downwards movements exist
- downward divergence then describes the “emphasis of one’s low-prestige mi-
nority heritage” [GO06, p. 295] or “down-to-earthness [and] toughness” [GP75,
p. 178].
Next to form, degree and direction of accommodation, speakers’ motivation
plays a role in CAT. Giles and Powesland distinguish between two kinds of
factors that might affect the speech behaviour of individuals: endogenous fac-
tors and exogenous factors [GP75]. Endogenous factors deal with the speaker’s
“physiological and emotional states at the time of interaction” [GP75, p. 119],
1According to Shepard et al. this result could also reflect overaccommodation on side ofthe conversational partners of Hirohito, who showed upward convergence, while Hirihitoshowed downward convergence [SGLP01, p. 37]
20

2.1 Communication Accommodation Theory
so factors that are internal to the speaker. Anxiety, for example, can thus
influence a speaker’s speech rate and pronunciation and can cause vocal dis-
turbances as well. Exogenous features, on the other hand, “are external to the
sender but present in the immediate social situation” [GP75, p. 118], such as
aspects of topic and context 2.
Beside the internal state of an individual and the context and topic of the
conversation attention has also be paid to the conversational partner. De-
pending on whom individuals are talking to they adjust their speech and be-
haviour. When talking to an unknown person, one of the first clues to the
characteristics of the conversational partner is his or her physical appearance.
Thus one hypothesis is, that sex/gender [NNS02, Par06, Lew12, Bab12], race
[Bab12] and social status [GW96] might play a crucial role in accommodation
[GP75]. Up to now there is no clear evidence for these “macro social factors”
[ACG+11, p. 192] being significant. Furthermore, the experiment by Abrego-
Collier and colleagues showed that neither gender nor the sexual orientation
of the speaker were found to be significant, but the personal opinion about
the speaker, which is built situationally and influences the direction of accom-
modation [ACG+11]. These include speakers’ motivations like proposed in the
Similarity Attraction Hypothesis [Byr71], which states that individuals try to
be more similar to people whom they are attracted to. Other proposed moti-
vations are the need of the speaker to gain approval from the conversational
partner [SG82] and the speaker’s concern for arranging the conversation un-
problematically and smoothly [GGJ+95] and/or to accomplish mutual goals
(as joint project) [Cla96]. It is also possible that speaker’s intelligibility might
increase during the interaction [Tri60] and his or her desire to reduce the social
distance [SGLP01] and to achieve interpersonal liking [CB99, p. 901].
In addition, intervisibility influences accommodation/convergence. Differ-
ences in speech behaviour occurred when individuals were able to see the
person they are listening to. Babel found more convergence in vowel spec-
tra when the participants of her experiment could see a picture of the speaker
who produced the signal [Bab12] and Schweitzer and Lewandowski observed a
higher articulation rate, when individuals were able to see their conversational
partner they are talking to [SL13].
In the following chapter phonetic convergence is described, which is “the
2Due to the fact that topic can influence the individual’s emotional state the distinctionbetween endogenous and exogenous factors can be indistinct.
21

2 Accommodation in dialogue
process in which a talker acquires acoustic characteristics of the individual
they are interacting with” [Bab09, p. 3].
2.2 Phonetic convergence
Phonetic convergence is defined as the increase of segmental and suprasegmen-
tal similarities in speech [Par06] (also called phonetic imitation or phonetic
accommodation [Bab09, Bab12]). Thereby individuals take in the acoustic
characteristics of their conversational partner [Bab09].
When investigating how conversational partners accommodate/converge,
one should also consider the link between perception and production [SF97].
A person has to perceive the speech of the conversational partner in order to
reuse its features in his or her own. It is an open question as to which features
a person relies on. Several studies have investigated individual features:
• VOT [Nie07, Nie10, SF97]
• speech rate [SL12, Web70]
• amplitude:
amplitude envelopes [Lew12]
amplitude contour [Gre90]
• intensity [GH82, Nat75, LH11]
• fundamental frequency [GW96, GDW97, BB11, LH11]
• vowel quality [Bab09, Par10, PGSK12]
• jitter and shimmer [LH11]
• harmonics [LH11]
It might also be possible that speakers perceive (and reuse) not only single fea-
tures, but also different combinations of features. Speaker-specific differences
can also occur. In order to understand how individuals are able to reuse the
perceived features, one has to deal with models of the link between perception
and production. These are discussed in Chapter 3 (The perception of voice).
When dealing with the perception and production of acoustic parameters an
important question that arises is, to what extent are processes of convergence
22

2.2 Phonetic convergence
controllable by the speaker, to what extent are they automatic and what influ-
ence do social factors have? The Communication Accommodation Theory (see
Chapter 2.1) regards changes in behaviour and speech socially motivated and
thus probably subconscious [Bab09, p. 20], whereas the Interactive Alignment
Model by Pickering and Garrod assumes a direct coupling between language
perception and language production processes [PG04].
The model is based on the assumption of Dijksterhuis and Bargh that imi-
tation is purely based on perception and that “no motivation is required, nor
a conscious decision” [DB01, p. 32]. Therefore imitation is a natural and au-
tomatic process with the caveat that other processes can intervene and inhibit
the process of accommodation. Pickering and Garrod adopt this assumption
for speech behaviour (in dialogues) and assume that “production and compre-
hension become tightly coupled in a way that leads to the automatic alignment
of linguistic representations at many levels” [PG04, p. 170] (e.g. syntactic, se-
mantic and phonological levels). Due to the interconnection of these levels
the alignment of one level automatically leads to the alignment of other lev-
els. Agreement on these levels lead to a mutual understanding between the
conversational partners. Aligned situation models, which contain information
about “space, time, causality, intentionality and currently relevant individu-
als” [GP04, p. 8] are the results of the interaction of the conversational partners
[PG04].
Figure 2.1 displays the proposed channels of alignment (by horizontal, dashed
arrows). The “channels are direct and automatic” [PG04, p.177] according to
priming. Priming describes the process by which the “activation of a represen-
tation in one interlocutor leads to the activation of the matching representation
in the other interlocutor directly” [PG04, p. 177]. A representation used for
the purposes of comprehension can then be reused for production. Pickering
and Garrod call this parity [PG04, p. 177]. If parity exists the neuronal infras-
tructure for speaking and listening should be the same [MPG12]. Evidence for
this has been found by Menenti et al. [MPG12] and by Garnier and colleagues
[GLS13]. Proof for automatic and unconscious alignment was also found by
Lewandowski [Lew12]. In her experiments with dialogues of native and non-
native speakers, the native speakers were explicitly instructed not to converge
to the nonnative speakers, but the results indicate that they nevertheless did
so.
In summary, the IAM proposes that the link of perception and production
23

2 Accommodation in dialogue
Figure 2.1: Interaction Alignment Model proposed by Pickering and Garrod[MPG12, p. 2]. Different schematic levels of comprehension and pro-duction are linked with each other. The dashed lines represent thechannels of alignment.
is direct and that alignment is an automatic process. The model has been
criticized due to the fact that no processes or steps exist that could counteract
automatic alignment. According to CAT three different strategies exist: con-
vergence, divergence and maintenance (in order to represent social distance).
If alignment is an automatic process, maintenance and divergence would con-
sequently not be possible because speakers would only be able to converge.
Indeed evidence has been found that linguistic knowledge has influence on
convergence. Nielsen found that participants in her experiment imitated an ex-
tended voice onset time (VOT) after listening to words with extended VOT on
the phoneme /p/, but they did not imitate reduced VOT [Nie07, Nie10]. She
suggests that imitation of the reduced VOT would have introduced phono-
logical ambiguity to the corresponding voiced plosives, while there were no
such ambiguities in imitating extended VOT. Babel also found that speakers
did not imitate all vowels heard from a model talker [Bab09]. These find-
ings indicate that phonetic imitation is not an automatic process, but a se-
lective one that can be modelled through linguistic features. In addition, rat-
ings of mutual attractiveness and/or liking have been found being influential
[ACG+11, Nat75, PG08, SL13].
Hence Krauss and Pardo emphasized the need for a hybrid model “in which
24

2.2 Phonetic convergence
alignment or imitation derives from both the kinds of automatic processes they
[Pickering and Garrod] describe and processes that are more direct or reflec-
tive” [KP04, p. 203] so socially motivated and conscious changes in speech can
also be considered in combination with the unconscious and automatic aspects
of alignment. Lewandowski proposes such a hybrid model [Lew12], which co-
vers different kinds of factors that can influence convergence (see Figure 2.2).
Figure 2.2: Hybrid model of convergence, including automatic and subconsciousfactors [Lew12, p. 205].
In the proposed hybrid model automatic processes and those which are said
to be conscious or rather subconscious are merged. In addition, social as-
pects, the situational context and the speaker’s personality and abilities are
integrated. The model shows that the convergence mechanism automatically
yields convergence, but can be influenced or alleviated through the evalua-
tion of the dialogue partner, the situational context and the speaker himself,
including his personality, psychological features, linguistic prerequisites and
phonetic talent as it has been shown that more phonetically-talented speakers
converge more to their partners than less talented ones (in native-nonnative
dialogues) [Lew12]. Important are also the linguistic prerequisites that speak-
ers have concerning different languages and dialects [Lew12, p. 205]. Linguistic
structures are stored in the speaker as well. Individual differences (personality
and psychological features) of the single speakers form the frame for the de-
gree of convergence. The evaluation of the dialogue partner (e.g. social status
attractiveness, friendliness and sympathy), the situational context and social
goals like the need for social approval are the parameters on which a speaker
25

2 Accommodation in dialogue
evaluates whether to converge, diverge or maintain.
Another important impact on convergence is attention, which “may adjust
the grain of perceptual resolution” [Par06, p. 2389]. If listeners are distracted
and/or do not listen carefully to their conversational partner, speech may not
be perceived in a detailed way. Also the process of the memory plays an
important role as perceived speech modalities and contents are stored there.
Experiments by Gordon and colleagues proved that indeed “attention plays a
role in the perception of phonetic segments and that the relative importance
of acoustic cues depends on the amount of attention that is devoted to the
speech stimulus” [GER93, p. 33].
26

3 The perception of voice
An utterance contains not only linguistic information “but also a great deal
of information for the listener about the characteristics of the speaker him-
self” [Lav68, p. 43]. Thus utterances can convey information from a speaker
to a listener on several layers as an abstract form, containing the structures
of a language, and a discrete form as the produced sounds. Many theories
therefore distinguish the concepts of language, the abstract system of gram-
mar, and speech, the vocal-motor-performance [KS11, p. 303] 1. The layer of
language contains several levels of linguistic information (such as e.g. phono-
logical, morphological, syntactic and semantic levels) which then represent the
content of an utterance [LP05, p. 203]. In other words, the speaker structures
and arranges the intended information, so that the listener can extract the in-
formation. The layer of speech, on the other hand, conveys information about
the speaker him- or herself (next to other parameters, e.g. facial expressions,
gestures, posture, etc.). Abercrombie refers to these conveyed features as in-
dexical properties which “[. . . ] may fulfil other functions which may sometimes
even be more important than linguistic communication, and which can never
be completely ignored” [Abe67, p. 5].
The two concepts of language and speech are carried out simultaneously -
this means that the speaker generates an acoustic signal, the listener receives
this signal and can then extract the information from both sources. Taking
the broad definition of voice2 into account the term voice includes the details
of the vocal fold motions and “the acoustic results of the coordinated action
of the respiratory system, jaw, lips and soft palate, both with respect to their
average values and the amount and pattern of variability in values over time”
[KS11, p. 6]. In this sense voice shares many similarities with the layer of
speech just described.
1Ferdinand de Saussure distinguishes langue et parole [Sau01]. John Laver distinguishesbetween the paralinguistic, extralinguistic and linguistic layers [Lav03].
2The narrow definition of voice is distinguished from speech and synonymously the termlaryngeal source, relating to the vocal fold vibrations exclusively [KS11, p. 5].
27

3 The perception of voice
3.1 Listeners’ judgements from voice
perception
According to the perception of the conversational partner’s verbal an non-
verbal behaviour people are “obliged to make a continuous stream of judge-
ments [. . . ] about a wide spectrum of information” [Lav76/97, p. 31]. Lis-
teners are not only able to draw conclusions from the content of what their
conversational partner is conveying, but also get an impression of his or her
personal characteristics - such as his or her physical and psychological char-
acteristics and social attributes. These conclusions about the conversational
partner “shape our own behaviour into an appropriate relationship with him”
[Lav76/97, p. 31].
Table 3.1 shows some judgements that listeners can make when listening
to voices [KS11, p. 2]. Through the perception of voice listeners get impres-
sions about physiological characteristics of the speaker, such as age and height,
psychological characteristics, such as arousal and stress, as well as social char-
acteristics as the social status. These are not necessarily accurate [KS11, p. 1]
but nevertheless they affect subsequent interaction.
In the Chapters 3.1.1-3.1.3 below, characteristics of the speaker that listeners
can perceive are presented.
3.1.1 Physical characteristics of the speaker
Every vocal tract shows individual differences which leads to acoustically dis-
tinctive speech productions. These differences occur due to anatomical differ-
ences (such as size and shape of the vocal tract) from which listeners can draw
conclusions about the speaker’s age, sex, body size and body height. Krauss
and colleagues found evidence that listeners can identify a speaker (from two
photos shown) from his or her voice better than chance (76.5 %) and that
they can estimate age and height only a little less accurate as from a photo
[KFM02]. A study by Ryalls and colleagues showed that older people exhibit
shorter average positive VOT values for unvoiced plosives [RST04]. They ex-
plain these findings by decreased lung volumes that older speakers often have
and subsequently a lower speaking rate. Studies also showed the development
28

3.1 Listeners’ judgements from voice perception
Physical characteristics of the speakerAgeAppearance (height, weight, attractiveness)Dental/oral/nasal statusHealth statusVocal fatigueIntoxicationRace, ethnicitySexSmoker/non-Smoker
Psychological characteristics of the speakerArousal (relaxed, hurried)CompetenceEmotional status/moodIntelligencePersonalityPsychiatric statusStressTruthfulness
Social characteristics of the speakerEducationOccupationRegional originRole in conversational settingSocial statusSexual orientation
Table 3.1: Judgements listeners can make from voice perception [KS11, p. 2], mo-dified.
of the fundamental frequency for men and women with age are caused by
different ratios of hormones [TE95].
In discriminating races, the distinction between racial profiling, which is
“based on visual cues that result in the confirmation of or in speculation con-
cerning the racial background of an individual or individuals” [Bau00, p. 363],
and linguistic profiling, which is “based upon auditory cues that may be used
to identify an individual or individuals as belonging to a linguistic subgroup
within a given speech community, including a racial subgroup” [Bau00, p. 396],
are made.
Concerning linguistic profiling, evidence has been found that listeners in-
deed can extract information from acoustic cues. Newman and Wu asked
New Yorkers to identify race and national heritage from other New Yorkers
[NW11]. Participants then heard speech samples from Chinese, Korean, Euro-
29

3 The perception of voice
pean, Latino and African Americans and categorized these into black, white,
Hispanic or Asian. Results indicated that judgements thereby were better
than chance. A phonetic analysis showed then that the different speakers dif-
fer in VOT, breathiness of voices, levels of productions of /E/ and /r/ as well
as in rhythm. Ryalls and colleagues also observed that participants with dif-
ferent ethnic backgrounds (Afro-American and Caucasian-American) differed
in their durations of positive and negative VOT [RZB97]. In addition, their
study showed that also sex plays a role on the durations of positive and neg-
ative VOT. Other typical differences for men and women is the fundamental
frequency. Typical values are 120 Hz for men and 210 Hz for women [TE95]3.
Along with age, sex, race and ethnicity, the health status of the speaker can
be heard, as for example vocal diseases of the organic types like polyps (lesion
on the anterior third of the vocal fold [WJM+04, p. 125]) or vocal fold nodules
(symmetric, small lesions occurring on both side of the vocal fold [WJM+04,
p. 125]). They can be caused by vocal overuse like singing, shouting and long
and loud usage of voice. Petrovic-Lazic and colleagues found evidence that
patients with polyps had different values for jitter, shimmer, variation of the
fundamental frequency and harmonics-to-noise ratio (and others) than speak-
ers without polyps and that these values improved after surgery [PLB+09].
Also the dental, oral and nasal status can be heard from voice because the
place and manner of articulation plays a role in sound production (of conso-
nants). Through the modification of the articulators (e.g. lips, teeth, parts
of the tongue, glottis) and also different manners of articulation (e.g. produc-
tion of nasals, plosives, fricatives) different sounds can be produced and it is
possible to deduce information about the status of the speech organs. During
a cold or an allergic reaction, for example, mucous membranes of the upper
respiratory system are swollen, leading to a nasal voice [Lav68, p. 47].
Vocal fatigue, defined as “negative vocal adaptation that occurs as a con-
sequence of prolonged voice use” [WM03, p. 22] such as singing or reading
out loud, also affects voice. Evidence shows that mean fundamental frequency
increases after long periods of reading out text [SSL94]. Reported effects on
jitter, shimmer and harmonics-to-noise ratio differ between studies and exper-
imental settings.
3Statements about the fundamental frequency and the standard deviation differ in litera-ture ([TE95]).
30

3.1 Listeners’ judgements from voice perception
In addition, smoking affects the quality of voice. Several studies showed
that smoking leads to a lowered mean fundamental frequency of speakers
[SH82, MD87] and also differences in harmonics-to-noise ratio and shimmer
[Bra94]. Intoxication can also be perceived by listeners. Alcohol affects hu-
man cognitive, motor and sensory processes and thus leads also to changes
in speech and voice [KS11, p. 357]. Schiel found that listeners can detect al-
coholic intoxication better in female voices than in male voices and better in
read speech than in spontaneous speech [Schi11]. Hollien and colleagues found
that a raise in fundamental frequency, a slow speaking rate and nonfluencies
in speech can be observed for intoxicated participants [HDJ+01].
3.1.2 Psychological characteristics of the speaker
Studying the effects of emotion on voice is difficult because questions arise as
to what exactly emotions are, how many of them exist and what type of fine-
grained distinctions can be made (e.g. anger can be expressed very tempered
and controlled or uncontrolled like in a rage attack). A tendency for affecting
acoustic parameters has been shown in studies for the emotions of sadness,
fear, anger, happiness and boredom. A summary [KS11, p. 321] can be seen
in Table 3.2.
Sadness Fear Anger Joy/ BoredomHappiness
F0 slightly very much very much much lower ormean lower higher higher higher normal
F0 (sightly) wider or much much morerange more narrower wider wider monotone
monotone or normal
F0 downward normal or abrupt smooth, lessvariability/ inflections abrupt changes/ upward variabilitycontour changes/ upward changes
upward inflectionsinflections
Intensity quieter normal louder louder quieter
Speaking slightly much slightly faster or slowerrate lower faster faster slower
Spectral less high- more or more more lessslope frequency less
energy
Table 3.2: Relations between acoustic parameters and emotions, adopted from[KS11, p. 321].
31

3 The perception of voice
The emotions mentioned in Table 3.2, such as sadness and joy/happiness,
can be divided into more active and more passive emotions which can be
distinguished through the level of arousal. Fear, anger, joy and happiness
can be grouped as activation emotions. They exhibit a higher fundamental
frequency (F0), more fundamental frequency variability, faster speech rate,
increased intensity and increases in high-frequency energy [KS11, p. 325]. It
was concluded that there is a direct relation between arousal and physiological
effect [Sch86, WS72]. Emotional arousal cause an increase in aspiration rate as
well as changes in articulation and phonation [Sch03, p. 229]. This leads to an
increase in subglottal pressure, F0 and intensity. Similarly speech durations
between breaths are shortened and the typical speaking rhythm of a speaker
may be altered [KS11, p. 325]. Also, stress as an emotional load, exhibits
a raise in F0 and its standard variation [WJE+02] as well as in amplitude
[SMA+82]. More relaxed emotions, like sadness or quiet happiness, induce a
decreased motor control and less articulatory precision [WS72, p. 1239], which
could lead to increased jitter and shimmer and changes in the contour of the
fundamental frequency [KS11, p. 325].
It can be assumed that acoustic measures are useful identifying arousal,
but do not distinguish between the different emotions. Evidence for this has
been found by Laukka and colleagues [LJB05]. In their experiment, model
talkers spoke a sentence with different emotions (anger, fear, disgust, happiness
and sadness). Afterwards several vocal cues were measured and additionally
listeners had to rate the samples heard on different dimensions (activation,
valence, potency and emotional intensity). The results of their experiment
indicate that cues of activation and emotional intensity largely overlap (e.g.
for high mean and maximum F0, large variability of F0, mean and standard
deviation of intensity). No relation was found between the ratings of the
listener (whether the sentence was positive or negative) when comparing to
the acoustical cues. Laukka et al. conclude that it is possible that they did
not capture all cues that listeners use for their judgements.
Goudbeek and Scherer found that valence and potency might nevertheless
be expressed in voice, although arousal is dominant for many acoustical param-
eters [GS10]. When level of arousal was low, valency was reflected in spectral
slope and variability of intensity and potency was expressed through shimmer.
A high level of arousal was reflected in spectral slope and intensity as, it was in
the low levels of arousal, and additionally in intensity level and spectral noise.
32

3.1 Listeners’ judgements from voice perception
Potency in high levels of arousal was expressed through variability of inten-
sity, spectral shape and the level of fundamental frequency. These findings
indicate that valence and potency can be measured, although they are depen-
dent on arousal. Nevertheless individuals also seem to vary in their expression
of emotion [WS72].
Furthermore, there is evidence that verbal and emotional messages interact
in production. In the experiment of Nygaard and Queen participants were
exposed to spoken words with a happy, sad or neutral meaning (e.g. comedy
and cancer) [NQ08]. The tone of voice of the model talker thereby was congru-
ent or incongruent with the word’s meaning. Participants were able to repeat
the heard words more quickly when they were spoken in a tone of voice that
matched its meaning.
Additionally, there is evidence that the perception of emotions in voice is cul-
ture and language-specific [SBW01]. Scherer et al. let participants from nine
different countries in Europe, North America and Asia listen to speech samples
produced by German actors, spoken in different emotions (anger, sadness, joy,
fear and neutral tone). After listening to a sample participants assigned up
to two emotional labels for the sample heard. Overall, participants from this
experiment were able to infer the emotions with a degree of accuracy better
than chance. In addition, accuracy decreased with increasing language dissim-
ilarity from German. From these results, Scherer et al. concluded that there
are culture- and language-specific paralinguistic patterns which influence the
decoding process in the perception of the listeners.
Another judgement listeners make while listening to voices is about the
personality of a person. Personality itself is a broad concept [KS11, p. 343].
In the following the definition of Kreiman and Sidtis will be used, describing
emotion as a transient state and personality as “the more enduring (but by
no means stable or permanent) aspects of the manner in which individuals
respond to stimuli” [KS11, p. 342].
Evidence that listeners make judgements about the speaker’s personality
was found by Pear [Pea31]. He discovered the existence and importance of vo-
cal stereotyping. In his study judgements about personality were made from
voices of nine different speakers over the radio. Listeners were very accurate at
guessing the sex of the speakers (except for the eleven-year old child), their age
and partly accurate at guessing the profession of the speakers (especially for
the actor and the judge). Errors in guessing the profession of the speakers were
33

3 The perception of voice
nevertheless more or less consistent. More than half of the listeners thought
that the first speaker, a police detective, was working on a farm and most of
them believed that the eighth speaker, an electrical engineer, worked in a man-
ual trade. Although the assumptions of the listeners were not always correct,
they drew conclusions from the voices. Pear thus considers stereotyping as an
important aspect of the perception of personality from voice.
Ko and colleagues tried to determine what information about the speaker,
especially about the speaker’s competence and his or her warmth, can be
inferred by listeners [KJS09]. In their experiment male and female speakers
had to read out resumes with stereotypically masculine or feminine content.
Ratings about competence (associated with assertive and decisive) were solely
affected by vocal femininity (not by sex or type of resume) - thereby voices
rated low in femininity were perceived as more competent. Warm voices,
associative with being supportive and caring, on the other hand, correlated
with high feminine voices. In addition, Ko et al. tested whether femininity
correlated with babyishness and found that vocal femininity had on overlap
with vocal cues of babyishness (associated with weakness and incompetence).
In a study by Berry and et al. similar results were achieved [BHL+94].
Listeners rated voice samples of five-year old children counting to ten according
to competence, leadership, dominance, honesty, warmth, attractiveness and
babyishness. Attractive voices suggested the personality to be competent and
warm and for boys’ voices additionally leading. Babyish voices of boys and
girls were associated with less competence, dominance and leading qualities,
but honesty and additionally warmth for the voices of boys.
Competence is also related to speaking rate - faster rates of speech were
associated with higher competence [SBS75] and social attractiveness [SBP83],
although it needs to be remarked that listeners may perceive speech rate rela-
tive to their own habitual speech rate [SBP83]. Thus judgements about com-
petence and social attractiveness might be dependent on both, speaker and
listener.
In an experiment of Fay and Middleton listeners judged speakers’ intelli-
gence according to read speech [FM40]. To draw a conclusions between the
judgements and the intelligence of the speakers the intelligence quotient (IQ)
of each speaker was measured. Results indicate that listeners were fairly re-
liable in their judgements but that they could judge the intelligence of some
speakers more reliable than those of others and that they rated more intelligent
34

3.1 Listeners’ judgements from voice perception
speakers to be more intelligent in most of the cases. Another result was that
listeners seem to develop stereotypes of superior and inferior intelligence.
The studies described above show that listeners can consistently rate person-
ality traits from voices, although these might not always be accurate, and that
listeners draw stereotypes out of the quality of voices. Also McAleer et al.
found that personality judgements between judges of their experiment were
consistent when listening to the word ’hello’ produced by different speakers
[MATB14].
Additionally, there is evidence that psychiatric diseases often influence voice
parameters. Laukka et al. found that speakers who were afraid of speak-
ing in public due to social phobias exhibited a change in acoustic parameters
after treatment (mean and maximum fundamental frequency, high-frequency
components in the spectrum and pauses) [LLA+08]. Speakers with depression
tended to exhibit an increase in speech rate and a decrease in pausing with
proceeding treatment and mood change as well as a decrease in minimum fun-
damental frequency for women [ES96]. Listeners in the experiment of Todt
and Howell were able to significantly distinguish schizophrenic voices from
non-schizophrenic voices, describing them as more inefficient, despondent, and
moody [TH80]. Studies about the relations of psychiatric disease and voice
characteristics is a difficult field of study as individual differences, inconsistent
longitudinal changes and subjective diagnostic criteria complicate the studies
[KS11, p. 357].
3.1.3 Social characteristics of the speaker
Analyses showed that voices can be associated with social groups. In an ex-
periment of Moreau and colleagues Senegalese and European listeners heard
recordings of Senegalese Wolof speakers, a language mainly spoken in North
Senegal, and had to make statements about their social and caste status
[MTHH14]. Senegalese listeners were able to classify the social status better
than chance as well as European listeners, who did not have prior knowledge
about the Wolof language. The results of this experiment indicate that listen-
ers can, largely independent of knowledge about language structures and thus
relying on acoustic parameters, make statements about the social status of a
speaker.
35

3 The perception of voice
Esling, who recorded male speakers in Edinburgh, found that vocal settings
(modal, creaky, whispery, breathy, harsh voice and combinations of them),
defined by Laver [Lav68], correlated with the socio-economic status of the
speaker [Esl78]. Creaky voices were associated with a higher social status
whereas harsh voices were associated with lower social status.
In the experiment by Gregory and Webster, who analysed speech with long-
term averaged spectra, found that accommodation was dependent on the social
status [GW96]. Speakers with a lower social status converged to speakers with
a higher social status. Dominance also played a role in the experiment of
Gregory and Gallagher [GG02]. They analysed the fundamental frequency of
US presidential candidates of eight elections and discovered that the candidate,
who did not converge in his fundamental frequency, was likely to win the
election. Next to dominance, the role in the conversational setting influences
speech. Pardo found that instruction givers, who had to explain a path in a
map task to another participant of the experiment, converged to the receivers
[Par06]. Still an open question is whether the sex of the speakers plays a
roles in the perception of speaker role as inconclusive results were obtained
regarding this matter [NNS02, PJK10, Lew12].
Linville proved in a perception experiment that female listeners were capable
of making accurate judgements regarding men’s sexual orientation (straight or
gay) [Lin98]. The acoustic analysis found evidence that the phoneme /s/ was
produced differently for straight and gay men. Although speakers tend to per-
ceive the sexual orientation of their conversational partner (or a model talker)
it does not seem to have any influence on accommodation. Abrego-Collier et
al. let participants of their experiment listen to a first-person narrative about
going on a date with different outcomes [ACG+11]. In the negative version
the speaker abandons his date and goes home alone, in the positive version
he goes to the date and they leave together. Additionally the narrative differs
in the sexual orientation of the speaker (“straight” and “gay” condition). In
the experiment VOT of plosives was extended in the recordings. The results
of the experiment indicate that participants with a positive opinion about the
speaker showed an increase in VOT after the experiment. Neither the outcome
of the date nor the sexual orientation are suggested to have had influence on
the participants.
Regional origins, as for example expressed by dialects or accents, can also be
perceived by the listener. Nasalisation characterizes most speakers of Received
Pronunciation (RP) in England, several accents from the United States of
36

3.2 Voice and exemplar theory
America and also Australia. Velarisation, on the other hand, functions as are
regional marker for speakers from Birmingham, England and parts of New
York [Lav68, p. 50].
3.2 Voice and exemplar theory
As the previous chapters (Chapters 4.1.1-4.1.3) show, listeners are capable of
inferring several pieces of information about a speaker from voice perception.
The judgements they make are not necessarily accurate, but nevertheless they
lead to the formation of opinion about the model talker or conversational
partner, which guides further interaction.
In order to evaluate the conversational partner and to accommodate/converge
to his or her speech, listeners have to perceive (parameters of) their conversa-
tional partner’s speech. That means that listeners are able to adopt some of
the acoustic-phonetic features of their conversational partner. Therefore, there
has to be a link between the perception of the characteristics of the speech of
others and one’s own production. Many different models exist that propose
how perception and production are coupled. The present chapter deals with
the perception and storage of voice and voice details. These processes can be
well explained by exemplar theory.
In abstractionist theories the process of normalisation, mapping from speaker-
specific to a speaker-neutral abstraction, is assumed. Thereby voice informa-
tion would be discarded during speech perception and ideal, modality-free units
would be stored in the mental lexicon. According to the vocabulary previously
used, this would then mean that only language (including structure and con-
tent), excluding speech (information about the speaker himself, including voice
details), from the perceived acoustic signal would be kept in memory. Indeed
some experiments show tendencies that talker variability plays a role in mem-
ory, which contradicts the process of normalisation. Exemplar theory suggests
that individuals store detailed instances in memory and that they are able to
compare a new stimulus with these stored instances for perception.
Van Lancker et al. found that listeners were able to recognize voices, even
when played backwards (and thus without any language-specific and phonetic
information) [VLKE85]. Martin et al. had participants try to recall a word
list with monosyllabic English words in the right order [MMPS89]. The word
37

3 The perception of voice
list was either produced by one speaker or by ten different ones (each word
spoken by different speaker). The result of this experiment was that the recall
was better for the participants that listened to the word list produced by one
speaker, but only for items that occurred early in the word list.
In a further experiment Martin et al. let participants run through an addi-
tional preload memory task. Participants were shown digits on a screen and
had to listen to the words list from the previous experiment with one of the
different conditions afterwards. The result of this experiment was that recall of
the digits was better if the word list that was heard afterwards was produced
by one speaker. Martin et al. suggested that the processing of the words
produced by different speakers requires more resources for working memory as
words produced by one speaker.
Goldinger et al. were able to prove some of the results of Martin et al.
[GPL91]. Participants in their experiments also had to recall of a word list
with ten items in the right order. The word lists were also produced by one
speaker or by different speakers (as in the experiment by Martin et al.). The
words were then presented to the participants at varying speeds. At relatively
fast presentation rates, the results are comparable to those of Martin et al.
The recall of the participants was better for the word lists produced by one
speaker than those produced by different speakers. In contrast, recall was bet-
ter for world lists produced by multiple speakers when they were played at slow
presentation rates. Goldinger et al. concluded that voice information (along
with lexical information) is retained in long-term memory when participants
are given sufficient time during rehearsal and that it facilitates the retrieval of
words.
These results of the study could also be proven by Lightfoot, who made
experiments with the familiarity of speakers’ voices [Lig89]. Participants of
her experiments were trained to recognize the voices of different speakers.
Different fictional names were associated with the voices. Word lists produced
by different speakers were then better recalled than word lists produced by
single speakers, even at relatively fast presentation rates. Nygaard et al. also
proved that familiarity with speaker’s voices facilitates the recognition of novel
words produced by familiar voices [NSP94]. They concluded that speaker-
specific information was encoded and retained in long-term memory.
Palmeri et al. also investigated the relationship between word recognition
and the memory of voices [PGP93]. In their experiment, old and new words
38

3.2 Voice and exemplar theory
were presented to the participants, who decided if the word they heard was
new (played for the first time) or old (repetition of an already heard word).
The lag between the words was then manipulated. Up to 64 intervening words
were set between the repetitions of words. The words in the presented word
lists were also uttered by different speakers - participants heard 2, 6, 12 or 20
different voices in one trial (half male and half female). As in the previously
mentioned experiments, repetitions of words uttered by the same voice were
better recognized than those uttered by different voices (independent of sex).
The effect of increasing the number of different voices up to 20 had no effect
on the participants either. Thus it can be supposed that speakers do not
strategically encode voices, because otherwise the increase from 2 to 20 voices
should have impaired their ability to do so. Palmeri et al. thus propose
automatic voice encoding and that detailed voice information is part of the
representations of spoken words that are retained in long-term memory.
Goldinger then investigated how long voice-specific details remain in mem-
ory [Gol96]. To this end, he tested whether participants could still manage to
distinguish old and new words after delays of five minutes, one day and one
week. He also investigated if the advantage of words uttered by the same voice
still remains over time to prove whether same voice repetitions were still better
recognized than different voice repetitions. The results indicate that voice ef-
fects retained up to one week, but that they decrease over time (7.5 % after five
minutes, 4.1 % after one day, 1.6 % after one week). These findings indicate
that episodic traces do not only affect memory, but also influence later percep-
tion. Goldinger defines these episodic traces as “complex perceptual-cognitive
objects, jointly specified by perceptual forms and linguistic functions” [Gol96,
p. 1179]. Thus he supposes that words are recognized against a background of
detailed traces and that the mental lexicon can be viewed as episodic, which
means that memories decay.
Goldinger then tested if these traces affect not only later perception but
also speech production [Gol98]. Participants were asked to produce words
that were shown to them on a computer screen. The words had different fre-
quencies (high frequent, medium high frequent, medium low frequent and low
frequent), following the assumption that low frequent words are affected more
easily, because they are not represented by so many exemplars as high frequent
words [Pie01, Hin86]. Afterwards the participants listened to different speakers
who produced the same words several times (2, 6 or 12 repetitions). Partici-
39

3 The perception of voice
pants then heard the words again and repeated them with different delays in
an immediate or delayed shadowing task. In a following AXB-perception test
the produced baseline words (A) were compared against the shadowed word
productions (B). Listeners therefore had to judge which of these productions
sounded more similar to the stimulus words in the shadowing task (X). Re-
sults indicate that participants sounded more like the samples that they were
exposed to and that indeed low frequency words, that are heard with a high
repetition rate, invoked strong imitation in the immediate shadowing condi-
tion. Thus Goldinger supposes different degrees of imitation and that variables
such as word frequency, number of exposures and response timing also play a
role.
It is worth noting that a distinction should be made between imitation
and convergence. “Imitation is a fully conscious and controlled action in a
controlled setting, whereas convergence happens rather naturally and without
full awareness or control” [Lew12, p. 79]. Nevertheless, one can assume that
similar tendencies exist for both.
Furthermore Goldinger explored the relationship between speech imitation
and attention [Gol13]. He had participants record baseline productions of
words. Afterwards they heard a speaker uttering one of these words and they
had to click on the related picture from a collection displayed on a screen. The
experiment had different conditions - in the first condition, the competitive
objects on the screen were dissimilar in visual and phonological form, in the
second, objects were phonologically similar (e.g. beetle, beater, beaker, beach-
ball, etc.), while in the third objects were visually similar (e.g. all objects
are rounded, examples are cookie, coin, pizza, etc.). In a following AXB-
perception test listeners then rated whether the produced baseline word or the
re-recorded words were more similar to the target word. Results indicate that
imitation increased when competitors (visual, phonological) were present and
that this increase is even stronger for phonologically similar objects. Goldinger
supposes that attention to the speech signal was modulated by the challenge
of the search task. If the participants needed to carefully monitor speech to
locate the appropriate targets, they created episodic traces very rich in detail
that supported better imitation.
The above described findings support the idea that the mental lexicon is
composed of detailed traces of past experiences. Thus, not abstract units, but
rather individual exemplars are stored, which serve then as the basis of recog-
40
3.2 Voice and exemplar theory
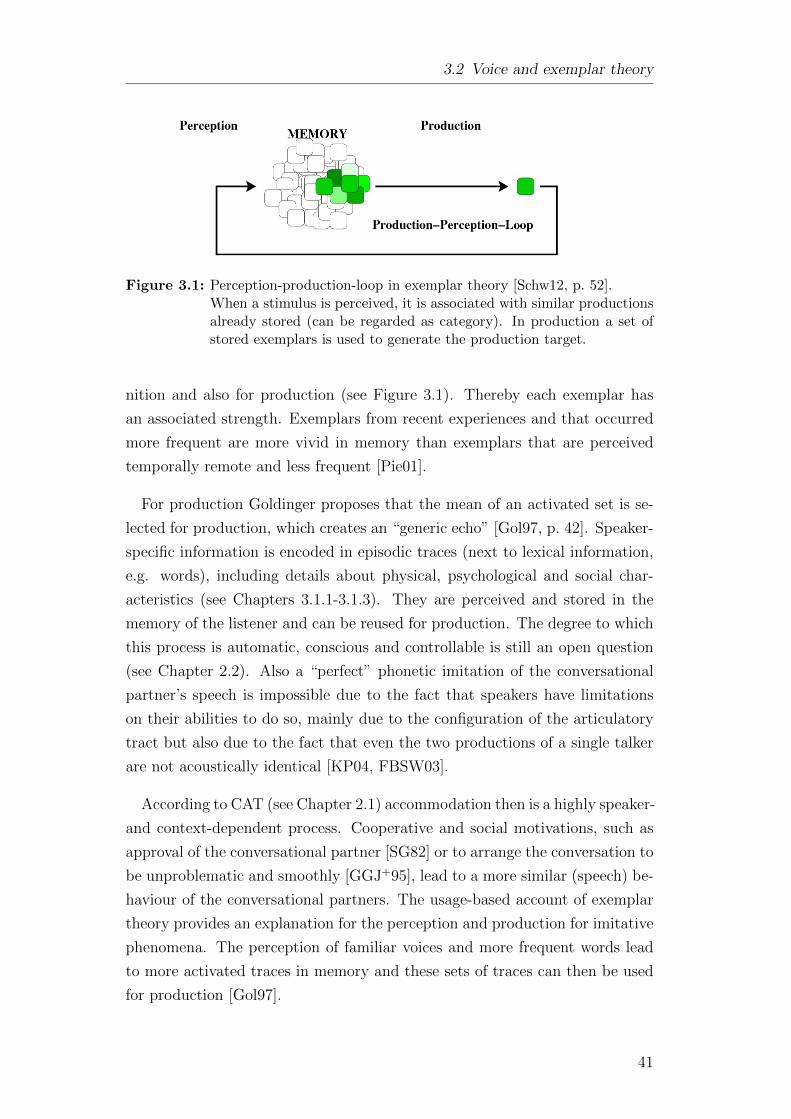
Figure 3.1: Perception-production-loop in exemplar theory [Schw12, p. 52].When a stimulus is perceived, it is associated with similar productionsalready stored (can be regarded as category). In production a set ofstored exemplars is used to generate the production target.
nition and also for production (see Figure 3.1). Thereby each exemplar has
an associated strength. Exemplars from recent experiences and that occurred
more frequent are more vivid in memory than exemplars that are perceived
temporally remote and less frequent [Pie01].
For production Goldinger proposes that the mean of an activated set is se-
lected for production, which creates an “generic echo” [Gol97, p. 42]. Speaker-
specific information is encoded in episodic traces (next to lexical information,
e.g. words), including details about physical, psychological and social char-
acteristics (see Chapters 3.1.1-3.1.3). They are perceived and stored in the
memory of the listener and can be reused for production. The degree to which
this process is automatic, conscious and controllable is still an open question
(see Chapter 2.2). Also a “perfect” phonetic imitation of the conversational
partner’s speech is impossible due to the fact that speakers have limitations
on their abilities to do so, mainly due to the configuration of the articulatory
tract but also due to the fact that even the two productions of a single talker
are not acoustically identical [KP04, FBSW03].
According to CAT (see Chapter 2.1) accommodation then is a highly speaker-
and context-dependent process. Cooperative and social motivations, such as
approval of the conversational partner [SG82] or to arrange the conversation to
be unproblematic and smoothly [GGJ+95], lead to a more similar (speech) be-
haviour of the conversational partners. The usage-based account of exemplar
theory provides an explanation for the perception and production for imitative
phenomena. The perception of familiar voices and more frequent words lead
to more activated traces in memory and these sets of traces can then be used
for production [Gol97].
41

3 The perception of voice
The following chapter describes parameters of voice which were investigated
in this thesis. Thereby the Praat Voice Report was used for samples extracted
from the GeCo corpus of spontaneous German conversations. The leading
hypothesis for the study was that conversational partners exhibit changes in
parameters of voice while having a dialogue. The speakers thus were expected
to react to the conversational partner and to situational aspects. These reac-
tions can be mirrored in the quality of voice. The study was supposed to show
on which parameters of voice (parameters of the fundamental frequency, jitter,
shimmer, harmonics-to-noise ratio) changes occur.
42
4 Method
In Chapter 4.1 the Praat Voice Report and the voice parameters of fundamental
frequency, perturbation and harmonicity are described. Further, in Chapter
4.2, the GeCo corpus and the analysis of the corpus are presented.
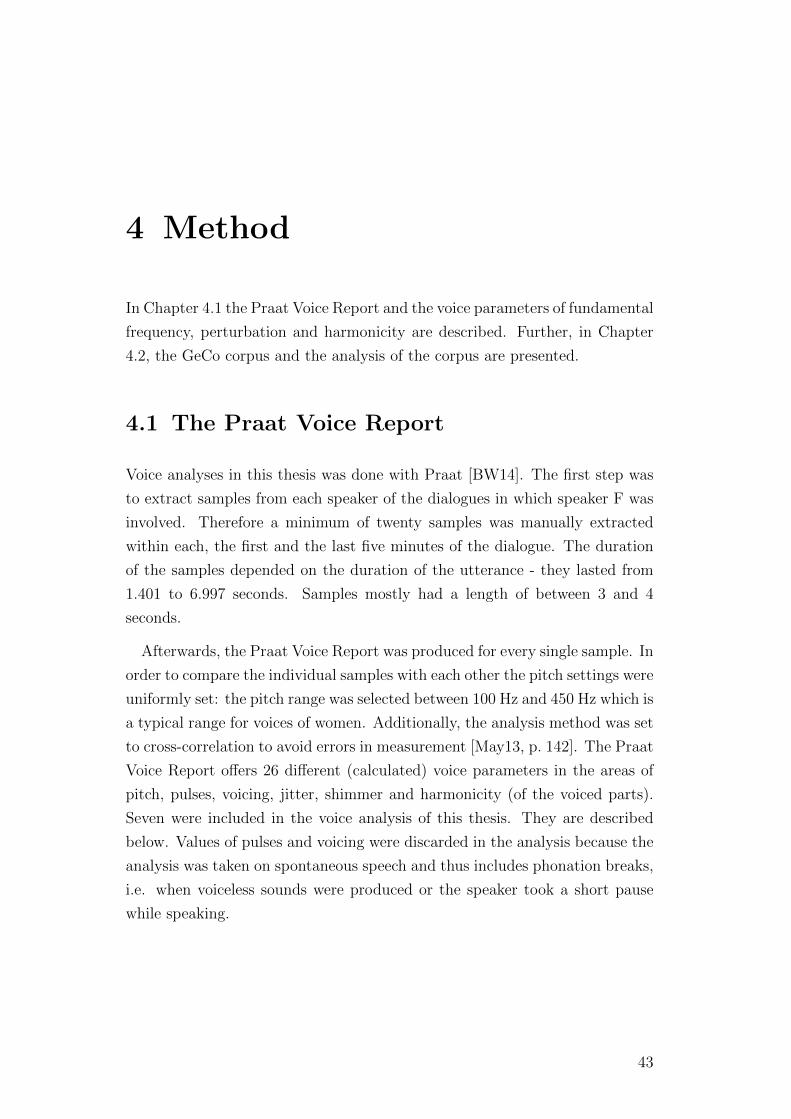
4.1 The Praat Voice Report
Voice analyses in this thesis was done with Praat [BW14]. The first step was
to extract samples from each speaker of the dialogues in which speaker F was
involved. Therefore a minimum of twenty samples was manually extracted
within each, the first and the last five minutes of the dialogue. The duration
of the samples depended on the duration of the utterance - they lasted from
1.401 to 6.997 seconds. Samples mostly had a length of between 3 and 4
seconds.
Afterwards, the Praat Voice Report was produced for every single sample. In
order to compare the individual samples with each other the pitch settings were
uniformly set: the pitch range was selected between 100 Hz and 450 Hz which is
a typical range for voices of women. Additionally, the analysis method was set
to cross-correlation to avoid errors in measurement [May13, p. 142]. The Praat
Voice Report offers 26 different (calculated) voice parameters in the areas of
pitch, pulses, voicing, jitter, shimmer and harmonicity (of the voiced parts).
Seven were included in the voice analysis of this thesis. They are described
below. Values of pulses and voicing were discarded in the analysis because the
analysis was taken on spontaneous speech and thus includes phonation breaks,
i.e. when voiceless sounds were produced or the speaker took a short pause
while speaking.
43

4 Method
Fundamental frequency (F0)
When sounds in human speech are voiced, the vocal folds in the larynx vi-
brate. These vibrations can be described as a complex quasi-periodic wave
[Joh03]. The fundamental frequency (F0), measured in Hertz (Hz), is then
the number of repetitions of this complex wave per second. Furthermore, the
fundamental frequency is the first and lowest frequency in the signal. It is
called quasi-periodic because in the strict mathematical sense the waves are
not perfectly periodic due to the not perfect identical periods. Nevertheless
the waves are periodic enough for the perception of a clear sound and the
identification of the fundamental frequency [May13, p.144]. Acoustically the
fundamental frequency is correlated with the perception of pitch in the voice.
The mean fundamental frequency (F0 Mean) was in the analysis.
The standard deviation of the fundamental frequency (F0 SD) is the second
value taken in the analysis of the fundamental frequency. It shows how much
the fundamental frequency deviates from the mean fundamental frequency (F0
Mean). The minimum (F0 Min) and the maximum (F0 Max), also included
in the present analyses, describe the range of voice of a speaker. A small
range stands for little variation, i.e. monotonous speech, and a large range
represents more variation, i.e. lively speech. The standard deviation is linked
to the minimum and the maximum.
Perturbation
Due to the quasi-periodicity of the sound waves, it is common for several
deviations in the duration, frequency and amplitude to occur with respect
to their neighbouring periods (perturbations). Deviations in the fundamental
frequency are called jitter and deviations in the amplitude are called shimmer,
which are declared in percent (%). To a certain extent, jitter and shimmer
are normal in the human voice. They can also be affected through influences
on the vocal folds (e.g. smoking affects shimmer values [Bra94]). Very high
values, which can be observed in pathological voices, lead to the impression of
a breathy, rough or hoarse voices [FHE07].
Different algorithms exist in Praat and other programs to calculate values
for jitter and shimmer. In general, the values for shimmer and jitter are better
the smaller they are [May13, p. 145]. The Multi-Dimensional Voice Program
44

4.1 The Praat Voice Report
Figure 4.1: Shimmer: perturbation of amplitude, jitter: perturbation of frequency[May13, p. 144] (modified).
(MDVP) measures jitter and shimmer with equal algorithms as Praat, except
for differences in the measurement on the previous step, the detection of pe-
riods in the acoustic signal. Praat is wave-form matching, while MDVP is
peak-picking [Boe09]. This difference leads to dissimilar results. MDVP pro-
poses a threshold for jitter (Jitt) of 1.04 % for the classification of healthy
and pathological voices. This threshold is not valid for calculations done with
Praat. The value for healthy voices for jitter (Jitter (local)) here probably has
to be lower than 1.0 % [May13, p. 145] 1.
The MDVP threshold value for shimmer (Shim) 3.81 % can also be cau-
tiously taken for the Praat value Shimmer (local) [May13, p. 156]. Nawka et
al. propose a value under 2,5 % [NFG06, p. 18]. Other factors, that may play
a major role for the values of jitter and shimmer, are the recording hardware
(e.g. microphone) and the sampling rate of the signal, which can also have an
influence on the calculation of the acoustic parameters [May13, p. 140].
These values are often valid for clear and well articulated speech, e.g. the
articulation of a vowel held for a few seconds. The participants of the experi-
ment produced spontaneous speech and thus the values for jitter and shimmer
are not expected to match the thresholds for pathological voices, but to be
higher instead.
The Praat Voice Report offers five different values for jitter (Jitter (local),
Jitter (local, absolute), Jitter (rap), Jitter (ppq5), Jitter (ddp)) and six different
values for shimmer (Shimmer (local), Shimmer (local, dB), Shimmer (apq3),
Shimmer (apq5), Shimmer (apq11), Shimmer (dda)). The difference between
1Mayer proposes values for healthy voices between 0.5 and 1 % [May13, p. 145],Nawka et al. propose values between 0.1 and 1 % [NFG06, p. 18].
45

4 Method
these values stems from their calculation with different algorithms. It is unclear
which value describes the phenomena best. For this thesis the values of Jitter
(local) and Shimmer (local) were chosen. Jitter(local) is the average absolute
difference between consecutive periods, divided by the average period [Boe11],
Shimmer(local) is the average absolute difference between the amplitude of the
consecutive periods, divided by the average amplitude [Boe03].
Harmonicity
Harmonicity is defined as the proportion of harmonic and non-harmonic (noisy)
parts of a signal [May13, p. 145]. Based on the assumption that an acoustic
signal can be divided into harmonic and non-harmonic parts, the noise-to-
harmonics ratio (NHR) (proportion of non-harmonics to harmonics) and the
harmonics-to-noise ratio (HNR) (proportion of harmonics to non-harmonics)
can be calculated. Bigger parts of non-harmonics are often perceived as aspi-
rated speech and hoarseness [YSO84, YWB82].
Next to NHR and HNR the Praat Voice Report gives the value of mean
autocorrelation, which measures the similarity between neighbouring periods
and returns the probability of their agreement [May13, p. 145]. In this thesis
the value of HNR (in decibel dB) is used, i.e. the degree of periodicity. The
threshold value for the classification of healthy and pathological voices is under
20 dB [MS08, p. 26]. A disadvantage of the HNR measure is the dependency
on minimal perturbations of frequency and amplitude (jitter and shimmer)
[Mur99, FMK98] 2.
4.2 Corpus analysis
The German conversations corpus (GeCo) was recorded by Schweitzer and
Lewandowski from the Institute for Natural Language Processing of the Uni-
versity of Stuttgart in 2013 [SL13, SLD14]. Previously unacquainted women
were asked to have a conversation with each other about topics of their choos-
ing. All of them were native speakers of German. The dialogues were then
recorded for about 25 minutes in a sound-attenuated room under two different
2Yumoto et al. suggested that jitter contributes to the magnitude of the noise componentsin the harmonics-to-noise-ratio (HNR) [YSO84].
46

4.2 Corpus analysis
conditions: a unimodal and a multimodal condition. In the unimodal condi-
tion the participants were not able to see each other but they were able to
listen and to talk to their conversational partner via head-set microphones.
In the second round, the multimodal condition, the participants were able to
see each other through a transparent screen. The analyses for this thesis were
done on the multi-modal condition of the dialogues, due to the fact that that
multimodality is known to increase convergence even in the speech modality
[DR10, SL13, Bab12]. Each of the the eight participants then had a total of
six dialogues with other participants. Thus a total of 24 dialogues was pro-
duced. For the analyses of this thesis the dialogues with speaker F and her
conversational partners were chosen (six dialogues, see Figure 4.2).
F J
KA
C
D H
Figure 4.2: Dialogues of speaker F with six different conversational partners.
After the recordings the participants filled in a questionnaire in which they
rated their conversational partners [SL13]. They had to make statements about
their impressions of the partner’s social attractiveness (likeable, kind, social,
relaxed) and her competence (intelligent, competent, successful, self-confident)
on a 5-point Likert scale. These values were then transformed to values from
-2 and 2 and added afterwords to a composite overall likeability score with a
range from -8 to 8. The values for social attractiveness and competence are
included in the discussion of results (Chapter 6.2.1).
For the analysis, samples of each speaker from each of the chosen dialogues
(every dialogue with speaker F) were manually extracted. Therefore a min-
imum of twenty samples were taken from each the first five minutes of the
dialogue as well as the last five minutes. This was done in order to compare
the voice quality from the beginning and the end of the dialogue. Samples
47

4 Method
which contained laughter, breathing or very glottalized speech were discarded.
Afterwards a Praat Voice Report was generated from each sample. The data
was then entered in IBM SPSS Statistics 21 [Inc12].
In order to detect outliers boxplots were generated (see Figure 4.3). Outliers
are defined as values that fall more than 1.5 to 3 box lengths from the upper
or lower hinge of the box. They are marked by a circle (◦). Extreme outliers
then are values that are more than 3 box lengths away from either hinge of
the box, marked by a star (∗) [JL13, p. 242]. Table 4.1 shows the sum of
the outliers and extreme outliers found for the beginnings and ends of the
individual speakers.
Figure 4.3: The boxplot represents the values of the minimal fundamental fre-quency from the beginning of the dialogue of speaker F with speakerJ. It includes the sample 2 with the error in measurement (see Figure6.1) which is classified as an extreme outlier.
Overall, extreme outliers were discarded in the analyses. A different proce-
dure in sorting out the outliers was made in the sample collections for each
speaker in the individual dialogues (about 20 samples for beginning/end for
each speaker) and the sample collection of speaker F (about 130 samples for
beginning/end). This means that some samples that are discarded for speaker
F in the individual dialogues are included in the sample collection of speaker F
for all dialogues. The reason for discarding outliers separately was that speaker
F might have shown an abnormal value in one of the parameters in a single
48
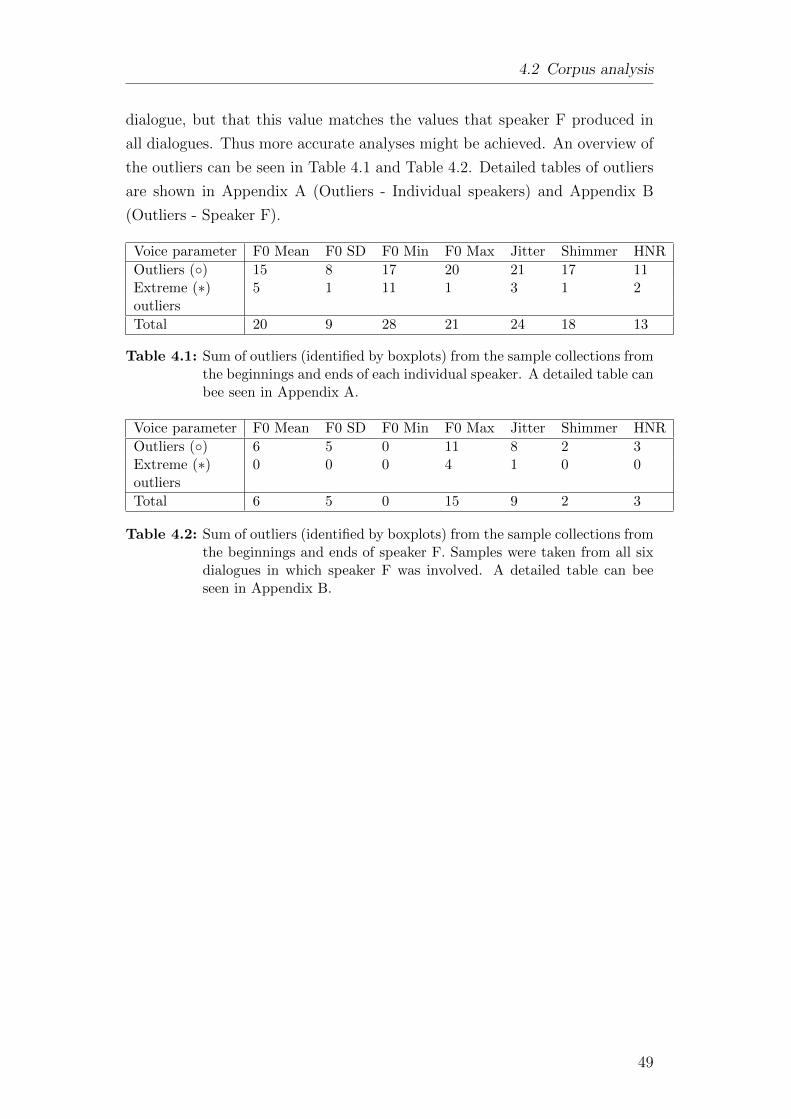
4.2 Corpus analysis
dialogue, but that this value matches the values that speaker F produced in
all dialogues. Thus more accurate analyses might be achieved. An overview of
the outliers can be seen in Table 4.1 and Table 4.2. Detailed tables of outliers
are shown in Appendix A (Outliers - Individual speakers) and Appendix B
(Outliers - Speaker F).
Voice parameter F0 Mean F0 SD F0 Min F0 Max Jitter Shimmer HNR
Outliers (◦) 15 8 17 20 21 17 11Extreme (∗) 5 1 11 1 3 1 2outliers
Total 20 9 28 21 24 18 13
Table 4.1: Sum of outliers (identified by boxplots) from the sample collections fromthe beginnings and ends of each individual speaker. A detailed table canbee seen in Appendix A.
Voice parameter F0 Mean F0 SD F0 Min F0 Max Jitter Shimmer HNR
Outliers (◦) 6 5 0 11 8 2 3Extreme (∗) 0 0 0 4 1 0 0outliers
Total 6 5 0 15 9 2 3
Table 4.2: Sum of outliers (identified by boxplots) from the sample collections fromthe beginnings and ends of speaker F. Samples were taken from all sixdialogues in which speaker F was involved. A detailed table can beeseen in Appendix B.
49


5 Results
Three statistical analyses were done with IBM SPSS Statistics 21 [Inc12]. Dif-
ferences were calculated with the help of paired t-tests and ANOVAs (analysis
of variance). Thereby values below or equal 0.05 are considered to be signifi-
cant. The goals of the analyses were the following:
• Analysis 1: Individual speakers
Samples from the beginning and the end for each speaker in each dialogue
were compared with each other with the help of paired t-tests. Significant
parameters were supposed to have changed over the course of the dialogue
(according to accommodation to the conversational partner). In this
analysis the individual speakers in the different dialogues were in the
focus. The goal was to find out which voice parameters changed in each
dialogue for each speaker.
• Analysis 2: Speaker F
All samples that speaker F uttered in the beginnings of the six dialogues
were compared with all samples from the ends with the help of paired t-
tests. The goal of this analysis was to identify those parameters speaker
F changed in all dialogues she had with different conversational partners.
• Analysis 3: Position in dialogue
Samples from the conversational partners in the individual dialogues were
compared between the beginning and the end of the conversation with the
help of ANOVAs. It is supposed that some parameters have changed from
the beginning and the end of the dialogue in order of accommodation.
In the following chapters (Chapters 5.1-5.3) the results of the analyses are
described.
51

5 Results
5.1 Analysis 1 - Individual speakers
In this section, samples from the beginnings and ends of the dialogues are
compared with each other for every individual speaker within the dialogues.
Paired t-tests were used to show which parameters changed for the individual
speakers during the dialogues. In the following the speakers F and D in their
conversation are analysed. The results of the other five dialogues are shown in
the summarizing Table 5.6.
Speaker D
Table 5.1 shows the descriptive statistics for the mean values of speaker D in
the dialogue with F. In Table 5.2 the results of the paired t-tests for speaker D
at the beginning and the end of the dialogue with speaker F are presented.
Parameter Position Mean N SD St. Error Mean
Pair 1 F0 Mean beginning 231.44841 22 19.494032 4.156142end 232.93950 22 12.807842 2.730641
Pair 2 F0 SD beginning 20.93773 22 6.026298 1.284811end 28.94427 22 12.411122 2.646060
Pair 3 F0 Min beginning 182.06523 22 18.481850 3.940344end 154.76977 22 50.631920 10.794762
Pair 4 F0 Max beginning 313.69659 22 31.624643 6.742397end 330.85964 22 31.889633 6.798893
Pair 5 Jitter beginning 1.83905 22 0.375192 0.079991end 1.85718 22 0.377235 0.080427
Pair 6 Shimmer beginning 7.05686 22 1.272993 0.271403end 6.75695 22 0.938097 0.200003
Pair 7 HNR beginning 18.75591 22 1.531032 0.326417end 18.39091 22 1.756843 0.374560
Table 5.1: Mean, standard deviation (SD) and standard error mean for the com-parison of the samples of speaker D from the beginnings and ends of thedialogue with speaker F.
Results show that speaker D changed on the variability of F0 (see Table 5.2)
as significant changes were found for F0 SD (0.021), F0 Min (0.029) and F0
Max (0.049). The mean values (see Table 5.1) show that F0 Min decreased
between beginning and end (from 182.07 Hz to 154.77 Hz) and F0 Max in-
creased (from 313.70 Hz to 330.86 Hz). As a consequence also the value of F0
SD increased from (20.94 Hz to 28.94 Hz).
52

5.1 Analysis 1 - Individual speakers
Mean SD Std. t df Sign.Error (2-tailed)Mean
Pair 1 F0 Mean -1.491091 18.110810 3.861238 -0.386 21 0.703Pair 2 F0 SD -8.006545 15,100058 3.219343 -2.487 21 0.021Pair 3 F0 Min 27.295455 54.519820 11.623665 2.348 21 0.029Pair 4 F0 Max -17.163045 38.508415 8.210022 -2.090 21 0.049Pair 5 Jitter -0.018136 0.422668 0.090113 -0.201 21 0.842Pair 6 Shimmer 0.299909 1.602436 0.341641 0.878 21 0.390Pair 7 HNR 0.365000 2,283732 0.486893 0.750 21 0.462
Table 5.2: Results of the paired t-tests, comparing samples of speaker D from thebeginning and the end. Significant changes were found for F0 SD, F0Min and F0 Max.
Speaker F
The results of speaker F, comparing samples from the beginning and the ends of
the conversation with speaker D, are shown in Table 5.4. Similar as for speaker
D the values of F0 SD (0.000) and F0 Min (0.001) were shown to be highly
significant. Mean values from Table 5.3 show that F0 Min increased from the
beginning to the end (from 97.03 Hz to 133.15 Hz) and (as a consequent effect)
F0 SD decreased (from 39.26 Hz to 22.53 Hz).
Parameter Position Mean N SD St. Error Mean
Pair 1 F0 Mean beginning 217.70765 20 19.166114 4.285673end 210.76340 20 21.706531 4.853728
Pair 2 F0 SD beginning 39.25525 20 11.712071 2.618899end 22.53040 20 8.312417 1.858713
Pair 3 F0 Min beginning 97.02540 20 6.125833 1.369778end 133.15010 20 37.985685 8.493857
Pair 4 F0 Max beginning 321.69335 20 60.458571 13.518947end 295.60210 20 61.244963 13.694790
Pair 5 Jitter beginning 1.84015 20 0.447757 0.100121end 1.94725 20 0.447375 0.100036
Pair 6 Shimmer beginning 7.18625 20 1.548080 0.346161end 6.81760 20 1.302867 0.291330
Pair 7 HNR beginning 20.02490 20 1.841146 0.411693end 20.26540 20 1.821685 0.407341
Table 5.3: Mean, standard deviation (SD) and standard error mean for the com-parison of the samples of speaker F from the beginnings and ends of thedialogue with speaker D.
53

5 Results
Mean SD Std. t df Sign.Error (2-tailed)Mean
Pair 1 F0 Mean 6.944250 22.846937 5.108730 1.359 19 0.190Pair 2 F0 SD 16.724850 13.373057 2.990306 5.593 19 0.000Pair 3 F0 Min -36.124700 41.604984 9.303157 -3.883 19 0.001Pair 4 F0 Max 26.091250 69.397917 15.517846 1.681 19 0.109Pair 5 Jitter -0.107100 0.600917 0.134369 -0.797 19 0.435Pair 6 Shimmer 0.368650 2.094771 0.468405 0.787 19 0.441Pair 7 HNR -0.240500 2.701613 0.604099 -0.398 19 0.695
Table 5.4: Results of the paired t-tests, comparing samples of speaker F from thebeginning and the end within the dialogue with speaker D. Significantchanges of F0 SD and F0 Min were found.
Table 5.5 shows a summary of the results of the paired t-tests compar-
ing samples from the beginning of speaker D and speaker F. Both exhibited
changes in the values of F0, namely F0 SD and F0 Min. Speaker D also showed
significant changes in F0 Max. While F0 variation increased for speaker D, it
decreased for speaker F.
Speaker F0 Mean F0 SD F0 Min F0 Max Jitter Shimmer HNR
D ∗ ∗ ∗F ∗ ∗
Table 5.5: Significant changes of voice correlates for the speakers D and F in theirdialogue. Significant values are marked by ∗.
54

5.1 Analysis 1 - Individual speakers
Summary of the results
Table 5.6 shows a summary of the results of the paired t-tests for all dialogues.
Samples from the beginning and the end for each speaker within the single
dialogues were compared. Detailed results of the analyses can be found in
Appendix C.
Speaker F0 Mean F0 SD F0 Min F0 Max Jitter Shimmer HNR
A (∗) ∗F ∗ ∗ ∗CF (∗) ∗D ∗ ∗ ∗F ∗ ∗H ∗F
J (∗) (∗) ∗ ∗F (∗)
KF ∗ ∗
Table 5.6: Significant changes of voice correlates for each speaker within the singledialogues. Significant values are marked by ∗, tendencies are marked by(∗).
In the dialogue between the speakers A and F HNR showed to be signifi-
cant (0.026) for speaker A. From the beginning to the end of the dialogue it
increased from 15.71 dB to 16.79 dB. Shimmer exhibited a tendency towards
being significant (0.066). It decreased from 9.50 % to 8.71 %. Speaker F had
significant changes in the values of F0, namely F0 SD (0.004), F0 Min (0.020)
and F0 Max (0.007). As F0 Min increased (from 129.02 to 150.67 Hz) and F0
Max decreased (from 299.24 Hz to 266.68 Hz), F0 SD decreased (from 27.24 Hz
to 16.95 Hz). The conversational partners did not exhibit changes on the same
parameters. Detailed results of the paired t-tests can be seen in Appendix
C.1.
Speaker C in the dialogue with speaker F showed no significant changes at
all. Speaker F changed on values of F0. F0 Min changed significantly (0.004)
as it decreased (from 131.65 Hz to 101.66 Hz) and F0 Mean showed a tendency
towards being significant (0.061) as it also decreased (from 203.54 Hz to 194.65
Hz). In Appendix C.2 detailed results are presented.
55
5 Results
In the dialogue of speaker H and F only speaker F changed significantly on
the parameter of F0 SD (0.037) as it decreased (from 15.51 Hz to 14.28 Hz).
Detailed results of the paired t-tests are shown in Appendix C.3.
Speaker J in the dialogue with F exhibited changes on the values of F0. F0
Mean (0.054) and F0 SD (0.053) showed a tendency towards being significant
and F0 Min (0.007) and F0 Max (0.032) proved to be significant. As F0 Min
increased (from 121.85 Hz to 147.47 Hz) and F0 Max decreased (from 352.53 Hz
to 324.47 Hz), F0 SD decreased (35.58 Hz to 29.16 Hz). F0 Mean also decreased
from (229.59 Hz to 219.89 Hz). Speaker F, in the same dialogue, exhibited a
tendency for a significant change on the parameter of F0 Min (0.056). It
decreased (from 163.30 Hz to 141.98 Hz). Appendix C.4 shows detailed results
for the values of speaker J and F.
In the dialogue between the speakers K and F only speaker F significantly
changed on F0 SD (0.014) and HNR (0.044). F0 SD decreased (from 24.11 Hz
to 18.62 Hz) and HNR increased (19.18 db to 20.46 Hz). Detailed results are
presented in Appendix C.5
The results of the analyses of the single speakers within dialogues, summa-
rized in Table 5.6, show that there is on overall tendency for F0 towards being
significant, especially F0 SD and F0 Min (as they both have been significant
five times each and showed a tendency towards being significant once). Also
there have been significant changes in F0 Max (three times) and HNR (two
times). Shimmer and F0 Mean showed a few tendencies towards being sig-
nificant (F0 Mean two times, Shimmer one time), whereas jitter was never
significant. Conversational partners did not changed on the same voice pa-
rameters (e.g. in the dialogue of the speakers A and F). In addition, speaker
F, involved in all six dialogues, mainly changed on F0, but did not change in
every dialogue.
5.2 Analysis 2 - Speaker F
The second analysis was done with the help of paired t-tests. Samples from
the beginning and end from speaker F from all dialogues were taken (resulting
in 137 samples for the beginning and 129 for the end; less discarded extreme
outliers). The descriptive statistics in Table 5.7 shows the mean values for
each voice parameter for the beginnings and ends for all six dialogues in which
56

5.2 Analysis 2 - Speaker F
speaker F was involved. The results of the paired t-tests can be seen in Ta-
ble 5.8 and a summary of the results in Table 5.9. Calculating the difference
between voice parameters from the beginning and the end showed on which
voice parameters speaker F changed.
Parameter Position Mean N SD St. Error Mean
Pair 1 F0 Mean beginning 209.5415 129 17.53992 1.54430end 202.31087 129 17.387400 1.530875
Pair 2 F0 SD beginning 26.4872 129 12.52197 1.10250end 19.70573 129 8.460571 0.744912
Pair 3 F0 Min beginning 133.6174 129 34.14449 3.00625end 140.74980 129 33.644801 2.962260
Pair 4 F0 Max beginning 293.9802 125 45.59580 4.07821end 267.53874 125 27.025453 2.417230
Pair 5 Jitter beginning 2.0738 128 0.51661 0.04566end 2.04703 128 0.547375 0.048382
Pair 6 Shimmer beginning 7.4931 129 1.51279 0.13319end 7.29301 129 1.617199 0.142386
Pair 7 HNR beginning 19.3451 129 2.17308 0.19133end 19.77159 129 2.184534 0.192338
Table 5.7: Mean, standard deviation (SD) and standard error mean for the com-parison of the samples of speaker F from the beginnings and the endsof the dialogues. All values from all six dialogues were taken.
Mean SD Std. t df Sign.Error (2-tailed)Mean
Pair 1 F0 7.230597 23.929435 2.106869 3.432 128 0.001Pair 2 F0 SD 6.781465 13.449280 1.184143 5.727 128 0.000Pair 3 F0 Min -7.132411 47.969186 4.223451 -1.689 128 0.094Pair 4 F0 Max 26.441448 49.541430 4.431120 5.967 124 0.000Pair 5 Jitter 0.026789 0.735625 0.065021 0.412 127 0.681Pair 6 Shimmer 0.200124 2.199984 0.193698 1.033 128 0.303Pair 7 HNR -0.426535 3.063233 0.269703 -1.582 128 0.116
Table 5.8: Results of the paired t-tests, comparing parameters from samples fromthe beginning and end of speaker F of all dialogues. F0 Mean, F0 SDand F0 Max have shown to be significant.
Speaker F0 Mean F0 SD F0 Min F0 Max Jitter Shimmer HNR
F ∗ ∗ ∗
Table 5.9: Significant changes of voice correlates for speaker F. Significant valuesare marked by ∗.
The overall analyses for speaker F showed that she changed significantly on
F0, namely F0 Mean (0.001), F0 SD (0.000) and F0 Max (0.000) (all values
57

5 Results
decreased). The parameters of F0 Min, Jitter, Shimmer and HNR did not
prove to be significant.
5.3 Analysis 3 - Position in dialogue
The following analysis shows the influence of the position (beginning and end)
of the dialogue. Therefore one-way ANOVAs (analysis of variance) were con-
ducted. For every single voice parameter an analysis was done, in which the
voice parameter was the dependent variable and the position (beginning or end
of the dialogue) the fixed factor. Detailed results are shown for the dialogue
of the speakers C and F. The other results are then presented in a summary.
Detailed values of the ANOVAs are shown in Appendix D.
Dialogue C-F
Table 5.10 shows the mean values (Mean), the standard deviation (SD) and the
Standard Error Mean (St. Error Mean) for the mean fundamental frequency
measurements of the dialogue of the speakers C and F.
F0 Mean
Position Speaker Mean N SD Std. Error Mean
beginning C 216.67610 29 16.455194 3.055653beginning F 203.86271 21 15.634375 3.411700
ending C 218.16552 29 15.574690 2.892147ending F 194.73200 20 9.603569 2.147423
Table 5.10: Mean, Standard deviation (SD) and Standard Error Mean for the meanfundamental frequency (F0 Mean) in Hertz (Hz) of the speakers C andF at the beginning and at the end of the dialogue.
The mean values of F0 Mean for both speakers, speaker C and speaker F, did
not vary much from the beginning and end in their dialogue. Speaker C showed
an F0 Mean value of 216.77 Hz at the beginning and a value of 218.17 Hz at
the end, which is a minimal change of 1.4 Hz. Speaker F had a F0 Mean
value of 203.86 Hz at the beginning and a value of 194.73 Hz at the end of the
dialogue. The difference was 9.13 Hz.
58

5.3 Analysis 3 - Position in dialogue
Source Type III df Mean F Sig.Sum of Square
Intercept 4321380.850 1 4321380.850 14043.360 0.000Position 189.073 1 189.073 0.614 0.435Error 29540.834 96 307.717
Table 5.11: Results of the ANOVA for F0 Mean for the speakers C and F at thebeginning and at the end of the dialogue.
The result of the ANOVA in Table 5.11 show that the values for F0 Mean
did not changed significantly from the beginning and the end of the dialogue
(0.435).
F0 SD
Table 5.12 shows mean values (Mean), the standard deviation (SD) and the
Standard Error Mean (St. Error Mean) for the standard deviation of F0 SD.
Position Speaker Mean N SD Std. Error Mean
beginning C 33.42803 29 11.400413 2.117004beginning F 21.17795 22 7.457711 1.589989
ending C 32.05234 29 10.207541 1.895493ending F 21.98543 21 8.624827 1.882092
Table 5.12: Mean, Standard deviation (SD) and Standard Error Mean for the stan-dard deviation of the fundamental frequency (F0 SD) in Hertz (Hz) ofthe speakers C and F at the beginning and at then end of the dialogue.
Speaker C showed a mean value for F0 SD of 33.43 Hz at the beginning of
the dialogue and a value of 32.05 Hz at the end of the dialogue. The difference
of 1.38 Hz was minimal. Speaker F showed a value of 21.18 Hz at the beginning
and a value of 21.99 Hz at the end of the dialogue. Also here the difference of
0.81 Hz was minimal.
Source Type III df Mean F Sig.Sum of Square
Intercept 78248.202 1 78248.202 622.294 0.000Position 2.209 1 2.209 0.018 0.895Error 12322.672 98 125.742
Table 5.13: Results of the ANOVA for F0 SD for the speakers C and F at thebeginning and at the end of the dialogue.
59

5 Results
Table 5.13 shows the results of the ANOVA for the dialogue of C and F.
No significant changes were found for F0 SD for the beginning and end of the
dialogue (0.895).
F0 Min
Table 5.14 shows the mean values (Mean), the standard deviation (SD) and
the Standard Error Mean (Std. Error Mean) for F0 Min of the speakers C and
F at the beginning and end of their dialogue.
Position Speaker Mean N SD Std. Error Mean
beginning C 125.65093 29 30.399702 5.645083beginning F 129.93255 22 37.79275 8.057442
ending C 113.03931 26 27.499529 5.393101ending F 101.65800 18 15.192292 3.580858
Table 5.14: Mean, Standard deviation (SD) and Standard Error Mean for the min-imal fundamental frequency (F0 Min) in Hertz (Hz) of the speakers Cand F at the beginning and end of the dialogue.
At the beginning of the dialogue speaker C exhibited a mean value of
125.65 Hz and at the end a value of 113.04 Hz. The value decreased about
12.61 Hz. Speaker F showed a value of 129.93 Hz at the beginning and a value
of 101.66 Hz at the end of the dialogue. The values lowered about 28.27 Hz.
Source Type III df Mean F Sig.Sum of Square
Intercept 1280665.126 1 1280665.126 1647.763 0.000Position 11479.017 1 11479.017 14.769 0.000Error 71503.743 92 777.215
Table 5.15: Results of the ANOVA for F0 Min for the speakers C and F at thebeginning and at the end of the dialogue.
Table 5.14 shows the results of the ANOVA. The parameter of F0 Min has
in the dialogue of the speakers C and F has shown to be highly significant
(0.000).
F0 Max
Table 5.16 shows the mean value (Mean), the standard deviation (SD) and the
Standard Error Mean (Std. Error Mean) for F0 Max.
60

5.3 Analysis 3 - Position in dialogue
Position Speaker Mean N SD Std. Error Mean
beginning C 321.76286 28 37.976402 7.176865beginning F 285.37145 22 40.874082 8.714383
ending C 319.56734 29 6.145114 33.092452ending F 266.61476 21 6.128564 28.084610
Table 5.16: Mean, Standard deviation (SD) and Standard Error Mean for the max-imal fundamental frequency (F0 Max) in Hertz (Hz) of the speakers Cand F at the beginning and end of the dialogue.
Speaker C’s mean values for F0 Max decreased minimally about 2.21 Hz
from 321.76 Hz at the beginning to 319.57 Hz at the end of the dialogue.
Speaker F showed a value from 285.37 Hz at the beginning of the dialogue and
a value of 266.61 Hz at the end. The decrease was by 18.76 Hz.
Source Type III df Mean F Sig.Sum of Square
Intercept 9092573.837 1 9092573.837 5213.073 0.000Position 1773.833 1 1773.833 1.017 0.316Error 170930.316 98 1744.187
Table 5.17: Results of the ANOVA for F0 Max for the speakers C and F at thebeginning and at the end of the dialogue.
Table 5.17 shows the results of the ANOVA for F0 Max for the speakers C
and F at the different positions of the dialogue. The parameter did not show
to be significant (0.316).
Jitter
Table 5.18 shows values for jitter at the beginning and end of the dialogue
of the speakers C and F. Values are shown for the mean (Mean), standard
deviation (SD) and standard error mean (Std. Error Mean).
Position Speaker Mean N SD Std. Error Mean
beginning C 2.26893 28 0.419790 0.079333beginning F 2.00895 22 0.557339 0.118825
ending C 2.46824 29 0.813099 0.150989ending F 2.21362 21 0.450859 0.098386
Table 5.18: Mean, Standard deviation (SD) and Standard Error Mean for the Jit-ter in percent of the speakers C and F at the beginning and end thedialogue.
61

5 Results
Speaker C and F both exhibited mean values about 2.2 % for jitter. Speaker
C showed a value of 2.27 % at the beginning of the dialogue and a small increase
of 0.2 % to the end, leading to a value of 2.47 %. Speaker F also shows a small
increase for the mean value of 0.2 % from 2.01 % at the beginning to 2.21 %
at the end of the dialogue.
Source Type III df Mean F Sig.Sum of Square
Intercept 499.668 1 499.668 1415.236 0.000Position 1.300 1 1.300 3.682 0.058Error 34.247 97 0.353
Table 5.19: Results of the ANOVA for jitter for the speakers C and F at the be-ginning and at the end of the dialogue.
Table 5.19 shows the results of the ANOVA made for jitter in the dialogue
of the speakers C and F at the beginning and end. The result shows that there
is a tendency for the changes in jitter to be significant (0.058).
Shimmer
Table 5.20 shows the mean values (Mean), the standard deviation (SD) and
the standard error mean (Std. Error Mean) for shimmer in the dialogue of C
and F at the beginning and end of their dialogue.
Position Speaker Mean N SD Std. Error Mean
beginning C 7.67610 29 1.395318 0.259104beginning F 7.69191 22 1.956215 0.417067
ending C 8.37276 29 2.160529 0.401200ending F 7.31910 21 1.224337 0.267172
Table 5.20: Mean, Standard deviation (SD) and Standard Error Mean for the shim-mer in percent of the speakers C and F at the beginning and end thedialogue.
Both speakers have shimmer values about 7 and 8 %. Speaker C had in
increase of 0.69 % from 7.68 % at the beginning of the dialogue to 8.37 %
at the end. Speaker F ’s shimmer value minimally decreased from 7.69 % to
7.32 % about 0.37 %.
62

5.3 Analysis 3 - Position in dialogue
Source Type III df Mean F Sig.Sum of Square
Intercept 6052.451 1 6052.451 1965.702 0.000Position 2.264 1 2.264 0.735 0.393Error 301.745 98 3.079
Table 5.21: Results of the ANOVA for shimmer for the speakers C and F at thebeginning and at the end of the dialogue.
Table 5.21 shows the results of the ANOVA done for the dialogue of the
speakers C and F at the beginning and end of their dialogue. Shimmer has
not proven to be significant (0.393).
HNR
Table 5.22 shows the mean values (Mean), standard deviation (SD) and stan-
dard error mean (St. Error Mean) of HNR for the speakers C and F at the
beginning and end of their dialogue.
Position Speaker Mean N SD Std. Error Mean
beginning C 19.11282 28 2.104718 0.397754beginning F 20.21164 22 2.538209 0.541148
ending C 18.95059 29 3.150715 0.585073ending F 20.03333 21 1.729479 0.377403
Table 5.22: Mean, standard deviation and standard error mean for the harmonics-to-noise ratio (HNR) in decibel (dB) of the speakers C and F at thebeginning and end the dialogue.
Speaker C shows a small decrease of 0.16 dB from 19.11 dB at the beginning
to 18.95 dB at the end of the dialogue. Speaker F also exhibited a small
decrease of 0.18 dB from 20.21 dB at the beginning and 20.03 dB at the end
of the dialogue.
Source Type III df Mean F Sig.Sum of Square
Intercept 38028.198 1 38028.198 5993.214 0.000Position 0.912 1 0.912 0.144 0.705Error 621.831 98 6.345
Table 5.23: Results of the ANOVA for harmonics-to noise ratio (HNR) for thespeakers C and F at the beginning and at the end of the dialogue.
63

5 Results
Table 5.23 shows the results of ANOVA for HNR for the beginning and end
of the dialogue of the speakers C and F. HNR has not proven to be significant
(0.705).
Summary of the results
A summary of the ANOVAs for all dialogues can be seen in Table 5.24. Detailed
results can be seen in Appendix D.
Dialogue partners F0 Mean F0 SD F0 Min F0 Max Jitter Shimmer HNR
A & F ∗C & F ∗ (∗)D & FH & FJ & F (∗) ∗K & F
Table 5.24: Results done with ANOVAs for all dialogues at the beginning and endfor the voice parameters of F0 Mean, F0 SD, F0 Min, F0 Max, Jitter,Shimmer and HNR.
In the dialogue between speakers A and F F0 SD has shown to be significant
(0.036). At the beginning of the dialogue speaker A had a value of 40.96 Hz and
a minimal decrease of 3.41 Hz to 37.54 Hz at the end of the dialogue. Speaker
F showed a strong decrease about 10.36 Hz from 27.31 Hz at the beginning to
16.95 Hz at the end of the dialogue. Detailed results of the analyses can be
seen in Appendix D.1
No significant changes of parameters were found for the dialogues of speaker
F with the speakers D, H and K. Appendices D.2, D.3 and D.5 show detailed
results of the analyses.
In the dialogue between the speakers J and F F0 Mean showed a tendency
for being significant (0.062). Speaker J showed a value of 229.51 Hz at the
beginning of the dialogue and a decrease of 9.62 Hz to 219.89 Hz at the end of
the dialogue. Speaker F showed a small decrease of 1.01 Hz from 211.08 Hz at
the beginning to 210.07 Hz at the end of the dialogue. Also the parameter of
F0 Max proved significant (0.041). At the beginning of the dialogue speaker
F showed a value of 349.95 Hz and a strong decrease of 25.48 Hz to 324.47 Hz
at the end. Speaker F exhibited a small decrease of 3.49 Hz from 276.54 Hz
at the beginning to 273.05 Hz at the end. Detailed results can be found in
Appendix D.4.
64

6 Discussion
In the present chapter the method used (Chapter 6.1) and the results (Chapter
6.2) are discussed. Afterwards, F0 is considered, as most significant changes of
the analyses occurred on features of F0 (Chapter 6.3). As other voice param-
eters were found to be significant in other studies, the influence of temporal
aspects are discussed (Chapter 6.4). At the end the influence of engagement
is examined as engagement rather than rapport has been presumed to have an
influence on accommodation/convergence (Chapter 6.5).
6.1 Discussion of method
The method of the Praat Voice Report analyses various parameters, including
those of F0, perturbation and harmonicity. For F0, the mean, the standard
deviation, the minimum and the maximum were taken for the analysis, which
gives a global view of the average and variation of the fundamental frequency.
Jitter and shimmer were taken for the analysis of perturbation in voice, so
that quality and irregularities of the frequency and the amplitude can be deter-
mined. From the different possible algorithms Jitter(local) and Shimmer(local)
were chosen. For measures of harmonicity the measure of harmonics-to-noise
ratio (HNR) was taken, which mirrors the degree of acoustic periodicity.
With the help of boxplots, generated with the help of SPSS [Inc12], ex-
treme outliers were discarded for the analyses. Notably, most extreme outliers
occurred for the minimum of the fundamental frequency for the individual
speakers (see Table 4.1, for a detailed table see Appendix A). An explanation
for that could be errors in measurements, as happened, for instance, for sam-
ple 2 from speaker F (see Figure 6.1). In this sample the Praat Voice Report
gave an F0 Min of 88.68 Hz. Due to the glottalization of some vowels in her
utterance the pitch was calculated incorrectly, which led to false values which
would have negatively influenced the analysis.
65

6 Discussion
Figure 6.1: Error of measurement that caused an extreme outlier in F0 Min.Sample 2 from speaker F from the beginning of the dialogue with J.(Utterance: “Ja, nee, ich hab hospitiert, also hinten drin beobachtetund vorbereitet und so, aber man redet ja immer trotzdem ziemlichviel.”)
Figure 6.2: Error of measurement in Praat that caused a wrong calculation of F0Max (and also F0 Min). Utterance: “Ja, genau, da wurd ich, wo ichumgekippt bin.”
The values of the maximum fundamental frequency should also be regarded
cautiously as errors in measurements can occur. In the boxplots made for
speaker F (for the beginnings and ends of all the dialogues she was involved
in) most outliers occurred for the maximum of the fundamental frequency
(see Table 4.2, for a detailed table see Appendix B). An example of a false
calculation can be seen in Figure 6.2, in which a false maximum fundamental
66

6.1 Discussion of method
frequency was calculated (379.18 Hz) due to glottalization.
Therefore values for the minimum and maximum fundamental frequency
should be read with caution. Overall, it can be assumed that errors in mea-
surement were not included in the analyses due to discarding extreme out-
liers.
Additionally, analyses of voices are usually done for held vowels [May13,
p. 169], mostly for the analysis of pathological voices. The present analyses
were done for samples of spontaneous speech, thus it can be expected that
values for jitter, shimmer and harmonics-to-noise ratio are not beneath the
threshold values for healthy and pathological voices set for these parameters.
Nevertheless the measured values have been constant in the study, as can be
seen in Table 6.1.
The values of jitter vary between 1.857 % and 2.533 % (see Table 6.1, which is
higher than the threshold for pathological voices beneath 1 % [May13, p. 145],
and the values for shimmer lay between 6.757 % and 9.512 %, which is also
much higher than the thresholds of 2.5 % [NFG06, p. 18] and 3.81 % [May13,
p. 156]. The values for the harmonics-to-noise ratio vary between 15.715 dB
and 19.772 dB and lie beneath the threshold for pathological voices of 20 dB
[MS08, p. 26].
As measured values for jitter, shimmer and HNR have been constant across
the analyses (see Table 6.1), although they cannot be compared to those mea-
sured in held vowels, it can be assumed that the Praat Voice Report is an ap-
propriate measure for spontaneous speech, even if not all parameters are useful.
Voicing parameters, i.e. pauses, occur more often in spontaneous speech than
in held vowels, such as in the usage of plosives in the speech stream or short
pauses, e.g. for breath taking.
A parameter that would also be interesting to include in the analysis of voice
would be vocal intensity, thus the analysis of amplitudes (as it is partly done
with the parameter of shimmer). As vocal intensity is perceived as loudness,
the question arises if speakers might converge in the height or form of ampli-
tudes. In the experiment of De Looze and colleagues [LORC11] voice intensity
was found to become more similar between conversational partners (among
other parameters). Analyses have also been done for individual words with
amplitude envelopes [Lew12] as a measure of spectral similarity.
67

6 Discussion
Parameter Speaker Position Mean Standard deviation N
Jitter F beginning 2.077 0.503 136end 2.047 0.545 129
A beginning 2.517 0.590 24end 2.315 0.378 23
C beginning 2.269 0.420 28end 2.468 0.813 29
D beginning 1.910 0.414 25end 1.857 0.377 22
H beginning 2.247 0.574 25end 2.415 0.708 22
J beginning 2.302 0.509 26end 2.173 0.292 23
K beginning 2.280 0.510 22end 2.533 0.539 21
Shimmer F beginning 7.482 1.497 137end 7.293 1.617 129
A beginning 9.504 1.457 24end 8.079 1.416 24
C beginning 7.676 1.395 29end 8.372 2.161 29
D beginning 7.088 1.194 25end 6.757 0.938 22
H beginning 7.102 1.296 25end 7.732 1.709 22
J beginning 9.291 1.350 26end 9.512 1.721 24
K beginning 7.164 1.376 22end 7.484 1.097 21
HNR F beginning 19.354 2.129 137end 19.772 2.185 129
A beginning 15.715 1.725 24end 16.789 1.438 24
C beginning 19.113 2.105 28end 18.951 3.151 29
D beginning 18.450 1.683 25end 18.391 1.757 22
H beginning 19.063 1.634 25end 18.905 1.526 22
J beginning 16.459 1.905 26end 16.726 2.049 24
K beginning 18.487 1.899 22end 17.849 1.584 21
Table 6.1: Mean and standard deviation values for jitter, shimmer and harmonics-to-noise ratio of speaker F and her conversational partners, measuredfrom samples from the beginnings and end of the six dialogues. Jitterand shimmer are measured in percent (%), the harmonics-to-noise ratio(HNR) in decibel (dB).
68

6.2 Discussion of results
6.2 Discussion of results
In the following the results of the three analyses are discussed (Chapter 5.1-
5.3). For the first analysis (Individual dialogues) the speakers’ ratings about
their conversational partner are included. Afterwards the results of Analysis
2 (Speaker F) and Analysis 3 (Position in dialogue) are treated.
6.2.1 Discussion of Analysis 1 - Individual speakers
Analysis 1 (Individual speakers) revealed that speakers mainly changed on F0
and that speakers behaved differently, e.g. speaker F did not exhibit changes
in every dialogue and speakers seem to change or maintain in parameters,
independent of whether their conversational partner does. In the following
the results of Analysis 1 are discussed. Ratings of the speakers about their
conversational partner’s social attractiveness and competence (each on a scale
from -8 to 8) are included.
Dialogue A-F
In the dialogue between the speakers A and F, both showed significant changes
for different parameters: speaker F changed on the values of F0 SD, F0 Min
and F0 Max (which led to little variation and thus monotonous speech), while
speaker A changed on HNR (sounding more hoarsely) and exhibited a tendency
for shimmer being significant (leading to a less breathy or rough voice). As the
significant values of speaker F departed from those of speaker A (see Appendix
C.1), divergence can be assumed for speaker F. Speaker A’s values, on the
other hand, approached those of speaker F. Thus for her convergence can be
assumed.
The ratings from speaker F about speaker A do not agree with the above
described parameter values as the ratings are quite high (both 6). On the other
hand, speaker A’s values of HNR and shimmer approached those of speaker
F, which leads to the assumption that she converged towards speaker F. The
high rating for social attractiveness (8) confirms this result.
69

6 Discussion
Dialogue C-F
In the dialogue between the speakers C and F only speaker F changed: signif-
icant results were found for F0 Min and a tendency towards being significant
for F0 Mean. For the minimum of F0 both speakers lowered their values (the
lowering led to more variability in the voice), speaker F more than speaker C
(see Appendix C.2). This can be interpreted differently: as both speakers show
the same behaviour as they decrease their values, they are acting synchronous
and this can be interpreted as convergence. Another explanation might be
that both speakers diverged due to the fact that the distance between the
values from the beginning and those from the end increased. The values for
F0 Mean of speaker F can be interpreted as divergence as the lowering of the
value (perceived as a deeper voice) leads to an increase of the distance between
the conversational partners.
As both speakers rated each other with quite positive values for social attrac-
tiveness and competence (F about C: 5 and 5, C about F: 4 and 5) convergence
for F0 SD by acting synchronously can be assumed. Another explanation might
be that both largely maintained as speaker F only significantly changed on one
parameter.
Dialogue D-F
Significant parameters in the dialogue of the speakers D and F were F0 SD as
well as F0 Min for both speakers and additionally F0 Max for speaker D. The
values of F0 Min can be interpreted as convergence as speaker D is decreasing
in her values towards speaker F (and thus exhibits more variance in her speech)
and speaker F is increasing in her values (less variance) towards speaker D (see
Chapter 5.1).
The values for F0 Max, on the other hand, can be interpreted as divergence
as they drift apart at the end of the dialogue. The values for speaker D
increased (which leads to more variance), while those of speaker F decreased
(leading to less variance).
F0 SD, as a value mirroring F0 Min and F0 Max and thus the variation of F0,
can be interpreted differently. The values for speaker D at the beginning are
smaller, compared to those of speaker F, and increased in the end, whereas it
is the opposite for speaker F. An interpretation of the results for F0 SD is thus
70

6.2 Discussion of results
difficult: one explanation might be that both tried to converge and thereby
increased or decreased too much, so that both speakers did not succeeded to
find an exact balance. The fact that the difference for F0 SD at the beginning
strongly decreased till the end supports this explanation. At the end they
are not similar to the value of the conversational partner, but at least they
approached it. Another possibility is that both speakers diverged and that they
both showed asynchronous behaviour as speaker D’s value increased while that
of speaker F decreased.
Yet another explanation might be that their convergence or divergence de-
pended on the context, such as they had different opinions about certain topics
and that voice parameters varied according to their opinions and on possibly
subsequent changes of emotion and arousal. Feeling more excited about a
topic or being more involved in the conversation might have caused the value
changes at the end for speaker F. The ratings of speaker C about speaker F’s
social attractiveness and competence were high (6 and 7), those of speaker
F about speaker C lower, but still positive (4 and 6). This might indicate
that convergence should be more likely than divergence and that the values
for F0 SD and F0 Min could be rather be interpreted as convergence.
Overall, convergence can be observed for F0 Min and divergence for F0
Max. As Pardo points out “convergence does not result in exact matching
of in all paramters at all times for all interlocutors” [Par12, p. 763]. Thus it
might be possible that not all parameters (also including syntactical, lexical
and sublexical aspects) have to be similar to a certain point in time.
Dialogue H-F
In the dialogue of speakers H and F only speaker H significantly changed on
F0 SD. As she lowers her value towards that of speaker F (and thus exhibits
less variation, leading to a more monotonous speech) convergence can be as-
sumed (see Appendix C.3). Another explanation might be maintenance as she
only changed on one parameter. For the values of speaker F maintenance is
reasonable.
The ratings of speaker H about F were neutral (social attractiveness and
competence, both 0). Thus maintenance can be assumed. The ratings of
speaker F about speaker H are positive (5 and 4). Nevertheless she might have
maintained as well.
71

6 Discussion
Dialogue J-F
In the dialogue of speakers J and F speaker J was the only one who changed
on voice parameters, namely she increased in F0 Min and decreased in F0 Max
(leading to less variation and thus more monotonous speech). Additionally, F0
Mean and F0 SD showed tendencies towards being significant (both lowered,
leading to a deeper voice and monotonous speech). All values can be inter-
preted as convergence as they all approach those of speaker F (see Appendix
C.4). Speaker F, on the other hand, exhibited no significant changes at all, but
only tendency for F0 Min in the direction of the value of speaker J (speaker
F lowered in F0 Min, leading to more variation in speech). Thus it can be
assumed that both speakers converged.
The ratings of speaker J about her conversational partner agree with the F0
values observed as they are (slightly) positive (social attractiveness: 2, com-
petence: 3). The ratings from speaker F about speaker H are both positive,
as the value for social attractiveness is quite positive (4) and that of com-
petence very high (8). Thus the changes on F0 Min could be interpreted as
convergence.
Dialogue K-F
In the dialogue between the speakers K and F speaker F was the only one who
exhibited significant changes, namely on the parameters of F0 SD and HNR.
The lowering of the value of F0 SD (leading to less variation in speech) and
increasing the value of HNR (sounding more hoarsely) can be interpreted as
divergence as they drift apart from the values of speaker K. Maintenance can
be assumed for speaker K (see Appendix C.5).
These findings contradict the rating of speaker K about speaker F as it was
quite positive (social attractiveness: 4, competence: 3). The ratings of speaker
F about speaker K were also positive (5 and 4), nevertheless divergence can
be assumed.
6.2.2 Discussion of Analysis 2 - Speaker F
The second analysis dealt with changes of voice parameters for speaker F in all
six dialogues she had with different conversational partners. Results indicate
72

6.2 Discussion of results
that she significantly changed on F0, mainly F0 Mean, F0 SD and F0 Max.
Compared to the first analysis, in which the voice parameters were analysed
within the individual dialogues, differences can be observed: although speaker
F tended to change on values of F0 in the first analysis, no significant changes
for F0 Mean were found (only one tendency, see Table 5.6). In Analysis 2
(Speaker F), conducted over six dialogues, significant changes for F0 Mean were
found (see Table 5.9). These different results might be caused by discarding
outliers for every single sample collection separately, namely outliers of the
single dialogues (see Table 4.1 and Appendix A) and the sample collection for
speaker F for all dialogues (see Table 4.2 and Appendix B). Thus the sample
collection of all single dialogues for speaker F are not identical to the sample
collection of all dialogues of speaker F. This distinction was made in order
to avoid having sift out samples that are abnormal for speaker F in a single
dialogue, but normal for her among all dialogues.
Overall, the results confirm those of Analysis 1 (Individual dialogues, see
Chapter 5.1) as changes there also mainly occurred for F0. Analysis 1 also
revealed that speakers behaved differently - speaker F changed parameters in
some dialogues (e.g. dialogue D-F) and maintained on others (e.g. dialogue
H-F). This implies that speaker F reacted to different conversational partners
and that she consequently changed parameters of the fundamental frequency.
No significant changes for jitter, shimmer and HNR have been found.
6.2.3 Discussion of Analysis 3 - Position in dialogue
The third analysis (Position in dialogue) concerned changes of voice param-
eters between the beginnings and ends of the individual dialogues. Only few
significant results could be achieved, all within F0 (namely F0 SD, F0 Min,
F0 Max and a tendency towards being significant for F0 Mean) as well there
was a tendency for the changes of jitter towards to be significant (see Table
5.24). These results are similar to those of the first (see Chapter 5.1, Individual
speakers) and the second analysis (see Chapter 5.2, Speaker F) in which also
changes of F0 were (mainly) significant.
73

6 Discussion
6.3 Changes in fundamental frequency
Most changes of voice parameters were related to F0 in all three analyses
(Chapters 5.1-5.3). Gregory and colleagues found that information about for
instance social status [GW96] and dominance [GG02] can be conveyed through
fundamental frequency (or rather frequency bands below 500 Hz). In the
experiment by Gregory et al. participants heard their conversational partner
unaltered or filtered (low-pass filtered at 550 Hz or high-pass filtered at 1000
Hz high-pass filtered) [GDW97]. Convergence was found for the unaltered and
the low-pass filtered conditions, but not for the high-pass filtered condition
in which the regions of F0 had been cut out. Additionally ratings about
the conversation were more negative for the filtered conditions, slightly more
for the high-pass filtered condition. Gregory and colleagues concluded that
F0 plays a significant role as it transfers social information and allows for
accommodation.
In a similar experiment, Babel and Bulatov high-filtered recordings of words
uttered by a male speaker at 300 Hz (and thus cut out regions of F0) [BB11].
Participants then heard the unaltered or the filtered version and were told
to shadow the heard words. Analysis of F0 revealed that in the unaltered
condition repetitions were more similar to the target word as in the filtered
condition. In an additional AXB-perception test, judgements of listeners con-
firmed this result as they rated repetitions in the unaltered condition to be
more similar to the target word as repetitions of the filtered condition. As Ba-
bel and Bulatov point out, the measures of accommodation did not correlate.
They conclude that F0 is a parameter that can be accommodated, but that it
is not the only one, as signals are complex and multiple acoustic features are
available, e.g. VOT [Nie07, Nie10] and vowel quality [Bab09, Bab12].
The present thesis confirmed that speakers change most, perhaps due to
convergence or divergence, on values of F0. Almost no significant changes
were found for other parameters of voice. Thus it can be concluded that
across the dialogues (and thus a great time span) and across the examined
voice parameters convergence of voice mostly occurs for F0.
74

6.4 Temporal aspects
6.4 Temporal aspects
An explanation that changes in voice parameters mainly occurred mainly for
values of F0 and not for other parameters might be due to to the extraction
of samples from the first and the last five minutes of the dialogue. It might be
that accommodation effects occur very early in the dialogue as also Schweitzer
and Lewandowski supposed [SL13]. Nevertheless they could not find an effect
of time in their analyses of articulation rate.
De Looze and colleagues suppose that “mimicry [similar to convergence]
is not a linear phenomenon but rather dynamic” [LORC11, p. 1297]. This
then would imply that in a spontaneous dialogue phases of convergence and
non-convergence could occur.
In the experiment of Levitan and Hirschberg different parameters showed
to be significant when comparing mean values of parameters extracted from
different time spans [LH11]. In their experiment, participants, working in pairs,
played three computer games. They were not able to see each other. Results
indicate that during the first game participants changed significantly on mean
intensity, shimmer and NHR. Regarding the whole session, including all three
computer games, participants changed on jitter and F0 Mean. Regarding the
turn-level even more changes could be found (F0 Mean, F0 Max, shimmer,
NHR). Thus it can be concluded that accommodation/convergence is sensitive
to temporal aspects (and means of measurement), as also the results of Levitan
and Hirschberg differ from the findings of the present thesis. It can be assumed
that some voice parameters tend to change early in conversation and that
others require more time for the participants to converge. Additionally, it
could be possible that some voice parameters change on the global level, i.e.
over the whole conversation, and others on local levels, i.e. from turn to turn
[LH11].
As the dialogues analysed in the present thesis lasted for about 25 min-
utes F0 could possibly be a global parameter (as also changes of F0 Mean
were significant for the whole session in Levitan and Hirschberg’s experiment
[LH11]). Future research could bring more evidence for voice parameters and
their compass in speech.
75

6 Discussion
6.5 Engagement
De Looze and colleagues revealed that becoming more similar on prosodic
parameters (median F0, F0 SD, pauses (number and duration), voice inten-
sity) is correlated with involvement in the interaction rather than agreement1
[LORC11]. This finding agrees with the coordination-engagement hypothesis
of Niederhoffer and Pennebaker which states that “the more that two peo-
ple in a conversation are actively engaged with one another - in a positive
or even negative way - the more verbal and nonverbal coordination [is ex-
pected]” [NP02, p. 358]. The hypothesis assumes that engagement, whether
positive or negative, might influence accommodation/convergence, rather than
rapport [NP02, p. 358]. Also, attention plays a major role as speakers do not
engage if they are not listening to their conversational partner or/and if they
are distracted. The coordination-engagement hypothesis agrees with CAT as
speakers can still converge to achieve social goals or to arrange the conversa-
tion smoothly and or diverge/maintain to emphasize the differences between
themselves and others.
In the study of Schweitzer and Lewandowski speakers’ local articulation
rates were influenced by the preceeding articulation rate of the conversational
partner and social factors, i.e. mutual liking [SL13]. Results of other studies
also revealed that ratings of mutual attractiveness and/ or liking were influ-
ential [PG08, Nat75, ACG+11]. Thus it can be assumed that social factors
have an influence on speech. As the present ratings for social attractiveness
and competence agreed partially with observed changes in voice parameters, it
could be assumed that both, engagement of the speakers, possibly stimulated
by discussed topics, as well as the evaluation of the dialogue partner influenced
speakers and thus convergence. Additional dimensions, including phonetic tal-
ent, as it showed to be influential [Lew12], should also be regarded. In addition,
future research could reveal which factors are influential, how distinct these
are and how they are related.
1Speakers’ agreement was annotated for disagreement, neutral speech and agreement. In-volvement was annotated for a group of speakers (not for individual speakers) on a scalefrom 0 to 10.
76

7 Conclusion and Outlook
In the present thesis voice parameters were investigated at the beginning and
ends of dialogues. Three different analyses were conducted in order to identify
which voice parameters are most prone to accommodation. For this reason,
values for the fundamental frequency (mean, standard deviation, minimum,
maximum), jitter, shimmer and harmonics-to-noise ratio were considered.
Results showed that most significant changes of voice parameters occur for
the fundamental frequency. Thus it can be concluded that accommodation of
voice parameters, at least for the global time span of the dialogues, is expressed
through the average and the variance of the fundamental frequency.
Additionally, Analysis 1, concerning the individual speakers, showed that
voice changes for different parameter combinations, which indicates that ac-
commodation of voice is probably not a fully automatic process as proposed by
Pickering and Garrod [GP04, PG04, PG06, MPG12]. Instead social variables,
for instance to gain the approval of the conversational partner [SG82] or to
arrange the conversation unproblematic and smoothly [GGJ+95], as proposed
in the Communication Accommodation Theory, might influence the (speech)
behaviour of the conversational partners as well as engagement, as proposed
in the coordination-engagement hypothesis, and phonetic talent.
In future work, more detailed analyses could reveal new details about con-
vergence of voice parameters. Therefore voice parameters could be evaluated
on different temporal levels, e.g. over the whole conversation or turns, as some
parameters might change on a global level and others on local levels. Addi-
tionally, detailed analyses could bring new insights on the influences of context
and topic as well as engagement, attention and emotions on voice parameters.
Therefore a detailed questionnaire, revealing speakers’ opinions, impressions
and attitudes towards the discussed topics and the conversational partner and
also to the whole situation during the dialogue, could show what factors are
most influential on convergence of voice and to what extent. This might bring
77

7 Conclusion and Outlook
new insights into the causes and motivations for speakers to change along
different voice parameters.
A possible next step is the evaluation of engagement of conversational part-
ners (in the GeCo corpus). Therefore listeners could rate the degree of engage-
ment and possibly this factor proves influential on accommodation/convergence.
78

Bibliography
[Abe67] Abercrombie, D. (1967). Elements of general phonetics. Volume 203.
Edinburgh: Edinburgh University Press.
[ACG+11] Abrego-Collier, C., Grove, J., Sonderegger, M., Yu A.C.L.
(2011). Effects of speaker evaluation on phonetic convergence. In
Proceedings of the 17th International Congress of Phonetic Sci-
ences (ICPhS XVIII), Hong Kong, China, (192-195). Retrieved
2014, July 9 from http://www.icphs2011.hk/resources/OnlineProceedings/
RegularSession/Abrego-Collier/Abrego-Collier.pdf
[AJL87] Aronsson, K., Jonnson, L., Linell, P. (1987). The courtroom hear-
ing as a middle ground: Speech accommodation by lawyers and de-
fendants. Journal of Language and Social Psychology, 6(2), 99-115.
doi:10.1177/0261927X8700600202
[Azu97] Azuma, S. (1997). Speech accommodation and Japanese
emperor Hiroheto. Discourse and Society, 8(2), 189-202.
doi:10.1177/0957926597008002003
[Bab09] Babel, M.E. (2009). Phonetic and Social Selectivity in Speech Ac-
commodation (Doctoral Dissertation), University of California, Berkeley.
Retrieved 2014, July 9 from http://linguistics.berkeley.edu/dissertations/
Babel dissertation 2009.pdf
[Bab12] Babel, M. (2012). Evidence for phonetic and social selectivity in
spontaneous phonetic imitation. Journal of Phonetics, 40(1), 179-188.
doi:10.1016/j.wocn.2011.09.001
[Bau00] Baugh, J. (2000). Racial identification by speech. American Speech,
75(4), 362-364. doi:10.1215/00031283-75-4-362
[BB11] Babel, M., Bulatov D. (2011). The role of fundamental frequency
in phonetic accommodation. Language and Speech, 55(2), 231-248.
doi:10.1177/0023830911417695
79
http://www.icphs2011.hk/resources/OnlineProceedings/RegularSession/Abrego-Collier/Abrego-Collier.pdf

Bibliography
[BFB04] Belin, P., Fecteau, S., Bedard, C. (2004). Thinking the voice: neural
correlates of voice perception. Trends in Cognitive Sciences, 8(3), 129-135.
doi:10.1016/j.tics.2004.01.008
[BG77] Bourhis, R.Y., Giles, H. (1977). The language of intergroup distinc-
tiveness. In H. Giles (Ed.), Language, Ethnicity and Intergroup Relations
(119135). London: Academic Press.
[BHL+94] Berry, D.S., Hansen, J.S., Landry-Pester, J.C., Meier, J.A. (1994).
Vocal determinants of first impressions of young children. Journal of Non-
verbal Behavior, 18(3), 187-197. doi:10.1007/BF02170025
[Boe03] Boersma, P. (2003, May 21). Voice 3. Shimmer. Retrieved
2014, June 14 from http://www.fon.hum.uva.nl/praat/manual/Voice 3
Shimmer.html
[Boe09] Boersma, P. (2009). Should jitter be measured by peak picking or
by waveform matching? Folia Phoniatrica et Logopaedica, 61(5), 305-308.
doi:10.1159/000245159
[Boe11] Boersma, P. (2011, March 2). Voice 2. Jitter. Retrieved 2014, June 14
from http://www.fon.hum.uva.nl/praat/manual/Voice 2 Jitter.html
[Bra94] Braun, A. (1994). The effect of cigarette smoking on vocal parameters.
In ESCA Workshop on Automatic Speaker Recognition, Identification and
Verification, Martigny, Switzerland (161-164). Retrieved 2014, July 9 from
www.isca-speech.org/archive open/archive papers/asriv94/sr94 161.pdf
[BW14] Boersma, P., Weenink, D. (2014). Praat: doing phonetics by computer
(Version 5.3.63) [Computer program]. Retrieved 2014, May 18. Available
from http://www.praat.org/
[Byr71] Byrne, D. (1971). The attraction paradigm. New York: Academic
Press.
[CB99] Chartrand, T.L., Bargh, J.A. (1999). The chameleon effect: the
perception-behavior link and social interaction. Journal of Personality
and Social Psychology, 76(6), 893-910. Retrieved 2014, June 9 from http:
//www.yale.edu/acmelab/articles/chartrand bargh 1999.pdf
[CJ97] Coupland, N., Jaworski, A. (1997). Relevance, accommodation and
conversation: Modeling the social dimension of communication. Multilin-
gua, 16(2-3), 233-258. doi:10.1515/mult.1997.16.2-3.233
80

Bibliography
[Cla96] Clark, H.H. (1996). Using language. Cambridge: Cambridge Univer-
sity Press.
[DB01] Dijksterhuis, A., Bargh J.A. (2001). The perception-behavior express-
way: Automatic effects of social perception an social behavior. In M.P.
Zanna (Ed.), Advances in Experimental Social Psychology, Volume 32,
(pp. 1-40). Retrieved 2014, January 1 from http://www.yale.edu/acmelab/
articles/Dijksterhuis Bargh 2001.pdf
[DBSA11] Duggan, A.P., Bradshaw Y.S., Swergold N., Altman W. (2011):
When rapport building extends beyond affiliation: communication overac-
commodation toward patients with disabilities. The Permanente Journal,
15(2), 23-30. Retrieved 2014, June 9 from http://www.ncbi.nlm.nih.gov/
pmc/articles/PMC3140744/pdf/i1552-5775-15-2-23.pdf
[DR10] Dias, J.W. and Rosenblum, L.D. (2010). Visual influences on interac-
tive speech alignment. Perception, 40(12), 1457-1466. doi:10.1068/p7071
[EN93] Edwards, H., Noller, P. (1993). Perceptions of overaccommodation
used by nurses in communication with the elderly. Journal of Language
and Social Psychology, 12(3), 207-223. doi:10.1177/0261927X93123003
[ES96] Ellgring, H., Scherer, K.R. (1996). Vocal indicators of mood
change in depression. Journal of Nonverbal Behavior, 20(2), 83-110.
doi:10.1007/BF02253071
[Esl78] Esling, J. (1978). The identification of features of voice quality in social
groups. Journal of the International Phonetic Association, 8(1-2), 18-23.
doi:10.1017/S0025100300001699
[FBSW03] Fowler, C.A., Brown, J.M., Sabadini, L., Weihing, J. (2003). Rapid
access to speech gestures in perception: Evidence from choice and simple
response time tasks. Journal of Memory and Language, 49(3), 396 - 413.
doi:10.1016/S0749-596X(03)00072-X
[FHE07] Farrus, M., Hernando, J., Ejarque, P. (2007). Jitter and shimmer
measurements for speaker recognition. In Proceedings of the 8th Annual
Conference of the International Speech Communication Association (In-
terspeech 2007), Antwerp, Belgium (778-781). Received 2014, July 18 from
http://nlp.lsi.upc.edu/papers/far jit 07.pdf
81
Bibliography
[FM40] Fay, P.J., Middleton, W.C. (1940). Judgement of intelligence from the
voices transmitted over a public address system. Sociometry, 3(2), 186-191.
doi:10.2307/2785442
[FMK98] Frohlich, M., Michaelis, D., Kruse E. (1998). Objektive Beschrei-
bung der Stimmguter unter Verwendung des Heiserkeits-Diagramms. HNO,
46(7), 684-489. doi:10.1007/s001060050295
[GA04] Goldinger, S.D., Azuma, T. (2004). Episodic memory reflected in
printed word naming. Psychonomic: Bulletin and Review, 11(4), 716-722.
doi:10.3758/BF03196625
[GCC91] Giles, H., Coupland, J., Coupland, N. (1991). Accommodation the-
ory: Communication, context and consequence. In H. Giles, J. Coupland,
N. Coupland (Eds.), Contexts of accommodation. Developments in applied
sociolinguistics (1-68). Westport: Greenwood Publishing Group.
[GDW97] Gregory, S.W., Dagan, K., Webster, S. (1997). Evaluating the re-
lation of vocal accommodation in conversation partner’s fundamental fre-
quencies to perceptions of communication quality. Journal of Nonverbal
Behavior, 27(1), 23-43. doi:10.1023/A:1024995717773
[GER93] Gordon, P.C., Eberhardt, J.L., Rueckl, J.G. (1993). Attentional
modulation of phonetic significance of acoustic cues. Cognitive Psychology,
25(1), 1-42. doi:10.1006/cogp.1993.1001
[GG98] Gallois, C., Giles, H. (1998). Accommodating mutual influence in in-
tergroup encounters. In M.T. Palmer, G.A. Barnett (Eds.), Progress in
communication sciences, Volume 14, (135-162).
[GG02] Gregory, S.W., Gallagher, T.J. (2002). Spectral analysis of candidates’
nonverbal vocal communication: Predicting U.S. presidential election out-
comes. Social Psychology Quarterly, 65(3), 298-308. Retrieved 2014, July 9
from http://www.jstor.org/stable/3090125
[GG13] Giles, H., Gasiorek , J. (2013). Parameters of nonaccommodation:
Refining and elaborating Communication Accommodation Theory. In J.P.
Forgas, O. Vincze, J. Laszlo (Eds.), Social cognition and communication.
The Sydney Symposium of Social Pschology. (155-172). New York: Psy-
chology Press.
82

Bibliography
[GGJ+95] Gallois, C., Giles, H., Jones, E., Cargile, A.C., Ota, H. (1995).
Accommodating intercultural encounters: Elaborations and extensions. In
R. Wisemann (Ed.), Intercultutal communication theory (115-1147). Thou-
sand Oaks: Sage publications.
[GH82] Gregory, S.W, Hoyt, B.R. (1982). Conversation partner mutual adap-
tation as demonstrated by fourier series analysis. Journal of Psycholinguis-
tic Research, 11(1), 35-46. doi:10.1007/BF01067500
[Gil73] Giles, H. (1973). Accent mobility: A model and some data. Anthro-
pological Linguistics, 15(2), 87-109. Retrieved 2014, July 9 from http:
//www.jstor.org/stable/30029508
[GLS13] Garnier, M., Lamalle, L., Sato, M. (2013). Neural correlates in pho-
netic convergence and speech imitation. Frontiers in Psychology, 4(600),
15 pages. doi:10.3389/fpsyg.2013.00600
[GO06] Giles, H., Ogay, T. (2006). Communication accommodation theory. In
B. B. Whaley and W. Samter (Eds.), Explaining Communication: Con-
temporary theories and exemplars (293-310). Mawah: Lawrence Erlbaum
Assosiates.
[Gol96] Goldinger, S.D. (1996). Words and voices: Episodic traces in spoken
identification and recognition memory. Journal of Experimental Psychol-
ogy: Learning, Memory and Cognition, 22(5), 1166-1183. Retrieved 2014,
July 9 from http://www.public.asu.edu/∼sgolding/docs/pubs/Goldinger
JEPLMC 96.pdf
[Gol97] Goldinger, S.D (1997). Perception and production in an episodic lex-
icon. In K. Johnson, J.W. Mullennix (Eds.), Talker variability in speech
processing (33-66). San Diego: Academic Press.
[Gol98] Goldinger, S.D. (1998). Echoes of echoes? An episodic the-
ory of lexical access. Psychological Review, 105(2), 251-279. Retrieved
2014, July 9 from http://www.cog.brown.edu/courses/cg195/pdf files/
Goldinger%201998.pdf
[Gol13] Goldinger, S.D. (2013). The cognitive basis of spontaneous imitation:
Evidence from the visual world. In Proceedings of Meetings in Acoustics,
Volume 19, Montreal, Canada (6 pages). doi:10.1121/1.4800039
83

Bibliography
[GOG05] Gallois, C., Ogay, T., Giles, H. (2005): Communication Accommo-
dation Theory, In W.B. Gudykunst (Ed.), Theorizing about intercultural
communication (121-148). Thousand Oaks: Sage publications.
[GP04] Garrod, S., Pickerin M.J. (2004). Why is conversation so easy? Trends
in Cognitive Sciences, 8(1), 8-11. doi:10.1016/j.tics.2003.10.016
[GP75] Giles, H., Powesland, F.P. (1975). Speech style and social variation,
Volume 7 of European monographs in social psychology. London: Academic
Press.
[GPL91] Goldinger, S., Pisoni, D., Logan J. (1991). On the nature of talker
variability effects on recall of spoken word lists. Journal of Experimen-
tal Psychology: Learning, Memory and Cognition, 17(1), 152-162. Re-
trieved 2014, July 9 from http://www.public.asu.edu/∼sgolding/docs/
pubs/Goldinger etal JEPLMC 91.pdf
[Gre90] Gregory, S. W. (1990). Analysis of fundamental frequency reveals co-
variation in interview partners’ speech. Journal of Nonverbal Behavior,
14(4), 237-251. doi:10.1007/BF00989318
[GS10] Goudbeek, M., Scherer, K. (2010). Beyond arousal: Valence and po-
tency/control cues in the vocal expression of emotion. Journal of the Acous-
tical Society of America, 128(3), 1322-1336. doi:10.1121/1.3466853
[GTB73] Giles, H, Taylor, D.M., Bourhis, R. (1973). Towards a theory of in-
terpersonal accommodation through language: Some Canadian data. Lan-
guage in Society, 2(2). 177-192. doi:10.1017/S0047404500000701
[GW96] Gregory, S.W., Webster, S. (1996). A nonverbal signal in voices of in-
terview partners effectively predicts communication accommodation and
social status perception. Journal of Personality and Social Psychology,
70(6), 1231-1240. Retrieved 2014, July 9 from http://www.columbia.edu/
∼rmk7/HC/HC Readings/Gregory.pdf
[HDJ+01] Hollien, H., DeJong, G., Martin, C.A., Schwartz, R., Lilje-
gren, K. (2001). Effects of ethanol intoxication on speech suprasegmen-
tals.Journal of the Acoustical Society of America, 110(6), 3198-32056.
doi:10.1121/1.1413751
[Hin86] Hintzman, D. (1986). Schema abstraction in multiple-trace
memory model. Psychological Review, 93(4), 411-428. Retrieved
84

Bibliography
2014, July 9 from http://www.sfs.uni-tuebingen.de/∼gjaeger/lehre/ss08/
exemplarBased/hintzman86.pdf
[Hog85] Hogg, M. (1985). Masculine and feminine speech in dyads and groups:
A study of speech style and gender salience. Journal of Language and So-
ciety, 4(2), 99-112. doi: 10.1177/0261927X8500400202
[Inc12] IBM Corporation (2012): IBM SPSS Statistics for Windows (Version
21.0) [Computer program]. New York: IBM Corporation.
[JF70] Jaffe, J., Feldstein, S. (1970). Rhythms of Dialogue. New York: Aca-
demic Press.
[JL13] Janssen, J., Laatz, W. (2013). Statistische Datenanalyse mit SPSS.
Eine anwendungsorientierte Einfuhrung in das Basissystem und das Modul
Extakte Tests. Berlin, Heidelberg: Springer Gabler Verlag.
[Joh03] Johnson, K. (2003). Acoustic and auditory phonetics. 2nd edition. Ox-
ford: Blackwell Publishing.
[KFM02] Krauss, R.M., Freyberg R., Morsella E (2002). Inferring speakers’
physical attributes from their voices. Journal of Experimental Social Psy-
chology, 38(6), 618625. doi:10.1016/S0022-1031(02)00510-3
[KJS09] Ko, S.J., Judd, C.M., Stapel, D.A. (2009). Stereotyping based on
voice in the presence of individuating information: Vocal femininity affects
perceived competence but not warmth. Personality and Social Psychology
Bulletin, 35(2), 198-211. doi:10.1177/0146167208326477
[KP04] Krauss, R. M. and Pardo, J. S. (2004). Commentary on Pickering and
Garrod. Is alignment always the result of automatic priming? Behavioral
and Brain Sciences, 27(2), 203-204. doi:10.1017/S0140525X0436005X
[KS11] Kreimanm J. and Sidtis, D. (2011). Foundations of voice studies.
An interdisciplinary approach to voice production and perception. Oxford:
Wiley-Blackwell.
[Lav68] Laver, J.M.D. (1968). Voice quality and indexical information. British
Journal of disorders of Communication, 3(1), 43-54. Retrieved 2014, July
10 from http://vambo.cent.gla.ac.uk/media/media 200297 en.pdf
[Lav76/97] Laver, J. (1997). Language and non-verbal communication. In J.
Laver (Ed.), The gift of speech: readings in the analysis of speech and voice
(131-146). Edinburgh: Edinburgh University Press.
85

Bibliography
(Reprinted from Language and Speech, Volume 7 of Handbook of Percep-
tion, 345-363, by E.C. Carterette, M.P. Friedmann, Eds., 1976, New York:
Academic Press)
[Lav03] Laver, J. (2003). Three semiotic layers of spoken communication.
Journal of Phonetics, 31(3-4), 413-415. doi:10.1016/S0095-4470(03)00034-2
[Lew12] Lewandowski, N. (2012): Talent in nonnative phonetic dialogue (Doc-
toral Dissertation). University of Stuttgart, Stuttgart. Retrieved 2014,
July 10 from http://elib.uni-stuttgart.de/opus/volltexte/2012/7402/pdf/
Lewandowski.pdf
[LH11] Levitan, R., Hirschberg, J. (2011). Measuring acoustic-prosodic en-
trainment with respect to multiple levels and dimensions. In Proceed-
ings of the 12th Annual Conference of the International Speech Com-
munication Association (Interspeech 2011), Florence, Italy (3081-3084).
Retrieved 2014, July 10 from http://www.cs.columbia.edu/∼julia/papers/
levitan&hirschberg11.pdf
[Lig89] Lightfoot, N. (1989). Effects of familiarity on serial recall for spoken
word lists. Research on speech perception, Progress report No. 15., 421-443.
Retrieved 2014, July 10 from http://files.eric.ed.gov/fulltext/ED318074.
[Lin98] Linville, S. (1998). Acoustic correlates of perceived versus actual sexual
orientation in mens speech. Pholia Phoniatrica et Logopaedica, 50(1), 3548.
doi:10.1159/000021447
[LJB05] Laukka, P., Juslin, P.N., Bresin, R. (2005). A dimensional approach
to vocal expression of emotion. Cognition and Emotion, 19(5), 633-653.
doi:10.1080/02699930441000445
[LLA+08] Laukka, P., Linnman, C., Ahs, F., Pissiota, A., Frans, O., Faria,
V., Michelgard, A., Appel, L., Frederikson, M., Furmark, T. (2008). In a
nervous voice: acoustic analysis and perception of anxiety in social phobic’s
speech. Journal of Nonverbal Behavior, 32(4), 195-214. Retrieved 2014,
July 10 from http://www.ohio.edu/people/leec1/documents/sociophobia/
Laukka Petri.pdf
[LORC11] de Looze, C., Oertel, C., Rauzy, S., Campbell (2011). Mea-
suring dynamics of mimicry by means of prosodic cues in conversa-
tional speech. In Proceedings of the 17th International Congress of Pho-
86

Bibliography
netic Sciences (ICPhS XVII), Hong Kong, China (1294-1297). Retrieved
2014, July 9 from http://www.icphs2011.hk/resources/OnlineProceedings/
RegularSession/de%20Looze/de%20Looze.pdf
[LP05] Levi, S., Pisoni D. P. (2005). Indexical and Linguistic Channels
in Speech Perception: Some Effects of Voiceovers on Advertising Out-
comes. Research on spoken language processing, Progress Report No. 27,
65-80. Retrieved 2014, July 10 from http://www.iu.edu/∼srlweb/pr/27/
65-Levi-Pisoni.pdf
[MATB14] McAleer, P., Todorov, A., Belin, P. (2014). How do you say
’Hello’? Personality Impressions from brief novel voices. PLoS ONE, 9(3),
doi:10.1371/journal.pone.0090779
[May13] Mayer, J. (2013). Phonetische Analysen mit Praat. Ein Handbuch
fr Ein- und Umsteiger. Retrieved 2014, May 18 from http://praatpfanne.
lingphon.net/downloads/praat manual.pdf
[MD87] Murphy, C.H., Doyle P.C. (1987). The effects of cigarette smoking on
voice-fundamental frequency. Otolaryngol Head Neck Surgery, 97(4), 376-
380. Retrieved 2014, July 10 from http://oto.sagepub.com/content/97/4/
376
[MMPS89] Martin, C.S., Mullennix, J.W., Pisoni, D.B., Summers, W.V.
(1989). Effects of talker variability on recall of spoken word lists. Jour-
nal of Experimental Psychology: Learning, Memory and Cognition, 15(4),
676-684. Retrieved 2014, July 10 from http://www.ncbi.nlm.nih.gov/pmc/
articles/PMC3510481/pdf/nihms418731.pdf
[MPG12] Meneti, L., Pickering, M.J., Garrod, S.C. (2012). Toward a neural
basis of interactive alignment in conversation. Frontiers in Human Neuro-
science, 6(185), 9 pages. doi:10.3389/fnhum.2012.00185
[MS08] Minnema, W., Stoll H.-C., (2008). Objektive computergesttzte Stim-
manalyse mit Praat. Forum Logopdie, 4(22), 24-29. Retrieved 2014, July
10 from https://www.wevosys.com/knowledge/ data knowledge/13.pdf
[MTHH14] Moreau, M.L., Thiam, N., Harmegnies, B., Huet, K.(2014). Can
listeners assess the sociocultural status of speakers who use a language they
are unfamiliar with? A case study of Senegalese and European students
listening to Wolof speakers. Journal of Language in Society, 43(3), 333-348.
doi:10.1017/S0047404514000220
87
Bibliography
[Mur99] Murphy, P.J. (1999). Perturbation-free measurement of the
harmonics-to-noise ratio in voice signals using pitch synchronous harmonic
analysis. Journal of the Acoustical Society of America, 105 (5), 2866-28881.
doi:10.1121/1.426901
[Nat75] Natale, M. (1975). Convergence of mean vocal intensity in dyadic
communication as a function of social desirability. Journal of Personality
and Social Psychology, 32(5), 790-804. doi:10.1037/0022-3514.32.5.790
[NFG06] Nawka T., Franke I., Galkin, E. (2006): Objektive Messverfahren in
der Stimmdiagnostik. Forum Logopdie, 4(20), 14-21. Retrieved 2014, July
10 from https://www.wevosys.com/knowledge/ data knowledge/7.pdf
[NP02] Niederhoffer, K.G., Pennebaker, J.W. (2002). Linguistic style match-
ing in social interaction. Journal of Language and social psychology, 21(4),
337-360. doi:10.1177/026192702237953
[Nie07] Nielsen, K.Y. (2007). Implicit phonetic imitation is constrained by
phonemic contrast. In Proceedings of the 16th International Congress of
Phonetic Sciences (ICPhS XVI), Saarbrucken, Germany (1961-1964). Re-
trieved 2014, July 10 from http://www.icphs2007.de/conference/Papers/
1641/1641.pdf
[Nie10] Nielsen, K.Y. (2010): Specificity and abstractness of VOT imitation.
Journal of Phonetics, 39(2), 132-142. doi:10.1016/j.wocn.2010.12.007
[NNS02] Namy, L.L., Nygaard, C. L., Sauerteig D. (2002). Gender differences
in vocal accommodation: The role of perception. Journal of Language and
Social Psychology, 21(4), 422-432. doi:10.1177/026192702237958
[NQ08] Nygaard, L.C., Queen, J.S. (2008). Communicating emotion: Linking
affective prosody and word meaning. Journal of Experimental Psychology:
Human Perception and Performance, 34(4), 1017-1030. doi: 10.1037/0096-
1523.34.4.1017
[NSP94] Nygaard, L.C., Sommers, M.S., Pisoni, D.B. (1994). Speech per-
ception as a talker-contingent process. Psychological Science, 5(1), 42-46.
doi:10.1111/j.1467-9280.1994.tb00612.x
[NW11] Newman, M., Wu, A. (2004): Do you sound Asian when you speak En-
glish? Racial identification and voice in Chinese and Koreans’s American
English. American Speech, 86(2), 152-178. doi:10.1215/00031283-1336992
88

Bibliography
[Par06] Pardo, J. (2006). On phonetic convergence during conversational in-
teraction. Journal of Acoustical Society of America, 119(4), 2382-2393.
doi:10.1121/1.2178720
[Par10] Pardo, J. (2010). Expressing oneself in conversational interaction. In E.
Morsella (Ed.), Expressing oneself/ expressing ones self: communication,
cognition, language, and identity (183-196). London: Taylor and Francis.
[Par12] Pardo, J. (2012). Reflections on phonetic convergence: Speech percep-
tion does not mirror speech production. Language and Linguistics Compass,
6(12), 753-767. doi:10.1002/lnc3.367
[Pea31] Pear, T.H. (1931). Voice and personality as applied to radio broadcast-
ing. New York: Wiley.
[PG04] Pickering, M.J., Garrod S. (2004). Toward a mechanistic psy-
chology of dialogue. Behavioral and brain sciences, 27(2), 169-190.
doi:10.1017/S0140525X04000056
[PG06] Pickering, M.J., Garrod, S. (2006). Alignment as the Basis for Suc-
cessful Communication. Research on Language and Computation, 4(2-3),
203-228. Retrieved 2014, July 10 from http://www.speech.kth.se/∼edlund/
bielefeld/references/pickering-and-garrod-2006.pdf
[PG08] Pitts, M.J., Giles, H. (2008). Social psychology and personal relation-
ships: Accommodation and relational influences across time and contexts.
In: G. Antos, V. Ventola (Eds.), Handbook of Interpersonal Communica-
tion, Volume 2 of Handbook of Applied Linguistics (15-31). Berlin: Mouton
de Gruyter.
[PGP93] Palmeri, Goldinger, Pisioni (1993). Episodic encoding of voice at-
tributes and recognition memory for spoken words. Journal of Exper-
imental Psychology: Learning, Memory and Cognition, 19(2), 309-328.
Retrieved 2014, July 10 from http://www.ncbi.nlm.nih.gov/pmc/articles/
PMC3499966/pdf/nihms418709.pdf
[PGSK12] Pardo, J., Gibbons, R., Suppes, A., Krauss, R.M. (2012). Phonetic
convergence in college roommates. Journal of Phonetics, 40(1), 190-197.
doi:10.1016/j.wocn.2011.10.001
[Pie01] Pierrehumbert, J. (2001). Exemplar dynamics: word frequency, leni-
tion and contrast. In Bybee, J. and Hopper P. (Eds.), Frequency effects
89

Bibliography
and the emerge of linguistic structure, Volume 45 of Typological studies of
language(137-157). Amsterdam: John Benjamins Publishing.
[PJK10] Pardo, J., Jay, I.C., Krauss, R.M. (2010). Conversational role influ-
ences speech imitation. Attention, Perception and Psychophysics, 72(8),
2254-2264. doi:10.3758/BF03196699
[PLB+09] Petrovic-Lazic M., Babac, S., Vukovic, M., Kosanovic, R. and
Ivankovic, Z. (2009): Acoustic Voice Analysis of Patients With Vocal Fold
Polyp Journal of Voice,25(1), 94-97. doi:10.1016/j.jvoice.2009.04.002
[RST04] Ryalls, J., Simon, M., Thomason, J. (2004). Voice Onset Time pro-
duction in older Caucasian- and African-Americans. Journal of multilin-
gual communication disorders, 2(1), 61-67. Retrieved 2014, July 10 from
http://informahealthcare.com/doi/pdf/10.1080/1476967031000090980
[RZB97] Ryalls, J., Zipprer, A. Baldauff, P. (1997). A preliminary investiga-
tion of the effects of gender and race on Voice Onset Time. Journal of
Speech, Language and Hearing Research, 40(3), 642-645. Retrieved 2014,
July 10 from http://jslhr.pubs.asha.org/article.aspx?articleid=1781846
[Sau01] de Saussure, F. (2001). Grundfragen der allgemeinen Sprachwis-
senschaft (3rd ed.). (H. Lommel, Transl.). Berlin: de Gruyter. (Original
work published 1916)
[SBS75] Smith, B.L., Brown, B.L. Strong W.J., Rencher A.C. (1975). Effects
of speech rate on personality perception. Language and Speech, 18(2), 145-
152. Retrieved 2014, July 10 from http://las.sagepub.com/content/18/2/
145.full.pdf
[SBP83] Street, R.L., Brady, R.M., Putman, W.B. (1983). The influence
of speech rate stereotypes and rate similarity or listeners’ evaluations
of speakers. Journal of Language and Social Psychology, 2(1), 37-56.
doi:10.1177/0261927X8300200103
[SBW01] Scherer, K.R., Banse, R., Wallbott, H.G. (2001). Emotion inferences
from vocal expression correlate across languages and cultures. Journal of
cross-cultural psychology, 32(1), 76-92. doi: 10.1177/0022022101032001009
[Sch86] Scherer, K.R. (1986). Vocal affect expression: a review and a
model for future research. Psychological Bulletin, 99(2), 143-165. Re-
trieved 2014, July http://www.affective-sciences.org/system/files/biblio/
1986 Scherer PsyBull.pdf
90

Bibliography
[Sch03] Scherer, K.R. (2003). Vocal communication of emotion: A re-
view of research paradigms. Speech Communication, 40(1), 227-256.
doi:10.1016/S0167-6393(02)00084-5
[Schi11] Schiel, F. (2011). Perception of alcoholic intoxication in speech. In
Proceedings of the 12th Annual Conference of the International Speech
Communication Association (Interspeech 2011), Florence, Italy (3281-
3284). Retrieved 2014, July 10 from http://www.phonetik.uni-muenchen.
de/forschung/publikationen/Schiel-IS2011.pdf
[Schw12] Schweitzer, K. (2012). Frequency effects on pitch accents: Towards
an exemplar-theoretic approach to intonation (Doctoral Dissertation). Uni-
versity of Stuttgart, Stuttgart. Retrieved 2014, July 10 from http://elib.
uni-stuttgart.de/opus/volltexte/2013/7997/pdf/Schweitzer2012.pdf
[SF97] Sancier, M.L., Fowler, C.A. (1997). Gestural drift of a bilingual speaker
of Brazilian Portuguese and English. Journal of Phonetics, 25(4), 421-436.
doi:10.1006/jpho.1997.0051
[SG82] Street, R.L., Giles, H. (1982). Speech Accommodation Theory: A so-
cial cognitive approach to language use and speech behavior. In M. Roloff,
C. Berger (Eds.), Social cognition and communication. Beverly Hills: Sage.
[SGLP01] Shepard, C.A., Giles, H., Le Poire, B.A. (2001). Communication Ac-
commodation Theory. In W.P. Robinson, H. Giles (Eds.), The New Hand-
book of Language and Social Psychology (33-56). Chichester: Wiley.
[SH82] Sorensen, D., Horii, Y. (1982). Cigarette smoking and voice funda-
mental frequency. Journal of communication disorders, 15 (2), 135-144.
doi:10.1016/0021-9924(82)90027-2
[SL12] Schweitzer, A., Lewandowski, N. (2012). Accommodation of backchan-
nels in spontaneous speech (Abstract). Book of Abstracts of the In-
ternational Symposium on Imitation and Convergence in Speech, Aix-
en-Provence, France, 2012, September 3-5. Retrieved 2014, July
9 from http://www.ims.uni-stuttgart.de/institut/mitarbeiter/schweitz/
docs/SchweitzerLewandowski2012.pdf
[SL13] Schweitzer, A. and Lewandowski, N. (2013). Convergence of ar-
ticulation rate in spontaneous speech. In Proceedings of the 14th An-
nual Conference of the International Speech Communication Associa-
tion (Interspeech 2013), Lyon, France (525-529). Retrieved 2014, July
91

Bibliography
10 from http://www.ims.uni-stuttgart.de/institut/mitarbeiter/schweitz/
docs/SchweitzerLewandowski2013.pdf
[SLD14] Schweitzer, A., Lewandowski, N., Dogil, G. (2014). Ad-
vancing corpus-based analyses of spontaneous speech: Switch to
GECO! In Proceedings of the 14th conference on Laboratory Phonol-
ogy (LabPhon), Tokyo, Japan (1 page). Retrieved 2014, July
10 from http://www.ims.uni-stuttgart.de/institut/mitarbeiter/schweitz/
docs/SchweitzerLewandowskiDogil2014.pdf
[SMA+82] Streeter, L.A., Macdonald, N.H., Apple, W., Krauss, R.M., Ga-
lotti, K.M. (1982). Acoustic and perceptual indicators of emotional
stress. Journal of the Acoustical Society of America, 73(4), 1354-1360.
doi:10.1121/1.389239
[SSL94] Stemple, J.C., Stanley, J., Lee, L. (1994). Objective measures of voice
production in normal subjects following prolonged voice use. Journal of
voice, 9(2), 127-133. doi:10.1016/S0892-1997(05)80245-0
[TE95] Traunmller, H., Eriksson, A. (1994). The frequency range of the voice
fundamental in the speech of male and female adults. Retrieved 2014, July
8 from http://www2.ling.su.se/staff/hartmut/f0 m&f.pdf
[TH80] Todt, E.H., Howell, R.J. (1980). Vocal cues as indices of
schizophrenia. Journal of Speech and Hearing Research, 23(3), 517-526.
doi:10.1044/jshr.2303.517
[Tri60] Triandis, H.C. (1960). Cognitive similarity and communication in a
dyad. Human Relations, 13(2), 175-183. doi:10.1177/001872676001300206
[VLKE85] Van Lancker, D., Kreimann, J., Emmorey, K. (1985). Familiar
voice recognition: Patterns and parameters. Part I: Recognition of back-
ward voices. Journal of Phonetics 13(1), 19-38. Retrieved 2014, July
10 from http://www.surgery.medsch.ucla.edu/glottalaffairs/papers/van%
20lancker%20-%20kreiman%20-%20emmorey%201985.pdf
[Web70] Webb, J.T. (1970). Interview synchrony. In A.W. Siegmann, B. Pope
(Eds.), Studies in dyadic communication: Proceedings of research confer-
ence on interview (115-133). New York: Pergamon.
92

Bibliography
[WJE+02] Wittels, P., Johannes, B., Enne, R., Kirsch, K. Gunga, H.C. (2002).
Voice monitoring to measure emotional load during short-term stress. Eu-
ropean Journal of Applied Physiology, 87(3), 278-282. doi:10.1007/s00421-
002-0625-1
[WM03] Wellham, N.V., Maclagan, M.A. (2003). Vocal fatigue: Cur-
rent knowledge and future directions. Journal of voice, 17(1), 21-30.
doi:10.1016/S0892-1997(03)00033-X
[WJM+04] Wallis, L., Jackson-Menaldi, C., Holland, W., Giraldo, A. (2004).
Vocal fold nodule vs. vocal fold polyp: Answer from surgical patholo-
gist and voice pathologist point of view. Journal of Voice, 18(1), 125129.
doi:10.1016/j.jvoice.2003.07.003
[WS72] Williams, C.E., Stevens, K.N. (1972). Emotions and speech: Some
acoustical correlates. Journal of the Acoustical Society of America , 52(4),
1238-1250. doi:10.1121/1.1913238
[YWB82] Yumoto, E., Wilbur, W.J., Baer, T. (1982). Harmonics-to-noise
ratio as an index of the degree of hoarseness. Journal of Acoustical So-
ciety of America, 71(6), 1544-1550. Retrieved 2014, July 10 from http:
//web.haskins.yale.edu/Reprints/HL0373.pdf
[YSO84] Yumoto E., Sasaki Y., Okamura H. (1984). Harmonics-to-noise ratio
and psychophysical measurement of the degree of hoarseness. Journal of
speech and hearing research, 27(1), 2-6. Retrieved 2014, July 10 from http:
//web.haskins.yale.edu/Reprints/HL0373.pdf
93


Appendices
95


A Outliers - Individual speakers
Speaker& partof dia-logue
Speakersin dia-logue
F0 F0 SD F0Min
F0Max
Jitt Shim HNR
A-beg A & F ∗16 ◦3, ◦9,◦13
◦3
A-end A & F ∗4, ◦7 ∗14
F-beg A & F ◦2, ◦10 ◦14 ◦14 ◦4
F-end A & F ◦1 ∗9,◦1, ◦2,◦12,◦15,◦20
C-beg C & F ◦4 ∗12 ◦ 12
C-end C & F ∗2,∗21,∗23,◦7, ◦19
◦13 ◦8, ◦26
F-beg C & F ∗9, ◦1 ◦8 ◦21 ◦1,◦18,◦22
◦12
F-end C & F ∗16,◦2,◦17,◦20
◦4 ∗10,∗14,∗16,◦12
◦16 ◦11
D-beg D & F ◦15 ∗23, ◦5 ◦7
D-end D & F
F-beg D & F ◦4, ◦3 ◦16
F-end D & F ◦2, ◦11 ◦3,◦11,◦17
◦4, ◦18
H-beg H & F ∗6 ◦6 ◦3, ◦6 ◦18 ◦4, ◦6 ∗6
H-end H & F ∗4, ∗13 ∗13, ◦3 ◦13
F-beg H & F ◦9 ◦7 ◦7, ◦10 ◦4, ◦15 ◦4
F-end H & F ∗15,◦5, ◦11
◦10 ◦7, ◦10
97

A Outliers - Individual speakers
Speaker& partof dia-logue
Speakersin dia-logue
F0 F0 SD F0Min
F0Max
Jitt Shim HNR
J-beg J & F ◦3, ◦4,◦10
◦2, ◦15 ◦5, ◦8
J-end J & F ∗11 ◦16
F-beg J & F ◦1 ∗2, ◦1,◦19,◦20,◦22
◦1, ◦3 ◦3, ◦18 ∗16 ◦7
F-end J& F ◦14 ◦14 ∗14,◦1, ◦2
K-beg K & F ◦1 ◦1 ◦10,◦13
◦2
K-end K & F ◦21
F-beg K & F ◦8 ◦1, ◦5,◦7, ◦8
F-end K & F ◦15, 20 ◦8 ◦5
Outliers for the beginnings and ends for the individual speakers of each dialogue,recognized with the help of Boxplots, generated with SPSS [Inc12]. Outliers markedby ∗are extreme values, defined as a score that is greater than 3 box lengths awayfrom the upper or lower hinge of the box [JL13, p. 242]. Those are discarded fromthe analyses. Outliers, marked by ◦, defined as samples in score that is between 1.5and 3 box lengths away from the upper or lower hinge of the box [JL13, p. 242], areincluded in the analyses. The numbers next to the outliers mark the correspondingsamples.
98

B Outliers - speaker F
Speaker& partof dia-logue
F0 F0 SD F0 Min F0 Max Jitt Shim HNR
F-beg ◦52,◦125
◦54, ◦55 ◦2, ◦10,◦38,◦45,◦52,◦54,◦55,◦67, ◦68
∗35,◦76,◦85, ◦93
◦35
F-end ◦38,◦45,◦54,◦129
◦26,◦104,◦129
∗46,∗54,∗60,∗129,◦9, ◦45
◦75,◦77,◦85,◦101,◦115
◦75,◦101
◦75,◦101
Outliers for the sample collections of the beginning and end of speaker F in allsix dialogues, recognized with the help of Boxplots, generated with SPSS [Inc12].Outliers marked by ∗are extreme values, defined as a score that is greater than 3box lengths away from the upper or lower hinge of the box [JL13, p. 242]. Thoseare discarded from the analyses. Outliers, marked by ◦, defined as samples in scorethat is between 1.5 and 3 box lengths away from the upper or lower hinge of thebox [JL13, p. 242], are included in the analyses. The numbers next to the outliersmark the corresponding samples.
99


C Results of Analysis 1 -Individual speakers
C.1 Dialogue A-F
Speaker A
Parameter Position Mean N SD St. Error Mean
Pair 1 F0 Mean beginning 198.8632 24 11.60327 2.36851end 202.67775 24 13.600890 2.776270
Pair 2 F0 SD beginning 40.9575 24 13.74137 2.80495end 37.54388 24 14.190584 2.896641
Pair 3 F0 Min beginning 97.5000 23 5.72999 1.19479end 99.30291 23 19.203485 4.004203
Pair 4 F0 Max beginning 305.5100 23 52.01498 10.84587end 306.25752 23 55.679642 11.610008
Pair 5 Jitter beginning 2.5478 23 0.58423 0.12182end 2.31452 23 0.378722 0.078969
Pair 6 Shimmer beginning 9.5035 24 1.45664 0.29734end 8.70875 24 1.415823 0.289004
Pair 7 HNR beginning 15.7147 24 1.72543 0.35220end 16.78892 24 1.438183 0.293568
Mean, standard deviation (SD) and standard error mean for the comparison of thesamples of speaker A from the beginnings and ends of the dialogue with speaker F.
Mean SD Std. t df Sign.Error (2-tailed)Mean
Pair 1 F0 Mean -3.814542 19.328867 3.945488 -0.967 23 0.344Pair 2 F0 SD 3.413625 19.856913 4.053275 0,842 23 0.408Pair 3 F0 Min -1.802957 20.017503 4.173938 -0.432 22 0.670Pair 4 F0 Max 2.112417 87.497135 17.860278 0.118 23 0.907Pair 5 Jitter 0.233261 0.624782 0.130276 1.791 22 0.087Pair 6 Shimmer 0.794750 2.020564 0.412446 1.927 23 0.066Pair 7 HNR -1.074208 2.213673 0.451864 -2.377 23 0.026
Results of the paired t-tests, comparing samples of speaker A from the beginningand the end. The parameter of HNR is significant and shimmer exhibits a tendencyfor being significant.
101

C Results of Analysis 1 - Individual speakers
Speaker F
Parameter Position Mean N SD St. Error Mean
Pair 1 F0 Mean beginning 205.4800 22 14.22599 3.03299end 204.61132 22 13.096973 2.792284
Pair 2 F0 SD beginning 27.2404 22 12.59454 2.68516end 16.94927 22 6.143384 1.309774
Pair 3 F0 Min beginning 129.0219 22 29.69783 6.33160end 150.67495 22 29.876391 6.369668
Pair 4 F0 Max beginning 299.2405 21 49.68683 10.84255end 266.68143 21 22.423106 4.893123
Pair 5 Jitter beginning 1.9809 22 0.45973 0.09802end 1.94086 22 0.440796 0.093978
Pair 6 Shimmer beginning 8.5525 22 1.52587 0.32532end 8.20800 22 1.314742 0.280304
Pair 7 HNR beginning 18.0233 22 2.05151 0.43738end 18.39323 22 1.868531 0.398372
Mean, standard deviation (SD) and standard error mean for the comparison of thesamples of speaker F from the beginnings and ends of the dialogue with speaker A.
Mean SD Std. t df Sign.Error (2-tailed)Mean
Pair 1 F0 Mean 0.868682 21.487454 4.581141 0.190 21 0.851Pair 2 F0 SD 10.291136 14.985259 3.194868 3.221 21 0.004Pair 3 F0 Min -21.653045 40.206783 8.572115 -2.526 21 0.020Pair 4 F0 Max 32.559095 49.352425 10.769582 3.023 20 0.007Pair 5 Jitter 0.040045 0.587328 0.125219 0.320 21 0.752Pair 6 Shimmer 0.344455 2.167322 0.462075 0.745 21 0.464Pair 7 HNR -0.369909 2.474797 0.527629 -0.701 21 0.491
Results of the paired t-tests, comparing samples of speaker F from the beginningand the end within the dialogue with speaker A. Significant parameters are F0 SD,F0 Min and F0 Max.
Speaker F0 Mean F0 SD F0 Min F0 Max Jitter Shimmer HNR
A (∗) ∗F ∗ ∗ ∗
Significant changes of voice correlates for the speakers A and F in their dialogue.Significant values are marked by ∗, tendencies are marked by (∗).
102
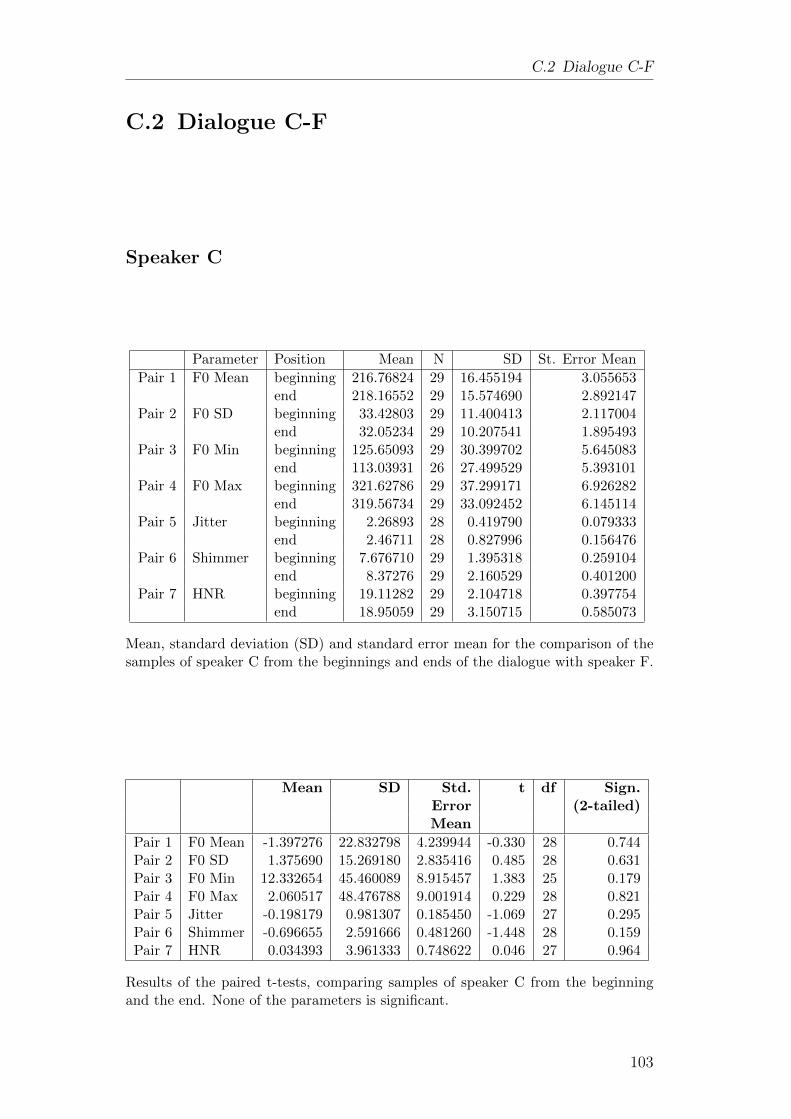
C.2 Dialogue C-F
C.2 Dialogue C-F
Speaker C
Parameter Position Mean N SD St. Error Mean
Pair 1 F0 Mean beginning 216.76824 29 16.455194 3.055653end 218.16552 29 15.574690 2.892147
Pair 2 F0 SD beginning 33.42803 29 11.400413 2.117004end 32.05234 29 10.207541 1.895493
Pair 3 F0 Min beginning 125.65093 29 30.399702 5.645083end 113.03931 26 27.499529 5.393101
Pair 4 F0 Max beginning 321.62786 29 37.299171 6.926282end 319.56734 29 33.092452 6.145114
Pair 5 Jitter beginning 2.26893 28 0.419790 0.079333end 2.46711 28 0.827996 0.156476
Pair 6 Shimmer beginning 7.676710 29 1.395318 0.259104end 8.37276 29 2.160529 0.401200
Pair 7 HNR beginning 19.11282 29 2.104718 0.397754end 18.95059 29 3.150715 0.585073
Mean, standard deviation (SD) and standard error mean for the comparison of thesamples of speaker C from the beginnings and ends of the dialogue with speaker F.
Mean SD Std. t df Sign.Error (2-tailed)Mean
Pair 1 F0 Mean -1.397276 22.832798 4.239944 -0.330 28 0.744Pair 2 F0 SD 1.375690 15.269180 2.835416 0.485 28 0.631Pair 3 F0 Min 12.332654 45.460089 8.915457 1.383 25 0.179Pair 4 F0 Max 2.060517 48.476788 9.001914 0.229 28 0.821Pair 5 Jitter -0.198179 0.981307 0.185450 -1.069 27 0.295Pair 6 Shimmer -0.696655 2.591666 0.481260 -1.448 28 0.159Pair 7 HNR 0.034393 3.961333 0.748622 0.046 27 0.964
Results of the paired t-tests, comparing samples of speaker C from the beginningand the end. None of the parameters is significant.
103
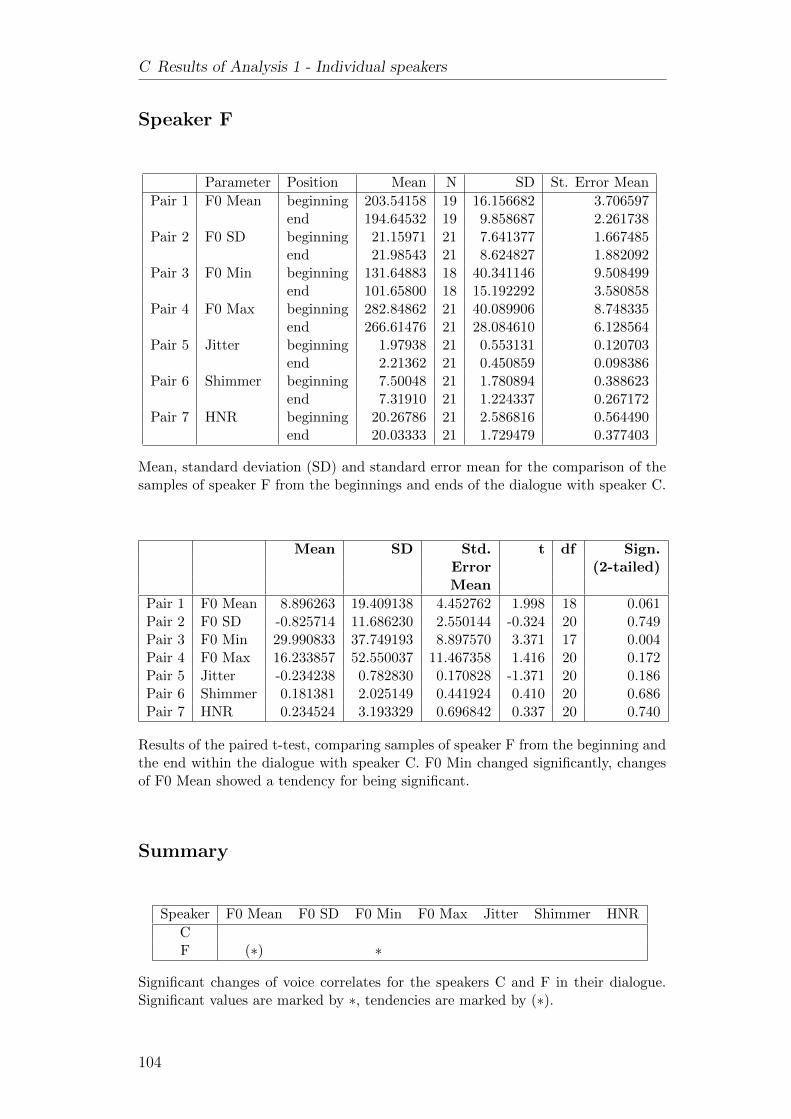
C Results of Analysis 1 - Individual speakers
Speaker F
Parameter Position Mean N SD St. Error Mean
Pair 1 F0 Mean beginning 203.54158 19 16.156682 3.706597end 194.64532 19 9.858687 2.261738
Pair 2 F0 SD beginning 21.15971 21 7.641377 1.667485end 21.98543 21 8.624827 1.882092
Pair 3 F0 Min beginning 131.64883 18 40.341146 9.508499end 101.65800 18 15.192292 3.580858
Pair 4 F0 Max beginning 282.84862 21 40.089906 8.748335end 266.61476 21 28.084610 6.128564
Pair 5 Jitter beginning 1.97938 21 0.553131 0.120703end 2.21362 21 0.450859 0.098386
Pair 6 Shimmer beginning 7.50048 21 1.780894 0.388623end 7.31910 21 1.224337 0.267172
Pair 7 HNR beginning 20.26786 21 2.586816 0.564490end 20.03333 21 1.729479 0.377403
Mean, standard deviation (SD) and standard error mean for the comparison of thesamples of speaker F from the beginnings and ends of the dialogue with speaker C.
Mean SD Std. t df Sign.Error (2-tailed)Mean
Pair 1 F0 Mean 8.896263 19.409138 4.452762 1.998 18 0.061Pair 2 F0 SD -0.825714 11.686230 2.550144 -0.324 20 0.749Pair 3 F0 Min 29.990833 37.749193 8.897570 3.371 17 0.004Pair 4 F0 Max 16.233857 52.550037 11.467358 1.416 20 0.172Pair 5 Jitter -0.234238 0.782830 0.170828 -1.371 20 0.186Pair 6 Shimmer 0.181381 2.025149 0.441924 0.410 20 0.686Pair 7 HNR 0.234524 3.193329 0.696842 0.337 20 0.740
Results of the paired t-test, comparing samples of speaker F from the beginning andthe end within the dialogue with speaker C. F0 Min changed significantly, changesof F0 Mean showed a tendency for being significant.
Summary
Speaker F0 Mean F0 SD F0 Min F0 Max Jitter Shimmer HNR
CF (∗) ∗
Significant changes of voice correlates for the speakers C and F in their dialogue.Significant values are marked by ∗, tendencies are marked by (∗).
104

C.3 Dialogue H-F
C.3 Dialogue H-F
Speaker H
Parameter Position Mean N SD St. Error Mean
Pair 1 F0 Mean beginning 197.06055 20 6.948634 1.553762end 194.00780 20 8.411587 1.880888
Pair 2 F0 SD beginning 24.68400 21 13.229052 2.886816end 19.05981 21 6.245378 1.362853
Pair 3 F0 Min beginning 138.45991 22 32.500408 6.929110end 137.51386 22 33.081591 7.053019
Pair 4 F0 Max beginning 287.31795 22 40.004453 8.528978end 273.86282 22 29.113741 6.207070
Pair 5 Jitter beginning 2.20095 22 0.587641 0.125286end 2.41505 22 0.707500 0.150840
Pair 6 Shimmer beginning 6.99855 22 1.291574 0.275364end 7.73232 22 1.708574 0.364269
Pair 7 HNR beginning 19.15148 21 1.655982 0.361365end 18.83214 21 1.524352 0.32641
Mean, standard deviation (SD) and standard error mean for the comparison of thesamples of speaker H from the beginnings and ends of the dialogue with speaker F.
Mean SD Std. t df Sign.Error (2-tailed)Mean
Pair 1 F0 Mean 3.052750 10.513544 2.350900 1.299 19 0.210Pair 2 F0 SD 5.624190 11.547481 2.519867 2.232 20 0.037Pair 3 F0 Min 0.946045 53.930192 11.497956 0.082 21 0.935Pair 4 F0 Max 13.455136 43.213473 9.13144 0.082 21 0.159Pair 5 Jitter -0.214091 1.078386 0.229913 -0.931 21 0.362Pair 6 Shimmer -0.733773 2.405927 0.512945 -1.431 21 0.167Pair 7 HNR 0.319333 2.311162 0.504337 0.633 20 0.534
Results of the paired t-tests, comparing samples of speaker H from the beginningand the end. The changes in F0 SD are statistically significant.
105

C Results of Analysis 1 - Individual speakers
Speaker F
Parameter Position Mean N SD St. Error Mean
Pair 1 F0 Mean beginning 200.52427 22 14.815574 3.158691end 195.57645 22 11.038573 2.353432
Pair 2 F0 SD beginning 15.51300 22 3.901668 0.31838end 14.27959 22 2.294422 0.489172
Pair 3 F0 Min beginning 155.35519 21 26.608971 5.806554end 160.54162 21 11.656008 2.543549
Pair 4 F0 Max beginning 258.92655 22 19.105151 4.073232end 257.80345 22 614.800031 3.155377
Pair 5 Jitter beginning 2.32586 22 0.623597 0.132951end 2.28414 22 0.699479 0.149129
Pair 6 Shimmer beginning 7.77027 22 1.504202 0.320697end 7.31000 22 2.131832 0.454508
Pair 7 HNR beginning 19.29195 22 2.195504 0.468083end 19.49045 22 2.408319 0.513455
Mean, standard deviation (SD) and standard error mean for the comparison of thesamples of speaker F from the beginnings and ends of the dialogue with speaker H.
Mean SD Std. t df Sign.Error (2-tailed)Mean
Pair 1 F0 Mean 4.947818 16.404760 3.497507 1.415 21 0.172Pair 2 F0 SD 1.233409 4.264649 0.909226 1.357 21 0.189Pair 3 F0 Min -5.186429 31.237738 6.816633 -0.761 20 0.456Pair 4 F0 Max 1.123091 22.03912 4.712570 0.238 21 0.814Pair 5 Jitter 0.041727 0.830614 0.177088 0.236 21 0.816Pair 6 Shimmer 0.460273 2.489135 0.530685 0.867 21 0.396Pair 7 HNR -0.198500 2.754264 0.587211 -0.338 21 0.739
Results of the paired t-test, comparing samples of speaker F from the beginning andthe end within the dialogue with speaker H. No significant changes were found.
Summary
Speaker F0 Mean F0 SD F0 Min F0 Max Jitter Shimmer HNR
H ∗F
Significant changes of voice correlates for the speakers H and F in their dialogue.Significant values are marked by ∗, tendencies are marked by (∗).
106

C.4 Dialogue J-F
C.4 Dialogue J-F
Speaker J
Parameter Position Mean N SD St. Error Mean
Pair 1 F0 Mean beginning 229.58946 24 16.292234 3.325638end 219.89042 24 15.174251 3.097431
Pair 2 F0 SD beginning 35.57646 24 8.541754 1.743578end 29.15771 24 10.220472 2.086245
Pair 3 F0 Min beginning 121.84750 24 30.776830 6.282294end 147.47408 24 28.601457 5.838248
Pair 4 F0 Max beginning 352.53571 24 30.629027 6.252124end 324.47083 24 42.039957 8.581370
Pair 5 Jitter beginning 2.31348 23 0.513965 0.107169end 2.17283 23 0.292467 0.060984
Pair 6 Shimmer beginning 9.29271 624 1.309628 0.267327end 9.51163 24 1.721053 0.351308
Pair 7 HNR beginning 16.30183 24 1.567090 0.319881end 16.72579 24 2.049451 0.418343
Mean, standard deviation (SD) and standard error mean for the comparison of thesamples of speaker J from the beginnings and ends of the dialogue with speaker F.
Mean SD Std. t df Sign.Error (2-tailed)Mean
Pair 1 F0 Mean 9.699042 23.403858 4.777292 2.030 23 0.054Pair 2 F0 SD 6.418750 15.408817 3.145312 2.041 23 0.053Pair 3 F0 Min -25.626583 42.231507 8.620470 -2.973 23 0.007Pair 4 F0 Max 28.064875 60.295057 12.307677 2.280 23 0.032Pair 5 Jitter 0.140652 0.573483 0.119579 1.176 22 0.252Pair 6 Shimmer -0.218917 2.267400 0.462831 -0.473 23 0.641Pair 7 HNR -0.423958 2.833680 0.578423 -0.733 23 0.471
Results of the paired t-tests, comparing samples of speaker J from the beginning andthe end. Changes in of F0 Min and F0 Max were statistically significant, changesin F0 Mean and F0 SD showed a tendency of being significant.
107

C Results of Analysis 1 - Individual speakers
Speaker F
Parameter Position Mean N SD St. Error Mean
Pair 1 F0 Mean beginning 212.21375 20 12.542785 2.804652end 210.07010 20 18.061822 4.038746
Pair 2 F0 SD beginning 18.57710 20 4.973111 1.112021end 23.24375 20 10.579260 2.365595
Pair 3 F0 Min beginning 163.30184 19 23.999646 5.505896end 141.98226 19 39.002431 8.947771
Pair 4 F0 Max beginning 279.9396 20 25.73868 5.75534end 273.04720 20 30.686576 6.861727
Pair 5 Jitter beginning 1.87755 20 0.529078 0.118305end 1.92160 20 0.579673 0.129619
Pair 6 Shimmer beginning 6.45684 19 1.037244 0.237960end 7.15842 19 2.204843 0.505826
Pair 7 HNR beginning 20.27668 19 2.183106 0.500839end 20.45516 19 2.247926 0.515710
Mean, standard deviation (SD) and standard error mean for the comparison of thesamples of speaker F from the beginnings and ends of the dialogue with speaker J.
Mean SD Std. t df Sign.Error (2-tailed)Mean
Pair 1 F0 Mean 2.143650 23.914759 5.347503 0.401 19 0.693Pair 2 F0 SD -4.666650 13.009558 2.909026 -1.604 19 0.125Pair 3 F0 Min 21.319579 45.457736 10.428720 2.044 18 0.056Pair 4 F0 Max 6.892350 44.333690 9.913314 0.695 19 0.495Pair 5 Jitter -0.044050 0.835138 0.186743 -0.236 19 0.816Pair 6 Shimmer -0.701579 2.775553 0.636756 -1.102 18 0.285Pair 7 HNR -0.178474 3.163230 0.725695 -0.246 18 0.809
Results of the paired t-tests, comparing samples of speaker F from the beginningand the end within the dialogue with speaker J. No significant changes were found.The parameter of F0 Min showed a tendency for changing significantly.
Summary
Speaker F0 Mean F0 SD F0 Min F0 Max Jitter Shimmer HNR
J (∗) ∗ ∗ ∗F (∗)
Significant changes of voice correlates for the speakers J and F in their dialogue.Significant values are marked by ∗, tendencies are marked by (∗).
108

C.5 Dialogue K-F
C.5 Dialogue K-F
Speaker K
Parameter Position Mean N SD St. Error Mean
Pair 1 F0 Mean beginning 192.37771 21 16.378680 3.574121end 196.43390 21 27.215643 5.938940
Pair 2 F0 SD beginning 25.92719 21 8.759352 1.911447end 27.96395 21 9.911624 2.162894
Pair 3 F0 Min beginning 135.80510 21 20.086390 4.383210end 125.86948 21 21.441889 4.679004
Pair 4 F0 Max beginning 281.20576 21 47.503958 10.366213end 296.79795 21 48.854073 10.660833
Pair 5 Jitter beginning 2.29376 21 0.518357 0.113115end 2.53286 21 0.538768 0.117569
Pair 6 Shimmer beginning 7.14919 21 1.407683 0.307182end 7.48424 21 1.097045 0.239395
Pair 7 HNR beginning 18.56224 21 1.911997 0.417232end 17.84895 21 1.584266 0.345715
Mean, standard deviation (SD) and standard error mean for the comparison of thesamples of speaker K from the beginnings and ends of the dialogue with speaker F.
Mean SD Std. t df Sign.Error (2-tailed)Mean
Pair 1 F0 Mean -4.056190 35.836419 7.820148 -0.519 20 0.610Pair 2 F0 SD -2.036762 14.710574 3.210110 -0.634 20 0.533Pair 3 F0 Min 9.935619 31.118958 6.790713 1.463 20 0.159Pair 4 F0 Max -15.592190 67.937001 14.25069 -1.052 20 0.305Pair 5 Jitter -0.239095 0.30475 0.159403 -1.500 20 0.149Pair 6 Shimmer -0.335048 1.755003 0.382973 -0.875 20 0.392Pair 7 HNR 0.713286 2.170863 0.473721 1.506 20 0.148
Results of the paired t-tests, comparing samples of speaker K from the beginningand the end. No significant changes were found.
109
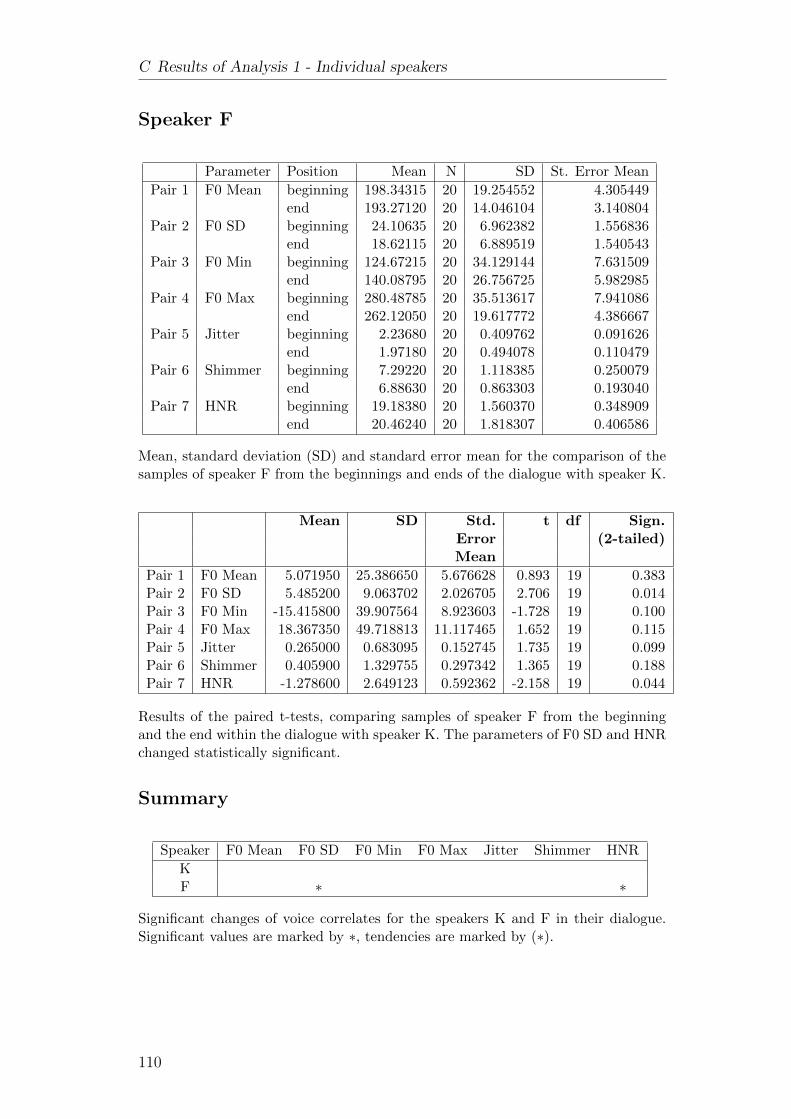
C Results of Analysis 1 - Individual speakers
Speaker F
Parameter Position Mean N SD St. Error Mean
Pair 1 F0 Mean beginning 198.34315 20 19.254552 4.305449end 193.27120 20 14.046104 3.140804
Pair 2 F0 SD beginning 24.10635 20 6.962382 1.556836end 18.62115 20 6.889519 1.540543
Pair 3 F0 Min beginning 124.67215 20 34.129144 7.631509end 140.08795 20 26.756725 5.982985
Pair 4 F0 Max beginning 280.48785 20 35.513617 7.941086end 262.12050 20 19.617772 4.386667
Pair 5 Jitter beginning 2.23680 20 0.409762 0.091626end 1.97180 20 0.494078 0.110479
Pair 6 Shimmer beginning 7.29220 20 1.118385 0.250079end 6.88630 20 0.863303 0.193040
Pair 7 HNR beginning 19.18380 20 1.560370 0.348909end 20.46240 20 1.818307 0.406586
Mean, standard deviation (SD) and standard error mean for the comparison of thesamples of speaker F from the beginnings and ends of the dialogue with speaker K.
Mean SD Std. t df Sign.Error (2-tailed)Mean
Pair 1 F0 Mean 5.071950 25.386650 5.676628 0.893 19 0.383Pair 2 F0 SD 5.485200 9.063702 2.026705 2.706 19 0.014Pair 3 F0 Min -15.415800 39.907564 8.923603 -1.728 19 0.100Pair 4 F0 Max 18.367350 49.718813 11.117465 1.652 19 0.115Pair 5 Jitter 0.265000 0.683095 0.152745 1.735 19 0.099Pair 6 Shimmer 0.405900 1.329755 0.297342 1.365 19 0.188Pair 7 HNR -1.278600 2.649123 0.592362 -2.158 19 0.044
Results of the paired t-tests, comparing samples of speaker F from the beginningand the end within the dialogue with speaker K. The parameters of F0 SD and HNRchanged statistically significant.
Summary
Speaker F0 Mean F0 SD F0 Min F0 Max Jitter Shimmer HNR
KF ∗ ∗
Significant changes of voice correlates for the speakers K and F in their dialogue.Significant values are marked by ∗, tendencies are marked by (∗).
110

D Results of Analysis 3 -Position in dialogue
D.1 Dialogue A-F
F0 Mean
Position Speaker Mean N SD Std. Error Mean
beginning A 198.8632 24 11.60327 2.36851beginning F 205.6947 23 13.93698 2.90606
end A 202.67775 24 13.600890 2.776270end F 204.61132 22 13.096973 2.792284
Mean, standard deviation (SD) and standard error mean (St. Error Mean) for themean fundamental frequency (F0 Mean) in Hertz (Hz) of the speakers A and F atthe beginning and the end of the dialogue.
Source Type III df Mean F Sig.Sum of Square
Intercept 3828384.652 1 3828384.652 22024.892 0.000Position 45.321 1 45.321 0.261 0.611Error 15817.694 91 173.821
Results of the ANOVA for the mean fundamental frequency (F0 Mean) for thespeakers A and F at the beginning and at the end of the dialogue.
111

D Results of Analysis 3 - Position in dialogue
F0 SD
Position Speaker Mean N SD Std. Error Mean
beginning A 40.9575 24 13.74137 2.80495beginning F 27.3065 23 12.30905 2.56661
end A 37.54388 24 14.190584 2.896641end F 16.94927 22 14.190584 1.309774
Mean, standard deviation (SD) and standard error mean (St. Error Mean) forthe standard deviation of the fundamental frequency (F0 SD) in Hertz (Hz) of thespeakers A and F at the beginning and the end of the dialogue.
Source Type III df Mean F Sig.Sum of Square
Intercept 89280.516 1 89280.516 403.055 0.000Position 1007.422 1 1007.422 4.548 0.036Error 20157.385 91 221.510
Results of the ANOVA for the standard deviation of the fundamental frequency (F0SD) for the speakers A and F at the beginning and at the end of the dialogue.
F0 Min
Position Speaker Mean N SD Std. Error Mean
beginning A 97.5000 23 5.72999 1.19479beginning F 130.2837 23 29.63934 6.18023
end A 98.86592 24 18.902999 3.858559end F 150.67495 22 29.876391 6.369668
Mean, standard deviation (SD) and standard error mean (St. Error Mean) forminimum of the fundamental frequency (F0 SD) in Hertz (Hz) of the speakers Aand F at the beginning and the end of the dialogue.
Source Type III df Mean F Sig.Sum of Square
Intercept 1297736.842 1 1297736.842 1295.122 0.000Position 2187.481 1 2187.481 2.183 0.143Error 90181.691 90 1002.019
Results of the ANOVA for the minimal fundamental frequency (F0 Min) for thespeakers A and F at the beginning and at the end of the dialogue.
112

D.1 Dialogue A-F
F0 Max
Position Speaker Mean N SD Std. Error Mean
beginning A 305.7183 24 50.88190 10.38622beginning F 297.3401 23 48.56891 10.12732
end A 306.25752 23 55.679642 11.610008end F 266.68143 21 22.423106 4.893123
Mean, standard deviation (SD) and standard error mean (St. Error Mean) formaximum of the fundamental frequency (F0 SD) in Hertz (Hz) of the speakers Aand F at the beginning and the end of the dialogue.
Source Type III df Mean F Sig.Sum of Square
Intercept 7883534.879 1 7883534.879 3377.766 0.000Position 4614.282 1 4614.282 1.977 0.163Error 207721.482 89 2333.949
Results of the ANOVA for the maximal fundamental frequency (F0 Max) for thespeakers A and F at the beginning and at the end of the dialogue.
Jitter
Position Speaker Mean N SD Std. Error Mean
beginning A 2.5173 24 0.59054 0.12054beginning F 1.9739 23 0.45043 0.09392
end A 2.31452 23 0.378722 0.078969end F 1.94086 22 0.440796 0.093978
Mean, standard deviation (SD) and standard error mean (St. Error Mean) for jitterin percent (%) of the speakers A and F at the beginning and the end of the dialogue.
Source Type III df Mean F Sig.Sum of Square
Intercept 441.683 1 441.683 1605.531 0.000Position 0.329 1 0.329 1.194 0.277Error 24.759 90 0.275
Results of the ANOVA for jitter for the speakers A and F at the beginning and atthe end of the dialogue.
113

D Results of Analysis 3 - Position in dialogue
Shimmer
Position Speaker Mean N SD Std. Error Mean
beginning A 9.5035 23 1.51940 0.31682beginning F 8.4913 24 1.45664 0.29734
end A 8.70875 24 1.415823 0.289004end F 8.20800 22 1.314742 0.280304
Mean, standard deviation (SD) and standard error mean (St. Error Mean) forshimmer in percent (%) of the speakers A and F at the beginning and the end ofthe dialogue.
Source Type III df Mean F Sig.Sum of Square
Intercept 7101.120 1 7101.120 3281.770 0.000Position 6.751 1 6.751 3.120 0.081Error 196.907 91 2.164
Results of the ANOVA for shimmer for the speakers A and F at the beginning andat the end of the dialogue.
HNR
Position Speaker Mean N SD Std. Error Mean
beginning A 15.7147 24 1.72543 0.35220beginning F 18.0405 23 2.00603 0.41829
end A 16.78892 24 1.438183 0.293568end F 18.39323 22 1.868531 0.398372
Mean, standard deviation (SD) and standard error mean (St. Error Mean) forharmonics-to-noise ratio (HNR) of the speakers A and F at the beginning and theend of the dialogue.
Source Type III df Mean F Sig.Sum of Square
Intercept 27524.410 1 27524.410 6751.830 0.000Position 11.500 1 11.500 2.821 0.096Error 370.969 91 4.077
Results of the ANOVA for the harmonics-to-noise ratio (HNR) for the speakers Aand F at the beginning and at the end of the dialogue.
114

D.2 Dialogue D-F
D.2 Dialogue D-F
F0 Mean
Position Speaker Mean N SD Std. Error Mean
beginning D 229.59724 25 12.807842 3.805483beginning F 217.70765 20 20.719282 4.285673
end D 232.93950 22 15.574690 2.730641end F 210.66168 22 20.719282 4.417366
Mean, standard deviation (SD) and standard error mean (St. Error Mean) for meanof the fundamental frequency (F0 Mean) in Hertz (Hz) of the speakers D and F atthe beginning and the end of the dialogue.
Source Type III df Mean F Sig.Sum of Square
Intercept 4243734.096 1 4243734.096 10705.279 0.000Position 13.651 1 13.651 0.034 0.853Error 33298.867 84 396.415
Results of the ANOVA for the mean fundamental frequency (F0 Mean) for thespeakers D and F at the beginning and at the end of the dialogue.
F0 SD
Position Speaker Mean N SD Std. Error Mean
beginning D 20.42756 25 5.950503 1.190101beginning F 39.25525 20 11.712071 2.618899
end D 28.94427 22 12.411122 2.646060end F 22.28627 22 8.167158 1.741244
Mean, standard deviation (SD) and standard error mean (St. Error Mean) forthe standard deviation of the fundamental frequency (F0 SD) in Hertz (Hz) of thespeakers D and F at the beginning and the end of the dialogue.
Source Type III df Mean F Sig.Sum of Square
Intercept 64157.271 1 64157.271 433.591 0.000Position 249.983 1 249.983 1.689 0.197Error 12429.256 84 147.967
Results of the ANOVA for the standard deviation of the fundamental frequency (F0SD) for the speakers D and F at the beginning and at the end of the dialogue.
115

D Results of Analysis 3 - Position in dialogue
F0 Min
Position Speaker Mean N SD Std. Error Mean
beginning D 181.33683 24 18.383121 3.752439beginning F 97.02540 20 6.125833 1.369778
end D 154.76977 22 50.631920 10.794762end F 136.24964 22 37.642780 8.025468
Mean, standard deviation (SD) and standard error mean (St. Error Mean) forminimum of the fundamental frequency (F0 Min) in Hertz (Hz) of the speakers Dand F at the beginning and the end of the dialogue.
Source Type III df Mean F Sig.Sum of Square
Intercept 1725662.578 1 1725662.578 860.341 0.000Position 731.843 1 731.843 0.365 0.547Error 166480.491 83 2005.789
Results of the ANOVA for the minimal fundamental frequency (F0 Min) for thespeakers D and F at the beginning and at the end of the dialogue.
F0 Max
Position Speaker Mean N SD Std. Error Mean
beginning D 308.76296 25 33.107201 6.621440beginning F 321.69335 20 60.458571 13.518947
end D 330.85964 22 31.889633 6.798893end F 295.33745 22 58.697028 12.514248
Mean, standard deviation (SD) and standard error mean (St. Error Mean) for themaximum of the fundamental frequency (F0 Max) in Hertz (Hz) of the speakers Dand F at the beginning and the end of the dialogue.
Source Type III df Mean F Sig.Sum of Square
Intercept 8397015.871 1 8397015.871 3529.055 0.000Position 25.107 1 25.107 0.011 0.918Error 199869.191 84 2379.395
Results of the ANOVA for the maximal fundamental frequency (F0 Max) for thespeakers D and F at the beginning and at the end of the dialogue.
116

D.2 Dialogue D-F
Jitter
Position Speaker Mean N SD Std. Error Mean
beginning D 1.90984 25 0.414307 0.082861beginning F 1.84015 20 0.447757 0.100121
end D 1.85718 22 0.377235 0.080427end F 1.90209 22 0.463344 0.098785
Mean, standard deviation (SD) and standard error mean (St. Error Mean) for jitterin percent (%) of the speakers D and F at the beginning and the end of the dialogue.
Source Type III df Mean F Sig.Sum of Square
Intercept 305.859 1 305.859 1711.968 0.000Position 0.004 1 0.004 0.022 0.883Error 15.007 84 0.179
Results of the ANOVA for jitter for the speakers D and F at the beginning and atthe end of the dialogue.
Shimmer
Position Speaker Mean N SD Std. Error Mean
beginning D 7.08792 25 1.194246 0.238849beginning F 7.18625 20 1.548080 0.346161
end D 6.75695 22 0.938097 0.200003end F 6.72559 22 1.303650 0.277939
Mean, standard deviation (SD) and standard error mean (St. Error Mean) for themaximum of the fundamental frequency (F0 Max) in Hertz (Hz) of the speakers Dand F at the beginning and the end of the dialogue.
Source Type III df Mean F Sig.Sum of Square
Intercept 4124.894 1 4124.894 2636.424 0.000Position 2.980 1 2.980 1.905 0.171Error 131.425 84 1.565
Results of the ANOVA for shimmer for the speakers D and F at the beginning andat the end of the dialogue.
117

D Results of Analysis 3 - Position in dialogue
HNR
Position Speaker Mean N SD Std. Error Mean
beginning D 18.44952 25 1.683333 0.336667beginning F 20.02490 20 1.841146 0.411693
end D 18.39091 22 1.756843 0.374560end F 20.40582 22 1.846650 0.393707
Mean, standard deviation (SD) and standard error mean (St. Error Mean) for theharmonics-to-noise ratio (HNR) in decibel (dB) of the speakers D and F at thebeginning and the end of the dialogue.
Source Type III df Mean F Sig.Sum of Square
Intercept 31987.091 1 31987.091 8019.834 0.000Position 0.990 1 0.990 0.248 0.620Error 335.034 84 3.988
Results of the ANOVA for the harmonics-to-noise ratio (HNR) for the speakers Dand F at the beginning and at the end of the dialogue.
D.3 Dialogue H-F
F0 Mean
Position Speaker Mean N SD Std. Error Mean
beginning H 196.24725 24 7.490674 1.529027beginning F 199.75152 23 14.941827 3.115586
end H 193.90176 21 8.212989 1.792221end F 195.57645 22 11.038573 2.353432
Mean, standard deviation (SD) and standard error mean (St. Error Mean) for themean of the fundamental frequency (F0 Mean) in Hertz (Hz) of the speakers H andF at the beginning and the end of the dialogue.
Source Type III df Mean F Sig.Sum of Square
Intercept 3463309.973 1 3463309.973 29634.075 0.000Position 230.452 1 230.452 1.972 0.164Error 10284.488 88 116.869
Results of the ANOVA for the mean fundamental frequency (F0 Mean) for thespeakers H and F at the beginning and at the end of the dialogue.
118

D.3 Dialogue H-F
F0 SD
Position Speaker Mean N SD Std. Error Mean
beginning H 23.35976 25 12.573196 2.514639beginning F 15.53235 23 3.813092 0.795085
end H 19.05981 21 6.245378 1.362853end F 14.27959 22 2.294422 0.489172
Mean, standard deviation (SD) and standard error mean (St. Error Mean) forstandard deviation of the fundamental frequency (F0 SD) in Hertz (Hz) of thespeakers H and F at the beginning and the end of the dialogue.
Source Type III df Mean F Sig.Sum of Square
Intercept 29760.685 1 29760.685 442.629 0.000Position 203.453 1 203.453 3.026 0.085Error 5984.020 89 67.236
Results of the ANOVA for the standard deviation of the fundamental frequency (F0SD) for the speakers H and F at the beginning and at the end of the dialogue.
F0 Min
Position Speaker Mean N SD Std. Error Mean
beginning H 139.00796 25 32.293084 6.458617beginning F 154.93026 23 25.446447 5.305951
end H 137.51386 22 33.081591 7.053019end F 160.54162 21 11.656008 2.543549
Mean, standard deviation (SD) and standard error mean (St. Error Mean) for theminimum of the fundamental frequency (F0 Min) in Hertz (Hz) of the speakers Hand F at the beginning and the end of the dialogue.
Source Type III df Mean F Sig.Sum of Square
Intercept 1979162.971 1 1979162.971 2389.789 0.000Position 102.187 1 102.187 0.123 0.726Error 73707.546 89 828.175
Results of the ANOVA for the minimal fundamental frequency (F0 Min) for thespeakers H and F at the beginning and at the end of the dialogue.
119

D Results of Analysis 3 - Position in dialogue
F0 Max
Position Speaker Mean N SD Std. Error Mean
beginning H 285.37520 25 38.816999 7.763400beginning F 259.05248 23 18.675661 3.894145
end H 273.86282 22 29.113741 6.207070end F 257.80345 22 14.800031 3.155377
Mean, standard deviation (SD) and standard error mean (St. Error Mean) for themaximum of the fundamental frequency (F0 Max) in Hertz (Hz) of the speakers Hand F at the beginning and the end of the dialogue.
Source Type III df Mean F Sig.Sum of Square
Intercept 6659341.869 1 6659341.869 7746.204 0.000Position 1102.196 1 1102.196 1.282 0.261Error 77372.189 90 859.691
Results of the ANOVA for the maximal fundamental frequency (F0 Max) for thespeakers H and F at the beginning and at the end of the dialogue.
Jitter
Position Speaker Mean N SD Std. Error Mean
beginning H 2.24668 25 .574052 0.114810beginning F 2.30130 23 0.620540 0.129392
end H 2.41505 22 0.707500 0.150840end F 2.28414 22 0.699479 0.149129
Mean, standard deviation (SD) and standard error mean (St. Error Mean) for jitterin percent (%) of the speakers H and F at the beginning and the end of the dialogue.
Source Type III df Mean F Sig.Sum of Square
Intercept 490.512 1 490.512 1180.659 0.000Position 0.135 1 0.135 0.325 0.570Error 37.391 90 0.415
Results of the ANOVA for jitter for the speakers H and F at the beginning and atthe end of the dialogue.
120

D.3 Dialogue H-F
Shimmer
Position Speaker Mean N SD Std. Error Mean
beginning H 7.10152 25 1.295600 0.259120beginning F 7.78578 23 1.471499 0.306829
end H 7.73232 22 1.708574 0.364269end F 7.31000 22 2.131832 0.454508
Mean, standard deviation (SD) and standard error mean (St. Error Mean) forshimmer in percent (%) of the speakers H and F at the beginning and the end ofthe dialogue.
Source Type III df Mean F Sig.Sum of Square
Intercept 5131.221 1 5131.221 1830.863 0.000Position 0.193 1 0.193 0.069 0.793Error 252.236 90 2.803
Results of the ANOVA for shimmer for the speakers H and F at the beginning andat the end of the dialogue.
HNR
Position Speaker Mean N SD Std. Error Mean
beginning H 19.06325 24 1.634153 0.333570beginning F 19.29700 23 2.145163 0.447297
end H 18.90482 22 1.526171 0.325381end F 19.49045 22 2.408319 0.513455
Mean, standard deviation (SD) and standard error mean (St. Error Mean) for theharmonics-to-noise ratio (HNR) in decibel (dB) of the speakers H and F at thebeginning and the end of the dialogue.
Source Type III df Mean F Sig.Sum of Square
Intercept 33466.642 1 33466.642 8817.808 0.000Position 0.009 1 0.009 0.002 0.961Error 337.786 89 3.795
Results of the ANOVA for the harmonics-to-noise ratio (HNR) for the speakers Hand F at the beginning and at the end of the dialogue.
121

D Results of Analysis 3 - Position in dialogue
D.4 Dialogue J-F
F0 Mean
Position Speaker Mean N SD Std. Error Mean
beginning J 229.51 26 17.16 3.36beginning F 211.08 23 13.02 2.71
end J 219.89 24 15.17 3.10end F 210.07 20 18.06 4.04
Mean, standard deviation (SD) and standard error mean (St. Error Mean) for themean fundamental frequency (F0 Mean) in Hertz (Hz) of the speakers J and F atthe beginning and the end of the dialogue.
Source Type III df Mean F Sig.Sum of Square
Intercept 4120925.946 1 4120925.946 13708.057 0.000Position 1073.366 1 1073.366 3.570 0.062Error 25252.141 84 300.621
Results of the ANOVA for the mean fundamental frequency (F0 Mean) for thespeakers J and F at the beginning and at the end of the dialogue.
FO SD
Position Speaker Mean N SD Std. Error Mean
beginning J 35.10 26 8.42 1.65beginning F 17.86 23 5.00 1.04
end J 29.16 24 10.22 2.09end F 23.24 20 10.58 2.37
Mean, standard deviation (SD) and standard error mean (St. Error Mean) forthe standard deviation of the fundamental frequency (F0 SD) in Hertz (Hz) of thespeakers J and F at the beginning and the end of the dialogue.
Source Type III df Mean F Sig.Sum of Square
Intercept 64117.605 1 64117.605 530.021 0.000Position 61.035 1 61.035 0.505 0.479Error 10161.631 84 120.972
Results of the ANOVA for the standard deviation of the fundamental frequency (F0SD) for the speakers J and F at the beginning and at the end of the dialogue.
122

D.4 Dialogue J-F
F0 Min
Position Speaker Mean N SD Std. Error Mean
beginning J 122.28 26 30.36 5.95beginning F 161.41 22 26.09 5.56
end J 147.47 24 28.60 5.84end F 143.44 20 38.52 8.61
Mean, standard deviation (SD) and standard error mean (St. Error Mean) for theminimal fundamental frequency (F0 Min) in Hertz (Hz) of the speakers J and F atthe beginning and the end of the dialogue.
Source Type III df Mean F Sig.Sum of Square
Intercept 1719477.594 1 1719477.594 1487.231 0.000Position 1518.309 1 1518.309 1.313 0.255Error 97117.487 84 1156.161
Results of the ANOVA for the minimal fundamental frequency (F0 Min) for thespeakers J and F at the beginning and at the end of the dialogue.
F0 Max
Position Speaker Mean N SD Std. Error Mean
beginning J 349.95 26 30.90 6.06beginning F 276.54 23 26.07 5.44
end J 324.47 24 42.04 8.58end F 273.05 20 30.69 6.86
Mean, standard deviation (SD) and standard error mean (St. Error Mean) for themaximal fundamental frequency (F0 Max) in Hertz (Hz) of the speakers J and F atthe beginning and the end of the dialogue.
Source Type III df Mean F Sig.Sum of Square
Intercept 8328125.156 1 8328125.156 4027.269 0.000Position 8902.044 1 8902.044 4.305 0.041Error 173706.416 84 2067.934
Results of the ANOVA for the maximal fundamental frequency (F0 Max) for thespeakers J and F at the beginning and at the end of the dialogue.
123

D Results of Analysis 3 - Position in dialogue
Jitter
Position Speaker Mean N SD Std. Error Mean
beginning J 2.30 26 0.51 0.10beginning F 1.84 23 0.50 0.10
end J 2.17 23 0.29 0.06end F 1.92 20 0.58 0.13
Mean, standard deviation (SD) and standard error mean (St. Error Mean) for jitterin percent (%) of the speakers J and F at the beginning and the end of the dialogue.
Source Type III df Mean F Sig.Sum of Square
Intercept 364.782 1 364.782 1380.755 0.000Position 0.021 1 0.021 0.080 0.778Error 21.928 83 .264
Results of the ANOVA for jitter for the speakers J and F at the beginning and atthe end of the dialogue.
Shimmer
Position Speaker Mean N SD Std. Error Mean
beginning J 9.29 26 1.35 0.26beginning F 6.30 22 1.04 0.22
end J 9.51 24 1.72 0.35end F 7.14 20 2.15 0.48
Mean, standard deviation (SD) and standard error mean (St. Error Mean) forshimmer in percent (%) of the speakers J and F at the beginning and the end of thedialogue.
Source Type III df Mean F Sig.Sum of Square
Intercept 5825.449 1 5825.449 1304.304 0.000Position 1.944 1 1.944 0.435 0.511Error 370.705 83 4.466
Results of the ANOVA for shimmer for the speakers J and F at the beginning andat the end of the dialogue.
124

D.5 Dialogue K-F
HNR
Position Speaker Mean N SD Std. Error Mean
beginning J 16.46 26 1.90 0.37beginning F 20.58 23 2.25 0.47
end J 16.73 24 2.05 0.42end F 20.46 19 2.25 0.52
Mean, standard deviation (SD) and standard error mean (St. Error Mean) for theharmonics-to-noise ratio (HNR) in decibel (dB) of the speakers J and F at thebeginning and the end of the dialogue.
Source Type III df Mean F Sig.Sum of Square
Intercept 28323.508 1 28323.508 3352.753 0.000Position 1.186 1 1.186 0.140 0.709Error 701.170 83 8.448
Results of the ANOVA for the harmonics-to-noise ratio (HNR) for the speakers Jand F at the beginning and at the end of the dialogue.
D.5 Dialogue K-F
F0 Mean
Position Speaker Mean N SD Std. Error Mean
beginning K 192.83 22 16.13 3.44beginning F 198.34 20 19.25 4.31
end K 196.43 21 27.22 5.94end F 195.55 22 17.05 3.63
Mean, standard deviation (SD) and standard error mean (St. Error Mean) for themean fundamental frequency (F0 Mean) in Hertz (Hz) of the speakers K and F atthe beginning and the end of the dialogue.
Source Type III df Mean F Sig.Sum of Square
Intercept 3255604.933 1 3255604.933 8007.169 0.000Position 5.908 1 5.908 0.015 0.904Error 33746.660 083 406.586
Results of the ANOVA for the mean fundamental frequency (F0 Mean) for thespeakers K and F at the beginning and at the end of the dialogue.
125

D Results of Analysis 3 - Position in dialogue
F0 SD
Position Speaker Mean N SD Std. Error Mean
beginning K 25.95 22 8.55 1.82beginning F 24.11 20 6.96 1.56
end K 27.96 21 9.91 2.16end F 19.92 22 9.57 2.04
Mean, standard deviation (SD) and standard error mean (St. Error Mean) forthe standard deviation of the fundamental frequency (F0 SD) in Hertz (Hz) of thespeakers K and F at the beginning and the end of the dialogue.
Source Type III df Mean F Sig.Sum of Square
Intercept 50843.983 1 50843.983 596.503 0.000Position 31.941 1 31.941 0.375 0.542Error 7074.648 83 85.237
Results of the ANOVA for the standard deviation of the fundamental frequency (F0SD) for the speakers K and F at the beginning and at the end of the dialogue.
F0 Min
Position Speaker Mean N SD Std. Error Mean
beginning K 136.09 22 19.65 4.19beginning F 124.67 20 34.13 7.63
end K 125.87 21 21.44 4.68end F 142.12 22 26.30 5.61
Mean, standard deviation (SD) and standard error mean (St. Error Mean) for theminimal fundamental frequency (F0 Min) in Hertz (Hz) of the speakers K and F atthe beginning and the end of the dialogue.
Source Type III df Mean F Sig.Sum of Square
Intercept 1490237.973 1 1490237.973 2126.529 0.000Position 264.206 1 264.206 0.377 0.541Error 58165.103 83 700.784
Results of the ANOVA for the minimal fundamental frequency (F0 Min) for thespeakers K and F at the beginning and at the en of the dialogue.
126

D.5 Dialogue K-F
F0 Max
Position Speaker Mean N SD Std. Error Mean
beginning K 280.25 22 46.58 9.93beginning F 280.49 20 35.51 7.94
end K 296.80 21 48.85 10.66end F 268.95 22 38.98 8.31
Mean, standard deviation (SD) and standard error mean (St. Error Mean) for themean fundamental frequency (F0 Max in Hertz (Hz) of the speakers K and F at thebeginning and the end of the dialogue.
Source Type III df Mean F Sig.Sum of Square
Intercept 6732564.089 1 6732564.089 3548.234 0.000Position 101.859 1 101.859 0.054 0.817Error 157487.593 83 1897.441
Results of the ANOVA for the maximal fundamental frequency (F0 Max) for thespeakers K and F at the beginning and at the end of the dialogue.
Jitter
Position Speaker Mean N SD Std. Error Mean
beginning K 2.28 22 0.51 0.11beginning F 2.24 20 0.41 0.09
end K 2.53 21 0.54 0.12end F 2.02 22 0.53 0.11
Mean, standard deviation (SD) and standard error mean (St. Error Mean) for jitterin percent (%) of the speakers K and F at the beginning and the end of the dialogue.
Source Type III df Mean F Sig.Sum of Square
Intercept 435.616 1 435.616 1557.211 0.000Position 0.002 1 0.002 0.007 0.934Error 23.218 83 0.280
Results of the ANOVA for jitter for the speakers K and F at the beginning and atthe end of the dialogue.
127

D Results of Analysis 3 - Position in dialogue
Shimmer
Position Speaker Mean N SD Std. Error Mean
beginning K 7.16 22 01.38 0.29beginning F 7.29 20 1.12 0.25
end K 7.48 21 1.10 0.24end F 7.04 22 1.03 0.22
Mean, standard deviation (SD) and standard error mean (St. Error Mean) forshimmer in percent (%) of the speakers K and F at the beginning and the end ofthe dialogue.
Source Type III df Mean F Sig.Sum of Square
Intercept 4456.157 1 4456.157 3295.051 0.000Position 0.021 1 0.021 0.016 0.901Error 112.247 83 1.352
Results of the ANOVA for shimmer for the speakers K and F at the beginning andat the end of the dialogue.
HNR
Position Speaker Mean N SD Std. Error Mean
beginning K 18.49 22 1.90 0.40beginning F 19.18 20 1.56 0.35
end K 17.85 21 1.58 0.35end F 20.30 22 1.81 0.39
Mean, standard deviation (SD) and standard error mean (St. Error Mean) for theharmonics-to-noise ratio (HNR) in decibel (dB) of the speakers K and F at thebeginning and the end of the dialogue.
Source Type III df Mean F Sig.Sum of Square
Intercept 30550.769 1 30550.769 8160.997 0.000Position 1.683 1 1.683 0.450 0.504Error 310.711 83 3.744
Results of the ANOVA for the harmonics-to-noise ratio (HNR) for the speakers Kand F at the beginning and at the end of the dialogue.
128