Design, Implementation and Comparative Study of Supervised Classification Algorithms for Object...
10
IOSR Journal of Electrical and Electronics Engineering (IOSR-JEEE) e-ISSN: 2278-1676,p-ISSN: 2320-3331, Volume 9, Issue 4 Ver. IV (Jul – Aug. 2014), PP 51-60 www.iosrjournals.org www.iosrjournals.org 51 | Page Design, Implementation and Comparative Study of Supervised Classification Algorithms for Object Sorting C. Chandra Mouli 1 , P. Jyothi 2 , K. P. J. Pradeep 3 and K. Nagabhushan Raju 4 11 Senior Research Fellow, Department of Instrumentation, Sri Krishnadevaraya University, Anantapur, INDIA 2&3 Research Scholar, Department of Instrumentation, Sri Krishnadevaraya University, Anantapur, INDIA 4 Professor, Department of Instrumentation, Sri Krishnadevaraya University, Anantapur, INDIA Abstract:The present study contributes the detailed design, Implementation and comparative studies of supervised classification algorithms such as Nearest Neighbor (NN),k-Nearest Neighbor (k-NN) and Minimum Mean Distance (MMD) along with the distance metrics Maximum, Sum (Manhattan) and Euclidean distances. Classification involves training and testing phases. Training phase teaches the classifier about the types of sample images to classify during the testing phase and saves the class names in a classifier file. Testing phase classifies an unknown sample image into one of the class from classifier file. Total numbers of sample images were divided into the ratio of 30:70 for training and testing respectively. Then classification procedure was performed on sample images for each algorithm with each distance metric. The training and testing VIs for particle and color classification were designed and implemented by using LabVIEW. All the algorithms and distance metrics were analyzed, compared for best results and the maximum accuracy algorithm along with its distance metric is going to implement in real time object sorting application. Keywords: Object Sorting, Supervised Classification Algorithms, Training Phase, Testing Phase, LabVIEW I. Introduction Grouping and tagging of objects with similar properties together, using image processing techniques and statistical classification algorithms for object sorting is the most attention-grabbing research area in the field of automation and instrumentation. Sorting systems remain essential in numerous areas with diverse applications such as in manufacturing industry, libraries, factories, warehouses, pharmacies, supermarkets etc. Yang Tao discusses the advantage of image processing in sorting applications by implementing a sorting system based on the hue extraction of an image processor from the image sensor and image processor performs a color transformation and obtains a single composite hue value for each object for piece of fruit to be sorted [1]. Thomas C. Pearson describes the object sorting system based on video image of an object [2]. MohamadBdiwi discusses about the control system and vision algorithms for library automation and book sorting using integrated vision/force robot control [3]. Roland Szabo implemented an object sorting system based on color using robot arm where webcam is used to identify the color of the object and robot arm is used to place the object in appropriate place [4]. A vision based robot system was developed for 3D pose estimation and picking of the objects in which a video camera surrounded by eight flashes is used to capture the images and CAD tool is used to find the edges of the object using a fully projective formulation [ACB98] of Lowe‘s model based pose estimation algorithm [5]. RaihanFerdousSajal and associates designed an efficient machine vision algorithm for real time image analysis and recognition of different features of Bangladeshi bank notes by using an automatic banknotes sorting system [6]. Image Classification is defined as the process of extracting information/data from an image. The main role of image classification is to detect, recognize and classify the features of an object in an image depending on the type of class [7]. The NN classification algorithm detects the unknown object of a class in an image on the basis of nearest neighbor to the unknown classes from the trained classes. NN is the most widely used classification algorithm in ranking models [13], text categorization [10-12], pattern recognition [8, 9], event recognition [14] and object recognition [15] applications. kNN uses NN rule in which nearest neighbor is calculated from the value of k to specify the number of nearest neighbors to be considered to define a class of sample data point. kNN provides objective, fast, transparent and produces good results over larger areas. The main advantage of kNN algorithm is its simplicity and lack of parametric assumptions [16]. Past researches on Minimum distance classification shows that it is extremely suggested in all image classification applications because of its minimum computation time as it mainly depends on the training data [17]. The present study was focused on the design and implementation of the training and testing VIs for particle and color classification along with distance metrics using LabVIEW. The comparative study was discussed in the results and discussions section. Best results and maximum accuracy algorithm with the corresponding distance metric for both particle and color sorting was used in the real time object sortingapplication.
-
Upload
independent -
Category
Documents
-
view
3 -
download
0
Transcript of Design, Implementation and Comparative Study of Supervised Classification Algorithms for Object...

IOSR Journal of Electrical and Electronics Engineering (IOSR-JEEE)
e-ISSN: 2278-1676,p-ISSN: 2320-3331, Volume 9, Issue 4 Ver. IV (Jul – Aug. 2014), PP 51-60 www.iosrjournals.org
www.iosrjournals.org 51 | Page
Design, Implementation and Comparative Study of Supervised
Classification Algorithms for Object Sorting
C. Chandra Mouli1, P. Jyothi
2, K. P. J. Pradeep
3 and K. Nagabhushan Raju
4
11Senior Research Fellow, Department of Instrumentation, Sri Krishnadevaraya University, Anantapur, INDIA 2&3Research Scholar, Department of Instrumentation, Sri Krishnadevaraya University, Anantapur, INDIA
4Professor, Department of Instrumentation, Sri Krishnadevaraya University, Anantapur, INDIA
Abstract:The present study contributes the detailed design, Implementation and comparative studies of
supervised classification algorithms such as Nearest Neighbor (NN),k-Nearest Neighbor (k-NN) and Minimum
Mean Distance (MMD) along with the distance metrics Maximum, Sum (Manhattan) and Euclidean distances.
Classification involves training and testing phases. Training phase teaches the classifier about the types of
sample images to classify during the testing phase and saves the class names in a classifier file. Testing phase
classifies an unknown sample image into one of the class from classifier file. Total numbers of sample images
were divided into the ratio of 30:70 for training and testing respectively. Then classification procedure was
performed on sample images for each algorithm with each distance metric. The training and testing VIs for
particle and color classification were designed and implemented by using LabVIEW. All the algorithms and
distance metrics were analyzed, compared for best results and the maximum accuracy algorithm along with its distance metric is going to implement in real time object sorting application.
Keywords: Object Sorting, Supervised Classification Algorithms, Training Phase, Testing Phase, LabVIEW
I. Introduction Grouping and tagging of objects with similar properties together, using image processing techniques
and statistical classification algorithms for object sorting is the most attention-grabbing research area in the field
of automation and instrumentation. Sorting systems remain essential in numerous areas with diverse
applications such as in manufacturing industry, libraries, factories, warehouses, pharmacies, supermarkets etc.
Yang Tao discusses the advantage of image processing in sorting applications by implementing a sorting system
based on the hue extraction of an image processor from the image sensor and image processor performs a color transformation and obtains a single composite hue value for each object for piece of fruit to be sorted [1].
Thomas C. Pearson describes the object sorting system based on video image of an object [2]. MohamadBdiwi
discusses about the control system and vision algorithms for library automation and book sorting using
integrated vision/force robot control [3]. Roland Szabo implemented an object sorting system based on color
using robot arm where webcam is used to identify the color of the object and robot arm is used to place the
object in appropriate place [4]. A vision based robot system was developed for 3D pose estimation and picking
of the objects in which a video camera surrounded by eight flashes is used to capture the images and
CAD tool is used to find the edges of the object using a fully projective formulation [ACB98] of Lowe‘s
model based pose estimation algorithm [5]. RaihanFerdousSajal and associates designed an efficient
machine vision algorithm for real time image analysis and recognition of different features of Bangladeshi
bank notes by using an automatic banknotes sorting system [6]. Image Classification is defined as the process of extracting information/data from an image. The main
role of image classification is to detect, recognize and classify the features of an object in an image depending
on the type of class [7]. The NN classification algorithm detects the unknown object of a class in an image on
the basis of nearest neighbor to the unknown classes from the trained classes. NN is the most widely used
classification algorithm in ranking models [13], text categorization [10-12], pattern recognition [8, 9], event
recognition [14] and object recognition [15] applications. kNN uses NN rule in which nearest neighbor is
calculated from the value of k to specify the number of nearest neighbors to be considered to define a class of
sample data point. kNN provides objective, fast, transparent and produces good results over larger areas. The
main advantage of kNN algorithm is its simplicity and lack of parametric assumptions [16]. Past researches on
Minimum distance classification shows that it is extremely suggested in all image classification applications
because of its minimum computation time as it mainly depends on the training data [17].
The present study was focused on the design and implementation of the training and testing VIs for particle and color classification along with distance metrics using LabVIEW. The comparative study was
discussed in the results and discussions section. Best results and maximum accuracy algorithm with the
corresponding distance metric for both particle and color sorting was used in the real time object
sortingapplication.

Design, Implementation and Comparative Study of Supervised Classification Algorithms for ….
www.iosrjournals.org 52 | Page
II. Hardware Features This section describes the basic hardware units required to implement the supervised classification
algorithms. The hardware units used to implement the present work are an image sensor, Illumination unit and PC.
Image Sensor and Illumination Unit An image sensor, its features and illumination unit used in the present work are described in this
section. Image sensor is the first system component to acquire the image of object and to convert it into
electrical signal. Most common type of image sensors used is Charge Coupled Device (CCD) and
Complementary Metal Oxide Semiconductor (CMOS) image sensors. In the present work CMOS image sensor
was used because of producing digital bits output and its compatibility for interfacing with electronic devices,
microcontrollers, PC etc. Since the image sensor produce digital output it was interfaced with the Universal
Serial Bus (USB) controller to communicate with PC. The specifications of CMOS image sensor used in the
present work are provided in the Table 1.
Description Value
Resolution 8 Mega Pixel
Interface USB2.0
Capture Size 640X480
Image Focus 3cm to infinity
Signal Noise Ratio 48DB
Table 1: Specifications of CMOS Image Sensor
CMOS image sensor was built with an array of photo detectors that contain amplifiers, noise- correction and digitization circuit. Generally an image sensor was fixed with lens and interfaced with the
microcontroller and a flash memory to get the data of images to PC. Lens was fixed to get the high quality
images from the image sensor. The image sensor produces serial digital data output. It was interfaced with
EEPROM and USB microcontroller. EEPROM used in the present work is Pm25LV512, a serial EEPROM
manufactured by Programmable Microelectronics Corporation. It comes with 512 Kbits of memory that
consumes low power with 3.3V and cost effective memory. USB controller used in the present work is VC0326
which was embedded with 8-bit microcontroller, 10-bit image processor, JPEG encoder engine, inbuilt ADC,
audio and video class USB support and complies with USB 2.0 protocols for transferring data to PC.
Fig. 1 Front Panel of Particle Training
Image sensor was equipped with illumination unit to capture clear and optimal images with ease.
Illumination unit consists of 12V LEDs which are connected in series and fixed in such a way that the lighting
was focused on the object. 35 LEDs are connected with 7 arrays and each array contains three LEDs and 3 current limiting resistors.
III. Supervised Classification Algorithms using LabVIEW This section describes the application design of particle training, particle testing, color training and
color testing in LabVIEW.

Design, Implementation and Comparative Study of Supervised Classification Algorithms for ….
www.iosrjournals.org 53 | Page
Fig. 2 Block Diagram of Particle Training
1.1 Particle Training
Particle training VI teaches the classifier session with number of images to generate a classifier file
with the class labels. The training procedure was explained in the principle. Fig. 1 shows the front panel of the
particle training phase. It consists of Sample Path, No of Samples, Class Name, Select Method & Metric,
Particle Classifier Options, Image Thresholding, Threshold Options, Sample and Training Results.Sample Path
is a file path control which is used to enter the file path of the sample images and it returns the location of the
directory. No of Samples is a 32-bit integer control used to enter the number of samples. Class Name is a string
used to enter the class name of the set of sample images. Select Method & Metric isa type definition of IMAQ classifier Nearest Neighbor options and cluster of three 32-bit integer control elements Method, Metric and k.
Method is used to specify the algorithm of the classifier session, options include NN, kNN and MMD
algorithms. Metric is used to specify the distance metric of the classifier session; options include Maximum,
Sum (Manhattan)and Euclidean metrics. kis used to enter an odd value when Method is kNN.
Fig. 3 Front Panel of Particle Testing
Particle Classifier Options is a type definition of IMAQ Classification Particle Classification Options
and a cluster of two 32-bit real control elements Scale Dependency and Mirror Dependency. Scale Dependency
is used to determine the relative importance from 0 to 1000 of scale when classifying particles. If it is 0 then
classifying is performed independent of scale value. Mirror Dependency determines the relative importance
from 0 to 1000 of mirror symmetry when classifying particles. Image Threshold is the type definition of IMAQ
Threshold Range and cluster of two 32-bit real control elements Lower Value and Upper Value. Lower Value
and Upper Value are the lowest and highest pixel values used during a threshold. Threshold Options is the type definition of IMAQ Classification particle Local Threshold Options anda cluster of 4 elements of which Method
indicates the local thresholding algorithm and Look For indicates the type of objects looking for, are 32-bit
integer control elements, Niblack Deviation Factor is 64-bit real control element that specifies the constantused
in the Niblack algorithmand Window Size is a cluster of 2 elements SizeX and SizeY which specifies the size of
the window the VI uses when calculating a local threshold. SizeX and SizeY are the sizes of windows in x and y
dimensions respectively. Sample is the type definition of IMAQ Image which is used to display the input sample
images.
Design, Implementation and Comparative Study of Supervised Classification Algorithms for ….
www.iosrjournals.org 54 | Page
Fig. 4 Block Diagram of Particle Testing
Training Results is an array of statistical information for each class in the classifier session and
a cluster of 3 elements Class, Standard Deviation and Number of Samples.Class is the string of class
name which the VI reads. Standard Deviation is the standard deviation from the mean of all samples in
class. Number of Samples is the no. of samples in the class.
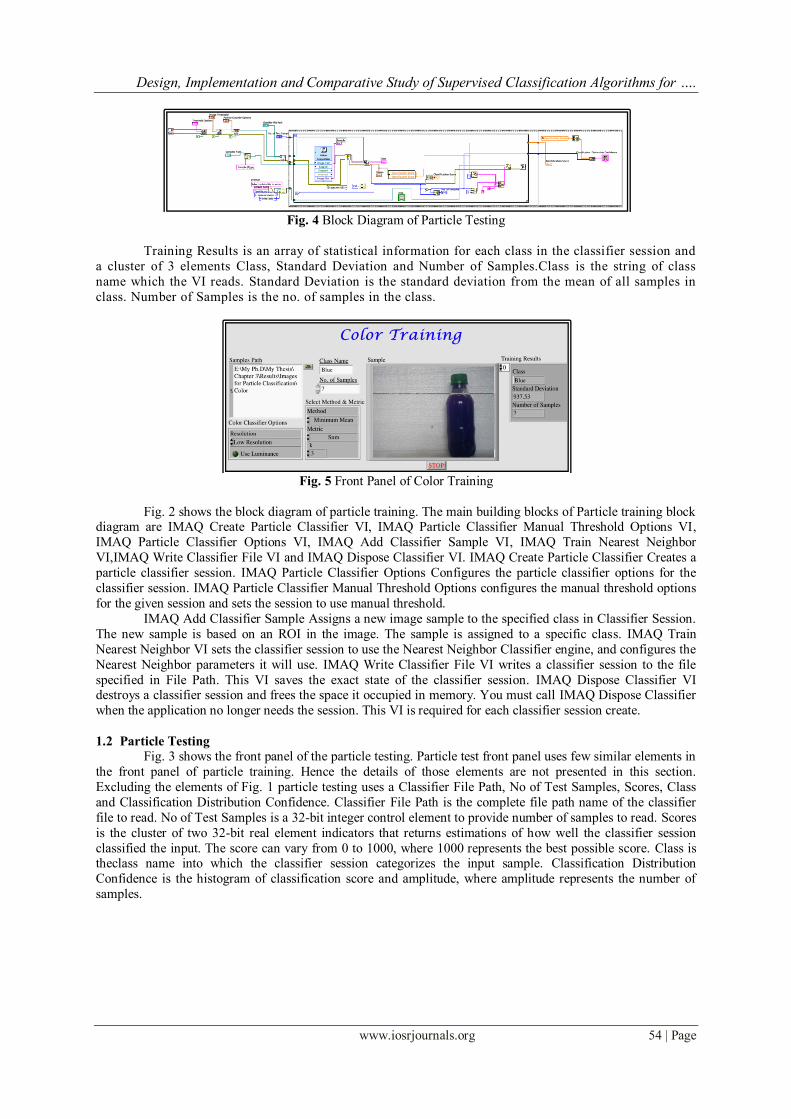
Fig. 5 Front Panel of Color Training
Fig. 2 shows the block diagram of particle training. The main building blocks of Particle training block diagram are IMAQ Create Particle Classifier VI, IMAQ Particle Classifier Manual Threshold Options VI,
IMAQ Particle Classifier Options VI, IMAQ Add Classifier Sample VI, IMAQ Train Nearest Neighbor
VI,IMAQ Write Classifier File VI and IMAQ Dispose Classifier VI. IMAQ Create Particle Classifier Creates a
particle classifier session. IMAQ Particle Classifier Options Configures the particle classifier options for the
classifier session. IMAQ Particle Classifier Manual Threshold Options configures the manual threshold options
for the given session and sets the session to use manual threshold.
IMAQ Add Classifier Sample Assigns a new image sample to the specified class in Classifier Session.
The new sample is based on an ROI in the image. The sample is assigned to a specific class. IMAQ Train
Nearest Neighbor VI sets the classifier session to use the Nearest Neighbor Classifier engine, and configures the
Nearest Neighbor parameters it will use. IMAQ Write Classifier File VI writes a classifier session to the file
specified in File Path. This VI saves the exact state of the classifier session. IMAQ Dispose Classifier VI destroys a classifier session and frees the space it occupied in memory. You must call IMAQ Dispose Classifier
when the application no longer needs the session. This VI is required for each classifier session create.
1.2 Particle Testing
Fig. 3 shows the front panel of the particle testing. Particle test front panel uses few similar elements in
the front panel of particle training. Hence the details of those elements are not presented in this section.
Excluding the elements of Fig. 1 particle testing uses a Classifier File Path, No of Test Samples, Scores, Class
and Classification Distribution Confidence. Classifier File Path is the complete file path name of the classifier
file to read. No of Test Samples is a 32-bit integer control element to provide number of samples to read. Scores
is the cluster of two 32-bit real element indicators that returns estimations of how well the classifier session
classified the input. The score can vary from 0 to 1000, where 1000 represents the best possible score. Class is theclass name into which the classifier session categorizes the input sample. Classification Distribution
Confidence is the histogram of classification score and amplitude, where amplitude represents the number of
samples.

Design, Implementation and Comparative Study of Supervised Classification Algorithms for ….
www.iosrjournals.org 55 | Page
Fig. 6 Block Diagram of Color Training
Fig. 4 shows the block diagram of the particle testing. Particle testing block diagram uses few similar
elements as in Fig. 2 such as IMAQ Create Particle Classifier VI, IMAQ Particle Classifier Manual Threshold
Options VI and IMAQ Particle Classifier Options VI. The only difference is the Get/Set Boolean control. For
particle training and testing Get/Set is 1 and 0 respectively. Excluding the elements in Fig. 2 particle testing
consists of IMAQ Read Classifier File VI and IMAQ Classify VI. IMAQ Read Classifier File VI Reads a classifier session from the file specified by File Path. IMAQ Classify VI Classifies the image sample and gives
classification score.
Fig. 7 Front Panel of Color Test
1.3 Color Training
Fig. 5 shows the front panel of color training. Color training front panel uses few similar elements as in
Fig. 3 such as Sample Path, No of Samples, Class Name, Select Method & Metric, Sample and Training Results.
Excluding the elements in Fig. 3 color training consists of only one element Color Classifier Options. It provides
options to set the color resolution like high, medium and low of a feature and to enable/disable luminance band.
Color Classifier Options is the type definition of IMAQ Classification Color Options and a cluster of one
Resolution which is the type definition of IMAQ Classification Color Resolution and one Boolean control Use
Luminance.
Fig. 6 shows the block diagram of the color training. Color training block diagram uses few similar
elements as in Fig. 2 such as IMAQ Add Classifier Sample VI, IMAQ Train Nearest Neighbor VI,IMAQ Write
Classifier File VI and IMAQ Dispose Classifier VI. Excluding the elements in Fig. 2 color training block
diagram consists of IMAQ Create Color Classifier VI and IMAQ Color Classifier Options. IMAQ Create Color Classifier VI creates a color classifier session. IMAQ Color Classifier Options configures the color classifier
options for the classifier session.
1.4 Color Testing
Fig. 7 shows the front panel of color testing. Color testing front panel uses all the elements as in Fig. 1
such as Classifier File path, No of Test Samples, Samples Path, Sample, Scores, Class Classification
Distribution Confidence and Color Classification options from Fig. 3.

Design, Implementation and Comparative Study of Supervised Classification Algorithms for ….
www.iosrjournals.org 56 | Page
Fig. 8 Block Diagram of Color Test
Fig. 8 shows the block diagram of color testing. Color testing uses elements from particle testing and
color training block diagram as shown in Fig. 2 and Fig. 4 excluding IMAQ Classify Color Advanced VI.
IMAQ Classify Color Advanced VI classifies the image sample located in the given ROI and returns advanced
information, such as the Sample Results.
IV. Methodology In [18], methodology was explained and Classification Accuracy (%), Misclassification Rate and kappa
coefficientwere evaluated only for one set of samples. Inthe present work an additional parameter classification
predictive value was explored. It indicates the probability that a sample classified into a given class belongs to
that class. Columns of the table were used to determine the predictive value, per class, of a classifier. Each
column represents a class into which the classifier classifies samples. The values in the columns indicate how
many samples of each class have been classified into the class represented by the column.
ClassificationPredictiveValue PV =No. ofsamplesclassifiedcorrectly
TotalNo. ofsamplesclassifiedintotheclass
LabVIEW programs were developed for training and testing of particle and color objects. The same
parameters were evaluated to select the best algorithm. Particle objects considered are nuts, bolts and electronic
components. Color liquid filled in bottles is considered as colored objects.
Fig. 11 shows the flow chart of particle and color classification procedure. Flow charts show that
initially it starts a new classifier session using IMAQ Create Particle Classifier VI and acquires necessary inputs
from the user through front panel of the LabVIEW using Sample Path, No of Samples, Class Name, Select
Method & Metric, Particle Classifier Options, Image Thresholding, Threshold Options, Classifier File Path
andColor Classifier Options. Input images of particle training and testing are converted from 32-bit RGB to 8-
bit Gray scale images as shown in Fig. 9 (a) & (c) whereas color training and testing uses 32-bit RGB images
directly as shown in Fig. 9 (b) & (d). Draw an ROI (Region of Interest) if the input image contains more than one object. Since an input image contains only one object no need to draw an ROI. Training procedure adds the
sample to the classifier session for both particle and color using IMAQ Add Classifier Sample VI. Next the
sequence checks whether the iteration of for loop for No. of samples reached or not. If yes train the classifier
using IMAQ Train Nearest Neighbor VI and write the training results using such as number of samples per
class, class name and trained classifier options using IMAQ Write Classifier File VI. Finally close the classifier
session for training using IMAQ Dispose Classifier.
Fig. 9 Flow Chart of Particle and Color Classification (a) Particle Training (b) Particle Testing (c) Color
Training and (d) Color Testing

Design, Implementation and Comparative Study of Supervised Classification Algorithms for ….
www.iosrjournals.org 57 | Page
In the testing procedure particle testing remains same as particle training until 32-bit to 8-bit image
conversion as shown in Fig. 9 (c). Then IMAQ Classify extracts the feature vectors of the test sample. There are
total 8 invariant features such as circularity of the sample, degree of elongation of the sample, convexity of the
sample shape, detailed description of the convexity of a sample shape, discrimination of samples with holes,
detailed discrimination of samples with holes, spread of the sample and slenderness of the sample. Depending
upon the nature, dimensions etc. of the sample, feature vectors are extracted. IMAQ Classify classifies the
samples and provides the outputs such as class name, classification score and identification scores. IMAQ Classify Color Advanced VI extracts color features to classify the color sample images. It
converts the color sample image to HSL color space for calculating hue, saturation and luminance histograms.
The hue and saturation histograms each contain 256 values. Decrease the luminance histogram to 8 values that
are suppressed by 12.5%. By doing this, IMAQ Classify Color Advanced VI accentuates the color information.
To get a high resolution color feature combine the 520 hue, saturation and luminance values. By applying a
dynamic mask to the high resolution color feature one can get medium and low resolution color features. These
are the subsets of high resolution color features. The medium resolution color feature contains 128 hue and
saturation values and 8 luminance values for a total of 136 values. The low resolution color feature contains 64
hue and saturation values and 8 luminance values for a total of 72 values.
A histogram is drawn which is known as classification confidence distribution. The output of the
classification confidence distribution is a good indicator of the classifier performance.
V. Results and Discussions This section gives results and discusses the importance of classification algorithm and distance metrics
for real time object sorting application of particle and color. Total 3 sets of images were considered for particle
classification. It uses 4mm, 5mm, 6mm, 10mm, 12mm and 15mm diameter nuts, 1inch length 4mm, 5mm,
6mm, 10mm and 12mm diameter bolts and electronic spares such as 9V DC battery, potentiometer, 6V DC ice
cube relay and toggle switches to evaluate the classifiers performance. Color classification uses the real colors
filled in the bottle. Total 9 colors are used to evaluate the classifiers performance.
Fig. 10 Classification Distribution Tables for Nuts
Fig. 11 Classification Confidence Distribution of NN-Sum for Nuts
Fig. 12 shows the classification distribution tables of nuts for all algorithms and distance metrics.

Design, Implementation and Comparative Study of Supervised Classification Algorithms for ….
www.iosrjournals.org 58 | Page
Results have been taken for total nine combinations in which NN-Sum (Nearest Neighbor with Sum distance
metric) shows the highest accuracy of 92.1429% among all. Hence the classification confidence distribution was
taken for NN-Sum. Fig. 13 (a), (b), (c), (d), (e) and (f) shows the classification confidence (Classification Score)
distribution for 10mm, 12mm, 15mm, 4mm, 5mm and 6mm nuts. From the figure it is clear that the
classification score threshold varies for each nut type. By keeping the threshold scores 121.33, 163.18, 121,
77.45, 139.66 and 49.46 one can eliminate 3, 4, 0, 1, 1, and 1 other sized nuts whereas 1, 2, 0, 1, 1, and 1 same
sized nuts can be ignored for 10mm, 12mm, 15mm, 4mm, 5mm and 6mm nuts. For all algorithms and distance metrics classification accuracy and classification predictive values are given in Fig. 12 with the label Accuracy
(in orange color) and PV(in blue color)for each class respectively.
Fig. 12 shows the classification distribution tables of bolts for all algorithms and distance metrics.
Results have been taken for total nine combinations in which NN-Sum shows the highest accuracy of 90.5714%
among all. Hence the classification confidence distribution was taken for NN-Sum. Fig. 13 (a), (b), (c), (d), and
(e) shows the classification confidence distribution for 1inch 10mm, 12mm, 4mm, 5mm and 6mm nuts. From
the figure it is clear that the classification score threshold varies for each bolt type. By keeping the threshold
scores 30.17, 207.59, 44.15, 207.18, and 44.06 one can eliminate 4, 5, 0, 7, and 0 other sized nuts whereas 2, 3,
0, 2, and 0 same sized nuts can be ignored for 1inch 10mm, 12mm, 4mm, 5mm and 6mm bolts.
Fig. 12 Classification Distribution Tables for 1inch Bolts
Fig. 13 Classification Confidence Distribution of NN-Sum for Bolts
Fig. 14 shows the classification distribution tables of electronic spares for all algorithms and distance
metrics. Results have been taken for total nine combinations in which NN-Euc (Nearest Neighbor with
Euclidean distance metric) shows the highest accuracy of 75% among all. Hence the classification confidence
distribution was taken for NN-Euc. Fig. 15 (a), (b), (c), and (d) shows the classification confidence distribution
for Battery, POT, Relay and Toggle Switch (TS). From the figure it is clear that the classification score
threshold varies for each spare. By keeping the threshold scores 686.89, 0, 210.14 and 128.38 one can eliminate
21, 0, 7, and 9 other spares whereas 12, 0, 6, and 3 same spare for 1inch Battery, POT, Relay and TS.

Design, Implementation and Comparative Study of Supervised Classification Algorithms for ….
www.iosrjournals.org 59 | Page
Fig. 14 Classification Distribution Tables for Electronic Parts
Fig. 15 Classification Confidence Distribution of NN-Sum for Bolts
Fig. 16 shows the classification distribution tables of color for all algorithms and distance metrics.
Results have been taken for total 9 colors with nine combinations in which NN-Sum and MMD-Sum shows the
highest accuracy of 95.238% among all. Since 7 sample images were considered for testing, classification
confidence distribution was not drawn.
Fig. 16 Classification Distribution Tables for Color Bottles
Nuts
NN-Sum Bolts
NN-Sum Elec-Spares
NN-Euc Color
NN/MMD-Sum
Accuracy (%) 92.1429 90.5714 75 95.2381
Misclassification Rate 0.07857 0.09429 0.25 0.04762
Kappa Coefficient 0.906 0.882 0.667 0.946
Table 2:Classification Parameters for Selected Algorithms
Misclassification rate and kappa coefficient was calculated for nuts, bolts, electronic spares, colors on each algorithm and distance metrics. Table 2 shows the best values of classification parameters such as

Design, Implementation and Comparative Study of Supervised Classification Algorithms for ….
www.iosrjournals.org 60 | Page
accuracy, misclassification rate and kappa coefficient among all. From the investigations it is clear that NN-Sum
can be used for nuts and bolts and NN-Euc can be used for electronic spares in real time object sorting
application. Both NN-Sum and MMD-Sum can be used in real time color bottles sorting application.
VI. Conclusion From the investigations it is clear that NN-Sum can be used for nuts and bolts and NN-Euc can be used
for electronic spares in real time object sorting application. Both NN-Sum and MMD-Sum can be used in real
time color bottles sorting application.However, the accuracy of the algorithms depends on the robustness and
quality constraints of training dataset. Different environmental conditions and selection of dataset also affects
the classification accuracy.
Acknowledgements The authors acknowledge the help and support of University Grants Commission (UGC), Bahadur
Shah Zafar Marg, New Delhi for providing the facilities for carrying out the research work.
References [1] Yang Tao, Method and Apparatus for Sorting Objects by Color, U.S. Patent 5 339 963, Aug 23, 1994.
[2] Thomas C. Pearson, Machine Vision Apparatus and Method for Sorting Object, U.S. Patent 5 703 784, Dec 30, 1997.
[3] Bdiwi, M.; Suchy, J., Robot control system with integrated vision/force feedback for automated sorting system,Technologies for
Practical Robot Applications (TePRA), IEEE International Conference, 23- 24 April 2012, p p.31,36.
[4] Szabo, R.; Lie, I., Automated colored object sorting application for robotic arms, Electronics and Telecommunications
(ISETC), 2012 10th International Symposium , pp.95,98, 15-16 Nov. 2012.
[5] AmitAgrawal, Yu Sun, John Barnwell, Ramesh Raskar, Vision Guided Robot System for Picking Objects By Casting Shadows,
International Journal of Robotics Research, vol. 29 no. 2-3, pp.155-173, February 2010.
[6] B.Gabrya, L. Petrakieva; Combining labeled and Unlabelled data in the design of pattern classification systems,
International Journal of Approximate Reasoning , 2004.
[7] V.Vaidehi, S. Vasuhi, Person Authentication using Face Reco
[8] gnition, Proceedings of the world congress on engg and computer science, 2008.
[9] Shizen, Y. Wu, An Algorithm for Remote Sensing Image Classification based on Artificial Immune b-cell Network, Springer
Berlin, Vol 40.
[10] G. Toker, O. Kirmemis, Text Categorization using k Nearest Neighbor Classification, Survey Paper, Middle East Technical
University.
[11] Y. Liao, V. R. Vemuri, Using Text Categorization Technique for Intrusion detection, Survey Paper, University of California.
[12] E. M. Elnahrawy, Log Based Chat Room Monitoring Using Text Categorization: A Comparative Study, University of Maryland.
[13] X. Genget. al, Query Dependent Ranking Using k Nearest Neighbor, SIGIR, 2008.
[14] Y. Yang and T. Ault, Improving Text Categorization Methods for event tracking, Carnegie Mellon University.
[15] F. Bajramovieet. al, A Comparison of Nearest Neighbor Search Algorithms for Generic Object Recognition, ACIVS 2006, LNCS
4179, pp 1186-1197.
[16] B.K. Mayanka; Classification of Remote Sensing data using KNN method, Journal Of Information, Knowledge And
Research In Electronics And Communication Engineering, Vol. 02, Issue – 02).
[17] J. Cohen, A coefficient of agreement for nominal scales, Educational and Psychological Measurement, 20:27-46, 1960.
[18] Richards, J.A., Remote Sensing Digital Image Analysis: An Introduction, Springer-Verlag, pp. 265-290, 1995.
[19] C. Chandra Mouli, P. Jyothi and K. Nagabhushan Raju, Comparative Study of Supervised Classification Algorithms for WOSRAS,
International Journal of Advanced Research in Electrical, Electronics and Instrumentation Engineering (An ISO 3297: 2007
Certified Organization) Vol. 3, Issue 2, February 2014, pp: 7188 – 7193.


![KLV-30MR1 - Error: [object Object]](https://static.fdokumen.com/doc/165x107/631786651e5d335f8d0a6a63/klv-30mr1-error-object-object.jpg)