DESIGN AND CHARACTERIZATION OF VALSARTAN NANO SUSPENSION
12
Inter. J. of Pharmacotherapy / 2(2), 2012, 70-81. 70 DESIGN AND CHARACTERIZATION OF VALSARTAN NANO SUSPENSION Rajalakshmi. R 1 , Thanda Venkataramudu *1 , R. Arun Kumar 1 , K. Divya Sree 2 , M. Deepti Kiranmayi 3 Dept. of Pharmaceutics, 1 Sree Vidyanikethan College of Pharmacy, Tirupati, A.P, 517102, India. 2 SV University, Tirupati, A.P, 517102, India. 3 AMR Memorial College of Pharmacy, Narasaraopet, Guntur, A.P, 522601, India. INTRODUCTION Various formulation parameters that play a crucial role in the successful formulation of drugs are aqueous solubility, stability at ambient temperature and humidity, photostability, compatibility with solvent and excipient. Among this aqueous solubility became a hurdle for the formulation of new molecular entities. More than 40% of the new chemical entities being generated through drug discovery programmes are poorly water‐soluble or lipophilic compounds [1]. Formulating a poorly water soluble drug has always been a challenging problem confronted by the pharmaceutical scientist. The formulation of nano‐sized particles can be implemented to all drug compounds belonging to biopharmaceutical classification system (BCS) classes II and IV to increase their solubility and hence partition into gastrointestinal barrier [2]. Micronization is used for class II drugs of (BCS), i.e. drugs having a good permeability and poor solubility [3‐5]. There are many conventional methods for increasing the solubility of poorly soluble drugs, which include micronization [6], solubilisation using co‐solvents [7], salt form [8], surfactant dispersions [9], precipitation technique [10‐11], and oily solution. Other techniques are like liposomes [12], emulsions [13‐14], microemulsion [15‐16], solid dispersion [17‐18] and inclusion complexation using cyclodextrins [19‐21] show sensible achiever, but they lack in universal applicability to all drugs. These techniques are not applicable for those drugs which are not soluble in aqueous and organic solvents. Nanotechnology can be used to solve the problems associated with these conventional approaches for solubility and bioavailability enhancement. Nanosuspension is favoured for compounds that are Corresponding Author:- Thanda Venkataramudu Email: [email protected] International Journal of Pharmacotherapy www.ijopjournal.com ISSN 2249 - 7765 Print ISSN 2249 - 7773 ABSTRACT Low oral bioavailability of poorly water soluble drugs poses a great challenge during drug development. Poorly water soluble compounds are difficult to develop as drug products and conventional formulation techniques are frequently abandoned early in discovery. The aim of the present study was to improve the dissolution rate of a poorly water soluble drug, valsartan, by a high pressure homogenization technique. Six different formulations were prepared by optimizing various parameters using different polymers like polaxamer, soyalecithin, PVP and PVA. Formulations are evaluated for pure drug identification, FTIR, DSC, %yield, drug content, %EE, SEM, In vitro drug release study. Polymer concentrations have greater effect on retention of nanosuspension and control the drug release for longer period. From the results of all the formulations F3 exhibited optimum characters. Key words: Bioavailability, Poor solubility, Valsartan, Polaxamer, Soyalecithin, PVP, PVA, Nano suspension.
-
Upload
independent -
Category
Documents
-
view
0 -
download
0
Transcript of DESIGN AND CHARACTERIZATION OF VALSARTAN NANO SUSPENSION
Inter. J. of Pharmacotherapy / 2(2), 2012, 70-81.
70
DESIGN AND CHARACTERIZATION OF VALSARTAN
NANO SUSPENSION
Rajalakshmi. R1, Thanda Venkataramudu
*1, R. Arun Kumar
1, K. Divya Sree
2,
M. Deepti Kiranmayi3
Dept. of Pharmaceutics, 1Sree Vidyanikethan College of Pharmacy, Tirupati, A.P, 517102, India. 2SV University, Tirupati, A.P, 517102, India.
3AMR Memorial College of Pharmacy, Narasaraopet, Guntur, A.P, 522601, India.
INTRODUCTION
Various formulation parameters that play a
crucial role in the successful formulation of drugs are
aqueous solubility, stability at ambient temperature and
humidity, photostability, compatibility with solvent and
excipient. Among this aqueous solubility became a hurdle
for the formulation of new molecular entities. More than
40% of the new chemical entities being generated through
drug discovery programmes are poorly water‐soluble or
lipophilic compounds [1]. Formulating a poorly water
soluble drug has always been a challenging problem
confronted by the pharmaceutical scientist. The
formulation of nano‐sized particles can be implemented to
all drug compounds belonging to biopharmaceutical
classification system (BCS) classes II and IV to increase
their solubility and hence partition into gastrointestinal
barrier [2]. Micronization is used for class II drugs of
(BCS), i.e. drugs having a good permeability and poor
solubility [3‐5]. There are many conventional methods for
increasing the solubility of poorly soluble drugs, which
include micronization [6], solubilisation using co‐solvents
[7], salt form [8], surfactant dispersions [9], precipitation
technique [10‐11], and oily solution. Other techniques are
like liposomes [12], emulsions [13‐14], microemulsion
[15‐16], solid dispersion [17‐18] and inclusion
complexation using cyclodextrins [19‐21] show sensible
achiever, but they lack in universal applicability to all
drugs. These techniques are not applicable for those drugs
which are not soluble in aqueous and organic solvents.
Nanotechnology can be used to solve the problems
associated with these conventional approaches for
solubility and bioavailability enhancement.
Nanosuspension is favoured for compounds that are
Corresponding Author:- Thanda Venkataramudu Email: [email protected]
International Journal of Pharmacotherapy
www.ijopjournal.com
ISSN 2249 - 7765
Print ISSN 2249 - 7773
ABSTRACT
Low oral bioavailability of poorly water soluble drugs poses a great challenge during drug development. Poorly
water soluble compounds are difficult to develop as drug products and conventional formulation techniques are frequently
abandoned early in discovery. The aim of the present study was to improve the dissolution rate of a poorly water soluble
drug, valsartan, by a high pressure homogenization technique. Six different formulations were prepared by optimizing
various parameters using different polymers like polaxamer, soyalecithin, PVP and PVA. Formulations are evaluated for
pure drug identification, FTIR, DSC, %yield, drug content, %EE, SEM, In vitro drug release study. Polymer
concentrations have greater effect on retention of nanosuspension and control the drug release for longer period. From the
results of all the formulations F3 exhibited optimum characters.
Key words: Bioavailability, Poor solubility, Valsartan, Polaxamer, Soyalecithin, PVP, PVA, Nano suspension.

Inter. J. of Pharmacotherapy / 2(2), 2012, 70-81.
71
insoluble in water (but are soluble in oil) with high log P
value, high melting point and high doses. Nanosuspension
technology can also be used for drugs which are insoluble
in both water and organic solvents eg. Naproxen [22],
clofazomine [23], bupravaquone [24] etc.
Oral administration is the most convenient and
widely utilized and preferred route of drug delivery for
systemic action. The dissolution behavior of a drug is key
determinant to its oral bioavailability. An improved oral
bioavailability of poor water soluble drugs remains one of
the most challenging aspects of drug development.
Nanosuspensions are colloidal dispersions of
nanosized drug particles stabilized by surfactants. They
can also be defined as a biphasic system consisting of
pure drug particles dispersed in an aqueous vehicle in
which the diameter of the suspended particle is less than
1µm in size. Reduction of drug particles to nanometer
range leads to an enhanced dissolution rate not only
because of increased surface area but also because of
saturation solubility [25]. The increase in the saturation
solubility and solution velocity of nanoparticle is due to
increase of vapour pressure of the particles.
Nanosuspension have disclosed the problems associated
with the delivery of poorly water ‐soluble and poorly
water‐and lipid soluble drugs and are unequalled because
of their simplicity and rewards they confer over other
strategies.
Preparation of nanosuspension There are two methods for preparation of
nanosuspension. They are ‘Bottom up technology’ and
‘Top down technology’[26‐27] of nanoparticles in Bottom
up technology the drug is dissolved in a solvent, which is
then added to non‐solvent that causes precipitation of the
fine drug particles[28‐29]. All‐Trans retinoic acid
nanosuspensions were prepared with a precipitation
method[30]. Use of simple and low cost equipment and
also benefit for higher saturation solubility is the
advantage for precipitation technique compared to other
methods of nanosuspension preparation. Precipitation
technique is not applicable to drugs which are poorly
soluble in aqueous and non-aqueous media. In this
technique, the drug needs to be soluble in atleast one
solvent which is miscible with nonsolvent. The major
challenge is to avoid crystal growth due to Ostwald
ripening being caused by different saturation solubilities
in the vicinity of differently sized particles. The top down
technologies include (a) media milling [31‐32] (b) high
pressure homogenizer [33], emulsion diffusion method,
(d) supercritical fluid method.
Valsartan is a nonpeptide, orally active and
specific angiotensin II antagonist acting on the AT1
receptor sub type. It is widely prescribed therapeutic drug
for hypertension. The bioavailability ofter oral
administration is low (10-35%) with a higher variability.
In recent years much attention has been focused on drug
nanosuspension for the improvement of bioavailability of
water insoluble drugs [30-32].
The present study was aimed at developing
nanosuspension of valsartan in order to improve the
stability, bioavailability and efficacy in treatment of
hypertension. The stabilizers are used to maintain the
stability of the product.
MATERIALS AND METHOD
Valsartan was obtained as a gift sample from
Hetero Laboratory Ltd. Polaxamer was a gift sample from
Reddy’s Laboratory Ltd. Soyalecithin and PVA were
procured from Sigma-Aldrich, USA. Tween 80 was
purchased from Qualikems fine chemicals Ltd, New
Delhi. All excipients and solvents were of laboratory
grade and double distilled deionized water was used for
the research work.
Standard Plot for Valsartan
a) In Methanol:
100mg of valsartan was weighed and transferred
to a 100ml standard flask. Volume was made up to 100ml
with Methanol. 1ml from above stock solution was
transferred into 100ml standard flask and volume was
made with Methanol. Pipette out 2ml, 4ml, 6ml, 8ml and
10ml from the above solution and transferred into 10ml
standard flask and the volume was made with Methanol
b) In Phosphate Buffer (pH 7.4):
100mg of valsartan was weighed and transferred to a
100ml standard flask. The volume was made up to 100ml
with Phosphate buffer. 1ml from above stock solution was
pipetted and transferred into 100ml standard flask and
volume was made up to 100ml with Phosphate buffer.
Pipetted out 2ml, 4ml, 6ml, 8ml and 10ml from the above
solution transferred in 10ml standard flask and made the
volume up to 10ml with Phosphate buffer.
Table 1. Formulation of valsartan nanosuspension
Ingredients F1 F2 F3 F4 Pure
drug
Valsartan (mg) 40 40 40 40 40
Soya lecithin (%w/v) 0.5 1 1 - -
Poloxamer (%w/v) 1 - - 1 -
Tween 80 (%v/v) - - 0.5 0.3 -
Aqueous solvent (ml) 20 20 20 20 20
Preparation of Valsartan Nanosuspension
To prepare nanosuspension of Valsartan, it is
preferred to start with a very fine powder. First the
surfactants in different concentrations were dissolved in
water. The drug powder was dispersed in the aqueous
surfactant solution using high speed ultra sound
homogenizer for 30 min at high rpm to obtain

Inter. J. of Pharmacotherapy / 2(2), 2012, 70-81.
72
nanosuspension. Composition of different valsartan
nanosuspensions are presented in Table 1.
Particle size analysis and zeta potential measurement
The particle size of the produced nanosuspension
was analyzed by photon correlation spectroscopy using a
zetasizer 5000 (Malvern Instruments Ltd, UK). Sample
was measured appropriately after diluted with bidistilled
water. The nanoparticle surface appearance and shape
were analyzed by scanning electron microscopy (SE The
mean particle size for the formulations was determined by
a Zeta sizer Nano ZS-90 (Malvern Instruments Ltd., UK)
equipped with the DTS software. The reading was carried
out at a 900 angle with respect to the incident beam. The
zeta potential was measured by a laser doppler
anemometer coupled with the same instrument. A
potential of ± 150 mV was set in the instrument.
Disposable cuvettes of 0.75 mL capacity were used for all
measurements. Statistical 91 analysis of the data were
performed via one way analysis of variance (ANOVA)
followed by Tucky test using Minitab software version
15. Thumb rule describes the relation between zeta
potential determination responses of the suspension being
tested, particularly hydrophobic colloids. The prepared
nanoparticles suspensions were characterized with respect
to zeta potential by using zeta potential analyzer (Malvern
Zeta sizer).
Scanning Electron Microscopy
In order to examine the particle surface
morphology and shape, Scanning Electron Microscopy
(SEM) was used. A concentrated aqueous suspension was
spread over a slab and dried under vacuum. The sample
was shadowed in a cathodic evaporator with a gold layer
20 nm thick. Photographs were taken using a JSM-5200
Scanning Electron Microscope (Tokyo, Japan) operated at
10 kV.
Fourier Transform Infrared Spectroscopy
The Fourier transform infrared analysis was
conducted to verify the possibility of interaction of
chemical bonds between drug and polymer. The FTIR
spectrum was performed by using a PerkinElmer 1600
spectrophotometer with a resolution of 2 cm-1
. The
samples were scanned in the spectral region between 4000
and 400 cm-1
by taking an average of 8 scans per sample.
Solid powder samples were oven dried at around 300C,
finely crushed, mixed with potassium bromide (1:10 ratio
by weight) and pressed at 15000 psig (using a Carver
Laboratory Press, Model C, Fred S. carver Inc., WIS
53051) to make disc. The detector was purged carefully
by clean dry nitrogen gas to increase the signal level and
reduce moisture. For the analysis of the data, the spectrum
GX series model software was used.
Differential Scanning Colorimetry
Thermal characteristics of the pure materials, the
physical mixtures and nano-solid suspension were
determined by an automatic thermal analyzer system.
Accurately weighed samples were placed in
nonhermetically aluminum pans and heated against an
empty aluminium pan as a reference. Heating rate was 5 0C/min and nitrogen purge 20 ml/min.
Determination of valsartan solubility
Valsartan solubility studies were performed in
triplicate by adding excess amounts of valsartan to water
and buffer solutions having different pH (1.2 and 7.4)
buffers. The solutions containing flasks were kept on a
rotary shaker for 24 h. After 24 h, solutions were analyzed
using UV spectrophotometer at 248 nm, which was the
absorption maxima determined earlier and drug
concentrations were calculated.
Determination of Nanosuspension Process Yield
The nanosuspension production yield was
calculated by gravimetry. Fixed volumes of nanoparticles
suspension were centrifuged (16,000×g, 30 min, 15ºC)
and sediments were dried.
The percentage process yield (% P.Y.) was calculated as
follows:
Nanoparticles weight
% P.Y. = ---------------------------------------- x100
Total solids weight
Determination of % Entrapment Efficiency
The Nanosuspension with known amount of drug
(1.5mg/1ml) incorporated was centrifuged at 5000 rpm
for 15 minutes. The supernatant solution was separated.
5ml of supernatant was distributed with 100 ml of 2% w/v
tween 80 solutions and the absorbance was measured
using UV spectrophotometer at 248 nm using 2% w/v
tween 80 as blank. The amount of drug unentrapped in the
supernatant was calculated. The amount of drug entrapped
and percentage entrapment was determined from drug
unentrapped. Standard deviation was determined for 3
trials.
In vitro drug release study
The diffusion medium used was phosphate
buffer pH 7.4. Assembly of diffusion cell for in-vitro
diffusion studies the oral diffusion cell was designed as
per the dimension given. The diffusion cell was placed on
the magnatic stirrer.Receptor compartment was filled with
buffer solution. Then the prepared egg membrane was
mounted on the cell carefully so as to avoid the
entrapment of of air bubbles under the membrane.
Intimate contact of egg membrane was ensured with
receptor fluid by placing it tightly with clamp. The speed
of the stirring was kept throughout the experiment. With
the help of pipette 5ml of sample was withdrawn at a time
Inter. J. of Pharmacotherapy / 2(2), 2012, 70-81.
73
intervals of one hour from sampling port of receptor
compartment and same volume was the replaced with
receptor fluid solution in order to maintain sink condition.
The samples were withdrawn and the amount of drug
released was assessed by measuring the absorbance at 248
nm using a single beam UV spectrophotometer.
Stability studies
Stability is defined as extent to which a product
remains within specified limits throughout its period of
storage and use. A drug formulation is said to be stable if
it fulfills the following requirements.
It should contain at least 90 % of the stated active
ingredient.
It should contain effective concentration of added
preservatives, if any
It should neither exhibit discoloration or
precipitation, nor develops foul odour.
It should not develop irritation or toxicity.
Procedure
Formulation was divided into 3 sets of samples
and stored at:
4ºC in refrigerator
Room Temperature (29ºC)
45ºC ± 2ºC, 75ºC % RH ± 5 % in humidity control
ovens
After 30 days drug contents of all samples were
determined by the method as in entrapment efficiency.
RESULTS AND DISCUSSION
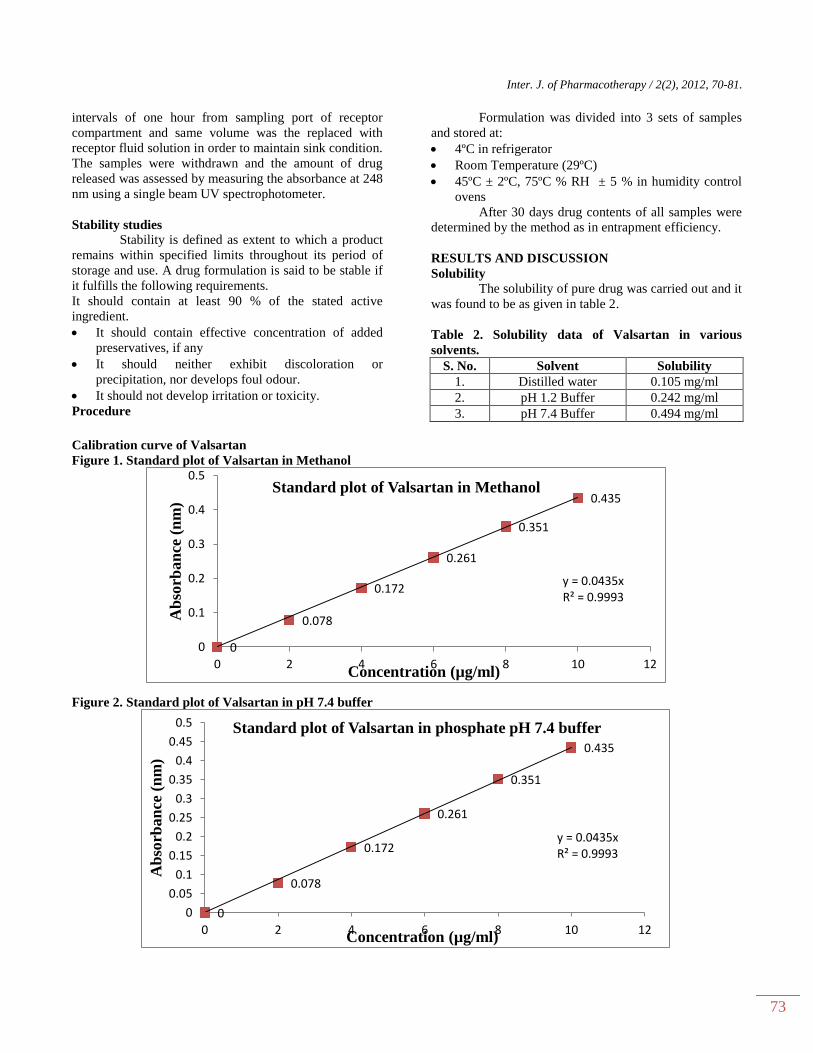
Solubility
The solubility of pure drug was carried out and it
was found to be as given in table 2.
Table 2. Solubility data of Valsartan in various
solvents.
S. No. Solvent Solubility
1. Distilled water 0.105 mg/ml
2. pH 1.2 Buffer 0.242 mg/ml
3. pH 7.4 Buffer 0.494 mg/ml
Calibration curve of Valsartan
Figure 1. Standard plot of Valsartan in Methanol
Figure 2. Standard plot of Valsartan in pH 7.4 buffer
0
0.078
0.172
0.261
0.351
0.435
y = 0.0435x R² = 0.9993
0
0.1
0.2
0.3
0.4
0.5
0 2 4 6 8 10 12
Ab
sorb
an
ce (
nm
)
Concentration (µg/ml)
Standard plot of Valsartan in Methanol
0
0.078
0.172
0.261
0.351
0.435
y = 0.0435x R² = 0.9993
0
0.05
0.1
0.15
0.2
0.25
0.3
0.35
0.4
0.45
0.5
0 2 4 6 8 10 12
Ab
sorb
an
ce (
nm
)
Concentration (µg/ml)
Standard plot of Valsartan in phosphate pH 7.4 buffer
Inter. J. of Pharmacotherapy / 2(2), 2012, 70-81.
74
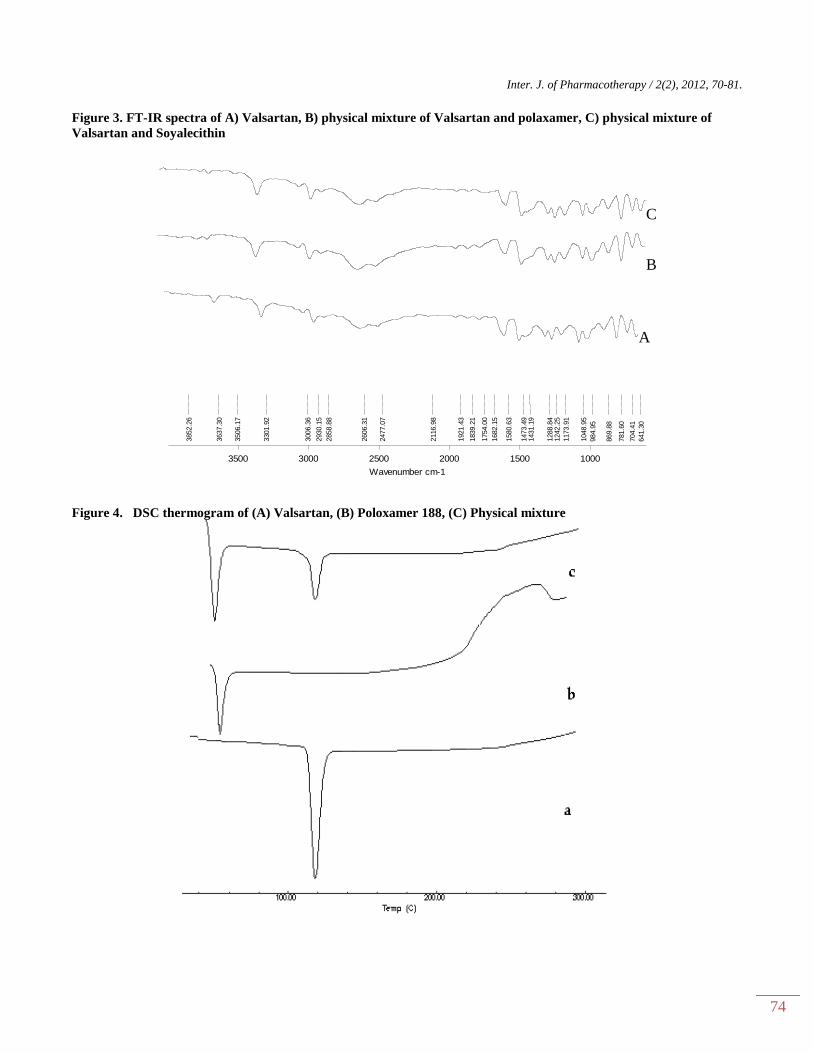
Figure 3. FT-IR spectra of A) Valsartan, B) physical mixture of Valsartan and polaxamer, C) physical mixture of
Valsartan and Soyalecithin
C
B
A
Figure 4. DSC thermogram of (A) Valsartan, (B) Poloxamer 188, (C) Physical mixture
E:\Pharmaceutics\Adil\Tramadol-HCl+Carbopol.0 Tramadol-HCl+Carbopol SOLID 23/09/2010
3772.66
3696.13
3639.90
3452.69
3302.00
3012.50
2930.23
2859.02
2594.10
2478.60
1922.25
1838.72
1708.39
1581.17
1471.80
1288.46
1241.21
1173.49
1048.82
982.41
869.52
781.40
703.82
646.65
100015002000250030003500
Wavenumber cm-1
9697
9899
Transmitt
ance [%]
Page 1/1
E:\Pharmaceutics\Adil\Tramadol-HCl.1 Tramadol-HCl SOLID 23/09/2010
3706.76
3637.74
3302.29
3010.31
2930.25
2851.58
2597.49
2475.49
1924.24
1838.16
1755.91
1580.70
1470.42
1287.04
1240.24
1173.89
1048.20
983.49 870.50 781.59 704.57
100015002000250030003500
Wavenumber cm-1
97.598.0
98.599.0
99.5100.0
Transmittance
[%]
Page 1/1
E:\Pharmaceutics\Adil\Tramadol-HCl+SOdium CMC.0 Tramadol-HCl+SOdium CMC SOLID 23/09/2010
3852.26
3637.30
3506.17
3301.92
3006.36
2930.15
2858.88
2606.31
2477.07
2116.98
1921.43
1839.21
1754.00
1682.15
1580.63
1473.49
1431.19
1288.84
1242.25
1173.91
1048.95
984.95
869.88
781.60
704.41
641.30
100015002000250030003500
Wavenumber cm-1
97.097.5
98.098.5
99.099.5
100.0
Transmitt
ance [%]
Page 1/1
E:\Pharmaceutics\Adil\Tramadol-HCl+SOdium CMC.0 Tramadol-HCl+SOdium CMC SOLID 23/09/2010
3852.2
6
3637.3
0
3506.1
7
3301.9
2
3006.3
6
2930.1
5
2858.8
8
2606.3
1
2477.0
7
2116.9
8
1921.4
3
1839.2
1
1754.0
0
1682.1
5
1580.6
3
1473.4
91431.1
9
1288.8
41242.2
5
1173.9
1
1048.9
5
984.9
5
869.8
8
781.6
0
704.4
1
641.3
0
100015002000250030003500
Wavenumber cm-1
97.0
97.5
98.0
98.5
99.0
99.5
100.0
Tra
nsm
itta
nce [
%]
Page 1/1

Inter. J. of Pharmacotherapy / 2(2), 2012, 70-81.
75
Figure 5. Particle size of formulation F3
Figure 6. Size distribution of Formulation F3
Figure 7. SEM photograph of pure drug

Inter. J. of Pharmacotherapy / 2(2), 2012, 70-81.
76
Figure 8. SEM photographs of nanosuspension
Table 3. Percentage drug content, Drug entrapment efficiency and percentage yield of Nanosuspension
Formulation batches % drug content Entrapment efficiency % Yield
F1 96.24 82.52 78.50
F2 94.64 74.96 69.51
F3 97.24 83.17 82.12
F4 89.92 79.26 70.24
In vitro drug release studies
Table 4. Drug release from all the formulations
S. No. Time
(hours)
% drug release
F1 F2 F3 F4 PURE DRUG
1. 0 0 0 0 0 0
2. 1 26.74 22.57 22.51 23.28 16.67
3. 2 37.4 33.4 32.79 36.3 19.13
4. 3 69.86 58.01 56.24 55.44 24.72
5. 4 81.26 76.66 66.72 73.35 26.51
6. 5 94.36 89.45 79.24 85.29 27.12
7. 6 98.08 95.98 84.91 91.08 32.72
Figure 9. Cumalative drug release from all formulatins
0
20
40
60
80
100
120
0 2 4 6 8CU
MA
LATI
VE
% D
RU
G R
ELEA
SE
TIME (HOURS)
F1
F2
F3
F4
PURE DRUG

Inter. J. of Pharmacotherapy / 2(2), 2012, 70-81.
77
Figure 10. Zero order plot for formulation F3
Figure 11. Highuchi release model plot for formulation F3
Figure 12. First order release model plot for formulation F3
y = 14.361x + 5.8314 R² = 0.9729
0
10
20
30
40
50
60
70
80
90
100
0 1 2 3 4 5 6 7
%dru
g r
ele
ase
time (H)
zero order kinetics
y = 36.581x - 7.6894 R² = 0.9556
-20
0
20
40
60
80
100
0 0.5 1 1.5 2 2.5 3
% d
rug
re
lea
se
square root of time
Higuchi release model
y = -14.101x + 93.735 R² = 0.9656
0
20
40
60
80
100
120
0 1 2 3 4 5 6 7
% d
rug r
em
ain
ed
time(H)
first order kinetics
Inter. J. of Pharmacotherapy / 2(2), 2012, 70-81.
78
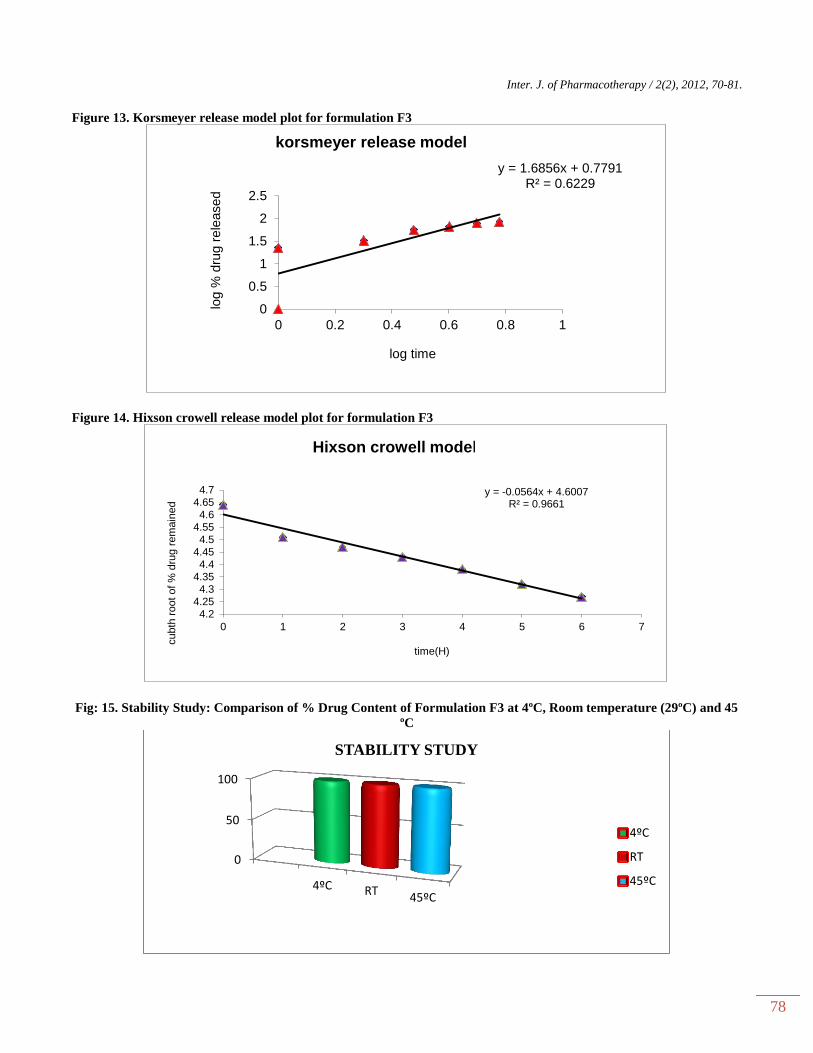
Figure 13. Korsmeyer release model plot for formulation F3
Figure 14. Hixson crowell release model plot for formulation F3
Fig: 15. Stability Study: Comparison of % Drug Content of Formulation F3 at 4ºC, Room temperature (29ºC) and 45
ºC
y = 1.6856x + 0.7791 R² = 0.6229
0
0.5
1
1.5
2
2.5
0 0.2 0.4 0.6 0.8 1
log %
dru
g r
ele
ased
log time
korsmeyer release model
y = -0.0564x + 4.6007 R² = 0.9661
4.24.25
4.34.35
4.44.45
4.54.55
4.64.65
4.7
0 1 2 3 4 5 6 7
cubth
root of %
dru
g r
em
ain
ed
time(H)
Hixson crowell model
0
50
100
4ºC RT45ºC
STABILITY STUDY
4ºC
RT
45ºC
Inter. J. of Pharmacotherapy / 2(2), 2012, 70-81.
79
FTIR studies
IR spectroscopic studies were conducted to
determine possible interactions between drug and carrier.
IR spectra of pure drug valsartan with Soya lecithin and
polaxamer were obtained. Which shows no chemical
interaction between Valsartan and excipients. The result
of IR study shown in Figure 3.
DSC studies The DSC thermograms of Pure drug and
optimized nanosuspension formulation were taken
between 30–200°C at a heating rate of 20°C/min. Pure
drug showed melting point at 117°C corresponding to its
melting point, whereas in the thermograph pattern of
formulation no such peak was observed. So it can be
concluded that the drug particles were absolutely bound
by the surfactant molecules. In the DSC of formulation
sharp transitions at 54.72°C was observed which
correspond to the melting points of poloxamer. From
thermograms, it was concluded that the drug and the
surfactant do not interact with each other. The data was
represented in figure 4.
Particle size analysis and zeta potential measurement
The effect of the drug to polymer ratio and the
effect of surfactant on size of the nanoparticles were
studied using six different ratios of polymer and
surfactant. The study was carried out in the range of 10-
40% drug incorporation in the formulation. The mean
particle size (Z-average diameter) for formulations varied
in the narrow range from 1200 nm to 190 nm. It could be
inferred from the results that there was significant impact
of the drug to polymer ratio on the mean particle size of
the drug loaded nanosuspension and the addition of the
surfactant also showed a significant change in particle
size. The mean particle sizes of the F3 formulation their
size distribution graph was shown in figure 5 and 6.
SEM analysis
SEM micrographs clearly showed great
differences between pure Valsartan (Figure. 7) and
optimized nanosuspension formulation (Figure 8) The
particles of Valsartan were found to be large and
especially irregular (Figure. 7). However after
formulation, particles disappeared and drug became small
and uniform. This might be due to the surfactant which
was used to stabillize the drug particles could be adsorbed
to crystal surface by hydrophobic interaction. So we can
say the method adopted to enhance the solubility is
appropriate.
Percentage drug content, Drug entrapment efficiency
and percentage yield In nanosuspension formulation the drug particles
were reduced to nano sized. During the formulation
process there was not any drug loss step involved, so
theoretically the formulation was considered as being
100% drug content. The Percentage drug content, drug
entrapment efficiency and percentage yield of all the
formulations were calculated and the results were
tabulated in table (3). Of all the formulations, formulation
F3 gave the highest percentage drug content with 97.24%
and least percentage content was found in F4 that is
89.92%. The drug entrapment efficiency of F3 was high
when compared to other formulations. This may be due to
the presence of optimum polymer and optimum tween 80
concentrations, comparing the formulations F1, F2 and
F4, it is clear that increase in polymer concentration
increased the drug entrapment efficiency. Considering
the formulations F1, F2, tween80 is in not used and the
drug cannot be reduced to lower particle size and high
polymer ratios causing the capture of drug molecules.
The percentage yield of formulation F3 leads the
race with 82.12% followed by F1, F2 and F4. This
indicates that F3 can be considered as best formulation,
where the polymer concentration is optimum and tween
concentration is to sufficient limit.
KINETICS
Different models like Zero order, First order,
Higuchi’s, and Peppa’s plots were drawn. The regression
coefficient (R2) value of Zero order, Higuchi’s, First
order, Korsmeyer and Hixson crowell plots (Figure 10-
14) for formulation F3 were found to be 0.972, 0.955,
0.965, 0.622 and 0.966. The optimized formulations F3
(0.972) follows Zero order plot since the regression
coefficient is found to be linear. The regression
coefficient (R2) values of zero order in the optimized
formulation F3 was greater than the R2 values of kinetics
model. Thus, the drug release follows zero order kinetics.
Stability studies
The stability studies of formulation F3 had been
performed and the results were shown in figure 15. The
formulation showed a good stability at 40C , at room
temperature and 450C.
CONCLUSION
A high pressure homogenization method was
developed to prepare Valsartan nanosuspension using
poloxamer and soyalecithin as stabilizers. From the
results of this study it may be concluded that
nanosuspensions of poorly soluble drugs such as
Valsartan are easy to prepare and represent a promising
new drug formulation for oral controlled drug delivery for
treatment of Hypertension. In vitro study in pH 7.4
phosphate buffer shows that nanosuspension formulation
gives higher drug release compared to the pure drug. The
optimized formulation F3 follows zero order plot since
the regression coefficient is 0.984 and plot was also found

Inter. J. of Pharmacotherapy / 2(2), 2012, 70-81.
80
to be linear. The regression coefficient (R2) values of zero
order in the optimized formulation F3 was greater than
the R2 values of First order. Thus, the drug release follows
zero order kinetics. The formulation showed a good
stability at 40c, room temperature and 45 ºC.
Consequently nanosuspensions represent a promising
alternative to current delivery systems aiming to improve
the biopharmaceutical performance of drugs with low
water solubility.
REFFERENCES 1. Merisko-Liversidge E, Liversidge GG, Cooper ER. Nanosizing: a formulation approach for poorly-water- soluble
compounds. Eur J Pharm Sci, 18, 2003, 113-120.
2. Dubey R. Impact of nanosuspension technology on drug discovery and development. Drug Delive Technol, 2006, 65-67.
3. Amidon GL, Lennernas H, Shah VP, Crison JR. A theoretical basis for a biopharmaceutic drug classification: the
correlation of in vitro drug product dissolution and in vivo bioavailability. Pharm Res, 12, 1995, 413-420.
4. Yu LX, Amidon GL, Polli JE, Zhao H, Mehta MU, Conner DP, Shah VP, Lesko LJ, Chen ML, Lee VH, Hussain AS.
Biopharmaceutics classification system: the scientific basis for biowaiver Extensions. Pharm Res, 19, 2002, 921-925.
5. Lennernas H, Abrahamsson B. The use of biopharmaceutic classification of drugs in drug discovery and development:
current status and future extension. J Pharm Pharmacol, 57, 2005, 273-285.
6. Varshosaz J, Talari R, Mostafavi SA, Nokhodchi A. Dissolution enhancement of gliclazide using in situ micronization
by solvent change method. Powder Technology, 187, 2008, 222-230.
7. Pahala S, Joan MA, Samuel HY. Solubilization of rapamycin. Int J Pharm, 213, 2001, 25-29.
8. Abu Serajuddin TM. Salt formation to improve drug solubility. Advanced Drug Delivery Reviews, 59, 2007, 603-616.
9. Wong SM, Kellaway IW, Murdan S. Enhancement of the dissolution rate and oral absorption of a poorly water soluble
drug by formation of surfactant containing microparticles. Int J Pharm, 317, 2006, 61-68.
10. Marazban S, Judith B, Xiaoxia C, Steve S, Robert O, Williams III, Keith PJ. Enhanced drug dissolution using
evaporative precipitation into aqueous solution. Int J Pharm, 243, 2002, 17-31.
11. True LR, Ian BG, James EH, Kevin LF, Clindy AC, Chritoper JT. Development and characterization of a scalable
controlled precipitation process to enhance the dissolution of poorly soluble drugs. Pharm Res, 21(11), 2004, 48-57.
12. Riaz M. Stability and uses of liposomes. Pak Pharm Sci, 8(2), 1995, 69-9.
13. Floyd AG. Top ten considerations in the development of parenteral Emulsions. Pharm Sci Tech, 4, 1999, 134-143.
14. Nakano M. Places of emulsions in drug delivery. Adv Drug Deliv Rev, 45, 2000, 1-4.
15. Jadhav KR, Shaikh IM, Ambade KW, Kadam VJ. Applications of microemulsion based drug delivery system. Cur Dr
del, 3(3), 2006, 267-273.
16. Lawrence MJ, Rees GD. Microemulsion based media as novel drug delivery systems. Adv Drug Deliv Rev, 45, 2000, 89-
121.
17. Leuner C, Dressman J. Improving drug solubility for oral delivery using solid dispersions. Eur J Pharm Biopharm,
50(1), 2000, 47-60.
18. Hemant NJ, Ravindra WT, Martha D, Vaishali PS, Mohammed J, Mohinder SB, Sailesh AV, Abu Serajuddin TM.
Bioavailability enhancement of a poorly water.soluble drug by solid dispersion in polyethylene glycol.polysorbate 80
mixture: Int J Pharm, 269, 2004, 251-258.
19. Stella VJ, Rajewski RA. Cyclodextrins: their future in drug formulation and delivery. Pharm Res, 14, 1997, 556-567.
20. Loftsson T, Brewster M. Pharmaceutical applications of cyclodextrins. J Pharm Sci, 85, 1996, 1017-1025.
21. Marcela L, Mar M. de Bertorello, Marcela L. Solubilization of naphthoquinones by complexation with hydroxypropyl.b.
cyclodextrin. Int J Pharm, 159, 1997, 13-18.
22. Liversidge GG, Conzentino P. Drug particle size reduction for decreasing gastric irritancy and enhancing absorption of
naproxen in rats. Int J Pharm, 125, 1995, 309-313.
23. Peters K, Leitzke S, Diederichs JE, Borner K, Hahn H, Muller RH, Ehlers S. Preparation of clofazamine nanosuspension
for intravenous use and evaluation of its therapeutic efficacy in Mycobacterium avium infection. J Antimicrob Chem, 45,
2000, 77-83.
24. Jacobs C, Kayser O, M¡§uller RH. Production and characterization of mucoadhesive nanosuspensions for the
formulation of bupravaquone. Int J Pharm, 214, 2001, 3-7.
25. Patravale VB, Date AA, Kulkarni RM. Nanosuspensions. A promising drug delivery strategy. J Pharm Pharmacol, 56,
2004, 827-840.
26. Kesisoglou F, Panmai S, Wu. Nanosizing oral formulation development and biopharmaceutical evaluation. Adv Drug
Deliv Rev, 59, 2007, 631-644.
27. Keck CM, Muller RH. Drug nanocrystals of poorly soluble drugs produced by high pressure homogenization. Eur J
Pharm Biopharm, 62, 2006, 3-16.

Inter. J. of Pharmacotherapy / 2(2), 2012, 70-81.
81
28. Rabinow B, Prasanna et al. Nanosuspensions in controlled drug delivery. Int J Pharm Pharm Sci, 3, 2004, 785-793.
29. Kocbek P, Baumgartner S, Kristl J. Preparation and evaluation of nanosuspensions for enhancing the dissolution of
poorly soluble drugs. Int J Pharm, 312, 2006, 179-186.
30. Trotta M, Gallarate M, Carlotti ME, Morel S. Preparation of griseofulvin nanoparticles from water dilutable micro.
emulsions. Int J Pharm, 254, 2003, 235-242.
31. Zhang X, Xia Q, Gu N. Preparation of All.Trans Retinoic Acid Nanosuspensions Using a Modified Precipitation
Method. Drug Development and Industrial Pharmacy, 32, 2006, 857-863.
32. Liversidge GG, Cundy K. Particle size reduction for improvement of oral bioavailability of hydrophobic drugs: I.
Absolute oral bioavailability of nanocrystalline danazol in beagle dogs. Int J Pharm, 125, 1995, 91-97.