Design and Characterization of a Microwave Transducer for ...
12
Citation: Gugliandolo, G.; Naishadham, K.; Crupi, G.; Donato, N. Design and Characterization of a Microwave Transducer for Gas Sensing Applications. Chemosensors 2022, 10, 127. https://doi.org/ 10.3390/chemosensors10040127 Academic Editor: Tae Geun Kim Received: 11 February 2022 Accepted: 25 March 2022 Published: 29 March 2022 Publisher’s Note: MDPI stays neutral with regard to jurisdictional claims in published maps and institutional affil- iations. Copyright: © 2022 by the authors. Licensee MDPI, Basel, Switzerland. This article is an open access article distributed under the terms and conditions of the Creative Commons Attribution (CC BY) license (https:// creativecommons.org/licenses/by/ 4.0/). chemosensors Article Design and Characterization of a Microwave Transducer for Gas Sensing Applications Giovanni Gugliandolo 1, * , Krishna Naishadham 2 , Giovanni Crupi 3 and Nicola Donato 1 1 Department of Engineering, University of Messina, 98158 Messina, Italy; [email protected] 2 School of Electrical Engineering, Georgia Institute of Technology, Atlanta, GA 30332, USA; [email protected] 3 Department of Biomedical and Dental Sciences and Morphofunctional Imaging, University of Messina, 98125 Messina, Italy; [email protected] * Correspondence: [email protected] Abstract: Gas sensors have wide applications in several fields, spanning diverse areas such as environmental monitoring, healthcare, defense, and the evaluation of personal and occupational exposure to hazardous chemicals. Different typologies of gas sensors have been proposed over the years, such as optical, electrochemical, and metal oxide gas sensors. In this paper, a relatively new typology of gas sensors is explored: the microwave gas sensor. It consists of a combination of a microwave transducer with a nanostructured sensing material deposited on an interdigitated capacitor (IDC). The device is designed and fabricated on a Rogers substrate (RO4003C) using microstrip technology, and investigated as a microwave transducer over the frequency range from 1 GHz to 6 GHz by measuring the scattering (S) parameters in response to gas adsorption and desorption. The sensing material is based on a nano-powder of barium titanate oxalate with a coating of urea (BaTiO(C 2 O 4 ) 2 /CO(NH 2 ) 2 ). It is deposited on the IDC surface by drop coating, thus creating a sensing film. The developed prototype has been tested toward different oxygen (O 2 ) concentrations and exhibits a sensitivity of 28 kHz/%O 2 . Special attention has been devoted to the measurement process. Besides the canonical short-open-load-thru (SOLT) calibration of the measured S-parameters, a thru-reflect-line (TRL) calibration has been performed in order to get rid of the parasitic electromagnetic (EM) contributions of the board connectors and the feedlines, thus moving the measurement reference planes to the edges of the IDC. Keywords: gas sensors; oxygen; microwave; measurements; TRL standards; calibration; interdigitated capacitor; IDC; microwave transducers 1. Introduction Nanotechnology has witnessed tremendous progress, especially in recent years be- cause of its wide applications. This technology provides the opportunity to manipulate and organize matter systematically at the nanometric scale. In this field, special attention has been devoted to the development of new nanostructured materials with features and properties sometimes quite distinct from the corresponding bulk materials. In general, nanostructured materials may be defined as those materials whose structural elements (clusters, crystallites or molecules) have dimensions in the range from 1 nm to 100 nm. Their special structure makes them more advantageous to specific applications. Nanostructured materials are used in many scientific areas such as chemistry, biology, medicine, and engineering. However, a common thread in these areas is represented by sensors and, in general, by sensing applications. Biosensors based on nanostructured material have been widely used for the identification of viral pathogens [1,2]. More recently, nanomaterial-based sensors have been employed for the detection of severe acute respiratory syndrome coronavirus 2 (SARS-CoV-2), the virus responsible for the coronavirus disease 2019 (COVID-19) that has caused a global pandemic [3]. Because Chemosensors 2022, 10, 127. https://doi.org/10.3390/chemosensors10040127 https://www.mdpi.com/journal/chemosensors
-
Upload
khangminh22 -
Category
Documents
-
view
0 -
download
0
Transcript of Design and Characterization of a Microwave Transducer for ...
Citation: Gugliandolo, G.;
Naishadham, K.; Crupi, G.; Donato,
N. Design and Characterization of a
Microwave Transducer for Gas
Sensing Applications. Chemosensors
2022, 10, 127. https://doi.org/
10.3390/chemosensors10040127
Academic Editor: Tae Geun Kim
Received: 11 February 2022
Accepted: 25 March 2022
Published: 29 March 2022
Publisher’s Note: MDPI stays neutral
with regard to jurisdictional claims in
published maps and institutional affil-
iations.
Copyright: © 2022 by the authors.
Licensee MDPI, Basel, Switzerland.
This article is an open access article
distributed under the terms and
conditions of the Creative Commons
Attribution (CC BY) license (https://
creativecommons.org/licenses/by/
4.0/).
chemosensors
Article
Design and Characterization of a Microwave Transducer for GasSensing ApplicationsGiovanni Gugliandolo 1,* , Krishna Naishadham 2, Giovanni Crupi 3 and Nicola Donato 1
1 Department of Engineering, University of Messina, 98158 Messina, Italy; [email protected] School of Electrical Engineering, Georgia Institute of Technology, Atlanta, GA 30332, USA; [email protected] Department of Biomedical and Dental Sciences and Morphofunctional Imaging, University of Messina,
98125 Messina, Italy; [email protected]* Correspondence: [email protected]
Abstract: Gas sensors have wide applications in several fields, spanning diverse areas such asenvironmental monitoring, healthcare, defense, and the evaluation of personal and occupationalexposure to hazardous chemicals. Different typologies of gas sensors have been proposed overthe years, such as optical, electrochemical, and metal oxide gas sensors. In this paper, a relativelynew typology of gas sensors is explored: the microwave gas sensor. It consists of a combinationof a microwave transducer with a nanostructured sensing material deposited on an interdigitatedcapacitor (IDC). The device is designed and fabricated on a Rogers substrate (RO4003C) usingmicrostrip technology, and investigated as a microwave transducer over the frequency range from1 GHz to 6 GHz by measuring the scattering (S) parameters in response to gas adsorption anddesorption. The sensing material is based on a nano-powder of barium titanate oxalate with acoating of urea (BaTiO(C2O4)2/CO(NH2)2). It is deposited on the IDC surface by drop coating,thus creating a sensing film. The developed prototype has been tested toward different oxygen (O2)concentrations and exhibits a sensitivity of 28 kHz/%O2. Special attention has been devoted to themeasurement process. Besides the canonical short-open-load-thru (SOLT) calibration of the measuredS-parameters, a thru-reflect-line (TRL) calibration has been performed in order to get rid of theparasitic electromagnetic (EM) contributions of the board connectors and the feedlines, thus movingthe measurement reference planes to the edges of the IDC.
Keywords: gas sensors; oxygen; microwave; measurements; TRL standards; calibration; interdigitatedcapacitor; IDC; microwave transducers
1. Introduction
Nanotechnology has witnessed tremendous progress, especially in recent years be-cause of its wide applications. This technology provides the opportunity to manipulateand organize matter systematically at the nanometric scale. In this field, special attentionhas been devoted to the development of new nanostructured materials with features andproperties sometimes quite distinct from the corresponding bulk materials. In general,nanostructured materials may be defined as those materials whose structural elements(clusters, crystallites or molecules) have dimensions in the range from 1 nm to 100 nm.Their special structure makes them more advantageous to specific applications.
Nanostructured materials are used in many scientific areas such as chemistry, biology,medicine, and engineering. However, a common thread in these areas is represented bysensors and, in general, by sensing applications. Biosensors based on nanostructuredmaterial have been widely used for the identification of viral pathogens [1,2]. Morerecently, nanomaterial-based sensors have been employed for the detection of severeacute respiratory syndrome coronavirus 2 (SARS-CoV-2), the virus responsible for thecoronavirus disease 2019 (COVID-19) that has caused a global pandemic [3]. Because
Chemosensors 2022, 10, 127. https://doi.org/10.3390/chemosensors10040127 https://www.mdpi.com/journal/chemosensors
Chemosensors 2022, 10, 127 2 of 12
of their porous structure, nanostructured materials have been successfully used for gasdetection, involving several typologies including electrochemical gas sensors [4], metaloxide (MOX) gas sensors [5–8] and microwave gas sensors [9,10].
The main advantage of the use of nanomaterials over the more common bulk materi-als is that the surface-to-volume ratio significantly increases for the adsorbed target gas.This leads to improved sensitivity, reduced power consumption, and reduced operatingtemperature. Moreover, the sensor response as well as recovery times are usually fasterusing nanomaterials. MOX sensors are today the predominant solid-state gas detectingdevices for environmental, healthcare, and industrial applications [5–8].
A relatively new frontier of gas sensors is represented by microwave gas sensors. Theyare usually characterized by a propagative structure (e.g., a microwave planar resonator)surrounded by a sensing film, often in the form of a nanostructured material. The sensingprinciple is based on the propagation and reflection of electromagnetic (EM) waves intothe sensitive material. When exposed to the gas target, the gas molecules interact withthe sensing material surface and this may cause a change in the sensing material complexpermittivity defined as follows:
εr = ε′r − jε′′r . (1)
The real part εr′ represents the energy stored in the material and is often referred
to as dielectric constant. The imaginary part εr′′, also known as dielectric loss factor, is
related to the material conductivity [11,12]. After gas interaction with the sensing material,a conductivity change (i.e., a change in the imaginary part of the complex permittivity) mayvary the amplitude of the reflected/transmitted signal. On the other hand, a resonancefrequency shift is linked to a change in the real part of the complex permittivity [12].
Since the propagation characteristics of the EM wave are related to the chemical andphysical properties of the propagation medium (i.e., the sensing material), the gas moleculesadsorbed on the material surface affect the measured reflection and transmission scattering(S-) parameters. In particular, variations in both modulus and phase of the S-parametersare observed due to gas adsorption and desorption on the film surface. Such variations canbe easily quantified and related to the target gas to be characterized. More details on themicrowave transduction principle for gas sensing applications, the nanomaterials used, thepropagation structures, and the signal analysis can be found in [12].
Microwave gas sensors have several advantages over the other competing technologies:they can work at ambient temperature with fast response and recovery times, the fabricationprocesses are the same as those used for manufacturing conventional printed circuit boards,and they are considered low-power devices. Moreover, since they work in the microwavefrequency range, they are inherently compatible with wireless technology. They can beeasily integrated into electronic boards and/or coupled to antennas thus making wirelesssensor nodes. Several advances are described in the literature in which a microwave gassensor is combined with an antenna with the aim of developing a low-cost and reliablewireless sensor node [13–18].
In the past decade, several microwave-based gas sensors have been proposed. In [19],a planar capacitor working in microwave range is covered by a nanostructured sensingmaterial and explored as a sensor for harmful gases to monitor environmental pollution.In [9], Bailly et al. used a microstrip interdigital capacitor surrounded by a sensing layer oftitanium dioxide (TiO2) nanoparticles for the detection of ammonia concentration in therange from 100 ppm to 500 ppm. More recently, Sadabadi et al. proposed a reconfigurableplatform for toxic gas detection based on a microwave ring resonator [10]. Microwavetransducers have been employed for the detection of oxygen [20,21], humidity [13,22],ammonia [23], and volatile organic compounds [24].
In this work, a microwave transducer is explored as a gas sensor by depositing ananostructured sensing material on its surface. A two-port interdigital capacitor (IDC) isemployed for this purpose. It is designed using microstrip technology for operation inthe frequency range from 1 GHz to 6 GHz. After the IDC design and fabrication, a nano-powder of barium titanate oxalate (BaTiO(C2O4)2) with a coating of urea (CO(NH2)2) is
Chemosensors 2022, 10, 127 3 of 12
deposited by drop-coating on the IDC surface to prepare the sensing film. The combinationof IDC and the sensing material (referred to as the device under test or DUT) is finallytested in a controlled atmosphere as an oxygen sensor. By using a fully automatic gas bottlecontrolled-flow system, the fabricated device is subjected to a binary gas mixture madeby nitrogen (N2) and oxygen (O2) with different concentrations, from 0% O2 (100% N2) to100% O2 (0% N2). The response of the microwave device in terms of scattering parametersis measured and evaluated using a vector network analyzer (VNA).
The innovation in this paper involves special attention devoted to the sensor responsemeasurement process. Before carrying out the tests on the DUT, the VNA needs to becalibrated thereby allowing subtraction of the contributions associated with the cables,connectors, and feedlines. To do so, besides the conventional short-open-load-thru (SOLT)standards, in this research custom thru-reflect-line (TRL) standards are designed andfabricated based on the IDC template. The calibration process then involves two steps. First,the VNA is calibrated using the commercial SOLT calibration standards, which establishesthe reference plane at the apertures of the coaxial connectors to be connected to the DUT.Next, the S-parameters of the TRL standards are measured using SOLT calibration, and theoffline post-processing of these parameters results in an improved SOLT + TRL (henceforthreferred to as TRL) calibration. The proposed TRL standards enable improvement of themeasurement accuracy by moving the measurement reference planes from the coaxialconnector interface to the edges of the studied IDC structure. Thus, unlike the conventionalSOLT calibration, the TRL calibration compensates for the effects of the connector transitionsbetween coaxial and microstrip lines and the length of the microstrip feed lines connectedto the DUT.
The article is organized as follows. Section 2 is divided into four subsections: the firstpart is devoted to the description of the design and fabrication of the microwave device(i.e., the IDC); the TRL calibration and the developed standards are briefly described inthe second subsection; the details of the nanostructured material are provided in the thirdsubsection, and finally the measurement setup is presented in the last subsection. The testsinvolving exposure to O2 gas, and the measured results, subjected to TRL calibration, arereported and discussed in Section 3, while conclusive remarks are presented in Section 4.
2. Materials and Methods
In this section the design and fabrication of the studied IDC are presented. This designhas been previously used as a sensing element of a sensor-integrated patch antenna [13,25]but the sensing performance of the IDC without the antenna has not been characterized. Inthis paper, TRL calibration is used to characterize the IDC as a microwave transducer forO2 detection without the effect of the connecting transmission lines, connectors and theantenna. Unlike the integrated antenna sensor described in [13] where only the reflectedwave is considered, the prototype proposed in this paper is a two-port device wherein bothreflected and transmitted EM waves are considered for the device characterization. In thissection a detailed description of the design and fabrication of the TRL standards and themicrowave measurement setup is presented. The synthesis of the sensing material and itsdeposition on the microwave transducer is described. The application of TRL calibration tothe measured S-parameters of the IDC is discussed in Section 3.
2.1. Microwave Transducer Design and Fabrication
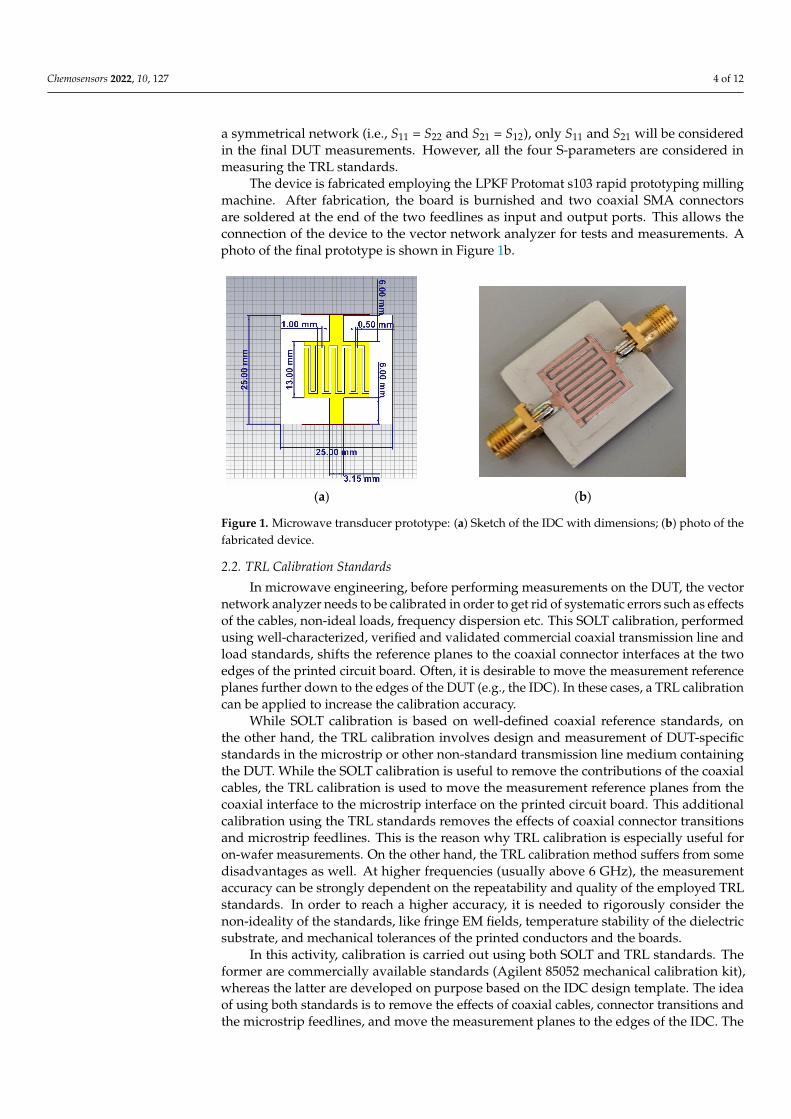
The IDC has been designed using a multi-finger configuration based on the connectionin parallel of ten fingers with a length and width of 11.5 mm and 0.5 mm, respectively, anda spacing of 0.5 mm. The substrate selected in this project is Rogers RO4003C characterizedby a thickness of 1.52 mm, a dielectric constant εr = 3.38, and a loss tangent tan δ = 0.0027.A sketch of the IDC design is depicted in Figure 1a. Two microstrip lines acting as feedlinesfor the two-port signals to the IDC are included. Their width is selected considering the sub-strate parameters (i.e., thickness and dielectric constant) in order to have a line impedanceof 50 Ω. The overall dimensions of the prototype are 25 mm × 25 mm × 1.52 mm. Due to
Chemosensors 2022, 10, 127 4 of 12
a symmetrical network (i.e., S11 = S22 and S21 = S12), only S11 and S21 will be consideredin the final DUT measurements. However, all the four S-parameters are considered inmeasuring the TRL standards.
The device is fabricated employing the LPKF Protomat s103 rapid prototyping millingmachine. After fabrication, the board is burnished and two coaxial SMA connectorsare soldered at the end of the two feedlines as input and output ports. This allows theconnection of the device to the vector network analyzer for tests and measurements. Aphoto of the final prototype is shown in Figure 1b.
Figure 1. Microwave transducer prototype: (a) Sketch of the IDC with dimensions; (b) photo of thefabricated device.
2.2. TRL Calibration Standards
In microwave engineering, before performing measurements on the DUT, the vectornetwork analyzer needs to be calibrated in order to get rid of systematic errors such as effectsof the cables, non-ideal loads, frequency dispersion etc. This SOLT calibration, performedusing well-characterized, verified and validated commercial coaxial transmission line andload standards, shifts the reference planes to the coaxial connector interfaces at the twoedges of the printed circuit board. Often, it is desirable to move the measurement referenceplanes further down to the edges of the DUT (e.g., the IDC). In these cases, a TRL calibrationcan be applied to increase the calibration accuracy.
While SOLT calibration is based on well-defined coaxial reference standards, onthe other hand, the TRL calibration involves design and measurement of DUT-specificstandards in the microstrip or other non-standard transmission line medium containingthe DUT. While the SOLT calibration is useful to remove the contributions of the coaxialcables, the TRL calibration is used to move the measurement reference planes from thecoaxial interface to the microstrip interface on the printed circuit board. This additionalcalibration using the TRL standards removes the effects of coaxial connector transitionsand microstrip feedlines. This is the reason why TRL calibration is especially useful foron-wafer measurements. On the other hand, the TRL calibration method suffers from somedisadvantages as well. At higher frequencies (usually above 6 GHz), the measurementaccuracy can be strongly dependent on the repeatability and quality of the employed TRLstandards. In order to reach a higher accuracy, it is needed to rigorously consider thenon-ideality of the standards, like fringe EM fields, temperature stability of the dielectricsubstrate, and mechanical tolerances of the printed conductors and the boards.
In this activity, calibration is carried out using both SOLT and TRL standards. Theformer are commercially available standards (Agilent 85052 mechanical calibration kit),whereas the latter are developed on purpose based on the IDC design template. The ideaof using both standards is to remove the effects of coaxial cables, connector transitions andthe microstrip feedlines, and move the measurement planes to the edges of the IDC. The
Chemosensors 2022, 10, 127 5 of 12
SOLT calibration is performed by connecting the commercial standards to the VNA andfollowing the standard calibration procedure recommended by the manufacturer. On theother hand, the TRL calibration is performed “offline” by using the Scikit-rf tool [26] toprocess the SOLT-calibrated measurements with the TRL standards. Scikit-rf is a Pythonpackage designed for microwave engineering applications. It allows basic operations onmicrowave networks (e.g., reading/writing Touchstone files, de-embedding operations,interpolations, plotting, etc.,) as well as advanced ones like VNA calibration, vector fitting,and the extraction of statistical network properties. Moreover, Scikit-rf is capable of directlycommunicating with VNAs [26]. Among all the features provided by Scikit-rf, we utilizethe offline TRL calibration. The term “offline” refers to the fact that the calibration is notmade onboard the VNA but rather performed on a computer by using the calibrationalgorithms provided by Scikit-rf.
As suggested by the name, the TRL calibration involves three standards: the “thru”, the“reflect”, and the “line”. There are no stringent rules for the design of these standards [27,28].A brief description of the common rules is reported below.
• Thru standard: it includes the two feed lines connected together without the DUT inthe middle.
• Reflect standard: it can be made by using either an open or a short in order to obtain180 phase shift. Usually, an open standard is recommended at lower frequencies.
• Line standard: it is a microstrip line that should be designed with an electrical lengthbetween 20 and 160 in the frequency range of interest. It is recommended to have atleast 20 at the minimum operating frequency and 160 at the higher frequency limit.If it is not possible to cover the entire frequency range with a single line standard,multiple line standards can be employed to perform the TRL calibration.
The custom-made TRL standards employed in this work are designed to be used inthe frequency range from 1 GHz to 6 GHz. They are intended to move the measurementreference planes to the IDC edges. For this reason, their geometry is selected starting fromthe IDC design and their design is optimized considering the operating frequency rangeand the rules described above. Moreover, the same substrate material that is used forthe IDC fabrication (i.e., Rogers RO4003C) should be employed for the TRL standards aswell. The design of the TRL standards is conducted by using CST Studio (Student Edition)software. The three standards are then fabricated and characterized using the VNA.
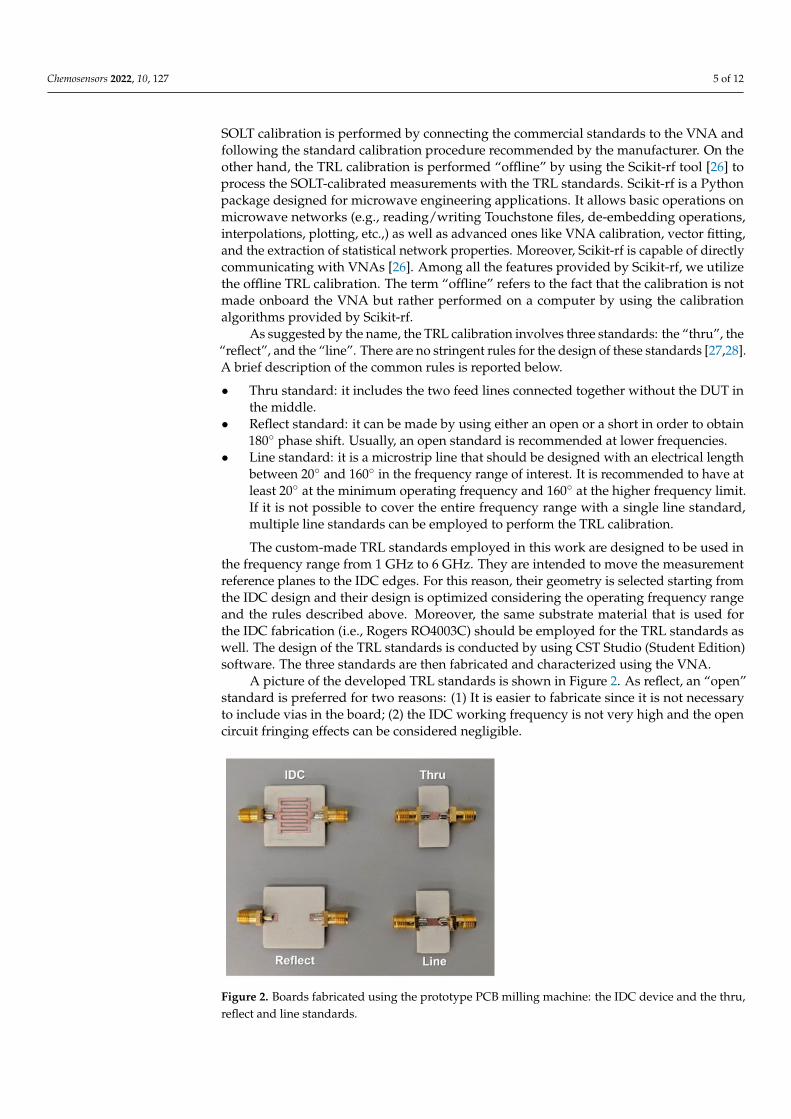
A picture of the developed TRL standards is shown in Figure 2. As reflect, an “open”standard is preferred for two reasons: (1) It is easier to fabricate since it is not necessaryto include vias in the board; (2) the IDC working frequency is not very high and the opencircuit fringing effects can be considered negligible.
Figure 2. Boards fabricated using the prototype PCB milling machine: the IDC device and the thru,reflect and line standards.
Chemosensors 2022, 10, 127 6 of 12
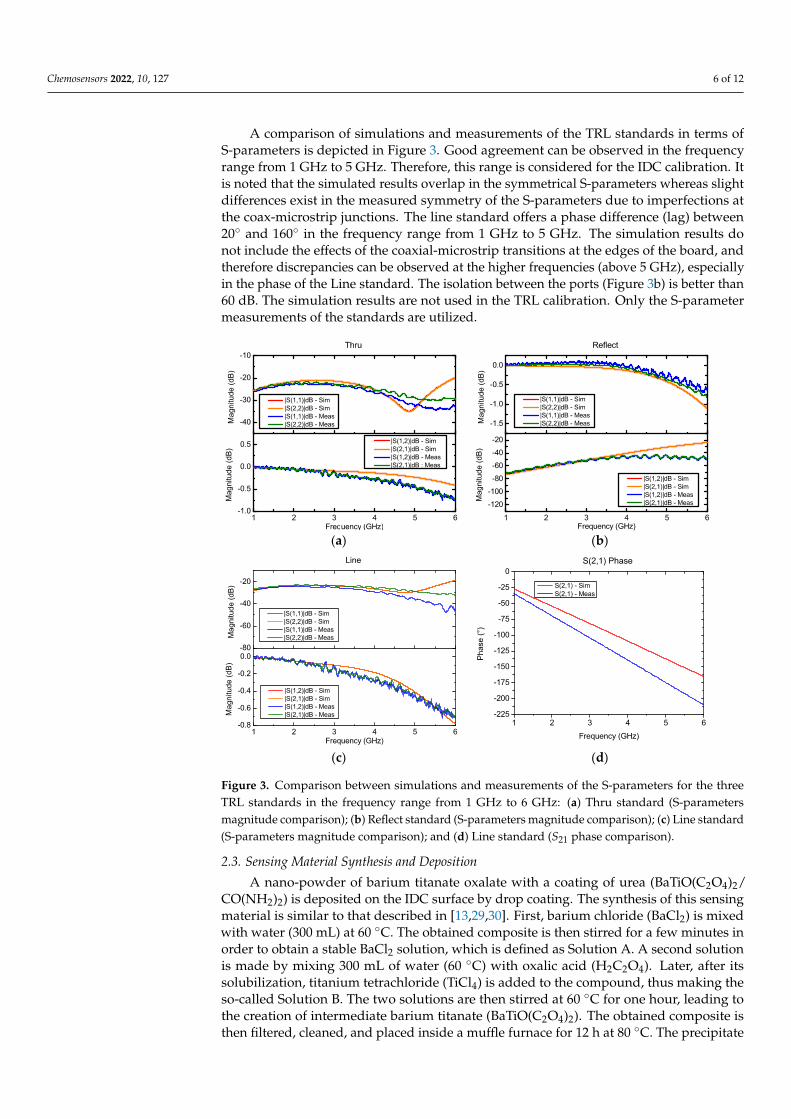
A comparison of simulations and measurements of the TRL standards in terms ofS-parameters is depicted in Figure 3. Good agreement can be observed in the frequencyrange from 1 GHz to 5 GHz. Therefore, this range is considered for the IDC calibration. Itis noted that the simulated results overlap in the symmetrical S-parameters whereas slightdifferences exist in the measured symmetry of the S-parameters due to imperfections atthe coax-microstrip junctions. The line standard offers a phase difference (lag) between20 and 160 in the frequency range from 1 GHz to 5 GHz. The simulation results donot include the effects of the coaxial-microstrip transitions at the edges of the board, andtherefore discrepancies can be observed at the higher frequencies (above 5 GHz), especiallyin the phase of the Line standard. The isolation between the ports (Figure 3b) is better than60 dB. The simulation results are not used in the TRL calibration. Only the S-parametermeasurements of the standards are utilized.
Figure 3. Comparison between simulations and measurements of the S-parameters for the threeTRL standards in the frequency range from 1 GHz to 6 GHz: (a) Thru standard (S-parametersmagnitude comparison); (b) Reflect standard (S-parameters magnitude comparison); (c) Line standard(S-parameters magnitude comparison); and (d) Line standard (S21 phase comparison).
2.3. Sensing Material Synthesis and Deposition
A nano-powder of barium titanate oxalate with a coating of urea (BaTiO(C2O4)2/CO(NH2)2) is deposited on the IDC surface by drop coating. The synthesis of this sensingmaterial is similar to that described in [13,29,30]. First, barium chloride (BaCl2) is mixedwith water (300 mL) at 60 C. The obtained composite is then stirred for a few minutes inorder to obtain a stable BaCl2 solution, which is defined as Solution A. A second solutionis made by mixing 300 mL of water (60 C) with oxalic acid (H2C2O4). Later, after itssolubilization, titanium tetrachloride (TiCl4) is added to the compound, thus making theso-called Solution B. The two solutions are then stirred at 60 C for one hour, leading tothe creation of intermediate barium titanate (BaTiO(C2O4)2). The obtained composite isthen filtered, cleaned, and placed inside a muffle furnace for 12 h at 80 C. The precipitate
Chemosensors 2022, 10, 127 7 of 12
is dispersed in a solution of urea with a ratio of 1:3 and mixed for half an hour. The formedBaTiO(C2O4)2/CO(NH2)2 is filtered, washed with water, and dried once again in the ovenat 80 C for 12 h.
The final product looks like white powder. The scanning electron microscopy (SEM)reveals the presence of nanoparticle agglomerates with a maximum size of 5 µm. Suchstructures have a spherical shape and appear to be formed by primary grains of nanometricsize. The presence of these grains is revealed by the transmission electron microscopy(TEM) analysis. In particular, the TEM analysis highlights that each grain is made by aninner core of barium titanate in crystalline form and an external amorphous coating of ureawith a thickness of 4 ± 1 nm. Further details on the sensing material synthesis and on itsstructural characterization are available in [13].
The synthesized sensing material is finally suspended in water and deposited onthe IDC surface by drop coating. Only the material between the fingers is left (witha thickness of approximately 17 µm), whereas the material in excess is removed. Theresultant device (i.e., IDC + sensing material) is dried and then tested in a controlledgas atmosphere. Further details on the measurement setup and the obtained results arereported in Sections 2.4 and 3, respectively.
2.4. Measurement Setup
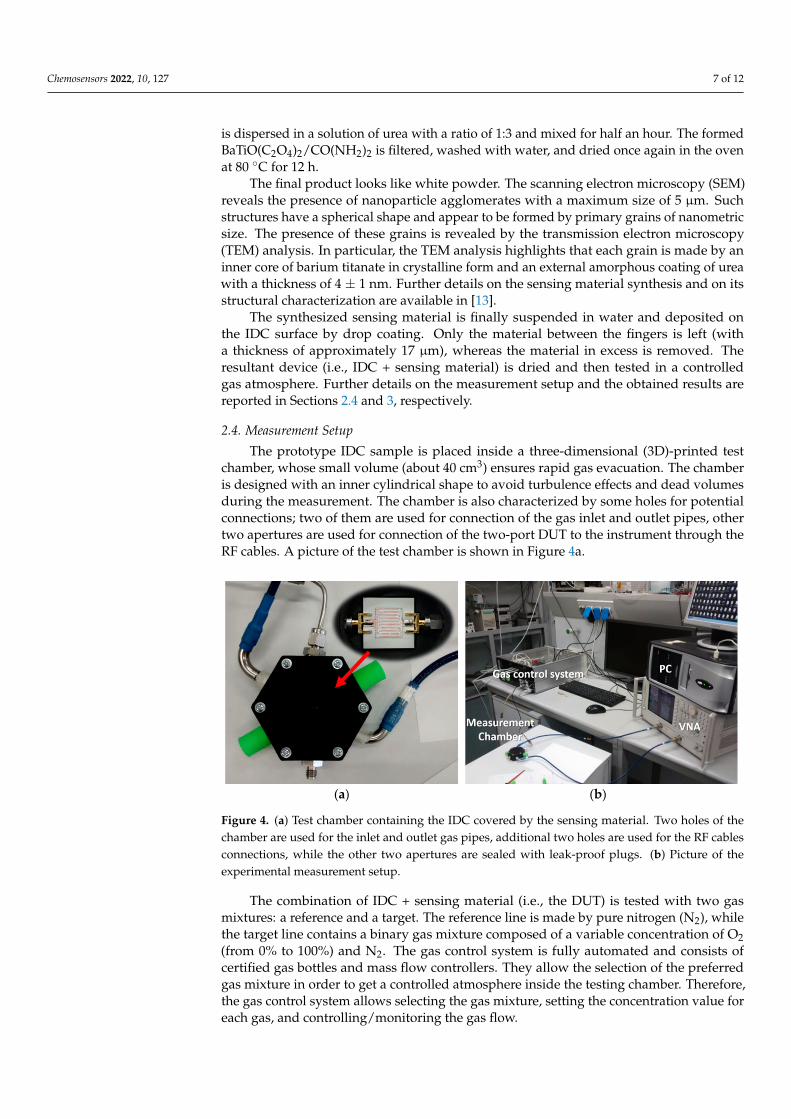
The prototype IDC sample is placed inside a three-dimensional (3D)-printed testchamber, whose small volume (about 40 cm3) ensures rapid gas evacuation. The chamberis designed with an inner cylindrical shape to avoid turbulence effects and dead volumesduring the measurement. The chamber is also characterized by some holes for potentialconnections; two of them are used for connection of the gas inlet and outlet pipes, othertwo apertures are used for connection of the two-port DUT to the instrument through theRF cables. A picture of the test chamber is shown in Figure 4a.
Figure 4. (a) Test chamber containing the IDC covered by the sensing material. Two holes of thechamber are used for the inlet and outlet gas pipes, additional two holes are used for the RF cablesconnections, while the other two apertures are sealed with leak-proof plugs. (b) Picture of theexperimental measurement setup.
The combination of IDC + sensing material (i.e., the DUT) is tested with two gasmixtures: a reference and a target. The reference line is made by pure nitrogen (N2), whilethe target line contains a binary gas mixture composed of a variable concentration of O2(from 0% to 100%) and N2. The gas control system is fully automated and consists ofcertified gas bottles and mass flow controllers. They allow the selection of the preferredgas mixture in order to get a controlled atmosphere inside the testing chamber. Therefore,the gas control system allows selecting the gas mixture, setting the concentration value foreach gas, and controlling/monitoring the gas flow.
Chemosensors 2022, 10, 127 8 of 12
A picture of the experimental measurement setup is shown in Figure 4b. It consists ofthe gas control system, the measurement chamber holding the sample, the Agilent 8753ESVNA, and a desktop computer used for real-time measurement acquisition and recording.
3. Results
The IDC combined with the sensing material is tested using different concentrationsof oxygen, from 0% (pure N2) to 100% (no N2 inside the test chamber) in six differentsteps. Measurements were made by alternating the target line (N2 + O2) with the referenceline (N2 only) and the sensor exhibited a good reversibility since the response reached itsbaseline every time the reference line was connected to the test chamber. For each oxygenset-point, the device response is evaluated in terms of S-parameter responses. In particular,the S11 and S21 parameters are acquired in order to examine how the changes in oxygenconcentration relate to response changes in the resonant frequency, the quality (Q) factor,and the amplitude at resonance.
It is reemphasized that while the SOLT calibration is performed onboard the VNA,the TRL calibration is performed as a post-processing operation by means of the Scikit-rftool [25], previously described. The acquired S-parameters are processed by the Scikit-rfalgorithm in conjunction with the measured S-parameters of the TRL standards (Figure 3).Noise is reduced by smoothing the acquired data points. As an output of the TRL algo-rithm, we get the DUT S-parameters without the contribution of connectors, transitions,and feedlines.
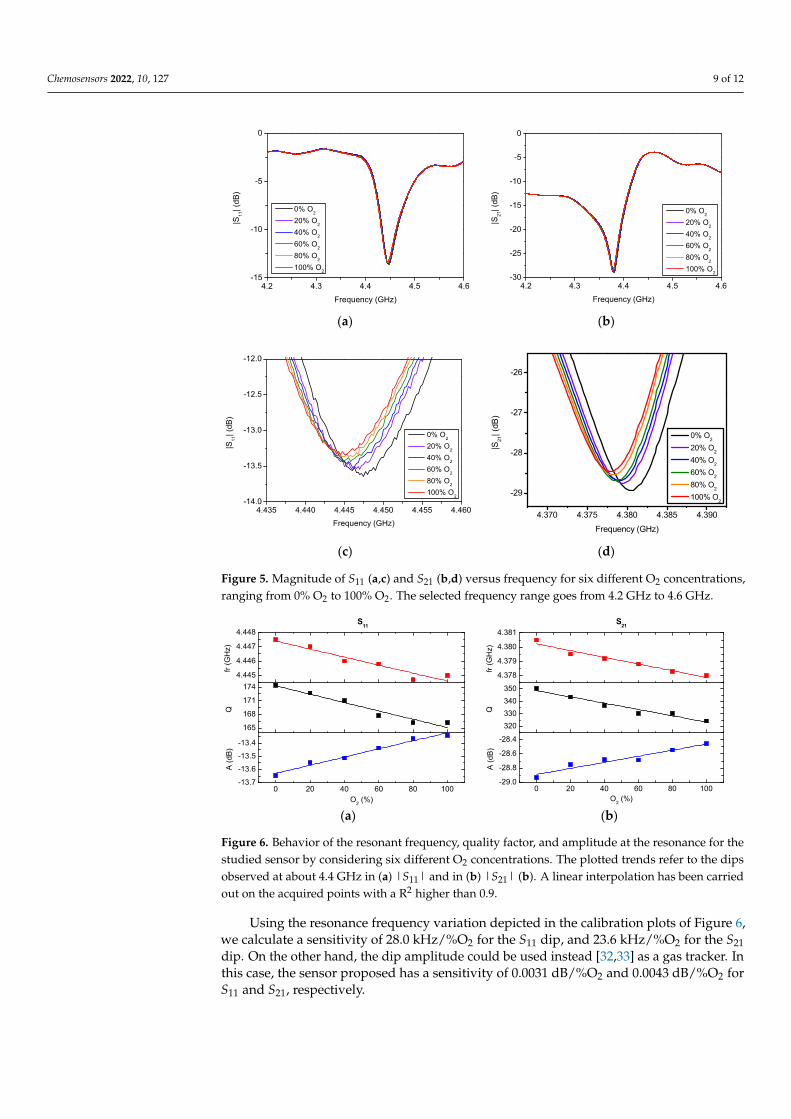
The proposed device is tested in the frequency range from 1 GHz to 6 GHz. In thisinterval, the IDC exhibits several resonant dips. Among these dips, we focus on the 4.4 GHzdip (see Figure 5) since it exhibits a good compromise between Q factor and amplitude.Moreover, it is within the band 1 GHz–5 GHz, in which the calibration standards are mosteffective (see Figure 3). For this reason, the 4.4 GHz dip is selected for examining theaccuracy of TRL calibration toward various oxygen concentrations.
In the frequency range from 4.2 GHz to 4.6 GHz both S11 and S21 magnitudes displaya dip, as shown in Figure 5a,b. It may be noted that both dips are affected by the oxygencontent inside the test chamber. In particular, as the concentration increases, the resonantfrequency undergoes a slight shift toward lower frequencies, and, at the same time, the dipamplitude decreases, as detailed in Figure 5c,d. A possible explanation to this behavior isthat the O2 molecules, once adsorbed on the surface of the sensing material, interact with it,thus affecting both the real (εr
′) and imaginary parts (εr′′) of the complex permittivity. This
results in a change of the dip amplitude and in a variation of the resonant frequency.Even if it is not evident, the Q factor associated with the dips is affected too. To better
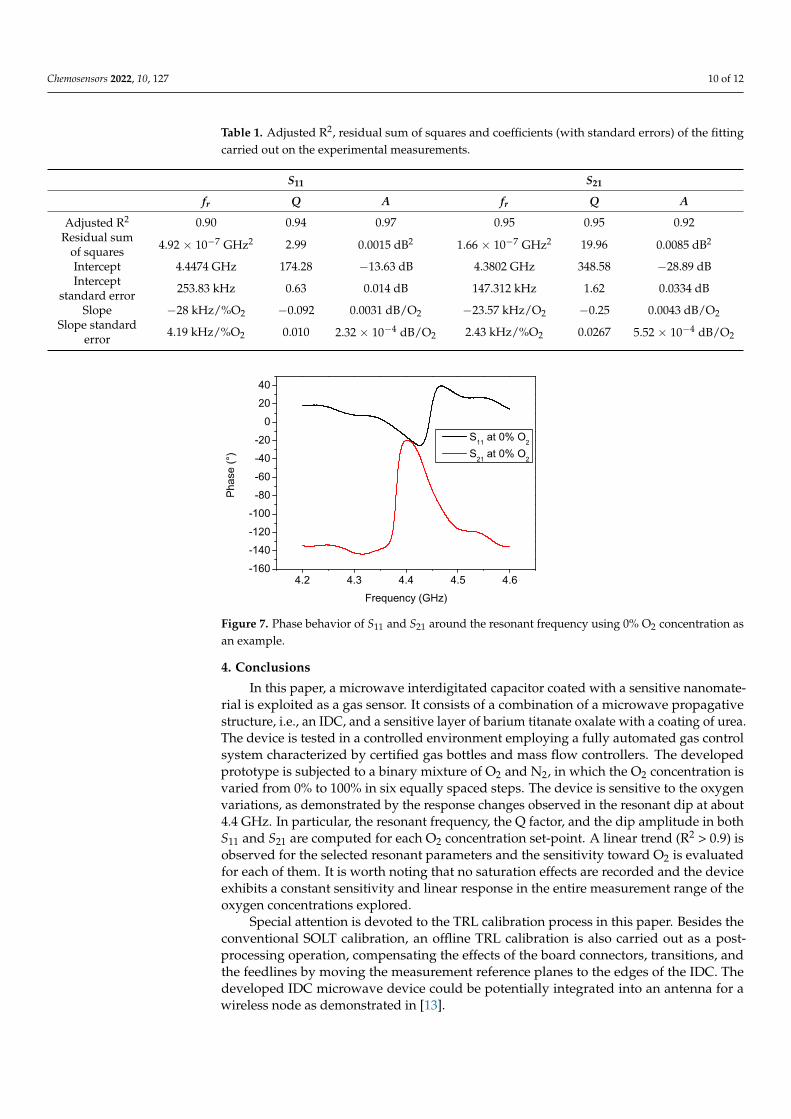
highlight and quantify such variations, in Figure 6 we plot the change of the resonant fre-quency (fr), the Q factor, and the dip amplitude (A) as functions of the oxygen concentration(O2 %), for both S11 and S21 responses. The Q factor is calculated as the ratio betweenthe resonant frequency and the half power bandwidth [31]. The resonant frequency is thefrequency at which the S-parameter magnitude reaches a minimum value (A); while thehalf-power bandwidth is the frequency range at which the magnitude of the S-parameter isbelow the threshold of A + 3 dB. For these three resonant parameter features investigatedin this work (i.e., fr, Q, and A), the sensor response can be considered linear with a goodapproximation. For the sake of completeness, the residual sum of squares, the adjusted R2,the line intercept, and slope along with their standard errors are reported in Table 1.
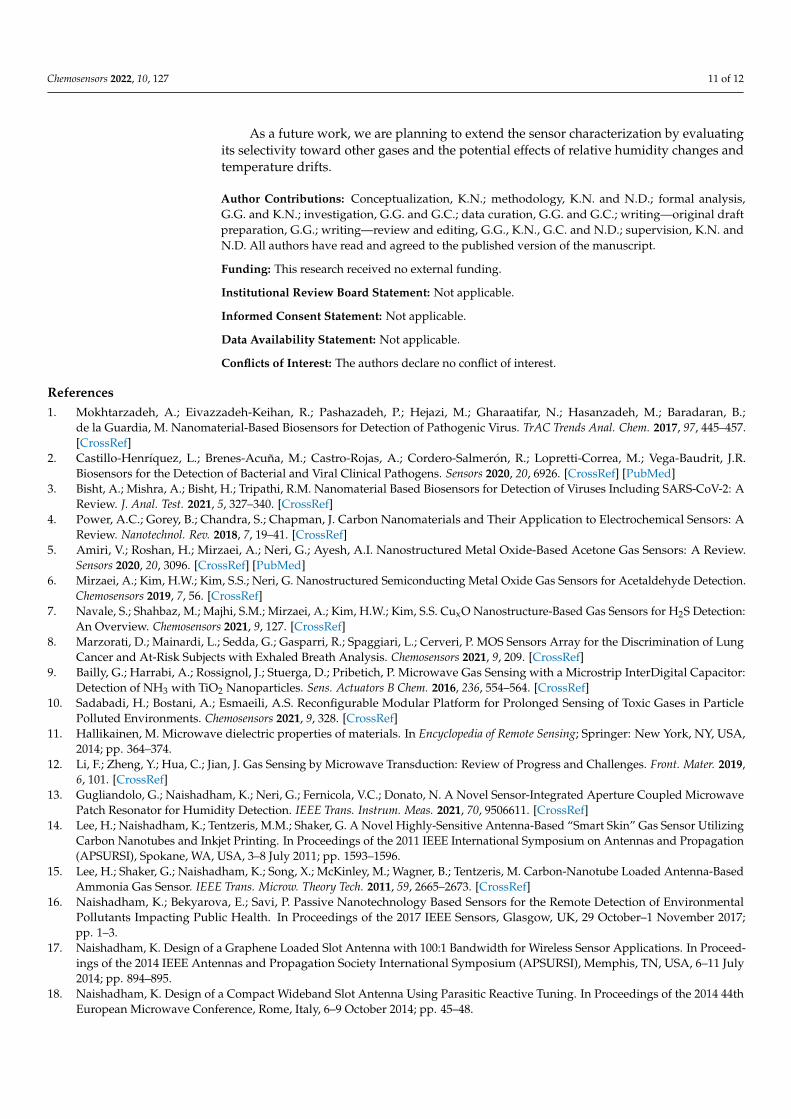
For microwave gas sensors the resonant frequency provides an attractive feature fortracking gas detection [22,23]. In order to investigate the validity of resonance, we plot thephase of both S11 and S21 as a function of frequency in Figure 7, using the response for 0%O2 for illustration. At resonance, the phase of S11 goes through zero and that of S21 reachesa maximum. Due to the damping losses and frequency dispersion of the sensor material,the S11 phase does not go through the ideal 180 phase shift and the resonant frequenciesof S11 and S21 are slightly displaced. Nonetheless, the resonant behavior is quite evident.
Chemosensors 2022, 10, 127 9 of 12
Figure 5. Magnitude of S11 (a,c) and S21 (b,d) versus frequency for six different O2 concentrations,ranging from 0% O2 to 100% O2. The selected frequency range goes from 4.2 GHz to 4.6 GHz.
Figure 6. Behavior of the resonant frequency, quality factor, and amplitude at the resonance for thestudied sensor by considering six different O2 concentrations. The plotted trends refer to the dipsobserved at about 4.4 GHz in (a) |S11| and in (b) |S21| (b). A linear interpolation has been carriedout on the acquired points with a R2 higher than 0.9.
Using the resonance frequency variation depicted in the calibration plots of Figure 6,we calculate a sensitivity of 28.0 kHz/%O2 for the S11 dip, and 23.6 kHz/%O2 for the S21dip. On the other hand, the dip amplitude could be used instead [32,33] as a gas tracker. Inthis case, the sensor proposed has a sensitivity of 0.0031 dB/%O2 and 0.0043 dB/%O2 forS11 and S21, respectively.
Chemosensors 2022, 10, 127 10 of 12
Table 1. Adjusted R2, residual sum of squares and coefficients (with standard errors) of the fittingcarried out on the experimental measurements.
S11 S21
fr Q A fr Q A
Adjusted R2 0.90 0.94 0.97 0.95 0.95 0.92Residual sum
of squares 4.92 × 10⁻⁷ GHz2 2.99 0.0015 dB2 1.66 × 10⁻⁷ GHz2 19.96 0.0085 dB2
Intercept 4.4474 GHz 174.28 −13.63 dB 4.3802 GHz 348.58 −28.89 dBIntercept
standard error 253.83 kHz 0.63 0.014 dB 147.312 kHz 1.62 0.0334 dB
Slope −28 kHz/%O2 −0.092 0.0031 dB/O2 −23.57 kHz/O2 −0.25 0.0043 dB/O2Slope standard
error 4.19 kHz/%O2 0.010 2.32 × 10⁻⁴ dB/O2 2.43 kHz/%O2 0.0267 5.52 × 10⁻⁴ dB/O2
Figure 7. Phase behavior of S11 and S21 around the resonant frequency using 0% O2 concentration asan example.
4. Conclusions
In this paper, a microwave interdigitated capacitor coated with a sensitive nanomate-rial is exploited as a gas sensor. It consists of a combination of a microwave propagativestructure, i.e., an IDC, and a sensitive layer of barium titanate oxalate with a coating of urea.The device is tested in a controlled environment employing a fully automated gas controlsystem characterized by certified gas bottles and mass flow controllers. The developedprototype is subjected to a binary mixture of O2 and N2, in which the O2 concentration isvaried from 0% to 100% in six equally spaced steps. The device is sensitive to the oxygenvariations, as demonstrated by the response changes observed in the resonant dip at about4.4 GHz. In particular, the resonant frequency, the Q factor, and the dip amplitude in bothS11 and S21 are computed for each O2 concentration set-point. A linear trend (R2 > 0.9) isobserved for the selected resonant parameters and the sensitivity toward O2 is evaluatedfor each of them. It is worth noting that no saturation effects are recorded and the deviceexhibits a constant sensitivity and linear response in the entire measurement range of theoxygen concentrations explored.
Special attention is devoted to the TRL calibration process in this paper. Besides theconventional SOLT calibration, an offline TRL calibration is also carried out as a post-processing operation, compensating the effects of the board connectors, transitions, andthe feedlines by moving the measurement reference planes to the edges of the IDC. Thedeveloped IDC microwave device could be potentially integrated into an antenna for awireless node as demonstrated in [13].
Chemosensors 2022, 10, 127 11 of 12
As a future work, we are planning to extend the sensor characterization by evaluatingits selectivity toward other gases and the potential effects of relative humidity changes andtemperature drifts.
Author Contributions: Conceptualization, K.N.; methodology, K.N. and N.D.; formal analysis,G.G. and K.N.; investigation, G.G. and G.C.; data curation, G.G. and G.C.; writing—original draftpreparation, G.G.; writing—review and editing, G.G., K.N., G.C. and N.D.; supervision, K.N. andN.D. All authors have read and agreed to the published version of the manuscript.
Funding: This research received no external funding.
Institutional Review Board Statement: Not applicable.
Informed Consent Statement: Not applicable.
Data Availability Statement: Not applicable.
Conflicts of Interest: The authors declare no conflict of interest.
References1. Mokhtarzadeh, A.; Eivazzadeh-Keihan, R.; Pashazadeh, P.; Hejazi, M.; Gharaatifar, N.; Hasanzadeh, M.; Baradaran, B.;
de la Guardia, M. Nanomaterial-Based Biosensors for Detection of Pathogenic Virus. TrAC Trends Anal. Chem. 2017, 97, 445–457.[CrossRef]
2. Castillo-Henríquez, L.; Brenes-Acuña, M.; Castro-Rojas, A.; Cordero-Salmerón, R.; Lopretti-Correa, M.; Vega-Baudrit, J.R.Biosensors for the Detection of Bacterial and Viral Clinical Pathogens. Sensors 2020, 20, 6926. [CrossRef] [PubMed]
3. Bisht, A.; Mishra, A.; Bisht, H.; Tripathi, R.M. Nanomaterial Based Biosensors for Detection of Viruses Including SARS-CoV-2: AReview. J. Anal. Test. 2021, 5, 327–340. [CrossRef]
4. Power, A.C.; Gorey, B.; Chandra, S.; Chapman, J. Carbon Nanomaterials and Their Application to Electrochemical Sensors: AReview. Nanotechnol. Rev. 2018, 7, 19–41. [CrossRef]
5. Amiri, V.; Roshan, H.; Mirzaei, A.; Neri, G.; Ayesh, A.I. Nanostructured Metal Oxide-Based Acetone Gas Sensors: A Review.Sensors 2020, 20, 3096. [CrossRef] [PubMed]
6. Mirzaei, A.; Kim, H.W.; Kim, S.S.; Neri, G. Nanostructured Semiconducting Metal Oxide Gas Sensors for Acetaldehyde Detection.Chemosensors 2019, 7, 56. [CrossRef]
7. Navale, S.; Shahbaz, M.; Majhi, S.M.; Mirzaei, A.; Kim, H.W.; Kim, S.S. CuxO Nanostructure-Based Gas Sensors for H2S Detection:An Overview. Chemosensors 2021, 9, 127. [CrossRef]
8. Marzorati, D.; Mainardi, L.; Sedda, G.; Gasparri, R.; Spaggiari, L.; Cerveri, P. MOS Sensors Array for the Discrimination of LungCancer and At-Risk Subjects with Exhaled Breath Analysis. Chemosensors 2021, 9, 209. [CrossRef]
9. Bailly, G.; Harrabi, A.; Rossignol, J.; Stuerga, D.; Pribetich, P. Microwave Gas Sensing with a Microstrip InterDigital Capacitor:Detection of NH3 with TiO2 Nanoparticles. Sens. Actuators B Chem. 2016, 236, 554–564. [CrossRef]
10. Sadabadi, H.; Bostani, A.; Esmaeili, A.S. Reconfigurable Modular Platform for Prolonged Sensing of Toxic Gases in ParticlePolluted Environments. Chemosensors 2021, 9, 328. [CrossRef]
11. Hallikainen, M. Microwave dielectric properties of materials. In Encyclopedia of Remote Sensing; Springer: New York, NY, USA,2014; pp. 364–374.
12. Li, F.; Zheng, Y.; Hua, C.; Jian, J. Gas Sensing by Microwave Transduction: Review of Progress and Challenges. Front. Mater. 2019,6, 101. [CrossRef]
13. Gugliandolo, G.; Naishadham, K.; Neri, G.; Fernicola, V.C.; Donato, N. A Novel Sensor-Integrated Aperture Coupled MicrowavePatch Resonator for Humidity Detection. IEEE Trans. Instrum. Meas. 2021, 70, 9506611. [CrossRef]
14. Lee, H.; Naishadham, K.; Tentzeris, M.M.; Shaker, G. A Novel Highly-Sensitive Antenna-Based “Smart Skin” Gas Sensor UtilizingCarbon Nanotubes and Inkjet Printing. In Proceedings of the 2011 IEEE International Symposium on Antennas and Propagation(APSURSI), Spokane, WA, USA, 3–8 July 2011; pp. 1593–1596.
15. Lee, H.; Shaker, G.; Naishadham, K.; Song, X.; McKinley, M.; Wagner, B.; Tentzeris, M. Carbon-Nanotube Loaded Antenna-BasedAmmonia Gas Sensor. IEEE Trans. Microw. Theory Tech. 2011, 59, 2665–2673. [CrossRef]
16. Naishadham, K.; Bekyarova, E.; Savi, P. Passive Nanotechnology Based Sensors for the Remote Detection of EnvironmentalPollutants Impacting Public Health. In Proceedings of the 2017 IEEE Sensors, Glasgow, UK, 29 October–1 November 2017;pp. 1–3.
17. Naishadham, K. Design of a Graphene Loaded Slot Antenna with 100:1 Bandwidth for Wireless Sensor Applications. In Proceed-ings of the 2014 IEEE Antennas and Propagation Society International Symposium (APSURSI), Memphis, TN, USA, 6–11 July2014; pp. 894–895.
18. Naishadham, K. Design of a Compact Wideband Slot Antenna Using Parasitic Reactive Tuning. In Proceedings of the 2014 44thEuropean Microwave Conference, Rome, Italy, 6–9 October 2014; pp. 45–48.
Chemosensors 2022, 10, 127 12 of 12
19. Bahoumina, P.; Hallil, H.; Lachaud, J.L.; Rebiere, D.; Dejous, C.; Abdelghani, A.; Frigui, K.; Bila, S.; Baillargeat, D.; Zhang, Q.; et al.Chemical Gas Sensor Based on a Novel Capacitive Microwave Flexible Transducer and Composite Polymer Carbon Nanomaterials.In Proceedings of the 2017 Symposium on Design, Test, Integration and Packaging of MEMS/MOEMS (DTIP), Bordeaux, France,29 May–1 June 2017; pp. 1–4.
20. Marinkovic, Z.; Gugliandolo, G.; Latino, M.; Campobello, G.; Crupi, G.; Donato, N. Characterization and Neural Modeling of aMicrowave Gas Sensor for Oxygen Detection Aimed at Healthcare Applications. Sensors 2020, 20, 7150. [CrossRef] [PubMed]
21. Gugliandolo, G.; Latino, M.; Campobello, G.; Marinkovic, Z.; Crupi, G.; Donato, N. On the Gas Sensing Properties of MicrowaveTransducers. In Proceedings of the 2020 55th International Scientific Conference on Information, Communication and EnergySystems and Technologies (ICEST), Niš, Serbia, 10–12 September 2020; pp. 161–194.
22. Gugliandolo, G.; Aloisio, D.; Campobello, G.; Crupi, G.; Donato, N. On the Design and Characterisation of a Microwave MicrostripResonator for Gas Sensing Applications. ACTA IMEKO 2021, 10, 54. [CrossRef]
23. Bogner, A.; Steiner, C.; Walter, S.; Kita, J.; Hagen, G.; Moos, R. Planar Microstrip Ring Resonators for Microwave-Based GasSensing: Design Aspects and Initial Transducers for Humidity and Ammonia Sensing. Sensors 2017, 17, 2422. [CrossRef] [PubMed]
24. Mohammadi, S.; Zarifi, M.H. Differential Microwave Resonator Sensor for Real-Time Monitoring of Volatile Organic Compounds.IEEE Sens. J. 2021, 21, 6105–6114. [CrossRef]
25. Gugliandolo, G.; Naishadham, K.; Donato, N.; Neri, G.; Fernicola, V. Sensor-Integrated Aperture Coupled Patch Antenna. InProceedings of the 2019 IEEE International Symposium on Measurements & Networking (M&N), Catania, Italy, 8–10 July 2019;pp. 1–5.
26. Arsenovic, A.; Hillairet, J.; Anderson, J.; Forsten, H.; Ries, V.; Eller, M.; Sauber, N.; Weikle, R.; Barnhart, W.; Forstmayr, F.Scikit-Rf: An Open Source Python Package for Microwave Network Creation, Analysis, and Calibration. IEEE Microw. Mag. 2022,23, 98–105. [CrossRef]
27. Copper Mountain Technologies. Fabricating and Using a PCB-Based TRL Pattern with a CMT VNA. Available online: https://coppermountaintech.com/wp-content/uploads/2018/05/Design-and-Fabrication-of-a-TRL-Calibration-Kit.pdf (accessed on15 November 2021).
28. Microwaves101, TRL Calibration. Available online: https://www.microwaves101.com/encyclopedias/trl-calibration (accessedon 15 November 2021).
29. Zhang, X.; Xu, L.; Wang, Q. Electro-Rheological Effect of Barium Titanate Particles Coated with Urea and Suspended in MethylSilicone Oil. J. China Univ. Min. Technol. 2007, 17, 578–581. [CrossRef]
30. Wen, W.; Huang, X.; Yang, S.; Lu, K.; Sheng, P. The Giant Electrorheological Effect in Suspensions of Nanoparticles. Nat. Mater.2003, 2, 727–730. [CrossRef] [PubMed]
31. Pozar, D.M. Microwave Wngineering; John Wiley & Sons: Hoboken, NJ, USA, 2011.32. Rossignol, J.; Harrabi, A.; Stuerga, D.; Pribetich, P.; Bailly, G.; Leblois, T. Critical Influence of Dielectric Sensitive Material and
Manufactured Process in Microwave Gas-Sensing: Application of Ammonia Detection with an Interdigital Sensor. ACS Omega2020, 5, 11507–11514. [CrossRef] [PubMed]
33. Bailly, G.; Harrabi, A.; Rossignol, J.; Domenichini, B.; Bellat, J.P.; Bezverkhyy, I.; Pribetich, P.; Stuerga, D. Influence of the Designin Microwave-Based Gas Sensors: Ammonia Detection with Titania Nanoparticles. Procedia Eng. 2016, 168, 264–267. [CrossRef]