Design and calibration of an electrodynamic driver for ... - CORE
233
Calhoun: The NPS Institutional Archive Theses and Dissertations Thesis Collection 1989 Design and calibration of an electrodynamic driver for the Space Thermoacoustic Refrigerator (STAR) Harris, David Anthony. Monterey, California. Naval Postgraduate School http://hdl.handle.net/10945/26965
-
Upload
khangminh22 -
Category
Documents
-
view
3 -
download
0
Transcript of Design and calibration of an electrodynamic driver for ... - CORE

Calhoun: The NPS Institutional Archive
Theses and Dissertations Thesis Collection
1989
Design and calibration of an electrodynamic driver
for the Space Thermoacoustic Refrigerator (STAR)
Harris, David Anthony.
Monterey, California. Naval Postgraduate School
http://hdl.handle.net/10945/26965


NAVAL POSTGRADUATE SCHOOLMonterey, California
rnIHESISDESIGN AND CALIBRATION OF AN ELECTRODYNAMIC
DRIVER FOR THE SPACE THERMOACOUSTIC REFRIGERATOR
by
David Anthony HarrisJune 1989
andRichard Eugene Volkert
December 1989*
Thesis Advisor: Thomas J. HoflerCo -Advisor Steven L. Garrett
Approved for public release; distribution is unlimited
lOLLOM


JNCLASSIFIEDSecurity Classification of this page
REPORT DOCUMENTATION PAGE[a Report Security Classification UNCLASSIFIED 1 b Restrictive Markings
la Security Classification Authority
lb Declassification/DowngTading Schedule
3 Distribution Availability of Report
Approved for public relesase; distribution is unlimited
1 Performing Organization Report Number(s) 5 Monitoring Organization Report Number(s)
Name of Performing Organization
^aval Postgraduate School6b Office Symbol
(If Applicable) 61Gx7a Name of Monitoring Organization
Naval Postgraduate School
>c Address (city, state, and ZIP code)
Monterey, CA 93943-50007 b Address (city, stale, ami ZIP code)
Monterey, CA 93943-5000
Sa Name of Funding/Sponsoring Organization
Naval Reasearch Laboratory8b Office Symbol Code(If Applicable) 8220
9 Procurement Instrument Identification Number
Sc Address (city, state, and ZIP code) 4555 Overlook Ave.
Washington D.C. 20375-5000
1 Source of Funding Numbers
Program Element Number I Project No Task No Work Unit Accession No
l Tuie (include Security Classification) DESIGN AND CALIBRATION OF AN ELECTRODYNAMIC DRIVER-OR THE SPACE THERMOACOUSTIC REFRIGERATOR (UNCLASSIFIED)
2 Personal Author(s)
Harris, David A. and Volkert, Richard E.
3 a Type of Report
vlaster's Thesis1 3b Time Covered
From To
14 Date of Report (year, monih.day)
1989, June1 5 Page Count
220
6 Supplementary Notation
7 Cosati Codes
ield Group Subgroup
1 8 Subject Terms (continue on reverse if necessary and identify by block number)
Electrodynamic Loudspeaker, Thermoacoustic Refrigerator
9 Abstract (continue on reverse if necessary and identify by block number
The objective of the STAR project is to test and space qualify a continuous cycle cryogenic
efrigeration system for the cooling of sensors and electronics based upon the thermoacoustic
teat pumping effect. This thesis describes the design, assembly, and calibration of the
;lectrodynamic driver and its associated performance monitoring and control instrumentation,
fhe electroacoustic efficiency of the driver is measured under different operating conditions
itilizing a prototype refrigerator resonator. These results are then compared to modelled
efficiencies derived from a computer simulation program that uses the independently-measured
ndividual component parameters to predict the driver performance. Good agreement betweenneasured and predicted efficiencies is observed. Highest electroacoustic efficiencies are shown to
occur when the resonance frequencies of the driver and resonator are most closely matched. Anaximum electroacoustic efficiency of 50% is achieved under these conditions. More important
lowever, is that the efficiency decreases by only 10% over a 30% bandwidth about resonance.>0 Distribution/Availability of Abstract UNCLASSIFIED
|X| unclassified/unlimited same as reportJDT1C users
21 Abstract Security Classification UNCLASSIFIED
i2a Name of Responsible IndividualDROF. S. L. Garrett
22b Telephone (Include Area code)
(408) 646-254022c Office Symbol
61Gx3D FORM 1473. 84 MAR 83 APR edition may be used until exhausted
All other editions are obsolete
security classification of this page
UNCLASSIFIED

Approved for public release; distribution is unlimited
Design and Calibration of an ElectrodynamicDriver for the Space Thennoacoustic Refrigerator (STAR)
- by
David Anthony ^larris
Captain, Canadian Air For:eB.S., Royal Roads Military College, 1981
June, ncFland
Richard Eugene VolkertLieutenant, United States NavyB.A.E., Auburn University .1982
December H<RSubmitted in partial fulfillment of the
requirements for the degree of
MASTER OF SCIENCE IN ENGINEERING ACOUSTICS
from the
NAVAL POSTGRADUATE SCHOOLJune 1989

, ABSTRACT
The objective of the STAR project is to test and space
qualify a continuous cycle cryogenic refrigeration system for
the cooling of sensors and electronics based upon the
thermoacoustic heat pumping effect. This thesis describes the
design, assembly, and calibration of the electrodynamic driver
and its associated performance monitoring and control
instrumentation. The electroacoustic efficiency of the driver
is measured under different operating conditions utilizing a
prototype refrigerator resonator. These results are then
compared to modelled efficiencies derived from a computer
simulation program that uses the independently-measured
individual component parameters to predict the driver
performance. Good agreement between measured and predicted
efficiencies is observed. Highest electroacoustic
efficiencies are shown to occur when the resonance frequencies
of the driver and resonator are most closely matched. A
maximum electroacoustic efficiency of 50% is achieved under
these conditions. More important however, is that the
efficiency decreases by only 10% over a 30% bandwidth about
resonance.
in

1.1
TABLE OF CONTENTS
I . INTRODUCTION 1
A . BACKGROUND 1
1 . History 1
2 . Refrigerator Efficiency 3
3. Driver Optimization 7
B. SPACE THERMOACOUSTIC REFRIGERATOR (STAR) 9
1
.
Motivation 9
2. Get Away Special (GAS) Program 10
3 . Non-acoustical Subsystems 10
4 . Acoustical Subsystems 14
C
.
SCOPE 18
II . THE ELECTRODYNAMIC DRIVER 2
A. ELECTRODYNAMIC DRIVER THEORY 2
1 . Introduction 2
2 . Lumped Parameter Modelling 25
B. ELECTRODYNAMIC DRIVER PARAMETERS 2 6
1. Driver Modifications 26
2 . Driver Measurements 28
a . Transduction Coefficient 28
b. Stiffness Determination 30
c. Quality Factor and MechanicalResistance 36
3 . Voice Coil Resistance 40
IV

4 . Accelerometer Calibration 42
C. STAR DRIVER HOUSING 4 4
1. Introduction 44
2. Design Considerations 45
3 . Component Description 50
4 . Microphone/FET Assembly 60
5. Housing Assembly 64
6. Vacuum Can Description 67
D. DRIVER/HOUSING MEASUREMENTS 69
1 . Driver/Housing Parameters 69
2 . Microphone Calibration 74
3. Volume Velocity Calibration 76
III. RESONATOR SUBSECTION 81
A . OVERVIEW 81
B . RESONATOR COMPONENTS 82
C. HELIUM LEAK TESTING OF THE FRP NECK 8 4
IV. SYSTEM TEST 89
A. EXPERIMENTAL APPARATUS AND PROCEDURE 89
1 . Prel iminary Requirements 89
2 . Experimental Configuration 92
3 . Experimental Procedure 93
B. COMPUTER SIMULATION 97
1 . Background 97
2 . Modifications 99
3 . Program Description 99

C . EXPERIMENTAL RESULTS 103
1 . Straight Tube 103
2 . Refrigerator-type Resonator 109
3. Refrigerator-type Resonator with Stack 127
4 . Power Measurements 138
V. CONCLUSIONS AND RECOMMENDATIONS 148
APPENDIX A - Capillary Flow Measurements 151
APPENDIX B - Computer Simulation Program 155
APPENDIX C - Selected Dimensional Drawings(Driver Housing) 162
APPENDIX D - Description of the STAR Resonator 180
APPENDIX E - Manufacturer Specification Sheets 184
APPENDIX F - Gas Distribution System 201
REFERENCES 202
INITIAL DISTRIBUTION LIST 204
VI

LIST OF TABLES
II-l Mass Loading Transduction Coefficient 30
II-2 Measured Values for the Bellows and DriverStiffness and Moving Mass 34
II-3 Stiffness and Moving Mass for IndividualComponents and Combined System 71
II-4 Driver Housing Parameters 74
IV-1 Measured Data from Straight Tube Experiment 104
IV-2 Summary of Measurements for Refrigerator-typeResonator 127
IV-3 Summary of Measurements for Refrigerator-typeResonator with Stack 137
IV-4 Summary of Power Measurements 147
VII

LIST OF FIGURES
1-1 STAR Components 4
1-2 Electroacoustic Efficiency 6
1-3 Schematic Layout of the STAR within theGAS canister 12
1-4 Block Diagram of the STAR'S Electronics 13
1-5 Hofler Prototype Thermoacoustic Refrigerator 15
1-6 Thermoacoustic Heat Transfer Processwithin a Resonator 17
II-l Diagram of a Moving Coil Transducer 21
II-2 Mechanical Model for a Simple HarmonicOscillator 2 4
II-3 Harmon-JBL 2450J Driver Indicating the PortionsRemoved for use on the STAR 2 7
II-4 Experimental Setup using the MTI PhotonicSensor to Measure Reducer Cone Displacement 31
II-5 Plot of the Square of the Period versusAdded Mass for Determination of DriverSuspension Stiffness 33
II-6 Experimental Apparatus for Bellows ResonanceFrequency Measurement 35
II-7 Sample Impedance Plot for the Driver as aFunction of Frequency 37
II-8 Sample Free Decay used for Determinationof the Quality Factor 39
II-9 Plot of the DC Resistance as a Function ofTemperature for a 4 " Voice Coil 41
11-10 Comparison of Experimental and TheoreticalTechniques used in the Determination of theAccelerometer Sensitivity 43
vm

11-11 Driver Housing Cross-sectional View 46
11-12 Driver Housing 47
11-13 Driver Housing Lid View 51
11-14 Section Y-Y • View of the Driver Housing 52
11-15 Schematic of the PX80 Pressure Sensor, SupportPlate, and Strain Relief Fixture 56
11-16 The Electronic Feed-through Plug 58
11-17 Driver Housing Showing Electronic Feed-throughPlug, DC Pressure Transducer Support Plate, andStrain Relief Fixture 59
11-18 Microphone/FET Assembly 65
11-19 Cross-sectional View of the Vacuum Can 68
11-20 Stiffness and Moving Mass Measurements ofthe Driver/Bellows System 71
11-21 Microphone Calibration 77
11-22 Volume Velocity Calibration 80
III-l Diagram of the STAR Resonator 83
III-2 Fiber-Reinforced Test Pieces 86
III-3 Alcatel Helium Leak Tester and FRP TestAssembly 88
IV-1 Electrical Power Measuring Circuit 91
IV-2 Schematic Representation of the ExperimentalApparatus 94
IV-3 Mathematical Derivation of ElectroacousticEfficiency in Terms of Measured Parameters 98
IV-4 Computer Simulation Strategy 101
IV-5 Predicted and Measured Electric Power for theStraight Tube at One Bar 106
IV-6 Predicted and Measured Acoustic Power for theStraight Tube at One Bar 107
IX

IV-7 Predicted and Measured Electroacoustic Efficiencyfor the Straight Tube at One Bar 108
IV-8 Electroacoustic Efficiency as a Function ofTube Resonance for the Straight Tube 110
IV-9 Refrigerator-type Resonator Ill
IV-10 Measured and Predicted Electric Power for theRefrigerator-like Resonator in 10 Bar Helium. ... 115
IV-11 Measured and Predicted Acoustic Power for theRefrigerator-like Resonator in 10 Bar Helium. ... 116
IV-12 Measured and Predicted Electroacoustic Efficiencyfor the Refrigerator-like Resonator in 10 BarHelium 117
IV-13 Measured and Predicted Electroacoustic Efficiencyfor the Refrigerator-like Resonator(f =511.6 Hz) 12
IV-14 Measured and Predicted Electroacoustic Efficiencyfor the Refrigerator-like Resonator(f =436.5 Hz) 121
IV-15 Measured and Predicted Electroacoustic Efficiencyfor the Refrigerator-like Resonator(f =415.4 Hz) 12 2
IV-16 Measured and Predicted Electroacoustic Efficiencyfor the Refrigerator-like Resonator(f =393.1 Hz) 123
IV-17 Measured and Predicted Electroacoustic Efficiencyfor the Refrigerator-like Resonator(f =377.1 Hz) 124
IV-18 Measured and Predicted Electroacoustic Efficiencyfor the Refrigerator-like Resonator in 10 BarHe-Ar (18.85% Ar) 126
IV-19 Measured and Predicted Electroacoustic Efficiencyfor Resonator with Stack in 10 Bar He 129
IV-20 Measured and Predicted Electroacoustic Efficiencyfor the Resonator with Stack (f =493.1 Hz) 131
IV-21 Measured and Predicted Electroacoustic Efficiencyfor the Resonator with Stack (f =441.8 Hz) 132

IV-22 Measured and Predicted Electroacoustic Efficiencyfor the Resonator with Stack (f =421.8 Hz) 133
IV-23 Measured and Predicted Electroacoustic Efficiencyfor the Resonator with Stack (f =366.3 Hz) 134
IV-24 Measured and Predicted Electroacoustic Efficiencyfor the Resonator with Stack in 10 Bar He-Ar(18.85% Ar) 135
IV-25 Electroacoustic Efficiency as a Function of theTube Resonance Frequency 13 6
IV-26 Power Measurements without Stack at 540 Hz in10 Bar Helium. a. power ratio. b. displacement/current ratio 140
IV-27 Power Measurements without Stack at 560 Hz in10 Bar Helium. a. power ratio. b. displacement/current ratio 142
IV-28 Power Measurements without Stack at 570 Hz in10 Bar Helium. a. power ratio. b. displacement/current ratio 143
IV-29 Power Measurements with Stack at 520 Hz in 10 BarHelium. a. power ratio. b. displacement/currentratio 144
IV-30 Power Measurements with Stack at 600 Hz in 10 BarHelium. a. power ratio. b. displacement/currentratio 145
A-l Possible Wire/Tubing Configurationsa. Concentric b. Eccentric 154
C-l Driver Housing - Lid (Top) View 162
C-2 Top View Detail of Figure C-l 163
C-3 Side View of the Driver Housing 164
C-4 Close-up Top View Detail of Figure C-l 165
C-5 Cross-sectional View of the Microphone/FETHousing 166
C-6 Top View of the Driver Housing 167
C-7 Bottom, or Resonator, View of the DriverHousing 168
XI
C-8 Cross-sectional View of the Driver Housing(Vertical Dimensions) 169
C-9 Cross-sectional View of the Driver Housing(Horizontal Dimensions) 170
C-10 Close-up Cross-sectional View of the DC PressureTransducer Port 171
C-ll Cross-sectional View along Y-Y" of Figure C-1...172
C-12 Driver Housing Pressure Lid with Bolt Circleand 0-ring Details 173
C-13 Plane and Section Views of the Pusher Platewith Taper Detail 174
C-14 The DC Pressure Transducer Support Plate inboth Plane and Section Views 175
C-15 The Electronics Feed-through Plug withoutConnectors or Fittings in Plane and SectionViews 176
C-16 Top View of the Vacuum Can Flange Section 177
C-17 Close-up Top View of the Vacuum Can ElectronicsFeed-through Port 178
C-18 Side View of the Vacuum Can Flange SectionShowing Detail 179
D-l Diagram of the STAR Resonator 181
E-l Dimensions of the Valpey-Fisher Quartz DiskShowing Electrode Configuration 196
E-2 Schematic of Eltec Impedance Converter withConstant Current Source Circuitry 199
E-3 Eltec 3 04 Output Impedance and Current SupplyDropout Curves 200
F-l Gas Distribution System 201
XII

ACKNOWLEDGEMENT
The authors would like to thank the following people for
their assistance and support in the building and testing of
the STAR driver:
Mr. Fancher M. Murray, P.E., of JBL Incorporated for
providing the Harmon-JBL™ neodymium-iron-boron
electrodynamic driver used in the Space Thermoacoustic
Refrigerator (STAR)
.
Dr. Greg W. Swift, of Los Alamos National Laboratories,
for his assistance in the modification of voice coils for
the STAR driver.
Mr. Glen Harrell, of the Naval Postgraduate School, for
his knowledge, insights, and outstanding craftsmanship in
the construction of the housing for the STAR driver.
Mr. Jay A. Adeff, of the Naval Postgraduate School, for
his assistance in the construction of the fiber-reinforced-
plastic test sections and of the system testing equipment.
In addition the authors would like to thank their thesis
advisors for their insight, direction, and patience during
the conduct of this research project.
xm


I . INTRODUCTION
A. BACKGROUND
This thesis, in part, is a continuation of the work
begun by Lt. M. Fitzpatrick 1(1988) dealing with the Space
Thermoacoustic Refrigerator (STAR) project. Much of her
introductory material is applicable to this investigation
and has therefore been reproduced where relevant. The
theory pertaining to the thermodynamics and thermoacoustics
involved in the design of the refrigerator is only briefly
discussed. Fitzpatrick covered these topics in some detail
and further reproduction of her work in these areas would be
unnecessarily repetitious.
1. History
Thermoacoustics can be thought of as any process
involving heat transport and sound propagation in which
energy is converted from one form to the other. The study
of thermoacoustic phenomena dates back many years. However
it wasn't until only recently (late 1970's to early 1980's)
that any major breakthroughs were made in the field. These
were largely due to the work of Nikolaus Rott, who
quantitatively described the thermoacoustic phenomena that
his predecessors had observed. In a review article on
thermoacoustics 2 Rott restricted his definition of the
subject matter to the study of heat engines in which a net

heat transport in some gaseous medium is related to the
acoustic properties of that medium. Rott discussed heat-
driven oscillations in which a heat engine acts as a prime
mover. In addition he explained the phenomenon he called
"thermoacoustic streaming" in which a heat engine acts as a
heat pump or a refrigerator.
Inspired by Rott's work, a group led by John
Wheatley at the Los Alamos National Laboratory, began
experimental research into the design of various
thermoacoustic heat engines. The performance of these early
prototypes was rather disappointing which resulted in the
group devoting more time to the study of some simple
thermoacoustic effects and comparing them to Rott's theory.
In 1986, Tom Hofler, a student of Wheatley 's, was able to
numerically solve Rott's theoretical eguations. Applying
this knowledge, Hofler designed and built a working
thermoacoustic refrigerator 3 as part of his doctoral thesis.
Subsequent to Hofler 's work, a proposal by Steve
Garrett of the Naval Postgraduate School led to the concep-
tualization of a space-qualified version of Hofler's
prototype refrigerator. Two of Garrett and Hofler's thesis
students, Fitzpatrick and Susalla, commenced work on two
different components of the refrigerator. This thesis is a
continuation of their work into the design, fabrication and
testing of a space-qualified thermoacoustic refrigerator.

2. Refrigerator Efficiency
In his doctoral dissertation, Hofler reported that
the lowest ratio of cold temperature (T c ) to ambient
temperature (Th ) attained with his prototype fridge was
0.66. Additionally he found that the highest coefficient of
performance relative to Carnot was 12% at a temperature
ratio of 0.82. In designing the space-qualified
thermoacoustic refrigerator one of the principle objectives
was to modify Hofler 's prototype in an attempt to increase
its overall efficiency. Achieving this goal requires a
basic understanding of the refrigerator and the energy
transformations that occur within it.
The actual design of the space thermoacoustic
refrigerator (STAR) is depicted in Figure 1-1. Basically an
acoustic standing wave, produced by an electrodynamic
driver, is excited within a closed resonator tube. A
closely-spaced stack of plastic plates is critically-
positioned near the pressure antinode within the resonator.
The thermodynamic interaction between the acoustic wave and
stack results in a net heat flow towards the pressure
antinode. This assumes that minimal heat conduction occurs
at the walls of the resonator in the vicinity of the stack.
Though this description of the refrigeration process is
over-simplified, it will suffice for now. For further
discussion of this process, the reader is referred to Swift
(1988).4 The main point concerning the present topic is

y\\yv\\vs\\\\\\\s\\\^
DRIVER
HOUS I NG
BELLOWS
HOT HEATEXCHANGER
STACK
COLD HEATEXCHANGER
RESONATOR
Figure 1-1. STAR Components

that three forms of energy exist (electric, acoustic, and
heat) and are interrelated in the definition of overall
efficiency.
The first transformation to occur involves the
electrodynamic driver, or transducer, which converts
electrical energy into acoustical energy. The electrical
power delivered to the driver (n elec ) is proportional to the
product of the input voltage (V) , current (I) , and the
cosine of the phase angle (0) between them. The acoustical
power generated (n ac ) is proportional to the product of the
acoustic pressure (p) , the volume velocity (U) , and the
cosine of the phase angle (0) between them. Electroacoustic
efficiency (T7 ea ) is then defined as the ratio of the output
acoustic power to input electric power.
The second energy transformation involves the inter-
action between the acoustic pressure wave and the stack. For
a given acoustic power, a net heat flow occurs resulting in
the removal of heat (Q c ) from the "cold" end of the stack
via a heat exchanger. In this case a common measure of
performance, known as the coefficient of performance (COP)
,
is equal to the ratio of heat removed to the acoustic power.
(Figure 1-2 summarizes the above discussion.)
Improvement of the overall performance of the Hofler
prototype refrigerator required that the electroacoustic
efficiency and coefficient of performance be maximized.
The latter was dealt with by Susalla whose work in

nelec
= I V cos « nac
= p u cos ij>
'ea= n
a c
ne 1 e c
COP = °-c
"u
Figure 1-2. Electroacoustic efficiency

designing and testing variations on the thermoacoustic stack
in different inert gas mixtures resulted in significant
improvements over previous designs. Using Hofler's
refrigerator, Susalla was able to achieve a 93% improvement
in the coefficient of performance relative to Carnot, 5
(where the Carnot COP is defined to be the maximum
attainable COP for a perfect refrigerator at a given
temperature span)
.
3. Driver Optimization
Optimization of the electroacoustic efficiency was
the topic of Fitzpatrick' s research (1988). She discussed
the need for a driver to have minimal moving mass (m ) and
minimal mechanical resistance (R^) in order to reduce
mechanical losses. She also explained the need for a driver
to have as large a transduction coefficient (Bl) as possible
in order to maximize acoustic power output. The driver
Fitzpatrick initially selected for modification and testing
was an Altec 260-16K electrodynamic transducer. This driver
was selected because of it's ability to produce the large
pressure amplitudes and volume velocities required for space
applications. The Altec driver was modified so that voice
coil displacements could be directly translated to a
flexible surface (the bellows) having approximately the same
cross-sectional area as the resonator tube that would house
the thermoacoustic stack. Fitzpatrick found that the
electroacoustic efficiency of the driver (in air at 1 bar)

ranged from 75.9% to 84.2% for electric powers of 54.2 mW to
0.56mW respectively. Using a computer model developed by
Susalla, Fitzpatrick was able to predict the electroacoustic
efficiency of the Altec driver. She found that her measured
efficiencies were about 15-20% higher than those predicted
by computer simulation.
In addition to the Altec 290-16K, Fitzpatrick
obtained a modified JBL model 2450J neodymium-iron-boron
(NIB) compression driver. This driver employs the latest
innovations in driver technology including a titanium
suspension and aluminum voice coil in addition to the rare-
earth magnetic structure. Imposed time limitations
prevented modification of the NIB driver for refrigerator
applications, however Fitzpatrick was able to determine the
unmodified driver parameters. Using these as inputs for the
computer program, and simulating different acoustic load
impedances, Fitzpatrick was able to predict electroacoustic
efficiencies of the NIB driver in 10 bar helium (He) and 10
bar helium-xenon (12.5% Xe) gas. Predicted efficiencies in
helium were reported to be about 50% higher due to better
impedance matching between the driver and acoustic load.
Although this suggests that helium would be the preferred
acoustic medium to be utilized by the fridge, Susalla
observed that the coefficient of performance could be
maximized by using a He-Xe gas mixture. For this thesis the
electroacoustic efficiency of a modified NIB driver is
8
physically determined for various inert gas mixtures (at 10
bars) and compared with Fitzpatrick 1 s predicted values.
B. SPACE THERMOACOUSTIC REFRIGERATOR (STAR)
1. Motivation
Numerous applications for spaced-based refrigeration
systems presently exist in the form of cooling low noise
and/or high speed electronics, high T c superconductors, and
infrared detectors. Presently, methods based on the
evaporation of expendable cyrogens (liquid helium, nitrogen,
etc.) or on closed cycle processes (Stirling cycle, Vuil-
leumier cycle, etc.) are used. Both methods suffer from
significant disadvantages. In evaporation based refriger-
ators, it is a limited supply of stored cyrogens, for closed
cycle systems, a high vibration level exists. Additionally
the use of sliding seals in these refrigerators are a
primary cause of system failure lowering their overall long
term reliability.
The potential advantages of the STAR in increased
reliability, reduced vibration, and simplicity over present
space based refrigeration systems indicate that it could
replace these systems in some applications. As a result of
this it was determined that space-based testing of STAR was
desirable. The absence of gravity would remove thermal
convection as a heat transport mechanism and the vacuum of
space would provide thermal insulation which would allow for

the most accurate determination of the systems overall
efficiency.
On 3 February 1988 a Memorandum of Agreement between
the Naval Postgraduate School (NPS) and the Air Force was
signed that provided funding for the space based testing of
STAR. The project was then assigned a National Aeronautics
and Space Administration (NASA) payload number of G-337 and
scheduled to fly onboard a future Space Shuttle mission as
part of NASA's Get Away Special (GAS) program as a Quick
Response Shuttle Payload.
2. Get Away Special (GAS) Program
NASA's GAS program is designed to allow small, self-
contained payloads to be taken into earth orbit onboard the
Space Shuttle in a standardized container at relatively low
cost to the experimenter (Get Away Special Team, 1984). 6
The standardized GAS container is designed to hold a payload
of less than five cubic feet and 200 pounds. Each payload
must be totally self-contained with its own electrical
power, control, data acquisition, and storage subsystems,
requiring only the operation of an ON/OFF switch by the
Shuttle's astronauts at designated times during the mission.
3. Non-Acoustical Subsystems
Another group of NPS students and faculty led by
Garrett (Boyd, et al., 1987)7 have taken advantage of the
GAS program to measure the resonant acoustic modes of the
shuttle payload bay and the ambient acoustic environment
10

produced as a result of main engine and booster operation
during launch. This experiment is called "The Space Shuttle
Cargo Bay Vibroacoustics Experiment" and is designated by
NASA as payload G-313. Several subsystems that were
developed for NASA G-313 will be used on NASA G-337 (STAR)
.
A schematic of the STAR in its GAS can is shown in Figure
1-3. One of the systems borrowed from NASA G-313 is the
computer/controller system used to run that experiment and
record the data. The recorder system consists of the INTEL
model BPK 5V75 magnetic bubble memory module and an NSC 800
microprocessor-based controller. Two other NPS students, LT
Charles B. Cameron, USN and CPT Ronald Byrnes, USA, will be
designing the analog electronics and software to integrate
these systems into the STAR experiment for their master's
thesis. 8 A block diagram of the electronics is shown in
Figure 1-4.
Another borrowed system is the power supply, which
consists of Gates brand lead-acid battery cells (five
Ampere-hour, two Volts each) . These gelled electrolyte
batteries are ideal for the STAR due to their high power
density, low cost, and the absence of outgassing during
discharge cycles. NASA G-313 used a one layer battery of 68
cells providing 680 watt-hours of energy and weighing about
80 pounds (including the cell's support structure). We will
be using two battery layers with 42 cells each to provide a
28 Volt bus with a maximum of 840 watt-hours of available
11

Figure 1-3 Schematic Layout of the STAR withinthe GAS container
12

/N
LQJ
_J3a.
Eou
oL_JC
u
M/
»
"7TT
QJ
Uc —
OJ l0) c owooCTUCD
e
Po.tr Control IIA0-IA4 2B4 I 6
Po.er SLotus 1 IB I" IB4 I
Aultichonnel Addre»» Select (2A0-2A3I
A/0 Stort Convernon ( 2C0 )
End Or Con.€rnon I 2C0 I
A/D Over-ronQe I 2C I I
Dig i tued Output Doto 14
J lj»
31L —03 0_
* a3
T. CLIO
^iZ_
<
T!L
CD
I
<i—on
MZiV -
TT
<- Contro K,
-71
LQJ
J
a_
aE<
Accel ero.cler Vo 1 tooe IRAS!
Microphone Vol tooe t RAS )
"D JC
X 0)
03 E—QJ
a l- 3 ~0J (I) L— 003 QJccm"7F
u *-J
\1/
Fr i moryBotteru'Voltese
A] tirnoteBoi leryVo 1 toge
«
^/
Figure 1-4. Block Diagram of the STAR'S Electronics
13

electrical energy and a battery weight between 118 and 130
pounds (including the weight of the sealed battery shelves)
.
The use of the GAS can imposes certain restrictions.
Since we are using batteries to supply the power, the
refrigerator has to be energy efficient. Also, the GAS can
setup requires the STAR to be compact and lightweight.
Figure 1-5 shows a photograph of Hofler's prototype
refrigerator. This setup is approximately six feet high
(which includes vacuum pumps that are not required in
space) . In comparison, the maximum payload height for the
GAS can is 28.25 inches, or less than 2.5 feet. These
considerations played a major role in the choice of
equipment for the STAR and its design.
4. Acoustical Subsystems
The acoustical subsystems of the STAR were designed
to assist in the optimization of the thermoacoustic heat
transfer process. Additionally they were designed to assist
the STAR in meeting NASA safety requirements and the
restrictions imposed by using the GAS container. The driver
housing accomplished this by providing a pressure tight
container that allowed the STAR to be operated in a ten
atmosphere Helium-Xenon gas mixture. The driver housing
also serves as a support mechanism for the electrodynamic
driver subsystem and various test instrumentation and
connectors
.
14

Figure 1-5. Hofler Prototype ThermoacousticRefrigerator
15

The driver subsystem is designed to efficiently
convert the input electrical power from the power amplifier
into acoustic power. In order to accomplish this a new type
of driver which uses Neodymium-Iron-Boron (NIB) magnets was
used in connection with a modified voice coil/reducer cone
assembly. The electrodynamic driver assembly was then
attached to a flexible bellows assembly designed to act as a
pressure seal between the housing assembly and the resonator
assembly.
Within the resonator assembly lies the core of the
thermoacoustic refrigerator, a plastic stack, first
developed by Hofler (1986) , which allows for the transfer of
heat when a standing wave is generated, as illustrated in
Figure 1-6. In this process acoustical energy can be
converted into a thermal heat transfer. Primary
considerations in the design of the resonator assembly were
to reduce acoustic losses in the cold portion, reduce its
overall length, and to reduce losses due to thermal
conduction along the walls of the resonator tube in the
vicinity of the plastic stack. The length and losses of the
resonator were decreased by using an attached sphere to
reduce the sealed resonator length from 1/2 to 1/4 of a
wavelength and by varying the tube diameter. The losses due
to heat transfer along the tube housing the stack were
reduced by using a composite wall material with a low
thermal conductivity.
16

^^:^>%^^v;:-^;^;^^^- ;>^v^^^^v:;^--y<
X X = x +
COLD END HOT END
PLATE
Figure 1-6. Thermoacoustic Heat Transfer Processwithin a Resonator
17

The final component of the acoustical subsystem is
the vacuum can which encloses the resonator assembly.
Designed to reduce the heat leak by thermal conduction and
radiation, the vacuum can and the superinsulation
surrounding the resonator act as an insulator. In the STAR
test project the vacuum can will also serve as a safety
shield to prevent driver or resonator components from
entering the remainder of the GAS can in the event of
catastrophic failure.
C. SCOPE
Chapter II begins with a brief discussion of the theory
involved in using an electrodynamic driver as a simple
harmonic oscillator. Additionally, the ability to model a
distributed system by lumped parameter modelling is
reviewed. Next, an in-depth discussion of the modifications
conducted to the STAR driver and the measurement of its
component parameters is presented. Following this
discussion, the design and testing of the driver housing and
it's various components and subsystems is presented and
analyzed.
Chapter III presents an overview on the important
thermoacoustic components of the resonator being built for
the STAR. A discussion of the limitations in using a helium
based gas mixture with a fiber-reinforced plastic neck is
presented. One method to overcome the stated liabilities is
18

discussed and experimental results shown to prove its
validity.
Chapter IV presents an analysis of the electroacoustic
efficiency of the STAR driver based upon measurements
conducted using various gas mixtures and resonators. The
experimental configuration and procedure used to meet the
test reguirements are discussed and schematically
illustrated. Additionally a computer simulation program
capable of providing a theoretical model of the
electroacoustic efficiency is presented. Finally, a series
of test measurements is presented for each test case and the
results analyzed and compared to results from the simulation
program.
Chapter V provides conclusions from the development and
testing of the STAR driver as well as recommendations for
areas reguiring further investigation.
19

II. THE ELECTRODYNAMIC DRIVER
A. ELECTRODYNAMIC DRIVER THEORY
1. Introduction
The electrodynamic driver exists for the purpose of
converting alternating current (AC) electrical current into
acoustic pressures (forces) within the resonator at high
efficiencies. The driver subsystem is a modified Harmon-JBL
model 2450J compression driver with a voice coil-reducer
cone assembly and a bellows. The moving coil transducer
consists of a permanent magnet structure energized with Nd-
Fe-B magnetic material with an annular gap. Inserted into
the gap is a wire wrapped cylindrical coil of known length
(1) , which is attached to a thin diaphragm as shown in
Figure II-l. When an alternating current (I) is applied to
the coil a force is generated on the coil. This force
(F=B1*I) is a result of the interaction of the induced
magnetic field of the coil on the permanent magnetic field
(B) . The frequency of the coils displacement is the same as
the frequency of the alternating current used to drive the
coil. An additional result of the coil's motion is the
generation of a voltage within the coil which opposes the
motion of the coil by Lenz's Law. This induced
electromotive force is linearly related to the velocity (u)
of the coil's motion and increases the driver's electrical
20

B
->
\s
\z$x^^TF^t
S4^
^s\\\\\N
( A ) Magnet ( B ) Back Plate
( C ) Pole Piece ( D ) Surround
( E ) Reducer Cone ( F ) Voice Coil
( G ) Electrical Lead Connection
Figure II-l. Diagram of a Moving Coil Transducer
21

impedance. Measurement of the driver's impedance may
therefore be used as an indication of the coil's motion and
can be easily determined using a modern impedance analyzer
(i.e; HP-4192, HP-4194).
To effectively transfer the mechanical motion of the
voice coil into acoustic pressure waves within the resonator
a reducer cone and dynamic bellows must be used. The
purpose of the reducer cone is to transfer the linear motion
from the 4" diameter voice coil to the 1.5" diameter dynamic
bellows. To accomplish this, the reducer cone needs to move
as one unit without flexure, while remaining light enough so
that little energy is lost in overcoming the cone's inertia.
This was accomplished for the STAR driver by machining the
reducer cone from a single piece of 6061-T6 aluminum. The
inertia of the cone was further reduced by drilling holes
throughout its surface. In addition to reducing the mass of
the cone, the holes allow for the free passage of gas within
the driver housing thus reducing the gas induced stiffness
of the driver.
The final element in the process of transferring the
drivers mechanical motion into acoustical pressure waves is
the bellows. This bellows is a custom built lightweight
electroformed nickel bellows (see APPENDIX E) . The purpose
of the bellows is to produce a flexible gas tight seal
between the driver housing and the resonator tube, while
transferring the motion of the driver into pressure waves in
22

the gas filled resonator. Connection of the driver's voice
coil to the reducer cone and of the reducer cone to the
bellows was accomplished using STYCAST 2850FT epoxy. The
2850FT epoxy was selected for use based on its cure strength
and relative temperature insensitivity in the temperature
range of interest. APPENDIX E contairs a listing of the
specific properties of the epoxy.
Once assembled, the driver can be modelled as a
simple harmonic oscillator (SHO)
.
9 This modelling is
illustrated schematically in Figure II-2 where the spring
stiffness (k) is the sum of the voice coil suspension
stiffness, the back stiffness due to trapped gas, and the
stiffness of the dynamic bellows. The mass (m ) shown in
the figure is the sum of the moving masses of the voice
coil-reducer cone assembly and of the bellows. Finally the
mechanical resistance (R^) of the system is the damping
present due to viscous losses in the voice coil/gap and any
other mechanical losses in the bellows or suspension. The
driver's resonance freguency can then be determined by
dividing the mass by the stiffness and taking the square
root of the result. This mass is the sum of the moving
masses plus any additional added mass. This yields the
angular frequency (rad/s) of resonance (u> ) . Section II-
B.2(b) describes the procedure used in more detail.
23

MECHANICAL ACOUSTICAL
M o= Mcoil
+ M bellows+ M driver
K = Ksusp
+ K bellows+ K
gas vol
F = B l*i
Figure II-2 Mechanical Model for a Simple HarmonicOscillator
24

2. Lumped Parameter Modelling
The ability to sum the individual masses of the
system into one mass, illustrated in Figure II-2, is an
example of lumped parameter modelling. In the previous
section we indicated that we were able to accomplish this
for not only the system's mass but also for its stiffness
and mechanical resistance. Use of these values, along with
knowledge of the driving force, provide all the parameters
needed for modelling the mechanical side of the driver.
To analyze the effects of the acoustical portion of
the system on the driver, it is necessary to model the
distributed acoustical load as a mechanical impedance acting
on the moving mass of the system. This method of modelling
is described by Kinsler, et a_l10 and is practical as long as
the largest diameter of the resonator is much smaller than
the wavelength of the driving frequency. This mechanical
impedance is useful in determining the acoustic pressure
difference acting upon the mass. Once the resonator has
been modelled, all the parameters are shown to act upon the
moving mass of the system. Analysis about this point should
then provide an indication of the coupled systems
performance. A computer program for use in this analysis is
discussed in Chapter IV.
25

B. ELECTRODYNAMIC DRIVER PARAMETERS
1. Driver modifications
The STAR driver must be capable of maximizing force
while adhering to the limits imposed by the NASA GAS
canister volume. The recent technological advance by
Harmon-JBL in producing a Neodymium-Iron-Boron magnet based
driver, the 2450J, resulted in a driver capable of meeting
these imposed restrictions. A modified 2450J NIB driver was
provided for use in the STAR project by Mr. F.M. Murray of
Harmon-JBL. As shown in Figure II-3, the commercially
available 2450J NIB driver was modified by cutting away
unnecessary portions of the throat area. This resulted in a
significant weight (4.4:1) and volume (2.2:1) reduction
without a major loss in transduction coefficient (1:0.9)
when compared to an earlier generation 2445J series driver.
Attached to the NIB driver is a voice coil-reducer
cone assembly. This assembly consists of a standard 4"
voice coil whose titanium diaphragm had been laser cut at
the Los Alamos National Laboratory and removed at 0.25"
above the surround. The aluminum reducer cone was then
permanently bonded to the voice coil and the assembly
treated as a single unit. Ideally a voice coil-reducer cone
assembly should not be needed. A custom built driver would
be capable of directly transferring the motion of its voice
coil to the dynamic bellows, however such a project was
beyond the resources of this experiment. Use of the voice
26

THROAT AREA REMOVED
Figure II-3. Harmon-JBL 2450J Driver indicating theportions removed for use on the STAR
27

coil-reducer cone assembly therefore allows us to use a
commercially available voice coil-suspension-magnet system
for the STAR project. Finally the previously discussed
bellows was bonded to the top of the reducer cone to form
the completed driver.
2. Driver Measurements
The parameters needed to accurately model any
electrodynamic driver include its moving mass, stiffness,
transduction coefficient, and mechanical resistance. For
this driver some of these measurements could be conducted on
individual components prior to assembly and then summed,
while others where determined on the assembled system. In
most instances it was possible to obtain the parameters by
both methods thereby providing a self-consistancy check of
the measurements.
a. Transduction Coefficient
The transduction coefficient was determined
using two methods. The first method involved the direct
measurement of the length of wire used in the assembly of
the voice coil and of the strength of the driver's magnetic
field. The length of the wire was determined by measuring
the diameter (d) of the voice coil and counting the number
of turns (N) of aluminum wire wrapped around it. From these
two values the length of the wire was found to be 8.33 ±
0.04 meters. Measurement of the magnetic field strength was
accomplished by using a Dowdy RFL Industries model 912
28

Gaussmeter (S/N 808) with a Hall Effect probe model 912015
(S/N 21122) . The Dowdy Gaussmeter provides a time averaged
measurement of the magnetic field of the NIB driver within
the annular gap. Several readings were taken at different
positions within the gap in order to average out any local
differences due to variations in gap width. The average
value over several positions was approximately 1.9 ± 0.3
Tesla. The transduction coefficient was then determined by
taking the product of these two values and yielded a value
of 15.8 ± 2.6 T-m for the NIB driver.
The above result can be checked by direct
measurement of the force in a force balance experiment.
Using the relationship between magnetic and gravitational
force it can be shown that the transduction coefficient can
be determined by the following equation;
Bl = mg/M (II-l)
where g is the acceleration due to gravity, m is a known
added mass, and Al is the additional current in the voice
coil necessary to return the voice coil to its origional
(unloaded) position. Experimentally this value was
determined by using a Mechanical Technology Incorporated '
s
(MTI) 1000 series Fotonic Sensor (S/N 38010818) as a monitor
of the reducer cone's displacement as shown in Figure II-4.
Adding a known mass to the reducer cone produces a change in
its net displacement. By applying DC current to the voice
coil it was possible to force the reducer cone back to its
29

original position. As shown in TABLE II-l, a series of
measurements were taken and the results averaged to yield a
value of Bl=15.3 ± 0.7 T-m. This value was found to agree
within 3% of the previously measured value of the
transduction coefficient well within experimental error.
TABLE II-l. MASS LOADING TRANSDUCTION COEFFICIENT
ADDED MASS (qms) CURRENT fmA^) Bl (Tm)
0.0 0.03265.5 -172.30 15.11
0.0 -0.48265.5 -178.40 14.64
0.0 -0.82265.5 -163.07 16.05
b. Stiffness Determination
The driver stiffness is composed of the
stiffness of the voice coil surround, the bellows, and the
back stiffness due to gases trapped behind the bellows. Due
to the design of the voice coil-reducer cone assembly this
latter effect was minimized. Measurement of the stiffness
of the voice coil-reducer cone (the suspension stiffness)
was accomplished using an added mass technique. The bellows
stiffness was determined using a free decay measurement
method. Both experimental methods were based on the
relationship of the resonant frequency to the stiffness and
mass of the system as described in section II. A. 1.
30

Figure II-4. Experimental Setup Using the MTI FotonicSensor to Measure Reducer Cone Displacement
31

The suspension stiffness was measured by
mounting a series of known masses onto the reducer cone and
observing the effect on the resonance frequency.
Measurement of the resonance frequency was accomplished
using a HP-4194 Impedance Analyzer in the impedance/phase
mode. In this mode the resonance frequency for the system
can be determined by locating the frequency of the maximum
impedance. Measurement of the added masses was accomplished
using a Sartorius model 2403 analytical balance. Using
these measurement pairs, a plot of the square of the period
versus its corresponding added mass was obtained as depicted
in Figure II-5. The slope of a best-fit line drawn through
these points will allow the determination of the suspension
stiffness ( kSUSP= 47r2/slope ) . The moving mass of the driver
may also be determined from this figure by dividing the y
axis intercept by the slope of the line. These measurements
were conducted for the NIB driver in air and vacuum in order
to determine the effect of mass loading due to atmospheric
pressure and due to trapped gases within the driver. The
results of a series of test runs are summarized in TABLE
II-2. It is important to note that the difference in driver
suspension stiffness in air and vacuum was found to be less
than 2%, confirming the belief that the holes in the reducer
cone would be effective in reducing back stiffness.
Measurement of the bellows stiffness was
accomplished using a series of added masses and the MTI
32

DRIVER SUSPENSION STIFFNESS MEASUREMENTS
7.00G-6
6.006-6
<v>
OLU
<O
ogcrUJ
^ 5.00e
4.006-6
0.000 0.001 0.002 0.003 0.004
ADDED MASS (kg)
Figure II-5 Plot of the Square of the Period versusAdded Mass for Determination of DriverSuspension Stiffness
33

Fotonic Sensor. The Fotonic was used to measure the
displacement of the bellows surface after if had been
disturbed (tapped) with a blunt instrument. The free decay
of this oscillatory displacement was then displayed by a
Nicolet model 310 digital storage oscilloscope and the
resonant period of the bellows was thus determined. Figure
II-6 provides a schematic of the experimental setup and the
eguations used in resonance freguency determinations.
Several masses were attached to a plate mounted on top of
the bellows in order to obtain a plot similar to the one
used in determination of the suspension stiffness. The
plate was mounted on top of the bellows in order to prevent
the thin flexible surface of the bellows from deforming due
to the added mass. Before determining the bellows moving
mass, the mass of the plate and adhesive must be subtracted
The results of the bellows measurements are included in
TABLE II-2.
TABLE II-2. MEASURED VALUES FOR THE BELLOWS ANDDRIVER STIFFNESS AND MOVING MASS
DRIVER 1 ATM AIR VACUUM
STIFFNESS (kN/m) 63.7 ± 1.2 62.7±0.9MOVING MASS (gm) 12.6 ± 0.3 11.9 ± 0.2
BELLOWS
STIFFNESS (kN/m) 3.87 ± .16MOVING MASS (gm) 0.07 ± .61
34

MTI FOTONIC
NICOLET
DIGITAL
OSCILLOSCOPE
BLUNT ROD
7 s:
Bellows Stiffness Measuiement
4.0009-4 -
fc>
3.000e-4 -
*•"•'" "
-a
Eto 2.0009-4 -
3
•~™?^~-
o| 1.0009-4 i
0.0009+0 -
r^^ —
_
—
0.000 0.005 0.010 0.015 0.020
added mass (kg)
Figure II-6 Experimental Apparatus for Bellows ResonanceFrequency Measurement
35

c. Quality Factor and Mechanical Resistance
The measurement of the driver's quality factor
(Q) is an indication of the mechanical losses in the driver.
Several methods are available for the measurement of the
quality factor including a phase slope method discussed in
section IV-B. Another method of measuring the quality
factor consists of measuring the resonance frequency and the
frequencies of the 3dB down points taken from a modified
impedance plot (HP-4194 in impedance/phase mode) . The
quality factor can then be determined by dividing the
resonance frequency by the difference between the 3dB
frequencies. This measurement, when conducted using the
Impedance Analyzer, must be corrected for the blocked
electrical impedance present due to direct current
resistance of the voice coil, test equipment, and test
leads. This is easily accomplished by using the HP-4192 in
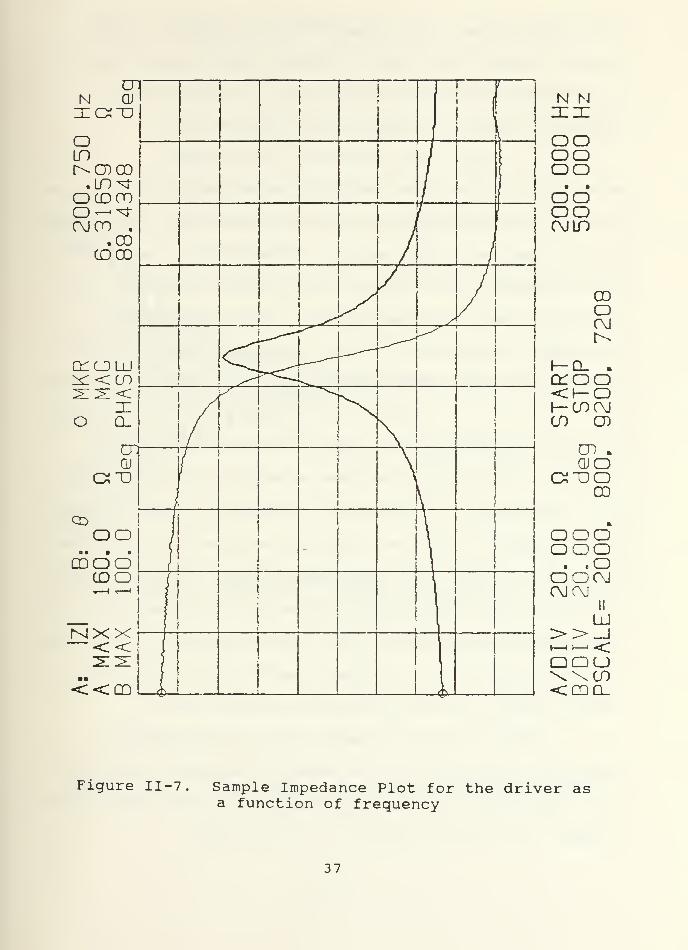
the COMPENSATION MODE. Figure II-7 is representative of the
impedance plots obtained as a function of frequency for the
driver in air at 1 atmosphere. Analysis of the data
indicates a resonance frequency of 364.25 Hz and half power
frequencies of 353.75 Hz and 376.25 Hz yielding a Q of
16.2 ± 0.3.
The driver's mechanical losses were also
determined by measuring the free decay of an impulsive
excitation. An Endevco model 22 Picomin accelerometer was
calibrated (section II-A.4) and mounted on the underside of
36
N Nziie
oooooo• aoooo
c\jid
oooCM
I— Q_ .
o:ooh-cnoj(/) CD
CD .
QJOCJT30
CO
OOOOOO. .OOO CM
C\JC\JII
LU>>_J•—••—
'-<OOO
\\(/)<CQQ.
Figure II-7 Sample Impedance Plot for the driver asa function of frequency
37

the reducer cone. When triggered by the removal of the
driving voltage, the signal from the accelerometer was sent
to a Nicolet 310 digital oscilloscope. This decaying
sinusoidal signal is described by equation II-2;
A(t) = A * exp(-nT/r) * sin(w ot+0) (H-2)
where A(t) is the signal amplitude as a function of time, A
is the initial amplitude, and nT represents the time elapsed
during n periods of the signal. In addition, t represents
the exponential decay time, w the resonant angular
frequency, and <p the phase angle. Taking the natural
logarithm of equation II-2 then results in equation II-3,
for the peak amplitudes of the signal as a function of time.
In A(n) = In A -nT/r (H-3)
A plot of logrithm of the peak amplitude versus period
number, n, can then be obtained as shown in Figure II-8.
From this graph it is possible to determine Q by dividing n
by the slope of the line. This follows from the definition
of Q=w t/2 = 7TT/T. For experimental runs in air at one bar
and in a vacuum, the quality factor of the driver system was
determined to be between Q air=15.4 and Qvacuun=17 . 2 . The value
of the quality factor obtained from the two methods can be
seen to agree to within 5% for the tests in air.
Once the quality factor has been measured the
mechanical resistance can be easily determined ( Rm=w m /Q )
.
This was done for the two test cases in air and vacuum and
yielded the values of Rm (air)= 1.82 kg/s and
38

Figure II-8 Sample Free Decay used for determinationof the quality factor
39

R^ ( vacuum) = 1.58 kg/s. Using this same formula for the
quality factor from the impedance plot yielded a value of
Rm (air)=1.78 kg/s. Once again it is possible to see a close
agreement between the two independent measurement
techniques.
3. Voice Coil Resistance
Heating of the voice coil as the driver operates
cause changes in the value of the voice coil resistance. If
the temperature coefficient of the voice coil resistance is
known it can be used to provide an i_n situ measurement of
the coil's temperature which can also be used as an
indicator to predict voice coil failure. As long as no short
circuits are present within the voice coil, the value of the
coil's resistance should remain relatively constant,
effected only by the coil's temperature.
Using the standard 4" voice coil modified similarly
to the one used in the STAR driver, temperature and
resistance measurements were taken as the coil was heated
inside of a sealed oven. The direct current resistance
measurements were taken using a four-wire measurement
technique while a thermocouple was used for the temperature
readings of the oven. These values were then plotted, as
shown in Figure II-9, and indicate the relationship is
linear (slope=31mfi/ cC) over a temperature range from 20.0°C
to 50.0°C. For the actual STAR voice coil, an initial RDC of
40

VOICE COIL TEMPERATURE SENSITIVITY
V)
Temperature ( Degrees Celsius)
Figure II-9 Plot of DC Resistance as a Function ofTemperature for a 4 M Voice Coil
41

8.22H was measured at T=20°C and minimal heating effects
noted during extended test runs.
4. Accelerometer Calibration
Several test measurements of the driver required the
use of an accelerometer mounted to the reducer cone. In
addition to the driver parameter measurements, the
monitoring of the driver's acceleration during actual
operation is accomplished using this accelerometer. Given
these two requirements, knowledge of the accelerometer '
s
sensitivity is extremely important in analysis of the STAR'S
performance.
For an accelerometer of known charge sensitivity,
the open circuit (voltage) sensitivity (Macc ) can be
determined as a function of acceleration if the total system
capacitance is known. This sensitivity can also be
experimentally determined by measuring the voltage output of
the accelerometer for a known driving acceleration. Since
the system's capacitance will vary up until the final
version of the STAR is connected to its flight electronics,
it is important to verify that the value based on the charge
sensitivity specification accurately reflects the actual
measured sensitivity. Figure 11-10 illustrates the
equations used in the theoretical and experimental methods
as well as the results of two test runs with different
system capacitances. From these two test cases, in which a
B&K model 4294 Calibration Exciter was used to supply a
42

A PICOMIN MODEL 22 MICROMINIATURE, PIEZOELECTRICACCELEROMETER
CALIBRATION
THEORETICAL
MaCc= C«/g)/EC
a - accelerometers charge sensitivity (pC/g)
g - gravitational acceleration (m/s 2)
EC - sum of the system's capacitance (pF)
MEASURED
Hacc= (Vout/G)/a
Vout — accelerometer output voltage (mV)
G = gain factor ( operator selected)a = 10 m/s 2 at 158.75 Hz from a B&K 4294
calibration exciter
RESULTS
ctotal (P F ) THEORY(V-s 2/m) MEASURED(V-
s
2/m) %DIFFERENCE
604.6 83.45 *10~ 6 79.43 *10~ 6 4.8
288.5 174.37 *1(T 6 175.40 *10~ 6 0.6
620.1 81.07 *10~ 6
Figure 11-10. Comparision of Experimental and TheoreticalTechniques Used in the Determination of theAccelerometer Sensitivity
43

constant 10 m/s acceleration at 159 Hz, agreement between
the two methods was shown to be between 0.6% and 4.8%. For
the test system used throughout the rest of the component
and system testing a theoretical value of Macc = 81.1 Vs 2/m
was determined based on a measured capacitance of 620.1 pF.
This measured capacitance included the capacitance of the
accelerometer (283.5 pF) , its cabling (116.5 pF) , and the
amplifier input capacitance (20.0 pF) . From the agreement
between the two test measurements we believe this value to
be accurate to within at least 5%.
C. STAR DRIVER HOUSING
1. Introduction
The design of the STAR driver housing is based upon
the mechanical drawings provided by Fitzpatrick in her
thesis 1 and the continuing work done by Hofler in the field
of thermoacoustics . Adapting lessons learned from Hofler'
s
prototype refrigerator, 11 and incorporating new materials
and innovations has led to the current driver housing
design.
The purpose of the housing is to rigidly support the
modified JBL driver, to serve as a pressure vessel for the
working medium (a 10 bar He-Xe gas mixture) , and to
accommodate the required electronics which will monitor and
control system parameters and acoustical performance.
44

In developing a design for the STAR driver housing
there were a number of system requirements that had to be
satisfied. Though some of these were stipulated by NASA,
many resulted from the innovative technology devised by
Hofler and Garrett. The following sections will discuss the
design considerations in detail, the individual components
and subsystems contained within the housing, and the
assembly of those components into an integrated system.
2. Design Considerations
The first and foremost design considerations
pertained to the limited space available in the Get-Away
Special (GAS) canister and the weight limitations imposed by
NASA. The GAS canister is approximately 28.25 inches high
having an inside diameter of about 19.75 inches and is
limited to a maximum payload of 200 pounds. Ensuring that
the driver housing is as light and compact as possible
provides more space for other system components, including
additional battery cells to prolong the STAR lifetime while
in orbit. Furthermore, the housing had to be designed to
attach to the lid of the GAS canister via twelve #10-32
bolts on a 9.5 inch diameter bolt circle. Since the
modified JBL driver is approximately 6.3 inches in diameter
and 1.9 inches high, the imposed size limitations provided
no unmanageable restrictions. The result was the driver
housing depicted in Figures 11-11 and 11-12, having a height
45

Figure 11-11. Driver Housing Cross-Sectional View
46

'
i: m.
Figure 11-12. Driver Housing
47

of approximately 3.75 inches and a maximum diameter of 10.80
inches, machined from 6061-T6 aluminum.
Aside from the NASA requirements, it was desirable
to ensure that the housing be capable of interfacing with
the resonator subsystem developed by Hofler for his
prototype refrigerator. By doing so, the integrity and
performance of the driver housing could be verified prior to
completion of the STAR resonator by testing with components
from the earlier designs. This had a direct impact on the
placement of the microphone/FET electronics package that
would be mounted within the housing to help monitor and
control system acoustical performance.
The size and placement of the electronic feed-
through port, DC pressure transducer port, and gas fill port
were another consideration. The placement of the electronic
feed-through port was based on the location of the
microphone/FET package. The DC pressure transducer port was
placed as close as possible to the electronic feed-through
port so that all housing electronics could be easily
accessed by the external signal processing package. The
size of the transducer port was dependent on the dimensions
of the commercially-available Omega PX-80 pressure sensor.
The gas fill port was situated such that its placement was
in the vicinity of the STAR'S gas reservoir. The size of
the fill port was determined by the choice of gas fitting
(1/8 inch Swagelok ) .
48

Two critical considerations resulted from the design
requirements that the working fluid in the refrigeration
system be a He-Xe gas mixture pressurized to 10 atmospheres.
First of all, the housing (once closed) would have to be
capable of withstanding the forces produced by the 150
lb/in2 gas mixture within it. Obviously internal regions of
the housing having the largest surface areas would be
subjected to the greatest forces. In particular the lid(s)
used to close the housing and isolate the internal workings
from the surrounding environment would have to be strong and
rigid. The bolts used to rigidly mount these lid(s) in
place would have to be numerous enough and have sufficient
tensile strength to handle the distributed load. This led
to the design of a single pressure lid that is fixed to the
housing by 12 equally-spaced #1/4-20 machine bolts.
The second consideration arose due to the ability of
helium to penetrate through all known insulators at ordinary
temperatures. This was a concern not only for system
performance but also because of a NASA requirement that the
venting of the inert gas mixture be kept to a leak rate that
was less than 10"* standard cm 3/s. As a result it was
decided to use lead 0-rings to seal all lids and fixtures in
place.
A final consideration was based on the amount of
vibration the housing and its components would experience
upon launch and landing of the Space Shuttle. In particular
49

the driver/bellows configuration would have to retain its
integrity. To ensure that this occurred a pusher plate was
devised which clamps down on the underside of the driver
rendering it immobile. At the same time this plate is
responsible for conduction of heat from the electrodynamic
driver to the GAS lid for removal via radiation into space.
3. Component Description
The housing has a number of components and
subsystems associated with it. The components include the
housing shell, a test lid, a pressure lid, a pusher plate, a
DC pressure transducer support plate with strain relief
fixture, and an electronic feed-through plug. All of these
were milled from 6061-T6 aluminum. The associated
subsystems include the driver/bellows assembly (with Endevco
model #22 accelerometer) , an Omega PX-80 high pressure
sensor and a microphone/FET package.
The inside of the housing shell is tiered to allow
precise placement of the driver assembly, pusher plate, and
pressure lid (see Figures 11-13 and 11-14 for a top and
cross sectional view of the housing shell). The 1.5 inch
diameter hole in the bottom of the shell is where the
Servometer single convolution 0.003 inch thick electroformed
nickel bellows is epoxied into place. The 1/32 inch
diameter hole that runs through the bottom of the housing is
for a 0.8 inch length of copper-nickel capilliary tubing
(inner diameter of 0.010 inches). This capilliary serves to
50

Figure 11-13. Driver Housing Lid View
51

01
CD
Figure 11-14. Section Y-Y ' View of the Driver Housing
52

equalize static pressure between the housing and resonator.
At the same time its diameter (and hence flow conductance)
has been kept small enough that at the operating frequency
of the STAR system it maintains a dynamic pressure seal.
Additionally, in the bottom of the shell, there are two
small cavities connected by a narrow channel. The
cylindrical cavity houses a Valpey-Fisher quartz plate which
acts as a microphone while the other accomodates an Eltec
model 304 P-channel MOSFET impedance converter. The #0-80
tapped holes located in the vicinity of these cavities are
used to mount a brass plate which shields the electronics.
Externally, the housing shell has two flanges. The
upper mounts directly to the GAS canister lid via 12 equally
spaced #10-32 bolts on a 9.5 inch diameter bolt circle. The
lower flange has a 9.3 inch diameter bolt hole circle that
permits the mounting of a vacuum can which provides thermal
insulation for the resonator and acts as a protective shield
should the resonator rupture. At the location of the elec-
tronic feed-through and pressure transducer ports, the hous-
ing shell has been appropriately machined to provide a flat
surface to mount the respective components. The 1/8" NPT
pipe thread tap situated in the side of the housing shell
directly opposite the electronic feed-through port is for a
Swagelok pipe fixture which serves as the gas fill port.
The housing test lid performs the same function as
the GAS canister lid. It has a groove for a rubber O-ring
53

so that when mounted to the housing it will provide a
sufficiently leak-tight seal for ground testing purposes.
It also has a centrally-located single tiered orifice which
is where a small length of 1-1/8 inch diameter aluminum
tubing is welded into place. In this configuration the test
lid (and housing) can be mounted onto an Alcatel ASM 110
Turbo CL helium leak detector and checked for leaks.
The pressure lid provides a leak-tight seal capable
of withstanding the forces developed from the 10 atmosphere
He-Xe gas mixture within the housing. It is approximately
3/4 inch thick for rigidity and strength and is secured to
the housing shell with 12 equally-spaced #1/4-20 high
strength carbon steel machine bolts. Applying a little
physics and assuming equal distribution of the load on the
bolts one can readily determine that each bolt must be
capable of withstanding a force of approximately 660 pounds.
Actual tensile strength tests performed on the carbon steel
bolts (using an Instron Model 6027) indicated that their
average yield was in the order of 5400 pounds force.
Regular stainless steel bolts were also tested and found to
be approximately half as strong as their carbon steel
counterparts
.
There are two O-ring grooves cut into the pressure
lid. The outer is for a 1/32 inch diameter wire lead O-ring
to prevent helium leakage. The inner groove is for a rubber
O-ring which serves as a backup for the lead. Since the
54

STAR system will be assembled and filled with He-Xe gas as
much as several months prior to it's Shuttle launch date,
the lead O-ring is critical to ensure that the system remain
charged and not leak an appreciable amount of helium.
Should the lead O-ring fail during launch due to excessive
vibrations, the rubber O-ring should be sufficient to
minimize helium leakage during a six day mission.
The role of the pusher plate is to secure the
driver/bellows assembly in place and provide a heat
conduction path from the driver (voice coil) to the housing.
The plate edge has a 10° taper that mates perfectly with the
taper inside the housing shell (seen in Figure 11-14). The
motivation for this design was to maximize the effectiveness
of the plate as a heat conduction path. A narrow channel
and notch were cut into the plate to serve as a passageway
for the accelerometer lead coming from the underside of the
driver's reducer cone.
The DC pressure transducer support plate is required
to rigidly hold the Omega PX-80 piezoresistive pressure
sensor in place as depicted in Figure 11-15. A 0.45 inch
diameter hole located in the center of the plate provides a
passageway for electronic leads to and from the transducer.
Encircling this opening is a shallow 0.6 inch diameter lip
in which the sensor is seated. The plate does not require
an O-ring groove since a leak-tight seal is achieved by
placing a lead O-ring between the transducer and housing.
55
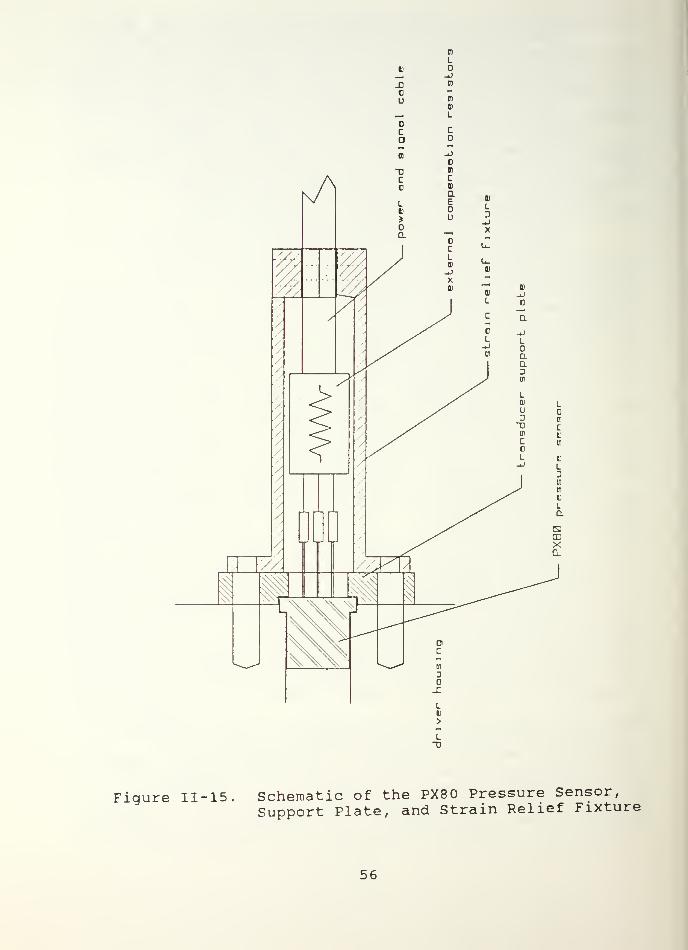
L
Figure 11-15 Schematic of the PX80 Pressure Sensor,
Support Plate, and Strain Relief Fixture
56

Attached to the support plate via two #6-32 machine
bolts is a strain relief fixture. This component serves a
dual purpose in that it houses the external compensation
resistors for the PX-80 transducer and provides strain
relief for the leads connecting the sensor to a 1.5 mADC
current supply and to the signal processing electronics.
(The DC current supply is used to energize the
piezoresistive strain gage bridge within the sensor)
.
The most complicated component in the housing is the
electronic feed-through plug shown in Figures 11-16 and
11-17. It has feed-throughs for six leads; two for the
driver, one for the accelerometer, two for the microphone,
and a spare. The main concern in the design of this
component was to minimize the potentially devastating helium
leak rate that would exist where the electrical leads were
fed through the housing shell. To accomplish this each
feed-through has a 0.3 inch long section that is only 0.040
inches in diameter. Additionally, glass particle-filled
epoxy was used to insulate the bare copper electrical leads
and seal the six narrow conduits. The selected epoxy was
Emerson and Cumming's STYCAST 2850FT and was proven
effective by Fitzpatrick in her thesis.
Each feed-through also has a #10-32 tapped hole on
either side of the narrow channel. Microdot coaxial
connectors and flat-top #8-32 brass bolts (each having a
length of bare copper wire soldered to them) were
57

_D
u L
—
1
_lj
c u—
I
a 1
X cc
-D
DL in
CL in
(J LJD
IS C\J
r\i VO
(S i
u>
c
ai
i—
'
w
w "0
03—
cL L_D JD
a
OJ
>D
La
OJ c>oj LQ)
i
(0o
" "Dc
Q) (1)—
'
Jl"-1
L c
to
s
a
Figure 11-16. The Electronic Feed-Through Plug
58

'#
Figure 11-17. Driver Housing Showing Electronic Feed-through Plug, DC Pressure TransducerSupport Plate, and Strain Relief Fixture
59

alternately mounted into the tapped holes on the external
face of the plug using the STYCAST epoxy. Enough epoxy was
used to ensure that the copper leads were properly insulated
as they passed through the narrow ducts. On the internal
face of the plug threaded brass and nylon sleeves were
alternately epoxied into place (opposite the coaxial
connectors and brass bolts respectively) . Each brass sleeve
had a 3/4 inch section of shielding braid soldered to it.
This braid was used to strengthen the connection between the
bare copper wires that would be joined to coaxial leads
coming from the microphone, MOSFET and accelerometer
.
Additionally the v>_aid provides electrical shielding to
those connections. Each of the three other copper wires
(passing through the nylon sleeves) had a length of teflon-
coated wire soldered to them. The resulting joints were
then insulated using a teflon heat-shrinkable tubing. Ring
connectors were attached to two of these leads that would
eventually be connected to the driver.
A lead O-ring groove was cut into the plug to
provide a leak-tight seal between it and the housing. A
final feature of the feed-through plug is a #4-40 tapped
hole on the internal face which was included as a possible
accessory mount.
4. Microphone/FET Assembly
Critical to the operation of the STAR are the
Valpey-Fisher quartz microphone and Eltec MOSFET impedance
60

converter. The microphone detects pressure changes at the
driver end of the resonator while the MOSFET converts high
impedance microphone signals into easily measureable low
impedance signals with approximately unity gain. Once
calibrated, the output from this assembly permits accurate
measurement of operating frequency and pressure amplitude
thus providing the means of monitoring the system for
feedback control resonance tracking. 8
The Eltec impedance converter (a MOSFET source
follower) was additionally connected to a constant current
source circuit consisting of a 6.8 kn resistor and 2N5457
JFET transistor (see APPENDIX E) . The purpose of this
configuration was primarily to stabilize it's gain. The
impedance converter network was experimentally shown to have
an output impedance of 3.03 kn and a gain of 0.97. It was
also shown that for signals ranging in frequency from 200 Hz
to 500 Hz (the operating region for the STAR) the phase
shift of the output signal introduced by this amplifier was
less than 0.14° (a highly desirable characteristic in that
the phase is used to control the resonance frequency)
.
Once the impedance converter network was certified
as being fully operational it was potted (using STYCAST 1266
epoxy) into a small oblong cavity having the same dimensions
as the one in the bottom of the housing. Care was taken to
ensure that leads were left exposed and fully accessible.
Once dry, the assembly was removed from it's mold and
61

epoxied (again using STYCAST 1266) into the oblong cavity in
the bottom of the driver housing.
The microphone consists of a y-cut quartz disk (see
APPENDIX E) epoxied to a quartz ring using STYCAST 1266
epoxy. Leads were attached to electrode tabs on the disk
using a silver paint. A fine bead of Dow Corning 732 Multi-
purpose Sealant was put on the bottom of the ring and the
assembly was gently lowered onto the lower lip of the small
cylindrical cavity in the bottom of the housing.
A small insert for the channel connecting the
microphone and impedance converter was manufactured using
STYCAST 1266 epoxy. A narrow groove was cut into the piece
allowing for the placement of a lead connecting the
microphone output to the pre-amp input. The insert was then
epoxied into place and the connection between the microphone
output and MOSFET input was completed.
The microphone back volume of approximately 0.4 cm3
was sealed with a circular brass plate having a small
capillary leak. The leak allows the static pressure between
the microphone back volume and housing to equalize while the
system is being pressurized. At the same time, the leak is
small enough that a dynamic pressure seal exists ensuring
that no undesirable acoustic pressure is introduced into the
microphone back volume. The leak was created by inserting 3
mil copper wire into a one centimeter long piece of 4 mil
bore copper-nickel tubing. Based upon the theory of flow
62

between concentric cylinders 12 and the requirement that
phase errors be kept to less than 0.5°, it was theoretically
determined that a minimum acceptable value for flow
resistance would be approximately 5xl0 6 gm/cm*-s. The above
tubing configuration was experimentally shown to have a flow
resistance per unit length of about 6xl0 6 gm/cm 3-s and so
the use of a one centimeter length of tubing was sufficient
to prevent the unwanted phase errors. The theoretical and
experimental derivations of flow resistance within the
capillary are explained in APPENDIX A.
The tubing was inserted into a hole in the brass
plate and soldered in place. The second lead from the
microphone was grounded by attaching it to the underside of
the brass plate with silver paint. The brass plate was then
placed on the upper lip of the microphone cavity and
carefully epoxied into place. A more viscous, fast drying
epoxy (TRA-BOND BA-2106) was then used to seal the small gap
that existed where the channel insert met the brass plate.
The final microphone/FET assembly requirement was to
install a brass plate to shield the electronics. The plate
had three holes drilled into it; one for the MOSFET ground,
and two for coaxial cable connection. The braids of the
cables (Microdot type 250-3866-0000 low noise coaxial cable)
were soldered to the top surface of the brass plate while
the center conductors were permitted to pass through the
plate for connection to the MOSFET. The MOSFET ground was
63

also soldered to the plate. With all appropriate
connections made the brass plate was then mounted to the
housing with two #0-80 screws and the microphone/FET was
finally ready for testing. Figure 11-18 shows the completed
microphone/FET assembly.
5. Housing Assembly
With the microphone/FET electronics installed the
assembly of the housing was ready to commence. The threads
of an 1/8 inch Swagelok gas fitting were wrapped with teflon
tape and the fixture was then installed in the gas fill
port. The electronic feed-through plug (complete with
connectors and fittings) and DC pressure transducer were
then mounted ensuring that their respective lead O-rings
were crushed to provide leak-tight seals. The two coaxial
leads coming from the microphone/FET package were coupled
with coaxial cables from the feed-through plug using Malco
microdot coaxial connectors (part numbers 031-0034-0001
(female) and 032-0023-0001 (male)). The two teflon-coated
power leads from the feed-through plug with the ring
connectors attached were then connected to the driver. The
driver was then carefully placed in position ensuring that
it's leads did not touch the reducer cone and that the
microphone cables were not disturbed or damaged. With these
connections made, any excessive lengths of electrical leads
were neatly placed in the available space between the driver
and inner wall of the housing. The underside of the
64

u
c 0)
3L •—
'
_jJ ll
UQJ _c
,—
i
01
QJ 3
L_J _£
_J
ini
"0 "0
€ QJ
QJ QJ
,—
i
L_
aou
QJ jjU LL _J3 -H
D(D U
L_C _-J U—
i
2 LQJ
h- ^UJLl ,—
i
CO ,—
i
ac u.
71* 1
_0EQJ
01
01
(0
QJ
C
JZD_
LU
Figure 11-18. Microphone/FET Assembly
65

driver's magnetic structure that would make contact with the
pusher plate was then coated with heat sink grease (EG&G
Wakefield Engineering Inc. Type 120 Thermal Joint
Compound) to improve the heat conduction path from the driver
to surrounding environment. The pusher plate was then
installed ensuring that the driver was firmly held in place.
The coaxial lead coming from the cone-mounted accelerometer
was then connected to the third coaxial cable from the feed-
through plug. Any excessive accelerometer lead was tucked
into the same gap occupied by the other leads through the
small cutaway section in the pusher plate.
The driver housing structure was then inverted
(resonator side up) in preparation for the bellows
installation. The flat section of the reducer cone that
would make contact with the bellows was lightly coated with
STYCAST 2850FT epoxy . The 1.5 inch diameter opening in the
housing which would also make contact with the bellows was
coated with STYCAST 1266 epoxy. The bellows was then gently
lowered into position ensuring that it made good contact
with the reducer cone. Additional STYCAST 1266 epoxy was
then allowed to be drawn (via capillary action) into the
very small gap between the bellows and housing. After
allowing a suitable time for the epoxies to cure (24 hours)
the pressure lid was installed to complete the assembly of
the driver housing system. The strain relief fixture was
attached once the housing was ready for connection to all
66

external electrical leads. At this point the components
were ready for preliminary testing to determine system
parameters (such as moving mass, stiffness, etc.) and to
calibrate the microphone and accelerometer sensitivities.
These procedures will be presented in section II. D.
6. Vacuum Can Description
The vacuum can requires a brief description here as
it is a critical accessory to ensure proper functioning of
the refrigerator. It's main function is to insulate the
resonator from the surrounding environment and thus allow
the refrigeration process to be measured without
uncontrolled, extraneous heat loads. It is 15 inches long
in order to completely encase the resonator and it's
insulation, and is composed of three sections that are
welded together (depicted in Figure 11-19) . Like all other
system components, it too is constructed out of 6061-T6
aluminum.
It has a 9.86 inch diameter flange section which
mates with the smaller of the two housing flanges. A groove
has been cut into the upper face of the flange for a Parker
2-174 rubber O-ring. Two ports have been been milled into
this section. One is an electronic feed-through port for a
commercially available six pin plug (Hermetic Seal
Corporation SS7201-10B-6P-1 mod 1) . The electronics plug is
for connection to thermocouple leads (that monitor hot and
cold heat exchanger temperatures) and for connection to a
67

Ksen
' Is:!' W„ 7 . . . ... —........,.,., ,,.,.. ,., ..-. .-.:. w ':.-..: •-
C
—
I
uQ)
ID
CD
c
. - --
EJ
.—
i
—
i
CD~D S03 CD_J . ,
(J
-i LL Q)
_D ~DC
U. -i
0) —
i
L IT)
D_ u
._....
.
.
''— . .
Q_
QJ
01
Figure 11-19. Cross-Sectional View of the Vacuum Can
68

heater used during the actual refrigerator tests. The other
port is a vent hole into which a 1/4 inch Swagelok pipe
fitting will be installed that permits evacuation of the
can.
The wall thickness of the flange section has been
limited to 1/4 inch to reduce overall weight but still
maintain rigidity. At the electronic feed-through port the
flange section has been machined on both the inner and outer
walls to provide flat surfaces for ease of mounting the
feed-through plug and for the feed-through O-ring seal. An
1/8 inch lip cut into the bottom of the flange section
around its entire diameter is for placement of length of 1/8
inch thick prefabricated aluminum tubing having an outer
diameter of eight inches.
One final vacuum can component is a 1/4 inch thick
base plate. An 1/8 inch lip has been milled around its
outer diameter in order that it be able to fit securely onto
the end of the aluminum tube prior to being welded in place.
D. DRIVER/HOUSING MEASUREMENTS
1. Driver/Housing Parameters
With the driver assembly completed, the first
measurements to be made established driver parameters
including the moving mass (m ) , stiffness (k) , mechanical
resistance (RJ ,quality factor (Q) , and resonance frequency
(f ) of the system. Several other parameters were also
69

determined that will be discussed at the end of this
section.
The resonance frequency was easily found by
connecting the driver (via the electronic feed-through plug)
to an HP-4194 Impedance Analyzer. Resonance was observed to
occur at approximately 350 Hz in air.
The moving mass and stiffness of the driver/bellows
system were determined using the previously discussed
dynamic mass loading procedure. Measurement of the
resonance frequency for a given added mass yields the
desired parameters if a graph of period squared versus added
mass is constructed (see Figure 11-20) . The slope of the
resulting straight line permits the calculation of stiffness
while the ratio of the slope to y-intercept determines the
moving mass of the system. Again the only instrumentation
required was an HP-4194 to measure resonance frequency. The
experimental results yielded a stiffness of 6.83x10'' N/m
(± 1.0%) and a moving mass of 1.43xl0" 2 kg (± 1.1%) when
done in air. Since both stiffness and moving mass are
additive when dealing with this multi-component system, it
is worthwhile comparing the above results to those
parameters determined for the driver and bellows prior to
system assembly (refer to TABLE II-3) . Summation of the
individual driver and bellows stiffnesses yields a value of
6.75x10'' N/m (about 1% lower than the value above) which is
reasonable within experimental error. Summation of the
70

TABLE II-3. STIFFNESS AND MOVING MASS FOR INDIVIDUALCOMPONENTS AND COMBINED SYSTEM
DRIVER BELLOVS COABINED DR I VER/BELLOVS
et 1 Tfriess
1 U /s 1
6 37 x I04
! 1.21 * IB3
3 B? x IB3
'1 16 x I0 ?
6 ?6 x I04
'.1 .33 x II)
3
6 03 x I04
- 6 83 « I02
mov 1 nQ moss
( gm 1
12 60
! 29
0.07
! 61
12 67
! 90
14 26
*1
6
Driver/Bellows Stiffness Measurement9e-6
— 9e-6 -
•o
3
V)
0)
a
8e-6
8e-6
0.0000 0.0005 0.0010 0.0015 0.0020 0.0025
added mass (kg)
Figure 11-20 Stiffness and Moving Mass Measurementsof the Driver/Bellows System
71

moving masses yields a value of 1.27xl0" 2 kg (about 11%
lower than above) . The contribution of the bellows to this
total is only 0.07 grams which seems rather low considering
that the mass of the bellows is 1.86 grams. It is therefore
believed that the large difference between the summation of
moving masses and that of the driver/bellows system is due
to experimental error.
The quality factor and mechanical resistance of the
system were determined using the free-decay method in 10 bar
helium. To maintain a leak-tight system a small test volume
(12.7 cm J
) was mounted onto the resonator side of the
housing. By momentarily exciting the driver (by means of a
D-cell battery) and observing the output of the driver-
mounted accelerometer on a digital oscilloscope, both Q and
R^ were readily ascertained. Measurement of peak voltages
over several cycles of the exponentially-decaying signal
provided the necessary information to graph the natural
logarithm of the voltage peaks versus their respective peak
numbers (starting at zero) . The slope of the resulting
curve yielded a quality factor of 20.4 ± 1.8. The
mechanical resistance was then determined to be 1.96 ± 0.18
kg/s based on the relationship that Rtr=wm /Q (where u> was
the angular resonance frequency with the test volume in
place)
.
Additional parameters that were determined included
the driver back volume (Vd ) , the stiffness of the back
72

volume (kd ) , the internal volume of the bellows (Vb ) , and
the effective piston area of the bellows (Aeff ) . The
internal volume of the bellows was required for use in
determining the volume acceleration sensitivity to be
discussed in section II. D. 3. The volume of the bellows was
determined to be 10.8 cm 3 by filling it with a measurable
quantity of water. Despite the non-scientific approach the
accuracy of this measurement was better than 2%. The
effective piston area of the bellows was calculated to be
6.87xlO~ A m2 which was about 8% lower than the value of
7.46x10"'* given in the bellows specification sheet. Its
derivation is also discussed in section II. D. 3.
The driver back volume was estimated using the known
dimensions of the the driver and housing, and assuming that
the volume between the driver's magnetic structure and inner
wall of the driver housing could be ignored since it is
blocked acoustically by the pusher plate. Knowledge of the
driver back volume and effective piston area were required
in order to determine the stiffness of the back volume and
to show that it was negligibly small in comparison to the
stiffness of the rest of the system. The relationship
between quantities is given by,
k d= (7P A eff
2 )/Vd (H-4)
where 7 is the ratio of specific heats and P is the ambient
gas pressure within the housing. The values that resulted
were a back volume of 4.12xl0" 4 m 3 having a stiffness of
73

2.27xl0 2 N/m. As expected the back volume stiffness was
less than 0.5% of the overall system stiffness. A summary
of all the driver parameters listed above is provided in
TABLE I I -4.
2. Microphone Calibration
The microphone located in the resonator end of the
housing has a critical role in monitoring the system
performance and therefore requires an accurate calibration.
It is the microphone output that is used in conjunction with
the accelerometer signal to determine the acoustic power
delivered by the driver to the resonator. If the electric
power to the driver is known then the overall
electroacoustic efficiency of the system can be determined
TABLE II-4. Driver Housing Parameters
resonance frequency
moving mass
driver/bellows stiffness
quality factor
mechanical resistance
driver back volume
back volume stiffness
bellows volume
effective piston area
fo 350 [Hz]
m 1.43X10" 2[kg]
k 6.83x10" [N/m]
Q 20.4
K 1.96 [kg/s
vd 4. 12x10"' [m3
]
K 2.27X10 2 [N/m]
vb 10.8X10" 6[m
3
]
A e ft 6.87x10"* [m2
]
74
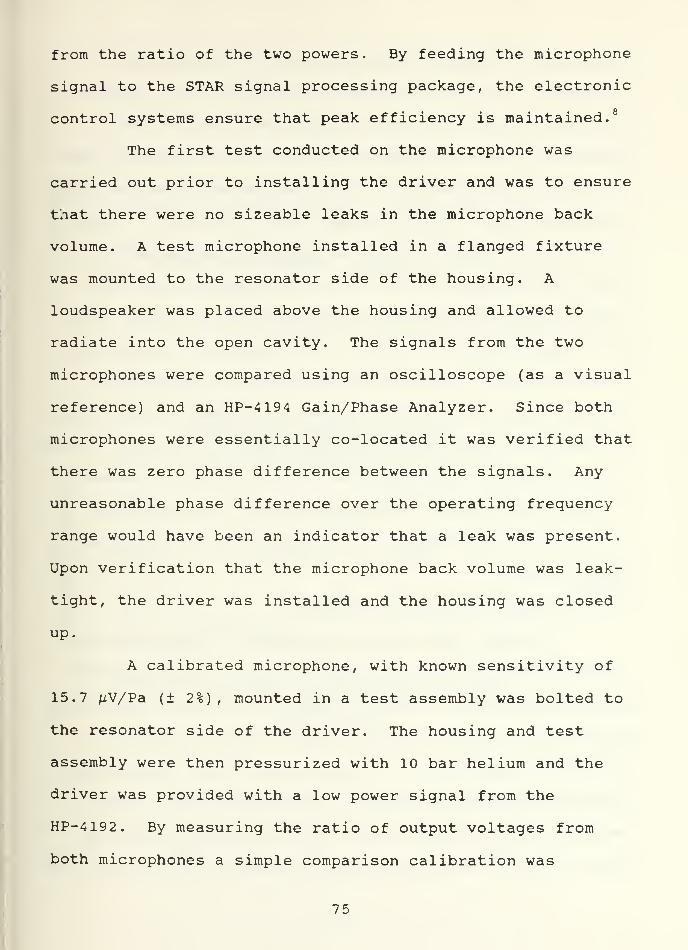
from the ratio of the two powers. By feeding the microphone
signal to the STAR signal processing package, the electronic
control systems ensure that peak efficiency is maintained. 8
The first test conducted on the microphone was
carried out prior to installing the driver and was to ensure
that there were no sizeable leaks in the microphone back
volume. A test microphone installed in a flanged fixture
was mounted to the resonator side of the housing. A
loudspeaker was placed above the housing and allowed to
radiate into the open cavity. The signals from the two
microphones were compared using an oscilloscope (as a visual
reference) and an HP-4194 Gain/Phase Analyzer. Since both
microphones were essentially co-located it was verified that
there was zero phase difference between the signals. Any
unreasonable phase difference over the operating frequency
range would have been an indicator that a leak was present.
Upon verification that the microphone back volume was leak-
tight, the driver was installed and the housing was closed
up.
A calibrated microphone, with known sensitivity of
15.7 /iV/Pa (± 2%), mounted in a test assembly was bolted to
the resonator side of the driver. The housing and test
assembly were then pressurized with 10 bar helium and the
driver was provided with a low power signal from the
HP-4192. By measuring the ratio of output voltages from
both microphones a simple comparison calibration was
75

conducted to determine the sensitivity of the housing
microphone. This calibration was conducted for a number of
different frequencies over a range from 100Hz to 1kHz to
determine if the microphone sensitivity was reasonably flat
(frequency independent) in the operating region of the STAR.
Calculated sensitivities ranged from 25.6 /iV/Pa at 100 Hz to
26.1 MV/Pa at 1kHz (a change of only 2% over the entire
range) with a mean of 25.8 /iV/Pa. The housing and test
fixture were then evacuated and repressurized with a 10 bar
He-Ar gas mixture (18.85% Ar) . The comparison calibration
was carried out once again to ensure that changing gas
mixtures would have little affect on microphone sensitivity.
The resulting sensitivities ranged from 25.7 /iV/Pa at 100 Hz
to 26.1 /xV/Pa at 1kHz with a mean of 26.0 /uV/Pa (agreement
to within one percent of the mean value in pure helium)
.
The results of the comparison calibrations are summarized in
Figure 11-22.
3. Volume Velocity Calibration
Acoustic power can be expressed as the product of
acoustic pressure, volume velocity, and the cosine of the
phase between them. Acoustic pressure is readily determined
by taking the ratio of the microphone output voltage to
microphone sensitivity. Volume velocity can be determined
from the accelerometer output but requires that a volume
velocity sensitivity be known. The following section is
based on the procedures outlined by Hofler in his thesis (as
76

Comparison Calibration : MV . M ,mi c c a 1
rruc
Vc a 1
oX
ro
Q.
>
|>
c0)
2.64
2 62-
2.60
2.58
2.56-
2.54
Microplione Calibration at 10 Bars
n
d n
I'
1'
1• 1
—
200 400 600 800
frequency (Hz)
—i •
—
1000 1200
n helium
helium-argon
Figure 11-21. Microphone Calibration
77

well as a related JASA article 13) for determining this
sensitivity.
A small cylindrical calibration volume having a
known acoustic impedance (easily determined by summing its
volume with the internal volume of the bellows) was mounted
to the resonator side of the housing. The housing and test
volume were evacuated and then pressurized to 10 bar with
helium. Since volume velocity is equal to the ratio of
acoustic pressure to acoustic impedance, knowledge of a
given load impedance and measurement of the pressure
amplitude at a given frequency completely determines the
desired parameter. It has already been shown how acoustic
pressure can be determined from the microphone sensitivity
and output voltage. Similarly volume velocity can be
determined from a sensitivity and measureable velocity
signal. In Hofler's thesis he electrically integrates the
accelerometer output signal to produce a velocity signal and
uses this to define a volume velocity sensitivity (H^) . In
the following procedure the accelerometer output voltage
(Vacc ) is used directly but is divided by angular frequency
to yield a volume acceleration sensitivity (m/) having
units of V-s 2/ro
3. Volume velocity (U) is then given by
u=vacc/wMu'- Since volume velocity is also equal to the
product of particle velocity (u) and effective piston area
(A eff ) , then the later parameter can be easily determined by
78

Aeff=Macc/Mu* if we define u=Vacc/u>Macc where Macc is the
accelerometer sensitivity.
By measuring the ratio of output voltages of the
accelerometer and microphone, a value for the volume
acceleration sensitivity was readily determined for a given
frequency. Sensitivities were calculated over a range of
frequencies from 100 Hz to 1 kHz and varied from 0.120 V-
s2/m 3 to 0.116 V-s 2/m 3 with a mean of 0.118 V-s2/m3
. The
calibration was repeated in a 10 bar He-Ar gas mixture
(18.85% Ar) with similar results. The mean value of the
sensitivity in He-Ar was again 0.118 V-s 2/m 3. Using this
value an effective piston area of 6.78xl0~ 4 m2 was determined
as reported in TABLE II-4. The theory and results of the
above procedure are summarized in Figure 11-23.
One additional piece of data obtained from the
volume acceleration sensitivity calibration was the phase
difference between the accelerometer and microphone signals.
This varied between -2.4 to -2.8 degrees in the operating
region of the STAR and is believed to be due to phase
differences existing in the electronics used to measure the
data. It is noted here as a required correction to the
phase between pressure and volume velocity. An additional
phase correction of +90° is also required when calculating
acoustic power using the accelerometer output directly since
pressure and velocity (not acceleration) are required to
determine acoustic power.
79

Impedance of a small :
cylindrical volumeZ =cav
l 7 pm
L> V
where
Pm =
CO =
V„ =
ratio of specific heats
internal ambient gas pressure [N/mz
]
angular frequency [rad/sec]
volume of cavity [m3
]
i - (-1)0.5
Volume accelerationsensitivity
* V M . I ZM = ace mic ' cavU
Ui Vm i c
Volume Acceleration Sensitivity at 10 Bars
0.121
o 0.120**
E
•«14
0.119
> 0.118>•
_>0.117
V)c0)CO 0.116
0.115
DD "
o
Dfi A
helium-argon
Q helium
—
•
1 •1 • 1 1 ' 1 '
—
200 400 600 800 1000 1200
frequency (Hz)
Figure 11-22. Volume Velocity Calibration
80

III. RESONATOR SUBSECTION
A. OVERVIEW
The resonator is designed to support an acoustic
standing wave and to serve as a housing for the pressurized
gas and thermoacoustic elements, including the stack and
heat exchangers. The interaction of the standing wave and
the stack transports heat. The geometry and the
construction of the resonator is constrained by the desire
to minimize extraneous heat loads due to unwanted thermal
conduction between the hot and cold portions of the stack.
In addition it is desireable to reduce acoustic losses due
to thermoviscous attenuation within the resonator and to
meet the size restrictions imposed by using the GAS
canister. In his doctoral dissertation, Hofler (1986)
discussed the loss mechanisms in detail along with resonator
design considerations. For use in the STAR project a custom
resonator was designed by Hofler, as illustrated in
APPENDIX D. Due to time limitations, the construction of
this resonator was not completed in time for use in the
experimental measurements discussed in Chapter IV. These
measurements where conducted with a resonator that is
acoustically similar to the one the STAR resonator, but that
has not been optimized for thermoacoustic transfer. The
81

resonator used in the space-qualified system will be
described in the forthcoming thesis by Jay Adeff.
B. RESONATOR COMPONENTS
As shown in Figure III-l, the STAR resonator is a
complex mechanical fixture composed of several components
joined together. The base assembly (1) is machined from
oxygen free, high conductivity (OFHC) copper (CRA 110) and
is designed to form a helium leak tight interface between
the driver housing and the fiber-reinforced plastic (FRP)
neck. The FRP neck (2) consists of a hollow composite
fiberglass and epoxy tube bonded to a .001" stainless steel
sleeve. Connected at the opposite end of the FRP neck is a
small diameter copper tube (3) which flares out as it enters
an attached stainless steel sphere (4). The spherical
volume is used to simulate an open-end termination, while
allowing the system to be closed. This results in the
resonator behaving as a 1/4 wavelength tube.
Within the FRP neck is the heart of the thermal heat
pumping process. This section is composed of a plastic
stack (5) which allows the thermoacoustic transport of heat
energy to occur along its length, and two heat exchangers
(6,7). The heat exchangers are multiple layers of parallel
thin copper strips bonded together and aligned
perpendicularly to the resonator's longitudinal axis. The
purpose of the heat exchangers is to provide a good thermal
82

Figure III-l. Diagram of the STAR resonator
83

transfer at the two ends of the stack in order to prevent
unnecessary losses, and to serve as a contact point between
the stack, the high temperature reservoir, and the cyrogenic
load. In this experiment the load is simply an electrical
heater (MINCO thermofoil heater model HK5232R45. 8112al-7)
.
Details of the stack construction and thermodynamics were
discussed by Susalla in his masters thesis. 5 Basically, the
stack is a long sheet of 0.003" thick plastic film with a
series of parallel sections of monofilament strings attached
to it. This film is then spiral wound around a small
diameter plastic rod to form a stack with a 38.1 mm diameter
and a length of 78.5 mm. One of these stacks, built at Los
Alamos National Laboratory, was used for the test
measurements conducted in Chapter IV.
C. HELIUM LEAK TESTING OF THE FRP NECK
In order to prevent unwanted thermal losses due to
thermal conduction, the wall material of the FRP neck must
have low thermal conductivity. The decision was made to use
fiberglass and epoxy (Dexter HYSOL EA9396) for the FRP neck
based upon its availability, ease of fabrication, high
mechanical strength, and low thermal conductivity. The
choice of helium as the major component of the working gas
creates certain problems. Helium is known to diffuse
through all known insulators at room temperature. One
method of overcoming this problem is to insert a metal vapor
84

barrier between the FRP and the area exposed to the helium
based gas. A one mil thick piece of stainless steel
(Precision Brand™ 698158) was chosen from the metals
available based upon its high tensile strength and its low
thermal conductivity. When soldered to the two copper tube
sections, this will provide a solid metal barrier to helium
diffusion, but until overlaid with the fiberglass epoxy will
lack strength and rigidity.
In order to verify that the leak rate would be
insignificant with the stainless steel liner and that a
leak-tight seal could be obtained, two test pieces (Figure
III-2) were manufactured. These pieces were scaled to
represent the actual driver resonator and consisted of two
copper pipe sections with a connecting piece of stainless
steel overlaid with fiberglass epoxy. In the construction
of one of the test pieces, leak paths were left along the
seam of the stainless steel liner. These leak paths were
designed to allow us to determine the effect of minor holes
in the stainless steel sleeve. The relative thinness of the
stainless steel required that a mandrel be inserted inside
the sleeve. Once the epoxy and fiberglass composite was
bonded to the stainless and copper parts, giving strength to
the test piece, the mandrel was removed. Prior to applying
the fiberglass it was verified that the completely sealed
test piece was leaktight in air at 1 atmosphere using an
85

Figure III-2. Fiber-Reinforced Test Pieces
86

Alcatel helium leak detector. The Alcatel He leak detector
was used for all such leak-testing procedures.
Once the two test pieces were covered with epoxy, it was
important to determine the leak rate for each piece. Using
a custom built testing stand shown in Figure III-3, the
interior of the test pieces were pressurized with 3
atmospheres of helium to saturate the FRP material exposed
to the helium by any leaks. A vacuum was then applied to
the exterior of the test piece, such as it will experience
during actual use, and sampling for helium conducted. The
first piece to be tested was the leak tight stainless
section after having been left pressurized with helium for
24 hours. After a sampling run of several hours no helium
diffusion above lCf10 standard cm3/s, the Alcatel's lowest
detection range, was detected and the test piece was assumed
to be helium leak tight. For the test piece with leak paths
in the stainless, but leak tight to air after having been
wrapped in fiberglass, helium was immediately detected
diffusing through the FRP neck. With this test piece it was
impossible to obtain a helium leak rate of less than 10" 6
standard cm 3/s, the Alcatel's upper limit. As a result of
these two tests it was verified that controlling the helium
leak rate through the composite by using a thin metallic
vapor barrier was necessary and possible.
87

Figure III-3. Alcatel Helium Leak Tester and FRPTest Assembly
88

IV. SYSTEM TEST
A. EXPERIMENTAL APPARATUS AND PROCEDURE
1. Preliminary Requirements
In order to determine the electroacoustic efficiency
of the STAR driver a procedure was required whereby electric
and acoustic power could be easily ascertained either
directly or indirectly. If the microphone and volume
velocity transducer sensitivities are known, then acoustic
power can be determined from measurement of the microphone
output voltage at the bellows location, the bellows-mounted
accelerometer output voltage, and the phase difference
between these signals. Therefore the first of three
preliminary requirements was to ensure that the microphone
and bellows accelerometer were accurately calibrated as
discussed in the sections II. D. 2 and II. D. 3.
The second requirement, prior to making any
measurements, was to devise a reliable (and hopefully
convenient) means of determining the electric power supplied
to the driver. This could have been determined by measuring
the input current and voltage to the driver and noting the
phase difference between them. Instead, a more automatic
approach was used whereby an electric power measuring
circuit was designed that provided the desired parameter
directly in the form of a DC voltage proportional to the
89

electrical power delivered to the driver. This circuit is
depicted in Figure IV- 1. Basically a 0.10 n current sensing
resistor was placed in series with the driver. The voltage
across both the driver and resistor then provided the
necessary inputs to the power measuring circuit. The
voltage across the resistor was used to ascertain the rms
current to the driver and as an input to the power
measurement. The power was determined by feeding the two
input voltages through a four-guadrant multiplier chip
(Analog Devices AD534) and then low-pass filtering the
output with a 1.6 second time constant to remove the AC
component. The average power was then directly available by
measuring the remaining DC voltage on a multimeter. The
measured value of power was 0.1 Watt/Volt. The rms current
was determined by feeding the 0.10 n resistor voltage
through an rms-to-DC converter (Analog Devices AD536) and
then measuring the output directly. The DC output voltage
was 1.0 Volt/Amp (rms) due to the voltage gain of ten
provided by the INA110 instrumentation amplifier.
The final necessity was to design and build a gas
handling system that was capable of both evacuating the
refrigeration system and pressurizing it up to 150 psia
(106
Pa) . The system (see APPENDIX F) consists of a wall-
mounted control panel having a differential pressure guage,
inputs for two sources of pressurized gas, a vacuum port, a
venting port and two pressure measuring devices (a Heise
90

v o
s—-*
•
c-H
—
.
CDII
. .
c—
1
La 0)
L ~Htu a-1 E LU- D Q)""
-iJ—
'
C La0)
E -• >-U c
•—
'
-•J uC L cc Q) 0) u-1 E a—1 —
•
3 i
-ij CL L a—
i
-*J -UL -U Ul i
OJ —
i
C Ula D -c EE
s L
—
'
^r —
1
UD—
'
m —
1
m^r m < IT)L_ a z_l < *~~* <
cj L_
3 _r H_—
'
ISIS
sIS — —» ii M
. t r\j _en q: u
Figure IV-1. Electrical Power Measuring Circuit
91

guage and an Omega PX304 pressure sensor) . The role of the
differential pressure guage is to ensure that the STAR
system does not pressurize (or depressurize) at too fast a
rate. Rapid pressure changes could result in damage to
either the microphone or bellows since both components are
dependent on small capillary leaks to equalize pressure
between their inner and outer boundaries.
2. Experimental Configuration
The driver was configured with two different
resonators, neither of which was the actual flight-ready
STAR resonator. The first, a straight, rigidly-terminated
tube having constant cross-sectional area, was used to
perfect measurement techniques with a system that could be
easily analyzed theoretically. The second resonator was
originally built by Hofler for the purpose of making
acoustic loss measurements. Though its design was not
optimal for refrigeration, it was an acceptable substitute,
capable of housing a stack and having basically the same
shape and acoustic characteristics as the STAR resonator.
An HP-4192 Impedance Analyzer was used as both a
signal source and gain/phase measurement device and
therefore played a central role in the experiment. The
signal output from the HP-4192 was passed through a 50.0 n
load prior to the power amplifier to ensure that a constant
voltage was maintained for all frequencies of operation.
92

The signal was then fed to both the driver and power
measuring circuit.
The microphone/FET was powered by a +15 VDC supply.
Its output, and that of the accelerometer, were passed
through separate Ithaco 1201 pre-amplif iers in order to
filter out unwanted noise and provide the necessary signal
gain. The amplified microphone and accelerometer signals
were then fed to the HP4192 for gain/phase measurements and
to an oscilloscope for visual monitoring purposes.
Other instrumentation such as constant DC voltage
and current supplies and multimeters were present for
peripherals such as the power measuring circuit and Omega
PX80 and PX304 pressure sensors. The experimental apparatus
is shown schematically in it's entirety in Figure IV-2.
3 . Experimental Procedure
Although helium-xenon is the preferred gas mixture
for the STAR, it is expensive and difficult to obtain. For
this reason various gas mixtures of helium and helium-argon
were used in all phases of these experiments. The primary
purpose for using different gas mixtures was to alter the
tube resonance frequency so that it ranged from above, to
below the driver resonance frequency. By doing so, the
performance of the system could be studied under different
operating conditions.
Once the driver/resonator was pressurized with a
particular gas mixture, the first information to be recorded
93

mu 1 L 1
meter
V
power"meosur- 1 ngc 1 rcu 1
i
ELECTRIC POWER
RAS CURRENT
. I ohm
-VA-V-50 ohm
•15 Vdc
eupp1
y
/ \
DRIVER
15 VDC
to m 1 c
1 5 mAdc
Lo PXB0
mul t 1
me Ler
HP4 1921 mpedonceono
)yzer
osc 1 1 1 oscope
PXB0
OUTPUT
Figure IV-2
.
Schematic Representation of theExperimental Apparatus
94

was the ambient room temperature and pressure guage
readings. These were important in determining the speed of
sound (c) and density (p) of the working medium . The
resonance frequency and quality factor of the resonator were
determined next. These two values provided some insight
into the behaviour of the combined driver/resonator system.
A knowledge of how closely matched the tube's resonance
frequency is to that of the driver is an indicator of system
efficiency. The quality factor defines the "sharpness of
resonance" 14 and is an indicator of how sensitive the system
will be to frequency changes. The higher the quality factor
the more sensitive the system is to change particularly as
the two resonances approach one another.
With the preliminary information recorded, the
system was run through a range of frequencies ensuring that
the tube resonance frequency was sufficiently bracketed.
For each run the frequency (f ) , microphone voltage (Vmic ) ,
accelerometer voltage (V acc ) ,phase difference (0) , electric
power (n elec ) ,power offset (n off ) and rms current (I rm£ ) were
IT)
recorded. The last three were obtained from a multimeter
that was connected to the power measuring circuit outputs.
The first four quantities were recorded directly from the
HP-4192. Once it was determined that enough data had been
taken for a given operating condition, the gas mixture in
the system was changed and the procedure was repeated. A
sample data set is provided in section IV.C.l (TABLE IV-1)
.
95

The actual electric power delivered to the driver
was determined by making a correction to the measured value
by subtracting off the measured DC offset as well as a
constant scaling factor. The constant scaling factor was
determined by replacing the driver with a known resistance
and measuring the voltage drop across that resistor. The
power delivered to the resistor was easily calculated and
could be compared with the value determined by the
electronic circuit. For low power measurements (below
0.25 W) the scaling factor was determined to be 95 percent
of the difference between the measured electric power and
electric power offset.
The acoustic power provided by the driver to the
resonator was determined by first calculating acoustic
pressure (p) and volume velocity (U) from the microphone and
accelerometer voltage levels. The phase difference between
the two signals was then corrected by +92.6° for reasons
previously discussed (electric phase shifts and
acceleration-to-velocity conversion) . Finally acoustic
power was determined by taking the product of pressure,
volume velocity, and the cosine of the corrected phase
angle.
The electroacoustic efficiency was then readily
determined from the ratio of the acoustic to corrected
electric power (n elec {corr) ) at each frequency measured in a
particular gas mixture. A plot of efficiency versus
96

frequency provided a quick indication of how well the
resonance frequencies of the driver and tube were matched.
A mathematical derivation of the electroacoustic efficiency
based on the measured parameters is provided in Figure IV-3.
To lessen the amount of time required for the
necessary computations, a program written by Susalla and
used by Fitzpatrick was modified to calculate and plot
acoustic power, electric power, and efficiency as a function
of frequency based on the measured data. These in turn
could be compared with theoretical values generated by the
program. The next sub-section discusses this program and
it's modifications in detail.
B. COMPUTER SIMULATION
1. Background
The purpose of the original program written by
Susalla was to determine the various performance
characteristics of a generic driver/resonator system by
treating it as an equivalent electric circuit driven by a
constant current source. Input to the program consisted of
sixteen operator-modifiable parameters that fully described
each sub-system. Basic principles in acoustic and
transduction theory were applied 15 to the given data set to
yield values for voltage, piston velocity, acoustic power,
and electroacoustic efficiency as functions of frequency.
97

nac= P Ucos(* + *corr)
V__ : _ V
"ac
mic ace t i \ i \—;— vr r corr y
M w M ,.m 1 c u
ne)ec
(corr) = 0.95 (IIe|ec
- IIoff)
m
r
?ea=
na c
e 1 e c
Figure IV-3. Mathematical Derivation of ElectroacousticEfficiency in terms of Measured Parameters
98

These results were then graphically depicted using a
standard plotting routine.
2. Modifications
The Susalla program suffered from a number of
deficiencies in its application to the experiment at hand.
To correct this, a number of modifications were made to the
program. To begin with, the program was altered so that
it's only outputs were frequency, electric power, acoustic
power, and electroacoustic efficiency. Secondly, provisions
were made to allow the operator to input measured data so
that actual experimentally determined values of electric
power, acoustic power, and electroacoustic efficiency could
be computed and compared graphically with theory. Finally,
the program was modified to deal with a constant voltage
source rather than constant current source since this is the
mode of excitation used in the experiments discussed in this
thesis and in the actual flight system. A copy of the
modified Susalla program is located in the APPENDIX B.
3. Program Description
Before running the program, the user must modify a
series of data statements located within the program which
define the electromechanical properties of the driver and
geometrical properties of the resonator. The parameters
defined in these statements include the mechanical
resistance (RM) , moving mass (M) , stiffness (SSUP) , and
transduction coefficient (BL) of the driver. Additionally,
99

the driver back volume (VOL) , voice coil inductance (LE)
,
coil resistance (RE) and driver piston area (A) are defined.
The parameters defining resonator shape include cross-
sectional area (S) and effective length (L) of the tube
(corresponding to one-half wavelength)
.
When the program is run it requests information
pertaining to the particular operating conditions of the
driver/resonator system. The user must then input gas
density (RHO) , sound speed (C),quality factor of the tube
(Q) , resonance frequency of the tube (FO) , and the driving
voltage (V) . With this information the desired quantities
are computed over a frequency range from one quarter to
three halves of the tube resonance and stored in a data
file. The quality factor is used to compute the absorption
coefficient (a) for the medium within the resonator based
upon the relationship that
a = u /(2Qc) (IV-1)
as discussed by Kinsler, Frey, et a_l.16 A description of
the remaining computations is provided in Figure IV-4
.
Additional details pertaining to these computations are
available in APPENDIX B.
The user is then given the option of inputting
measured data for analysis and display. If this is desired,
the program then requests a value for amplifier gain (which
100

Z. = —\p c Sl+j(o/k)
l+(Q/k) 2
cos(kL)Bin(kL) + J8inh(orL)cosh(oL)
«in 2 (kL)co«h 2 (oL)+co8 2 (kL)iinh 2 (oL)
V
Zm = Z, + (Rm + j(w m-k/u/ -k ./a/ ))m t m o ' o d' oZ i = Hi. + j w L •,
coil uc Jcoil
_^L
ZE =( B1 )
2/ Zm ->
^/
ZTOT " ZE + Zcoil
= (Ztu)/A < u = F / Z
->
^ F = Bl I <
^1
I — V / ZjQJ.
AL
n = 0.5 Reac P u n . =0.5 Re
elecV I
_vk_
<-
J^_
r] = n /n ,
'ea ac ' ele
where Z t is the mechanical impedance of the tube
Zm is the mechanical impedance of thesystem
Z coil is the voice coil electrical impedance
Z E is the transformed electrical impedanceof the mechanical system
Z tot is the total electrical impedance ofthe system
Figure IV-4. Computer Simulation Strategy
101

is assumed constant for all measurements taken) . The user
is then prompted for six measured quantities corresponding
to frequency, microphone voltage, accelerometer voltage,
phase angle, electric power, and power offset. With this
input, the program computes acoustic power, corrected
electric power, and electroacoustic efficiency for a given
frequency and stores it in a data file. The user is then
given the option to input another set of measured data. The
program continues asking for data and then storing the
outputs until the user indicates that there are no more data
to be analyzed. At this point the program ends leaving a
message to the user that two data files have been created
containing measured and theoretical data. Instructions are
also provided enabling the user to obtain graphs comparing
the two sets of data in those files.
It should be noted that the "program" as described
above actually consists of two parts, both of which are
written in Fortran-77 code. The numerical analysis part
(FRIDGE FORTRAN Al) produces the two data files. The second
part is the plotting routine (GRAFRI FORTRAN Al) which is
invoked by simply typing "DISSPLA GRAFRI" once the data
files have been created. GRAFRI FORTRAN has been programmed
to output three plots to the IBM mainframe laser printer
(SHERPA) . To actually receive hard copies of these plots
the user must type "SHERPA STAR SHGRAPH Al" after typing
"DISSPLA GRAFRI".
102

C. EXPERIMENTAL RESULTS
1. Straight Tube
As previously mentioned, the straight tube is useful
in that it can be easily modelled using basic acoustic
theory. The first experiment conducted with this resonator
was to determine the acoustic impedance of the tube in air
and compare the results with theory. This served as a
validation of the two sensitivities previously determined.
By measuring microphone and accelerometer outputs at tube
resonance and converting them to acoustic pressure and
volume velocity respectively, the acoustic impedance could
be readily ascertained based on the ratio of the two
quantities. The value obtained experimentally was
1.59xl0 7 N-s/m 5. By applying the expression for Z t shown in
Figure IV-4 , the acoustic impedance of the tube was
calculated to be 1.74xl0 7 N-s/m 5(a difference of about
8.5%) at resonance. This was acceptable agreement within
experimental error.
The next procedure was to validate the modified
Susalla program by comparing measured data with theoretical
values. The tube was pressurized with helium to
approximately three atmospheres (45 lb/in 2) and measurements
were taken over a range of frequencies that spanned the tube
resonance (475.5 Hz). The measured data is provided in
TABLE IV- 1. The quality factor of the tube was determined
to be 63.5 based on the frequency dependence of phase
103

TABLE IV-1. MEASURED DATA FROM STRAIGHT TUBE EXPERIMENT
f = 475.6 Hz T = 20.5 °C = 293.5 K
Q = 63.5 Vms = 0.26 V = 0.37 Vpeak
c = 1009 m/s p = 0.50 kg/m3
freq(Hz)
Vv mic(dBV)
vY ace
(dBV)phase(deg)
''elec
(mW)n Qff
(mW) (itlA)
375.0 -35.28 -10.51 -178.0 1.6 1.0 3.2
400.0 -32.05 -10.04 -177.4 2.1 1.2 7.6
420.0 -29.68 -9.82 -175.5 2.5 1.1 11.0
440. -25.32 -9.73 -175.0 3.2 1.2 14.1
450. -22.62 -9.76 -172.7 3.2 1.1 15.6
460. -18.73 -9. 93 -167.7 3.8 1.0 17.2
465.0 -15.93 -10. 17 -161.8 4.1 1.2 18.2
470.0 -12.14 -10.79 -147.6 4.5 1.0 18.9
472.0 -10. 36 -11.27 -135.4 4.8 1.0 18.8
474.0 -8.74 -11.78 -114.6 4.9 1.1 17.8
475.6 -8.00 -11.78 -91.31 4.6 1.0 16.1
478.0 -8.57 -10.80 -58.04 3.7 1.0 13.5
480.0 -10. 18 -10.06 -40.94 3.5 1.0 15.6
485.0 -14.54 -9.41 -22.39 3.3 0.9 15.2
495.0 -20.49 -9.33 -11.73 3.6 0.9 17.8
515.0 -27.06 -9.42 -6.35 4.4 0.9 20.3
530.0 -30.33 -9.50 -5.00 4.8 0.9 21.6
550.0 -33.71 -9.56 -3.91 5.3 0.9 22.7
104

between pressure and volume velocity in the vicinity of tube
resonance. The relationship (as given by Hofler) is
Q = (f /2) (d0/df)| f (IV-2)
o
where <p is in radians.
Using a constant source voltage of 0.2 6 V^, the
average electric power input to the driver never exceeded 5
mW during the entire experiment in order to prevent damage
to the voice coil and titanium surround of the driver. The
maximum measured electroacoustic efficiency was about 38%
and occurred when the system was driven at 478 Hz. In the
vicinity of the driver resonance (350 Hz) the efficiency was
only about one percent, indicative of a large acoustic
impedance mismatch between the driver and resonator under
those operating conditions (as expected) . In comparison the
maximum efficiency determined by the model was about 51% and
occurred at 480 Hz. Graphical comparison of measured
electric power, acoustic power, and electroacoustic
efficiency to the theoretical values showed that the model
was a reasonable approximation to reality. Measured values
appeared to follow the theoretical curves quite well, but
tended to have smaller magnitudes. The results are
graphically depicted in Figures IV-5 to IV-7
.
The final experiment conducted with the straight tube
was to measure the electroacoustic efficiency at tube
resonance for a number of different gas mixtures at one bar.
105

Figure IV-5 Predicted and Measured Electric Powerfor the Straight Tube at One Bar
106

Figure IV-6 Predicted and Measured Acoustic Powerfor the Straight Tube at One Bar
107

t>H
uqd
q0)
H 10
pc;
PhaCOto
* m
C/J
> A q.
o_— ri O0B
^ °—n n n He o e
U ~^"%q
S )
<6 *-^
SISc
u (1
in 55—
^
pen \
or
H j PS
uCO\2 o q
73 q oq
rj
Ooo—1 II
Oarj
3II
w Sa
-i
o P 3q
pc; 5P-H O wL. w X qd
W S
1
) ->
) <D 1032- 5903- 0774- 5645- 0516- 5387- 0258- 5129-
33
hJ -i £ 33
r^ * ) •* -*r>ri(\iw-H-;0(3W 1 d cicjc>c>c>ddcj(«A\J DIHJ,3ai3/yMd 3IJ,Sn03V
3
1'
Figure IV-7 Predicted and Measured ElectroacousticEfficiency for the Straight Tube at OneBar
108

Ideally, the maximum efficiency would occur when the
resonance frequencies of the driver and tube were the same.
The results are presented in Figure IV-8 . The highest
efficiency measured was 50.8% at 359.4 Hz (3% off driver
resonance) and was achieved using a helium-argon gas mixture
(with <18.85% Ar) . The lowest efficiency occurred when pure
helium was used since this created the greatest mismatch of
resonance frequencies.
With reasonable confidence in both measurement
techniques and theory, the next phase of testing for the
STAR driver involved the use of a refrigerator-type
resonator pressurized to 10 bars.
2. Refrigerator-Type Resonator
This resonator consisted of two tubes having
different diameters that were joined together with a tapered
section that smoothed the transition from larger to smaller
diameter (see Figure IV-9) . The resonator was attached to
the driver via a flanged section that was integral to the
larger tube. A cylindrical section was attached to the end
of the smaller diameter tube thereby making the resonator a
closed system. Additionally a cold heat exchanger was fixed
within the resonator at the end of the larger diameter
section (just before the tapered section) . Since the aim of
the experiment was to estimate driver performance under
simulated operating conditions, this refrigerator-type
resonator is a good facsimile of the actual STAR resonator.
109

CO
m
On
ucg
LLI
O'*-
3OUro
o
u
LU
3" "———— '-""---—- "-—--•""— • .-——«—-. .-.^.www... ——-——. ~ ™*
D
„
D. - —
NI
Oc
32"
oCD
O o oCO
oCM
OmCM
(%) Aouapuja
Figure IV-8 Electroacoustic Efficiency as aFunction of Tube Resonance forthe Straight Tube
110

m
Of
Figure IV-9 . Refrigerator-type Resonator
111

The only difficulty in using this resonator was in
determining an expression for its input mechanical impedance
(accounting for absorptive processes) . This was considered
unnecessary and beyond the scope of this thesis and
therefore it was assumed that the expression for tube
impedance given at the top of Figure IV-4 would suffice for
modelling purposes. In using this expression the resonator
cross-sectional area (S) was taken to be 1.14xl0" 3 m2
corresponding to that of the larger diameter resonator
section. The absorption coefficient was the same as
previously defined.
With the resonator mounted in place, the system was
pressurized to 10 bars with helium. Under these
conditions the maximum possible tube resonance freguency
could be achieved. The primary reason for beginning with
pure helium was that gas characteristics like sound speed
and density were readily available. 17 Knowledge of these
values for a given ambient temperature permits easy
calculation of sound speeds and densities for unknown gas
mixtures (assuming constant temperature and constant ratio
of heat capacities) from the following relationship,
gas (CHe/C gas )
2P H e (IV-3)
Additionally, measurement of the tube resonance freguency in
pure helium allows one to readily determine the effective
112

length of the resonator. Numerically this is given as
Leff = c/(2fj (IV-4)
where the effective length is equal to one half of the
wavelength. Since the computer model requires accurate
values for gas density, sound speed, and effective resonator
length in order to predict driver performance, it follows
that taking a set of measurements in a known (pure) medium
first is imperative if the simulation is to have any value.
In pure helium at 10 bars (with an ambient
temperature of 21°C) , the resonance frequency and quality
factor of the tube were determined to be 553.6 Hz and 74
respectively. Based on this information it was expected
that system efficiency would be minimal due to the
difference between driver and tube resonance. Furthermore,
it was anticipated that small changes in frequency would
constitute large changes in efficiency due to the large
quality factor. These system characteristics were verified
upon examination of the measured data. With the electric
power to the driver kept below 40 mW (constant drive voltage
of 0.25 V^J, the maximum measured electroacoustic
efficiency was about 34% at 570 Hz. Of interest is that
when the system was driven at tube resonance (only 16 Hz
below 570 Hz) the efficiency was down by a factor of two
indicative of the effects of a resonator having a large
113

quality factor. At driver resonance (350 Hz) the system
efficiency was only about 2%. The measured and modelled
performance characteristics of the system are depicted in
Figures IV-10 to IV-12. The "HE/GAS RATIO" of 1.0 in Figure
IV-12 represents a ratio of the density of helium at 10 bars
to the density of the gas mixture used in the experiment.
Though this is trivial for this first experiment it is a
convenient means of comparison when various helium-argon gas
mixtures are used later.
In all three plots the agreement with theory is
quite satisfactory especially when considering the low power
levels at which the system was driven. Note in Figure IV-10
that there are two dips and a peak in the electric power
over the given frequency range. The first dip occurs at a
frequency where the system mechanical impedance is at a
relative minimum permitting a maximum displacement of the
bellows and voice coil. The motion of the voice coil in the
permanent magnetic field of the driver results in the
generation of a large back emf. The net result is that the
electrical impedance becomes a relative maximum thus
reducing the input electric power. The small peak occurs in
the vicinity of the tube resonance. At this frequency the
mechanical impedance of the system is at a relative maximum
effectively blocking the motion of the bellows/coil. As a
result the back emf produced is at a relative minimum
114

Figure IV-10 Measured and Predicted ElectricPower for the Refrigerator-likeResonator in 10 Bar Helium
115

ooCM00
>H OOSu R
iz;
hi oCO
5 / CO
o* Jhi —©
o ~•*
—-— n
^ o
c/3 \K**
\ OPP4 \
°gF*l
^ I ^i
—
05 £OOh
(
o
U CD
3k-H cj
H(/J
•
o
CO
Oo o
<! CO
o
D
63
1 1 1 1 1 1 1 1 1
t- mcgo>con-l coinN<imcDor3G3S-'?^C-3r 3r- ccc7>-<rjn'*<0 f,
:a>o
a>-; -*aJ-<-*£;c><2<dbaJcon^^rj^cvj-1
,-01r. (a\)u;ja\oj Dixsno:)V
i
Figure IV-11 Measured and Predicted AcousticPower for the Refrigerator-likeResonator in 10 Bar Helium
116

S>H
uqdOS
BO* q
00wtfPh q
a CD
C/2
>o
o
>-Q n
<n
U "^\o
iz. ft O) EN
w C
5l~H ou 6*h-H " WPlH O1
(inW ^ F"8
uHH OT
EH or—
,
Q(0
CO o qc\j
o o—
<
II
oo*CD
sII
-Jw>>
-*
oPC,
no<vcc
E-1 o Wo tn a q
. di i i i i i i i iCDCUCOO-*CCtVCOC3
i •* ro-«o)oo«Di»'nwc3
^1 l
i a
in
3333
' d °o ci c;d ooe3
ua\j oiuxoaia/UMd oixsnoov
i1'
Figure IV-12 Measured and Predicted ElectroacousticEfficiency for the Refrigerator-likeResonator in 10 Bar Helium
117

meaning that more current can flow to the driver thus
increasing the input electric power.
Turning one's attention to Figure IV-11 it is
apparent that maximum acoustic power occurs at the tube
resonance frequency and decreases as the system is driven
off resonance. This makes sense since maximum dissipation
of energy in the tube occurs at its resonance frequency.
By combining the results shown in Figures IV-10 and IV-11
the electroacoustic efficiency is nothing more than the
ratio of the two individual power measurements. Note in
Figure IV-12 that the ratio of acoustic to electric powers
yields not one but two efficiency peaks over the frequency
range. One is due to a minimum electric power while the
other is due to a maximum acoustic power.
For the next set of measurements, the system was
partially vented and then repressurized to 10 bars with a
helium-argon gas mixture. The effect of this "doping" was
to decrease the speed of sound in the acoustic medium in
order to decrease the resonance frequency of the tube. This
was done in an attempt to better match the tube and driver
resonances in order to improve overall system performance
and because this simulates the actual refrigerator
operation. The doping resulted in a new tube resonance
frequency of 511.6 Hz and quality factor of 77. At
resonance the electroacoustic efficiency was about 16%, less
than half the 36% measured at 520 Hz. Again the effects of
118

the large quality factor are observed. Figure IV-13
compares the measured efficiency with that modelled and
again there is good agreement between the two. Notice how
the smaller efficiency peak has increased somewhat in
magnitude under the new operating conditions.
The system was doped with the helium-argon gas
mixture four more times and resulted in the measured values
shown in Figures IV-14 to IV-17. The modelled efficiencies
become more and more dissimilar to those measured as the
driver and tube resonances approach each other. At the same
time the overall system efficiency decreases. As the two
efficiency peaks change in magnitude it appears that what
one loses the other gains. Driver and tube resonances are
nearly matched when the peaks are roughly equal in
magnitude. The only redeeming quality of this feature is
that instead of having a sharp peak, the efficiency is
almost flat over a broader frequency range. This is highly
desirable for the STAR so that frequency fluctuations due to
temperature changes will not impose any major limitations.
Ideally with the STAR however, one would expect efficiencies
in this flat region to be significantly better than the 10
to 15 percent measured under the above operating conditions.
A final set of measurements was taken after purging
the system and refilling it to 10 bars with the helium-argon
gas used previously to dope the system. This particular gas
mixture consisted of 18.85% argon and resulted in the lowest
119

>H
u&g
od(0
o 1 o
w COto
p£Tin
oCDoCO
CO /
>o
oN
S>H.. o in
u ^t*b
\ o
jz;cry CD -—
>
m tSJ
W o|
ojM n /o /03 W
of°'\ or
uk-H oEH ^ CM CO
CDCO
CO
O 05
oII
Oorj
<̂$
II
w>p5
Pi
o01
in<
oid
Uo Hc/j W a
. d1 i i i i i 1 i i V
£ (oeoci-^n-^asmor. 1 -
J CD ^-cJocnt^^n'Ho< W n^inintot^cDOJo
\- -i o1 <"> h."i«o)ej»5»HiooW ;5 m '*'"'!«NCJ*1«HOoj o doddd°ddd
UMd DIUJ,Daifj/UMd D!.i,sno:)v
1 1?
Figure IV-13 Measured and Predicted ElectroacousticEfficiency for the Refrigerator-likeResonator (f =511.6 Hz)
120

>*u
!3
o6
"IOco
a
w CD
K&H
adCM
CO/ o
to
> e-qd
>-. o_ •*
u o
o1
o /
° 1
d ^-v
M o Iu q L)d Z
HH o \ £ wGh o\ O1
Pn o«H1
ID l"1-!
N
UHGO C\l
CD
Od
P rio
doO CO
II
O d
3II
w>
5-H
o QP
dCD
EHUO
q
3 f-
i i i i i i i
^ —< CO CO OJ O CD1
31 — O OS t- CD IO D C\J «H (3
ri J
-< CO —i in o m o m o « (D
I 9 CD CD N c^ CO CO O)o •* °> 3 a> * o)ri c-> c\» N -h -< o
3 'J c
D
w c
1- < 9 <33 6 d CD d o o d o o
13
umj oiuioaia/uMd ousnoDv
1
Figure IV-14. Measured and Predicted ElectroacousticEfficiency for the Refrigerator-likeResonator (f =436.5 Hz)
121

>H
uqdto
E>O 1 odH
KPh
od
COy o
*
> oa
.— " o
o " n>H ——2__
>*
u o\ o
^ o
W oo s
HH o Ko o °\ o O
d 2;H=H ON.
~m WPmPn •
**>
wH • Pi
ON=H
CO5M/S
.569
d03
EDO
764.!
0= o
SOUND
VEL=
HE/GAS
RATI
o
U
o
o* a
1 VID OjaM<D0)r)CD0)o (0 o
kJ" PJ o* o
1 Tca> ir) o(Dt'jKc-)(r) <* ow s
, r> n r5 rjW'-<^o O o)d°6ododo d d
UMd oiHioaia/HMd oiisnoov
ii
Figure IV-15 Measured and Predicted ElectroacousticEfficiency for the Refrigerator-likeResonator (f =415.4 Hz)
122

t>H
uodCO
O* o
w CM"CMin
Kfo o
^-^ ° - CO
GO—-"^ oo
^*
> oo
ood
>-' — °
O °\ q^ O |
o 1
co Oo V
o \^o ^~-
ro X
o o^~\^6%
t=H a WPEH
CM pOf
&H wW ° ex
CM rj.
CJCM
HH
COoin
o•i
OCOCJ
dII
ood
II
o oPO
COo
- d
CJ)o
i di
3 —9 CO
1 1 1 1 1 1 1
cm co <*• m id r~ oor- »-i m en co r» -I
1 '
CD (
IT) C
33
3 CD o co m p. o cm m f» (DO * t- O CO r- O CO CO (35—^ b3 CO cd in cm co *f -* t-* CO 3H J
3 co rj pj m -;-;-; o o ,-
3 d d d d cJ ci o d <=> «3
HA\d DIHXOaia/UMd DLLSnODV
1 1'
Figure IV-16. Measured and Predicted ElectroacousticEfficiency for the Refrigerator-likeResonator (f =393.1 Hz)
123

>Hu^K
od
"CDn
G' a
H ~0
KpL| ^r o
oCO
^-"^ o •*
GO Oo
> oo——-— °
qN"CD
>-* — °
CO
U o ) o
fr° (
^-^^.^CO -—
,
-n N
a ba Z
h-H S w
T̂Jh ° rvw ct^CO
uH=H r/i o
GO
<
in
CDCO
CDCO
n0)CD
dII
oC3
N11
W> 'o Q < CO
m
UO wW X o
> oi
3 cji i i i i i i
* CO 00 O N * <01
00 (33 co + e\j o O) r- «o co —
• <D
hJ [
-1 TT r- o co in co -h -*- r- c3(O Q m -y fo w N —
<
o <D3 r~ ^- —t co in w 0) cd co c_->W J
o rj N C\J -I -H -} O O o 53 C3 o d d d o o d o t6
ua\j oiuioaia/UMd ousnoov
n
Figure IV-17. Measured and Predicted ElectroacousticEfficiency for the Refrigerator-likeResonator (f =377.1 Hz)
124

measured tube resonance (335.3 Hz). The resulting measured
and predicted electroacoustic efficiencies are depicted in
Figure IV-18. Again there are discrepancies between
measured and theoretical values. A maximum measured
efficiency of 30% was measured at 310 Hz however this
dropped off rapidly to 11% at the tube resonance.
The results of the above measurements are summarized
in TABLE IV-2 . In particular, the tube resonance frequency
and quality factors are recorded along with the electro-
acoustic efficiency at resonance. Also included in the
table are the peak efficiencies (eff peak:and eff peak 2 )
and the corresponding frequencies at which they occurred (fx
and f2 respectively) . Inspection of these data shows that,
unlike the results of the straight tube, maximum efficiency
did not occur when the driver and tube resonances were most
closely matched. The results of the above experiment were
rather disappointing in that maximum measured efficiencies
were not very high and that a number of unexplained
discrepancies between measurements and theory existed. It
is unclear at this time why many of the predicted
efficiencies differed from those measured in the vicinity of
the peaks. Possibly the model is severely degraded by high
Q resonators or perhaps the assumption pertaining to the
modelled resonator impedance is invalid.
Whatever the case, the next experiment to be
conducted was to install a prototype stack and a crude hot
125

!>H
u&H
qdom
b*ad
w 5
Ph[J-.
c
o
odo
,*
r/2
> \^ o\\ o
) °
qdin
>-o
.
——- o
n
o © "
q:-, o d ^^o t>5
m "K
U *^x d 2;1—-1 \ S wTt, \
ClH 1 °£w 6 uL
UI
1t-- 1
H(/J o
C-.
CO
od
& doo CO
II
o dou II 1
<1 1
>o n5
t/3 d
ooCO
pqK o
, do o>
i i i i i i i
co r- <o m •+ n oji VH O
c\j co ^t- tn co c~ co o> oJm0) -I re m f- o —i n in £ o
as r> 5 re o> -f 0)O) C- * CM O) K •*-i *i "j -j o 9 o
o d d o ° d a ° o ° d
umj DiiiJDa'iaAiMd oi.rsnoov
I1
1
Figure IV-18. Measured and Predicted ElectroacousticEfficiency for the Refrigerator-likeResonator in 10 Bar He-Ar (18.85% Ar)
126
TABLE IV-2. SUMMARY OF MEASUREMENTS FORREFRIGERATOR-TYPE RESONATOR
gosro t 1 o
Qt
F ( Hz )
eFF{ '/. ) ( Hz )
eFFpeok
F2
( Hz )
eFFpeak
1 .000 74 .4 553.6 17.1 370 2.9 570 34 .4
862 77.6 511.6 16 3 370 3.9 520 36.2
0.627 79. 4 436.5 13.6 360 7.7 460 37 1
0.569 75 9 4 15 4 13 8 360 119 440 27 4
509 74 . 9 393. 1 12 9 340 16 1 420 20. 3
469 ?A .6 377. 1 12. 4 340 19 7 400 14.6
371 83. 3 335.3 1 ! 310 30
heat exchanger into the refrigerator-type resonator. It was
felt that this particular configuration would best represent
the actual STAR resonator and would therefore serve to
provide the most realistic driver performance data.
3. Refrigerator-Type Resonator with Stack
There was a keen interest to see what effects would
occur if an actual thermoacoustic stack was installed into
the resonator of the previous section, since this would
actually simulate the refrigerator. It was expected that
when configured in this manner, the quality factor of the
resonator would be much lower due to greater losses and thus
the acoustic load impedance would be much lower. The
127
electroacoustic efficiency is expected to depend on the
magnitude of the acoustic load impedance. By lowering the
quality factor the system performance would be less
sensitive to variations in frequency, especially when driver
and tube resonances coincide.
The experimental procedures of the previous section
were repeated beginning with a set of measurements in pure
helium at 10 bars. The input electric power was again kept
below 5mW for the same reasons as previously described. The
quality factor of the resonator was reduced to 11 by adding
the stack and heat exchanger. Figure IV-19 shows the
measured and theoretical values of the electroacoustic
efficiency over a frequency range spanning the tube
resonance of 557.6 Hz. It is interesting to note the
difference between these pure helium measurements and those
of the last section (Figure IV-12) . In Figure IV-19 there
are clearly two distinct efficiency peaks neither of which
is as sharp as the the one shown in Figure IV-12.
Additionally the relative difference between peak
efficiencies is much less with the low Q resonator.
Although the maximum measured efficiency was higher when the
resonator was not configured with a stack, analysis of
system performance measured over the given frequency range
shows that higher efficiencies exist off resonance.
Finally, as in Figure IV-11, the predicted efficiencies show
reasonably good agreement with those measured.
128

Figure IV-19. Measured and Predicted ElectroacousticEfficiency for the Resonator with Stackin 10 Bar Helium
129

The system was doped with a helium-argon gas mixture
(18.85% Ar) lowering the tube resonance freguency to 493.1
Hz. After taking a set of measurements this procedure was
repeated three more times. Finally the system was purged
and re-pressurized to 10 bars with the 18.85% Ar gas mixture
for one last data set. At this point the resonance
freguency of the tube was down to 341.5 Hz. The performance
of the system for each of the different gas mixtures is
depicted in Figures IV-20 to IV-24. The effect of adding
the stack, thereby lowering the Q, is very apparent. The
first noticeable feature in every figure is how well the
predicted values agree with those measured. Another
noticeable feature is that as the tube and driver resonances
approach each other the two efficiency peaks slowly combine
to form a broad plateau. The best example of this is
depicted in Figure IV-23 where a minimum electroacoustic
efficiency of 40% occurs over a 100 Hz band of freguencies.
The resonance freguency in this particular case was 366.3 Hz
(less than 5% off the experimentally-determined driver
freguency of 350 Hz) . The effect of matching resonances is
graphically-depicted in Figure IV-25 where efficiency is
plotted as a function of the tube resonance freguency. A
broad region of moderately high efficiencies is observed to
occur in the vicinity where the driver and tube resonances
are close. These results are most satisfactory and are
130

>H
uqd
~C3
o
H co
«fe o
«CO
t/2
> qO - ^
>H<r>
u qJZj 0S
03 ^"v
uo/
/^H=H O z' -co WPH ^-^OPh ~~~~~-^-Ci c"H ^^\o -siE
U \H-H \ o
C/3
C/3\CO
o \
°? 1
£> od
oo CDII
1o id
3II
>QD
oPS
od
Oq
. d1
3 CDi > i i i i i iCO^t'NOeOCO-d'NC3
33 r> ocD^nor^mrjc31 o3 m 3
3w •3 q nNN«H«**tOgjJ3
3 d dddcic> d c; c3
UMd DIU.L3aia/UMd ousnoav
1 1'
Figure IV-20 Measured and Predicted ElectroacousticEfficiency for the Resonator with Stack(f = 493.1 Hz)
131

>H
uS5
o6ID
5o*
o
w in
KPm q
n
CO> ^_sx.
o
i>H—-——°——0_^ *
u ^~~—-2^ q
^ <0 .-—
*
"S tsi
m / ° Ph
—h / o o5u 6 Z=H o "~~-^-~^^ S wEnPh ° r3W
\° CJ
uN—
I
o
CO
co
CD
a" 0)
;- ri
coo CD
II
O re
<II
w %X
o Qp
CO<
ototo
CJTil 5
OCO X q
di
3 <J3
1 1 1 1 1 1 1 1
3f a r> t~ w r* —< < o in (3J 3
a> *a:mt^(\!<o-*in<3-><oo;f,o.r>oiO| 33w :
* •no^cj-i — qi 3s 6 odd°obdd,6
UA\d 3iuj,oaia/HMd Diisnoov
Figure IV-21 Measured and Predicted ElectroacousticEfficiency for the Resonator with Stack(f = 441.8 Hz)
132

>H
u odo(0
£>o*
o
w tom
a(Jh
o" o
c/i
> o"~~~o - •*
^ o~ —-
Q)-——-~_ o
+
u ^~^-~^ o
:z; »o 03 s—v
/ °o \^^_^
X
L)o U
t=H m M-t
&HPh o Hw in mh
uHH OH wf"-
1
CO
GO 2 in"•
oCO
dII
ooto0J
II
>Q[5
cr;
o CO<:
o
10
HUo wCA> X
. di
5 -"1 1 I 1 1 1 1 1
31 -2 romt^cn—iniot^<3
~1 s
•^ o co to ro >n —< r^ n <35 OD5 a mtN(V)qO«HCOOlft| 3
M l
> * Di 6 odcJoOooo,3
MA\d oiiuaaia/UAVd oiisnoov
Figure IV-22 Measured and Predicted ElectroacousticEfficiency for the Resonator with Stack(f = 421.8 Hz)
133

>-u!z; o
d*
&Q" o
W toIS
Hh^ o
t/i
T)
> Oo O
o OS
>- ^ ^Ou / o a
£ N NO _____^
u o*M ° Wr^ \ N p
or|Jh wW ° a
2 ^
u rj
' •
['
CO CM
COOrj(0
o CO
dII
O su II H -t
<!1—
1
<
o oo*in
G od
1
3 P3
1 1 1 1 1 1 1 1n-'OmtD'Oo-'Ori i
—< —'
-h O O O o ° O
W c
} in
: 6
UA\d 3ia.L33ia/MMd DI.LSflODV
Figure IV-23 Measured and Predicted ElectroacousticEfficiency for the Resonator with Stack(f = 366.3 Hz)
134

t>H
Uag
qdm
Q 1 q0)
w SottPh
osio
go ^ ' o
o\ o
o
\ o„ m
>- ) „o*°n
U o o
:z;
wKH P-1
u o Uin ^M S w
rn \ 0*ptH \ °£wCJ
CO^ q
ri
24
CD in
£> CDc\)
Oqo CO II
O oII
.-!
Ws.
S#
o QD
C/3qin
E- 1 O Wc/) W o
di
) (Vi i i i i i i i
3) -H ^t^O'i't^oncDc3
"1 a ' ~ mO)-*CDMt^-ilOC3I "H -«*qr}C\JCJ—<-ho c3
w i <=> doooooooc3
UA\d DIUXOaia/HMd OLLSflOOV
1'
Figure IV-24
.
Measured and Predicted ElectroacousticEfficiency for the Resonator with Stackin 10 Bar He-Ar (18.85% Ar)
135

oT—
I
oaV>
c\i
n**
Ocoo£LU
ou03
o**o
LU
E
D
NX
uCft.
38"
oin
o-3-
OCO
oCO
ooco
(%) Aouspuja
Figure IV-25. Electroacoustic Efficiency as a Functionof the Tube Resonance Frequency
136

representative of the desired electroacoustic
characteristics of the STAR.
Compared to the system without a stack, the results
of this section are most reassuring and have been summarized
in TABLE IV-3. Modelled efficiencies were surprisingly good
TABLE IV-3. SUMMARY OF MEASUREMENTS FOR REFRIGERATOR-TYPE RESONATOR WITH STACK
gos
ratio tF ( Hz )
eFF( '/. )
F1
( Hz )peok
f2
( Hz )
eFFpeok
1 000 11.0 557.6 25.6 360 ! 1 7 570 29.8
804 115 493 1 3) 4 360 27.9 510 40. 3
644 1 1 4 441.8 40 1 360 20.6 460 50.0
587 1 1 421 3 40 5 340 32 440 52 4
443 11.4 366 3 40 6 320 47 6 400 50 3
0. 384 1 1 5 341 5 37 9 300 49.2 375 42 3
especially considering the low power levels used to drive
the system. It would appear that the poor results of the
last section were due to the effects of the high Q resonator
as speculated.
137

4. Power Measurements
The use of low power levels to drive the system was
sufficient for the electroacoustic measurements above.
However, in order to achieve the desired pressure levels
within the resonator for refrigeration, the system has to be
driven at higher powers. The amount of power used to drive
the system is limited by the performance characteristics of
the voice coil/reducer cone/bellows assembly. The voice
coil can only handle a limited amount of current (1-2 Aras )
before becoming permanently damaged by self-heating.
Additionally, the total displacement of the assembly has a
limit before the titanium component breaks up. Although
this limit is unknown, it is desired that the bellows peak
displacement be at least 0.010 inches in order to produce
the required pressure amplitudes within the resonator.
Determination of the peak bellows displacement (ax) is
achieved by measuring the accelerometer output and applying
the following relationship,
ax = (7i V acc )/( W2 Macc )
(IV-5)
where Macc is the accelerometer sensitivity in volts-s 2/^ and
Vacc is the rms accelerometer output voltage. To better
characterize the performance of the driver under actual
operating conditions, a series of experiments were conducted
using progressively higher input power. The experimental
138

setup was the same as before except that for the present set
of measurements the frequency was held constant as electric
power was increased. Additionally, a multimeter was used to
monitor the voice coil resistance to ensure that it was not
overheating. In all cases, driving current was kept below
1-0 A^
For the first experiment, the refrigerator-type
resonator (without stack) was mounted to the driver/housing
and the system was pressurized to 10 bars with helium. The
system was then driven at a 540 Hz (below tube resonance)
with less than 10 mW and measurements were taken to yield
values for driving current, electric power, acoustic power,
and peak bellows displacement. The input power was
increased and another set of measurements was taken. The
procedure continued as long as the driving current remained
below 1.0 Arm£ and there was no noticeable distortion in the
accelerometer output signal. For this first experiment a
maximum bellows displacement of 3.2 mil (peak) was achieved
when an average input power of 6.8 W was supplied to the
driver. Attempting to drive the system at higher powers
resulted in a distorted accelerometer signal. It is
believed that this distortion was due to the amplifier and
not the driver. Plots of acoustic versus electric power and
bellows displacement versus driving current were generated
with these data and are shown in Figure IV-26. The slope of
the first graph represents the electroacoustic efficiency
139

Power Measurement (540 Hz)
E
IoQ.
2000 4000 6000
electric power (mW)
8000
c
E
u
CL
o
sooJ3
Power Measurements (540 Hz)
200 400 600
current (mA rms)
800 1000
Figure IV-26 Power measurements without stackat 540 Hz in 10 bar Heliuma. power ratiob. displacement/current ratio
140

and is equal to 7.8%. The linearity of the curve indicates
that the efficiency is independent of the input power. The
slope of the second graph is also constant indicating that a
linear relationship exists between the bellows displacement
and driving current.
The above procedure was repeated again at 570 Hz
(above resonance) and at 560 Hz (in the vicinity of tube
resonance) . The results are graphically depicted in Figures
IV-27 and IV-28. With the exception of the displacement
versus current plot at 560 Hz, all the curves are linear
over the power range observed. It is interesting to note
that although a best fit can be made to the 560 Hz
displacement/current data, it appears that the curve tends
to decrease in slope with increasing current. At 560 Hz the
maximum bellows displacement was 6.0 mil (peak) resulting
from an input electric power of 4 . 8W to the driver. By
comparison a 7.5 mil (peak) displacement was measured at
570 Hz with only 3.5 W input to the driver.
For the next set of measurements the resonator was
configured with a stack and heat exchanger. Once again the
system was pressurized with helium to 10 bars. The first
data set was taken below tube resonance at 520 Hz followed
by a second set at 600 Hz (above resonance) . The maximum
bellows displacement measured in both cases was about 5 mil
achieved by driving the system with approximately 5 W. The
results are shown in Figures IV-29 and IV-30 and again
141

Power Measurements (560 Hz)
3000
S 2000 -
!Q-
n
O1000
1000 2000 3000 4000electric power (mW)
5000
c0>
Eoora
Q-wD(0
o"5
XI
Power Measurements (560 Hz)
6 -i 5—
o
100 200 300 400
current (mA rms)
500
Figure IV-27. Power measurements without stackat 560 Hz in 10 bar Heliuma. power ratiob. displacement/current ratio
142

Power Measurements (570 Hz)
1000
IoQ.
1000 2000 3000electric power (mW)
4000
c0)
E0)
ora
av>
-a
m
o"53
^3
Power Measurements (570 Hz)
100 200 300
current (mA rms)
400 500
Figure IV-28 Power measurements without stackat 570 Hz in 10 bar Heliuma. power ratiob. displacement/current ratio
143

Power Measurements with Stack (520Hz)
500
E
03
oQ.
~\ ' r
1000 2000 3000 4000electric power (mW)
5000
Power Measurements with Stack (520Hz)
c0)
E8J
UmQ
CO
5o«jX3
200 400 600
current (mA rms)
800
Figure IV-29 Power measurements with stackat 520 Hz in 10 bar Heliuma. power ratiob. displacement/current ratio
144

Power Measurements with Stack (600Hz)
oQ.
OOT
Oo(0
800
600
400
200 -
1000 2000 3000 4000
electric power (mW)
5000 6000
Power Measurements with Stack (600Hz)
c9)
E<u
oro
O-
TJ
(0
JO
"53
400 600
current (mA rms)
800
Figure IV-30 Power measurements with stackat 600 Hz in 10 bar Heliuma. power ratiob. displacement/current ratio
145

demonstrate the desired characteristic of linearity between
the respective measured quantities.
All the power measurement results (with and without
stack) are summarized in TABLE IV-4 . In this format a
number of observations can be made regarding the system
performance under high power operating conditions. First
and foremost is that the driver is capable of handling the
input electric power to produce the required bellows
displacement. Finally, there is good consistency in the
measured data over a broad frequency range for the resonator
with stack configuration. Unfortunately, power measurements
were not taken near resonance for the stack configuration.
In an attempt at estimating the maximum electric power that
could be delivered to the driver under the above operating
conditions, one must make the following assumptions: that
there is a linear relationship between bellows displacement
and input current, and that the maximum electric power
delivered to the driver is limited by either a peak bellows
displacement of 10 mils or a maximum input current of
1.5 Arrs . Extrapolation of the data used to generate Figure
IV-19 (resonator with stack in 10 Bar helium) indicates that
the system will be displacement limited at 10 mil peak, to a
maximum input electric power of about 26 Watts producing an
output acoustic power of approximately 7 Watts (where
f =557.6 Hz, V^S^mV^, Vacc=2.37 mV^ , 1 = 19.1 mA^
,
M^^Sl.lxlO" 6 V/Pa, n ac=1.19 mW, and n elec=4.65 mW) . At this
146

acoustic power level the corresponding acoustic pressure
would be about 0.07 bar peak.
TABLE IV-4. SUMMARY OF POWER MEASUREMENTS
sys L em
coriT I gumL 1 on
Treq
(Mr. 1
irelec
I V 1
A x
(millef r
( 7. )
•3 1 opeo
1 7 )
s 1 ope
,
(mil /mA I
10 BAR HE
vi it lour S1ACK
5-10 6.8 3.2 7 8 7 8 0.0038
560 A 8 6.0 48.0 44 . 7 0.0130
570 3.5 7.5 23 23 0.0154
10 BAR IE
Villi SIALK
520 A .8 5 2 9 7 9.7 0076
600 5 3 5 5 1 1 7 117 0078
Note that the actual value for Bl/k based on the measureddata is approximately 0.0088"/Arms
147

V. CONCLUSIONS AND RECOMMENDATIONS
The objective of the STAR project is to test and space
qualify a continuous cycle cryogenic refrigeration system
for the cooling of sensors and electronics based upon the
thermoacoustic heat pumping effect. This thesis deals with
the design, assembly, and calibration of the electrodynamic
driver subsystem and its associated performance monitoring
and control instrumentation. Accurate measurement of all
driver parameters (stiffness, moving mass, transduction
coefficient, and mechanical resistance) were obtained for
use in a computer simulation of the driver's performance.
Attachment of a test resonator to the driver allowed
measurement of the electroacoustical efficiencies under
different operating conditions. Comparison of measured and
predicted efficiencies was graphically obtained and shown to
be in good agreement, with the highest efficiencies occuring
when the resonance frequencies of the driver and resonator
were closely matched. For a Helium-Argon doped resonator,
using a Los Alamos National Laboratory stack, a maximum
electroacoustic efficiency of 50% was obtained. More
important however, was that only a 10% decrease in
efficiency was seen when the resonator and driver resonance
frequencies were mismatched by as much as ± 14%.
148

A flight resonator has been designed for use in the
STAR and construction techniques were tested. Due to the
nature of the working gas of the system it was found that a
layer of metal was necessary in the FRP neck to prevent
diffusion of the helium through the epoxy. The task for the
next group of students will be to construct and test the
actual flight resonator and to repeat the series of
measurements conducted in this thesis for the flight system.
Their measurements will also allow for the first
determination of the STAR'S overall thermoelectric
efficiency.
As discussed in Chapter II, the best design of the
STAR driver would incorporate a custom built driver capable
of transferring the motion of the voice coil to the bellows
with a smaller, less massive, more rigid reducer cone.
Theoretically, this should increase the system's overall
efficiency and reliablity, investigation into this area is
recommended as a follow-on project. Another area to be
investigated is the relationship between the modelled
resonator impedance used in the computer simulation and the
actual test resonator. The simulation program models the
resonator as a 1/2 wavelength tube of constant diameter and
thus ignores losses due to the changes in the actual
resonator's configuration. Based on the correlation between
experimental and measured values of electroacoustic
efficiency it is believed that this factor is minor. However
149

a better modelling of the resonator to include these changes
in cross-sectional area might help to bring the two sets of
values into even closer agreement.
150

APPENDIX A. CAPILLARY FLOW MEASUREMENTS
A critical requirement to ensure that the housing
microphone does not get damaged due to excessive pressure
changes within the housing, is to provide a capillary leak
through the microphone back plate. This is achieved by
inserting a length of 3 mil diameter copper wire into a
slightly shorter piece of 4 mil bore copper-nickel tubing.
The actual length of tubing to be used is dependent on the
flow resistance of gas through the tiny capillary and the
requirement that induced phase errors are kept to a minimum
Flow between concentric cylinders 12 is given by,
ucyl
= .!_^8r? 1
b4_ a4_ (b2- a
2)
2
ln( b/a)(A-l)
where r? is the shear viscosity of the working medium, AP is
the pressure difference between the ends which are separated
by a distance, 1, a is the outer diameter of the wire, b is
the inner diameter of the tube, and U cyl is the volumetric
velocity (m3/s) of the flow. When the ratio of b to a
approaches unity, the flow between concentric cylinders can
be approximated with a similar expression describing flow
between plates. This is given as,
u = h3 wAP
plate( A_ 2
)
12 r? 1
151

where h=(b-a) and w=7r(a+b). This in turn leads to the
following expression for flow resistance,
AP_ 12nlR~Tr=—f ( a~ 3 )
wh
The capillary and microphone back volume act as a low
pass filter having a related time constant which can be
derived from the adiabatic gas law as follows,
5£__I^ _> JL8P__JL8v__JLu (a-4)
where 6P is the pressure variation inside the microphone
back volume. Using equation A-3, and the assumption of
harmonic time dependance (6/6t => ju>) one obtains,
J0)5P=--J^-AP (A-5)RV
At the -3 dB point for this acoustic filter there exists an
angular frequency (w=u> ) where <5P=AP. In this instance
equation A-5 becomes,
co = TPo
RV (A-6)
where V is the volume of the microphone cavity, 7 is ratio
of specific heat, P c is the pressure within the cavity, and
the exponential relaxation time, t, is defined to be l/to .
152

If the operating frequency is w = 27r(300 Hz) then wt > 100
in order that unwanted phase errors be kept below 0.5°.
Setting u>t = 200 yields a time constant of 0.11 seconds.
The required flow resistance is then found to be 4.6xl0 6
gm/cm (,-sec (for helium at 10 atmospheres) by substituting
into equation A-6 as follows,
R=?P o T = (5/3)(1.0*10 7 dyn t ./cm 2
) ,n „^ (ft_?)
V (0.4 cm 3)o v
By substituting appropriate values into equation A-l a
maximum resistance per length (R/l) of 41xl0 6 gm/cm 5-sec is
determined if the wire is concentric to the tube axis (as
shown in Figure la) . Based on the value of R derived in
equation A-7 , the capillary is required to have a minimum
length of 1.2 mm.
The actual flow resistance per length for the capillary
was experimentally determined by measuring the time taken
for a given volume of helium (77 = 196xl0" 6 poise at 20°C) at
a certain constant pressure to flow through the capillary.
The experiment was conducted a number of times using
different lengths of copper-nickel tubing/copper wire. The
net result was an average value for R/l of 6.3xl0 6 gm/cm 5 -
sec. Since this is smaller than the maximum value stated
above, a one centimeter length of tubing was used to achieve
a desirable leak rate. There are two possible causes for
the discrepancy between the experimental and theoretical
153

values for R/l. The first is due to the fact that the
actual dimensions of the wire and tubing are only known to
within about 10%. A second source of error could be due to
the positioning of the copper wire within the tubing.
Rather than having the perfectly centered concentric
cylinder case, the inner wire was most likely pressed
against the inner wall of the tubing (as depicted in Figure
A-lb) . In this case the flow resistance is approximated by
eguation A-3 with h=2(b-a) and w=7rb. For these conditions
(which are closer to reality, but less precise
theoretically) R/l is approximately egual to 9xl0 6 gm/cm 5-s.
~7£~
-rr b
3L
*\ k-
h-21 b-o
Figure A-l. Possible Wire/Tubing Configurationsa. Concentric b. Eccentric
154

APPENDIX B. COMPUTER SIMULATION PROGRAM
C
C PROGRAM: FRIDGE FORTRANC MODIFIED BY CAPT. D. HARRIS (CF) 11 JUNE 1989
C
C THIS IS A MODIFIED VERSION OF A PROGRAM WRITTEN BY LT . MICHAELC SUSALLA THAT WAS USED BY LT. MICHELE FITZPATRICK IN HER THESIS.C THE PURPOSE OF THE PROGRAM IS TO DETERMINE VARIOUS PERFORMANCEC CHARACTERISTICS OF A GENERIC DRIVER/RESONATOR SYSTEM BY TREATINGC IT AS AN EQUIVALENT ELECTRIC CIRCUIT DRIVEN BY A CONSTANT VOLTAGEC SOURCE.C
C BEFORE RUNNING THE PROGRAM, THE USER MUST MODIFY A SERIES OF DATAC STATEMENTS WITHIN THE PROGRAM WHICH DEFINE THE ELECTROMECHANICALC PROPERTIES OF THE DRIVER AND THE GEOMETRIC PROPERTIES OF THEC RESONATOR. ONCE THE PROGRAM IS INITIATED, THE USER IS REQUESTEDC TO DEFINE SOME ADDITIONAL PARAMETERS WHICH DESCRIBE THE OPERATINGC CONDITIONS FOR A GIVEN EXPERIMENT.C
C THE PROGRAM THEN COMPUTES VALUES FOR ELECTRIC POWERC DELIVERED TO THE SYSTEM, ACOUSTIC POWER PRODUCED, AND THE ELECTRO
-
C ACOUSTIC EFFICIENCY OF THE DRIVER, ALL AS FUNCTIONS OF FREQUENCYC (RANGING FROM 1/4 TO 3/2 THE RESONANCE FREQUENCY OF THE RESONATOR)
.
C THESE VALUES ARE THEN OUTPUT TO A DATA FILE ("FRIDGE OUTPUT") FORC LATER USE BY THE PLOTTING PROGRAM "GRAFRI FORTRAN".C
C THE USER IS THEN GIVEN THE OPTION OF INPUTTING MEASURED DATAC FOR ANALYSIS AND COMPARISON TO THEORY. VALUES FOR ELECTRICC POWER, ACOUSTIC POWER, AND ELECTROACOUSTIC EFFICIENCY ARE DETERMINEDC AND OUTPUT TO A DATA FILE CALLED "EFF OUTPUT". THIS DATA CAN THENC BE RETRIEVED BY "GRAFRI FORTRAN" AND PLOTTED WITH THE THEORETICALC VALUES DETERMINED ABOVE AS A MEANS OF VISUAL COMPARISON.C
C THE FOLLOWING IS A LIST OF ALL VARIABLES USED IN THIS PROGRAM:C
C RM - MECHANICAL RESISTANCE OF THE DRIVER'S MOVING MASS (KG/S)C M - DRIVER MOVING MASS (KG)C SSUP - MECHANICAL STIFFNESS OF THE DRIVER (N/M)C S - CROSS -SECTIONAL AREA OF THE RESONATOR (M**2)C BL - DRIVER TRANSDUCTION COEFFICIENT (T.M)C A - EFFECTIVE PISTON AREA OF THE DRIVER (BELLOWS) (M**2)C VOL - DRIVER BACK VOLUME (M**3)C LE - VOICE COIL INDUCTANCE (HENRY)C RE - VOICE COIL RESISTANCE (OHM)C RHOHE - DENSITY OF HELIUM AT A GIVEN TEMP. AND PRESS. (KG/M**3)
155

L - EFFECTIVE RESONATOR LENGTH (HALF WAVELENGTH) (M)
RHO - DENSITY OF MEDIUM USED IN EXPERIMENT (KG/M**3)C - SPEED OF SOUND IN MEDIUM (M/S)
Q - QUALITY FACTOR OF RESONATORFO - RESONANCE FREQUENCY OF RESONATOR (HZ)
V - INPUT DRIVING VOLTAGE (VPEAK)
SVOL - STIFFNESS OF GAS IN DRIVER BACK VOLUMEWO - ANGULAR RESONANCE FREQUENCY
ALPHA - ABSORPTION COEFFICIENT FOR MEDIUM WITHIN THE RESONATORRD - RATIO OF DENSITIES (PURE HELIUM TO GAS MIXTURE USED)F - FREQUENCYW - ANGULAR FREQUENCYK - WAVE NUMBER
LCOIL - VOICE COIL ELECTRICAL IMPEDANCE DUE TO COIL INDUCTANCEREZM - REAL PART OF THE MECHANICAL IMPEDANCE OF THE SYSTEMIMZM - IMAGINARY PART OF THE MECHANICAL IMPEDANCE OF THE SYSTEM
ZM - COMPLEX MECHANICAL IMPEDANCE OF THE SYSTEMZE - TRANSFORMED ELECTRICAL IMPEDANCE OF THE MECHANICAL SYSTEM
ZCOIL - COMPLEX ELECTRICAL IMPEDANCE OF THE VOICE COILZTOT - TOTAL COMPLEX ELECTRICAL IMPEDANCE OF THE SYSTEM
I - CURRENT DRIVING THE SYSTEM (AT A GIVEN FREQUENCY)FORCE - FORCE ON DRIVER MOVING MASS DUE TO VOICE COIL MOTION
U - PISTON VELOCITYREZT - REAL PART OF THE RESONATOR'S MECHANICAL IMPEDANCEIMZT - IMAGINARY PART OF THE RESONATOR'S MECHANICAL IMPEDANCE
ZTUBE - COMPLEX MECHANICAL IMPEDANCE OF RESONATORP - COMPLEX PRESSURE PRODUCED AT BELLOWS/RESONATOR INTERFACE
PU - ACOUSTIC POWER GENERATEDPWR - ELECTRIC POWER DELIVERED TO DRIVER
PUPWR - ELECTROACOUSTIC EFFICIENCY OF DRIVERGA - AMPLIFIER GAIN USED FOR MEASURED DATAFR - FREQUENCY (HZ)
VM - VOLTAGE OUTPUT FROM MICROPHONE (DBV RE IV)
VA - VOLTAGE OUTPUT FROM ACCELEROMETER (DBV RE IV)
TH - PHASE ANGLE BETWEEN VM AND VA (DEG)PO - ELECTRIC POWER MEASURED (MW)
- POWER OFFSET (MW)
PE - ELECTRIC POWER (CORRECTED FOR AND CONST. SCALING FACTOR)PA - ACOUSTIC POWER MEASURED
EFF - ELECTROACOUSTIC EFFICIANCY MEASURED1 1 , 1 J , J , J J , Y ,
- DUMMY' VARIABLES
REAL LCOI L , K , IMZM , IMZT , M , L , LE , V , MAGVCOMPLEX ZM , ZE , ZCOIL , ZTOT , I , U , ZTUBE , P , FORCEPI-3. 141592654
USER-MODIFIABLE DATA STATEMENTS
DATA RM>M,SSUP,S,BL/1.96,0.01426,68266,1.14E-3,15.3/
DATA A,VOLJLE,RE/6.348E-4,4.12E-4,2.3E-4,8.22/
DATA Y,RHOHE,L/0. 0,0. 524,1.037/
156

c
C REQUEST FOR DATA DESCRIBING OPERATING CONDITIONSC
WRITE(*,*)' INPUT A VALUE FOR GAS DENSITY (KG/M**3)'READ(*,*)RHOWRITE(*,*)' INPUT SOUND SPEED OF MEDIUM (M/S)
'
READ(*,*)CWRITE(*,*)' INPUT QUALITY FACTOR OF RESONATOR'READ(*,*)QWRITE(*,*)' INPUT RESONANCE FREQUENCY OF TUBE (HZ)'
READ(*,*)FOWRITE(*,*) 'INPUT DRIVING VOLTAGE (VPEAK)
'
READ(*,*)VC
C CALCULATION SECTION FOR THEORETICAL VALUES OF ELECTRIC POWER,C ACOUSTIC POWER, AND ELECTROACOUSTIC EFFICIENCYC
SVOL= ( A*A*RHO*C*C )/VOL
WO=2*PI*FOALPHA-WO/(2*Q*C)RD=RHOHE/RHOOPEN(UNIT=69,FILE=' FRIDGE OUTPUT Al
', IOSTAT=IOS)
OPEN(UNIT=22,FILE='EFF OUTPUT Al'
, IOSTAT=IOS)WRITE(69,*)' SOUND VEL HE/GAS RATIO'WRITE ( 69, 1)C,RDWRITE(69,*)' FREQUENCY POWER(AC) EFFICIENCY POWER(EL)
'
1 FORMAT (F6.1.10X.F5. 3)
DO 10 J-1,300F«(FO/4)+((J-l)*(FO/240))W=2*PI*FK=W/CLCOIL=W*LET=SREZM=RM+(((RHO*C*T*ALPHA*COS(K*L)*SIN(K*L))+(K*RHO*C*T*SINH(ALH
*HA*L) *COSH (ALPHA*L) ) ) / (K* ( 1+ (ALPHA/K) **2 ) * ( ( ( ( SIN (K*L) ) **2 ) * ( ( COSH*(ALPHA*L) )**2) )+( ( (COS(K*L) )**2)*( (SINH(ALPHA*L) )**2) ) ) )
)
IMZM=(W*M) - (SSUP/W) - (SVOL/W)+( ( (RHO*C*T*ALPHA*SINH(ALPHA*L)*COS*H (ALPHA*L) )
- (K*RHO*C*T*COS (K*L) *SIN (K*L) ) ) / (K* ( 1+ (ALPHA/K) **2 ) * ( (
(
*(SIN(K*L))**2)*((COSH(ALPHA*L))**2))+(((COS(K*L))**2)*((SINH(ALPHA**L))**2)))))
ZM=CMPLX(REZM, IMZM)ZE=(BL**2)/ZMZCOIL=CMPLX(RE , LCOIL)ZTOT=ZCOIL+ZEI=V/ZTOTFORCE=BL*IU=FORCE/ZMREZT=REZM-RMIMZT=IMZM- (W*M)+(SSUP/W)+(SVOL/W)ZTUBE=CMPLX (REZT , IMZT
)
P=(ZTUBE*U)/A
157

PU=0.5*(REAL(P*CONJG(U))*A)PWR=0 . 5* (REAL(V*CONJG ( I ) )
)
PUPWR=PU/PWRC
C SAVE DESIRED VALUES TO "FRIDGE OUTPUT" FILEC
WRITE ( 6 9 , 100 ) F , PU , PUPWR , PWR100 FORMAT(E13.5,E13.5,E13.5,E13.5)10 CONTINUE
CLOSE(69)C
C INPUT MEASURED DATA FOR COMPARISON TO THEORYC
WRITE (*,*) 'CALCULATE AND PLOT MEASURED DATA? (Y-1.N-0)'READ(*,*)IIIF(II.EQ.0)GOTO125WRITE(*,*) 'INPUT VALUE OF GAIN USED FOR MEASURED VOLTAGES'READ(*,*)GACALL EXCMS('CLRSCRN')
110 WRITE(*,*)' INPUT MEASURED VALUES (FR, VM, VA.TH , PO ,0)
'
READ(*,*)FR,VM,VA,TH,PO,0WRITE (*,*) 'CHECK YOUR INPUT- IF OKAY TYPE "1" IF NOT TYPE "0"'
READ(*,*)JJIF(JJ.EQ.0)GOTO110
C
C CALCULATION OF MEASURED ELECTRIC POWER, ACOUSTIC POWER, ANDC ELECTROACOUSTIC EFFICIENCYC
PE=PO-O-((PO-O)*.05)PA=(((((10**(VM/20))/GA)*((10**(VA/20))/GA))/(1.9277E-5*FR))*COS((
*TH+92.6)*.01745))*1000EFF»(PA/PE)*100
C
C SAVE DESIRED VALUES TO "EFF OUTPUT" FILEC
WRITE(*,115)PE,PA,EFF115 FORMAT(F5.2,5X,F6.3,5X,F5.1)
WRITE(22,120)FR,EFF,PE,PA120 FORMAT ( F5 . 1 , IX , F5 . 1 , IX , F5 . 2 , IX , F6 . 3
)
WRITE(*,*) 'DO YOU WISH TO CONTINUE? Y-1.N-0'READ(*,*)IJIF(IJ.EQ.l)GOTO110WRITE(22,15)Y
15 FORMAT (F5.1)125 CALL EXCMSCCLRSCRN'
)
C
C EXPLANATION OF OUTPUT FILES AND HOW TO GENERATE PLOTS OF THE DATAC
WRITE(*,*) 'THIS PORTION OF THE PROGRAM IS COMPLETE'WRITE(*,*)'YOU NOW HAVE TWO OUTPUT FILES ON YOUR DISK'WRITE(*,*) 'THE "EFF OUTPUT Al" FILE PROVIDES MEASURED EFFICIENCY'
158

WRITE(*WRITE(*WRITE(*WRITE(*WRITE(*WRITE(*WRITE(*
* GRAFRISTOPEND
,*)•
,*)'
,*)•
,*)'
,*)'
,*)•
,*)•
THE "FRIDGE OUTPUT Al" FILE CONTAINS THEORETICAL DATA'
TO GENERATE PLOTS TYPE "DISSPLA GRAFRI" WHEN READY'
THE FOLLOWING THREE PLOTS WILL BE GENERATED:'1. ELECTRIC POWER VS FREQUENCY'2. ACOUSTIC POWER VS FREQUENCY'3. ELECTROACOUSTIC EFFICIENCY VS FREQUENCY'
FOR HARDCOPY TYPE "SHERPA STAR SHGRAPH A" ONCE DISSPLAEXECUTED 1
*************************************************
PROGRAM: GRAFRI FORTRANMODIFIED BY CAPT D. HARRIS (CF) 11 JUNE 1989
THIS IS A MODIFIED VERSION OF A PLOTTING PROGRAM WRITTEN BYLT. MICHAEL SUSALLA THAT IS USED IN CONJUNCTION WITH THE FRIDGEFORTRAN PROGRAM. THE PROGRAM RETRIEVES THE "FRIDGE OUTPUT" AND "EFFOUTPUT" FILES AND GENERATES THREE DIFFERENT PLOTS WHICH INCLUDES:
1. ELECTRIC POWER VERSUS FREQUENCY2. ACOUSTIC POWER VERSUS FREQUENCY3. ELECTROACOUSTIC EFFICIENCY VERSUS FREQUENCY
FOR THE FREQUENCY RANGE DEFINED BY THE "FRIDGE FORTRAN" PROGRAM.
THIS PROGRAM MUST BE COMPILED IN FORTVS PRIOR TO GENERATING ANYPLOTS SINCE VARIOUS DISSPLA SUBROUTINES ARE REQUIRED TO GRAPH THEDATA.
********************************************************************
DIMENSION D(300) ,H(300) ,0(300) ,T(300) ,F(50) ,E(50) ,EL(50) ,AC(50)
CHARACTER*80 NEW1$ , DUMMY$REAL D,H,0,T,MDATA XMAX , YMAX2 , YMAX3 , YMAX4/0
., . , . , .
/
NEW1$=' RENAME ' // ' FRIDGE OUTPUT Al'//' FILE XYZ1 Al
'
CALL EXCMS(NEW1$)CALL EXCMSC'FILEDEF 22 DISK EFF OUTPUT Al
'
)
RETRIEVE THEORETICAL DATA FROM "FRIDGE OUTPUT" FILE
OPEN (69,FILE='XYZ1')READ (69,
' (A80)' )DUMMY$READ (69,1)C,RDREAD (69,
'(A80)
')DUMMY$
1 FORMAT (F6.1.10X.F5.3)DO 20 J-1,300
READ (69,15,END=21)D(J) , H(J) ,0(J) ,T(J)15 FORMAT (E13.5,E13.5,E13.5,E13.5)
DETERMINE MAXIMUM VALUES FOR AXES OF GRAPHS
159

IF(D(J) .GT.XMAX)THENXMAX=D(J)END IFIF(H(J) .GT.YMAX2)THENYMAX2=H(J)ENDIFIF(0(J) .GT.YMAX3)THENYMAX3=0(J)ENDIFIF(T(J) .GT.YMAX4)THENYMAX4=T(J)ENDIF
20 CONTINUE21 CLOSE(69)
1=1
C
C RETRIEVE MEASURED DATA FROM "EFF OUTPUT" FILEC
24 READ(22,25)F(I) , E( I) , EL( I ) , AC (I
)
2
5
FORMAT (F5 . 1 , IX , F5 . 1 , IX , F5 . 2 , IX , F6 . 3
)
IF(F(I) .EQ.0.0)GOTO26E(I)=E(I)/100EL(I)=EL(I)/1000AC(I)=AC(I)/10001 = 1 + 1
GOTO 24
26 1=1-1
C
C DETERMINE INCREMENTAL STEPS FOR EACH AXIS OF THE VARIOUS PLOTSC
INC=INT(XMAX/10.
)
YINC 2=YMAX2/10.YINC3=YMAX3/10.YINC4=YMAX4/10.MAX=INT(XMAX)NEW1$=' RENAME '//' FILE XYZ1 Al'//' FRIDGE OUTPUT Al
'
CALL EXCMS(NEW1$)C CALL TEK618
CALL SHERPAC STAR \'A',3)CALL BLOWUP (1.5)
CALL YAXANG(O)C
C PLOT MEASURED AND THEORETICAL ELECTRIC POWER VERSUS FREQUENCYC
CALL PAGE(11,8.5)CALL AREA2D(8. ,6.)
CALL SCMPLXCALL XNAMEC FREQUENCY ( HZ) $' ,100)CALL YNAMEC ELECTRIC POWER(W) $ '
, 100)CALL HEADINC ELECTRIC POWER VS. FREQUENCY$
', 100 , 2
., 1)
CALL THKFRM( .02)
160

CALL FRAMECALL GRAF(0.0,INC,MAX,0.0,YINC4,YMAX4)CALL CURVE(D,T, 300,0)CALL CURVE(F,EL,I,-1)CALL ENDPL(O)
C
C PLOT MEASURED AND THEORETICAL ACOUSTIC POWER VERSUS FREQUENCYC
CALL AREA2D(8. ,6.)
CALL XNAME('FREQUENCY(HZ)$' ,100)
CALL YNAME( 'ACOUSTIC POWER(W) $' , 100)
CALL HEADINC ACOUSTIC POWER VS . FREQUENCY$ ', 100 , 2 . , 1)
CALL THKFRM(.02)CALL FRAMECALL GRAF(0.0,INC,MAX,0.0,YINC2,YMAX2)CALL CURVE(D,H, 300,0)CALL CURVE(F,AC,I,-1)CALL ENDPL(O)
C
C PLOT MEASURED AND THEORETICAL ELECTROACOUSTIC EFFICIENCY VERSUSC FREQUENCYC
CALL AREA2D(8. ,6.
)
CALL MESSAGC SOUND VEL=$ ' ,100,0.1,5.5)CALL REALNO(C,l, 'ABUT' , 'ABUT'
)
CALL MESSAG( 'M/S$' ,100, 'ABUT' , 'ABUT')CALL MESSAG (
' HE/GAS RATIO=$'
, 100 , . 1 , 5.
)
CALL REALNO (RD , 3,
' ABUT'
,
' ABUT'
)
CALL XNAME('FREQUENCY(HZ)$' ,100)
CALL YNAME( 'ACOUSTIC PWR/ELECTRIC PWR$',100)CALL HEADINC 'ELECTROACOUSTIC EFFICIENCY VS. FREQUENCY$
', 100 ,
2
CALL THKFRM(.02)CALL FRAMECALL GRAF ( . , INC , MAX , . , YINC3 , YMAX3
)
CALL CURVE(D, 0,300,0)CALL CURVE(F,E,I, -1)
CALL ENDPL(O)CALL DONEPLSTOPEND
161

APPENDIX C. SELECTED DIMENSIONAL DRAWINGS (DRIVER HOUSING)
d i mens i o n s i n i nches )
X
Figure C-l. Driver Housing - Lid (Top) View
162

IDD_l
—
CL ii
Xu
CO c
U c
z 01
o c
q: 01
h-1)u E
LU "D
J -
LU C
q:o olU_ LU
UCO Z)LU QJ COo .-'
1 <h- q:cr h-oCL LU
cri Z3
10> COLU LU—
'
cr> CL
_l <
I
Xa3
Figure C-2 Top View Detail of Figure C-l Showingthe Ports for the Electronics Feed-throughPlug and DC Pressure Transducer
163

<oinojmmE3CS
0_£>—i
<Dinoj
LPLT.
ITcncn
u
CD03
_i
LU
>LU
JL u
01LU _
1
Q^
QL[nLd>
~D
"DQJ
_J_J
E
if)
QJ
C
CQJ
Figure C-3. Side View of the Driver Housing Showingthe Bevelled Surfaces to which the ElectronicsFeed-through Plug and DC Pressure TransducerSupport Plate are Mounted
164

ID
J—
<
13CL
m—rooj ID
r\j
ss s1
1
Figure C-4 Close-up Top View Detail of Figure C-lShowing the Microphone/FET Housing
165

LD
O
LdLl
'
NCo >
D>
01
0)
_cuc
If
:
o
U)
c
E
"D
SIDsen0Of\J
Figure C-5 Cross-sectional View of the Microphone/FETHousing along Z-Z' of Figure C-4
166

in
co
in
c(U
E
"U
LCL 01
c1) <
T>u -D 1—
1
~0r\i D
m nIT)LP
s sen< a
a DIDT
o 7> L mm—enen U—
s
3 01mm cr II
U DJ)
Tl1' f\J
U m
71— L— D
(M— X
enen
Figure C-6. Top View of the Driver Housing Showingthe Bolt Circle Dimensions
167

ID QID SODJ_ aor-(1
C ss
cc
c0)
e
Figure C-7 Bottom, or Resonator View of theDriver Housing
168

. sin
XX
LU -i
1 10
Q)
UC
>
CD
CD
in
c
Jinu
Xc0)
E
LU
~D
>crQ
KFigure C-8 Cross-sectional View of the Driver Housing
Showing Vertical Dimensions along X-X'in Figure C-l
169

XX
LJ ~,
in
> 2uc
I _
CD
CDc
Z)O L
mj_ E
Tl
LTUJ>CLQ
"7TinlpIDLP<3S>
If
T
7^
~^~
g£ oik mm P!m irw
(<\±
"1
7K
mmKCD ^
LPLP fwin<^- SOI Ssr^ "^ ^
J
JL
±.
t •
I
I'!!)
I'l'l'l)
"X
JL
Figure C-9 Cross-sectional View of the Driver HousingShowing Horizontal Dimensions along X-X
'
in Figure C-l
170

(Li
01
>D-D
c0)
1)
-D
(I)
c-C
0J
u
la-
in
0)
uc
\/
c
10
cQJ
E
"ID
f\JOD
SC3
JL
D.CDOD. ->
H^
DIDS
(DID
Dinr\jBI3inin
BS
r\JG3UDODB3S3
^L
'A
Figure C-10. Close-up Cross-sectional View of theDC Pressure Transducer Port
171

irin(Dfv
jL
rj<D
cncr• SIS
-H
LJ
>
CD
(J)
Z3OX
TK
—
in
QJ
uc
JID
LJ>cr
ini\innSIS
Figure C-ll. Cross-sectional View along Y-Y ofFigure C-l Showing the Electronics Feed-through Port and Gas Fill Port
172

t 1
C —3 «
U L
GOOD
1 1
en10 s
L COTn-
n C\Jss
-OLKJS
i
-Is.
L
uc
Q.
-JQ.
—Tl
Lt I*J > mmI U tv—f
r L— u paraT)
oL c r1 *j
c L Tr
o
D
— u r\j—
i
1 '
^r-7
<ivr^
oCO |vcxicd
^0J (DIDr>nbe ora
(M—
Figure C-12 Driver Housing Pressure Lid withBolt Circle and 0-ring Details
173

_r xcDt\J»r>1. •
IS
umm
1F
QLOU)cdcdr\jr\j
Jl
h=—
—
1 f\JCD
ss
-g-m
OS
u
Figure C-13 Plane and Section Views of thePusher Plate with Taper Detail
174

1
L
i
Dt^_
"0
1' BU Hi—a o in
IT _C -j
Jl tu— u XI— cr\j
3 L nU Ctu a) s <V u1 i D< ss
—
s
CD CD
— (S rnrci
<->
SL
"0
0)
< aa
Dcd in"xT^ r\j
00SQ
<insin in ,
ssA"
<
SLD _n,LD^T /
^
K
<
Figure C-14 The DC Pressure Transducer Support Platein Both Plane and Section Views
175

CD
K
7fi
<
CMCDmr\jrsrsa
^ca
ii
-H !*
_/x\\\\Y\ \V\ S
^S\>;
r
i r—
i
ACMCD
ss
<-
CD
Figure C-15 The Electronics Feed-through Plug withoutConnectors or Fittings in Plane and Section Views
176

"2 im
u i
S5
oom '
pj———
nr EHS
L
O -C-J
("D
li-*
>
-0)
LSTmr>-
[»- SSIi so
(\J
LD _C_r -JL aI iQ jT) , <
aLJ
inin~~ sen
sunTTCOr^r>- tDh--
Figure C-16. Top View of the Vacuum Can Flange Section
177

'"LiI
OJ
—
i
0)—
i
u0) D> u_OJ
1"°1
cornss
Figure C-17 Close-up Top View of the Vacuum CanElectronics Feed-through Port
178

(SLD
^ K-
7I\
<Dh-lOCD CD
cnm
-ahe
SsES
rooj
QJ
uDU.
UDLT) T)as a)
ss
IDSr\jr\j
ss
0.)
>0)
VT
^I / nn
I
' LDCD>J L> CDCOTF] r=: <mCO
^mm i
mmcom L^_
SQ
Figure C-18 Side View of the Vacuum Can FlangeSection Showing Detail
179

APPENDIX D. DESCRIPTION OF THE STAR RESONATOR
This appendix is used to further describe the
preliminary design of the STAR resonator mentioned in
Chapter III. Design requirements for the resonator included
the fact that the resonator must be able to effectively
contain ten atmospheres of pressure, have low thermal
conductivity across the FRP neck, and acoustically simulate
an open ended tube. Figure D-l, is a scale drawing
illustrating the initial resonator design that is presently
being constructed.
All copper parts of the resonator were constructed from
oxygen free, high conductivity copper which was chosen for
high thermal conductivity. The component parts of the
resonator include a copper flange (1) with eight #l/4"-20
bolt holes designed to allow the resonator to mate firmly to
the driver housing. The groove on the bottom of the flange
is designed for a lead O-ring, used to seal the resonator to
the driver housing. A copper heat exchanger insert (2) is
designed to fit within the flange, reducing the inside
diameter of the flange to a 1.5" diameter. The primary
function of the insert is to restrain the hot heat exchanger
element (4) next to the thermoacoustic stack and provide a
high thermal conductivity path from the heat exchanger to
the driver. Connected to the flange is a 1.84" O.D. FRP
180

2) Heot Exchonger Insert
Fl ange
13.91
Tap Gr l p Ri ngEpoxy to FRP
Hot Heot ExchangerE 1 ementSoft .older to ©
FRP 00-1 038. 00210-1 . ?00
0.001 inch stolnleesSoft Bolder to © 8 ©EJPlostlc Sleeve
Cold Heot ExchangerE 1 ementSoft solder to®
q) Bottom Grip RingEpoxy to FRP fl ©
7) Reducer
Cu S 1 esveSoFt Bolder to©
0} Sphere F 1 tt 1 ngHord solder lojT})hemisphere. 8 (D~^
304 StainlessHem l spheresVelded
I 1) Trumpet
Figure D-l. Diagram of the STAR resonator
181

neck constructed as described in Chapter III. The FRP neck
with its stainless steel liner is attached to the mating
flange at its lower end and to the reducer tube (7) at it's
upper end by two grip rings (3,8).
The two grip rings are designed to provide the final
element of the metal boundary required to prevent helium
diffusion. On one side they are bonded to the FRP neck
using epoxy, and on the other side they are attached to
copper components of the resonator. This provides metal
contact to the FRP both inside and out so that differential
thermal expansion or contraction will place the FRP/Cu joint
in compression. In order to prevent damage to the stainless
steel lining of the FRP neck, a plastic insert is placed
between the stack and the FRP. This plastic sleeve (5) also
serves as a filler between the 1.5" diameter stack and the
1.7" inside diameter of the FRP neck. Below the plastic
liner is the cold heat exchanger element (6) which is held
in place by soft soldering it to the reducer tube. Both
heat exchanger elements (4,6) are composed of multiple
layers of thin copper strips as described in Chapter III.
The copper reducer tube (7) is designed to provide a
smooth transition from the stack to the lower portion of the
resonator-trumpet-sphere acoustical element. The tube is
then connected to the stainless steel sphere by a copper
sleeve (9) , which is then hard soldered to a fitting piece
designed to match the curve of the sphere (10) . The
182

stainless steel sphere was choosen based upon its commercial
availability and was used to simulate an open-ended tube.
The final element of the resonator, the trumpet (11) , is
located within the sphere. The trumpet is designed to allow
the pressure waves to transition into the spherical volume
in a way that is smooth and does not cause excessive
velocities in the oscillatory fluid.
183

APPENDIX E. MANUFACTURER SPECIFICATION 8HEETS
This appendix contains the manufacturer's specification
sheets for the following commercially available items used
in the STAR project; (1) the PICOMIN TW Model 22
accelerometer, (2) the Emerson & Cuming STYCAST® 2850FT
epoxy, (3) the Dexter HYSOL EA9396 adhesive, (4) the OMEGA®
PX80 pressure transducer, and (5) the Servometer
Corporations electroformed nickel bellows. The
specifications sheet for the Y-cut quartz disk used in the
construction of the driver microphone is also included in
order to provide clarification of it's dimensions. Finally
the manufacturer's specification sheets for the Eltec model
304 impedance converter is included, as are plots of the
Eltec 's measured performance as a function of current supply
and driving voltage and a schematic diagram of the 304 and
its constant current source.
184
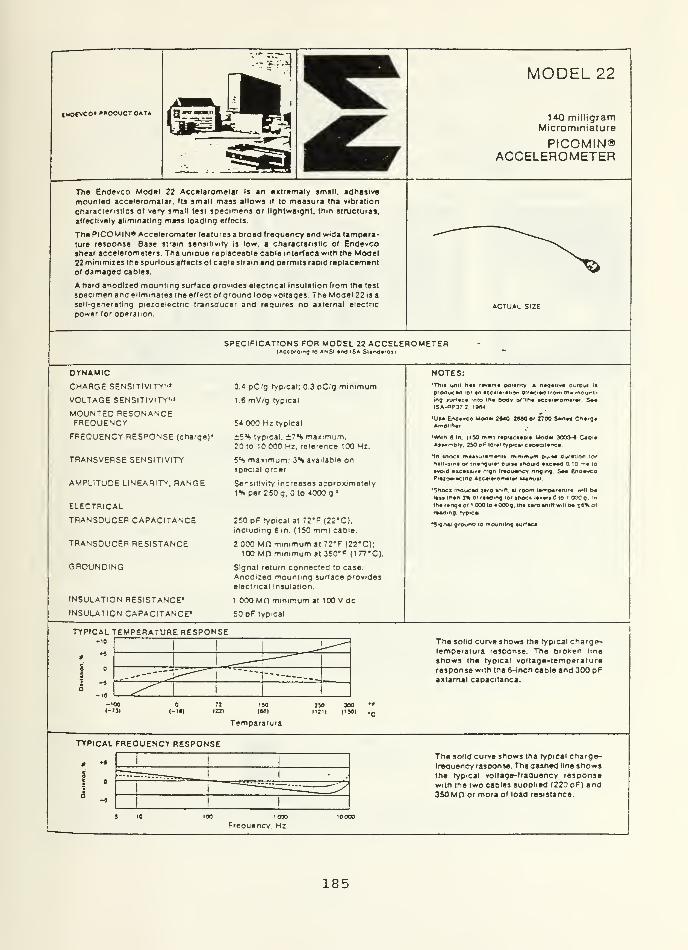
iNorvco* »«OOUCT OATA
MODEL 22
140 milligramMicrominiature
PICOMIN®ACCELEROMETER
The Endevco Model 22 Acceieromeier Is an extremely small, adhesive
mounted acceieromeier. Its small mass allows it to measure the vibration
characteristics of very small test specimens or lightweight, thin structures.
ellectively eliminating mass loading effects
The PICOMIN* Acceieromeier features a broad frequency and wide tempera-
ture response. Base strain sensitivity is low. a characteristic of Endevcoshear aecelerometers. The unique replaceable cable interface with the Model22 minimizes the spurious effects of cable strain and permits rapid replacementof damaged cables.
A hard anodlzed mounting surface provides electrical Insulation from the test
specimen and eliminates the effect of ground loop voltages. The Model 22 is a
self-generating piezoelectric transducer and requires no external electric
power for operation.ACTUAL SIZE
SPECIFICATIONS FOR MODEL 22 ACCELEROMETER{According 10 ANSI and ISA StanoarOll
DYNAMIC
CHARGE SENSITIVITY'-'
VOLTAGE SENSITIVITY'-'
MOUNTED RESONANCEFREQUENCY
FREOUENCY RESPONSE (charge)*
TRANSVERSE SENSITIVITY
AMPLITUDE LINEARITY. RANGE
ELECTRICAL
TRANSDUCER CAPACITANCE
TRANSDUCER RESISTANCE
GROUNDING
INSULATION RESISTANCE'
INSULATION CAPACITANCE*
0.4 pC'g typical: 0.3 pC-'g minimum
1.6 mV/g typical
E4 0O0 Hz typical
;5°* typical, ±7% maximum.20 to 10 000 Hz. reference 100 Hz.
5% maximum: 3% available onspecial order
Sensitivity increases approximately••.per 250 g. to 4000 g.'
250 pF typical at 72"F (22*C).including 6 in. (150 mm) cable.
2 000 MD minimum at 72'F (22*C):100 Mn minimum at 350*F (177'C).
Signal return connected to case.
Anodized mounting surface provideselectrical Insulation.
1 000 Mfl minimum at 100 V dc
50 pF typical
NOTES:•Thia unit haa •-•'*• ooianry A naoatnra ouiout I*
producad (of an accaiaration dlraciao Irom ma mourn-ing iur'ir» into trta body al'ini aecararomatar S««ISA-OP37 J. IMA
'UH Enoato uodn 2»A0 2880 or 7700 Sanaa OargaAmpulla*
•with e in. 1150 mmi raplacaaDia Modal 3003-4 CaolaAAaamOty. 250 O** lOtal ryp-cn :imgi^iIn anoca maaauramanta. minimum putaa duration lor
hail-aina or tnanguia' putaa anomd aacaad 0. 10 ma 10
avoid nciti •• nign Inaouancr nnging. S*« EnoaveoPiajoaracmc Accaiaromatar kAanual.
•"irioca Inducad zaro an,n. al room tavnoararura w>ll bdlaaa man 3% ol raaomg lor inoca lavara to ' 000 g In
ma ianga ol 1 000 to a 000 g. tna lard arlirt anil Da r*J*A ol
r»admg. ryprCAl
•Signal ground lo mourning aurlac*.
TYPICAL TEMPERATURE RESPONSE10 The solid curve shows the typical charge-
temperature response. The broken line
shows the typical voltage-temoeratureresponse with the 6-inch cable and 300 pFexternal capacitance.
Temperature
TYPICAL FREOUENCY RESPONSE
1000
Frequency. Hz
The solid curve shows the typical charge-frequency response. The dashed line showsthe typical voltage-frequency resoonsewith the two cables supplied (220 pF) and350 Mfl or more of load resistance.
185

SPECIFICATIONS FOR MOOEL 22IDENTIFICATIONLABEL
•IH UNC 2A TMBEAO. MATES WITH ENOEVCO30»« CABLE
(3 5J)
XXD CABLE ASSEMBLY(REPLACEABLE)
Oiuensions IN inches ano {UILLIUE TBJ SI
PHYSICALDESIGNCRYSTAL MATERIALCASE MATERIALCASE FINISH
WEIGHT
CONNECTORMOUNTING
ACCESSORIES SUPPLIED
ACCESSORIES AVAILABLE
Shear
PIEZITE»Type P-8
Aluminum Alloy
Hard anodlze
40 gram (2 carats) typical, with 6 Inch (150 mm) cable:
14 gram (0.7 carat) typical, excluding cable.
Special connector mates with Model 3003-6 Cable Assembly
Adhesive Use Tool No 17267 (supplied) to remove acceierometer.See Instruction Manual.
Model 3003-6 Low Ncse Coaxial Cable Assembly. 6 inch (150 mm), stainless
steel sheath. Kapton» poiyimide iacket. capacitance 50 pF typical.
Model 3095A-72 Coaxial Cable Assembly. 6 tt. (1.8m) with mating receptacletor 3003 assembly. 10-32 plug on other end. capacitance 180 pF typical.
Model 17267 Tool tor removal ol acceierometer and 3003 cable
Model 3090C Low Noise Extension Cable Assembly and EJ34 Adapter
Model 3093-12 with 10-32 female connector. 12 in, (0.3m|
ENVIRONMENTALACCELERATION LIMITS'
TEMPERATURE RANGE
HUMIDITY'
ALTITUDEBASE STRAIN SENSITIVITY
MAGNETIC SENSITIVITY
ACOUSTIC SENSITIVITY
10 000 q in any direction
Operating: -100*F to +30O*F (-73*C to 150'C)Non-Operating: -150*F to +350*F (-100*0 to + 177*C)
Sealed with silicone compound. Tests indicate 48 hour protection against
97% R.H, at 140'F.
Not allected
Typically 2.0 eauivaient g at 250 u strain
0.0009 equivalent g per gauss (10''T). typical at 100 g, 60 Hz
0.008 equivalent g typical at 140 dB SPL
NOTES: *W**OJv0l»C:td!O *'0* dllO'lCI-"*"! IOw lf|0.u«r,CV viOnliOn l*« Cl0'« T>VS1 D« (ltd flO*n II CIOU II OOIJ.6l» 10 ir>« iCC*'!'OmiW to 0' •"•**! CID*« wnrp »n
r*«Mual • • llilurf
'Bimp,inq cjc'l noom lcc»'«fO^«t#r lo '"• inn'onmifll S*« MoO»l 2? InitrvCDOft M«null 'Or nmWH innrvction*
Continued product improvement necessitates that Endevco reserve the nght to modify these specifications without notice
RELIA 9ILITY: Endevco maintains a prcg ram of constant surveillance over all Droducts to ensure a high level of re liability This programincludes attention to reliability factors Bunng product design, the support of stnngent Quality Control requirements and compulsorycorrective action crocedures. These measures, together with conservative specifications, have maoe the name Endevco synonymouswith reliability. Enoevco s Quality and Reliability System meets the requirements ol MIL-0-9858A and MIL-STD-785A.
CALIBRATION Each unit Is calibrated at room temoerature for charge and voltage sensitivity, caoacitance. maximum transverse
sensitivity and charge frequency response from 20 Hz to 4000 Hz. Other calibrations such as Temperature Resoonse at-lOO*F(-73*C).room temperature, 250*F (121*C). and 350"F (177'C) are available on special order See Calibration Service Bulletin No. 301.
END EVCOBANCWO VitJO ROAO SAM JUAN CAPiSTPANO.CA 93673 • TELEPHONC C7141 -«93-Oiai
ANAmEJU C* • awhapOuS. uo • CHtC*GO IV, « Dayton O" • HOUSTON TO • LAU8fPTV»u.t NJ • 0*LANOO F*l • '*tO ALTO O • wr fc#vmc CTAflGENT'NA • AUSTBA4.IA • BWAJTlL • CANADA CHILE • HNl_ANO • »«A»»C! * tNO<A • -l»E\>ND • lTAl.r • JJW*AN • «O fl tA UAJ_AY*>A • WDlCCNC7H£fll»iOS • NO»»f*AV • SiNGAiXOBE • y*AiN • SvwECEn • SwfTZtW-ANO • TAjman • UNITED KINGDOM * Uf*jGUAV • vlNCZUfLA • wr GEPmant
186

TECHNICAL BULLETIN 7-2-7A
STYCAST® 2850FT
EMERSON&CUMINGWhere there's a way.
%.
Versatile Epoxy Casting Resinwith High Thermal Conductivity
Cunt C»»ung< » Specialty With Thii WilfrnlNe- Folder Available on
Other Thermil Conductive MatePrecjaa Thermal Ccnd-jctivitv
Mtiruiunint of Sample Ctiung
STYCAST 2850FT is a highly filled epoxy formulation with
remarkably good over-all general properties. In addition
to having excellent electrical grade insolation properties
and excellent resistance to chemicals and solvents, STY-CAST 2S50FT has unusually high thermal conductivity andlow thermal expansion. This combination of properties has
shown STYCAST 2850FT to be invaluable in solving problemswhere electrical insulation and mechanical protection mustbe maintained while coping with heat transfer con side rations.
STYCAST 2850FT is excellent in high voltage applications,
e.g. power supplies, transformers, bushings, insulators,
etc. In some hicn voltage applications, the di stanc e betweenelectrodes may be critical and cause surface tracking whenSTYCAST 2S50FT (Black) is used. The use of STYCAST2850FT (Blue) will solve the problem.
Since STYCAST 2850FT has a slight settling problem, werecommend that the material be remixed before removalfrom the shipping container.
STYCAST 2850FT is a highly versatile epoxy resin systemwhich may be cured with any one of three curing agents.
The choice of catalyst should be made after reviewing yourrequirements with regard to the following guidelines.
CHOICE OF CURING ACENTS: From the information sup-plied, select the catalyst which best suits your require-ments.
CATALYST 24LV - Room temperature curing - 30 minutespot life, 1 lb. (0.45 kg) mass - lowest viscosity and besthandling properties - generally does not require vacuumdesiring - best thermaland mechanical shock - not recom-mended for applications subjected to temperatures above2S0T (121 -C) - will soften slightly above 180 - F (82'C) -
best adhesion.
TYPICAL PROPERTIES (cured with Catalvst 11):
Cure Shrinkage, cm/cmViscosity at 65*C Icatalyzed with Cat. II), cps
Viscosity at 25"C (catalyzed with Cat. 9), cps
Viscosity at 25*C (catalyzed with Cat. 24LV), cps
Thermal Conductivity, (BTU)(in)/(hr)(ft 2 )f F)
(cal)(cm)/(sec)(cm2|CC)Specific Gravity
Tensile Strength, psi fkg/cm^)Compressive Strength, psi (kg/cm^)Flexural Strength, psi (kg/cmMFlexural Modulus, psi (kg/cm2)Elastic Modulus, compressive, psi
(kg/cm'Hardness. Shore DIzod Impact, ft. lb. /in. of notch
(Joules /cm)Thermal Expansion Coefficient /'C
/•FMax. Service TemperatureWater Absorption. 7 days
Volume Resistivity, ohm-cm.
Dielectric Constant. 60 Hz1 kHz1 MHz
Dissipation Factor, 60 Hz1 kHz1 MHz
Dielectric Strength, volts/mil
kv/mmMachineabillty
. 001
3. 000
90. 00015. 000
10
0. 0034
2. 3
8.400 (5881
16, 500 (1. 155)
13, 300 (931)
2 x 10 8 (1.4 x !
C"
)
1.1 x 10 c
) (7. 7 x 1 C-*)
o 4
0. 3
(0. 161
29 x 10-6
16 x 10-6
400*F (205*C)less than 0. 15%
5 x 10'6
1 x 10'
2
6. 5
6. 3
5. 9
0. 02
0.0080. 02
550
21. 7
Poor (must be ground)
77'F (25*0302'F (121*C)
187

STYCAST 2S50FT continued TECHNICAL BULLETIN 7-2-7A
CATALYST ° - Room temperature curing - 45 minutes pot
life, 1 lb. (0.45 kg) mu f - highest visce stty, but with mod-estly good handling properties - tough and rigid at aU tem-peratures to 300*F (150*C).
CATALYST 11 - Requires oven cure - 4 hour pot liie, 10
lb. (4. 5 kg) mats - low viscosity with excellent handlingproperties - exceLlent thermal and mec haoical shock - bestelectrical and phvsical properties at temperatures above250'F (121 *C) - can be used up to 400 "F (205 *C).
General Instructions : Mix the entire contents of the shipping
container to a uniic rm consistenc y each timebefore remov-ing material. Power rnlxing is preferred. Mold Release1225 wiUprevent adhesion to molds. Where necessary, en-trapped air can be removed by vacuum deairing.
IF using CATALYST 24LV
1, Add and thoroughly blend 6-1/2 to 7-1/2 parts of Cat-
alyst 24LV by weight for each 100 parts by weight of
STYCAST 2850FT. Slight warming, 100'F (38*C). of
the resin before catalyst addition will aid pouring and
hasten bubble release.
Four into meld.
75*F (25'C), (
150'F (66-C).
Allow to cure at room temoerarure,• eroigr.t or oven cure for 2 hours at
IT USING CATALYST ?
1. Add and thoroughly blend 3 to 4 parts Catalyst 9 by
weight for each 100 parts by weight of STYCAST 2850FT.Slight warming, 100*F (38'C), of the resin prior to
adding catalyst will improve pourabiliry . Small amounts(up to 10% by weight) of ECCOBONE- -* 55 mxxed with
Catalyst 9 (see Tech. Bull. 3-2-1) may be added to fur-
ther lower viscosity with some sacrifice in properties.
2. Pour into mold. Allow to cure at room temoeratMre,
75*F (25"C), overnight or oven cure for 2 hours at
150'F (66'C).
IF U5INC CATALYST 11
1. Add and thoroughly blend 4 to 5 parts by weight of Cat-alyst 11 for each 100 parts by weight of STYCAST2850FT. STYCAST 2850FT may be heated at any tem-perature up to 165*F (74*C) before catalyst addition to
lower viscosity and aid pourabiliry.
2. Pour into mold. Cure at any of the following schedules:16 hours at 180'F (B2'C). 2 hours at 212*F (lOO'C).or I hour at 257'F (125'C).
For optimum high temperature performance and minimumcoefficient of expansion, post cure for 4 hours at 300*FflSO'C).
The shell life of STYCAST 2S50FT, when stored uncatalyr-
ed. in unopened containers at temperatures no higher than
25"C is 6 months.
The handling of this product should present no problems if
care is exercised to avoid breathing excessive amounts of
the vapors, and if the skin is protected against contamina-tion. The eyes should be protected. Observe precautions
in Public Health Se rvice Publication No. 1040. May l°63.
Superintendent of Documents, U. S. Government Printing
Office. Washington D. C. 20402.
This information, while believed to be completely reliable.
is not to be taken as warranty for which we assume legal
responsibility nor as permission or recommendation to
practice anv patented invention without license. It is offer-
ed for consideration, investigation, and verification.
188

.."••- .?.
VBGUt
•OLtiii: »tt EA 9390
DESCRIPTIONEA 9396 is a tow viscosity, room temperature curing arlheisve system with excellent strength properties at temperatures trom
STT to 350"F EA 9396 has a shell tite ot ten months when stored al 77"F tor separate components.
FEATURES• Low Viscosity
• Long She" Lite at 77"
F
Cures at Room TemperatureHigh Slienoth at Low and Hiqh Temperatures
UNCURED ADHESIVE PROPERTIES
Part A PartB Mixed
Viscosity iu 77" F BOO- 1200 Poise 1 Poise 30-40 Poise
Shell Life (5 <40 F
ffi v 7TF1 year
10 months1 year
1 year
This matenal will normally be shipped al ambient conditions, which will not nlior our standatd warranty, provided that the
material is placed into its intended storage upon receipt Premium shipment is available upon request
HANDLINGMixing - This product requires miring two components toqclher just pror lo ppplratipn to the pans to be bonded Completemixing is necessary The temperature ol Ihe sepaiate components pnor to mi«mg is not critical but should be dose lo roomtemperature
Mix Ratio
By Weight
Part A
100
Ncle \bfume measurement is not recommended for sinjctur/il applications unless special precautions are taken to assureproper ratios
Pot Life (450 gm mass)Method - ASTM D 2471 in water bath
75-90 mmules
APPLICATIONMixing - Combine Part A and Pari B in the correct ratio and mix thoroughly THIS IS IMFORTANT' Heat buildup during or
atler mixing is normal Do not mix quantities greater than 250 ornms as dangerous heal buildup can occur causing unconlro'leddecomposition ol tfie mixed adhesive TOXIC FUMES CAN OCCUR. RESULTING IN PERSONAL INJURY Mixing smaller
Quantities will minimize the heat buildup
Applying - Bonding surfaces should be clean, dry and property prepared For optimum surlare preparation consult HysolBulletin G 1-500 'Preparing the Surtace tor Adhesive Ponding "The bonded pails should be held in contact until the adhesiveis set Handling strengtti lor this adhesive will occui in 24 hours al 77 F after which the suppoti tooling or pressure usedduring cure may be removed Since full bond slienglh has not yet been attained, load application should be small al this lime
Curing - EA 9396 may be cured for 5-7 days al 77"F to achieve normal performance Acceleiaied cures ol 1 hour al 150"For at 180"F may be used
Cleanup - II is important to remove excess adhesive from the work area and application equipment before It hardensDenBlured alcohol and many common industrial solvents are suitable fo< removmq uncured adhesive Consult with yoursuppliers inlormation pertainrnq 1p the sale and proper wse ol solvents
189

BOND STRENGTH PERFORMANCETensile Lap Sheer Strength Tensile lap sheer strength tested per ASTM D 1002 Adherends are 2024-T3 clad aluminumtreated with phosphoric acid anodize per BAC 5555 (Values are expressed in PSI)
Test Temperature, 'F -67 75 180 300 350
Cure 5 days '« 77"F 3300 4000 3200 1800 15001 hourf.c 150*F 3300 4200 3300 1800 120030 mm <u 180T 3500 4200 3300 1900 1200
Peel Strength
Bell Peel strength lested per ASTM D 3167 after curing for 5 days at 77*F Adherends 8(8 2024-T3 clad aluminum treated
with phosphoric aod anodize per BAC 5555
Test Temperature, 'F Typical Results (PL!)
77 25180 20
Service TemperatureService temperature Is defined as thai temperature at which this adhesive still retains 1000 PSI using test method ASTM D1002 and is 300 F
HAZARD WARNINGFor Industrial Use Only!
PART ACAUTION! The uncured adhesive causes eye irritation and may cause skin irritation as allergic dermatitis Contains epoxyresins. Use good ventilation Avoid coniact with eyes or skin Wash thoicughly with soap and water after handling Do not
hand'e or use until tne Salery Data Sheet has been read and understood Do not cut or weld empty container
PART BDANGER! Causes severe skin and eye bums Do not get in eyes on skin or on clothing Wash thoroughly afler handling
Vapors mav be irritating to the respiratory tract Avoid breathmq vapor Keep container tightly closed Use only with adequateventilation Do no' cut or weld empty container Do not handle or use until Salety Data Sheet has been read and understoodThese warnings are based on Guides tor Classifying and Lat*)ting Epoxy Products According to Thoir Hazardous Fo'pntialit>es
prepared by the Epory Resin Formulatorg Division and the Society of the Plastics Industry, Inc . and based on ANSI Z129standard
AVAILABILITYThis product 's available I'om Hyso' Aerospace and Industrial Products Division. 2850 Willow Pass Road. PO Box 312,
Pittsburg. CA 94565-3299. Telephone 415 687-4201 TWX 910 387-0363
Revised 2'8S
•o 'fnw»r"« CO*,unt'C<|i 11*1 **« ••P»*»i mtfmnim* • • '*tm*time t> y »nT >*rvr^i-<'i'-nr. »-.« r**««j »>a r*o "•"•««»•* nfwh ••i»»kj tHrVG f**» o*«c"Ot'0" O" >»• '»cf r»#<»oi Th«
V%*' •• •O<f'«»0 ") u»« »?*"»/^01 •** Cu'i CC*v)''w< m*mn » . . - |tw| .-••-• i*\ji a • at WMMtMaftv* M DOM*© 1* O' IN)M u«»0 «n »*t •CluaW mtnultCtUTM «•<*»
KYSOLAf t0?*»C! ft INDUmUl PRODUCTS DIVISION
2950 WiHo« P»« Ro»fl PO Bo« 312 P"U6vf<) CA 94S65Phon. H15I 6S'-4?01 Twil SUMS? 0363
* Division or The SPECIALTY Chemicals «. SERVICES GROUPTHE DEXTER CORPORATION
190

PX80 & PX90 SERIESSOLID STATE PRESSURE SENSORS
GENERAL DESCRIPTION
The OMEGA* PX80 and PX90 Series Solid State Pressure Sen-
sors are mounted in 316 stainless steel housing and are intend-
ed for high pressure applications requinng long term stability.
The stainless steel housing structure utilizes an oil column to
couple a diffused, piezoresistive sensor to a convoluted, flush
stainless steel diaphragm th8t can be interfaced with mostharsh media. The PX80 Senes feature a flush mount connec-
tion; the PX90 Series feature a welded % -18 NPT pressure
fitting.
Temperature compensation and calibration over 0° to 50°C is
accomplished with the addition of only 3 external resistors, the
values of which are included with each sensor.
These sensors are available in both sealed gage and absolute
pressure from 0-300 psi to 0-1000 psi (PX80 Series! and to
0-3000 psi (PX90 Senesl. Each sensor is individually serialized.
FEATURES• Solid-State Reliability
• Welded Construction
• Flush Diaphragm• Ratiometnc• ±0.5% Accuracy
• Low Noise
• Serialized
TYPICAL APPLICATIONS
Hydraulic Servo Controls
Refrigeration
Robotics
Smart Values
Tank Levels
Air Conditioning
Food Processing
Machine Tools
Engine Diagnostics
Iniection Pump Monitoring
Process Control
Industrial Control
DIMENSIONS/CONNECTIONS
Refer to Specification Notes # 2 and 3.
PX90
,' * V -'
6 6 6 6 6 6
L
??????1 N« Al »•
3
(SCI NO'M J t i o*t »*C« »*OI 1
&lk 0'-l-«"">""
Flgur* 1b.
Note: Excitation current can be derived from a constant voltage
source with the electrical circuit shown in Figure 2. IOMEGAPart No. PS-KIT-11.
DIMENSIONS/CONNECTIONS
Refer to Specification Notes #2 and 3.
PX80i
—1
OMEGA NO. PS-KIT-1
<- # y <'
O C
> .' I «*. '
KM
t"rt0*0 O'A
COtO «\»<ID
3^4-DIODEI 1.24K
j^f:
CONSTANTCURRENTSUPPLY
CONVERTS VOLTAGE SOURCETO CONSTANT CURRENT SOURCE
LM324 — OPAMPLM385—1.ZVDIOOERESISTORS— RNS5. METAL FILM RESISTORS 1HACCURATE
Figure 2.
UX 0«wtwt>0«ia ** m mwcxii
Frgur* 1a.
191

PX80 & PX90 SERIES SPECIFICATIONS
Supply Current = 15 mA & Ambient Temperature = 25°C (Unless otherwise specified)
PARAMETER
PRESSURE RANGE
UNITS NOTES
300. 500 pil 1000. 3000 otl
MIN FTP MAI MIN HP MAI
Full-Suit Outoul Soan 100 250 mV 2
Zero Pressure Outoul 5 5 im¥ 2.3.4
Slanc Accuracy 5 5 i %Span 5
Input & Outoul Resist; nee 4000 5000 6000 4000 5000 6000 QTemoeratute Coeiticieni-Soan 10 1 i % Soan 1.2.3
Temperature Coefficient Zero 1 1 * % Soan 1.2.3
Suopiy Current 1 5 2 1 5 20 mA 6
Output Load Resistance 2 2 MQ 7
Insulation Resistance (50V0C) 50 SO MQPressure Overload 3X 3X Rated 8
Operating Temperature -40Tto + 125 *C
Storage Temperature •65 "CIO + ISO *C
Meoia Compatible with 316 Stainless Sleel
weiont 8 Grams
SPECIFICATION NOTES
1
.
Temperature range: 0° to 50°C in reference to 25°C.
2. With externa! resistors (R1 or R2). (R3 or P4] and R5 included in circuit shown in Figure 1 If R1 is required then R2 is left open(R2 = oo| and vice versa. If R3 is reauired then R4 is a short (R4 = 01 and vice versa.
R3 or R4 is used for OFFSET COMPENSATIONR1 or R2 is used for THERMAL OFFSET COMPENSATIONR5 is used for THERMAL SPAN COMPENSATION
Positive offset is when the voltage at Pin 4 is higher than at Pin 1. Positive offset is compensated by adding R4 and shorting
R3. For negative offset compensation the reverse is true.
Positive thermal offset is when thermal effects cause the voltage at Pin 4 to increase faster than at Pin 1 Positive thermal off-
set is compensated by adding R1 and leaving R2 open. For negative thermal offset compensation the reverse is true.
3. A computer printout is supplied with each sensor detailing the values of the 3 required external resistors along with open andshort information for the other two locations.
4. Vacuum for absolute and one standard atmosphere for sealed gage.
5. Includes repeatability, pressure hysteresis and linearity (best fit straight line).
6. Guarantees output/input ratiometricity.
7. Prevents increase of TC-Span due to output loading.
8. 3X or 10.0C0 psi maximum whichever is less.
WARRANTYOMEGA warrants irtis u^ to he t'w of defers '" rnarenaJS anc rrorxmansrtipand to orve iatisiaci<y\ sennce tor a penoc ct 13 mryvt-s r~>m ca'eo' put^aaeOMEGA rVa/rarrv eacs ir aoctxxiat one 1 1 1 mon'ri g-ace Denod lo me norma)one ( i ) year procuct warramv tc cover r-Anc'.ing a/v-j v.ppnq time Pva ensuresthat our customers racatva maximum coverage on eecn pmcjcl II the unti
should mamjncjon. rt must De tri/r« tc ma factorv lor evaiuaron OurCustomer Service Oaoarrnani mil issue an Autnoruec Peturn iARI numoerimiTKaatfiy upon phone or written reouesL Upon axammauon dv OMEGA, il the
unfl es rouno tDDeoe'eoveri mrioe -eoaxedor reouxrec atneche/oe nc**mt.tnn warranty is vC'O it ma unit snows evidence o' rxawnrj seen tamoeredwith or snows moenc* ot o»no, oameoeo as a i esotr or excesarve current realmccsrura rujrarion.or misuse Components wnch wear or wruch are damagedby rrnause ana noi warranted These include contact pomts ruses and tnaca.
THERE ARE NO WARRANTES EXCEPT AS STATED HEREIN THEPE ARENO OTHER WARRANTIES EXPRESSED OR IMPLIED INCLUDING BUTNOT LIMITED TO THE IMPLIED WARRANTIES OP MERCHANTABILITY ANDOF FITNESS FOR A PARTICULAR PURPOSE. IN NO EVENT SHALL OMEGAENGINEERING. INC BE LIABLE FOR CONSEQUENTIAL tNCDENIALORSPECIAL DAMAGES THE BUYER S SOLE REMEDY FOR any BREACH OFTHIS AGREEMENT Bv OMEGA ENGINEERING. INC CR any BREACH OFANY WARRANTY BY OMEGA ENGINEERING INC SHALL NOT EXCEEDTHE PURCHASE PRICE °AiO BY THE PURCHASER TO OMEGAENGINEERING INC FOR THE UNIT OR UNITS OR EQUIPMENT DIRECTLYAFFECTED BY SUCH BREACH
/TZOMEGAOne Omeqa D"ve. Box 4047
SlamlnrC. Connecticut 0*3907-0047
(?03)3S9-I660 Telex 996*04 Cable OMEGAFAX (203)359-7700
Printed m U SXReturn Regueetvlnqulrtes
Direct al warranty and rooe* •ouesiarinoume* to OMEOA Customer SemesDeoartmerx. aaaaanp • rajnaafiaai3Sa> '860 Betora return**; any rexrumerx plejejoontaa me OMEGA Cuseomer Sernca Oeoartment *o otxan an aucxmrud rerum |AR)
rrumber The oe»j isiai I AR numoar sno SB then Da merxao on a» eiejaej (X ffta return
paouge
To avow* pejeaejarig detaya aeeo ptaase be aura id tncxide
1 Retvmea name address and prune number
2. Uonei end Senai numbers3 Rep** rrjfrucnons
OMEGA* a a reomwefl trademarx ej OMEGA ENGeNEEWWO INC
J Cocrnont 19M OMEGA ENGINEERING. INC A» ngtws reserved including
exmiarjons Novwxj n trm manual ma* oe reproduced ft any manner, ether rmoey
or f Dan lor any purooae wnacsoever wrmout wrmen permaeion rrom OMEGAENGINEERING INC
M566/106
192

Q $1-1361.
PROPOSED ELECTROFORMED NICKEL BELLOWS DESIGN SK - t( 31 7 ,Z£v U
Custome r L oS /jlJImoj /V/> riQAJAL <->3
Address ^ A Ou P p-io A*4j /Vy^V
Engineer TQV W*f*™£*
Telephone g^g Si7 - ?
V
f'?
Tftt 'a'1
F.jub ga
Ext.
Lil
nJ
Application Engineer
Date /i /a •>/ gT-
P/N
Inquiry
£ b * > '; / . V 9 8 _T/,W o 0>
<~<"I I -u 1ST Z°£o id
/" 'Ay/4
Bellows O.D. (in .
)
3ellows I.D. (in.)
Convolution Pitch (in.)
Wail Thickness (ref.
)
Effective Area (in.)
No. GroovesConvolutions Active:
Before AssemblyAfter Assembly
Max. Allowable Axial Stroke:Compression (in.)* >
Extension (in. ) *
Max. Pressure Ratings (psi)
:
Working-'350Z StroKeProof-?Free LengthBurst-'?Free Length »
3uckling-a " (int. )
Spring Rate (lbs. /in.
)
@ . O i c omo /wtp-: : L 7 5 •
"
Before AssemblyAfter Assembly
Spring Rate Tolerance
l. TOO
.111. oo '- 'J
I. I i'i
1'*
I b
, o S-
•etc
loSo70-CO
- I
S 3o
3SMO' N'
TOLERA? ICES •
.XX : . 1- 5 '
. XXX = : .
" Q ^ i
Max. 3end Angle (degrees)*Max. Off-Set Rating (in.)*Min . Life Expectancy (cycles)Regular Nickel For Soldering
= *s/,i
Sulfur-Free Nickel For WeldingOr Corrosion Resistance
Gold Plate:Class
WrYes_
TypeNo
Grade
Yes No X
Other Finish
Leak Test:
Notes
:
1. Max. Operating Temp. For ContinuousUsage 350"F (260°F If Solder Ass'y.).
2.*-Values Are Mutually Exclusive. If
Combinations Of These Are Required,Please Consult Us.
"3. Bellows Normally Have A .0001 Inch
Copper La=ina Which Is Centered In Wall
193

IIANCH Of FICTSi
Pv-U*—... ».International
C-.U- iiJ~^ IKTE1
rabQratnrics, Inc.
Strcct
METALLURGICAL REPORT
No.
From
534729
Servcneter CorporationSOI Little Falls ReadCedar Grove, New Jersey 07009
DATE February 2, 1988
Sajrple of
>larked
RESULTS
Electro-Deposited Sheet Metal
SEF.VOETER CORPORATION501 Little Fall? RoadCedar Grove, New Jersey 07009
MATERIAL : REGULAR NICXELPurchase Order No. 17120
PHYSICAL TESTS
Tensile Strength, PSI
Yield Strengxh, PSI
Elongation in 2 inches
172,500136,400
2.001
VIGORS HARDNESS, 500 Gran Load
488
To
Qsqai ANALYSIS
Nickel * Cobalt : 99.921
Sulphur : 0.018*.
Ser/cmeter CorporationCedar Grove, New Jersey 07009
INTERNATIOMAl TESTING LABORATORIES, INC
(1_^ '* lift—.
194

(T111,,.SERVOMETER CORPORATION -.B«i<«r. „.«<u M,„.
501 LITTLE FALLS ROADCEDAR GROVE. NEWJERSEY 07009
AREA CODE 201 785*630
CERTIFICATION
CUSTOMER, Naval Postgraduate School
CUSTOMERS PURCHASE ORDER NUMBER. N62271-89-H-0440
SHIPMENT DATE: February 7, 1989
CONTENTS OF SHIPMENT- 20 Pes
.
SK-11397 Rev. A Bellows
This it lo certify thol the subject ports lilted obove as shipped on the sub|ect
purchase order, meet the requirements checked below.
Drawing: Dimensions and tolerances: _
Moteriols: Bellows- Servometer Spec N99I0D x
End Fittings: .__ _.
Phys ical__and chemica 1 test reports enc 1 osed_
Finish,
Performonce: D«s-qned:
Tested: ...
Spring rate: Twied: _.._.l.Q0J._
leok rote- Trsted: _ _N/A
S*rvomerer Corporation
Glenn A. Weinrich Q.A. Mgr. S-82
195

f
Y " c u
ini sh.quarizT h i c K n
1 s K
ess is"ine lapped0.0041 inch.0. 0035
Electrode edge uurap connectinglop left electrode to bottomright electrode
ElectrodeDiameter n c h
Quariz^'direction
QuartzDiameter
8 3 313c3 inch
Electrode edge uuraconnecting bottomelectrode to top rielectrode
feflght
Figure E-l Dimensions of Valpey-Fisher Quartz DiskShowing Electrode Configuration
196

IMPEDANCE CONVERTERS
MODEL 304 impedance converter has
the complete circuit, bias resistor Ri,
source resistor R? and the FET sealed into
a standard TO-72 transistor housing.
Ri, Rj, and the FET can be specified.
Sockets made from Teflon and polyester
are available for applications requiring
removal of the circuit for testing, cleaning
or exchange.
UL 2C-.-J4
1
Bottom rt«»
1 \n-ch.
VetP ch
MOSFET
1 i
2
3 G \
G
+
4|GNO \ s
using in N chlnml JR1 <$
HtQh Imsiftjntl
StCHXL IN
SIGNAL oin
ttnetdlACI co«y»rt«r
•tii>f i f cntnmi MCSriT
Wit* lr«c»fljiri
SI6N»l IN
-O L8» Imtldinct
SIGNAL oin
8-78
DESIGN
The connection to the gate terminal is the most
critical connection. At the gate, the signal is still a
high impedance voltage signal. Care must be
taken to assure the connection to the gate termi-
nal is not influenced by noise or a relative low
insulation resistance which would lower the inout
impedance and increase the noise of the impe-
dance converter.
t^fIT
.160
4 mmot
—
MOO932
HP '
JTlUc
* .160
[ 4 mm ]
tj:i i
MOC933
IK
,\ i
1-
.220
1I
+ .002
DIA -.000
^ 005|
5.6 mm© -.000|
The following plug-in sockets are
recommended:
Eltec model 932, Teflon (shown)
Eltec model 933. Teflon (shown)
Eltec model 934, Polyester, (see 932)
ELTEC
197

IMPEDANCE CONVERTERSImpedance converters change difficult to
measure high impedance voltage signals
into easily measured low impedance voltage
signals.
They effectively convert the electrical
charge or output from a high impedance
sensor into useable voltage signals.
Exhibiting near unity gain, impedanceconverters generally consist of a FET, a high
megohm resistor for biasing and a low value
resistor in the output circuit.
The FET senses the formed charge or vol-
tage stored in the input capacitance at the
gate and this effects a proportional change in
source to drain current.
The high megohm resistor R, connects the
gale of the FET to a fixed or zero bias level and
continually discharges the input capacitance at a
rate depending upon its resistance value.
The change in source to drain cur rent mentioned
above creates an output voltage signal across the
low value resistor R2
in the output circuit. This
signal is at a low impedance level.
Two basic types of FET's can be used:
JFETs exhibit very low noise at RT. The gate
reverse current less changes with operating
temperature. It doubles for every 1CPC increase in
temperature. It decreases the same ratio for de-
crease m temperature. The lowest operating
temperature is about 73K =-200 C.
MOSFET's exhibit relative higher noise at RTThe gate reverse current less does not changewith temperature. Lowest operating temperatureis 3K =-270e
C.
o»nf Ifl N-ChlMtl JFH O
lm»l«J|«tl -r*>-« •»
Il"| • P-CMamI MOSFTT
*'.-•_ in
SIGNAL OUT
SPECIFICATIONS
Using an N-channel JFET
Pinch-olf voltage Vgs (oh) - 1 V maxMaximum voltage BVgss - 50 VInput impedance 2 x 10 9 n
Output impedance 5 kn
Noise (oc too kHz) @ w 6/j. V rms
Gate reverse current Igss@ht 0.1 nA
Operating current 80 /iA
Maximum drain current loss 0.6 mAGain 0.7
Operating temperature -55°C to +150°C
SPECIFICATIONS
Using a P-channel M0SFET
Threshold voltage Vgshm -5V maxMaximum voltage BVgss ± 40 VInput impedance 5 x 10" ft
Output impedance 6.2 knNoise ioc imhii * i2v 25 (1 V rmsGate reverse current Igss -10pA maxOperating current loiom vos-vgs-ijv .... -2.5 mAMaximum drain current loss -50 mAGam 0.95
Operating temperature -55'C to + 150"C
Prototype and production quantities can be
made to meet specific applications.
The customer must specify:
1- Bias resistor Ri:
2- Source resistor R 2 :
3- Transistor:
Any Eltec highmegohm resistor
value, up to 1 x 10' 2 Q .
Any standard resistor
value and tolerance.
Specify FET and/or
specific requirements.
8-78
ELTEC
198

t 1 2 V DC
o
2N5457
6.80 kfl
Figure E-2. Schematic of Eltec Impedance Converterwith Constant Current Source Circuitry
199

3o>
100
Eltec Output Impedance
D 1 A/out
5 29e-23 2 00e-4 4.00e-4 6 00e-4 8.00e-4
Gload(mho)
<zL
CD
—
o
Current Supply Dropout
Figure E-3.
i ou -
120 - DD
G D
110 -
100 -
D Current (jxA)
90 -
80 -
70 -T T T—T- r- , r—r- i
t t -,—i—,—|—
^
-r T t—i
—
4 6 8 10
Voltage (Vdc)
12 14
Eltec 304 Output Impedance and CurrentSupply Dropout Curvesa. Based on the slope, the ouput impedanceof the microphone pre-amp is 3.03 knb. Supply current is maintained constantto voltages as low as 2 VDC
200

APPENDIX F. GAS DISTRIBUTION SYSTEM
Figure F-l. Gas Distribution System
201

REFERENCES
1. Fitzpatrick, M. , Electrodvnamic Driver for the SpaceThermoacoustic Refrigerator (STAR) . Masters Thesis,Naval Postgraduate School, Monterey, California, March1988. [DTIC Report No. ADA 192 337]
2. Rott, N. , "Thermoacoustics" , Advances in AppliedMechanics , Vol. 20, 1980.
3. Hofler, T. J., Thermoacoustic Refrigeration Design andPerformance , Ph.D. Dissertation, University ofCalifornia, San Diego, California, 1986.
4. Swift, G.W. , "Thermoacoustic Engines", Journal of theAcoustical Society of America , Vol. 84(4), p. 1145,1988.
5. Susalla, M. P., Thermodynamic Improvements for theSpace Thermoacoustic Refrigerator (STAR) , MastersThesis, Naval Postgraduate School, Monterey,California, June 1988. [DTIC Report No. ADA 196 958]
6. Get Away Special Team, Get Away Special (GAS) SmallSelf-contained Payloads—Experimenter Book , NationalAeronautics and Space Administration, Goddard SpaceFlight Center, Special Payloads Division, Greenbelt,MD, July 1984.
7. Boyd, A.W. , Kosinski, B.P., and Weston, R.L.,"Autonomous Measurement of Space Shuttle Payload BayAcoustics During Launch", Naval Research Reviews ,
Vol. 39(1) , p. 9, 1987.
8. Byrnes, R. B. , Control and Measurement of the SpaceThermoacoustic Refrigerator , Masters Thesis, NavalPostgraduate School, Monterey, California, June 1989.
9. Kinsler, L.E., Frey, A.R., Coppens, A.B., Sanders,J.V. , Fundamentals of Acoustics . Third Edition, p. 2,John Wiley and Sons, Inc., New York, NY, 1982.
10. Kinsler, L.E., Frey, A.R., Coppens, A.B., Sanders,J.V. , Fundamentals of Acoustics , Third Edition, pp. 231-235, John Wiley and Sons, Inc., New York, NY, 1982.
202

11. Hofler, T.J., Wheatley, J.C., Swift, G.W. , andMigliori, A., "Acoustic Cooling Engine", U.S. Patent4,722,201, 2 February 1988.
12. Landau, L.D. and Lifshitz, E.M. , Fluid Mechanics ,
Pergamon Press Inc., Elmsford, NY, 1959.
13. Hofler, T. J., "Accurate Acoustic Power Measurementswith a High-intensity Driver", Journal of theAcoustical Society of America . Vol. 83(2), p. 777,February 1988.
14. Kinsler, L.E., Frey, A.R., Coppens, A.B., Sanders,J. V., Fundamentals of Acoustics . Third Edition, p. 16,John Wiley and Sons, Inc., New York, NY, 1982.
15. Kinsler, L.E. , Frey, A.R. , Coppens, A.B., Sanders,J.V. , Fundamentals of Acoustics . Third Edition, pp. 351-353, John Wiley and Sons, Inc., New York, NY, 1982.
16. Kinsler, L.E., Frey, A.R. , Coppens, A.B., Sanders,J.V., Fundamentals of Acoustics . Third Edition, p. 208,John Wiley and Sons, Inc., New York, NY, 1982.
17. M cCarty, R.D., Computer code HELIUM . National Instituteof Standards and Technology, Boulder, CO, 1986.
203

INITIAL DISTRIBUTION LIST
No. Copies
1. Library, Code 0142 2
Naval Postgraduate SchoolMonterey, CA 93943-5002
2. Professor S.L. Garrett, Code 61GX 6
Naval Postgraduate SchoolMonterey, CA 93943-5000
3. Dr. T.J. Hofler, Code 61HF 3
Naval Postgraduate SchoolMonterey, CA 93943-5000
4. Professor A. A. Atchley, Code 61AY 1
Naval Postgraduate SchoolMonterey, CA 93943-5000
5. Commanding Officer 4
Naval Research LaboratoryATTN: E. Senasack (code 8220)
P. Hastman (code 8222)T. Kowocki (code 8222)C. Merk (code 8211)
4555 Overlook AvenueWashington, D.C. 20375-5000
6. Professor R. Panholtzer, Code 62PZ 2
Naval Postgraduate SchoolMonterey, CA 93943-5000
7. D. Rigmaiden, Code 72 1
Naval Postgraduate SchoolMonterey, CA 93043-5000
8. Los Alamos National LaboratoriesCondensed Matter and Thermal Physics (Group P-10)ATTN: Dr. G.W. Swift 1
P.O. Box 1663/MS 764Los Alamos, NM 87545
9. Lt. Michele Fitzpatrick 1
1634 W. Norwegian St.Pottsville, PA 17901
204

10. Lt. Michael P. Susalla4148 Mustang St.San Diego, CA 92111
11. National Center for Physical AcousticsATTN: LibrarianP.O. Box 847Fraternity RowUniversity, MS 38677
12. Lt. R.E. VolkertNaval Postgraduate SchoolSMC 1984Monterey, CA 9 3 943
13. Capt. D.A. HarrisP.O. Box 1854Greenwood, Nova ScotiaCanada BOP 1N0
14. Mr. F. M. Murray, P.E.JBL Incorporated8500 Balboa Blvd.Northridge, CA 91329
15. Lt. S. CobbSSD/CLFPDP.O. Box 92960LLAFBLos Angeles, CA 90009-2960
16. Mr. T. C. MooreDevelco, Inc.175 Nortech ParkwaySan Jose, CA 95142-2306
17. Mr. J. AdeffCode 61Naval Postgraduate SchoolMonterey, CA 93943
18. Mr. D.V. ConteProgram Manager - NGAS Magnavox1313 Production RoadFt. Wayne, IN 46808
19. Professor D.E. HallCalifornia State UniversityDepartment of Physics and Physical ScienceSacramento, CA 95819
205

20. Defense Technical Information CenterCameron StationAlexandria, VA 22304-6145
206

>Jb

_ SO "*


ThesisH289307c.l
Harris
„.Design and CaUution of an ,
callbra-fflic drive" L^^na-gerat°r (STAR;
Refri~
Thesis
H289307c.l
HarrisDesign and calibra-
tion of an electrodyna-mic driver for the SpaceThermoacoustic Refri-gerator (STAR).