Description and interpretation of the bracts epidermis of Gramineae (Poaceae) with rotated image...
7
Description and interpretation of the bracts epidermis of Gramineae (Poaceae) with rotated image with maximum average power spectrum (RIMAPS) technique Eduardo A. Favret a, * , Ne ´stor O. Fuentes b , Ana M. Molina c , Lorena M. Setten d a Instituto de Suelos, Centro de Investigaciones de Recursos Naturales (CIRN), Instituto Nacional de Tecnologı ´a Agropecuaria (INTA), De Las Caban ˜as y De Los Reseros s/n, 1686 Hurlingham, Buenos Aires, Argentina b Comisio ´n Nacional de Energı ´a Ato ´mica, GAEN – GIDAT – UA Materiales, Av. General Paz 1499, B1650KNA San Martı ´n, Buenos Aires, Argentina c Instituto de Recursos Biolo ´gicos, CIRN, INTA Castelar, De Las Caban ˜as y De Los Reseros s/n, 1686 Hurlingham, Buenos Aires, Argentina d Centro Milstein - Fundacio ´n Pablo Cassara ´ - Saladillo 2468 C1440FFX, Ciudad Auto ´noma de Buenos Aires, Argentina Received 17 July 2007; received in revised form 14 October 2007; accepted 15 October 2007 Abstract During the last few years, RIMAPS technique has been used to characterize the micro-relief of metallic surfaces and recently also applied to biological surfaces. RIMAPS is an image analysis technique which uses the rotation of an image and calculates its average power spectrum. Here, it is presented as a tool for describing the morphology of the trichodium net found in some grasses, which is developed on the epidermal cells of the lemma. Three different species of grasses (herbarium samples) are analyzed: Podagrostis aequivalvis (Trin.) Scribn. & Merr., Bromidium hygrometricum (Nees) Nees & Meyen and Bromidium ramboi (Parodi) Ru ´ golo. Simple schemes representing the real microstructure of the lemma are proposed and studied. RIMAPS spectra of both the schemes and the real microstructures are compared. These results allow inferring how similar the proposed geometrical schemes are to the real microstructures. Each geometrical pattern could be used as a reference for classifying other species. Finally, this kind of analysis is used to determine the morphology of the trichodium net of Agrostis breviculmis Hitchc. As the dried sample had shrunk and the microstructure was not clear, two kinds of morphology are proposed for the trichodium net of Agrostis L., one elliptical and the other rectilinear, the former being the most suitable. # 2007 Elsevier Ltd. All rights reserved. Keywords: RIMAPS technique; Taxonomy; SEM; Lemma; Poaceae; Trichodium net 1. Introduction Scanning electron microscopy (SEM) is one of the most useful tools used by botanists and taxonomists (Barthlott and Neinhuis, 1997; Neinhuis and Barthlott, 1997; Romero Garcı ´a et al., 1988; Ru ´golo and Molina, 1992, 1998; Molina and Ru ´golo de Agrasar, 2007). The use of this microscopic technique makes it possible to characterize biological surfaces in a manner based only on visual observation. Fuentes and Favret (2002) developed the rotated image with maximum average power spectrum (RIMAPS) technique, which allows determining the orientation and quantification of the micro-topography of a surface. Even though this technique has firstly been used to characterize metallic surfaces, it has been applied recently to the study of biological surfaces (Favret et al., 2003, 2006; Favret and Fuentes, 2004; Favret and Lo ¨thman, 2007). The present research work proposes RIMAPS technique as a tool for taxonomic studies. Some grasses (Poaceae) are characterized in the lemma by the presence of transverse thickening bars, called trichodium net (Bjo ¨rkman, 1960; Romero Garcı ´a et al., 1988; Ru ´golo and Molina, 1992, 1998; Ru ´golo de Agrasar and Molina, 2002; Molina and Ru ´golo de Agrasar, 2007). The exterior cell wall of the epidermis of the lemma is very thin, but in some species a kind of reinforcement occurs. This reinforcement imbricates with those of the neighboring cells and form the net known as trichodium net. The epidermis of the lemma of different species of grasses was analyzed with the SEM. Simple geometrical schemes representing the real microstructure of the lemma were www.elsevier.com/locate/micron Available online at www.sciencedirect.com Micron 39 (2008) 985–991 * Corresponding author. E-mail address: [email protected] (E.A. Favret). 0968-4328/$ – see front matter # 2007 Elsevier Ltd. All rights reserved. doi:10.1016/j.micron.2007.10.005
-
Upload
independent -
Category
Documents
-
view
0 -
download
0
Transcript of Description and interpretation of the bracts epidermis of Gramineae (Poaceae) with rotated image...

A
b
i
l
h
a
s
o
s
a
#
0
d
Description and interpretation of the bracts epidermis of Gramineae
(Poaceae) with rotated image with maximum average power
spectrum (RIMAPS) technique
Eduardo A. Favret a,*, Nestor O. Fuentes b, Ana M. Molina c, Lorena M. Setten d
a Instituto de Suelos, Centro de Investigaciones de Recursos Naturales (CIRN), Instituto Nacional de Tecnologıa Agropecuaria (INTA),
De Las Cabanas y De Los Reseros s/n, 1686 Hurlingham, Buenos Aires, Argentinab Comision Nacional de Energıa Atomica, GAEN – GIDAT – UA Materiales, Av. General Paz 1499, B1650KNA San Martın, Buenos Aires, Argentina
c Instituto de Recursos Biologicos, CIRN, INTA Castelar, De Las Cabanas y De Los Reseros s/n, 1686 Hurlingham, Buenos Aires, Argentinad Centro Milstein - Fundacion Pablo Cassara - Saladillo 2468 C1440FFX, Ciudad Autonoma de Buenos Aires, Argentina
Received 17 July 2007; received in revised form 14 October 2007; accepted 15 October 2007
bstract
During the last few years, RIMAPS technique has been used to characterize the micro-relief of metallic surfaces and recently also applied to
iological surfaces. RIMAPS is an image analysis technique which uses the rotation of an image and calculates its average power spectrum. Here, it
s presented as a tool for describing the morphology of the trichodium net found in some grasses, which is developed on the epidermal cells of the
emma. Three different species of grasses (herbarium samples) are analyzed: Podagrostis aequivalvis (Trin.) Scribn. & Merr., Bromidium
ygrometricum (Nees) Nees & Meyen and Bromidium ramboi (Parodi) Rugolo. Simple schemes representing the real microstructure of the lemma
re proposed and studied. RIMAPS spectra of both the schemes and the real microstructures are compared. These results allow inferring how
imilar the proposed geometrical schemes are to the real microstructures. Each geometrical pattern could be used as a reference for classifying
ther species. Finally, this kind of analysis is used to determine the morphology of the trichodium net of Agrostis breviculmis Hitchc. As the dried
ample had shrunk and the microstructure was not clear, two kinds of morphology are proposed for the trichodium net of Agrostis L., one elliptical
nd the other rectilinear, the former being the most suitable.
2007 Elsevier Ltd. All rights reserved.
eywords: RIMAPS technique; Taxonomy; SEM; Lemma; Poaceae; Trichodium net
www.elsevier.com/locate/micron
Available online at www.sciencedirect.com
Micron 39 (2008) 985–991
K
1. Introduction
Scanning electron microscopy (SEM) is one of the most
useful tools used by botanists and taxonomists (Barthlott and
Neinhuis, 1997; Neinhuis and Barthlott, 1997; Romero Garcıa
et al., 1988; Rugolo and Molina, 1992, 1998; Molina and
Rugolo de Agrasar, 2007). The use of this microscopic
technique makes it possible to characterize biological surfaces
in a manner based only on visual observation.
Fuentes and Favret (2002) developed the rotated image with
maximum average power spectrum (RIMAPS) technique,
which allows determining the orientation and quantification of
the micro-topography of a surface. Even though this technique
* Corresponding author.
E-mail address: [email protected] (E.A. Favret).
968-4328/$ – see front matter # 2007 Elsevier Ltd. All rights reserved.
oi:10.1016/j.micron.2007.10.005
has firstly been used to characterize metallic surfaces, it has
been applied recently to the study of biological surfaces (Favret
et al., 2003, 2006; Favret and Fuentes, 2004; Favret and
Lothman, 2007). The present research work proposes RIMAPS
technique as a tool for taxonomic studies.
Some grasses (Poaceae) are characterized in the lemma by
the presence of transverse thickening bars, called trichodium
net (Bjorkman, 1960; Romero Garcıa et al., 1988; Rugolo and
Molina, 1992, 1998; Rugolo de Agrasar and Molina, 2002;
Molina and Rugolo de Agrasar, 2007). The exterior cell wall of
the epidermis of the lemma is very thin, but in some species a
kind of reinforcement occurs. This reinforcement imbricates
with those of the neighboring cells and form the net known as
trichodium net.
The epidermis of the lemma of different species of grasses
was analyzed with the SEM. Simple geometrical schemes
representing the real microstructure of the lemma were

Fig. 1. SEM image of the Podagrostis aequivalvis lemma.
Fig. 3. SEM image of the Bromidium ramboi lemma.
Fig. 2. SEM image of the Bromidium hygrometricum lemma.
E.A. Favret et al. / Micron 39 (2008) 985–991986
proposed. Then, RIMAPS spectra of those schemes and the real
microstructures were compared. From this comparison it was
possible to infer how similar the geometrical schemes were to
the real microstructures. If this was the case, each correspond-
ing scheme could be used as a reference for classifying other
species.
2. Materials and methods
The abaxial epidermis of the lemma (middle section) was
observed in the following species of Poaceae: Podagrostis
aequivalvis (Trin.) Scribn & Merr; Bromidium hygrometricum
(Nees) Nees & Meyen; Bromidium ramboi (Parodi) Rugolo and
Agrostis breviculmis Hitchc.
The observations were carried out on herbarium material.
The material was previously cleaned with alcohol 908 or xilol
and then it was coated with gold–palladium. The morphology
of the epidermis of the lemma was analyzed with a SEM Philips
500. Simple patterns or schemes of the epidermis based on the
micrographs were done for comparison purposes. Only the wall
or boundaries of the cells and trichodium nets were drawn on
the scheme. The Power Point program (Microsoft Office) was
used for drawing the patterns.
2.1. RIMAPS technique
RIMAPS is a new imaging characterization technique
independent of the class of microscopy and of conditions used
for observation as long as they remain constant (Fuentes and
Favret, 2002; Favret et al., 2003, 2006; Favret and Fuentes,
2004; Favret and Lothman, 2007).
This technique involves rotating the image using available
algorithms of commercial software and computing one space-
variable integral of the two-dimensional Fourier transform
for each value of the other variable (Elliot and Rao, 1982;
Gorcester et al., 1989; Mc Donough and Whalen, 1995;
Gonzalez-Velasco, 1996; Felinger, 1998; Ozaktas et al.,
1999; Takeda, 2000; Jeffrey, 2001; Smith, 2002; Palm, 2003;
Palmblad and Bergquist, 2003). The commercial software
used was a demo version of Mountains Map, which could be
run in a computer with Intel Pentium IV processors and
512 MB RAM.
The mathematical procedure is essentially the rotation of the
digitised image I(x, y) a certain angle a, and the calculation of
the x-step of the two-dimensional Fourier transform for each y-
line of the new image Ia(x, y) obtained after rotation:
Iaðnx; yÞ ¼Z 1�1
Iaðx; yÞ expð�inxxÞ dx: (1)
Results from Eq. (1) are averaged over all the y-coordinate of
the image and an average power spectrum (APS) is obtained for
each angular position:
AaðnxÞ ¼ jhIaðnx; yÞi�hIaðnx; yÞij; (2)
where hi means average value and with Iaðnx; yÞh i� being the
complex conjugate of Iaðnx; yÞh i. If the set of maximum values,

Fig. 4. (a) Scheme of the epidermis surface seen in Fig. 1. (b) Scheme of the epidermis surface, including prickles, seen in Fig. 1.
Fig. 5. Scheme of the epidermis surface seen in Fig. 2.
E.A. Favret et al. / Micron 39 (2008) 985–991 987
in arbitrary units (a.u.), of all average power spectra (MAPS):
MðaÞ ¼ max AaðnxÞ; (3)
is plotted as a function of the angle of rotation (typically steps
of 18) of original image (RI), valuable information can be
obtained from the surface pattern under study (Fuentes and
Favret, 2002). The peaks appearing in the resulting plots
indicate surface pattern orientation.
In the present paper we focus our study on the shape of the
curves and the relative position of peaks, but not specifically on
the intensity and shape of them. Images from the ideal regular
patterns and the experimental patterns were analyzed using this
technique. As the RIMAPS spectra show symmetry after a full
rotation of 3608, only the first 1808 are presented in the graphs.
The apical direction corresponds, in the graphs, to the angular
position of 908.
3. Results
Figs. 1–3 shows the microstructure of the lemma of P.
aequivalvis, B. hygrometricum and B. ramboi. Figs. 4–6
represent the respective simplified schemes of the epidermis
surface of the lemma. These schemes only consider the
boundaries of the epidermis cells and trichodium net seen in
Figs. 1–3 and not the prickles, except in Fig. 4b where they are
taken into account. They correspond to the studied species: P.
aequivalvis (Fig. 4a and b), B. hygrometricum (Fig. 5) and B.
ramboi (Fig. 6). As the number of prickles seen in Fig. 2 is very
low, they have not been considered in the corresponding
scheme design (Fig. 5).
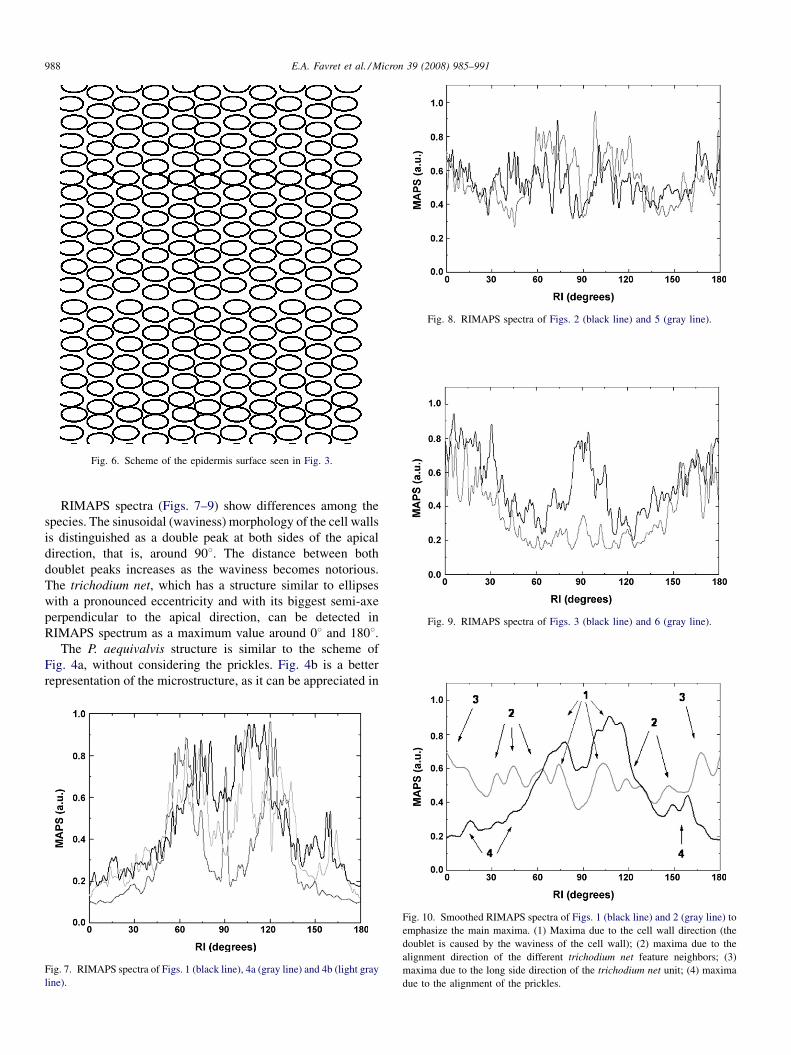
Fig. 6. Scheme of the epidermis surface seen in Fig. 3.
Fig. 8. RIMAPS spectra of Figs. 2 (black line) and 5 (gray line).
Fig. 9. RIMAPS spectra of Figs. 3 (black line) and 6 (gray line).
E.A. Favret et al. / Micron 39 (2008) 985–991988
RIMAPS spectra (Figs. 7–9) show differences among the
species. The sinusoidal (waviness) morphology of the cell walls
is distinguished as a double peak at both sides of the apical
direction, that is, around 908. The distance between both
doublet peaks increases as the waviness becomes notorious.
The trichodium net, which has a structure similar to ellipses
with a pronounced eccentricity and with its biggest semi-axe
perpendicular to the apical direction, can be detected in
RIMAPS spectrum as a maximum value around 08 and 1808.The P. aequivalvis structure is similar to the scheme of
Fig. 4a, without considering the prickles. Fig. 4b is a better
representation of the microstructure, as it can be appreciated in
Fig. 7. RIMAPS spectra of Figs. 1 (black line), 4a (gray line) and 4b (light gray
line).
Fig. 10. Smoothed RIMAPS spectra of Figs. 1 (black line) and 2 (gray line) to
emphasize the main maxima. (1) Maxima due to the cell wall direction (the
doublet is caused by the waviness of the cell wall); (2) maxima due to the
alignment direction of the different trichodium net feature neighbors; (3)
maxima due to the long side direction of the trichodium net unit; (4) maxima
due to the alignment of the prickles.
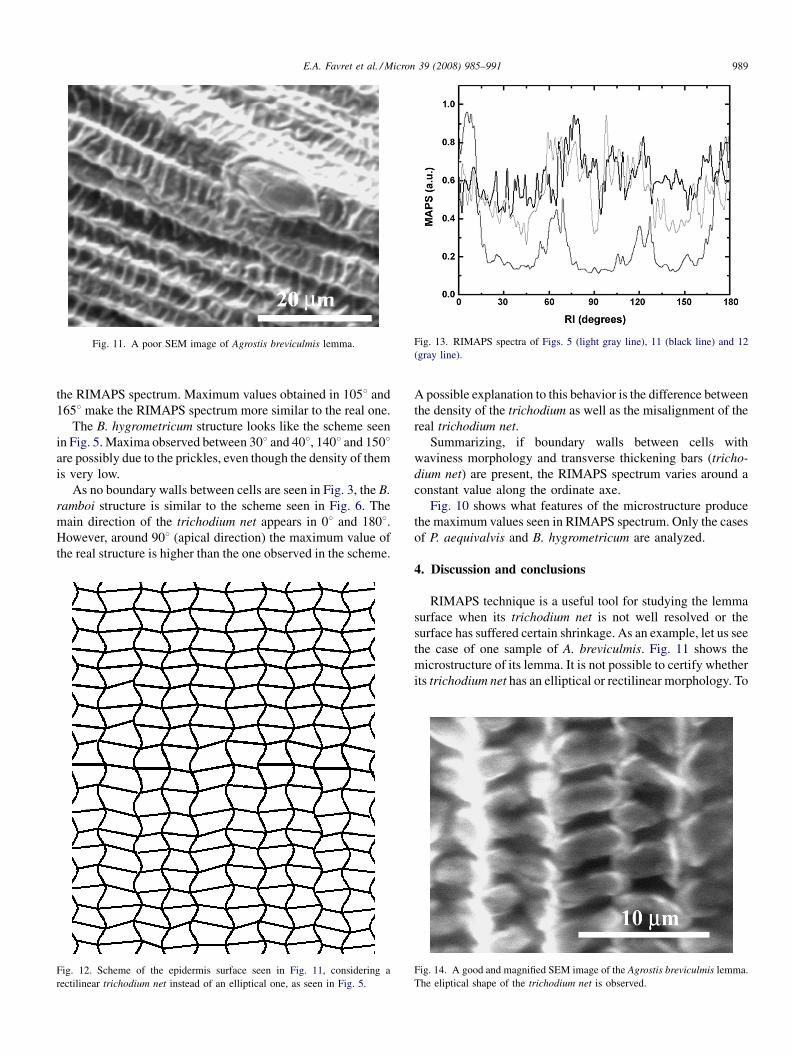
Fig. 11. A poor SEM image of Agrostis breviculmis lemma. Fig. 13. RIMAPS spectra of Figs. 5 (light gray line), 11 (black line) and 12
(gray line).
E.A. Favret et al. / Micron 39 (2008) 985–991 989
the RIMAPS spectrum. Maximum values obtained in 1058 and
1658 make the RIMAPS spectrum more similar to the real one.
The B. hygrometricum structure looks like the scheme seen
in Fig. 5. Maxima observed between 308 and 408, 1408 and 1508are possibly due to the prickles, even though the density of them
is very low.
As no boundary walls between cells are seen in Fig. 3, the B.
ramboi structure is similar to the scheme seen in Fig. 6. The
main direction of the trichodium net appears in 08 and 1808.However, around 908 (apical direction) the maximum value of
the real structure is higher than the one observed in the scheme.
Fig. 12. Scheme of the epidermis surface seen in Fig. 11, considering a
rectilinear trichodium net instead of an elliptical one, as seen in Fig. 5.
A possible explanation to this behavior is the difference between
the density of the trichodium as well as the misalignment of the
real trichodium net.
Summarizing, if boundary walls between cells with
waviness morphology and transverse thickening bars (tricho-
dium net) are present, the RIMAPS spectrum varies around a
constant value along the ordinate axe.
Fig. 10 shows what features of the microstructure produce
the maximum values seen in RIMAPS spectrum. Only the cases
of P. aequivalvis and B. hygrometricum are analyzed.
4. Discussion and conclusions
RIMAPS technique is a useful tool for studying the lemma
surface when its trichodium net is not well resolved or the
surface has suffered certain shrinkage. As an example, let us see
the case of one sample of A. breviculmis. Fig. 11 shows the
microstructure of its lemma. It is not possible to certify whether
its trichodium net has an elliptical or rectilinear morphology. To
Fig. 14. A good and magnified SEM image of the Agrostis breviculmis lemma.
The eliptical shape of the trichodium net is observed.
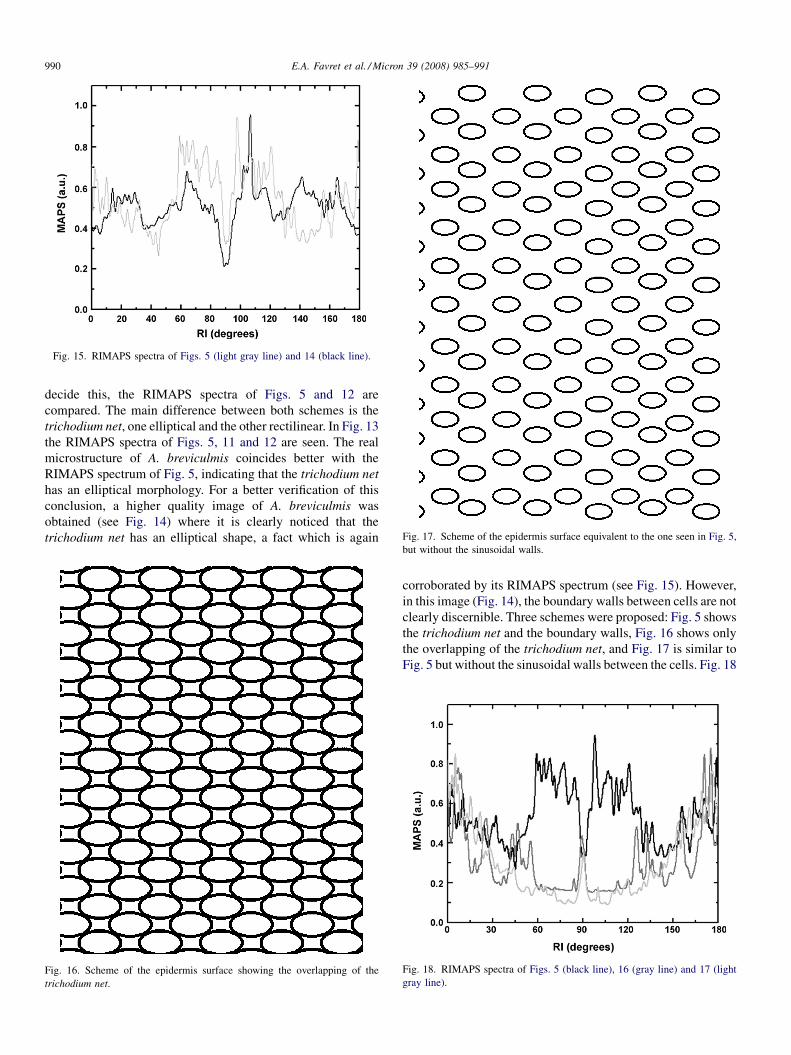
Fig. 17. Scheme of the epidermis surface equivalent to the one seen in Fig. 5,
Fig. 15. RIMAPS spectra of Figs. 5 (light gray line) and 14 (black line).
E.A. Favret et al. / Micron 39 (2008) 985–991990
decide this, the RIMAPS spectra of Figs. 5 and 12 are
compared. The main difference between both schemes is the
trichodium net, one elliptical and the other rectilinear. In Fig. 13
the RIMAPS spectra of Figs. 5, 11 and 12 are seen. The real
microstructure of A. breviculmis coincides better with the
RIMAPS spectrum of Fig. 5, indicating that the trichodium net
has an elliptical morphology. For a better verification of this
conclusion, a higher quality image of A. breviculmis was
obtained (see Fig. 14) where it is clearly noticed that the
trichodium net has an elliptical shape, a fact which is again
but without the sinusoidal walls.Fig. 16. Scheme of the epidermis surface showing the overlapping of the
trichodium net.
corroborated by its RIMAPS spectrum (see Fig. 15). However,
in this image (Fig. 14), the boundary walls between cells are not
clearly discernible. Three schemes were proposed: Fig. 5 shows
the trichodium net and the boundary walls, Fig. 16 shows only
the overlapping of the trichodium net, and Fig. 17 is similar to
Fig. 5 but without the sinusoidal walls between the cells. Fig. 18
Fig. 18. RIMAPS spectra of Figs. 5 (black line), 16 (gray line) and 17 (light
gray line).

E.A. Favret et al. / Micron 39 (2008) 985–991 991
compares the RIMAPS spectra of the three schemes, and shows
the coincidence between Fig. 5 and the microstructure of A.
breviculmis.
These geometrical schemes used as models contribute to
represent the microstructure of the lemma in a simple way. The
comparison between the RIMAPS spectra of real surfaces and
the designed patterns will enable the researcher to find the real
trichodium net morphology when the SEM images are not clear
enough.
Acknowledgements
The authors express their appreciation to Dr. Patricia
Bozzano, Mrs. Adriana Domınguez and Lic.Graciela Favret for
their help on the work.
References
Barthlott, W., Neinhuis, C., 1997. Purity of the sacred lotus, or escape from
contamination in biological surfaces. Plantarum 202, 1–8.
Bjorkman, J., 1960. Studies in Agrostis and related genera. Symb. Bot. Upsala
17 (1), 1–112.
Elliot, D., Rao, K., 1982. Fast Transforms Algorithms, Analyses, Applications.
Academic Press, New York, pp. 448.
Favret, E., Fuentes, N., 2004. RIMAPS and variogram analysis of barley leaf
surfaces. Microsc. Today.
Favret, E., Lothman, P., 2007. RIMAPS image analysis of biological and
technical non-wettable surfaces. Microsc. Anal. 21 (1), 7–9.
Favret, E., Fuentes, N., Molina, A., 2003. Identification of botanical species
using RIMAPS analysis on images from leaf surfaces. Microsc. Microanal.
9 (Suppl. 2), 1338–1339.
Favret, E., Fuentes, N., Molina, A., 2006. Quantitative study of Xanthosoma
violaceum leaf surfaces using RIMAPS and variogram techniques. Microsc.
Res. Tech. 69, 684–688.
Felinger, A., 1998. Data Analysis and Signal Processing in Chromatography.
Elsevier Science, New York, pp. 19–40; 167–173; 241–247; 279–286;
385–406.
Fuentes, N., Favret, E., 2002. A new surface characterization technique:
RIMAPS (rotated image with maximum average power spectrum). J.
Microsc. 206, 72–83.
Gonzalez-Velasco, E., 1996. Fourier Analysis and Boundary Value Problems.
Academic Press, New York, p. 551.
Gorcester, J., Millhauser, G.L., Freed, J.H., 1989. Two-dimensional and Fourier
transform EPR. In: Hoff, A.J. (Ed.), Advanced EPR. Applications in
Biology and Biochemistry. Elsevier Science, Amsterdam, pp. 105–125.
Jeffrey, A., 2001. Advanced Engineering Mathematics ISE International Edi-
tion. Academic Press, New York, pp. 545–622.
Mc Donough, R., Whalen, A., 1995. Detection of Signals in Noise, second ed.
Academic Press, New York, pp. 24–25; 52–54; 96–101.
Molina, A.M., Rugolo de Agrasar, Z.E., 2007 (inedito). Estudio Taxonomico de
las especies americanas del genero Podagrostis (Griseb.) Scribn. & Merr.
(Poaceae: Agrostideae).
Neinhuis, C., Barthlott, W., 1997. Characterisation and distribution of water-
repellent, self-cleaning plant surfaces. Ann. Bot. 79, 667–677.
Ozaktas, H.M., Alper Kutay, M., Mendlovic, D., 1999. Introduction to the
fractional Fourier transform and its applications, in: Kazan, B., Mulvey, T.,
(Serial Eds.) Hawkes, P., Editor in Chief, Advances in Imaging and Electron
Physics, vol. 106. Academic Press, New York, pp. 239–286.
Palm, A., 2003. Capillary isoelectric focusing developments in protein analysis.
In: Marko-Varga, G., Oroszlan, P. (Eds.), Emerging Technologies in Protein
and Genomic Material Analysis. Journal of Chromatography Library, vol.
68. Elsevier Science, New York, pp. 118–122; 209–210.
Palmblad, M., Bergquist, J., 2003. Identification and characterization of pep-
tides and proteins using Fourier transform ion cyclotron resonance mass
spectrometry. In: Marko-Varga, G., Oroszlan, P. (Eds.), Emerging Tech-
nologies in Protein and Genomic Material Analysis. Journal of Chromato-
graphy Library, vol. 68. Elsevier Science, New York, pp. 209–210.
Romero Garcıa, A.T., Blanca Lopez, G., Morales Torres, 1988. Revision del
genero Agrostis (Poaceae) en la Penınsula Iberica. Ruizia 7, 1–160.
Rugolo, Z.E., Molina, A.M., 1992. Las especies del genero Agrostis (Grami-
neae: Agrosteae) de la Argentina. Parodiana 7 (1–2), 179–255.
Rugolo, Z.E., Molina, A.M., 1998. Las especies del genero Agrostis L.
(Gramineae: Agrostideae) de Chile, Gayana. Botany 54, 91–156.
Rugolo de Agrasar, Z.E., Molina, A.M., 2002. El genero Lachnagrostis
(Gramineae:Agrostideae) en America del Sur: 20–32. In: En Freire-Fierro,
A., Nelly, D.A. (Eds.), La Botanica en el Nuevo Milenio, Memorias del III
Congreso Ecuatoriano de Botanica. Publicaciones de la Fundacion Ecua-
toriana para la Investigacion y el Desarrollo de la Botanica FUNBOTA-
NICA 4. Quito, 260 pp.
Smith, S., 2002. Digital Signal Processing: A Practical Guide for Engineers and
Scientists. Newnes, New York, 141–260, 311–318, 567–580.
Takeda, M., 2000. Fourier transform profilometry. In: Rastogi, P.K., Inaudi, D.
(Eds.), Trends in Optical Non-Destructive Testing and Inspection. Elsevier
Science, New York, pp. 576–600.