Multinucleon mechanisms in (gamma,N) and (gamma,NN) reactions
Upload
fz-juelichCategory
view
4download
0
arX
iv:p
hysi
cs/0
6110
11v1
[ph
ysic
s.m
ed-p
h] 1
Nov
200
6 Universidad De Valen iaDepartamento de Físi a Atómi a, Mole ular y Nu learConsejo Superior de Investiga iones Científi as
Depth of Intera tion Enhan edGamma-Ray Imagingfor Medi al Appli ations
Christoph Werner Ler heTesis Do toralJunio 2006


To Judit and Evai

ii

Abstra tA novel design for an inexpensive depth of intera tion apable dete tor forgamma rays, suitable for nu lear medi al appli ations, espe ially PositronEmission Tomography, has been developed, studied via simulations, andtested experimentally. The design takes advantage of the strong orrela-tion between the width of the s intillation light distribution in ontinuous rystals and the depth of intera tion of the gamma-ray. For measuringthe distribution width, an inexpensive modi ation of the ommonly used harge dividing ir uits that allows analogue and instantaneous omputa-tion of the 2nd moment has been developed and is presented in this work.This measurement does not ae t the determination of the entroids ofthe light distribution. The method has been tested with a dete tor madeof a ontinuous LSO-s intillator of dimensions 42x42x10 mm3 and opti- ally oupled to the ompa t large area position sensitive photomultiplierH8500 from Hamamatsu. The mean resolution in all non-trivial momentswas found to be rather high (smaller than 5%). However the dire t useof these moments as estimates for the three-dimensional photo onversionposition turned out to be unsuitable. Espe ially, for gamma-ray impa tpositions near the edges and orners of the s intillation rystal, there is astrong interdependen e between rst and se ond moments. Nevertheless,it ould be demonstrated that the measurement of the entroids is not af-fe ted at all by the simultaneous measurement of the se ond moment. Alsoit is has been shown that the bare moments an be used to re onstru t thetrue photo onversion position. This is a typi al inverse problem also knownas the trun ated moment problem. Standard polynomial interpolation inhigher dimensions has been adopted to re onstru t the impa t positions ofthe gamma-rays from the measured moments. For this, a parameterizationof the signal distribution has been derived in order to predi t the momentresponse of the dete tor for all possible gamma-ray impa t positions in-side the s intillation rystal. The starting point is the inverse square lawbut other important ee ts have been in luded: refra tion and Fresneltransition at the rystal-window interfa e, angular response of the photo- athode, exponential attenuation of the s intillation light, and ba kgroundfrom residual diuse ree tions at the bla k painted rystal surfa es. Thismodel has been veried by experiment. For the three non-trivial moments,a very good agreement with measurements was observed. When using there onstru ted impa t positions, the intrinsi mean spatial resolution of thedete tor was found to be 1.9mm for the transverse omponents and 3.9mmfor the depth of intera tion. Using dire tly the bare moments as positionestimate, the intrinsi mean spatial resolution of the dete tor was foundto be 3.4mm and 4.9mm, respe tively. The ost for the required dete torimprovements are essentially negligible.iii

iv

Resumen en CastellanoT pure and simple truth is rarely pure and ner simple.Os ar Wil, ⋆ 1854 † 1900Ante edentes, Objetivos y Organiza ión del TrabajoEN los últimos años, las té ni as de imagen en Medi ina Nu lear han ganado en importan ia debido asus éxitos en el diagnósti o de on ología, neurología y ardiología. Imágenes tridimensionales puedenser obtenidas a tualmente por tomografía omputerizada, mediante resonan ia magnéti a nu lear (RMN)o mediante el empleo de isótopos radioa tivos in orporados en una droga o en un ompuesto biológi oa tivo en general. La tomografía por emisión de positrones (Positron Emission Tomography o PET eninglés), gammagrafía y tomografía por emisión de un solo fotón (Single Photon Emision Tomography,SPECT) son las té ni as más usadas en diagnósti o por imagen en Medi ina Nu lear y se basan en lare onstru ión de la distribu ión de pequeñas antidades de radiofárma os administrados previamente. Siel radiofárma o administrado es espe í o para un ierto pro eso metabóli o, el empleo de los mediosdiagnósti os permite estudiar, ara terizar y valorar este mismo pro eso. Las imágenes obtenidas son portanto imágenes fun ionales del uerpo entero, de órganos o de las élulas. Por el ontrario, imágenes médi asobtenidas por rayos X, tomografía omputerizada, e ografía o similares aportan informa ión morfológi ay estru tural del uerpo o de los órganos. La RMN es apaz de propor ionar imágenes estru turales yfun ionales, aunque la RMN fun ional requiere la administra ión de grandes antidades de sustan ias de ontrastes y su sensibilidad es de alrededor de seis ordenes de magnitud inferior que la de PET, SPECT ygammagrafía.Los dete tores de entelleo han onstituido durante años los instrumentos primordiales para la dete iónde la radia ión gamma pro edente de los radiofárma os. Los más simples omprenden un úni o ristal de entelleo y un úni o fotodete tor. Para obtener imágenes on di ho dete tor se inventó el es áner re tilíneoque aporta la informa ión espa ial al mover el dete tor sobre el objeto, registrando a la vez su señal junto on su posi ión a tual. La primera ámara gamma fue desarrollada por Hal Anger en 1952 y onsistió en un ristal y 7 fotomultipli adores on una lógi a analógi a (lógi a de Anger) que al ula las posi iones por suma on pesos. La ongura ión de ámaras gamma a tuales se diferen ia muy po o de este primer diseño aunquelos onstituyentes modernos de di has ámaras se han mejorado signi ativamente en los últimos años. Hoyen día hay una amplia gama de ristales entelladores on muy diferentes propiedades y lo mismo o urre on los fotodete tores. Una mejora muy importante de los últimos años es el uso de sistemas de dínodosespe iales para que los fotomultipli adores sean sensibles a la posi ión (Position Sensitive PhotomultiplierTube, PSPMT). Esto hizo posible el desarrollo de ámaras gamma muy ompa tas para su apli a ión en lavisualiza ión de órganos pequeños. La gran mayoría de dete tores de rayos-γ para todas las modalidadesde Medi ina Nu lear son ámaras de este tipo y que se han espe ializado para su fun ión eligiendo los omponentes más ade uados.Desgra iadamente, los dete tores de entelleo para rayos-γ, en general, pade en de un problema omún.Dado que los ristales de entelleo han de ser de un grosor nito para onseguir parar los rayos-γ que sepretenden dete tar, ellos mismos introdu en una in ertidumbre debido al he ho de que hasta el día de hoyexisten po as té ni as ya omer ializadas para dete tar la profundidad de intera ión del rayo-γ dentrodel ristal entellador. Como onse uen ia, la posi ión del origen del rayo-γ no se al ula orre tamente, ondu iendo al error de paralaje. Este error es espe ialmente importante para la modalidad PET porque losfotones de aniquila ión que se tienen que dete tar tienen una energía alta de 511 keV y en onse uen ia suprobabilidad de ser dete tados es relativamente baja. Para dete tores de PET on una e ien ia intrínse aa eptable, entelladores gruesos son ne esarios. Debido a la falta de una omponente de la posi ión dev

foto onversión, el origen de la radia ión γ no se puede omputar exa tamente siempre que la in iden iadel rayo-γ no es normal respe to al plano del área sensible del fotodete tor. Este error es espe ialmenteimportante para puntos de la región de interés lejos del entro del dete tor.En los últimos años se han dedi ado mu hos esfuerzos a mejorar los parámetros laves omo e ien iaintrínse a, resolu ión espa ial y resolu ión energéti a. La dete ión de la profundidad de intera ión esuno de estos ampos de investiga ión. Entre los métodos más ono idos para determinar la profundidadde intera ión gura la llamada té ni a phoswi h que usa el he ho de que los tiempos de desintegra ión(desex ita ión) de diferentes entelladores se distinguen entre ellos y por lo tanto dan lugar a pulsos de luzde entelleo de diferente dura ión (Seidel et al. [1). Usando dos materiales de entelleo diferentes, se puededeterminar en ual de los dos ristales se ha efe tuado la foto- onversión del rayo-γ. Las desventajas sonla ne esidad de dos ristales distintos para ada dete tor y la ele tróni a para diferen iar los dos tiemposde aída de la señal. Otra té ni a muy usada es el light-sharing (Moses and Derenzo [2). Esta té ni ase usa sobre todo on ristales pixelados y requiere dos fotodete tores de los uales por lo menos uno hade aportar la informa ión espa ial. Para ada pixel del entellador, se puede dedu ir la profundidad deintera ión usando el reparto de la luz de entelleo entre los dos dete tores. Uno de los fotodete torestiene que ser un dete tor de semi ondu tores para no atenuar demasiado los rayos-γ. A parte de estas dosté ni as existen otras posibilidades no tan omunes. Una gran desventaja de los métodos men ionados es lane esidad de foto-dete tores o/y ristales de entelleo adi ionales para realizar la medida de la profundidadde intera ión. Debido a que estos omponentes son los más aros de un dete tor, estas té ni as en are eríansigni ativamente su onstru ión. Para permitir el amplio uso de métodos diagnósti os por imagen, tantoen medi ina omo en la investiga ión se requieren té ni as baratas y on razonables presta iones. La segundadesventaja de todas las té ni as, a ex ep ión del light-sharing, es que la resolu ión de la profundidad deintera ión es no- ontinua (dis reta) y que esta depende del tamaño de los pixels.El objetivo prin ipal de este trabajo fue el desarrollo de un dete tor de rayos-γ de un oste de fabri a iónredu ido pero on presta iones omparables a los de otros dete tores a tuales. Con este n, se emplearon ristales de entelleo ontinuos y de grandes dimensiones, ya que de esta forma se puede evitar el ostosopro eso de segmenta ión de los ristales. Se estima que este pro eso en are e el ristal en un fa tor 7debido al material del entellador que se pierde y también a las rupturas involuntarias. El uso de unfotomultipli ador sensible a la posi ión y on un área sensible elevada se fundamenta en una redu ión enlos ostes de fabri a ión. Aunque estos dispositivos son relativamente aros, el pre io por unidad de áreasensible no es muy elevado. Varios estudios anteriores mostraron, que el empleo de ristales ontinuos esproblemáti o espe ialmente para la tomografía por emisión de positrones. Debido a la elevada energía delos fotones de aniquila ión, los ristales deben tener un grosor también elevado para asegurar una e ien iaintrínse a de dete ión su ientemente alta. Esto introdu e varia iones importantes en la distribu ión deluz de entelleo que dependen de la profundidad del impa to de rayo-γ y de su posi ión en el plano delfoto átodo. Obviamente, la determina ión de la posi ión del impa to es más difí il que en el aso de ristalespixelados en el que es su iente identi ar el pixel a tivo. El empleo de ristales ontinuos requiere analizarla distribu ión de luz y dedu ir a partir de este análisis los parámetros de impa to. Por su extremadamentebajo oste, el método más omún es el algoritmo de entro de gravedad. Desgra iadamente, su uso junto on ristales gruesos produ e efe tos no lineales y dependientes de la profundidad de intera ión er a delos bordes de los ristales. Como resultado se perjudi a la resolu ión espa ial y energéti a en estas zonas,siempre que la profundidad de intera ión no pueda ser medida (Freifelder et al. [3, Siegel et al. [4, Seidelet al. [5, Joung et al. [6). No obstante, la ongura ión de un ristal ontinuo on un fotomultipli adorsensible a la posi ión y de área sensible amplia ofre e la estima ión de la profundidad de intera ión apartir de la an hura de la distribu ión de luz de entelleo dete tada (Kenneth et al. [7, Anti h et al.[8). El prin ipal problema onsiste en medir esta an hura de forma rápida y on modi a iones de bajo oste. La digitaliza ión de ada uno de los segmentos del ánodo permite su ál ulo pero requiere mu hos anales ele tróni os. Si se implementara este método en un PET de animales pequeños ompuesto por o homódulos y ada uno on un PSPMT de 64 anales se requerirían en total 512 anales ele tróni os. Para unaversión on PSPMTs on 256 anales, el número se uadrupli a. In luso on muy bajos ostes por anal,el oste total para el sistema de adquisi ión de datos, alma enamiento y pro esamiento sería elevado.La idea fundamental para la resolu ión de este problema es una pequeña mejora de los ir uitos dedivisión de arga que se usan para la implementa ión analógi a del algoritmo de entro de gravedad y seexpli a de la siguiente manera: el ómputo del entroide o del primer momento de una distribu ión dis retade argas se puede realizar on una adena de resisten ias del mismo valor. Una arga que se inye ta enuna de las inter onexiones de la adena se divide en dos fra iones. Según la posi ión donde se inye ta la arga, estas fra iones tienen diferentes valores siendo su suma siempre la misma. Si las fra iones de argasvi

varían linealmente on la posi ión, la diferen ia de las argas totales extraídas de los extremos de la adenade resisten ias es propor ional a la posi ión de la inye ión, o, lo que es lo mismo, al entroide. La varia iónlineal de las argas se onsigue on una varia ión lineal de las resisten ias y por lo tanto on resisten ias deigual valor. Esto impli a que la arga inye tada ve la onexión en paralelo de las dos ramas de la adena.Como la varia ión de las resisten ias on la posi ión es lineal, la varia ión de la impedan ia total vista porla arga es uadráti a. Teniendo en uenta que la an hura de la distribu ión de luz en ristales ontinuosesta orrela ionada on la profundidad de intera ión y que la desvia ión estándar es un buen estimadorestadísti o para la an hura de una distribu ión, la observa ión de la odi a ión uadráti a de los voltajesofre e un método muy e az para la medida de la profundidad de intera ión.El punto de partida del presente trabajo se basó en estas observa iones ya que el desarrollo de ir uitosde división de arga, on apa idad para medir un momento adi ional sin perjudi ar la medida de los en-troides, puede propor ionar un diseño para dete tores de rayos-γ relativamente barato pero on presta ionessimilares a los de los diseños basados en ristales segmentados. No obstante, la mera medida del segundomomento o de la desvia ión estándar a partir del segundo momento y de los entroides no es su iente paraobtener una buena resolu ión espa ial. Aunque la medida de la profundidad de intera ión pueda ayudara eliminar el error de paralaje, la resolu ión espa ial intrínse a de los dete tores empeora sustan ialmenteha ia los bordes del ristal debido a que los entroides están sometidos a una ompresión no lineal y de-pendiente de la profundidad de intera ión. Este último he ho posibilita la re onstru ión de la posi iónverdadera del impa to del rayo-γ a partir de los tres primeros momentos no triviales. Este problema es unproblema inverso típi o pero también se ono e omo el problema de los momentos trun ados (Tka henkoet al. [9). Se trata de re onstruir la distribu ión a partir de una se uen ia in ompleta de los momentos deesta.Este trabajo esta organizado de la siguiente manera. Tras una introdu ión general e históri a a lamateria de Medi ina Nu lear en el apitulo 1 se re apitulan en el apitulo 3 el diseño típi o para dete toresde rayos-γ para esta dis iplina, sus limita iones más omunes y propuestas de mejoras. El apitulo 2 resumela motiva ión para este trabajo. Una gran parte del trabajo se destinó al estudio de las distribu iones deluz de entelleo ( apitulo 4) y al diseño y omportamiento teóri o de ir uitos de división de arga on apa idad de omputar analógi amente el segundo momento ( apitulo 5). Cada uno de los dos apítulos sepuede leer on independen ia. En los apítulos 7 y 8 se tratan respe tivamente la valida ión experimental delos resultados de los apítulos anteriores y un algoritmo para re onstruir la posi ión del impa to del rayo-γa partir de las medidas propor ionadas por las ir uitos de división de arga modi adas. Finalmente, seresumen los resultados más importantes en las on lusiones ( apitulo 9).El apitulo 4 está dedi ado al estudio del reparto de luz de entelleo sobre el área sensible del fotode-te tor. Para este n se optó por el uso de una parametriza ión analíti a de los efe tos supuestamente másimportantes. No se usó el método de las simula iones Monte Carlo aunque es muy omún para estudiossimilares. Las razones para esta de isión son la mejor omprensión de la distribu ión de luz de entelleonalmente dete tada y, una vez en ontrado un modelo able y onforme on las observa iones, su adop iónmás sen illa a nuevos diseños de dete tores. Para llegar a las mismas on lusiones que permite tal modeloanalíti o on simula iones de Monte Carlo, mu has horas de simula ión y mu has repeti iones on diferen-tes parámetros hubieran sido ne esarias. En todo aso, simula iones de Monte Carlo in luyen los mismosefe tos físi os ono idos que se in luyeron en la parametriza ión usada en este trabajo pero on la ventajade que el modelo analíti o permite atribuir fá ilmente detalles de la distribu ión a efe tos fundamentalesaislados. Por ejemplo, se puede estudiar muy bien on este modelo el efe to de usar ristales de extensiónespa ial nita. Simplemente hay que estable er un modelo para un ristal de dimensiones nitas y otro ondimensiones innitas y omparar los resultados. En el aso de simula iones de Monte Carlo, ni siquiera esposible ha er esta ompara ión. A parte de esto, las simula iones se llevan a abo evento por evento, esde ir, fotón por fotón, y por lo tanto requieren un tiempo elevado de omputa ión.En el modelo de la distribu ión de luz de entelleo se in luyeron lo siguientes efe tos: El punto departida fue la ley del inverso uadrado que des ribe el reparto de intensidades en super ies esféri as parafenómenos de radia ión. Se ha de tener en uenta que los fotodete tores en general (y en parti ular elque se usa para este trabajo) disponen de una super ie plana para la dete ión de los fotones. Por lotanto hay que multipli ar por el oseno del ángulo de in iden ia para ompensar la diferen ia de las áreasirradiadas. Otro efe to fundamental es la auto-absor ión de luz de entelleo por el mismo ristal entellador.Aunque esta es normalmente muy baja por razones obvias, puede resultar relevante para posibles aminosde luz muy largos. La auto-absor ión obede e la ley de atenua ión exponen ial. Sobre todo para puntos deobserva ión lejos de la posi ión de impa to se redu irá la intensidad dete tada de la luz. Estri tamente, lavii

atenua ión exponen ial in luye dos efe tos: la absor ión y la dispersión elásti a de la luz in idente. Estaúltima ontribu ión ausa un fondo de luz ya que la luz distribuida puede ser dete tada en otro punto dela super ie sensible del fotodete tor. Se supone que esta ontribu ión es muy baja y no se in luyó en elmodelo.El siguiente efe to es debido al interfaz ópti o entre el fotodete tor y el ristal de entelleo. Para suprote ión, los fotodete tores disponen siempre de una ventana de entrada he ha de un material transpa-rente para la radia ión que se quiere dete tar. Esta ventana es de un grosor nito y en general su índi ede refra ión es diferente al del ristal de entelleo. Mu hos de los ristales de entelleo on apli a iónpara Medi ina Nu lear tienen un índi e de refra ión muy elevado y mayor al de la ventana de entrada delfotodete tor. En este interfaz ópti o se produ e reexión total uando el ángulo de in iden ia supera alángulo ríti o. Debido a este he ho, el ristal entellador ha de a oplarse al fotodete tor mediante grasaópti a de un índi e de refra ión intermedio. De otro modo no se pueden evitar la in lusión de una na apa de aire que redu e onsiderablemente la e a ia de re ole ión de luz. La luz de entelleo que pasaa la ventana de entrada se desvía según la ley de Snell y la amplitud de la misma viene des rita por lase ua iones de Fresnel que también reprodu en bien la reexión de una fra ión residual de la luz in identepara ángulos de in iden ia menor al ángulo ríti o. La refra ión de Snell y la transmisión y reexión deFresnel se in luyeron en el modelo analíti o suponiendo además, que la luz de entelleo no esta polarizada.El siguiente fenómeno que se tuvo en uenta requiere espe i ar que tipo de fotodete tor se usa para eldiseño del dete tor de rayos-γ, ya que las propiedades de los mismos pueden resultar muy diferentes. Comoya se había men ionado arriba, para el presente trabajo se optó por un fotomultipli ador sensible a posi ión.La sensibilidad del foto átodo del mismo no es onstante para diferentes ángulos de in iden ia. Esto esdebido a varias ir unstan ias. Una de ellas es la limita ión de que los foto átodos tienen que tener ungrosor muy pequeño para asegurar que los fotoele trones puedan salir del mismo y ser re ole tados por elprimer dínodo. Por esta razón, la e ien ia uánti a no es muy elevada porque una fra ión alta de la luzde entelleo es transmitida sin ser dete tada. Los fotones de luz on un ángulo de in iden ia elevado tienenque re orrer una traye toria más larga dentro del foto átodo y su probabilidad de rear un fotoele tron esmás elevado.Aparte de la luz de entelleo que llega dire tamente a ser dete tada por el fotomultipli ador tambiénexisten ontribu iones debidas a reexiones en los in o lados del ristal entellador que no están a opladasópti amente al fotodete tor. Se ono en numerosos estudios que demuestran que el a abado de estassuper ies es muy importante para la e ien ia de re ole ión de luz y la resolu ión espa ial. No obstante, elmétodo de dedu ir la profundidad de intera ión a partir de la an hura no permite usar a abados ree tantessino que requiere la supresión de esta luz. Por este motivo se ubrieron estos lados on resina epóxi a negra.Aunque el oe iente de reexión de este material es muy bajo, el área total de las super ies ubiertas oneste material es elevado, y, omo se verá en el apitulo 7 de los resultados experimentales, no es despre iableespe ialmente para profundidades de intera ión er a del limite superior de los posibles valores. Ya quelos ristales de entelleo no están pulidos sino ubiertos on resina epóxi a negra, di ha reexión residual essupuestamente difusa y su omportamiento se aproximó on la ley de Lambert. También hay que tener en uenta que gran parte de la luz pro edente del punto de foto onversión no es apaz de entrar a la ventanade entrada debido a la reexión total. En su lugar, esta luz ree tada se reeja una segunda vez y de formadifusa en las otras super ies negras. Esta ontribu ión es igual de importante que la luz que se reejadire tamente en las super ies negras y por lo tanto se in luyó en el modelo analíti o. Otros efe tos omorefra ión, transmisión de Fresnel o sensibilidad angular del foto átodo no se tuvieron en uenta para laluz de fondo debido a la reexión difusa. La distribu ión de señal observada en los segmentos del ánodo delfotodete tor es el resultado de la a ión onjunta de todos los efe tos des ritos y suponiendo omo pro esosideales la re ole ión de los fotoele trones por el sistema de dínodos y su multipli a ión.En el siguiente apítulo 5 se analizaron detalladamente las propiedades de diferentes implementa ionesde ir uitos de división de arga. También se mostró omo se pueden mejorar estos ir uitos para que omputen simultáneamente el segundo momento sin perjudi ar a los entroides. Aparte de la lógi a de Angertradi ional existen otras posibilidades de implementa ión del algoritmo de entro de gravedad on redes deresisten ias (Siegel et al. [10). Las tres variantes más omunes muestran una alidad de posi ionamientomuy pare ido pero hay importantes diferen ias en la antidad de resisten ias ne esarias. Como se haexpli ado anteriormente, las orrientes (o equivalentemente las argas) inye tadas ausan un poten ial odi ado uadráti amente. Esto se debe a la odi a ión lineal para la omputa ión de los primerosmomentos, los llamados entroides. Por lo tanto un sumador analógi o ya es su iente para obteneruna úni a señal adi ional que representa el segundo momento. Ya que los omponentes ne esarios paraeste sumador son un ampli ador opera ional y unas po as resisten ias y ondensadores, el oste totalviii

viene úni amente dado por el anal ele tróni o adi ional (por dete tor de rayos-γ) para la digitaliza ióndel segundo momento. Si retomamos el ejemplo de un PET para animales pequeños onstruido on 8dete tores on ristales ontinuos, el uso del algoritmo de entro de gravedad analógi o redu e el numerototal de anales ele tróni os ne esarios a 32 en vez de 512 para PSPMTs de 64 ánodos o de 2048 paraPSPMTs de 256 anales. Además el número de anales ele tróni os ne esarios no depende del numero desegmentos de ánodos del tipo de PSPMT usado. Esto ha e el método del entroide muy versátil. Con lamejora para la medi ión simultánea de los segundos momentos harán falta 40 anales en vez de 32 lo queno supone ningún problema de realiza ión.Aunque el omportamiento de las diferentes variantes de los ir uitos de división de arga es muy simi-lar para el entroide, el omportamiento respe to a la medida del segundo momento muestra importantesdiferen ias. Un aspe to es la simetría en el omportamiento de los ir uitos de división de argas respe to alinter ambio de las oordenadas espa iales x e y. La lógi a de Anger original posee esta simetría inherente-mente. Sin embargo, tanto las ongura iones ele tróni as de la versión basada en adenas propor ionalesde resisten ias omo la de la versión híbrida, que es una mez la de las otras dos, rompen esta simetría.Para restable er la simetría por ompleto para los entroides en los dos asos, algunas resisten ias tienenque tener valores determinados que dependen de la ongura ión y los valores de las otras. En el aso delsegundo momento se puede restable er la simetría sólo para la variante híbrida. Para la versión basada en adenas propor ionales de resisten ia no es posible jar los valores de las resisten ias de una manera talque el ir uito se omporte exa tamente igual en la medida de los uatro momentos (energía, entroides ysegundo momento) para las dos dire iones espa iales. No obstante, en el aso optimizado, la disimetríaresidual para el segundo momento es menor del 1% y los otros tres momentos se omportan de formatotalmente simétri a. Para obtener esta simetría óptima hay que a eptar que el segundo momento ontiene ontribu iones de los ordenes O(x4), O(y4) y O(x2y2). Este he ho tiene onse uen ias uando se quierausar la desvia ión estándar omo estimador de la profundidad de intera ión pero no signi a ningunadesventaja para el método de re onstru ión de la posi ión que se presentara en el apitulo 8.Otro aspe to estudiado en el apitulo 5 es la inuen ia de la impedan ia de entrada del sumador ana-lógi o sobre la medida de los entroides. Obviamente no se puede permitir que la medida omplementariareduz a signi ativamente la alidad de las medidas de los entroides o la de la energía. Para que este re-quisito se umpla hay que asegurar que el sumador extraiga muy po a orriente de los ir uitos originales.Desgra iadamente no se pueden usar seguidores de tensión para este n ya que el onsumo medio de talampli ador sería de unos 20 mA que as iende a unos 1.2 A para el modulo entero si el PSPMT tiene 64segmentos de ánodo. La impedan ia de entrada de una rama del sumador analógi o viene dada aproxima-damente por la resisten ia de entrada que a su vez determina el peso on que la señal orrespondiente entraen la suma total. Por lo tanto, estas resisten ias tienen que tener valores elevados pero no deben superar ierto límite, ya que valores demasiado altos introdu irán ruido térmi o. Como riterio de diseño se usael he ho de que las resisten ias reales y omer iales tienen una toleran ia en su valor de 1%. Care e desentido al ular los valores de resisten ia on mayor pre isión. Este aspe to se tiene que tener en uentapara las tres variantes de los ir uitos de división de arga.El efe to de dispersión de Compton de los rayos-γ dentro del ristal entellador es el objetivo del apitulo 6. El modelo de la distribu ión de señal que se desarrolló en el apitulo 4 es solo válido paraeventos que depositan toda su energía en una sola intera ión, es de ir, para foto onversiones por efe tofotoelé tri o. Espe ialmente para los fotones de energía 511 keV de la modalidad de PET abe la posibilidadde que experimenten varias dispersiones de Compton antes de ser absorbidos por ompleto. Obviamente,sólo la posi ión de la primera intera ión orresponde a la linea de vuelo orre ta del fotón gamma. Con lalógi a de Anger y sus variantes des ritas anteriormente no es posible determinar esta posi ión. En su lugar,se medirá el entroide de la superposi ión de varias distribu iones pro edentes de deposi iones puntualesde energía, ya que ada intera íon por efe to Compton depositará una fra ión de la energía ini ial delfotón in idente. Esto resultará en un error de la posi ión de impa to medida y del segundo momento yredu irá la resolu ión espa ial transversal y la de la profundidad. Para estimar el impa to de dispersiónde Compton sobre di ha resolu ión se llevó a abo una simula ión de Monte Carlo on el paquete GEANT3 (Brun and Carminati [11). Se simularon las intera iones de 20000 rayos-γ de 511keV en un ristal entellador de LSO on dimensiones 40 × 40 × 20 mm3. Como resultado se pueden resumir las siguientesdos observa iones. La in ertidumbre introdu ida por este efe to es en la mitad de los asos menor a 300 µmtanto para las oordenadas paralelas al foto átodo omo para la omponente normal. La otra mitad delos eventos se reparte en una ola muy larga de baja intensidad atribuyendo sobre todo ruido de fondopor que las distan ias son más grandes que las resolu iones espa iales medidas obtenidos en los apítulos 7y 8. El otro efe to observado es la opresión de eventos de dispersión ha ia delante, o sea on ángulosix

de dispersión er a de ero grados. Esta opresión se puede expli ar de la siguiente manera. Debido a laformula de Klein-Nishina (Leo [12), la dispersión de Compton para rayos-γ de 511 keV favore e fuertementeángulos de dispersión alrededor de ero grados. Además, para esta energía, la probabilidad de que un fotónexperimente una intera ión de Compton es ya muy redu ida y se requiere un grosor elevado para parare ientemente di hos rayos-γ. No obstante, el ristal simulado es solo de un grosor de 20 mm y un grannúmero de fotones pasará el ristal sin ser dete tado. Otro número elevado de fotones experimentará unaintera ión de Compton on un ángulo de dispersión muy pequeño. En onse uen ia, la energía del fotónque sale seguirá siendo muy elevada y la probabilidad de intera ión muy baja. Por lo tanto, todos estosfotones probablemente es apen del ristal sin ser dete tados. Sin embargo, en el aso de que la primeraintera ión sea de tipo Compton y on un ángulo de dispersión elevado, la pérdida de energía del fotóntambién será elevada y el fotón que salga de esta intera ión tendrá una probabilidad de intera ión mu homás alta. Aparte de esto se moverá más o menos en paralelo al foto átodo de forma que aumentará aúnmás la probabilidad de su dete ión, ya que la extensión transversal del ristal simulado es el doble de laextensión normal. Estos efe tos dan lugar a una predisposi ión ha ia ángulos de dispersión elevados parael sub onjunto de eventos dete tados. Probablemente esta es la ausa de que el método para medir laprofundidad de intera ión que se presenta en este trabajo de lugar a resultados su ientemente buenospara su apli a ión en dete tores reales.El siguiente apítulo 7 abar a las veri a iones experimentales de los resultados de los tres anteriores apítulos. Para llevar a abo los experimentos se usaron dos dete tores iguales. Cada uno esta ompuestopor un úni o ristal del entellador LSO de grandes dimensiones (42 × 42 × 10 mm3) y de un PSPMTdel tipo H8500 de la empresa Hamamatsu Photoni s In . (Hamamatsu [13). Debido a la radia tividadintrínse a del LSO, medidas on fuentes de a tividad menor de 20 mCi se tienen que llevar a abo en oin iden ia temporal (Huber et al. [14). A parte de ello, medidas en oin iden ia on dos dete tores derayos-γ on resolu ión espa ial permite una olima ión ele tróni a del haz. El fotomultipli ador H8500tiene un área sensible de 49 × 49 mm2 y dispone de 64 segmentos de ánodo. La señal de disparo para elmódulo se derivó de los últimos dínodos de los PSPMT. Un dis riminador del tipo leading edge admitió soloeventos a partir de ierto umbral y reó pulsos lógi os de an hura temporal de . 5 ns. A partir de estasdos señales se reó la señal de oin iden ia temporal on una puerta lógi a de fun ión booleana AND quesirvió para dos fun iones. Se usó para derivar otro pulso lógi o de an hura temporal de 400 ns y retrasadopor 200 ns. El an o de subida de este pulso se usó para ini iar el pro eso de integra ión y su an o debajada la nalizó. El resultado de esta integra ión de la orriente es propor ional a la arga total extraídade los fotomultipli adores y fue onvertida a valor digital. Las opera iones de restaura ión de línea base,integra ión de arga y digitaliza ión se realizaron on una tarjeta de 12 anales ele tróni os (Zavarzin andEarle [15). La ventana temporal se obtiene omo suma dire ta de las dos an huras de las señales quepropor ionan los dis riminadores. Estos se ajustaron a su límite inferior de . 5 ns on lo ual la ventanade oin iden ia fue de unos 10 ns.Una vez digitalizadas las 10 señales de los dos módulos se transrieron al ordenador para la omputa iónde los 4 momentos. Un modulo se usó omo dete tor de testeo mientras el otro sólo tuvo las fun iones dedete tor de oin iden ia temporal y de la olima ión ele tróni a. La distan ia total entre los dos módulosera de unos ≈ 25 cm y la fuente radia tiva (22Na, a tividad nominal 10 µCi) se olo ó entre ellos de forma entrada y muy er a (a unos ≈ 3 mm del ristal) del dete tor de testeo. De esa manera se pudo olimarel haz ele tróni amente al sele ionar eventos de oin iden ia temporal on una posi ión de impa to (enel dete tor de oin iden ia) que ayó dentro de un ir ulo entral de diámetro 12 mm. Por argumentosgeométri os, la región de posi iones en el dete tor de testeo tiene que ser un ir ulo de diámetro 0.2 mm.Mientras el dete tor de oin iden ia y la fuente radia tiva estuvieron alineados y esta ionarios, el dete torde testeo estuvo montado en ima de una mesa x-y omputerizada. Esto permitió variar la posi ión delimpa to del rayo-γ a lo largo del plano del foto átodo y se pudieron medir de forma automáti a los diferentesmomentos en diferentes posi iones.Dos detalles muy importantes que hay que tener en uenta son los siguientes. Primero, la fuente deradia ión no fue puntual sino que tuvo un diámetro de aproximadamente 1 mm. Además, omo el 22Nade ae pro radia ión β+, estos positrones penetran hasta dentro la ápsula de resina. Por lo tanto, eldiámetro efe tivo que se obtiene a partir de la radia ión de aniquila ión es diferente a 1 mm. Se estimópor simula iones Monte Carlo, que el diámetro efe tivo es de unos 0.92 mm. La resolu ión espa ial quese espera para el dete tor de rayos-γ diseñado en este trabajo es del mismo orden y por lo tanto se tuvoque orregir mediante el diámetro efe tivo de la fuente radia tiva. El segundo efe to que juega un papelmuy importante es que no se puede prepara el haz de fotones gamma para que estos intera ionen enuna profundidad del ristal determinada. Mientras las omponentes paralelas al plano del foto átodo sex

puede prepara fá ilmente posi ionando el dete tor de testeo en la posi ión deseada, la profundidad deintera ión es una variable ompletamente aleatoria. Sin embargo, diferentes dete iones on diferentesprofundidades ausan distribu iones de luz de entelleo on diferentes segundos momentos y por lo tantose pueden distinguir estos su esos si la resolu ión en la medida de este momento es su ientemente alta.Se ha de observar una estadísti a muy ara terísti a para este momento que reeja una aída exponen ialdebido a la absor ión de los rayos-γ dentro del ristal de LSO, una resolu ión intrínse a para el segundomomento y los limites superiores e inferiores para el momento, ya que el ristal es de un grosor nito ysolo se pueden dete tar eventos uyo segundo momento orresponda a una profundidad real existente y dea uerdo on las dimensiones del ristal. Se ha ideado un modelo que des ribe bien el omportamiento dedi ha distribu ión y que permite extraer los parámetros lave que son los limites superiores e inferiores yla resolu ión intrínse a.Una vez a abados todos estos preparativos se veri ó el modelo de la distribu ión de luz estable idoen el apitulo 7. Para este n se midieron los uatro momentos en 9 × 9 posi iones distribuidas de forma entrada, artesiana y on una distan ia de 4.75 mm entre ellas. Estas medidas se ompararon on laspredi iones del modelo analíti o para las mismas posi iones y momentos. Para nalizar este apitulo, seestimó la resolu ión en la posi ión tridimensional del dete tor propuesto en el aso de que se usaran estosmismos momentos omo estimador de posi ión de impa to y energía. Para obtener resolu iones reales sehubo que orregir por la ompresión que introdu en los entroides y por el efe to del diámetro efe tivo dela fuente radia tiva.El apítulo 8 se motivó por las observa iones en los apítulos 5 y 7. Los resultados del apitulo 7muestrearon, que los momentos de la distribu ión de luz se pueden medir on buena resolu ión aunqueestos momentos no onstituyen estimadores de gran validez para la posi ión de impa to real. También seobservó en el apitulo anterior, que el modelo analíti o para la distribu ión de señal derivada en el apitulo 4propor iona momentos que on uerdan muy bien on las medidas. Por lo tanto se tiene un modelo quees apaz de prede ir muy bien el omportamiento de las señales que propor iona el dete tor de rayos-γ.A parte de esto se tiene para ada posi ión tridimensional de impa to y su energía un número total de uatro momentos de la distribu ión. La re onstru ión de la posi ión real a partir de estos momentos es untípi o problema inverso y su viabilidad se estudió en el apitulo 8. El problema también se ono e omoproblema de momentos trun ados que se ha estudiado intensivamente desde su des ubrimiento (Talenti[16, Kren and Nudel'man [17, Jones and Opsahl [18). Desgra iadamente, todos los algoritmos basadosen este método requieren una se uen ia de más de 4 momentos para una re onstru ión viable. Por lo tantose optó por la interpola ión polinómi a que se apli ó on éxito para un problema muy similar (Ol ott etal. [19). Este método usa para la re onstru ión de las posi iones reales una matriz de orre ión que seobtiene a partir de la inversa de Moore-Penrose de los oe ientes de los polinomios de interpola ión delos momentos y sus orrespondientes posi iones de impa to. El fun ionamiento orre to de este métodose omprobó usando los datos de medida en todas las 81 posi iones obtenido en el apitulo 7 de forma ualitativa. Después se midió la resolu ión espa ial del propuesto dete tor en los 81 puntos usando estavez la posi ión re onstruida en vez de los momentos y se ompararon on los anteriores resultados usandolos momentos omo estimadores de posi ión. Se intentó también, pero sin éxito, la re onstru ión de laenergía verdadera. Otra vez hubo que orregir por el efe to del diámetro efe tivo de la fuente radia tiva yel de la ompresión residual de las posi iones re onstruidas.Para terminar el trabajo se resumieron en apitulo 9 las prin ipales on lusiones de los diferentes apítulos y algunas perspe tivas para investiga iones futuras. Por último se in luyeron los apéndi es A-D que ontienen algunos datos de interés omo radiofárma os omunes, entelladores típi os, resultados omplementarios y ongura iones ele tróni as detalladas.Dis usión de los resultados y on lusionesEn el presente trabajo se ha desarrollado un método innovador para medir la profundidad de intera ión derayos-γ en ristales de entelleo gruesos y ontinuos. La nueva té ni a onsiste en estimar este parámetrousando la an hura de la distribu ión de luz de entelleo en los ristales que es dete tada por un fotomul-tipli ador. Para su medida rápida y sen illa se ideó una modi a ión de muy bajo oste de los ir uitos onven ionales de división de arga que se usan on gran fre uen ia para la determina ión de la posi ióndel impa to en dete tores de rayos-γ para la Medi ina Nu lear. xi

Para que la alidad de la imagen médi a sea alta respe to a la rela ión señal a ruido, el ontraste yla resolu ión espa ial, el dete tor de rayos-γ tiene que propor ionar informa ión sobre la posi ión tridi-mensional del impa to, espe ialmente para al modalidad de PET. Sin esta informa ión, se introdu e unerror de paralaje para todas las posi iones fuera del entro y que tiene mayor importan ia en zonas de laregión de interés que están lejos de este entro. Es más, dete tores de rayos-γ de tipo Anger onven ionalesaproximan los omponentes transversales de la posi ión de impa to usando los entroides, o bien los pri-meros momentos normalizados, de la distribu ión de señal. Varios grupos han observado que el algoritmode entro de gravedad omo estimador de posi ión de impa to produ e errores no-lineales y dependientede la profundidad de intera ión para ristales gruesos. Esto perjudi a la resolu ión espa ial er a de loslados y espe ialmente en las esquinas del dete tor.En el apitulo7 se dis utieron on detalle los errores debidos al algoritmo de gravedad. Se reveló que la ompresión de las posi iones es ausada por la ruptura de la simetría de la distribu ión de señal por ulpade un ristal de dimensiones espa iales nitas. Por esta razón, la insu iente resolu ión espa ial obtenida on ámaras Anger onven ionales no es debida a una medida de baja resolu ión de los momentos por los ir uitos de división de arga, sino a que la aproxima ión de la posi ión de impa to por estos momentos noes valida para estas regiones del área sensitiva. No obstante, se mostró en el apítulo 7 que los momentospueden ser medidos on alta resolu ión. Igualmente se observó, que la impedan ia de entrada de los ir uitosde división de arga están odi ados uadráti amente on la posi ión y por tanto produ en voltajes on lamisma propiedad bajo la inye ión de orrientes pro edentes de los fotomultipli adores. Una ongura ióntan simple omo un sumador analógi o puede ser usado para sumar estos voltajes y propor ionar una señaladi ional linealmente orrela ionada on el segundo momento. Junto on la observa ión de otros grupos(Rogers et al. [20, Kenneth et al. [7, Anti h et al. [8) de que la an hura de la distribu ión dependefuertemente de la profundidad de intera ión, esto propor iona un método potente para medir la mismaprofundidad de intera ión.En el apítulo 5 se demostró, que todas las versiones ono idas de ir uitos de división de arga puedenser modi ados on un sumador analógi o para medir el segundo momento. También se vio, que lasdiferen ias teóri as en las ualidades de estas versiones solo varían po o de una a otra. Esto se observótambién experimentalmente para los entroides y la arga total (Siegel et al. [10) y por lo tanto el riteriopara la ele ión de la variante del ir uito de división de arga puede ser la omplejidad de la red deresisten ias. Se dieron también en el apítulo 5 expresiones expli itas para la dependen ia de los voltajes y lasuma de ellos en fun ión de la posi ión de la orriente inye tada y en fun ión de la ongura ión del ir uito.Compara iones on simula iones on Spi e, (Simulation Programwith Integrated Cir uits Emphasis, Tietzeand S henk [21) on uerdan muy bien on las predi iones he has on estas fórmulas y las diferen iasmáxima es en todos los asos menor de un 3%. Un resultado omplementario está rela ionado on el omportamiento de la simetría de los ir uitos. La lógi a de Anger onven ional es inherentemente simétri arespe to al inter ambio de las posi iones x e y, pero las otras dos versiones no lo son. Afortunadamentese puede restaurar esta simetría por ompleto para los entroides, y, en el aso de la red híbrida, tambiénpara el segundo momento. Para el ir uito basado ompletamente en adenas de resisten ias, sólo sepuede minimizar la disimetría, aunque se onsiguen valores residuales muy pequeños de 1% o menos. Para onseguir esto, hay que a eptar que se introdu irán ordenes de O(x4), O(y4) y O(x2y2) en el segundomomento. Esto sólo supone un problema si se quiere usar la desvia ión estándar omo estimador para laprofundidad de intera ión. Para el método presentado en el apítulo 8, estos ordenes elevados no suponenninguna ompli a ión adi ional. La impedan ia de entrada de los sumadores se tiene que dimensionar detal forma, que evite la extra ión ex esiva de orriente del ir uito para los entroides. En aso adverso,esto perjudi aría a los mismos lo que no es a eptable. La solu ión ideal sería usar seguidores de tensión, yaque estos tienen una impedan ia de entrada muy elevada. Su uso no es posible debido a su alto onsumo.Esta op ión esta reservada para un futuro diseño de un ir uito ASICs (Appli ation-Spe i IntegratedCir uit) y no forma parte del presente trabajo. Por estas razones, los valores de las resisten ias para lossumadores tienen que ser en general muy elevados. Una indi a ión adversa al uso de valores demasiadoaltos es el ruido térmi o. En el presente aso se obtuvieron resultados a eptables on valores de resisten iasal sumador que extraen omo máximo un 1% de orriente en ada nodo del ir uito de división. Para larealiza ión del dete tor de rayos-γ se usó un ir uito basado ompletamente en adenas de resisten ias yun sumador on 64 entradas ya que esta versión es la que más fá ilmente se implementa.En el apítulo 7 se presentaron medidas de los 4 momentos de un dete tor real. El dete tor está basadoen un ristal de LSO de dimensiones de 42 × 42 × 10 mm3 y un fotomultipli ador H8500. Los experimentosmuestran que los entroides no están afe tados por la medida del momento adi ional. La resolu ión media enestos momentos es menor del 5%. También se observó, que la aproxima ión de usar estos uatro momentosxii

omo posi ión de impa to es inade uada. Los mismos resultados obtuvieron otros grupos que investigabanel omportamiento de los entroides sin medida del segundo momento. El momento trivial representa laenergía del impa to y los momentos no-triviales son los entroides y el segundo momento. El momentotrivial se ve afe tado por efe tos y ondi iones adi ionales y no al anza la resolu ión de los momentos notriviales. Una ausa para esto es la inhomogeneidad del foto átodo de los fotomultipli adores. La e ien iay la ganan ia puede variar de un segmento de ánodo a otro hasta al anzar diferen ias de un fa tor 3. Estafalta de uniformidad introdu e una varia ión de energía dete tada adi ional e importante. Por otro lado, elmétodo para medir el segundo momento que se presenta on este trabajo requiere que todas las super iesque no están a opladas al fotodete tor estén ubiertas de una apa muy absorbente para evitar reexiones,ya que estas destruyen por ompleto la orrela ión de la profundidad de intera ión on el segundo momento.Obviamente esto redu e la e a ia de re ole ión de luz y por lo tanto la resolu ión energéti a. Este efe toes de muy elevada importan ia en las esquinas del dete tor y las resolu iones energéti as son muy bajas enestas zonas. En los experimentos se observó una resolu ión energéti a media del 25% on el valor mínimoen el entro del 17% y el valor máximo (70%) en una de las esquinas. La degrada ión de la resolu iónenergéti a se ompone de dos efe tos. Un efe to importante es la varia ión del total de la luz dete tadapor razones geométri as. Para puntos de foto onversión muy er a de una super ie negra, menos luz esdete tada y el máximo del espe tro está en anales más bajos. En los histogramas de energía se superponenmu hos eventos on diferentes posi iones y por lo tanto se obtiene una úni a distribu ión muy an ha debidoal movimiento del máximo del fotopi o. Este efe to se puede orregir una vez obtenida la posi ión real delimpa to y ono iendo el omportamiento del momento trivial para todo el volumen del ristal. El he hode que no se podía orregir la energía omo parte del presente trabajo es probablemente debido a unaresolu ión espa ial aún no su iente para este n. El otro efe to es el de la varia ión por estadísti a dePoisson. Este efe to no se puede orregir on la posi ión aún teniendo una resolu ión muy buena en lamisma. El uso de retroree tores (Karp and Muehllehner [22, Rogers et al. [20, M Elroy et al. [23) puedeprobablemente mejorar este aspe to.El modelo para la distribu ión de luz se veri ó experimentalmente en el apítulo 7. Para los tresmomentos no triviales se observó que las predi iones del modelo reprodu en muy bien las medidas de estosmomentos. Las desvia iones siempre estaban por debajo del 11 %, ex epto para el momento trivial. Eneste último aso, el modelo no reprodu e orre tamente todos los detalles de las medidas. Las predi ionesdel modelo on uerdan bien on los momentos medidos para profundidades de intera ión er a del limiteinferior. En el aso opuesto, es de ir, para profundidades de intera ión er a del limite superior, se produ endis repan ias obvias entre el modelo y las medidas. Estas observa iones se pueden expli ar fá ilmente onlas aproxima iones que se hi ieron para llegar al modelo para la distribu ión de luz de fondo. Se suponíaque la ontribu ión total no fuera muy elevada. No obstante, para profundidades de intera ión elevadas,la ontribu ión de luz de fondo a la distribu ión total se vuelve muy importante. Esto se veri ó on unmodelo alternativo que no disponía de luz de fondo. Sin luz de fondo, el modelo reprodu e las varia ionesdel momento trivial a lo largo del foto átodo mu ho peor. Sin embargo, los resultados para los momentosno-triviales se reprodujeron on una alidad muy similar. Esto se espera, ya que la normaliza ión de estosmomentos elimina de forma e iente la dependen ia del momento trivial. Razones para los errores en estosmomentos son probablemente la inuen ia de dispersión de Compton y sobre todo la pre isión me áni a.Aunque la mesa x-y dispone de muy buena pre isión, el resto del montaje, que in luye la ja ión de lafuente y de las ar asas de los dete tores de rayos-γ, no al anza la misma pre isión. Esta última fuente deerror ha de minimizarse para obtener mejores resultados en medidas futuras.El apítulo 8 se dedi ó a en ontrar un algoritmo para la re onstru ión de la posi ión de impa toreal a partir de los momentos. Para este n se usó el modelo de la distribu ión de señal, ya que en el apítulo 7 se veri ó que esta reprodu e bien los momentos no-triviales. Se usó el modelo para prede irel omportamiento del dete tor en 40000 diferentes posi iones de impa to. La respuesta del dete tor onsiste en los tres momentos no-triviales y el momento trivial. Los resultados para los dos entroides y elsegundo momento se interpolaron on ordenes 12 para los omponentes transversales y on orden 5 parael omponente normal. Según el apítulo 8, se puede usar la inversa de Moore-Penrose en onjunto onlas 40000 posi iones de impa to para obtener una matriz del dete tor que permite la re onstru ión de laposi ión de impa to. A ontinua ión, se al ularon las posi iones a partir de los momentos. La resolu iónespa ial del dete tor era en este aso de 1.9 mm para las dos dimensiones transversales y de 3.9 mm para laprofundidad de intera ión. Esto presenta una mejora sustan ial on respe to a la resolu ión del dete torobtenido usando los momentos (3.4 mm y 4.9 mm) para las mismas oordenadas. Espe ialmente el resultadopara la resolu ión en profundidad es muy importante, ya que existen muy po os métodos que llegan a estaresolu ión. No se onsiguió orregir por ompleto la no-linealidad de la posi ión on este método. Con losxiii

Referen esvalores men ionados aquí, se obtuvo una no-linealidad residual de aproximadamente el 10%. Este error esdel mismo orden que el error del modelo observado en apítulo 7. Probablemente, la pre isión del modeloanalíti o tiene que superar este valor para obtener mejores linealidades y resolu iones. La resolu ión espa ialy tridimensional que se obtiene de momento on el método presentado no es su iente para re onstruir laenergía real a partir del momento trivial on la informa ión de los momentos no-lineales.En este trabajo se ha presentado un método simple y barato para medir el segundo momento de ladistribu ión. Se ha mostrado, que esta informa ión adi ional se puede utilizar onjuntamente on los entroides para re onstruir la posi ión real del impa to. De esta manera se pueden realizar dete tores derayos-γ para Medi ina Nu lear que propor ionan informa ión sobre la profundidad de intera ión y quepermiten redu ir el error de paralaje. El método presentado es apto para ualquiera de las modalidadesen las que ha e falta saber la informa ión de profundidad y es muy barato. No obstante, el algoritmo deinversión no es óptimo y requiere futura investiga ión.Referen ias[1 J. Seidel, J. Vaquero, S. Siegel, W. Gandler, and M. Green, Depth Identi ation A ura y of a ThreeLayer Phoswi h PET Dete tor Module, IEEE Trans. Nu l. S i., vol. 46, no. 3, pp. 485489, June1999.[2 W. M. Moses and S. Derenzo, Design studies for a PET dete tor module using a PIN photodiode tomeasure depth of intera tion, IEEE Trans. Nu l. S i., vol. 41, no. 4, pp. 14411445, Aug. 1994.[3 R. Freifelder, A. T. Haigh, and J. S. Karp, Redu ing edge ee ts and improving position resolution inposition sensitive NaI(Tl) dete tors, IEEE Trans. Nu l. S i., vol. 40, no. 2, pp. 208213, Apr. 1993.[4 S. Siegel, S. R. Cherry, A. R. Ri i, Y. Shao, and M. E. Phelps, Development of ontinuous dete torsfor a high resolution animal PET system, IEEE Trans. Nu l. S i., vol. 42, no. 2, pp. 10691074, Aug.1995.[5 J. Seidel, W. Gandler, and M. Green, Chara teristi s of a Pair of Small Field-of-View LSO S intillationCameras, IEEE Trans. Nu l. S i., vol. 43, no. 3, pp. 19681973, June 1996.[6 J. Joung, R. Miyaoka, and T. Lewellen, Mi e: a high resolution animal PET using ontinuous LSOwith a statisti s based positioning s heme. Nu l. Instr. and Meth. A, vol. 489, pp. 584598, 2002.[7 K. L. Matthews II, S. M. Leonard, C. E. Ordonez, D. E. Persyk, and W. Chang, A depth-en odinganger dete tor using s intillation bers, IEEE Trans. Nu l. S i., vol. 48, no. 4, pp. 13971402, Aug.2001.[8 P. Anti h, N. Malakhov, R. Parkey, N. Slavin, and E. Tsyganov, 3D position readout from thi ks intillators, Nu l. Instr. and Meth. A, vol. 480, pp. 782787, 2002.[9 I. M. Tka henko, M. Urrea Núñez, and P. Fernández de Córdoba Castellá, Algoritmos de Re on-stru ión de Fun iones de Distribu ión. Servi io de Publi a iones de la Universidad Polité ni a deValen ia, 1996, in Spanish.[10 S. Siegel, R. Silverman, Y. Shao, and S. Cherry, Simple harge division readouts for imaging s intillatorarrays using a multi- hannel PMT, IEEE Trans. Nu l. S i., vol. 43, no. 3, pp. 16341641, June 1996.[11 R. Brun and F. Carminati, GEANT dete tor des ription and simulation tool, 1994, CERN ProgramLibrary, W5013.[12 W. R. Leo, Te hniques for Nu lear and Parti le Physi s Experiments, 2nd ed. Springer Verlag, 1994.[13 Hamamatsu Photoni s K.K., Flat-Panel type multianode photomultiplier tube assembly H8500,http://www.hamatsu. om/, data sheet.[14 J. Huber, W. Moses, W. Jones, and C. Watson, Ee t of 176Lu ba kground on singles transmissionfor LSO-based PET ameras, Phys. Med. Biol., vol. 47, pp. 17, 2002.[15 V. Zavarzin and W. Earle, A 500k event/se 12-bit ad system with high-speed buered p i interfa e,IEEE Trans. Nu l. S i., vol. 46, p. 414, 1999.xiv

Referen es[16 G. Talenti, Re overing a fun tion from a nite number of moments. Inverse Problems, vol. 3, pp.501517, 1987.[17 M. G. Kren and A. A. Nudel'man, The Markov Moment Problem and Extremal Problems. Ameri anMathemati al So iety, 1977, translated from the Russian by Israel Program for S ienti Translation.[18 L. M. Jones and L. R. Opsahl, On moment inversion, Nu l. Phys., vol. 12, pp. 591598, 1986.[19 P. D. Ol ott, J. Zhang, C. S. Levin, F. Habte, and A. M. Foudray, Finite element model based spatiallinearity orre tion for s intillation dete tor that use position sensitive avalan he photodiodes, inNu lear S ien e Symposium, Conferen e Re ord, vol. 5, Nov. 2005, pp. 24592462.[20 J. Rogers, D. Saylor, R. Harrop, X. Yao, C. Leitao, and B. Pate, Design of an e ient positionsensitive gamma ray dete tor for nu lear medi ine, Phys. Med. Biol., vol. 31, no. 10, pp. 10611090,1986.[21 U. Tietze and C. S henk, Halbleiter-S haltungs-te hnik, 12nd ed. Springer, Berlin, 2002, (In German).[22 J. Karp and G. Muehllehner, Performan e of a position-sensitive s intillation dete tor, Phys. Med.Biol., vol. 30, no. 7, pp. 643655, 1985.[23 D. P. M Elroy, S.-C. Huang, and H. E. J., The Use of Retro-Ree tive Tape for Improving SpatialResolution of S intillation Dete tors, IEEE Trans. Nu l. S i., vol. 49, no. 1, pp. 165171, Feb. 2002.
xv

Referen es
xvi

ContentsContents1 Histori al Introdu tion 11.1 Gamma-Ray Imaging in Nu lear Medi ine . . . . . . . . . . . . . . . . . . . . . . . . . . . . 61.2 Gamma-Camera (Planar Imaging) . . . . . . . . . . . . . . . . . . . . . . . . . . . . . . . . 81.3 Single Photon Emission Computed Tomography . . . . . . . . . . . . . . . . . . . . . . . . . 101.4 Positron Emission Tomography . . . . . . . . . . . . . . . . . . . . . . . . . . . . . . . . . . 101.5 PET Designs . . . . . . . . . . . . . . . . . . . . . . . . . . . . . . . . . . . . . . . . . . . . 141.6 Radioa tive Agents and Nu lear Medi ine . . . . . . . . . . . . . . . . . . . . . . . . . . . . 151.6.1 Requirement for Radiotra ers . . . . . . . . . . . . . . . . . . . . . . . . . . . . . . . 162 Motivation and Outline 213 Dete tor Components and Limits 233.1 Solid-State Gamma-Ray Dete tors . . . . . . . . . . . . . . . . . . . . . . . . . . . . . . . . 243.2 S intillation Dete tors . . . . . . . . . . . . . . . . . . . . . . . . . . . . . . . . . . . . . . . 253.2.1 S intillators . . . . . . . . . . . . . . . . . . . . . . . . . . . . . . . . . . . . . . . . . 253.2.2 Photodete tors . . . . . . . . . . . . . . . . . . . . . . . . . . . . . . . . . . . . . . . 263.3 Degrading Fa tors . . . . . . . . . . . . . . . . . . . . . . . . . . . . . . . . . . . . . . . . . 293.3.1 Parallax Error and Depth of Intera tion . . . . . . . . . . . . . . . . . . . . . . . . . 293.3.2 Compton S attered Events and Randoms . . . . . . . . . . . . . . . . . . . . . . . . 303.3.3 Errors Contributed by the Radiopharma euti al . . . . . . . . . . . . . . . . . . . . 323.4 Dete tor Improvements . . . . . . . . . . . . . . . . . . . . . . . . . . . . . . . . . . . . . . 343.4.1 Depth of Intera tion Dete tion . . . . . . . . . . . . . . . . . . . . . . . . . . . . . . 343.4.2 Time-of-Fight PET . . . . . . . . . . . . . . . . . . . . . . . . . . . . . . . . . . . . . 354 Parameterization of the Signal Distribution 394.1 In luded Contributions and Conventions . . . . . . . . . . . . . . . . . . . . . . . . . . . . . 394.1.1 The Inverse Square Law . . . . . . . . . . . . . . . . . . . . . . . . . . . . . . . . . . 414.1.2 The Cosine Law . . . . . . . . . . . . . . . . . . . . . . . . . . . . . . . . . . . . . . 414.1.3 Exponential Attenuation . . . . . . . . . . . . . . . . . . . . . . . . . . . . . . . . . . 424.1.4 Light Transmission to the Photodete tor Window . . . . . . . . . . . . . . . . . . . 424.1.5 Angular Sensitivity of the Photo athode . . . . . . . . . . . . . . . . . . . . . . . . . 464.1.6 Ba kground Light . . . . . . . . . . . . . . . . . . . . . . . . . . . . . . . . . . . . . 484.2 Complete Signal Distribution . . . . . . . . . . . . . . . . . . . . . . . . . . . . . . . . . . . 50xvii

Contents5 Enhan ed Charge Dividing Cir uits 555.1 Introdu tion, Conventions and General Considerations . . . . . . . . . . . . . . . . . . . . . 555.1.1 Statisti al Estimates . . . . . . . . . . . . . . . . . . . . . . . . . . . . . . . . . . . . 555.1.2 Signal Chara teristi s of Photomultiplier Tubes . . . . . . . . . . . . . . . . . . . . . 575.1.3 General Preamplier Design . . . . . . . . . . . . . . . . . . . . . . . . . . . . . . . . 585.2 Charge Dividing Cir uits for Position Determination . . . . . . . . . . . . . . . . . . . . . . 595.3 Anger's Approa h . . . . . . . . . . . . . . . . . . . . . . . . . . . . . . . . . . . . . . . . . 625.4 Proportional Resistor Chains . . . . . . . . . . . . . . . . . . . . . . . . . . . . . . . . . . . 655.4.1 2D Proportional Resistor Network . . . . . . . . . . . . . . . . . . . . . . . . . . . . 665.5 Hybrid Solution . . . . . . . . . . . . . . . . . . . . . . . . . . . . . . . . . . . . . . . . . . . 695.6 Simultaneous Measurement of the Se ond Moment . . . . . . . . . . . . . . . . . . . . . . . 705.6.1 Anger Logi . . . . . . . . . . . . . . . . . . . . . . . . . . . . . . . . . . . . . . . . . 725.6.2 Proportional Resistor Chains . . . . . . . . . . . . . . . . . . . . . . . . . . . . . . . 735.6.3 Hybrid Solution . . . . . . . . . . . . . . . . . . . . . . . . . . . . . . . . . . . . . . 785.7 Anode Inhomogeneity Compensation . . . . . . . . . . . . . . . . . . . . . . . . . . . . . . . 795.7.1 Passive Compensation . . . . . . . . . . . . . . . . . . . . . . . . . . . . . . . . . . . 805.7.2 A tive Compensation . . . . . . . . . . . . . . . . . . . . . . . . . . . . . . . . . . . 815.8 Errors of The Center of Gravity Algorithm . . . . . . . . . . . . . . . . . . . . . . . . . . . 815.8.1 Signal Flu tuations . . . . . . . . . . . . . . . . . . . . . . . . . . . . . . . . . . . . . 815.8.2 Dis retization Errors . . . . . . . . . . . . . . . . . . . . . . . . . . . . . . . . . . . . 835.8.3 Symmetry Breaking of the Current Distribution . . . . . . . . . . . . . . . . . . . . 845.8.4 Ele troni Noise . . . . . . . . . . . . . . . . . . . . . . . . . . . . . . . . . . . . . . 866 Compton S attered Events 896.1 Inner Crystal Compton S attering . . . . . . . . . . . . . . . . . . . . . . . . . . . . . . . . 916.2 S reening of Forward S attered Events . . . . . . . . . . . . . . . . . . . . . . . . . . . . . . 947 Experimental Veri ation 977.1 Experimental Setup . . . . . . . . . . . . . . . . . . . . . . . . . . . . . . . . . . . . . . . . 977.1.1 Spatial Extension of the Radioa tive Test-Sour e . . . . . . . . . . . . . . . . . . . . 1007.1.2 Model Distribution for Event Statisti s . . . . . . . . . . . . . . . . . . . . . . . . . 1017.2 Results . . . . . . . . . . . . . . . . . . . . . . . . . . . . . . . . . . . . . . . . . . . . . . . . 1057.2.1 Qualitative Veri ation of the Method . . . . . . . . . . . . . . . . . . . . . . . . . . 1057.2.2 Validity of the Model for the Signal Distribution . . . . . . . . . . . . . . . . . . . . 1067.2.3 Moments as 3D Position Estimate . . . . . . . . . . . . . . . . . . . . . . . . . . . . 1138 3D-Impa t Position Re onstru tion 1198.1 The Trun ated Moment Problem . . . . . . . . . . . . . . . . . . . . . . . . . . . . . . . . . 1198.2 Polynomial Interpolation . . . . . . . . . . . . . . . . . . . . . . . . . . . . . . . . . . . . . . 1208.2.1 Polynomial Interpolation in One Dimension . . . . . . . . . . . . . . . . . . . . . . . 1208.2.2 Polynomial Interpolation in Higher Dimensions . . . . . . . . . . . . . . . . . . . . . 1218.2.3 Moore-Penrose Matrix Inverse . . . . . . . . . . . . . . . . . . . . . . . . . . . . . . 1238.3 Inverse Mapping of the Gamma-Ray Impa t Positions . . . . . . . . . . . . . . . . . . . . . 1238.4 Results . . . . . . . . . . . . . . . . . . . . . . . . . . . . . . . . . . . . . . . . . . . . . . . . 1248.4.1 Qualitative Validation of the Method . . . . . . . . . . . . . . . . . . . . . . . . . . . 1258.4.2 3D Spatial Resolution . . . . . . . . . . . . . . . . . . . . . . . . . . . . . . . . . . . 1278.4.3 Linearity of the Positioning S heme . . . . . . . . . . . . . . . . . . . . . . . . . . . 1318.4.4 Exe ution Time . . . . . . . . . . . . . . . . . . . . . . . . . . . . . . . . . . . . . . . 131xviii

Contents9 Con lusions & Outlook 135A Common Radiopharma euti als 139B Common Inorgani S intillators 143C Supplementary Analyti Results 145C.1 Impedan es of the 2D Proportional Resistor Network . . . . . . . . . . . . . . . . . . . . . . 145D Ele troni Amplier Conguration for the Experiment 147
xix

Contents
xx

1 Histori al Introdu tion1 Histori al Introdu tionFortune knos but on e, but misfortune s mu more tien e.Lauren e J. Peter, ⋆ 1919 † 1988GAMMA-ray imaging overs only a small area of the large spe trum of imaging te hniques applied tomedi al diagnosti s. Many of these te hniques, e.g. Radiography, Sonography and Nu lear Magneti Resonan e (NMR), have already been in routine use for many years. Others are at an early stage ofdevelopment and far from being widely applied. Sin e 1895, when the possibility of using X-rays forplanar transmission imaging was dis overed by Wilhelm Conrad Röntgen at the university of Würzburg(Germany), all te hniques have been under a tive development to a greater or lesser extent. In that year,Röntgen observed a green olored uores ent light generated by a material lo ated a few feet away froma working athode-ray tube. He attributed this ee t to a new type of ray that he supposed had beenemitted from the tube and found that the penetrating power of the new ray also depended on propertiesof the exposed substan es asting the obje t's density distribution into a two dimensional proje tion. Oneof Röntgen's rst experiments with the newly dis overed radiation was a proje tion image of the handof his wife Bertha. An important ontribution to radiography diagnosti s was made by Carl S hleussner.He developed the rst silver bromide photographi X-ray lms, whi h made ar hival storage of diagnosti results possible and also lowered the ne essary exposure. Within only a month after the announ ement ofthe dis overy, several medi al radiographs had been built. They were used by surgeons to guide them intheir work and only a few months later they were used to lo ate bullets in wounded soldiers.Although radiography was the rst medi al imaging modality, the rst attempts to see inside the humanbody without invasive operation go ba k a longer time (Wayand, [24). When in the year 1879 MaximilianNitze and Josef Leiter introdu ed the rst opti al system in Vienna using a platinum glow wire as lightsour e, they laid the foundations of Endos opy. Only two years later and also in Vienna, the surgeonJan Mikuli z-Rede ki demonstrated the rst Gastros opy (teles opi inspe tion of the inside of the gullet,stoma h and duodenum). However, the rst ommer ial semi-exible Gastros ope, designed by Georg Wolfand Rudolph S hindler, did not appear until 1932.Thermography and Ele tro ardiography are two other examples of medi al imaging modalities thatwere known before the dis overy of X-rays by W.C. Röntgen. As for thermography, the knowledge evengoes ba k to Hippo rates, who rst obtained thermograms of the hest. He proposed overing the patient'sthorax with a pie e of thin linen soaked with earth, and observing the pro ess of drying. At the warmerareas of the thorax, the earth-soaked loth dries faster and the pattern of enlargement of the dry areasrepresents the temperature distribution (Otsuka et al. [25). Sir John Hers hel redis overed thermographyin 1840 and reated the rst thermal image of modern times by evaporating a thin lm of al ohol appliedto a arbon- oated surfa e. The rst dete tor that was able to measure infrared radiation was inventedin 1880 by Samuel P. Langley, 80 years after the dis overy of this radiation by Sir William Hers hel.Hers hel measured the temperature of light split by a prism and found that the temperature in reasedthrough the olors of the spe trum and furthermore ontinued to in rease into the non-visible region, today alled infrared. Also, bio-ele tri ity was known long before the late 19th entury. It was rst observed byA.L. Galvani in 1787, when he exposed a frog mus le to ele tri ity (Zywietz [26). The rst measurementsof urrents and voltages of the frog itself were possible after 1825, when Nobili et al. onstru ted su ientlysensitive galvanometers (Mehta et al. [27). Eighteen years later, C. Matteu i measured ele tri al urrentsoriginating in a resting heart mus le and Augustuts D. Waller was the rst to re ord ele tri potentials(originating from the beating heart and measured from the body surfa e) as a fun tion of time. He used the apillary ele trometer, a devi e invented and onstru ted 14 years before by G. Lippmann that visualizespotential dieren es by hanging the surfa e tension of a mer ury sulfuri a id interfa e. This was the rstEle tro ardiograph. Between 1893 and 1896 George J. Bur h and Wilhelm Einthoven strongly improvedthis method by alibration and signal orre tion. 1

1 Histori al Introdu tionWith the beginning of the 20th entury new ndings piled up. Investigation and development fo usedon the improvement of the te hnologies known hitherto; natural s ien es experien ed a boom leading tonumerous new imaging modalities that emerged as a dire t onsequen e and also the two world warsstrongly fuelled the te hnologi progress. The rst pra ti al use of Laparos opy (endos opi exploration ofbody avities without natural external a ess) was reported by the internist Hans-Christian Ja obäus, whopublished in 1910 the results of endos opies of the abdominal avity. Nearly at the same time, radiographi imaging was enhan ed by using ollimators (E.A.O. Pas he, 1903) and the employment of high-va uum hot- athode Röntgen-tubes engineered by William D. Coolidge in Massa husetts, USA. However, the imagingte hnique that the lini ians were mainly interested in was one whi h was able to isolate in fo us someparti ular plane in the patient. The superimposition of three-dimensional obje ts in a two-dimensionaldisplay learly leads to relevant stru tural information loss. That is to say, the aim was to reate sharpimages of some parti ular plane with all other planes su iently blurred out. Nearly simultaneouslyappeared Stratigraphy developed by Allesandro Vallebona, planigraphy by André Edmond Marie Bo age,Bernard Ziedses des Plantes, Ernst Pohl and Carlo Baese and tomography1 by Gustave Grossman. This longlist of names shows the in reased interest in se tion imaging in the 1920s, the more so as the inventors wereworking independently from ea h other [28. At the same time, other s ientists fo used their investigationon methods that allow sharp images of the patient's spe i sli es using geometri arrangements of theX-ray sour e and more than one lm. If two lms are used, this is alled stereo imaging and its origins havebeen attributed to Elihu Thomson. In 1896, he published a des ription of X-ray stereo images taken fromphantoms with metal obje ts and mi e. An almost ontemporary development of X-ray stereo imaging wasput forward in by Imbert and Bertin-Sans in Fran e and by Czermak at the University of Graz. The useof stereo imaging was indi ated for measuring distan es within solid obje ts.A further milestone was rea hed in 1929 when the Austrian Hans Berger re orded the rst ele troen- ephalogram (EEG) with a string galvanometer (Wright et al. [29), developed by W. Einthoven between1900 and 1903. With his development, Einthoven wanted to over ome the slow temporal response and thepoor a ura y of the apillary ele tro-meter onstru ted by G. Lippmann. The importan e of EEG has tobe attributed to the fa t that until re ently this modality was the only non-invasive method for re ordingbrain fun tions. After the invention of the va uum tube in 1913, bio-ele tri ity ould be amplied makingthe ECGs and EEGs portable. The nal breakthrough of these te hnologies ame with the rst implemen-tation of dire t writing instruments by Du hosal and Luthi in 1932 and the use of athode-ray tubes byW. Hollmann and H.E. Hollmann in 1937. Compared to me hani al re ording systems, os illos opes basedon athode-ray tubes are mu h more suitable for displaying rapidly varying signals owing to their fasterresponse. Two years after the rst EEG, Dr. Mi hael Burman published an arti le on Myleos opy (spinal anal Endos opy). He reports the results from the ex-vivo examinations of eleven vertebral olumns (Gor h-esky [30), whilst the rst myles opi exam on an anesthetized patient was performed by Dr. J. Lawren ein 1937.A ompletely new imaging modality was born in 1916, when P. Langevin used ultrasoni waves to lo atea submarine that was sunk in shallow water (Tiggelen et al. [31). P. Langevin was a student of PierreCurie who analyzed together with his brother Ja ques Curie the piezoele tri qualities of rystals. In 1880,they were su essful in produ ing ultrasound waves. However, it took sixty-two years until the rst attemptat medi al appli ation was made by the Austrian K. Dussik in the year 1942. Unfortunately, he tried totake ultrasound images of the patient's brain where sonography ould not be applied due the skull. Alsothe foundations of NMR (also alled Magneti Resonan e Imaging MRI) were laid in the 1930s. IsidorRabi rst des ribed nu lear magneti resonan e in beams in the year 1937. But it was not until 1946 thatFelix Blo h and independently Edward Mills Pur ell observed the same phenomenon in liquids and solids(Keevil [32). A further major step forward was a paper from Bloembergen, Pur ell and Pound abouttheir observations on relaxation ee ts of matter and the inuen e of motion (Boes h [33). Three yearslater, Arnold reported that the nu lear magneti resonan e frequen y of protons depends on their hemi alenvironments.During World War II, mu h work was on entrated on the sharp imaging of proje tiles within woundedsoldiers. This was a period of onsolidation of the known te hnologies, of their improvement and pra ti alimplementation. New development was started only for te hnologies that give a lear advantage to theirowner. This is how many new inventions like peni illin, Sonar (Sound Navigation and Ranging), Radar(Radio Dete tion and Ranging) and the use of nu lear energy appeard. However, after the war, an extensivetransfer of te hnologies towards other elds of investigation also promoted the s ien e of medi al imaging. A1The term tomography is derived from the Greek word τoµoς for sli e.2
1 Histori al Introdu tion
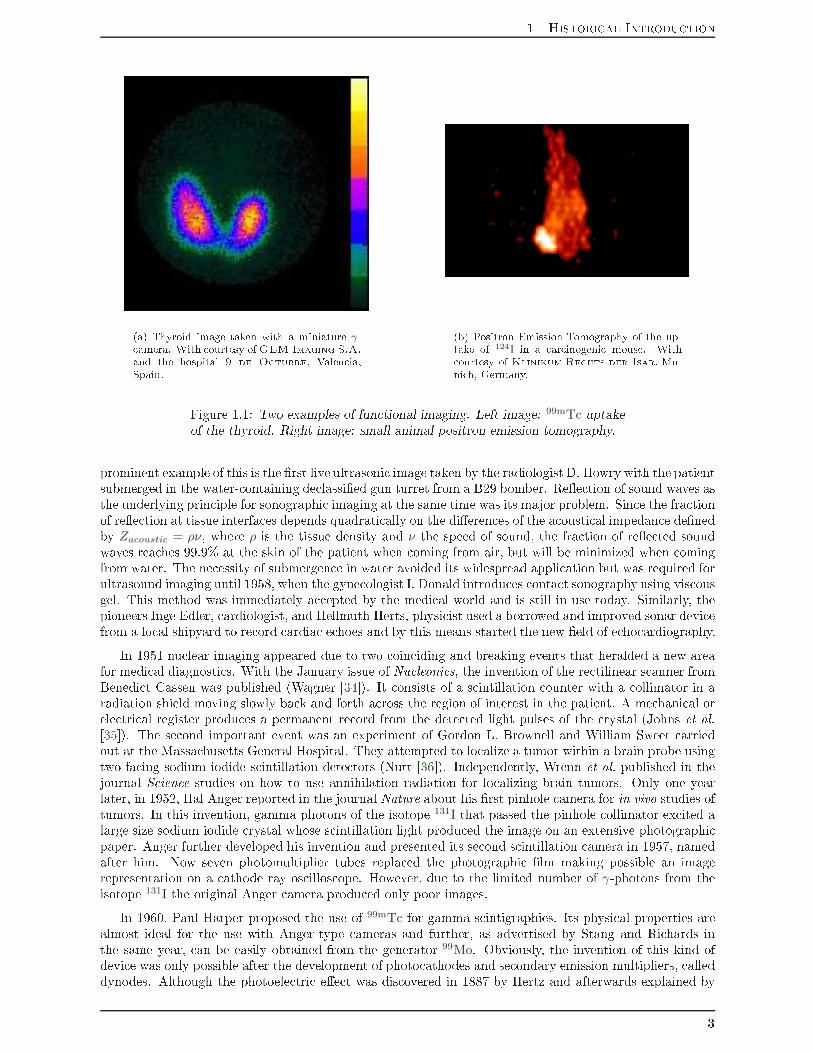
(a) Thyroid image taken with a miniature γ- amera. With ourtesy ofGEM Imaging S.A.and the hospital 9 de O tubre, Valen ia,Spain. (b) Positron Emission Tomography of the up-take of 124I in a ar inogeni mouse. With ourtesy of Klinikum Re hts der Isar, Mu-ni h, Germany.Figure 1.1: Two examples of fun tional imaging. Left image: 99mTc uptakeof the thyroid. Right image: small animal positron emission tomography.prominent example of this is the rst live ultrasoni image taken by the radiologist D. Howry with the patientsubmerged in the water- ontaining de lassied gun turret from a B29 bomber. Ree tion of sound waves asthe underlying prin iple for sonographi imaging at the same time was its major problem. Sin e the fra tionof ree tion at tissue interfa es depends quadrati ally on the dieren es of the a ousti al impedan e denedby Zacoustic = ρν, where ρ is the tissue density and ν the speed of sound, the fra tion of ree ted soundwaves rea hes 99.9% at the skin of the patient when oming from air, but will be minimized when omingfrom water. The ne essity of submergen e in water avoided its widespread appli ation but was required forultrasound imaging until 1958, when the gyne ologist I. Donald introdu es onta t sonography using vis ousgel. This method was immediately a epted by the medi al world and is still in use today. Similarly, thepioneers Inge Edler, ardiologist, and Hellmuth Herts, physi ist used a borrowed and improved sonar devi efrom a lo al shipyard to re ord ardia e hoes and by this means started the new eld of e ho ardiography.In 1951 nu lear imaging appeared due to two oin iding and breaking events that heralded a new areafor medi al diagnosti s. With the January issue of Nu leoni s, the invention of the re tilinear s anner fromBenedi t Cassen was published (Wagner [34). It onsists of a s intillation ounter with a ollimator in aradiation shield moving slowly ba k and forth a ross the region of interest in the patient. A me hani al orele tri al register produ es a permanent re ord from the dete ted light pulses of the rystal (Johns et al.[35). The se ond important event was an experiment of Gordon L. Brownell and William Sweet arriedout at the Massa husetts General Hospital. They attempted to lo alize a tumor within a brain probe usingtwo fa ing sodium iodide s intillation dete tors (Nutt [36). Independently, Wrenn et al. published in thejournal S ien e studies on how to use annihilation radiation for lo alizing brain tumors. Only one yearlater, in 1952, Hal Anger reported in the journal Nature about his rst pinhole amera for in vivo studies oftumors. In this invention, gamma photons of the isotope 131I that passed the pinhole ollimator ex ited alarge size sodium iodide rystal whose s intillation light produ ed the image on an extensive photographi paper. Anger further developed his invention and presented its se ond s intillation amera in 1957, namedafter him. Now seven photomultiplier tubes repla ed the photographi lm making possible an imagerepresentation on a athode ray os illos ope. However, due to the limited number of γ-photons from theisotope 131I the original Anger amera produ ed only poor images.In 1960, Paul Harper proposed the use of 99mTc for gamma-s intigraphies. Its physi al properties arealmost ideal for the use with Anger-type ameras and further, as advertised by Stang and Ri hards inthe same year, an be easily obtained from the generator 99Mo. Obviously, the invention of this kind ofdevi e was only possible after the development of photo athodes and se ondary emission multipliers, alleddynodes. Although the photoele tri ee t was dis overed in 1887 by Hertz and afterwards explained by3

1 Histori al Introdu tionthe quantum theory from Albert Einstein, the rst photoele tri tube did not appear until 1913, produ edby Elster and Geiter (Kume [37). In order to a hieve higher ele tron multipli ation, resear h on se ondaryemission surfa es was put forward.At nearly the same time, very interesting work was going on another eld of s ien e, solid-state ele -troni s. The theoreti al tool of quantum me hani s of the late 1920s with its on ept of band-stru tures ledto a detailed understanding of solids. By 1940, Russel Ohl, member of a solid-state working group at theBell-Laboratories was able to prepare p- and n-type sili on, and a little later on, even a sample that was ofp-type at one side and of n-type at the other (Brinkmann [38). He also found that this sample generateda voltage when it was irradiated by visible light. During World War II, Radar requirements produ ed avery strong desire to ne-tune solid-state materials when it be ame obvious that shorter wavelength radar,and thus devi es working at higher frequen y than the onventional va uum tubes were needed. Finally,William Sho kley, John Bardeen and Walter H. Brattain were the rst to make a working transistor inNovember of the year 19472. It took only ten years until Ja k Kilby of Texas Instruments developed therst Integrated Cir uit, one of the most important inventions of modern time for all dis iplines of medi alimaging.In the beginning of the 1960s, Kuhl and Edwards fo used their work on image re onstru tion forsingle photon tomography. They su essfully attempted to apply re onstru tion te hniques to s annersfor radioisotope distributions that were formerly employed in X-ray se tion imaging. Furthermore at thebeginning of the 1960s, Alexander Gotts halk began to work with the new Anger-Camera and found thatit ould also be used for positron imaging. About the same time, in 1963, Allan M. Corma k onstru ted,together with David Hennage, the rst experimental X-ray omputed tomography (CT) s anner. That thiswas not the starting point for its widespread a eptan e and appli ation to medi al diagnosti s was mainlydue to two reasons. First, he applied his own re onstru tion te hnique to the experimental data withonly partial su ess and did not dis over until 1970 that this mathemati al problem had been solved byJ. Radon in 1917. Se ondly, sin e at that time there was mu h interest in positron emission tomography, hedesigned his s anner and phantoms adapted to this modality. Thus, the work of Godfrey N. Hounseld ontransmission omputed tomography marks the beginning of this new area in diagnosti imaging. ThoughHounseld's rst experimental s anner used a gamma-ray sour e, it needed nine days for data olle tion,2 1/2 hours for re onstru tion and further 2 hours for displaying the digitized image, the prototype developedfor the Atkinson Morly Hospital in 1971 took an image in 18 se onds.Also in 1971, Raymond Damadian wrote in the journal S ien e about his observation of variations in therelaxation times of NMR signals obtained from an erous and normal tissues. This publi ation essentiallystimulated the medi al interest in NMR as diagnosti te hnique, although already in 1960 a report fromthe US National Heart Institute advised that NMR experiments might lead to a medi al imaging modality.A tually, long before 1971, important progress was made on erning the basi understanding of NMR andhow to obtain images from it. Before the publi ation of Hahn in 1950, where he des ribed how de ayingNMR-signals ould be partially refo ussed by a determined sequen e of radio-frequen y pulses, the state-of-the-art was the measurement of a spe trum with ontinuous irradiation with radio-frequen y. Modern MRIis heavily based onto these so- alled spin-e hos. A further important landmark of NMR was established byLauterbur and independently Manseld in the year 1973. They were the rst ones to propose the use ofmagneti eld gradients in order to spatially en ode the NMR signals for a subsequent image re onstru tion.Another important result prior to the latter was the observation of Ernst and Anderson in 1966 that the freeindu tion de ay signal (studied by Hahn) ontained the whole spe trum information. They introdu ed theFourier framework into NMR. Finally, the dis overy of super ondu tivity and the subsequent developmentof super- ondu tion magnets in the 1970s of the past entury marked another important step in MRI(Coupland [41, S hrieer et al. [42).In emission tomography, one ould also observe a time-dense series of key developments onvergingsteadily towards the rst ring tomograph for oin iden e imaging as well as the rst Single Photon EmissionComputed Tomograph (SPECT). On e again, Hal Anger played a key role in the development of SinglePhoton Emission Tomography (SPET). In his work presented in June of 1967 at the 14th Meeting ofthe So iety of Nu lear Medi ine, he explained how to form ross-se tional images obtained from a patientrotated in front of a stati gamma- amera using ba k proje tion onto a likewise rotating lm. The ne essityof analogue te hniques to form se tion images was over ome with the appearan e of omputers after theinvention of the IC. Muellehner and Wetzel were the rst in re onstru ting proje tion amera data using a2The two physi ists, Herbert Mataré and Heinri h Welker, from the German radar program independently invented a verysimilar semi ondu tor devi e and alled it transitron (Dormael [39, Riordan [40).4

1 Histori al Introdu tion omputer in 1971, therefore being the rst ones to use the medi al imaging modality that today is alledSPECT. The re onstru tion was done with an IBM 360/30 omputer rendering the emission informationinto a 40×40 pixel matrix. Simultaneously with this SPECT s anner they proposed iterative re onstru tionalgorithms. The te hnology needed to rotate the gamma- amera instead of the patient be ame availablein 1977, when John Keyes got the Humongotron working. In 1955, the rst lini al positron s anner hadalready appeared, onstru ted by Gordon Brownell. However, the images from this devi e where rather rude, sin e it performed only planar s ans and estimated the distribution of the radioa tive tra er usingthe dieren e in the average of ounting rates of the two dete tors.The rst true tomographi image (from a dog heart) was s anned with the positron amera at theMassa husetts General Hospital in the late 1960s by Brownell and Burmann. After this event many dierentPET s anners have been developed. It turned out that the optimal geometry is a ir ular stru ture andthat the general tenden y of the dierent generation of PET s anners in the last de ades points towardssmall-sized segmented rystal dete tors. This is known as Nutt's law, an analogue to More's law for mi roele troni devi es. It points out that the number of individual rystal elements in a positron emissiontomograph has doubled every two years for the past 25 years (Nutt [36). The s intillation material usedfor the dete tor has also a major impa t on the performan e of generations of PET s anners. While inthe mid-70s thallium doped sodium iodide was the only hoi e for PET, the development of bismuth-germanate, known as BGO, provided the physi ists with a more suitable rystal for high energy gammaphotons. During the last two de ades, this has been the s intillator of hoi e due to its signi antly greaterstopping power. However, this was at the ost of only 15% of the NaI:Tl's s intillation light yield at 511keV. Therefore, the announ ement of Lutetium Oxyorthosili ate (LSO) by C. Mel her 1989 resulted on eagain in higher image quality. LSO has a relative light yield of 75% ompared to sodium iodide, is morethan six times as fast as BGO and more than four times as fast as NaI:Tl.Further important landmarks in medi al imaging are the appearan e of Doppler-sonography in 1979 dueto the work of Donald W. Baker and many other s ientists and the appearan e of Human MR spe tros opy(MRS) in 1980 and fun tional NMR (fNMR) in 1990. With MRS one is able to measure the on entrationof bio hemi al ompounds and the spatial variations in the on entration an be used to form images. (referto (Hendee [43)). The isotopes used for this modality are 31P and 1H (Kuijpers [44). Seiji Ogawa fromthe AT&T Bell Laboratories was the rst who observed NMR-signal variation indu ed by the oxygenationlevel hanges in brains from rats (Ogawa et al. [45) and thus initiated fNMR. Also, a revitalization ofinvestigation on Diuse Opti al Tomography ould be observed after having been abandoned twi e in thepast entury. The rst attempt was made by Cutler in 1929. He proposed to dete t breast lesions with ontinuous light, but found that the ne essary intensity would overheat the patient's skin. It was abandonedfor the se ond time in the year 1990 when a study found too many false negatives for small breast lesionswith a te hnique introdu ed by Gros et al. in 1973, where the breast was positioned between a visible-light sour e and the physi ian's unaided eye. In 1989, the rst heli al s an X-ray omputed tomographys anner was put in operation using the new slip-ring te hnology of 1988 for ontinuous rotation of tubeand dete tors. Heli al-s an CT allows one to freely sele t the in rement between sli es to be imaged asa re onstru tion parameter. This enables re onstru tion of overlapping sli es without in reasing the dose.With the repla ement of Xenon gas dete tors by solid-state dete tors in the beginning of 1997, the radiationdose applied to the patient ould be signi antly redu ed without loss in image quality. And nally, inthe past few years Biolumines ent Imaging (BLI) has emerged (Dikmen et al. [46). It is parti ularly wellsuited for imaging small animals and uses the photo hemi al rea tion between lu iferin and lu iferase thatdepends on Adenine-Tri-Phosphate (ATP) and O2. Therefore only living ells an emit photons.The whole spe trum of medi al imaging te hnologies has be ome very broad due to a far-rea hings ienti eort during the last entury and now in ludes many modalities besides radiography. Furthermore,the lini ian today an hoose either modalities for stru tural imaging or modalities for fun tional imaging,where the latter provides a relevant omplement to onventional methods like radiography, sonography or X-ray CT. The stri t, histori al denition of fun tional imaging in ludes all te hniques that use either repeatedstru tural s anning of the region of interest (ROI) or other measurable variables for the representation ofthe temporal dependen e of spe i physiologi al pro esses. While this is possible with almost all thementioned imaging modalities, nowadays fun tional imaging mainly refers to methods whi h are apable ofrendering metaboli pro esses of body regions. Likewise, stru tural imaging makes the stru ture of the ROIa essible to the observer. Using the underlying physi al prin iples and pro esses of image formation as keyproperty allows the more detailed sub lassi ation of the dierent known modalities shown in gure 1.2(De onin k [47). 5

1.1 Gamma-Ray Imaging in Nu lear Medi ineThe spe trum of medi al imaging modalitiesstru tural imaging methodfun tional imaging methodunderlying prin ipleMedi alImaging
ExternalSour e Ree tionRefra tion Endos opyLaparos opyPhotographyVideographySonographyDoppler-SonographyTransmission X-Rays RadiographyCTDiuseOpti alTomographyInternalSour e
NaturalSour e ECG, EEGThermographyPhono ardiographyInje tedTra er PET PET-CTSinglePhotonS intigraphy SPECTγ-S intigraphyExternalEx itation MRSNMRfNMRBiolumi-nes en eImagingFigure 1.2: The s heme is divided into two main bran hes, depending ifany kind of radiations/elds has to be applied from the outside or not.For the ase that the physi al pro ess whi h is going to be representedgraphi ally has its origins inside the body, there is also the possibility ofexternal ex itation. There are also methods that ombine two ore moreprin iples and therefore an be fun tional as well as stru tural, e.g. PET-CT, whi h is quiet a new development. Another example is MRS, whi hrequires internal tra er mole ules as well as external ex itation.1.1 Gamma-Ray Imaging in Nu lear Medi ineThe eld involving the lini al use of non-sealed radionu lides is referred to as nu lear medi ine. The same riterion holds for nu lear imaging and, although not a-priori obvious, Magneti Resonan e Imaging shouldalso be in luded in this subgroup of imaging modalities be ause it is a tually based on the properties of thenu leus of hydrogen, whi h is omnipresent as H2O in biologi al tissue. It is due the negative onnotations ofthe word nu lear in the 1970s that the imaging te hnology was marketed as Magneti Resonan e Imaging,while Nu lear Magneti Resonan e refers to the underlying physi al ee t. For nu lear imaging, twoimportant requisites are needed: the parti le dete tor, able to provide good temporal, spatial and energeti 6

1 Histori al Introdu tion
Figure 1.3: Original proposal of an Radiation Image Devi e, now alledAnger- amera and patented by Hal O. Anger in November 1961 (US-Patentnumber 3.011.057).information, and the radioa tive substan e to be tra ed by the dete tor. The radionu lides an rarelybe administered to the patient in their simplest hemi al forms. Instead, there are many ompounds inbiology and medi ine that may be of interest be ause of their spe i bio hemi al, physiologi al or metaboli properties whenever they are prepared in a form that is suitable for use with the spe imen to be examined.Many of these ompounds an be marked by repla ing one of their atomi onstituents by a radioa tiveisotope and are alled radiopharma euti als. After administration to the patient, the radiopharma euti alspreads out within the explored patient due to the normal (or abnormal) vital fun tions in a way that is hara teristi for a spe i metaboli pro ess. In ea h period of time, the unstable atoms of a small fra tionof the pharma euti al disintegrate giving rise to β+- or γ-radiation. α-radiation is not desired owing toits heavy mole ular-biologi al impa t and furthermore is only generated by isotopes of very high atomi number, whi h are generally toxi . Furthermore, sin e α-parti les are strongly ionizing, they would notleave the explored body and therefore ould not be dete ted by a external dete tor. The same holds forβ−-parti les. After the dete tion of the radiation by the gamma-ray imager, the spatial distribution of theradiopharma euti al is re onstru ted from the dete tion positions of the photons. If the spatial distributionis s anned repeatedly, it an be mapped as a fun tion of time.The de ay mode of the radiopharma euti al normally determines the gamma-ray dete tor to be used.In the simplest ase, exa tly one γ photon is produ ed. This mode is suitable for γ-s intigraphy or SPECT.If the radionu lides disintegrates via β+-de ay, it is nearly instantly followed by ollinear γ-photon pairemerging from the positron-ele tron annihilation. Whilst this radiation an be used for ea h of the threemodalities PET, SPECT and γ-s intigraphy, its is parti ularly well suited for oin iden e imaging. Certainradionu lides emit two gammas of dierent energies in as ade (75Se, 111In, 48Cr and 43K) or one gammaand a positron like 52Fe, and ele tron apture is known to give rise to X-ray and γ radiation (125I and 197Hg).This opened up the possibility for γ-γ oin iden e tomography, as proposed by Powell and Mohan in 1970and 1970. On e again, the radiation resulting from these de ay mode an be imaged with PET, SPECTand γ-s intigraphy. As a onsequen e of the arguments and examples above, nu lear imaging is essentiallybased on γ-ray imaging and the energy of the emerging γ-photon is a further important parameter thathas to be taken into a ount for the onstru tion of the imaging dete tor. Due to the quantum nature ofphotons, they annot be partially stopped by the dete tor material. It either omes lose enough to anatom to undergo one of the possible elementary intera tions or it will not be ae ted at all. The probabilityfor the intera tion strongly depends on the energy E of the γ-ray, on the ee tive atomi number Zeff ofthe atom and the density of these atoms (or ompounds) forming the dete tor material. That is to say,7

1.2 Gamma-Camera (Planar Imaging)
Collimator
Housing+Leadshield
gammarayProtection
PMT
Scintillator
Light−guide
Selection+EnergyPositioning
Figure 1.4: S hemati s of the most important omponents of an Anger types intillation amera.the γ-imaging dete tor has not only to dete t the photon, but also has to stop it for dete tion. The abilityof the dete tor to stop the γ-ray is known as its intrinsi e ien y. This is the reason why Anger-typeγ- ameras, optimized for 140 keV radiation from the tra er 99mTc will only produ e low quality imageswhen used for SPECT with 511 keV annihilation radiation. However, e ien y is not the only parameterof interest and its optimization is very often in oni t with the optimization of others.PET, SPECT and γ-s intigraphy are now widely applied to medi al diagnosti s and resear h in theelds of Cardiology, On ology and Neurology. They are sometimes referred to as mole ular imaging, sin ebeing photon- ounting methods, they are a tually able to visualize single mole ules. It is that strikingsensitivity that makes them very useful for the evaluation of biologi al systems that are parti ularly sen-sitive to small quantities of metaboli a tive substan es su h as many re eptor systems and intra ellularpro esses. Compared to MRS, whi h requires on entrations of paramagneti tra ers of 10−6 mol/l inorder to hange relaxativity, the normally administered on entrations of 99mTc is with ≈ 10−10 mol/l fourorders of magnitudes smaller. Iodinated ontrast agents even need a on entration of 10−2 mol/l to a hieveopa i ation with X-ray CT (Blankenberg et al. [48). As a result, for the moment only nu lear imagingallows the in vivo uninuen ed study of ertain spe i bio hemi al, physiologi al or metaboli pro esses,sin e the normally administered on entrations will not ause a pharmalogi al ee t.1.2 Gamma-Camera (Planar Imaging)The prin iple of the Anger-type s intillation amera whi h was presented by Hal O. Anger in 1958 (Anger[49, refer to gure 1.3) has hanged little in the past half entury and is based on the amera os ura fromthe early days of photography. While this prin iple was repla ed by sophisti ated opti s in photography,it is not possible to onstru t lenses for γ-radiation ex ept for some spe ial ases. Figure 1.4 shows as hemati diagram of an Anger-type gamma- amera. The obje t to be studied is pla ed in front of thedevi e, and, after the inje tion of the radiopharma euti al, is ontinuously emitting γ-radiation. Althougha large fra tion of radiation is lost due to isotropi emissions, absorption by the ollimator or be ause itis not absorbed by the s intillator, there are still su ient γ-photons that intera t with the s intillator.The γ-photons that intera t with the s intillation rystal will originate isotropi s intillation light whosespatial distribution is proje ted through the light-guide onto the sensitive area of the photodete tor. Thisdistribution is sampled by the photodete tor array or a position sensitive photodete tor and used to omputeele troni ally the position of the impa t within a plane within the s intillation rystal and normal to thedete tor axis. In order to prote t the dete tor from environmental and ba ks attered radiation, it has to be8

1 Histori al Introdu tiont
af
h
(a) Parallel hole ollimator
φ
d
F
D
(b) Pinhole ollimatorFigure 1.5: Diagram showing the most important ollimators for Anger-typegamma- ameras.tted into a shield. Modern gamma- ameras o asionally wrap the photodete tor into µ-metal to prote t itfrom external magneti elds. Furthermore, the holes of the ollimator have to be overed to avoid diusestraylight to be dete ted by the photodete tor. In general, this is done with an aluminum sheet of smallthi kness that does not stop the γ-radiation.While this prin iple is repeated in almost all gamma- ameras, there exist lear dieren es from one amera to another depending on the omponents used and the appli ations that they are designed for. Ifthe obje t as well as the s intillation rystal is large, e.g. for a whole-body s an of a human being, thepinhole ollimator leads to an important loss of sensitivity and the use of a multiple hole ollimator isadvised (Anger [50). The main dieren es of these two ollimator types are their eld of view (FOV) andtheir e ien y. The FOV of the parallel hole ollimator (gure 1.5(a)) is just its spatial extension parallelto the sour e plane and is independent of the distan e between obje t and ollimator.In the ase of the pinhole ollimator (gure 1.5(b)), the FOV depends on the distan e D between obje tand ollimator. It an be approximated using pure geometri al arguments as follows:FOV ≈ D
FAC
eff (1.1)where ACeff is the ee tive area of the s intillation- rystal photodete tor ombination and F its distan e tothe ollimator. The geometri e ien y is given by
εpingeo =
(deff
4D
)2 with deff = d ·√
1 +2
d
tan Φ/2
µ
(
1 +tan Φ/2
µ
) (1.2)where the ee tive pinhole diameter deff a ounts for ee ts due to near-hole ollimator penetration of theγ-rays and µ is the ollimators absorption oe ient for the γ-ray energy of interest. Clearly the geometri design of the pinhole ollimators also ontributes to the total spatial resolution of the amera by
∆pintot ≈
√
(∆pingeo)2 + (∆pin
int )2 with ∆pingeo =
D + F
Ddeff , (1.3)where ∆pin
int is the s intillation dete tors intrinsi resolution. For a ir ular parallel hole ollimator, thegeometri e ien y is given byεparageo =
Ahole
2π (a − 2/µ)2
NAhole
Acol
, (1.4)9

1.3 Single Photon Emission Computed Tomographywhere Ahole denominates the area overed by one aperture, Acol is the area of the whole ollimator, N thenumber of the apertures and a the thi kness of the ollimator. Its ontribution to the spatial resolution an be approximated by∆para
geo =h(a − 2/µ + D + f)
a − 2/µ(1.5)It is lear from the equations 1.1-1.5 that type and quality of the ollimator is of striking importan e forFOV, spatial resolution and dete tion e ien y.1.3 Single Photon Emission Computed TomographyWhen the Anger-type gamma- amera is rotated step-wise around the patient while a quiring proje tionimages at ea h step, a tomographi image an be re onstru ted from a su iently large set of proje tions.Today this is known as Single Photon Emission Tomography or Single Photon Emission Computed Tomog-raphy. The spatial resolution of the resulting images depends on the performan e of the gamma- ameraused and is thus omparable to the resolution of the planar gamma-ray imaging modality. However, the ontrast is signi antly in reased ompared to planar imaging leading to more reliable lesion dete tability.The sensitivity of SPECT is learly outperformed (by approximately two orders of magnitude) by PositronEmission Tomography and also its spatial resolution falls behind be ause it is strongly ae ted by thene essity of ollimators. Nevertheless, SPECT is an imaging te hnique nowadays widely used in medi aldiagnosti s and the reason for this is that SPECT devi es urrently used for lini al purposes onsist of fromone to three Anger-type gamma- ameras. Thus, unlike PET s anners, SPECT s anners are multi-modalitydevi es and allow for a higher ost-ee tiveness and broader eld of appli ation. Histori ally, SPECT wasintrodu ed into nu lear medi ine fa ilities by upgrading existing gamma- ameras and using the same radio-pharma euti als. For this reason, there was no need for expensive ompa t y lotrons and radio hemistryfa ilities for tra er produ tion, although the low γ-ray energy give raise to a large fra tions of Comptons attered events and totally absorbed γ-photons. It is therefore far from being ideal for tomography of thehuman body but remains an interesting imaging modality for small animal studies, where it is ommonlyused in experimental on ology (Weissleder [51).1.4 Positron Emission TomographyPositron Emission Tomography is often referred to as the ben hmark te hnique for fun tional imaging. Atthe same time, it presents the highest level of resour ing for in vivo studies among all inherently ontrastagent imaging modalities. In 1950, Gordon L. Brownell suggested that spatial resolution and sensitivity ofnu lear imaging of brain diseases might be improved using annihilation radiation (Brownell [52). PET isbased on the de ay of a β+ emitting radioisotope tagged to a derivative of a metaboli a tive substan e.The released positron has only a very short lifetime after the de ay of the radiotra er and its path ends in anannihilation with one of the millions of surrounding ele trons. As a onsequen e of energy and momentum onservation, the annihilation pro ess gives rise to the nearly ollinear γ-photons with an energy of 511 keV(refer to gure 1.6).If both γ-photons are dete ted, the two points in spa e where they are dete ted dene a straight line,the line of response (LOR), whi h ne essarily ontains the annihilation point. Sin e the path of the γ-rays is known, there is no need for absorptive ollimation of the tra er radiation whi h is ne essary inplanar imaging like SPECT. Consequently, PET oers a wide a eptan e angle for dete ting the γ-photonsand its sensitivity of approximately 10−10 mol outperforms the sensitivity of SPECT by two orders ofmagnitude (Cassidy et al. [53) and, that of a single headed Anger-type amera by three orders of magnitude(Jones [54). In addition, the temporal oin iden e dete tion provides an inherent and e ient reje tionof ba kground radiation and a further advantage is that the higher energy of 511 keV of the annihilationradiation entails a mu h higher probability for the γ-rays to es ape from the examined obje t, whi h is notthe ase for the 140 keV radiation normally applied with SPECT and γ-s intigraphy. While for a 140 keVphoton the half-layer of soft-tissue (International Commission on Radiation Units and Measurements, Four-Component soft-tissue) is ≈ 4.5 cm, this value rea hes ≈ 7.3 cm for 511 keV radiation. It is therefore nosurprise that, within the spe trum of nu lear imaging, PET is the modality par ex ellen e for qualitativelyand quantitatively imaging mole ular pathways and intera tions in vivo.10

1 Histori al Introdu tionPSfrag repla ementsβ+
γ
γ
e−
ν positron rangeradiotra erradiotra er
CH2OH
CH2OH
C
C
C C
C
C
C
C C
C
O
O
18F
18O
before de aydesintegration
after de ayannihilation
non- ollinearityFigure 1.6: Sket h of all important degrading ee ts in PET, from the de ayof the radionu lide of the pharma euti al to the annihilation of the positron.PSfrag repla ementsτ(d, ω)
A
d
ω(a) Single dete tor e ien yPSfrag repla ements
ω
τ1(d1, ω)A1
d1
τ2(d2, ω)
A2
d2(b) Coin iden e dete tor e ien yFigure 1.7: Cal ulation of the dete tion e ien y of single dete tor and a oin iden e dete tor.However, annihilation oin iden e dete tion does not present a mira le ure for the physi al problemsof nu lear imaging and also involves fundamental problems. First, the higher penetrating power of 511 keVγ-rays not only is true for the examined obje t, but also applies to the photon-dete tor. One of thefundamental prin iples of Quantum Me hani s requires the γ-photon to be stopped and destroyed in orderto dete t its path and energy. Due to the greater penetrating power of the annihilation radiation, thedete tor has to be more massive and normally of larger dimensions. Another drawba k is that bothannihilation photons have to be dete ted to register a ounted event. This dire tly translates to a quadrati dependen y of the tomograph's dete tion e ien y on the intrinsi dete tion e ien y of one dete tormodule. Furthermore, sin e there are now two γ-rays that have to es ape from the examined obje t, bothof them an undergo Compton s attering and the probability of misspositioned events is also squared.The overall sensitivity of PET is determined by the intrinsi dete tion e ien y εint of the dete torsystem and the fra tion of the solid angle 4π that is overed by the dete tor. The latter is alled the geo-metri e ien y εgeo and is normally a nontrivial fun tion of the dete tor's and FOV's geometry. A tually,the distin tion between εgeo and εint is hard to learly dene. This is due to the fa t that one has to stopthe impinging γ-ray in order to dete t it, i.e. a non-vanishing dete tor volume is required and onsequentlythe dete tor element's geometry is already involved. For one single dete tor element, one an ompute itse ien y by
ε1(d, ω) =1
A
∫
A
(
1 − e−λτ(d,ω)) (1.6)where A is the area of the dete tor fa ing the radiation sour e, d the distan e of this surfa e from the sour e,
ω the solid angle as shown in gure 1.7(a), λ the linear absorption oe ient of the dete tor material andτ(d, ω) the length of the path of the γ-parti le through the a tive dete tor volume. Likewise one nds for11

1.4 Positron Emission TomographyPSfrag repla ementsD1 D2
d′
d
D
S
ABCP1
Figure 1.8: Intrinsi spatial resolution for oin iden e dete tion.the e ien y of an annihilation oin iden e dete torεγ−γ = ε1(d1, ω) · ε2(d2, ω) =
1
A1A2
∫
A1
(
1 − e−λτ1(d1,ω))
∫
A2
(
1 − e−λτ2(d2,ω))
. (1.7)In order to obtain the total e ien y, equation (1.7) has to be multiplied by a fa tor that representsthe fra tion of the spheri al surfa e o upied by A1 and A2. Furthermore, one has to take into a ountthat the examined obje t also absorbs γ-photons. The angular dependen y is, however, highly nontrivialbe ause it also depends on the density distribution of the examined obje t, normally an animal or a human.Approximately, one an write the oin iden e dete tion e ien y as (Cherry et al. [55)εeff ≃ ε2
intεgeoe−µT , (1.8)where µ is the (mean) absorption oe ient of the examined obje t and T its total thi kness. Instead ofεgeo , the average geometri e ien y
εgeo ≈ 2A
3π(d1 + d2)2(1.9)is frequently used. This expression is valid when the dete tor dimensions are small ompared to the distan e
(d1 + d2) between both dete tors. The fa tor 2 in the numerator a ounts for the fa t that if one γ-photonis dete ted, the se ond photon inherently points towards the se ond dete tor module. The fa tor 3 inthe denominator is the average oin iden e dete tion e ien y a ross the sensitive volume at mid-plane.Commer ial state-of-the-art PET s anners typi ally arrange up to 18000 small dete tors in ir ular or(regular) polygonal arrays. Ea h dete tor element operates in multi- oin iden e mode with a very largenumber of the opposite dete tor elements. If a perfe t ring-dete tor is supposed, i.e. a omplete ring ofvery small dete tors of thi kness h in axial dire tion, diameter D with h ≪ D and vanishing inter-dete torspa ing of adja ent elements, one obtains for a point sour e lo ated at the enter of the ring by geometri alargumentsεring ≈ h
D(1.10)and
εring ≈ h
2D(1.11)for the average geometri e ien y when moving the point-sour e axially away from the enter plane of thering towards its end-planes. Equations 1.10 and 1.11 are valid for a small volume element near the enter ofthe ring and also apply to polygonal arrays and ontinuous dete tors that use the Anger positioning logi .The spatial resolution of oin iden e dete tors depends in a nontrivial way on the dete tor module'sintrinsi resolution. For the ase of dis retized dete tors, it depends primarily on the size of the individual12

1 Histori al Introdu tionPSfrag repla ementsFWHM = d FWHM = 3
4d FWHM = 12d
ABCd
(a) Dis rete dete torPSfrag repla ementsFWHMFWHMFWHM ABCFWHM = δi
S
FWHM =√
58 δi
S
FWHM =δiS√2
ABC(b) Continuous dete torFigure 1.9: Intrinsi spatial resolution for oin iden e dete tion.dete tor elements sin e there is no possibility to de ide where within the element the γ-ray intera ted. One an derive the fun tional dependen y of the spatial resolution on the position along the inter onne tion linein the following way. Suppose, an ideal point sour e is pla ed at the enter between two ideal dete tors.The distan e between both dete tors is D. If dis retized dete tors are used, the elements are normally allof equal size d. Annihilation radiation in oin iden e dete tion results in lines of response that are denedby the two intera tion points within the rystal. Now, the sour e is moved along a plane between the twodete tors D1 and D2 and parallel to their surfa es through the eld of view of the oin iden e dete tor(refer to gure 1.8). By doing so, one obtains the point-sour e response prole of the oin iden e dete torfor that plane. This prole is the onvolution of the geometri al proje tions of both dete tors onto the planewhere the point sour e is situated and with the enter of dilatation lying within the plane of the oppositedete tor. Sin e the geometri proje tion depends on the position x along the opti al axes D, the spatialresolution also does. At mid-plane (plane A) of the dete tor pair, two identi al re tangle fun tions withwidth d′ = d/2 are onvolved and the response prole is a triangle fun tion with a FWHM of d/2. As thesour e moves towards either dete tor, the response prole be omes trapezoidal (plane B) and a re tanglefun tion of width d′ = d at the fa e of either dete tor (plane C). For any plane in between, the FWHM ofthe response prole an be given as
FWHM(x) =
(1
2+
|x|D
)
d (1.12)and the mean spatial resolution asδpix =
1
D
D2∫
−D2
d
(1
2+
|x|D
)
dx =3
4d. (1.13)The very same arguments hold for deriving the spatial resolution as fun tion of the inter-dete tor position
x for the ase of ontinuous dete tors. If one assumes the intrinsi spatial resolution δiS of both dete torsto be equal and its response prole of Gaussian form, then the onvolution of their proje tions is alsoa Gaussian. One obtains the standard deviation of the resulting Gaussian by the geometri sum of the13

1.5 PET Designsstandard deviation of the both proje ted Gaussians. Thus the spatial resolution along D is given byFWHM(x) =
δiS√2
√
1 +
(2x
D
)2 (1.14)and the mean spatial resolution byδcont =
1
D
D2∫
−D2
δiS√2
√
1 +
(2x
D
)2
dx =
(
1
2+
ln(1 +
√2)
2√
2
)
δiS ≈ 0.81δi
S . (1.15)1.5 PET DesignsThe rst PET systems were either two or more Anger-type ameras operated in temporal oin iden e or usedindividual dete tor units onsisting of a s intillator blo k oupled to a photomultiplier tube and arrangedin one or multiple rings around the subje t. This geometry required a huge number of the expensivephotomultiplier tubes and as a onsequen e there was a large interest in multiplexing s hemes that wouldredu es the number of PMTs. In 1984, S anditronix designed a PET s anner that used dete tor modules ofone PMT and two s intillators with dierent de ay time (Nutt [36). The rystal where the γ-ray is stopped ould be identied by measuring the de ay time of the urrent pulse. Only a few tomographs were produ edand the te hnique was given the name of phoswi h-dete tion3 . It now arries the hope of enabling depth ofintera tion dete tion in γ-ray imaging. Burmham et al. at the Massa husetts General Hospital pla ed manyindividual photodete tors on a ir ular light-guide. By taking the ratio of two adja ent PMTs, the position ould be estimated just in the way it is done in Anger-type ameras. Mike Casey and Ronald Nutt fromCTI re ognized the advantages of this method and developed nally the Blo k dete tor that signi antlyeases the manufa turing pro ess and eo ipso redu es osts. Figure 1.10(a) shows the basi onguration.A large pie e of s intillation material is partially segmented into many small elements. A variation in hedepth of the saw uts from element to element is used to ontrol the distribution of the s intillation lightto the four single- hannel photomultiplier tubes. Two position estimates X and Y an be omputed fromthe four signals by simple arithmeti operations:X =
PMTupright + PMT down
right − PMTupleft − PMT down
left
PMTupleft + PMT
upright + PMT down
left + PMT downright
(1.16)Y =
PMTupright + PMT
upleft − PMT down
right − PMT downleft
PMTupleft + PMT
upright + PMT down
left + PMT downright
, (1.17)whi h are used afterwards to identify the element where the s intillation light ame from. Typi al Blo kdete tors are made from 20 to 30 mm thi k BGO or LSO with 4 to 6 mm wide sub-elements. While therst Blo k dete tor used only 32 rystal elements, up to 144 rystals per PMT an be found in modernstate-of-the art PET s anners.The geometry of dedi ated PET-systems is strongly onned by the fa ts that temporal oin iden edete tion is required and that se tors without γ-ray dete tion result in artifa ts due to the image re on-stru tion methods used (Natterer and Wübbeling [56). Therefore, one nds either losed ring and regularpolygon systems that exhibit a lear axial symmetry or partial ring and polygon systems that are rotatedin order to re-establish the broken symmetry. Figures 1.10(b)-1.10(e) illustrate some dierent approa hes.Espe ially in PET s anners with ir ular geometry one often nds several sta ked full rings in order to in- rease the axial FOV. PET s anners with a polygonal arrangement of panel dete tors normally inherentlyexhibit a su iently large axial FOV. Further advantages of full-ring systems are a higher e ien y andredu ed s anning time. In parti ular the gain in e ien y has to be mentioned sin e it grows with thesquare of the a tive dete ting volume when no septa are used. Suppose one has a system onsisting in onesingle dete tor ring. If one now adds a se ond full ring, one not only gains the events dete ted by this newring, but also those events where one γ-photon is dete ted by one ring and the se ond by the other.3The word phoswi h is derived from the words phosphor and sandwi h.14

1 Histori al Introdu tionPSfrag repla ementsSaw uts four PMTs
Blo k of S intillator(a) blo k dete tor
PSfrag repla ementsSaw utsfour PMTsBlo k of S intillator(b) partial ring s annerPSfrag repla ementsSaw utsfour PMTsBlo k of S intillator ( ) full ring s anner
PSfrag repla ementsSaw utsfour PMTsBlo k of S intillator(d) planar s annerPSfrag repla ementsSaw utsfour PMTsBlo k of S intillator (e) hexagonal s annerFigure 1.10: Positron Emission Tomography s anner geometries. Photo-dete tion elements are dark gray shaded and s intillator rystals are lightgray shaded.1.6 Radioa tive Agents and Nu lear Medi ineThe very rst study of metabolism using radioa tive substan es transport within living systems dates ba kto 1923, when de Hevesy and Paneth investigated the transport of radioa tive lead in plants. Seven yearsafter, Ernest Lawren e et al. onstru ted the rst y lotron (Bryant [57) with the aim of bombardingelements and exploring the nature of the atomi nu leus (Wagner [58). It took further 4 years untilCurie and Joliot dis overed that elements ould be a tivated by irradiating them with alpha parti les fromradium or polonium. The importan e of the radiotra er prin iple together with the fa t that virtuallyevery element ould be a tivated now be ame lear, and in 1935 Hevesy and Chiewitz were the rst toapply this new prin iple to a study of 32P distribution in rats. In 1936, Martin David Kamen ame toBerkeley to visit Laweren e's famed radiation laboratory. He was nally hired and used the y lotronto produ e the radioa tive 11C in order to larify the still poorly understood pro ess of photosynthesis.However, the usefulness of this isotope was limited by its very short half-life of only 21 minutes that for edKamen and its olleagues to work at high speed and even to use arrier pigeons to inter hange samplesbetween laboratories. The dis overy of 14C with its half-life of 5730 years was the result of the sear h tond a more suitable radioa tive arbon isotope. This isotope is very important be ause it an be used fordetermining the age of fossils as shown by William Libby in 1946. Until the development of CT and MRI,nu lear medi ine physi ians fo used their attention to the imaging of organs, whi h were insu ientlydierentiated by X-ray imaging. However, the overwhelming potential of radiotra er imaging lies in itspossibility to mark and tra e virtually every metaboli a tive substan e allowing a graphi al representationof its distribution within the examined obje t. Thus the development of radiopharma euti als was fo ussedon biologi al elements like 11C, 15O, 18F and 13N that ould be generated with y lotrons.One of the rst in vivo studies was the measurement of erebral blood ow with 79Kr and later 133Xeand 131I. With the emergen e of the Anger-type amera and dete tors for positron-emitting radionu lides in1953, the in vivo lo alization of tumors be ame possible. In 1960, Stang and Ri hards from the BrookhavenNational Laboratory, USA, announ ed the new radionu lide 99mTc, obtainable from 99Mo and Paul Harperat the University of Chi ago realized that it was almost ideal for nu lear imaging for various reasons: Itsde ay energy perfe tly mat hes the requirements of Anger-type ameras. Its physi al and biologi al half-lifewas short enough to allow administration of high doses and it was readily available through its long-livinggenerator 99Mo. Owing to its properties, 99mTc be ame the workhorse of nu lear medi al imaging. De ades15

1.6 Radioa tive Agents and Nu lear Medi ineelapsed before hemi al analogues of interest ould be tagged with radionu lides and even nowadays manyradioa tive tra er substan es in routine diagnosti imaging are of a very basi hemi al stru ture and oftendo not exist naturally in the human body. The renaissan e of the biologi al radionu lide began with astudy of Ter-Pogossian and Powers in 1958 on the oxygenation of tumors. They worked with 15O and mi ewith mammary adeno ar inomas. Dire tly onne ted to O2-metabolism one nds the dierent sa haridesas important energy substrates in living organisms explaining the high interest in a radiotra er that ouldvisualize this metabolism. Of spe ial interest is glu ose owing to its importan e as an energy pool for thenervous system. Sin e an adult human requires at least 180 grams of glu ose every day (Ruhlmann [59),standard s intigraphy ould not be used due to the high signal level. Another in onvenien e of this mole ulewas that it ould not be labelled with one of the usual radionu lides known at that time. A rst attemptwas made in 1977 by Sokolo et al. using 14C-deoxyglu ose. Deoxyglu ose (DG) is an analogue of glu ose inwhi h the hydroxyl group on the se ond arbon has been repla ed by hydrogen (Phelps [60). DG has alsobeen labeled with the positron-emitting 11C thereby making it a essible to positron emission tomography.The mu h shorter half-life of only 20 min. allows repeated studies in a single day, but unfortunately the DG'sblood pool learan e only takes about 40 min. Attempts were also made with 11C-glu ose, that is, using theradioa tive labeled natural substrate glu ose. Unlike the analogue tra er, labeled substrates annot usuallybe used to isolate single rea tions steps. In the ase of gly olysis, the metaboli pro ess in whi h glu ose is onverted to pyrovate4, ten dierent hemi al rea tions are involved. The 11C-labeled glu ose undergoes asubstantial fra tion of these rea tions and the following ATP-metabolism until it is removed from the ell as11CO2 or 11C-labeled la tate. It is lear that the radiation from these end-produ ts annot be distinguishedfrom radiation oming from the tra er in its original form. Further, labeled intermediates ould also betaken up by other pro esses ompletely dierent for glu ose. The kineti data is thus distorted and lessreliable. By substituting the hydroxyl group on the se ond arbon of glu ose by 18F one obtains [18F-FDG.This radiotra er has a more suitable physi al half-life of 110 min. and furthermore provides the advantagethat its gly olysis breaks down after a few hemi al rea tion inside the ell. The idea for this tra er wasborn at a wine-tasting event where Lou Sokolo and Martin Reivi h oin ided. They ommented on theirndings to Al Wol and Joanna Fowler from the Brookhaven National Laboratory, where 18F-labeled FDGhas been synthesized for the rst time by Ido et al. The rst images using this tra er in the brain were takenwith the Mark-IV s anner by Kuhl et al. and numerous later studies have been realized with [18F-FDGmaking it the prime radiotra er for routine medi al PET explorations. Studies that were arried out withthis radiotra er over de ades have demonstrated the a umulation of [18F-FDG in an erous tissue andshowed that PET is very useful for dierent lini al requirements, su h as dete ting primary sites of an er,dierentiating benignity or malignity of lesions, staging and grading the degree of malignity, planing andmonitoring of the treatment and dete tion of re urrent diseases and metastasis.Nu lear imaging modalities are now established as a powerful s ienti and lini al tool for probingbio hemi al pro esses in the human body. Sin e the dis overy of 99mTc and the development of [18F-FDG,many other more spe i radiotra ers have been found and su essfully applied. It nally leads to theemergen e of nu lear pharma y as a spe ialty pra ti e and motivated a large number of resear h groups tosear h for further possible radiopharma euti als. At the moment, there is already a very large spe trum ofspe i pharma euti als whi h an be used for visualizing very parti ular aspe ts of the metabolism of dis-eases and the prospe ts of nding new ones are promising. Routine lini al appli ation nowadays embra esabove all on ology, nu lear ardiology, and neurology (S hlyer [61, A ampa et al. [62). Nevertheless, themost ommonly used radiotra ers are still very unspe i or do not exist in the human metabolism. Presentand future developments are strongly fo used on new radiotra ers with high spe i ity and with adequatekineti hara teristi s for quantitative analysis. This in ludes the development of radiotra ers for imagingneurotransmitter systems, amino a id transport, protein synthesis, DNA synthesis and re eptor imaging(Kim and Ja kson [63, Fowler et al. [64). A list of ommonly mentioned radiotra ers together with themedi al tests that they are used for an be found in Appendix A.1.6.1 Requirement for Radiotra ersMole ular imaging is very promising for providing physiologi al or bio hemi al information for individualpatients and, as has been mentioned before, is already be oming a routine diagnosti te hnique in medi ine.Generally, an imaging tool for routine medi ine has to obtain the results in a short time in order to beuseful. Fun tional imaging also requires that the un ertainty in ea h measurement is smaller than the4Pyruvate is the ompound to start the energy y le within ells that yield dire t pre ursors to ATP or ATP itself.16

Referen esre onstru ted ontrast among dierent physiologi al states so that a hange in these states an be easilydete ted. Consequently, radiotra ers have to fulll some important requirements in order to be suitablefor mole ular imaging, espe ially if they are applied in human medi ine (Phelps et al. [60, Hamilton [65).First of all, the tra er must be related predominantly to the pro ess of on ern, whatever this may be. Alsoit is ne essary that the turnover time of the tra er within the spe imen must be within the time window ofthe nu lear imaging modality. This se ond requirement in ludes many dierent aspe ts of the radiotra erand radionu lide, the s anner to use and the biologi al tissue and fun tion that is imaged. The hoi e ofradionu lide has to be made on the basis of providing the maximum diagnosti information together withminimum radiation dose to the patient. Therefore, the radionu lide must have a su iently long physi alhalf-life TPHY in order to obtain su ient statisti s for medi al images of reasonable quality and at the sametime, they have to be short for a fast lowering of the dose that the patient re eives. There are two pro essesthat redu e the radioa tivity inside the patient on e the radiopharma euti al has been administered. Besidethe radioa tive de ay, the radionu lide is removed from the body physiologi ally with a biologi al half-lifeTBIO. The ee tive half-life is the inverse sum of T−1BIO and T−1PHY. The pharma euti al is also required to benon-toxi in the administered amounts, to be present in the target tissue in a su iently short time and theuptake in pathology should show dieren es from normal. Moreover, many of the radiopharma euti als aresynthesized in situ and just before they are administered to the patient. This requires that the synthesisand the imaging pro ess must be nished within a time frame that is ompatible with the ee tive half-lifeof the radiopharma euti al. Synthesis and imaging may take few minutes up to hours.GenerationRadiopharma euti als an be divided into two ategories by their properties whether they are brought readyfor use from outside the site of appli ation or whether they have to be re onstituted in situ. The earliestmethod of produ ing ommer ial arti ial radionu lides was to expose a target material to the neutron uxof nu lear rea tors. However, even in intense neutron uxes only a very small fra tion of the target nu leiis a tivated. Sin e the target and produ t nu lei are dierent isotopes of the same elements (neutrons arryno harge), they annot be separated hemi ally. Hen e, the produ t is not target- or arrier-free and oflow spe i a tivity. Carrier-free produ ts an be generated by hoosing parti ular targets whose a tivationresults in short-lived intermediate produ ts. If the subsequent de ay to the desired radionu lide in ludes a hange in the element, hemi al separation is possible. Alternatively, radionu lides an be obtained by usingparti le a elerators, espe ially ompa t y lotrons. Sin e the a elerated parti les are harged, the produ tis normally a dierent element and an be separated hemi ally for obtaining arrier-free radionu lides.A very important on ept for obtaining radionu lides is the produ tion of a long-lived generator. Theprin iple onsists in the reation of an unstable but long-lived parent radionu lide at the produ tion fa ility.This parent de ays steadily to produ e a short-lived daughter nu lide whi h has all properties of the desiredradionu lide and moreover whose hemi al hara teristi s allow for easy separation. Examples for generatorsare 99Mo, 81Rb and 113Sn. They de ay to the radionu lides 99Tcm, 81Krm and 113Inm with the half-livesof 67 h, 4.7 h and 115 days respe tively.Referen es[24 W. Wayand, The history of minimally invasive surgery, Business Brieng: Global Surgery, pp. 3738,2004.[25 K. Otsuka and T. Togawa, Hippo rati thermography, Physiol. Meas., vol. 18, pp. 227232, 1997.[26 C. Zywietz, A Brief History of Ele tro ardiography - Progress through Te hnology,, biosigna Institutefor Biosignal Pro essing and Systems Resear h, http://www.opene g.net/, Hannover, Germany.[27 N. J. Mehta and I. A. Kahn, Cardiology's 10 greatest dis overies of the 20th entury, Texas HeartInstitute Journal, vol. 29, no. 3, pp. 164171, 2002.[28 S. Webb, From the wat hing of shadows. Adam Hilger, 1990.[29 P. Wright, Psy hology & Psy hiatry / Mental Illness. Elsevier S ien e / Health S ien e, 2002. 17

Referen es[30 M. S. Gor hesky, Spinal endos opy, Ja ksonville Medi ine, vol. 50, no. 4, pp. 155158, 1999, nowNortheast Florida Medi ine.[31 R. Van Tiggelen and E. Pouders, Ultrasound and omputed tomography: Spin-os of the world wars,JBR-BTR, vol. 86, pp. 235241, 2003.[32 S. E. Keevil, Magneti resonan e imaging in medi ine, Phys. Edu ., vol. 36, pp. 476485, 2001.[33 C. Boesh, Mole ular aspe ts of magneti resonan e imaging and spe tros opy, Mol. Aspe ts Med.,vol. 20, pp. 185318, 1999.[34 H. N. Wagner, Hal Anger: Nu lear medi ine's quiet genius, J. Nu l. Med., vol. 44, no. 11, pp.26N34N, Nov. 2003.[35 H. E. Johns and J. R. Cunningham, The Physi s of Radiology, 4th ed. Charles C Thomas Publisher,1983.[36 R. Nutt, The history of positron emission tomography, Mol. Img. and Biol., vol. 4, no. 1, pp. 1126,2001.[37 H. Kume, Photomultiplier tube, prin iple to appli ation, Hamamatsu Photoni s K.K., 1994.[38 W. F. Brinkmann, D. E. Haggan, and W. E. Troutman, A history of the invention of the transistorand where it will lead us, IEEE J. Solid-State Cir uits, vol. 32, no. 12, pp. 18581865, De . 1997.[39 A. V. Dormael, The 'Fren h' Transistor, in Pro eedings of the 2004 IEEE Conferen e on the Historyof Ele troni s, 2004.[40 M. Riordan, How Europe Missed The Transistor, IEEE Spe trum, vol. 42, no. 11, pp. 4651, Nov.2005.[41 J. Coupland, Super ondu ting magnets, Phys. Te hnol., vol. 18, pp. 143152, 1987.[42 J. S hrieer and M. Tinkham, Super ondu tivity, Reviews of modern physi s, vol. 71, no. 2, pp.313317, 1999.[43 W. R. Hendee, Physi s and appli ation of medi al imaging, Rev. Mod. Phys., vol. 71, no. 2, pp.444450, 1999.[44 F. Kuijpers, The role of te hnology in future medi al imaging, Medi a Mundi, vol. 40, no. 3, pp.181189, 1995.[45 S. Ogawa, D. Tank, R. Menon, J. Ellermann, S. Kim, H. Merkle, and K. Ugurbil, Intrinsi signal hanges a ompanying sensory stimulation: fun tional brain mapping with magneti resonan e imag-ing. Pro . Natl. A ad. S i. USA, vol. 89, no. 13, pp. 59515955, jul 1992.[46 G. Z. Dikmen, G. Gellert, P. Do§an, R. Mason, P. Anti h, A. Ri her, W. E. Wright, and J. W. Shay, Anew diagnosti system in an er resear h: Biolumines ent imaging (BLI), Turk. J. Med. S i., vol. 35,pp. 6570, 2005.[47 F. De onin k, Nu lear imaging in the realm of medi al imaging, Nu l. Instr. and Meth. A, vol. 509,no. 1, pp. 213228, aug 2003.[48 F. G. Blankenberg and H. Strauss, Nu lear medi ine appli ations in mole ular imaging, J. Magn.Reson. Imaging, vol. 7, pp. 352361, 2002.[49 H. Anger, S intillation amera, Rev. S i. Inst., vol. 29, no. 1, pp. 2733, 1958.[50 H. O. Anger, S intillation amera with multi hannel ollimators, J. Nu l. Med., vol. 5, 1964.[51 W. Ralph, S aling down imaging: Mole ular mapping of an er in mi e, Nature, vol. 2, pp. 18, Jan.2002.[52 G. L. Brownell, A history of positron imaging, Published by the Physi s Resear h Laboratory, Mes-sa husetts General Hospital, http://www.mit.edu/~glb/alb.html, 1999, presentation given in elebra-tion of the 50th year of servi es by the author to the Massa husetts General Hospital on O tober 15th,1999.18

Referen es[53 J. Cassidy, Paul and G. K. Radda, Mole ular imaging perspe tives, J. R. So . Interfa e, vol. 2, no. 2,pp. 133144, June 2005.[54 T. Jones, The role of positron emission tomography within the spe trum of medi al imaging, Eur.J. Nu l. Med., vol. 23, no. 2, pp. 207211, Feb. 1996.[55 S. R. Cherry, J. A. Sorenson, and M. E. Phelps, Physi s in Nu lear Medi ine, 3rd ed. Saunders,Imprint of Elsevier, 2003.[56 F. Natterer and F. Wübbeling, Mathemati al Methods in Image Re onstru tion. Siam Monographson Mathemati al Modeling and Computation, 2001.[57 P. Bryant, A brief history and review of a elerators, CERN A elerator Te hnology and Physi s In-trodu tion, http://do . ern. h/yellowrep/1994/94-01/p1.pdf, pp. 117, 1993, AS - CERN A eleratorS hool: 5th General a elerator physi s ourse.[58 H. N. Wagner, A brief history of positron emission tomography, Seminars Nu l. Med., vol. 28, pp.213220, July 1998.[59 O. J. Ruhlmann and P.-J. Biersa k, Pet in On ology. Springer, Berlin, 2003.[60 M. E. Phelps, J. C. Mazziotta, and H. R. S helbert, Positron Emission Tomography and Autoradiog-raphy. Raven Press, New York, 1986.[61 D. S hlyer, PET Tra ers and Radio hemistry, Annals A ademy of Medi ine, vol. 33, no. 2, pp.146154, Mar. 2004.[62 W. A ampa, C. Di Benedetto, and A. Cuo olo, An overview of radiotra ers in nu lear ardiology, J.Nu l. Cardiol., vol. 7, no. 6, pp. 701707, 2000.[63 E. E. Kim and E. F. Ja kson, Mole ular Imaging in On ology. Springer, Berlin, 1999.[64 J. S. Fowler, Y.-S. Ding, and N. D. Volkow, Radiotra ers for positron emission tomography imaging,Seminars Nu l. Med., vol. 33, no. 1, pp. 1427, Jan. 2003.[65 D. Hamilton, Diagnosti Nu lear Medi ine. Springer, Berlin Heidelberg, 2004.
19

Referen es
20

2 Motivation and Outline2 Motivation and OutlineTse w fail to learn t le&ons of hi<ory are omed to reat tm.George Santayana, ⋆ 1863 † 1952NUCLEAR imaging modalities not only have proven very valuable in the medi al dis iplines of on- ology, ardiology, neurology, neuropsy hology and ognitive neuros ien e and psy hiatry, but alsoplay a ru ial role in pharma ology. Due to their dedi ated fun tional imaging te hniques, it is not onlypossible to evaluate in pre lini al trials new drugs very ee tively in small animals but also opens thedoorway to a mu h more sophisti ated and fun tion spe i drug development. Moreover, nu lear imaginghas signi antly enhan ed the ability to study animal models of diseases by enabling the ontinuous in vivomonitoring of disease development and rendering many ne ropsy studies unne essary. The possibility oftransgeni manipulation of mi e emerged in re ent years and led to a more detailed understanding of exist-ing rosslinks between spe i genes and mole ular, ellular and organ fun tions. So- alled Kno k-out mi eare now the basis for studying the physiology of the brain, heart and any other fun tion. The perspe tivesfor mole ular imaging be ome strikingly lear if one bears in mind that this progress was made with imagingequipment of rather poor performan e. Spatial resolutions above 1 mm, sensitivity of mere 5% and less fordedi ated small animal PETs together with energy resolutions of about 15% made many of these resultspossible. It is against this ba kground that many resear h groups all over the world are making a greateort to further improve all performan e parameters. Unfortunately, many of these parameters onstitutedesign oni ts and nearly all oni t with the requirement of low fabri ation ost. Yet, one of the mostimportant prerequisites for a widespread appli ation of the developed te hnologies is a low initial outlay.A main motivation for this work has been the redu tion of fabri ation osts, under the ondition thata reasonable dete tor performan e is a hieved. The de ision to use ontinuous, large-sized s intillation rystals has been taken for this reason. It avoids ostly segmentation of the rystals whi h involves the lossof a substantial amount of material due to involuntary rupture and the saw uts and requires either a rathertedious assembling or the installation of a robot. Likewise, the hoi e of using large-area position sensitivephotomultipliers together with the enter of gravity algorithm (CoG) is a dire t onsequen e of this goal.The pri e per unit sensitive area of these devi es is a eptable for use in dedi ated small animal s annersand the analogi ally implemented CoG algorithm ee tively redu es the number of required ele troni hannels. Unfortunately, ele troni implementations of the CoG algorithm in its present form are not ableto provide information about the depth of intera tion (DOI) of the in ident γ-ray. This leads to artifa tsthat onsiderably redu e the spatial resolution of the dete tor, espe ially for the PET modality where thi ks intillation rystals are required for stopping the in ident 511 keV γ-ray ee tively.In order to fulll the pre ondition of reasonable dete tor performan e, important enhan ements of theanalogue CoG algorithm be ome ne essary. The known fa t of the orrelation between the width of thes intillation light distribution and the depth of intera tion motivated the design of DOI enhan ed hargedividing ir uits and an algorithm for re overing the true impa t positions from their output signals. Forthis purpose, a detailed omprehension of all aspe ts of light propagation within the s intillation rystaluntil its dete tion is indispensable and in hapter 4, the distribution of the s intillation light a ross thephotosensitive surfa e of the dete tor is parameterized. In hapter 5, the behavior of existing hargedividing ir uits is studied. It will be shown that all ongurations analogi ally ompute the trivial andthe rst non-trivial moment of the applied signal distribution and a novel modi ation will be presentedthat allows the simultaneous omputation of the se ond non-trivial moment, whi h relates to the DOI.Chapter 6 briey summarizes the impa t of Compton s attering on the expe ted a ura y of the momentmeasurements. The results of hapters 4 and 5 have been veried by experiment. How this was done andwhat results have been obtained is explained in hapter 7. Chapter 8 presents a standard method on howthe new information provided by the depth-enhan ed harge divider ir uits an be used to re onstru t thefull, three-dimensional photo onversion position. The nal hapter 9 summarizes the main on lusions anddis usses the future outlook for this method. 21

2 Motivation and Outline
22

3 Dete tor Components and Limits3 Dete tor Components and LimitsEry generation laughs at t old fashions, but foows religiously t new.Henry David Treau, ⋆ 1817 † 1862THE rst radiation dete tor that was used in medi ine was learly the photographi lm for X-raytransmission radiography. Film-based radiography is still used extensively in daily medi al appli a-tions, a ir umstan e whi h is due to the high amount of stru tural information, the low ost and omplexityand an outstanding spatial resolution of the photographi lm. The overwhelming progress in atomi andnu lear physi s aused an ever-in reasing interest in more sophisti ated and a urate parti le dete torswith onstant improvement in spatial resolution, energy resolution, timing resolution, et . In parti ular,the eld of nu lear medi ine benets from these advan es for obvious reasons.Radiation dete tors an be lassied into three large families: Ionization dete tors, s intillation dete torsand semi ondu tor dete tors. Ionization dete tors were the rst ele tri al devi es that were developed forradiation dete tion. Members of this family are the ionization hamber, the proportional ounter, theGeiger-Müller ounter and later the multi-wire proportional hamber, the drift hamber and the timeproje tion hamber (see for instan e Leo [66). Ex ept for very few ases, su h as the HIDAC PET,developed by Jeavons et al. [67, and a more re ent proposal of using lead walled straw tubes (La y etal. [68), none of these dete tors are applied to medi al imaging, mainly be ause it is di ult to design ompa t dete tors. However, they are extensively used in experimental high energy physi s sin e there isno need for ompa tness in large parti le a elerator installations.The most important dete tor design for medi al imaging is the s intillation dete tor. They are undoubt-edly the most versatile parti le dete tors with a wide range of appli ations. In 1903, Crooks invented thespintharis ope. This is probably the rst use of s intillators for parti le dete tion and onsisted of a ZnSs reen that produ ed weak s intillation when stru k by α-parti les that ould be observed with the nakedeye. This, however, required some pra ti e and it was tedious to use. After the su ess of Iams et al. in1935 to produ e the rst triode photomultiplier tube, the human eye was repla ed in 1944 by these newdevi es for the rst time by Curran and Baker. The s intillation ould now be ounted using ele troni devi es. After further development and improvement of the photomultiplier tubes and the s intillators inthe following de ades, s intillation parti le dete tors are now among the most reliable and onvenient de-te tors. This, and the fa t that nowadays very ompa t s intillation dete tors an be manufa tured, leadsto their wide appli ation in medi al imaging. Modern S intillation dete tors an provide information aboutthe energy and two-dimensional position of the radiation. Moreover, they are very fast and, depending onthe s intillator, an show very short re overy times ompared to other types of dete tors. With ertains intillators it is even possible to distinguish between dierent types of parti les by means of pulse shapedis rimination.Semi ondu tor dete tors are the youngest family of parti le dete tors. Real development of these devi esbegan in the late 1950's. They provided the rst high-resolution dete tors for energy measurement and werequi kly adopted for parti le dete tion and espe ially gamma spe tros opy. The use of semi ondu tors forposition measurement is rather new, however development in this eld has seen huge progress in re ent years.This was mainly due to the adaption of te hnologies used in mi ro-ele troni s and has been further enhan edby enormous improvements in sili on dete tor te hnology, front end ele troni s and signal pro essing. Mi ro-strip dete tors and sili on drift hambers exhibit ex ellent properties for use as high-resolution parti le tra kdete tors and are possibly the dete tors for the next generation experiments in high energy physi s. A veryimportant drawba k of semi ondu tor parti le dete tors arises from their intrinsi noise. Espe ially forimaging modalities that are based on high energy photons, this is an important design oni t. Due to thehigh energy of the photons, γ-ray dete tors need to have an elevated stopping power whi h is a hieved bysu iently sensitive volume of high density materials with high ee tive atomi number. The density and23

3.1 Solid-State Gamma-Ray Dete torsPSfrag repla ementsAl Al
p+ n+nBiasSignal
︸ ︷︷ ︸
SensitiveVolumeFigure 3.1: p-n diode jun tion dete tor in reversed bias operation mode.ee tive atomi number are already determined by the hoi e of the semi ondu tor and only the volumeremains as a free design parameter. Unfortunately, the noise of semi ondu tor devi es s ales with thevolume and very strong onstraints exist. Although the noise an be redu ed by a tive ooling, this wouldfurther in rease the ost of the system. Therefore there are very few and very spe i appli ations thatallow the use of solid state dete tors in medi al imaging.3.1 Solid-State Gamma-Ray Dete torsThe basi operating prin iple of semi ondu tor dete tors is analogous to gas ionization hambers. Thein ident ionizing parti le reates a large number of ele tron-hole pairs along its traje tory through thesemi ondu tor material and these harges are olle ted by an ele tri eld. Compared to gaseous ionizationdete tors, there are important advantages. In the ase of semi ondu tor material, the average energy thatis required to reate a single ele tron-hole pair is ∼ 3.6 eV, one order of magnitude smaller than the averageionization energy of ∼ 30 eV for gases. Furthermore, semi ondu tors have a higher ee tive atomi numberand density. Therefore the energy loss per traversed length is very large resulting in a high stopping powerfor ionizing parti les. As a onsequen e, semi ondu tor parti le dete tors an be made very ompa t andthe me hani al rigidity allows for building self-supporting stru tures. Despite the high material density,ele trons and holes have a very high mobility and the harge an be olle ted in a few nanose onds.Additional advantages are the possibility of embedding xed-spa e harges for reating sophisti ated eld ongurations and, as both dete tors and ele troni s an be built out of sili on, they an be integrated ina single devi e (Lutz [69). Important disadvantages are the already mentioned intrinsi noise that oftenmakes intense ooling ne essary and the possibility that their rystalline stru ture an be damaged by thedete ted radiation.A simple p-n diode jun tion an already be used for the dete tion of light or ionizing radiation. Thediode may be used without the appli ation of an external bias voltage or in the reverse bias mode. Unbiaseddete tors are preferred for radiation level measurements. The example for a p-n jun tion in reverse biasmode is shown in gure 3.1. This is the ommon operation mode for single parti le measurements. Thediode onsists of a very low doped n substrate. In order to be able to olle t the harges released by theradiation, metal onta ts must be bonded onto both sides of the diode. Sin e simple onta ts betweenmany metals and semi ondu tors lead to depletion zones, highly doped but shallow p+ and n+ regions areintrodu ed at both surfa es of the diodes before tting the onta ts. Ele tron-hole pairs that are generatedinside the sensitive volume are separated by the ele tri eld and will move towards the ele trodes. Forsignal isolation purposes, the bias voltage is supplied to the p-n diode through a resistor.Nearly all existing semi ondu tor dete tors are based on this prin iple. More or less sophisti ated mod-i ations are made in order to a hieve spe ial required properties, su h as position resolution, et . Besidesthe elemental semi ondu tors Si and Ge, there are omposed semi ondu tors onsisting of ombinations ofelements from dierent periodi table groups. Well known members of this family are GaAs and InAs. Inre ent years, mu h investigation has been done in this eld and the list of possible andidates is now verylong and allows for hoosing semi ondu tor materials that are most suitable for the appli ation of interest.For instan e, nitrides of the third group have high toleran e to ionizing radiation, making them suitablefor radiation-hardened ele troni s. Among this large range, the II-IV semi ondu tor Cadmium telluride(CdTe) and the II-VI ternary alloy semi ondu tor (CdZnTe) are promising materials for hard X-ray andγ-ray dete tion. The high atomi numbers of the materials give a reasonable quantum e ien y that is24

3 Dete tor Components and LimitsPSfrag repla ements Housing
Ele troni sS intillatorOpti al ouplingPhotodete tor
Figure 3.2: S hemati diagram of the most basi s intillation ounter. Thehousing is required for avoiding the dete tion of straylight. It may also ontain lead for redu ing the dete tion of ba kground radiation and/or µ-metal for shielding against magneti elds.suitable for operation at the energy range from 10 KeV to 500 KeV (S heiber and Gaikos [70). Thesematerials are already used in ommer ial devi es for digital radiography, omputerized tomography, smalleld-of-view γ- ameras and intra-operative probes for radio-guided surgery. However, large multi-elementdete tors made from these materials are very expensive whi h is still the main drawba k of this te hnology.3.2 S intillation Dete torsThe basi onguration of a s intillation dete tor is shown in gure 3.2 and onsists of a s intillator that isopti ally oupled to a photosensor. As radiation intera ts with the s intillator by elementary pro esses likeCompton s attering or photoele tri ee t, a kno k-on ele tron is produ ed that then ex ites or ionizes theatoms and mole ules of the s intillation rystal. The de ay of these ex ited s intillation enters give rise tothe predominantly visible light photons whi h an be onverted to ele tri al signals with the photodete tor.3.2.1 S intillatorsVisual ounting of the (at that time) re ently dis overed X-rays and also natural radioa tivity be amepossible with the powdered phosphor materials CaWO4 and ZnS at the end of the 19th entury and madepossible the previously mentioned invention of the spintharis ope. Sin e that time, inorgani s intillatorsespe ially have been an integral part of medi al imaging and are still heavily used in this dis ipline. This an be explained by their omparatively good dete tion e ien y for hard radiation. After the invention ofthe photomultiplier tube, the nal breakthrough of s intillation dete tors was due to the dis overy of thepure and a tivated alkali halide rystals. In 1948, Hofstadter introdu ed the s intillators NaI:Tl and CsI:Tlfor e ient photon and parti le dete tion (Novotny, [71). They have been used extensively for nearly 60years and are still very ommonly applied. Nevertheless, s intillator development is in full progress, andthe volume of s intillator material required ea h year for medi al imaging devi es is onsiderable. All inall, a total of 175 tons of s intillator are produ ed annually (Moses [72).Yet, the various nu lear medi al imaging modalities dier in their underlying prin iples and above allin the energy of the γ-rays they have to dete t. Therefore, there are dierent requirements for s intillationdete tors and the s intillators to be used. An ideal s intillator must have a very large density and ee tiveatomi number, high luminous e ien y (light yield), short de ay time of the ex ited states, neither after-glow nor other ba kground, and low ost. These requirements annot be met by a single s intillator andmany of them are still sub-optimal for many appli ations. This is essentially the reason for further resear hand development in this eld. Sin e the all-in-one s intillator does not exist, one has to hoose instead themost suitable from all available materials. Fortunately, the list of available s intillators is already ratherlong and the properties of the dierent materials over wide ranges.For developing a new s intillator material, materials with relatively high density, ρ, and ee tive atomi number, Zeff , should be used be ause the absorption probability by photoele tri ee t is proportional toρZ3−4
eff (van Eijk, [73). The material should also be transparent to the s intillation light. Hen e, rystalswith a forbidden energy gap, Egap , between valen e and ondu tion bands must be used and learly Egap25

3.2 S intillation Dete torshas to be large enough to permit the transmission of the light. This is fullled by ioni rystals or rystalswith some degree of ovalen e. Also good energy resolution is required by many imaging modalities.Sin e the photon ounting is dominated by Poisson pro esses, a large number of s intillation photonsis desired and this is a hieved by a low small forbidden gap. This is learly a design oni t with theformer requirement and a reasonable tradeo has to be found. Further aspe ts are non-proportionality, rystal growth, photofra tions et . A list (whi h is not intended to be omplete) of ommonly mentioneds intillators together with their key properties is given in Appendix B.The spe ial requirements for X-ray s intillators are, in order of de reasing importan e: high light yield,high density, good mat hing of the peak emission wavelength, well dened granularity and homogeneity. Allthese properties are nearly ex ellently ombined by Gd2O2S:Tb making it the universally used s intillatorfor this purpose.For X-ray omputed tomography, the most important property is low afterglow, followed in order ofde reasing importan e, high temporal and hemi al stability and insensitivity to radiation damages, highdensity, good mat hing of the peak wave length and high light yield. CdWO4 and erami s intillators areoften used here.The requirements for Gamma-S intigraphy and SPECT are already inuen ed by the higher energyof the imaged radiation. They are, in order of de reasing importan e, high light yield for good energyand spatial resolution, high density for e iently stopping the radiation, low ost be ause in general largequantities are required, good mat hing of the peak emission wavelength and short de ay time. Almost allthese requirements are well mat hed by the alkali halide rystals NaI:Tl and CsI:Tl. Re ently, the news intillators LaCl3:Ce and LaBr3:Ce have been introdu ed. These materials ombine high light yield andgood energy resolution with a response time mu h smaller than that of the former two rystals. Sin e theirdete tion e ien y is omparable to that of NaI:Tl, they may be interesting alternatives for future dete tordevelopments of this modality.Finally, PET and PEM require above all rystals of a very short attenuation length, sin e annihilationradiation is already very penetrating. Further sele tion riteria, in order of de reasing importan e, areshort de ay times of the ex ited s intillation enters, low ost be ause a high sensitive volume is ne essaryfor a reasonable dete tion e ien y, high light yield and a good mat hing of the peak emission wavelength.Common s intillators for PET imaging are NaI:Tl, Bi4Ge3O12 (BGO) and Lu2(SiO4)O:Ce+ (LSO). NaI:Tlhas long been the standard s intillator for Gamma- ameras and positron ameras for its high light yieldand be ause it mat hes well the sensitivity of photomultiplier tubes. Moreover, it an be grown easily andlarge rystal volumes are possible. With the appearan e of BGO in 1973, it was qui kly repla ed be auseBGO has signi antly better stopping power and photofra tion. However, light yield and energy resolutionare far below the values obtained with NaI:Tl. LSO was introdu ed by Mel her and S hweitzer in 1992 [74.LSO a hieves nearly the same dete tion e ien y as BGO having at the same time a mu h larger light yieldand faster response. While there are dierent important drawba ks of this material, for instan e afterglow(Rogers et al. [75), radioa tive ba kground from Lu (Huber et al. [76) and poor intrinsi energy resolution,for the moment it is the s intillator of hoi e for the PET imaging modality. More re ently, other LSOrelated s intillators have been developed. They are mixed lutetium sili ate (MLS), Lu1.8Gd0.2SiO5:Ce+(LGSO) and Lu2−xYxSiO5:Ce+ (LYSO). Other s intillators that have been used for PET dete tors areGd2SiO5:Ce+ (GSO), LuAlO3:Ce (LuAP) and Lu1−xYxAlO3:Ce (LuYAP).3.2.2 Photodete torsAll designs of radiation dete tors demand a omponent that onverts the s intillation light into ele tri- al signals. A large variety of dete tors have been onstru ted during the past years and their dierentproperties mat h a wide range of individual appli ation needs. They an be grouped in va uum devi es,solid-state devi es and a ombination of both alled hybrid devi es and gaseous dete tors (Renker [77).The latter group has been mainly designed for high-energy physi s experiments and, up to now, there isno appli ation of these devi es for medi al imaging in ombination with s intillators. They will not bedis ussed here. Likewise, the group of hybrid photodete tors has no major signi an e for ommer ialnu lear medi al imaging at present and they are not dis ussed here either.All photodete tors have in ommon that the energy of the light photons is transferred to ele trons andthese ele trons are dete ted. This pro ess is alled photo onversion. The groups of photodete tors dier,however, in whi h material is used and how exa tly this energy transfer o urs. Normally, they also provide26

3 Dete tor Components and Limitsan inherent system of ampli ation that has to be adapted to the dete tor material used and to the kindof photo onversion that takes pla e.A photon that impinges on the surfa e of any material an liberate an ele tron from its atom or evenfrom out of the volume of the material of whi h the atom forms a part. This ee t is alled photoele tri ee t and requires that the photon's energy is higher than the ele tri work fun tion of the material1.Therefore, the work fun tion denes the low energy limit of the light spe trum that an be dete ted whenusing a spe i material. Typi al photo athodes of photomultipliers have their threshold in the visible redlight region. Semi ondu tors have a very low work fun tion and thus an be used for dete ting infraredphotons. However, semi ondu tors also oer a se ond pro ess for photo onversion. It is su ient to lifta ele tron into the valen e band and to avoid, by appli ation of an ele tri eld in an adequate way, thatthis ele tron re ombines and an be olle ted. Due to the very low band gap of semi ondu tors, very littleenergy is ne essary and a highly e ient photodete tor an be realized.Va uum TubesAfter the dis overy of the photoele tri ee t by Heinri h Hertz in 1887 and its su essful des ription byAlbert Einstein in 1905, all onditions had been met for the development of the rst photoele tri tube byElster and Geiter in 1913 (see also Kume [78). The next milestone was the dis overy of the ompoundphoto athode alled S-1 (AgOCs) whi h in reased the sensitivity by two orders of magnitude and was thebeginning of dedi ated photo athode development.Photoele tri tubes an be signi antly enhan ed by introdu ing se ondary emission surfa es as wasrst mentioned in 1902. The photoele trons are a elerated towards an additional ele trode where theirimpa t produ es se ondary ele trons. In its rst implementation by the RCA laboratories in 1936, only oneadditional ele trode was used, but devi es with more than one dynode were qui kly developed. The repeatedgeneration of se ondary ele trons results in an ee tive multipli ation of the primary photoele tron andtherefore an ampli ation of the signal. The implementation is very simple be ause the required va uumtube was already realized with the simple photoele tri tube. Sin e this time, large progress has been madein the development of new photo athodes and dierent dynode types.Modern photomultiplier tubes (PMTs) have a light transmitting window and a semi-transparent pho-to athode is normally evaporated dire tly onto the inner va uum side of this window. Nowadays, there arealso dierent types of windows with dierent properties su h as uto wavelength, thi kness and refra tionindex. Most often borosili ate glasses and UV-transmitting glasses are applied (Fly kt and Marmonier[79). The most used photo athode materials are the already mentioned silver-oxygen aesium, antimony- aesium (SbCs), and the bi- and trialkali ompounds SbKCs, SbRbCs and SbNa2KCs. Dire tly behind thephoto athode, an input ele tron opti s fo uses all photoele trons onto the useful area of the rst dynode.Over the past 70 years, dierent dynode geometries and materials have been developed. The ongurationof the dynode system has a very high importan e for the a hieved gain. Ea h single dynode has to bearranged adequately in order to allow the se ondary ele trons they emit to hit the following dynode. InPMTs with a typi al number of 10-16 stages, gains of about 106 are a hieved. A number of dynode sys-tems have been designed putting the emphasis on dierent key requirements. A very important propertyprovided by mesh dynodes, foil dynodes and mi ro hannel plate dynode is the low spatial dispersion of theele tron avalan he. This allows position sensitive photomultiplier tubes (PSPMTs) that are now widelyused for dierent imaging te hniques. Cir ular age dynodes allow for very ompa t and fast PMTs, butprovide no spatial information.Dynode materials must have a satisfa tory se ondary emission oe ient and a su ient rigidity. Typ-i al materials are AgMg, CuBe and NiAl. Their surfa es an be easily oxidized and yield MgO, BeO andAl2O3 whi h oer a reasonable se ondary emission oe ient. For operation of the PMT, the dynodes haveto be supplied with high voltages where the potentials of all dynodes must dier for orre t a elerationand multipli ation. This an be a hieved with separate high-voltage supplies for ea h stage or using voltagedivider known as bleeder ir uits. Simple resistor hains normally show an insu ient linearity behavior,espe ially for high output urrents. For this reasons, sophisti ated and a tive bleeder ir uits have beendesigned. An example for a high output linearity ir uit is shown in gure 3.2.2.The anode or anodes of photomultiplier tubes are the ele trodes that olle t all se ondary ele trons fromthe last dynode and provide the output signals. Its geometri onguration has to assure large olle tion1The ele tri work fun tion of a material is the minimum required energy for liberating an ele tron from the materialvolume. 27

3.2 S intillation Dete torsC1 C1 C1 C2 C2 C2
K A
DY1 DY2 DY3 DY4 DY5DY DY6 DY7 DY10 DY11 DY12DY9DY8
2R 0.5R 0.75RR
R R R R R R R
0.5R 0.5R 0.5R
-HVFigure 3.3: S hemati of a modern high output linearity bleeder ir uit.e ien y, minimized spa e harge ee ts and good impedan e mat hing with the following ele troni s. Inposition sensitive PMTs, pixelated anodes, rossed wire anodes or rossed plate anodes must be used.An additional syn hronous signal an be derived from the last dynode of the ele tron multiplier sys-tem. The requirement for su h a signal often arises from the desire to syn hronize dierent measurementinstruments. Espe ially in the ase of position sensitive photomultiplier tubes, the last dynode signal is ofinterest. Owing to the segmentation of the anode system, there is no signal that provides position inde-pendent information about the total amount of dete ted light. In order to obtain this information frommulti-anode PMTs, all anode harges have to be summed up. This an be avoided by sensing one of thedynodes be ause the ele trons for the avalan he are liberated from the dynodes and the sudden loss of manyof them an be noted as a variation in the potential. To obtain an amplitude omparable with that of theanode, usually the last dynode is used for the derivation of the signal. Care has to be taken not to disturbthe anode signal and an appropriate mat hing of the impedan es must be assured. Otherwise, the anodesignal will be distorted and the dynode signal dierentiated respe tively. The properties of this additionalsignal allows one to use it for the generation of trigger signals and also for hardware energy dis rimination.An important hara teristi not only for photomultiplier tubes but all photon dete ting devi es is itsquantum e ien y QE whi h gives the probability that an impinging photon leads to an output signal. Atypi al value for PMTs is 25%.Solid-State Photodete torsA very important advantage of semi ondu tor devi es over photomultiplier tubes is their mu h higherquantum e ien y of about 80%. This redu es signi antly signal noise aused by the Poisson pro ess ofphoton dete tion. They an also be produ ed in a fully automated pro ess and therefore an be heap. Itis also possible to make them very ompa t be ause there is no need for me hani al parts. At the sametime, this makes them very insensitive to magneti elds. The dete tor itself is only 0.3mm thi k (Renker,[77).The sili on PIN diode is an example of a semi ondu tor dete tor for visible light photons. Its fun tionalprin iple has already been explained in se tion 3.1 about solid state γ-ray dete tors. It an be produ edby standard semi ondu tor pro esses and its operation is simple and reliable. However, it has no gain atall, making it only suitable for the integrating dete tion mode but not for single photon ounting purposes.Arrays of PIN diodes are very easy to produ e and the time response is, at 1-2 ns, quite low.An important improvement of PIN-photodiodes are avalan he photodiodes (APDs). Theses devi es aredesigned to allow a very high reverse bias voltage. For su iently high voltages, impinging light photons ause ele tron avalan hes with a hieved gains of between 50 and 200. Even higher gains are possible butthey make the devi e very sensitive to ambient instability like temperature drift or residual ripple of thehigh voltage power supply. APDs are suitable for single photon ounting and already have been su essfullyused for small animal PETs. Very interesting enhan ements are large area APDs, (Shah et al. [80) positionsensitive avalan he photodiodes (PSAPDs, Shah et al. [81) and solid-state photomultipliers (SiPMs, Petroand Stapelbroek [82, Saveliev [83). PSAPDs onsist of a large area APD overed with a thin layer withhomogeneous resistivity. This layer performs an integration with linear weighting of the impinging light.From four urrents extra ted at the orners of the resistive layer, the entroids of the light distribution an28

3 Dete tor Components and Limitsbe omputed. Sensitive areas up to 28 × 28 mm2 with a planar spatial resolution of 300 µm are urrentlypossible. Important drawba ks of all APD based devi es are their high intrinsi ele troni noise and thelow temperature stability. Sili on photomultipliers onsist of a large array of small APDs operated inGeiger mode. In this way, respe table gains an be obtained and their timing resolution of 50 ps is alsoex ellent. However, these devi es are still under development and there is no ommer ial appli ation inmedi al imaging to this day.3.3 Degrading Fa torsAll modalities of nu lear imaging are limited by dierent physi al ee ts and un ertainties that impa t ontheir nal performan e, in luding all qualifying parameters like spatial resolution, noise and e ien y. Inall modalities, namely PET/PEM, SPECT and gamma-s intigraphy, γ-photons are the information arrierand the dete tor modules are often of the same type, even though some of the design parameters dier.The dete tion of high and medium energy photons involves, however, a number of di ulties that aremainly due to non-ideal behavior of the dete tor omponents. Finite size of the dete tors leads to a limitedgeometri e ien y, while the nite size of a dete tor pixel limits the spatial resolution. Likewise, none ofthe dis ussed radiation- or photodete tors have a quantum e ien y of 100% and all introdu e ele troni noise. Above all the signal to noise ratio (SNR) and the spatial resolution of the nal image are degradedby a number of physi al ee ts that are hard to avoid. Some aspe ts, e.g. e ien y of Anger-type amerasand positron emission tomographs, as well as the spatial resolution degradation aused by ollimators, havebeen dis ussed already in se tions 1.4 and 1.2 respe tively and are therefore not repeated here.3.3.1 Parallax Error and Depth of Intera tionOne of the most important degrading fa tors for Positron Emission Tomography is the depth of intera tion(DOI) problem. It is aused by the failure of nearly all γ-ray imaging dete tors to provide full three-dimensional information about the photo onversion position within the s intillation rystal (or solid-statedete tor). As a onsequen e of its nature, it is inherent to all nu lear imaging modalities where the γ-raysenter the dete tor in an o-normal dire tions. The la k of DOI information leads to a parallax error inthe determination of both remaining spatial dire tion. Its existen e is known from other elds, espe iallyfrom astronomy, where it is used for determination of stellar distan es. Parallax is the Greek word foralteration and denotes the hange of angular position of two stationary points relative to ea h other if theobserver's position alters. This is shown in gure 3.4. A Parallax error is introdu ed in γ-ray imagingwhenever the thi kness of the absorbing material is nite, the in iden e dire tion of the γ-ray is obliqueand only the spatial oordinates normal to the thi kness of the dete tor are measured. Hen e, the parallaxerror is due to the thi kness of the dete tor and s ales with the same. There is no parallax error for γ-rayswhose angle of in iden e equals 90° respe t to the plane dened by both measured oordinates. For thisreason, Anger-type ameras for s intigraphy or SPECT that use parallel hole ollimators do not suer fromthis error. Contrariwise, the pinhole ollimator introdu es parallax errors be ause it allows oblique γ-rays.The thi ker the dete ting material is, the larger will be the parallax error be ause the un ertainty in thedepth of intera tion in reases. On the other hand one has the requirement of higher mass attenuationfor in reasing γ-ray energy. This an be obtained in two ways. The rst way is the use of material withhigh attenuation oe ient and the se ond method is to in rease the thi kness. Therefore, the intera tiondepth un ertainty poses a more serious problem to positron emission tomography than to SPECT and toGamma-s intigraphy with radiopharma euti als of low de ay energy.For the PET-modality, the parallax ee t appears for any positron sour e displa ed from the geometri al enter of the tomograph's eld-of-view, or in general for any γ-ray impinging non-normal on the rystal(refer to gures 3.4( ) and 3.4(d)). Knowing neither the in iden e angle nor the intera tion depth, thein iden e dire tion of the γ-ray annot be unambiguously determined. In positron emission tomography,the parallax error is also known as radial elongation or radial astigmatism. For a typi al ommer ial whole-body positron emission tomograph with 4 mm wide dete tors and a ring diameter of 80 cm, the la kingDOI information redu es the spatial resolution by ≈ 40% at a distan e of only 10 cm from the enter of theeld of view (Cherry et al. [84). Sin e the DOI ee t in reases strongly with the distan e from this enter,PET s anners are often designed with inner ring diameters mu h larger than it would be ne essary to tthe patient. 29

3.3 Degrading Fa torsPSfrag repla ements observationpoint opti alaxisDD′
d
(a) Histori al signi an e of the parallax error. The absolute error ddepends on the distan es D and D′.PSfrag repla ements
Photodete torCrystalγ
x
y z =?(b) Manifestation in γ-raydete tors.
( ) Parallax error for a full ringPET s anner. The green (light-gray) lines are true LORs and thered (dark) line is a mis-positionedevent. (d) Parallax error for planarPET s anner. The green (light-gray) lines are true LORs andthe red (dark) line is a mis-positioned event. (e) Parallax error for γ- amerasusing pinhole ollimators. Thegreen (light-gray) lines are truelines of ight (LOFs) and the red(dark) line is a mis-positionedevents.Figure 3.4: Formation of the parallax error. Dete tors that are not apableof measuring neither the in iden e angle nor the z- oordinate annot dis-tinguish between γ-rays impinging parallel to the a tual ones. This leads tomisinterpretation of the γ-ray's origin. The three gures below demonstratethe manifestation of this error for dierent imaging modalities and dete tor ongurations.La k of intera tion depth information leads to an additional positioning error when large-sized ontin-uous s intillation rystals together with the enter of gravity positioning s heme are used. This error is aused by the in omplete s intillation light olle tion near the borders of the dete tor. It leads to a strong,depth of intera tion dependent image ompression whi h is the main reason that nearly all resear h groupsabandoned this parti ular design of PET dete tor modules. This parti ular error will be dis ussed in detailin se tion 5.8.3.3.2 Compton S attered Events and RandomsAnother very important error in emission tomography is the presen e of s attered γ-photons. Although itis likewise aused by the ina essibility of an important parameter, it is ompletely dierent in nature tothe just dis ussed un ertainty. For all imaging modalities of nu lear medi ine, it is ne essary not only todete t γ-photons with energies between 15 KeV and 511 KeV, but also to determine information about theirdire tion and line of ight. At these energies, γ-photons are very likely to undergo elementary pro esseslike Rayleigh s attering, Compton s attering or photoele tri absorption within the dete ting elements andalso inside the explored patient, animal or tissue. Sin e the γ-rays are emitted isotropi ally, a tually all30

3 Dete tor Components and LimitsPSfrag repla ements 12ROI ollimator dete tor(a) O urren e of orre tly (1) andmis-positioned (2) events in singlephoton imaging modalities.
PSfrag repla ementsdete tor dete torROI
123(b) O urren e of orre tly (1), mis-positionedevents due to Compton (2) and random oin i-den es in PET (3).Figure 3.5: S hemati diagrams for possible dete tion of Compton s at-tered events in single emission tomography (l.h.s.) and positron emissiontomography (r.h.s.).surrounding matter, in luding dete tor housing, ele troni s et ., an ause s attered radiation. Sin e thephotoele tri absorption destroys the γ-photons, they an no longer be dete ted and therefore only redu ethe e ien y but, ex ept for PET, do not lead to mis-positioned events. In positron emission tomography,two 511 keV photons have to be dete ted. If one annihilation photon is absorbed before arriving at thedete tor element, no oin iden e signal is possible and this event is lost as in the single photon ase.However, the ne essity of dete ting two γ-photons an lead to the random oin iden e dete tion of twodierent annihilation events when only one photon of ea h annihilation arrives at the dete tor. This leadsto randomly positioned events.Coherent (Rayleigh) s attering involves the intera tion with an atom. Hen e there is virtually no hangein energy. Moreover, the s attering angles are usually low; that is, the original dire tion of the photon isonly hanged marginally. Compton (in oherent) s attering is an inelasti pro ess that is due to intera tionwith the atomi and mole ular ele trons. In the energy range of relevan e for nu lear imaging, espe iallyPET, the probability of Compton s attering is high in all materials and tissue involved. Three types withdierent impa t on the nal image an be distinguished: Compton s atter within the explored body/tissue,Compton s atter within the dete tor but without dete tion by the same dete tor element (Ba k s atter)and inter- and inner-dete tor element Compton s atter. The last ee t is of spe ial relevan e for the presentwork and will be dis ussed in detail in hapter 6. Ba k s atter in ludes large hanges in the dire tion of thephoton. The hange in energy depends on the energy of the photon itself. While 180° s attered 15 KeVphotons leave the intera tion position with ≈ 95% of their initial energy, 511 KeV photons will loose 2/3 ofits energy under the same ir umstan es. Hen e, in PET, one an ee tively lter ba ks attered events bymeans of energy dis rimination. Also, the dete tion e ien y of ba ks attering is normally low (Zaidi andKoral [85) and an be further optimized by means of adequate dete tor design. The impa t of this s attertype on the nal image is therefore normally low ompared to Compton s attering within the region ofinterest (ROI).Figure 3.5(a) shows the dierent types of mis-positioned events for single photon emission modalities.Clearly, the presen e of ollimators in single photon emission modalities redu es signi antly the fra tionof dete ted γ-photons that were s attered inside the ROI, but leads to additional mis-positioned events dueto s attering within the ollimator. Typi al values for fra tions of mis-positioned events in this modalityare of the order of 5% when a 67Ga based radiopharma euti al (energy: 93 keV) is used and ≈ 30% whena 131I based radiopharma euti al (energy: 360 keV) is used (Zaidi and Koral [85).In annihilation oin iden e dete tion, an event is registered whenever two events are re orded within aspe ied temporal window. True oin iden es are those events that really arise from the pair of annihilationphotons without intermediate s atter. Erroneous LORs an arise from a pair of annihilation photons whenone of them or both undergo Compton s attering before being dete ted (event (2) in gure 3.5(b)). Also itis possible that two photons are dete ted (they may be s attered or not) from dierent annihilation events31

3.3 Degrading Fa tors
PSfrag repla ements
189F
188O
CBNCNO
0+
1+ 109.8m
QEC 1.6555
EC 3.1%
β+ 96.9%
PSfrag repla ementsFO
116C
115B
NCNO
3/2−
3/2− 20.38m
QEC 1.9821
EC 0.24%
β+ 99.76%
PSfrag repla ementsFOCB
137N
136C
NO
1/2−
1/2− 9.96m
QEC 2.2205
PSfrag repla ementsFOCBNC
157N
158O
1/2−
1/2− 122s
QEC 2.7539
EC 0.11%
β+ 99.89%
Figure 3.6: De ay s hemes together with bran hing ratios, half-lives andQ-values of four often used radionu lides for PET.(event (3) in gure 3.5(b)). It is rather likely that one of the two photons of an annihilation pair is absorbedinside the ROI or fails to be dete ted by the system. The fra tion of mis-positioned events is mu h largerin oin iden e dete tion modalities be ause the γ-radiation is in general not ollimated.2 Random eventsdo not exist in single photon emission tomography.An in rease in s attered and random events results in a de reasing signal to noise ratio (SNR) of there onstru ted image. Even though the total of true events an be in reased by designing dete tors withhigher e ien y, this would lead also to higher dete ting e ien y for s attered events and randoms.In general, the dierent fra tions and the nal SNR depend in a omplex manner on the geometry ofthe s anner, the dete tor element design and also the explored obje t (Humm et al. [86). For instan e,Compton s attered events are of lower importan e in small animal PET. In order to provide a physi almeasure for hara terizing the inuen e of s attered events and randoms, the noise equivalent ount rate(NEC) was introdu ed:
fNEC := f2TruefTrue + fRandom + 2fSingle , (3.1)where fTrue, fRandom and fSingle are the ount rates for true events, random events and single dete tedphotons. Noise equivalent ount exhibits a maximum when plotted against the administered a tivity. Thisis the a tivity at whi h an optimum SNR is expe ted.3.3.3 Errors Contributed by the Radiopharma euti alBeside the limitations mentioned so far, Positron Emission Tomography has to deal with a further positionun ertainty arising from the nature of the β+ de ay whi h was already shown in gure 1.6. In parti ular,this measurement error is aused by the range of the positron within the explored tissue (Phelps et al. [87,Palmer and Brownell [88, Levin and Homan [89) and the non- ollinearity of the annihilation photons(Beringer and Montgomery [90, de Benedetti et al. [91).Radionu lides that are used for PET have to be β+-emitters. They are nu lides with a proton ex essand an de ay by two pro esses:
p −→ n + e+ + νe (3.2)p + e− −→ n + νe. (3.3)The rst rea tion (3.2) des ribes the ordinary β+-de ay. For this mode, de ays dire tly to the ground statesare possible. The se ond rea tion (3.3) is the ompeting ele tron apture pro ess.2In many ommer ial PET s anners, passive ollimation parallel to the plane of the drawing 3.5(b) is performed by septa.This is referred to as 2D-mode PET. If the septa are removed, it is alled 3D-mode PET. Even with septa, all events ingure 3.5(b) an o ur and there is a tually no ollimation for two spatial dire tions.32

3 Dete tor Components and Limits-3 -2 -1 0 1 2 3
0
0.2
0.4
0.6
0.8
1
PSfrag repla ementsβ+-range [mm(a) 18F, FWHM ≈ 0.1mm, FWTM ≈ 1mm
-3 -2 -1 0 1 2 30
0.2
0.4
0.6
0.8
PSfrag repla ementsβ+-range [mm(b) 11C, FWHM ≈ 0.19 mm, FWTM ≈ 1.9mm
-3 -2 -1 0 1 2 30
0.2
0.4
0.6
0.8
1
PSfrag repla ementsβ+-range [mm( ) 13N, FWHM ≈ 0.28mm, FWTM ≈ 2.5mm
-3 -2 -1 0 1 2 3
0.2
0.4
0.6
0.8
1
PSfrag repla ementsβ+-range [mm(d) 15O, FWHM ≈ 0.5mm, FWTM ≈ 4.1mmFigure 3.7: Radial point spread fun tion for the positron range of the fourradionu lides for PET. Below ea h gure, FWHM and FWTM for ea hisotope are indi ated (Values and fun tional behavior taken from Levin andHoman [89).In most ases, radiopharma euti als for PET are based on uorine 18F, oxygen 15O, arbon 11C, andnitrogen 13N. The transitions of these radionu lides are allowed Gamow-Teller (18F) and allowed Fermi-transitions (15O, 11C, and 13N). Therefore, they exhibit the required short half-lives in the order of minutesas it was dis ussed in se tion 1.6. De ay s hemes for these radionu lides are displayed in gure 3.6. Sin e for
β+-de ay the positron is always a ompanied by a hardly dete table neutrino νe that shares the momentumand energy, the energy spe trum of the positron is ontinuous.After the de ay pro ess, the positron loses energy sin e it intera ts with the tissue until it nallyannihilates with an ele tron and gives rise to the emission of two 511 keV γ-rays propagating in nearlyexa tly opposite dire tions. The permanent ollisions with the mole ules slow the positron down and theannihilation in general does not o ur until the e+ is in thermal equilibrium with the environment. Forthis reason, the range of the positron strongly depends on its initial energy. This pro ess an be des ribeddiusively (Palmer and Brownell[88) or alternatively by the Bethe-Blo h formula (Leo [66). Figure 3.7shows the results for the distributions of the positron range in water and orresponding FWHM and FWTMvalues that were obtained by Levin and Homan [89 from Monte Carlo simulations.Besides the loss of spatial resolution in positron imaging devi es aused by the positron's range, thereis a se ond equally fundamental ee t, whi h in ertain oin iden e dete tor ongurations an result in amore serious loss of resolution. After the thermalisation pro ess of the positron, the kineti energy of theannihilating pair is typi ally of a few eV whi h is mainly as ribed to the orbital momentum of the ele tron.In their enter-of-mass frame, the photon energies are 0.511 MeV and their dire tions are exa tly opposite.However, having a non-vanishing residual momentum, the two ba k-to-ba k γ-ray photons formed uponannihilation are not seen at exa tly 180 with respe t to ea h other in the rest frame of the parti le dete tors(de Benedetti et al. [91). The angular spread leads to an approximately Gaussian-like distribution withthe full width of ∼ 0.6 at half maximum (Beringer and Montgomery [90). For a system with a large33

3.4 Dete tor Improvementsdete tor-dete tor separation, this ee t an result in a signi ant positioning error when re onstru ting thelo ation of the radiopharma euti al. Both positron range and photon non- ollinearity annot be measuredwith present γ-ray imaging dete tors and represent fundamental limitations to the spatial resolution ofpositron emission tomography.3.4 Dete tor ImprovementsBlo k dete tors as dis ussed in se tion 1.5 made from BGO and LSO are still the most ommonly usedPET dete tor designs for ommer ial PETs. Typi al performan e parameters are 80% dete tion e ien y,20% energy resolution, 2 ns timing resolution and 5 mm spatial resolution (Moses, [92). In the ase ofs intillation dete tor modules, the s intillation rystal poses the most important limit to the performan eparameter. One important issue is to in rease the very low total dete tion e ien y of usually < 1% for ommer ial PET s anner. This an be a hieved by in reasing the intrinsi e ien y of the modules or byin reasing the total volume of the s intillation rystal. While the latter possibility is mainly a questionsof osts, the rst possibility together with high spatial resolution onstitutes a pair of antagonisti designgoals. This is be ause a higher intrinsi dete tion e ien y an only be a hieved by thi ker rystals or rystals of higher stopping power than BGO. For the moment, there is no alternative s intillator with higherstopping power than BGO and only the rst possibility is left, but this would in rease radial elongation asexplained in se tion 3.3.1.The timing resolution of s intillation dete tors is mainly determined by the de ay time of the s intillator.The shorter this parameter is, the higher will be the on entration of the dete ted light at the very rstmoments of the s intillation pulse leading nally to smaller statisti al errors and a better temporal denitionof the rising edge of the pulse. If the timing resolution of the γ-ray dete tor is su iently high, the possiblepositions of the positron's annihilation point an be onned to a fra tion of the FOV. This ee tivelyin reases the SNR of the a quired image. LSO is a very attra tive alternative to BGO be ause it has asigni antly faster de ay time but nearly the same stopping power. Moreover, it has 3-4 times as mu hlight yield ompared to BGO and therefore allows for higher energy resolution and better denition of thedete ted position.Developing PET dete tor modules with high timing resolution and the ability to measure depth ofintera tion information are two a tive elds of resear h. Notably, te hniques of DOI measurement havemushroomed in re ent years.3.4.1 Depth of Intera tion Dete tionDete tors that do not provide information about the DOI of the re orded γ-ray introdu e parallax errorswhi h lead to un ertainties in the parameterization of the line of response (LOR) and, as a onsequen e,to a nonuniform and non-isotropi spatial resolution (Homan et al. [93, Kao et al. [94). One possiblestrategy to partially over ome the ee t of parallax errors is to restri t the transaxial eld of view (FOV)of PET-systems to a small fra tion at the enter of the PET-system's sensitive volume. Unfortunatelythis auses other unwanted ee ts su h as loss of e ien y and an in reasing relevan e of photon non- ollinearity, besides the fa t that it makes ompa t PET s anners impossible. For existing γ-ray imagingsystems, the image quality an be improved potentially if a su iently good estimate of DOI is providedby the dete tor. Espe ially for PET-dete tors based on pixelated s intillators, a number of te hniques fordesigning DOI apable dete tors for γ-rays in the elds of nu lear medi al imaging have been proposed.One of them onsists in measuring the ratio of s intillation light dete ted at opposite rystal surfa esusing two photodete tors and is shown in gure 3.8(a) (Moses and Derenzo [95). The DOI information isderived from the dieren e in the signal amplitudes of the upper and lower dete tor. To avoid additionalexpensive photodete tors and their asso iated ele troni s, other te hniques an be used. Phoswi h dete toruse pulse shape dis rimination for DOI dete tion. Various layers of rystal pixels with dierent s intillation hara teristi s are sta ked on a single position sensitive photodete tor (refer to gure 3.8(b)). The DOIinformation is derived from measuring the pulse widths for the oin iden e events (see for instan e Seidel etal. [96). Very similar to this approa h is the introdu tion of absorbing bands between the dierent rystalpixel layers as shown in gure 3.8( ). This was also proposed by dierent resear h groups (Bartzakosand Thompson [97 and Rogers et al. [98). A staggered double-layer array of rystal needles as displayedin gure 3.8(d) was proposed by Liu et al. [99. The relative displa ement of the pixel layers allows the34

3 Dete tor Components and Limits
(a) Light sharing te hnique forDOI determination. (b) Phoswi h te hnique for DOIdetermination. ( ) DOI determination by re-du tion of light yield in one de-te tor segment.(d) Staggered double layer of rystal pixels for DOI determi-nation. (e) Multiple pixel layer de-te tor for DOI dete tion bya omplex ree tion s heme. (f) Fully independent dual layer of pixe-lated dete tors.Figure 3.8: Most ommon approa hes of realizing DOI apable γ-ray dete -tors.identi ation of the a tive layer by the dete ted transverse position. Similar to this method is the oneproposed by Tsuda et al. [100 and shown in gure 3.8(e). By introdu tion of verti al ree ting sheetsbetween spe i pixels and at dierent interfa es in ea h layer, the measured transverse positions aredispla ed by a well dened amount and allow for identi ation of the a tive layer. Completely independent rystal pixels have been proposed for the MADPET-II dedi ated small animal PET s anner by Rafe as etal. [101. This is shown in gure 3.8(f). Also ombinations of dierent te hniques are possible. However,all these approa hes imply ostly dete tor modi ations to a greater lesser extent. They need additionalphotodete tors, smaller rystals or rystals of a dierent type.Proposals for intera tion depth measurements in ontinuous s intillation rystals for nu lear imagingwere reported by Karp and Daube-Witherspoon [102, Matthews et al. [103 and Anti h et al. [104. Ex eptfor Karp and Daube-Witherspoon, who used a temperature gradient applied to NaI:Tl in order to for e avariation of the signal shape with the intera tion depth that ould be used for dis rimination, the othergroups sampled the s intillation light distribution and omputed the standard deviation from the data setbe ause of its orrelation to the intera tion depth.3.4.2 Time-of-Fight PETCommer ial PET s anners have an inner ring diameter of 80 cm. This distan e is overed by a γ-raytraveling at the speed of light in T ≈ 2.7 ns. If the dete tor elements were able to estimate the time ofarrival with this resolution, the supposed annihilation position an be restri ted to a region of diameter
t and smaller than the disk dened by the PET s anner (refer to gure 3.9). The higher the timingresolution of the oin iden e system is, the smaller will be the region from whi h the annihilation photons an originate. If this information is implemented in the re onstru tion algorithm, the quality of the image an be improved signi antly (Moses [105). One of the parameters that is improved is the SNR. But alsothe noise equivalent ount rate is in reased, be ause many random events an be now reje ted. For a timing35

Referen es
Figure 3.9: Image re onstru tion with TOF apable PET amera. If thetime of ight for the LOR T an be measured with su ient a ura y, thepossible annihilation position an be restri ted to region of diameter t andsmaller than the FOV (light-gray ir ular region).resolution of 500 ps, the random rate is redu ed by a fa tor 1.5-2, fNEC is in reased by a fa tor 1.4-1.6 andthe noise varian e is lowered by a fa tor of 5.Referen es[66 W. R. Leo, Te hniques for Nu lear and Parti le Physi s Experiments, 2nd ed. Springer Verlag, 1994.[67 A. Jeavons, D. Townsend, N. Ford, K. Kull, A. Manuel, F. O. and M. Peter, A High-ResolutionProportional Chamber Positron Camera and its Appli ations, IEEE Trans. Nu l. S i., vol. 25, no. 1,pp. 164173, Feb. 1978.[68 J. L. La y, C. S. Martin, and L. P. Armendarez, High sensitivity, low ost PET using lead-walledstraw dete tors, Nu l. Instr. and Meth. A, vol. 471, pp. 8893, 2001.[69 G. Lutz, Sili on radiation dete tors, Nu l. Instr. and Meth. A, vol. 367, pp. 2133, 1995.[70 C. S heiber and G. C. Giakos, Medi al appli ations of CdTe and CdZnTe dete tors, Nu l. Instr.and Meth. A, vol. 458, pp. 1225, 2001.[71 R. Novotny, Inorgani s intillators a basi material for instrumentation in physi s, Nu l. Instr.and Meth. A, vol. 537, pp. 15, 2005.[72 W. Moses, William, S intillator requirements for medi al imaging, Lawren e Berkeley NationalLaboratory, http://repositories. dlib.org/lbnl/LBNL-45805, Sept. 1999, Paper LBNL-45805.[73 C. W. van Eijk, Inorgani s intillators in medi al imaging, Phys. Med. Biol., vol. 47, pp. R85R106,2002.[74 C. Mel her and J. S hweitzer, A promising new s intillator: erium-doped lutetium oxyorthosili ate,Nu l. Instr. and Meth. A, vol. 314, pp. 212214, 1992.[75 J. G. Rogers and C. J. Batty, Afterglow in LSO and its possible ee t on energy resolution, IEEETrans. Nu l. S i., vol. 47, no. 2, pp. 438445, Apr. 2000.[76 J. Huber, W. Moses, W. Jones, and C. Watson, Ee t of 176Lu ba kground on singles transmissionfor LSO-based PET ameras, Phys. Med. Biol., vol. 47, pp. 17, 2002.[77 D. Renker, Photosensors, Nu l. Instr. and Meth. A, vol. 527, pp. 1520, 2004.36

Referen es[78 H. Kume, Photomultiplier tube, prin iple to appli ation, Hamamatsu Photoni s K.K., 1994.[79 S. Fly kt and C. Marmonier, Photomultiplier tubes, prin iple and appli ation, Photonis, 2002.[80 K. S. Shah, R. Farrell, R. Grazioso, R. Myers, and L. Cirignano, Large-Area APDs and Monolithi APD Arrays, IEEE Trans. Nu l. S i., vol. 48, no. 6, pp. 23522356, De . 2001.[81 K. S. Shah, R. Farrell, R. Grazioso, E. S. Harmon, and E. Karplus, Position-Sensitive Avalan hePhotodiodes for Gamma-Ray Imaging, IEEE Trans. Nu l. S i., vol. 49, no. 4, pp. 16871692, Aug.2002.[82 M. Petro and M. Stapelbroek, Photon-Counting Solid-State Photomultiplier, IEEE Trans. Nu l.S i., vol. 36, no. 1, pp. 158162, Feb. 1989.[83 V. Saveliev, The re ent development and study of sili on photomultiplier, Nu l. Instr. and Meth.A, vol. 535, pp. 528532, 2004.[84 S. R. Cherry, J. A. Sorenson, and M. E. Phelps, Physi s in Nu lear Medi ine, 3rd ed. Saunders,Imprint of Elsevier, 2003.[85 H. Zaidi and K. F. Koral, S atter modelling and ompensation in emission tomography, Eur. J.Nu l. Med. Mol. Imaging, vol. 31, no. 5, pp. 761782, May 2004.[86 J. L. Humm, A. Rosenfeld, and A. del Guerra, From PET dete tors to PET s anners, Eur. J. Nu l.Med. Mol. Imaging, vol. 30, no. 11, pp. 15741597, Nov. 2003.[87 M. E. Phelps, E. J. Homan, S.-C. Huang, and M. M. Ter-Pogossian, Ee t of Positron Range onSpatial Resolution, J. Nu l. Med., vol. 16, no. 7, pp. 649652, Nov. 1975.[88 M. R. Palmer and G. L. Brownell, Annihilation density distribution al ulations for medi ally im-portant positron emitters, IEEE Trans. Med. Imag., vol. 11, pp. 373378, Sept. 1992.[89 C. S. Levin and E. J. Homan, Cal ulations of positron range and its ee t on the fundamental limitof positron emission tomography system spatial resolution, Phys. Med. Biol., vol. 44, pp. 781799,1999.[90 R. Beringer and C. Montgomery, The angular distribution of positron annihilation radiation, Phys.Rev., vol. 61, pp. 222224, Mar. 1942.[91 S. De Benedetti, C. Cowan, W. Konneker, and H. Primako, On the angular distribution of two-photon annihilation radiation, Phys. Rev., vol. 77, no. 2, pp. 205212, Jan. 1950.[92 W. M. Moses, Trends in PET imaging, Nu l. Instr. and Meth. A, vol. 471, pp. 209214, 2001.[93 E. J. Homan, T. M. Guerrero, G. Germano, W. M. Digby, and M. Dahlbom, PET system alibra-tions and orre tions for quantitative and spatially a urate images, IEEE Trans. Nu l. S i., vol. 36,no. 1, pp. 11081112, Feb. 1989.[94 C.-M. Kao, X. Pan, and C.-T. Chen, A urate image re onstru tion using doi information and itsimpli ations for the development of ompa t PET systems, IEEE Trans. Nu l. S i., vol. 47, no. 4,pp. 15511560, Aug. 2000.[95 W. M. Moses and S. Derenzo, Design studies for a PET dete tor module using a PIN photodiode tomeasure depth of intera tion, IEEE Trans. Nu l. S i., vol. 41, no. 4, pp. 14411445, Aug. 1994.[96 J. Seidel, J. Vaquero, S. Siegel, W. Gandler, and M. Green, Depth Identi ation A ura y of a ThreeLayer Phoswi h PET Dete tor Module, IEEE Trans. Nu l. S i., vol. 46, no. 3, pp. 485489, June1999.[97 P. Bartzakos and C. Thompson, A Depth-En oded PET Dete tor, IEEE Trans. Nu l. S i., vol. 38,no. 2, pp. 732738, Apr. 1991.[98 J. Rogers, C. Moisan, E. Hoskinson, M. Andrea o, C. Williams, and R. Nutt, A pra ti al blo kdete tor for a depth-en oding PET amera, IEEE Trans. Nu l. S i., vol. 43, no. 6, pp. 32403248,De . 1996. 37

Referen es[99 H. Liu, T. Omura, M. Watanabe, and T. Yamashita, Development of a depth of intera tion dete torfor γ-rays, Nu l. Instr. and Meth. A, vol. 459, pp. 182190, 2001.[100 T. Tsuda, H. Murayama, K. Kitamura, N. Inadama, T. Yamaya, E. Yoshida, F. Nishikido,M. Hamamoto, H. Kawai, and Y. Ono, Performan e Evaluation of a Subset of a Four-Layer LSODete tor for a Small Animal DOI PET S anner: jPET-RD, IEEE Trans. Nu l. S i., vol. 53, no. 1,pp. 3539, Feb. 2006.[101 M. Rafe as, G. Böning, B. Pi hler, E. Lorenz, M. S hwaiger, and S. Ziegler, A Monte Carlo Studyof High-Resolution PET With Granulated Dual-Layer Dete tors, IEEE Trans. Nu l. S i., vol. 48,no. 4, pp. 14901494, Aug. 2001.[102 J. Karp and M. Daube-Witherspoon, Depth-of-intera tion determination in Na(Tl) and BGO s in-tillation rystals using a temperature gradient. Nu l. Instr. and Meth. A, vol. 260, pp. 509517,1987.[103 K. L. Matthews II, S. M. Leonard, C. E. Ordonez, D. E. Persyk, and W. Chang, A depth-en odinganger dete tor using s intillation bers, IEEE Trans. Nu l. S i., vol. 48, no. 4, pp. 13971402, Aug.2001.[104 P. Anti h, N. Malakhov, R. Parkey, N. Slavin, and E. Tsyganov, 3D position readout from thi ks intillators, Nu l. Instr. and Meth. A, vol. 480, pp. 782787, 2002.[105 W. Moses, Time of Flight in PET Revisited, IEEE Trans. Nu l. S i., vol. 50, no. 5, pp. 13251330,O t. 2003.
38

4 Parameterization of the Signal Distribution4 Parameterization of the SignalDistributionWre tre is mu light, t sw is ep.Jonn Wolfgang von Gt, ⋆ 1749 † 1832IN hapter 2 it has been pointed out that the use of ontinuous s intillation rystals arries several generaladvantages and that good results an be obtained with γ-ray imaging dete tors based on this design.When Positron Emission Tomography emerged as a novel imaging te hnology, it was straightforward totake the design from existing Anger-type ameras and use it for positron ameras, be ause they are justγ- ameras optimized for the dete tion of the annihilation radiation. The key problem arises from thehigh energy of this radiation. While γ-photons from the 99mTc isotope have an energy of approximately140 keV, the energy of annihilation photons is more than three times as large. The dete tion of thesephotons presupposes the photo onversion within the s intillation rystal but the intera tion probabilityde reases with in reasing γ-ray energy. Therefore, the rystals have to be thi ker in order to stop the samenumber of photons. Sin e it is not normally known at whi h depth the γ-ray intera ts, an un ertainty isintrodu ed. This may ause serious positioning errors for γ-rays with non-normal angles of in iden e and,depending on whi h positioning method is used, depth-dependent variations in the position measurement.Apart from Anger [106, there have been attempts by several resear h groups (Karp et al. [107, Rogers et al.[108, Siegel et al. [109 and Seidel et al. [110) to develop γ-ray dete tors for positron emission tomographyusing ontinuous s intillation rystals instead of arrays of small rystal segments. Ex ept for a few, allgroups abandoned this design due to the strong border artefa ts in large-sized ontinuous s intillation rystals aused by the enter of gravity (CoG) algorithm (see se tion 5.8). Clearly, the ru ial point is howthe position measurement is implemented. The mentioned resolution degradation at the rystal edges isinherent in the CoG algorithm, but not ne essarily in other positioning methods. There are statisti al basedposition re onstru tion s hemes (Liu et al. [111, Joung et al. [112) that do not suer from this systemati error. However, a sampling of the signal distribution, i.e. the digitization of all hannels, is required andthe border-ee ts are avoided at the expense of higher omputation time and dete tor osts. An alternativea ess to the real three-dimensional position where the photo onversion took pla e seems to be possibleby using the width of the signal distribution, sin e this parameter is orrelated with the intera tion depth(Siegel et al. [109, Matthews et al. [113, Taka s et al. [114, Anti h et al. [115 and Ler he et al. [116).In this hapter, a parameterization for the density distributions of light seen by the photo athode and harge seen by the anode-segments of the position sensitive photodete tor is derived. Although there aremany simulation tools based on the Monte Carlo method, the analyti model was preferred, be ause itleads to a better understanding of the resulting distribution.4.1 In luded Contributions and ConventionsThe signal distribution that is nally a essible for the re onstru tion software emerges as an interplay ofa broad variety of physi al phenomena. The generation starts with the photo onversion of the in identγ-ray via a sequen e of elementary intera tions, e.g. Rayleigh s attering, Compton s attering and thephotoele tri ee t. However, only the position of the very rst γ-ray intera tion orresponds to the trueline of response (LOR). The photoele tri ee t and Compton s atter events produ e so- alled kno k-onele trons that ex ite the atoms of the rystal material along its path until being ompletely stopped. Also,ionization with se ondary ele trons of high energy (δ-ele trons) is possible. The s intillation light arises fromthe de-ex itation of the s intillation enters along the dierent ele tron paths. Sin e ommon s intillators39

4.1 In luded Contributions and ConventionsPSfrag repla ements depth of intera tion s intillatorentran e windowphotosensitive layerposition of photo onversionintera tion distan eFigure 4.1: Naming onvention for the intera tion depth and intera tiondistan e.for PET are normally made of a high density material, these paths are rather short. One an estimate therange of these ele trons using an empiri al formula from Tabata, Ito and Okabe (Tsoulfanidis [117) basedon experiments that measured the range of positrons by extrapolating the linear part of the transmissionfun tion and dening the interse tion with the ba kground to be the extrapolated range Rex. The largestpossible distan e of ≈ 150µm is overed by an ele tron that emerges from a unique photoele tri intera tionof an in ident 511keV γ-ray and that produ es no δ-ele trons. However, the majority of produ ed ele tronswill travel mu h shorter distan es before being stopped and we assume these elementary intera tions to bepoint-like.In this hapter, only signal distributions arising from single photoele tri intera tions will be onsidered.This seems to be a very rough approximation, sin e for 511keV γ-rays one expe ts various Comptons attering intera tions as part of the photo onversion even for dedi ated PET s intillators su h as LSO.The inuen e of inner- rystal Compton s attering on spatial resolution that an be a hieved with the CoGalgorithm will be dis ussed in detail in se tion 6. In se tion 7 it will be shown that even with this rigorousapproximation, very good agreement with the real dete tor response is a hieved. Signal distributionsthat arise from various intera tions are superpositions of the independent single-event distributions. If theenergies deposited at these points are dierent (as in the vast majority of the ases), the distribution arisingfrom the point with maximum energy deposition will dominate.Four issues have to be laried before beginning with the derivation of the theoreti al model. The rstis the signi an e of ontinuous s intillation rystals. Crystals of almost every possible spatial dimension an be alled ontinuous as long as one does not rea h the mole ular s ale. A tually, the denition dependsstrongly on the s ale, sin e a rystal of dimensions 2 × 2 × 2 mm3 an be onsidered ontinuous, if the regionof interest is onned to this same volume. The volume of interest for the present work is however dened bythe produ t of the required s intillator thi kness and the sensitive area of the photodete tor. Throughoutthis work I will refer to a ontinuous rystal whenever this volume of interest is overed by one single rystal. Similarly, the expression pixelated rystal or rystal array is used, if the same volume is overedby several independent rystals. The se ond issue is the treatment of the rystal surfa es. Generally, onlyone of the six s intillator fa es is oupled to a photodete tor. For all other fa es there exist many possibletreatments that allow an optimization of the dete tor performan e. However, the aim of the present work isnot the dete tor optimization, and therefore, all free surfa es are assumed to be ne ground and overed byhighly absorptive oatings in order to avoid ree tions while the one that is oupled to the photodete toris assumed to be polished.The third issue on erns the hoi e of the point of origin. Throughout the following se tions and haptersthe referen e system is hosen in su h a way that the sensitive area of the photodete tor is parallel to the x-
y-plane and entered at the point of origin x0 = y0 = z0 = 0. The x- and y-spatial dire tions are understoodto be the transverse and horizontal spatial dire tions respe tively and the z-dire tion the normal or verti aldire tion. The s intillator is pla ed within the half-spa e with z > 0 and the dete tion material of thephotodete tor within the half-spa e with z < 0. The last issue is a pure naming onvention. The expressiondepth of intera tion (DOI) refers to the distan e between the position of the γ-ray's photo onversion andthe rystal surfa e fa ing to the photodete tor (refer to gure 4.1). For the derivation below, the distan ebetween the photo onversion point and the rystal surfa e oupled to the photodete tor is more intuitive.Throughout this work, this parameter will be primarily used and it will be alled the intera tion distan e(ID).40

4 Parameterization of the Signal DistributionPSfrag repla ementsϑ
zc−z0
z0
Jc
dS
dS′ r
rc
Figure 4.2: Diagram of the planar surfa e element dS′ on the dete torssensitive area is irradiated by the sour e at rc and with the angle ϑ. Aphoton density redu ed by the fa tor cosϑ is observed, be ause the ux ofphotons through dS is dispersed over dS′.4.1.1 The Inverse Square LawThe starting point for the derivation of the signal distribution is the inverse square law. It says that theintensity of light radiating from a point sour e is inversely proportional to the square of the distan e fromthe sour e. This law is founded in stri tly geometri al onsiderations and therefore applies to all isotropi radiation phenomena. It an be easily derived using the divergen e theorem and givesJ(r, rc) =
Jc
4π|r− rc|2, (4.1)where J(r, rc) is the amount of s intillation light at the observation point r, Jc is the total amount ofreleased s intillation light and rc is the position of photo onversion. Equation (4.1) shows the geometri al hara ter of the inverse square law sin e the denominator is just the expression for the surfa e area ofa sphere with radius |r − rc|. Moreover, it states that the total number of light photons released at thes intillation enter is onserved and does not hange as the light propagates through the rystal.4.1.2 The Cosine LawIn the previous paragraph, the inverse square was derived for spheri al surfa es. Commer ially availablephotodete tors oer always, ex ept for a few spe ial ases, a planar design of the sensitive area. Onlyfor almost normal in iden e of the s intillation light, the dieren e between planar and spheri al surfa eelement will be not very important. However, sin e ontinuous and large-sized rystals in the sense ofse tion 4.1 are used in this study, a large fra tion of the s intillation light impinges on the photodete torat large angles.In the ase of s intillation dete tors, the position of the light sour e is onned to the volume of thes intillation rystal. For optimum performan e, it has to be oupled through light guides as lose as possibleto the photodete tor. Therefore, the normal distan e between the light sour e and the photodete tor neverex eeds the thi kness of the rystal. Furthermore, it is small ompared to the planar extension of thedete tor. The photon ux orresponding to the surfa e element dS is overed by the dete tors sensitivesurfa e element dS′ as shown in gure 4.2. By similarity of the triangles spanned by dS′ and dS and (r−rc)and (zc − z0) one dedu es that
dS = dS′ cosϑ = dS′ zc − z0
|r − rc|. (4.2)With this result, the inverse square law of equation (4.1) be omes
J(r, rc) =Jc
4π
(zc − z0)
|r − rc|3/2. (4.3)Equation (4.3) inherently has the orre t normalization. Integrating J(r, rc) over an innite plane normalto the z-unit ve tor ez and at zc 6= z0, one obtains Jc/2 whi h is exa tly the expe ted result sin e just thehalf of all released s intillation light will be olle ted. 41

4.1 In luded Contributions and Conventions4.1.3 Exponential AttenuationWhile the s intillation light travels within the opti al omponents of the dete tor, it is attenuated a ordingto the exponential lawI(r, rc) = I0e
−α(λ)|r−rc|, (4.4)where α(λ) is the inverse of the attenuation length at the wavelength λ, I0 is the initial intensity andI(r, rc) the attenuated intensity. An important requirement for s intillators is a high transparen y to itsown s intillation light in order to allow an ee tive light olle tion. Therefore, one an assume that α(λ)−1is large ompared to the spatial extensions of the s intillator. Otherwise, the hosen s intillation materialwould not be adequate for the appli ation. Furthermore, α(λ) an be approximated by the onstant averagevalue α, sin e the emission spe tra of many s intillators are onned to intervals of less than a few hundrednm with only small variations of α(λ) over this interval.4.1.4 Light Transmission to the Photodete tor WindowThe s intillation light that rea hes the borders of the rystal is either absorbed at one of the ve absorbing rystal sides or dete ted by the photodete tor oupled to the transparent side. The photodete tor itself ontains a transparent entran e window for prote tion from environmental inuen es. Although this windowis optimized with respe t to olle tion e ien y and transparen y, its refra tion index in general doesnot mat h the one of the s intillation rystal. Furthermore, sin e the refra tion index of the entran ewindow and the refra tion index of the s intillator are mu h larger than the refra tion index of air, air-gapsbetween both media have to be avoided. Optimal opti al oupling is a hieved with opti al gel or sili one ofintermediate refra tion index. Hen e, the s intillation light traverses an opti al multi-layer system onsistingof several homogeneous media in sequen e, e.g. the s intillation rystal, the opti al grease, the entran ewindow and the photo athode. There is also a fra tion of light that is transmitted to the the va uum ifphotomultiplier tubes are used for dete tion. The behavior of light at the interfa e between opti al mediaof dierent refra tion indexes is well des ribed by Snell's Law and the Fresnel equations. In order to redu ethe omplexity of the derived model-distribution, the intermediate layer of opti al fat is not in luded in the onsiderations. This approximation an be made, sin e the refra tion index is hosen to lie in between thevalues for the entran e window and the s intillation rystal, and be ause the thi kness of the additionallayer will be very small. Thus, it will ause only a very small deviation of the light path.Refra tion of the LightThe relationship between the angles of in iden e and refra tion for a wave impinging on an interfa e betweentwo media is given by Snell's law
sin ϑ2 = κ sinϑ1 with κ =n1
n2, (4.5)where the angles ϑ1 and ϑ2 are taken with respe t to the normal on the interfa e plane and n1 and n2 are therefra tion indi es of the s intillator and the entran e window respe tively. The refra tion index of inorgani s intillation rystals for γ-ray dete tion is omparatively high. n1 is normally larger than n2. This leads tototal ree tion whenever the angle ϑ1 of the in ident ray is larger than the riti al angle ϑc = arcsin
(κ−1
).As a onsequen e, only the fra tion Φ = (1− cosϑc)/2 of the s intillation light that is onned to the oneof aperture 2ϑc enters the photodete tor and ontributes dire tly to the signal distribution (Ambrosio etal. [118). The s intillation light outside this one is trapped within the rystal due to total ree tion andmost of it will be lost by absorption. The light inside the one is refra ted away from the normal on theinterfa e. This is shown in gure 4.3. For a photodete tor, the sensitive material, i.e. the photo athodeor the semi ondu tor will be lo ated at the plane z = zPC behind the window of thi kness t. Due to therefra tion, light that is emitted from a s intillation event at the impa t position r0 will not be dete ted atthe proje ted distan e rvirt but at r. The s intillation light seems to ome from a point at normal distan edvirt from the interfa e instead of oming from point rc. One therefore has to ompute dvirt as a fun tionof the true intera tion distan e d, the distan e r, the window thi kness t and κ. This is equivalent to nd42

4 Parameterization of the Signal DistributionPSfrag repla ements
n1
n2
a
b
th
ϑ1
ϑ1
ϑ2
ϑ2
ϑ2
d
dvirt
r
z = zPC
rc
rvirtFigure 4.3: Geometri refra tion of the s intillation light path (thi k, greenline). Due to Snell's Law, light dete ted at a distan e r seems to be releasedat the virtual point (xc, yc, zvirtc ) = rvirt
cthe roots of the following quarti equation:0
!= b2 − d2
virt − a2 + d2, with (4.6)a = κ−1b and b =
dvirt
dvirt + t
√
(dvirt + t)2
+ r2Equation (4.6) has eight mathemati al solutions but only one is of physi al interest for the present problem.It is given bydvirt =
1
2
(
q − t +
√
2t2 − w − u +2t(u − t2 + 2d2κ2)
q
) , where (4.7)q =
∣∣∣
√
w + t2 − u∣∣∣ ,
w =1
3
(
u + u2(v
2
)−1/3
+(v
2
)1/3) ,
u = t2 − κ2d2 + r2(1 − κ2
) ,v = 2
(
p +∣∣∣
√
p2 − u6∣∣∣
) andp = u3 + 54 t2d2κ2r2
(1 − κ2
) . (4.8)With the aid of dvirt we an dene the new, virtual photo onversion position rvirtc : = (xc, yc, z
virtc ) =
(xc, yc, zc − d + dvirt ). This is the position from whi h the s intillation light seems to ome from. Thedependen e of dvirt on the proje ted distan e r from the impa t position rc is shown in gure 4.4(a) ford ∈ 1, 2, . . . , 10mm. In gure 4.4(b), the dependen e of the angle of in iden e ϑ2 of the light pathon the dete ting surfa e is shown for the same d-values. At this point, important observations an bemade. First, although the ee t of total ree tion prohibits the transmission of s intillation light into thephotodete tors entran e window for ertain angles, the light distribution seen at the dete ting material willnever be trun ated. This is due to the fa t that the light within the one of aperture 2ϑc an pass to themedium of refra tion index n2 but will be refra ted away from the normal onto the opti al interfa e. Fora light ray of in ident angle ϑc, the refra ted light would be bent in su h a way that it propagates justwithin the plane of the interfa e. For all light rays with in ident angles ϑ < ϑc, the refra ted angle willbe in the interval [0, 90[. That is to say, the entering light whi h is onned to the one of half-angle ϑcwill be redistributed and auses a new ontinuous distribution illuminating ompletely the innite plane atz = zPC. 43
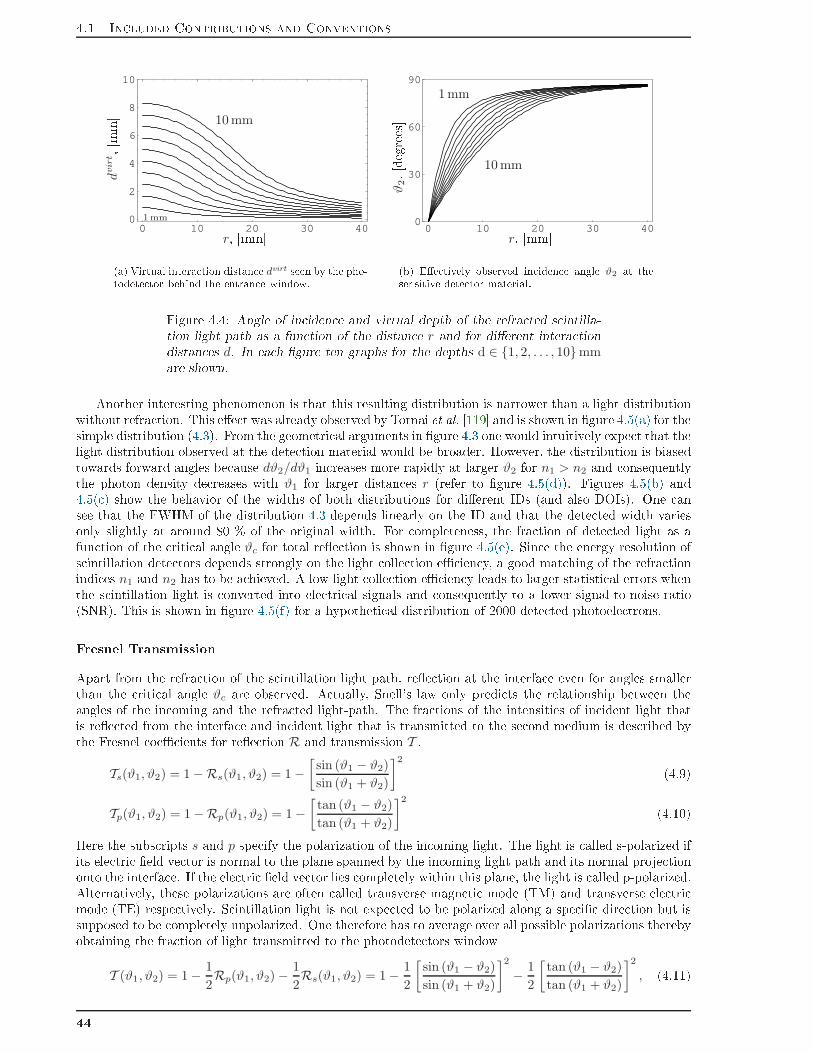
4.1 In luded Contributions and Conventions0 10 20 30 40
0
2
4
6
8
10
PSfrag repla ements1mm
10 mmdvir
t
,[mmr, [mm(a) Virtual intera tion distan e dvirt seen by the pho-todete tor behind the entran e window. 0 10 20 30 40
0
30
60
90
PSfrag repla ements 1 mm
10 mm
ϑ2
,[degreesr, [mm(b) Ee tively observed in iden e angle ϑ2 at thesensitive dete tor-material.Figure 4.4: Angle of in iden e and virtual depth of the refra ted s intilla-tion light path as a fun tion of the distan e r and for dierent intera tiondistan es d. In ea h gure ten graphs for the depths d ∈ 1, 2, . . . , 10mmare shown.Another interesting phenomenon is that this resulting distribution is narrower than a light distributionwithout refra tion. This ee t was already observed by Tornai et al. [119 and is shown in gure 4.5(a) for thesimple distribution (4.3). From the geometri al arguments in gure 4.3 one would intuitively expe t that thelight distribution observed at the dete tion material would be broader. However, the distribution is biasedtowards forward angles be ause dϑ2/dϑ1 in reases more rapidly at larger ϑ2 for n1 > n2 and onsequentlythe photon density de reases with ϑ1 for larger distan es r (refer to gure 4.5(d)). Figures 4.5(b) and4.5( ) show the behavior of the widths of both distributions for dierent IDs (and also DOIs). One ansee that the FWHM of the distribution 4.3 depends linearly on the ID and that the dete ted width variesonly slightly at around 80 % of the original width. For ompleteness, the fra tion of dete ted light as afun tion of the riti al angle ϑc for total ree tion is shown in gure 4.5(e). Sin e the energy resolution ofs intillation dete tors depends strongly on the light olle tion e ien y, a good mat hing of the refra tionindi es n1 and n2 has to be a hieved. A low light olle tion e ien y leads to larger statisti al errors whenthe s intillation light is onverted into ele tri al signals and onsequently to a lower signal-to-noise ratio(SNR). This is shown in gure 4.5(f) for a hypotheti al distribution of 2000 dete ted photoele trons.Fresnel TransmissionApart from the refra tion of the s intillation light path, ree tion at the interfa e even for angles smallerthan the riti al angle ϑc are observed. A tually, Snell's law only predi ts the relationship between theangles of the in oming and the refra ted light-path. The fra tions of the intensities of in ident light thatis ree ted from the interfa e and in ident light that is transmitted to the se ond medium is des ribed bythe Fresnel oe ients for ree tion R and transmission T .
Ts(ϑ1, ϑ2) = 1 −Rs(ϑ1, ϑ2) = 1 −[sin (ϑ1 − ϑ2)
sin (ϑ1 + ϑ2)
]2 (4.9)Tp(ϑ1, ϑ2) = 1 −Rp(ϑ1, ϑ2) = 1 −
[tan (ϑ1 − ϑ2)
tan (ϑ1 + ϑ2)
]2 (4.10)Here the subs ripts s and p spe ify the polarization of the in oming light. The light is alled s-polarized ifits ele tri eld ve tor is normal to the plane spanned by the in oming light path and its normal proje tiononto the interfa e. If the ele tri eld ve tor lies ompletely within this plane, the light is alled p-polarized.Alternatively, these polarizations are often alled transverse magneti mode (TM) and transverse ele tri mode (TE) respe tively. S intillation light is not expe ted to be polarized along a spe i dire tion but issupposed to be ompletely unpolarized. One therefore has to average over all possible polarizations therebyobtaining the fra tion of light transmitted to the photodete tors windowT (ϑ1, ϑ2) = 1 − 1
2Rp(ϑ1, ϑ2) −
1
2Rs(ϑ1, ϑ2) = 1 − 1
2
[sin (ϑ1 − ϑ2)
sin (ϑ1 + ϑ2)
]2
− 1
2
[tan (ϑ1 − ϑ2)
tan (ϑ1 + ϑ2)
]2
, (4.11)44

4 Parameterization of the Signal Distribution
-20 -10 0 10 200
2
4
6
8
10
PSfrag repla ements F
[a.u.r [mm(a) Real dete ted intensity distribution (solid line) for
κ = nLSO/nBS ompared to an inverse square distribu-tion without jump in the refra tive index (dashed line). 0 20 40 60 80 1000
25
50
75
100
125
150
PSfrag repla ements FW
HM
[mmd [mm(b) FWHM of both sample distributions as a fun tion ofthe intera tion distan e d.
0 20 40 60 80 10081.8
82
82.2
82.4
82.6
82.8
PSfrag repla ements ratio[%z0 [mm( ) Ratio of FWHMs of both sample distributions in %. 0 20 40 60 80
0
0.25
0.5
0.75
1
1.25
1.5
PSfrag repla ements dϑ
2/dϑ
1
(normalized)ϑ2 [degree(d) Normalized refra ted photon density as a fun tion ofthe refra ted angle and for κ ∈ 1, 1.0, 1.1, . . . , 1.4. Thesolid line orresponds to κ = 1 and the dot-dashed lineto κ = 1.4.
0 15 30 45 60 75 900
0.1
0.2
0.3
0.4
0.5
PSfrag repla ementsϑc [degree
Φ
(e) Light fra tion that is transmitted from the s intillatorthrough the entran e window to the photo athode as afun tion of the riti al angle ϑc. 0 15 30 45 60 75 900
5
10
15
20
25
30
PSfrag repla ementsϑc [degree
SNR(f) Variation of the signal-to-noise ratio with the riti alangle ϑc for a supposed distribution of 2000 dete tedphotoele trons and Poisson-like statisti al errors.Figure 4.5: Signal distributions for a dete tor with and without a jump in the refra tiveindex. Not only is the overall olle ted amount of s intillation light ae ted, but onealso observes an important hange in the widths of the signal distribution when twoopti al media of dierent refra tive indi es are used. 45

4.1 In luded Contributions and Conventionswhere the refra ted angle an be expressed as a fun tion of rvirtc
ϑ2 = tan−1
(√
(x − x0)2 + (y − y0)2
zvirt0 + t
) (4.12)and the in iden e angle ϑ1 an be obtained by virtue of Snell's law (4.5), on e the refra ted angle ϑ2 isknown.4.1.5 Angular Sensitivity of the Photo athodeThe physi al ee ts onsidered so far, e.g. inverse square law, osine law and opti al transmission intothe entran e window, are ommon to many dierent s intillation dete tor ongurations. Also, the pho-todete tor itself has a hara teristi inuen e on the dete ted signal distribution be ause it is not an idealdevi e. Therefore, the type of photodete tor used has to be spe ied at this point. For this work, aposition-sensitive photomultiplier tube has been hosen as photodete tor. A photomultiplier onverts lightinto an ele tri al signal by photoemission of ele trons from the photo athode. There are two main kinds ofphoto athodes: semi-transparent athodes that are evaporated onto the inner side of the input window andopaque athodes that are deposited on a metal ele trode inside the tube (Fly kt et al. [120, Kume, [121).Position-sensitive photomultipliers mostly use semi-transparent photo athodes be ause then the athode an be very large and the entran e window on whi h it is deposited an be at or urved. In this ase, thephotoele trons are emitted from the side opposite the in ident light.Most photo athodes are made of ompound semi ondu tors onsisting of alkali metals with a low workfun tion1. Often, the materials applied are silver-oxygen- esium (AgOCs), antimony- esium (SbCs), Bi-alkali ompounds (SbKCs, SbRbCs and SbNaCs) and the tri-alkali ompound SbNa2KCs, besides the lessfrequent applied solar-blind types (CsI and CsTe) and semi ondu tors of negative ele tron anity andextended near-infrared sensitivity (GaAs, InGaAs and InGaAsP) (Fly kt et al. [120, Kume, [121). Ea hof these photo athodes has its typi al spe tral response, whi h is, however, of less importan e for the presentderivation of the signal distribution. The quantum e ien y for photoemission not only depends on thewavelength of the in ident light but also on the angle of in iden e of the light. The dependen e on this angleis alled the angular sensitivity. It is mainly a onsequen e of ree tions and multiple internal ree tionsinside the photo athode (refer to gure 4.6) and is therefore well des ribed by a standard appli ation ofthe Fresnel equations for ree tan e and transmittan e of multi-layer systems (Jones [122, Chyba et al.[123 and Motta et al. [124).The photo athode an be treated as a ontinuous medium with omplex refra tive index n3.2 It isdeposited onto the photomultiplier's entran e window of refra tive index n2 and fa es the PMTs interiorva uum on the other side (n4 = 1). Cal ulating the ree tan e and transmittan e for a light beam in identfrom the entran e window on the photo athode one obtainsR(ϑ2) =
|z1|2e2ην + |z2|2e−2ην + 2|z1||z2| cos(arg z2 − arg z1 + 2uη)
e2ην + |z1|2|z2|2e−2ην + 2|z1||z2| cos(arg z2 + arg z1 + 2uη)(4.13)
T (ϑ2) =
√
(1 − n22 sin2 ϑ2)16n2
2 cos2(ϑ2)(u2 + v2)G
n2 cosϑ2 [e2ην + |z1|2|z2|2e−2ην + 2|z1||z2| cos(arg z2 + arg z1 + 2uη)](4.14)where
z1 =n2 cosϑ2 − u − iv
n2 cosϑ2 + u + iv, z2 =
u + iv −√
1 − n22 sin2 ϑ2
√
1 − n22 sin2 ϑ2 + u + iv
(4.15)G =
1
|n2 cosϑ2 + u + iv|2|√
1 − n22 sin2 ϑ2 + u + iv|2
(4.16)1The (photoele tri ) work fun tion is the minimum energy required to liberate an ele tron from the surfa e of the parti ularmetal ompound.2Complex refra tion indi es are used to des ribe absorptive media.46

4 Parameterization of the Signal DistributionPSfrag repla ementsϑ2
ϑ3 entran e windowphoto athodeva uummultipleinternalree tionsn2
n3
n4
in oming light
transmitted lightree ted light
Figure 4.6: Light transmission and ree tion at the photo athode. Whenthe s intillation light moves from the entran e window into the photo ath-ode, only a fra tion of this light transfers its energy to the ele trons of thematerial. The remaining light is either ree ted or transmitted without on-tributing to the photoemission pro ess. The fa t that n2 < n3 > n4 makesmultiple internal total ree tions very probable and leads to a signi antlyin reased absorption for high in iden e angles ( f. gures 4.7(a) and 4.7(b)).for s-polarized light (TM waves) andz1 =
n23 cosϑ2 − n2(u + iv)
n23 cosϑ2 + n2(u + iv)
, z2 =u + iv − n2
3
√
1 − n22 sin2 ϑ2
n23
√
1 − n22 sin2 ϑ2 + u + iv
(4.17)G =
|n3|4
|n23 cosϑ2 + n2(u + iv)|2|n2
3
√
1 − n22 sin2 ϑ2 + u + iv|2
(4.18)for p-polarized light (TE waves). In addition, η = 2πtPC/λS andu + iv = n3 cosϑ2 (4.19)n2 sin ϑ2 = n3 sin ϑ3 (4.20)was used, where tPC is the thi kness of the photo athode and λS the va uum wavelength of the in idents intillation light. Equations (4.13) and (4.14) have been derived and veried by various resear h groups(Jones [122, Chyba et al. [123 and Motta et al. [124) and agreement with experimental data was found.Neither the ree tan e (4.13) nor the transmittan e (4.14) are formulae of dire t interest for the on-sidered model for the signal distribution. Ex ept for spurious ree tions at the PMT's dynode system andhousing, and photoemissions at the rst dynodes, the transmitted light does not ontribute to the signaldistribution. The ree ted ux will also be negle ted sin e we suppose our dete tor to have absorbingborders and therefore the major part will not be dete table. The s intillation light that will neither beree ted nor transmitted must have been absorbed by the photo athode and one hasA(ϑ2) = 1 − T (ϑ2) −R(ϑ2). (4.21)Sin e the light is supposed to be ompletely unpolarized, one has to average equation (4.21) over all possiblepolarizations. Figure 4.7 shows a typi al photomultiplier absorban e (4.21) and the dierent ontributionsfor TE and TM waves. 47

4.1 In luded Contributions and Conventions
0 20 40 60 80
0.2
0.4
0.6
0.8
1
PSfrag repla ementsϑ2 [degreeR
(ϑ2)
&T(ϑ 2)(a) Ree tan e and transmittan e for the dierent po-larizations: solid line: TM-ree tan e; dashed line: TE-ree tan e; dotted line: TM-transmittan e and dash-dotted line: TE-transmittan e.
0 20 40 60 80
0.2
0.4
0.6
0.8
1
PSfrag repla ementsϑ2 [degree
A(ϑ
2)
(b) Absorban e for unpolarized light (solid line), for TM-waves (dash-dotted line) and TE-waves (dashed line).Figure 4.7: Ree tan e, transmittan e and absorban e of the photo athodefor both polarizations assuming the following parameter values: n2 = 1.4,n3 = 2.7 + 1.5i, λS = 420 nm and tPC = 20 nm. The strong variation of all oe ients at ϑ2 ≈ 46 are due to total ree tion at the photo athode-va uum interfa e.4.1.6 Ba kground LightBesides the s intillation light that rea hes the photo athode dire tly, there are also photons that are s at-tered or ree ted. The ontribution of the s attered photons is expe ted to be very small for reasonsexplained in se tion 4.1. However, the overall ontribution of light ree ted at the absorbing borders anbe ome very important for dierent reasons. First, it is impossible to a hieve ideal absorbing surfa es.Residual ree tion is expe ted from all absorbing surfa es of the s intillation rystal. The total area ofthese surfa es is always larger than the area that is oupled to the photodete tor. Se ondly, if total ree tiono urs at the entran e window, the ratio of ree ted light to dire t light even be omes more biased towardshigher fra tions of ree ted light. Apart from this, we have Fresnel ree tions at all opti al interfa es.A onsequent in lusion of all possible ontributions produ ed by ree tion phenomena is learly im-pra ti al. Instead, one has to look for a simple, omputable model that satisfa torily des ribes the mostimportant fun tional dependen es of the distribution aused by ree tions. A tually, an exa t model is noteven required be ause the distribution of ree ted s intillation light is already a rst order orre tion tothe model. The following approximations are made: Two or more su essive ree tions are negle ted sin e they will be very improbable for bla k surfa es. The bla k surfa es are supposed to exhibit ideal Lambertian ree tan e. This assumption an bemade sin e the rystal is only polished at the side that is oupled to the photodete tor. All othersurfa es are ne-ground and overed with a bla k epoxy resin omposite of a very low ree tion oe ient. Light rays that undergo rst a total ree tion on the interfa e between the s intillator and theentran e window, and are subsequently diusely ree ted at one of the bla k-painted surfa es, arealso onsidered be ause they are of the same intensity as light rays dire tly ree ted at the bla ksides. Fresnel ree ted light from the dierent opti al interfa es is not in luded. This would be already ase ond-order orre tion. Likewise, orre tions dis ussed in se tions 4.1.3 to 4.1.5 are not applied. It was shown in se tion 4.1.4 that the refra tion of the light leads to a narrower dete ted distributionwhen passing into the entran e window. We dene teff as the ee tive window thi kness that leads tothe same average distribution width as the true refra ted light distribution for the onsidered rangeof intera tion distan es. teff is used to approximate the ee t of refra tion of the ba kground light.The appli ation of the inverse square law of equation (4.3) together with Lambert's osine law (Bornand Wolf, [125, Xu et al. [126) gives the four dierent ontributions shown in gure 4.8. One has diuse48

4 Parameterization of the Signal DistributionPSfrag repla ementsrc
r
z = 0
z = T + teff
γ-raydiuseree tion rRϑREϑD
(a) Diuse ree tion at bla k oating opposite the en-tran e window.
PSfrag repla ements
rc
r′0r
z = 0
z = T + teff
γ-raydiuseree tiontotalree tion
rRϑRE
ϑD(b) Total ree tion at the s intillator-window interfa eand subsequent diuse ree tion at bla k oating oppo-site the entran e window.PSfrag repla ements
rc
r
z = 0
z = T + teffγ-ray
diuse ree tionrRxRyRzR ϑRE
ϑD( ) Diuse ree tion at bla k oatings normal to theentran e window.
PSfrag repla ementsrc
r′0r
z = 0
z = T + teff
γ-raydiuse ree tion totalree tionrR
xRyRzR ϑREϑD
(d) Total ree tion at the s intillator-window interfa eand subsequent diuse ree tion at bla k oatings nor-mal to the entran e window.Figure 4.8: Contributions to the ba kground distribution aused by rst-order diusive ree tions.ree tion at the rystal border rR = (xR, yR, T + teff )
BGA(r, rc) = ξJc
4π
x
SR (T + teff )2
(rR − rc)2(r − rR)4dxRdyR, (4.22)total ree tion at the s intillator-window interfa e and subsequent diuse ree tion at the rystal border
rR = (yR, yR, T + teff )
BGB(r, rc) = ξJc
4π
x
SR θ
cos−1
(z0 + T + teff
|r − rc|
)
− ϑc
(T + teff )2
(rR − rc)2(r − rR)4dxRdyR, (4.23)with rc = (xc, yc,−zc); diuse ree tion at any of the rystal borders rR = (±L, yR, zR) and rR =
(xR,±L, zR)BGC(r, rc) = ξ
Jc
4π
x
SR √(x − xR)2 + (y − yR)2(zR − z)
(rR − rc)2(r − rR)4dvRdzR, (4.24)and total ree tion at the s intillator-window interfa e and subsequent diuse ree tion at any of the rystalborders rR = (±L, yR, zR) and rR = (xR,±L, zR)
BGD(r, rc) = ξJc
4π
x
SR θ
cos−1
(zR + z0 + 2t
|r− rc|
)
− ϑc
√
(x − xR)2 + (y − yR)2(zR − z)
(rR − rc)2(r − rR)4dvRdzR, (4.25)49

4.2 Complete Signal Distributionwith rc = (xc, yc,−zc). θx in equations (4.23) and (4.25) is the unit-step distribution and dvR in equa-tions (4.24) and (4.25) has to be repla ed by dxR or dyR depending on the surfa e SR over whi h theintegration is arried out. T is the thi kness of the s intillation rystal and 2L its transverse dimensionsupposing a square shape. The omplete ba kground light distribution BG(r, rc) is given by the superpo-sition of the ontributions (4.22)-(4.25).4.2 Complete Signal DistributionThe total s intillation light distribution is given as a superposition of the ba kground light and the produ tof the ontributions dis ussed in se tions 4.1.1-4.1.5.LDetector (r, r
virtc ) = J(r, rvirt
c )I(r, rvirtc )T (ϑ2)A(ϑ2)/I0 + BG(r, rc) (4.26)with
rvirtc = rvirt
c (r, rc). (4.27)The subs ript in (4.26) indi ates that the light density does not only depend on the observation point rand the γ-ray photo onversion position rvirtc , but also on the s intillation dete tor onguration, e.g. therefra tion indi es, the entran e window thi kness, the rystals spatial dimensions, et . Sample distribu-tions are plotted for dierent photo onversion positions in gure 4.9 with the following dete tor designparameters: t = 2 mm, n1 = nLSO = 1.82, n2 = nBS = 1.51, n3 = nPC = 2.7 + 1.5i, L = 21 cm, T = 10 mm,
ξ = 2.5%, λ = 400 nm and tPC = 20 nm. Also shown are the ontributions of the ba kground light due todiuse ree tion at the rystal borders. It an be seen that this ontribution be omes important for largeintera tion distan es zc and near the rystal borders and edges, while it is very low for small zc. Alsothe expe ted variation of the distributions width with the intera tion distan e an be observed. If these ond moment and the standard deviation are omputed from the distribution, the dependen e an alsobe observed in this variables. However, both variables also depend on the planar impa t position to greateror lesser extent. Figure 4.10 shows the dependen e of the standard deviation and the se ond moment onthe intera tion distan e for dierent transverse photo onversion positions. The graphs shown in the sub-gures 4.10(a) and 4.10(b) are obtained from a light distribution with ree ted ba kground as dis ussed inse tion 4.1.6. A strong variation in both measures an be observed for large intera tion distan es shownin the plots (zc & 7 mm). This is not expe ted and not observed for a signal distribution without any re-e tions (sub-gures 4.10( ) and 4.10(d)) and may be an artefa t aused by the important approximationsused for the derivation of the ba kground light model.Referen es[106 H. Anger, Gamma-ray and positron s intillation amera, Nu leoni s, vol. 21, no. 10, pp. 5659, O t.1963.[107 J. Karp and G. Muehllehner, Performan e of a position-sensitive s intillation dete tor, Phys. Med.Biol., vol. 30, no. 7, pp. 643655, 1985.[108 J. Rogers, D. Saylor, R. Harrop, X. Yao, C. Leitao, and B. Pate, Design of an e ient positionsensitive gamma ray dete tor for nu lear medi ine, Phys. Med. Biol., vol. 31, no. 10, pp. 10611090,1986.[109 S. Siegel, S. R. Cherry, A. R. Ri i, Y. Shao, and M. E. Phelps, Development of ontinuous dete torsfor a high resolution animal PET system, IEEE Trans. Nu l. S i., vol. 42, no. 2, pp. 10691074,Aug. 1995.[110 J. Seidel, W. Gandler, and M. Green, Chara teristi s of a Pair of Small Field-of-View LSO S intil-lation Cameras, IEEE Trans. Nu l. S i., vol. 43, no. 3, pp. 19681973, June 1996.[111 X. Liu, N. Clinthorne, L. Shao, K. Koral, and W. Rogers, Re ursive Cal ulation of the Two-Dimensional Maximum Likelihood Position Estimate for a S intillation Camera, IEEE Trans. Nu l.S i., vol. 37, no. 2, pp. 713717, Apr. 1990.50

Referen es
-20-10
010
20-20
-10
0
10
20
0
20
40
60
-20-10
010
20
PSfrag repla ementsx [mmx [mm y [mmJtot
(a) Total light density in arbitrary units for a pho-to onversion at rc = (0, 0, 0) mm.-20
-100
1020
-20
-10
0
10
200.25
0.3
0.35
-20-10
010
20
PSfrag repla ementsx [mmx [mm y [mmJBG
(b) Ba kground light density in arbitrary units fora photo onversion at rc = (0, 0, 0) mm.-20
-100
1020
-20
-10
0
10
202
4
6
-20-10
010
20
PSfrag repla ementsx [mmx [mm y [mmJtot
( ) Total light density in arbitrary units for a pho-to onversion at rc = (0, 0, 10) mm.-20
-100
1020
-20
-10
0
10
201
2
3
4
-20-10
010
20
PSfrag repla ementsx [mmx [mm y [mmJBG
(d) Ba kground light density in arbitrary units fora photo onversion at rc = (0, 0, 10) mm.-20
-100
1020
-20
-10
0
10
20
0
2
4
6
8
-20-10
010
20
PSfrag repla ementsx [mmx [mm y [mmJtot
(e) Total light density in arbitrary units for a pho-to onversion at rc = (−16, 16, 5)mm.-20
-100
1020
-20
-10
0
10
20
0
1
2
-20-10
010
20
PSfrag repla ementsx [mmx [mm y [mmJBG
(f) Ba kground light density in arbitrary units fora photo onversion at rc = (−16, 16, 5)mm.Figure 4.9: Example distributions of the total light distribution and theassumed ba kground light at dierent possible γ-ray intera tion positions. 51

Referen es
0 2 4 6 8 10
0.2
0.4
0.6
0.8
1
PSfrag repla ementszc [mm
[a.u.(a) Dependen e of the ombined se ond moment onthe intera tion distan e at positions (xc, yc) = (0, 0)mm(dashed line), (xc, yc) = (21, 0) mm (dot-dashed line)and (xc, yc) = (21, 21) mm (solid line).
0 2 4 6 8 10
0.7
0.75
0.8
0.85
0.9
0.95
1
PSfrag repla ementszc [mm
[a.u.(b) Dependen e of the standard deviation on the in-tera tion distan e at the positions (xc, yc) = (0, 0)mm(dashed line), (xc, yc) = (21, 0)mm (dot-dashed line)and (xc, yc) = (21, 21) mm (solid line).
0 2 4 6 8 10
0.2
0.4
0.6
0.8
1
PSfrag repla ementszc [mm
[a.u.( ) Dependen e of the ombined se ond moment on theintera tion distan e at the positions (xc, yc) = (0, 0)mm(dashed line), (xc, yc) = (21, 0) mm (dot-dashed line)and (xc, yc) = (21, 21) mm (solid line) for a model dis-tribution without ree ted ba kground.
0 2 4 6 8 10
0.3
0.4
0.5
0.6
0.7
PSfrag repla ementszc [mm
[a.u.(d) Dependen e of the standard deviation on the in-tera tion distan e at the positions (xc, yc) = (0, 0)mm(dashed line), (xc, yc) = (21, 0)mm (dot-dashed line)and (xc, yc) = (21, 21)mm (solid line) for a model dis-tribution without ree ted ba kground.Figure 4.10: Dependen e of the model distributions normalized se ond mo-ment and the standard deviation on the intera tion distan e at three har-a teristi impa t positions.[112 J. Joung, R. Miyaoka, and T. Lewellen, Mi e: a high resolution animal PET using ontinuous LSOwith a statisti s based positioning s heme. Nu l. Instr. and Meth. A, vol. 489, pp. 584598, 2002.[113 K. L. Matthews II, S. M. Leonard, C. E. Ordonez, D. E. Persyk, and W. Chang, A depth-en odinganger dete tor using s intillation bers, IEEE Trans. Nu l. S i., vol. 48, no. 4, pp. 13971402, Aug.2001.[114 G. J. Taka s, A. B. Rosenfeld, and M. F. Ler h, Design and simulation of ontinuous s intillatorwith pixellated photodete tor, IEEE Trans. Nu l. S i., vol. 48, no. 4, pp. 14121417, Aug. 2001.[115 P. Anti h, N. Malakhov, R. Parkey, N. Slavin, and E. Tsyganov, 3D position readout from thi ks intillators, Nu l. Instr. and Meth. A, vol. 480, pp. 782787, 2002.[116 C. W. Ler he, J. M. Benllo h, F. Sán hez, N. Pavón, B. Es at, E. N. Gimenez, M. Fernández, I. Torres,M. Giménez, A. Sebastià, and J. Cerdá, Depth of intera tion within ontinuous rystals from thewidth of its s intillation light distribution, IEEE Trans. Nu l. S i., vol. 52, no. 3, pp. 560572, June2005.[117 N. Tsoulfanidis, Measurement and Dete tion of Radiation, 2nd ed. Taylor & Fran is, 1995.52

Referen es[118 C. D'Ambrosio, F. De Notaristefani, H. Leutz, D. Puertolas, and E. Rosso, Improved light transitionsfrom s intillators to new photo athode windows, Nu l. Instr. and Meth. A, vol. 431, pp. 455459,Sept. 1999.[119 M. P. Tornai, E. J. Homan, and S. R. Cherry, Ee t of refra tion index and light sharing on dete torelement identi ation for 2D dete tor modules in Positron Emission Tomography, Nu l. Instr. andMeth. A, vol. 348, pp. 618622, 1994.[120 S. Fly kt and C. Marmonier, Photomultiplier tubes, prin iple and appli ation, Photonis, 2002.[121 H. Kume, Photomultiplier tube, prin iple to appli ation, Hamamatsu Photoni s K.K., 1994.[122 D. Jones, Photomultiplier sensitivty variation with angle of in iden e on the photo athode, AppliedOpti s, vol. 15, no. 4, pp. 910914, Apr. 1976.[123 T. Chyba and L. Mandel, Angular sensitivity of a va uum photodiode, or does a photodete toralways ount absorbed photons? J. Opt. So . Am. B, vol. 5, no. 6, pp. 13051311, June 1988.[124 D. Motta and S. S hönert, Opti al properties of bialkali photo athodes, Nu l. Instr. and Meth. A,vol. 539, no. 1-2, pp. 217235, Feb. 2005.[125 M. Born and E. Wolf, Prin iples of Opti s, 7th ed. Cambridge University Press, 2003, reprintedseventh edition with orre tions.[126 G. Xu, M. Tazawa, P. Jin, and K. Yoshimura, Diuse ree tion of erami s oated with diele tri thin lms, Applied Opti s, vol. 42, no. 7, pp. 13521359, Mar. 2003.
53

Referen es
54

5 Enhan ed Charge Dividing Cir uits5 Enhan ed Charge Dividing Cir uitsCraer is like a tree and reputation like a sw. T sw is wtwe think of it; t tree is t real thing.Abram Lin oln, ⋆ 1809 † 1865THE rst time that the enter of gravity algorithm (CoG) was used for position estimation in nu learmedi ine was in 1953, when Hal Anger developed the rst s intillation amera (Anger [127) (refer togure 1.3 of hapter 1). As a onsequen e of its subtle and easy ele troni implementation, it has nowa-days be ome very useful for the position estimation of γ-ray imaging dete tors even though it introdu essystemati errors. The method is often alled entroiding and the measured position estimates for the xand y spatial dire tions are given the name entroid. A tually, only in rare ases an one avoid using the enter of gravity algorithm for the analysis of the signal distribution. High-energy physi s experimentsshow a dramati in rease in the dete tor segmentation and therefore a tremendous amount of data have tobe pro essed. As a onsequen e, the use of the enter of gravity algorithm for position determination hasbe ome very widespread for s ienti and pra ti al appli ations (Lauterjung et al. [128, Kuhlmann et al.[129, Bo k et al. [130, M Di ken et al. [131, Doehring et al. [132 and Landi [133).In this se tion, the mathemati al properties of the enter of gravity algorithm and espe ially the onse-quen es that result from its ele troni implementation are reviewed in detail. However, the spe ial emphasisis put on the analysis of how the existing harge dividing ir uits an be enhan ed to measure the se ondmoment in addition to the entroid and the total harge.5.1 Introdu tion, Conventions and General Considerations5.1.1 Statisti al EstimatesBy analogy with the geometri entroid, whi h represents the enter of gravity1 of a body, the generalizedfun tional entroid is dened as
〈x〉 =
∫
ω x ϕ(x)dx∫
ω ϕ(x)dx, (5.1)provided that the integrals exist. In equation (5.1) ϕ(x) is an integrable fun tion and ω ⊆ Ω ⊆ R is thesupport within the domain Ω of ϕ(x). If ϕ(x) is repla ed by an arbitrary probability density fun tion P(x),equation (5.1) redu es to
E(x) =
∫
ω
xP(x)dx, (5.2)with ∫ω P(x)dx = 1, sin e P(x) is a probability density fun tion. E(x) is alled the mean, or more generally,the expe tation value of x respe t to P(x). The mean (5.2) is not to be onfused with the average probabilitygiven byP =
∫
ω P(x)dx∫
ωdx
. (5.3)1O asionally, the method is also alled enter of mass algorithm. In an uniform gravitational eld, the enter of mass andthe enter of gravity are identi al. 55

5.1 Introdu tion, Conventions and General ConsiderationsPSfrag repla ements
medianP mode mean(a) Median, mode and mean of the non-symmetri exam-ple distribution fun tion Pa(x) = xe10−x/2
4e10−44. In general,the three values are dierent.
PSfrag repla ementsmedian
P modemean(b) Median, mode and mean of the axially symmetri example distribution fun tion Pb(x) = e−(x−10)2
√π Erf 10
. Thethree estimators give the same result for this spe ial ase.Figure 5.1: Lo ation of mean, mode, median and average probability fortwo spe ial ases of unimodal probability distribution fun tions in a losedinterval. The average probability of both distributions is also drawn.Equation (5.2) an be generalized to yield the expe tation value E [g(x)] for an arbitrary fun tion g(x)respe t to the probability density fun tion P(x):E [g(x)] =
∫
ω
g(x)P(x)dx, (5.4)whenever the integral is absolutely onvergent. The same generalizations an be made for equation (5.1).Of spe ial statisti al interest is the lass of monomials g(x) = xk with k ∈ N. Plugging in this lass intoequation (5.1) for the fun tional entroid, one obtainsµk =
∫
ωxkϕ(x)dx∫
ω ϕ(x)dxand (5.5)
µ′k =
∫
ω(x − µ1)kϕ(x)dx
∫
ω ϕ(x)dx. (5.6)The sequen es µk and µ′
k of real or omplex numbers are alled the normalizedmoments and the normalized entral moments of ϕ(x) respe tively being µ0, µ′0 ≡ 1 and µ′
1 ≡ 0 by denition. Spe ial names are givento the lowest order entral moments of probability distribution fun tions. As already mentioned, the rstmoment µ1 is alled the mean. µ′2 is given the name of varian e. It is a measure of the spread or widthof P(x). The next two higher entered moments are alled skewness and kurtosis respe tively. Whilethe skewness is a measure for the degree of antisymmetry of the fun tion, the kurtosis hara terizes itsrelative atness ompared to a standard distribution. Further details an be found in standard textbooks,e.g. [134, 135. If the moments are not normalized, then µ0 and µ′
0 give the norm of ϕ(x) and normallyrepresent physi al quantities. It is also possible (and straightforward) to dene the joint moments andexpe tation values for multivariate fun tions ϕ(x), g(x) and P(x) dened on ω ⊆ Ω ⊆ Rn:
µk1,...,kn =
∫
ω
∏ni xki
i ϕ(x)dx∫
ωϕ(x)dx
, (5.7)µ′
k1,...,kn=
∫
ω
∏ni (xi − µ1i)
kiϕ(x)dx∫
ω ϕ(x)dxand (5.8)
E [g(x)] =
∫
ω
g(x)P(x)dx. (5.9)Alternative estimators for probability distribution fun tions are the median and the mode. The modeis the value x, where P(x) takes on a maximum. Clearly there exist multi-modal probability distribution56

5 Enhan ed Charge Dividing Cir uitsPSfrag repla ements DnDn−1Dn−2
A
RL
CL
(a) Anode ir uit with load resistan e RLand apa itan e CL
0 2 4 6 8 10-1
-0.8
-0.6
-0.4
-0.2
0PSfrag repla ements
V PMT(t)/V PMT(0)∣ ∣
κ=
0
t/τS intκ
=1
κ=
0
(b) Wave forms of the output voltages for dierent time on-stants of the anode load. The κ-values for the 5 dierentgraphs are 0, 0.2, 0.4, 0.6, 0.8 and 1.Figure 5.2: Typi al anode ir uit (left) and pulse shapes for anode loads ofdierent τRC = RLCL (right).fun tions. The median of P(x) is the value xmed for whi h larger and smaller values are equally probable,i.e. the value for whi h the area below P(x) to the left from xmed is equal to the area below P(x) to the rightfrom xmed . Figures 5.1 show these values for the two dierent probability distributions Pa(x) = xe10−x/2
4e10−44and Pb(x) = e−(x−10)2
√π Erf 10
on the support interval ω = [0, 20]. Note that for general probability distributionfun tions, all mentioned estimators take on dierent values, as an be seen for Pa(x) in gure 5.1(a), whilethere are lasses of distribution fun tions for whi h some or even all of the mentioned estimators give thesame results (gure 5.1(b)). A tually the single ondition of only onsidering axially symmetri univariatefun tions obviously makes the median oin ide with the mean. For single mode axially symmetri univariatefun tions these values also oin ide with the mode. This and the fa t that numeri omputation of thedierent estimators are of dierent omputational eort, are the reasons for o asionally taking one of theseestimators as the approximation for another. One has to take spe ial are with these approximations if oneis dealing with asymmetri distribution fun tions, sin e the introdu ed errors an be ome signi ant.5.1.2 Signal Chara teristi s of Photomultiplier TubesThe anode urrent of a photomultiplier tube operated in the saturated urrent region depends on thein ident s intillation light ux but not on the load that is onne ted to the anode (Fly kt et al. [136). One an treat the anodes of the photomultiplier tubes like ideal urrent sour es, sin e they are more or lesssophisti ated olle tion ele trodes with ne essarily low internal impedan e (Güttinger et al. [137, M Hose[138).The temporal dependen e of the s intillation light emission L(t) that was indu ed at time t0 by adete ted γ-photon an be approximated by an exponential de ay lawL(t) =
nPh(E)
τS int e− t
τS int , (5.10)τS int being the de ay time onstant of the s intillator used and nPh(E) the average number of s intillationphotons set free from the parti le with energy E . The resulting number of photoele trons is given by the onvolution of L(t) with the photomultiplier's pulse response RPMT(t). This response is mainly determinedby the transit time that requires the ele tron avalan he to pass the multiplying stages and to rea h theanode. In parti ular, the dieren e in this time for ea h single photoele tron leads to temporal impulsebroadening (Kume [139). If one assumes a RPMT(t) of Gaussian shape, the urrent at the anodes be omes
JPMT(t) = LS int(t) ∗ RPMT(t)
=e−GPMTnPE(E)
2τS int exp
[τ2PMT2τ2S int − t
τS int ](1 + Erf
[t√
2τPMT − τPMT√2τS int ]) ,
(5.11)57

5.1 Introdu tion, Conventions and General Considerationswhere e− is the elementary harge, GPMT the gain of the photomultiplier tube, τPMT the ele tron transittime spread, nPE(E) the average number of photoele trons and Erf the error fun tion. In reasing thesupply voltages of the dynode system leads to a higher ele tri eld strength between the dynode stagesand onsequently leads to a higher ele tron speed and shorter transit times. The geometri design type ofthe dynode system and the total size of the photomultiplier are also of importan e for the timing resolution.After all, photomultiplier tubes are, with rise times between 0.7 ns and 7 ns, photodete tors of ex eptionallyfast response (Kume et al. [140, M Hose [141). The response pulse width τPMT is therefore normallynegligible ompared to the de ay time τS int of the s intillator and equation 5.11 an be approximated byJPMT(t) ≈ qa(E)
2τS int e−t/τS int , (5.12)where e−GPMTnPE(E) has been substituted by the average harge qa(E) olle ted at the anode. For propersignal olle tion, the anode is maintained at ground potential via a load resistan e RL. This is shown ingure 5.2(a). The parallel apa itan e CL an be required, or is just a parasiti one and builds, togetherwith the load resistan e RL, an R-C network. As an be easily veried by Fourier-analysis, the pulseresponse of this R-C network is a de aying exponential with the time onstant τRC = RLCL. It has to be onvolved with the photomultiplier pulse given in equation (5.12) leading to the following voltage pulseVPMT(t) ≈ qa(E)
CL
τRCτS int − τRC (e−t/τS int − e−t/τRC) . (5.13)The rise time of the voltage pulse is the time from the beginning of the pulse at t = 0 until it rea hes itsmaximum value, and is given2 by the position of the only extremum of (5.13):
tmax =κ τS intκ − 1
log κ, (5.14)being κ = τRC/τS int. For the ideal ase of τRC = 0, the rise-time tmax in equation (5.14) be omes zero.However, this is due to the approximation made in (5.12). The real rise-time in this ase would be givenby the maximum position of (5.11). As κ is swit hed on, the rise-time will be rapidly dominated bythe time onstant τRC of the anode ir uit. This result is of parti ular interest for the study of hargedividing ir uits made in this hapter. Sin e τRC is proportional to RL as well as to CL, any hange intheir values leads to a variation in the pulse shape of the anode signal. As will be seen, the resistor RLespe ially is required to feature a large variation depending on the position of the anode-segment of theposition-sensitive photomultiplier tubes used. This will lead to a strong variation of the rise-time of theanode-signal depending on the impa t position of the γ-ray. If this signal were used to generate the triggersignal for the oin iden e dete tion, the varying pulse shape would introdu e a signi ant temporal jitter,lowering the temporal resolution of the dete tor as a result. The use of the last dynode instead avoids thisproblem ompletely and should be preferred when a harge divider is used for position dete tion.While these last onsiderations are of major importan e for the timing hara teristi s of γ-ray imagingdete tors, espe ially in oin iden e mode, they are of sparse interest for the positioning algorithm itself.All versions of the harge dividing ir uits dis ussed here work without apa itors ex ept for a few that areneeded for frequen y and oset ompensation of an operational amplier. However, they do not hangethe pulse shape and do not ae t the omputation of the rst order moments of the signal distribution.These are obtained ex lusively by using resistan es, whi h are supposed to behave in an ideal way, i.e. anyfrequen y dependen e, temperature dependen y, et . is negle ted. Consequently, analyzing the urrentsthat are the temporal derivatives of the harges is equivalent to analyzing the harges itself. In this work,ex ept for a few ex eptions, the urrents will be studied.5.1.3 General Preamplier DesignIn the following se tion, three possible ele troni implementations of the enter of gravity algorithm arepresented. All three versions have in ommon that they provide urrents whi h have to be measured asexa tly as possible. A parti ular property of all presented harge dividing ir uits is that the stages thatread and amplify these urrents ne essarily need an input impedan e ZIn that is small ompared to the2In order to ope with unavoidable noise, the anode signal rise time is often dened as the elapsed time between 10% and90% amplitude of the leading edge of the anode urrent pulse.58

5 Enhan ed Charge Dividing Cir uits+
-
PSfrag repla ements R
OP
JIn
UIn UOut(a) S hemati for a urrent ontrolled voltage sour e.+
-
PSfrag repla ementsR1
R2
OPUIn
UOut(b) S hemati for a voltage ontrolled voltage sour e.+
-+
-PSfrag repla ements R
OP1OP1
JIn
UOut( ) S hemati for the preamplier ongurationto be used with harge dividing ir uits.Figure 5.3: S hemati s of elementary operational amplier ongurationand a urrent sensitive preamplier for harge dividing ir uits.typi al resistor values used for the harge divider. Therefore, amplier ongurations with minimized ZInare required so that the des ribed ir uits work predi tably.As input stage, normally the urrent ontrolled voltage sour e shown in gure 5.3(a) is used. Expressionsfor its input impedan e ZIn , output voltage UOut and output impedan e ZOut an be found in standardtextbooks, e.g. [142 and, when negle ting parasiti apa itan es, are given byZIn =
R
AD, UOut = −RJIn , ZOut =
Z0
g. (5.15)Here, AD denotes the dierential gain and Z0 the output impedan e of the used operational amplier OP.
g is the loop gain of the ir uit and for the inverting amplier is given by g = kF AD, with kF a fa tordepending only on the external feedba k network. In the ase of the urrent ontrolled voltage sour e, kFbe omes very small, while the dierential gain AD for modern operational ampliers easily ex eeds 106.As one an see from the middle equation in (5.15), it is easy to redu e the input impedan e to a verysmall value. However, the output resistan e Z0 of the same operational amplier will typi ally be of a fewhundred Ohms, so that the output impedan e of ir uit 5.3(a) an get very small. The problem of the lowoutput impedan e of the I-U onverter stage an be solved by a downstream voltage ontrolled voltagesour e, shown in gure 5.3(b). Its input impedan e, output voltage and output impedan e are given byZIn = RCMR, UOut =
UIn
kF, ZOut =
Z0
g, (5.16)where RCMR denotes the ommon mode resistan e of the used amplier, whi h normally is of a few MΩ and an rea h in spe ial devi es up to 1TΩ. For the non-inverting amplier, the open loop gain is also given by
g = kF AD, with kF taking the value R1/(R2 + R1). For the maximum value of kF = 1, the output voltagefollows the input voltage. It an be realized by removing R1 from the ir uit and shorting R2. In this ase,one also obtains the minimum possible output impedan e. The nal onguration is shown in gure 5.3( )and represents a standard onguration for harge dividing ir uit readout. It ombines the advantages ofboth sub- ir uits dis ussed, and is still inexpensive and easy to implement. There are further proposals tooptimize operational parameters of preamplier ir uits for photomultipliers, whi h is outside the s ope ofthis work (refer to Kume [139, Fly kt [136 and Fabris et al. [143).5.2 Charge Dividing Cir uits for Position DeterminationThe underlying prin iple of the positioning prin iple invented by Anger for his s intillation amera (Anger[127) is based on Kir hho's rules. It uses the fa t that a urrent J that is inje ted into a onguration onsisting of two resistors, Rl and Rr (refer to gure 5.4(a)), is divided into two partial urrents Jl and Jrdepending only on the ratio Rl/Rr. As a orollary, it is possible to dedu e this ratio from both urrents Jland Jr for the notional ase that although the sum of both resistor values Rl and Rr is known, their ratio59

5.2 Charge Dividing Cir uits for Position Determinationis not.J = Jl + Jr
RrJr = RlJl
=⇒Rl = Jr
Rl + Rr
J
Rr = JlRl + Rr
J
(5.17)This an be of spe ial interest for position dete tion of the inje ted urrent when there is a known orrelationbetween the resistan es Rl and Rr and the position. Consider the simplest ase, when one has the situationshown in gure 5.4(b). A steady urrent J is inje ted at the position x0 ∈ ]−L2 , L
2 [ into a wire of lengthL. An innitely small wire segment has the resistan e dR = g(x)dx with dR > 0 and g(x) = ρ(x)/A(x),where ρ(x) is the spe i resistan e of the wire and A(x) its ross-se tion. The total resistan e RW of thewire from −L
2 to L2 is obtained by integration of g(x) over its length, while the resistan es to the left andto the right of the inje tion point x0 are obtained by integrating over the orresponding wire-segment:
Rl (x0) =
x0∫
−L2
g(x) dx , Rr (x0) =
L2∫
x0
g(x) dx , RW = Rl (x0) + Rr (x0) =
L2∫
−L2
g(x) dx (5.18)The urrent J , whi h is inje ted at position x0 into the wire, will be divided into two fra tions, Jl andJr , orresponding to the ratio of Rl and Rr and thus on the inje tion position x0. Likewise, the parallel onne tion of Rl and Rr in equation (5.18) is given by
Rl (x0) ‖ Rr (x0) =
∫ x0
−L2
g(x) dx∫ L
2
x0g(x) dx
∫ L2
−L2
g(x) dx. (5.19)It is just the overall resistan e that sees the urrent J . Making use of Kirs ho's voltage law, Jr (x0)Rr (x0) =
Rl (x0)Jl (x0), the urrents to the right and to the left of x0, namely Jr (x0) and Jl (x0), an easily be om-puted:Jr (x0) =
Rl (x0)
Rr (x0)
(J − Jr (x0)
)=
Rl (x0)
Rr (x0) + Rl(x0)J (5.20)
Jl (x0) =Rr (x0)
Rl (x0)
(J − Jl(x0)
)=
Rr (x0)
Rr (x0) + Rl(x0)J (5.21)where Jr (x0) + Jl (x0) = J was used. With either of the two equations (5.20) and (5.21), it is now possibleto re onstru t exa tly the position x0 on the wire where the urrent J was inje ted. For this, the values of
Jr (x0) and Jl (x0) and the distribution g(x) of the resistan e along the wire must be known. Normally oneuses the dieren e of both urrents for the omputation:Jr (x0) − Jl (x0)
Jr (x0) + Jl (x0)=
Rr (x0) − Rl(x0)
Rr (x0) + Rl(x0)(5.22)If one supposes a onstant resistan e distribution g(x) ≡ g along the wire, the resistan e to the left and tothe right are then given by Rl = (x0 + L/2) g and Rr = (L/2 − x0) g, where x0 ∈ ]−L
2 , L2 [. Thus, fromequations (5.17) and (5.18), one obtains the following expressions:
(x0 + L2 ) g = Jr
Rw
J
(L2 − x0) g = Jl
Rw
J
=⇒ x0 = (Jr − Jl)Rw
2Jg
L = (Jr + Jl)Rw
Jg
=⇒ x0 =(Jr − Jl)
(Jr + Jl)
L
2. (5.23)For this reason, one an easily dedu e the inje tion point of the urrent J from Jl and Jr. Note that theequation on the far right of (5.23) does not depend on the resistan e g but only on the length of the wire.The statisti al un ertainties of this positioning method are obtained straightforwardly by error propa-gation and are given by:
δx =L
J2
√
J2r δJ2
l + J2l δJ2
r and δx
x= 2
√
J2r δJ2
l + J2l δJ2
r
J2r − J2
l
, (5.24)60

5 Enhan ed Charge Dividing Cir uitsPSfrag repla ementsJ
Jl Jr
RrRl
GND(a) Simplest asefor a harge divid-ing onguration.
PSfrag repla ementsL2
−L2
x0
wireJl Jr
Jδ(x − x0)
g(x)(b) A 'pun tual' urrent Jδ(x−x0) is in-je ted at the position x0 into the wire.PSfrag repla ements
L2
−L2 wire
Jl Jr
Jϕ(x)
g(x)( ) A urrent distribution Jg(x) is in-je ted along the wire.Figure 5.4: Graphi al representation for dierent inje ted urrent distribu-tions along a ondu tor. If the resistor values Rl and Rr in gure 5.4(a) are hosen in su h a way that they are proportional to a spatial dire tion, the urrents Jl and Jr an be used for the determination of the position whereJ is inje ted.with the limits
δx
x
∣∣∣Jr→0
= −2√
δJr
Jl, δx
x
∣∣∣Jl→0
=2√
δJl
Jrand δx
∣∣∣Jl,r→ J
2
=L
2J
√
δJ2l + δJ2
r =L
4
√(
δJl
Jl
)2
+
(δJr
Jr
)2(5.25)Clearly, the relative error in the measurement of x at the enter position x = 0 diverges. The absoluteerror at this position is just the geometri sum of the relative measurement errors in the urrents to the leftand to the right, s aled by a quarter of the wire-length. At both ends of the wire, the relative positioningerror depends only on the measurement error of the urrent extra ted at the opposite end, whi h does notne essarily equal zero, although the respe tive urrent does.Now onsider the ase of a urrent distribution Jϕ(x), that is inje ted simultaneously at all possiblepositions x0 ∈ ]−L2 , L
2 [ along the wire as shown in gure 5.4( ). It is supposed that the inje ted urrentdistribution ϕ(x) is normalized.L2∫
−L2
ϕ(x) dx = 1 (5.26)Sin e the superposition prin iple applies to ele tromagneti elds, the impulse response of the wire (equa-tions 5.20 and 5.21) must be summed up for all possible inje tion points x0, weighted by the value of thefun tion at this point ϕ(x0). This will transform the urrents Jl and Jr into the following fun tionals ofϕ(x):
Jr [ϕ] =J
RW L2∫
−L2
Rl (x)ϕ(x) dx , Jl [ϕ] =J
RW L2∫
−L2
Rr (x)ϕ(x) dx, (5.27)and leads to the equivalent of equation (5.22),Jr [ϕ] − Jl [ϕ]
Jr [ϕ] + Jl [ϕ]=
1
RW L2∫
−L2
(Rr (x) − Rl(x)
)ϕ(x) dx, (5.28)with
Jr [ϕ] + Jl [ϕ] =J
RW L2∫
−L2
(Rr (x) + Rl(x)
)ϕ(x) dx =
J
RW L2∫
−L2
RWϕ(x) dx = J. (5.29)61

5.3 Anger's Approa hEquations (5.28) and (5.29) are valid for any possible dependen e of the resistan e-distribution g(x)along the wire. Now onsider the simplest non-trivial ase of a wire with a onstant ross se tion A(x) ≡A and onstant spe i resistan e ρ(x) ≡ ρ. One than has g(x) ≡ g = const . Setting g(x) = g inequations (5.18), the resistan es to the left, to the right, of the whole wire (equation 5.18) and the parallel onne tion in equation (5.19) be ome
Rl (x) = gL
(1
2+
x
L
)
, Rr (x) = gL
(1
2− x
L
)
, RW(x) = gL, (5.30)andRr (x) ‖ Rl (x) = gL
(1
4− x2
L2
)
. (5.31)Equivalently, the urrents to the left and to the right in equation (5.27) are given by the simple relationsJr [ϕ] =
J
2+
J
L
L2∫
−L2
x ϕ(x) dx and Jl [ϕ] =J
2− J
L
L2∫
−L2
x ϕ(x) dx, (5.32)that dire tly leads to the rst moment of the arbitrary distribution ϕ(x) as dis ussed in the previousse tion 5.1.1.Jr [ϕ] − Jl [ϕ]
Jr [ϕ] + Jl [ϕ]=
2
L
L2∫
−L2
x ϕ(x) dx, (5.33)when the urrents (equations 5.32) are plugged into equation (5.28). The dis retized version of equa-tion (5.33) is widely used in the eld of nu lear medi al imaging to ompute the planar intera tion positionof the impinging γ-ray within the s intillation rystal. Axial symmetry of the distribution ϕ(x) and theexisten e of exa tly one maximum is required for this method to work, sin e only for axial symmetri distributions does the rst moment oin ide with the unique maximum of the distribution. If this onditionis not fullled, systemati errors in real γ-ray dete tor setups are introdu ed. Sin e the length of the wireis always limited to a nite value, in the most normal ase the distribution ϕ(x) is trun ated on its endsat the left and the right. This will destroy the symmetry of the distribution whenever the position of itsmaximum is dierent from the enter of the wire. These and other errors of the enter of gravity algorithmwill be dis ussed briey in se tion 5.8.5.3 Anger's Approa hFor the Anger-type gamma amera one ne essarily needs a dis rete positioning logi instead of wires witha onstant resistivity sin e ommer ially available photodete tors in general ome with a nite numberof dete tor segments. The adaptation to that ase an be a hieved by onne ting a set of resistors toea h photomultiplier or ea h anode-segment with their values adjusted in su h a way that there is a linear orresponden e between the urrents and the position of the photomultiplier tube. Figure 5.5 shows su ha onguration for one dimension. For ea h position xi, the inje ted urrent Ji is divided into Jui and Jd
iwith a ratio that orresponds uniquely to that position by hoosing the values of resistors Rui and Rd
i inan adequate way. Sin e ele tri al urrents are subje ted to the superposition prin iple, the urrents Juiand Jd
i are summed up on the upper and lower bus giving rise to Ju and Jd respe tively. The resistan esRIn represent the input impedan e of the atta hed amplier stage, whi h have to be as low as possible foroptimal linearity of the positioning network. Rewriting equation (5.17) for this ase, one obtains
Jui =
Rdi
Rdi + Ru
i
Ji
Jdi =
Rui
Rdi + Ru
i
Ji
=⇒Ju
i − Jdi =
Rdi − Ru
i
Rdi + Ru
i
Ji
Jui + Jd
i = Ji
=⇒ Jui − Jd
i
Jui + Jd
i
=Rd
i − Rui
Rdi + Ru
i
. (5.34)62

5 Enhan ed Charge Dividing Cir uitsPSfrag repla ements
Ju
Jd
J1 J2
Ji
JnJn−1
x1 x2 xi xn−1 xn X
RIn
RIn
Ru1
Rd1
Rui
Rdi
Ru2
Rd2
Run
Rdn
Run−1
Rdn−1
∆xFigure 5.5: Cir uit diagram showing the 1D-version of the Anger positioning ir uit. The resistan es RIn represent the input impedan e of the followingamplier stage and are supposed to be onne ted to virtual ground be ausethese impedan es should be zero.In the spe ial ase that there is only one single position xi, with Ji 6= 0 and all other Jj 6=i = 0, one hasJu ≡ Ju
i and Jd ≡ Jdi . For the general ase, the superposition prin iple has to be applied and all urrents
Jui and Jd
i must be summed up to obtain Ju and Jd respe tively.Ju =
∑Ni Ju
i =∑N
iRd
i
Rdi +Ru
i
Ji
Jd =∑N
i Jdi =
∑Ni
Rui
Rdi +Ru
i
Ji,=⇒
Ju − Jd =∑N
iRd
i −Rui
Rdi +Ru
i
Ji
Jd + Jd =∑N
i Ji,=⇒ Ju − Jd
Ju + Jd=
∑Ni
Rdi −Ru
i
Rdi +Ru
i
Ji
∑Ni Ji
(5.35)where N is the total number of inje tion points xi. If the input impedan e of the downstream urrentamplier annot be negle ted, the entroid would readJu − Jd
Ju + Jd=
∑Ni
Rdi −Ru
i
Rdi +Ru
i +2RInJi
∑Ni Ji
. (5.36)In order to determine the required resistor values Rdi and Ru
i a urrent J is onsidered that is inje ted atall positions xi, but only at one position at a time. One an then ompute the positions from the urrentsJu and Jd. For any arbitrary linear position en oding one just need to hoose the resistor pairs to fulll
Rdi − Ru
i
Rdi + Ru
i
!= axi + b. (5.37)However, there are innitely many possible fun tional dependen es for Ru
i and Rdi whi h fulll thisrequirement. Ru
i + Rdi = Ri is just the total resistan e and must not be the same for all positions.Therefore, any pair of resistor values of the form
Rui = Ri
2 (1 − b − axi)
Rdi = Ri
2 (1 + b + axi)(5.38)fulll equation (5.37) and an additional onstraint for Ri is ne essary. Choosing a onstant Ri ≡ R = const .,yields the trivial solution to (5.37). The parameter a is the s ale and b denes, whi h position i within theresistor array maps to x = 0. A very ommon hoi e is b = 0, a = 1 for the enter of the resistor array anda unity s ale. For these values, the right hand side of equation (5.35) transforms to the dis rete version forthe omputation of the entroid (equation 5.1).The impedan e seen by the sour e of the urrent Ji is given by the parallel onnexion of ea h resistorpair,
Rui ‖ Rd
i =Ru
i Rdi
Rui + Rd
i
=Ri
4
(1 − (axi + b)2
). (5.39)63

5.3 Anger's Approa hPSfrag repla ementsJij
Ruij
Rlij Rr
ij
Rdij
J l Jr
Ju
Jd
J lij
J lij−1
J lij+1
Jrij
Jrij−1
Jrij+1
JuijJu
i−1j Jui+1j
JdijJd
i−1j Jdi+1j(a) The two-dimensional version of the posi-tioning logi as proposed by Anger for the s in-tillation amera.
PSfrag repla ementsJi1,i2,...,ik
Jn1a
Jn1
b
Jn2a
Jn2
b
Jnka
Jnk
b
Ra,n1
i1i2...ik
Rb,n1
i1i2...ik
Ra,n2
i1i2...ik
Rb,n2
i1i2...ik
Ra,nk
i1i2...ik
Rb,nk
i1i2...ik
(b) General ase of k dimensions. For ea h dimension an ad-ditional pair of resistors is required for every inje tion point(xi1 , xi2 , . . . , xik
).Figure 5.6: Anger positioning logi for higher dimensions.As dis ussed in paragraph 5.1.2, photomultipliers a t like an ideal urrent sour e and the impedan e (5.39)does not ae t the working of the harge dividing ir uit. The only restri tion is given by the fa t thatthe anode urrents Ji lift the anode potential by the amount Ji(Rui ‖ Rd
i ) with respe t to the last dynode.When this voltage be omes too large, the PMT will stop working orre tly.For situations where the impedan e of the dierent inputs of the harge divider is important, equa-tion (5.39) an be used to adjust it to the required value for ea h xi. Of spe ial interest is the onstraintRu
i ‖ Rdi ≡ Rp = const . , i.e. an input impedan e that is equal for all positions xi. One then obtains forthe resistor values Ru
i , Rdi and Ri:
Rui =
2Rp
1 + b + axi, Rd
i =2Rp
1 − b − axiand Ri =
4Rp
1 − (b + axi)2, (5.40)with xi, i ∈ N equidistant points along the x-axis.The generalization to the higher dimensional ase is straightforward, however appli ations of the CoGusing harge dividing ir uits normally do not ex eed 3 dimensions. One only has to onne t one more harge divider with its orresponding busses for ea h additional spatial dimension that has to be measured.This is shown in gure 5.6(a) for the two-dimensional ase. On obtains for the urrents to the left, right,up and down at ea h inje tion point (xi, yj)
J lij =
RrijR
uijR
dij
RiJij , Jr
ij =Rl
ijRuijR
dij
RiJij
Juij =
RrijR
lijR
dij
RiJij , Jd
ij =Rl
ijRuijR
rij
RiJij
(5.41)and their equivalent bus urrents J l, Jr, Ju and Jd are obtained by summation over both position indexesi and j
J l =∑
ij
RrijRu
ijRdij
RiJij , Jr =
∑
ij
RlijRu
ijRdij
RiJij
Ju =∑
ij
RrijRl
ijRdij
RiJij , Jd =
∑
ij
RlijRu
ijRrij
RiJij
(5.42)64

5 Enhan ed Charge Dividing Cir uitswith Ri = (Rdij + Ru
ij)RlijR
rij + (Rl
ij + Rrij)R
dijR
uij .In analogy to equation (5.35) one obtains
Ju − Jd
Ju + Jd=
Nx,Ny∑
ij
Rdij − Ru
ij
Rdij + Ru
ij
Jij
Nx,Ny∑
ij
Jij
and Jr − J l
Jr + J l=
Nx,Ny∑
ij
Rrij − Rl
ij
Rrij + Rl
ij
Jij
Nx,Ny∑
ij
Jij
. (5.43)The impedan e of the resistor network at point (xi, yi) is given by the parallel onnexion of the four resistorsRl
i, Rri , Ru
i and Rdi , whi h is just the inverse of the sum of their inverse values. On e again, there is nounique solution for the required linear en oding for the urrent dieren es in (5.43) and further onstraints an be implemented on the positioning ir uit. Reasonable ones are the requirement of a onstant inputimpedan e for all positions (xi, yi) or, as will be shown later, an input impedan e that depends quadrati allyon the positions. It an be easily shown that if the resistor values fulll
Rlij ∝ 1
1−xi, Rr
ij ∝ 11+xi
, Ruij ∝ 1
1+yjand Rd
ij ∝ 11−yj
(5.44)a onstant input impedan e will be a hieved. Likewise, one obtains the above-mentioned quadrati en odingof the impedan e if the following resistor-value position dependen e instead of (5.44) are hosen.Rl
ij ∝ 4(x2i +y2
j )
1−xi, Rr
ij ∝ 4(x2i +y2
j )
1+xi, Ru
ij ∝ 4(x2i +y2
j )
1+yjand Rd
ij ∝ 4(x2i +y2
j )
1−yj. (5.45)Equivalent results an be obtained for the k-dimensional ase shown in gure 5.6(b).5.4 Proportional Resistor ChainsThe se ond possible onguration of harge dividing ir uits is based on position-sensitive RC-line readoutsfor proportional gas hambers (Borkowski et al. [144). It was developed to determine the position of ionizingevents with large volume proportional dete tors. A dis retized version designed for use with multi-anodeposition-sensitive photomultiplier tubes was presented by Siegel et al. [145. This version needs signi antlyfewer resistors than the original Anger logi and also redu es the wiring eort, exposing a nearly equivalentpositioning behavior. This is learly a great advantage with respe t to its implementation. As for the harge dividing ir uit by Anger, it is possible to extend the ir uit to arbitrary many dimensions, as longas the level of ele troni noise remains su iently low.The ontinuous ase has already been treated in se tion 5.2. For the dis rete ase the wire is repla edby a hain of a nite number of resistors R1 · · ·Rn+1. Consider su h a network (gure 5.7) for a number
n ∈ N of dete tor outputs. The anodes are numbered by i ∈ [1−n2 ; n−1
2 ] and in unit steps. In this way, oneonly has to multiply the index i by the distan e between the enters of two adja ent anode segments ∆xto get the true position x. If now a urrent Ji is inje ted at an arbitrary position i, it is grounded by theresistan es,Rl (i) =
(n + 1
2+ i
)
Rd =
(R
2Rd+ i
)
Rd (5.46)Rr (i) =
(n + 1
2− i
)
Rd =
(R
2Rd− i
)
Rd (5.47)to the left (equation 5.46) and to the right (equation 5.47) from i respe tively. R = (n + 1)Rd is thesum of all resistan es used in the network. Plugging equations (5.46) and (5.47) into the se ond theoremof Kir ho Rl(i)Jl (i) = Rr (i)Jr (i) and applying its rst theorem J(i) = Jl (i) + Jr (i), one obtains thefollowing urrents at the two ends of the hainJl (i) =
(1
2− Rd
Ri
)
Ji and Jr (i) =
(1
2+
Rd
Ri
)
Ji. (5.48)65

5.4 Proportional Resistor ChainsPSfrag repla ements
i:∆x
xx = 0xi
R1 Rn+1 JrightJleft
Ji
1−n2
n−12
12− 3
2 − 12
32
anode 1 anode n
Figure 5.7: Normally used DPC- ir uit for urrent PSPMTs in one dimen-sion, espe ially multi-wire type PSPMTs, with n anode-wires. The inje ted urrents Ji will ause the voltages Ui at the inter onne tion points.They depend linearly on the inje tion position i. In the ase of more than one inje ted urrent at two ormore dierent positions, one obtains the resulting urrents by superposition of all n dierent urrents Jl(i)and Jr (i):Jl =
1
2
∑
i
Ji −Rd
R
∑
i
iJi and Jr =1
2
∑
i
Ji +Rd
R
∑
i
iJi. (5.49)Equation (5.49) dire tly leads to the relations normally used for the sum of urrents and the entroid ofthe index:J =
∑
i
Ji = Jl + Jr and Jr − Jl
Jr + Jl
=2Rd
R
∑
i iJi∑
i Ji. (5.50)In order to get the entroid in the position spa e, one simply uses the fa t that xi = i∆x and thus i = xi/∆x.
〈x〉 =
∑
i xiJi∑
i Ji=
R
Rd
∆x
2
Jr − Jl
Jr + Jl
. (5.51)The urrent Ji at the point xi will see the impedan eRl(i) ‖ Rr(i) =
Rd
n + 1
((n + 1)2
4− i2
)
. (5.52)5.4.1 2D Proportional Resistor NetworkIt was shown that the generalization to higher dimensions in the ase of Anger's solution is straightforward.For the proportional resistor hain approa h however, one fa es a situation where the ele troni implemen-tation of higher-dimensional dete tor-readouts is easy, but it is very di ult to give expli it expressionsfor the entroids as fun tions of the used resistor values and number of anode segments. To a hieve posi-tional sensitivity for two dimensions Borkowski et al. [144 proposed a ir uit onguration that was laterdis retized by Siegel et al. [145 and whi h is shown in gure 5.8. In this onguration, the urrents fromthe dierent sour es are inje ted into the inter onne tion points of m (horizontal) 1D-proportional resistor- hains, where m is the number of anode-segments along the y spatial dire tion. Equivalently, n denotesthe number of anode segments along the x spatial dire tion. The urrents along one horizontal resistor hain are divided and superposed a ording to equations (5.48-5.49) of se tion 5.4. Now one has 2m su h urrents J l1, J
l2, . . . , J
lm and Jr
1 , Jr2 , . . . , Jr
m that are inje ted into the two verti al resistor hains where theyare divided and superposed as in the 1D ase. However, ontrary to this ase, the horizontal sum urrentsJ l
1, Jl2, . . . , J
lm and Jr
1 , Jr2 , . . . , Jr
m do not see the same impedan e to ground. A ording to (5.52), they willsee approximatelyRImp(j) ≈ Ru(j) ‖ Rd(j) =
Rv
m + 1
((m + 1)2
4− j2
) (5.53)66

5 Enhan ed Charge Dividing Cir uitsPSfrag repla ements Rv
Rv
Rv
Rv
Rv
Rv Rv
Rv
Rv
Rv
Rv
Rv
RhRhRhRh
RhRhRhRh
Rh Rh Rh Rh
RhRhRhRh Rh1Rh1
Rh2 Rh2
RhmRhm
Rhm−1Rhm−1
JA JB
JCJD
Ji1j1 Ji2j1
Ji1j2 Ji2j2
Jinjm
Jij
J l1
J l2
J lm
J lm−1
Jr1
Jr2
Jrm
Jrm−1
Figure 5.8: Two-dimensional proportional resistor network for a PSPMTwith a n × m matrix of anode pads. The position indexes are given byil = l − 1+n
2 , l ∈ [1, 2, . . . , n] and jl = l − 1+m2 , l ∈ [1, 2, . . . , m].instead, if Rv ≪ Rh. Therefore, the equations (5.48-5.49) have to be modied in order to orre tly des ribethe a tual harge division that takes into a ount the lateral impedan e Ru(j) ‖ Rd(j):
Jl (i, j) =
(1
2− iRd
(n − 1)Rd + 2RImp(j)
)
Ji and Jr (i, j) =
(1
2+
iRd
(n − 1)Rd + 2RImp(j)
)
Ji. (5.54)The j dependen e in equation (5.54) will propagate through the rest of the derivation for the entroidsand nally results in a nonlinear positioning behavior. Fortunately, one an re-linearize the behavior of thenetwork by varying the value of the lateral horizontal resistors Rh1 , Rh2 , . . . , Rhm in gure 5.8 (Siegel et al.[145). However, the fa t that there are losed loops within this ir uitry adds a new order of omplexityto the problem and makes a general des ription for N dimension, by expli it expression for the entroidsas a fun tion of the number of anode-segments per dimension and the position index rather ompli ated.The solution an be found by network analysis using the bran h urrent method. In this method, oneestablishes a set of equations that des ribes the relationship of the urrents and voltages to ea h otherthrough Kir hho's urrent law and Ohm's law. This set of algebrai equations an be solved, giving theexa t urrents and voltages at ea h node of the network.As a rst step, one has to ompute the lateral horizontal resistor values Rh1 , Rh2 , . . . , Rhm in order tore over the linearity of the 2D-proportional positioning network. Sin e the position-sensitive multi-anodephotomultiplier tube H8500 [146 from Hamamatsu Photoni s Co. was used for the experimental validationof the ndings in this se tion, it is done here for the spa ial ase of n = m = 8 (refer to gure 5.9). Considerthe ase where, of all 64 anode-segments, only one is a tive, and that the a tive is one of the rst row in67

5.4 Proportional Resistor Chains
PSfrag repla ements
Rv Rv Rv Rv Rv Rv Rv Rv Rv
RvRvRvRvRvRvRvRvRv
7Rh7Rh7Rh7Rh7Rh7Rh7Rh
Rh1
Rh1Rh2
Rh2Rh2
Rh2 Rh3
Rh3Rh3
Rh3 Rh4
Rh4Rh4
Rh4
Rl
Rr
JA
JB JC
JD
JU
U r1 U r
2 U r3 U r
4 U r5 U r
6 U r7 U r
8
U l1 U l
2 U l3 U l
4 U l5 U l
6 U l7 U l
8Figure 5.9: Ele tri ir uit with naming onvention for the omputation ofthe lateral resistors.gure 5.8 (or the rst olumn in gure 5.9 respe tively). Then the following set of equations is obtained:U − U r
1
Rr+
U − U l1
Rl
!= J
U r1
Rv+
U r1 − U r
2
Rv− U − U r
1
Rr
!= 0
U l1
Rv− U l
1 − U l2
Rv− U − U l
1
Rl
!= 0
U lj+1 − U l
j
Rv+
U lj+1 − U r
j+1
7Rh + 2Rhj+1
+U l
j+1 − U lj+2
Rv
!= 0
U rj+1 − U r
j
Rv−
U lj+1 − U r
j+1
7Rh + 2Rhj+1
+U r
j+1 − U rj+2
Rv
!= 0
U l8 − U l
7
Rv+
U l8 − U r
8
7Rh + 2Rh8
+U l
8
Rv
!= 0
U r8 − U r
7
Rv− U l
8 − U r8
7Rh + 2Rh8
+U r
8
Rv
!= 0
with j ∈ [1, 2, . . . , 6]
Rh8 = Rh1
Rh7 = Rh2
Rh6 = Rh3
Rh5 = Rh4
(5.55)The equations Rh9−j = Rhj , j ∈ [1, 2, 3, 4] are valid due to the symmetry of the harge dividing ir uit.If the system (5.55) is solved, the four urrents JA, JB, JC , and JD an be expressed as fun tions of thedierent resistor values and J . The entroids are omputed from these urrents using equations (5.50) that an be naturally adapted to the 2D ase as follows:
〈j〉 = cjJA + JB − (JC + JD)
JA + JB + JC + JDand 〈i〉 = ci
JB + JC − (JA + JD)
JA + JB + JC + JD, (5.56)where the onstants ci and cj still have to be determined. If one further onstrains this set of equations with
Rr = Rh1 and Rl = 7Rh +Rh1 , one gets the onstant value of 7/9 for 〈j〉 independent of any resistor value.For the expe tation value 〈i〉, a quotient of polynomials in Rv, Rh1 −Rh4 and R1 is obtained. However, thisvalue is supposed to give the same value as 〈j〉 owing to the symmetry of the network and the requirementthat it behaves in the same manner for both spatial dire tions. Repeating this pro edure three times with urrents only at the positions (i, j) = (5/2, 5/2), (i, j) = (3/2, 3/2), and (i, j) = (1/2, 1/2), one gets a newset of 4 equations, whose solution gives the values for the lateral horizontal resistors.Rh1 = Rh8 = Rh − 4Rv, Rh2 = Rh7 = Rh − 7Rv
Rh3 = Rh6 = Rh − 9Rv, Rh4 = Rh5 = Rh − 10Rv(5.57)They an be parameterized in the following way:
Rnhl
=l
2(l − (n + 1)) , with l ∈ [1, 2, . . . , n] (5.58)68

5 Enhan ed Charge Dividing Cir uitsorRn
hl=
1
2
(
l2 − (n + 1)2
4
)
, with l ∈ [1 − np
2, . . . ,
n − 1
2]. (5.59)Equations (5.58) and (5.59) have been veried for the ases n = m and n, m ∈ [2, 4, 6, 8, 10]. On e the2D-proportional resistor network has been linearized, one an determine the two proportionality onstants
ci and cj . This an be done in exa tly the same way as the linearization of the network, but repla ingthe resistan es seen by the inje ted urrent to its left and right by Rl = (7/2 + i)Rh + Rhj and Rr =(7/2− i)Rh +Rhj in equations (5.55) and using the results (5.57). In analogy to (5.51), for the expe tationvalues of x and y one obtains
〈x〉 = ∆x9
2
JB + JC − (JA + JD)
JA + JB + JC + JD, 〈y〉 = ∆y
9
2
JA + JB − (JC + JD)
JA + JB + JC + JD. (5.60)Note that the fa tors 9/2 oin ide with (n + 1)/2 for the ase n = 8. However, the general validity of thisexpression for arbitrary n has not been proved here.The set of equations (5.55) an equally be used to determine the impedan e of the network of ea h ofits 64 inputs. For this, one solves equations (5.55) and its three equivalents when the urrent is inje tedin rows 2,3 and 4 for the voltage U at the inje tion point. By virtue of Ohm's law and together with theinje ted urrent J , this is equivalent to the impedan e. The other 4 rows are given impli itly due to thesymmetry of the network.One obtains 4 equations for the impedan es at the dierent inter onne tion points along the horizontalresistor hains whi h are given in Appendix C. An expli it parameterization in the position indexes i and
j an be given for the ase reported by (Siegel et al. [145) with Rh = 10Rv:RImp(i, j) =
5
18
(81 − 4i2
)Rv +
(a2j
2 + a0 + i2(b6j
6 + b4j4 + b2j
2 + b0
))Rv, (5.61)with the parameter values
a0 = − 6316 , a2 = − 7
36 , b0 ≈ 0.24, b2 ≈ 0.015, b4 ≈ 0.19 · 10−3, b6 ≈ 0.19 · 10−5. (5.62)Equation (5.61) shows that the quadrati dependen e of RImp(i, j) is reprodu ed only for the x spatialdire tion, i.e. j = const ., while the y spatial dire tion in ludes O(j4), manifesting in this way the antisym-metry of the network in both spatial dire tions. Note that the behavior is not due to the linearization ofthe position response by varying the lateral horizontal resistor values Rhj . If all Rhj are set to Rh, one willobtain the following parameter valuesa0 = 9
8 , a2 = − 118 , b0 ≈ 0.048, b2 ≈ 0.0021, b4 ≈ 0.15 · 10−4, b6 ≈ 0.47 · 10−7, (5.63)that still ontain higher than quadrati orders in j. Note that approximate values of the parameters b0, b2, b4and b6 are given here for learity although they an be omputed exa tly. They are given in Appendix C.5.5 Hybrid SolutionThe third and last possible implementation of the CoG algorithm using harge divider ir uits is the ombination of both previous methods (Siegel et al. [145). Clearly there an be no hybrid version forone dimension. Instead, the dierent previously mentioned approa hes are applied to dierent spatialdimensions in the ir uit. This is shown in gure 5.10 for the 2D- ase.As dis ussed in se tion 5.1.3, it is possible to read the urrents JA, JB, JC and JD with shunt feedba ktransresistan e ampliers that have an input resistan e ZIn of virtually 0 Ω. In this ase, the horizontalresistor hains in gure 5.10 de ouple among ea h other and an be treated separately a ording to se -tion 5.4. It was also shown that all resistors, in luding both at the hain ends, need to have the same valuein order to obtain orre t results from equations (5.50-5.52). This an be assured using equations (5.40) ofse tion 5.3, where the positioning properties for the verti al omponent in gure 5.10 were also dis ussed.Choosing the following values for Ru
j and Rdj of the y spatial dire tion harge dividers:
Ruj =
Rh
12 − j
m+1
and Rdj =
Rh
12 + j
m+1
, (5.64)69

5.6 Simultaneous Measurement of the Se ond MomentPSfrag repla ementsRd
1Rd1
Rd2Rd
2
Ru1Ru
1
Ru2Ru
2
RhRh
RhRh
RhRh
RhRh Rh
RhRhRhRh
RhRhRhRh
Rh Rh Rh Rh
RhRhRh
RumRu
m
RdmRd
m
Rum−1Ru
m−1
Rdm−1Rd
m−1
JA JB
JCJD
Ji1j1 Ji2j1
Ji1j2 Ji2j2
Jinjm
Jij
J l1
J l2
J lm
J lm−1
Jr1
Jr2
Jrm
Jrm−1
Figure 5.10: Cir uit for the 2D hybrid harge dividing readout proposed by(Siegel et al. [145). It uses m horizontal resistor hains for the x- entroidand Anger urrent s aling for the other spatial dire tion.the expressions for the entroids along the x- and y-spatial dire tions give〈x〉 = ∆x
n + 1
2
JB + JC − JA − JD
JA + JB + JC + JD, 〈y〉 = ∆y
m + 1
2
JA + JB − JC − JD
JA + JB + JC + JD. (5.65)Along the x-spatial dire tion, the impedan e of the hybrid- ir uit inputs is the same as for the 1D pro-portional resistor hain given by equation (5.52). It does not depend, however, on the index j for the
y-spatial dire tion, sin e this was the onstraint for nding expression (5.64). Thus one obtains for theinput impedan e of the hybrid solutionRIn(i, j) =
Rh
n + 1
((n + 1)2
4− i2
)
. (5.66)Siegel et al. state that the positioning performan e of the three ir uits is quite similar. Therefore, thenatural onsequen e of hoosing one of the three versions is to onsider the omplexity of implementationand their ost as the most important riteria. In this ase, the lear favorite is the multidimensional versionof the proportional resistor hain. First, it is the version whi h an be managed with fewest resistors; onlym(n + 1) + 2(m + 1) omponents are required. Se ond, there are no rossing wires in the ir uit whi heases the layout onsiderably and allows for a ompa t design. The most expensive solution is the proposalfrom Anger. It requires 4nm resistors and a more ompli ated layout. The hybrid solution gets by withm(n + 1) + 4m resistors.5.6 Simultaneous Measurement of the Se ond MomentAfter the dis ussion of how the entroids of a distribution an be measured with dierent harge dividing ir uits, the emphasis is now put on the se ond moment. The motivation for measuring this moment isjustied by the fa t that the square root of the entered se ond moment is an ex ellent measure for thewidth of a distribution fun tion. It was dis ussed in detail in se tion 4 that there is a strong orrelationbetween the γ-ray's depth of intera tion within thi k rystals and the indu ed s intillation light distribution70

5 Enhan ed Charge Dividing Cir uits+
-
PSfrag repla ementsR1
Ri
Rn
Rc
Rf
Cc
CfU1
Ui
Un
UOut
OP
(a) Standard onguration of ananalogue adder ir uit.+
-
+-
+-
+-
PSfrag repla ementsR1
Ri
Rn
Rc
Rf
Cc
Cf
U1
Ui
UnUOut
OP
(b) Conguration with voltage follower fora high input impedan e of the individualbran hes.
PSfrag repla ementsJA JB JC JD
∑
J1,1
Jn,mCDRPSPMT adder
( ) Blo k-diagram of the om-bined summation and hargedividing ir uit.Figure 5.11: Inverting amplier onguration used as summation amplier.The ontributions of the voltages Ui to the output voltages an be adjustedwith the resistors Ri and Rf . Cf is required for phase orre tion and Cc||Rcfor oset orre tion.observed at the sensitive area of a photodete tor. Using this ee t for depth of intera tion determination hasbeen proposed at various times and by dierent resear hers (refer to se tion 3.4.1). However, the problem onsists of how to implement this measurement in the dete tor ele troni s, while simultaneously meetingall typi al requirements su h as fast measurement, low omputational eort, low osts and su ientlygood measurement. Observing the impedan es seen by the urrents fed into the harge dividing ir uits(equations 5.39, 5.52 and 5.66) a possible solution be omes quite obvious. Sin e the impedan es arequadrati ally en oded with the inje tion position and owing to Ohm's law one has U = RJ , one alreadydisposes of the orre t weighting for the sampled distribution and the only step that remains is to do thesummation over these voltages. This an be done with a standard onguration of a summation amplierexplained in ele troni s textbooks and shown in gure 5.11(a).The output voltage of this ir uit is the sum of the input voltages Ui, weighted by −Rf/Ri:UOut = −Rf
n∑
i=1
Ui
Ri. (5.67)Theoreti ally there is no upper limit on the number of individual inputs Un when the ele troni omponentsbehave as ideal ones. In pra ti e, however, this limit is imposed by the thermal noise of the resistors
R1, R2, . . . , Rn and the maximal output voltage swing of the operational amplier used. The spe traldensity for the noise for ea h ohmi resistan e Ri in gure 5.11 is given by |Unoisei (f)|2 = 4kBTRi, where
kB is the Boltzmann onstant and T the absolute temperature. After integration over all frequen ies, oneobtains the measurable ee tive noise. For this, the parasiti apa itan e CpRi
of ea h resistan e Ri has tobe taken into a ount whi h results in |Unoisei (f)| → 0 for f → ∞, ensuring the onvergen e of the integral.
Unoise,effi =
√
kBT
CpRi
. (5.68)Equation (5.68) holds for ea h resistan e used in the ongurations of gure 5.11 and also the impedan es(equations 5.39, 5.52 and 5.66) of the entroid networks. For ambient temperature and a typi al apa itan eof 0.2pF, equation (5.68) gives an ee tive noise of approximately 150µV, whi h is three orders of magnitudebelow the given signal level. A more important onstraint is given by the maximal output voltage swingthat an be delivered by the operational amplier used. With an adequate hoi e of Rf , one has to ensurethat UOut is always smaller than this devi e parameter, otherwise the operational amplier saturates anddistorts the signal.The impedan e RIni of the inputs of the summing amplier is approximately given by their inputresistan e Ri. Sin e RIni is onne ted in parallel to the impedan es (5.39), (5.52) and (5.66) of the networks71

5.6 Simultaneous Measurement of the Se ond Momentfor the transverse positioning, the desired quadrati dependen e gets distorted. In order to minimize thisee t, one has to hoose the individual RIni very large ompared to the impedan es at the dierent inputsof the harge dividing ir uits. Alternatively one an use the adder onguration of gure 5.11(b). In thisversion, ea h input of the summation amplier is buered with a voltage follower des ribed in se tion 5.1.3.In this way, one is able to realize very high input impedan es that are also independent of the weightsof the adder. However, the large number of required operational ampliers an pose thermal and power onsumption problems on this solution.The resistan e Rc in gures 5.11 is required for oset ompensation (Tietze and S henk [142). Sin ethe inverting terminal of the operational amplier is onne ted to virtual ground when using the inverting onguration, the input urrent auses an oset voltage UOff = IInRf at the output of of the amplier.This oset voltage an be ompensated by a resistan e Rc of value
Rc =
(
1
Rf+
n∑
i=1
1
Ri
)−1 (5.69)and onne ted as displayed in gures 5.11. In order not to introdu e additional noise with this resistor,the apa ity Cc is onne ted in parallel to Rc, shortening by this means all signal omponents with non-vanishing frequen ies. Similarly, Cf is not required for the orre t working of the method of determiningthe se ond moments, but is needed for ompensation of the non-ideal behavior of the amplier onguration(Fran o [147). It avoids os illations of the operational amplier aused by stray apa ities at the invertingterminal.The summation ampliers of gure 5.11 an be atta hed to any of the three dis ussed harge dividing ir uits as shown in gure 5.11( ). One an use the values of the individual Ri to adapt the summationamplier to the parti ular requirements of ea h of the three harge dividing ir uits. The value of Rf an be used to adjust the ampli ation of the sum signal for avoiding saturations of the operationalamplier. Throughout the remaining part of this work, only implementations of the summation ir uitshown in gure 5.11(a) will be onsidered. This onguration was preferred to the buered version shownin gure 5.11(b), whi h is ompli ated to realize in pra ti e. The n×m voltage follower requires spa e andimpedes the development of a simple ir uit layout. On the other hand, the power onsumption of ea hof the required n × m operational ampliers imposes a serious design problem. A very low supply urrentof 15 mA already leads to an overall onsumption of approximately 1A required for the buers when aposition sensitive photodete tor with 8× 8 anode-segment is used. For this and other reasons, the solutionproposed in gure 5.11(b) is more suitable for ASICs (appli ation-spe i integrated ir uits).As an important disadvantage, one introdu es a systemati error when omputing the se ond momentusing the ir uit in gure 5.11(a), sin e the urrent oming from the anode-segment of the photodete torwill see the input impedan e of the summation amplier in parallel to that of the harge dividing ir uit.This leads not only to improper weights for the signal distribution but also extra ts urrents from the hargedividing ir uit for the transverse positioning. In order to minimize this ee t, the weighting resistors Riof the summation amplier have to be hosen as large as possible. Here, the fabri ation toleran e of 1% ofthe standard SMD-resistors used an serve for a reasonable design riterion. If one hooses the weightingresistors Ri at least 100 times larger than the smallest input impedan e of all the inputs of the hargedividing ir uit, the errors introdu ed in the entroid and the se ond moment will be smaller than 1% fora 1D resistor hain.5.6.1 Anger Logi In the ase of the true Anger Logi , the appli ation of the analogue summation ir uit is straightforward.The spe i design of this ir uit, whi h uses an individual harge divider for ea h urrent from the anode-segments, produ es a ompletely de oupled set of input voltages for the summation ir uit sin e the output urrents of the Anger logi are onne ted to virtual ground (refer to gure 5.6(a)). One now has twopossibilities to obtain a quadrati weighting of the signal distribution. Choosing the resistor values for the harge divider a ording to equations (5.44), i.e. the same input impedan e for all CDR inputs, impliesthe implementation of the quadrati dependen e using the resistors Ri of the summation ir uit. By virtueof equation (5.67) and the onstant input impedan e RCDRIn of the Anger logi the relative values of thesummation weights Rij are given by
Rij ∝ RCDRIn Rf
x2i + y2
i
. (5.70)72

5 Enhan ed Charge Dividing Cir uitsPSfrag repla ements
i:∆x
xx = 0xi
R1 Rn+1 JrightJleft
Ji
Rd
1−n2
n−12
12− 3
2 − 12
32
anode 1 anode n
UijUi,i
Figure 5.12: S hemati diagram of the resistor hain and naming onven-tions for the omputation of the sum of the voltage fra tion indu ed by theinje ted urrent Ji.Note that equation (5.70) has a singularity at (xi, yi) = (0, 0), i.e. for this position one would obtainRij = ∞. In pra ti e, this requirement an be implemented by omitting this resistor, that is to say, onedoes not in lude this value into the weighted sum in the same manner as this value is ex luded in themathemati al denitions (5.7)-(5.9) for xi = 0 ∀ i ∈ [1, n]. In the majority of the ases, however, thereis no reason for this onsideration, sin e most position-sensitive photodete tors have an even number ofdete tion segments. Also one subsequently has to invert the signal sin e summing ampliers are realizedby the inverting onguration of operational ampliers. For the determination of the absolute values ofthe Rij one an use the above-mentioned design riterion of adjusting the minimal systemati error to theresistor toleran e.The se ond implementation onguration is given by equations (5.45). Here, the quadrati impedan evariation seen by the anode- urrents is inherently in orporated into the harge divider. One therefore hasto give all summands the same weights with one single value Rij = R. On e again the error- riterion forthe determination of the absolute values an be used.5.6.2 Proportional Resistor ChainsIn the ase of the proportional resistor hains, the omputation of the se ond moment using the des ribedsummation amplier is not as trivial as in the ase of the true Anger logi . The reason lies in the fa tthat all resistors are used to generate the weights for ea h position. Therefore, the harge dividing ir uitdoes not de ouple the voltages produ ed by the input urrents over the impedan es of the network fromtheir neighborhood. Fortunately, this does not avert the su essful omputation of the se ond moment butmakes the mathemati al des ription more ompli ated. First the one-dimensional ase is studied, sin e forthis it is possible to nd an expli it and exa t expression for the summed voltage. Furthermore, it is ofinterest for the hybrid ase. Based on this result, approximate solutions for the two-dimensional ase anbe found.One-Dimensional CaseFirst, the situation that indu es a urrent Ji inje ted at a single but arbitrary anode of index i withi ∈ [1−n
2 ; n−12 ] is onsidered. Owing to Ohm's law, the voltage Ui,i seen at this same position is just theprodu t of the urrent Ji and the impedan e to ground, i.e. Rl(i) ‖ Rr(i) given in equation (5.52):
Ui,i =JiRh
n + 1
((n + 1)2
4− i2
)
= Ji R
(
1
4−(
Rh
R
)2
i2
)
, (5.71)where R = Rh(n + 1) was used for the last step. As in the se ond ase of the Anger logi , the requiredquadrati dependen e is inherently in orporated into the harge divider. However, an atta hed summationamplier would not give just the sum of all Ui,i with i ∈ [ 1−n2 ; n−1
2 ] sin e the resistor hain in gure 5.12would a t as a voltage divider for the Ui,i. Therefore the onne ted analogue adder will see and add Ui,iand all Ui,j with j 6= i; i, j ∈ [ 1−n2 ; n−1
2 ] that appear due to the urrent Ji at all inter onne tion points73

5.6 Simultaneous Measurement of the Se ond Momentj 6= i. Sin e all resistors of the hain have the same value, the voltage fra tions Uj≤i and Uj>i to the leftand to the right of the inje tion position i are given by
Uj≤i = Ui,ij
iand Uj>i = Ui,i
j
n + 1 − i. (5.72)As a onsequen e of the superposition prin iple, the adder sums up all voltage fra tions Ui,j (in luding
Ui,i) of all Ji. Additionally ea h summand will be amplied by the (same) weight −Rf/Rs. Therefore onehas to sum over all i and all j:UΣ ≈ −Rf
Rs
n∑
i,j
Ui,j . (5.73)Equation (5.73) an only be an approximation sin e the nite impedan e of the summing amplier's inputswas not taken into a ount. However, this approximation is su iently good if the adder version ofgure 5.11(b) is used. If one onsiders for a moment the situation where the urrent Ji is only inje ted atone position, then the sum over i ollapses. The remaining sum over j readsUi ≈ −Rf
Rs
∑
j
Ui,j = −Rf
RsUi,i
1
i
i∑
j=1
j +1
n − i + 1
n−i∑
j=1
j
= −Ui,iRf
Rs
n + 1
2= −Ui,i
RfR
2RsRh, (5.74)where the sum of the arithmeti series was omputed in the next to last step. Note that we did not imposeany restri tion on where the urrent is inje ted, so the ontribution of this partial sum to the ompletesum (5.73) is the same onstant fa tor for all inje tion points i. It is this parti ular detail that allows the omputation of the se ond moment by atta hing a summing amplier to the proportional resistor hainand hybrid harge divider. Besides, it leads to an additional ampli ation of (n+1)/2 of the voltage signal
Ui,i sin e n fra tions are fed into the summing amplier. For a signal omposed of various Ji with dierenti, the sum over i gives
UΣ ≈∑
i
Ui = − RfR2
2RsRh
(
1
4
∑
i
Ji −(
Rh
R
)2∑
i
i2Ji
)
. (5.75)The se ond moment an be normalized by virtue of equations (5.50). However, one has to take into a ountthat the ele troni hannel and ampliers for the voltage sum UΣ and the urrents Jr and Jl in generalexhibit unequal ampli ations gJ and gΣ due to dierent design requirements. One nally getsUΣ
J≈ |gΣ|RfR2
2|gJ |RsRh
(
1
4−(
Rh
R
)2 ∑
i i2Ji∑
i Ji
)
, (5.76)whi h an be solved for the wanted se ond moment of the set of urrents Ji:∑
i i2Ji∑
i Ji≈ R2
4R2h
− 2|gJ |Rs
|gΣ|RfRh
UΣ
Jr + Jl(5.77)and
∑
i x2i Ji
∑
i Ji≈ ∆x2
(R2
4R2h
− 2|gJ |Rs
|gΣ|RfRh
UΣ
Jr + Jl
) (5.78)respe tively.For the simpler implementation version of the summing amplier (refer to gure 5.11(a)), an exa tsolution for the voltage sum an be found, where exa t means that all ele troni omponents are onsideredas ideal. That is to say, the input impedan e of ea h input is exa tly given by Rs (refer to gure 5.13).With the bran h urrent method for analysis of the network (gure 5.13), an expli it solution for the inputimpedan e at the onne tion i an be found:RIn
i =Rd
n + 1
((n + 1)2
4− i2
)
κI(i, ε); (5.79)74

5 Enhan ed Charge Dividing Cir uits+
-
PSfrag repla ementsRhRhRhRhRhRhRh
RsRsRsRsRsRsRsRs Rf
RhRh RIn1 RIn
i RIn8
OpAmpFigure 5.13: One dimensional proportional resistor hain for 8 anodes. Foran ideal operational amplier, signals that feed into its inverting terminal an be treated as if they were onne ted to ground (dashed line inside theamplier). In this ase one an ompute the voltages at ea h onne tion ofthe resistor network.κI(i, ε) = a0 + a2 i2 + a4 i4 + a6 i6;
a0 =(ε + 2)(ε(ε + 4)(ε(ε + 4)(3637ε(ε + 4) + 25504) + 54528) + 36864)
8192(ε + 1)(ε + 3) (ε(ε + 3)2 + 1) (ε(ε + 3)2 + 3),
a2 =ε(ε + 2)(ε + 4)(ε(ε + 4)(1731ε(ε + 4) + 10304) + 26880)
71680(ε + 1)(ε + 3) (ε(ε + 3)2 + 1) (ε(ε + 3)2 + 3),
a4 = − ε2(ε + 2)(ε + 4)2(3ε(ε + 4) − 224)
17920(ε + 1)(ε + 3) (ε(ε + 3)2 + 1) (ε(ε + 3)2 + 3),
a6 =ε3(ε + 2)(ε + 4)3
4480(ε + 1)(ε + 3) (ε(ε + 3)2 + 1) (ε(ε + 3)2 + 3),
(5.80)with ε = Rh/Rs. As expe ted, κI(i, ε) tends to unity for a vanishing ε, and for ε . 0.002 one an makeκI(i, ε) & 99/100. Similarly, an impli it and exa t expression for the sum-voltage UΣ
i that is generated atthe output of the operational amplier by a single urrent Ji at the position i an be omputed.UΣ
i
Ji= −RfRd
2Rs
((n + 1)2
4− i2
)
κII(i, ε) (5.81)κII(i, ε) =
(64i6 − 48i4 + 6924i2 + 127295
)ε3
1290240+
(16i4 + 184i2 + 3985
)ε2
5760+ 1
48
(4i2 + 71
)ε + 1
(ε + 1) (ε(ε + 3)2 + 1) (5.82)Also κII(i, ε) in equation (5.81) tends to unity if ε vanishes. However, the errors in ea h input impedan eget summed up and one now has to assure that ε . 0.001 if one requires a deviation smaller than 1%from the ideal sum-voltage that would have been obtained with a summing amplier with innite inputimpedan e. If a ompound signal onsisting of various Ji at dierent positions is applied to the hargedivider their ontributions are superposed. Thus, the sum over i has to be performed as follows:UΣ = −RfRd
2Rs
∑
i
[
Ji
((n + 1)2
4− i2
)
κII(i, ε)] . (5.83)Two-Dimensional CaseFor the two-dimensional ase of the harge dividing ir uit with proportional resistor hains it be omesrather di ult to nd an expli it expression for the voltage sum. As for the one-dimensional ase, a urrent75

5.6 Simultaneous Measurement of the Se ond MomentJij inje ted at an arbitrary input (i, j) of the network auses not only a voltage Uij
3 at this input but alsowell-dened fra tions at all the other inputs sin e they are oupled among themselves through the weightingresistors for the rst and se ond moments. This leads to a distortion of the desired quadrati weighting forthe summing amplier that is dierent for both spatial dire tions and that an be orre ted only partially.An additional disadvantage is that the expressions that des ribe the dependen y of the quantity of intereston the onguration of the harge divider are omplex. Therefore it is a lear advantage of the true Angerlogi that ea h input has their harge dividing resistors for its own and that an exa t quadrati weighting an be implemented in this ase.An important point is that the ele troni onguration of the proportional resistor network breaks thesymmetry with respe t to rotations by 90°within the x-y-plane. It was shown in se tion 5.4.1 that oneis able to orre t this symmetry breaking for the determination of both entroids. The input impedan ehowever, whi h is used for the determination of the se ond moment of the signal distribution, shows a ratherdierent fun tional dependen e along both spatial dire tions. Instead of the desired variation proportionalto (i2 + j2), the position dependent impedan e (5.61) was obtained. Unfortunately, one annot adjust thedierent resistor values of the network in order to obtain the desired behavior as was done for the trueanger logi , sin e this would ae t the omputation of the entroids. Clearly one also nds this unequalbehavior in the voltage sum that is needed for the measurement of the se ond moment. Nevertheless, thesumming amplier itself gives us the possibility to nearly regain symmetri behavior of the voltage sum. Ifan analogue adder, as shown in gures 5.11(a) or 5.11(b), is atta hed to the proportional resistor networkof gure 5.8, one an give ea h row of signals a dierent weight (see equation 5.67). But, as shown in theprevious se tion, along ea h row the weights of summing amplier have to be the same sin e this is thespatial dire tion for whi h the 2D-proportional network intrinsi ally shows quadrati position en oding.First onsider the bare 2D-proportional resistor network and suppose that an ideal summing amplieris atta hed to it, i.e. with RIni,j = ∞. A network analysis now gives a oupled linear system of 76 equationsand 76 unknowns. A general solution depending on the dierent resistor values is very hard to nd and theresult would be probably mu h more omplex than the exa t solutions for the 1D-resistor hain (equations5.79 and 5.81 in se tion 5.6.2). For this reason and within the s ope of this work, only a solution for thespe i ase of the harge divider onguration reported in ase B of Siegel et al. [145 is given; (that is:
8× 8 anode-segments, Rh = 10Rv and the orresponding values given in equation 5.57). For other network ongurations, a solution an be found in an analogous way.The voltage that an be observed at the output of the (ideal) summing amplier of unity gain for allrows when the single urrent Jij is inje ted into the harge divider at the position (i, j) was found to beUΣ
ij = −5
(81
4− i2
)
RvJij . (5.84)While the olumn index has the desired quadrati behavior, the row index j does not even appear inequation (5.84). Furthermore, a detailed omparison between this result and equation (5.75) brings outthat the only dieren e is a fa tor of ten. Figure 5.14 gives a graphi al representation of UΣij/RvJij . On eagain one has to sum over i and j if instead of the single urrent a omposite signal is applied.
UΣ = −5Rv
∑
i,j
(81
4− i2
)
Jij . (5.85)Note that the last obtained result (5.85) already allows for sensible measurement of the signal distri-bution's se ond moment. This is a dire t onsequen e of the rotational symmetry about an axis normal tothe x-y-plane and through the photo onversion point of the signal distribution generated by the dete tedγ-photon whi h was ommented on in se tion 4. Owing to this symmetry, a supposed resistor network withatta hed unity-gain summing amplier is able to su essfully measure the se ond moment of the distributionsin e they are equal along both spatial dire tions. The motivation for sear hing for a symmetri equivalentto equation (5.85) is founded on the possible maximization of the SNR of the measurement. An ele troni implementation of a quadrati variation for the j dire tion would lead to a highly in reased signal while3The notation for a `pun tual' urrent Jij and of the voltage Uij for the two-dimensional ases of the harge divider arenot to be onfused with the voltages Ui,j (equations 5.71-5.74) that will arise at positions j when the single urrent Ji isinje ted into position i of an one-dimensional resistor hain.76

5 Enhan ed Charge Dividing Cir uits-3.5
-2.5-1.5
-0.50.5
1.52.5
3.5-3.5
-2.5
-1.5
-0.5
0.51.52.53.5
40
60
80
100
-3.5-2.5
-1.5-0.5
0.51.5
2.5
PSfrag repla ements j
ii
UΣij
Jij
Figure 5.14: Dependen e of the voltage sum on the position of the inje ted urrent for the native 2D-proportional resistor network.the statisti al and ele troni errors remain the same. A tually, one already performs the sum over all the64 voltages, but be ause all rows have the same weight one will get no benet from the sum over the indexj. The summing amplier itself allows us to implement dierent weights for ea h row of the network byvarying the values of the input resistors R1, R2, . . . Rn of the ir uits shown in gures 5.11(a) and 5.11(b).As a riterion for the determination of these values, the symmetry behavior of the quadrati en oding ofthe anode-segments was used. For this, the voltage sum of the 64 inputs was omputed as a fun tion ofthe gains g1 = −Rf/RS1 , g2 = −Rf/RS2 , g3 = −Rf/RS3 and g4 = −Rf/RS4 . Here, RS1 , . . . , RS4 are theinput resistan es of the rst and eighth row, the se ond and seventh row, the third and sixth row and thefourth and the fth row. This hoi e already implements the desired symmetry with respe t to the enter ofthe network. For better larity, the summed voltage at the dierent inputs of the enhan ed harge dividernetwork is shown in matrix form:
UΣij = −JRvGij , (5.86)where the gain matrix Gij is given by
28g1 + 4 (g2 + g3 + g4) 58g1 + 4 (g2 + g3 + g4) 78g1 + 4 (g2 + g3 + g4) 88g1 + 4 (g2 + g3 + g4)20g2 + 4 (g1 + 2g3 + 2g4) 50g2 + 4 (g1 + 2g3 + 2g4) 70g2 + 4 (g1 + 2g3 + 2g4) 80g2 + 4 (g1 + 2g3 + 2g4)16g3 + 4 (g1 + 2g2 + 3g4) 46g3 + 4 (g1 + 2g2 + 3g4) 66g3 + 4 (g1 + 2g2 + 3g4) 76g3 + 4 (g1 + 2g2 + 3g4)4 (g1 + 2g2 + 3g3) + 16g4 4 (g1 + 2g2 + 3g3) + 46g4 4 (g1 + 2g2 + 3g3) + 66g4 4 (g1 + 2g2 + 3g3) + 76g4
· · ·... . . . .(5.87)The quadrants of the matrix whi h are not displayed have the same elements as the one shown but ina dierent order and a ording to the symmetry of the network. If one wants a se ond moment with sameweighting behavior along both dire tions i and j, one has to make the matrix Gij symmetri . Unfortunately,this is not possible and one have to settle for an approximate symmetry between the i and the j index.As possible Ansatz for nding an almost symmetri weighting matrix, one an require that at least onerow- olumn pair of (5.87) has the desired symmetry. This gives a linear system of 4 equations whi h anbe solved exa tly and as a fun tion of g4. One needs at least one degree of freedom left in order to adjustthe minimum input impedan e of all 64 inputs to a value that ensures the orre t working of the entroiddetermination.Sin e one is free in the hoi e of the olumn-row pair, there are 4 su h sets of equations and for all existunique but suboptimal solutions that dier from ea h other. To nd an optimum solution to the posedproblem, one an measure the asymmetry S[G] of the matrix as follows:S[G] =
√√√√∑
i,j
[Gij − Gji
Gij
]2
. (5.88)77
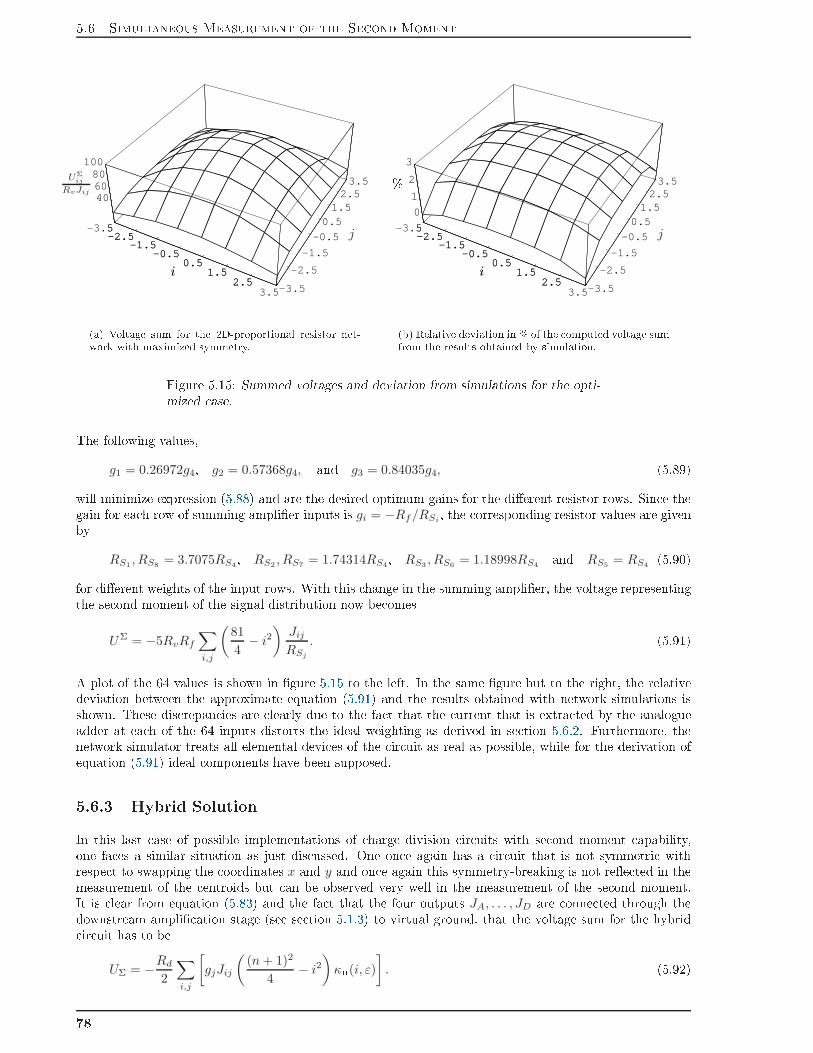
5.6 Simultaneous Measurement of the Se ond Moment-3.5
-2.5-1.5
-0.50.5
1.52.5
3.5-3.5
-2.5
-1.5
-0.5
0.51.52.53.5
406080
100
-3.5-2.5
-1.5-0.5
0.51.5
2.5
PSfrag repla ements j
ii
UΣij
RvJij
(a) Voltage sum for the 2D-proportional resistor net-work with maximized symmetry.-3.5
-2.5-1.5
-0.50.5
1.52.5
3.5-3.5
-2.5
-1.5
-0.5
0.51.52.53.5
0
1
2
3
-3.5-2.5
-1.5-0.5
0.51.5
2.5
PSfrag repla ements j
ii
%(b) Relative deviation in % of the omputed voltage sumfrom the results obtained by simulation.Figure 5.15: Summed voltages and deviation from simulations for the opti-mized ase.The following values,
g1 = 0.26972g4, g2 = 0.57368g4, and g3 = 0.84035g4, (5.89)will minimize expression (5.88) and are the desired optimum gains for the dierent resistor rows. Sin e thegain for ea h row of summing amplier inputs is gi = −Rf/RSi, the orresponding resistor values are givenbyRS1 , RS8 = 3.7075RS4, RS2 , RS7 = 1.74314RS4, RS3 , RS6 = 1.18998RS4 and RS5 = RS4 (5.90)for dierent weights of the input rows. With this hange in the summing amplier, the voltage representingthe se ond moment of the signal distribution now be omesUΣ = −5RvRf
∑
i,j
(81
4− i2
)Jij
RSj
. (5.91)A plot of the 64 values is shown in gure 5.15 to the left. In the same gure but to the right, the relativedeviation between the approximate equation (5.91) and the results obtained with network simulations isshown. These dis repan ies are learly due to the fa t that the urrent that is extra ted by the analogueadder at ea h of the 64 inputs distorts the ideal weighting as derived in se tion 5.6.2. Furthermore, thenetwork simulator treats all elemental devi es of the ir uit as real as possible, while for the derivation ofequation (5.91) ideal omponents have been supposed.5.6.3 Hybrid SolutionIn this last ase of possible implementations of harge division ir uits with se ond moment apability,one fa es a similar situation as just dis ussed. One on e again has a ir uit that is not symmetri withrespe t to swapping the oordinates x and y and on e again this symmetry-breaking is not ree ted in themeasurement of the entroids but an be observed very well in the measurement of the se ond moment.It is lear from equation (5.83) and the fa t that the four outputs JA, . . . , JD are onne ted through thedownstream ampli ation stage (see se tion 5.1.3) to virtual ground, that the voltage sum for the hybrid ir uit has to beUΣ = −Rd
2
∑
i,j
[
gjJij
((n + 1)2
4− i2
)
κII(i, ε)] . (5.92)78

5 Enhan ed Charge Dividing Cir uits-3.5
-2.5-1.5
-0.50.5
1.52.5
3.5-3.5
-2.5
-1.5
-0.5
0.51.52.53.5
02468
10
-3.5-2.5
-1.5-0.5
0.51.5
2.5
PSfrag repla ements j
ii
UΣij
RdGJij
(a) Voltage en oding for an 8 × 8 array of anode seg-ments when using the hybrid solution.-3.5
-2.5-1.5
-0.50.5
1.52.5
3.5-3.5
-2.5
-1.5
-0.5
0.51.52.53.5
012
3
-3.5-2.5
-1.5-0.5
0.51.5
2.5
PSfrag repla ements j
ii
%(b) Relative dieren e in % between theoreti model(equation 5.94) and simulation results for n = 8.Figure 5.16: Corre ted sum voltage for the hybrid harge divider ongura-tion.If one supposes a summing amplier of the se ond type (gure 5.11(b)), one an set κII(i, ε) = 1. Alter-natively one an equate κII(i, ε) ≃ 1 by hoosing the input resistors of the summing amplier su ientlylarge. κII(i, ε) an then be negle ted for the symmetrization of equation (5.92). This substantially easesthe symmetrization of equation (5.92). Sin e the rows of the hybrid ir uit (gure 5.10) de ouple from ea hother, for even n one only has to set
gj =4
n (n + 2)
((n + 1)2
4− j2
)
, (5.93)where the fa tor 4/(n(n+2)) has been derived from the requirement of unity gain for both entral rows, e.g.gn/2 = gn/2+1 = 1. For the ase of odd n, equation (5.93) has to be adjusted a ording to this situation.With the aid of the feedba k resistor Rf of the summing amplier, the global gain G = Rf/RSn/2
isintrodu ed and the symmetrized version of the sum voltage (5.92) readsUΣ = − 2RfRd
RSn/2n (n + 2)
∑
i,j
[
Jij
((n + 1)2
4− i2
)((n + 1)2
4− j2
)]
. (5.94)The voltage values are plotted in gure 5.16(a) for the ase of n = 8. As for the other results, ex-pression (5.94) for the voltage sum of the hybrid solution was veried with Spi e simulations (SimulationProgram with Integrated Cir uits Emphasis, see for instan e Tietze and S henk [142). The small dier-en es between the model and the simulations are shown in gure 5.16(b). They are mainly due to theapproximation made with κ(i, ε) = 1, that is, by the nite input impedan es of the summing amplier.5.7 Anode Inhomogeneity CompensationOne point that has not been onsidered so far are the dieren es in the response of the dierent anode-segments. For real devi es one learly annot expe t all the dete tion segments to behave in exa tly thesame manner. The deviation in the total sensitivity Stot , that denes the ratio of the anode urrent andthe in ident light ux an alter signi antly from one segment to another, espe ially for large size positionsensitive PMTs. Stot is generally an a umulation of various ee ts like the photo athode sensitivitySPC, the quantum e ien y QEPC, the photoele tron olle tion e ien y η, the gain GDyn of the ele tronmultiplier system and the anode sensitivity SAnode [136. The variation over the dete tor's spatial extensionof ea h of these fa tors is nally ree ted in the signal distribution at the output of the dete tor. Due79

5.7 Anode Inhomogeneity CompensationPSfrag repla ementsJij
Ruij
Rlij Rr
ij
Rdij
Rcij
J l Jr
Ju
Jd
J lij
J lij−1
J lij+1
Jrij
Jrij−1
Jrij+1
JuijJu
i−1j Jui+1j
JdijJd
i−1j Jdi+1j
(a) Passive ompensation method proposed by Tornai etal. [148 for use with the Anger positioning logi .
PSfrag repla ementsR1 R2 R3
RS1 RS2
αJ βJ
(1−α)βJ(1−β) αJ(b) Simplest non-trivial ase of proportional hargedividing resistor hains with intended passive om-pensation.PSfrag repla ementsR1 R2 R3
JlRS
J βJβJ
(1 − β)JJr( ) Spe ial ase 0 < β < α = 1, RS1
= RS andRS2
= ∞.Figure 5.17: Ele troni ongurations for passive ompensation of the spa-tial sensitivity inhomogeneity of photodete tors.to the large number of ontributions involved, the inhomogeneity of the sensitivity is mostly determinedexperimentally and provided by the manufa turer in the form of an anode uniformity map for ea h singledevi e.As shown in hapter 7, the normalized nontrivial moments that are intended to be measured with thepresented enhan ed harge division ir uits are nearly unae ted by these variations. This however doesnot apply to the 0th moment whi h represents the energy. In favor of a high intrinsi energy resolution,one is tempted to orre t for this dete tor inhomogeneity. In systems that digitize all hannels of the usedphotodete tor independently, the way to go would be a software orre tion of these aberrations from theiroptimal behavior. In the present ase, many omputation steps are performed analogi ally and the dete tor- aused inhomogeneity of the signal results in a systemati error of these omputations. The problem anbe solved satisfyingly with additional a tive ele troni omponents or, in the ase of the Anger logi , witha passive ompensation of the anode inhomogeneity.5.7.1 Passive CompensationThe true Anger logi des ribed in se tion 5.3 has the already mentioned advantage that ea h anode-segmenthas its own independent harge divider. Therefore it is possible to onne t a (dierent) orre tion shuntRc
ij as shown in gure 5.17(a) at ea h input of the Anger logi (Tornai et al. [148). The value of Rcij that isrequired for the ompensation of the anode inhomogeneity an be easily omputed from the manufa turer'sanode uniformity map and the input impedan e of the Anger logi at the respe tive position a ording to
RIn =
(
1
Ruij
+1
Rlij
+1
Rdij
+1
Rrij
)−1
. (5.95)For the proportional resistor hain and its derived positioning ir uits, this ompensation method annotbe used. This an be demonstrated for the simple ase of a 1D-resistor hain of two inputs shown in gure80

5 Enhan ed Charge Dividing Cir uits5.17(b). Suppose that the two anode-segments whose signals αJ and βJ are fed into this harge divider areof dierent strength, e.g. α 6= β, and are wanted to be equalized. Without loss of generality one an furtherassume that 0 < β < α = 1. The passive ompensation works by redu ing all signals of the photodete torto the strength of the lowest one. Therefore one en ounters the situation shown in gure 5.17( ). A rst ondition on the values of the resistors R1, R2, R3 and RS is given by the fa t that the omputation of therst moment requires linear weights for the urrents J and βJ . Therefore, the onditionR2 = R3 =
R1RS
R1 + RS(5.96)has to be fullled. In order to equalize both urrents J and βJ , the fra tion (1 − β)J has to be bled toground by the resistor RS and one obtains (negle ting the trivial solution of RS = R1 = R2 = R3 = 0)
RS =R1
3
(1 + β
1 − β
)
. (5.97)With this onguration, the ir uit behaves as desired for the urrent J fed into the left input of the ir uit.Unfortunately, the urrent βJ will also be divided at the left node and the omputation of the entroidgives〈x〉∣∣β 6=1
=Jr − Jl
Jr + Jl=
5
3+
8
3(β − 3)6= 〈x〉
∣∣β→1
=1
3. (5.98)This leads to una eptable systemati errors in the entroid even for β near to unity. As a onsequen e,one obtains for a omposed signal a positioning error, whi h is omparable in its size to the mispositioning,that would exist if the network were not ompensated at all.5.7.2 A tive CompensationA se ond obvious possibility whi h works with ea h of the des ribed enhan ed harge dividers is to use anindependent urrent amplier for ea h of the inputs of the positioning ir uit. Figure 5.18 shows this fora 1D-resistor hain. One only has to adjust the gain of ea h single amplier orresponding to the anodeuniformity map. Besides the universality of this ir uit, another important advantage is that it does notbleed parts of the signal to ground but amplies it. For the orre t working of this harge divider ir uit,the xed gain ampliers (FGAs) have to deliver urrents at their outputs. Furthermore, a very small inputimpedan e is needed, sin e photodete tors for photon- ounting appli ations normally a t as urrent sour es.The main drawba k of this method is its ompli ated implementation owing to power onsumption andrequired spa e on the printed ir uit board.5.8 Errors of The Center of Gravity AlgorithmAt the end of the present se tion, the systemati and statisti errors that are introdu ed by the enter ofgravity algorithm as well as the imperfe tion of the photodete tors and readout ele troni s are dis ussed.Important sour es for systemati errors are dis retization ee ts and border ee ts. The rst are a onse-quen e of the sampling of an arbitrary signal distribution that enfor edly in ludes its dis retization. Almostalways, this destroys existing symmetries of the distribution. Border ee ts arise be ause it is impossibleto realize dete tors of innite spatial extension and lead also to breaking of the symmetries of the signaldistribution. On the other hand, one fa es signal u tuations that are aused by the quantization of thesignal and a quantum dete tion e ien y whi h in no real ase an rea h 100%. The thermal noise of theele troni omponents falls far short of the other mentioned error sour es and it will be shown that onemust not worry too mu h about this error.5.8.1 Signal Flu tuationsFlu tuations in the signal distribution are aused by various underlying pro esses. The signal generationstarts with the photo onversion of the γ-ray into one or more ele trons within the s intillation rystal.Depending on the underlying pro ess, e.g. the Compton ee t, photoele tri ee t or pair produ tion, one81

5.8 Errors of The Center of Gravity AlgorithmPSfrag repla ements FGAFGAFGAFGAFGAFGAFGAFGAJrJl
Ji
anode 1 anode n
Figure 5.18: Anode inhomogeneity ompensation using urrent ampliers.Ea h of these ampliers will have a dierent ampli ation a ording tothe anode-segment that it has to orre t. It is important that the inputimpedan e of the FGA is very low. Otherwise the urrents Ji will generatevoltages JiRFGAIn that are opposite in sign to the bias voltages of the pho-todete tor and lead to a de rease or even an omplete breakdown of ele tron olle tion or multipli ation.or more primary ele trons are generated. These primary ele trons produ e the s intillation light via thede ay of the se ondarily ionized atoms. Together with these random pro esses, inhomogeneities of thematerial and non-proportional energy dependen y lead to important u tuations in the total light outputof the s intillator. While this ae ts all anode-segments by the same amount, the distribution of the nitenumber of these s intillation photons over the sensitive area of the dete tor leads to u tuation that diersfor all anode-segments. In the following step, the visible light photons will be onverted independentlyand one by one into photoele trons at the athode of the dete tor. This is a Poisson pro ess and probablythe most important ause for segment-dependent signal u tuations for photomultiplier tubes. Finally,the u tuation will lead to an un ertainty δPµ1 in the entroid measurement µ1, whi h an be estimatedusing error propagation. For this, a set f (xo) = f (xo)
j , j = [1, 2, . . . , n] of n ∈ N values that represent thesignals of the anode-segments with enter-positions xj is onsidered. The supers ript (x0) indi ates thatthe signals are generated by the photo onversion of a γ-photon at position x0. If the errors of the anodepositions are assumed to be negligible, one obtains for the error δPµ1(f(xo)) in the entroid µ1(f
(xo)) theexpressionδPµ1(f
(xo)) =
√√√√∑
j
[
∂
∂fj
(∑
i xif(xo)i
∑
i f(xo)i
)
δf(xo)j
]2
=1
√∑
i f(xo)i
√√√√
∑
j(xj − µ1(f (xo)))2δf2j
∑
i f(xo)i
, (5.99)where the entroid is given byµ1(f
(xo)) =
∑
i xif(xo)i
∑
i f(xo)i
. (5.100)Setting δfj ∝√
fj for the u tuations of Poisson dominated pro ess, equation (5.99) redu es toδPµ1(f
(xo)) ∝ σSD√∑
i f(xo)i
, (5.101)where σSD denotes the standard deviation for the set f (xo). This result is not unexpe ted. Sin e the standarddeviation gives an idea of the dispersion of the set of variables f (xo)j , equation (5.101) states that the errorof the entroid is smaller the narrower the signal distribution is. Furthermore, the result also s ales withthe square root of the sum of all signals f (xo)
j , e.g. the total amount of photons olle ted by all theanode-segments. One therefore expe ts a better position estimate from the enter of gravity algorithm themore light is released by the γ-ray and the narrower the distribution of this light is.As already mentioned, any measurement of the ( hara teristi ) parameter of the distribution observedwith the photodete tor has to be sampled and therefore will be only available in the form of the nite set82

5 Enhan ed Charge Dividing Cir uitsof values f (xo)j . Normally, this sampling is done by integrating the distribution of interest pie ewise overmany small and equidistant intervals. Mathemati ally, this amounts to a onvolution (Landi [133) of thereal distribution ϕ(x) with the interval fun tion4 Π(x) of width τ :
fxo(x) =
∞∫
−∞
Π
(x − x′
τ
)
ϕ(x′ − x0)dx′. (5.102)The set of measured values f (xo)j is just given by the fun tional value of fxo(x) at the positions x = xj :
f(xo)j = fxo(x)
∣∣xj
. (5.103)It is lear from equation (5.102), that the resulting distribution fxo(x) has to be wider than the originaldistribution ϕ(x), sin e one always has τ > 0 for any real photodete tor. This means together withequation (5.101), that when the CoG algorithm is used together with a ontinuous light distribution, thepixel size of the dete tor used is of great importan e. As an example, the proje tion of the normalizedone-dimensional inverse square law onto the abs issa x,ϕ(x) =
dJ
π(x2 + d2), (5.104)is used to study the inuen e of the dete tor pixel size τ on the width of the sampled distribution fxo(x). Forthe omputation one an set x0 = 0 w.l.o.g. While the undisturbed distribution (5.104) has a FWHM equalto 2d, the sampled distribution fxo(x) will have the width √
τ2 + 4d2. The results are plotted in gure 5.19for two dierent depths d and dierent values of τ . Obviously, this result is not dire tly appli able toequation (5.101) sin e there the standard deviation was omputed. Nevertheless, the qualitative result thatone gets a larger statisti al error of the CoG for a oarser sampling of the distribution still holds sin ethe standard deviations as well as the FWHMs of the distributions fxo(x) and ϕ(x) are stri tly in reasingfun tions.The statisti al error made in the se ond moment is not related to the enter of gravity algorithm butwill be given for ompleteness. It an be omputed equivalently to (5.99) and yieldsδPµ2(f
(xo)) =
√√√√∑
j
[
∂
∂fj
(∑
i x2i f
(xo)i
∑
i f(xo)i
)
δf(xo)j
]2δfj=
√fj
=1
√∑
i f(xo)i
√√√√√
∑
j
(
x2j −
∑
i x2i f
(xo)i
∑
i f(xo)i
)2
f(xo)j
.(5.105)Note that ∑i(x2i f
(xo)i )/(
∑
i f(xo)i ) is just the entral se ond moment for x0 = 0.5.8.2 Dis retization ErrorsThe ne essary dis retization of the signal distribution leads to additional systemati errors (Landi [133).The denition of the moments for a distribution ϕ(x) was given by (see equation (5.5) in se tion 5.1.1)
µk(x) =
∫
ω
xkϕ(x)dx. (5.106)At this level and for normalized ϕ(x), the method gives a perfe t position measurement for k = 1 and allother moments for k 6= 1, k ∈ N whenever the integration interval ω overs the support of the distribution.Unfortunately, ϕ(x) is not a essible to experiments, ϕ(x) is not normalized, nor is it possible to builddete tors of innite spatial extension. Ea h real dete tor performs a dis rete redu tion that essentiallymodies the properties of the method. In its simplest form, the sampling is a set of nite disjoint integrationsof the distribution. Therefore the dete tor readout is the set of the following n numbersf
(xo)j =
τ(n+ 12 )
∫
τ(n− 12 )
ϕ(x − x0) dx, (5.107)4The interval fun tion is dened through Π(x) =
1 |x| < 1/21/2 for |x| = 1/20 |x| > 1/2
. 83
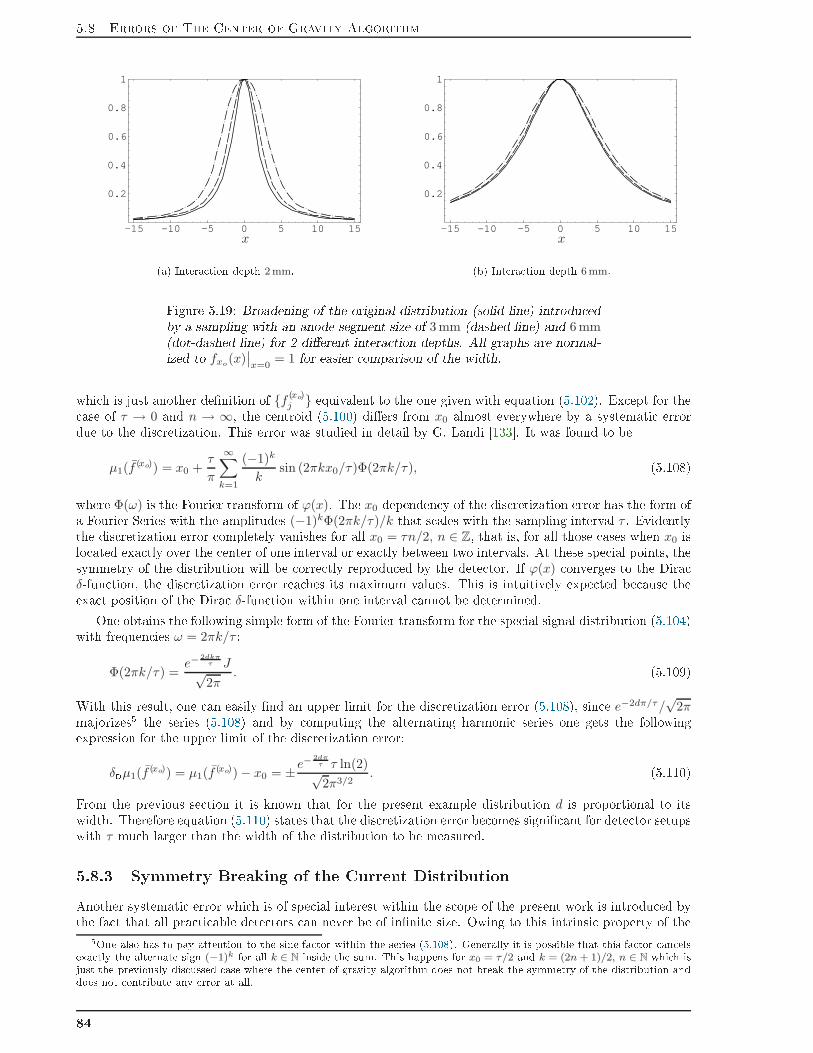
5.8 Errors of The Center of Gravity Algorithm-15 -10 -5 0 5 10 15
0.2
0.4
0.6
0.8
1
PSfrag repla ementsx(a) Intera tion depth 2mm. -15 -10 -5 0 5 10 15
0.2
0.4
0.6
0.8
1
PSfrag repla ementsx(b) Intera tion depth 6mm.Figure 5.19: Broadening of the original distribution (solid line) introdu edby a sampling with an anode-segment size of 3 mm (dashed line) and 6 mm(dot-dashed line) for 2 dierent intera tion depths. All graphs are normal-ized to fxo(x)
∣∣x=0
= 1 for easier omparison of the width.whi h is just another denition of f (xo)j equivalent to the one given with equation (5.102). Ex ept for the ase of τ → 0 and n → ∞, the entroid (5.100) diers from x0 almost everywhere by a systemati errordue to the dis retization. This error was studied in detail by G. Landi [133. It was found to be
µ1(f(xo)) = x0 +
τ
π
∞∑
k=1
(−1)k
ksin (2πkx0/τ)Φ(2πk/τ), (5.108)where Φ(ω) is the Fourier transform of ϕ(x). The x0 dependen y of the dis retization error has the form ofa Fourier Series with the amplitudes (−1)kΦ(2πk/τ)/k that s ales with the sampling interval τ . Evidentlythe dis retization error ompletely vanishes for all x0 = τn/2, n ∈ Z, that is, for all those ases when x0 islo ated exa tly over the enter of one interval or exa tly between two intervals. At these spe ial points, thesymmetry of the distribution will be orre tly reprodu ed by the dete tor. If ϕ(x) onverges to the Dira
δ-fun tion, the dis retization error rea hes its maximum values. This is intuitively expe ted be ause theexa t position of the Dira δ-fun tion within one interval annot be determined.One obtains the following simple form of the Fourier transform for the spe ial signal distribution (5.104)with frequen ies ω = 2πk/τ :Φ(2πk/τ) =
e−2dkπ
τ J√2π
. (5.109)With this result, one an easily nd an upper limit for the dis retization error (5.108), sin e e−2dπ/τ/√
2πmajorizes5 the series (5.108) and by omputing the alternating harmoni series one gets the followingexpression for the upper limit of the dis retization error:δDµ1(f
(xo)) = µ1(f(xo)) − x0 = ±e−
2dπτ τ ln(2)√2π3/2
. (5.110)From the previous se tion it is known that for the present example distribution d is proportional to itswidth. Therefore equation (5.110) states that the dis retization error be omes signi ant for dete tor setupswith τ mu h larger than the width of the distribution to be measured.5.8.3 Symmetry Breaking of the Current DistributionAnother systemati error whi h is of spe ial interest within the s ope of the present work is introdu ed bythe fa t that all pra ti able dete tors an never be of innite size. Owing to this intrinsi property of the5One also has to pay attention to the sine fa tor within the series (5.108). Generally it is possible that this fa tor an elsexa tly the alternate sign (−1)k for all k ∈ N inside the sum. This happens for x0 = τ/2 and k = (2n + 1)/2, n ∈ N whi h isjust the previously dis ussed ase where the enter of gravity algorithm does not break the symmetry of the distribution anddoes not ontribute any error at all.84

5 Enhan ed Charge Dividing Cir uitsdevi es, the sampled signal distribution has a nite support. This error is well known and be ause of itsseverity it has been subje ted to detailed studies by many investigation groups (e.g. Freifelder et al. [149,Clan y et al. [150, Siegel et al. [151 and Joung et al. [152) in order to avoid or ombat this degradationoften referred to as image ompression or edge ee ts. A tually, this error is a simple onsequen e ofapplying the CoG algorithm with an integration interval smaller than the support for the signal distribution.It an be observed for all moments whose distribution is (ne essarily) trun ated by the dete tor design.Being one of the most important of all errors onsidered here, it often for es the designer of the dete torto restri t the usable area to a entral region and render inoperative a large peripheral area. There aremany re ipes to extra t the best results from ea h dete tor te hnology and geometry, e.g. s intillator orsemi ondu tor, pixels or ontinuous. The error dis ussed in this se tion depends ru ially on the dete tor onguration. Here, only the spe ial onguration of a s intillation dete tor with ontinuous rystal is onsidered. Even in this ase, the response performan e an be varied by dierent approa hes in orderto optimize total light yield and other important parameters. Some well-known design enhan ements, forexample diusive ree tive oating, are, however, ex luded for an optimal performan e of the depth ofintera tion measurement. Sin e ree tion on the rystal edges would destroy the orrelation between thedistribution width and the depth of intera tion (not the se ond moment), all rystal surfa es that are notread out by a photodete tor have to be oated anti-ree tive.First, the 0th moment is onsidered sin e it is required for the energy measurement and for the normal-ization of the enter of gravity algorithm a ording to equation (5.1). The error that is made by trun atingthe integration be omes lear from splitting the integral into the integration over the support L of thedete tor and two residual parts ]−∞, −L2 ] and [L
2 ,∞ [ to the left and to the right respe tively:µ
(x0)0 = J
L2∫
− L2
ϕ(x − x0) dx = J − J
∞∫
L2
ϕ(x − x0) + ϕ(−x − x0) dx. (5.111)Note that the signal distribution will have its symmetry enter at x0 and not x = 0. Therefore, ex ept forthe ase x0 = 0, the integration of ϕ(x− x0) over the intervals ]−∞, −L2 ] and [L
2 ,∞ [ give dierent results.The generalization of equation (5.111) to any k-th moment is straightforward and given byµ
(x0)k = J
L2∫
− L2
xkϕ(x − x0) dx = Jµk − J
∞∫
L2
xkϕ(x − x0) + (−1)kϕ(−x − x0)
dx, (5.112)where the µk are the normalized distribution moments a ording to its denition (5.5), and the normaliza-tion of the moments µ
(x0)k has to be done with µ
(x0)0 . From equations (5.111) and (5.112) it be omes learthat the introdu ed error depends on the signal distribution ϕ(x) in a non-trivial way. Nevertheless, somegeneral properties an be extra ted from them. Consider the ase of a distribution that is symmetri aroundthe impa t point x0, i.e. ϕ(x−x0) = ϕ(x0 −x). A tually, this is a property of many signal distributions ofinterest in the eld of experimental high energy physi s and/or when using s intillation dete tors. Result(5.112) splits then into two ases depending on whether k is odd or even. The error in the odd momentsvanishes ompletely for x0 = 0. Contrariwise, the error in the even moments will never vanish for the lassof non-trivial distributions with ϕ(x) 6= 0, x ∈ [L/2,∞ [. Obviously this is the symmetry behavior of theCoG algorithm and the error that distinguishes the real impa t position x0 from the entroid µ
(x0)1 omesalong with the breaking of the symmetry of the distribution by the integration over the nite interval.For the test distribution (5.104) the entroid a tually measured is given by:
µ(x0)1 = x +
d log(
4d2+(L−2x)2
4d2+(L+2x)2
)
2(
cot−1(
2dL−2x
)
+ cot−1(
2dL+2x
)) . (5.113)The other nite support moments µ(x0)k an be obtained similarly by straightforward appli ation of thedenition (5.112). Result (5.113) is plotted for various impa t depths d and a typi al dete tor size L ingure 5.20(a). From equation (5.113) and its graphi al representation in gure 5.20(a), it is seen thatthe trun ation of the signal distribution at the dete tor's limits ompresses the identity y = x at thedete tor's edges. The loser the impa t position is to the edge, the stronger the ompression. The degree of85

5.8 Errors of The Center of Gravity Algorithm
-20 -10 0 10 20-20
-10
0
10
20
PSfrag repla ements true position [mm entroid[mm
(a) Behavior of positioning for dierent depth of in-tera tions (d = 0, 2, 4, . . . , 10mm) if the enter ofgravity algorithm is used. L was set to 20 cm. 0 2 4 6 8 10
2.5
5
7.5
10
12.5
15
17.5
20
PSfrag repla ements measured entroid [mminvertedposition[mm
(b) Broadening of the point spread fun tion due tothe nonlinearity in the position response of the trun- ated enter of gravity algorithm. The identity x = yis plotted as dashed line.Figure 5.20: Behavior of positioning of the enter of gravity algorithm and onsequen es for the linearization. ompression varies also with the depth of intera tion. This ompression not only results in a hara teristi mapping of the impa t position, but also leads to a resolution loss at the dete tor's edges. Sin e it will beattempting to nd the inverse mapping of the dependen es in gure 5.20(a), the point spread fun tion ofthe dete tor will be broadened as shown in gure 5.20(b). A dete tor response that ompresses the imagesat its edges is orre ted by the appli ation of an expanding reverse mapping. However, not only will the enter-points of the point spread fun tion be dispersed, but also the point spread fun tion itself. Togetherwith the depth dependen e of the dete tor's positioning hara teristi , the distortion at peripheral zones ofthe sensitive area are subje ted to a signi ant resolution degradation. The dierent image ompressionsfor dierent impa t depths easily lead to superposition of impa t positions that makes the bare enter ofgravity algorithm useless ex ept for a small region at the enter, espe ially for appli ations that requirethi k s intillators.5.8.4 Ele troni NoiseFinally, the inuen e of thermal noise generated by the passive and a tive ele troni devi es is onsidered.In general, the spe tral density of the noise power P at the frequen y f is given by P = kBTf , where kBdenotes the Boltzmann onstant and T the absolute temperature of the devi e (Tietze and S henk [142).Sin e the power is also given by P = U2/R and by virtue of Ohms law, the spe tral density of the noisevoltage and urrent an be derived to yieldU =
√
4RkBTf and I =√
4R−1kBTf, (5.114)where the fa tor 4 arises from averaging the sin2(t) fun tion over a full period. At room temperature, 4kBTamounts to 1.6 · 10−20 Ws and therefore the noise voltage of a resistor is given by UR ≃ 0.13 nV × √Rf .Clearly the noise voltages of any two resistors are not orrelated at all and the n × n noise voltages of thesumming amplier have to be added quadrati ally, while one has to take into a ount that they will beamplied along with the desired signal voltage.
UΣnoise ≃
√√√√U2
noiseOP+ U2
RC+ 4kBTf
n,n∑
i,j
g2ijRij (5.115)86

Referen esHere, UnoiseOPis the noise ontribution to the output signal of the operational amplier itself and U2
RCthe ontribution aused by the ompensation resistor Rc (refer to gure 5.11 in se tion 5.6). Using thenetwork onguration of the two-dimensional proportional harge divider (gure 5.8) together with theoptimum values for the summation weights omputed in se tion 5.6.2, one obtains a typi al total noisevoltage of UΣnoise ≈ 160 µV. The spe tral noise UnoiseOP
of the operational amplier was assumed to be of10 nV
√Hz, whi h is a typi al value for modern operational amplier. Therefore, the strongest ontributionin the sum (5.115) arises, with ≈ 140 µV, from the operational amplier itself. The reason for the ratherlow ontribution from the summation network (≈ 25 µV) lies in the posterior attenuation of the signal.A tually, the presented summation amplier, with a mean gain of fa tor ≈ 0.003, is more likely to be alleda summation attenuator. This very small gain is needed in order to avoid saturations of the operationalamplier but also ee tively suppresses the thermal noise of the resistor network.Typi al signal amplitudes observed with our experimental setup des ribed in hapter 7 are of 50 mVand more. Thus, the ele troni noise of the summing amplier an be negle ted ompared with the othererror sour es dis ussed in this se tion. The same holds for the urrents JA, JB , JC and JD.Referen es[127 H. Anger, S intillation amera, Rev. S i. Inst., vol. 29, no. 1, pp. 2733, 1958.[128 K. Lauterjung, J. Pokar, B. S himmer, and S. R., Grenzs hi htzaehler fuer Orts- und Energiebes-timmung, Nu l. Instr. and Meth., vol. 22, pp. 117121, 1963, (In German).[129 W. Kuhlmann, L. K.H. and B. S hirmer, Anlage zur Orts- und Energiebestimmung mit Halbleiter-Detektoren, Nu l. Instr. and Meth., vol. 40, pp. 109112, 1966, (In German).[130 R. Bo k, H. Duhm, W. Melzer, F. Pühlhofer, and B. Stadler, An Array of Position Sensitive Surfa eBarrier Dete tors for Use in a Broad Range Magneti Spe trograph, Nu l. Instr. and Meth., vol. 41,pp. 190194, 1966.[131 W. M Di ken, A Position Sensitive Geiger Counter, Nu l. Instr. and Meth., vol. 54, pp. 157158,1967.[132 A. Doehring, S. Kalbitzer, W. Melzer, and W. Stump, A Pulse Divider for Use with PositionSensitive Dete tors, Nu l. Instr. and Meth., vol. 74, pp. 4244, 1969.[133 G. Landi, Properties of the enter of gravity as an algorithm for position measurement, Nu l. Instr.and Meth. A, vol. 485, pp. 698719, 2002.[134 D. Lindley, Introdu tion to Probability and Statisti s. Cambridge University Press, 1980.[135 W. H. Press, S. A. Teukolsky, W. T. Vetterling, and B. P. Flannery, Numeri al Re ipes in C, 2nd ed.Cambridge University Press, 1992.[136 S. Fly kt and C. Marmonier, Photomultiplier tubes, prin iple and appli ation, Photonis, 2002.[137 H. Güttinger, M. Gauts hi, and E. Serralla h, A low- ost preamplier/dis riminator for fast photon ounting, J. Phys. E, vol. 9, pp. 936937, 1976.[138 R. M Hose, Fast Photomultiplier Tube Te hniques, Burle Te hnologies In ., appli ation note,http://www.burle. om/, 1989.[139 H. Kume, Photomultiplier tube, prin iple to appli ation, Hamamatsu Photoni s K.K., 1994.[140 H. Kume, K. Koyama, K. Nakatsugawa, S. Suzuki, and D. Fatlowitz, Ultrafast mi ro hannel platephotomultipliers, Applied Opti s, vol. 27, no. 6, pp. 11701178, Mar. 1988.[141 R. M Hose, Time Chara teristi s of Photomultipliers Some General Observations, Burle Te h-nologies, In ., http://www.burle. om/, 1989, appli ation note.[142 U. Tietze and C. S henk, Halbleiter-S haltungs-te hnik, 12nd ed. Springer, Berlin, 2002, (In German).87

Referen es[143 L. Fabris, N. Madden, and H. Yaver, A fast, ompa t solution for low noise harge preampliers,Nu l. Instr. and Meth. A, vol. 424, pp. 545551, 1999.[144 C. Borkowski and M. Kopp, Some appli ations and properties of one- and two-dimensional position-sensitive proportional ounters. IEEE Trans. Nu l. S i., vol. 17, no. 3, pp. 340349, 1970.[145 S. Siegel, R. Silverman, Y. Shao, and S. Cherry, Simple harge division readouts for imaging s in-tillator arrays using a multi- hannel PMT, IEEE Trans. Nu l. S i., vol. 43, no. 3, pp. 16341641,June 1996.[146 Hamamatsu Photoni s K.K., Flat-Panel type multianode photomultiplier tube assembly H8500,http://www.hamatsu. om/, data sheet.[147 S. Fran o, Design with Operational Ampliers and Analog Integrated Cir uits, 2nd ed. M Graw-Hill,1998.[148 M. P. Tornai, L. R. Ma Donald, C. S. Levin, S. Siegel, and E. J. Homan, Design Considerationsand Performan e of a 1.2 cm2 Beta Imaging Intra-Operative Probe, IEEE Trans. Nu l. S i., vol. 43,no. 4, pp. 23262335, Aug. 1996.[149 R. Freifelder, A. T. Haigh, and J. S. Karp, Redu ing edge ee ts and improving position resolutionin position sensitive NaI(Tl) dete tors, IEEE Trans. Nu l. S i., vol. 40, no. 2, pp. 208213, Apr.1993.[150 R. Clan y, C. Thompson, J. Robar, and A. Bergman, A simple te hnique to in rease the linearityand eld-of-view in position sensitive photomultiplier tubes. IEEE Trans. Nu l. S i., vol. 44, no. 3,pp. 494498, June 1997.[151 S. Siegel, S. R. Cherry, A. R. Ri i, Y. Shao, and M. E. Phelps, Development of ontinuous dete torsfor a high resolution animal PET system, IEEE Trans. Nu l. S i., vol. 42, no. 2, pp. 10691074,Aug. 1995.[152 J. Joung, R. Miyaoka, and T. Lewellen, Mi e: a high resolution animal PET using ontinuous LSOwith a statisti s based positioning s heme. Nu l. Instr. and Meth. A, vol. 489, pp. 584598, 2002.
88

6 Compton S attered Events6 Compton S attered EventsWe did not inrit this earth from our rents, we are rrowing it from ourildren. old nati Ameri an prorbAN important issue that has not been addressed so far is the inuen e of Compton s attered eventson the presented method for the determination of the intera tion depth. Compton s attering isthe pro ess in whi h a γ-photon and an ele tron s atter o one another. Owing to its small rest energyEe = mec
2 = 511 keV, a signi ant amount of the γ-ray's in iden e energy is transferred to the targetele tron. It is therefore referred to as in oherent s attering in ontrast to the oherent Rayleigh s atteringthat des ribes the pro ess in whi h a γ-photon and an atom s atter o of one another. Coherent s atteringentails usually only a small hange in the photon's original dire tion and there is virtually no loss ofenergy. Compton and Rayleigh s attering are only two of a number of individual pro esses by whi hphotons intera t with matter, e.g. photoele tri absorption, pair produ tion and the nu lear photoele tri ee t.1 The probability that the in ident photon undergoes one of these pro esses when traversing thetarget matter an be expressed in terms of the mass attenuation oe ient µ/ρ [cm2/g], where µ [cm−1]is the (density dependent) linear attenuation oe ient and ρ [g/cm3] the material's density. The massattenuation oe ient is related to the total atomi ross se tion σtot [cm2/atom] by the atomi weight.This quantity an also be obtained as the sum of ross se tions for the mentioned dierent types of possibleintera tions of the photons with the target material:σtot = σpe + σincoh + σcoh + σpair + σphn , (6.1)in whi h σpe is the atomi photoele tri ee t ross se tion, σincoh and σcoh are the Compton and theRayleigh ross se tions respe tively, σpair is the ross se tion for pair produ tion and σphn is the nu learphotoele tri ee t ross se tion (refer to Hubbell [153, Johns and Cunningham [154). All ontributionsin equation 6.1 show a strong energy dependen y. For photon energies below 2mec
2 pair produ tion is notallowed. The major intera tion pro ess in the energy range between 15 keV and 511 keV are oherent andin oherent s attering and photoele tri absorption with a ross se tion for Rayleigh s attering that is oneor two orders of magnitudes smaller than σtot in equation 6.1. It an therefore be negle ted without gravein onvenien e with the remaining major pro esses Compton s attering and photoele tri absorption.When dis ussing the onsequen es of these two pro esses, one has to distinguish between intera tioninside (dete tor s atter) and outside (obje t s atter) the dete tor's sensitive volume, i.e. inside and outsidethe s intillation rystal. Obje t s atter an ause serious problems at the moment of image re onstru tions.Its impa t and possible orre tion has been addressed by numerous studies (see Zaidi and Koral [155) butwill not be treated here. In obje t Compton s attering, the photon leaves the intera tion point with anew dire tion and a new energy. The error will be introdu ed when onstru ting the line of response (in oin iden e imaging) or the origin of the γ-ray (in single photon tomography) and not when determiningthe impa t position inside the dete tor, espe ially if the dete tor has poor energy resolution.Compton s attering inside the s intillation rystal instead ae ts the position determination. The γ-photon an undergo photoele tri absorption or an have been Compton s attered multiple times withinthe rystal, and at ea h intera tion position it will deposit a fra tion of its energy. At best, the s atteredγ-photon es apes the sensitive volume after one or more intera tions taking away a su iently large energyfra tion and allowing a dis rimination against photoele tri events. Obviously, photoele tri absorptiondoes not introdu e any position blurring and is therefore the preferred intera tion pro esses. While it is1The nu lear photoele tri ee t des ribes the pro ess of liberating an ele tron from the atomi nu leus or one of itsnu leons. 89

6 Compton S attered Events
0.01 0.05 0.1 0.5 1 5 10
0.0001
0.001
0.01
0.1
1
10
100
PSfrag repla ements Photon Energy [MeVAttenuationCoe ients[cm
2/g
Figure 6.1: Total γ-ray attenuation for LSO from 10 keV to 10 MeV (thi ksolid line). Also shown are the attenuation oe ient for oherent s attering(dot-dashed-dashed line), the attenuation oe ient for in oherent s atter-ing (dot-dashed line), the attenuation oe ient for photoele tri absorption(dotdot-dashed line), the attenuation oe ient for pair produ tion in thenu lear eld (long-dashed line), and the attenuation oe ient for pair pro-du tion in the ele tron eld (short-dashed line); Berger and Hubbell [156.The verti al solid line marks the energy of 511 keV.not possible to ontrol whi h elementary pro ess a single photon undergoes, one an optimize the fra tions(or probability) of Compton-s attered events and photoele tri events by hoosing an adequate s intillator.For the dete tion of annihilation radiation with 511 keV energy, materials of high density and high atomi number are required ( f. se tion 3.2.1). LSO mat hes all requirements for positron emission tomographyquite well and is one of the s intillators of hoi e for this imaging modality. Nevertheless, its Comptonattenuation oe ient at 511 keV is, at 0.07 cm2/g, nearly twi e as large as the photoele tri attenuation oe ient of 0.04 cm2/g (Berger and Hubbell [156). In gure 6.1, all LSO oe ients are plotted for theenergy range 10 keV to 10 MeV.The physi s behind Compton s attering is very well understood. From relativisti energy and momen-tum onservation the equation for its kinemati s an be derived:E1 =
E0
1 + γ(1 − cosϑ), (6.2)with γ = E0/Ee the photon's relativisti γ-fa tor, E0 the photon's initial energy, E1 the photon's nalenergy and ϑ the hange in the photon's dire tion. For annihilation radiation with E0 = Ee equation 6.2transforms into the simpler expression
E1 =Ee
2 − cosϑ. (6.3)From equation (6.3) it an be seen that the maximum energy transfer to the ele tron is given by 2Ee/3 forba ks attering and that the photon no loses energy at all if it is s attered forward. This is the most likelydire tion in whi h the photon is expe ted to be s attered as an be seen from the Klein-Nishina (see forinstan e Leo [157) dierential ross se tion for Compton s attering:
dσ
dΩ=
r2e
2
1
[1 + γ(1 − cosϑ)]2
(
1 + cos2 ϑ +γ2(1 − cosϑ)2
1 + γ(1 − cosϑ)
)
, (6.4)in whi h re = e2/Ee is the lassi al ele tron radius (re ≈ 2.83 · 10−13 cm). The photon's nal energy,the energy transfer to the ele tron and the (normalized) dierential ross se tion are shown for γ = 1 ingure 6.2.90

6 Compton S attered Events1 0.8 0.6 0.4 0.2 0.2 0.4 0.6 0.8 1.
1
0.8
0.6
0.4
0.2
0.2
0.4
0.6
0.8
1.
(a) Polar plot for the energy E1 in equation 6.3 (solidline, in units of E0) and the energy E0 − E1 that istransferred to the ele tron (dashed line, in units ofE0).
1 0.8 0.6 0.4 0.2 0.2 0.4 0.6 0.8 1.
1
0.8
0.6
0.4
0.2
0.2
0.4
0.6
0.8
1.
(b) Polar plot of the Klein-Nishina formula 6.4 forγ = 1 and normalized to its maximum at ϑ = 0.Figure 6.2: Angular dependen y of the photon's nal energy E1, the energytransfer E0 − E1 and the dierential ross se tion dσ
dΩ .6.1 Inner Crystal Compton S atteringFrom the plot of the attenuation oe ients for LSO in gure 6.1, it is lear that a large fra tion of theimpinging 511 keV γ-rays is expe ted to undergo single or multiple Compton s attering in the s intillation rystal. For a dete ted γ-photon, there exist dierent possibilities of how they have deposited their energy.If the very rst intera tion is a photoele tri ee t, a single s intillation light distribution as des ribed in hapter 4 arises from this impa t position and no blurring due to Compton s atter will o ur. This is justthe ase that was onsidered throughout this work up to now. Another possibility is that the s atteredγ-photon es apes from the s intillation rystal. If ∆E is the energy resolution of the dete tor and lessthan approximately 100%-∆E/2 of the 511 keV are deposited in the s intillator, this event an be dis rim-inated using the energy window. The last possibility is the total absorption after one or more Comptonintera tion(s). These events will deposit the whole photon energy within the s intillator and annot bedis riminated by virtue of the energy. These are of the kind of events studied in this hapter. Various lightdistributions of the form (4.1) originating from the dierent intera tion points are then superposed at thephotodete tor and the moments will be omputed from this superposed signal distribution. However, onlythe rst γ-ray's intera tion point is onne ted to its origin by a single straight line segment (line of ight).Although the energy is determined for ea h possible s atter angle (and vi e versa) by equation (6.2) andtherefore allows, at least theoreti ally, the re onstru tion of the s attered path, the information that is ne -essary for doing so is lost be ause the moments are omputed from the superposed light distribution. Evenwith mu h more sophisti ated dete tors (Sán hez et al. [158) it is rather di ult to exa tly distinguishthe several onse utive Compton intera tion position.Monte Carlo simulations have been arried out in order to investigate the impa t of this ee t on thespatial resolution and the depth of intera tion resolution in γ-ray imaging dete tors using ontinuous LSO rystals (Sán hez [159). In a similar study, the same ee t was examined for dierent s intillators (NaI:Tland BGO) and dete tor geometries, e.g. individual rystal pixel readout, dierent Blo k dete tor designsand large-sized ontinuous rystals together with PSPMTs (Thompson [160). He found that the strengthof the aused resolution degradation strongly depends on the dete tor's geometry and omponents. For thisreason, and be ause the results also depend strongly on the applied s intillation material, their ndings arenot dire tly appli able to our dete tor setup.Instead of setting up from-s rat h programs for Monte Carlo simulations as done by Thompson, the91

6.1 Inner Crystal Compton S atteringNumber ofIntera tions Counts Fra tionof Events Dete tedEvents Total Fra tion ofDete ted Events Relative Fra tion ofDete ted Events0 3807 19% 0 0% 0%1 7389 37% 5499 27% 40%2 5752 29% 5273 26% 38%3 2302 12% 2218 11% 16%4 614 3% 600 3% 4%5 114 0.6% 114 0.6% 0.8%6 18 0.1% 18 0.1% 0.1%7 4 0.02% 4 0.02% 0.03%Table 6.1: Counts, total fra tions and relative fra tions of possible eventsobtained with the Monte Carlo simulation.GEANT 3 library (Brun and Carminati, [161) was used. A large LSO rystal of re tangular shape andwith x, y and z dimensions 40 × 40 × 20 mm3 was simulated with the 511 keV γ-rays impinging on the enter of the x-y plane and normal to the same. A total of 20000 events were simulated and the resultswere lassied by their number of intera tions within the s intillator. An event is registered as dete tedwhen it deposits all its energy (511 keV) within the rystal. Table 6.1 shows the obtained probabilities.3807 of the γ-rays pass through the rystal without any intera tion. 7389 events o ur with exa tlyone intera tion within the simulated rystal volume. However, only 5499 of these were ounted as dete tedevents. These intera t via the photoele tri ee t and do not ause any spatial resolution degradation.The remaining 1890 γ-photons were s attered oherently or in oherently and es aped from the LSO blo k.With growing number of intera tions, the probability of being dete ted rises signi antly. The total of alldete ted events gives the e ien y at the enter of the dete tor and rea hes approximately 68%.For estimating the position blurring aused, the displa ement ve tors r1i = ri − r1 were omputed.Here, r1 is the position of the rst intera tion of the γ-ray and ri with i = 2, 3, . . . , 7 the positions of allfollowing intera tions. Obviously, r1 has the same x-y oordinates as the γ-ray sour e. The displa ementve tors were then proje ted onto the x-y plane (r1i) and onto the z-axis (z1i) and their entroids r and zwere omputed:r =
∑7i=1 r1iEi∑7
i=1 Ei
(6.5)z =
∑7i=1 z1iEi∑7
i=1 Ei
. (6.6)Figure 6.3 shows the histograms of the displa ements of the entroids of all dete ted events for the proje -tions onto the x-y plane and onto the z-axis.The two distributions of r and z show a long tail and a very sharp maximum whi h is aused by thephotoele tri events. These events have displa ement ve tors r and z equal to zero and ause no blurring atall. From gures 6.3( ) and 6.3(d) it an be seen that the slope of the tail is atter the higher the numberof intera tions is.For want of a suitable model distribution, the data has been interpolated in order to ompute theFHWM and FWTM. The results have been summarized together with additional statisti al estimates, e.g.mean, standard deviation and median, in table 6.2. The same omputations have been repeated for thetotal of all those dete ted events that undergo at least one Compton s attering. Rather large values anbe observed for the mean values and standard deviations of all four statisti s. In ontrast, one obtainssmall values for the full widths at half maximum. This ombination is hara teristi for distributions witha narrow maximum and a long tail of low intensity. Ex ept for the ase of transverse displa ement withoutphotoele tri absorptions, the omputed medians are also very small.92

6 Compton S attered Events
0 2.5 5 7.5 10 12.5 15
10
100
1000
10000
PSfrag repla ementsr [mmdete tedevent
s(a) Displa ement histogram for the transverse om-ponent for all the events registered as dete ted. -2.5 0 2.5 5 7.5 10 12.5 15
10
100
1000
10000
PSfrag repla ementsz [mmdete tedevent
s(b) Displa ement histogram for the normal ompo-nent for all the events registered as dete ted.
PSfrag repla ements
0
1
1
1
12
2
233
4
4
455
66
6778 12 14 16
1010
10
102102
103103
104104
# of intera tions
# of intera tions
r [mmdete tedeventsdete tedevents
( ) Displa ement histograms for the transverse omponent and lassied by the numberof intera tions.PSfrag repla ements
−2−4 0
1
1
1
12
2
233
4
4
455
66
6778
1010
10 12 14 16 18
102102
103103
104104
# of intera tions
# of intera tions
z [mmdete tedeventsdete tedevents
(d) Displa ement histograms for the normal omponent and lassied by the numberof intera tions.Figure 6.3: Histograms for the displa ements of the entroids due to Comp-ton s attering. Figures 6.3(a) and 6.3(b) show the displa ement of bothproje tions for the total of dete ted events. In gures 6.3( ) and 6.3(d)separate histograms are shown for the seven subsets of events with samenumber of intera tions. 93

6.2 S reening of Forward S attered EventsComponent FWHM FWTM Mean Standard deviation Mediantransverse (alldete ted events) 0.2 1.33 1.46 2.36 0.3transverse (dete tedevents with nr. ofintera tions > 1) 1.08 8.51 2.44 2.64 1.49normal (alldete ted events) 0.22 0.4 1.04 2.56 0.11normal (dete tedevents with nr. ofintera tions > 1) 0.38 2.86 1.04 2.56 0.11Table 6.2: Dierent statisti al estimates for the displa ement distributionsthat were found by Monte Carlo simulations.6.2 S reening of Forward S attered EventsAnother remarkable feature is that the transverse displa ement gives a broader statisti s than the normaldispla ement. This is obviously not expe ted, sin e the Klein-Nishina formula strongly favors forwards attering (see gure 6.4). One instead would expe t a mu h stronger blurring along the dire tion parallelto the γ-ray beam. The reason lies in the geometry of the s intillator blo k. As already observed byThompson [160, the degree of spatial blurring that results from inner rystal Compton s attering dependsstrongly on the onguration of the γ-ray imaging dete tor. In the ase dis ussed here, the s intillator hasa spatial extension of 40 × 40 × 20 mm3. That is, its transverse extension is twi e as large as its normalextension.Suppose an in ident γ-ray is forward s attered. Then, the energy E1 of the s attered photon is approx-imately Ee by virtue of equation (6.3). This s attered photon now sees a remaining rystal thi kness of20 mm − z1 being z1 the z- omponent of this rst intera tion position. The distribution of z1 is shown ingure 6.4( ) for the subset of all these events that are dete ted (68% of all simulated events). As is expe tedfor the 511 keV annihilation radiation, a large fra tion of γ-rays travel a large distan e along the z-dire tionbefore intera ting, due to the lower ross se tion for higher energies. The mean value is approximately 7 mmfor the present simulation. Therefore, all those events that are forward s attered in the rst intera tionmost likely es ape from the rystal without any further intera tion be ause their energy is still high and theremaining rystal thi kness is small. This is not the ase for events whose rst intera tion results in a larges attering angle. First, the spatial extension of the rystal along the x- and y-dire tion is larger and thes attered photons need to travel a larger distan e through the s intillator in order to es ape. Se ondly, theirenergy is signi antly redu ed and therefore their probability for intera tion in reased (refer to gure 6.1).As a onsequen e, the distribution of the rst s attering angles of all dete ted events is biased towards larges attering angles be ause the dete tor des ribed here is nearly blind to the forward s attered events. Thedistribution is plotted in gures 6.4(a) and 6.4(b). From the histogram 6.4(a) the mean s attering angle an be omputed to be about 63°. If all events are onsidered, the mean value of the rst s attering angleis, at approximately 57°, noti eably lower. For an angle of 63°, the energy of the outgoing photon is ≈ 2
3Eeand its probability of intera tion almost twi e as large. The distribution of the energy deposition at therst intera tion position of all dete ted events is shown in gure 6.4(d). It is also biased towards lowerenergy and the mean value is 315keV.Referen es[153 J. Hubbell, Review of photon intera tion ross se tion data in the medi al and biologi al ontext,Phys. Med. Biol., vol. 44, pp. R1R22, 1999.[154 H. E. Johns and J. R. Cunningham, The Physi s of Radiology, 4th ed. Charles C Thomas Publisher,1983.94

Referen es0 25 50 75 100 125 150 175
0
20
40
60
80
100
PSfrag repla ementsϑ1 [degreedete tedevent
s(a) Histogram of the s attering angles ϑ1 ofthe very rst intera tion inside the rystal fordete ted events.
1. 0.8 0.6 0.4 0.2 0.2 0.4 0.6 0.8 1.
0.9
0.7
0.5
0.3
0.1
0.1
0.3
0.5
0.7
0.9
(b) Polar plot of the s attering an-gles ϑ1 of the very rst intera tioninside the rystal (solid bla k line).The Klein-Nishina angular depen-den ies (solid gray line: simulation,dashed gray line: theory) are alsoplotted for omparison. Both distri-butions are normalized to the max-imum values of the theoreti al de-penden y.0 5 10 15 20
0
25
50
75
100
125
150
PSfrag repla ementsz1 [mm]
dete tedevents( ) z omponent of the very rst intera tionposition of all dete ted events. 200 250 300 350 400 450 500
40
60
80
100
120
140
160
PSfrag repla ementsE1 [keV]
dete tedevents(d) Energy deposition at the very rst inter-a tion position of all dete ted events.Figure 6.4: Distribution of the s attering angle obtained from the subsetof all dete ted events and for the very rst intera tion of the γ-ray. The
z- omponent and the energy of the intera tion position of these events isshown in the gures below.[155 H. Zaidi and K. F. Koral, S atter modelling and ompensation in emission tomography, Eur. J.Nu l. Med. Mol. Imaging, vol. 31, no. 5, pp. 761782, May 2004.[156 M. Berger and J. Hubbell, XCOM: Photon Cross Se tions on a Personal Computer, Center forRadiation Resear h, National Bureau of Standards, July 1987, nBSIR 87-3597.[157 W. R. Leo, Te hniques for Nu lear and Parti le Physi s Experiments, 2nd ed. Springer Verlag, 1994.[158 F. Sán hez, F. Ballesteros, and V. Reglero, Monte arlo study of an imager for low-energy γ-rayastronomy: Optimization of the design and evaluation of the s ienti performan es. Nu l. Instr.and Meth. B, vol. 122, pp. 718 283292, May 1996.[159 F. Sán hez, private ommuni ation.[160 C. Thompson, The ee ts of dete tor material and stru ture on PET spatial resolution and e ien y,IEEE Trans. Nu l. S i., vol. 37, no. 2, pp. 718724, Apr. 1990.[161 R. Brun and F. Carminati, GEANT dete tor des ription and simulation tool, 1994, CERN ProgramLibrary, W5013. 95

Referen es
96

7 Experimental Verifi ation7 Experimental Veri ationDie gef[hrli<e Weltansauung i< die Weltansaung rjenigen, die dieWelt nit angesaut n. Alexanr von Humldt, ⋆ 1769 † 1859THE experimental veri ation of the derived theoreti al models of hapters 4 and 5 is hampered bythe fa t that it is nearly impossible to design a measurement setup that allows a su iently gooddenition of the γ-rays intera tion depth. The same statement holds for the evaluation of the dete torperforman e on erning the energy resolution, spatial resolution and depth of intera tion resolution. Fora γ-ray impinging normally to the plane of the photodete tor's sensitive area, the depth at whi h thephoton intera ts is subje ted to a random pro ess and it is not a essible by experimental preparation.The possibility of using a sandwi h-like onguration onsisting of several ina tive layers and only ones intillation layer, but all having the same opti al properties, has been dis arded for e onomi reasons.Moreover, it is questionable if these set of sandwi hes really reprodu e the properties of a single thi ks intillator slab. Lateral irradiation with a ollimated γ-ray, as was explained by Moses and Derenzo [162or Huber et al. [163 for the use with small s intillation rystal needles, has to be dis arded for anotherreason: due to the large transverse spatial extension of the rystal slab, the intensity of the γ-ray wouldde rease qui kly from the edge and lead to very high ounting statisti s at the side of the dete tor thatfa es the radioa tive sour e and very low statisti s at the opposite side.Another important problem is aused by the ollimation of the γ-ray beam. When using ollimators, onehas to keep in mind that, for the 511 keV energy of the annihilation photons, the probability for s atteringis already rather high. For lead or tungsten, whi h are the most suitable materials for ollimators, thephoton ross-se tions for photoele tri absorption and in oherent Compton s attering a tually have verysimilar values. This leads to a high fra tion of Compton s attered photons in the γ-ray beam and fansout the ollimated beam. A se ond possibility is given by ele troni ollimation using a se ond oin iden edete tor, whi h is required anyway for Positron Emission Tomography. In this ase, the spatial extensionof the radioa tive sour e has to be taken into a ount. Commer ially available positron emitters normallyhave a diameter of one millimeter or more. Modern γ-ray imaging dete tors already rea h intrinsi spatialresolutions in the range of 1 mm to a few mm (Correia et al. [164, Joung et al. [165 and Tavernier et al.[166) and one has to orre t the obtained results for the spatial extension of the γ-ray sour e. The samearguments hold for beams ollimated with a tungsten or lead ollimator.In this se tion a method is explained, detailing how information about the depth of intera tion anbe obtained without the ne essity of preparing several experiments for dierent DOIs. This method issubsequently used to verify the analyti model for the signal distribution derived in hapter 4. Also, thefour rst-order moments, namely µ0, µx
1 , µy1 and µ2 (refer to hapter 5), are measured at 81 uniformlydistributed test positions within the sensitive area of the photodete tor.7.1 Experimental SetupFor the measurement of the moments, two identi al and opposite γ-ray dete tors were used. Ea h module onsisted of a single large-sized s intillator-blo k with spatial dimensions 42 × 42 × 10 mm3. As s intillationmaterial, erium-doped lutetium oxyorthosili ate (Lu2(SiO4)O : Ce3+, also LSO, invented by Mel her andS hweitzer, [167) was hosen for the ex ellent mat hing of its properties with the requirements for PositronEmission Tomography ( f. se tion 3.2.1). A ording to the arguments given in se tion 4.1 and the ndingsof se tion 4.2, the ve side-surfa es that were not oupled to the photodete tor, had to be overed with ahighly anti-ree tive layer. Furthermore, these sides were not polished but only ne ground. The reason for97

7.1 Experimental SetupPSfragrepla ementsele troni s
ele troni s PSPMT opti al grease s intillatorFigure 7.1: Explosion view of a single γ-ray dete tor module (without hous-ing) onsisting of the large-sized ontinuous s intillation rystal, the pho-todete tor, the printed ir uit boards for the ampliers and high-voltagesupply.this de ision was not only e onomi al. A polished rystal surfa e together with the glue of the painting orthe epoxy possibly builds an interfa e of two opti al media with dierent refra tive indi es. Most probably,this would lead to total ree tions be ause the refra tion index nLSO of LSO is, at 1.82, rather high. Bla kepoxy resins an be used to realize high quality anti-ree tive oatings that generally out-perform mostother resin types in terms of me hani al properties and resistan e to environmental degradation. Wealso observed that the ree tions aused by simply bla k painted side-surfa es result in a high fra tion ofree ted s intillation light that renders the determination of the distribution's se ond moment with themethod presented here almost impossible.As position sensitive photodete tor, the Flat-Panel type multi-anode PMT H8500 from HamamatsuPhotoni s K.K. [168 was hosen. Photomultipliers generally have outstanding signal hara teristi s, namelyvery high gains together with low noise, fast response, high stability and a long life. The pri e per unitsensitive area is also very low ompared to other photodete tors making it a very versatile light dete tor. TheH8500 is hara terized by a 49 × 49 mm2 sensitive area with a dimensional outline of only 52 × 52 × 28 mm3.That is to say, it is an extremely ompa t PMT with a very low dead area at the borders, allowing a highpa king density and very ompa t γ-ray imaging dete tors. The small thi kness of the H8500 indi atesthat the 12-stage metal hannel dynode system is also very ompa t, leading to a low ele tron transit timeand ele tron transit time spread. The H8500 has a borosili ate window of refra tive index nW = 1.51 at400 nm in ident wavelength and a thi kness of 2 mm. It has a standard bi-alkali photo athode of thi kness200 Å [169 with a omplex refra tive index of 2.54 + 1.59i (Motta and S hönert [170). The anode onsistsof an array of 8 × 8 segments of size 5.8 × 5.8 mm2 and an inter-segment pit h of 6.08 mm.A non- uring opti al grease (Rhodorsil Pâte 7, Rhodia Sili oni Italia) was used to atta h the LSO rystal to the entran e window of the H8500. The refra tive index of this gel (nGel ≈ 1.6) lies in betweenthe refra tive indi es of the s intillator and the entran e window. It avoids air-gaps between the two mediaand optimizes the s intillation light olle tion. Figure 7.1 shows s hemati ally the internal onguration ofthe dete tor module.The ele troni s ontained in ea h dete tor module in ludes the proportional resistor network displayedin gure 5.8 of se tion 5.4.1 together with the summation amplier (gures D.1 and gures 5.11(a), 5.11( )of se tion 5.4.1), the 1000 V high-voltage power supply (Hamamatsu, [171) and the preampliers and linedrivers displayed in gures D.2 and D.3. of Appendix D. The preamplier and line-driver modules performthe urrent-to-voltage onversion, restore the baseline of the signal and amplify it for an optimal mat hingof the input voltage range with the analog-to-digital onverter module. The basi onguration from Siegelet al. ([172) was adopted for the 2D proportional resistan e network and the values 806 kΩ, 402 kΩ, 270 kΩand 243 kΩ were taken for the summation resistors (refer to se tion 5.6.2).Although the method for depth of intera tion dete tion presented in this work is not onned to imagingmodalities based on oin iden e dete tion, the experiments have to be arried out in temporal oin iden efor two reasons. First, approximately 2.6 % of the natural lutetium ontained in LSO is radioa tive (176Lu,t1/2 ≈ 4 · 1010 years) ausing a ba kground of roughly 280 dete ted single events per se ond and cm3of s intillation material. 176Lu de ays via β−-de ay with a maximum energy of 1.192 MeV and withsubsequent de ays of the 597 keV and 998 keV levels of 176Hf through γ-de ay with transition energiesof 88 keV, 202 keV, 307 keV and 401 keV (Lau kner et al. [173, Mel her and S hweitzer [167, Huberet al. [174). Therefore, a γ-ray sour e of high a tivity is required for the use of LSO with single photonimaging modalities, whereas the 176Lu isotope produ es only a negligible ba kground event rate in temporal98
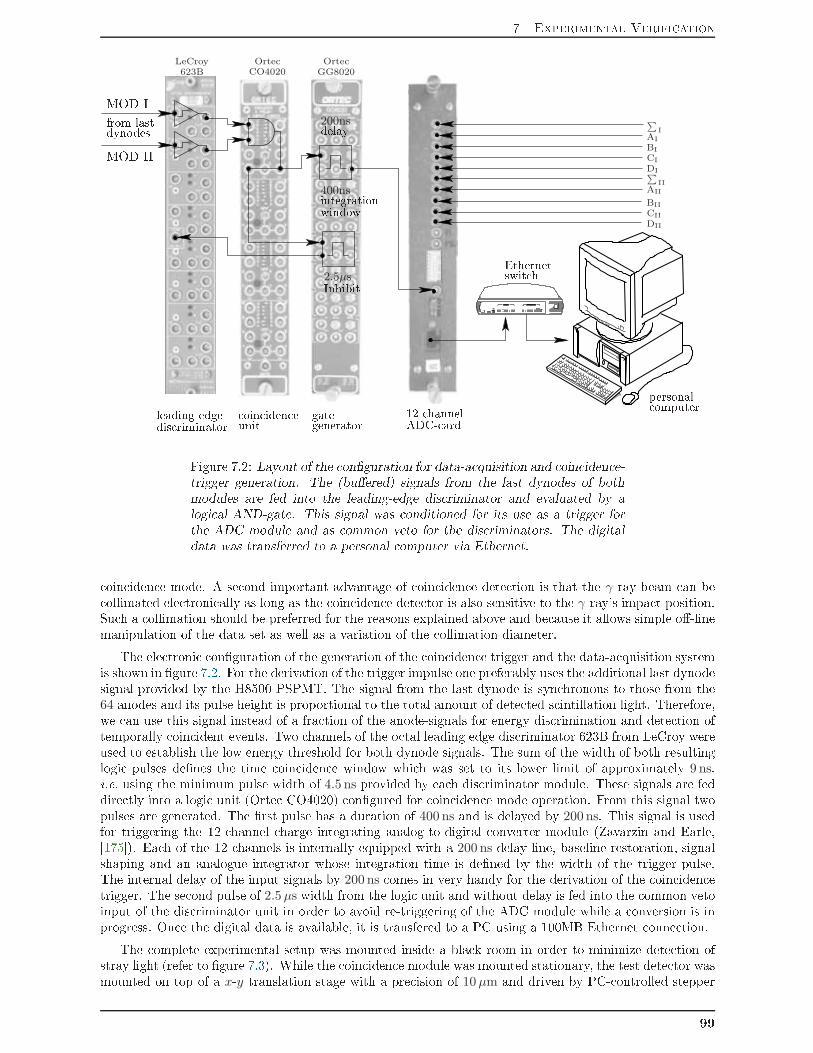
7 Experimental Verifi ationPSfrag repla ements
leading edgedis riminator oin iden eunit gategeneratorEthernetswit h
12 hannelADC- ard personal omputer
MOD IIMOD Ifrom lastdynodes2.5µsInhibit200nsdelay400nsintegrationwindow
∑
I
∑
II
AI
AII
BI
BII
CI
CII
DI
DII
LeCroy623B
OrtecCO4020
OrtecGG8020
Figure 7.2: Layout of the onguration for data-a quisition and oin iden e-trigger generation. The (buered) signals from the last dynodes of bothmodules are fed into the leading-edge dis riminator and evaluated by alogi al AND-gate. This signal was onditioned for its use as a trigger forthe ADC module and as ommon veto for the dis riminators. The digitaldata was transferred to a personal omputer via Ethernet. oin iden e mode. A se ond important advantage of oin iden e dete tion is that the γ-ray beam an be ollimated ele troni ally as long as the oin iden e dete tor is also sensitive to the γ-ray's impa t position.Su h a ollimation should be preferred for the reasons explained above and be ause it allows simple o-linemanipulation of the data set as well as a variation of the ollimation diameter.The ele troni onguration of the generation of the oin iden e trigger and the data-a quisition systemis shown in gure 7.2. For the derivation of the trigger impulse one preferably uses the additional last dynodesignal provided by the H8500 PSPMT. The signal from the last dynode is syn hronous to those from the64 anodes and its pulse height is proportional to the total amount of dete ted s intillation light. Therefore,we an use this signal instead of a fra tion of the anode-signals for energy dis rimination and dete tion oftemporally oin ident events. Two hannels of the o tal leading edge dis riminator 623B from LeCroy wereused to establish the low energy threshold for both dynode signals. The sum of the width of both resultinglogi pulses denes the time oin iden e window whi h was set to its lower limit of approximately 9 ns,i.e. using the minimum pulse width of 4.5 ns provided by ea h dis riminator module. These signals are feddire tly into a logi unit (Orte CO4020) ongured for oin iden e mode operation. From this signal twopulses are generated. The rst pulse has a duration of 400 ns and is delayed by 200 ns. This signal is usedfor triggering the 12- hannel harge integrating analog-to-digital onverter module (Zavarzin and Earle,[175). Ea h of the 12 hannels is internally equipped with a 200 ns delay line, baseline restoration, signalshaping and an analogue integrator whose integration time is dened by the width of the trigger pulse.The internal delay of the input signals by 200 ns omes in very handy for the derivation of the oin iden etrigger. The se ond pulse of 2.5 µs width from the logi unit and without delay is fed into the ommon vetoinput of the dis riminator unit in order to avoid re-triggering of the ADC module while a onversion is inprogress. On e the digital data is available, it is transfered to a PC using a 100MB Ethernet onne tion.The omplete experimental setup was mounted inside a bla k room in order to minimize dete tion ofstray light (refer to gure 7.3). While the oin iden e module was mounted stationary, the test dete tor wasmounted on top of a x-y translation stage with a pre ision of 10 µm and driven by PC- ontrolled stepper99

7.1 Experimental Setup
Figure 7.3: Me hani al setup of the experiment. All omponents requiredfor the measurements are mounted inside a bla k room in order to avoid de-te tion of exterior stray light. The distan e L1 from the radioa tive sour eto the oin iden e module was 24 cm and the distan e L2 from the radioa -tive sour e to the test dete tor was approximately 3 mm.motors. A 22Na sour e of 10 µCi nominal a tivity was aligned with the enter of the oin iden e dete tor.Furthermore, it was pla ed at the large distan e L1 = 24 cm from this dete tor but as lose as possible tothe test dete tor (distan e L2 ≈ 3 mm). Due to geometri arguments, the positions of valid annihilationevents dete ted at the test dete tor have to lie within a small ir ular spot of diameter d = DL2/L1 ≈ D/80whenever they are dete ted at the oin iden e dete tor within the ir le of diameter D. In the experiment,D was set to approximately 1.2 cm.After the alignment of the radioa tive sour e and both modules, the test dete tor was alibrated forosets introdu ed by the preamplier and the analogue-to-digital onverters. For this purpose, the hargeintegrating digitizing ard provides an internal lo k allowing a fast simultaneous oset measurement ofall 12 ele troni hannels with the high voltage of the Photomultiplier tubes turned o. The gain of thedierent ele troni hannels was supposed to be nearly the same and was not alibrated.The energy, both entroids and the se ond moment of the signal distributions of valid oin iden e eventswere measured at 81 dierent positions (x, y),with x, y ∈ [±19,±14.25,±9.5,±4.75, 0]. With the aid of thetranslational stage, the test-dete tor was automati ally moved to ea h of these positions as indi ated ingure 7.4 and 192000 oin iden e events were registered before moving to the next position. The data wasstored in raw format (all 12 ele troni hannels for ea h event) for subsequent pro essing, i.e. omputationof the moments, ele troni ollimation and energy and position ltering. Approximately 6 − 8 % of allevents produ ed an ADC overow or underow. These events have been removed from the data sets.7.1.1 Spatial Extension of the Radioa tive Test-Sour eA 22Na point sour e of 370 kBq nominal a tivity was used for these measurements. The radioa tive isotopeis absorbed in an ion-ex hange bead and xed at the geometri enter of an epoxy resin apsule. However,this sour e with a diameter of 1 mm annot be onsidered as a point-like sour e for the present experiment,sin e the spatial resolution is expe ted to be of the same order and therefore one has to orre t the resultsfor this nite size ee t. Furthermore, one has to take into a ount that the sour e is a β+-emitter andthat the positrons have a nite range before giving rise to the annihilation radiation (refer to se tion 3.3.3).This leads to a penetration of β+-parti les into the epoxy resin and also to an expe ted higher a tivityat the enter of the sour e pellet. The resulting ee tive sour e diameter an hardly be measured and ades ription with analyti models would be too umbersome. Instead, it was estimated using Monte Carlosimulations (San hez, [176) with GEANT 3 (Brun and Carminati [177).Figure 7.5(a) shows a normalized density plot of the positron endpoint positions of 20000 simulatedevents proje ted onto the x-y-plane. However, for the estimation of the ee tive diameter only the radius|r| =
√
x2 + y2 is of interest. One has to normalize the bin- ontent of the histogram for |r| with |r| be ause100

7 Experimental Verifi ation. . .
. . .
7281
1239
Figure 7.4: Graphi illustration of the 81 test positions. The starting pointof the measurement sequen e is the upper left orner; then the test dete toris moved to the right until the last position of the upper row in the matrixof positions is rea hed. Thereafter, the dete tor is moved to the left of thenext row and begins measuring the next row and ontinues in this way tillthe end position with number 81.-1 -0.5 0. 0.5 1.
-1
-0.5
0.
0.5
1.
0
1
PSfrag repla ements x [mmy[mm(a) Normalized density plot of the simu-lated positron endpoint positions. 0 0.2 0.4 0.6 0.8 1
0
0.5
1
1.5
2
PSfrag repla ements ounts[a.u.|r| [mm(b) Histogram of the distan es |r| from the enter ofthe sour e to the positron endpoint positions. Thelarger relative errors for small |r| are due to the nor-malization of the bin ontents.Figure 7.5: Simulated positron endpoint distribution of the test sour e.the ir umferen e and therefore the ounts in ea h bin grow with the radius. The simulation results aredisplayed in gure 7.5(b). In order to ompute the FWHM from the histograms of the radii, the followingempiri al model distribution
N(|r|) = a + b arctan(d + c |r|) (7.1)was least-square tted to the data (gure 7.5(b)). The obtained best-t parameters are:a = 830 ± 26, b = 580 ± 18, c = −13.9± 0.8 mm−1, d = 6.3 ± 0.4. (7.2)Equation 7.1 an be easily inverted for nding the FWHM of the distribution:|r|FWHM = −
(
d + tan(a−b arctan(d)2 b )
c
)
, (7.3)and leads to the nal result for the ee tive sour e diameterdeff = 2|r|FWHM = 0.92 ± 0.15 mm. (7.4)7.1.2 Model Distribution for Event Statisti sAs mentioned in the introdu tion of this hapter, another experimental di ulty in the setup is imposedby the fa t that one annot easily prepare a measurement for the distribution moments at well dened101

7.1 Experimental Setup
0.2 0.3 0.4 0.5 0.60
2
4
6
8
10
12
14
PSfrag repla ements e−αz
a b
z [a.u.Counts[a.u.(a) Sket h of the derivation of the model distributionfor the se ond moment of the dete ted events. 0.2 0.3 0.4 0.5 0.6
0
2
4
6
8
10
12
14
PSfrag repla ements e−αz
a b
z [a.u.Counts[a.u.(b) Resulting model distribution.
0 2 4 6 80
0.2
0.4
0.6
0.8PSfrag repla ementsz [a.u.Counts[a.u. ( ) Sample distributions for A =
10, a = 2, b = 6, α = 0.1 andσ = ≃ 0, 0.2, 0.4, . . . , 1.4. 0 2 4 6 8
0
0.5
1
1.5
2PSfrag repla ementsz [a.u.Counts[a.u. (d) Sample distributions for A =
10, a = 2, b = 6, σ = 0.2 and α =≃ 0, 0.1, 0.2, . . . , 1.1. 0 2 4 6 8
0
0.2
0.4
0.6
0.8PSfrag repla ementsz [a.u.Counts[a.u. (e) Sample distributions for A =
10, a = 2, σ = 0.4 and α = 0.1b = 2.5, 3, 3.5, . . . , 6.Figure 7.6: Graphi al illustration for the derivation of the t model. Thelower gures illustrate the hange of the shape for variations in some of theparameters. Note that the parameters do not have subs ripts referring tothe position or moment spa e be ause this general behavior does not dependon the hoi e of representation spa e.intera tion depths. Unfortunately, one is only able to dene the impa t position along the two spatialdire tions that are normal to the γ-ray beam. The position of intera tion along the remaining dire tionparallel to the beam is subje ted to the random pro esses of photoabsorption and Compton s attering. Forthi k s intillation rystals one therefore fa es a large un ertainty in this third position omponent whilethinner rystals produ e a lower un ertainty. However, the attempt to redu e the rystal thi kness wouldlead to lower intera tion probability (e ien y) and would learly hange the opti al behavior of the rystal.Another possibility onsists of properly dening the depth of intera tion and one of the spatial dimen-sions x or y. This an be a hieved experimentally when a γ-ray beam parallel either to the x-axis or the
y-axis enters the rystal at one of the small sides normal to the sensitive area. The remaining omponentof the impa t position an be measured su iently well by means of the enter of gravity algorithm, sin eno superposition from dierent depths o urs. An important drawba k of this method is the attenuationof the γ-ray beam along the indeterminate spatial dire tion. Espe ially for large-sized rystals this leadsto low statisti s at the side opposite to the γ-ray sour e. Furthermore, it does not allow fast and handy alibrations of the dete tor.The depth enhan ed harge dividing ir uits presented in hapter 5 allow for a more suitable approa hsin e all three spatial omponents of the impa t position an be measured simultaneously, provided that thespatial resolution is su iently good and the dependen y of the se ond moment on the depth of intera tionis known and su iently pronoun ed. In this ase, one expe ts a hara teristi distribution of the se ondmoment whi h has to be a superposition of the dete tor response at all possible intera tion depths. Bymaking the following assumptions, an adequate model for the distribution of the se ond moment wasderived. First, it is supposed that there is a onstant intrinsi resolution for the spatial dire tion parallel102

7 Experimental Verifi ationto the γ-ray beam. This is learly only an approximation sin e there are various possible ee ts that anmake this intrinsi resolution depend on the position. However, the superposition requires integration overthe rystal's spatial extension along z-axis and, therefore, does not admit very sophisti ated integrands.Furthermore, the dete tor's response fun tion for an exa tly dened depth of intera tion is expe ted tohave Gaussian shape and width 2σ. The se ond assumption is that the se ond moment at all points(x, y) depends linearly on the depth of intera tion. This allows for linear transformations of the integrationvariable and legitimates the use of the model for the se ond moment instead of the true depth of intera tion.Eviden e for this se ond assumption has been reported by Anti h et al. [178 and was also predi ted by themodel derived in hapter 4 (refer to gures 4.10(a)-4.10(d) in se tion 4.2).The γ-ray beam's intensity de reases exponentially due to the attenuation within the rystal. There-fore, the amplitudes of the Gaussians de rease with in reasing depth of intera tion and one obtains the onvolution
Dm(zm) =Amαm√2 π σm
bm∫
am
exp
−αm(zm′ − am) − (zm − zm
′)2
2 σ2m
dzm′, (7.5)where αm is the attenuation oe ient of the s intillation rystal for the γ-ray energy of interest, and amand bm are the upper and lower limits of the rystal respe tively. Outside of these limits one does notexpe t any events and the distribution is equal to zero. The subs ript m indi ates that all parametersin equation 7.5 are understood to refer to the moment spa e. Figure 7.6(a) illustrates the integral inequation 7.5. An expli it form is obtained by resolving the previous integral:
Dm(zm) =Amαm
2exp
αm
(
am − zm +αm σ2
m
2
)[
Erf
bm − zm + αm σ2
m√2 σm
− Erf
am − zm + αm σ2
m√2 σm
]
,(7.6)where Erf stands for the error fun tion. Sin e there is a linear dependen e between the se ond momentand the depth of intera tion, the orresponding intrinsi depth resolution σp in the position spa e is givenby s aling σm . The integration limits am and bm in equation 7.5 dene with |am − bm | a measure for thetrue rystal thi kness T in the moment spa e. Therefore, in position spa e one obtains the resolutionσp = σm
T
|am − bm | . (7.7)In gures 7.6( ) - 7.6(e), plots of the model distribution for dierent parameters are shown. One anobserve that the distribution adopts a Gaussian shape for the ase |am − bm| ≪ σm. A tually, it an beseen dire tly from the denition 7.5 that the distribution approa hes a Gaussian-like shape in the limitbm → am. If αm is large ompared to σm and α−1
m ≪ |am − bm|, the distribution approa hes an exponentialde ay distribution that is horizontally shifted by am. For both these limits, ts with this spe ial modeldistribution annot produ e reliable estimates for the parameters am and bm. Clearly, these limits haveto be avoided with a proper experimental setup. In the experiment, the majority of histograms did notapproa h these limits and the t routine gave a eptable results.Note that all assumptions that were made for the derivation of the model also hold for the zerothmoment, i.e. the energy, and both rst moments (the entroids). As shown in se tion 5.8, these moments alsoexhibit depth of intera tion dependen e. In parti ular, near the rystal borders it shows the hara teristi shape displayed in the examples in gures 7.6(a)-7.6(e) and, therefore, has to be preferred to the Gaussianmodel. The model (7.6) was modied in some ases by adding a onstant or linear ba kground.Figures 7.7(a)-7.7(f) show some examples of the model tted to distributions measured with the exper-imental setup that was des ribed above. The left olumn shows best ts for the ase when the γ-ray beamentered the dete tor at the enter of the PSPMTs sensitive area (x = y = 0). The right olumn shows theresults obtained when lo ating the beam at one of the orner positions, e.g. x, y = ±19. It an be seenthat the model reprodu es well the measured distributions for both ases. All other positions will result indistributions of a form in between these two extreme ases.A more reliable method to estimate the goodness of the t results is given in Press et al. [179 and isreasoned as follows. The probability Q that a value for χ2 obtained by tting the model to experimentaldata o urs for a determinate number ν of degrees of freedom is given byQ = 1 − Γ
(ν
2,χ2
2
)
/Γ(ν
2
)
, (7.8)103

7.1 Experimental Setup0.54 0.56 0.58 0.6 0.62 0.640
10
20
30
40
PSfrag repla ementsz [a.u. ounts
(a) Se ond moment at the enter of the PSPMT,ν = 123, χ2 = 1.15, Q = 0.87. 0.2 0.25 0.3 0.35 0.4
0
20
40
60
80
PSfrag repla ementsz [a.u. ounts
(b) Se ond moment at a orner, ν = 145, χ2 = 1.37,Q = 1.
-0.15 -0.1 -0.05 0 0.05 0.1 0.150
10
20
30
40
50
60
70
PSfrag repla ementsx [a.u. ounts
( ) Dispersion of the x- oordinate at the enter,ν = 144, χ2 = 1.2, Q = 0.95. 0.6 0.65 0.7 0.75 0.8 0.85
0
10
20
30
40
50
60
70
PSfrag repla ementsx [a.u. ounts
(d) Dispersion of the x- oordinate at a orner,ν = 143, χ2 = 1.13, Q = 0.86.
2000 2200 2400 26000
10
20
30
40
PSfrag repla ements energy [a.u. ounts(e) Dispersion of the energy at the enter, ν = 145,χ2 = 1.16, Q = 0.9. 1000 1500 2000 2500 3000 3500 4000
0
25
50
75
100
125
150
PSfrag repla ements energy [a.u. ounts(f) Dispersion of the energy at a orner, ν = 113,χ2 = 1.24, Q = 0.96.Figure 7.7: Distributions of the se ond moment, x- oordinate of the entroidand energy at two dierent positions over the photo athode. True data (thinlight-gray lines) are plotted together with the best ts (bla k lines).where Γ(z) is the Euler gamma fun tion and Γ(a, z) is the in omplete gamma fun tion. The values of Q,
ν and χ2 are given together with the graphs in gures 7.7(a)-7.7(f). Note that in this estimation nothingis known about the a hieved pre ision of the best t parameters. It is possible to obtain good values forQ (Q ≃ 1) and χ2 while the errors of the adjusted parameters ould be rather large. A tually, this is the ase when the measured distributions be omes similar to the Gaussian or exponential ase. These limits ontain only poor information on a, b and σ and, thus, their errors are quite large.104

7 Experimental Verifi ation
x [a.u.]-0.4 -0.3 -0.2 -0.1 -0 0.1 0.2 0.3 0.4
sec.
mo
m. [
a.u
.]
0.7
0.72
0.74
0.76
0.78
0.8
0.82
0
2
4
6
8
10
12
14
(a) Density plot of µx2,y0 + µx0,y2 vs. µx1,y0 . x [a.u.]-0.4 -0.3 -0.2 -0.1 -0 0.1 0.2 0.3 0.4
sec.
mo
m. [
a.u
.]
0.7
0.72
0.74
0.76
0.78
0.8
0.82
0
5
10
15
20
25
(b) Density plot of µx2,y0 + µx0,y2 vs. µx0,y1 .Figure 7.8: Measured values for the se ond moment vs. the x entroid (leftgure) and the y entroid (right gure) when the test dete tor is in linedby ≈ 45° against the γ-ray beam.7.2 ResultsFirst of all, the method of depth of intera tion determination is tested using an in lined γ-ray beam. Thisin lination must be ree ted somehow in the histograms for the se ond moment and the entroids. Likewise,the broken symmetry of the light distribution that was explained in se tion 5.8.3 must be ome apparentfrom the same histograms if the γ-ray intera ts with the rystal near one of its absorbing borders. On ethis has been tested, it will be shown that the quality of the se ond moment is su iently good in order tolter subsets with similar DOI parameters out of the data.After these qualitative ross he ks, the moments measured at the 81 test positions were ompared tothe predi tions of the model for the signal distribution established in hapter 4. In addition, the possibleresolution whi h an be obtained for ea h of the lower-order moments is measured.7.2.1 Qualitative Veri ation of the MethodIn order to ross he k the presented method, the test dete tor was irradiated with an ele troni ally olli-mated γ-ray beam in lined by ≈ 45° with respe t to the z-axis. The beam was adjusted in su h a way thatits axis rossed the geometri enter of the rystal and laid in the x-z-plane. In gure 7.8(a), σm is plottedversus the x- entroid and a orrelation between these two measures is apparent. In ontrast to this, one an-not observe this orrelation for the y- entroid (gure 7.8(b)) sin e the γ-ray beam is perpendi ular to thisdire tion. Anti h et al. [178 already reported this result. They studied the possibility of using rossed-wirephotomultiplier tubes together with large-sized NaI:Tl s intillator rystals for three-dimensional positionreadout for SPECT/PET. However, they needed to digitize all 32 hannels from the Hamamatsu R2486PSPMT in order to obtain this impa t parameter. Using the enhan ed harge dividing ir uits des ribedin hapter 5, only 5 ele troni hannels were ne essary and the moments were omputed analogi ally andonline.The distribution of the measured entroids within the x-y-plane is shown in the density plot 7.9(a).There is an apparent blurring along the x-dire tion and almost none along the y-dire tion. The smallinset shows the histogram for the standard deviation of the signal distribution. In the same gure to theright, the distribution for the x- and y- entroids is shown for a γ-ray beam hitting the test dete tor at anouter orner of the photo athode. The blurring of both entroids is now aused by the ee t des ribedin se tion 5.8.3 and not by the γ-ray beam itself, be ause this time it is normal to the photo athode.The small inset shows the orresponding distribution of the se ond moment. Note that due to me hani allimitations of the experimental setup, the radioa tive sour e ould not be pla ed very lose to the dete torwhen the dete tor was in lined by ≈ 45°. Therefore, a more important blurring in all dire tions is observedin gure 7.9(a). 105

7.2 Results
x [a.u]-0.6 -0.4 -0.2 0 0.2 0.4 0.6
y [a
.u]
-0.6
-0.4
-0.2
0
0.2
0.4
0.6
0
5
10
15
20
25
σ0.7 0.75 0.8 0.850
50
100
150
200
(a) x- y- entroid distribution for in lined γ-ray beam. x [a.u]-0.6 -0.4 -0.2 0 0.2 0.4 0.6
y [
a.u
]
-0.6
-0.4
-0.2
0
0.2
0.4
0.6
0
10
20
30
40
50
60
σ0.2 0.4 0.6
0
50
100
150
200
(b) x- y- entroid distribution for γ-ray beam impingingon a orner.Figure 7.9: Density plot of the entroids that were registered when the testdete tor was in lined by an angle of ≈ 45° against the γ-ray beam (l.h.s.)and when the ollimated γ-ray was positioned at (x, y) = (19, 19) mm, i.e.at only 2 mm from the rystals borders (r.h.s.). The small insets show the orresponding σm distributions.The information that is given for ea h dete ted event with the se ond moment (or alternatively thestandard deviation) an be used for ltering out events with a spe i se ond moment. This is illustratedin gures 7.10(a)-7.10(f). In the left olumn, three density plots for the x- and y- entroids are displayed.The shaded regions of the histograms in the small insets indi ate those events that are sele ted for displayin large density plots. This was repeated for three hara teristi subsets of σm-values (low, medium andhigh). By this means, the long spot in gure 7.9(a) ould be fragmented into three smaller spots of almost ir ular shape. The same pro edure was repeated for the normal γ-ray beam impinging on an outer ornerof the photo athode. On e again, a lear dis rimination of subsets of similar x- and y- entroids is possible.All observed ee ts in these preliminary experiments an be easily explained assuming that:1. the signal distribution behaves like the analyti model derived in hapter 4,2. the enhan ed harge divider ir uit presented in hapter 5 measures indeed the se ond moment, and3. the arguments given for deriving the t model (expression 7.6) in fa t des ribe the steps of theformation of this distribution.Throughout the rest of the present work it is therefore assumed that the se ond moment (or alternativelythe standard deviation) is appropriate for estimating the depth of intera tion.7.2.2 Validity of the Model for the Signal DistributionIn order to test the a ura y of the analyti model for the signal distribution, some further ee ts have tobe taken into a ount. The model in ludes the most important physi al ee ts until the s intillation lightis absorbed, with or without its dete tion. In addition, the photomultiplier is assumed to behave as ideal.That is, neither photoemission from the dynode-system, nor ree tions inside the PSPMT, nor ee ts likedark- urrent are onsidered. A tually, photomultipliers behave almost ideally in many aspe ts.After the photoemission of an ele tron, it is attra ted by the strong ele tri potential of the rst dynodewhere its impa t auses various se ondary ele trons. In the ase of the H8500 from Hamamatsu, thispro ess is repeated twelve times be ause it has twelve dynode stages. The spe ial design of these dynodes106

7 Experimental Verifi ation
x [a.u]-0.6 -0.4 -0.2 0 0.2 0.4 0.6
y [a
.u]
-0.6
-0.4
-0.2
0
0.2
0.4
0.6
0
1
2
3
4
5
6
7
8
9
σ0.7 0.75 0.8 0.850
50
100
150
200
(a) Events (in lined beam) with low σm. x [a.u]-0.6 -0.4 -0.2 0 0.2 0.4 0.6
y [a
.u]
-0.6
-0.4
-0.2
0
0.2
0.4
0.6
0
5
10
15
20
25
30
σ0.5 0.6 0.7 0.8
0
50
100
150
(b) Events (beam at orner) with low σm.
x [a.u]-0.6 -0.4 -0.2 0 0.2 0.4 0.6
y [a
.u]
-0.6
-0.4
-0.2
0
0.2
0.4
0.6
0
2
4
6
8
10
12
14
16
18
σ0.7 0.75 0.8 0.850
50
100
150
200
( ) Events (in lined beam) with medium σm. x [a.u]-0.6 -0.4 -0.2 0 0.2 0.4 0.6
y [a
.u]
-0.6
-0.4
-0.2
0
0.2
0.4
0.6
0
5
10
15
20
25
30
35
40
σ0.5 0.6 0.7 0.8
0
50
100
150
(d) Events (beam at orner) with mediumσm.
x [a.u]-0.6 -0.4 -0.2 0 0.2 0.4 0.6
y [a
.u]
-0.6
-0.4
-0.2
0
0.2
0.4
0.6
0
2
4
6
8
10
12
14
16
18
σ0.7 0.75 0.8 0.850
50
100
150
200
(e) Events (in lined beam) with high σm. x [a.u]-0.6 -0.4 -0.2 0 0.2 0.4 0.6
y [a
.u]
-0.6
-0.4
-0.2
0
0.2
0.4
0.6
0
10
20
30
40
50
60
σ0.5 0.6 0.7 0.8
0
50
100
150
(f) Events (beam at orner) with high σm.Figure 7.10: Density plots for the same data displayed in gure 7.9 but nowthe additional moment is used to separate the events into subsets of similarσm. The gray shaded areas in the small insets mark the events that aresele ted for display in the large density plots. 107

7.2 Resultsprovides for low transverse dispersion of the ele tron avalan hes. These are nally olle ted by the 8 × 8anode pads. The size and pit h of the anode pixels are found to be 5.8 × 5.8 mm2 and 6.08 mm respe tively[168. However, the ee tive sensitive area of the devi e (49 × 49 mm2) is larger than 64 × 5.8 × 5.8 mm2or 64 × 6.08 × 6.08 mm2. This is be ause the ele tron avalan hes an be fo used towards the anode padsand the small gaps between them are not riti al. Dividing the ee tive area by the total number of pixels,one an dene the ee tive pixel size LASeff , area AAS
eff and pit h PASeff to be 6.125 mm, 6.125 × 6.125 mm2 and
6.125 mm, respe tively.The parti ular ombination of photo athode, fo using dynodes and anode matrix onguration performsan integration by intervals of the s intillation light. The intervals are dened by the ee tive pixel sizeLAS
eff and its position. The integration gives a set of 64 positive numbers that orrespond to the amountsof s intillation light dete ted at ea h of the 64 equal-sized segments of the photo athode. It was alreadymentioned that the light sensitivity an vary signi antly from one anode segment to another. The typi alvalue for this uniformity is given by the manufa turer and is of the order of 1:3. Eventually ratios as high as1:6 an be rea hed. Therefore, an anode uniformity map is provided with ea h delivered PSPMT. In orderto obtain reasonable predi tions of the dete tor energy response behavior, one has to multiply ea h of the64 values obtained by integration with the relative anode sensitivity εi,j of the segment that orrespondsto this integration interval.From this set of orre ted numbers, the moments an now be omputed. The energy µx0,y0(rc) isobtained by simply summing up all 64 orre ted numbers. For omputing the entroids and the se ondmoment, the numbers have to be multiplied with linear and quadrati weights respe tively before buildingthe sum. Sin e it was shown there that all ongurations of harge dividers an be ongured to reprodu ean exa t linear weighting along both transverse dire tions, the weights for the entroids (normalized rstorder moments) are nothing but the enter positions of the anode segments. The situation for the se ondmoment is more omplex due to several reasons. First of all, one has to de ide whi h type of se ond momentis appropriate. By denition (5.7), many se ond moments are possible in the multivariate ase, e.g. µx2,y0 ,µx0,y2 , µx2,y2 et .. Due to limitation by ele troni design, minimum ost requirements and the desire tomaximize the SNR of the measured moment, the omposite se ond moment (µx2,y0 + µx0,y2)(rc) is hosen.In the ideal ase, the weights would then be given by the sum of squares of the anode enter positions:(x2
i,j + y2i,j). However, this behavior an only be approximated with the harge divider onguration thatuses proportional resistor hains. Therefore, higher orders and mixed terms of the enter position alsoo ur. Furthermore, the ele troni signals have to be amplied and prepared for integration, introdu ing orre tions that would be far too omplex to be treated analyti ally. For these reasons, the impulse responseof the ir uitry for the se ond moment omputation for ea h of the 64 segments was simulated using the ir uit simulation program Spi e. The response was tted using a polynomial Ansatz W(x, y) onsistingof even orders of x and y as well as their mixed ontributions, and with the following result:
W(x, y) ≈ 906 − 30x2 − 37y2 + 0.09y2x2 − 0.008x4 + 0.001y4 − 8 · 10−8y4x4. (7.9)All mathemati al operations performed by the PSPMT as part of the present γ-ray imaging dete tor an now be written in the formµx0,y0(rc) =
∑
i,j
εi,j
x
ωi,j
LDetector(r, rc) dxdy (7.10)µx1,y0(rc) =
1
µx0,y0(rc)
∑
i,j
xi,jεi,j
x
ωi,j
LDetector (r, rc) dxdy (7.11)µx0,y1(rc) =
1
µx0,y0(rc)
∑
i,j
yi,jεi,j
x
ωi,j
LDetector (r, rc) dxdy (7.12)(µx2,y0 + µx0,y2)(rc) =
1
µx0,y0(rc)
∑
i,j
εi,jW(xi,j , yi,j)x
ωi,j
LDetector (r, rc) dxdy. (7.13)The values for all parameters of the signal distribution LDetector (r, rc) together with the onguration ofthe enhan ed harge divider ir uit was des ribed in se tion 7.1. The ele troni amplier onguration issket hed in appendix D. Figures 7.11(a)-7.11(d) graphi ally represent the weights for the entroids, these ond moment and the anode uniformity.The moments were then omputed numeri ally for the 81 dierent transverse positions (x, y), withx, y ∈ [±19,±14.25,±9.5,±4.75, 0] mm and at the two limit values for the depth of intera tion zc = 0 and108

7 Experimental Verifi ation
12345678
12345678
-20
-10
0
10
20
12345678PSfrag repla ements
ii
j
xi,j
(a) Weights for the x- entroid.12345678
1 2 3 4 5 6 7 8
-20
-10
0
10
20
12345678
-20
-10
0
10
PSfrag repla ements ii
j
yi,jyi,j
(b) Weights for the y- entroid.12345678
1 2 3 4 5 6 7 80
5
10
15
12345678
0
5
10PSfrag repla ementsii
j
W(x
i,j,y
i,j)
W(x
i,j,y
i,j)
( ) Weights for the omposite se ond mo-ment (divided by 103).12345678
1 2 3 4 5 6 7 80
0.25
0.5
0.75
1
12345678
0
0.25
0.5
0.75
PSfrag repla ements ii
j
εi,jεi,j
(d) Relative sensitivity of the anode seg-ments.Figure 7.11: Weights for the entroids and the omposite se ond moment(7.11(a)-7.11( )). Figure 7.11(d) shows the relative anode sensitivity of theparti ular PSPMT H8500 from Hamamatsu.zc = 10. The data obtained from the measurement of the dierent moments at these positions are, however,distributions of all possible values of zc between these two limits. One an obtain these limits (parametersa and b) from the experimental data by means of the t model (expression 7.6) des ribed in se tion 7.1.2.In order to ompare the parameters a and b to the omputed moments for the limits zc = 0 and zc = 10one has to take into a ount that the analog-to-digital onversion introdu es a global and linear shift ofthe measured moments whi h is very di ult to predi t analyti ally. The ADC module internally shapes,delays and integrates the urrent pulses fed into their inputs before the analog-to-digital onverter maps thearea to an integer of the interval ]0, 4096[ (0 and 4096 are reserved for under- and overows, respe tively).This sequen e of transformations produ es both a global oset tADC and a global proportionality onstantmADC. The determination of these parameters is best done by minimizing the sum of dieren es sin e themeasurements are subje ted to statisti al errors. Hen e, the following sum is dened:
ζµ := 9∑
i
9∑
j
[(ameas
i,j − mADC · µi,j |(zc=10) − tADC)2 +(bmeasi,j − mADC · µi,j |(zc=0) − tADC)2] . (7.14)Here, µ stands for one of the four moments µx0,y0(rc), µx1,y0(rc), µx0,y1(rc) and (µx2,y0(rc) + µx0,y2)(rc),109

7.2 Resultsea h having its own pair of transformation parameters mADC and tADC. That is, the sum in equation (7.14)has to be omputed four times. The optimum values for mADC and tADC of ea h moment are given by thosethat minimize ζµ. Table 7.1 summarizes the results for a signal model without diuse ree ted ba kgroundlight and another in luding the latter ontribution.µ mADC tADC
µx0,y0(rc) 1.124 875
µx1,y0(rc) 0.954 −0.434
µx0,y1(rc) 0.947 0.225
(µx2,y0 + µx0,y2)(rc) 2.774 · 10−5 0.204
µ mADC tADCµx0,y0(rc) 0.866 608
µx1,y0(rc) 1.053 −0.78
µx0,y1(rc) 1.06 0.196
(µx2,y0 + µx0,y2)(rc) 3.471 · 10−5 0.165Table 7.1: S aling of the theoreti al moment predi tions for a signal distri-bution without ree ted ba kground (l.h.s.) and a signal distribution withree ted ba kground (r.h.s.).In gures 7.12(a)-7.13(h), the measured and predi ted values are displayed for a model that in ludesthe ree tive ba kground dis ussed in se tion 4.1.6. For larity, the predi ted values (gray dashed line) aredisplayed in 2D-plots together with the measured data (bla k data points) and in the order illustrated ingure 7.4. The right olumn of plots shows the deviation between the model predi tion and the measuredvalues (light-gray solid lines), displayed together with the measurement errors (dashed bla k lines).An important observation is that the model distribution derived in hapter 4 reprodu es very well thespatial dependen e of the three non-trivial moments. In the ase of the zeroth moment, i.e. the energy,the agreement was, however, poorer. The model fails to reprodu e orre tly the details of the energyvariation over the sensitive area espe ially for the upper limit in the intera tion distan e (zc = 10). Notethat this ae ts the non-trivial moments only marginally be ause the aim of normalization is to suppressthe dependen y on the trivial moment. The measured entroids (gures 7.12(a)-7.12(h)) exhibit errorsat the entral positions that are mu h larger than the dis repan y between predi tion and measurement.Most likely this is aused by the fa t that the parameters a and b annot be estimated very well with thet model (7.6) when the distribution are nearly of Gaussian shape. In the ase of the omposite se ondmoment (gures 7.13(a)-7.13(d)), it is observed that the agreement between model and measurement ismu h better in the limit zc = 0 (parameter b) than in the limit zc = 10 (parameter a). Sin e this alsoo urs for the zero-order moment (gures 7.13(e)-7.13(h)), it has to be assumed that the model for theba kground light does not reprodu e well the distribution of the additional light. However, a model withthe ba kground light swit hed o, fails ompletely to predi t the trivial moment (gures 7.14(a)- 7.14(d)).Therefore, a detailed study of the ree tion properties is ne essary in order to nd a more reasonableba kground model.Other reasons for the remaining deviations between measurements and those obtained from the theoret-i al model are Compton s attering as des ribed in hapter 6, la k of me hani al pre ision and possible lightree tions inside the PSPMT, e.g. at the dynode system and the housing. In parti ular, the me hani altoleran e may be of relevan e. While the pre ision of the motorized translation stage used (10 µm) is su- iently good for our purposes, the remaining parts of the me hani al setup like housing, sour e holder andtest dete tor mounting, not only miss this pre ision but are estimated to introdu e errors in the transversedire tions up to 1 mm. This pre ision has to be signi antly in reased if a model with higher a ura y isrequired. Table 7.2 summarizes some statisti estimators of all observed measurement errors and deviationsbetween model (with residual ree tions) and measurement. Ex ept for the entroids, relative errors areused. Absolute errors have been preferred for the entroids be ause at nominal positions around 0, therelative error of the entroid will diverge even for very small absolute errors. All relative errors are of theorder of 10%, while the absolute errors of the entroid are about 1 mm. Note that this orresponds to theestimated me hani al un ertainty of the test dete tor assembly.For the ase of a model without diuse ree tions, only the results for the zeroth order moment havebeen plotted (gure 7.14(d)). The results for the other moments are very similar to the ase with ree tedba kground and their errors of the same order. A tually, this model was only applied to demonstrate thateven for very low ree tan eivity of the absorbing oatings, residual ree tions on these surfa es annot benegle ted if the model is also required to yield good agreement for the trivial moment.110

7 Experimental Verifi ation0 20 40 60 80
-20
-15
-10
-5
0
5
10
15
PSfrag repla ements position #value[mm(a) Parameter a of µx1,y0 (values). 0 20 40 60 80
0
0.5
1
1.5
2
PSfrag repla ements position #abs.error[mm (b) Parameter a of µx1,y0 (errors).0 20 40 60 80
-15
-10
-5
0
5
10
15
PSfrag repla ements position #value[mm( ) Parameter b of µx1,y0 (values). 0 20 40 60 80
0
0.5
1
1.5
2
2.5
PSfrag repla ements position #abs.error[mm (d) Parameter b of µx1,y0 (errors).0 20 40 60 80
-15
-10
-5
0
5
10
15
PSfrag repla ements position #value[mm(e) Parameter a of µx0,y1 (values). 0 20 40 60 80
0
0.5
1
1.5
2
2.5
PSfrag repla ements position #abs.error[mm (f) Parameter a of µx0,y1 (errors).0 20 40 60 80
-10
-5
0
5
10
15
PSfrag repla ements position #value[mm(g) Parameter b of µx0,y1 (values). 0 20 40 60 80
0
0.5
1
1.5
2
2.5
3
3.5
PSfrag repla ements position #abs.error[mm (h) Parameter b of µx0,y1 (errors).Figure 7.12: Comparison between measurements (errors only at the lefthand side) and theoreti al predi tions for both entroids in the limits zc = 0and zc = 10. The model signal distributions used in lude residual ree tionsat the absorbing surfa es. 111

7.2 Results0 20 40 60 80
0.35
0.4
0.45
0.5
0.55
PSfrag repla ements position #value[a.u.(a) Parameter a of µx2,y0 + µx0,y2 (values). 0 20 40 60 80
0
0.02
0.04
0.06
0.08
0.1
PSfrag repla ements position #rel.error[%(b) Parameter a of µx2,y0 + µx0,y2 (errors).
0 20 40 60 80
0.3
0.4
0.5
0.6
PSfrag repla ements position #value[a.u.( ) Parameter b of µx2,y0 + µx0,y2 (values). 0 20 40 60 80
0
0.02
0.04
0.06
0.08
0.1
PSfrag repla ements position #rel.error[%(d) Parameter b of µx2,y0 + µx0,y2 (errors).
0 20 40 60 801750
2000
2250
2500
2750
3000
3250
3500
PSfrag repla ements position #value[ h.(e) Parameter a of µx0,y0 (values). 0 20 40 60 80
0
0.05
0.1
0.15
0.2
0.25
PSfrag repla ements position #rel.error[%(f) Parameter a of µx0,y0 (errors).
0 20 40 60 80
1250
1500
1750
2000
2250
2500
2750
PSfrag repla ements position #value[ h.(g) Parameter b of µx0,y0 (values). 0 20 40 60 80
0
0.05
0.1
0.15
0.2
0.25
PSfrag repla ements position #rel.error[%(h) Parameter b of µx0,y0 (errors).Figure 7.13: Comparison between measurements (errors only at the lefthand side) and theoreti al predi tions for energy and omposite se ond mo-ment in the limits zc = 0 and zc = 10. The model signal distributions usedin lude residual ree tions at the absorbing surfa es.112

7 Experimental Verifi ation0 20 40 60 80
1750
2000
2250
2500
2750
3000
3250
3500
PSfrag repla ements position #value[ h.(a) Parameter a of µx0,y0 (values). 0 20 40 60 80
0
0.05
0.1
0.15
0.2
PSfrag repla ements position #rel.error[%(b) Parameter a of µx0,y0 (errors).
0 20 40 60 80
1250
1500
1750
2000
2250
2500
2750
PSfrag repla ements position #value[ h.( ) Parameter b of µx0,y0 (values). 0 20 40 60 80
0
0.1
0.2
0.3
0.4
PSfrag repla ements position #rel.error[%(d) Parameter b of µx0,y0 (errors).Figure 7.14: Comparison between measurements (errors only at the lefthand side) and theoreti al predi tions for energy in the limits zc = 0 and
zc = 10. The model signal distributions used do not in lude residual ree -tions at the absorbing surfa es.moment p. model-measure deviation measurement error unitMean StdDev Min Max Mean StdDev Min Maxµx0,y0 a 3.8 4.2 0.1 27.8 5.7 3.6 <0.1 24.4 %µx0,y0 b 9.0 5.9 <0.1 26.4 6.6 3.8 <0.1 25.1 %µx1,y0 a 0.48 0.25 0.04 1.03 1.01 0.53 0.24 2.42 mmµx1,y0 b 0.49 0.34 <0.01 1.24 1.08 0.56 0.26 2.67 mmµx0,y1 a 0.37 0.25 <0.01 1.15 1.19 0.65 0.17 2.76 mmµx0,y1 b 0.49 0.38 0.01 1.43 1.16 0.65 0.21 3.62 mm
µx2,y0 + µx0,y2 a 3.1 2.3 0.2 11.2 1.7 1 0.1 5.3 %µx2,y0 + µx0,y2 b 2.7 2.2 <0.1 11.4 1.8 1.1 0.2 6.2 %Table 7.2: Statisti estimators for the errors of the limit parameters a and
b of all four moments. Relative errors are given ex ept for the entroids,where absolute errors have been preferred.7.2.3 Moments as 3D Position EstimateAt the end of this hapter, an estimation is given of what 3D-spatial resolution an be expe ted from thepresented dete tor setup if the raw moments were used as position estimates. While it has been reportedelsewhere (Clan y et al. [180, Joung et al. [165, Tavernier et al. [166) that this is not satisfa tory for manyreasons, the results are given here not only for ompleteness. Instead, the availability of an analogi ally omputed se ond moment that an be used to estimate the depth of intera tion via the standard deviationis an interesting extension of the onventional Anger logi . Unfortunately, this new estimate suers from113

Referen esthe same problems as the entroids: as the γ-ray's impa t position gets loser to one of the borders, thelight distribution is distorted and the moment is subje ted to an additional variation not aused by theintera tion depth. The following hapter will treat this problem by presenting an algorithm for re overingthe true three-dimensional impa t position from the set of moments.In order to obtain the standard deviation σID from the three non-trivial and normalized moments µx1,y0 ,µx2,y1 and µx2,y0 + µx0,y2 , the denition of the varian e for two dimensions an be applied only with somemodi ations:
var(X + Y ) = var(X) + var(Y ) + 2 cov(X, Y )
= E(X2) − E(X)2 + E(Y 2) − E(Y )2 + 2E [(X − E(X))(Y − E(Y ))]
= E(X2) + E(Y 2) − E(X)2 − E(Y )2 + 2E(XY ) − E(X)E(Y ),
(7.15)where E(A) denotes the expe tation value of A. Note that E(X2) + E(Y 2) is just the additional momentµx2,y0 + µx0,y2 provided by the enhan ed harge divider. E(X) and E(Y ) are the entroids µx1,y0 andµx0,y1 , respe tively. However, one has to take into a ount that dierent ele troni amplier designs (referto Appendix D) are used for the entroids and for the omposite se ond moment. Therefore, they arrive withdierent gain-fa tors at the ADC-module. Moreover, as it was dis ussed before in this se tion and also inse tion 5.4, proportional resistor hains do not provide exa tly the se ond moment, but also in lude higherthan quadrati orders. We dene, therefore, the ID-estimator σID as the square root of the omposite se ondmoment µx2,y0 + µx0,y2 , redu ed by the transverse dependen y W(µx1,y0 , µx0,y1) dened in equation (7.9):
σID := √
(µx2,y0 + µx0,y2) −W(µx1,y0, µx0,y1). (7.16)For measuring the three-dimensional resolution of the dete tor, model (7.6) is tted to the histogramsof the entroids and the energy for all 81 test positions. The FWHM is omputed from the best t urvesand its error is estimated by applying standard error propagation. Equation (7.7) with the orrespondingerror propagation was used for the bare se ond moment µx2,y0 +µx0,y2 and σID. Sin e the entroids alwaysreprodu e a ompressed image of the radioa tive sour es, they have to be expanded by applying the inverseof the position-to- entroid mapping. However, not only the enter-position is shifted in this way but thepoint-spread fun tion is also proportionally blurred. This expansion has to be applied to the FWHMs of the entroid distributions and the FWHMs also have to be orre ted for the nite sour e diameter (7.4). Theresults are displayed in gures 7.15(a)-7.16(d). As expe ted, the energy and entroid resolutions degrade onsiderably towards the edges and borders of the rystal. The values for µx2,y0 + µx0,y2 and σID likewisedepend strongly on the transverse oordinates. Nevertheless, a good depth of intera tion estimate is givenby σID, rea hing a mean DOI resolution of ≈ 5 mm and its best value of 1.8 mm at the enter. This a highresolution in omparison with the methods dis ussed in se tion 3.4.1. The resolution of the bare se ondmoment be omes very poor at ertain test positions. These positions are part of a onne ted region of thePSPMT's sensitive area, at whi h the resolution of this moment is subje ted to strong variations. Thisee t an be easily explained by the fa t that the parabolas of the bare se ond moments for dierent DOIsinterse t at this parti ular region. As a onsequen e, even large variations of the intera tion depth leadonly to very small variation for this moment, although the intrinsi width of the point-spread fun tion forthe DOI remains the same. Then, the denominator of equation (7.7) be omes very small and this explainsthe observed large values (see also Ler he et al. [181).Mean values, standard deviations, maximum and minimum values for the resolutions of the ve momentsare summarized in table 7.3.Referen es[162 W. M. Moses and S. Derenzo, Design studies for a PET dete tor module using a PIN photodiode tomeasure depth of intera tion, IEEE Trans. Nu l. S i., vol. 41, no. 4, pp. 14411445, Aug. 1994.[163 J. Huber, W. Moses, M. Andrea o, M. Loope, L. Mel her, and R. Nutt, Geometry and surfa etreatment dependen e of the light olle tion from LSO rystals, Nu l. Instr. and Meth. A, vol. 437,pp. 374380, 1999.114

Referen es
0 20 40 60 8010
20
30
40
50
60
70
PSfrag repla ements position #∆
E
[%(a) Measured energy resolution at the 81 positions.
-18-12
-60
612
18 -18
-12
-6
061218
2030
40
-18-12
-60
612
18
PSfrag repla ementsxx
y
∆E
[%(b) 2D-dependen y of the energy resolution.
0 20 40 60 80
5
10
15
20
PSfrag repla ements position #
∆X
[mm( ) Measured X resolution at the 81 positions.
-18-12
-60
612
18 -18
-12
-6
061218
5101520
-18-12
-60
612
18
PSfrag repla ementsxx
y∆
X
[mm(d) 2D-dependen y of X resolution.
0 20 40 60 80
5
10
15
20
PSfrag repla ements position #
∆Y
[mm(e) Measured Y resolution at the 81 positions.
-18-12
-60
612
18 -18
-12
-6
061218
5101520
-18-12
-60
612
18
PSfrag repla ementsxx
y
∆Y
[mm(f) 2D-dependen y of Y resolution.Figure 7.15: Measured resolutions for the x- and y- entroid and the energy.To the left; the values are displayed with error bar. To the right, 2D-plots areshown for better re ognition of the fun tional dependen e on the transverse oordinates.[164 J. Correia, C. Burnham, D. Kaufman, and A. Fis hman, Development of a Small Animal PETImaging Devi e with Resolution Approa hing 1 mm, IEEE Trans. Nu l. S i., vol. 46, no. 3, pp.631635, June 1999. 115

Referen es
0 20 40 60 800
20
40
60
80
PSfrag repla ements position #µx2,y
0+
µx0,y
2
[mm(a) Measured resolution of the bare se ond moment at the 81positions.
-18-12
-60
612
18 -18
-12
-6
061218
0255075
100
-18-12
-60
612
18
PSfrag repla ementsxx
yµx2,y
0+
µx0,y
2
[mm(b) 2D-dependen y of the resolution of the barese ond moment.
0 20 40 60 80
2
4
6
8
10
PSfrag repla ements position #
σ
ID[mm( ) Measured the resolution of σID at the 81 positions.
-18-12
-60
612
18 -18
-12
-6
061218
2468
-18-12
-60
612
18
PSfrag repla ementsxx
y
σID[mm(d) 2D-dependen y of the resolution of σID.Figure 7.16: Measured resolutions for the µx2,y0 + µx0,y2 and σID. To theleft; the values are displayed with error bar. To the right, 2D-plots areshown for better re ognition of the fun tional dependen e on the transverse oordinates. Moment Mean StdDev Min Max Unit
µx0,y0 24.9 8.8 16.6 71.2 %µx1,y0 3.4 3.2 1.4 20.9 mmµx0,y1 3.3 3.1 1.3 19.9 mm
µx2,y0 + µx0,y2 15.9 23 2.2 73.1 mmσID 4.9 1.8 1.9 9.0 mmTable 7.3: Mean, standard deviation, maximum and minimum values forthe resolutions of the dierent moments.[165 J. Joung, R. Miyaoka, and T. Lewellen, Mi e: a high resolution animal PET using ontinuous LSOwith a statisti s based positioning s heme. Nu l. Instr. and Meth. A, vol. 489, pp. 584598, 2002.[166 S. Tavernier, P. Bruyndon kx, S. Leonard, and O. Devroede, A high-resolution PET dete tor basedon ontinuous s intillators, Nu l. Instr. and Meth. A, vol. 537, pp. 321325, 2005.[167 C. Mel her and J. S hweitzer, A promising new s intillator: erium-doped lutetium oxyorthosili ate,116

Referen esNu l. Instr. and Meth. A, vol. 314, pp. 212214, 1992.[168 Hamamatsu Photoni s K. K., Flat-Panel type multianode photomultiplier tube assembly H8500,data sheet, http://www.hamatsu. om/.[169 Hamamatsu Photoni s K. K., private ommuni ation.[170 D. Motta and S. S hönert, Opti al properties of bialkali photo athodes, Nu l. Instr. and Meth. A,vol. 539, no. 1-2, pp. 217235, Feb. 2005.[171 Hamamatsu Photoni s K. K., High Voltage Power Supply Unit C4900 Series, data sheet,http://www.hamatsu. om/.[172 S. Siegel, R. Silverman, Y. Shao, and S. Cherry, Simple harge division readouts for imaging s in-tillator arrays using a multi- hannel PMT, IEEE Trans. Nu l. S i., vol. 43, no. 3, pp. 16341641,June 1996.[173 K. Lau kner, P. Crespo, W. Enghardt, J. Pawelke, and G. Kraft, A LSO-based s anner for in-beamPET: A feasibility study, O t. 2001.[174 J. Huber, W. Moses, W. Jones, and C. Watson, Ee t of 176Lu ba kground on singles transmissionfor LSO-based PET ameras, Phys. Med. Biol., vol. 47, pp. 17, 2002.[175 V. Zavarzin andW. Earle, A 500k event/se 12-bit ad system with high-speed buered p i interfa e,IEEE Trans. Nu l. S i., vol. 46, p. 414, 1999.[176 F. Sán hez, private ommuni ation.[177 R. Brun and F. Carminati, GEANT dete tor des ription and simulation tool, 1994, CERN ProgramLibrary, W5013.[178 P. Anti h, N. Malakhov, R. Parkey, N. Slavin, and E. Tsyganov, 3D position readout from thi ks intillators, Nu l. Instr. and Meth. A, vol. 480, pp. 782787, 2002.[179 W. H. Press, S. A. Teukolsky, W. T. Vetterling, and B. P. Flannery, Numeri al Re ipes in C, 2nd ed.Cambridge University Press, 1992.[180 R. Clan y, C. Thompson, J. Robar, and A. Bergman, A simple te hnique to in rease the linearityand eld-of-view in position sensitive photomultiplier tubes. IEEE Trans. Nu l. S i., vol. 44, no. 3,pp. 494498, June 1997.[181 C. W. Ler he, J. M. Benllo h, F. Sán hez, N. Pavón, B. Es at, E. N. Gimenez, M. Fernández, I. Torres,M. Giménez, A. Sebastià, and J. Cerdá, Depth of intera tion within ontinuous rystals from thewidth of its s intillation light distribution, IEEE Trans. Nu l. S i., vol. 52, no. 3, pp. 560572, June2005.
117

Referen es
118

8 3D-Impa t Position Re onstru tion8 3D-Impa t Position Re onstru tionImagination is t real and eternal world of whi this getable unirse isbut a faint sw. Wiiam Blake, ⋆ 1757 † 1827AS mentioned in hapter 2, the reason for using large-sized ontinuous s intillation rystals1 is mainlyfounded in the aim to redu e the ost of γ-ray imaging dete tors. Clearly this an only be justiedif there is no signi ant loss in the performan e of the dierent hara terizing parameters. With thedevelopment of the blo k dete tor by Nutt and Casey [182, a promising te hnique for building PETs anners appeared. Sin e the intrinsi spatial resolution of the γ-ray imaging dete tor an be obtained bysele ting an adequate size of the rystal element, this design has been adopted by several resear h groupsfor use with small animal positron emission tomography. There have been some alternative eorts to use ontinuous rystals for γ-ray imaging for oin iden e and single photon imaging (Siegel et al. [183 andSeidel et al. [184), relying on the Center of Gravity algorithm implemented as des ribed in se tion 5.2.They report strong edge artefa ts, espe ially when thi k rystals for the dete tion of high energy photonsare required. As shown in se tion 5.8, these errors are inherent in the CoG algorithm for rystals of nitesize and thi kness. Other groups abandoned the onventional Anger positioning s heme in favor of statisti based positioning (Joung et al. [185) or the use of neural networks (Tavernier et al. [186), but at the expenseof independently digitizing all photodete tor segments. Despite the fa t that a better spatial resolution anbe a hieved by using these methods, they are obtained by drasti ally in reasing the number of ele troni hannels. Due to the fa t that the data a quisition and analysis system has to be more omplex, the nal ost of the devi e is signi antly in reased.8.1 The Trun ated Moment ProblemIn hapter 5, DOI enhan ed designs of harge dividing networks were presented. These networks have beendeveloped primarily in order to allow for an e ient estimation of the depth of intera tion of the γ-ray.However, the experimental results of hapter 7 revealed that using the standard deviation as DOI estimatoryields a good resolution at the entral region of the sensitive area but degrades towards the rystal edges.The reason for this ee t is that near the edges, the dete ted signal distribution is distorted be ause a largefra tion of the s intillation light is absorbed by the bla k painted surfa es. This auses a hange in allmoments and their use as three-dimensional position and energy estimators be omes a poor approximationfor a large fra tion of the sensitive area.Using dire tly the se ond moment instead of the square root of the entral se ond moment (i.e. thestandard deviation) is not possible without problems be ause it is subje ted to strong quadrati variationsalong the transverse spatial dire tions. Moreover, the se ond moments for dierent DOI interse t at anannular region of the sensitive area. That is, there is a region of the sensitive area where the measuredse ond moments of events with dierent depth but same x-y-position are almost equal to ea h other. Forpoints within this region, no DOI information an be obtained dire tly from the se ond moment sin e allDOIs are mapped to a similar value. However, this applies only to the non- entered se ond moment. Forthe standard deviation no interse tions are observed (refer to hapter 7 and also Ler he et al. [187).As a onsequen e, one is tempted to re over the true impa t positions from the available moments givenby equations (7.10)-(7.13). This is a typi al inverse problem and for its solution one needs to nd the1In the sense of se tion 4.1. 119

8.2 Polynomial Interpolationfollowing three fun tions, or at least good approximations for them.x = X
(µx1,y0
µx0,y0
,µx2,y1
µx0,y0
,µx2,y0 + µx0,y2
µx0,y0
) (8.1)y = Y
(µx1,y0
µx0,y0
,µx2,y1
µx0,y0
,µx2,y0 + µx0,y2
µx0,y0
) (8.2)z = Z
(µx1,y0
µx0,y0
,µx2,y1
µx0,y0
,µx2,y0 + µx0,y2
µx0,y0
)
. (8.3)No inverse fun tion is required for the energy sin e µx0,y0 is used for normalization of the moments involvedand the true energy of the dete ted event, i.e. the amplitude J0 of the signal distribution 4.26, a ts as amultipli ative onstant.A spe ial feature of the present inverse problem is that one has to re onstru t distribution parametersfrom some known moments of the distribution. Thus, it is very similar to the trun ated moment problem(Kren and Nudel'man [188, Tka henko et al. [189). There are three essentially dierent types of momentproblems depending on whi h type of intervals they are dened on. For histori al reasons, the momentproblem on the semi-innite interval [0,∞[ is alled the Stieltjes moment problem. On R it is alled theHamburger moment problem and on the bounded interval [0, 1] it is referred to as the Hausdor momentproblem.8.2 Polynomial InterpolationA promising te hnique for inverting the system of equations (7.10)-(7.13) is given with standard polynomialinterpolation. The approximation of fun tions by interpolation embra es a large variety of methods in lud-ing Spline interpolation, Taylor series, ontinued fra tions, et ., whi h are well understood and widely used(see for instan e Kin aid and Cheney [190 and Press et al. [191).Polynomial interpolation has been re ently applied to a rather similar problem (Ol ott et al. [192, [193).They studied the spatial response of a s intillation rystal array oupled to a position-sensitive avalan hephotodiode (PSAPD). These photodete ting devi es present a promising te hnology for γ-ray imagingdete tors but suer from a strong pin ushion-like distortion. Ol ott et al. used nite element methodsfor solving Lapla e's equation on the resistive layer of the PSAPD in order to predi t its spatial responsefun tion. Finally, they expanded the supposed dete ted positions using a two-dimensional polynomial basis,thereby obtaining a matrix of oe ients that ould be inverted and applied for linearity orre tion withen ouraging results.The dieren es ompared to the inverse problem posed by equations (7.10)-(7.13) and the dete tor setupdis ussed in the present work are minor. Instead, the fa t that an additional measure of the distribution,i.e. the se ond moment, is made available, probably in reases the performan e of the method.8.2.1 Polynomial Interpolation in One DimensionBefore applying this method to the inverse problem, some useful properties are summarized (refer to Kin aidand Cheney [190). The interpolation problem onsists in nding a polynomial p(x) of lowest possible degreek for a given set of n+1 known data points (xi, yi), i = 0, 1, . . . , n. If the interpolation points x0, x1, . . . , xnare distin t real numbers, then there is a unique polynomial pn(x) of degree k at most n su h that
pn(xi) = yi, with (0 ≤ i ≤ n). (8.4)This theorem holds for arbitrary values y0, y1, . . . , yn and a proof an be found in Kin aid and Cheney[190. The interpolation polynomial an be written in terms of powers of x
pn(x) =
n∑
j=0
ajxj (8.5)120

8 3D-Impa t Position Re onstru tionwhi h, together with the interpolation onditions (8.4), leads to a system of n+1 linear equations that anbe used for determining the oe ients a0, a1, . . . , an. This system has the following form:yi = pn(xi) =
n∑
j=0
ajxji . (8.6)The oe ient matrix X := xj
i is known as the Vandermonde Matrix (also alled an alternant matrix), andhas the formV =
1 x0 x20 · · · xn
0
1 x1 x21 · · · xn
1
1 x2 x22 · · · xn
2... ... ... . . . ...1 xn x2
n · · · xnn
. (8.7)While the Vandermonde matrix is non-singular be ause the system has an unique solution for any hoi eof y0, y1, . . . , yn, it is often ill- onditioned and does not allow an a urate determination of the oe ientsai. There are still other algorithms for polynomial interpolation that all produ e the same result, sin e thesolution is unique as stated above. Depending on the posed problem, they have advantages and disadvan-tages. The amount of work involved to obtain pn(x) in equation (8.5) seems ex essive and algorithms thatintrinsi ally implement Horner's s heme2 may be preferred. However, as will be shown later, the expansioninto the polynomial pn(x) never has to be omputed be ause there is no need to know the fun tional formof the distribution. Only the three-dimensional impa t position has to be estimated.The dis repan y between the true fun tion f(x) that produ ed the data points (xi, yi)i=0,1,...,n and theinterpolating polynomial at the position x is given by εn(x) = f(x) − pn(x). This error an be expressedas a fun tion of the (n + 1)th derivative of f(x) at the orresponding position ξx as follows:
εn(x) =1
(n + 1)!f (n+1)(ξx)
n∏
i=0
(x − xi), (8.8)where it is supposed that all distin t interpolation nodes x0, x1, . . . , xn lie in the interval [a, b], and thatto ea h x in this interval orresponds a point ξx in ]a, b[ that satises equation (8.8). The error εn(x) ofthe polynomial pn(x) an be optimized by hoosing adequate interpolation nodes. When the roots of theChebyshev polynomials dened byTn(x) = cos
[n cos−1(x)
] , with n ≥ 0 (8.9)on the interval [−1, 1] are used as nodes, equation (8.8) transforms into|εn(x)| ≤ 1
2n(n + 1)!max|t|≤1
∣∣∣f (n+1)(t)
∣∣∣ . (8.10)The roots of the Chebyshev polynomials are given by the following losed-form expression:
xi = cos
(2i + 1
2n + 1π
)
. (8.11)Again, proofs for both error estimates (8.8) and (8.10) an be found in Kin aid and Cheney [190.8.2.2 Polynomial Interpolation in Higher DimensionsFor larity, higher dimensional interpolation is explained onsidering the two-dimensional ase. General-izations to higher dimensions are straightforward using the results derived in this paragraph. In the twodimensional ase, the interpolation problem onsists in nding a smooth interpolant p for the set of n + 1distin t interpolation points (x0, y0), (x1, y1), . . . , (xn, yn). With ea h point (xi, yi) there is an asso iated2Horner's s heme rearranges a polynomial into the re ursive form pn(x) = a0 + x(a1 + x(a2 + · · · x(an−1 + anx) · · · )) andtherefore requires only n additions and n multipli ations for evaluating the polynomial. 121

8.2 Polynomial Interpolationreal fun tion value fi. Clearly, the interpolation fun tion has to reprodu e these values at the interpolationpoints su h thatp(xi, yi) = fi, with 0 ≤ i ≤ n. (8.12)Within the s ope of this work, the higher dimensional interpolation an be redu ed to univariate asesusing a tensor produ t of the interpolation des ribed above. For this, the interpolation nodes have to forma Cartesian grid su h that Nip = (xl, ym) : 0 ≤ l ≤ r, 0 ≤ m ≤ q; rq = n with x0, x1, . . . , xr being theinterpolation points in the x-spatial dire tion and y0, y1, . . . , yq the interpolation points in the y-spatialdire tion. As in the one-dimensional ase, the interpolation polynomial an be written in the formpkx,ky(x, y) =
kx∑
jx=0
ky∑
jy=0
cjxjyxjxyjy . (8.13)with 0 ≤ kx ≤ r and 0 ≤ ky ≤ q Equations (8.12) and (8.13) again result in a set of linear equations that an be used to nd the oe ients cjxjy of the interpolating polynomial:fi = pkx,ky(xi, yi) =
kx∑
jx=0
ky∑
jy=0
cjxjyxjx
i yjy
i . (8.14)The Vandermonde matrix now has the formV =
1 x1 y1 · · · xkx1 y
ky
1 x1y1 · · · x1yky
1 · · · xkx1 y1 · · · xkx
1 yky
1
1 x2 y2 · · · xkx2 y
ky
2 x2y2 · · · x2yky
2 · · · xkx2 y2 · · · xkx
2 yky
2... ... ... . . . ... ... ... . . . ... . . . ... . . . ...1 xn yn · · · xkx
n ykyn xnyn · · · xny
kyn · · · xkx
n yn · · · xkxn y
kyn
. (8.15)So far, only fun tions that map a region into the one dimensional spa e have been onsidered. Letnow the unknown fun tion that has to interpolated be a mapping from the two-dimensional spa e intothe two-dimensional spa e, e.g. f : U ⊂ R2 7→ B ⊂ R
2. Then, ea h interpolation node (xi, yi) has a pairof asso iated real numbers (vi, ui). Obviously, a single polynomial annot reprodu e this two-dimensionalmapping. However, one an dene a ombined fun tion using one polynomial for ea h dimension of theimage as follows:P (x, y) := (pu(x, y), pv(x, y)), (8.16)where pu(x, y) and pv(x, y) are ordinary one-dimensional polynomials that satisfy the following relations:pu(xi, yi) = ui, with 0 ≤ i ≤ n and (8.17)pv(xi, yi) = vi, with 0 ≤ i ≤ n. (8.18)As in the previous ases, one an write both polynomials pu(x, y) and pv(x, y) as a sum of the dierentorders weighted with the oe ients ajxjy and bjxjy . Together with equations (8.17) and (8.18) one nowobtains two systems of linear equations, one for the oe ients ajxjy and another for the oe ients bjxjy :ui = pu(xi, yi) =
kx∑
jx=0
ky∑
jy=0
ajxjyxjx
i yjy
i (8.19)vi = pv(xi, yi) =
kx∑
jx=0
ky∑
jy=0
bjxjy xjx
i yjy
i . (8.20)Note that the Vandermonde matrix is exa tly the same in both systems (8.19), (8.20) and they an bewritten in matrix form as follows:u = Va and v = Vb. (8.21)122

8 3D-Impa t Position Re onstru tionEquation (8.21) an be rewritten in one single equation by gathering all u and v values in the matrixY := [uv] and all a and b values in the oe ient matrix C := [ab]. In this way, one obtains the singlematrix equation
Y = VC, (8.22)where the Vandermonde matrix V is obtained from the interpolation nodes Nip . As stated formerly, V isnon-singular and its determinant is therefore nonzero if the interpolation nodes Nip are distin t. Therefore,equation (8.22) an be inverted in order to obtain the oe ients C as a fun tion of the fun tion-values Yat the interpolation nodes. Thus one hasC = V
+
Y, (8.23)were, V+ denotes the pseudo-inverse (also alled Moore-Penrose matrix inverse) of V des ribed in the nextse tion.8.2.3 Moore-Penrose Matrix InverseThe matrix that has to be inverted in order to obtain (8.23) from (8.22) is the Vandermonde matrix (8.15).In general, this matrix is not a square matrix but a n × (kx + 1)(ky + 1) matrix, where n is the totalnumber of interpolation points and kx and ky the interpolation orders along the x- and y-spatial dire tionsrespe tively. By denition, the inverse A−1 of an matrix A has to satisfy the relationA−1A = AA−1 = I, (8.24)where I denotes the identity matrix. Clearly, this is only possible, if the matrix A is a square matrix.For general l × m matri es with l 6= m, the matrix produ t does not ommute and the rst identityin expression (8.24) does not hold. A generalization of the matrix inverse for non-square matri es wasindependently given by E.H. Penrose and R. Moore. Whenever the inverse of ATA exist, one an dene anew matrix A
+ asA
+
=(AT A
)−1AT . (8.25)This matrix is either alled the pseudo-inverse or the Moore-Penrose inverse. AT is the transpose of thematrix A. In the present ase, the pseudo-inverse of the Vandermonde matrix an be omputed, sin e Vhas a non-vanishing determinant. In addition, the inverse of VT V exists as a onsequen e of distributivityof determinants and be ause detAT = detA.8.3 Inverse Mapping of the Gamma-Ray Impa t PositionsAt this stage, an algorithm for omputing the true three-dimensional photo onversion position of the γ-photon from the moments of the produ ed signal distribution an be given. For this purpose, the methodgiven by Ol ott et al. [192 was adapted to the three-dimensional ase.As a rst step, the dete tor's response is omputed by using the signal distribution LDetector (r, rc) ofse tion 4.2 at a three-dimensional grid of interpolation nodes X := [xy z] that are the supposed x-, y- and
z- oordinates of the photo onversion. At ea h position, a set of three non-trivial moments, representing the entroids and the se ond moment are omputed from the signal distribution as was des ribed in se tion 7.2.2.This is the response that one expe ts from the dete tor by virtue of hapters 4 and 7 and forms thematrix Y : = [xµ yµ zµ], where the subs ript indi ates that these values are the moments extra tedusing an enhan ed harge divider onguration. These moments are used as interpolation nodes and theVandermonde V matrix is built from them. The oe ients that map the polynomial expansion of thedete tor response ba k into the spa e of impa t positions an be found using the Moore-Penrose inverse ofthe previous paragraph.X = SV with (8.26)S = XV
+ (8.27)123
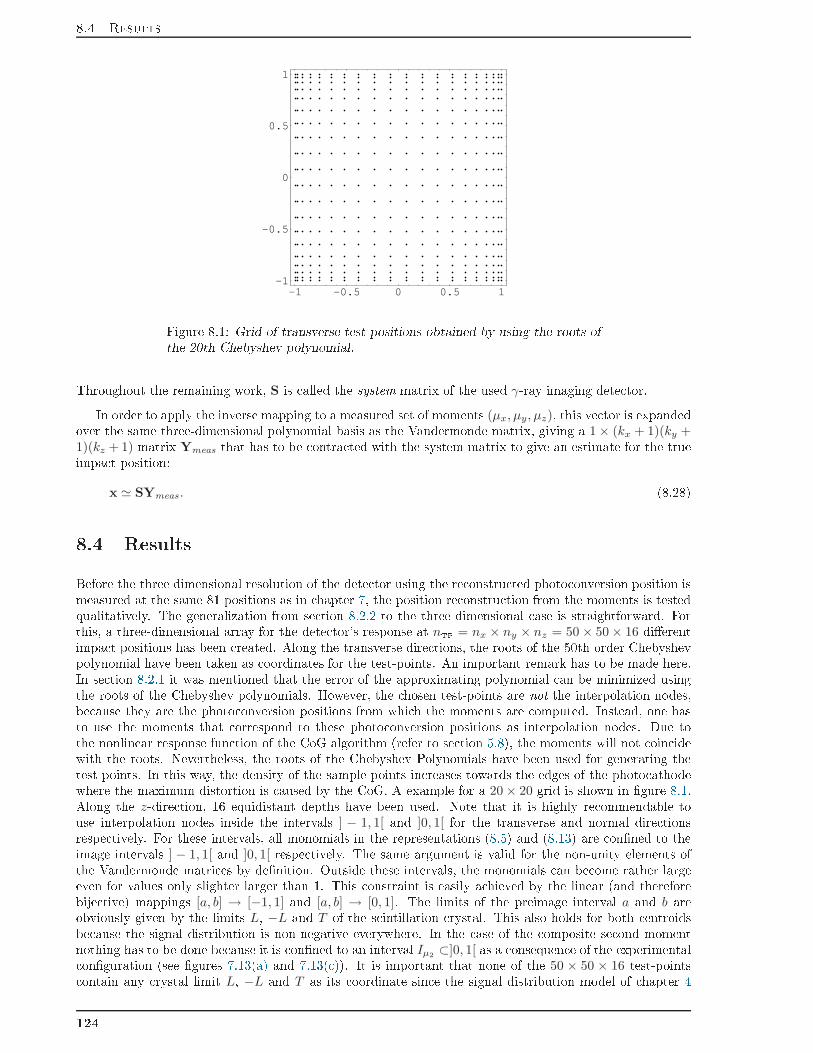
8.4 Results
-1 -0.5 0 0.5 1-1
-0.5
0
0.5
1
Figure 8.1: Grid of transverse test-positions obtained by using the roots ofthe 20th Chebyshev polynomial.Throughout the remaining work, S is alled the system matrix of the used γ-ray imaging dete tor.In order to apply the inverse mapping to a measured set of moments (µx, µy, µz), this ve tor is expandedover the same three-dimensional polynomial basis as the Vandermonde matrix, giving a 1 × (kx + 1)(ky +1)(kz + 1) matrix Ymeas that has to be ontra ted with the system matrix to give an estimate for the trueimpa t position:
x ≃ SYmeas . (8.28)8.4 ResultsBefore the three dimensional resolution of the dete tor using the re onstru ted photo onversion position ismeasured at the same 81 positions as in hapter 7, the position re onstru tion from the moments is testedqualitatively. The generalization from se tion 8.2.2 to the three-dimensional ase is straightforward. Forthis, a three-dimensional array for the dete tor's response at nTP = nx × ny × nz = 50 × 50 × 16 dierentimpa t positions has been reated. Along the transverse dire tions, the roots of the 50th order Chebyshevpolynomial have been taken as oordinates for the test-points. An important remark has to be made here.In se tion 8.2.1 it was mentioned that the error of the approximating polynomial an be minimized usingthe roots of the Chebyshev polynomials. However, the hosen test-points are not the interpolation nodes,be ause they are the photo onversion positions from whi h the moments are omputed. Instead, one hasto use the moments that orrespond to these photo onversion positions as interpolation nodes. Due tothe nonlinear response fun tion of the CoG algorithm (refer to se tion 5.8), the moments will not oin idewith the roots. Nevertheless, the roots of the Chebyshev Polynomials have been used for generating thetest-points. In this way, the density of the sample points in reases towards the edges of the photo athodewhere the maximum distortion is aused by the CoG. A example for a 20 × 20 grid is shown in gure 8.1.Along the z-dire tion, 16 equidistant depths have been used. Note that it is highly re ommendable touse interpolation nodes inside the intervals ] − 1, 1[ and ]0, 1[ for the transverse and normal dire tionsrespe tively. For these intervals, all monomials in the representations (8.5) and (8.13) are onned to theimage intervals ] − 1, 1[ and ]0, 1[ respe tively. The same argument is valid for the non-unity elements ofthe Vandermonde matri es by denition. Outside these intervals, the monomials an be ome rather largeeven for values only slighter larger than 1. This onstraint is easily a hieved by the linear (and thereforebije tive) mappings [a, b] → [−1, 1] and [a, b] → [0, 1]. The limits of the preimage interval a and b areobviously given by the limits L, −L and T of the s intillation rystal. This also holds for both entroidsbe ause the signal distribution is non-negative everywhere. In the ase of the omposite se ond momentnothing has to be done be ause it is onned to an interval Iµ2 ⊂]0, 1[ as a onsequen e of the experimental onguration (see gures 7.13(a) and 7.13( )). It is important that none of the 50 × 50 × 16 test-points ontain any rystal limit L, −L and T as its oordinate sin e the signal distribution model of hapter 4124
8 3D-Impa t Position Re onstru tionis not dened at these points. Furthermore, it has been observed that the use of test-points with theparti ular transverse oordinates x = 0, y = 0 or x = y = 0 lead to large re onstru tion errors in the nearneighborhood of these points. The reason for this behavior is not known but it an be easily avoided by hoosing an even number of test-positions along the x- and y-spatial dire tions. Then, the mis-positionedevents disappear ompletely.On e the three-dimensional grid of test-positions has been reated, the dete tor response is omputed atea h of them as des ribed in se tion 7.2.2. In parti ular, the parameter values for the signal distribution andthe optimum s alings resumed in table 7.1 have been used. This gives two matri es X and Y of dimensionnTP×3 representing the true impa t position and the orresponding three non-trivial moments respe tively.Moments and positions were then s aled down to the intervals ] − 1, 1[ and ]0, 1[. The system matrix Y ofthe test dete tor was then omputed by virtue of equation (8.27). Dierent interpolation orders have beentested.8.4.1 Qualitative Validation of the MethodFirst of all, the impa t positions of all dete ted events were re onstru ted from the measured moments at all81 test-positions. All two-dimensional position plots were inspe ted to make sure that the algorithm worksin a qualitatively orre t way, i.e., that no artefa ts were present and that the re onstru ted events weregrouped around a reasonably small region around the nominal γ-ray beam position. At a rst glan e, it ould be observed that the method works as expe ted. For impa t positions within the entral region of thephoto athode, transverse positions and entroids are nearly the same be ause the positioning error of theCoG algorithm is small for these points. The se ond moment is, however, subje ted to a strong quadrati variation with the impa t position whi h is su essfully removed to a great extent by the interpolationalgorithm. As a result, the majority of the re onstru ted intera tion depths lie within the interval [0, 10] ofpossible values of the DOI. A low fra tion of events lead to re onstru ted DOI values outside this interval.There are two possible reasons for this. First, there are always statisti al errors in the measurements of themoments and a tually the intrinsi resolution for the DOI parameter is nite. On the other hand, there isa signi ant fra tion of Compton s attered events, as was explained in hapter 6, whi h are not in luded inthe response predi tion of hapters 4 and 7. While the entroids will always be smaller than the true impa tpositions, (there an be no event outside the interval [−1, 1], neither for the x nor the y spatial dire tions)there is no well dened upper limit for the se ond moment. Consider an in ident γ-ray perpendi ular to theplane of the photo athode that is s attered o at 90° to the normal dire tion. It will deposit Ee/2 at thisposition and the s attered photon will travel parallel to the photo athode. If the s attered photon oversa large distan e and is photoele tri ally absorbed at its se ond intera tions, one will get an event witha very large se ond moment that does not orrespond to the the intera tion distan e be ause the signaldistribution is a superposition of two equal distributions like in expression (4.26) but displa ed horizontally.Su h events annot be re onstru ted be ause they are not in luded in the predi ted position response. Whilethe entroids remain inside the interval [−1, 1] even for this spe ial event, the se ond moment seems tooriginate from an event of very high ID. Therefore, the polynomial interpolation will proje t it outsidethe interval [0, 10]. In hapter 6, the frequen y and expe ted range of events with large s attering angleswas dis ussed. Due to the s reening of forward s attered events, many of the undis riminated Comptons attered events will behave similarly to the dis ussed example. Nevertheless, it was found that half ofall Compton s attered events have a transverse range of the s attered photons of the order of 300µm.This is signi antly less than the obtained spatial resolution for both transverse and normal dire tions (seese tion 7.2.3) and therefore will not lead to large positioning errors for the majority of the ases. Theother half of the Compton s attered events are part of the long tails of the histograms 6.3(a)-6.3(d). Theywill produ e strongly mispla ed positions and large re onstru ted intera tion depths. Note that this mayprovide an ex ellent possibility for ltering inner- rystal Compton s attered events. Unfortunately, theerrors in the re onstru ted positions are still too large and an improvement of the method's a ura y isrequired. This possibility has been mentioned here for ompleteness but has not been studied in detail.Figure 8.2 shows various graphi al representations of the entroids for the adja ent beam positions(x, y) = (14.25, 9.5)mm and (x, y) = (19, 9.5)mm. A total of 192000 temporal oin iden e events havebeen registered at ea h beam position. The ele troni ollimation was adjusted to lter out all events thatare onned to the entral ir ular region of diameter ≈ 12 mm at the oin iden e dete tor orrespondingto a ir ular region of diameter . 0.2 mm at the test dete tor (refer to se tion 7.1). Only photopeakevents have been onsidered. The moments have been omputed and were used for position re onstru tion125

8.4 Results
-1. -0.5 0. 0.5 1.-1.
-0.5
0.
0.5
1.-1. -0.5 0. 0.5 1.
-1.
-0.5
0.
0.5
1.
PSfrag repla ementsx entroid
y
entroid(a) 2D-density plot of the entroids for two γ-ray beams impinging on the positions (x, y) =(14.25, 0)mm and (x, y) = (19, 0)mm.
-1. -0.5 0. 0.5 1.-1.
-0.5
0.
0.5
1.-1. -0.5 0. 0.5 1.
-1.
-0.5
0.
0.5
1.
PSfrag repla ementsx position
y
position(b) 2D-density plot of the re onstru ted positionsfor two γ-ray beams impinging on the positions(x, y) = (14.25, 0) mm and (x, y) = (19, 0) mm.
0.3 0.5 0.7 0.9 1.10.
0.20.40.60.8
0
50
100
0.3 0.5 0.7 0.9
PSfrag repla ementsx entroidx entroid y
entroid ounts( ) Surfa e plot of the entroids for two γ-ray beamsimpinging on the positions (x, y) = (14.25, 0)mmand (x, y) = (19, 0)mm.
0.3 0.5 0.7 0.9 1.10.
0.20.40.60.8
0
20
40
60
0.3 0.5 0.7 0.9
PSfrag repla ementsx positionx position y
position ounts(d) Surfa e plot of the re onstru ted positions fortwo γ-ray beams impinging on the positions (x, y)= (14.25, 0) mm and (x, y) = (19, 0)mm.
0.3 0.4 0.5 0.6 0.7 0.8 0.9 10
20
40
60
80
100
120
140
PSfrag repla ementsx entroid ounts
(e) x- entroid for the same beam positions. Mea-sured data (light-gray lines) and best ts (bla klines) are plotted together. 0.3 0.4 0.5 0.6 0.7 0.8 0.9 10
20
40
60
80
100
PSfrag repla ementsx entroid ounts
(f) Re onstru ted x-positions for the same beampositions. Measured data (light-gray lines) andbest ts (bla k lines) are plotted together.Figure 8.2: Comparison of the quality of moments and re onstru ted posi-tions for a pair of two representative beam positions.126

8 3D-Impa t Position Re onstru tionas des ribed above with the results plotted in gures 8.2(a)-8.2(d). When using the entroids as impa tposition estimate, it is hardly possible to distinguish ea h position. The typi al elongation of the entroidalong the x dire tion an be learly observed for the distribution aused by the beam at position (x, y)= (19, 9.5)mm. The image is also ompressed giving maximum positions of approximately (0.6, 0.4) and(0.7, 0.4) instead of the true beam positions (0.68, 0.45) and (0.9, 0.45)3. The use of the re onstru tedpositions improves the quality of the image in all aspe ts. Both peaks are now well separated and an beeasily distinguished. The distribution of the penultimate beam position is entered very lose to the trueimpa t position and the Gaussian shape of the other distribution is restored. However, the enter positionis slightly underestimated and the width is onsiderably larger than the width for the penultimate position.A quantitative evaluation of the quality of the algorithm an be given in the following way. One-dimensional Gaussians are tted to the measured x-position distributions and the distribution of x- entroidsthat orresponds to the beam position (0.68, 0.45). For the remaining distribution, model (7.6) is usedinstead, be ause it exhibits strong CoG distortion. The results are shown in gures 8.2(e) and 8.2(f). Withthe aid of the best ts one an ompute the fra tion of mis-positioned events by determining the interse tionof both entroid distributions and both position distributions and omputing the area-fra tions below the urves. In the ase of the entroids one obtains that a total of 5.3% of the events orrespond to theoverlapping area and annot be unequivo ally assigned to one position or the other. In the ase of there onstru ted positions, this fra tion drops to 2.5%. For the ideal ase when both re onstru ted positionshave the same width as the inner one and are perfe tly entered at the nominal beam positions, one expe tsan overlapping fra tion smaller than 0.1%. This shows that the method improves the positioning but alsothat it is far from being perfe t, and further optimization and improvement must be arried out. Equalevaluations have been made for other pairs of points and similar results have been obtained.Figures 8.3(f)-8.3( ) show the same sele tion of data-points displayed as three-dimensional s atter plotsfor the ase of two γ-rays impinging on the rystal at dierent positions. The right olumn shows there onstru ted impa t positions of the events and the left olumn the measured moments. The omparisonof the six ases reveals the de ien y of using the bare moments as position estimate. In the ase ofa dete tor without distortion by the CoG algorithm, the events would appear as two thin verti al line-like distributions. It an be seen that the distributions of the re onstru ted positions are indeed line-likeand verti al. The thi kness represents just the spatial resolution for the dierent intera tion distan es.However, the distributions of the bare moments are neither verti al nor line-like and therefore introdu e alarge systemati error. Note that the intera tion depths are rather well onned to the expe ted interval[0, 1].8.4.2 3D Spatial ResolutionThe intrinsi spatial resolution of the test dete tor after impa t position re onstru tion is measured in thesame way as it was done in se tion 7.2.3. Sin e the Gaussian shape of the dete tor point spread fun tionalong the transverse dire tions is re overed by the inversion algorithm to a large extent, simple Gaussiandistributions with linear ba kgrounds are used instead of the t model derived in se tion 7.1.2. The spatialresolutions are then given by
∆x =√
(2.35σXGauss)2 − d2eff and ∆y =
√
(2.35σYGauss)2 − d2eff , (8.29)where σXGauss and σYGauss are the widths of the Gaussian distribution for the x- and y- oordinate respe tivelythat best ts to the measured data, and deff is the ee tive sour e diameter (7.4) dis ussed in se tion 7.1.1.Finally, a residual linearity orre tion has to be applied. This is ne essary be ause the re onstru tionalgorithm in its a tual form fails to ompletely re over the linear behavior and thus, the spatial resolutionwould be underestimated. Results for the spatial resolutions of both transverse dire tions are plotted ingures 8.4(a)-8.4(d). Clear improvements ompared to the spatial resolutions in the ase of using the baremoments as position estimate (refer to se tion 7.2.3) an be observed.The resolution of the depth of intera tion is obtained in the same way as for the resolution of the omposite se ond moment in se tion 7.2.3. The results are displayed in gures 8.5(a) and 8.5(a). Forthis impa t parameter the best results were obtained with interpolation orders of 13 for the transverse omponents and 2 for the normal omponent. The reason is not understood and will be subje t of further3These positions have been s aled to the referen e interval [−1, 1]. 127

8.4 Results
0.2 0.4 0.6 0.800.20.40.60.80.3
0.4
0.5
0.2 0.4 0.6 0.8
PSfrag repla ementsµx1,y0µx1,y0
µx0,y1
µx2,y
0+
µx0,y
2
(a) Moments for the beam at (x, y) =(19, 9.5) mm. 0 0.5 1
00.250.50.75
0
1
0 0.5 1
PSfrag repla ementsxx
y
z
(b) Re onstru ted positions for thebeam at (x, y) = (19, 9.5)mm.0.2 0.4 0.6 0.8
00.20.40.60.80.3
0.4
0.5
0.2 0.4 0.6 0.8
PSfrag repla ementsµx1,y0µx1,y0
µx0,y1
µx2,y
0+
µx0,y
2
( ) Moments for the beam at (x, y) =(14.25, 9.5) mm. 0 0.25 0.5 0.75 1
00.250.50.75
0
1
0 0.25 0.5 0.75 1
PSfrag repla ementsxx
y
z
(d) Re onstru ted positions for thebeam at (x, y) = (14.25, 9.5)mm.0 0.2 0.4 0.6 0.8
00.20.40.60.80.3
0.4
0.5
0.6
0 0.2 0.4 0.6 0.8
PSfrag repla ementsµx1,y0µx1,y0
µx0,y1
µx2,y
0+
µx0,y
2
(e) Moments for both γ-ray beams at(x, y) = (14.25, 9.5)mm and (x, y) =(19, 9.5) mm.
0 0.5 100.250.50.75
0
1
0 0.5 1
PSfrag repla ementsxx
y
z
(f) Re onstru ted positions for bothbeams at (x, y) = (14.25, 9.5)mm and(x, y) = (19, 9.5)mm.Figure 8.3: Three-dimensional representation of the sele ted oin iden eevents. The gures to the right hand side show the re onstru ted positionsfor both beam positions separately and together. To the left, the momentsof the orresponding events are shown.128

8 3D-Impa t Position Re onstru tion
0 20 40 60 801.5
2
2.5
3
3.5
4
4.5
PSfrag repla ements position #∆
x
[mm(a) Measured resolutions in the x-dire tion of the re on-stru ted events at all 81 positions.
-18-12
-60
612
18 -18
-12
-6
0
6
12
18
1.52.
2.53.
3.54.
-18-12
-60
612
18
PSfrag repla ementsxx
y
∆x
[mm(b) 2D-dependen y of resolution in the x-dire tion of the re onstru ted events.
0 20 40 60 80
1.5
2
2.5
3
3.5
4
PSfrag repla ements position #
∆y
[mm( ) Measured resolutions in the y-dire tion of the re on-stru ted events at all 81 positions.
-18-12
-60
612
18 -18
-12
-6
0
6
12
18
1.52.
2.53.
3.5
-18-12
-60
612
18
PSfrag repla ementsxx
y
∆y
[mm(d) 2D-dependen y of resolutions in the y-dire tion of the re onstru ted events.Figure 8.4: Measured resolutions for the re onstru ted x- and y-positions.To the left: the resolutions are displayed with their error bars. To the right:3D-plots are shown for better re ognition of the fun tional dependen e onthe transverse oordinates.investigation. Only a slight improvement ompared to using the standard deviation is a hieved in thespatial resolution of the z position. An important advantage is, however, the more a urate mapping of there onstru ted z to the orre t interval of values ([0, 1] or [0, 10] after s aling). This is shown in gures 8.5( )-8.5(f). Mean, standard deviation, minimum and maximum values for the a hieved resolutions of all threeimpa t oordinates are summarized in table 8.1, where the results for the spatial resolution obtained inse tion 7.2.3 are also shown for better omparison. The improvement of the dete tor performan e isunfortunately not su ient for the orre tion of the energy. Two dierent methods for energy orre tionhave been tested. The rst in luded the energy as a fourth dimension in the matri es of the dete torresponse Y and the test-position X for polynomial interpolation. This method failed ompletely andrendered the position information unusable. The se ond method onsists in omputing multipli ative orre tion fa tors. For this, the energy predi tion obtained from the model in hapter 7 was interpolatedat the three-dimensional grid of nTP test-points. Sin e the energy is proportional to the amount of releaseds intillation light J0 in expression (4.26), the orre tion fa tor is obtained as the inverse of the predi tedenergy multiplied by the dete ted zeroth moment. This method does not lead to any improvement eventhough the theoreti al model for the signal distribution predi ts a variation of the energy with the impa tposition (see also Gagnon et al. [194). A possible reason is that the a ura y of the position re onstru tion isstill low at the outer regions where exa t position information is most required for the energy re onstru tion.Also, the strong variation of the anode sensitivity may make higher interpolation orders ne essary. With129

8.4 Results
0 20 40 60 800
2
4
6
8
PSfrag repla ements position #∆
z
[mm(a) Measured resolutions in the z-dire tion of the re on-stru ted events at all 81 positions.
-18-12
-60
612
18 -18
-12
-6
0
6
12
18
234567
-18-12
-60
612
18
PSfrag repla ementsxx
y
∆z
[mm(b) 2D-dependen y of resolutions in the z-dire tion of the re onstru ted events.
0 20 40 60 80
-10
-7.5
-5
-2.5
0
2.5
5
PSfrag repla ements position #
z
[mm( ) Measured lower limits for the intera tion depth at all81 positions.
-18-12
-60
612
18 -18
-12
-6
0
6
12
18
-8-5-214
-18-12
-60
612
18
PSfrag repla ementsxx
y
z
[mm(d) 2D-dependen y of the measured lowerlimits of the re onstru ted events.
0 20 40 60 804
6
8
10
12
14
PSfrag repla ements position #
z
[mm(e) Measured upper limits for the intera tion depth at all81 positions.
-18-12
-60
612
18 -18
-12
-6
0
6
12
18
468
1012
-18-12
-60
612
18
PSfrag repla ementsxx
y
z
[mm(f) 2D-dependen y of the measured upperlimits of the re onstru ted events.Figure 8.5: Measured resolutions for the re onstru ted z-positions and max-imum and minimum measured intera tion depths. To the left: the valuesare displayed with error bars. To the right: 2D-plots are shown for betterre ognition of the fun tional dependen e on the transverse oordinates.130

Referen esCoordinate Mean StdDev Min Max Unitx 1.9 0.9 1.2 4.8 mmy 1.9 1 1.1 6.1 mmz 3.9 1.5 1.6 7.3 mm
µx1,y0 3.4 3.2 1.4 20.9 mmµx0,y1 3.3 3.1 1.3 19.9 mmσDOI 4.9 1.8 1.9 9.0 mmTable 8.1: Mean, standard deviation, maximum and minimum values forresolutions of the re onstru ted 3D positions. For omparison, the resultsfrom se tion 7.2.3 have been in luded in the same table.the personal omputer used, orders higher than 12 for the transverse omponents and higher than 5 for thenormal omponent were not possible to use.8.4.3 Linearity of the Positioning S hemeCoordinate Mean StdDev Min Max Unitx 0.7 0.5 0.2 2.0 mmy 0.5 0.6 <0.1 2.1 mmTable 8.2: Mean, standard deviation, maximum and minimum values of theabsolute linearity error for the 3D positionsThe linearity of the position response has been tested for the re onstru ted impa t position. As men-tioned above, the method fails to ompletely restore the three-dimensional impa t position and a residualnon-linearity of the position mapping remains. This is shown in gures 8.6(a)-8.6(d) together with thelinearity behavior of the entroids. On e again, a lear improvement is observed. Only the last row (or olumn) of the beam positions shows a signi ant deviation from the linear behavior of the re onstru tedimpa t positions. In the ase of using the entroids as position estimates, the non-linearity is mu h morepronoun ed. Mean, standard deviation, minimum and maximum values of the absolute systemati position-ing errors are summarized in table 8.2. Note that the maximum values for the positioning error orrespondwithout ex eption to the beam positions (x, y) = (±19, y)mm and (x, y) = (x,±19)mm. Consequently, themaximum relative positioning error is of about 10%, whi h was just the a hieved a ura y for the signaldistribution model. A further improvement in the position orre tion probably requires a higher a ura yof the model signal distribution. Note that the maximum linearity error in the ase of using the entroidsis of the order of 25%.8.4.4 Exe ution TimeThe inversion algorithm was implemented on a standard single CPU personal omputer with a 2.4GHzPentium IV CPU. Exe ution times of ∼ 20 µs per event were a hieved. This orresponds to pro essingrates of about 50 · 103 events per se ond thus being a fa tor of 10 slower than the data aquisition ard(Zawarzin [195).Referen es[182 M. Casey and R. Nutt, A multisli e two-dimensional BGO dete tor system for PET. IEEE Trans.Nu l. S i., vol. 33, no. 1, pp. 760763, 1986. 131

Referen es-18
-12-6
06
1218 -18
-12
-6
0
6
12
18
00.51.
1.5
2.
-18-12
-60
612
18
PSfrag repla ementsxx
y
x
-position(a) Re onstru ted x-position as a fun tion of thetrue impa t position.
-18-12
-60
612
18 -18
-12
-6
0
6
12
18
012345
-18-12
-60
612
18
PSfrag repla ementsxx
y
x
- entroid(b) x- entroid as a fun tion of the true impa t posi-tion.
-18-12
-60
612
18 -18
-12
-6
0
6
12
18
00.51.
1.52.
-18-12
-60
612
18
PSfrag repla ementsxx
y
x
-position( ) Re onstru ted y-position as a fun tion of the trueimpa t position.
-18-12
-60
612
18 -18
-12
-6
0
6
12
18
012345
-18-12
-60
612
18
PSfrag repla ementsxx
y
x
- entroid(d) y- entroid as a fun tion of the true impa t posi-tion.Figure 8.6: Linearity behavior of both the re onstru ted positions (l.h.s.)and the entroids (r.h.s.). Note that the s ales for the fun tion values arenot the same.[183 S. Siegel, S. R. Cherry, A. R. Ri i, Y. Shao, and M. E. Phelps, Development of ontinuous dete torsfor a high resolution animal PET system, IEEE Trans. Nu l. S i., vol. 42, no. 2, pp. 10691074,Aug. 1995.[184 J. Seidel, W. Gandler, and M. Green, Chara teristi s of a Pair of Small Field-of-View LSO S intil-lation Cameras, IEEE Trans. Nu l. S i., vol. 43, no. 3, pp. 19681973, June 1996.[185 J. Joung, R. Miyaoka, and T. Lewellen, Mi e: a high resolution animal PET using ontinuous LSOwith a statisti s based positioning s heme. Nu l. Instr. and Meth. A, vol. 489, pp. 584598, 2002.[186 S. Tavernier, P. Bruyndon kx, S. Leonard, and O. Devroede, A high-resolution PET dete tor basedon ontinuous s intillators, Nu l. Instr. and Meth. A, vol. 537, pp. 321325, 2005.[187 C. W. Ler he, J. M. Benllo h, F. Sán hez, N. Pavón, B. Es at, E. N. Gimenez, M. Fernández, I. Torres,M. Giménez, A. Sebastià, and J. Cerdá, Depth of intera tion within ontinuous rystals from thewidth of its s intillation light distribution, IEEE Trans. Nu l. S i., vol. 52, no. 3, pp. 560572, June2005.132

Referen es[188 M. G. Kren and A. A. Nudel'man, The Markov Moment Problem and Extremal Problems. Ameri anMathemati al So iety, 1977, translated from the Russian by Israel Program for S ienti Translation.[189 I. M. Tka henko, M. Urrea Núñez, and P. Fernández de Córdoba Castellá, Algoritmos de Re on-stru ión de Fun iones de Distribu ión. Servi io de Publi a iones de la Universidad Polité ni a deValen ia, 1996, in Spanish.[190 D. Kin aid and W. Cheney, Numeri al Analysis: Mathemati s of S ienti Computing, 3rd ed.Brooks/Cole, 2002.[191 W. H. Press, S. A. Teukolsky, W. T. Vetterling, and B. P. Flannery, Numeri al Re ipes in C, 2nd ed.Cambridge University Press, 1992.[192 P. D. Ol ott, J. Zhang, C. S. Levin, F. Habte, and A. M. Foudray, Finite element model based spatiallinearity orre tion for s intillation dete tor that use position sensitive avalan he photodiodes, inNu lear S ien e Symposium, Conferen e Re ord, vol. 5, Nov. 2005, pp. 24592462.[193 P. D. Ol ott, private ommuni ation.[194 D. Gagnon, N. Pouliot, L. Laperri£re, M. Therrien, and P. Oliver, Maximum likelihood positioningin the s intillation amera using depth of intera tion, IEEE Trans. Med. Imag., vol. 12, no. 1, pp.101107, Mar. 1993.[195 V. Zavarzin andW. Earle, A 500k event/se 12-bit ad system with high-speed buered p i interfa e,IEEE Trans. Nu l. S i., vol. 46, p. 414, 1999.
133

Referen es
134

9 Con lusions & Outlook9 Con lusions & OutlookSti round t orner tre may waitA new road or a se ret gate;And tugh I oft &ed tm by,A y wi ome at la< wn IS take t hidn ths tt runWe< of t Moon, Ea< of t Sun.John Ronald Reuel Tolkien, ⋆ 1892 † 1973IN all nu lear imaging modalities, γ-photons in the energy range between 15keV and 511keV must be de-te ted. Simultaneously, measurements of their energies and intera tion positions have to be performed.From these measured values, the distribution of a fun tion-spe i radiopharma euti al in the organism an be re onstru ted and this allows one to make on lusions about the explored metaboli fun tion. Higha ura y of this omputed distribution is equivalent to high quality of the imaging pro ess and an bequantied by means of the spatial resolution, the SNR and the image ontrast. High spatial resolution,high SNR and high ontrast require γ-ray dete tors that provide full three-dimensional information aboutthe position of the photo onversion inside the rystal, good energy resolution and high e ien y. It wasrepeatedly stressed that, above all, the requirement for high intrinsi e ien y and high spatial resolution onstitute an important design oni t for onventional Anger-type γ-ray imaging dete tors. These dete -tors annot provide depth of intera tion information without modi ations and approximate the transverse omponents of the impa t position by entroids, i.e. the normalized rst moments of the s intillation lightdistribution. However, for the PET modality in parti ular, thi k s intillation rystals are required for ee -tively stopping the in ident 511 keV γ-ray. It is well known that the enter of gravity algorithm results ina non-linear and depth-dependent position mapping and leads to a signi antly lowered spatial resolutionnear the edges and orners of the s intillation rystal, espe ially for ases when the thi kness of the rystalis no longer signi antly smaller than its transverse extension.A detailed study in se tion 5.8 revealed that this is a onsequen e of the breaking of the signal distri-bution's symmetry aused by the nite rystal dimension. Therefore, it is not a de ien y of the hargedividing ir uits but an indi ation that one of the onditions for using the enter of gravity algorithm is notfullled. This ondition is learly the geometri shape of the s intillation rystal. In other words: althoughthe entroids an be measured with high pre ision, they do not represent suitable impa t position estimatesfor γ-ray imaging dete tors. A tually, it was shown in hapter 7 that the moments an be measured withrather high a ura y. The detailed study of harge dividing ir uits also revealed that the input impedan eof these ir uits together with the harge signals from photodete tors produ e voltages that are inherentlyquadrati ally position en oded. The onne tion of a standard analog adder presented in hapter 5 allowsthe addition of these voltages and provide by this means an additional signal, whi h depends linearly onthe se ond moment of the signal distribution.Previous studies by other resear hers showed that the width of the signal distribution aused by pho-to onversion of the impinging γ-ray and the free propagation of the liberated s intillation light is strongly orrelated with the intera tion depth of the γ-ray (Rogers et al. [196, Matthews et al. [197, Anti h et al.[198). As a onsequen e, the su essful and pre ise measurement of the se ond moment provides gooddepth of intera tion information.In hapter 5, it was demonstrated that all known unidimensional and bidimensional harge dividing ir uits an be easily modied for omputing the se ond moment analogi ally. Approximated but expli it135

9 Con lusions & Outlookexpressions were given for the dependen e of the quadrati voltage en oding on the position of the dividernodes. Comparison with simulations were arried out with the Spi e program and showed a a very goodagreement with low systemati deviations of the order of 3%. Further results on ern the symmetry of thethree ongurations. The true Anger logi is inherently symmetri with respe t to inter hanging the x-and the y- oordinate. The ongurations based on proportional resistor hains and the hybrid network arenot. Adequate dimensioning of the resistor values an, however, ompletely restore this symmetry for the entroid measurements in both ases. In the ase of the se ond moment, only for the hybrid onguration an an appropriate hoi e of resistor values be found in order to make its response in all four momentssymmetri . For the two-dimensional resistor hain network, the symmetri behavior of the se ond moment an, however, be optimized and residual asymmetries < 1% an be a hieved. This hoi e of optimumvalues for the resistan es leads also to a fun tional behavior slightly dierent from an exa t parabola.Terms of O(x4), O(y4) and O(x2y2) are introdu ed. However, no di ulty is expe ted from this result ifthe polynomial interpolation of hapter 8 is used, be ause the interpolated points must not fulll spe ialrequisites apart from building a Cartesian grid on the volume ] − 1, 1[2×]0, 1[. It may, however, result inadditional errors if the standard deviation is used for estimating the depth of intera tion. In addition, thevalues of the resistors for the summation amplier have to be hosen in su h a way that a tradeo betweenele troni noise and a ura y of the entroid is a hieved. As a design riterion, the following requirementwas established: at any node less than 1% of the total urrent should be extra ted for the omputation ofthe se ond moment. Higher a ura y does not make sense be ause the toleran e of ommer ial resistorsis of order 1%. It was found that the DOI enhan ed true Anger logi is the least pra ti al ongurationdue to the large number of required resistors. The two remaining ongurations have very similar analyti properties when ompared to ea h other. Their real performan e still has to be tested by experiment infurther investigations. For the present work, the two-dimensional onguration of the proportional resistor hain based harge divider has been hosen to set up a DOI enhan ed small animal PET dete tor modulebe ause it is very easy to implement.In hapter 7, measurements of all four lower moments for a real γ-ray imaging dete tor have beenpresented. The dete tor is based on a 42 × 42 × 10 mm3 LSO parallelepiped together with the large areaPSPMT H8500 from Hamamatsu Photoni s In . and is suitable for small animal PET. The design is mod-ular and a full ring made from 8 su h modules would have a entral aperture of ≈ 10 cm. The experimentalveri ation demonstrated that the measurement of the entroids is not ae ted at all by the simultaneousmeasurement of the ompound se ond moment. The mean resolution is in all non-trivial moments ratherhigh (. 5%). However, the dire t use of these moments as an estimate for the three-dimensional photo- onversion position leads to a very low spatial resolution in all omponents for γ-ray impa t positions nearthe edges and orners of the s intillation rystal. This is no surprise as it was reported by many resear hgroups and by virtue of the arguments given above.The trivial moment represents the energy of the dete ted γ-ray. This moment is ae ted by additionalee ts and requirements and its a hieved resolution falls behind those of the non-trivial moments. Oneof these ee ts is the anode inhomogeneity of the position sensitive photomultiplier tube used. Sin e thedieren e in e ien y and gain from one segment to another an a hieve ratios up to 1:3, a strong positiondependen e of the zero order moment has to be expe ted and is also observed. A passive ompensation asproposed by Tornai et al. [199 is neither possible for the proportional resistor hain based harge dividernor for the hybrid onguration. For the same reasons mentioned in onjun tion with the a tive impedan e onverters, an a tive ompensation is only possible if a dedi ated ASIC is developed. This possibility isthe subje t of further development. The se ond reason for lower quality of this moment is the intrinsi energy resolution of the s intillator used. The nite number of s intillation photons together with thelow quantum e ien y of the photomultiplier leads to an energy resolution of about 14% for LSO and511keV photons. This resolution is further lowered be ause the se ond moment measurement does nottolerate diuse or spe ular ree tions at any inner rystal surfa e. Ree tions would lead to superposedlight distributions with widths that dier from those of the distribution of dire t s intillation light and thusdestroy the orrelation between DOI and distribution width. Therefore, all surfa es ex ept for the one thatis oupled to the PSPMT have been overed with highly absorptive bla k epoxy resin oatings. This learlylowers the light olle tion e ien y and leads to poorer energy resolution espe ially at the regions near the rystal borders. A mean energy resolution of 25% together with the best value of 17% at the enter andthe poorest value of 70% at one orner have been observed. The very poor energy resolution at the rystal orners is due to a strong dependen e of the light yield on the DOI. For events that undergo photoele tri ee t near the photo athode, the total amount of dete ted light is mu h larger than for events that o urfar from the photo athode. Therefore, the photopeak is shifted towards lower values of the energy spe trum136

9 Con lusions & Outlookwhen the photo onversion position gets loser to the absorbing surfa es. As a result, one dete ts a lowerγ-ray energy although the true energy of the photon remains the same. However, it is possible to orre tthis shift if a high quality measurement of the true impa t position is a hieved. A rst attempt was madewith the re onstru ted positions obtained in hapter 8, but no improvement ould be a hieved. This isprobably due to the still low spatial resolution. Apart from this variation in the total amount of dete teds intillation light, there is, of ourse, also a higher statisti al error. Probably, a large amount of the lightlost by absorption an be re overed with the aid of a mi ro-ma hined retroree tor. The perspe tivesof using su h mi ro-opti al omponents have been investigated several times by dierent resear h groups(Karp and Muehllehner [200, Rogers et al. [196 and M Elroy et al. [201), but emphasis was put mainlyon position resolution. Retroree tors ree t the in oming light ba k onto a dire tion that is parallel tothat one of the in ident light. Therefore, in the ideal ase, the light distribution is expe ted to be exa tlythe same as for an absorbing oating but with twi e the intensity. Initial tests have been arried out, givingen ouraging results, and further investigation will probably end up using these ( heap) devi es for betterdete tor performan e.As stated above, the bare moments are rather poor estimates for the true γ-ray photo onversion positionbut they an be used to re onstru t the true photo onversion position. This is a typi al inverse problem andis also known as the trun ated moment problem. In hapter 8, a method for position re onstru tion from thethree non-trivial moments is presented. The omplete understanding of all aspe ts of the formation of thesignal distribution and the moments omputed from it is a sine qua non ondition for the su essful positionre onstru tion. A parameterization for the signal distribution has been derived in hapter 4. The startingpoint is the inverse square law, but other important ee ts have been in luded: geometri refra tion at the rystal-window interfa e, Fresnel transition at the same, angular response of the photo athode, exponentialattenuation of the s intillation light and ba kground from residual diuse ree tions at the bla k epoxyresin surfa es. The signal distribution was derived for the photoele tri ee t. Compton s attering has beentreated as an independent ee t and its impa t on the moment determination method has been studied indetail in hapter 6.The model has been veried by experiment and the results are summarized in hapter 7. For the threenon-trivial moments, a very good agreement with measurements was observed (errors . 11%). On e again,the trivial moment is an ex eption. Good agreement was a hieved only for the lower limit of possibleDOI values. For the upper limit, the model with ba kground fails to reprodu e all details of the measureddependen y. Nevertheless, ba kground light is present in the true dete tor and is an important ontributionespe ially for large DOI values. This has been veried with an alternative model where the ba kgroundlight was swit hed o. In this ase, the model fails ompletely to reprodu e the measurement values for thismoment. The non-trivial moments are only slightly ae ted by this variation be ause they are normalized.The above mentioned dependen y of the distribution width on the intera tion depth was better reprodu edby the model without ba kground. Reasons for these disagreements between model behavior and measuredmoments may be mainly due to the rough approximation made during the derivation of the distributionof the residual diuse ree tions at the epoxy resin surfa es. It is espe ially this ontribution of the modelthat has to be improved if higher a ura y is required. Other possible reasons are the blurring aused byCompton s attering and, above all, poor me hani al pre ision. The absolute error of the sour e position istoo high (≈ 1 mm) for a hieving better agreement between model and measurement. In hapter 6 it wasfound that Compton s attered ee ts result in a position blurring that is very low for the vast majority ofevents and an be very high for a small fra tion of events. The FWHMs and the medians of the ausedpoint spread fun tion are rather low, being only a few hundred µm, and the main error has to be attributedto the low me hani al pre ision.In the last hapter, standard polynomial interpolation in higher dimensions has been adopted to solvethe inverse problem of position re onstru tion from the moments. For this, the moment response of thedete tor was predi ted by virtue of the model derived in hapter 4 at a total of 40000 possible impa tpositions. This response has then been interpolated with polynomials of order 13 for the transverse spatialdire tions and a polynomial of order 6 for the normal omponent. The oe ients that map from theexpansion onto the grid of interpolation nodes an be solved by using the pseudo-inverse. Measured eventswhere then expanded onto the same polynomial basis and an be orre ted by multipli ation by a systemmatrix obtained from the pseudo-inverse and the true 40000 intera tion points. Approximately 132 · 6 · 3multipli ations and the same number of additions are required for the three-dimensional impa t positionre onstru tion of one single event. Therefore, the method will be fast enough for its pra ti al use. Theintrinsi mean spatial resolution of the dete tor, when using these re onstru ted impa t positions, wasfound to be 1.9 mm for the transverse omponents and 3.9 mm for the depth of intera tion. This is a137

Referen essigni ant improvement ompared to the bare moments, where 3.4 mm and 4.9 mm respe tively have beenmeasured for the orresponding resolutions. Also the maximum and minimum values show a signi antimprovement. In parti ular, the a hieved DOI resolution is an ex eptional result whi h is a hieved by veryfew of the alternative measurement methods presented in hapter 1. The ost for the ne essary dete torimprovements are, however, for the present method essentially negligible. A residual non-linearity of about10% remains present in the position information after re onstru tion and is probably due to insu ientpredi tion a ura y of the analyti model. An in reased a ura y here will very likely lead to even betterresults for the position re onstru tion and presumably make possible ee tive orre tion of the trivialmoment. The spatial resolution a hieved at the moment turned out to be insu ient for that purpose.In this work, a novel te hnique for measuring the DOI in γ-ray imaging dete tors was presented. Thehigh quality of the DOI measurement makes fast three-dimensional impa t position omputation from the entroids possible and therefore allows the onstru tion of heap dete tors that provide a performan e omparable to γ-ray imaging dete tors based on pixelated s intillators. Future investigation should puttheir emphasis on higher me hani al pre ision of the experimental setup and the radioa tive sour e, better alibration and an essential improvement in the model for the residual ree tions at the rystal borders.Other possible improvements of the method are the mentioned retroree tor and a PSPMT with smallerdete tor segments. The H9500 from the same ompany is an interesting alternative to the type used forthe present study. It has 256 anode segments of ≈ 3 × 3 mm3 and a thinner entran e window. All otherparameters are exa tly the same and the depth enhan ed harge divider ir uits are easily adapted to thisdevi e without making ne essary additional ele troni hannels.Referen es[196 J. Rogers, D. Saylor, R. Harrop, X. Yao, C. Leitao, and B. Pate, Design of an e ient positionsensitive gamma ray dete tor for nu lear medi ine, Phys. Med. Biol., vol. 31, no. 10, pp. 10611090,1986.[197 K. L. Matthews II, S. M. Leonard, C. E. Ordonez, D. E. Persyk, and W. Chang, A depth-en odinganger dete tor using s intillation bers, IEEE Trans. Nu l. S i., vol. 48, no. 4, pp. 13971402, Aug.2001.[198 P. Anti h, N. Malakhov, R. Parkey, N. Slavin, and E. Tsyganov, 3D position readout from thi ks intillators, Nu l. Instr. and Meth. A, vol. 480, pp. 782787, 2002.[199 M. P. Tornai, L. R. Ma Donald, C. S. Levin, S. Siegel, and E. J. Homan, Design Considerationsand Performan e of a 1.2 cm2 Beta Imaging Intra-Operative Probe, IEEE Trans. Nu l. S i., vol. 43,no. 4, pp. 23262335, Aug. 1996.[200 J. Karp and G. Muehllehner, Performan e of a position-sensitive s intillation dete tor, Phys. Med.Biol., vol. 30, no. 7, pp. 643655, 1985.[201 D. P. M Elroy, S.-C. Huang, and H. E. J., The Use of Retro-Ree tive Tape for Improving SpatialResolution of S intillation Dete tors, IEEE Trans. Nu l. S i., vol. 49, no. 1, pp. 165171, Feb. 2002.
138

A Common Radiopharma euti alsA Common Radiopharma euti alsThe following table summarizes important tests with its orresponding radiopharma euti al. The list wasnot intended to be omplete and the data was taken from the indi ated sour es.Test Agent Isotope Purpose & Indi ationsPlasma volume Serum albumin 121I Determination of plasma volumeex essive blood loss, burns, ardiovas ular or renal disease;[202, 203Red ell volume Erythro ytes 51Cr Determination of red ell volumeand their half life gastro-intestinalprotein loss; [202Vitamin B12absorption Vitamin B12 with intrinsi fa tor(IF) and Vitamin B12
57Co,58Co
Determination of Vitamin B12absorption/ex retion, Perni iousanemia; [202Thyroid Na salt 131I Determination of thyoridfun tion, thyorid imaging, alsodiagnosis of abnormal liverfun tion, renal blood ow, urinarytra t obstru tion; [202, 203Thyroid (Imaging) NaTcO−4
99mTc Determination of areas withde reased/in reased uptake,hyperthyoridism, tumor; [202Brain imaging Glu oheptonate 99mTc Study of vas ularity of brainphysi al injury, tumor; [202liver/spleen imaging sulphur olloid 99mTc Study of uptake of olloid,abnormal liver/spleen; [202Kidney Glu oheptonate 99mTc Study of stru ture and ltrationrate, renal trauma, tumors or ysts; [202Lung Albumin ma roaggregates 99mTc Ma roaggregates trapped inpulmonary apillary bed,defe tive perfusion; [202Internal, mammaryand ilia lymph nodes Antimony sulphide olloid 99mTc Lo alization of internal mammaryand pelvi lymph nodes,lo alization of sentinel nodes;[202Skeleton Phosphates,HDP 99mTc Uptake/hlaf-life of tra er(phosphate tra er behaves like al ium), metastati disease,regions of trauma, arthriti regions; [202Tumors 67Ga-Citrate 67Ga Regional tra er uptake, re urren eof lymphomas, regions ofinammation; [202Heart Sestamibi, Tetrofosmin 99mTc Myo ardial perfusion imaging(MPI), diagnosis of heart onditions, oronary arterydisease (CAD), a ute is hemi syndrome, also lo ation oflow-grade lymphomas;[202, 203, 204139

A Common Radiopharma euti alsTest Agent Isotope Purpose & Indi ationsHeart TlCl (via the ATP-pump for Ka) 201Tl Myo ardial viability, regionalbloodow, CAD, predi tion offuture ardia events;[202, 203, 204Heart Ru (via the ATP-pump for Ka) 82Ru Myo ardial perfusion imaging,stress/rest proto ols; [204Lung Krypton-gas 81mKr Fun tional imaging of pulmonaryventilation, asthma, earlydiagnosis of lung disease; [203Breast Sestamibi 99mTc Imaging of dense breast tissue,dete tion of breast an er; [202Enzymes Seleno-methionine 75Se Study of produ tion of digestiveenzymes; [203Tumors/Heart Fluoro-dioxy glu ose (FDG) 18F Distribution of FDG (gly olysis),dete tion of tumors, infe tion,post-traumati inammation,gly olysis of myo ardium;[202, 203, 204Heart Ammonia (via the Na/K ATPasepump) 13N Quality images of themyo ardium; [204Heart Radioiodinated fatty a id 123I Metaboli imaging of themyo ardium; [204Heart 15-(p-123Iiodophenyl-)-3-R,S-methylspentade anoi a id (BMIPP) 123I Cardia metaboli a tivity,myo ardial viability; [204Heart Palmitate 11C Myo ardial blood ow (tra eruptake), metaboli metabolism(tra er learan e); [204Somatostatin re eptor 111In-D-Phe-DTPA-o treotide(O treos an) 111In Clini al imaging of primary andmetastati breast ar inoma,lymphoma and neuroendo rinetumors; [205Somatostatin re eptor 99mTc-depreotide (Neote t) 99mTc Clini al imaging of primary andmetastati breast ar inoma,lymphoma and neuroendo rinetumors; [205(GABA)A re eptor(Gamma-Aminobutyri A id) [123Iiomazenil 123I Imaging of neurologi disorders,Alzheimer presenile dementia,pre/intra-operative denition of erebral tumor margins (SPECT);[205(GABA)A re eptor [11Cumazenil 11C Imaging of neurologi disorders,epilepsy (PET); [205, 206Dopamine Transporter(DAT) [123Iβ-CIT,[123IFP-CIT 123I A elerated presynapti dopaminergi degeneratin inParkinson disease; [205D2 DopamineRe eptor 123I-iodo-benzamide,
123I-iodolisuride 123I Abnormal in rease in D2 re eptorbinding found in s hizophrenia;[205Dopamine Metabolism [18FFluoroDOPA 18F Loss of dopaminergi neurons(dopamine synthesis); [206140

Referen esTest Agent Isotope Purpose & Indi ationsD2 DopamineRe eptor N-methylspiroperidol 18F,
11CMeasurement of dopaminere eptor availibility, absolute on entration in thenormal/diseased brain, probe ofdopamine re eptor o upan y byantipsy hoti drugs; [206DopamineTransporters [11Cnomifensine, [11C o aine 11C Study of neurodegeneration,aging, dopamine transportero upan y by drugs; [206Vesi ular aminetransporters α(+) − [11C]-dihydrotetrabenazine 11C Normal aging, Parkinson'sdisease; [206Cate hol-O-Methyl-transferase (estrogenmetabolism) [18FRo41-0960 18F Promising tra er for Breast an er(pre lini al studies); [206Brain serotoninesystem (5-HTre eptors) [18Faltanserin, [18Fsetoperone 18F Anxiety, depression, sleep/eatingdisorders, violen e; [206Brain opiate system [11CCarfentanil 11C Respiratory depression, analgesia,reward, sedation; [206Benzodiazepine system isoquinoline [11CPK 11195 11C High, saturable uptake in gliomarelative to normal brain tissue,multiple s lerosis; [206Mus arini -Cholinergi Re eptors [11CN-methyl-4-piperidinylbenzilate 11C Mus arini re eptor on entrationin normal aging and Alzheimer'sdisease; [206Amino-A id transportand Protein synthesis [11CD/L-methionine 11C Delineation of tumors; [206Amino-A id transportand Protein synthesis [11C- arboxylL-leu ine 11C Protein synthesis rate (braindevelopment, regeneration,repair); [206Amino-A id transportand Protein synthesis O-(2-[18Fuoroethyl)-L-tyrosine 18F Mammary ar inoma in mi e,re urrent astro ytoma in humans;[206DNA synthesis 14C/3H-labeled thymidine 14C,
3HMeasurement of tissueproliferation and growth kineti s;[206DNA synthesis [18FFluorouridine, [11Fthymidine 18F,
11CMeasurement of tissueproliferation and growth kineti s;[206DNA synthesis [18FFLT 18F High- ontrast images of normalbone marrow and tumors in anine and human subje ts; [206Referen es[202 H. E. Johns and J. R. Cunningham, The Physi s of Radiology, 4th ed. Charles C Thomas Publisher,1983.[203 UIC, Radioisotopes in medi ine, Published by the World Nu lear Asso iation, May 2004,http://www.world-nu lear.org.[204 W. A ampa, C. Di Benedetto, and A. Cuo olo, An overview of radiotra ers in nu lear ardiology,J. Nu l. Cardiol., vol. 7, no. 6, pp. 701707, 2000.[205 F. G. Blankenberg and H. Strauss, Nu lear medi ine appli ations in mole ular imaging, J. Magn.Reson. Imaging, vol. 7, pp. 352361, 2002. 141

Referen es[206 J. S. Fowler, Y.-S. Ding, and N. D. Volkow, Radiotra ers for positron emission tomography imaging,Seminars Nu l. Med., vol. 33, no. 1, pp. 1427, Jan. 2003.
142

B Common Inorgani S intillatorsB Common Inorgani S intillatorsThe following table resumes the physi al properties of various ommon s intillators. The data has beentaken mainly from Novotny [207, Mel her [208, van Eijk [209, 210, Pidol et al. [211, Eriksson et al. [212and Derenzo and Moses [213.Name/Dopand Zeff Density[g/cm2 λ [nm photons[keV−1 de aytime[ns refra .index radiationlength [ m&photofra t. Hygro-s opi
NaI:Tl 50.8 3.67 415 38 230 1.85 2.6/17 yesCsI 54 4.51 305 450 2 2 20 1.8 1.86/21 slightCsI:Na 54 4.51 420 39 4604180 1.84 1.86/21 slightCsI:Tl 54 4.51 550 565 65 6803340 1.8 1.86/21 slightBi4Ge3O12 (BGO) 75 7.13 480 8.2 300 2.15 1.12/40 noBaF2 51 4.88 220 310 1.4 9.5 0.6 630 1.56 2.03/19 noCaF2:Eu 16.5 3.18 435 24 940 1.44 3.05 noCdWO4 66 8 470 15 1.1µs14.0µs
2.3 1.06/29 noCaWO4 6.1 430 6 940 1.92 1.5 noLiF:W 8.31 2.64 430 1.5 4000 1.4 noLiI:Eu 4.08 470 485 11 1400 1.96 2.73 yesLuAlO3:Ce (LuAP) 65 8.4 365 17 17 1.94 1/30 noLu1−xYxAlO3:Ce(LuYAP) 61.3 7.1 367 6-8 20-26200 1.4 1.3/27 noLu2(SiO4)O:Ce+(LSO) 66.4 7.4 420 25 40 1.81 1.14/32 noLu2−xYx(SiO4)O:Ce+(LYSO) 66 7.4 428 32 41 1.81 1.1/30 noLu2−xGdx(SiO4)O:Ce+(LGSO) 57 6.7 410 500 18 65 noLu2Si2O7:Ce (LPS) 64 6.2 380 20 30 1.74 1.4/29 noLu2S3:Ce 6.2 590 28 32 1.4 noGd2SiO5:Ce+ (GSO) 59.4 6.71 440 9 56 400 1.85 1.4/25 noGd2O2S:Pr(GOS/UFC) 61.3 7.34 510 50 3000 1.27/27 noY1.34Gd0.6O3S:Eu0.06
Y1.34Gd0.6O3S:Pr0.06(Hilight) 52.2 5.9 610 44 1000 1.78/16 noGd3Ga5O12:Cr, Ce 53.5 7.1 730 40 140µs 1.48/18 noPbSO4 70.4 6.20 350 3.8 100 1.88 1.28 noCsF 53 4.64 390 1.5 5 1.48 2.69 yesCeF3 6.16 310 340 4.4 5 27 1.68 1.68 noY3AlO3:Ce+ (YAP) 36 5.37 370 18 27 1.95 2.7 noY3Al5O12:Ce+ (YAG) 14 4.56 550 17 88 302 1.82 3.5 noLiF/ZnS:Ag 26.1 4.09 450 75 200 2.36 no 143

Referen esName/Dopand Zeff Density[g/cm2 λ [nm photons[keV−1 de aytime[ns refra .index radiationlength [ m&photofra t. Hygro-s opi Lu2O3:Eu, Tb 68.7 9.4 610 30 >1000 8.7/35 noPbWO4 76 8.28 440
∼500 0.2 5 ∼ 15 2.16 0.89 noPbWO4:Mo, Y 8.3 ∼ 500 0.6 ∼ 15 0.87 noPbWO4:Mo, Nb 8.3 ∼ 500 0.4 10 ∼
1030.87 no
LaF3:Ce 52 5.94 290 340 2.2 26 1.7 1.85 noLaCl3:Ce 50 3.86 330 46 25 27.8 yesLaBr3:Ce 47 5.3 360 61 25 1.88 2.13/15 yesLuI3:Ce 61 5.6 474 33 34,360 1.7 yesLuPo4:Ce 62.5 6.53 360 17 24 1.43/30 noZnSe:Te 33 5.42 610
∼640 80 1000∼30000 2.6 no
ZnS:Ag 4.1 450 49 200 2.4 2.94 noZnO:Ga 5.6 385 15 1.48 2.0 2.16 noZnWO4 7.87 480 10 5000 2.2 1.2 noanthra ene 1.25 450 16 30 1.62 8.79 noReferen es[207 R. Novotny, Inorgani s intillators a basi material for instrumentation in physi s, Nu l. Instr.and Meth. A, vol. 537, pp. 15, 2005.[208 C. Mel her, Perspe tives on the future development of new s intillators, Nu l. Instr. and Meth. A,vol. 537, pp. 614, 2005.[209 C. W. van Eijk, Inorgani s intillators in medi al imaging, Phys. Med. Biol., vol. 47, pp. R85R106,2002.[210 C. W. E. van Eijk, Inorgani s intillators in medi al imaging dete tors, Nu l. Instr. and Meth. A,vol. 509, no. 1-3, pp. 1725, Aug. 2003.[211 L. Pidol, A. Kahn-Harari, B. Viana, B. Ferrand, P. Dorenbos, J. de Haas, C. van Eijk, and E. Virey,S intillation properties of Lu2Si2O7 : Ce3+, a fast and e ient s intillator rystal, J. Phys. Condens.Matter, vol. 15, pp. 20912102, 2003.[212 L. Eriksson, D. Townsend, M. Eriksson, C. Mel her, M. S hmand, B. Bendriem, and R. Nutt, Ex-perien e with s intillators for PET: towards the fth generation of PET s anners, Nu l. Instr. andMeth. A, vol. 525, pp. 242248, 2004.[213 S. Derenzo and W. Moses, Experimental eorts and results in nding new heavy s intillators, inTransparen ies, Chamonix, Fran e, Sept. 2226, 1992, prepared for International Workshop on HeavyS intillators for S ienti and Industrial Appli ations: Crystal 2000, Chamonix, Fran e, 22-26 Sep1992.
144
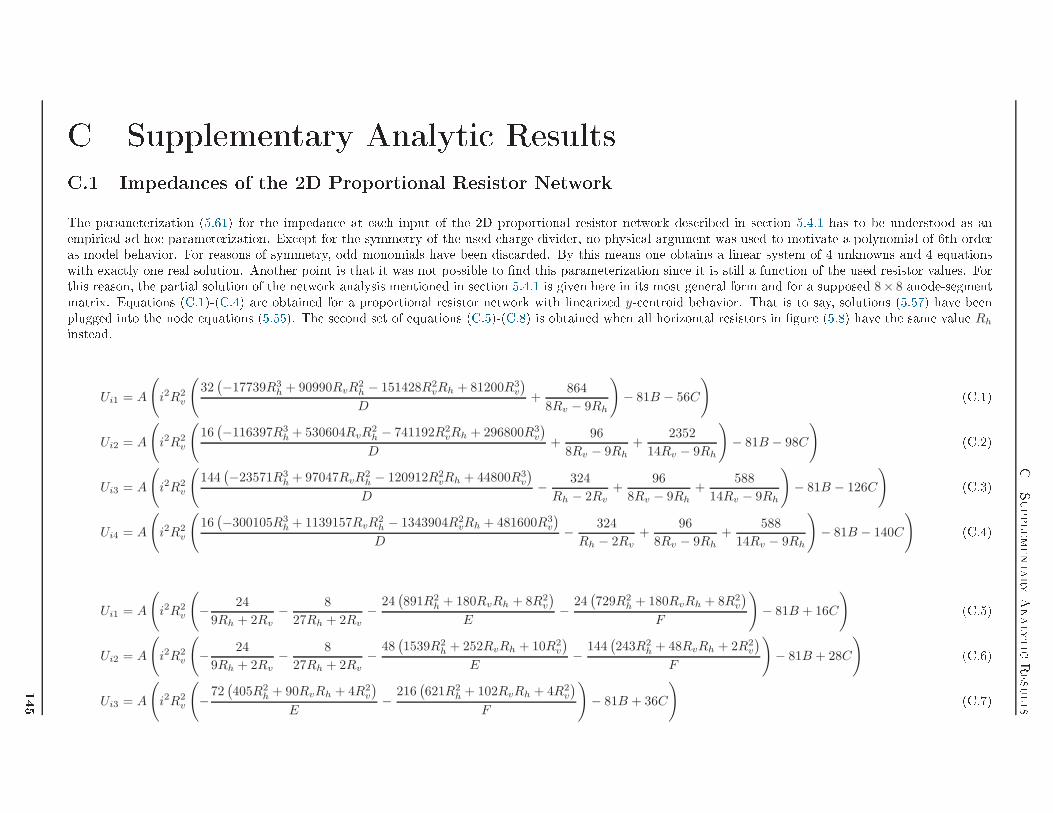
CSupplementaryAnalyti Results
C Supplementary Analyti ResultsC.1 Impedan es of the 2D Proportional Resistor NetworkThe parameterization (5.61) for the impedan e at ea h input of the 2D proportional resistor network des ribed in se tion 5.4.1 has to be understood as anempiri al ad-ho parameterization. Ex ept for the symmetry of the used harge divider, no physi al argument was used to motivate a polynomial of 6th orderas model behavior. For reasons of symmetry, odd monomials have been dis arded. By this means one obtains a linear system of 4 unknowns and 4 equationswith exa tly one real solution. Another point is that it was not possible to nd this parameterization sin e it is still a fun tion of the used resistor values. Forthis reason, the partial solution of the network analysis mentioned in se tion 5.4.1 is given here in its most general form and for a supposed 8× 8 anode-segmentmatrix. Equations (C.1)-(C.4) are obtained for a proportional resistor network with linearized y- entroid behavior. That is to say, solutions (5.57) have beenplugged into the node equations (5.55). The se ond set of equations (C.5)-(C.8) is obtained when all horizontal resistors in gure (5.8) have the same value Rhinstead.
Ui1 = A
(
i2R2v
(
32(−17739R3
h + 90990RvR2h − 151428R2
vRh + 81200R3v
)
D+
864
8Rv − 9Rh
)
− 81B − 56C
) (C.1)
Ui2 = A
(
i2R2v
(
16(−116397R3
h + 530604RvR2h − 741192R2
vRh + 296800R3v
)
D+
96
8Rv − 9Rh+
2352
14Rv − 9Rh
)
− 81B − 98C
) (C.2)
Ui3 = A
(
i2R2v
(
144(−23571R3
h + 97047RvR2h − 120912R2
vRh + 44800R3v
)
D− 324
Rh − 2Rv+
96
8Rv − 9Rh+
588
14Rv − 9Rh
)
− 81B − 126C
) (C.3)
Ui4 = A
(
i2R2v
(
16(−300105R3
h + 1139157RvR2h − 1343904R2
vRh + 481600R3v
)
D− 324
Rh − 2Rv+
96
8Rv − 9Rh+
588
14Rv − 9Rh
)
− 81B − 140C
) (C.4)
Ui1 = A
(
i2R2v
(
− 24
9Rh + 2Rv− 8
27Rh + 2Rv− 24
(891R2
h + 180RvRh + 8R2v
)
E− 24
(729R2
h + 180RvRh + 8R2v
)
F
)
− 81B + 16C
) (C.5)
Ui2 = A
(
i2R2v
(
− 24
9Rh + 2Rv− 8
27Rh + 2Rv− 48
(1539R2
h + 252RvRh + 10R2v
)
E− 144
(243R2
h + 48RvRh + 2R2v
)
F
)
− 81B + 28C
) (C.6)
Ui3 = A
(
i2R2v
(
−72(405R2
h + 90RvRh + 4R2v
)
E− 216
(621R2
h + 102RvRh + 4R2v
)
F
)
− 81B + 36C
) (C.7)145

C.1Impedan esofthe2DProportionalResistorNetworkUi4 = A
(
i2R2v
(
− 24
9Rh + 2Rv− 8
27Rh + 2Rv− 24
(7209R2
h + 1152RvRh + 44R2v
)
E− 24 (9Rh + 2Rv) (27Rh + 2Rv)
F
)
− 81B + 40C
) (C.8)with
A = 2916−1
B =(4i2 − 81
)Rh
C =(4i2 + 81
)Rv
D = 6561R4h − 38880RvR
3h + 82404R2
vR2h − 73056R3
vRh + 22400R4v
E = 729R3h + 1458RvR
2h + 216R2
vRh + 8R3v
F = 2187R3h + 1458RvR
2h + 216R2
vRh + 8R3vWith these expressions, an expli it parameterization in the position indexes i and j an be given for the ase explained in se tion 5.4.1 with Rh = 10Rv:
RImp(i, j) =5
18
(81 − 4i2
)Rv +
(a2j
2 + a0 + i2(b6j
6 + b4j4 + b2j
2 + b0
))Rv, (C.9)with the exa t parameter values
a0 = − 6316 , a2 = − 7
36
b0 = − 1834806486574993190912 , b2 = 105010791245
6918121861632 , b4 = − 3274123751729530465408 , b6 = 816155
432382616352 .
(C.10)If all Rhj are set to Rh, one will obtain the following exa t parameter valuesa0 = 9
8 , a2 = − 118
b0 = 44570871214009595922346100698554368 , b2 = − 52753280350225
25620725019404288 , b4 = − 974527303756405181254851072 , b6 = − 74531275
1601295313712768 .
(C.11)
146

D Ele troni Amplifier Configuration for the ExperimentD Ele troni Amplier Congurationfor the ExperimentSumming AmplierFor the omputation of the sum of the 64 voltages sensed at the inputs of the harge divider ir uits, thestandard analogue adder onguration of gure D.1 was used. The diodes D1 and D2 have the fun tion ofprote ting the inputs of the operational amplier. R1, R2 and R3 are used for oset orre tions and C7prevents the ir uit from os illations.-
+
Vee
Vcc
Vcc
Vee
PSfrag repla ementsR1
R2
R3 R4
R5
R6
C1 C2 C3
C4 C5 C6
C7
D1 D2
U1 VOut∑
Figure D.1: S hemati s of the summation amplier.Component Value Component Value Component ValueR1, R3 1kΩ R6 50Ω D1, D2 1SS335R2 10kΩ C1, C6 10µF U1 AD8055
R4 1.5kΩ C2, C5 100nF C7 3.9pF
R5 2.7kΩ C3, C4 1nFTable D.1: Ele troni onguration ( omponent values) for the summationamplier shown in gure D.1.Inverting/Non-inverting Amplier and Line-driverThe onguration for the inverting (gure D.2) and the non-inverting (gure D.3) amplier are the sameex ept for the detail that the operational amplier U2 inverts the signal from U1 in the rst ase and doesnot invert the orresponding signal in the latter ase. R2 onverts the input urrent IIn into a voltagewhi h enters the rst stage build by U1. U2 builds a dierential amplier whi h subtra ts the output ofthe integrator U3. U4 senses the output voltage of the dierential amplier and feeds it into the integrator.In this way, the baseline of the fast PMT signals are restored. The diodes prote t the inputs of the rststages.147

D Ele troni Amplifier Configuration for the Experiment-
+-
+
-
+
-
+
PSfrag repla ementsR1
R2
R3
R4
R5
R6
R7
R8
R9
R10
C1
C2
C3
C4
C5
C6
C7
C8
C9
C10
C11
C12
C13
C14
C15
C16
C17
C18
C19
D1
D2
U2
U3
U4
U1
VCC VCCVCC
VCCVEE
VEEVEE
VEEIIn
IOut
Figure D.2: S hemati ir uit diagram of the inverting preamplier/linedriver. The values of the dierent omponents are given in table D.2.Component Value Component Value Component ValueR1 270Ω R9 10kΩ D1, D2 1SS335
R2, R8 50Ω R10 4.7kΩ U1 AD8009
R3, R6, R7 270Ω C1, C4, C5, C8, C10, C13, C15, C18 1µF U2, U4 AD8055R4, R5 100Ω C2, C3, C6, C7, C11, C12, C14, C16, C17, C19 100nF U3 OP97FSTable D.2: Ele troni onguration ( omponent values) for the invertingpreamplier/line driver.Component Value Component Value Component ValueR1 47Ω R9 10kΩ D1, D2 1SS335
R2, R8 50Ω R10 4.7kΩ U1 AD8009R3, R6, R7 270Ω C1, C4, C5, C8, C10, C13, C15, C18 1µF U2, U4 AD8055
R4, R5 100Ω C2, C3, C6, C7, C11, C12, C14, C16, C17, C19 100nF U3 OP97FSTable D.3: Ele troni onguration ( omponent values) for the non-inverting preamplier/line driver.148

D Ele troni Amplifier Configuration for the Experiment
-
+
-
+
-
+
-
+
PSfrag repla ementsR1
R2
R3
R4
R5
R6
R7
R8
R9
R10
C1
C2
C3
C4
C5
C6
C7
C8
C9
C10
C11
C12
C13
C14
C15
C16
C17
C18
C19
D1
D2
U2
U3
U4
U1
VCC VCCVCC VCC
VEE
VEEVEE
VEEIIn IOut
Figure D.3: Cir uit diagram of the non-inverting preamplier/line driver.The values of the dierent omponents are given in table D.3.
149

D Ele troni Amplifier Configuration for the Experiment
150

List of FiguresList of Figures1.1 Two examples of fun tional imaging . . . . . . . . . . . . . . . . . . . . . . . . . . . . . . . 31.2 The spe trum of medi al imaging modalities . . . . . . . . . . . . . . . . . . . . . . . . . . . 61.3 Original proposal of the Anger amera . . . . . . . . . . . . . . . . . . . . . . . . . . . . . . 71.4 S hemati s of the most important omponents of an Anger type s intillation amera . . . . 81.5 Diagram showing the most important ollimators for Anger-type gamma- ameras . . . . . . 91.6 Sket h of important degrading ee ts in PET . . . . . . . . . . . . . . . . . . . . . . . . . . 111.7 Cal ulation of the dete tion e ien y of single dete tor and a oin iden e dete tor . . . . . 111.8 Intrinsi spatial resolution for oin iden e dete tion . . . . . . . . . . . . . . . . . . . . . . . 121.9 Intrinsi spatial resolution for oin iden e dete tion . . . . . . . . . . . . . . . . . . . . . . . 131.10 Positron Emission Tomography s anner geometries . . . . . . . . . . . . . . . . . . . . . . . 153.1 p-n diode jun tion dete tor in reversed bias operation mode . . . . . . . . . . . . . . . . . . 243.2 S hemati diagram of the most basi s intillation ounter . . . . . . . . . . . . . . . . . . . 253.3 S hemati of a modern high output linearity bleeder ir uit . . . . . . . . . . . . . . . . . . 283.4 Formation of the parallax error and its manifestation . . . . . . . . . . . . . . . . . . . . . . 303.5 S hemati diagrams for possible dete tion of Compton s attered events . . . . . . . . . . . . 313.6 De ay s hemes of four often used radionu lides for PET . . . . . . . . . . . . . . . . . . . . 323.7 Radial point spread fun tion for the positron range of four radionu lides for PET . . . . . . 333.8 Most ommon approa hes of realizing DOI apable γ-ray dete tors . . . . . . . . . . . . . . 353.9 Image re onstru tion with TOF apable PET amera . . . . . . . . . . . . . . . . . . . . . 364.1 Naming onvention for the intera tion depth and intera tion distan e . . . . . . . . . . . . . 404.2 Cosine law for the irradiation of planar surfa es . . . . . . . . . . . . . . . . . . . . . . . . . 414.3 Geometri refra tion of the s intillation light path . . . . . . . . . . . . . . . . . . . . . . . 434.4 Angle of in iden e and virtual depth of the refra ted s intillation light path . . . . . . . . . 444.5 Impa t of dierent refra tive indi es of dete tor-window/s intillator on signal distributions 454.6 Light transmission and ree tion at the photo athode . . . . . . . . . . . . . . . . . . . . . 474.7 Ree tan e, transmittan e and absorban e of the photo athode . . . . . . . . . . . . . . . . 484.8 Contributions to the ba kground distribution aused by rst-order diusive ree tions . . . 494.9 Example distributions of the total light distribution and the assumed ba kground light . . . 514.10 Depth dependen e of the normalized se ond moment and the standard deviation . . . . . . 525.1 Mean, mode , median and average probability for two unimodal PDF . . . . . . . . . . . . . 565.2 Anode ir uit and pulse shapes for anode loads . . . . . . . . . . . . . . . . . . . . . . . . . 575.3 Elementary operational amplier onguration and urrent sensitive preamplier . . . . . . 595.4 Graphi al representation for dierent inje ted urrent distributions along a ondu tor . . . 615.5 Cir uit diagram showing the 1D-version of the anger positioning ir uit . . . . . . . . . . . 635.6 Anger positioning logi for higher dimensions . . . . . . . . . . . . . . . . . . . . . . . . . . 645.7 Normally used one-dimensional DPC- ir uit for urrent PSPMTs . . . . . . . . . . . . . . . 66151

List of Figures5.8 Two-dimensional proportional resistor network . . . . . . . . . . . . . . . . . . . . . . . . . 675.9 Ele tri ir uit with naming onvention for the omputation of the lateral resistors . . . . . 685.10 Cir uit for a two-dimensional hybrid harge dividing readout . . . . . . . . . . . . . . . . . 705.11 Inverting amplier onguration for use as summation amplier . . . . . . . . . . . . . . . . 715.12 S hemati diagram of the resistor hain and naming onventions . . . . . . . . . . . . . . . 735.13 One dimensional proportional resistor hain for 8 anodes . . . . . . . . . . . . . . . . . . . . 755.14 Dependen e of the voltage sum on the position of the inje ted urrent . . . . . . . . . . . . 775.15 Summed voltages and deviation from simulations for the optimized ase . . . . . . . . . . . 785.16 Corre ted sum voltage for the hybrid harge divider onguration. . . . . . . . . . . . . . . 795.17 Ele troni ongurations for passive anode inhomogeneity ompensation . . . . . . . . . . . 805.18 A tive anode inhomogeneity ompensation using urrent ampliers . . . . . . . . . . . . . . 825.19 Broadening of the signal distribution owing to the pixel size . . . . . . . . . . . . . . . . . . 845.20 Behavior of positioning of the enter of gravity algorithm . . . . . . . . . . . . . . . . . . . 866.1 Total γ-ray attenuation for LSO from 10 keV to 10 MeV . . . . . . . . . . . . . . . . . . . . 906.2 Angular dependen y of the photon's nal energy, energy transfer and di. ross se tion . . . 916.3 Histograms for the displa ements of the entroids due to Compton s attering . . . . . . . . 936.4 Distribution of the s attering angle obtained from the subset of all dete ted events . . . . . 957.1 Explosion view of a single γ-ray dete tor module . . . . . . . . . . . . . . . . . . . . . . . . 987.2 Layout of the onguration for data-a quisition and oin iden e-trigger generation . . . . . 997.3 Me hani al setup of the experiment . . . . . . . . . . . . . . . . . . . . . . . . . . . . . . . . 1007.4 Graphi illustration of the 81 test positions . . . . . . . . . . . . . . . . . . . . . . . . . . . 1017.5 Simulated positron endpoint distribution of the test sour e . . . . . . . . . . . . . . . . . . 1017.6 Graphi al illustration for the derivation of the t model . . . . . . . . . . . . . . . . . . . . 1027.7 Examples of distributions from moment measurements . . . . . . . . . . . . . . . . . . . . . 1047.8 Correlation between x, y and µ2 for an in lined γ-ray beam . . . . . . . . . . . . . . . . . . 1057.9 Density plot of the entroids for an in lined beam . . . . . . . . . . . . . . . . . . . . . . . . 1067.10 Density plot of the entroids for an in lined beam (ltered) . . . . . . . . . . . . . . . . . . 1077.11 Weights for the entroids and the omposite se ond moment . . . . . . . . . . . . . . . . . . 1097.12 Plots of measured values, errors and theoreti al predi tions for both entroids . . . . . . . . 1117.13 Plots of measured values, errors and theoreti al predi tions for energy and se ond moment . 1127.14 Plots of measured values, errors and theoreti al predi tions for energy without ree tive bg. 1137.15 Measured resolutions for the x- and y- entroid and the energy . . . . . . . . . . . . . . . . 1157.16 Measured resolutions for µx2,y0 + µx0,y2 and σID . . . . . . . . . . . . . . . . . . . . . . . . . 1168.1 Grid of transverse test-positions . . . . . . . . . . . . . . . . . . . . . . . . . . . . . . . . . . 1248.2 Qualitative omparison of the quality of moments and re onstru ted positions . . . . . . . . 1268.3 Three-dimensional representation of the sele ted oin iden e events . . . . . . . . . . . . . . 1288.4 Measured resolutions for the re onstru ted x- and y-positions . . . . . . . . . . . . . . . . . 1298.5 Measured resolution for the re onstru ted z-positions . . . . . . . . . . . . . . . . . . . . . . 1308.6 Linearity behavior of the re onstru ted positions and the entroids . . . . . . . . . . . . . . 132D.1 S hemati s of the summation amplier . . . . . . . . . . . . . . . . . . . . . . . . . . . . . . 147D.2 S hemati ir uit diagram of the non-inverting preamplier/line driver . . . . . . . . . . . . 148D.3 Cir uit diagram of the non-inverting preamplier/line driver . . . . . . . . . . . . . . . . . . 149152

List of TablesList of Tables6.1 Counts, total fra tions and relative fra tions of possible events . . . . . . . . . . . . . . . . 926.2 Dierent statisti al estimates in mm for the displa ement distributions . . . . . . . . . . . . 947.1 S aling of the theoreti al moment predi tions . . . . . . . . . . . . . . . . . . . . . . . . . . 1107.2 Statisti estimators for the errors of the limit parameter a and b of all four moments . . . . 1137.3 Mean, std. dev., max. and min. values for the resolutions of the four moments . . . . . . . . 1168.1 Mean, std. dev., max. and min. values for resolutions of the 3D positions . . . . . . . . . . . 1318.2 Mean, std. dev., max. and min. values of the linearity error for the 3D positions . . . . . . . 131D.1 Ele troni onguration for the summation amplier . . . . . . . . . . . . . . . . . . . . . . 147D.2 Ele troni onguration ( omponent values) for the inverting preamplier/line driver . . . . 148D.3 Ele troni onguration ( omponent values) for the non-inverting preamplier/line driver . 148
153

List of Tables
154

A knowledgmentsI want to thank everyone who helped me nish this dissertation resear h and writing.First of all, I'd like to thank José-M. Benllo h for being my supervisor during thelast 4 years. Spe ial thanks go to Filomeno Sán hez and José Luis Taín for their on-tinuous support and many larifying dis ussions. I also would like to thank Mi haelDöring, Igor Tka henko, Adora ión Abellan, Magdalena Rafe as, Noriel Pavón, Fran- is o Gar ía-de-Quirós and Jose Antonio Palazón for helpful suggestions and om-ments.I am also indebted to Luis Caballero, Antonio Gonzalez, Ana Ros, Mike Ramage andall others who helped me revise my dissertation.Further thanks go to María Fernández, Cibeles Mora, Eva Nerina Giménez and Mar osGiménez and others. Their help on various o asions is gratefully a knowledged.I would spe ially thank Daniel Bornkessel and Thomas Übermeier who helped mewith several omputer issues.My thanks and appre iation also go to the German A ademi Ex hange Servi e(DAAD) and the Spanish Ministry of S ien e and Edu ation for the funding of thisdo toral thesis.At last, I want to thank my parents Sieglinde and Karl-Heinz and my sister Sabinefor their endless support. Without their help and ourage this work would not havebeen possible.Thank You everyone

Copyright © 2022 FDOKUMEN