Geochemical Characterization of Groundwater in the Confined ...
Upload
independentCategory
view
1download
0
arX
iv:c
ond-
mat
/041
1575
v1 [
cond
-mat
.sup
r-co
n] 2
3 N
ov 2
004
Depinning and dynamics of vortices confined in
mesoscopic flow channels.
R. Besseling∗ and P.H. KesKamerlingh Onnes Laboratorium, Leiden University,
P.O. Box 9504, 2300 RA Leiden, the Netherlands.
T. DroseI. Institut fur Theoretische Physik, Universitat Hamburg, Jungiusstrasse 9, D-20355 Hamburg, Germany.†
V.M. VinokurMaterials Science Division, Argonne National Laboratory, Argonne, Illinois 60439
(Dated: January 26, 2014)
We study numerically and analytically the behavior of vortex matter in artificial flow channelsconfined by pinned vortices in the channel edges (CE’s). The critical current density Js for chan-nel flow is governed by the interaction with the static vortices in the CE’s. Motivated by earlyexperiments which showed oscillations of Js on changing (in)commensurability between the chan-nel width w and the natural vortex row spacing b0, we study structural changes associated with(in)commensurability and their effect on Js and the dynamics. The behavior depends cruciallyon the presence of disorder in the arrays in the CE’s. For ordered CE’s, maxima in Js occur atcommensurability w = nb0 (n integer), while for w 6= nb0 defects along the CE’s cause a vanishingJs. For weak disorder, the sharp peaks in Js are reduced in height and broadened via nucleationand pinning of defects. The corresponding structures in the channels (for zero or weak disorder)are quasi-1D n row configurations, which can be adequately described by a (disordered)sine-Gordonmodel. For larger disorder, matching between the longitudinal vortex spacings in and outside thechannel becomes irrelevant and, for w ≃ nb0, the shear current Js levels at ∼ 30% of the value J0
s
for the ideal commensurate lattice. Around ’half filling’ (w/b0 ≃ n± 1/2) the disorder leads to newphenomena, namely stabilization and pinning of misaligned dislocations and coexistence of n andn ± 1 rows in the channel. At sufficient disorder, these quasi-2D structures cause a maximum in Js
around mismatch, while Js smoothly decreases towards matching due to annealing of the misalignedregions. Near threshold, motion inside the channel is always plastic. We study the evolution of staticand dynamic structures on changing w/b0, the relation between the Js modulations and transversefluctuations in the channels and find dynamic ordering of the arrays at a velocity with a matchingdependence similar to Js. We finally compare our numerical findings at strong disorder with recentmode-locking experiments, and find good qualitative agreement.
PACS numbers: 74.25.Qt flux motion; 83.50.Ha flow in channels ;83.50.Lh slip boundary effects ; 71.45.Lr
CDW’s; 62.20.Fe Deformation and plasticity
Contents
I. Introduction 2
II. Model and numerical procedure 4
III. Single chain in an ordered channel 5
A. Continuum sine-Gordon description 5
B. Transport properties 6
C. Numerical results 7
IV. Ordered CE’s and multiple chains 8
∗Presently at the School of Physics, University of Edinburgh,
Kings Buildings, Mayfield Road, Edinburgh EH9 3JZ, United King-
dom†Presently at Siemens AG, St.-Martin-Str. 76, D-81617 Munchen,
Germany
V. Single chain in a disordered channel 10
A. Disordered sine-Gordon equation 11B. Numerical results 11C. Analysis of pinning forces and crossover to strong disorder
VI. Wide channels with weak disorder 15A. Behavior near commensurability 15B. Behavior around ’half filling’ 16
VII. Wide channels with strong disorder 17
A. Static structures, yield strength and depinning17
B. Analysis of dynamic properties 18
VIII. Discussion 20
IX. Summary 22
Acknowledgments 22
2
A. Ordered channel for arbitrary field 22
B. Solution to the dynamic sine-Gordon equation23
C. Elastic shear waves in commensurate, ordered channels24
D. Disordered channel potential and pinning of defects25
References 27
I. INTRODUCTION
The depinning and dynamics of the vortex lattice (VL)in type II superconductors is exemplary for the behaviorof driven, periodic media in presence of a pinning poten-tial [1]. Other examples range from sliding surfaces ex-hibiting static and dynamic friction and absorbed mono-layers [3] to charge density waves (CDW’s) [2], Wignercrystals [4] and (magnetic) bubble arrays [5]. Vortexmatter offers the advantage that the periodicity a0 of thehexagonal lattice can be tuned by changing the magneticinduction B. In addition, the effect of various types ofpinning potentials can be studied. This pinning poten-tial, arising from inhomogeneities in the host material,can be completely random, as in most natural materi-als, or can be arranged in periodic arrays using nano-fabrication techniques [6, 7]. In a variety of cases corre-lated inhomogeneities occur naturally in a material, suchas twin boundaries and the layered structure of the highTc superconductors [8].
Depinning of the VL in a random potential generally in-volves regions of plastic deformations [9, 10, 11, 12, 13],i.e. coexistence of (temporarily) pinned domains withmoving domains. For very weak pinning the typical do-main size can exceed the correlation length Rc of the VL(see [11]) and the weak collective pinning theory [14] canbe successfully used to estimate the critical current den-sity Jc [15, 16]. However, as either the ratio of the VLshear modulus c66 and the elementary pinning strengthor the number of pins per correlated volume decreases,plastically deformed regions start to have a noticeable ef-fect on Jc. Recent imaging experiments [17] have showndirectly that the rise in Jc in weak pinning materialsnear the upper critical field Bc2, known as the peak ef-fect [15, 16], originates from such, rather sudden, en-hancement of the defect density. This strong reductionof the VL correlation length is also accompanied by aqualitative change in the nature of depinning: for strongpinning, depinning proceeds through a dense network ofquasi-static flow channels (filaments) such that the typ-ical width of both static and moving ’domains’ has ap-proached the lattice spacing [9, 10, 18, 19]. Depinningtransitions via a sequence of static, channel like struc-tures have also been observed experimentally via trans-port experiments [20].
FL
Jw + b0
HA
NbN
a-Nb3Ge
~a0
wetched
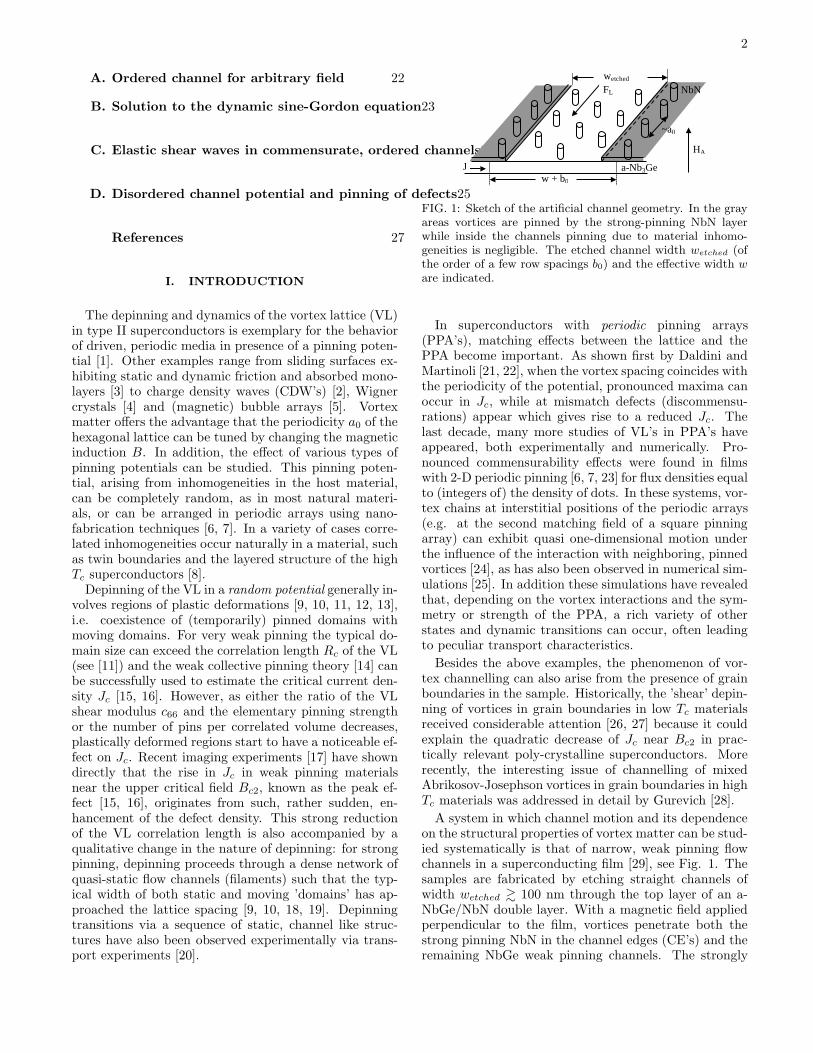
FIG. 1: Sketch of the artificial channel geometry. In the grayareas vortices are pinned by the strong-pinning NbN layerwhile inside the channels pinning due to material inhomo-geneities is negligible. The etched channel width wetched (ofthe order of a few row spacings b0) and the effective width ware indicated.
In superconductors with periodic pinning arrays(PPA’s), matching effects between the lattice and thePPA become important. As shown first by Daldini andMartinoli [21, 22], when the vortex spacing coincides withthe periodicity of the potential, pronounced maxima canoccur in Jc, while at mismatch defects (discommensu-rations) appear which gives rise to a reduced Jc. Thelast decade, many more studies of VL’s in PPA’s haveappeared, both experimentally and numerically. Pro-nounced commensurability effects were found in filmswith 2-D periodic pinning [6, 7, 23] for flux densities equalto (integers of) the density of dots. In these systems, vor-tex chains at interstitial positions of the periodic arrays(e.g. at the second matching field of a square pinningarray) can exhibit quasi one-dimensional motion underthe influence of the interaction with neighboring, pinnedvortices [24], as has also been observed in numerical sim-ulations [25]. In addition these simulations have revealedthat, depending on the vortex interactions and the sym-metry or strength of the PPA, a rich variety of otherstates and dynamic transitions can occur, often leadingto peculiar transport characteristics.
Besides the above examples, the phenomenon of vor-tex channelling can also arise from the presence of grainboundaries in the sample. Historically, the ’shear’ depin-ning of vortices in grain boundaries in low Tc materialsreceived considerable attention [26, 27] because it couldexplain the quadratic decrease of Jc near Bc2 in prac-tically relevant poly-crystalline superconductors. Morerecently, the interesting issue of channelling of mixedAbrikosov-Josephson vortices in grain boundaries in highTc materials was addressed in detail by Gurevich [28].
A system in which channel motion and its dependenceon the structural properties of vortex matter can be stud-ied systematically is that of narrow, weak pinning flowchannels in a superconducting film [29], see Fig. 1. Thesamples are fabricated by etching straight channels ofwidth wetched & 100 nm through the top layer of an a-NbGe/NbN double layer. With a magnetic field appliedperpendicular to the film, vortices penetrate both thestrong pinning NbN in the channel edges (CE’s) and theremaining NbGe weak pinning channels. The strongly

3
0.0 0.2 0.4 0.6 0.8 1.0 1.2 1.40.0
0.5
1.0
1.5
Fs
(106 N
/m3 )
B (T)
FIG. 2: Data: critical shear force density Fs = JsB, deter-mined using a velocity criterion v/a0 ≈ 1 MHz, versus ap-plied field for a channel sample with wetched ≈ 230 nm atT = 1.94 K. Drawn line: Eq.(1) with A = 0.05, Bc2 = 1.55T, λ(T ) = 1.13 µm and effective width w = 300 nm.
pinned CE vortices provide confinement to the vorticesinside the channel as well as the pinning (shear) potentialwhich opposes the Lorentz force from a transport cur-rent J applied perpendicular to the channel. By chang-ing the applied field H one can tune the commensurabil-ity between the vortex lattice constants and the channelwidth, allowing a detailed study of the shear response andthreshold for plastic flow as a function of the mismatchand the actual microstructure in the channel.
Phenomenologically, plastic flow in the channel occurswhen the force density F = JB (with B/Φ0 the vortexdensity) exceeds 2τmax/w, where τmax = Ac66 is the flowstress at the edge (the factor 2 is due to both CE’s) andw is the effective width between the first pinned vortexrows, defined in Fig. 1. Thus, the critical force densityis given by:
Fs = JsB = 2Ac66/w. (1)
The parameter A describes microscopic details of the sys-tem: it depends on lattice orientation, (an)harmonicityof the shear potential, details of the vortex structure inthe CE’s and the microstructure of the array inside thechannel. Critical current measurements as function of ap-plied field reflected this change in microstructure throughoscillations of Fs, shown in Fig. 2 for a channel withwetched ≈ 230 nm. Note that in such a narrow channel,the pinning strength due to intrinsic disorder in the a-NbGe is at most 10% of Fs (except for B . 50 mT) anddoes not affect the oscillations. Since the natural rowspacing of the VL is b0 =
√3a0/2, with a2
0 = 2Φ0/√
3B,and in our geometry B ≃ µ0H one can check that theperiodicity of the oscillations corresponds to transitionsfrom w = nb0 to w = (n ± 1)b0 with n integer, i.e. theprincipal lattice vector ~a0 is oriented along the channel(Fig. 1). The envelope curve represents Eq.(1) withBrandt’s expression for the VL shear modulus [30]:
c66 =Φ0Bc2
16πµ0λ2b(1 − b)2(1 − 0.58b + 0.29b2), (2)
(b = B/Bc2 is the reduced field and λ is the penetra-tion depth) and a value A = 0.05. This value for A
is close to the value√
〈u2〉/a0 = 0.047 for the relativedisplacements at the crossover from elastic to plastic de-formations as obtained from measurements on the peakeffect [16, 17]. This led to a qualitative interpretation ofthe reduction of Fs at minima as being due to defects inthe channel, which develop at incommensurability. How-ever, recent developments [31, 32, 33, 34] have shownthat (strong) structural disorder may be present in theCE arrays, in which case the interpretation can drasti-cally differ.
In this article we present numerical and analyticalstudies of the threshold force and dynamics of vorticesin the channel system for various degrees of edge dis-order. In an early paper [35] we studied the commen-surability effects in the idealized case with periodic ar-rays in the CE’s. In this situation Fs at matching(w = nb0) is equal to the ideal lattice strength 2A0c66/w
(the value A0 = 1/(π√
3) follows from Frenkels consid-erations [36]), while at mismatch dislocations develop,leading to A ≃ 0. The resulting series of delta-like peaksin Fs versus matching parameter differed considerablyfrom the experimental results, which could not be ex-plained by thermal fluctuations or intrinsic disorder in-side the channel. Therefore we investigated the effect ofpositional disorder in the CE arrays on Fs near commen-surability (w ≈ nb0) [33]. In this regime the behavior isdominated by the longitudinal displacements of vorticesin the chains, i.e. quasi one-dimensional (1D), and Fs iscontrolled by defects with Burgers vector along the chan-nel. At weak disorder, we found a clear reduction of Fs
at commensurability caused by nucleation of defects atthreshold, while the existing defects at incommensurabil-ity become pinned by disorder, leading to an increase ofFs in the mismatching case.
The present paper first describes in detail these quasi1D phenomena near commensurability and/or for weakdisorder. Using a generalized sine-Gordon model, wequantitatively describe how the structure and transportproperties depend on the vortex interaction range andon weak disorder in the CE’s. Besides the connectionto our system, these results also provide a backgroundfor understanding quasi-1D vortex states and matchingeffects in artificial PPA’s, including the effects of disor-der which these PPA’s may contain due to fabricationuncertainties.
The 1D model shows that, above a certain disorderstrength, spontaneously (disorder) induced defects alongthe CE’s dominate over incommensurability induced de-fects. The commensurability peak in Fs is then com-pletely smeared out with a value of Fs at matching(w = nb0) saturating at ∼ 30% of the ideal latticestrength. In the more general case of wider channels,the transverse degrees of freedom, especially away frommatching (w/b0 ≃ n±1/2), lead to new phenomena: un-der the influence of disorder, the channel array may splitup in regions with n and n ± 1 rows, involving disloca-

4
tions with Burgers vector strongly misaligned with theCE’s. At sufficient disorder strength, such dislocationslead to a more effective pinning of the array then the’aligned’ dislocations around matching. Fs then exhibitsa smooth oscillation as function of w/b0, similar to Fig. 2,with yield strength maxima occurring around mismatch.This behavior resembles the classical peak effect, i.e. atmismatch the enhanced ability of the arrays to sampleconfiguration space allows better adjustment to the ran-dom CE’s. In the last part of the paper we show detailedsimulations of both static and dynamical aspects of thisbehavior, including a study of reordering phenomena atlarge drive. We find an ordering velocity of the arrayswith a channel width dependence similar to that of thethreshold force. Using a modified version of the dynamicordering theory in [37] it is shown that such behavior canbe explained by a reduction of the energy for formation ofmisaligned defect pairs away from matching. The numer-ical results at strong disorder are also in good qualitativeagreement with recent mode-locking experiments on thechannel system [31, 32].
The outline of the paper is as follows. In Sec.II thechannel geometry and the simulation procedure are dis-cussed. The first part of the paper deals with channelshaving hexagonal, ordered arrays in the CE’s: in Sec.IIIwe present the sine-Gordon description and numerical re-sults for a single 1D vortex chain in an ordered channel;in section IV we show how the 1D behavior extends towider channels with multiple rows and ordered CE’s. Thesecond part of the paper deals with disordered channels:section V describes the effects of weak CE disorder on thebehavior of a 1D chain, both analytically and using nu-merical simulations. The effects of weak disorder in widerchannels are discussed in Sec.VI. Section VII describesthe static and dynamic properties of wider channels inpresence of strong disorder, including an analysis of thereordering phenomena in this situation. A comparisonwith the dynamic ordering theory, the confrontation withexperiments and a summary of the results are presentedin Secs.VIII and IX.
II. MODEL AND NUMERICAL PROCEDURE
We consider straight vortices at T = 0 in the geome-try as illustrated in Fig. 3 for the case of 1 row in thechannel. The approximation T = 0 is well justified overa considerable range of the experiments (see Sec.VIII).The CE’s are formed by two semi-infinite static arrays.The distance between the first vortex rows on both sidesof the channel is w + b0, with w the effective channelwidth. The vortices are assumed to be fixed by colum-nar pins in the CE’s. The principal axis of the pinnedarrays is along the channel direction x. A relative shift∆x is allowed between the arrays. In (a) the simplestconfiguration is shown, where CE vortices form a perfecttriangular lattice. For ∆x = 0, their coordinates are:
rn,m = ([n + frac(m/2)]a0, m[b0 + (w − b0)/2|m|]), (3)
(b)(a)
∆x
x
rn,m
m=1m=2
a0
b0
w+b0
rn,m
+dn,m
FIG. 3: Channel geometry with pinned vortices in the grayareas. The specific case of w ≃ b0, i.e. with 1 row in thechannel is illustrated. (a) Ordered situation: the equilibriumpositions rn,m of pinned vortices in the CE’s are denoted by(). The effective width w and relative shift ∆x are indicated.(b) Disordered case. The randomized vortex positions aredenoted by (•).
for m 6= 0 and frac(m/2) denotes the remainder of m/2.Disorder is incorporated in the model by adding ran-
dom shifts d to the coordinates of the ordered arrays:
Rn,m = rn,m + dn,m, (4)
as shown in Fig. 3(b). The amplitudes of the ran-dom shifts are characterized by disorder parameters ∆x
and ∆y as follows: transverse relative displacementsdy/a0 are chosen independently from a box distribution[−∆y, ∆y]. The longitudinal shifts dx
n,m are chosen suchthat the strain (dn+1 − dn)/a0 along the channel is uni-formly distributed in the interval [−∆x, ∆x]. The lat-ter provides a simple way of implementing loss of longrange order along the CE’s. For ∆x and ∆y we studythe following specific cases: ∆x, ∆y = 0 in Secs. III,IV,∆x ≡ ∆, ∆y = 0 in Sec.V and ∆x = ∆y ≡ ∆ inSecs.VI,VII.
To study the commensurability effects, the effectivewidth of the channel is varied from a value w/b0 ∼ 1−10.We assume that the vortex density in and outside thechannel are the same. The number of vortices in thechannel is then given by Nch = (L/a0)(w/b0) with Lthe channel length. In a commensurate situation one hasw = pb0 and both the row spacing and (average) lon-gitudinal vortex spacing in the channel match with thevortex configuration in the CE’s. When w 6= nb0 thesespacings become different, leading to generation of topo-logical defects. While this model differs from the experi-mental case where the applied field drives the incommen-surability, the method offers a simple way of introducinggeometrical frustration and study various (mis)matchingconfigurations.
With a uniform transport current J applied perpen-dicular to the channel, the equation of motion for vortexi in the channel reads (in units of N/m):
γ∂tri = f −∑
j 6=i
∇V (ri − rj) −∑
n,m
∇V (ri − Rn,m). (5)
V (r) is the vortex-vortex interaction potential, j labelsother vortices inside the channel, the damping parameter

5
γ is given by γ = BΦ0/ρf with ρf the flux flow resistiv-ity, and f = JΦ0 is the drive along the channel. Forfilms which are not too thin compared to the penetrationdepth λ and magnetic fields small compared to the up-per critical field Bc2, the interaction V (r) is given by theLondon potential:
V (r) = U0K0(|r|/λ), (6)
where U0 = Φ20/2πµ0λ
2 and Φ0 is the flux quantum.In the simulations we integrate Eq.(5) numerically
for all vortices in the channel. We use a Runge-Kuttamethod with variable time steps such that the maximumvortex displacement in one iteration was a0/50. Dis-tances were measured in units a0 (r = r/a0), forces inunits U0/a0 and time in units γa2
0/U0. Following Ref.[37], the London potential was approximated by:
V (r) = ln
(
rc
|r|
)
+
( |r|rc
)2
− 1
4
( |rrc
)4
− 0.75, (7)
with a cut-off radius rc corresponding to rc ≃ 3λ/a0.We performed most simulations for rc = 3.33. Peri-odic boundary conditions in the channel direction wereemployed. For each w/b0 we relaxed the system tothe ground state for f = 0. We found that this isbest achieved by starting from a uniformly stretchedor compressed n or n ± 1 configuration. For an initialconfiguration with Nch vortices distributed randomly inthe channel, relaxation resulted in (slightly) metastablestructures, even when employing a finite temperature,simulated annealing method. Some peculiarities asso-ciated with such structures are mentioned in Secs.IVand VI. After the f = 0 relaxation, the average ve-locity versus force (v-f) curve was recorded by stepwisevarying the force from large fmax → 0 (occasionallyf = 0 → fmax → 0 was used to check for hysteresis).At each force we measured v(f) = 〈xi〉i,t after the tem-poral variations in v became < 0.5% (ignoring transientsby discarding the data within the first 3a0). In addi-tion, at each force we measured several other quantities,e.g. the temporal evolution of ri and the time dependentvelocity v(t) = 〈xi〉i.
III. SINGLE CHAIN IN AN ORDERED
CHANNEL
The first relevant issue for plastic flow and commensu-rability effects in the channel is to understand the influ-ence of periodically organized vortices in the CE’s (seeFig. 3a). The characteristic differences between com-mensurate and incommensurate behavior can be well un-derstood by focusing on a 1-D model in which only a sin-gle vortex chain is present in the channel. Therefore theCE’s are assumed to be symmetric with respect to y = 0(i.e. ∆x = 0 in Fig. 3) and only the longitudinal degreesof freedom of the chain are retained. At commensurabil-ity, w = b0, the longitudinal vortex spacing a = a0. For
w 6= b0 the average spacing a = Φ0/(Bw) = a0b0/w doesnot match with the period a0 in the edges and intersti-tials or vacancies develop in the channel. Their densitycd is given by cd = |a−1
0 − a−1| = (1/a0)|1 − (w/b0)|.
A. Continuum sine-Gordon description
We first consider the interaction of a vortex in thechannel with the periodic arrays in the CE’s. As shown inApp.A, when B . 0.2Bc2 and λ & a0 the edge potentialarising from this interaction is:
Vce,0(x, y) = −2U0e−k0(w+b0)/2 cosh(k0y) cos k0x, (8)
where k0 = 2π/a0. For w = b0 and y = 0, the associ-ated sinusoidal force caused by the edge has an amplitudewhich we denote by µ:
µ = (4πU0/a0)e−π
√3 ≃ U0/(6πa0). (9)
Next we consider a static chain of vortices inside thechannel. The chain is most easily described in termsof a continuous displacement field u(x), representing thedeviations of vortices in the chain with respect to thecommensurate positions, i.e. u(ia0) = ui = xi − ia0.The edge force is then given as fp = −µ sin(k0u). To de-scribe the interaction between vortices within the chain,we assume that their relative displacements are small,∂xu ≪ 1. Then one can use linear elasticity theory. Tak-ing into account that the interaction range λ > a0, theelastic force at x = ia0 is:
fel =∑
s=ja0>ia0
∂2sV (s)[u(x+s)+u(x−s)−2u(x)]. (10)
Using the Fourier transform of V the force due to a dis-placement uq(x) =Re(uqe
iqx) with wave vector q is:
fel =
∫
dk
2π
U0πk2
√k2 + λ−2
∑
s>x
2eiks[1 − cos(qs)]u(x). (11)
Recasting this into a sum over reciprocal vectors lk0 ±q and retaining only the l = 0 term, one obtains thefollowing dispersive elastic modulus of the chain:
κq =U0πλ/a0√
1 + λ2q2. (12)
For deformations of scale > 2πλ, the elastic force is fel =κ0∂
2xu with a long wavelength stiffness κ0 = U0π(λ/a0).
The equation of motion for u for a uniformly drivenchain, is obtained by adding the driving force f to theedge force and the intra-chain interactions resulting in:γ∂tu = f + fp + fel. Assuming for the moment that thelong wavelength description is valid, the evolution of u isgiven by the following sine Gordon (s-G) equation:
γ∂tu = f − µ sin(k0u) + κ0∂2xu (13)

6
0 20 40 60 80 100-0.50
-0.25
0.00
0.25
0.50
0.75
1.00
1.25
1.50ud/a0=1/2+atan[(xc-x)/3π]/π
rc=3.33 rc=6.7 rc=30
ud/a0=(2/π)atan(e(xc-x)/a
0g1/2
)
u (a
0)
x (a0)
FIG. 4: Drawn lines: the anti-kink solution Eq.(14) forλ/a0 = 1, 2 and 9 (most extended line). Symbols: numer-ically obtained displacement field for an isolated interstitialfor the corresponding rc. Dashed line: defect shape Eq.(18)in the nonlocal limit.
A useful visual representation of Eq.(13) is an elasticstring of stiffness κ0 with transverse coordinate u(x) ina tilted washboard potential (µ/k0) cos(k0u) − fu.
The s-G equation (13) has been thoroughly studied indifferent contexts (e.g. [38, 39, 40]). In the static case(f = 0), it has the trivial solution u = 0, correspondingto a commensurate chain, or kinked, incommensurate,solutions in which u(x) periodically jumps by ±a0, eachjump representing a point defect in the channel. In thecontext of long Josephson junctions (LJJs, [38]), a kinkcorresponds to a Josephson vortex where the phase dif-ference across the junction changes by 2π. An isolated
defect is represented by the familiar ’soliton’ solution ofthe s-G model:
ud(x) = 2a0 arctan[exp(±2π(x − xc)/ld)]/π. (14)
Here xc denotes the center of the defect and the + (−)sign denotes a vacancy or interstitial (kink or antikink).The length ld represent the core size of the defect:
ld = 2πa0√
g, (15)
with g the dimensionless ratio between the chain stiffnessand maximum curvature of the pinning potential:
g = κ0/2πµa0 = 3π(λ/a0), (16)
as follows from Eq.(9),(12). For λ/a0 & 1, ld thus con-siderably exceeds the lattice spacing. The continuum ap-proach is validated since ∂xud . 2a0/ld ≪ 1. In Fig. 4 wehave illustrated the characteristic defect shape Eq.(14),along with numerical data from a later section.
The long wavelength limit is only valid when ld con-siderably exceeds λ. Since ld grows only as
√
λ/a0 thedispersion in the elastic interactions becomes importantbeyond a certain value of λ/a0. This value is estimatedby setting λqd = 2πλ/ld = 1 in Eq.(12), resulting inλ/a0 ≃ 9, in which case ld ≃ 54a0.
For larger interaction range one employs the follow-ing approach, first derived by Gurevich [28] for mixedAbrikosov-Josephson vortices in grain boundaries. Ex-pression (10) for the elastic force can be written as an
integral fel =∫
(ds/a0)∂2sV (s)u(x + s). For defects on a
scale < λ, only the short distance behavior of V has to beretained: V (x) = U0K0(x/λ) ≈ −U0 ln(|x/λ|). Integrat-ing the expression for fel by parts and adding the edgeforce and the drive, the equation of motion becomes:
γ∂tu = f − µ sin(k0u) + (U0/a0)
∫ ∞
−∞ds
∂su
s − x. (17)
A static solution of Eq.(17) for a single defect is [28]:
k0u = π + arctan(±2πx/lnld ), (18)
with lnld = 6π2a0, which is valid when λ > lnl
d . Thevalue for lnl
d is nearly the same as the s-G core size ld forλ/a0 = 9. This means that upon approaching the nonlo-cal regime, the increase of core size saturates at ∼ 60a0,while only the tails of the defect are affected according toEq.(18), see Fig. 4. A more accurate calculation of theonset of the nonlocal field regime using Brandt’s field-dependent vortex interaction (App.A) shows that non-locality is only relevant for a channel in a superconductorwith λ/ξ & 50.
So far, we discussed isolated defects. For finite defectdensity, the repulsive interaction between defects of thesame ’sign’ causes a periodic superstructure in the chain.When cd grows to ∼ 1/ld, the defects start to overlapsignificantly. For the (local) s-G model, explicit solutionsfor u have been obtained in terms of the Jacobi ellipticfunctions, for which we refer to [38, 40]. Recently, also inthe non-local limit where lnl
d > λ, the ’soliton’ chain hasbeen described analytically [28], which we will not repeathere.
B. Transport properties
With a uniform drive f , the transport propertiesstrongly depend on the presence and density of defectsin the channel. At commensurability (a = a0, cd = 0), athreshold force fs = µ is required, above which all vor-tices start moving uniformly. Their velocity is identicalto that of an overdamped particle in a sinusoidal poten-
tial: v =√
f2 − µ2 [41]. The threshold µ coincides withthe well known relation between shear strength and shearmodulus of an ideal lattice by Frenkel [36]: for a harmonic
shear interaction, a value A = A0 = a0/(2πb0) = 1/π√
3applies in Eq.(1). Identifying Fsa0b0 = fs = µ forw = b0, one finds:
c66 = π√
3µ/(2a0) = U0/(8a0b0), (19)
which coincides with the familiar expression for the shearmodulus in the London limit: c66 = Φ0B/(16πµ0λ
2).In App.A we generalize the expression for the orderedchannel potential to higher field and show that also inthat case the potential is harmonic and that A = A0
holds for a commensurate channel.At incommensurability, depinning of the chain is gov-
erned by the threshold force to move a defect. In
7
the present continuum approach such threshold is ab-sent. However, taking into account the discreteness ofthe chain, in which case Eq.(13) turns into a Frenkel-Kontorova (FK) model [35], a finite Peierls-Nabarro (PN)barrier exists to move a defect over one lattice spac-ing (see e.g. [40]). The magnitude of the PN barrierhas been studied for a variety of cases, including FK-models with anharmonic and/or long-range interactions[40, 42]. For g < 1, fPN can amount to a considerablefraction of µ. Additionally, in this regime anharmonic-ity may renormalize g [40, 42] and cause pronounceddifferences between the properties of kinks (vacancies)and antikinks (interstitials). In our limit g ≫ 1, where∂xu << 1 and harmonic elastic theory applies, thesedifferences are small and the pinning force vanishes asfPN = 32π2gµ exp (−π2√g). Hence, defects in an or-dered channel give rise to an essentially vanishing plasticdepinning current Js [43].
Considering the dynamics, for small drive f < µ themotion of defects, each carrying a flux quantum, providesthe flux transport through the channel. When defects arewell separated, for cd < l−1
d , the mobility of the chain isdrastically reduced compared to free flux flow and theaverage velocity v is proportional to the defect density:v = cdvda0. Here vd is the velocity of an isolated defectat small drive. It can be calculated from the generalrequirement that the input power must equal the averagedissipation rate:
fv = γ〈(∂tu)2〉L,t = (γ/ld)
∫ ld
(∂tu)2dx. (20)
The last step arises from the space and time periodicityof u. Using ∂tu = vd∂xu and the kinkshape Eq.(14), oneobtains the ’flux flow resistivity’ at small defect density:
dv/df = cda0(π2√g/2γ), (21)
where π2√g/2γ = Md is the kink mobility in the s-Gmodel [39]. For larger defect density, where defects startto overlap this relation changes. The linear response forf . µ may then be obtained from the solutions for ubased on elliptic integrals [28, 38, 40].
For larger drive f & µ, the ’tilt’ induced reduction ofthe (washboard) edge potential becomes important. Thisleads to an expansion of the cores of the sliding defectsand causes a nonlinear upturn in the v-f curves. Exactsolutions of Eq.13 describing this behavior do not exist.Therefore we use a perturbative method similar to thatin [22, 44] which is able to describe the full v-f curveover a wide range of defect densities. It is convenient todefine the displacements h(x, t) = u(x, t)− s(x, t), wheres(x, t) = (q/k0)x+vt, with (q/k0) = cda0, is the continu-ous field describing the displacements of an undeformedincommensurate chain (i.e. straight misoriented stringin the washboard potential) moving with velocity v. Interms of h, the equation of motion (13) and Eq.(20) canbe written as:
γv(1 + ∂sh) = f + µ sin(k0h + qx + k0vt) + κ(q/k0)2∂2
sh(22)
f = γv + (γv/a0)
∫ a0
(∂sh)2ds. (23)
The last term in Eq.(23) describes additional dissipationdue to internal degrees of freedom in the chain. Underinfluence of the potential, h acquires modulations withperiod 1/cd in x, i.e. period a0 in s. These modulationsare then expressed as a Fourier series of modes with wave-length 1/(mcd) (m integer ≥ 1) and amplitude hm:
h(x, t) =∑
m
hm exp[imk0s] + c.c. (24)
The overlap of defects and the core expansion for f ≥ µappears in the q and v dependence of h. Both effectscause a reduction of the relative displacements h. Anapproximate solution for h(v) is obtained by substitutingEq.(24) into Eq.(13), yielding the coefficients hm (detailsof the solution are deferred to App.B). The v-f relationEq.(23) attains the form:
f = γv
[
1 +ω2
p
2[ω20 + ω2
r ]
]
. (25)
The additional ’friction’ force is represented in terms ofthe pinning frequency ωp = µk0/γ, the washboard fre-quency ω0 = k0v and ωr = K2
eff (cd)/γ which is the effec-tive relaxation frequency for nonlinear deformations as-sociated with a defect density cd = q/(2π), with K2
eff (cd)given in App.B. At small v, the elastic relaxation time1/ωr for the chain to relax is much smaller than thetimescale 1/ω0 between passage of maxima in the edgepotential. This corresponds to the linear sliding responseof the static structure of (overlapping) defects. For largev, 1/ωr ≫ 1/ω0 meaning that the incommensurate chainis not given enough time to deform. This leads to ex-panded defects described by a sinusoidal variation of hwith reduced amplitude (see App.B). The v-f curve thenapproaches free flux flow according to f − γv ∼ v−1 asfor a single particle.
Recently, exact solutions describing the nonlineardynamics and core expansion of mixed Abrikosov-Josephson vortices based on the nonlocal Eq.(17) havebeen derived in [28]. The resulting transport curves arevery similar to those obtained from Eq.(25), see Fig. 5.We also note the similarity with the IV curves obtainedfrom a model for kinked Josepson strings [45] in highTc superconductors with the field under an angle withrespect to the insulating layers.
C. Numerical results
The simulations of symmetric channels (∆x = 0) forw ∼ b0 fully support the above findings. The interactionwith the CE’s for w = b0 provides a maximum restoringforce with a value 0.054, independent of the interactioncut-off rc used in the numerics. This value is in agreement
8
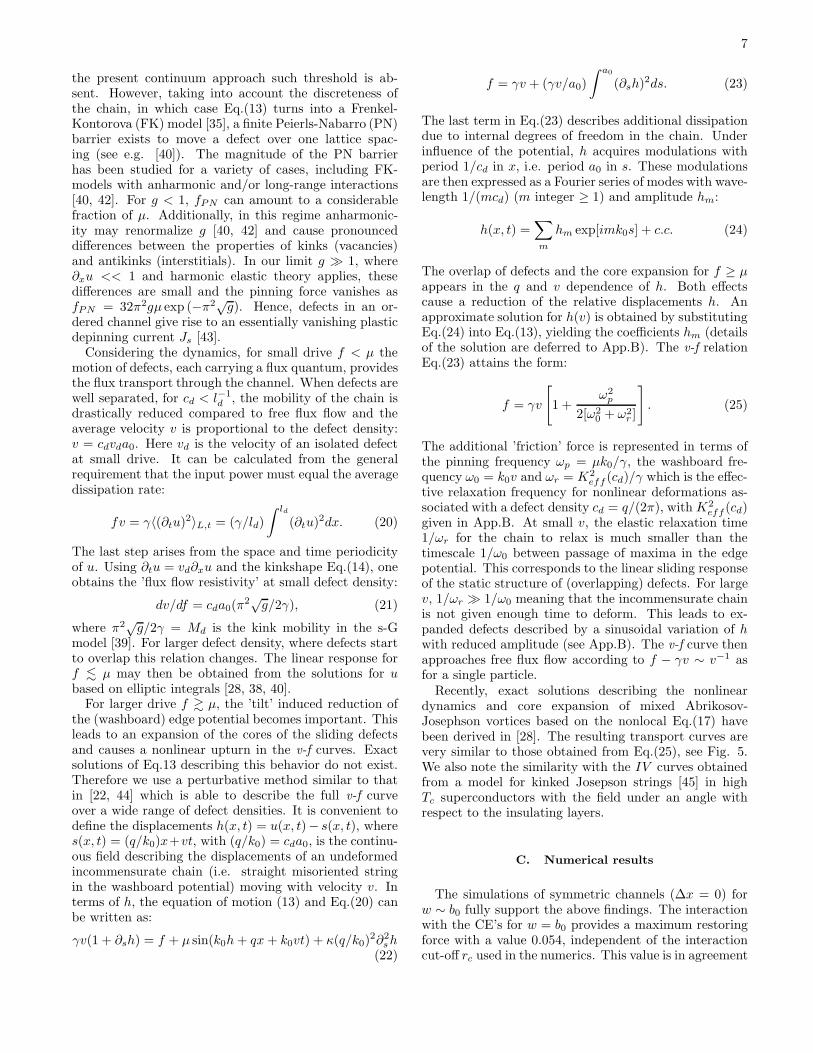
0.00 0.05 0.10 0.150.00
0.05
0.10
0.15 w/b
0
0.82 0.97 0.99 1 1.02 1.05
f
v
0.0
0.5
1.00.0 0.5 1.0
v (1
0-3)
f ( 10-3)
FIG. 5: v-f characteristics for ordered vortex channels withw ≈ b0 and ∆x = 0. Symbols are simulation results, drawnlines are obtained with Eq.(25). The inset shows an expandedview of the small velocity regime.
with the dimensionless values for µ and c66 in Eq.(9) and
(19): a0µ/U0 = 1/(6π) and c66a20/U0 = 1/(4
√3)).
The data points in Fig. 4 show the displacement fieldof a single defect (obtained by adding one vortex to acommensurate chain) for three values of the cut-off rc
(i.e. various λ/a0). We conclude that up to rc = 30(λ/a0 = 9) the s-G kink shape Eq.(14) forms a gooddescription of a defect in the chain.
The data points in Fig. 5 show numerical resultsfor the transport of a single chain in channels of vari-ous widths and rc = 3.33. The features discussed pre-viously, i.e. the vanishing PN barrier and nonlineartransport, clearly appear in the data for incommensu-rate chains. We also plotted the results according toEq.(25), with K2
eff (cd) evaluated using the results in
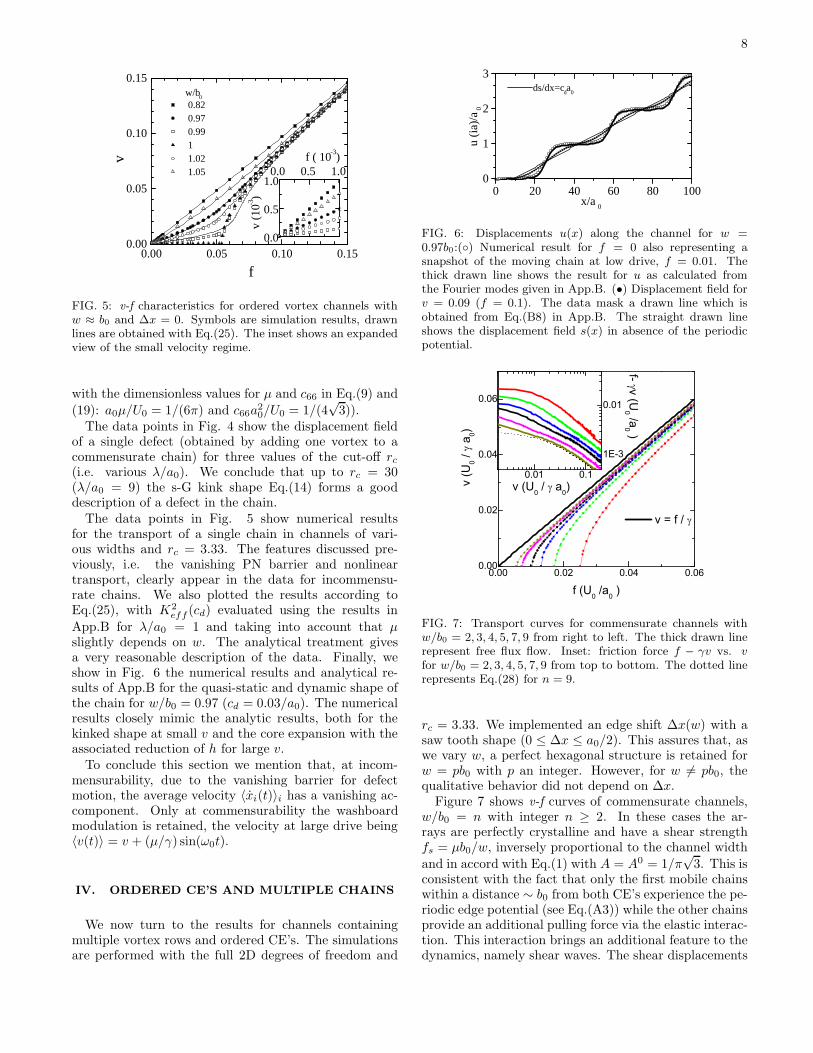
App.B for λ/a0 = 1 and taking into account that µslightly depends on w. The analytical treatment givesa very reasonable description of the data. Finally, weshow in Fig. 6 the numerical results and analytical re-sults of App.B for the quasi-static and dynamic shape ofthe chain for w/b0 = 0.97 (cd = 0.03/a0). The numericalresults closely mimic the analytic results, both for thekinked shape at small v and the core expansion with theassociated reduction of h for large v.
To conclude this section we mention that, at incom-mensurability, due to the vanishing barrier for defectmotion, the average velocity 〈xi(t)〉i has a vanishing ac-component. Only at commensurability the washboardmodulation is retained, the velocity at large drive being〈v(t)〉 = v + (µ/γ) sin(ω0t).
IV. ORDERED CE’S AND MULTIPLE CHAINS
We now turn to the results for channels containingmultiple vortex rows and ordered CE’s. The simulationsare performed with the full 2D degrees of freedom and
0 20 40 60 80 1000
1
2
3ds/dx=c
da
0
x/a 0
u (i
a)/a
0
FIG. 6: Displacements u(x) along the channel for w =0.97b0:() Numerical result for f = 0 also representing asnapshot of the moving chain at low drive, f = 0.01. Thethick drawn line shows the result for u as calculated fromthe Fourier modes given in App.B. (•) Displacement field forv = 0.09 (f = 0.1). The data mask a drawn line which isobtained from Eq.(B8) in App.B. The straight drawn lineshows the displacement field s(x) in absence of the periodicpotential.
0.00 0.02 0.04 0.060.00
0.02
0.04
0.06
0.01 0.1
1E-3
0.01
v = f /
v (U
0 /
a0)
f (U0 /a0 )
f- v (U
0 /a0 )
v (U0 / a0)
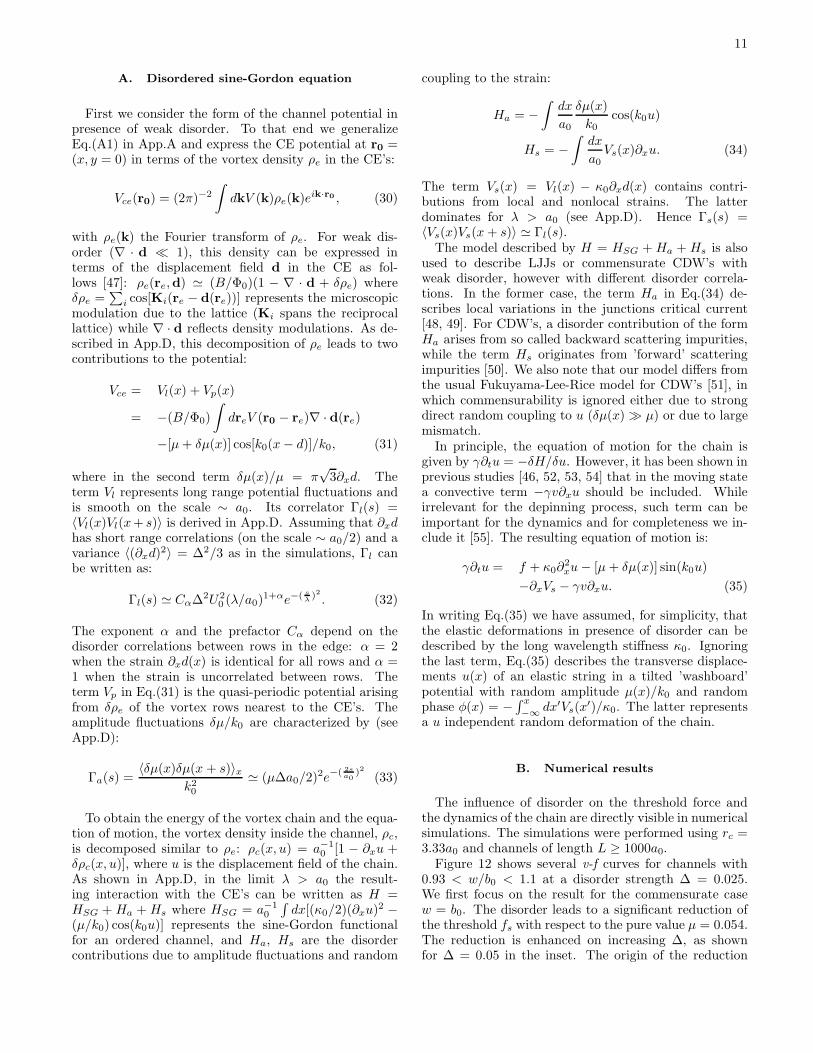
FIG. 7: Transport curves for commensurate channels withw/b0 = 2, 3, 4, 5, 7, 9 from right to left. The thick drawn linerepresent free flux flow. Inset: friction force f − γv vs. vfor w/b0 = 2, 3, 4, 5, 7, 9 from top to bottom. The dotted linerepresents Eq.(28) for n = 9.
rc = 3.33. We implemented an edge shift ∆x(w) with asaw tooth shape (0 ≤ ∆x ≤ a0/2). This assures that, aswe vary w, a perfect hexagonal structure is retained forw = pb0 with p an integer. However, for w 6= pb0, thequalitative behavior did not depend on ∆x.
Figure 7 shows v-f curves of commensurate channels,w/b0 = n with integer n ≥ 2. In these cases the ar-rays are perfectly crystalline and have a shear strengthfs = µb0/w, inversely proportional to the channel width
and in accord with Eq.(1) with A = A0 = 1/π√
3. This isconsistent with the fact that only the first mobile chainswithin a distance ∼ b0 from both CE’s experience the pe-riodic edge potential (see Eq.(A3)) while the other chainsprovide an additional pulling force via the elastic interac-tion. This interaction brings an additional feature to thedynamics, namely shear waves. The shear displacements

9
of rows n in the bulk of the channel can be described incontinuum form, un(t) → u(y, t), by the following equa-tion of motion:
γ∂tu(y, t) = f + c66a0b0∂2yu(y, t). (26)
At large v the CE interaction can be represented by os-cillating boundary conditions. As shown in App.C, thiscauses an oscillatory velocity component dh/dt with y-dependent amplitude and phase describing periodic lag-ging or advancing of chains with respect to each other:
∂th(y, t) ∼ −f(y) sin(ω0t) − g(y) cos(ω0t). (27)
Here ω0 is the washboard frequency k0v, f(y) =cos(y/l⊥,v) cosh(y/l⊥,v), g(y) = sin(y/l⊥,v) sinh(y/l⊥,v).
The length scale l⊥,v =√
(µ/γv)b0 explicitly dependson v and represents the distance over which the ampli-tude and phase difference decay away from the CE’s. Al-though in principle Eq.(27) is only valid for γv/µ & 0.25,it provides useful qualitative insight in the dynamics atall velocities: at small velocity l⊥,v is large, meaning thatfor all rows the velocity modulation and phase becomesimilar. Hence, for v → 0 the array may be described asa single vortex chain, which is the underlying origin ofthe fact that close to threshold the curves approach the1D commensurate behavior v =
√
f2 − f2s with reduced
threshold fs = µ/n. At large velocity, l⊥,v eventuallybecomes less than the row spacing. In that limit onlythe two chains closest to the CE experience a significantmodulation. In App.C we quantitatively analyze the fric-tion force in this regime with the result:
f − γv =µ2
2n(2γv + µ). (28)
In the inset of Fig. 7 this behavior is displayed for n = 9by the dotted line. In the high velocity regime the resultagrees well with the numerical data, at lower velocitiesEq.(28) underestimates the true friction.
Next we discuss the behavior of incommensurate chan-nels. The static vortex configuration for a channel ofwidth w/b0 = 3.92 is shown in the upper part of Fig. 8.A Delauney triangulation shows that the array consistsof 4 rows with two pairs of 5,7-fold coordinated vorticesat the CE constituting two misfit dislocations of opposite
Burgers vector ~b and glide planes along x. Due to theirmutual attraction, dislocations at the upper and lowerCE are situated along a line with an angle of ∼ 60 with~x. The two edge dislocations thus form a ’transverse’stacking fault (TSF). In the lower part of Fig. 8 thestructure for a channel with w/b0 = 3.52 is shown. Herethe density of stacks, given by cTSF = |(1/a0) − (1/a)|,is enhanced. The dislocations at one side of the CE re-pel each other and are equally spaced, like the periodicsuperstructure for a single chain in Fig. 6. The slightmisalignement between the ’upper’ and ’lower’ disloca-tions of a pair is due to the relative shift between theCE’s: the exact orientation of the pairs is determined
FIG. 8: Delauney triangulation of the static structure fortwo incommensurate channels: w/b0 = 3.92 and w/b0 = 3.52.Open circles and filled squares denote 7 and 5-fold coordinatedpoints, respectively. The construction for the Burgers vectoris shown for w/b0 = 3.92; the drawn lines for w/b0 = 3.52mark the transverse stacking faults.
0.00 0.01 0.02 0.03 0.040.00
0.01
0.02
0.03
0.04
v (1
0-3)
v
w/b0
3.96 3.92 3.84 3.60 3.48 3.33 3.06 3.03
f
5
100 5
f (10-3)
FIG. 9: v-f curves for incommensurate channels. Inset:regime of small drive.
by the choice of ∆x. For channel widths in the regimen < w/b0 . n + 1/2 with integer n, we find very simi-lar structures but instead of TSF’s consisting of vacan-cies, we now have TSF’s consisting of interstitial vortices,again arranged in a periodic superstructure.
Figure 9 shows the transport curves associated withthese structures. As for the single chain, the presenceof misfit defects causes an essentially vanishing thresholdforce. For small drive, f < µb0/w, a low mobility regimeoccurs associated with glide of the edge dislocation pairsalong the CE. This allows for elastic motion of a completeTSF, i.e. the vortices in the ’bulk’ of the channel remain6-fold coordinated.
It is interesting to study how the mobility due tothe TSF’s changes on increasing the number of rows.In Fig. 10 we plot the mobility per stack, MTSF =(dv/df)f→0/cTSF versus channel width. MTSF aroundeach peak decreases with increasing cTSF . This is causedby overlap of the strain fields of the defects, in analogywith the behavior for a single chain. The overall increaseof the peak value of MTSF is related to a change in the

10
0 1 2 3 4 50
10
20
30
40
MTS
F
w/b0
FIG. 10: The mobility per stack MTSF = (dv/df)/cstack ver-sus w/b0. The drawn line shows the predicted form Eq.(29)for λ/a0 = 1.
size of an isolated TSF. An extension of the analysisin Sec.III allows to describe this change quantitatively.For small n the longitudinal deformations do not varystrongly over the channel width. This can be understoodby considering shear and compression deformations re-lated by the equation κ∂2
xux + c66a0b0∂2yux = 0. It fol-
lows that a longitudinal deformation on a scale l‖ along
the channel varies over a scale l⊥ = l‖√
c66a0b0/κ per-pendicular to the channel. In case l⊥ & w, the transversevariation of ux(y) is small and can be neglected so thatκ0 in Eq.(13) can be replaced by an effective stiffness nκ0
due to n rows. Similarly, the driving force is replaced byf → nf . This results in the same equation (13) with arescaled edge force µ → µ/n. Accordingly, the longitu-dinal size of a defect (TSF) is given by lTSF = 2πa0
√ng
and the mobility of an isolated TSF by (compare Md
below Eq.(21)):
MTSF ≃ π2√ng/2γ. (29)
As shown by the drawn line in Fig. 10, this form gives areasonable description of the data up to n = 3. Workingout the condition l⊥ & w given above for the validity
of Eq.(29), one obtains w . (ld/2)√
c66a0b0/κ ≃ 3b0, inagreement with the data. At larger n, ’bulk-mediated’elasticity [46] leads to decay of the longitudinal deforma-tions towards the channel center. We also note that, dueto the increase of lTSF with n, the density cTSF for whichdefects are non-overlapping, decreases on increasing n.
In the v-f curves of Fig. 9 we observe at larger velocityfeatures very similar to the transport of the 1D chain:for f & µ/n the effective barrier is reduced, leading tocore expansion of the TSF’s. Accordingly, the curvesapproach free flux flow behavior. As in the commensuratecase, this approach is initially more slowly then f −γv ∼1/v due to additional oscillating shear deformations inthe channel for f & µ/n.
Figure 11 summarizes the behavior of the shear forcefs, taken at a velocity criterion v ≈ 0.01µ/γ, versus thematching parameter. At integer w/b0 = n, the thresholdis fs = µ/n, but we note that it can be reduced due to afinite edge shift ∆x. At mismatch fs is essentially vanish-ing. Near ’half filling’, w/b0 ≃ n± 1/2, where the arrays
1 2 3 4 5 60.0
0.5
1.0
f s / µ
w/b0
FIG. 11: Threshold force versus w/b0 for ordered channels.The dashed line represents Frenkels prediction for an ideallattice in the continuum limit.
switch from n to n±1 chains, a small enhancement of fs isobserved. In this regime, the static (f = 0) structure wasobtained by annealing from a random initial configura-tion, attempting to determine the exact switching point.This results in metastable structures with coexisting nand n ± 1 row regions (or longitudinal stacking faults,LSF’s) bordered by dislocations with misoriented Burg-ers vector, see [35]. The increase in fs is caused by thefinite barrier for climb-like motion of these dislocations,via which an LSF can move as ’giant’ defect through thechannel. For sufficiently large drive, (part of) the LSF’sare annealed which may result in hysteresis for up/downcycled v-f curves. We will discuss these ’mixed’ n/n ± 1structures in more detail in Secs.VI and VII in the con-text of disordered CE’s. We also note that the integerchain structures with TSF’s away from half filling differfrom the results in [35]. The structures there, obtainedfrom a random initial configuration, contained point de-fects unequally distributed among rows, yielding ’gliding’dislocations within the channel. Such structures are alsoslightly metastable but the conclusion of vanishing fs forincommensurate, integer chain structures, drawn in [35],remains unaltered.
V. SINGLE CHAIN IN A DISORDERED
CHANNEL
We will now consider the influence of disorder in theCE arrays on transport in the channels, focussing inthis section on the characteristics of a single chain forw/b0 ∼ 1 with only longitudinal degrees of freedom. TheCE disorder is implemented with longitudinal randomshifts as described in Sec.II. We note that both CE’sremain ’in phase’; the effect of quenched phase slips ordislocations between the CE’s will be treated in the dis-cussion in Sec.VIII.
11
A. Disordered sine-Gordon equation
First we consider the form of the channel potential inpresence of weak disorder. To that end we generalizeEq.(A1) in App.A and express the CE potential at r0 =(x, y = 0) in terms of the vortex density ρe in the CE’s:
Vce(r0) = (2π)−2
∫
dkV (k)ρe(k)eik·r0 , (30)
with ρe(k) the Fourier transform of ρe. For weak dis-order (∇ · d ≪ 1), this density can be expressed interms of the displacement field d in the CE as fol-lows [47]: ρe(re,d) ≃ (B/Φ0)(1 − ∇ · d + δρe) whereδρe =
∑
i cos[Ki(re − d(re))] represents the microscopicmodulation due to the lattice (Ki spans the reciprocallattice) while ∇ · d reflects density modulations. As de-scribed in App.D, this decomposition of ρe leads to twocontributions to the potential:
Vce = Vl(x) + Vp(x)
= −(B/Φ0)
∫
dreV (r0 − re)∇ · d(re)
−[µ + δµ(x)] cos[k0(x − d)]/k0, (31)
where in the second term δµ(x)/µ = π√
3∂xd. Theterm Vl represents long range potential fluctuations andis smooth on the scale ∼ a0. Its correlator Γl(s) =〈Vl(x)Vl(x+ s)〉 is derived in App.D. Assuming that ∂xdhas short range correlations (on the scale ∼ a0/2) and avariance 〈(∂xd)2〉 = ∆2/3 as in the simulations, Γl canbe written as:
Γl(s) ≃ Cα∆2U20 (λ/a0)
1+αe−( sλ )2 . (32)
The exponent α and the prefactor Cα depend on thedisorder correlations between rows in the edge: α = 2when the strain ∂xd(x) is identical for all rows and α =1 when the strain is uncorrelated between rows. Theterm Vp in Eq.(31) is the quasi-periodic potential arisingfrom δρe of the vortex rows nearest to the CE’s. Theamplitude fluctuations δµ/k0 are characterized by (seeApp.D):
Γa(s) =〈δµ(x)δµ(x + s)〉x
k20
≃ (µ∆a0/2)2e−( 2sa0
)2 (33)
To obtain the energy of the vortex chain and the equa-tion of motion, the vortex density inside the channel, ρc,is decomposed similar to ρe: ρc(x, u) = a−1
0 [1 − ∂xu +δρc(x, u)], where u is the displacement field of the chain.As shown in App.D, in the limit λ > a0 the result-ing interaction with the CE’s can be written as H =HSG + Ha + Hs where HSG = a−1
0
∫
dx[(κ0/2)(∂xu)2 −(µ/k0) cos(k0u)] represents the sine-Gordon functionalfor an ordered channel, and Ha, Hs are the disordercontributions due to amplitude fluctuations and random
coupling to the strain:
Ha = −∫
dx
a0
δµ(x)
k0cos(k0u)
Hs = −∫
dx
a0Vs(x)∂xu. (34)
The term Vs(x) = Vl(x) − κ0∂xd(x) contains contri-butions from local and nonlocal strains. The latterdominates for λ > a0 (see App.D). Hence Γs(s) =〈Vs(x)Vs(x + s)〉 ≃ Γl(s).
The model described by H = HSG + Ha + Hs is alsoused to describe LJJs or commensurate CDW’s withweak disorder, however with different disorder correla-tions. In the former case, the term Ha in Eq.(34) de-scribes local variations in the junctions critical current[48, 49]. For CDW’s, a disorder contribution of the formHa arises from so called backward scattering impurities,while the term Hs originates from ’forward’ scatteringimpurities [50]. We also note that our model differs fromthe usual Fukuyama-Lee-Rice model for CDW’s [51], inwhich commensurability is ignored either due to strongdirect random coupling to u (δµ(x) ≫ µ) or due to largemismatch.
In principle, the equation of motion for the chain isgiven by γ∂tu = −δH/δu. However, it has been shown inprevious studies [46, 52, 53, 54] that in the moving statea convective term −γv∂xu should be included. Whileirrelevant for the depinning process, such term can beimportant for the dynamics and for completeness we in-clude it [55]. The resulting equation of motion is:
γ∂tu = f + κ0∂2xu − [µ + δµ(x)] sin(k0u)
−∂xVs − γv∂xu. (35)
In writing Eq.(35) we have assumed, for simplicity, thatthe elastic deformations in presence of disorder can bedescribed by the long wavelength stiffness κ0. Ignoringthe last term, Eq.(35) describes the transverse displace-ments u(x) of an elastic string in a tilted ’washboard’potential with random amplitude µ(x)/k0 and randomphase φ(x) = −
∫ x
−∞ dx′Vs(x′)/κ0. The latter represents
a u independent random deformation of the chain.
B. Numerical results
The influence of disorder on the threshold force andthe dynamics of the chain are directly visible in numericalsimulations. The simulations were performed using rc =3.33a0 and channels of length L ≥ 1000a0.
Figure 12 shows several v-f curves for channels with0.93 < w/b0 < 1.1 at a disorder strength ∆ = 0.025.We first focus on the result for the commensurate casew = b0. The disorder leads to a significant reduction ofthe threshold fs with respect to the pure value µ = 0.054.The reduction is enhanced on increasing ∆, as shownfor ∆ = 0.05 in the inset. The origin of the reduction

12
0.00 0.05 0.100.00
0.05
0.10
w/b0 1.10 1.02 1.00 0.97 0.95 0.93v
f
123
0.04 0.05 f
=0.05
10-2 v
FIG. 12: v-f curves of a commensurate and various incom-mensurate chains for weak disorder ∆ = 0.025. Inset: v-f
curve of a commensurate channel for ∆ = 0.05
is that disorder lowers the energy barrier for formationof vacancy/interstitial (kink/antikink) pairs in the chain.Figure 13a shows the time evolution of the displacementsui = xi − ia0 upon a sudden increase of f to a valuef = 0.049 > fs at t1. For t < t1 u is ’flat’ and the 2Dcrystal formed by the chain and the CE’s is topologicallyordered. At t = t1, the motion starts at an unstable site(at x/a0 ≃ 500) by nucleation of a vacancy/interstitialpair visible as steps of ±a0 in u. We henceforth denotethe force at which this local nucleation occurs by fn. Thedefects are driven apart by the applied force and whentheir spacing becomes ∼ ld a new pair nucleates at thesame site. This process occurs periodically with rate Rn,leading to the formation of a domain with defect densitycd = Rn/〈vd〉 and a net velocity v = cd〈vd〉a0 = Rna0
with 〈vd〉 the average defect velocity. In the present caseof weak disorder 〈vd〉 is essentially the same as for ∆ = 0.For a further increase of the force to f = 0.053 an in-crease of the nucleation rate is observed. In Ref.[33] weshowed that in larger systems coarsening occurs in theinitial stage of depinning due to a distribution of un-stable sites. However, after sufficiently long times thestationary state consists of one domain around the sitewith the largest nucleation rate (smallest local thresholdfmin
n ) with vacancies travelling to the left and intersti-tials to the right. It is interesting to compare this to astudy of CDW’s with competing disorder and commen-surability pinning [52]. Using a coarse grained version ofEq.(35) it was found in [52] that in the pinning domi-nated, low velocity regime, the so-called interface widthW (L) =
√
〈(u(x) − 〈u〉)2〉x grows linearly with the sys-tem size L. The mechanism of defect nucleation whichwe observe naturally explains this phenomenon. In ad-dition, we found that at depinning the average velocityv = Rmax
n a0 can be described by Rmaxn ∝ (f − fmin
n )β
with a depinning exponent β = 0.46 ± 0.04, similar aspreviously reported for 1D periodic media [56].
The defective flow profile does not persist up to a arbi-trary large forces. In the commensurate v-f curve in Fig.12 and its inset, a small kink is observed for f . µ. Asso-
FIG. 13: (a) Evolution of longitudinal displacements ui(t) forthe commensurate chain in Fig. 12(∆ = 0.025), plotted forclarity in a transverse way vs. x. At t = t1 the force isincreased above threshold. (b) Stationary evolution of ui(t)for large drive (f = 0.08) showing the motion over a distance∼ 1.8a0 (the t and u axis have arbitrary offset, and a fewframes around t = 10 were omitted for clarity).
ciated with this kink we find a transition to a much moreordered state. We have illustrated the temporal evolu-tion of vortex displacements in this state in Fig. 13(b)for f = 0.08. The ’staircase’ structure has vanished andthe relative vortex displacements are greatly reduced. Infact, in the above mentioned study Ref. [52] a very simi-lar transition in the CDW dynamics was found, and wasshown to be of first order. We leave the precise depen-dence of this transition on disorder and vortex interac-tions in our channels for future studies.
We now turn to the incommensurate case. The v-f
curves with w 6= b0 in Fig. 12 all exhibit a finite thresh-old instead of the vanishing threshold for the incommen-surate channels without disorder (Fig. 5). With disorderthe defects that are present in the channel, couple to thedisorder in the CE, which causes a pinning barrier fd.This barrier has a distribution along the channel fd andmaximum value fmax
d . We now focus on the curves withsmall defect density cd . 1/ld for which the defects areindividually pinned. In this regime the threshold forcefs satisfies fs . fmax
d .
The precise threshold behavior depends on the distri-bution of barriers fd, similar as for LJJ and CDW sys-tems [48]. As an illustration, we show in Fig. 14(a) theevolution of displacements for a channel with w/b0 = 0.99for a force just above threshold f(t > 0) > fs. The staticconfiguration at t = 0 (f < fs) shows that the disorderbreaks the periodicity of the ’soliton’ chain. For t > 0, de-

13
FIG. 14: (a) Evolution of displacements for w/b0 = 0.99 andf = 0.013 > fs for t > 0. Defects at x ≈ 50a0, x ≈ 150a0 andx ≈ 325a0 are initially pinned while the others are mobile.A defect collision-release process occurs at x ≈ 150a0 andt ≈ 1500. (b)Evolution of displacements when f is suddenlyincreased to f = 0.048. Nucleation is observed for x ≈ 500a0.
pinning starts with the defect at x ≃ 270a0 and proceedsvia a ’collision-release’ process between the moving de-fect and its pinned neighbor. Thus, for f & fs strong lo-cal variations in the defect mobility exist and the overallchain velocity depends strongly on the distribution fd(of which we show an example below). However, as seenin the v-f curves in Fig. 12, for f & 2fmax
d these effectsvanish and the mobility approaches dv/df ≃ cda0Md withMd the defect mobility without disorder. Another featurein the v-f curves for small defect densities is the velocityupturn at a force f ≃ fmin
n < µ. It is caused by nucle-ation of new defect pairs in the incommensurate chain.The start of such a process is illustrated in Fig. 14(b):at x ≃ 500a0 the chain is unstable against pair nucleationand the nucleated interstitials/vacancies are formed ’ontop of’ the moving incommensurate structure. This pro-cess only occurs at small defect densities when the timebetween passage of existing defects ≃ 1/(vdcd) exceedsthe nucleation time R−1
n . For f & µ, the structure ofboth defects disappears again. The resulting dynamicstate resembles that of the large velocity profile shown inFig. 6, but with additional ’roughness’ due to the weakCE disorder.
The v-f curves in Fig. 12 at w/b0 = 0.93 and w/b0 =1.1, for which the defect density in the chain is larger,exhibit a smaller threshold force. In this regime the in-
0.85 0.90 0.95 1.00 1.05 1.100.0
0.4
0.8
1.2
0.2 0.4 0.6 0.8 1.0 1.2
0.20.40.60.81.01.2
f /
v /
=0.025 =0.05 =0.075 =0.15 =0.2
f s /
w/b0
=0.2
w/b0 0.96 1.00 1.05
FIG. 15: Threshold fs, obtained from a velocity criterion v ≈0.025µ/γ and L = 1000a0, versus w/b0 for several disorderstrengths. Data were averaged over 5 disorder realizations.Inset: v-f curves in the strong disorder regime ∆ = 0.2.
teraction between defects starts to become important andfs is determined by collective pinning of the defects. Thissituation was studied analytically for the case of Joseph-son vortices in a disordered LJJ in [49]. We will notconsider this situation explicitly but we note here that,as the disorder and the typical pinning force on the de-fects increases, the onset of the collective pinning regimeshifts to larger defect density, where defect interactionsare stronger [49].
In Fig. 15 we show the dependence of fs on channelwidth, both for the weak disorder regime treated aboveand for larger disorder. The data at ∆ = 0.025 exhibit asharp peak at w = b0, reflecting the gap between mini-mum nucleation threshold and maximum defect pinningforce. Larger disorder however rapidly smears the peak,being eventually completely suppressed for ∆ & 0.15.The origin of this behavior is a spontaneous nucleationof defects in the static chain at larger disorder. This isconveniently illustrated via the changes in the distribu-tion of the individual defect pinning force fd and thatof the nucleation threshold fn for increasing disorderstrength, shown in Fig. 16. The data were obtained bysimulating hundreds of short channels (L = 100a0) bothwith one vacancy, yielding fd, and without ’geometric’defects, yielding fn. While for ∆ = 0.025 the distri-butions are separated (formally, in infinite systems, suchseparation only exist for bounded disorder, see the nextsection), for larger disorder they start to overlap and theybecome nearly identical for ∆ = 0.075. This implies thatnucleated defect pairs at w = b0 can remain pinned, whileat incommensurability defects may be nucleated beforethe ’geometrical’ defects are released. In other words,regardless of the matching condition the static configu-ration contains both kinks and antikinks.
While for bounded disorder static defects first appearat a disorder strength defined as ∆c, the complete col-lapse of the peak in fs is associated with the presence ofa finite density of disorder induced defects, of the orderof the inverse kinkwidth ∼ l−1
d . We define the disorder

14
0
10
20 (a) = 0.025
P (f/
) fd fn
0
5
(b) = 0.05
P (f/
)
0.2 0.4 0.6 0.8 1.001234 (c) = 0.075
P (f/
)
f /
FIG. 16: Probability density of critical forces in channels oflength L = 100a0 ≈ 5ld and w = b0 for a commensurate chain(•) and for a chain with one vacancy () for ∆ = 0.025 (a),∆ = 0.05 (b) and ∆ = 0.075 (c).
8101214161820222426
0 200 400 600 800 1000-202
u i-dx i /
a0
u i / a
0
x/a0
FIG. 17: Lower panel: relative displacements ui −dxi for ∆ =
0.15 and f < fs ≃ 0.0165 at commensurability w = b0. Upperpanel: evolution of displacements at depinning, f = 0.017.The time increment between consecutive snapshots is ∆t = 10and for clarity each snapshot has been shifted up by a0.
strength at which this occurs as ∆∗, here ∆∗ ≃ 0.15.An example of the displacement fields for this disorderstrength is shown in Fig. 17 for w = b0. The lowerpanel shows the displacements for f . fs, relative to thedisplacements in the CE. Clearly, the static configura-tion has numerous defects. In general, the approach tothe critical pinned state occurs by avalanches in whichlocal nucleation and repinning, i.e. nonpersisting nucle-ation events, drive the rearrangements. The upper paneldisplays the evolution of displacements above threshold,revealing a growth of ’mountains’ due to persistent nu-cleation, superimposed on a disordered background.
The effect of large disorder on the shape of the v-f
curves is shown in the inset to Fig. 15. All curves nowexhibit essentially linear behavior [57], except in a small
regime just above fs. We note that also in this disorderedregime a gradual transition to a smoother displacementfield occurs at larger forces, similar to the dynamic tran-sition found for CDW’s. Going back to Fig. 15 we shouldalso mention the overall asymmetry of fs with respect tow/b0 = 1 and the slight decrease of fs on increasing w/b0
at large disorder. These effects are unrelated to the com-petition between commensurability pinning and disorderdiscussed so far, but simply reflect the overal decrease ofthe edge potential for larger width.
C. Analysis of pinning forces and crossover to
strong disorder
Using the results of Sec.VA, we now analyze in moredetail the dependence of the pinning force on disorderand the vortex interaction range. We focus on the average
pinning strength of isolated defects, which we derive herein a semi-quantitative fashion (the formal calculation isdeferred to App.D). Our analysis applies to the caseof weak disorder, i.e. we assume that the defect shapeis unaffected by disorder [49]). Extrapolation to largerdisorder provides a useful estimate for the crossover value∆∗ at which the commensurability peak vanishes. Weconclude the section with a summary of previous results[33] for the threshold forces fmin
n and fmaxd in the special
case of bounded disorder.The disorder correction Eq.(34) to the energy of the
vortex chain consists of a term Ha, due to amplitudefluctuations in the periodic potential, and a term Hs, dueto random coupling to the strain. We first evaluate thetypical pinning energy of a defect
√
〈E2a〉 due to the am-
plitude fluctuations. The local fluctuations are assumedto be uncorrelated on a length scale a0, and have a vari-ance 〈(δµ/k0)
2〉. Hence, for a defect in the chain, whichextends over a range ld, the resulting random potentialhas a variance 〈E2
a〉 ≃ 〈(δµ/k0)2〉(ld/a0) ≃ µ2∆2lda0/4.
The typical pinning force on a defect is then given by√
〈E2a〉/ld which reduces to:
√
〈f2a 〉 ≃ 0.2µ∆g−1/4 (36)
The typical pinning energy√
〈E2s 〉 of a defect due
to the term Hs in Eq.(34) is estimated in a similarway. The mean square energy due to coupling of asingle fluctuation in Vs to the strain of a defect is∼ Γs(0)(rd/a0)
2(2a0/ld)2 where rd is the range of Γs,
given below Eq.(34), and a0/ld represents the strain. Onthe scale of a defect, there are ld/rd such fluctuations.Thus the associated random potential for a defect hasa variance 〈E2
s 〉 ∼ Γs(0)(rd/a0)2(a0/ld)
2(ld/rd). TakingΓs(0) ≃ Γl(0) and using Eq.(32), in which case rd = λ,yields 〈E2
s 〉 ≃ 2Cα(U0∆λ)2(λ/a0)α/(lda0) (the factor 2
comes from the refined calculation in App.D) The typ-
ical pinning force√
〈E2s 〉/ld due to random coupling to
the strain is then given by:√
〈f2s 〉 ≃
√
3Cαµ∆(g/3π)2+α
2 g−3/4 (37)

15
The ratio between the two characteristic defect ener-gies is
√
〈E2s 〉/√
〈E2a〉 ≃ 8
√Cα(λ/a0)
α+12 , which shows
that, particularly for increasing λ/a0, the dominant pin-ning is due to random coupling to the strain. Hence-forth we use only this contribution. We next estimatethe disorder strength where the commensurability peakvanishes. As mentioned before, this collapse occurs whenthe density of disorder induced defects becomes ∼ l−1
d ,in other words, when the typical energy gain of a de-fect due to disorder becomes of the same magnitude asits bare elastic energy
∫
(dx/a0)(κ0/2)(∂xu)2 ≃ µa0√
g.
This leads to ∆∗ ∝ C−1/2α g−(2α+1)/4. For the particu-
lar case of random strains that are identical for all rows(α = 2), ∆∗ is given by:
∆∗ ≃ 3g−5/4 (38)
This can be compared to the numerical data in Fig. 15.Even though those results were obtained for λ/a0 = 1(g = 3π), formally outside the regime of validity of ouranalysis, the predicted value ∆∗ ≃ 0.18 is in reasonableagreement with the data.
In the particular case of bounded random strains inthe CE’s, the distribution of the nucleation force fn atcommensurability is bounded from below by fmin
n andthat of the defect pinning force fd is bounded fromabove by fmax
d (at weak disorder). For completeness wegive here the previously derived results [33] for these ex-tremal values: both occur due to disorder fluctuations onthe same length scale as that on which the displacementfield u(x) varies. For a defect this naturally correspondsto ld. The associated maximum defect pinning force isfmax
d /µ ∝ ∆g3/2 (for uniform strains [33]). For nucle-ation, at f . µ, the appropriate length scale is lsan, theextent of a so called small amplitude nucleus [39]. Due tothe nonlinearity of the pinning force, lsan itself dependson the force, i.e. lsan(f) > ld and it diverges for f → µ.As shown in detail in [33], this leads to a minimum nu-cleation threshold given by 1 − (fmin
n /µ) ∝ [g3/2∆]4/3.From the condition fmax
d = fminn one then obtains the
disorder strength ∆c at which pinned defects can firstappear spontaneously in the system: ∆c ≃ g−3/2 < ∆∗.
VI. WIDE CHANNELS WITH WEAK
DISORDER
We now consider how channels of larger width, inwhich vortices have the 2D degrees of freedom, behavein the presence of weak edge disorder. Close to com-mensurability, the effects we find are similar to that fora single chain. However, around ’half filling’ the impor-tance of the transverse degrees of freedom of the channelvortices become apparent.
0.00 0.01 0.02 0.030.00
0.01
0.02
0.03
v
f
w/b0 3 3.03 3.06 3.3 3.48 v=f/
FIG. 18: v-f curves for weak disorder (∆ = 0.05) and severalchannel widths. The arrow indicates the yield strength fs =µ/3 for w/b0 = 3 and no disorder. All data are computed forchannel lengths L > 400a0.
A. Behavior near commensurability
For the commensurate case, w/b0 = n, weak CE dis-order causes a reduction of the threshold with respect tothe ideal value f0
s = µ/n, see the data in Fig. 18. The re-duction originates from defect formation at threshold, asillustrated for w = 3b0 in Fig. 19. In (a), three snapshotsof the displacements of individual rows inside the channelare displayed. The first snapshot is for f < fs ≃ 0.7f0
s
and yields the ’flat’ profile. The subsequent snapshotsfor f > fs reveal simultaneous nucleation and motion ofa pair of ’oppositely charged’ TSF’s, each terminated atthe CE’s by a pair of edge dislocations (see Fig. 19(b)).The macroscopic, stationary motion of the array is gov-erned by periodic repetition of this process at the leaststable nucleation site. In (c) we show the vortex trajec-tories during nucleation of the TSF at the left in Figs.19(a),(b). Very similar images were obtained in deco-ration experiments at the initial stage of VL depinningin NbSe2 [11], implying that even for weakly disorderedVL’s, defects may nucleate at depinning (see also [12]).We also note that in simulations of a rapidly moving 2Dvortex lattice [58] the same nucleation mechanism as inFig. 19, but relative to the comoving frame, was identi-fied as source of velocity differences between chains.
For incommensurate channels close to commensurabil-ity, the TSF’s which are caused by the mismatch arepinned by the disorder. For the weak disorder strengthsconsidered here the random stress from the CE’s is notsufficient to break up the TSF’s. Consequently, at zerodrive the array in the channel consists of a weakly disor-dered superlattice of TSF’s. The behavior of the trans-port curves is shown in Fig. 18 for w/b0 = 3.03 and 3.06.It reveals features very similar to the curves of a singlechain (Fig. 12). For fs . f . µ/n, a low mobility regimein the v-f curves develops due to the motion of the TSF’s.Here fs corresponds either to the rms pinning force of in-dividual TSF’s or to the collective pinning force for largerstack density. For forces f > µ/n the curves approachlinear flow behavior again.

16
FIG. 19: (a): Time evolution of longitudinal displacementsui,j of individual rows j = 1, 2, 3 at depinning for w/b0 = 3and ∆ = 0.05. (b) Square lattice representation of the nu-cleated stacks of discommensurations. Small arrows indicatethe Burgers vector of the dislocations terminating each stack.The large arrows indicate their propagation direction. (c)vortex trajectories during nucleation of the vacancy stack be-tween x = 40a0 and x = 65a0 (up to the time correspondingto the filled symbols in (a)).
1 2 3 4 5 60.0
0.5
f s /
w/b0
FIG. 20: Critical force versus channel width for a disorderstrength ∆ = 0.05 using a velocity criterion v ≈ 0.01µ/γ.The dashed line represents the continuum result fs = µb0/w.
B. Behavior around ’half filling’
The dependence of fs on the channel width for ∆ =0.05 is shown in Fig. 20 for two disorder realizations.For larger channel widths, smaller channel lengths wereused with L & 1000/(w/b0). The data around matching(w/b0 ≃ n) reflect the nucleation and pinning of TSF’s asdiscussed above: fs at commensurability is reduced com-pared to the pure value µ/n and the commensurabilitypeak is considerably broadened, particularly for larger n,due to the pinning of TSF’s. The apparent discontinuityin the peak may be an artifact of the finite channel length(see the discussion in Sec.VB on the distribution of nucle-ation sites). A new, and robust feature, however, is thataround ’half filling’ distinct maxima in fs appear. Theorigin of these maxima is illustrated by the static struc-ture near half filling. An example is given for w/b0 = 3.48in for Fig. 21. The triangulation shows that, in addition
to aligned dislocations with ~b ‖ ~x, also misaligned dislo-cations appear with Burgers vector at an angle of about±60 with the CE’s. These misaligned defects are lo-cally stabilized by the disorder in the CE’s and thus also
FIG. 21: Triangulation of the static ground state structure forw/b0 = 3.48 and ∆ = 0.05. The arrows indicate the Burgersvectors of the dislocations. Shown is a characteristic segmentof the total channel length L = 500a0.
FIG. 22: Vortex trajectories for the channel segment shownin Fig. 21 (w/b0 = 3.48, ∆ = 0.05) during motion over ∼ 4a0
at (a) f = 0.0038, (b) f = 0.0101, (c) f = 0.0209 and (d)f = 0.0419.
pinned by the disorder which leads to the increase in thethreshold force. In addition, the projection of the driv-ing force along the glide direction is always smaller formisaligned dislocations than for aligned dislocations. Itis seen that the misaligned dislocations separate regionswith n rows from regions with n±1 rows. Either of theseregions may thus be considered as a longitudinal stack-ing fault (LSF). In Sec.IV we mentioned that in absenceof disorder LSF’s are metastable, the structure with asingle integer number of rows and a regular distributionof TSF’s is energetically somewhat more favorable. Inpresence of weak disorder, however, the LSF are stableand have the lowest energy.
As for the dynamics at f > fs, the dislocation struc-ture and flow pattern are generally different from thestatic pattern of LSF’s. We illustrate this in Fig. 22where the vortex trajectories at various (increasing) driv-ing forces are shown. For small drive (Fig. 22(a),f ≃ 0.25µ/(w/b0)), a region of plastic motion within thechannel is seen at about the location where the static pat-tern shows a 4 row structure. Vortex transport throughthese fault zones occurs by repeated nucleation and anni-hilation of misaligned defects. At a fixed driving force anLSF remains at the same position, although its bound-aries fluctuate over a distance of at most 2 − 3a0. Thiscontrasts the situation in absence of disorder where LSF’scan move along the channel via a ’climb’ like process (see[35]).
For different driving forces, the location and amount
17
of either n or n ± 1-row regions or fault zones is differ-ent, as shown in Figs. (b),(c) and (d). In this particularsegment the n = 4 region expands on increasing drivebut at other locations the reverse can occur. Moreover,after cycling the force, a different structure can occurat the same drive, i.e. no unique structure exists at agiven force. This may also lead to small hysteresis in thev-f curves. Overall, we see that the transverse degreesof freedom in the channel, in combination with disor-der, give rise to an important new mechanism of yieldstrength enhancement. In the following section we an-alyze these structures in more detail in the context ofstrong disorder.
VII. WIDE CHANNELS WITH STRONG
DISORDER
The behavior of fs versus w/b0 in Fig. 20 still exhibitsconsiderable discrepancies with the experimental data inFig. 2. Clearly, the CE disorder underlying these exper-imental data (see [59]) differs from the type of weak CEdisorder considered so far. Motivated by recent imagingexperiments [34], which showed glassy vortex configura-tions in the NbN edge material, we now consider the caseof strong CE disorder. As will be shown, in this regimethe effect of transverse degrees of freedom and the pres-ence of misaligned defects provide the main mechanismfor the critical current oscillations.
The simulations we discuss here in detail were per-formed at a large disorder strength ∆ = 0.2. The onlyremaining order in the CE arrays is their preferred ori-entation with the principle lattice vector along the CE’s.The system sizes were typically such that wL & 1500a0b0.We also allowed for quenched defects between the twoCE’s (uncorrelated longitudinal strains in the upper andlower CE arrays), but at these large disorder strengthsthis is not essential.
A. Static structures, yield strength and depinning
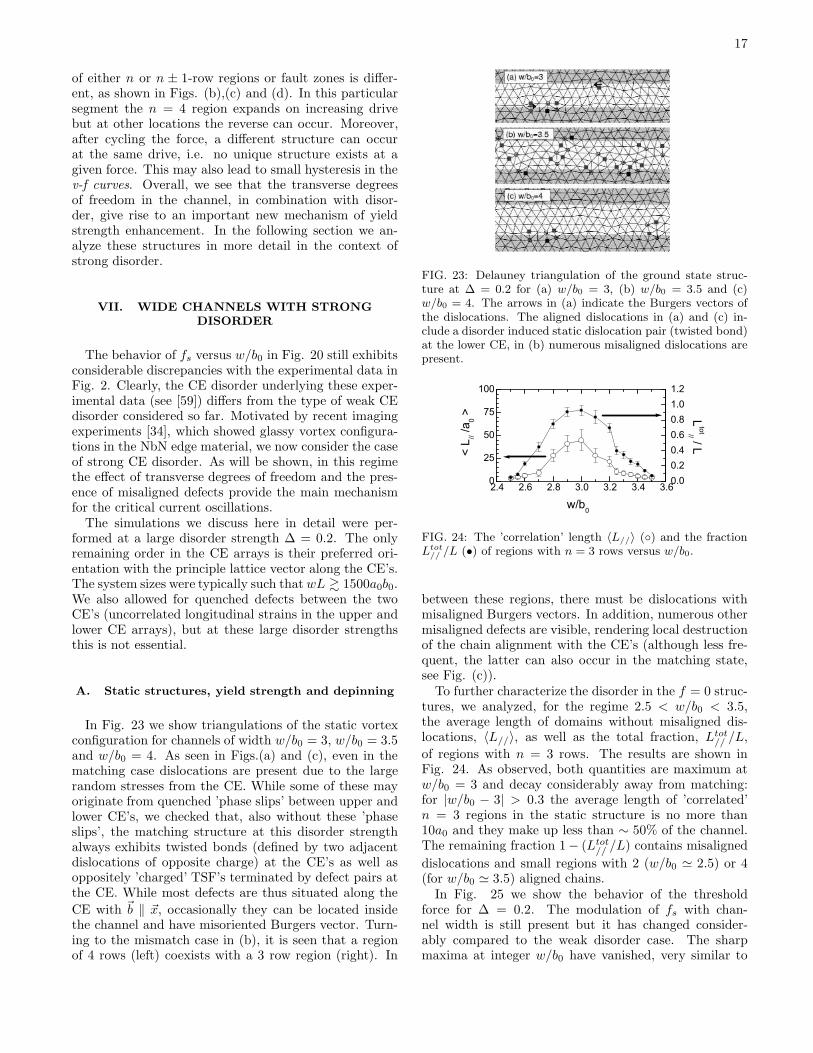
In Fig. 23 we show triangulations of the static vortexconfiguration for channels of width w/b0 = 3, w/b0 = 3.5and w/b0 = 4. As seen in Figs.(a) and (c), even in thematching case dislocations are present due to the largerandom stresses from the CE. While some of these mayoriginate from quenched ’phase slips’ between upper andlower CE’s, we checked that, also without these ’phaseslips’, the matching structure at this disorder strengthalways exhibits twisted bonds (defined by two adjacentdislocations of opposite charge) at the CE’s as well asoppositely ’charged’ TSF’s terminated by defect pairs atthe CE. While most defects are thus situated along the
CE with ~b ‖ ~x, occasionally they can be located insidethe channel and have misoriented Burgers vector. Turn-ing to the mismatch case in (b), it is seen that a regionof 4 rows (left) coexists with a 3 row region (right). In
FIG. 23: Delauney triangulation of the ground state struc-ture at ∆ = 0.2 for (a) w/b0 = 3, (b) w/b0 = 3.5 and (c)w/b0 = 4. The arrows in (a) indicate the Burgers vectors ofthe dislocations. The aligned dislocations in (a) and (c) in-clude a disorder induced static dislocation pair (twisted bond)at the lower CE, in (b) numerous misaligned dislocations arepresent.
2.4 2.6 2.8 3.0 3.2 3.4 3.60
25
50
75
100
0.00.20.40.60.81.01.2
< L // /
a 0 >
w/b0
Ltot// / L
FIG. 24: The ’correlation’ length 〈L//〉 () and the fractionLtot
// /L (•) of regions with n = 3 rows versus w/b0.
between these regions, there must be dislocations withmisaligned Burgers vectors. In addition, numerous othermisaligned defects are visible, rendering local destructionof the chain alignment with the CE’s (although less fre-quent, the latter can also occur in the matching state,see Fig. (c)).
To further characterize the disorder in the f = 0 struc-tures, we analyzed, for the regime 2.5 < w/b0 < 3.5,the average length of domains without misaligned dis-locations, 〈L//〉, as well as the total fraction, Ltot
// /L,
of regions with n = 3 rows. The results are shown inFig. 24. As observed, both quantities are maximum atw/b0 = 3 and decay considerably away from matching:for |w/b0 − 3| > 0.3 the average length of ’correlated’n = 3 regions in the static structure is no more than10a0 and they make up less than ∼ 50% of the channel.The remaining fraction 1− (Ltot
// /L) contains misaligned
dislocations and small regions with 2 (w/b0 ≃ 2.5) or 4(for w/b0 ≃ 3.5) aligned chains.
In Fig. 25 we show the behavior of the thresholdforce for ∆ = 0.2. The modulation of fs with chan-nel width is still present but it has changed consider-ably compared to the weak disorder case. The sharpmaxima at integer w/b0 have vanished, very similar to
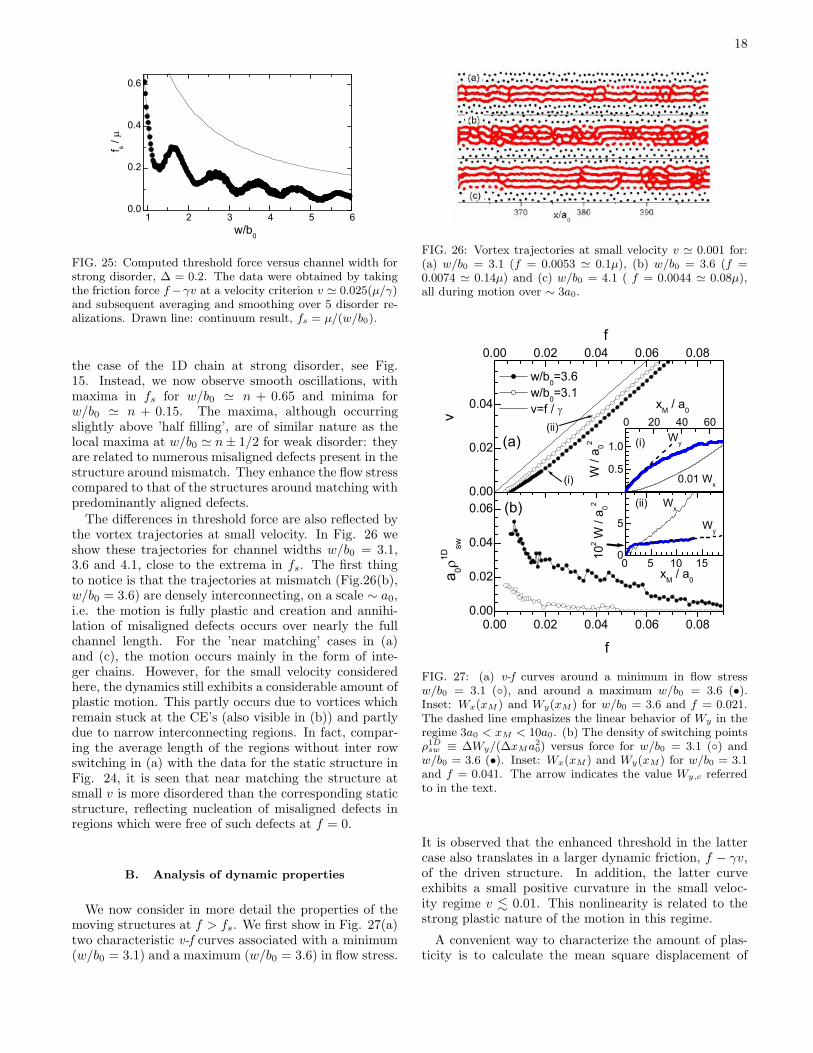
18
1 2 3 4 5 60.0
0.2
0.4
0.6
f s /
w/b0
FIG. 25: Computed threshold force versus channel width forstrong disorder, ∆ = 0.2. The data were obtained by takingthe friction force f −γv at a velocity criterion v ≃ 0.025(µ/γ)and subsequent averaging and smoothing over 5 disorder re-alizations. Drawn line: continuum result, fs = µ/(w/b0).
the case of the 1D chain at strong disorder, see Fig.15. Instead, we now observe smooth oscillations, withmaxima in fs for w/b0 ≃ n + 0.65 and minima forw/b0 ≃ n + 0.15. The maxima, although occurringslightly above ’half filling’, are of similar nature as thelocal maxima at w/b0 ≃ n± 1/2 for weak disorder: theyare related to numerous misaligned defects present in thestructure around mismatch. They enhance the flow stresscompared to that of the structures around matching withpredominantly aligned defects.
The differences in threshold force are also reflected bythe vortex trajectories at small velocity. In Fig. 26 weshow these trajectories for channel widths w/b0 = 3.1,3.6 and 4.1, close to the extrema in fs. The first thingto notice is that the trajectories at mismatch (Fig.26(b),w/b0 = 3.6) are densely interconnecting, on a scale ∼ a0,i.e. the motion is fully plastic and creation and annihi-lation of misaligned defects occurs over nearly the fullchannel length. For the ’near matching’ cases in (a)and (c), the motion occurs mainly in the form of inte-ger chains. However, for the small velocity consideredhere, the dynamics still exhibits a considerable amount ofplastic motion. This partly occurs due to vortices whichremain stuck at the CE’s (also visible in (b)) and partlydue to narrow interconnecting regions. In fact, compar-ing the average length of the regions without inter rowswitching in (a) with the data for the static structure inFig. 24, it is seen that near matching the structure atsmall v is more disordered than the corresponding staticstructure, reflecting nucleation of misaligned defects inregions which were free of such defects at f = 0.
B. Analysis of dynamic properties
We now consider in more detail the properties of themoving structures at f > fs. We first show in Fig. 27(a)two characteristic v-f curves associated with a minimum(w/b0 = 3.1) and a maximum (w/b0 = 3.6) in flow stress.
FIG. 26: Vortex trajectories at small velocity v ≃ 0.001 for:(a) w/b0 = 3.1 (f = 0.0053 ≃ 0.1µ), (b) w/b0 = 3.6 (f =0.0074 ≃ 0.14µ) and (c) w/b0 = 4.1 ( f = 0.0044 ≃ 0.08µ),all during motion over ∼ 3a0.
0.00
0.02
0.04
0.00 0.02 0.04 0.06 0.08
0.00 0.02 0.04 0.06 0.080.00
0.02
0.04
0.06
0.5
1.0
0 20 40 60
0
5
0 5 10 15
(ii)
(i)
(a)
xM / a0
v
w/b0=3.6 w/b0=3.1 v=f /
xM / a0
(b)
f
a 01D
sw
f
(i) Wy
0.01 Wx
W /
a 02
(ii)
Wy
Wx
102 W
/ a 02
FIG. 27: (a) v-f curves around a minimum in flow stressw/b0 = 3.1 (), and around a maximum w/b0 = 3.6 (•).Inset: Wx(xM ) and Wy(xM ) for w/b0 = 3.6 and f = 0.021.The dashed line emphasizes the linear behavior of Wy in theregime 3a0 < xM < 10a0. (b) The density of switching pointsρ1D
sw ≡ ∆Wy/(∆xMa20) versus force for w/b0 = 3.1 () and
w/b0 = 3.6 (•). Inset: Wx(xM ) and Wy(xM) for w/b0 = 3.1and f = 0.041. The arrow indicates the value Wy,c referredto in the text.
It is observed that the enhanced threshold in the lattercase also translates in a larger dynamic friction, f − γv,of the driven structure. In addition, the latter curveexhibits a small positive curvature in the small veloc-ity regime v . 0.01. This nonlinearity is related to thestrong plastic nature of the motion in this regime.
A convenient way to characterize the amount of plas-ticity is to calculate the mean square displacement of

19
vortices form their center of mass (M) positions [60]:
Wα(t) =∑
i
[αi(t + t0) − αi(t0)]2/Nch, (39)
where α = x−xM , y−yM denotes longitudinal and trans-verse displacements, respectively. As shown by Kolton et
al for a ’bulk’ 2D vortex lattice [60], Wα(t) can be char-acterized by Wα = Rαtξα . For example, when ξy = 1we have normal transverse diffusion (caused by ’random’switching of vortices between chains) with Ry = Dy thediffusion coefficient. However, in the channels Wy will be-come bounded at long times (large xM ) due to the finitechannel width. In the inset (i) to Fig. 27(a) we have illus-trated this behavior for w/b0 = 3.6 and f = 0.021. ForxM . 15a0 (the point xM = 0 was chosen in the steadystate after transients had disappeared), Wy increases lin-early as in usual diffusion, but for larger displacements(times) Wy levels off and eventually saturates. In addi-tion, even when all vortices remain in their chain (notransverse diffusion), Wy initially increases to a valueWy,c due to finite chain ’roughness’. Such behavior isobserved for xM . 2a0 in the inset (ii) to Fig. 27(b)where Wy is shown for a more coherent flow situationat w/b0 = 3.1 and f = 0.041. In practice, we foundthat Wy,c is always reached for xM < 3a0, while for thelong time (large distance) behavior significant levellingof Wy occurs only when xM & 10a0. The appropriateregime we use to characterize real diffusion is thereforegiven by 3a0 < xM < 10a0 (i.e. ∆xM = 7a0). Further,Dy itself does not directly reflect the density of chain-switching points along the channel. Defining the ’1D’density of such switching points as ρ1D
sw ≃ Nsw/L, therate of switching increases linearly both with ρ1D
sw andwith the average velocity: t−1
sw ≃ ρ1Dsw v. Hence, the diffu-
sion constant is given by: Dy ≃ a20/tsw = ρ1D
sw va20. Being
interested in ρ1Dsw , we therefore divide out the intrinsic
velocity dependence of Dy and calculate Wy(t)/(vta20) =
∆Wy/(∆xMa20) ≡ ρ1D
sw .The results of ρ1D
sw versus f are shown in Fig. 27(b)for the two cases w/b0 = 3.1 and w/b0 = 3.6. Aroundthe minimum in flow stress (), the overall value of ρ1D
sw
is considerably smaller than around the maximum (•),similar to what is seen in the trajectories in Fig. 26. Forboth cases, ρ1D
sw is clearly reduced on increasing the force.This reflects both a decrease of the number of fault zonesin the moving structure as well as a suppression of switchevents (called ’transverse freezing’ in [60]) within regionsalready organized in n moving rows. Around matching,ρ1D
sw smoothly vanishes at f ∼ µ ≈ 0.05, indicating com-plete dynamic ordering into an n = 3 row structure with-out transverse wandering. For w/b0 = 3.6 an orderingtransition is also observed but it occurs at much largerdrive (f ∼ 3µ, not shown) and the array orders into ann = 4 row configuration, with a reduced spacing b < b0
between the chains and average vortex spacing a > a0
within the chains. At the end of this section we willshow how in this large drive regime the number of rowschanges with w/b0.
FIG. 28: (a) Flow trajectories at large drive (a) during motionover ∼ 3a0 for w/b0 = 3.1 and f ≃ 2µ. (b) Delauney triangu-lation of one snapshot of (a). (c) Trajectories for w/b0 = 3.55and f ≃ 2µ. (d) Triangulation of a snapshot of (c).
The insets to Fig. 27 also show the longitudinal meansquare displacements. For strongly plastic flow at mis-match (inset (i)), Wx is large and ξx is close to 2, asexpected when some vortices remain stuck at the CE’s.For the more coherent situation in (ii), where transverseswitching has nearly ceased, Wx is smaller and ξx & 1.We always find an exponent 1 < ξx < 2, similar to theresults for 2D VL’s in [60]. Interestingly, even withouttransverse wandering (ρ1D
sw = 0), Wx increases indefi-nitely (with ξ & 1), indicating that the moving integerchain structure still exhibits slip events and (local) ve-locity differences between the chains.
We illustrate some more aspects of the structures atlarge drive in Fig. 28, where the vortex trajectoriesand triangulations of a single snapshot are displayed forw/b0 = 3.1 and w/b0 = 3.55, both at f ≃ 2µ. Forw/b0 = 3.1, we do not see any transverse wandering inFig. 28(a). Figure 28(b) shows that in this case the
dynamic structure exhibits only dislocations with ~b ‖ ~x,mainly located at the CE but also occasionally betweenchains inside the channel. The latter dislocations are pos-sibly dynamically nucleated. They are non-stationaryin the comoving frame and lead to slip events and thegrowth of Wx as was discussed above. Turning to the mis-match case (Figs. 28(c) and (d)), it is seen that the dy-namic structure consists of n = 3 and n = 4 row regionscoexisting in the channel. At the driving force consideredhere, ρ1D
sw has a finite but small value a0ρ1Dsw ≃ 0.007,
which is solely due to switching of vortices in the faultzones separating the 3 and 4-row regions. Within theseregions transverse wandering is absent. At yet largerforces the minority 3-row regions vanish and completeordering into 4 rows occurs, as for the case w/b0 = 3.6.For a given driving force, the n-row regions again remainquasi-static during motion. The triangulation in (d) ex-hibits the expected misaligned dislocations at the fault

20
zone but in general also aligned dislocations are presentbetween the chains within an n-row region (not shown inthe figure).
It is also interesting to compare the velocities in thetwo coexisting regions with n and n ± 1 rows. Denot-ing the vortex velocity in an n-row region by vn andthe longitudinal vortex spacing there by an, flux con-servation implies that nvn/an = n′vn′/an′ . We checkedthat, in both regions, the average flux density 1/(anbn),with bn = w/n the row spacing, was equal to 1/(a0b0)within ∼ 4%. Therefore an′ = (n′/n)an, and conse-quently the average vortex velocities are equal, vn = vn′ .However, the local washboard frequency, νn = vn/an, isdifferent in both regions. Indeed, the spectrum of the ve-locity fluctuations in channels with dynamic coexistenceof n and n ± 1 rows showed two shallow fundamentalpeaks at frequencies νn/νn′ = n′/n. We however notethat, both around matching (where a single peak occursat ν ∼ v/a0) and around mismatch, the amplitude ofthe washboard peak(s) decays on increasing the chan-nel length L. In addition, for large velocities the mixedn/n ± 1 structures ultimately anneal into a single n orn ± 1 domain, causing the collapse of one of the peaks.
The simulations also allow to explicitly show the in-fluence of the transverse degrees of freedom on the mod-ulations of the dynamic friction force (and, ultimately,the critical current). Generalizing the expression for thefriction force Eq.(20) in Sec. III B including transversefluctuations leads to:
f = (γ/v)[〈(∂tux)2〉i,t + 〈(∂tuy)2〉i,t]
= γv + fxfric + fy
fric
≡ γv + ffric, (40)
where fxfric and fy
fric denote the contribution to the totalfriction due to longitudinal and transverse fluctuations,respectively. Figure 29(a) displays the numerical resultsfor these quantities, normalized by the total friction forcef − γv as obtained from the v − f curves. The sum ofthe two data is 1 as it should be, confirming the correctnumerical evaluation of these quantities. The total fric-tion is also shown for clarity (Fig.(b)) and is essentiallythe same as the data shown in Fig. 25. Clearly, therelative contribution of longitudinal fluctuations to ffric
decreases on approaching a mismatch situation, whilefy
fric/ffric increases accordingly. These qualitative fea-tures remain present also at larger velocities, where per-meation modes between chains are being suppressed.
Finally, we consider the continuous modulation ofstructural (dis)order in the moving arrays when vary-ing the channel width. As was shown in Fig. 27(b), for afixed velocity, the density of switching points ρ1D
sw is max-imum around mismatch while for fixed channel width itdecreases with velocity. We can then define an order-ing velocity vc operationally as the point at which ρ1D
sw isreduced below a certain threshold. In Fig. 29(c) the be-havior of vc for channel widths w/b0 > 2 is shown for twocriteria. The lower curve (vc,1), with a0ρ
1Dsw ≈ 0.01, cor-
responds to a situation with ∼ 70% of the channel length
0.0
0.2
0.4
0.6
0.8
1.0 1 2 3 4 5 6
1 2 3 4 5 6
246
0.0
1.0
2.0
3.0
0.1
0.2
(a)
w/b0
f fric
/f fric
(d)
n
vc,2(c)
v* /
w/b0
(b)
f fric/
FIG. 29: (a) The contributions fxfric/ffric (•) and fy
fric/ffric
() to the dynamic friction versus w/b0 for a velocity v =0.1µ/γ. (b) Total friction f − γv at v = 0.1µ/γ. (c) Orderingvelocity vc,1 (•) determined from a criterion a0ρ
1Dsw ≃ 0.01,
and vc,2 () using a criterion a0ρ1Dsw ≃ 0.002 (error bars were
estimated from different disorder realizations). (d) Numberof moving rows n at large drive (v & vc,2) versus w/b0.
’transversely frozen’ into integer chain regions of length& 10a0. The upper curve (vc,2), with a0ρ
1Dsw ≈ 0.002,
corresponds to nearly fully annealed arrays. As observed,vc,1 increases smoothly by about an order of magnitudebetween a matching and mismatching situation, whilevc,2 increases by a factor & 5 (except for w/b0 > 5). Re-gardless of the criterion, the amplitude of the modulationof vc is considerably larger than the amplitude of the fs
modulation, which we will further discuss shortly.For v & vc,2 the arrays all completely anneal into a sin-
gle n-row structure without permeation modes. Figure29(d) displays the number of rows n of these structuresversus w/b0. The switching from n to n + 1 rows is seento occur at half integer channel widths for w/b0 > 3 butthe transitions 1 → 2 and 2 → 3 take place below thesepoints, at w/b0 ≃ 1.35 and w/b0 ≃ 2.4, respectively.Around the transition points, there are regions in whichn and n±1 rows coexist at smaller velocity v . vc,2. Thewidths of these regions were found to be ∆w/b0 = ±0.05.
VIII. DISCUSSION
The results for fs versus w/b0 at strong disorder in theprevious section show strong resemblance to the measure-

21
1 2 3 4 5 60.0
0.1
0.2
0.3
0.4
0.5
0.6 0.2 0.3 0.4 0.5 0.6 0.7
0.0
0.1
0.2
0.3
0.4
B1/2
A/A0
w/b0
Aexp /A
0
FIG. 30: Comparison between the experimentally measuredyield strength of an artificial flow channel and the numericalresults at strong disorder [61], represented through the param-eter A (see the text) normalized by the value A0 = (π
√3)−1
for the ideal lattice.
ments of the critical current versus field B in the exper-imental channel system, see Fig. 2. For a more detailedcomparison, we combine in Fig. 30 both data, repre-sented in terms of the parameter A (see Sec.I): for theexperiment, Aexp is determined from Aexp = Fsw/(2c66)
and is plotted versus B1/2, for the simulations, A =(fs/µ)(w/b0)A
0 ([61]). As observed, the shapes of theoscillations are in very reasonable agreement, althoughthe overall value of A from the numerics is larger thanthe experimental value [62]. The important conclusionfrom the simulations here is thus that the maxima inthe measured critical current do not correspond to tra-ditional commensurability peaks, but are caused by en-hanced plastic motion and transverse deviations in mis-matching channels with strong edge disorder. Previously,we indeed obtained experimental evidence for this mecha-nism via mode-locking (ML) experiments [31] in which anrf-drive is superimposed on the dc-drive. Interference be-tween the former and collective modes of deformation inthe moving array leads to plateaus in the current-voltagecurves. The plateau (ML) voltage then directly yields thenumber of moving rows n and transitions from n → n±1rows were observed to coincide with maxima in criticalcurrent [63].
More detailed ML-experiments provided a wealth ofadditional information on the dynamics of the arrays[32]. In particular, a minimum velocity was requiredto observe the ML-phenomenon, which we identified asordering velocity. This ordering velocity exhibited astrong upturn away from matching, similar to the be-havior of vc in the simulations. As proposed in [32],vc can be estimated from a modified version of the dy-namic ordering theory of Koshelev and Vinokur (KV)[37]. Firstly, instead of the 2D random potential in [37],for the channels vc is related to the short range corre-lated random stress from the CE, with r.m.s. amplitude∼ εcec66 and εce the random strain. Secondly, when ther-mal fluctuations can be ignored compared to typical de-fect energies (see below), vc is inversely proportional to
the energy kBTp for creation of small defect pairs (see
also [64]): vc/a ≃√
3/32π(a0/a)2(εcec66)2a0b0/(γkBTp),
with kBTp ≃ Apc66a20/2π (per unit vortex length). The
typical pairs referred to are those with misaligned Burg-ers vector, which are responsible for breakup of the chainstructure. Hence, the increase of vc away from matchingimplies a decrease in the pair formation energy, whichis accounted for by including the parameter Ap . 1 inkBTp, while setting Ap ≡ 1 at matching. Experimentally,Ap decreased to ∼ 0.1 at mismatch. The behavior of vc
and Ap in the simulations is analyzed using the dimen-sionless form of the above formula for vc:
(γvc/µ) ≃ 2.5ε2ce(a0/a)/Ap (41)
The data for vc,1 around matching (where Ap = 1) yieldas measure for the random strain εce ≃ 0.19 and, nearmismatch, a reduction of the defect pair creation energyby a factor Ap ≃ 0.1. The latter is in very reasonableagreement with the experiments, and the reduction ofkBTp near mismatch also qualitatively agrees with thelarge number of disorder induced fault zones observed inthe static structures near mismatch (Fig.23). However,the result for εce is considerably larger than the valueεce = 0.025 found experimentally. This is also manifestin the fact that in the experiments the pinning frequency,defined as fs/(γa), always exceeds the ordering frequencyvc/a, while in the simulations fs . γvc.
Within the modified KV theory, the pinning frequencyand the ordering frequency are directly related via [32]:vc/a = τ(fs/γa)2 with τ = (ε2
ce/2A2)(wB)2/(Apc66ρf ).Experimentally, τ was found to be independent of thematching condition. The decrease in the defect pair cre-ation energy (∝ Ap) then relates to the increase in thepinning frequency (yield strength) away from matching(∝ A) as Ap ∝ 1/A2. The numerical results for Ap versusA behave similarly and can be fitted by Ap ∝ 1/Aς withς ∼ 2 − 3, but data collected over the full range of w/b0
show to much scatter to make a more detailed compari-son. Nevertheless, the KV model qualitatively accountsfor the enhanced amplitude of the vc modulation com-pared to that of the yield strength.
As for the discrepancy between the experimental andnumerical values for εce or vc, one should keep in mindthat experimentally the ordering velocity is determinedfrom the onset of an n-row ML plateau, i.e. it corre-sponds to the velocity at which coherent n-row regionsfirst appear, while incoherent regions may still exist inother parts of the channel. In the simulations this maythus correspond to vc determined using a larger criterionfor the density of switching points ρ1D
sw . In addition, thesuperimposed rf-drive in the experiments may assist re-ordering of the structure, also leading to smaller valuesof vc. For future studies it is interesting to directly com-pare numerical simulations of channels with mixed rf-dcdrive with the experiments and test which criterion bestrepresents the reordering phenomenon.
Additionally, the experimental results indicated thatin the large drive regime (where the ML amplitude satu-
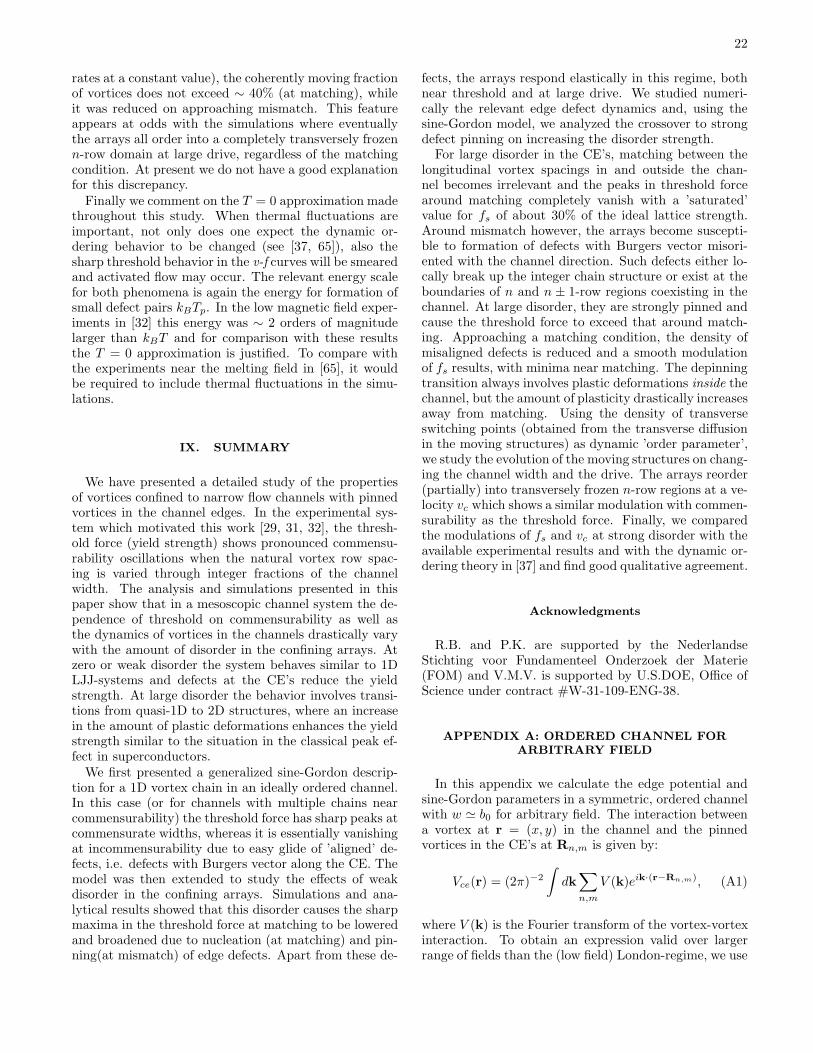
22
rates at a constant value), the coherently moving fractionof vortices does not exceed ∼ 40% (at matching), whileit was reduced on approaching mismatch. This featureappears at odds with the simulations where eventuallythe arrays all order into a completely transversely frozenn-row domain at large drive, regardless of the matchingcondition. At present we do not have a good explanationfor this discrepancy.
Finally we comment on the T = 0 approximation madethroughout this study. When thermal fluctuations areimportant, not only does one expect the dynamic or-dering behavior to be changed (see [37, 65]), also thesharp threshold behavior in the v-f curves will be smearedand activated flow may occur. The relevant energy scalefor both phenomena is again the energy for formation ofsmall defect pairs kBTp. In the low magnetic field exper-iments in [32] this energy was ∼ 2 orders of magnitudelarger than kBT and for comparison with these resultsthe T = 0 approximation is justified. To compare withthe experiments near the melting field in [65], it wouldbe required to include thermal fluctuations in the simu-lations.
IX. SUMMARY
We have presented a detailed study of the propertiesof vortices confined to narrow flow channels with pinnedvortices in the channel edges. In the experimental sys-tem which motivated this work [29, 31, 32], the thresh-old force (yield strength) shows pronounced commensu-rability oscillations when the natural vortex row spac-ing is varied through integer fractions of the channelwidth. The analysis and simulations presented in thispaper show that in a mesoscopic channel system the de-pendence of threshold on commensurability as well asthe dynamics of vortices in the channels drastically varywith the amount of disorder in the confining arrays. Atzero or weak disorder the system behaves similar to 1DLJJ-systems and defects at the CE’s reduce the yieldstrength. At large disorder the behavior involves transi-tions from quasi-1D to 2D structures, where an increasein the amount of plastic deformations enhances the yieldstrength similar to the situation in the classical peak ef-fect in superconductors.
We first presented a generalized sine-Gordon descrip-tion for a 1D vortex chain in an ideally ordered channel.In this case (or for channels with multiple chains nearcommensurability) the threshold force has sharp peaks atcommensurate widths, whereas it is essentially vanishingat incommensurability due to easy glide of ’aligned’ de-fects, i.e. defects with Burgers vector along the CE. Themodel was then extended to study the effects of weakdisorder in the confining arrays. Simulations and ana-lytical results showed that this disorder causes the sharpmaxima in the threshold force at matching to be loweredand broadened due to nucleation (at matching) and pin-ning(at mismatch) of edge defects. Apart from these de-
fects, the arrays respond elastically in this regime, bothnear threshold and at large drive. We studied numeri-cally the relevant edge defect dynamics and, using thesine-Gordon model, we analyzed the crossover to strongdefect pinning on increasing the disorder strength.
For large disorder in the CE’s, matching between thelongitudinal vortex spacings in and outside the chan-nel becomes irrelevant and the peaks in threshold forcearound matching completely vanish with a ’saturated’value for fs of about 30% of the ideal lattice strength.Around mismatch however, the arrays become suscepti-ble to formation of defects with Burgers vector misori-ented with the channel direction. Such defects either lo-cally break up the integer chain structure or exist at theboundaries of n and n ± 1-row regions coexisting in thechannel. At large disorder, they are strongly pinned andcause the threshold force to exceed that around match-ing. Approaching a matching condition, the density ofmisaligned defects is reduced and a smooth modulationof fs results, with minima near matching. The depinningtransition always involves plastic deformations inside thechannel, but the amount of plasticity drastically increasesaway from matching. Using the density of transverseswitching points (obtained from the transverse diffusionin the moving structures) as dynamic ’order parameter’,we study the evolution of the moving structures on chang-ing the channel width and the drive. The arrays reorder(partially) into transversely frozen n-row regions at a ve-locity vc which shows a similar modulation with commen-surability as the threshold force. Finally, we comparedthe modulations of fs and vc at strong disorder with theavailable experimental results and with the dynamic or-dering theory in [37] and find good qualitative agreement.
Acknowledgments
R.B. and P.K. are supported by the NederlandseStichting voor Fundamenteel Onderzoek der Materie(FOM) and V.M.V. is supported by U.S.DOE, Office ofScience under contract #W-31-109-ENG-38.
APPENDIX A: ORDERED CHANNEL FOR
ARBITRARY FIELD
In this appendix we calculate the edge potential andsine-Gordon parameters in a symmetric, ordered channelwith w ≃ b0 for arbitrary field. The interaction betweena vortex at r = (x, y) in the channel and the pinnedvortices in the CE’s at Rn,m is given by:
Vce(r) = (2π)−2
∫
dk∑
n,m
V (k)eik·(r−Rn,m), (A1)
where V (k) is the Fourier transform of the vortex-vortexinteraction. To obtain an expression valid over largerrange of fields than the (low field) London-regime, we use

23
a generalization of the London potential Eq.(6) as pro-posed by Brandt [30]. This generalization accounts forthe reduction of superfluid density with field and an ad-ditional attractive interaction due to overlapping vortexcores. The Fourier transform of this interaction reads:
V (k) = 2πU0(1 − b)
[
1
|k|2 + λ′−2− 1
|k|2 + ξ′−2
]
, (A2)
where b = B/Bc2, λ′ = λ/(1 − b)1/2 and ξ′ = ξ C(2−2b)1/2
the effective coherence length with C ∼ 1. It is conve-nient to split Eq.(A1) for the total potential in terms ofthe contribution Vm of row m (see Fig. 3). Integratingover ky and using Poisson summation yields
Vm(r) =∑
l
|V lm(y)| cos lk0(x − ma0/2) (A3)
where k0 = 2π/a0 and the prefactors are:
|V lm(y)| = k0U0(1 − b)
[
e−lk0,λ′ |y′m|
lk0,λ′− e−lk0,ξ′ |y′
m|
lk0,ξ′
]
(A4)
with lk0,λ′ =√
(lk0)2 + (λ′)−2, lk0,ξ′ =√
(lk0)2 + (ξ′)−2 and y′m = −y+m[b0+((w−b0)/2|m|)].
First of all, we neglect in Eq.(A3) the l = 0 terms whichrepresent uniform (x-independent) interaction. Sec-ondly, when λ & a0, as practically encountered infilms, k0,λ′ ≈ k0. Then the |l| > 1 terms can beneglected, resulting in a sinusoidal potential |l| = 1.Further, in the summation over m only the contribu-tions from the m = ±1 terms are significant. Nextwe employ the relation ξ2/a2
0 = b√
3/4π and rewrite
k0,ξ′ = (1/a0)√
4π2 + 8π(1 − b)/(√
3C2b). The resulting
expression for the total edge potential is:
Vce,0(r) = −[
cosh(k0y) − e(1−s(b))π
w+b0a0
s(b)cosh(k0ys(b))
]
×2U0(1 − b)e−πw+b0
a0 cos k0x, (A5)
where s(b) =√
1 + (2 − 2b)/(π√
3C2b).
For a channel with w = b0, the maximum µ(b) of thesinusoidal pinning force −∂xVce,0 at y = 0 is then givenby:
µ(b) ≃ 2U0(1 − b)f(b)
12πa0, (A6)
where we used e−π√
3 ≃ 1/24π2 and
f(b) = 1 − 24π3 e−√
π√
3(2−2b)
C2b+3π2
√
π(2−2b)
C2√
3b+ π2
. (A7)
It can be checked that the associated shear modulusc66 = π
√3µ(b)/2a0 is very similar to the interpolation
formula of Brandt Eq.(2). Additionally, the edge poten-tial Eq.(A5) is harmonic for all fields. Hence the idealflow stress of a commensurate, ordered channel, is char-acterized by Frenkels value A0 = 1/π
√3 for all fields [66].
In the low field limit b . 0.2 (and λ/a0 & 1/π) the aboveexpressions reduce to Eq.(8), (9) in Sec. III A.
Using the field-dependent vortex interaction Eq.(A2),one can derive the parameters in the sine-Gordon de-scription of Sec. III A generalized for higher field. Theequation for the chain stiffness becomes:
κq = U0π(1 − b)
[
λ′/a0√
1 + λ′2q2− ξ′/a0√
1 + ξ′2q2
]
. (A8)
The reduced stiffness is obtained from g(b) =κ0(b)/(k0µ(b)a2
0):
g(b) =3π
f(b)
√ √3b
4π(1 − b)
(
λ
ξ− C√
2
)
(A9)
Taking into account these refinements in Eq.(10) andEq.(17), the defect width in the nonlocal regime becomes:
lnld (b) = 6π2a0/f(b). (A10)
One can obtain the typical crossover field bnl (or typicalλ/a0,nl) at which nonlocal behavior sets in for a chainin an ordered channel by equating Eq.(A10) to the s-
G value for the kink width 2πa0
√
g(b). Approximating
f(b) ≃ (1 − b), one finds 1 − b = 3π/√
g(b), which hasthe approximate solution
bnl ≃1
2
[
1 −√
1 − (48√
3π3ξ2/λ2)
]
(A11)
Hence, the nonlocal regime is absent for a channel ina material with λ/ξ . 50 (and thickness d & λ). Forλ/ξ & 60, nonlocal behavior occurs for b > bnl withbnl . 0.2. This is to be compared with the estimatea0,nl < λ/3π resulting from a simple London interaction,see Sec. III A.
APPENDIX B: SOLUTION TO THE DYNAMIC
SINE-GORDON EQUATION
For a displacement field of the form Eq.(24), expressedin modes with wave vector mq = 2πmcd and amplitudehm, Eq.(23) for the v-f curve attains the form:
f = γv
[
1 + 2k20
M∑
m=1
m2|hm|2]
. (B1)
The amplitudes hm are obtained by inserting Eq.(24) intothe equation of motion (13) with the wavelength depen-dent elasticity κ(q) from Eq.(12). Since h can become ofthe order of a lattice spacing a0, one expands the ’sin’term in (13) up to second order in h. Furthermore, we

24
assume that hm decays rapidly upon increasing m and wekeep only the three lowest order contributions hm withm ≤ 3. Collecting terms of equal wave number, one ob-tains the following set of approximate equations:
2
µ(iγvk0 + K1,q)h1 = −i + ik2
0(|h1|2 + |h2|2)
+k0h2 − i(k20/2)h2
1 (B2)
2
µ(2iγvk0 + K2,q)h2 = k0h1 + ik2
0(h∗1h2 − h1h2) (B3)
2
µ(3iγvk0 + K3,q)h3 = k0h2 + i(k2
0/2)h21, (B4)
where Km,q = m2q2κ(mq) and h∗ denotes the complexconjugate of h. At small v, the real components of hvanish and the amplitudes describing the shape of thequasi-static deformations are given by:
|h1| ≈(2K1,q/µ) −
√
(2K1,q/µ)2 + 6k20
3k20
(B5)
|h2| ≈−k0|h1|
2k20|h1| − (2K2,q/µ)
(B6)
|h3| ≈µ(k0|h2| − k2
0 |h1|2/2)
2K3,q. (B7)
For arbitrary v, the hm’s in Eq.(B2,B3,B4) may be deter-mined by a mathematical program. However, the mostimportant effect of the coupling is that above a char-acteristic velocity v∗ (see below), |h2| and |h3| decreaserapidly as |h2| ∼ |h1|/v and |h3| ∼ |h1|2/3v, so that onlythe first Fourier mode survives. This mode is describedby (v ≫ v∗):
h1(v) =(2γv/µ) −
√
(2γv/µ)2 + 2
k0
≈ − µ
2γvk0, (B8)
Since Eq.(B8) can be obtained by neglecting the elas-tic force terms κn,q, it describes the deviation from theaverage velocity of a single particle in a periodic poten-tial. Further analysis of Eq.(B2,B3,B4) shows that thecrossover velocity v∗ is determined by the amplitude ofthe quasi-static result in Eq.(B5,B6,B7):
(2γv∗k0/µ)23∑
m=1
(m|hm|)2 ≈ 1. (B9)
Using the definition
K2eff (cd =
q
2π) ≡ µ2
4
(
3∑
m=1
(m|hm|)2)−1
, (B10)
we rewrite Eq.(B9):
k0v∗ = Keff (cd)/γ. (B11)
Here γ/Keff(cd) can be interpreted as the effective relax-ation time for the non linear deformations in the chain,which is expressed through the relaxation times γ/Km,q
of linear modes (phonons) by Eq.(B10). The velocitydependence of
∑
(m|hm|)2 may then be written as:
3∑
m=1
m2|hm(v)|2 =µ2
4[K2eff + (γvk0)2]
. (B12)
This has the correct small v behavior (where highermodes play a role) and large v behavior (where h2 ≈ h3 ≈0). First order perturbation using only h1 to first orderin Eq.(B2) yields the same functional form but with K2
eff
replaced by K21,q, supporting the analytical interpolation
made in obtaining Eq.(B12). Finally, using Eq.(B1) onearrives at Eq.(25) in section III B.
APPENDIX C: ELASTIC SHEAR WAVES IN
COMMENSURATE, ORDERED CHANNELS
Starting from Eq.(26) we write u as the sum of a spa-tially uniform dc-component and a non-uniform, time-dependent component h(y, t). The result for h(y, t) =u(y, t) − vt is the following modified diffusion equation:
γ∂th(y, t) = (f − γv) + c∂2yh(y, t), (C1)
where c = b20k0µ/2 = c66a0b0. The boundary condition
is set by:
γ∂th(−w/2, t) = −(µ/2) sin[ω0t + h(−w/2, t)]
+(c/b20)∆h(t), (C2)
and similarly for y = +w/2. Here the discrete char-acter of the array near the CE’s is retained in ∆h =h(−w/2 + b0, t)− h(−w/2, t). For the pinning term (lastterm on the r.h.s.) we now use the large velocity expan-sion for the restoring force from one CE: (µ/2) sin[k0(vt+h)] ≃ (µ/2) sin[ω0t]. Then Eqs.(C1),(C2) become similarto those for heat diffusion in a rod with at both endsheat sources that vary sinusoidally in time. In our casethe frequency is the washboard frequency ω0 = k0v. Byseparation of variables one finds:
h(y, t) = heAe,v(w)[fv(y) cos(ω0t) + gv(y) sin(ω0t)]
− (f − γv)
2cy2, (C3)
where fv(y) = − cos(y/l⊥,v) cosh(y/l⊥,v) and gv(y) =sin(y/l⊥,v) sinh(y/l⊥,v) with a velocity (frequency) de-
pendent ’healing’ length l⊥,v =√
2c/γω0 =√
(µ/γv)b0.
The factor Ae,v(w) = 1/√
f2v (w/2) + g2
v(w/2) normal-izes the displacement at the CE to he. The latter is ob-tained from the boundary condition Eq.(C2). In the limit

25
FIG. 31: Velocity profile ∂th(y, t) versus time from Eq.(C3)in a channel with w/b0 ≃ 9. (a) for γv/µ ≃ 0.4 and (b) forγv/µ ≃ 2.
w/b0 = n ≥ 3 and γv/µ & 0.25, he can be approximatedby:
he ≃ µ
2k0γv
√
2γv
2γv + µ(C4)
The solution (C3) describes a periodic velocity modu-lation ∂th of each chain, with a y-dependent amplitude|h′| and phase shift. The latter reflects periodic laggingand advancing of the inner rows with respect to the outerones. Both the decay of |h′| away from the CE and thephase shift strongly increase with velocity through l⊥,v.In Fig. 31 we have illustrated this behavior for smallvelocity γv/µ = 0.4 (a) and larger velocity γv/µ = 2(b). Although the result in (a) is actually out of theregime of validity of the high velocity expansion, the ’in-phase’ behavior at small v is a feature that qualitativelyagrees with the simulations. For comparison we showin Fig. 32 numerical results for the oscillating velocitycomponent for w/b0 = 9 and small drive, f ≃ 2fs ≃ µ/5(γv/µ ≈ 0.16). In addition to the small phase shift oneobserves that the modulation is highly non-sinusoidal,which is not captured by our approximate solution.
Based on the above, one can also evaluate the dy-namic friction force f − γv. Using Eq.(20),(23), theexpression for the elastic-continuum u(y, t) would bef − γv = (γ/vw)
∫
dydt[∂th(y, t)]2. However, in thevelocity regime where our solution applies, the length
FIG. 32: Simulation result of the profile of the fluctuatingvelocity component ∂th versus time in a channel with w/b0 =9 at f = 0.011. The projection in the y − dh/dt plane furtherclarifies the y-dependence of |h′|.
l⊥,v ≤ 2b0. Since we have a discrete number of vortexrows, it is the two outer rows at y = ±w/2 which give thedominant contribution. Evaluating f −γv using Eq.(C4)then leads to Eq.(28) in Sec. IV.
APPENDIX D: DISORDERED CHANNEL
POTENTIAL AND PINNING OF DEFECTS
In this appendix we derive the disorder corrections tothe channel potential and the effect on pinning of thechain. For the vortex interaction we use the London po-tential of Eq.(6). Starting from Eq.(30) we first split thepotential in contributions from row m with transversecoordinate y:
Vm(x) = (2π)−1
∫
dkV (k, y)ρm(k)eikx, (D1)
where k = kx and
V (k, y) = U0πe−y
√k2+λ−2
√k2 + λ−2
. (D2)
In addition, ρm(k) in Eq.(D1) is related to the longitu-dinal displacement field dx
m(x) via [47]
ρm(k) = a−10
∫
dx [1 − ∂xdm + δρm(x − dm)] e−ikx,(D3)
which contains the microscopic density modulationδρm(x − dm(x)) =
∑
l 6=0 cos(lk0[x − dm(x)]) as well asthe density variations ∝ ∂xdm due to long wavelength de-formations. Inserting Eq.(D3) in Eq.(D1) yields a totalpotential of the form Vm(x) = Vl,m(x) + Vp,m(x) where
Vl,m(x) = −a−10
∫
dx′V (x − x′, y)∂x′dm(x′), (D4)
and
Vp,m(x) =2
a0
∫
dx′V (x − x′, y) cos[k0(x′ − dm)]. (D5)

26
A constant offset arising from the ’DC’part of the den-sity has been omitted in Eq.(D4) and in Eq.(D5) onlythe l = ±1 components of the density are taken intoaccount. The latter represents a quasi-periodic potentialwith wavelength ∼ a0. It is only significant for y . 1.5b0,i.e. for m = ±1, as in the pure case. Therefore Vp canbe written as
Vp = −[µ + δµ(x)] cos[k0(x − d)]/k0, (D6)
where d = (d1 + d−1)/2 and
δµ(x) =k0
a20
∫
dk[V (k+, b0) − V (k−, b0)]ikd(k)eikx
≃ π√
3µ∂xd, (D7)
where k± = k0 ± k and the second line is valid fork . 0.4k0. The local strains thus also provide varia-tions in the potential height. A similar conclusion holdswhen transverse shifts in the CE are included. In thesimulations the mean square strain is 〈(∇ · d)2〉 = ∆2/3and short range (∼ a0/2) correlated along x with cor-relator S(s, 0) ≡ 〈∂xd(x, y)∂xd(x + s, y′ = y)〉x ≃(∆2/3)e−(2s/a0)
2
. Accordingly, the amplitude fluctua-tions of the periodic potential are characterized by:
Γa(s) =〈δµ(x)δµ(x + s)〉x
k20
≃ (µ∆a0/2)2e−( 2sa0
)2 (D8)
The non-local contributions Eq.(D4) add up to a totalcontribution Vl =
∑
m 6=0 Vl,m in Vce. Vl thus originatesfrom strains within a region ∼ λ around the channel andwill be smooth on the scale a0 (we assume λ ≫ a0).Transforming the sum into an integral and using Eq.(D2),the correlator Γl = 〈Vl(x)Vl(x+s)〉 can be written as [67]:
Γl(s) =1
a40
∫
CE
dydy′∫
dxAy,y′(x)S(s − x, y′ − y),(D9)
The term Ay,y′(x) = (2π)−1∫
dkV (k, y)V (k, y′) cos(kx)can be approximated by
Ay,y′(x) ≃ U20 πλe−
|y|+|y′ |λ e−( x
λ )2 . (D10)
In case the strains are uncorrelated between the rowsS(x, y′ − y) ∼ exp(−(2(x2 + (y′ − y)2)/a2
0)) and Eq.(D9)can be approximated by
Γl(s) ≃ Cα∆2U20 (λ/a0)
1+αe−( sλ )2 , (D11)
with α = 1 and C1 ≃ 1. In case of uniform strains, S(x)is independent of y′ − y. Then again the correlator isgiven by the above formula, but with α = 2 and C2 =(4/3)π3/2.
To study the effect of the disorder on the pinning ofvortices inside the channel, we write the total energy asa sum of an elastic and a pinning term:
H(x, u) = Hel + Hp = a−10
∫
dxκ0
2(∂xu)2 + Hp.(D12)
The dispersion of the elastic constant has been neglectedand u represents the displacements of vortices inside thechannel. By writing the density of the chain as ρc(x, u) =a−10 [1−∂xu+
∑
l 6=0 cos(lk0(x−u))], the pinning term Hp
in Eq.(D12) can be expressed as:
Hp = a−10
∫
dx(Vp + Vl)(δρ(x, u) − ∂xu), (D13)
where only the lowest Fourier components of ρc are re-tained, i.e. δρ(x, u) = 2 cosk0(x − u). This expres-sion can be simplified as follows. Since we consider thelimit where ∂xu is nearly constant within a0, the cross-term of the quasi-periodic potential Vp and ∂xu can beneglected compared to the Vl(x)∂xu term. The prod-uct Vlδρ(x, u) is also oscillatory and can be neglected aswell [68]. The other remaining term Vp(x)δρ(x, u) canbe written as (µ(x)/k0) cos[k0(u − d)]. Shifting the ar-gument via k0(u − d) = k0u and writing u → u, anextra term κ0∂xd∂xu is generated in Hel in Eq.(D12)(and also u-independent terms which can be neglected).The total coupling to the strain ∂xu then consists ofVs ≡ Vl − κ0∂xd. The result for the total energy is
H = HSG −∫
dx
a0
[
δµ(x)
k0cos(k0u) − Vs(x)∂xu
]
.(D14)
The potential Vs has a correlator 〈Vs(x)Vs(x+s)〉 = Γs(s)which is characterized by
Γs(s) =16π2g2
3Γa(s) + Γl(s) +
2U0∆2λ
a0V (s, b0)(D15)
in which g = κ0/(2πµa0) and the last termarises from cross-correlations. In Eq.(D14), HSG =∫
dx[(κ0/2)(∂xu)2 − (µ/k0) cos(k0u)] is the original sine-Gordon energy functional of the pure model and the re-maining terms reflect the corrections due to disorder. Fi-nally, we denote the first correction, which is due to theamplitude fluctuations, as Ha and the second, couplingto the strain, as Hs.
For weak disorder, we can now calculate the ef-fect of disorder on a defect in the chain by assum-ing that the shape of a defect at x, ud(x
′ − x) =2a0 arctan[exp(±2π(x′ − x)/ld)]/π, is unchanged by dis-order [49]. The pinning energy of a defect due to theterm Ha is:
Ea(x) = (a0k0)−1
∫
dx′δµ(x′) cos(k0ud(x′ − x)).(D16)
The correlations of Ea are given by [67]:
〈Ea(x)Ea(x + s)〉 =1
a20
∫
dpAa(p)Γa(s − p), (D17)
where
Aa(p) =
∫
4(ld/2π)dx
cosh2(x) cosh2(x + p)≃ lde
−( 4pld
)2, (D18)
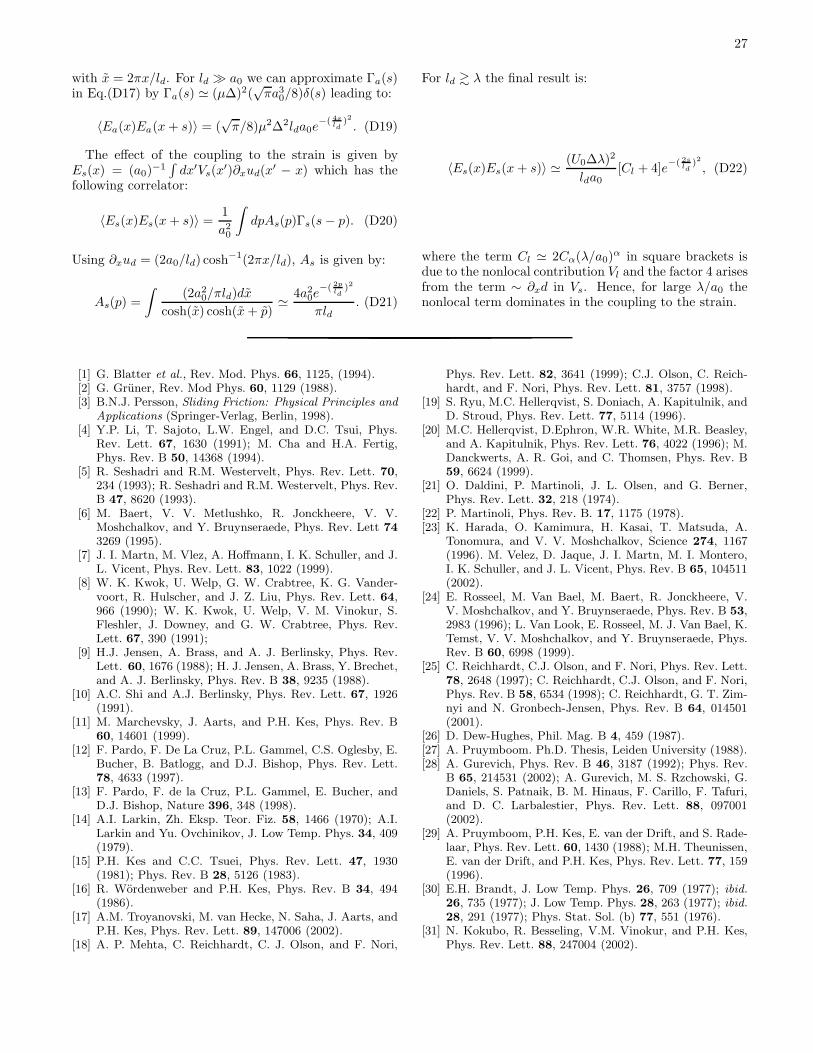
27
with x = 2πx/ld. For ld ≫ a0 we can approximate Γa(s)in Eq.(D17) by Γa(s) ≃ (µ∆)2(
√πa3
0/8)δ(s) leading to:
〈Ea(x)Ea(x + s)〉 = (√
π/8)µ2∆2lda0e−( 4s
ld)2
. (D19)
The effect of the coupling to the strain is given byEs(x) = (a0)
−1∫
dx′Vs(x′)∂xud(x
′ − x) which has thefollowing correlator:
〈Es(x)Es(x + s)〉 =1
a20
∫
dpAs(p)Γs(s − p). (D20)
Using ∂xud = (2a0/ld) cosh−1(2πx/ld), As is given by:
As(p) =
∫
(2a20/πld)dx
cosh(x) cosh(x + p)≃ 4a2
0e−( 2p
ld)2
πld. (D21)
For ld & λ the final result is:
〈Es(x)Es(x + s)〉 ≃ (U0∆λ)2
lda0[Cl + 4]e
−( 2sld
)2, (D22)
where the term Cl ≃ 2Cα(λ/a0)α in square brackets is
due to the nonlocal contribution Vl and the factor 4 arisesfrom the term ∼ ∂xd in Vs. Hence, for large λ/a0 thenonlocal term dominates in the coupling to the strain.
[1] G. Blatter et al., Rev. Mod. Phys. 66, 1125, (1994).[2] G. Gruner, Rev. Mod Phys. 60, 1129 (1988).[3] B.N.J. Persson, Sliding Friction: Physical Principles and
Applications (Springer-Verlag, Berlin, 1998).[4] Y.P. Li, T. Sajoto, L.W. Engel, and D.C. Tsui, Phys.
Rev. Lett. 67, 1630 (1991); M. Cha and H.A. Fertig,Phys. Rev. B 50, 14368 (1994).
[5] R. Seshadri and R.M. Westervelt, Phys. Rev. Lett. 70,234 (1993); R. Seshadri and R.M. Westervelt, Phys. Rev.B 47, 8620 (1993).
[6] M. Baert, V. V. Metlushko, R. Jonckheere, V. V.Moshchalkov, and Y. Bruynseraede, Phys. Rev. Lett 74
3269 (1995).[7] J. I. Martn, M. Vlez, A. Hoffmann, I. K. Schuller, and J.
L. Vicent, Phys. Rev. Lett. 83, 1022 (1999).[8] W. K. Kwok, U. Welp, G. W. Crabtree, K. G. Vander-
voort, R. Hulscher, and J. Z. Liu, Phys. Rev. Lett. 64,966 (1990); W. K. Kwok, U. Welp, V. M. Vinokur, S.Fleshler, J. Downey, and G. W. Crabtree, Phys. Rev.Lett. 67, 390 (1991);
[9] H.J. Jensen, A. Brass, and A. J. Berlinsky, Phys. Rev.Lett. 60, 1676 (1988); H. J. Jensen, A. Brass, Y. Brechet,and A. J. Berlinsky, Phys. Rev. B 38, 9235 (1988).
[10] A.C. Shi and A.J. Berlinsky, Phys. Rev. Lett. 67, 1926(1991).
[11] M. Marchevsky, J. Aarts, and P.H. Kes, Phys. Rev. B60, 14601 (1999).
[12] F. Pardo, F. De La Cruz, P.L. Gammel, C.S. Oglesby, E.Bucher, B. Batlogg, and D.J. Bishop, Phys. Rev. Lett.78, 4633 (1997).
[13] F. Pardo, F. de la Cruz, P.L. Gammel, E. Bucher, andD.J. Bishop, Nature 396, 348 (1998).
[14] A.I. Larkin, Zh. Eksp. Teor. Fiz. 58, 1466 (1970); A.I.Larkin and Yu. Ovchinikov, J. Low Temp. Phys. 34, 409(1979).
[15] P.H. Kes and C.C. Tsuei, Phys. Rev. Lett. 47, 1930(1981); Phys. Rev. B 28, 5126 (1983).
[16] R. Wordenweber and P.H. Kes, Phys. Rev. B 34, 494(1986).
[17] A.M. Troyanovski, M. van Hecke, N. Saha, J. Aarts, andP.H. Kes, Phys. Rev. Lett. 89, 147006 (2002).
[18] A. P. Mehta, C. Reichhardt, C. J. Olson, and F. Nori,
Phys. Rev. Lett. 82, 3641 (1999); C.J. Olson, C. Reich-hardt, and F. Nori, Phys. Rev. Lett. 81, 3757 (1998).
[19] S. Ryu, M.C. Hellerqvist, S. Doniach, A. Kapitulnik, andD. Stroud, Phys. Rev. Lett. 77, 5114 (1996).
[20] M.C. Hellerqvist, D.Ephron, W.R. White, M.R. Beasley,and A. Kapitulnik, Phys. Rev. Lett. 76, 4022 (1996); M.Danckwerts, A. R. Goi, and C. Thomsen, Phys. Rev. B59, 6624 (1999).
[21] O. Daldini, P. Martinoli, J. L. Olsen, and G. Berner,Phys. Rev. Lett. 32, 218 (1974).
[22] P. Martinoli, Phys. Rev. B. 17, 1175 (1978).[23] K. Harada, O. Kamimura, H. Kasai, T. Matsuda, A.
Tonomura, and V. V. Moshchalkov, Science 274, 1167(1996). M. Velez, D. Jaque, J. I. Martn, M. I. Montero,I. K. Schuller, and J. L. Vicent, Phys. Rev. B 65, 104511(2002).
[24] E. Rosseel, M. Van Bael, M. Baert, R. Jonckheere, V.V. Moshchalkov, and Y. Bruynseraede, Phys. Rev. B 53,2983 (1996); L. Van Look, E. Rosseel, M. J. Van Bael, K.Temst, V. V. Moshchalkov, and Y. Bruynseraede, Phys.Rev. B 60, 6998 (1999).
[25] C. Reichhardt, C.J. Olson, and F. Nori, Phys. Rev. Lett.78, 2648 (1997); C. Reichhardt, C.J. Olson, and F. Nori,Phys. Rev. B 58, 6534 (1998); C. Reichhardt, G. T. Zim-nyi and N. Gronbech-Jensen, Phys. Rev. B 64, 014501(2001).
[26] D. Dew-Hughes, Phil. Mag. B 4, 459 (1987).[27] A. Pruymboom. Ph.D. Thesis, Leiden University (1988).[28] A. Gurevich, Phys. Rev. B 46, 3187 (1992); Phys. Rev.
B 65, 214531 (2002); A. Gurevich, M. S. Rzchowski, G.Daniels, S. Patnaik, B. M. Hinaus, F. Carillo, F. Tafuri,and D. C. Larbalestier, Phys. Rev. Lett. 88, 097001(2002).
[29] A. Pruymboom, P.H. Kes, E. van der Drift, and S. Rade-laar, Phys. Rev. Lett. 60, 1430 (1988); M.H. Theunissen,E. van der Drift, and P.H. Kes, Phys. Rev. Lett. 77, 159(1996).
[30] E.H. Brandt, J. Low Temp. Phys. 26, 709 (1977); ibid.
26, 735 (1977); J. Low Temp. Phys. 28, 263 (1977); ibid.
28, 291 (1977); Phys. Stat. Sol. (b) 77, 551 (1976).[31] N. Kokubo, R. Besseling, V.M. Vinokur, and P.H. Kes,
Phys. Rev. Lett. 88, 247004 (2002).
28
[32] N. Kokubo, R. Besseling, and P.H. Kes, Phys. Rev. B69, 064504 (2004).
[33] R. Besseling, T. Drose, V. M. Vinokur and P. H. Kes,Europhys. Lett. 62, 419 (2003).
[34] G.J.C. van Baarle, A.M. Troianovski, T. Nishizaki, P.H.Kes and J. Aarts, Appl. Phys. Lett. 82, 1081 (2003).
[35] R. Besseling, R. Niggebrugge and P.H. Kes, Phys. Rev.Lett. 82, 3144 (1999).
[36] J. Frenkel, Z. Phys. 37, 572 (1926).[37] A.E. Koshelev and V.M. Vinokur, Phys. Rev. Lett. 73,
3580 (1994).[38] C.S. Owen and J. Scalapino, Phys. Rev. 164, 538 (1967).[39] M. Buttiker and R. Landauer, Phys. Rev. A. 23, 1397
(1981).[40] O.M. Braun and Yu.S. Kivshar, Phys. Rep. 306, 1
(1998).[41] M. Tinkham, Introduction to Superconductivity
McGRAW-HILL INTERNATIONAL EDITIONS,1996.
[42] O.M. Braun, Yu.S. Kivshar and I.I. Zelenskaya, Phys.Rev. B. 41, 7118 (1990); O.M. Braun and Y.S. Kivshar,Phys. Rev. B 50, 13388 (1994); S.F. Mingaleev, Y.B.Gaididei, E. Majernikova, and S. Shpyrko, Phys. Rev. E61, 4454 (2000).
[43] Practically, discreteness effects can be neglected for g &2. One can then also consider the regime λ/a0 . 1.The reduced stiffness is g = V ′′(x = a0)/V ′′
ce,0 where
V ′′(x = a0) ≃ (U0/λ2)√
πλ/(2x)e−x/λ(1 + λ/x) and V ′′ce
is obtained from the full (λ dependent) expression forVce,0 in App. A (Eq.(A3) and (A4)). The result is thatthe continuum approach is valid for λ/a0 & 0.3. For thefrequently occurring geometry of a vortex chain confinedby vortices pinned in a square array one can also estimatethe continuum regime. In this case one replaces (w+b0)/2in Eq.(8) by a0/2, yielding a periodic pinning force withµ ≃ 10µ. Correspondingly g ≃ λ/a0 and lattice dis-creteness is unimportant for λ/a0 & 2.
[44] T. Strunz and F. Elmer, Phys. Rev. E 58, 1601 (1998).[45] P. Ziswiler, V. Geshkenbein, and G. Blatter, Phys. Rev.
B 56, 416 (1997).[46] D. Cule and T. Hwa, Phys. Rev. B 57, 8235 (1998).[47] T. Giamarchi and P. Le Doussal, Phys. Rev. B 52, 1242
(1995).[48] B.A. Malomed, Phys. Rev. B 39, 8018 (1989).[49] V.M. Vinokur and A.E. Koshelev, Sov. Phys. JETP 70,
547 (1990).[50] M.V. Feigelman and V.M. Vinokur, Solid State Commu-
nications, 45, 595 (1983); ibid., 45, 599 (1983); V.M.Vinokur and M.B. Mineev, Sov. Phys. JETP 61 1073(1985).
[51] H. Fukuyama and P.A. Lee, Phys. Rev. B 17, 535 (1978);P.A. Lee and T.M. Rice, Phys. Rev. B 19, 3970 (1979);an early study of the competition between impurity andcommensurability pinning was reported in H. Fukuyama,J. Phys. Soc. Japan 45, 1474 (1978).
[52] L. Chen et al., Phys. Rev. B 54, 12798 (1996).[53] J. Krug, Phys. Rev. Lett. 75, 1795 (1995).[54] L. Balents and M.P.A Fisher, Phys. Rev. Lett. 75, 4270
(1995).[55] The convective term −γv∂xu ≃ −f∂xu arises naturally
when realizing that the driving force density on a ’string’segment is the product of f and the average vortex den-sity ∼ (1 − ∂xu), see also [46].
[56] C.R. Myers and J.P. Sethna, Phys. Rev. B 47, 11171(1993); D. Cule and T. Hwa, Phys. Rev. Lett. 77, 278(1996).
[57] A detailed study of the v-f curves at strong disordershowed that the friction force f − γv exhibited, besidesthe usual decrease on increasing v above threshold, ashallow minimum and then a weak increase when furtherincreasing v. These features did not depend on systemsize or simulation time step and varied little with com-mensurability. The observed behavior is in marked con-trast with analytical and numerical studies in standardCDW models, which find a correction f − γv ∝ v−1/2
at large velocity for a 1D system, see L. Sneddon, M.C.Cross, and D.S. Fisher, Phys. Rev. Lett. 49, 292 (1982)and also H. Matsukawa, J. Ph. Soc. Jap. bf 56, 1522(1987); 57 3463 (1988). The difference could arise fromthe additional u independent random force or the remain-ing (relatively small) commensurability pinning whichare present in our system, but absent in the previousstudies. This issue deserves further investigation.
[58] H. Fangohr, S. J. Cox, and P. A. J. de Groot, Phys. Rev.B 64, 064505 (2001).
[59] The data in Fig. 2 have been taken in a ’field down’experiment. Qualitatively similar data were obtained in’field cooled’ experiments and both data can be inter-preted in terms of strong edge disorder. The results of’field up’ measurements however are qualitatively differ-ent and indicate much weaker CE disorder in this case,see N. Kokubo et al., in preparation.
[60] A.B. Kolton, D. Dominguez, and N. Gronbech-Jensen,Phys. Rev. Lett. 83, 3061 (1999).
[61] For the numerical data, fs was obtained from a criterionγv/µ ≈ 0.025, i.e. γva0/U0 ≈ 0.001, while in the experi-ments a criterion v/a0 = 1 MHz was used for the criticalcurrent. The latter corresponds to a dimensionless cri-terion (v/a0)(γa2
0/U0) ≃ (v/a0)(20πµ0λ2Bc2/(
√3Bρ0))
where ρf ≃ 0.2Bρ0/Bc2 was used, with ρ0 the nor-mal resistivity and Bc2 the upper critical field. Takingλ = 1.1 µm, B ≃ 0.012(w/b0)
2 T for the channel systemunder investigation, Bc2 = 1.55 T and ρ0 = 2 µΩm,yields (v/a0)(γa2
0/U0) ≃ 3.4 · 10−9(v/a0)/(w/b0)2 =
3.4 ·10−3/(w/b0)2. Occasional checks using the latter cri-
terion however yielded results for fs and A/A0 essentiallythe same as in Figs. 25 and 30.
[62] There are several possible explanations for the discrep-ancy between Aexp and the numerical result for A. Theexperimental system consists of channels with walls offinite hight at the CE’s. Screening currents along thesewalls may cause the average distance between the firstmobile row and the first pinned rows to be larger thanthat in the simulation (where it is b0 at matching), lead-ing to an overall reduced value of the shear interaction.In addition, the precise amount of disorder in the ex-perimental system is unknown (imaging studies only ex-ist on related geometries and outside the relevant fieldregime, see B.L.T. Plourde, D.J. Van Harlingen, N. Saha,R. Besseling, M.B.S. Hesselberth, and P.H. Kes, Phys.Rev. B 66, 054529 (2002) and M.V. Marchevsky, Ph.D.Thesis, Leiden University (1997)). Further, differences inthe amount of longitudinal and transverse positional dis-order may exist. Finally, compared to the experiments,the simulations were performed for relatively small ratioλ/a0.
[63] In the experiments we found that the switching point
29
n → n ± 1 together with the maxima and minima inJs can be shifted to different magnetic field by chang-ing the field history. This implies a non-trivial relationbetween the effective width w and the physical channelwidth wetched, depending on the amount of screening cur-rents along the channel walls, see N. Kokubo, R. Bessel-ing and P.H. Kes, Physica C 412-414, 362 (2004).
[64] M.C. Faleski, M.C. Marchetti, and A.A. Middleton,Phys. Rev. B 54, 12427 (1996).
[65] R. Besseling, N. Kokubo and P.H. Kes, Phys. Rev. Lett.91, 17702 (2003).
[66] Note that this calculation neglects fluctuation effects athigh field.
[67] We employed the fact that for a function of the formR(x) =
∫
dx′f(±(x′ − x))g(x′) the correlator is given by〈RxRx+s〉 =
∫
dpAf(p)〈g(x)g(x + s ± p)〉 with Af (p) =∫
dx′f(x′)f(x′ + p).[68] One can calculate that the typical correction Eb,l to the
pin energy of a defect due to a ’backward’ scattering term∫
Vl(x) cos[k0(x−ud)] vanishes rapidly with increasing λ,
i.e. 〈E2b,l〉 ≃ U2
0 ∆2g1/2(λ/a0)2+αe−(πλ/a0)2 .
Copyright © 2022 FDOKUMEN