Deoxygenation of palmitic and stearic acid over supported Pd catalysts: Effect of metal dispersion
10
This article appeared in a journal published by Elsevier. The attached copy is furnished to the author for internal non-commercial research and education use, including for instruction at the authors institution and sharing with colleagues. Other uses, including reproduction and distribution, or selling or licensing copies, or posting to personal, institutional or third party websites are prohibited. In most cases authors are permitted to post their version of the article (e.g. in Word or Tex form) to their personal website or institutional repository. Authors requiring further information regarding Elsevier’s archiving and manuscript policies are encouraged to visit: http://www.elsevier.com/copyright
Transcript of Deoxygenation of palmitic and stearic acid over supported Pd catalysts: Effect of metal dispersion

This article appeared in a journal published by Elsevier. The attachedcopy is furnished to the author for internal non-commercial researchand education use, including for instruction at the authors institution
and sharing with colleagues.
Other uses, including reproduction and distribution, or selling orlicensing copies, or posting to personal, institutional or third party
websites are prohibited.
In most cases authors are permitted to post their version of thearticle (e.g. in Word or Tex form) to their personal website orinstitutional repository. Authors requiring further information
regarding Elsevier’s archiving and manuscript policies areencouraged to visit:
http://www.elsevier.com/copyright

Author's personal copy
Deoxygenation of palmitic and stearic acid over supported Pd catalysts:Effect of metal dispersion
Irina Simakova a,b, Olga Simakova a,b, Paivi Maki-Arvela b, Andrey Simakov c,Miguel Estrada d, Dmitry Yu. Murzin b,*a Boreskov Institute of Catalysis, Novosibirsk, Russiab Abo Akademi University, Process Chemistry Centre, FI-20500 Turku/Abo, Finlandc Centro de Nanociencias y Nanotecnologia, UNAM, Ensenada, B.C., 22800, Mexicod Posgrado en Fisica de Materiales, CICESE, Ensenada, B.C., 22800, Mexico
1. Introduction
Fatty acids and their esters are potential raw materials forproducing long chain, diesel-like hydrocarbons, which areindustrially manufactured in Finland and are known as secondgeneration biodiesel [1–6]. One of the possibilities to producehydrocarbons is to apply catalytic deoxygenation of fatty acids andtheir esters. Several active metals, such as Pd, Ni, Ru, Ir, Os, Rhsupported on silica, alumina, active carbon as well as some alloysand bimetallic catalysts have been studied [4] in this reaction. Themost promising catalyst reported in the literature has been Pd/C instearic acid deoxygenation at 300 8C under 17 bar under helium ina semibatch reactor [4] with selectivity of 95% to heptodecane atcomplete conversion. Besides stearic acid also other potentialfeedstocks, such as esters and unsaturated acids were investigatedin catalytic deoxygenation. The main reaction pathway indeoxygenation of fatty acids results in formation of one carbonshorter hydrocarbons compared to the acid. Other products aregaseous carbon monoxide and carbon dioxide. In case of esters thefirst reaction step is the formation of a corresponding fatty acid,thereafter the reaction proceeds analogously as for acids.
In the catalytic deoxygenation of fatty acids the effect of metalparticle size on activity, i.e. structure sensitivity, has not beenpreviously studied. In the current work the main aim was tosystematically study the effect of metal particle size and dispersionon catalytic deoxygenation of a mixture of palmitic and stearicacids. Four different Pd catalysts exhibiting different metaldispersions were investigated in this work. A synthetic mesopor-ous carbon, Sibunit, was applied as a support material, which ischaracterized by high mechanical strength, chemical and thermalstability, high purity and a controllable narrow pore sizedistribution [7].
2. Experimental
2.1. Experimental setup
The catalytic deoxygenation of stearic acid was performed in300 ml semibatch reactor. The reaction mixture containingtypically 0.1 M of a mixture of palmitic and stearic acids (Fluka,59 mol% palmitic and 40 mol% stearic acid), in dodecane wasinjected into the reactor containing 1 g of prereduced Pd/C catalyst(powder; size < 50 mm to avoid internal diffusion limitations). Theliquid phase volume was 50 ml. The reaction temperature wasvaried within 260–300 8C at pressure 17.5 bar. The flow of carriergas and reaction pressure inlet and outlet were controlled by a flow(Brooks 58505 S) and a pressure controllers (Brooks 5866),
Applied Catalysis A: General 355 (2009) 100–108
A R T I C L E I N F O
Article history:
Received 7 July 2008
Received in revised form 29 November 2008
Accepted 2 December 2008
Available online 9 December 2008
Keywords:
Deoxygenation
Fatty acid
Palladium
A B S T R A C T
Catalytic deoxygenation of palmitic and stearic acids mixture was studied over four synthesized Pd
catalysts supported on synthetic carbon (Sibunit) in a semibatch reactor and dodecane as a solvent at
260–300 8C. The catalysts were prepared by precipitation deposition method using Pd chlorides as metal
precursors. All catalysts contained 1 wt.% Pd, however, the metal dispersion was systematically varied.
An optimum metal dispersion giving the highest reaction rate was observed. The main liquid phase
products were n-heptadecane and n-pentadecane, which were formed in parallel. In addition to the
particle size effect the impact of mass transfer was elucidated and a detail discussion on temperature
programmed desorption of CO from the fresh and spent samples was provided.
� 2008 Elsevier B.V. All rights reserved.
* Corresponding author.
E-mail address: [email protected] (D.Yu. Murzin).
Contents lists available at ScienceDirect
Applied Catalysis A: General
journal homepage: www.e lsev ier .com/ locate /apcata
0926-860X/$ – see front matter � 2008 Elsevier B.V. All rights reserved.
doi:10.1016/j.apcata.2008.12.001
Author's personal copy
respectively. The stirring speed was maintained suitably high, at1100 rpm, to prevent external mass transfer limitation. Prior to thecatalytic test the catalysts were reduced in situ by hydrogen flow atpressure 4.8 bar according to the following temperature program:10 8C/min—60 8C, hold 1 h, 10 8C/min—300 8C. In the experimentsat lower temperatures the temperature profile for reduction wasthe same, but after the reduction the operating temperature wasestablished. Thereafter, the hydrogen was replaced by the mixtureof 5 vol.% H2 and 95 vol.% Ar, reaction pressure was increased till17.5 bar and the reaction commenced via turning on the stirrer.Reaction atmosphere gas was passed during decarboxylationthrough the reactor with 25 ml/min. After the reaction, the catalystparticles were filtered and washed with dodecane and acetone forfurther characterization.
2.2. Product analysis
Liquid phase samples were withdrawn from the reactor anddissolved in pyridine. Thereafter, the samples were silylated withN,O-bis(trimethyl)-trifluoroacetamide, BSTFA in order to analyze by
GC. Generally 100 wt.% excess of BSTFA compared to the acidconcentration was added to the sample. The silylation wasperformed in an oven at 60 8C for 1 h. The internal standard eicosane,C20H42 was added for quantitative calculations. The samples wereanalyzed with a gas chromatograph (GC, HP 6890) equipped withDB-5 column (60 m� 0.32 mm� 0.5 mm) and a flame ionizationdetector. 1 ml sample was injected into the GC with split ratio of 50:1,and the carrier gas (helium) flow rate was 137 ml/min. The injectorand detector temperature were 265 and 290 8C, respectively. Thefollowing temperature program was used for analysis: 130 8C, 169 8C(1 8C/min) hold for 5 min, 246 8C (5 8C/min), 250 8C (1 8C/min) holdfor 1 min and 300 8C (10 8C/min) hold for 10 min. The chromato-graphic pressure program was well-adjusted to achieve satisfactoryseparation of the desired product. The initial pressure at 1.7 bar waskept for 30 min, thereafter, the pressure was ramped with 0.34 bar/min until reaching the final pressure 2.2 bar and then pressure washold at this value for 64 min. The gas chromatographic method wascalibrated using the following chemicals: n-pentadecane (Acros,99%), n-heptadecane (Acros, 99%). The product identification wasvalidated with a gas chromatograph–mass spectrometer (GC–MS).
Table 1Metal dispersion and Pd particle size determined by CO chemisorption.
Catalyst Metal dispersion
fresh (%)
Pd particle size
fresh (nm)
BET specific surface
area of the spent
catalysta (m2/g)
Metal dispersion
spent (%)
Pd particle size
spent (nm)
1 wt.%/Pd/C (Sibunit) (A) 18 6.0 318 n.m. n.m.
1 wt.%/Pd/C (Sibunit) (B) 47 2.3 366 40 2.8
1 wt.%/Pd/C (Sibunit) (C) 65 1.7 n.m. n.m. n.m.
1 wt.%/Pd/C (Sibunit) (D) 72 1.5 370 7.7 14.6
a BET specific surface area of the fresh catalyst �379 (m2/g).
Fig. 1. TEM images of catalyst samples (a) A spent, (b) B spent, (c) C fresh, and (d) D fresh.
I. Simakova et al. / Applied Catalysis A: General 355 (2009) 100–108 101

Author's personal copy
2.3. Catalyst preparation and characterization
Four different Pd/C catalysts supported on Sibunit wereprepared by deposition of palladium hydroxide yielded byhydrolysis of palladium chloride at pH 8–10 [8]. The differentmetal dispersions can be achieved by changing the pH of thepalladium hydroxide solution [9].
HRTEM images were acquired on JEM 2010 (JEOL, Japan) withresolution 0.14 nm at accelerated voltage 200 kV. The histogramson the particle size distribution were calculated according tostandard method with 150,000-fold image upscaling. Metaldispersion was measured also by CO chemisorption usingAutochem 2910 apparatus (Micromeritics). The catalysts werereduced with the same temperature program as used in catalyticexperiments (see above). After reduction at 300 8C the adsorbedhydrogen was removed by flushing the catalyst with helium for
60 min. Thereafter the catalyst was cooled to room temperatureand CO pulses were introduced on the catalyst surface by using10 vol% CO in helium (AGA). The stoichiometry for Pd:CO wastaken to be unity [10].
Temperature programmed reduction (TPR) of catalysts wereperformed using 10% hydrogen in Ar and helium as follows: (1)catalyst pretreatment in helium flow with the following tempera-ture programme: 10 8C/min—60 8C (1 h) and thereafter it wascooled to room temperature, (2) catalyst reduction with a flow of50 ml/min of a gas mixture containing 10 vol.% hydrogen in argonand helium at temperature increase up to 300 8C with ramp 10 8Cper min. Thereafter, the sample was cooled to room temperature inhelium flow. After reduction CO was adsorbed using 1 vol.% CO inhelium at room temperature until saturation level was confirmedwith mass spectrometry. It was followed by CO TPD performed inhelium flow with the following temperature programme: 20 8C/
Fig. 2. The histograms on Pd particle size distribution based on TEM images for the following catalysts: (a) A spent, (b) B spent, (c) C fresh, and (d) D fresh.
Table 3TPR data, in parenthesis there is the temperature for maximum H2 uptake.
Catalyst H2 (mmol/g)
(total)
H2 (mmol/g)
(after 250 s)
Peak I
(mmol/g)
Peak II
(mmol/g)
Peak III
(mmol/g)
A (fresh) 18% 337a 136 201 (24) 114 (65) 22 (234)
B 47% n.m. n.m. n.m. n.m. n.m.
C (fresh) 65% 269 214 55 (25) 162 (76) 52 (200)
D (fresh) 72% 212b 191 21 (25) 56 (82) 135 (196)
a H2 desorption at 47 8C, 21 mmol/g.b H2 desorption at 51 8C, 8 mmol/g.
Table 2Pd particle size determined by CO chemisorption and by TEM analysis.
Name in
paper
State dCO (Pd), nm Pd particle
size determined by CO
chemisorption
dTEM (Pd), nm Pd particle
size determined by
TEM, mean
A Spent 6.2 6.1
B Spent 2.8 3.1
C Fresh 1.7 2.3
D Fresh 1.6 2.8
I. Simakova et al. / Applied Catalysis A: General 355 (2009) 100–108102
Author's personal copy
min—500 8C. All gases used in this study were of UHP grade. Themass spectrometer used in this study was HP-20 (Hiden) and thequantification was made by known gas mixtures.
Diffraction patterns were obtained on a URD-6 diffractometer(Cu Ka radiation, l = 1.5418 A) in the scan mode in a 2u range of10–908 with 0.058 increments and a counting time of 10 s perpoint. The PCPDF and ICSD databases were used to identifycrystalline phases. Unit cell parameters were determined with anaccuracy of �0.005 A.
The BET specific surface area of the support was measured bynitrogen adsorption using Carlo Erba Sorptomatic 1900.
3. Results and discussion
3.1. Catalyst characterization results
The BET specific surface area of the used support, Sibunit, was411 m2/gcat.. The BET specific surface area of the fresh B catalystwas 379 (m2/g). The specific surface areas of three spent catalysts,i.e. catalyst A, B and D were also determined by nitrogenadsorption in order to evaluate if coking is one of the possiblereasons for catalyst deactivation (Table 1). The BET specific surfacearea of spent catalysts A and D decreased by 23 and 10%,respectively, indicating the catalytic activity remained high for thelatter catalyst compared to the former one after prolonged reactiontimes (see Section 3.3).
Since the aim of this study is to find out the effect of active metalparticle size (dispersion) on the catalytic properties in decarbox-ylation reaction (if the effect in principle appears in this reactionfor palladium) the method of Pd particle size determination has tobe reliable. According to CO chemisorption data the metaldispersions of the catalysts are varying in a range of 18–72%depending first on the pH of the precipitation and second on the
aging time of the solution containing PdCl2 and Na2CO3 (Table 1).The lowest metal dispersion obtained for catalyst A was achieved,when the above mentioned aging time for PdCl2 and Na2CO3
solution was long enough prior to be mixed with the carbonpowder. In that case Pd polyhydroxy species are formed [9].
HRTEM images for the selected samples A (spent), B (fresh andspent), C (fresh) and D (fresh) and presented in Fig. 1. The sample A(spent) has a wide size distribution with a maximum at 3–4 nm,showing also a substantial amount of large palladium particlesgenerated through sintering. The sample B (spent) has a narrowsize distribution with a maximum at 2–3 nm, also there are a veryfew aggregates with size above 10 nm. The sample C (fresh) has anarrow size distribution with a maximum at 2–3 nm, there arevery few particles with size above 10 nm. The sample D (fresh) hasa narrow size distribution with a maximum at 1–2 nm, also thereare a very few aggregates with size above 10 nm.
The histograms on the particles distributions in these selectedsamples are built towards a represented selection of particles
Table 4Data from temperature programmed desorption of CO. The total amount of CO
desorbed, the amount of linearly bound CO, the amount of bridged CO, in
parenthesis the temperature for maximum CO desorption.
Catalyst CO mmol/g
(total)
CO mmol/g
(linear)
CO mmol/g
(bridged)
Ratio between CO
(bridged) to CO
(linear)
A (fresh) 18% 23 10 (92, 202) 13 (428, 494) 1.3
A (spent) 54 6 (92) 48 (370, 500) 8.0
B (fresh) 47% n.m. n.m. n.m. n.m.
B (spent) 39 27 (99, 187) 12 (500) 0.44
C (fresh) 65% 52 30 (90, 170) 22 (377, 496) 0.73
C (spent) 45 22 (80, 175) 23 (371, 452) 1.0
D (fresh) 72% 79 56 (90, 197) 23 (370) 0.41
D (spent) 43 18 (85, 180) 25 (376, 486) 1.4
Fig. 3. TPR of fresh catalyst with hydrogen (a) catalyst A (D = 18%), (b) catalyst C (D = 65%) and (c) catalyst D (D = 72%).
I. Simakova et al. / Applied Catalysis A: General 355 (2009) 100–108 103
Author's personal copy
(from 635 to 865 depending on the catalyst sample) (Fig. 2). Thevalues of the mean size were determined and presented in Table 2.It should be noted that CO chemisorption data were in goodagreement for the samples with low dispersion (A and B), but differfrom each other for samples with small particles (C and D).Obviously the samples C and D contain small particles with sizesbelow HRTEM detection limit. At the same time these particles areaccessible for CO adsorption and were taken into account forcalculation of the average particle size. The difference between Pdparticle size obtained by CO chemisorption and by TEM forcatalysts C and D could be explained by the fact that the largeportion of Pd particles in these catalysts is outside of the TEMdetection limit.
It is well known that heterogeneous catalytic steps proceedover accessible atoms. From this point of view the method of COchemisorption is quite representative to be considered as aninformative one for finding correlations between catalytic proper-ties and particle size.
Note that according to the TEM and CO chemisorption thecatalysts C and D have the same particle size and particle sizedistribution. However, these catalysts exhibit rather differentcatalytic activity in decarboxylation reaction which indicates thatin addition to the particle size per se other parameters of Pd speciescan influence the catalytic activity. In order to reveal the nature ofPd species TPR analysis was applied.
The data obtained by TPR are presented in Table 3 and in Fig. 3.It should, however, be noted that the peaks for hydrogenconsumption are not related to metallic palladium, but for Pd
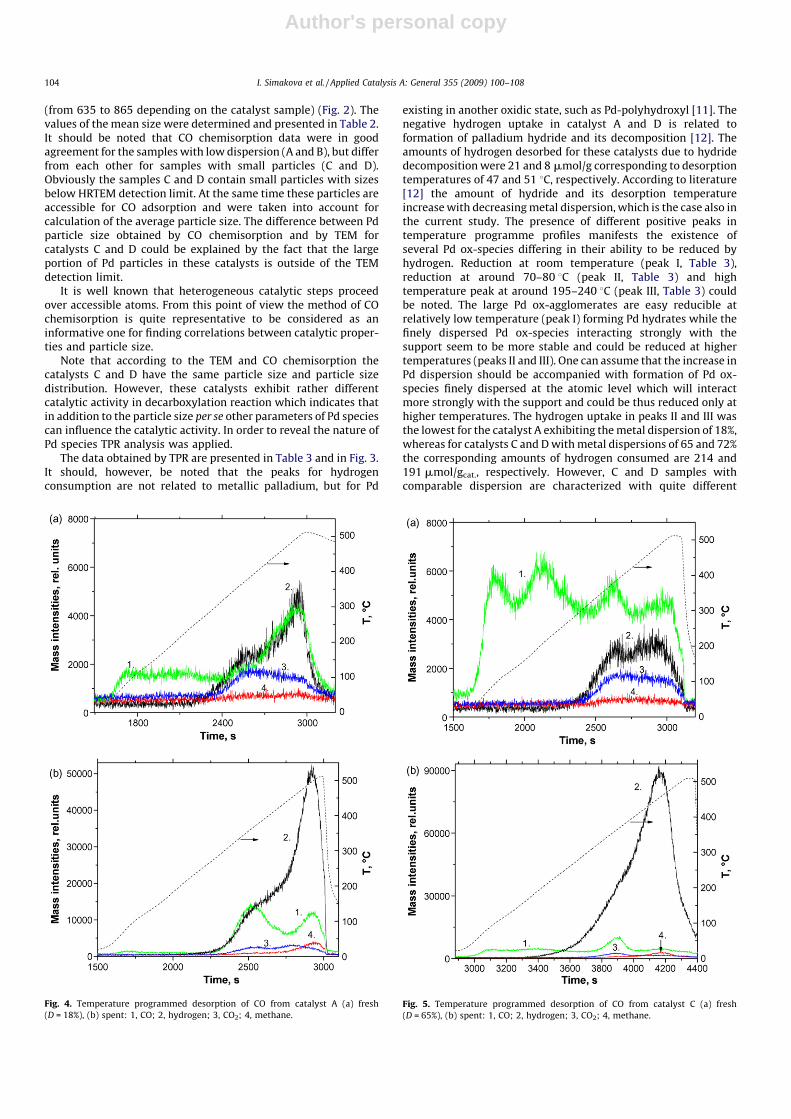
existing in another oxidic state, such as Pd-polyhydroxyl [11]. Thenegative hydrogen uptake in catalyst A and D is related toformation of palladium hydride and its decomposition [12]. Theamounts of hydrogen desorbed for these catalysts due to hydridedecomposition were 21 and 8 mmol/g corresponding to desorptiontemperatures of 47 and 51 8C, respectively. According to literature[12] the amount of hydride and its desorption temperatureincrease with decreasing metal dispersion, which is the case also inthe current study. The presence of different positive peaks intemperature programme profiles manifests the existence ofseveral Pd ox-species differing in their ability to be reduced byhydrogen. Reduction at room temperature (peak I, Table 3),reduction at around 70–80 8C (peak II, Table 3) and hightemperature peak at around 195–240 8C (peak III, Table 3) couldbe noted. The large Pd ox-agglomerates are easy reducible atrelatively low temperature (peak I) forming Pd hydrates while thefinely dispersed Pd ox-species interacting strongly with thesupport seem to be more stable and could be reduced at highertemperatures (peaks II and III). One can assume that the increase inPd dispersion should be accompanied with formation of Pd ox-species finely dispersed at the atomic level which will interactmore strongly with the support and could be thus reduced only athigher temperatures. The hydrogen uptake in peaks II and III wasthe lowest for the catalyst A exhibiting the metal dispersion of 18%,whereas for catalysts C and D with metal dispersions of 65 and 72%the corresponding amounts of hydrogen consumed are 214 and191 mmol/gcat., respectively. However, C and D samples withcomparable dispersion are characterized with quite different
Fig. 5. Temperature programmed desorption of CO from catalyst C (a) fresh
(D = 65%), (b) spent: 1, CO; 2, hydrogen; 3, CO2; 4, methane.
Fig. 4. Temperature programmed desorption of CO from catalyst A (a) fresh
(D = 18%), (b) spent: 1, CO; 2, hydrogen; 3, CO2; 4, methane.
I. Simakova et al. / Applied Catalysis A: General 355 (2009) 100–108104
Author's personal copy
behaviour in high temperature reduction (peaks II and III). Theslight increase in Pd dispersion results in a dramatic change of peakII/peak III ratio. Obviously, there are different Pd finely dispersedox-species due to difference in the preparation of the samples.
CO desorption was studied for the fresh and spent catalysts(Table 4, Figs. 4–6). Collected data provided information aboutdifferent adsorption sites and modes of CO adsorption on Pd. Thereexists both linear and bridged bonded CO on Pd according to [13],where these two adsorption modes have been identified with FTIRspectroscopy. The adsorbed CO species below 327 8C are inter-preted to be as linear bonded, whereas the species found above thistemperature exist in bridged bonded form. Furthermore it wasinterpreted that on Pd/Al2O3 two linear bonded CO stated withpeak maximum at 170 and 233 8C correspond to Pd(1 0 0) andPd(1 1 1), respectively, whereas the bridged bonded CO speciesexhibiting a temperature maximum at 428 8C corresponded toPd(1 1 1) [13]. As well known it is not so easy to investigate carbonsupported metal catalysts by IRS because of strong IR absorption ofcarbon. On the other hand CO interactions with Pd planessupported on different oxides do not differ much. It can be thussupposed that these interactions do not strongly depend on thesupport and can be approximately the same for Pd on a carbonsupport.
In the current case the total adsorption of CO correlated wellwith the metal dispersion determined by pulse chemisorptionmeasurements, when comparing Table 4 with Table 1. Themaximum temperature for CO desorption was lower for Pd
supported on mesoporous carbon than for Pd/Al2O3 in [14],however, these differences can be explained by the differences inPd support mutual interactions for carbons and alumina. Theamounts of linear and bridged bonded desorbed CO as well as theratio between linear to bridged bonded CO were calculated andgiven in Table 4. It can be seen that for the fresh catalysts thefraction of linear bonded CO decreased with decreasing metaldispersion.
During CO desorption also desorption of carbon dioxide,methane and hydrogen occurred. These compounds are formedand desorbed due to disproportionation of CO at low temperaturesaccording to Boudouard reaction
2CO ! CO2þCðsÞ (1)
and furthermore at high temperatures water–gas shift reactiontakes place when CO reacts with surface hydroxyl groups [14]according to
2CO þ 2OHs ! 2CO2þH2 (2)
The two low temperature maxima for CO desorption at 170 and233 8C for Pd/Al2O3 were interpreted to correspond to linearbonded CO on Pd(1 0 0) and Pd(1 1 1), respectively [14]. Whenanalogous interpretation corresponding to Pd(1 0 0) and Pd(1 1 1)was applied for Pd/C Sibunit catalysts for the desorbed CO at about80–90 8C and about 175–200 8C (Table 4) it was observed the ratiobetween Pd(1 0 0) to Pd(1 1 1) in linear bonded CO decreased inthe following order: catalyst D (0.33) > catalyst C (0.30) > catalyst
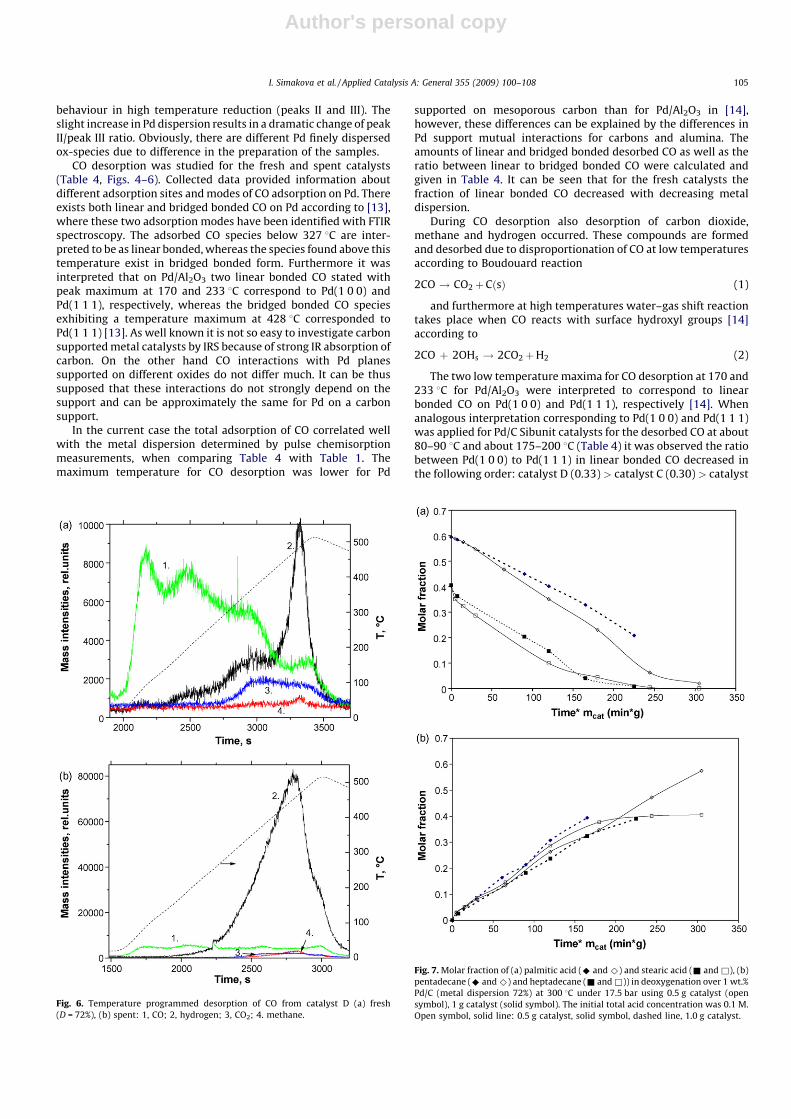
Fig. 6. Temperature programmed desorption of CO from catalyst D (a) fresh
(D = 72%), (b) spent: 1, CO; 2, hydrogen; 3, CO2; 4. methane.
Fig. 7. Molar fraction of (a) palmitic acid (^ and ^) and stearic acid (& and &), (b)
pentadecane (^ and ^) and heptadecane (& and &)) in deoxygenation over 1 wt.%
Pd/C (metal dispersion 72%) at 300 8C under 17.5 bar using 0.5 g catalyst (open
symbol), 1 g catalyst (solid symbol). The initial total acid concentration was 0.1 M.
Open symbol, solid line: 0.5 g catalyst, solid symbol, dashed line, 1.0 g catalyst.
I. Simakova et al. / Applied Catalysis A: General 355 (2009) 100–108 105
Author's personal copy
A (0.20) indicating that the amount of Pd(1 0 0) increased withincreasing dispersion. This result is in accordance with literature[14]. Additionally it was stated in [13] that CO dissociation isenhanced over Pd(1 0 0) faces with low coordination sites. COdissociation according to Eq. (2) can be studied by calculating theamount of hydrogen desorbed, which decreases as follows:catalyst D (1.9) > catalyst A (1.1) > catalyst C (1.0). This resultconfirmed indirectly the high number of Pd(1 0 0) sites in thecatalyst D.
CO desorption was studied for the spent catalysts as well. Thedesorbed CO was 2.6-fold for the spent catalyst D compared to thefresh one. The amount of desorbed CO decreases for other spentcatalysts, except for the catalyst A (Table 4, Fig. 4). This result wouldsuggest that desorbed CO from the spent catalyst can originate alsofrom other carbon containing compounds on the catalyst surface.The amount of bridged bonded CO has increased in the spent catalystA 3.7-fold compared to the fresh one (Table 4), whereas for the othermeasured spent catalyst the amount of bridged bonded CO wasapproximately constant. The bridged bonded CO is associatedaccording to [14] with Pd(1 1 1), whereas the linear bonded COcorresponds to both Pd(1 0 0) and Pd(1 1 1) faces [14]. The ratiobetween bridged to linear bonded CO was calculated and for thefresh catalyst an analogous inverse relationship between the metaldispersion and the relative amount of bridged bonded CO faces [14]was obtained indicating that there are more Pd(1 1 1) species in thecatalysts exhibiting low metal dispersion. Catalyst A with dispersionof 18% deactivated extensively under deoxygenation conditions (seeSection 3.3). The high hydrogen amount desorbed suggests theenhanced CO dissociation on the spent catalyst. There can, however,
be also other effects for hydrogen formation and desorption from thespent catalysts, like dehydrogenation of organic compounds on thespent catalyst surface at high temperatures, which could increasethe amount of desorbed hydrogen.
It should be noted that from TPR results all the samples werereduced completely at 300 8C, which is in agreement with XRDanalysis (not shown), revealing presence of only Pd0 in the reducedsamples.
3.2. Effect of gas/liquid transfer limitations
The effect of gas/liquid mass transfer limitations was studied inpalmitic and stearic acid deoxygenation by using two differentcatalysts amounts, 0.5 and 1 g, respectively 1 wt.% Pd/C (Sibunit)with the metal dispersion of 72%. The molar fractions of palmiticand stearic acid were plotted as a function of normalized abscissa,i.e. time multiplied by the catalyst mass (Fig. 7a). If the two kineticcurves are coinciding, gas to liquid mass transfer limitations couldbe excluded. At the beginning of the reaction two kinetic curves infact coincided. After prolonged reaction times, however, it can beseen that with 1 g of catalyst the catalyst deactivation was lessprominent compared to 0.5 g and the corresponding conversionlevels after 300 min reaction time, were 45 and 98%, respectively.Thus catalyst load of 1 g was further used for investigation theeffect of metal dispersion (see Section 3.3).
The main products in the liquid phase were n-heptadecane and n-pentadecane and their selectivity from respective acids was veryclose to 100%. These products were formed in a parallel fashion(Fig. 7b).
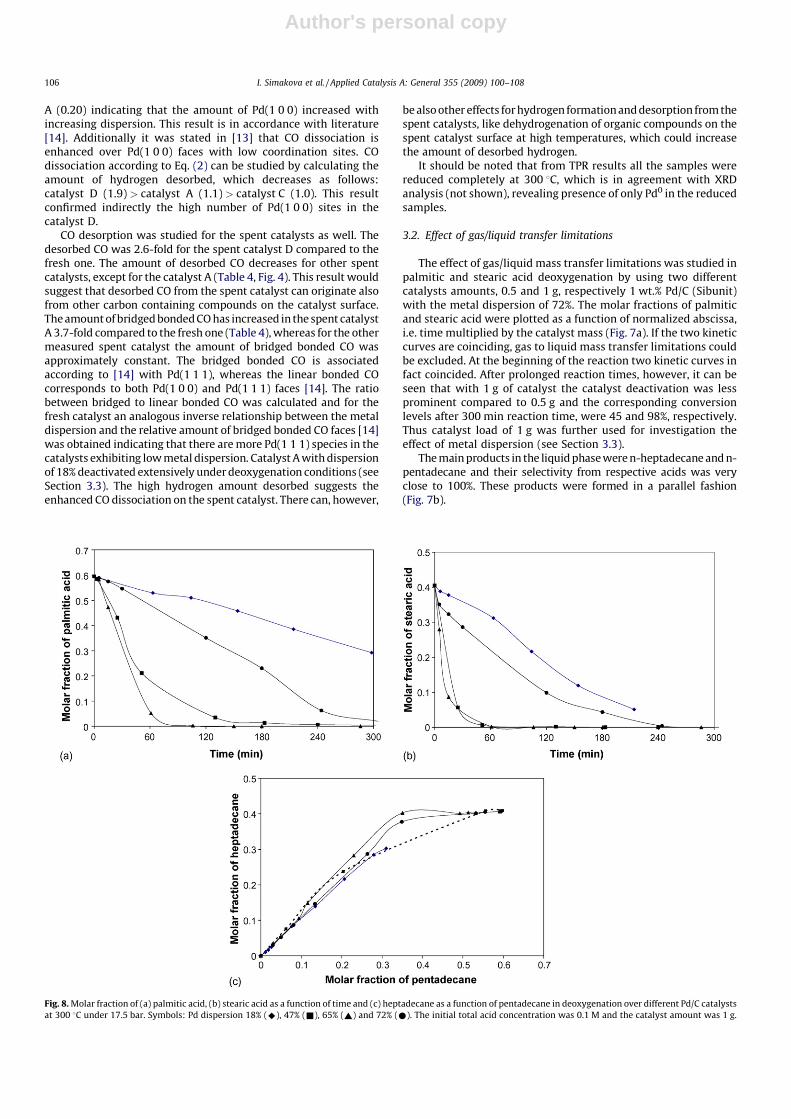
Fig. 8. Molar fraction of (a) palmitic acid, (b) stearic acid as a function of time and (c) heptadecane as a function of pentadecane in deoxygenation over different Pd/C catalysts
at 300 8C under 17.5 bar. Symbols: Pd dispersion 18% (^), 47% (&), 65% (~) and 72% (*). The initial total acid concentration was 0.1 M and the catalyst amount was 1 g.
I. Simakova et al. / Applied Catalysis A: General 355 (2009) 100–108106
Author's personal copy
3.3. Influence of metal dispersion
Four different Pd/C (Sibunit) catalysts with 1 wt.% Pd loading,but different Pd dispersions, were tested in palmitic and stearicacid deoxygenation at 300 8C under 17.5 bar H2/Ar (Fig. 8a and b).The initial reaction rates over different catalysts (Table 5) showedthat there was a maximum obtained for the catalyst withdispersion of 65%. When comparing the reaction rates for palmitic
and stearic acid it can be seen that they reacted with about thesame rates. This result could be expected; assuming thatdeoxygenation of fatty acids should be independent on the carbonchain length, e.g. on carbon and hydrogen atoms located rather farfrom the reactive center. The hydrocarbon chain can be consideredas an inert part of the molecule, whereas the carboxylic group infatty acid is adsorbed on the metal being in close vicinity of thesupport.
After prolonged reaction times, however, the catalysts withdispersion of 47 and 65% exhibited similar high activity (Fig. 8a).The conversion levels after 300 min of reaction time decreasedover different Pd/C catalysts as follows: Pd/C (D = 47%) � Pd/C(D = 65%) > Pd/C (D = 72%) > Pd/C (D = 18%) (Table 5). The Pdparticle size in the catalyst with 18% dispersion being 6 nm wasprobably too large to be enough active (Table 1). On the other handsample D is characterized by the presence of large Pd particles andextremely highly dispersed Pd species according to TPR data. Thehighly dispersed Pd species in the sample D seem to be not
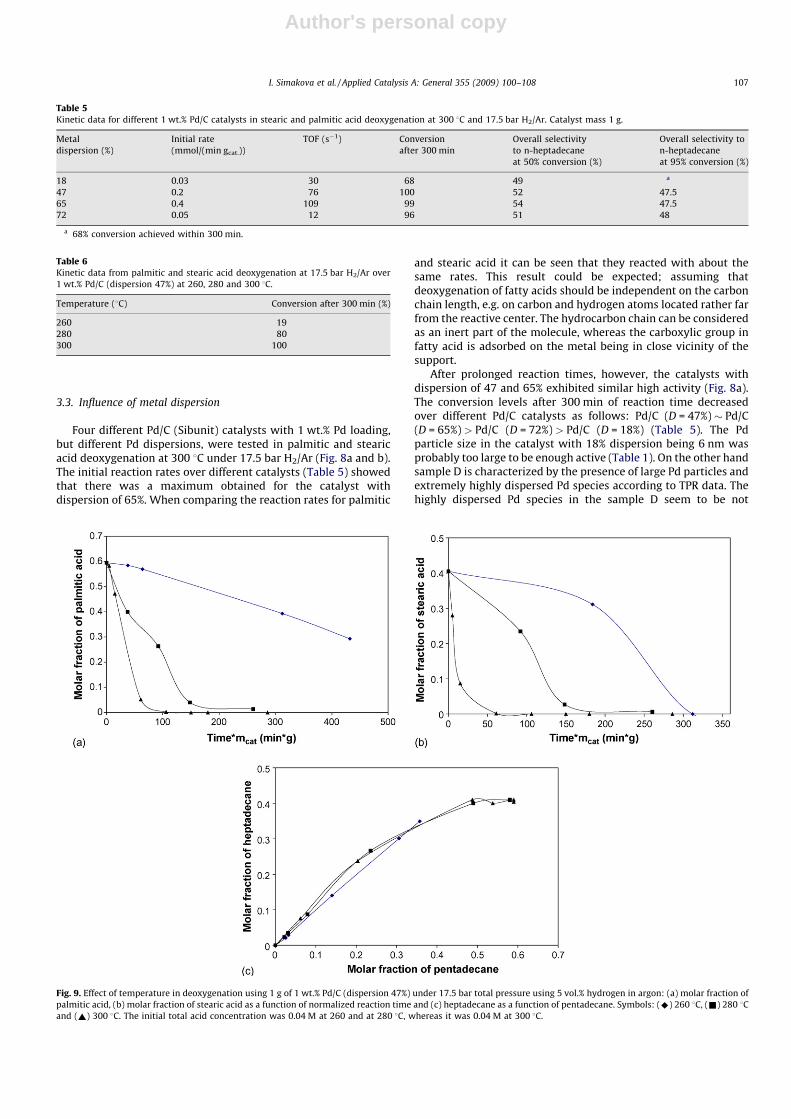
Fig. 9. Effect of temperature in deoxygenation using 1 g of 1 wt.% Pd/C (dispersion 47%) under 17.5 bar total pressure using 5 vol.% hydrogen in argon: (a) molar fraction of
palmitic acid, (b) molar fraction of stearic acid as a function of normalized reaction time and (c) heptadecane as a function of pentadecane. Symbols: (^) 260 8C, (&) 280 8Cand (~) 300 8C. The initial total acid concentration was 0.04 M at 260 and at 280 8C, whereas it was 0.04 M at 300 8C.
Table 5Kinetic data for different 1 wt.% Pd/C catalysts in stearic and palmitic acid deoxygenation at 300 8C and 17.5 bar H2/Ar. Catalyst mass 1 g.
Metal
dispersion (%)
Initial rate
(mmol/(min gcat.))
TOF (s�1) Conversion
after 300 min
Overall selectivity
to n-heptadecane
at 50% conversion (%)
Overall selectivity to
n-heptadecane
at 95% conversion (%)
18 0.03 30 68 49 a
47 0.2 76 100 52 47.5
65 0.4 109 99 54 47.5
72 0.05 12 96 51 48
a 68% conversion achieved within 300 min.
Table 6Kinetic data from palmitic and stearic acid deoxygenation at 17.5 bar H2/Ar over
1 wt.% Pd/C (dispersion 47%) at 260, 280 and 300 8C.
Temperature (8C) Conversion after 300 min (%)
260 19
280 80
300 100
I. Simakova et al. / Applied Catalysis A: General 355 (2009) 100–108 107
Author's personal copy
sufficiently active because of their strong interactions with thesupport resulting in the changes of Pd metal structure required foreffective deoxygenation of stearic and palmitic acids. Note that theaverage particle size for samples D and C is close to each other.However, the sample C is characterized by higher level of catalyticactivity in comparison with sample D. According to TPR data the Pdparticle size distribution in the sample C is more uniform with theaverage size of particles and their surface structure required foreffective deoxygenation of fatty acids.
Two products, heptadecane and pentadecane, were formedparallel in the deoxygenation of palmitic and stearic acid over allPd/C (Sibunit) catalysts (Fig. 8c). The change in metal dispersionaffected thus only the deoxygenation rate, but not the productdistribution. This result confirmed the reaction pathway, in whicha hydrocarbon exhibiting one carbon less than the correspondingacid was formed from both acids.
3.4. Effect of temperature
Three different reaction temperatures, 260, 280 and 300 8Cwere utilized in deoxygenation of stearic and palmitic acidmixtures using 1 wt.% Pd/C (dispersion 47%) as a catalyst(Table 6, Fig. 7). The catalyst to acid mass ratio was 0.63, and ahigher initial total acid concentration was used in the experimentperformed at 300 8C.
The kinetic plots for palmitic and stearic acid transformationsusing different amounts of catalysts are shown in Fig. 9a and b as afunction of normalized abscissa, time multiplied by catalyst mass.It can be seen that at 260 8C the reaction was much slower than athigher temperatures. The complete conversion of palmitic acid wasachieved at 110 min gcat. at 300 8C, whereas at 260 8C only ca. 50%conversion of palmitic acid was obtained. Analogous trends wereobserved for stearic acid transformation (Fig. 9b).
The only liquid phase products were heptadecane andpentadecane (Fig. 9c), which were formed in a parallel fashionindependent on temperature.
4. Conclusions
Four different 1 wt.% Pd/C catalysts supported on syntheticmesoporous carbon (Sibunit) with different metal dispersionwere prepared, characterized and tested in deoxygenation ofstearic acid and palmitic acid mixture at 260–300 8C under overallpressure of 17.5 bar of 5 vol% of hydrogen in helium. The mainliquid phase products were heptadecane and pentadecane beingformed in a parallel mode. Additionally the fresh and spent
catalysts were characterized by nitrogen adsorption, hydrogenTPR and CO TPD techniques in order to reveal the catalyticallyactive sites.
An optimum metal dispersion was found, which was giving thehighest catalytic activity in palmitic and stearic acid deoxygena-tion. One can expect that large Pd particles in a sample A are notenough active due to their relatively small surface area. On theother hand highly dispersed Pd species in a sample D are notsufficiently active because of their strong interactions with thesupport resulting in the changes of Pd metal structure required foreffective deoxygenation of stearic and palmitic acids. The presenceof small Pd particles in the samples B and C provides enough highsurface concentration of active Pd atoms in the proper metalstructure.
Acknowledgements
This work is part of activities at the Abo Akademi ProcessChemistry Centre of Excellence Programmes (2000–2011) financedby the Academy of Finland. The work was partly supported byDGAPA-PAPIIT (UNAM, Mexico) through grant N 120706-3. Thepart of research work was supported by RFBR Grant No. 07-03-12159.
References
[1] D.Yu. Murzin, I. Kubickova, M. Snare, P. Maki-Arvela, J. Myllyoja, Method for themanufacture of hydrocarbons. PCT International Application WO2006-FI50031,2006.
[2] I. Kubickova, M. Snare, K. Eranen, P. Maki-Arvela, D.Y. Murzin, Catal. Today 106(2005) 197.
[3] P. Maki-Arvela, I. Kubickova, K. Eranen, M. Snare, D.Y. Murzin, Energy Fuels 21(2007) 30.
[4] M. Snare, I. Kubickova, P. Maki-Arvela, K. Eranen, D.Y. Murzin, Ind. Eng. Chem. Res.45 (2006) 5708.
[5] M. Snare, I. Kubickova, P. Maki-Arvela, K. Eranen, J. Warna, Yu. Murzin, Chem. Eng.J. 134 (2007) 29.
[6] M. Snare, I. Kubickova, P. Maki-Arvela, D. Chichova, K. Eranen, D.Y. Murzin, Fuel 87(2008) 933.
[7] Boreskov Institute of Catalysis: http://www.catalysis.ru/tech.php?lang=en&,access date 30.6.2008.
[8] P.A. Simonov, S.Y. Troitskii, V.A. Likholobov, Kinet. Catal. 41 (2000) 255.[9] O.A. Simakova, P.A. Simonov, A.V. Romanenko, I.L. Simakova, React. Kinet. Catal.
Lett. 95 (1) (2008) 3.[10] M. Gurrath, T. Kuretzky, H.P. Boehm, L.B. Okhlopkova, V.A. Lisitsyn, V.A. Likho-
lobov, Carbon 38 (2000) 1241.[11] H. Li, G. Sun, Q. Jiang, M. Zhu, S. Sun, Q. Xin, J. Power Sources 172 (2007) 641.[12] N.K. Nag, J. Phys. Chem. B 105 (2001) 5945.[13] R.S. Monteiro, L.C. Dieguez, M. Scmal, Catal. Today 65 (2001) 77.[14] J.S. Rieck, A.T. Bell, J. Catal. 103 (1987) 46.
I. Simakova et al. / Applied Catalysis A: General 355 (2009) 100–108108