Density effects in forward scattering of resonant light in rubidium vapor
17
arXiv:physics/0404053v2 [physics.optics] 2 Aug 2004 DENSITY EFFECTS IN FORWARD SCATTERING OF RESONANT LIGHT IN RUBIDIUM VAPOR SZYMON PUSTELNY, WOJCIECH LEWOCZKO, WOJCIECH GAWLIK Abstract. Transmission of light through an atomic sample placed between crossed polarizers in a magnetic field is jointly determined by Faraday rotation and net absorption: transmission increases with rotation and decreases with absorption. Both rotation and absorption are proportional to the atomic den- sity N 0 , hence, in a certain range of N 0 , the two effects may compete yielding a distinct density dependence of the transmitted light. We have studied such dependence in rubidium vapor for N 0 ≈ 6.0 × 10 9 ÷ 3.0 × 10 11 at/cm 3 with resonant laser light. We present interpretation of the competition effect and discuss its possible application for atomic density determination. 1. Introduction Studies of magneto-optical effects in atoms and molecules have a long tradition. The advent of tunable lasers stimulated renewed interest in the nonlinear magneto- optics. Numerous papers are describing various aspects of this nonlinearity (see reference[1] for recent review). In the systems with ground state (or other long- lived lower levels) of angular momentum J = 0, the magneto-optical nonlinearities are due to optical pumping and Zeeman coherences. Optical pumping changes the saturation conditions for a given transition by affecting the sublevel populations whereas the Zeeman coherence allows interference of quantum paths linking differ- ent sublevels. These effects give rise to an optical anisotropy which can be easily studied experimentally. One important application of magneto-optical studies is the determination of optical density and thus a measurement of oscillator strength (dipole moment) of a given transition when the number density is known or, inversely, of atomic densities when the transition probability is known. Examples of such applications of linear Faraday effect are the measurements of relative oscillator strengths in neon [2] and sodium [3] and of atomic vapor density of optically thick potassium vapors [4]. The present work describes experimental and theoretical analysis of transmission of resonance laser light by atomic vapors positioned between crossed polarizers in a weak longitudinal magnetic field (forward scattering - FS) under conditions of nonlinear light-matter interaction. In general, the FS signal, i.e. the transmitted light intensity vs. magnetic field, depends on the polarization anisotropy both in atomic absorption and dispersion. In such context FS has been analyzed for conventional light sources in early works of G. W. Series and coworkers [5], and for laser light by W. Gawlik et al.[6]. For a medium of length L, placed between crossed polarizers and characterized by refractive indices n ± and absorption coefficients κ ± for the σ ± polarized light, the intensity of the forward-scattered monochromatic 1
-
Upload
jagiellonian -
Category
Documents
-
view
0 -
download
0
Transcript of Density effects in forward scattering of resonant light in rubidium vapor
arX
iv:p
hysi
cs/0
4040
53v2
[ph
ysic
s.op
tics]
2 A
ug 2
004 DENSITY EFFECTS IN FORWARD SCATTERING OF
RESONANT LIGHT IN RUBIDIUM VAPOR
SZYMON PUSTELNY, WOJCIECH LEWOCZKO, WOJCIECH GAWLIK
Abstract. Transmission of light through an atomic sample placed betweencrossed polarizers in a magnetic field is jointly determined by Faraday rotationand net absorption: transmission increases with rotation and decreases withabsorption. Both rotation and absorption are proportional to the atomic den-sity N0, hence, in a certain range of N0, the two effects may compete yieldinga distinct density dependence of the transmitted light. We have studied suchdependence in rubidium vapor for N0 ≈ 6.0 × 10⁹
÷ 3.0 × 10¹¹ at/cm3 withresonant laser light. We present interpretation of the competition effect anddiscuss its possible application for atomic density determination.
1. Introduction
Studies of magneto-optical effects in atoms and molecules have a long tradition.The advent of tunable lasers stimulated renewed interest in the nonlinear magneto-optics. Numerous papers are describing various aspects of this nonlinearity (seereference[1] for recent review). In the systems with ground state (or other long-lived lower levels) of angular momentum J 6= 0, the magneto-optical nonlinearitiesare due to optical pumping and Zeeman coherences. Optical pumping changes thesaturation conditions for a given transition by affecting the sublevel populationswhereas the Zeeman coherence allows interference of quantum paths linking differ-ent sublevels. These effects give rise to an optical anisotropy which can be easilystudied experimentally.
One important application of magneto-optical studies is the determination ofoptical density and thus a measurement of oscillator strength (dipole moment) of agiven transition when the number density is known or, inversely, of atomic densitieswhen the transition probability is known. Examples of such applications of linearFaraday effect are the measurements of relative oscillator strengths in neon [2] andsodium [3] and of atomic vapor density of optically thick potassium vapors [4].
The present work describes experimental and theoretical analysis of transmissionof resonance laser light by atomic vapors positioned between crossed polarizers ina weak longitudinal magnetic field (forward scattering - FS) under conditions ofnonlinear light-matter interaction. In general, the FS signal, i.e. the transmittedlight intensity vs. magnetic field, depends on the polarization anisotropy bothin atomic absorption and dispersion. In such context FS has been analyzed forconventional light sources in early works of G. W. Series and coworkers [5], and forlaser light by W. Gawlik et al.[6]. For a medium of length L, placed between crossedpolarizers and characterized by refractive indices n± and absorption coefficients κ±
for the σ± polarized light, the intensity of the forward-scattered monochromatic1
2 SZYMON PUSTELNY, WOJCIECH LEWOCZKO, WOJCIECH GAWLIK
light of wavenumber k is given by[3]
(1.1) IFS =I0
4[e−κ+kL − e−κ
−kL]2 + I0 sin2[
n+ − n−
2kL]e−(κ++κ
−)kL,
where I0 is the incident light intensity. The FS signal is non-zero only if the mediumpossesses some optical anisotropy between the σ+ and σ− light polarizations. Animportant cause of such anisotropy is a longitudinal magnetic field which splitsthe n±(ω) and κ±(ω) profiles. The first part of Eq. (1.1) describes the effect ofmedium dichroism whereas the second part is due to its birefringence weighted bya net absorption. For the light frequency ω tuned exactly to the atomic transitionfrequency ω0 and for a linear splitting of atomic energy levels due to magnetic field,the appearance of a nonzero FS signal is caused exclusively by the second partof expression (1.1), i.e. by the birefringence. The exact shape of the FS signaldependence on the magnetic field is affected by a combined effect of birefringenceand total absorption. In the case of nonlinear interaction with the light beam,this dependence may have the form of a narrow sub-Doppler, or even subnatu-ral, resonances (see, e.g. references [1, 6]). The two properties of the medium,birefringence and total absorption, scale differently with the atomic density whichresults in specific density/temperature characteristics of the FS signals discussedbelow. We hope that these characteristic density dependences would be useful fordetermination of the optical density of atomic samples.
The detailed mechanism of nonlinear FS signals has been theoretically analyzedin several papers (see, e.g. references[7, 8, 9, 10, 11, 12]) at different levels ofaccuracy. Below, we present a nonperturbative treatment that for low J valuesyields analytical formulae.
In the next section we describe our setup and present experimental results. InSec. 3 we present theoretical calculations and interpretation of the experiment.Finally, we conclude in Sec. 4.
2. Experiment
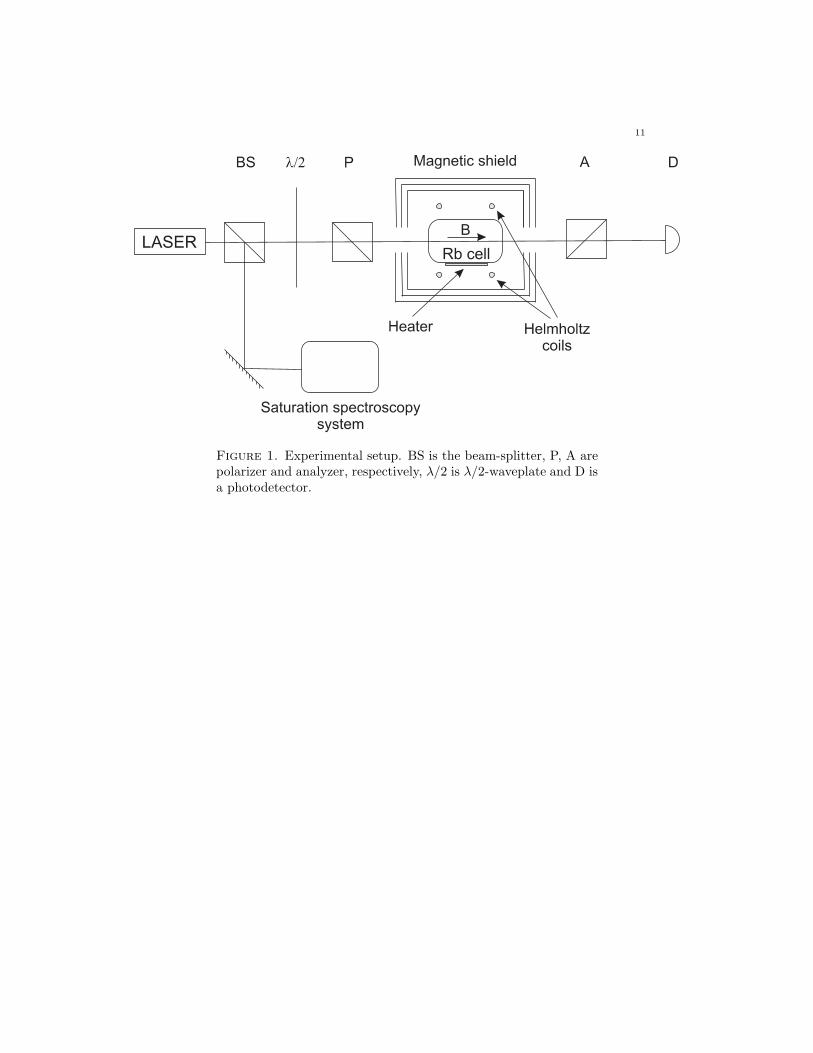
2.1. Apparatus. The experimental setup is shown in Fig. 1. We used an externalcavity diode laser tuned to the hfs component Fg = 3 → Fe = 2 of the 85Rb D1
line. The laser frequency was stabilized by an external stabilization system basedon Doppler-free dichroism[13]. The light beam of 2 mm diameter was linearlypolarized and its power was varied by rotation of a λ/2-waveplate in the range 0 to4 mW. The laser light was passing through a 5 cm long cylindrical glass cell of 2 cmdiameter filled with the natural mixture of 85Rb and 87Rb and no buffer gas. Thecell was heated by a nonmagnetic heater to temperatures between 20 oC and 60 oCwhich yielded saturated vapors with densities in the range 6.0 × 10⁹ ÷ 3.0 × 10¹¹
at/cm3. A pair of Helmholtz coils produced the longitudinal magnetic field of -3G to 3 G value. The cell and the coil system were surrounded by a three-layermagnetic shield made of mu-metal. As assessed from the resonance line-width, theshielding efficiency was better than 104. Polarizer P and crossed analyzer A weremounted outside the shield[5]. In that geometry, detector D placed behind theanalyzer registered only the FS signal due to rotation of the polarization plane ofthe transmitted light and/or its ellipticity. Part of the incident beam was directedto the saturation spectroscopy system which served as frequency reference.

3
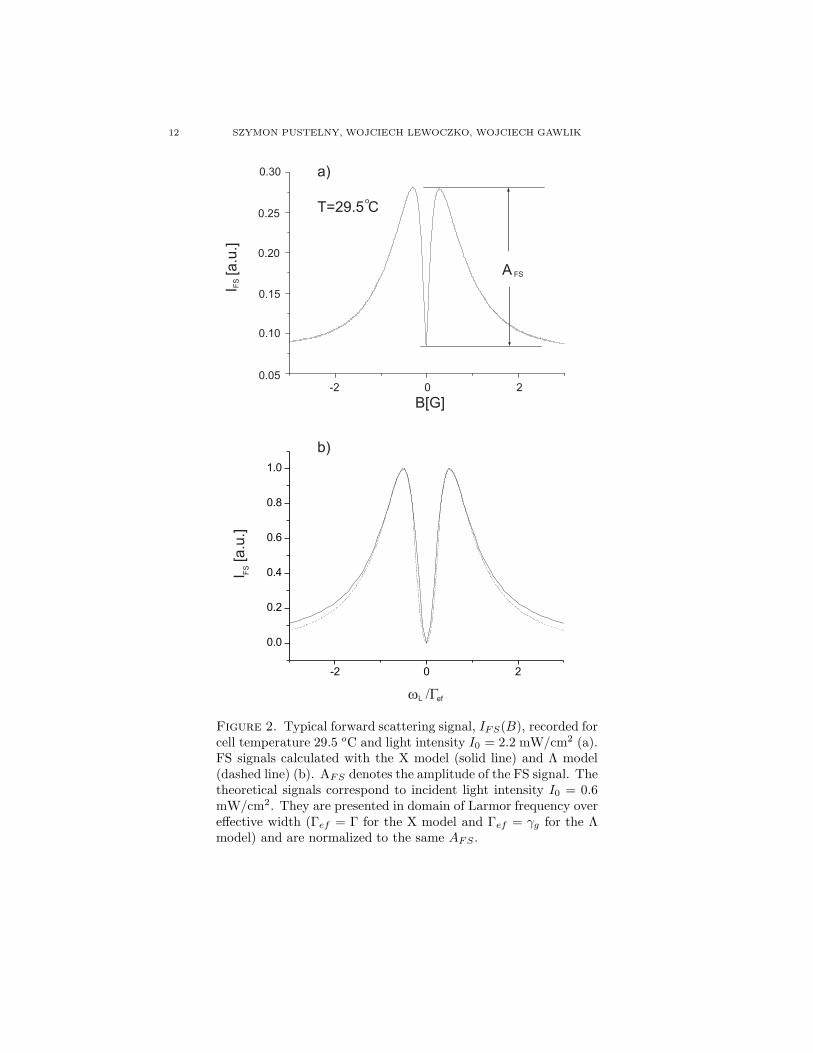
2.2. Results. The FS signals, IFS(B), were recorded as a function of the magneticfield B for various temperatures T and light intensities I0. The narrowest features insignals are caused by nonlinear Faraday effect due to ground-state optical pumpingand Zeeman coherences. A typical plot of that part of the FS signal is presentedin Fig. 2a. The amplitude of the signal, defined as AFS in Fig. 2a, depends onthe light intensity and concentration of the atomic vapors. In Fig. 3 we summarizethe results of the amplitude vs. temperature T dependences taken for various lightintensities I0.
For the studied range of intensities between 1 mW/cm2 and 6 mW/cm2, thesignals exhibit characteristic temperature dependence: for low temperature theiramplitudes increase with T then reach their maxima and subsequently decrease withT . The temperature of the maximum amplitude shifts with the light intensity. Forhigh temperatures almost no light is transmitted through the cell between crossedpolarizers. For very high light intensity (above 100 mW/cm2), the maximum shiftseven beyond the range of temperatures available with our setup (Fig. 4).
We have verified that the amplitude of the FS signal is a nonlinear function of thelight intensity. This could be expected as the intensities we were using were closeto, or higher than, the saturation intensity which for rubidium is 1.6 mW/cm2. Itcan be thus expected that the interplay between rotation and absorption is affectedby different saturation behavior of the dispersive and absorptive atomic properties.Such different saturation effects are manifest in Fig. 3 by a shift of the maximatowards higher temperatures with increasing I0.
3. Interpretation
The properties of the maxima in the AFS(T ) dependences, described above,are independent of the detailed mechanisms responsible for the FS signals. Themaximum occurs for linear, as well as for nonlinear Faraday rotations. For nonlinearFaraday effect, it appears no matter if the FS signals have natural or sub-naturalwidths, i.e. if they are due to population redistribution or Zeeman coherences. Thedetailed nature of atomic birefringence and absorption mechanism affects only therange of the concentrations (temperatures) where the maximum is visible.
This property can be illustrated by the following simple arguments. For exactresonance, δ = 0, only the second part of Eq.(1.1) differs from zero, hence
(3.1)IFS
I0= sin2(αN0) exp(−βN0),
where α/β = 1/2(n+ − n−)/(κ+ + κ−) and N0 is the atomic concentration. Fora given atomic transition, cell length, magnetic field and light intensities, α andβ are constants mutually related by the Kramers-Kronig relation [14]. IFS/I0 isthus an universal function of N0, parameterized by the ratio α/β but independent
of the detailed form of α and β. Generally, the specific value of the ratio dependson particular dependences of α and β on atomic energy level structure, mechanismof interaction with the external fields and their intensities. However, for the valueof the magnetic field corresponding to maximum rotation AFS the splitting ofatomic magnetic sublevels is nearly equal to their width which results in α/β ofthe order of 1. By virtue of the Kramers-Kronig relation, the value of α/β ata given B is nearly insensitive to the details of the atomic structure and to thenature of optical anisotropy. With α/β = 1, expression (3.1) represents a stronglydamped oscillatory dependence on N0, dominated by the first oscillation. These

4 SZYMON PUSTELNY, WOJCIECH LEWOCZKO, WOJCIECH GAWLIK
oscillations are nonlinear counterparts of those described in reference [3]. Note,that the appearance of the characteristic maximum of the AFS dependence on N0
is possible only with the FS methodology and cannot be observed by measuringonly the rotation.
For more quantitative interpretation of our experimental results we use semiclas-sical approach of forward scattering and density matrix formalism[15] to calculatethe refractive indices n and absorption coefficients κ
(2a) n − 1 =ℜ(
∑
i di〈ρ(i)coh〉v)
Eǫ0,
(2b) κ =ℑ(
∑
i di〈ρ(i)coh〉v)
Eǫ0,
where 〈ρ(i)coh〉v are the velocity averaged optical coherences for the i-th transition of
a given polarization, ℜ and ℑ denote their real and imaginary parts, respectively,di is the dipole moment of the particular transition, E the amplitude of the lightelectric field, and ǫ0 is the electric permittivity of free space.
In this paper we consider the simple model of atomic structure Jg = 1/2 → Je =1/2 with two sublevels in the ground state and two sublevels in the excited statethe, so called, X model. The σ+ component of the propagating beam excites atomsfrom the ground-state sublevel |a〉 (m = −1/2) to the excited-state sublevel |B〉(m = 1/2). Analogically, the σ− component causes transition from |b〉 (m = 1/2)to |A〉 (m = −1/2). The great advantage of this simple model is its analyticalsolvability. Despite its simplicity, the X model gives good qualitative agreementwith the experimental results. Furthermore it reproduces well the observed depen-dence of the FS amplitude on the properties of the atomic medium, in particular onthe dipole moment and concentration of atoms in the ground sublevels in thermalequilibrium.
To check to what extent the density dependence of AFS(N0) is insensitive toparticular model, and to verify that the X model does not oversimplify the in-terpretation, we have additionally applied another model using the Λ-type atomicstructure (Fig. 5b). The second model allows proper analysis of the coherenceeffects, such as coherent population trapping (CPT) [16], and their consequencesfor magneto-optical properties of the medium. However, analytical solutions andvelocity integration are much more difficult within the second model. For this rea-son, in this paper we concentrate exclusively on the X model. Nevertheless, we haveverified by numerical calculation with the Λ model that Zeeman coherence effectsdo not change qualitative predictions of the X model concerning the temperaturedependence of AF S(N). This is due to the fact that the IF S(B) signals simulatedby both models are qualitatively very similar to the experimental ones, as seen inFig.2, so the α and β quantities in Eq. (2) remain very close, no matter whatdetailed model is being used.
Within our model, the refractive indices and absorption coefficients for bothcircular polarizations are calculated using equations (2a) and (2b) as
(3a) n+ − 1 =dℜ(〈ρaB〉v)
Eǫ0, n− − 1 =
dℜ(〈ρbA〉v)Eǫ0
,

5
(3b) κ+ =dℑ(〈ρaB〉v)
Eǫ0, κ− =
dℑ(〈ρbA〉v)
Eǫ0.
The semiclassical Hamiltonian of the system is given by(4)
H = ~ω0(ρAA+ρBB)+~
2ggωB(ρaa−ρbb)+
~
2geωB(ρAA−ρBB)+dE(ρaB+ρbA+h.c.),
where ρii denotes population of the i-th state, gg, ge are the Lande factors of theground and the excited states, respectively, ω0 is the transition frequency in zeromagnetic field, and ωB is the Larmor frequency ωB = µBB/~ with µB being Bohrmagneton.
Evolution of the density matrix is described by the master equation
(5) ρ = − i
~[H, ρ] − Γρ,
where Γρ stands for the relaxation operator.Formula (5) yields the following equations describing evolution of the optical
coherences in the X model
(6a) ρaB = i(ω0 + ω′
B + iΓ)ρaB + iβ(ρaa − ρBB),
(6b) ρbA = i(ω0 − ω′
B + iΓ)ρbA + iβ(ρbb − ρAA),
where ω′B = 1
2 (gg +ge)ωB is the effective magnetic shift of the resonance frequency,β = Ed/~ is the Rabi frequency and Γ is the relaxation constant of the opticalcoherences.
Further calculations are performed in the rotating-wave and steady state approx-imations. Under such conditions the optical coherences become
(7a) ρaB = − β
δ + ω′B + iΓ
(ρaa − ρBB),
(7b) ρbA = − β
δ − ω′B + iΓ
(ρbb − ρAA),
where ρaB and ρbA are slowly-varying coherences in the rotating-wave approxi-mation and δ = ω0 − ω. Although only ρaB is calculated below, the analogicalcalculation can be performed for ρBa.
Relation (7a) couples the optical coherence with atomic populations. Using Eq.(5) to calculate atomic populations and inserting them to (7a) one can write
(8) ρaB = βneq(δ + ω′
B − iΓ)MA(δ) + 2rG
MA(δ)MB(δ) + rG(MA(δ) + MB(δ)) + 2rG2,
where neq is the thermal equilibrium atomic population of the ground state andother symbols are defined as
MA(δ) = (δ − ω′
B)2 + Γ2,
MB(δ) = (δ + ω′
B)2 + Γ2,
r =γe
3γg
,
6 SZYMON PUSTELNY, WOJCIECH LEWOCZKO, WOJCIECH GAWLIK
G =2β2Γ
γe
,
with γg and γe being the relaxation constants of the ground and excited states,respectively. Relation (8) is an analitical expression valid for any light intensitiesand allowing easy analysis of the dispersive and absorptive responses of our modelsystem to light and magnetic field. Perturbative solutions for optical coherencescan be obtained in the low light power regime, G ≪ 1, by expanding relation (8)into power series of G.
Relation (8) contains the ratio of two polynomials of δ (they also depend onω′
B). At this point atomic movement needs to be taken into consideration, i.e. δhas to be corrected for Doppler shifts (δ → δ − kv) and expression (8) needs to beintegrated over the Maxwell distribution of the velocities v. Generally, this is theplace when one sacrifices analyticity of solutions for a single velocity class. However,the benefits of analytic expressions can be retained by expanding (8) into partialfractions
(9) ρaB = −neqβ[A+(ω′
B)
δ + δ1(ω′B)
+A−(ω′
B)
δ − δ1(ω′B)
+B+(ω′
B)
δ + δ2(ω′B)
+B−(ω′
B)
δ − δ2(ω′B)
],
where δ21,2 = B2 − γ2 − rG ±
√
r2G2 − 4B2(γ2 + rG) − 2rG2 are the roots of thedenominator of Eq. (8), while A±, B± are the expansion coefficients equal to
A± =1
2
δ31 ∓ aδ2
1 + bδ1 ∓ c
δ1(δ21 − δ2
2), B± = −1
2
δ32 ∓ aδ2
2 + bδ2 ∓ c
δ2(δ21 − δ2
2),
where a = B + iγ, b = 2rG − (a∗)2, and c = −a∗(2rG + |a|2). One thus obtains
〈ρaB〉v = −neqβN0√πu
[A+(ω′
B)
∫ ∞
−∞
exp(−v2/u2) dv
δ − kv + δ1(ω′B)
+A−(ω′
B)
∫ ∞
−∞
exp(−v2/u2) dv
δ − kv − δ1(ω′B)
+B+(ω′
B)
∫ ∞
−∞
exp(−v2/u2) dv
δ − kv + δ2(ω′B)
+B−(ω′
B)
∫ ∞
−∞
exp(−v2/u2) dv
δ − kv − δ2(ω′B)
],(10)
where u is the average atomic speed. Writing down the coherence in form (10)allows a clear interpretation of each contribution. The functions A±(ω′
B), B±(ω′B)
are responsible for narrow structures in the FS signals and describe the nonlinearFaraday effect, while the integrals describe wide pedestals of IFS(ω′
B), barely visiblein a narrow scan of the magnetic field. For calculations of the integrals in (10),standard tabularized functions, the plasma dispersion function [17] or the complexerror function [18], can be used.
As it was mentioned above, the FS signal registered with the crossed polarizersarrangement results from competition between rotation of the polarization planeand net absorption. The competition is seen in Eq.(1.1) which for δ = 0, takes theform
(11) IFS = I0 sin2(n+ − n−
2kL) exp(−2κkL),
where κ = κ+(ωB, δ = 0) = κ−(ωB, δ = 0). Relation (10) was used for simulationof the FS signals with parameters corresponding to the experimental conditions:

7
d = 2.25 ×10⁻²⁹ Cm, u = 200 m/s, ge = gg = 1, γg = 2π × 0.1 MHz, γe =2π × 5.74 MHz, and Γ = 2π × 2.92 MHz. The ground-state relaxation rate γg
reflects finite atomic transit time across the laser beam. In the D1 line of rubidium,there are two transitions within the Doppler width that can be excited by light:Fg = 3 → Fe = 2 and Fg = 3 → Fe = 3 but since in our experiment the laserwas tuned only to the Fg = 3 → Fe = 2 component, the contribution of anothertransition has been neglected. Apart from a very simplified atomic structure, thepresent analysis also does not take into account specific relaxation mechanisms, e.g.velocity-changing collisions[19] and/or radiation trapping [20] which may affect thespecific ratio α/β in Eq. (3.1).
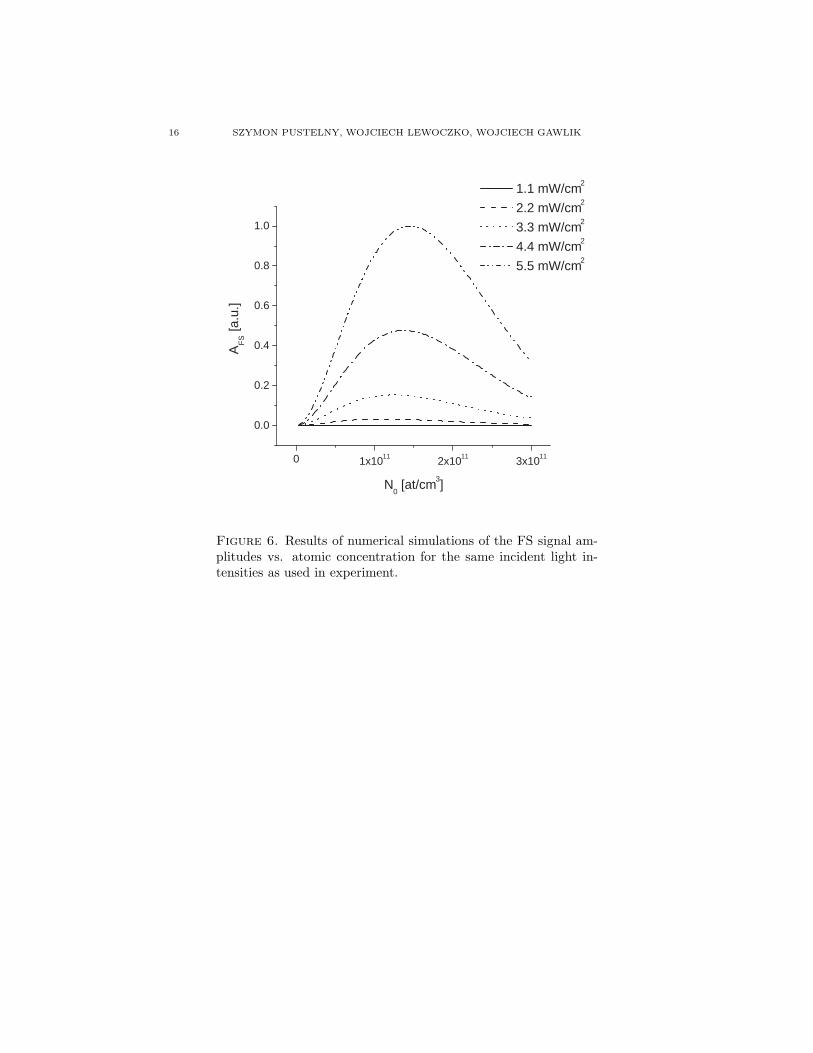
Results of the simulations with our X model of the FS signal amplitude vs.atomic concentration are shown in Fig. 6 for various light intensities.
As the experimental results were recorded vs. vapor temperature, the atomicdensity in Eq. (10) has to be expressed as a function of the vapor temperature whichis possible if the temperature dependence of rubidium vapor pressure is known.The issue of vapor pressure is crucial for many experimental situations, yet exactmeasurements of vapor pressures are difficult and subject to various systematicerrors. A common procedure is to use one of the existing compilations which fitexperimental data obtained in various temperatures by simple analytical formulaethat can be used for extra- or interpolation to other temperatures. In principal,such fits are based on the statistical physics and chemistry laws (Arrhenius law,ideal gas law) with possible corrections for departures from the ideal gas modeland/or for specific metal evaporation conditions. Particular care should be takenclose to phase-transition temperatures, as e.g. near the melting point. This is thecase of our experimental conditions as the melting point of rubidium 39.3 oC occursjust in the middle of our temperature range.
Assuming ideal gas and starting from the Arrhenius relation, the saturated vaporpressure could be determined by formula
(12) log10 p(T ) = A − B
T.
Such a dependence is used, e.g. in reference[21], which for rubidium gives A =4.875 and B = −4215 below the melting point and A = 4.312 and B = −4040above the melting temperature. Another widely cited compilation [22] applies extracorrections terms and uses relation
(13) log10 p(T ) = A′ +B′
T+ C′T + D′ log10 T,
where for rubidium A′ = 94.05, B′ = 1961, C′ = −0.03772, and D′ = 42.57 belowthe melting temperature and A′ = 15.88, B′ = 4330, C′ = 0.00059, and D′ = −2.99above the melting point. From Eqs. (12) and (13), with the help of ideal gas equa-tion, pV = NatkBT (Nat is the number of atoms the gas, V is its volume, and kB
the Boltzmann constant), one can obtain the final concentration-temperature rela-tion N0(T ). Reliability of such density determination depends obviously on qualityof experimental data used for a given analytic fit. Reference[23] presents a thoroughcomparison of several measurements of rubidium vapor pressure vs. temperaturewhich appears to be fairly consistent with the Nesmeyanov’s prediction[22]. On theother hand, the CRC compilation[21] is based on not too many experiments and,to our best knowledge, has not been verified in a wide range of temperatures.

8 SZYMON PUSTELNY, WOJCIECH LEWOCZKO, WOJCIECH GAWLIK
Our experiment interpreted in terms of the X model yields for T ≈ 50 oC thedensity that is consistent with the data given by[21] and by 25% higher from thevalue given in reference[22]. We hope that after more detailed interpretation, thedescribed method could allow accurate measurements of the atomic vapor densitiesand possibly improve existing literature inconsistencies.
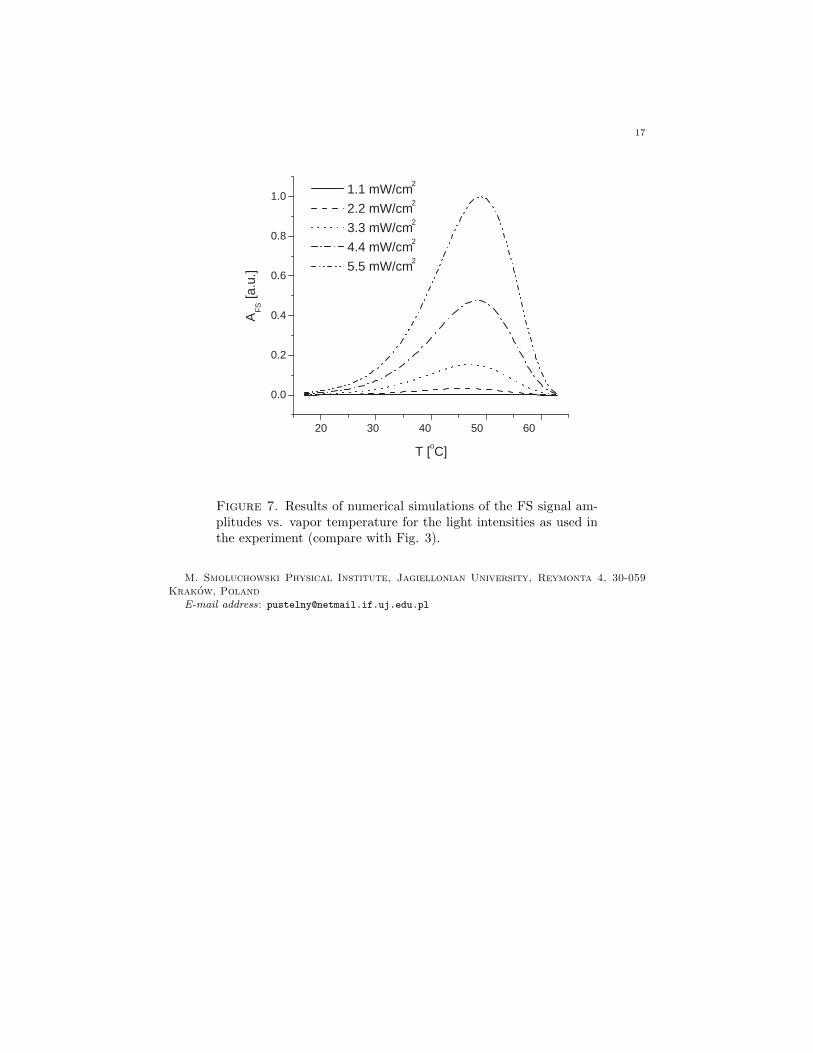
Comparison of Fig. 3 with Fig. 7 shows that while there is not a perfect agree-ment of the simulated signals with the experimental ones, they are very similar andexhibit the same general character. For low temperatures the FS amplitude scalesas a square function of the concentration N0. This part of the dependences is de-termined only by the dispersive properties of the medium. For higher temperaturesthe absorption starts to play an important role and cannot be neglected anymore.The interplay between dispersion and absorption produces the maximum of the FSamplitude signal. For even higher temperatures, the absorption of the transmittedlight becomes dominant and the amplitudes of the FS signals decrease exponentiallywith concentration N0. In addition to this temperature/density dependence, theFS amplitude rises and shifts with increase of the incident light intensity. The shiftsof the maxima positions for various light intensities are due to different saturationbehavior of the dispersion and absorption coefficients which affects the α/β ratioin Eq. (3.1). This is a very interesting effect that deserves independent systematicstudy, preferably with more complex models of atomic structure.
4. Conclusions
The specific effect of competition between polarization rotation and absorption,described above, shows up in the FS signals. The FS intensity, given by Eq. (10),increases with the medium birefringence (as sin2 of the Faraday angle) and decreasesexponentially with the medium absorption. Competition of these opposite trendsis responsible for the observed maxima of the dependences seen in Figs. 3 and7. Appearance of this competition is an universal feature, independent of whetherthe light-matter interaction has a linear or a nonlinear character. The possiblenonlinearity only affects the absolute scale of the rotation and absorption and,consequently, the range of densities where the competition occurs. For alkali metalvapors and for light intensities of the order of 1 mW/cm2, the resonant nonlinearFaraday effect allows observation of such a competition already in a low-densityrange, about N0 ≈ 1010 at/cm3, which requires temperatures not much higherthan the room temperature. The onset of optical nonlinearity not only lowers thedensity at which the characteristic maximum of the AFS(N0) dependence appearsbut results in its shift with the light intensity. This is due to different saturationbehavior of the dispersive and absorptive atomic properties.
We note that the main features of the discussed dependences do not depend onthe detailed mechanism of the nonlinearity. We have considered two physically dif-ferent models in which the nonlinearities are caused by two different mechanisms:either they are due to redistribution of populations between Zeeman sublevels (op-tical pumping), or are due to the coherence established between the sublevels. Bothmodels gave very similar results and reproduced our experimental observations. Thevery distinct result of the competition between absorption and rotation, i.e. themaximum of the forward scattering amplitude signal, appears at well determinedvalue of the atomic density. We believe that existence of such characteristic pointwhose position is well defined function of the atomic properties of the medium and

9
scattered light intensity should allow precise determination of the atomic numberdensities or transition probabilities.
5. Acknowledgements
We acknowledge stimulating and helpful discussions with Dmitry Budker, KrzysztofSacha and Jerzy Zachorowski whose experimental help is also very appreciated.This work was partially supported by NRC U.S.-Poland Twinning Grant No.015369,and by the Polish KBN grant No. 3T11B 079 26. It was also a part of a pro-gram of Polish National Laboratory of AMO Physics in Torun, Poland (grant No.PBZ/KBN/043/PO3/2001).
References
1. D. Budker, W. Gawlik, D. F. Kimball, S. M. Rochester, A. Weis, and V. V. Yashchuk, ”Reso-nant nonlinear magneto-optical effects in atoms”, Rev. Mod. Phys. 74, 1153-1201 (2002).
2. W. Seka and F.L. Curzon, ”Measurements of relative transition probabilities using Faradayeffect”, J. Quant. Radiat. Transfer 8, 1147-1162 (1968).
3. W. Gawlik, J. Kowalski, R. Neumann, and H. B. Wiegemann, ”A new method for measuringoscillator strengths using the resonant Faraday effect in monochromatic light”, J. Phys. B (At.Mol. Phys.) 12, 3873-3882 (1979).
4. E. Vliegen, S. Kadlecek, L. W. Anderson, T. G. Walker, C. J. Erickson, and W. Happer,”Faraday rotation density measurements of optically thick alkali metal vapors”, Nucl. Instr.Meth. A 460, 444-450 (2001).
5. A. Corney, B. P. Kibble, and G. W. Series, ”Forward scattering of resonance radiation withspecial reference to double resonance and level-crossing experiments”, Proc. R. Soc. London,Ser. A 293, 70-93 (1966).
6. W. Gawlik, J. Kowalski, and R. Neumann, F. Trager, ”Observation of the electric hexadecapolemoment of free Na atoms in a forward scattering experiment”, Opt. Commun. 12, 400-404(1974).
7. S. Giraud-Cotton, V. P. Kaftandjian, and L. Klein, ”Forward scattering of resonant radiationas a function of applied magnetic field theoretical study of the hyperfine lines of the sodiumdoublet”, Phys. Lett. A 88, 453-436 (1982).
8. X. Chen, V. L. Telegdi, and A. Weis, ”Quantitative study of the nonlinear Macaluso-Corbino(resonant Faraday) effect in Cs”, Opt. Commun. 74, 301-305 (1990).
9. B. Stahlberg, P. Jungner, T. Fellman, and A. Lindberg, ”Nonlinear forward scattering of reso-nant laser-light from excited neon systems”, Appl. Phys. B 50, 547-551 (1990).
10. F. Schuller and D. N. Stacey, ”Magneto-optical rotation in atomic transitions between levelswith J=0 and J=1”, Phys. Rev. A 60, 973-981 (1999).
11. B. W. Holmes and J. A. R. Griffith, ”A detailed study of the effects of weak magnetic fieldson the forward scattering of resonant laser light by sodium vapour”, J. Phys. B 28, 2829-2846(1995).
12. B. Lobodzinski and W. Gawlik, ”Multipole moments and trap states in forward scattering ofresonance light”, Phys. Rev. A 54, 2238-2252 (1996).
13. G. Wasik, W. Gawlik, J. Zachorowski, and W. Zawadzki, ”Laser frequency stabilization byDoppler-free magnetic dichroism”, Appl. Phys. B 75, 613-619 (2002).
14. J. D. Jackson, Classical Electrodynamics, (Wiley, New York, 1972), Chapter 7.15. R. W. Boyd Nonlinear Optics (Academic, Boston, 1992), Chapter 3.16. E. Arimondo, ”Coherent population trapping in laser spectroscopy”, Progress in Optics
XXXV, E. Wolf Ed., Elsevier, 1996, pp. 259-354.17. B. Fried and S. Conte, The Plasma Dispersion Function (Academic Press, New York, 1961).18. M. Abramovitz and I. A. Stegun, Handbook of Mathematical Functions, (Dover, New York,
1972), p. 297.
19. E. Arimondo, ”Relaxation processes in coherent-population trapping”, Phys. Rev. A 54, 2216-2223 (1996).
20. A. B. Matsko, I. Novikova, M. O. Scully, and G. R. Welch, ”Radiation Trapping in CoherentMedia”, Phys. Rev. Lett. 87, 133601 (2001).

10 SZYMON PUSTELNY, WOJCIECH LEWOCZKO, WOJCIECH GAWLIK
21. CRC Handbook of chemistry and Physics, 73rd Edition, D. R. Lide Ed., CRC Press, BocaRaton, 1992, p. 5-80.
22. A. N. Nesmyanov, Vapor pressures of the chemical elements, Elsevier, New York, 1963.23. D. C. Thompson and G.-X. Xu, ”Optical measurements of vapor pressures of Rb and a Rb-K
mixture”, Can. J. Phys. 60, 1496-1501 (1982).
11
Rb cell
Figure 1. Experimental setup. BS is the beam-splitter, P, A arepolarizer and analyzer, respectively, λ/2 is λ/2-waveplate and D isa photodetector.
12 SZYMON PUSTELNY, WOJCIECH LEWOCZKO, WOJCIECH GAWLIK
-2 0 2
0,005
0,010
0,015
0,020
0,025
0,030
A FS
I FS[a
.u.]
B [G]
T = 29.5oC
Figure 2. Typical forward scattering signal, IFS(B), recorded forcell temperature 29.5 oC and light intensity I0 = 2.2 mW/cm2 (a).FS signals calculated with the X model (solid line) and Λ model(dashed line) (b). AFS denotes the amplitude of the FS signal. Thetheoretical signals correspond to incident light intensity I0 = 0.6mW/cm2. They are presented in domain of Larmor frequency overeffective width (Γef = Γ for the X model and Γef = γg for the Λmodel) and are normalized to the same AFS .

13
0,0
0,2
0,4
0,6
0,8
1,0
25 30 35 40 45 50 55 60
5.5 mW/cm 2 4.4 mW/cm 2 3.3 mW/cm 2 2.2 mW/cm 2 1.1 mW/cm 2
A F
S [a
.u.]
T [ o C]
Figure 3. The amplitudes of the FS signals (AFS) vs. tempera-ture for various intensities of the incident light.

14 SZYMON PUSTELNY, WOJCIECH LEWOCZKO, WOJCIECH GAWLIK
35 40 45 50 55 60 65
0,00
0,04
0,08
0,12
0,16 132 mW/cm 2
A F
S [a
.u.]
T [ o C]
Figure 4. The amplitude of the FS signal (AFS) vs. temperaturefor very high light intensity, I0 = 130 mW/cm2.

15
| |
0
J =1g
J =0e
b)
|a |b
A B
ss
J =g
J =e
a)
m=_1
m=1m=0
+ ss +
m= 12__
m= 12__
m= 12_
m= 12_
m=0
12_
12_
Figure 5. Energy level structure for a) the X-model, b) the Λ-model.
16 SZYMON PUSTELNY, WOJCIECH LEWOCZKO, WOJCIECH GAWLIK
0 1x10 11 2x10 11 3x10 11
0.0
0.2
0.4
0.6
0.8
1.0 A
FS
[a.u
.]
N 0 [at/cm 3 ]
1.1 mW/cm 2
2.2 mW/cm 2
3.3 mW/cm 2
4.4 mW/cm 2
5.5 mW/cm 2
Figure 6. Results of numerical simulations of the FS signal am-plitudes vs. atomic concentration for the same incident light in-tensities as used in experiment.
17
20 30 40 50 60
0.0
0.2
0.4
0.6
0.8
1.0
A F
S [a
.u.]
T [ o C]
1.1 mW/cm 2
2.2 mW/cm 2
3.3 mW/cm 2
4.4 mW/cm 2
5.5 mW/cm 2
Figure 7. Results of numerical simulations of the FS signal am-plitudes vs. vapor temperature for the light intensities as used inthe experiment (compare with Fig. 3).
M. Smoluchowski Physical Institute, Jagiellonian University, Reymonta 4, 30-059
Krakow, Poland
E-mail address: [email protected]