Dendroecological analysis of defoliator outbreaks on Nothofagus pumilio and their relation to...
15
Dendroecological analysis of defoliator outbreaks on Nothofagus pumilio and their relation to climate variability in the Patagonian Andes JUAN PARITSIS and THOMAS T. VEBLEN Biogeography Laboratory, Department of Geography, University of Colorado, Boulder, CO 80309-0260, USA Abstract In the temperate forests of the southern Andes, Nothofagus pumilio, the dominant species of the most extensive forest type, experiences severe defoliation caused by caterpillars of the Ormiscodes genus (Lepidoptera: Saturniidae). This study uses tree rings to reconstruct the history of Ormiscodes outbreaks for the 1850–2005 period and examines relationships between outbreaks and climate variability. We used local climate records to compare outbreak–climate relationships in the northern Patagonian Andes (c. 411S) and the cooler southern Patagonian Andes (c. 491S). We also examined relationships between outbreak events and regional climate variability driven by variability in the Southern Annular Mode (SAM) and the El Nin ˜ o-Southern Oscillation. Although relationships between Ormiscodes outbreaks and climate proved to be complex, in northern Patagonia defoliation events are associated with drier and warmer than average growing seasons. Warming and drying trends in Patagonia during the latter part of the 20th century have been linked to a positive trend in SAM. During the post-1976 period of accelerated warming in Patagonia, widespread defoliation outbreaks have occurred in both northern and southern Patagonia but the increase in frequency of events has been greater in the south. In southern Patagonia the increases in frequency of outbreaks in the late 20th century appear to be unprecedented over the c. 150 year tree-ring record of reconstructed outbreaks. These results are consistent with the greater magnitude of recent warming in southern Patagonia, and suggest that under predicted warmer and drierclimates in the 21st century, defoliator outbreaks may continue to increase in frequency. This study is the first systematic reconstruction of past insect outbreaks in South America and provides a preliminary under- standing of how climate variability affects defoliator outbreaks in Patagonian Nothofagus forests. Keywords: climate, defoliation, dendroecology, ENSO, insect outbreaks, Nothofagus pumilio, Ormiscodes amphimone, Patagonia, Southern Annular Mode Received 25 January 2010; revised version received 29 April 2010 and accepted 3 May 2010 Introduction Climate warming has been suggested as a cause of increased severity and spread of forest insect outbreaks in many parts of the world (Logan et al., 2003; Jepsen et al., 2008). Although many studies have explored the influences of climate variability on insect outbreak activity (mostly in the northern temperate zone), the effects of climatic variation on insect outbreak dynamics remain poorly known, in part due to the lack of ade- quate long-term outbreak records for robust statistical analyses (Swetnam & Lynch, 1993; Rauchfuss et al., 2009). Long-term records of past outbreaks are needed to determine how current outbreak trends may or may not have departed from their historical range of varia- bility. Despite some early studies in Australia and New Zealand of outbreaks of forest insects potentially related to climate variation (Jane & Green, 1983; Hosking & Kershaw, 1985), the lack of research on long-term pat- terns of forest insect outbreaks in relation to climate is particularly evident for the southern hemisphere tem- perate zone. Although warming generally is expected to favor growth of herbivorous insect populations to epidemic population levels (Ayres & Lombardero, 2000), there is a wide range of actual responses of insect outbreak dy- namics to climate. Some forest insects, including most Dendroctonus bark beetles, accelerate their life cycles under warming, favoring epidemic population growth (Hebertson & Jenkins, 2008; Raffa et al., 2008). In con- trast, outbreaks of other insect species such as larch bud moth (Zeiraphera diniana) in the Alps have declined with warming, apparently due to asynchrony between egg hatch and budburst (Bu ¨ ntgen et al., 2009). Additionally, outbreaks of the same insect species may respond differently to warming and drying trends in different parts of the insect’s geographic range (Thomson et al., Correspondence: Juan Paritsis, tel. 1 303 492 4785, e-mail: [email protected] Global Change Biology (2011) 17, 239–253, doi: 10.1111/j.1365-2486.2010.02255.x r 2010 Blackwell Publishing Ltd 239
-
Upload
conicet-ar -
Category
Documents
-
view
1 -
download
0
Transcript of Dendroecological analysis of defoliator outbreaks on Nothofagus pumilio and their relation to...

Dendroecological analysis of defoliator outbreaks onNothofagus pumilio and their relation to climatevariability in the Patagonian AndesJ U A N PA R I T S I S and T H O M A S T . V E B L E N
Biogeography Laboratory, Department of Geography, University of Colorado, Boulder, CO 80309-0260, USA
Abstract
In the temperate forests of the southern Andes, Nothofagus pumilio, the dominant species of the most extensive forest
type, experiences severe defoliation caused by caterpillars of the Ormiscodes genus (Lepidoptera: Saturniidae). This
study uses tree rings to reconstruct the history of Ormiscodes outbreaks for the 1850–2005 period and examines
relationships between outbreaks and climate variability. We used local climate records to compare outbreak–climate
relationships in the northern Patagonian Andes (c. 411S) and the cooler southern Patagonian Andes (c. 491S). We also
examined relationships between outbreak events and regional climate variability driven by variability in the Southern
Annular Mode (SAM) and the El Nino-Southern Oscillation. Although relationships between Ormiscodes outbreaks
and climate proved to be complex, in northern Patagonia defoliation events are associated with drier and warmer than
average growing seasons. Warming and drying trends in Patagonia during the latter part of the 20th century have
been linked to a positive trend in SAM. During the post-1976 period of accelerated warming in Patagonia, widespread
defoliation outbreaks have occurred in both northern and southern Patagonia but the increase in frequency of events
has been greater in the south. In southern Patagonia the increases in frequency of outbreaks in the late 20th century
appear to be unprecedented over the c. 150 year tree-ring record of reconstructed outbreaks. These results are
consistent with the greater magnitude of recent warming in southern Patagonia, and suggest that under predicted
warmer and drier climates in the 21st century, defoliator outbreaks may continue to increase in frequency. This study
is the first systematic reconstruction of past insect outbreaks in South America and provides a preliminary under-
standing of how climate variability affects defoliator outbreaks in Patagonian Nothofagus forests.
Keywords: climate, defoliation, dendroecology, ENSO, insect outbreaks, Nothofagus pumilio, Ormiscodes amphimone, Patagonia,
Southern Annular Mode
Received 25 January 2010; revised version received 29 April 2010 and accepted 3 May 2010
Introduction
Climate warming has been suggested as a cause of
increased severity and spread of forest insect outbreaks
in many parts of the world (Logan et al., 2003; Jepsen
et al., 2008). Although many studies have explored the
influences of climate variability on insect outbreak
activity (mostly in the northern temperate zone), the
effects of climatic variation on insect outbreak dynamics
remain poorly known, in part due to the lack of ade-
quate long-term outbreak records for robust statistical
analyses (Swetnam & Lynch, 1993; Rauchfuss et al.,
2009). Long-term records of past outbreaks are needed
to determine how current outbreak trends may or may
not have departed from their historical range of varia-
bility. Despite some early studies in Australia and New
Zealand of outbreaks of forest insects potentially related
to climate variation (Jane & Green, 1983; Hosking &
Kershaw, 1985), the lack of research on long-term pat-
terns of forest insect outbreaks in relation to climate is
particularly evident for the southern hemisphere tem-
perate zone.
Although warming generally is expected to favor
growth of herbivorous insect populations to epidemic
population levels (Ayres & Lombardero, 2000), there is a
wide range of actual responses of insect outbreak dy-
namics to climate. Some forest insects, including most
Dendroctonus bark beetles, accelerate their life cycles
under warming, favoring epidemic population growth
(Hebertson & Jenkins, 2008; Raffa et al., 2008). In con-
trast, outbreaks of other insect species such as larch bud
moth (Zeiraphera diniana) in the Alps have declined with
warming, apparently due to asynchrony between egg
hatch and budburst (Buntgen et al., 2009). Additionally,
outbreaks of the same insect species may respond
differently to warming and drying trends in different
parts of the insect’s geographic range (Thomson et al.,Correspondence: Juan Paritsis, tel. 1 303 492 4785, e-mail:
Global Change Biology (2011) 17, 239–253, doi: 10.1111/j.1365-2486.2010.02255.x
r 2010 Blackwell Publishing Ltd 239

1984; Swetnam & Lynch, 1993). Thus, it is difficult to
predict the response of forest insect pests to the now
well-established trend toward warmer temperatures in
the southern hemisphere (IPCC, 2007) and in southern
South America in particular (Villalba et al., 2003).
Over the past three decades in southern South Amer-
ica, severe defoliation events caused by Ormiscodes
(Lepidoptera: Saturniidae) species have been reported
in Nothofagus (southern beech) forests along a large
portion of the southern Andes in Patagonia (40–501S).
For instance, in 1985–1986 a large outbreak of Ormis-
codes amphimone caterpillars, severely defoliated many
tens of thousands of hectares of Nothofagus forests in
northern Patagonia (40–411S) (Veblen et al., 1996). Se-
vere O. amphimone outbreaks, also lasting for a single
growing season, occurred in southern Patagonian
Nothofagus forests in Los Glaciares National Park
(501S) in 1998–1999, and in 2002–2003 (Queiro, 2003).
Although local residents and land managers regarded
such outbreaks as unprecedented, the historical range
of variability of Ormiscodes outbreaks is unknown. It is
not clear whether similar severe and widespread out-
breaks were common in past centuries or if the dy-
namics of the Nothofagus–Ormiscodes interaction have
recently changed. In order to assess the temporal pat-
terns of Ormiscodes defoliations on Nothofagus pumilio
forests in Patagonia and the potential effects of climate
variability on these outbreaks, we reconstructed the
history of outbreak events using dendroecological
methods and statistically examined their potential
relationships to climate variability.
During the past decade significant advances have
been made in documenting and understanding climate
trends and variability in southern South America
(Thompson & Solomon, 2002; Marshall, 2003; Villalba
et al., 2003; Aravena & Luckman, 2009; Garreaud et al.,
2009). Tree-ring proxy records and instrumental climate
records show a clear warming in northern (0.53 1C) and
southern (0.86 1C) Patagonia over the 20th century
(compared with the 1640–1899 means) that accentuated
in the mid-1970s (Villalba et al., 2003). This warming has
been accompanied by a decrease in precipitation in
most of the Patagonian–Andean region (Aravena &
Luckman, 2009). These trends will likely continue as
predicted by several General Circulation Models that
indicate a warming of c. 2–3 1C in northern Patagonia
(Carril et al., 1997) and predict further decreases in
precipitation for the 21st century throughout Patagonia
(Vera et al., 2006). Additionally, the influence of broad-
scale climate modes, such as El Nino-Southern Oscilla-
tion (ENSO) and the Southern Annular Mode (SAM) on
the regional climate variability of Patagonia is well
established (Daniels & Veblen, 2000; Garreaud et al.,
2009), and tree-ring proxy reconstructions of these
climate modes for the past several centuries are avail-
able (e.g. Villalba et al., 1997b; D’Arrigo et al., 2005;
Gergis & Fowler, 2009). For example, widespread trends
toward warmer and drier conditions in Patagonia have
been related to an upward trend in SAM since c. 1950
(Aravena & Luckman, 2009; Garreaud et al., 2009).
Together, these advances provide exceptional opportu-
nities to explore the effects of climate variability at
multiple scales (i.e. seasonal, interannual, and multi-
decadal) on the temporal dynamics of insect outbreaks
in the Patagonian Andes.
In this study we use tree-ring methods to reconstruct
the outbreak history since 1850 of an insect defoliator
(O. amphimone) of N. pumilio forests in two climatically
contrasting regions in northern and southern Patagonia.
Specifically, we address two questions: (i) Have Ormis-
codes outbreaks changed in frequency since the incep-
tion of accelerated warming in the late 20th century?
(ii) How are Ormiscodes outbreaks related to regional
climate variation and to broad-scale climate modes (i.e.
ENSO and the SAM)?
Methods
Study area
Sampling for detection of past outbreaks of Ormiscodes was
conducted in N. pumilio forests on the eastern slopes of the
Argentinean Andes in northern Patagonia at 40–411S and in
southern Patagonia at 49–501S, in Nahuel Huapi and Los
Glaciares National Parks, respectively (Fig. 1). The southern
Andes (37–551S) experience strong westerly winds year round
that carry moist air across the Andean divide generating a
steep west-to-east gradient of decreasing precipitation asso-
ciated with distance from the divide. In the northern Patagonia
study area the mean annual temperature in the mountain
valleys is c. 12 1C and it decreases to c. 6 1C in southern
Patagonia, south of 471S (Villalba et al., 2003). In northern
Patagonia (c. 401S), annual precipitation decreases from
3000 mm, at the Andean divide, to 800 mm in the foothills of
the Andes o50 km eastwards (Barros et al., 1983). In southern
Patagonia (c. 501S) annual precipitation declines from
7000 mm on the Pacific coast to 200 mm on the eastern side
of the Andes (Aravena & Luckman, 2009). While the study
area in northern Patagonia encompasses the entire gradient of
precipitation, the study area in southern Patagonia only spans
from 400 to 700 mm of annual precipitation.
Climate variations in the southern Andes are strongly
influenced by the intensity and latitudinal position of the
southeast Pacific subtropical anticyclone, which can block
westerly flow of moist air masses into Patagonia causing
temperature and precipitation variations. The strength of the
southeast Pacific subtropical anticyclone is closely related to
ENSO (Aceituno, 1988). Predominant climatic responses to
El Nino (i.e. the positive phase of ENSO) at mid-latitudes
(401S) are cool and wet springs and warm and dry summers; at
240 J . PA R I T S I S & T . T . V E B L E N
r 2010 Blackwell Publishing Ltd, Global Change Biology, 17, 239–253

high-latitudes (c. 501S) El Nino generates cool and wet springs
and warm but not necessarily dry summers (Daniels & Veblen,
2000; Garreaud et al., 2009). Since the mid-1970s, there has been
a trend toward the dominance of El Nino rather than La Nina
events, with unusually long and strong episodes (Allan, 2000).
This trend, in turn, has coincided with accentuated warming
after 1976 in the southern hemisphere and specifically in
Patagonia (Villalba et al., 2003) and with declining precipita-
tion in northern Patagonia (Aravena & Luckman, 2009).
ENSO-related regional climate variation in northern Patagonia
has been shown to be an important driver of tree population
dynamics (Villalba & Veblen, 1998; Daniels & Veblen, 2004)
and wildfire activity (Kitzberger et al., 1997; Veblen et al., 1999).
Climate variability in the southern Andes is also influenced
by blocking events of high pressure over the South America–
Antarctic Peninsula sector of the Southern Ocean, which drive
cyclonic storms northward into Patagonia. The strength and
position of these blocking events are associated with the SAM
(also referred as the Antarctic Oscillation) (Thompson &
Solomon, 2002), which is a large-scale pattern of alternating
zonal pressure anomalies with one sign centered in Antarc-
tica (i.e. south of 651S) and the opposite sign located in a
Fig. 1 Map showing the location of the study areas and the tree-ring sample sites in (a) northern Patagonia (Nahuel Huapi NP) and
(b) southern Patagonia (Los Glaciares NP). Triangles represent sites used for the outbreak reconstructions and circles represent sites used
for the regional climate control chronology. Sites 28, and 30–33 are outside the mapped area (b) for southern Patagonia (see Table 1 for
their location).
I N S E C T O U T B R E A K S A N D C L I M A T E I N S O U T H A M E R I C A 241
r 2010 Blackwell Publishing Ltd, Global Change Biology, 17, 239–253

circumpolar band at 40–501S (Gong & Wang, 1999). SAM
modifies the atmospheric circulation pattern between high-
and mid-latitudes, which in turn changes the meridional
position of the westerlies. The positive phase of SAM is
associated with warmer temperatures and reduced precipita-
tion south of 401S in South America (Gillett et al., 2006;
Garreaud et al., 2009) due to reduced zonal flow at mid-
latitudes resulting in less frontal activity and less orographic
precipitation (Gillett et al., 2006). Since c. 1950, SAM has shown
an upward trend (especially in summer to fall), which intensi-
fied in the mid-1970s, and is believed to be driven by Antarctic
ozone depletion and increasing greenhouse gases (Miller et al.,
2006; Fogt et al., 2009). Climate models and observations
suggest that this positive trend in SAM will continue (Miller
et al., 2006) as well as the warming (IPCC, 2007) and precipita-
tion decline (Vera et al., 2006) trends documented in Patagonia.
Climate variability induced by SAM has been shown to
influence population trends of several species of penguins at
high southern latitudes (Forcada & Trathan, 2009) and one
species of rodent in northwestern Patagonia (Murua et al.,
2003), as well as fire in South Africa (Wilson et al., 2010) and
southern Chile (Holz, 2009).
Studied species
The most widely distributed and economically important
Nothofagus species in South America, N. pumilio, is a broad-
leaved deciduous canopy tree that extends from 351350S in
central Chile to 551300S in Tierra del Fuego (Veblen et al., 1996;
Gea-Izquierdo et al., 2004). In southern Patagonia (i.e. south of
491S), N. pumilio forests appear to grow under suboptimal
climatic conditions related to relatively short growing seasons
and strong winds year round.
O. amphimone, one of the most widespread Ormiscodes
species in southern South America (Lemaire, 2002), is a native
polyphagous saturniid moth known to cause severe defolia-
tion on N. pumilio (Bauerle et al., 1997; Baldini & Alvarado,
2008; Paritsis et al., accepted). O. amphimone overwinters in the
egg stage and larvae emerge during early-to-late spring and
feed until mid-to-late summer depending on climate condi-
tions and geographic location (Lemaire, 2002). Defoliation
caused by O. amphimone apparently does not generate wide-
spread mortality of mature N. pumilio trees, most likely due to
the short duration of these outbreaks (i.e. one season; Carrillo
& Cerda, 1987; Veblen et al., 1996). Nonetheless, Ormiscodes
defoliation significantly reduces N. pumilio radial growth
(Paritsis et al., 2009) and has been reported to kill saplings of
Nothofagus species even under moderate larval densities
(Bauerle et al., 1997). In addition, severe defoliation may
promote secondary attacks by Gnathotrupes bark beetles (Bal-
dini & Alvarado, 2008).
Although several Ormiscodes species feed on Nothofagus
trees, field observations (Baldini & Alvarado, 2008; Paritsis
et al., accepted), as well as the documented geographic ranges
of Ormiscodes species (Lemaire, 2002) strongly suggest that
O. amphimone is the species that caused all past and recent
defoliations on N. pumilio (Paritsis et al., accepted). Hence,
even though it is not possible to confirm that all reconstructed
defoliations in this study were generated exclusively by
O. amphimone, it is highly likely that this species is responsible
for most, if not all, the outbreaks identified in the reconstructions.
Sampling design and field methods
We sampled 23 sites (13 in the northern and 10 in the southern
Patagonian study areas) to reconstruct Ormiscodes outbreaks in
N. pumilio forests (Fig. 1, Table 1). Site selection was based on
the occurrence of documented O. amphimone defoliations for
which there are available historical records (Veblen et al., 1996;
Queiro, 2003) and/or verification in Landsat TM and ETM 1
images of the defoliated areas (Paritsis, 2009; Paritsis et al.,
2009). Two sites were selected at locations with no documen-
ted past outbreaks to increase sample heterogeneity and verify
the effectiveness of the method applied to detect past out-
breaks. To incorporate stand structure variations and stand age
in the sampling design, which may influence outbreak fre-
quency, we sampled two stands with contrasting structures
and ages at each site whenever such stand variation was
available. Sampled stands were separated by at least 200 m
and in no case were more than 500 m apart. At each stand, we
recorded the latitude, longitude, elevation, slope angle, and
aspect of its central point and collected two increment cores
per tree at c. 1.2 m above the ground from at least 15 trees
within a 40 m radius from the central point. Trees sampled
included the full range of tree sizes present from a minimum
of 15 cm diameter at breast height (dbh) to the largest trees in
the stand. To quantify structural differences between paired
stands we delimited two square plots per stand that ranged
from 100 to 900 m2 each (to include at least 10 trees per plot)
and measured tree density and dbh.
Sample processing and reconstruction of outbreak history
We prepared tree-ring samples according to standard dendro-
chronological procedures (Stokes & Smiley, 1968). Calendar
dates were assigned to rings according to the southern hemi-
sphere tree-ring dating convention that assigns an annual ring
to the calendar year in which the annual ring formation begins
(Schulman, 1956). All series were initially visually crossdated
using marker rings. Additionally, on all samples we measured
tree-ring width to the closest 0.01 mm with a Velmex-type
stage. To check for errors in the dating of the ring-width series
we used time series correlation analyses using the COFECHA
program (Holmes, 1983), and we excluded samples that did
not crossdate with existing master chronologies (Boninsegna &
Holmes, 1974; Holmes et al., 1984; Roig, 1986; Villalba &
Veblen, 1997; Villalba et al., 1997a). We detrended all tree-ring
series applying a double detrending procedure using a nega-
tive exponential or linear function first and a cubic-smoothing
spline (with a 67% rigidity) as the second option, and we
created one residual chronology per stand with the ARSTAN
software (Cook & Holmes, 1986).
To reconstruct O. amphimone outbreak history on N. pumilio
stands, we used the protocol designed and tested in Paritsis
et al. (2009), which uses a combination of three complementary
methods to detect past Ormiscodes defoliations: pointer years
242 J . PA R I T S I S & T . T . V E B L E N
r 2010 Blackwell Publishing Ltd, Global Change Biology, 17, 239–253

(Weber & Schweingruber, 1995), departure from a regional
host chronology control (Swetnam et al., 1985), and a morpho-
logical tree-ring signature (Hogg et al., 2002). Past outbreak
events were identified with either a high or moderate con-
fidence level by testing for three conditions for a potential
outbreak year. Condition (1): the tentative outbreak year must
be associated with a narrow ring (450% reduction compared
with the six neighboring tree rings) based on the pointer year
method. Condition (2): at least 10% of the trees (minimum
sample of 20 trees) in a tentative outbreak year must have the
morphological signature associated with known outbreaks.
Condition (3): the observed tree-ring index must be at least
Table 1 Location and characteristics of sites sampled for tree-ring chronologies
Study area and site name Code No. of trees Period (AD) Latitude (S) Longitude (W) Elevation (m) Slope (1) Aspect
Northern Patagonia
Sites sampled for Ormiscodes outbreaks
Rıo Filuco FIL 34 1844–2005 401240 711300 1060 0–5 S
Portezuelo POR 37 1832–2005 401360 711380 1110 0–25 E
Cerro Coligue CCO 18 1903–2005 401380 711420 1080 5–15 NW
Arroyo Catarata CAT 16 1873–2004 401380 711310 1090 0–5 SE
Veranada Catarata VER 33 1801–2005 401410 711320 1190 0–20 NE
Rıo Bonito BON 37 1783–2005 401430 711330 1350 5–15 NW
Paso Puyehue PUY 24 1850–2003 401430 711560 1150 0–5 N
Cerro Bayo BAY 24 1868–2003 401450 711360 1470 25–35 E
Rıo Ragintuco RAG 33 1828–2005 401490 711280 1230 10–20 NW
Cerro Colorado COL 33 1744–2005 401530 711420 1450 20–40 N
Cerro Tronador TRO 21 1815–2003 411120 711500 1050 10–20 E
Challhuaco CHA 34 1795–2005 411160 711170 1350 5–20 NW
Rıo Nireuco NCO 33 1821–2005 411200 711210 1290 5–15 E
Sites used to generate the regional host chronology (climatic control)
Paso Cordoba* PCO 32 1754–1986 401400 711150 1050w ndz nd
Paso de las Nubes§ PNU 12 1751–1991 411070 711480 1230 5–18 E
Rıo Nirihuau NIR 18 1873–2003 411170 711150 1190 25–35 SE
Laguna Cesares LCE 17 1820–2006 411180 711420 1170 0–5 SE
Southern Patagonia
Sites sampled for Ormiscodes outbreaks
Rıo Las Vueltas VUE 21 1888–2003 491160 721540 580 15–20 SE
Cerro Polo POL 33 1857–2005 491170 721540 460 15–35 SE
Chorrillo del Salto CHO 32 1873–2005 491180 721540 430 0–15 NE
Laguna Capri CAP 39 1888–2005 491180 721560 780 5–15 NW
Laguna Torre TOR 15 1872–2003 491200 721590 660 5–15 E
Madre e Hija 1 MH1 32 1822–2005 491200 721570 600 10–20 S
Pliegue Tumbado N PTN 34 1810–2005 491210 721540 780 0–10 NE
Pliegue Tumbado S PTS 39 1812–2005 491230 721540 830 0–15 NE
Lagunas Pajonales PAJ 38 1795–2005 491230 721530 810 10–20 E
Rıo Tunel TUN 39 1788–2005 491240 721540 810 0–10 SE
Sites used to generate the regional host chronology (climatic control)
Lago del Desierto} DES 28 1881–1998 491000 721500 550 nd nd
Madre e Hija 2 MH2 18 1864–2005 491200 721570 620 10–20 S
Cerro Buenos Aires 1k BA1 31 1750–1984 501220 721470 870 nd nd
Cerro Buenos Aires 2** BA2 14 1823–1974 501250 721450 600 nd nd
Rıo Rico RIC 15 1789–2003 501320 721430 780 0–10 SW
Cordon Cristales CRI 16 1766–2003 501350 721520 700 0–10 NE
The starting date listed under period corresponds to the year in which a chronology included at least five trees.
*Roig (1986).wEstimated elevation based on location provided in Roig (1986).znd, not determined.§Villalba et al. (1997a).}Veblen et al. (unpublished).kHolmes et al. (1984).
**Boninsegna et al. (1974).
I N S E C T O U T B R E A K S A N D C L I M A T E I N S O U T H A M E R I C A 243
r 2010 Blackwell Publishing Ltd, Global Change Biology, 17, 239–253

2 SDs less than the index of the regional-host chronology. If
only condition 1 is met, it is more probable that the suppressed
tree ring was caused by climatic conditions rather than defo-
liation. If condition 1 and either condition 2 or 3 are met, then,
it is more likely that the suppressed ring was due to a
defoliation event rather than climate unfavorable to tree
growth; consequently, an outbreak can be inferred with mod-
erate confidence. Finally, if all three conditions are met, an
outbreak defoliation event in that year is inferred with a high
degree of confidence. The current study includes only out-
break years of moderate confidence (two out of three condi-
tions) and high confidence (all three conditions). The protocol
was previously tested against direct observations of outbreaks
in five stands in the northern Patagonian study area (Paritsis
et al., 2009), and in the current study with an additional eight
and 10 stands in northern and southern Patagonia, respec-
tively. In addition to the outbreaks documented by tree-ring
attributes, we included in the reconstruction a recent outbreak
(austral summer 2004–2005) directly observed in southern
Patagonia but not sampled for tree-ring attributes.
Reconstructions of outbreaks were initially performed on a
stand basis and plotted from the year when at least five trees
were included in the stand chronology. For analyses of climatic
relationships of outbreak occurrence, we aggregated stand
chronologies into regional composite time series of outbreak
events for the northern and southern Patagonian study areas.
To avoid spurious interpretations of past outbreak frequency
due to low sample size, we began our analyses of the compo-
site time series in 1850 for each study area (i.e. when at least
50% of the sites and c. 25% of the trees were included in the
composite; Fig. 2). Given that the reduced ring width gener-
ated by the defoliation is formed in the growing season after
the outbreak event, we reassigned the outbreak year to the
growing season in which the defoliation occurred (e.g. a
defoliation occurring during January–March 1986, was as-
signed to the 1985 calendar year, which represents the 1985–
1986 growing season).
Climate datasets
We used instrumental climate data (i.e. monthly temperature
and precipitation) from representative climate stations in each
of the two study areas to examine the associations between
Ormiscodes outbreaks and climate variability. For the study
area in northern Patagonia mean monthly temperature and
total monthly precipitation records were obtained from the
Bariloche meteorological station (411090S, 711160W; elevation
825 m) located at c. 60 km on average from the sampled sites.
For southern Patagonia, we used temperature and precipita-
tion records from the Balmaceda meteorological station
(451550S, 711410W; elevation 223 m) located at c. 380 km on
average from the sampled sites. These stations were selected
based on three criteria: closest linear distance to the study
areas, similar relative position from the Andean divide as the
study areas, and sufficiently long records to perform climatic
analyses. For Bariloche, the record spans from 1914 to 2005 and
from 1905 to 2005 for temperature and precipitation, respec-
tively; and for Balmaceda it spans from 1963 to 2005 and 1950
to 2005 for temperature and precipitation, respectively.
To explore relationships of outbreaks to ENSO and SAM, we
used tree-ring reconstructed sea surface temperature anoma-
lies (SST, December–February) for ENSO (Cook reconstruc-
tion, Nino3 region; D’Arrigo et al., 2005), and tree-ring
reconstructed mean sea level pressures (MSLP) anomalies
(November–February) for the South American sector of Ant-
arctica for SAM (Villalba et al., 1997b). Given that these
reconstructions end in 1978 (Cook Nino3) and 1984 (MSLP),
we extended them to 2005 using instrumental records. We
used Nino 3.4 December–February SST instrumental records
for the 1950–2005 period (http://www.cpc.noaa.gov/data/
indices/sstoi.indices) to extend the Cook Nino3 reconstruc-
tion. We used Marshall’s (2003) SAM index (December–
February), which is the monthly mean difference between
MSLP anomaly at six stations near 401S and six stations near
651S, for the 1957–2005 period to extend MSLP. MSLP annual
values were multiplied by �1 to allow these to correspond to
Marshall SAM index values. To extend the reconstructions
we adjusted their SDs and means (calculated for the over-
lap period between these and the detrended instrumental
record) and we replaced the reconstructed series with
the detrended instrumental values for the 1950–2005 and
1957–2005 periods for Cook Nino3 and SAM, respect-
ively (Schoennagel et al., 2007). Finally, we normalized the
extended reconstructions for the 1850–2005 time period. Here-
inafter we will refer to the reconstructed Cook Nino3 extended
with Nino 3.4 as ‘Nino3’ and to the reconstructed MSLP
extended with the SAM Marshall index (Marshall, 2003) as
‘SAM.’
Climate–outbreak analyses
We examined the association of outbreak occurrence and
climate warming in Patagonia by calculating the mean number
of outbreak events per decade per region and compared these
means with a t-test for the 1850–1975 vs. the 1976–2005 periods
in northern and southern Patagonia. The selection of these
time periods is based on the well documented acceleration of
warming that started around 1976 in the southern Andes
(Villalba et al., 2003).
To quantitatively examine interannual associations between
outbreak occurrence and climate variables we used Super-
posed Epoch Analysis (SEA) (Grissino-Mayer, 1995). SEA
compares the mean values of climate conditions during out-
break years and the mean values of climate conditions during
the entire period of analysis. Mean values of climate condi-
tions were calculated for each year in a window of 5 years
(3 years preceding the outbreak year, the outbreak year itself,
and 1 year following the outbreak). Statistical significance was
determined by a bootstrap method in which years are selected
randomly and expected mean values of climate conditions are
calculated for the entire period of analysis (Grissino-Mayer,
1995). Because of the small number of outbreak events during
the period covered by the instrumental climate record, we also
assessed climate conditions during all nonoutbreak years
using SEA. If mean climate conditions during the nonoutbreak
244 J . PA R I T S I S & T . T . V E B L E N
r 2010 Blackwell Publishing Ltd, Global Change Biology, 17, 239–253

years are the opposite of those during outbreak years, then the
latter results based on small sample sizes are more likely to
have a causal explanation. We performed SEA for climate data
by single months, 2- and 3-month seasons, and annual time
periods but we only present results if they are statistically
significant and consistent across different data arrangements.
Additionally, we conducted SEA analyses with a moisture
index calculated as precipitation departures minus tempera-
ture departures (both in SDs) following Villalba & Veblen
(1998). We performed SEA between outbreaks and the climate
indexes for the entire study period, as well as for the recent
period of increasingly positive SAM (1951–2005) vs. the pre-
vious 101 years when SAM fluctuated between positive and
negative departures at a multidecadal scale (Miller et al., 2006;
Fogt et al., 2009).
Variability in timing of initiation, duration, and strength of
ENSO events is known to affect teleconnections to climate, and
outliers can obscure statistical associations of ecological phe-
nomena with ENSO variability in Patagonia (Villalba, 1994;
Veblen et al., 1999). Therefore, we qualitatively examined the
associations between ENSO phases and regional outbreak
years (i.e. years when outbreaks were recorded in at least
two sites within the same study area) based on a multiproxy
reconstruction of intensities of individual ENSO events (Ger-
gis & Fowler, 2009). Because a portion of any calendar year can
be El Nino (La Nina) and then shift to the opposite phase
during the same calendar, some years in Gergis and Fowler’s
(2009) reconstruction are indicated as both ENSO phases
simultaneously.
Given that climate responses to Nino3 and SAM are not
uniform over all of Patagonia (Daniels & Veblen, 2000; Gillett
et al., 2006; Garreaud et al., 2009), we performed correlation
functions between local climate data (monthly and seasonal
means) from the Bariloche and Balmaceda climate stations and
these climate indices for the time period common to both
stations (1963–2003). Correlation functions with their respec-
tive calculated bootstrapped confidence intervals allowed us
to estimate the strength of the relationship between local
climate data from meteorological stations and index variabil-
ity. The software DENDROCLIM2002 was used to perform the
correlation functions and to calculate the bootstrapped con-
fidence intervals (Biondi & Waikul, 2004).
Fig. 2 Tree-ring reconstructions of Ormiscodes outbreak events in (a) northern and (b) southern Patagonia. Dotted lines represent
chronology length and vertical bars are outbreak years. Composite chronologies (lower portion of each sub figure) indicate total
outbreaks per region and sample depth (solid and dotted lines represent percentage of stands and number of trees, respectively). See
Table 1 for site codes. Outbreak events are defined as years in which either three (pointer year, morphological signature, and regional
host) or two criteria (pointer year and morphological signature or regional host) indicate an outbreak event. The 2004 outbreak, directly
observed for southern Patagonia, did not affect any of the sampled stands but is included in the composite (indicated with an arrow).
I N S E C T O U T B R E A K S A N D C L I M A T E I N S O U T H A M E R I C A 245
r 2010 Blackwell Publishing Ltd, Global Change Biology, 17, 239–253

Results
Tree-ring reconstructions of Ormiscodes outbreaks
Based on the tree-ring reconstructions, there were 14
O. amphimone outbreaks (71% high and 29% moderate
confidence levels) in the northern Patagonia study area,
and 15 outbreaks (67% high and 33% moderate con-
fidence levels) in the southern Patagonia study area
over the 1850–2005 time period (Fig. 2). In the northern
Patagonia study area outbreak events occurred mostly
during the 1857–1897 (50% of the events) and the 1962–
2001 (36%) periods; in the southern Patagonia study
area most of the outbreaks (60%) occurred during the
1962–2004 period (Fig. 2). In both study areas, the post-
1961 period of frequent outbreaks was preceded by a
40-year period (1922–1961) time period lacking out-
breaks (Fig. 2). Outbreak occurrence per decade for
the 1850–1975 period was significantly lower than for
the 1976–2005 period in southern (P 5 0.01) but not in
northern Patagonia (P 5 0.4; Table 2).
Despite the low occurrence of multiple outbreaks at
the same site, many outbreaks are regionally synchro-
nous with at least one other site at an annual scale (Fig. 2).
On average, c. 1.5 outbreaks occurred in a given site per
century per study area and c. 10 outbreaks occurred per
century per study area (i.e. regional scale). Outbreak
frequency is not consistently or significantly related to
stand structure variables (i.e. dbh and tree density) in
either study area (results not shown).
Associations of outbreaks with variability in instrumentalclimate records
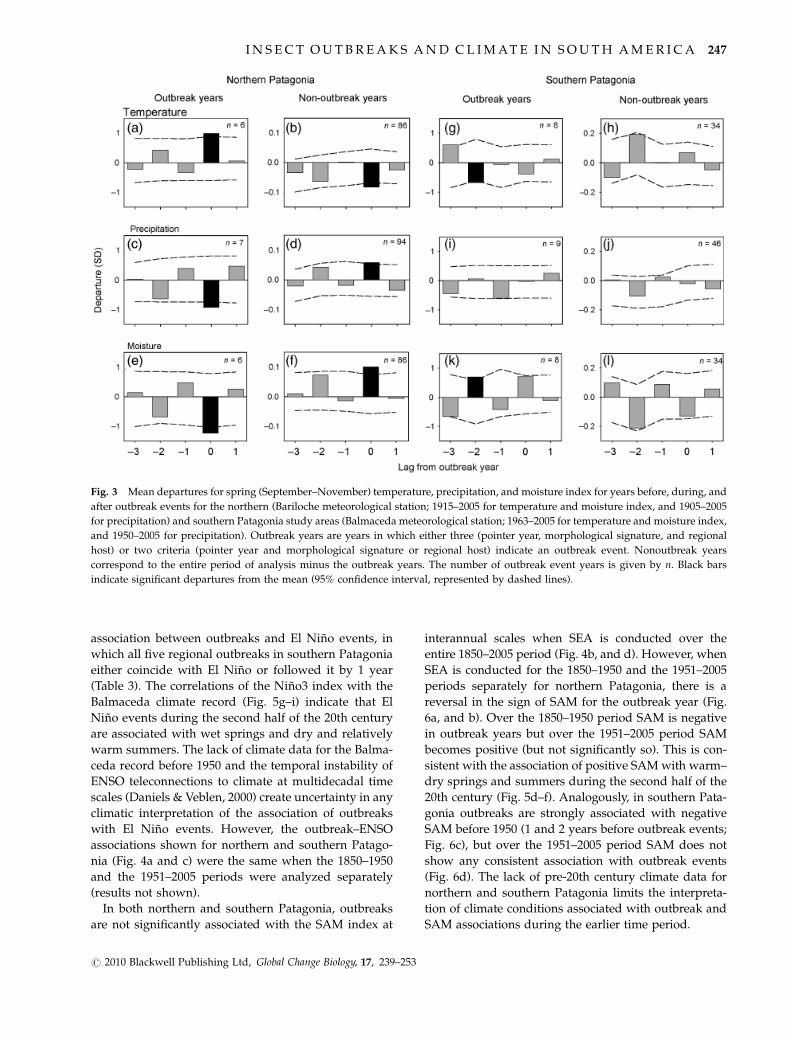
SEA reveals that outbreaks in northern Patagonia are
associated with warmer and drier than average springs
during the year of the outbreak based on the c. 100-year
Bariloche climate record (Fig. 3a, c, and e). Consistent
with this pattern is the association of nonoutbreak years
with cooler and moister than average springs (Fig. 3b, d,
and f). There are no significant or consistent associa-
tions of outbreaks with other 2–3-month seasons or
single months (results not shown).
Given the distance of the study area from the Balma-
ceda climate station, it is not surprising that statistical
relationships of outbreaks in southern Patagonia with
the instrumental record are weak and/or unclear as
proximate causes for outbreak occurrence. SEA indicate
that over the past c. 50 years, springs are cooler than
average 2 years before the outbreak (Fig. 3g). Springs
the year before outbreaks are slightly drier than average
but springs in the outbreak year show average precipi-
tation (Fig. 3i). These temperature and precipitation
patterns resulted in above average spring moisture 2
years before the outbreak and during the year of the
outbreak (Fig. 3k). The SEA results with the dataset of
nonoutbreak years show the opposite patterns, imply-
ing the weak outbreak–climate patterns found with the
outbreak dataset reflect causal relationships (Fig. 3h, j,
and l). As with northern Patagonia, there are no sig-
nificant or consistent associations of outbreaks with
other seasons or months using the instrumental record
that can be interpreted as proximate causes of outbreak
occurrence.
Associations of outbreaks with variability of ENSO andSAM
In northern Patagonia, there are no significant depar-
tures with SEA for the Nino3 index over the 5-year
window before, during and after outbreak years (Fig. 4a).
However, of the seven regional outbreak events in
northern Patagonia, all four 19th century outbreaks
either coincide with or lag El Nino by 1 year (Table 3).
In contrast, during the 20th century, the three regional
outbreaks in northern Patagonia lag La Nina events by
1–3 years (Table 3). SST (Nino3) positively correlate
with spring moisture availability in northern Patagonia
(Fig. 5a–c). Thus, La Nina events (cool SST) indicate dry
and relatively warm springs preceding the three 20th
century regional outbreaks which is consistent with the
association of outbreaks with warm and dry springs in
the Bariloche climate record (Fig. 3a–f). On the other
hand, the association of the four regional outbreak years
from 1857 to 1877 in northern Patagonia with El Nino is
not consistent with the moister springs expected during
El Nino events. However, the lack of local instrumental
records during this period and the known decadal
variations in the relationships of ENSO to climate and
ecological processes in Patagonia (Daniels & Veblen,
2000, 2004) make interpretations uncertain.
In southern Patagonia, SST (Nino3 index) over the
1850–2005 period are significantly above average 1 year
before outbreak events indicating El Nino conditions
(Fig. 4c). This pattern is consistent with the qualitative
Table 2 Mean (� SD) outbreak events per decade for the
1850–1975 and 1976–2005 periods in the northern and southern
study areas
Time period Outbreaks/decade
Northern Patagonia
1850–1975 0.8 � 0.7
1976–2005 1.0 � 0.0
Southern Patagonia
1850–1975 0.6 � 0.8
1976–2005 2.3 � 1.5*
*Significant difference between periods (t-test; Po0.05).
246 J . PA R I T S I S & T . T . V E B L E N
r 2010 Blackwell Publishing Ltd, Global Change Biology, 17, 239–253
association between outbreaks and El Nino events, in
which all five regional outbreaks in southern Patagonia
either coincide with El Nino or followed it by 1 year
(Table 3). The correlations of the Nino3 index with the
Balmaceda climate record (Fig. 5g–i) indicate that El
Nino events during the second half of the 20th century
are associated with wet springs and dry and relatively
warm summers. The lack of climate data for the Balma-
ceda record before 1950 and the temporal instability of
ENSO teleconnections to climate at multidecadal time
scales (Daniels & Veblen, 2000) create uncertainty in any
climatic interpretation of the association of outbreaks
with El Nino events. However, the outbreak–ENSO
associations shown for northern and southern Patago-
nia (Fig. 4a and c) were the same when the 1850–1950
and the 1951–2005 periods were analyzed separately
(results not shown).
In both northern and southern Patagonia, outbreaks
are not significantly associated with the SAM index at
interannual scales when SEA is conducted over the
entire 1850–2005 period (Fig. 4b, and d). However, when
SEA is conducted for the 1850–1950 and the 1951–2005
periods separately for northern Patagonia, there is a
reversal in the sign of SAM for the outbreak year (Fig.
6a, and b). Over the 1850–1950 period SAM is negative
in outbreak years but over the 1951–2005 period SAM
becomes positive (but not significantly so). This is con-
sistent with the association of positive SAM with warm–
dry springs and summers during the second half of the
20th century (Fig. 5d–f). Analogously, in southern Pata-
gonia outbreaks are strongly associated with negative
SAM before 1950 (1 and 2 years before outbreak events;
Fig. 6c), but over the 1951–2005 period SAM does not
show any consistent association with outbreak events
(Fig. 6d). The lack of pre-20th century climate data for
northern and southern Patagonia limits the interpreta-
tion of climate conditions associated with outbreak and
SAM associations during the earlier time period.
Fig. 3 Mean departures for spring (September–November) temperature, precipitation, and moisture index for years before, during, and
after outbreak events for the northern (Bariloche meteorological station; 1915–2005 for temperature and moisture index, and 1905–2005
for precipitation) and southern Patagonia study areas (Balmaceda meteorological station; 1963–2005 for temperature and moisture index,
and 1950–2005 for precipitation). Outbreak years are years in which either three (pointer year, morphological signature, and regional
host) or two criteria (pointer year and morphological signature or regional host) indicate an outbreak event. Nonoutbreak years
correspond to the entire period of analysis minus the outbreak years. The number of outbreak event years is given by n. Black bars
indicate significant departures from the mean (95% confidence interval, represented by dashed lines).
I N S E C T O U T B R E A K S A N D C L I M A T E I N S O U T H A M E R I C A 247
r 2010 Blackwell Publishing Ltd, Global Change Biology, 17, 239–253

Discussion
Tree-ring reconstructions of Ormiscodes outbreaks
To our knowledge this is the first regional tree-ring
reconstruction of insect outbreaks in South America,
and consequently, it represents a crucial first step to-
ward the understanding of long-term dynamics of in-
sect outbreaks in the temperate forests of the southern
hemisphere. We found that Ormiscodes outbreaks in the
northern and southern study areas in Patagonia are
relatively rare over most of the study period (i.e.
1850–2005) but their frequency increased markedly in
the late 20th century (Fig. 2). The conservative nature of
the tree-ring methods used to reconstruct outbreak
events identified only moderate and high severity out-
breaks, and it is not known if there are long-term trends
in less severe outbreaks.
This study confirms previous observations (i.e.
Carrillo & Cerda, 1987; Veblen et al., 1996) regarding
the 1 year duration of Ormiscodes outbreaks in Patago-
nia. Conversely, the observed acyclic occurrence of
outbreaks at individual sites or groups of nearby sites
(Fig. 3) contrasts with a suggested 4-year cycle for
Ormiscodes cinnamomea (a close relative of O. amphimone)
in the Concepcion region (361S; 731W) in Chile (Artigas,
1972). However, Artigas (1972) did not present any
quantitative evidence of a 4-year cycle of O. cinnamomea
outbreaks. Based on the temporal patterns of outbreaks
qualitatively described in the current study, there is
no evidence of any regular periodicity in Ormiscodes
outbreaks.
Ormiscodes outbreaks and climate variability
Although the associations found between O. amphimone
outbreaks and climate are complex and variable, they
provide a preliminary understanding of climatic influ-
ences on defoliation events. In northern Patagonia, the
relatively long instrumental climate record shows that
outbreak events are associated with drier and warmer
than average springs during the 20th century (Fig. 3a–f).
Conversely, and supportive of that conclusion, nonout-
Fig. 4 Mean departures for Nino3 (December–February sea surface temperature, calendar year assigned to December calendar year)
and for Southern Annular Mode (SAM; SAM index from Marshall, 2003 extended with reconstructed mean sea level pressure) for years
before, during, and after outbreak years in northern and southern Patagonia (1850–2005 period). Positive departures (warm phase)
indicate El Nino conditions while negative departures (cool phase) indicate La Nina conditions. The number of outbreak event years is
given by n. Outbreak years are years in which either three (pointer year, morphological signature, and regional host) or two criteria
(pointer year and morphological signature or regional host) indicate an outbreak event. Black bars indicate statistically significant
departures from the mean (95% confidence intervals are represented by dashed lines).
248 J . PA R I T S I S & T . T . V E B L E N
r 2010 Blackwell Publishing Ltd, Global Change Biology, 17, 239–253

break years are significantly above average in spring
moisture availability. This finding is consistent with the
association of outbreaks with La Nina events during
the 20th century (Table 3). Likewise, it is consistent
with the positive (but nonsignificant) departures of
SAM during outbreak years in the 1951–2005 period
(Fig. 6b) and the association of positive SAM with drier
and warmer springs (Fig. 5d–f).
In southern Patagonia, analyses based on the rela-
tively short Balmaceda meteorological station, located c.
380 km north of the study area, did not yield any
conclusive associations of outbreak events with seaso-
nal precipitation or temperature departures. Data from
other stations closer to the study area were of shorter
duration and were of poor quality due to missing data.
Analyses based on these other stations also did not
show clear or consistent associations of outbreak events
with seasonal climate anomalies. A key limitation of
the outbreak–climate analyses is the low number of
outbreak events overlapping with the relatively short
climate record from southern Patagonia. Consequently,
associations between outbreaks and the instrumental
climate record are inconclusive for southern Patagonia.
Despite the limitations imposed by the lack of a long
instrumental climate record near the outbreak events in
southern Patagonia, associations of outbreak events
with ENSO and SAM indicate the importance of cli-
matic variability in triggering outbreaks. Over the 1850–
2005 period, outbreaks are significantly associated with
above average SST (El Nino events) during the prior
year (Fig. 4c). Likewise, during the 1850–1950 period
outbreaks are strongly associated with negative depar-
tures in SAM (Fig. 6c) but the absence of a long, local
climate record makes the climatic interpretation of this
pattern uncertain. Nevertheless, the warming trend
recorded after the mid-1970s in the southern hemi-
sphere is much more pronounced in southern than in
northern Patagonia (Villalba et al., 2003). Consistent
with this pattern, the frequency of outbreaks during
the 1976–2005 period increased fourfold compared with
the previous 126 years in southern Patagonia, whereas
the increase in outbreak frequency in northern Patago-
nia was less dramatic (Table 2; Fig. 2). Hence, despite
the lack of significant departures of seasonal climate
variables during outbreak years for southern Patagonia
(Fig. 3), the increase in outbreak frequency in southern
Patagonia coincides with the post-1976 accelerated
warming. Synchronous defoliation over large areas
(e.g. defoliated patches during the 1985–1986 outbreak
were distributed over a north–south distance 4130 km)
strongly suggests that regional climate variability rather
than density-dependent factors (e.g. dispersal, local
stand conditions) is the main driver of outbreak occur-
rence (Zhang & Alfaro, 2003).
Implications of the outbreaks–climate relationships forN. pumilio forests
In both study areas there were several years of warmer
and drier than average springs during the periods of
instrumental climate records that were not associated
with outbreaks. Thus, although particular climate con-
ditions appear to be an important precondition for
Ormiscodes outbreaks, other unknown and perhaps
density-dependent factors (Peltonen et al., 2002; Zhang
& Alfaro, 2003) are likely contributing to the observed
population dynamics. Direct long-term monitoring of
variations in O. amphimone demography as well as
manipulative experiments are needed in order to iden-
tify density-dependent factors and their interactions
with climate variability. However, based on the preli-
minary findings presented here, current and predicted
warming and precipitation decline in Patagonia (Carril
et al., 1997; Villalba et al., 2003; Vera et al., 2006; IPCC,
2007; Aravena & Luckman, 2009) as well as the con-
tinued positive trend in SAM (Miller et al., 2006) are
likely to favor increased outbreak frequency (and po-
tentially severity and extent) during the 21st century.
This prediction raises important but complex ques-
tions about how increased defoliator activity will affect
Table 3 Regional outbreak events (i.e. events that occurred in
at least two sites) and associated El Nino and La Nina years
from Gergis & Fowler (2009) from 1850 to 2005
Regional outbreak
year
El
Nino Intensity La Nina Intensity
Northern Patagonia
1857 1856, 1857 M – –
1859 1858 M – –
1869 1868 VS 1867, 1868 S
1877 1877 VS 1875 S
1921 1918, 1919 VS, S 1918 S
1985 1983 E 1984 M
2001 – – 2000 S
Southern Patagonia
1906 1905 E – –
1980 1980 M – –
1998 1997 E* 1998 E
2002 2002 E 2000 S
2004 2004 ? – –
Intensities of El Nino/La Nina events are given as: M, mod-
erate; S, strong; VS, very strong; E, extreme (weak events are
not shown). Some years are listed as both El Nino and La Nina
because of phase flipping during the same calendar year.
*Although according to Gergis & Fowler (2009) 1997 El Nino
has a weak intensity, it is considered an intense El Nino year
by Cook Nino3 reconstruction (D’Arrigo et al., 2005) and
instrumental data (http://www.cdc.noaa.gov/enso/).
I N S E C T O U T B R E A K S A N D C L I M A T E I N S O U T H A M E R I C A 249
r 2010 Blackwell Publishing Ltd, Global Change Biology, 17, 239–253

the demography and ecosystem processes of N. pumilio
forests. Historically, defoliation events have been lim-
ited to a single growing season, have been relatively
rare events in these forests, and have not been asso-
ciated with any obvious tree mortality. However, if the
outbreak frequency observed in southern Patagonia
over the last c. 30 years (and especially over the last
10 years) continues, N. pumilio forests may start show-
Fig. 5 Correlation function analysis of seasonal temperature, precipitation, and moisture index with December–February. Nino3 and
Southern Annular Mode (SAM) by region (1963–2003 period). Bootstrapped 95% confidence intervals (dotted lines) are used to estimate
the statistical significance of the correlations (black bars indicate significant correlations). The meteorological stations used are Bariloche
(northern Patagonia) and Balmaceda (southern Patagonia). Seasons are defined as Fall, March–May; Winter, June–August; Spring,
September–November; Summer, December–February. Positive (warm) Nino3 indicates El Nino conditions and negative (cool) Nino3
indicates La Nina conditions.
250 J . PA R I T S I S & T . T . V E B L E N
r 2010 Blackwell Publishing Ltd, Global Change Biology, 17, 239–253

ing mortality caused directly by defoliation or greater
susceptibility to other stressors such as drought and
secondary insect attacks (Manion, 1981). Recent
drought episodes in northern Patagonia are already
causing significant mortality of Nothofagus dombeyi, a
closely related species that grows at lower elevation
(Suarez et al., 2004). Higher mortality rates of N. dombeyi
are associated with previous attacks by insect borers,
which render the trees more susceptible to hydric stress
(Suarez et al., 2004). Defoliation events may make N.
pumilio more susceptible to subsequent attack by other
insects such as has occurred in closely related Nothofa-
gus spp. in New Zealand where drought and defoliation
by scale insects weaken trees and make them suscep-
tible to other lethal agents such as pinhole beetles
(Hosking & Kershaw, 1985; Hosking & Hutcheson,
1988). In order to understand similar plausible syner-
gistic effects of defoliations and climate change on N.
pumilio forests, it is crucial to combine assessments of
the historical regime of variability of these outbreaks
with long-term monitoring of severely defoliated and
nondefoliated (or lightly defoliated) stands. Likewise,
indirect climate influences on the Ormiscodes–Nothofa-
gus system via effects on food quality and predator
populations of the defoliators will require manipulative
and long-term studies (Barbosa & Schultz, 1987; Ayres
& Lombardero, 2000).
Overall, the results of the current study imply that
climate warming has promoted O. amphimone outbreaks
in southern Patagonia. Although there is evidence
supporting the view that climate warming and drought
is favoring outbreaks of some guilds of forest insects,
such as bark beetles (Dendroctonus spp.) in the northern
hemisphere (Logan et al., 2003; Berg et al., 2006), support
for this idea for insect defoliators has been variable and
inconclusive (Huberty & Denno, 2004; Rouault et al.,
2006; Buntgen et al., 2009). Therefore, our study adds
to this general knowledge by providing information
on historical activity of defoliator outbreaks and pre-
liminary data on their relationship to climate variability
from an understudied region that is experiencing con-
siderable warming and an apparent increase in insect
defoliation.
Acknowledgements
We thank A. Holz, T. Kitzberger and two anonymous reviewersfor useful comments on the manuscript. For assistance in the
Fig. 6 Mean departures for Southern Annular Mode (SAM) for years before, during, and after outbreak years for the 1850–1950 and the
1951–2005 time periods in the northern Patagonia (a, b) and southern Patagonia study areas (c, d). The number of outbreak event years is
given by n. Outbreak years are years in which either three (pointer year, morphological signature, and regional host) or two criteria
(pointer year and morphological signature or regional host) indicate an outbreak event. Black bars indicate statistical significant
departures from the mean (95% confidence interval).
I N S E C T O U T B R E A K S A N D C L I M A T E I N S O U T H A M E R I C A 251
r 2010 Blackwell Publishing Ltd, Global Change Biology, 17, 239–253

field and in the lab we are grateful to C. Quintero, D. Marini,A. Meyer, J. Lariviere, E. Stuffings, and M. DePaz. For help withfield logistics we thank M. Mermoz, S. Queiro, M. Paritsis,A. Quintero, C. Duprez, and B. Dim. This research was finan-cially supported by the US National Science Foundation (No.0602164) and a Beverly Sears Graduate Student Grant (GraduateSchool of the University of Colorado). The Argentinean NationalPark Service Administration granted permission to sample in theNahuel Huapi and Los Glaciares National Parks.
References
Aceituno P (1988) On the functioning of the Southern Oscillation in the South
American sector. Monthly Weather Review, 116, 505–524.
Allan R (2000) ENSO and climatic variability in the past 150 years. In: El Nino and the
Southern Oscillation: Multiscale Variability and Global and Regional Impacts (eds Diaz
H, Markgraf V), pp. 3–35. Cambridge University Press, Cambridge, UK.
Aravena JC, Luckman BH (2009) Spatio-temporal rainfall patterns in Southern South
America. International Journal of Climatology, 29, 2106–2120.
Artigas J (1972) Ritmos poblacionales de Lepidopteros de interes agrıcola. Boletın de la
Sociedad Biologica de Concepcion (Chile), 45, 5–94.
Ayres MP, Lombardero MJ (2000) Assessing the consequences of global change for
forest disturbance from herbivores and pathogens. The Science of the Total Environ-
ment, 262, 263–286.
Baldini A, Alvarado A (2008) Manual de plagas y enfermedades del bosque nativo en Chile.
Asistencia para la recuperacion y revitalizacion de los bosques templados de Chile, con
enfasis en los Nothofagus caducifolios. FAO/CONAF, Santiago de Chile.
Barbosa P, Schultz JC (eds) (1987) Insect Outbreaks: Ecological and Evolutionary Perspec-
tives. Academic Press, London.
Barros V, Cordon V, Moyano C, Mendez R, Forquera J, Pizzio O (1983) Cartas de
precipitacion de la zona oeste de las provincias de Rıo Negro y Neuquen. Report to the
Facultad de Ciencias Agrarias, Universidad Nacional del Comahue, Cinco Saltos,
Neuquen.
Bauerle P, Rutherford P, Lanfranco D (1997) Defoliadores de roble (Nothofagus
obliqua), rauli (N. alpina), coigue (N. dombeyi) y lenga (N. pumilio). Bosque, 18,
97–107.
Berg EE, Henry JD, Fastie CL, De Volder AD, Matsuoka SM (2006) Spruce beetle
outbreaks on the Kenai Peninsula, Alaska, and Kluane National Park and Reserve,
Yukon Territory: relationship to summer temperatures and regional differences in
disturbance regimes. Forest Ecology and Management, 227, 219–232.
Biondi F, Waikul K (2004) DENDROCLIM2002: a C 1 1 program for statistical
calibration of climate signals in tree-ring chronologies. Computers & Geosciences,
30, 303–311.
Boninsegna J, Holmes R (1974) Nothofagus pumilio Tree-Ring Chronology, Cerro Buenos
Aires, Santa Cruz. IGBP PAGES/World Data Center for Paleoclimatology. NOAA/
NCDC Paleoclimatology Program, Boulder.
Buntgen U, Frank D, Liebhold A et al. (2009) Three centuries of insect outbreaks across
the European Alps. New Phytologist, 182, 929–941.
Carril AF, Menendez CG, Nunez MN (1997) Climate change scenarios over the South
American region: an intercomparison of coupled general atmosphere–ocean circu-
lation models. International Journal of Climatolo, 17, 1613–1633.
Carrillo R, Cerda L (1987) Zoofitofagos en Nothofagus chilenos. Bosque, 8, 99–103.
Cook ER, Holmes RL (1986) Users manual for program ARSTAN. In: Tree-Ring
Chronologies of Western North America: California, Eastern Oregon and Northern Great
Basin (eds Holmes RL, Adams RK, Fritts HC), pp. 50–65. Laboratory of Tree-Ring
Research, the University of Arizona, Tucson.
Daniels LD, Veblen TT (2000) ENSO effects on temperature and precipitation of the
Patagonian–Andean region: implications for biogeography. Physical Geography, 21,
223–243.
Daniels LD, Veblen TT (2004) Spatiotemporal influences of climate on altitudinal
treeline in northern Patagonia. Ecology, 85, 1284–1296.
D’Arrigo R, Cook ER, Wilson RJ, Allan R, Mann ME (2005) On the variability of ENSO
over the past six centuries. Geophysical Research Letters, 32, L03711, doi: 10.1029/
2004GL022055.
Fogt RL, Perlwitz J, Monaghan AJ, Bromwich DH, Jones JM, Marshall GJ (2009)
Historical SAM variability. Part II: twentieth-century variability and trends from
reconstructions, observations, and the IPCC AR4 models. Journal of Climate, 22,
5346–5365.
Forcada J, Trathan PN (2009) Penguin responses to climate change in the Southern
Ocean. Global Change Biology, 15, 1618–1630.
Garreaud RD, Vuille M, Compagnucci R, Marengo J (2009) Present-day South
American climate. Palaeogeography Palaeoclimatology Palaeoecology, 281, 180–195.
Gea-Izquierdo G, Pastur GM, Cellini JM, Lencinas MV (2004) Forty years of silvicul-
tural management in southern Nothofagus pumilio primary forests. Forest Ecology and
Management, 201, 335–347.
Gergis JL, Fowler AM (2009) A history of ENSO events since AD 1525: implications for
future climate change. Climatic Change, 92, 343–387.
Gillett NP, Kell TD, Jones PD (2006) Regional climate impacts of the Southern Annular
Mode. Geophysical Research Letters, 33, L23704, doi: 10.1029/2006GL027721.
Gong DY, Wang SW (1999) Definition of Antarctic Oscillation Index. Geophysical
Research Letters, 26, 459–462.
Grissino-Mayer HD (1995) Tree-ring reconstructions of climate and fire history at El Malpaıs
National Monument, New Mexico. PhD Dissertation, University of Arizona, Tucson,
405 pp.
Hebertson EG, Jenkins MJ (2008) Climate factors associated with historic spruce beetle
(Coleoptera: Curculionidae) outbreaks in Utah and Colorado. Environmental
Entomology, 37, 281–292.
Hogg EH, Hart M, Lieffers VJ (2002) White tree rings formed in trembling aspen
saplings following experimental defoliation. Canadian Journal of Forest Research, 32,
1929–1934.
Holmes RL (1983) Computer-assisted quality control in tree-ring dating and measure-
ment. Tree-Ring Bulletin, 43, 69–75.
Holmes RL, Ambrose JE, Boninsegna JA (1984) Nothofagus pumilio Tree-Ring Chronol-
ogy, Cerro Buenos Aires, Santa Cruz. IGBP PAGES/World Data Center for Paleoclimatol-
ogy. NOAA/NCDC Paleoclimatology Program, Boulder.
Holz A (2009) Climatic and Human Influences on Fire Regimes and Forest Dynamics
in Temperate Rainforests in Southern Chile, Unpublished PhD University of
Colorado, Boulder.
Hosking GP, Hutcheson JA (1988) Mountain beech (Nothofagus solandri var cliffortioides)
decline in the Kaweka range, north island, New Zealand. New Zealand Journal of
Botany, 26, 393–400.
Hosking GP, Kershaw DJ (1985) Red beech death in the Maruia valley, South Island,
New Zealand. New Zealand Journal of Botany, 23, 201–211.
Huberty AF, Denno RF (2004) Plant water stress and its consequences for herbivorous
insects: a new synthesis. Ecology, 85, 1383–1398.
IPCC (2007) Climate change 2007: synthesis report. In: IPCC Fourth Assessment Report
(eds Pachauri RK, Reisinger A), pp. 26–73. Cambridge University Press, Cam-
bridge, UK.
Jane GT, Green TGA (1983) Episodic forest mortality in the Kaimai Ranges, North
Island, New Zealand. New Zealand Journal of Botany, 21, 21–31.
Jepsen JU, Hagen SB, Ims RA, Yoccoz NG (2008) Climate change and outbreaks of the
geometrids Operophtera brumata and Epirrita autumnata in subarctic birch forest:
evidence of a recent outbreak range expansion. Journal of Animal Ecology, 77,
257–264.
Kitzberger T, Veblen TT, Villalba R (1997) Climatic influences on fire regimes along a
rain forest to xeric woodland gradient in northern Patagonia, Argentina. Journal of
Biogeography, 24, 35–47.
Lemaire C (2002) The Saturniidae of America. Les Saturniidae Americains. Druckhaus
Frankenbach, Lindenberg.
Logan JA, Regniere J, Powell JA (2003) Assessing the impacts of global warming on
forest pest dynamics. Frontiers in Ecology and the Environment, 1, 130–137.
Manion PD (1981) Tree Disease Concept. Prentice-Hall, Englewood Cliffs, NJ.
Marshall GJ (2003) Trends in the southern annular mode from observations and
reanalyses. Journal of Climate, 16, 4134–4143.
Miller RL, Schmidt GA, Shindell DT (2006) Forced annular variations in the 20th
century intergovernmental panel on climate change fourth assessment report
models. Journal of Geophysical Research-Atmospheres, 111, D18101, doi: 10.1029/
2005JD006323.
Murua R, Gonzalez LA, Lima M (2003) Population dynamics of rice rats (a Hantavirus
reservoir) in southern Chile: feedback structure and non-linear effects of climatic
oscillations. Oikos, 102, 137–145.
Paritsis J (2009) Insect Defoliator Outbreaks and Environmental Heterogeneity in
Nothofagus Forests in the Patagonian Andes, Unpublished PhD University of
Colorado, Boulder.
Paritsis J, Elgueta M, Quintero C, Veblen TT New host-plant records for the defoliator
Ormiscodes amphimone (Fabricius) (Lepidoptera: Saturniidae). Neotropical Entomol-
ogy, (in press).
252 J . PA R I T S I S & T . T . V E B L E N
r 2010 Blackwell Publishing Ltd, Global Change Biology, 17, 239–253

Paritsis J, Veblen TT, Kitzberger T (2009) Assessing dendroecological methods to
reconstruct defoliator outbreaks on Nothofagus pumilio in northwestern Patagonia,
Argentina. Canadian Journal of Forest Research, 39, 1617–1629.
Peltonen M, Liebhold AM, Bjornstad ON, Williams DW (2002) Spatial synchrony in forest
insect outbreaks: roles of regional stochasticity and dispersal. Ecology, 83, 3120–3129.
Queiro SM (2003) Untitled report no. 39/03. Administracion de Parques Nacionales,
Parque Nacional Los Glaciares, Chalten, Argentina.
Raffa KF, Aukema BH, Bentz BJ, Carroll AL, Hicke JA, Turner MG, Romme WH (2008)
Cross-scale drivers of natural disturbances prone to anthropogenic amplification:
the dynamics of bark beetle eruptions. Bioscience, 58, 501–517.
Rauchfuss J, Ziegler SS, Speer JH, Siegert NW (2009) Dendroecological analysis of
spruce budworm outbreaks and their relation to climate near the prairie-forest
border in northwestern Minnesota. Physical Geography, 30, 185–204.
Roig FA (1986) Nothofagus pumilio Tree-Ring Chronology, Paso Cordoba, Neuquen. IGBP
PAGES/World Data Center for Paleoclimatology. NOAA/NCDC Paleoclimatology
Program, Boulder.
Rouault G, Candau JN, Lieutier F, Nageleisen LM, Martin JC, Warzee N (2006) Effects
of drought and heat on forest insect populations in relation to the 2003 drought in
Western Europe. Annals of Forest Science, 63, 613–624.
Schoennagel T, Veblen TT, Kulakowski D, Holz A (2007) Multidecadal climate
variability and climate interactions affect subalpine fire occurrence, Western Color-
ado (USA). Ecology, 88, 2891–2902.
Schulman E (1956) Dendroclimatic Change in Semiarid America. University of Arizona
Press, Tucson.
Stokes MA, Smiley TL (1968) An Introduction to Tree-Ring Dating. University of Chicago
Press, Chicago.
Suarez ML, Ghermandi L, Kitzberger T (2004) Factors predisposing episodic drought-
induced tree mortality in Nothofagus – site, climatic sensitivity and growth trends.
Journal of Ecology, 92, 954–966.
Swetnam TW, Lynch AM (1993) Multicentury, regional-scale patterns of western
spruce budworm outbreaks. Ecological Monographs, 63, 399–424.
Swetnam TW, Thompson MA, Sutherland EK (1985) Spruce Budworms Handbook: Using
Dendrochronolgy to Measure Radial Growth of Defoliated Trees. Agriculture Handbook No.
639. Cooperative State Research Service, Forest Service, USDA, Washington, DC.
Thompson DWJ, Solomon S (2002) Interpretation of recent Southern Hemisphere
climate change. Science, 296, 895–899.
Thomson AJ, Shepherd RF, Harris JWE, Silversides RH (1984) Relating weather to
outbreaks of western spruce budworm, Choristoneura occidentalis (Lepidoptera:
Tortricidae) in British Columbia. Canadian Entomologist, 116, 375–381.
Veblen TT, Donoso C, Kitzberger T, Rebertus AJ (1996) Ecology of southern Chilean
and Argentinean Nothofagus forests. In: The Ecology and Biogeography of Nothofagus
Forests (eds Veblen TT, Hill RS, Read J), pp. 293–353. Yale University Press, New
Haven.
Veblen TT, Kitzberger T, Villalba R, Donnegan J (1999) Fire history in northern Patagonia:
the role of humans and climatic variation. Ecological Monographs, 69, 47–67.
Vera C, Silvestri G, Liebmann B, Gonzalez P (2006) Climate change scenarios for
seasonal precipitation in South America from IPCC-AR4 models. Geophysical
Research Letters, 33, L13707, doi: 10.1029/2006GL025759.
Villalba R (1994) Tree-ring and glacial evidence for the Medieval Warm Epoch and the
little ice age in southern South America. Climatic Change, 26, 183–197.
Villalba R, Boninsegna JA, Veblen TT, Schmelter A, Rubulis S (1997a) Recent trends in
tree-ring records from high elevation sites in the Andes of northern Patagonia.
Climate Change, 36, 425–454.
Villalba R, Cook ER, D’Arrigo RD, Jacoby GC, Jones PD, Salinger MJ, Palmer J (1997b)
Sea-level pressure variability around Antarctica since A.D. 1750 inferred from
subantarctic tree-ring records. Climate Dynamics, 13, 375–390.
Villalba R, Lara A, Boninsegna JA et al. (2003) Large-scale temperature changes across
the southern Andes: 20th-century variations in the context of the past 400 years.
Climatic Change, 59, 177–232.
Villalba R, Veblen TT (1997) Spatial and temporal variation in Austrocedrus growth
along the forest-steppe ecotone in northern Patagonia. Canadian Journal of Forest
Research, 27, 580–597.
Villalba R, Veblen TT (1998) Influences of large-scale climatic variability on episodic
tree mortality in Northern Patagonia. Ecology, 79, 2624–2640.
Weber UM, Schweingruber FH (1995) A dendroecological reconstruction of western
spruce budworm outbreaks (Choristoneura occidentalis) in the front range, Colorado,
from 1720 to 1986. Trees-Structure and Function, 9, 204–213.
Wilson AM, Latimer AM, Silander JA, Gelfand AE, de Klerk H (2010) A hierarchical
Bayesian model of wildfire in a Mediterranean biodiversity hotspot: implications of
weather variability and global circulation. Ecological Modelling, 221, 106–112.
Zhang QB, Alfaro RI (2003) Spatial synchrony of the two-year cycle budworm
outbreaks in central British Columbia, Canada. Oikos, 102, 146–154.
I N S E C T O U T B R E A K S A N D C L I M A T E I N S O U T H A M E R I C A 253
r 2010 Blackwell Publishing Ltd, Global Change Biology, 17, 239–253