Demon Voltammetry and Analysis software: Analysis of cocaine-induced alterations in dopamine...
15
Demon voltammetry and analysis software: Analysis of cocaine- induced alterations in dopamine signaling using multiple kinetic measures Jordan T. Yorgason 1,2 , Rodrigo A. España 1 , and Sara R. Jones 1,2 Jordan T. Yorgason: [email protected]; Rodrigo A. España: [email protected]; Sara R. Jones: [email protected] 1 Department of Physiology and Pharmacology, Wake Forest University Health Sciences, Medical Center Boulevard, Winston-Salem, North Carolina, 27157, USA 2 Neuroscience Program, Wake Forest University Health Sciences, Medical Center Boulevard, Winston-Salem, North Carolina, 27157, USA Abstract The fast sampling rates of fast scan cyclic voltammetry make it a favorable method for measuring changes in brain monoamine release and uptake kinetics in slice, anesthetized, and freely moving preparations. The most common analysis technique for evaluating changes in dopamine signaling uses well-established Michaelis-Menten kinetic methods that can accurately model dopamine release and uptake parameters across multiple experimental conditions. Nevertheless, over the years, many researchers have turned to other measures to estimate changes in dopamine release and uptake, yet to our knowledge no systematic comparison amongst these measures has been conducted. To address this lack of uniformity in kinetic analyses, we have created the Demon Voltammetry and Analysis software suite, which is freely available to academic and non-profit institutions. Here we present an explanation of the Demon Acquisition and Analysis features, and demonstrate its utility for acquiring voltammetric data under in vitro, in vivo anesthetized, and freely moving conditions. Additionally, the software was used to compare the sensitivity of multiple kinetic measures of release and uptake to cocaine-induced changes in electrically evoked dopamine efflux in nucleus accumbens core slices. Specifically, we examined and compared tau, full width at half height, half-life, T 20 , T 80 , slope, peak height, calibrated peak dopamine concentration, and area under the curve to the well-characterized Michaelis-Menten parameters, dopamine per pulse, maximal uptake rate, and apparent affinity. Based on observed results we recommend tau for measuring dopamine uptake and calibrated peak dopamine concentration for measuring dopamine release. Keywords Demon Voltammetry; cocaine; dopamine; fast scan cyclic voltammetry; software; kinetic analyses; dopamine transporter; Michaelis-Menten © 2011 Elsevier B.V. All rights reserved. Corresponding Author: Sara R. Jones, Ph.D., Wake Forest University Health Sciences, Department of Physiology and Pharmacology, Medical Center Boulevard, Winston-Salem, NC 27157, Office: 336-716-8533, Fax: 336-716-8501, [email protected]. Publisher's Disclaimer: This is a PDF file of an unedited manuscript that has been accepted for publication. As a service to our customers we are providing this early version of the manuscript. The manuscript will undergo copyediting, typesetting, and review of the resulting proof before it is published in its final citable form. Please note that during the production process errors may be discovered which could affect the content, and all legal disclaimers that apply to the journal pertain. NIH Public Access Author Manuscript J Neurosci Methods. Author manuscript; available in PMC 2012 November 15. Published in final edited form as: J Neurosci Methods. 2011 November 15; 202(2): 158–164. doi:10.1016/j.jneumeth.2011.03.001. NIH-PA Author Manuscript NIH-PA Author Manuscript NIH-PA Author Manuscript
-
Upload
independent -
Category
Documents
-
view
1 -
download
0
Transcript of Demon Voltammetry and Analysis software: Analysis of cocaine-induced alterations in dopamine...
Demon voltammetry and analysis software: Analysis of cocaine-induced alterations in dopamine signaling using multiple kineticmeasures
Jordan T. Yorgason1,2, Rodrigo A. España1, and Sara R. Jones1,2
Jordan T. Yorgason: [email protected]; Rodrigo A. España: [email protected]; Sara R. Jones:[email protected] Department of Physiology and Pharmacology, Wake Forest University Health Sciences, MedicalCenter Boulevard, Winston-Salem, North Carolina, 27157, USA2 Neuroscience Program, Wake Forest University Health Sciences, Medical Center Boulevard,Winston-Salem, North Carolina, 27157, USA
AbstractThe fast sampling rates of fast scan cyclic voltammetry make it a favorable method for measuringchanges in brain monoamine release and uptake kinetics in slice, anesthetized, and freely movingpreparations. The most common analysis technique for evaluating changes in dopamine signalinguses well-established Michaelis-Menten kinetic methods that can accurately model dopaminerelease and uptake parameters across multiple experimental conditions. Nevertheless, over theyears, many researchers have turned to other measures to estimate changes in dopamine releaseand uptake, yet to our knowledge no systematic comparison amongst these measures has beenconducted. To address this lack of uniformity in kinetic analyses, we have created the DemonVoltammetry and Analysis software suite, which is freely available to academic and non-profitinstitutions. Here we present an explanation of the Demon Acquisition and Analysis features, anddemonstrate its utility for acquiring voltammetric data under in vitro, in vivo anesthetized, andfreely moving conditions. Additionally, the software was used to compare the sensitivity ofmultiple kinetic measures of release and uptake to cocaine-induced changes in electrically evokeddopamine efflux in nucleus accumbens core slices. Specifically, we examined and compared tau,full width at half height, half-life, T20, T80, slope, peak height, calibrated peak dopamineconcentration, and area under the curve to the well-characterized Michaelis-Menten parameters,dopamine per pulse, maximal uptake rate, and apparent affinity. Based on observed results werecommend tau for measuring dopamine uptake and calibrated peak dopamine concentration formeasuring dopamine release.
KeywordsDemon Voltammetry; cocaine; dopamine; fast scan cyclic voltammetry; software; kineticanalyses; dopamine transporter; Michaelis-Menten
© 2011 Elsevier B.V. All rights reserved.Corresponding Author: Sara R. Jones, Ph.D., Wake Forest University Health Sciences, Department of Physiology and Pharmacology,Medical Center Boulevard, Winston-Salem, NC 27157, Office: 336-716-8533, Fax: 336-716-8501, [email protected]'s Disclaimer: This is a PDF file of an unedited manuscript that has been accepted for publication. As a service to ourcustomers we are providing this early version of the manuscript. The manuscript will undergo copyediting, typesetting, and review ofthe resulting proof before it is published in its final citable form. Please note that during the production process errors may bediscovered which could affect the content, and all legal disclaimers that apply to the journal pertain.
NIH Public AccessAuthor ManuscriptJ Neurosci Methods. Author manuscript; available in PMC 2012 November 15.
Published in final edited form as:J Neurosci Methods. 2011 November 15; 202(2): 158–164. doi:10.1016/j.jneumeth.2011.03.001.
NIH
-PA Author Manuscript
NIH
-PA Author Manuscript
NIH
-PA Author Manuscript
1. IntroductionFast scan cyclic voltammetry (FSCV) is an electrochemical detection technique that isacclaimed for its ability to measure presynaptic monoamine activity with high temporal andspatial resolution. It also provides information about transporter kinetics, as well aspresynaptic auto-receptor and hetero-receptor activity (Fawaz et al., 2009; Jones et al., 1999;Jones et al., 1996). In this technique, a potentiostat is used to pass a voltage ramp rapidlyacross a carbon-fiber electrode, while measuring the resultant current. During this voltageramp, nearby electroactive chemical species, such as monoamines, adenosine, 3,4-dihydroxyphenylacetic acid (DOPAC) or ascorbate, are oxidized/reduced resulting inchanges in current amplitude that are proportional to the concentration of the species (Heienet al., 2003; Swamy and Venton, 2007). The current readout during the voltage ramp isreferred to as a voltammogram which is collected and compared across time to determinechanges in concentrations of electroactive species. Because of its high temporal resolution,voltammetry is an ideal technique for measuring rapid presynaptic signaling events in thebrain during in vitro, in vivo anesthetized, and freely moving experiments.
One common application of voltammetry methods is to measure dopamine (DA) release andtransporter activity in limbic brain regions. By electrically stimulating DA overflow, one canassess exocytotic release during the rising phase of the overflow, and uptake kinetics of DAtransporters during the falling phase. The most commonly used kinetic analysis forevaluating changes in DA release and uptake rates uses methods established in anesthetizedrats employing electrically evoked DA release (Wightman et al., 1988; Wightman andZimmerman, 1990). Under these conditions, it is possible to elicit high enough DAconcentrations that uptake can be saturated, thus allowing data to be fitted to a Michaelis-Menten kinetic model. Unfortunately, under some conditions, transient DA release events donot reach concentrations that saturate uptake, and therefore Michaelis-Menten-based curvefitting programs cannot be used reliably (Garris et al., 2003; Robinson and Wightman, 2007;Wightman et al., 1988; Wightman and Zimmerman, 1990). Consequently, researchers haveturned to other measures to estimate changes in DA uptake, including tau, full width at halfheight (FWHH), half-life, T20, T80, slope, peak height, calibrated peak dopamineconcentration ([DAc]), and area under the curve (AUC). While these methods may be valid,to our knowledge no systematic comparison amongst these measures has been conducted forvoltammetry data, and certainly no standard measure has been established. Further, there iscurrently no comprehensive, commercially available kinetic analysis software programavailable for voltammetry data, and thus these types of assessments tend to be cumbersomeand difficult to compare across laboratories.
Accordingly, we have embarked on an extensive project to develop freely availablevoltammetry acquisition and analysis software that provides reliable and efficient dataanalysis. In the present study, we confirmed that our software is compatible with existinghardware and is capable of detecting and quantifying electrically evoked DA release anduptake. The Demon Voltammetry and Analysis software suite (Demon Voltammetry) isavailable at no cost to academic and nonprofit entities athttp://www.wfubmc.edu/OTAM/Technologies/Computer-Software-and-copyright.htm#Demon.
2. Material and methods2.1 Hardware
Two National Instruments data acquisition cards (NI-DAQ; PCI-6711 and PCI-6052e;National Instruments, Austin, TX) were used for interfacing Demon Voltammetry with aChem-Clamp potentiostat (Dagan Corporation; Minneapolis, MN) for voltammetric
Yorgason et al. Page 2
J Neurosci Methods. Author manuscript; available in PMC 2012 November 15.
NIH
-PA Author Manuscript
NIH
-PA Author Manuscript
NIH
-PA Author Manuscript
recordings. Other similar NI-DAQ cards may be used as well. The Chem-Clamp wasmodified to have a gain range of 0.005 to 8.0 mV/pA, and a headstage with 5 MOhmresistance. The NI-DAQ cards contain multiple on-board high speed clocks, and several 16bit analog outputs/inputs suitable for generating potential sweeps and acquiringvoltammograms at high rates (>100kHz) while performing electrical stimulations forevoking DA release. NI-DAQ cards were connected to the potentiostat via specializedbreakout boxes created locally from 2 NI-DAQ CB-68LPR screw terminals.
2.2 SoftwareDemon Voltammetry has been developed for data collection, analysis, and figure making.This suite was written in the graphical programming language, LabView (NationalInstruments). It contains several new features that were used in this publication as well asmany other features which we use regularly. The acquisition portion of Demon Voltammetrycontains stimulation settings designed for performing paired pulse stimulations, and burststimulation trains, which allow the user to designate intervals between either single pulses orconfigured stimulation trains. Such trains have been shown to be useful for measuringautoreceptor activity (Bao et al., 2010; Kennedy et al., 1992). Demon Voltammetry alsoincorporates acquisition features for automated data collection, including timed multiplecollections, providing controls for specifying collection durations, intervals, and number offiles to collect for an experiment. Additionally, the software contains an integrated routinebuilder which assists in designing more complex experiments with variable stimulationoccurrences, collection times, durations, and intervals between files. These parameters areintegrated with digital event generation/registration such that TTL pulse information fromexternal devices are recorded and stored within each file. This information is useful forrecording behavioral cue presentations and operant responses, and communicatingstimulation and collection events to external devices, such as drug self-administrationsetups. These latter features are critical for drug studies with time collections at differentintervals, as well as freely moving experiments where DA transient events, cue-evoked, andelectrically stimulated measures are performed in the same animal. Figure 1 shows theDemon Voltammetry user interface for the acquisition portion of the software.
The analysis portion of the software contains many useful tools for examining data,including new peak finding algorithms for detecting evoked and transient neurochemicalsignals at the click of a button. An additional feature uses a three cursor system formeasuring tau, FWHH, half-life, T20, T80, slope, peak height, [DAc], and AUC. All of theseparameters can then be exported to a tab delimited file, compatible with Microsoft Excel®(Redmond, WA). Another part of the analysis software contains a Michaelis-Mentenmodeling utility, using previously published algorithms to derive information about DA perpulse [DAp], maximal uptake rate Vmax, and apparent affinity Km (Wightman et al., 1988;Wightman and Zimmerman, 1990; Wu et al., 2001).
Additional features not described explicitly in the current publication include a figuremaking utility that allows for creation of publication quality figures which can be used as-isor exported in various formats for subsequent modification. Additionally, the softwareincludes a well-developed chemometric analysis suite, designed for seamless creation ofchemometric training sets and analysis with either principle component or partial leastsquares regressions (Faber and Rajkó, 2007; Heien et al., 2004; Heien et al., 2005; Hermanset al., 2008; Keithley et al., 2009; Lavine and Workman, 2008). These analyses areextremely useful for extracting information on monoamine concentrations in the presence ofinterference from pH and other species, especially in freely moving preparations.
Yorgason et al. Page 3
J Neurosci Methods. Author manuscript; available in PMC 2012 November 15.
NIH
-PA Author Manuscript
NIH
-PA Author Manuscript
NIH
-PA Author Manuscript
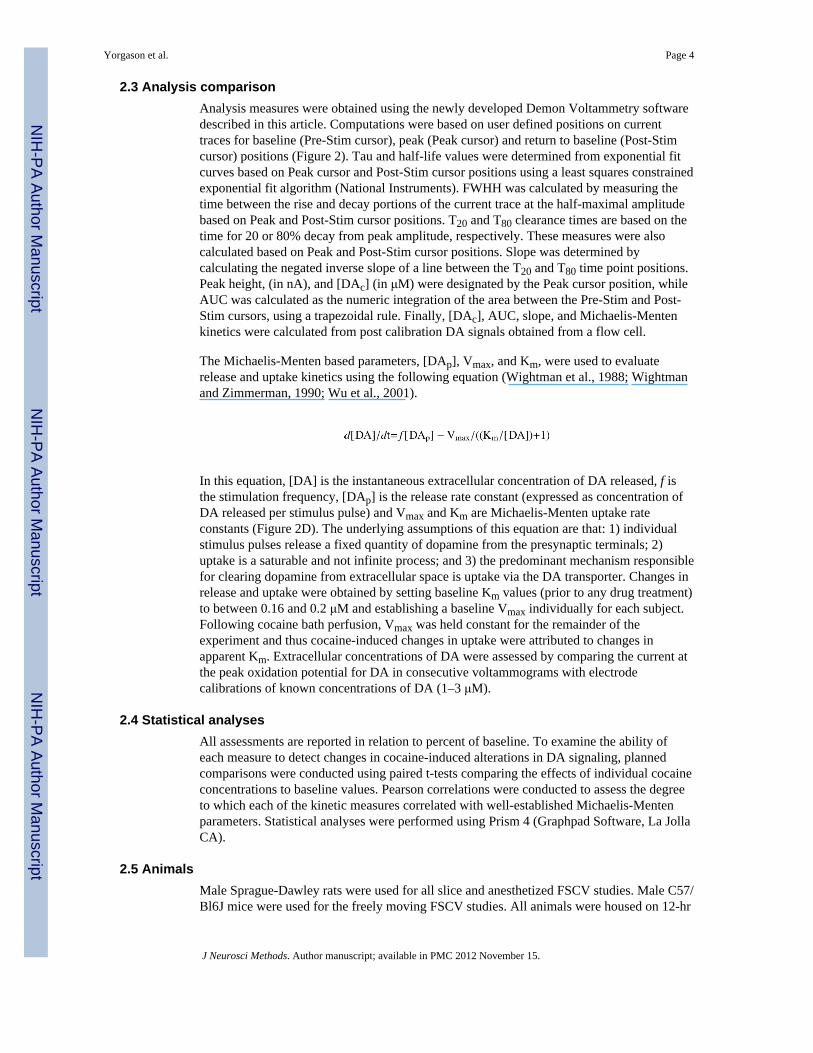
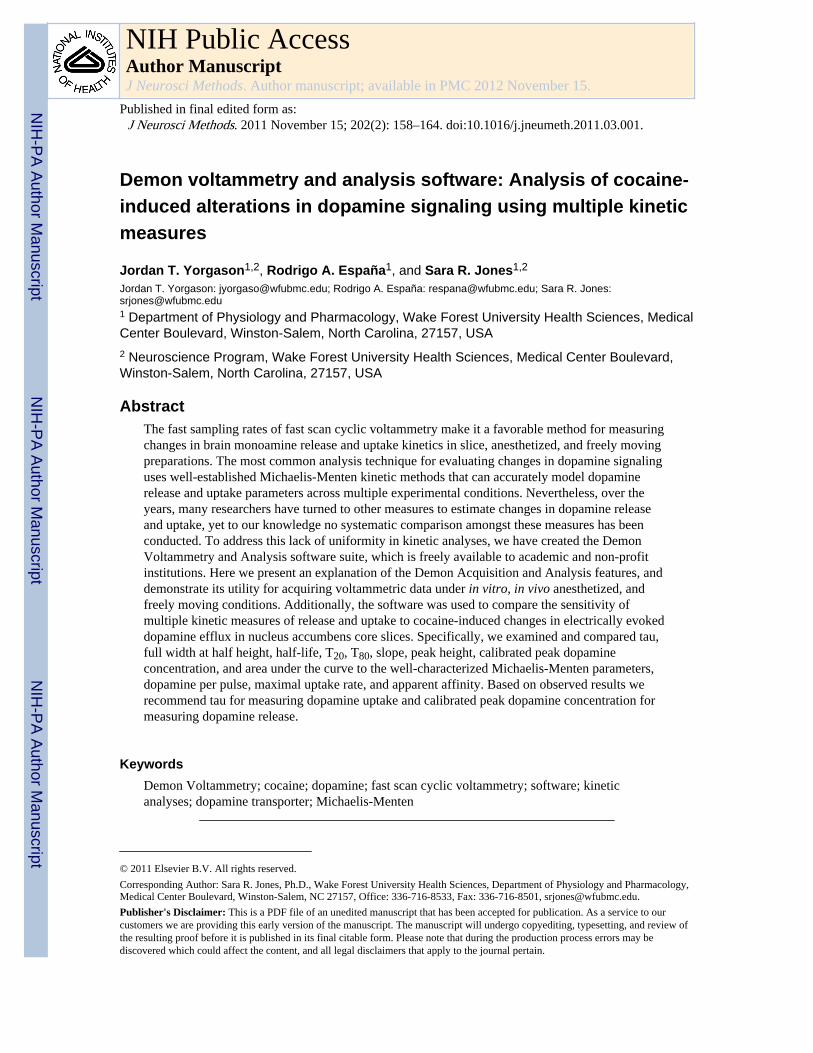
2.3 Analysis comparisonAnalysis measures were obtained using the newly developed Demon Voltammetry softwaredescribed in this article. Computations were based on user defined positions on currenttraces for baseline (Pre-Stim cursor), peak (Peak cursor) and return to baseline (Post-Stimcursor) positions (Figure 2). Tau and half-life values were determined from exponential fitcurves based on Peak cursor and Post-Stim cursor positions using a least squares constrainedexponential fit algorithm (National Instruments). FWHH was calculated by measuring thetime between the rise and decay portions of the current trace at the half-maximal amplitudebased on Peak and Post-Stim cursor positions. T20 and T80 clearance times are based on thetime for 20 or 80% decay from peak amplitude, respectively. These measures were alsocalculated based on Peak and Post-Stim cursor positions. Slope was determined bycalculating the negated inverse slope of a line between the T20 and T80 time point positions.Peak height, (in nA), and [DAc] (in μM) were designated by the Peak cursor position, whileAUC was calculated as the numeric integration of the area between the Pre-Stim and Post-Stim cursors, using a trapezoidal rule. Finally, [DAc], AUC, slope, and Michaelis-Mentenkinetics were calculated from post calibration DA signals obtained from a flow cell.
The Michaelis-Menten based parameters, [DAp], Vmax, and Km, were used to evaluaterelease and uptake kinetics using the following equation (Wightman et al., 1988; Wightmanand Zimmerman, 1990; Wu et al., 2001).
In this equation, [DA] is the instantaneous extracellular concentration of DA released, f isthe stimulation frequency, [DAp] is the release rate constant (expressed as concentration ofDA released per stimulus pulse) and Vmax and Km are Michaelis-Menten uptake rateconstants (Figure 2D). The underlying assumptions of this equation are that: 1) individualstimulus pulses release a fixed quantity of dopamine from the presynaptic terminals; 2)uptake is a saturable and not infinite process; and 3) the predominant mechanism responsiblefor clearing dopamine from extracellular space is uptake via the DA transporter. Changes inrelease and uptake were obtained by setting baseline Km values (prior to any drug treatment)to between 0.16 and 0.2 μM and establishing a baseline Vmax individually for each subject.Following cocaine bath perfusion, Vmax was held constant for the remainder of theexperiment and thus cocaine-induced changes in uptake were attributed to changes inapparent Km. Extracellular concentrations of DA were assessed by comparing the current atthe peak oxidation potential for DA in consecutive voltammograms with electrodecalibrations of known concentrations of DA (1–3 μM).
2.4 Statistical analysesAll assessments are reported in relation to percent of baseline. To examine the ability ofeach measure to detect changes in cocaine-induced alterations in DA signaling, plannedcomparisons were conducted using paired t-tests comparing the effects of individual cocaineconcentrations to baseline values. Pearson correlations were conducted to assess the degreeto which each of the kinetic measures correlated with well-established Michaelis-Mentenparameters. Statistical analyses were performed using Prism 4 (Graphpad Software, La JollaCA).
2.5 AnimalsMale Sprague-Dawley rats were used for all slice and anesthetized FSCV studies. Male C57/Bl6J mice were used for the freely moving FSCV studies. All animals were housed on 12-hr
Yorgason et al. Page 4
J Neurosci Methods. Author manuscript; available in PMC 2012 November 15.
NIH
-PA Author Manuscript
NIH
-PA Author Manuscript
NIH
-PA Author Manuscript
light-dark cycle with ad libitum access to food and water. Experimental protocols adhered toNational Institutes of Health Animal Care guidelines and were approved by the Wake ForestUniversity Institutional Animal Care and Use Committee.
2.5 Experimental procedures2.5.1 In Vitro voltammetry—Rats were euthanized and their brains rapidly removed andprepared as previously described (John and Jones, 2007). Coronal slices (400 μM) of thestriatum were maintained at room temperature in oxygenated (95% O2–5% CO2) artificialcerebrospinal fluid (aCSF) which consisted of (in mM) NaCl (126), NaHCO3 (25), D-glucose (11), KCl (2.5), CaCl2 (2.4), MgCl2 (1.2), NaH2PO4 (1.2), L-ascorbic acid (0.4), pHadjusted to 7.4. A capillary glass-based carbon-fiber electrode was positioned ~75 μm belowthe surface of the slice in the nucleus accumbens (NAc) core. DA release was evoked every5 min by a 4 ms, one-pulse stimulation (monophasic, 300 μA) from a bipolar stimulatingelectrode (Plastics One) placed 100–200 μm from the carbon-fiber electrode. Drugs wereapplied by superfusion (1 ml/min) using cumulative increases in cocaine concentration (300nM, 1 μM, 3 μM, 10 μM, and 30 μM; John and Jones, 2007; Jones et al., 1995b).
2.5.2 In vivo anesthetized voltammetry—Rats were anesthetized with urethane (1.5 g/kg, i.p.; Sigma-Aldrich, St. Louis, MO, USA) and placed in a stereotaxic apparatus aspreviously described (España et al., 2010a; España et al., 2010b; España et al., 2008). Ratswere implanted with a reference electrode in the left cortex, a bipolar stimulating electrodein the ventral tegmental area (VTA; −5.2 A, +1.1 L, −7.5 V), and a capillary glass-basedcarbon-fiber electrode in the NAc core (+1.3 A, +1.3 L, −4.5 V). Once a 1 sec, 60 Hzmonophasic (4 ms; 300 μA) stimulation train elicited a robust DA signal, DA release anduptake parameters were recorded.
2.5.3 Freely moving voltammetry—Mice were anesthetized using isoflurane anesthesiaand placed in a stereotaxic apparatus. A reference electrode was implanted into the leftcortex, a stimulating electrode was placed into the VTA (−3.0 A, +1.0 L, −4.5 V), and afused silica-based carbon-fiber electrode was placed into the NAc core. Once stimulationparameters were optimized and a 0.4 sec, 60 Hz biphasic (2 ms; 250 μA) stimulation trainelicited a robust DA signal, all implants were cemented into place using acrylic dentalcement as previously described (Clark et al., 2010). Mice were tested within 2–7 daysfollowing recovery and received identical stimulation parameters to elicit DA release.
2.6 Fast scan cyclic voltammetryThe electrode potential was linearly scanned as a triangular waveform from −0.4 to 1.3 Vand back to −0.4 V vs Ag/AgCl using a scan rate of 400 V/s. Cyclic voltammograms wererecorded at the carbon fiber electrode every 100 ms by means of a voltammeter/amperometer (Dagan Corporation).
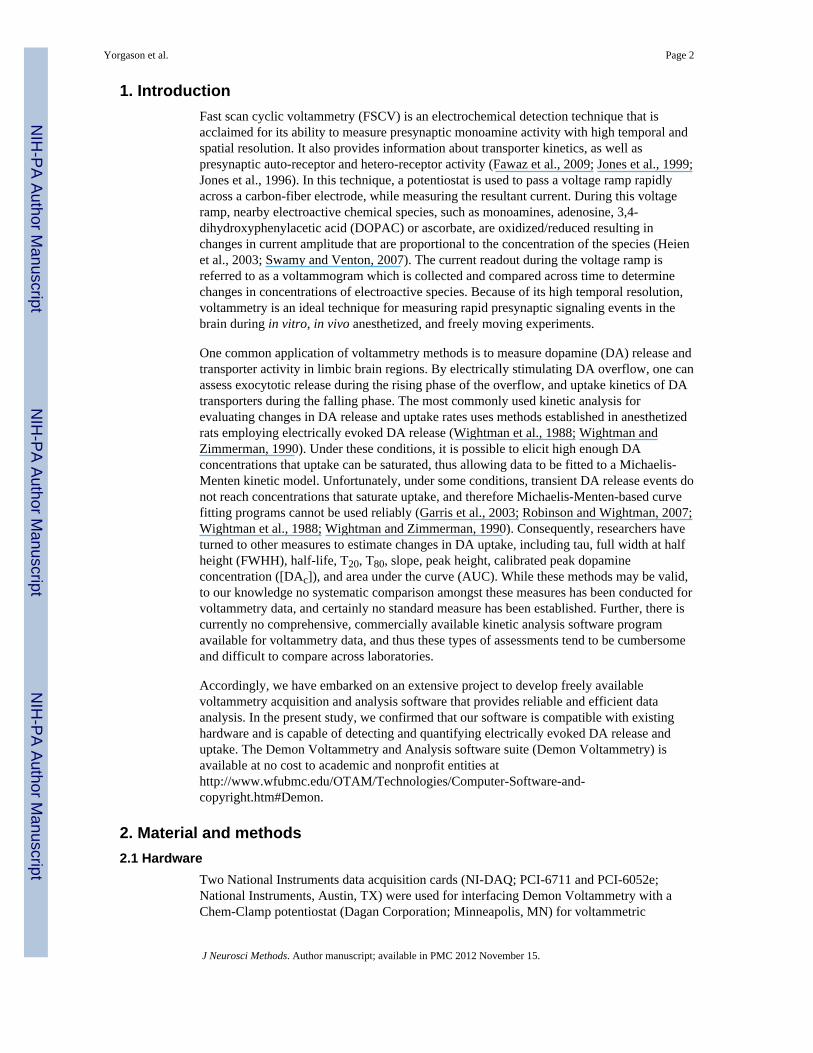
3. ResultsTo validate the utility of Demon Voltammetry we performed FSCV in the NAc core duringin vitro slice, in vivo anesthetized, and freely moving experiments. As shown in Figure 3,Demon Voltammetry was capable of detecting electrically stimulated DA release underthese three conditions. Cyclic voltammograms verify that the electroactive species detectedwas dopamine, with oxidation and reduction peaks at ~ 600 mV and ~ −200 mVrespectively.
Cocaine induced inhibition of DA uptake was measured using in vitro voltammetry in brainslices containing the NAc core, a brain region rich in DA terminals, with well characterized
Yorgason et al. Page 5
J Neurosci Methods. Author manuscript; available in PMC 2012 November 15.
NIH
-PA Author Manuscript
NIH
-PA Author Manuscript
NIH
-PA Author Manuscript
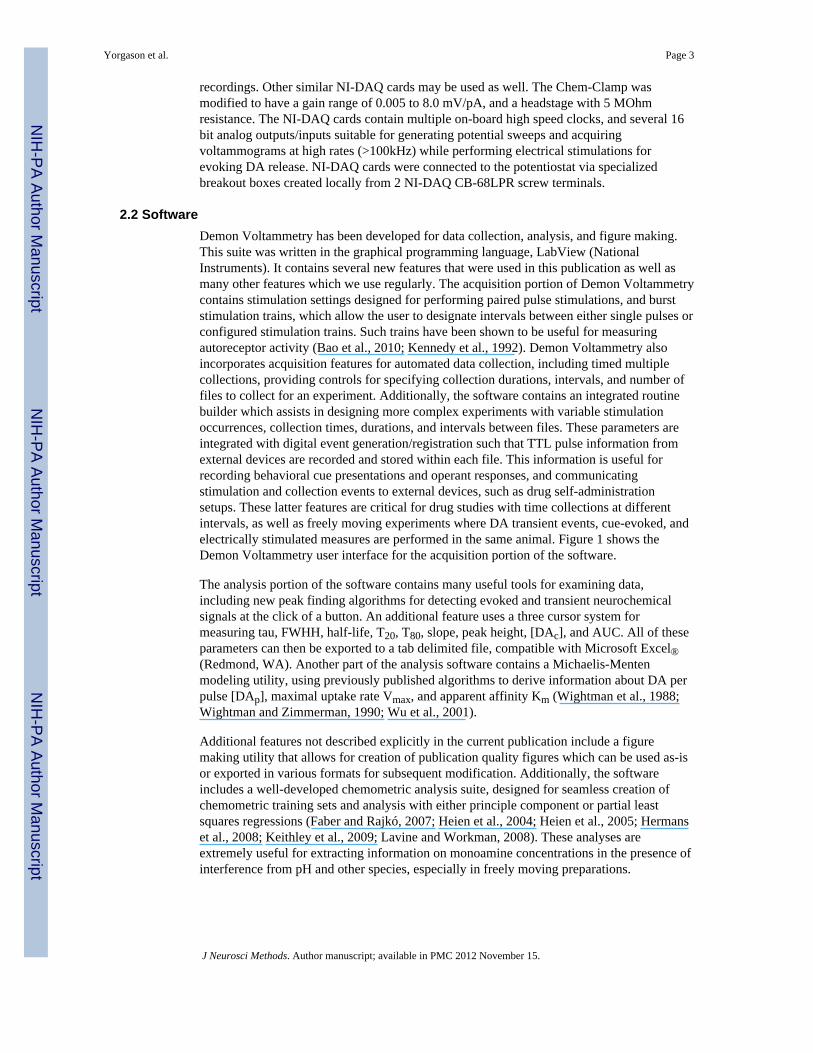
uptake (Garris and Wightman, 1995; Jones et al., 1995a; Jones et al., 1995b; Jones et al.,1996). Figure 4 shows representative electrically evoked (1 pulse) DA traces followingapplication of increasing concentrations of cocaine. To assess the utility of the kineticmeasurements in Demon Voltammetry, the current studies also compared the well-documented Michaelis-Menten parameters of [DAp], Vmax, and Km (Wightman et al., 1988;Wightman and Zimmerman, 1990) to results obtained using analyses of tau, FWHH, half-life, T20, T80, slope, peak height, [DAc], and AUC across increasing concentrations ofcocaine (Figure 5). Results indicate that under baseline conditions, slope was the onlymeasure to be correlated with Vmax, indicating that it might be useful to represent baselinelevels of maximal DA uptake (Table I). Following drug application, all measures detectedcocaine-induced changes in DA uptake inhibition, with slope being the only measure thatfailed to detect changes at low concentrations of cocaine. Peak height, [DAc], and [DAp]exhibited an inverted U shaped response, reflecting typical reductions in stimulated DArelease at high concentrations of cocaine (John and Jones, 2007). AUC also showed adownward deflection, but this effect only occurred at the last concentration examined.Correlations between Michaelis-Menten based parameters and the Demon Voltammetrykinetic measures indicated that tau, FWHH, half-life, T20, T80, and slope were positivelycorrelated with changes in Km. Although these measures were also correlated with changesin [DAp], those negative correlations were generally less robust. By comparison, peakheight, [DAc], and AUC did not correlate with Km, yet both peak height and [DAc] showedrobust positive correlations with [DAp].
4. DiscussionWe have developed Demon Voltammetry and Analysis software to be freely available toacademic and non-profit organizations. This software is particularly useful forneurobiological analyses due to its user-friendly analysis tools for measuring parametersrelating to release and uptake, as well as for its chemometric analysis capabilities.Additionally, Demon Voltammetry contains useful tools for performing paired pulsestimulations, stimulation trains, automated peak amplitude detection, automated datacollection routines, and has integrated digital event generation/registration features. DemonVoltammetry is available at no cost to academic and non-profit entities athttp://www.wfubmc.edu/OTAM/Technologies/Computer-Software-and-copyright.htm#Demon.
In the current studies, we sought to systematically assess the ability of multiple kineticmeasures to detect cocaine-induced alterations in DA signaling and to compare results withwell established Michaelis-Menten kinetic models (Wightman et al., 1988; Wightman andZimmerman, 1990). Tau, FWHH, half-life, T20, and T80, were reliable measures fordetecting changes in DA uptake and were strongly correlated with changes in Km,suggesting that these are accurate measures of DA uptake. Slope did not detect uptakechanges at the lowest cocaine concentration, and therefore may not be as useful as the otherindices for quantifying uptake changes. Peak height and [DAc] were reliable measures ofcocaine-induced increases in the magnitude of DA efflux across cocaine concentrations, andwere strongly correlated with [DAp], suggesting that these are accurate release measures.
4.1 Michaelis-Menten based measuresThe DA transporter is a 12 transmembrane ~ 69kDa enzyme (Kilty et al., 1991) that followstraditional enzyme kinetics, making it a prime candidate for modeling with Michaelis-Menten methods (Wightman et al., 1988; Wightman and Zimmerman, 1990). Indeed,Michaelis-Menten based analyses have been routinely used for modeling changes in DAsignaling in vitro and in vivo (Jones et al., 1995a; Jones et al., 1995b; Jones et al., 1996;Kawagoe et al., 1992; Nah et al., 2009; Robinson et al., 2005; Wightman et al., 1988;
Yorgason et al. Page 6
J Neurosci Methods. Author manuscript; available in PMC 2012 November 15.
NIH
-PA Author Manuscript
NIH
-PA Author Manuscript
NIH
-PA Author Manuscript
Wightman and Zimmerman, 1990; Wu et al., 2001). Despite its well-established utility, DAconcentrations are not always large enough to meet the assumptions of Michaelis-Mentenmodeling in whole animal preparations, especially in freely moving animals where transientand cue evoked DA release events are frequently low in concentration (Robinson andWightman, 2007). Therefore, a variety of measures have surfaced over the years to modelchanges in DA kinetics. To better understand which of the many possible analyses of DArelease and uptake best represents cocaine’s blockade of DA transport, we compared thekinetic measures included in Demon Voltammetry to the Michaelis-Menten parameters[DAp], Vmax, and Km.
4.2 Release and uptake comparisonsIn the present studies we used cocaine as a classical DA transporter inhibitor to producepredictable and well-defined alterations in DA uptake (John and Jones, 2007). Thesechanges in uptake result in a protracted time-course for DA levels to return to baseline. Toestablish the utility of individual kinetic measures used in the literature to model changes inDA release and uptake, we compared tau, FWHH, half-life, T20, T80, and slope to traditionalparameters obtained from Michaelis-Menten modeling. These studies demonstrated that tau,FWHH, half-life, T20, and T80 highly correlate with cocaine-induced changes in apparentKm, indicating that these measures accurately represent changes in uptake. Although slopewas also correlated with Km, this measure was unable to detect changes in uptake at thelowest concentrations of cocaine, displayed the greatest degree of variation betweensubjects, and differed substantially from the other indices at modeling changes in DAsignaling at higher concentrations. Nevertheless, under basal conditions when stimulationintensity is sufficient to produce zero-order kinetics, slope may be a useful measure to detectVmax when calculated over the linear portion of the falling phase of the curve, preferablyduring the initial half of the descent. AUC appears to be a contaminated measurement, as itwas useful at showing expected changes following cocaine application, but was notsignificantly correlated with either [DAp] or Km. Based on these observations, and the factthat tau is derived from an exponential curve fit that encompasses the majority of the DAclearance curve, we recommend it as an initial and accurate measure for changes in DAuptake.
Another aspect of DA signaling that is altered by cocaine is the magnitude of evoked DAoverflow, which reflects both release and uptake. At low concentrations of cocaine (0.3–3μM), DA efflux increases relative to baseline, whereas at higher concentrations (10–30 μM)DA efflux is reduced. To model these changes in amplitude we examined peak height and[DAc] and compared these measures to the Michaelis-Menten parameter, [DAp]. Both peakheight and [DAc] were useful for tracking the well-documented changes in DA amplitudeacross cocaine concentrations (John and Jones, 2007). Additionally, peak height and [DAc]were highly correlated with changes observed using [DAp], indicating that these indiceswould be useful as measurements of DA release. Given that [DAc] takes electrodesensitivity into account with a calibration, we recommend this as a more reliable index ofrelease.
4.3 ConclusionsThe current studies describe a new FSCV acquisition and analysis software suite, DemonVoltammetry and Analysis software, which is freely available to the public. Using thissoftware we successfully detected evoked DA release in the NAc core during in vitro,anesthetized in vivo, and freely moving experiments. Additionally, we conducted a detailedcomparison of multiple kinetic parameters and we recommend tau for measuring DA uptake,and [DAc] for measuring DA release. These findings confirm the utility of DemonVoltammetry for FSCV acquisition and analysis of DA signaling under various experimental
Yorgason et al. Page 7
J Neurosci Methods. Author manuscript; available in PMC 2012 November 15.
NIH
-PA Author Manuscript
NIH
-PA Author Manuscript
NIH
-PA Author Manuscript
conditions. Further the information provided concerning the various indices for measuringrelease and uptake will help to clarify when it is most appropriate to use a particular kineticparameter to describe specific pharmacological effects.
AcknowledgmentsWe would like to thank Erin S. Calipari, Joanne K. Konstantopoulos, James R. Melchior, Paul L. Walsh and Drs.Mark J. Ferris and Kimberly N. Huggins for their patience and willingness to test the software during itsdevelopment stages. Additionally, we would like to thank Dr. R. Mark Wightman for his expert advice andgenerous contribution of the Michaelis-Menten analysis algorithms used in the development of the DemonVoltammetry and analysis software. These studies were supported by K01 DA025279 (R.A.E), R01 DA021325,U01 AA014091, P01 AA17506 (S.R.J.) and P32 AA007565 (J.T.Y.).
ReferencesBao L, Patel JC, Walker RH, Shashidharan P, Rice ME. Dysregulation of striatal dopamine release in a
mouse model of dystonia. Journal of Neurochemistry. 2010; 114:1781–91. [PubMed: 20626557]Clark JJ, Sandberg SG, Wanat MJ, Gan JO, Horne EA, Hart AS, Akers CA, Parker JG, Willuhn I,
Martinez V, Evans SB, Stella N, Phillips PEM. Chronic microsensors for longitudinal, subseconddopamine detection in behaving animals. Nature Methods. 2010; 7:126–9. [PubMed: 20037591]
España RA, Melchior JR, Roberts DCS, Jones SR. Hypocretin 1/orexin A in the ventral tegmental areaenhances dopamine responses to cocaine and promotes cocaine self-administration.Psychopharmacology. 2010a
España RA, Oleson EB, Locke JL, Brookshire BR, Roberts DCS, Jones SR. The hypocretin-orexinsystem regulates cocaine self-administration via actions on the mesolimbic dopamine system. TheEuropean Journal of Neuroscience. 2010b; 31:336–48.
España RA, Roberts DCS, Jones SR. Short-acting cocaine and long-acting GBR-12909 both elicitrapid dopamine uptake inhibition following intravenous delivery. Neuroscience. 2008; 155:250–7.[PubMed: 18597947]
Faber NM, Rajkó R. How to avoid over-fitting in multivariate calibration--the conventional validationapproach and an alternative. Analytica Chimica Acta. 2007; 595:98–106. [PubMed: 17605988]
Fawaz CS, Martel P, Leo D, Trudeau L-E. Presynaptic action of neurotensin on dopamine releasethrough inhibition of D(2) receptor function. BMC Neuroscience. 2009; 10:96. [PubMed:19682375]
Garris PA, Budygin EA, Phillips PEM, Venton BJ, Robinson DL, Bergstrom BP, Rebec GV,Wightman RM. A role for presynaptic mechanisms in the actions of nomifensine and haloperidol.Neuroscience. 2003; 118:819–29. [PubMed: 12710989]
Garris PA, Wightman RM. Distinct pharmacological regulation of evoked dopamine efflux in theamygdala and striatum of the rat in vivo. Synapse (New York, NY). 1995; 20:269–79.
Heien MLAV, Johnson MA, Wightman RM. Resolving neurotransmitters detected by fast-scan cyclicvoltammetry. Analytical Chemistry. 2004; 76:5697–704. [PubMed: 15456288]
Heien MLAV, Khan AS, Ariansen JL, Cheer JF, Phillips PEM, Wassum KM, Wightman RM. Real-time measurement of dopamine fluctuations after cocaine in the brain of behaving rats.Proceedings of the National Academy of Sciences of the United States of America. 2005;102:10023–8. [PubMed: 16006505]
Heien MLAV, Phillips PEM, Stuber GD, Seipel AT, Wightman RM. Overoxidation of carbon-fibermicroelectrodes enhances dopamine adsorption and increases sensitivity. The Analyst. 2003;128:1413–9. [PubMed: 14737224]
Hermans A, Keithley RB, Kita JM, Sombers LA, Wightman RM. Dopamine detection with fast-scancyclic voltammetry used with analog background subtraction. Analytical Chemistry. 2008;80:4040–8. [PubMed: 18433146]
John CE, Jones SR. Voltammetric characterization of the effect of monoamine uptake inhibitors andreleasers on dopamine and serotonin uptake in mouse caudate-putamen and substantia nigra slices.Neuropharmacology. 2007; 52:1596–605. [PubMed: 17459426]
Yorgason et al. Page 8
J Neurosci Methods. Author manuscript; available in PMC 2012 November 15.
NIH
-PA Author Manuscript
NIH
-PA Author Manuscript
NIH
-PA Author Manuscript
Jones SR, Garris PA, Kilts CD, Wightman RM. Comparison of dopamine uptake in the basolateralamygdaloid nucleus, caudate-putamen, and nucleus accumbens of the rat. Journal ofNeurochemistry. 1995a; 64:2581–9. [PubMed: 7760038]
Jones SR, Garris PA, Wightman RM. Different effects of cocaine and nomifensine on dopamineuptake in the caudate-putamen and nucleus accumbens. The Journal of Pharmacology andExperimental Therapeutics. 1995b; 274:396–403. [PubMed: 7616424]
Jones SR, Joseph JD, Barak LS, Caron MG, Wightman RM. Dopamine neuronal transport kinetics andeffects of amphetamine. Journal of Neurochemistry. 1999; 73:2406–14. [PubMed: 10582600]
Jones SR, O’Dell SJ, Marshall JF, Wightman RM. Functional and anatomical evidence for differentdopamine dynamics in the core and shell of the nucleus accumbens in slices of rat brain. Synapse(New York, NY). 1996; 23:224–31.
Kawagoe KT, Garris PA, Wiedemann DJ, Wightman RM. Regulation of transient dopamineconcentration gradients in the microenvironment surrounding nerve terminals in the rat striatum.Neuroscience. 1992; 51:55–64. [PubMed: 1465186]
Keithley RB, Heien ML, Wightman RM. Multivariate concentration determination using principalcomponent regression with residual analysis. Trends in Analytical Chemistry: TRAC. 2009;28:1127–36. [PubMed: 20160977]
Kennedy RT, Jones SR, Wightman RM. Dynamic observation of dopamine autoreceptor effects in ratstriatal slices. Journal of Neurochemistry. 1992; 59:449–55. [PubMed: 1352798]
Kilty JE, Lorang D, Amara SG. Cloning and expression of a cocaine-sensitive rat dopaminetransporter. Science (New York, NY). 1991; 254:578–9.
Lavine B, Workman J. Chemometrics. Analytical Chemistry. 2008; 80:4519–31. [PubMed: 18484744]Nah S-Y, Bhatia KS, Lyles J, Ellinwood EH, Lee TH. Effects of ginseng saponin on acute cocaine-
induced alterations in evoked dopamine release and uptake in rat brain nucleus accumbens. BrainResearch. 2009; 1248:184–90. [PubMed: 19026615]
Robinson DL, Volz TJ, Schenk JO, Wightman RM. Acute ethanol decreases dopamine transportervelocity in rat striatum: in vivo and in vitro electrochemical measurements. Alcoholism, Clinicaland Experimental Research. 2005; 29:746–55.
Robinson, DL.; Wightman, RM. Rapid Dopamine Release in Freely Moving Rats. In: Michael, AC.;Borland, LM., editors. Electrochemical Methods for Neuroscience: Frontiers in Neuroengineering.CRC Press; Boca Raton, FL: 2007.
Swamy BEK, Venton BJ. Subsecond detection of physiological adenosine concentrations using fast-scan cyclic voltammetry. Analytical Chemistry. 2007; 79:744–50. [PubMed: 17222045]
Wightman RM, Amatore C, Engstrom RC, Hale PD, Kristensen EW, Kuhr WG, May LJ. Real-timecharacterization of dopamine overflow and uptake in the rat striatum. Neuroscience. 1988;25:513–23. [PubMed: 3399057]
Wightman RM, Zimmerman JB. Control of dopamine extracellular concentration in rat striatum byimpulse flow and uptake. Brain Research Brain Research Reviews. 1990; 15:135–44. [PubMed:2282449]
Wu Q, Reith ME, Kuhar MJ, Carroll FI, Garris PA. Preferential increases in nucleus accumbensdopamine after systemic cocaine administration are caused by unique characteristics of dopamineneurotransmission. The Journal of Neuroscience: The Official Journal of the Society forNeuroscience. 2001; 21:6338–47. [PubMed: 11487657]
Yorgason et al. Page 9
J Neurosci Methods. Author manuscript; available in PMC 2012 November 15.
NIH
-PA Author Manuscript
NIH
-PA Author Manuscript
NIH
-PA Author Manuscript
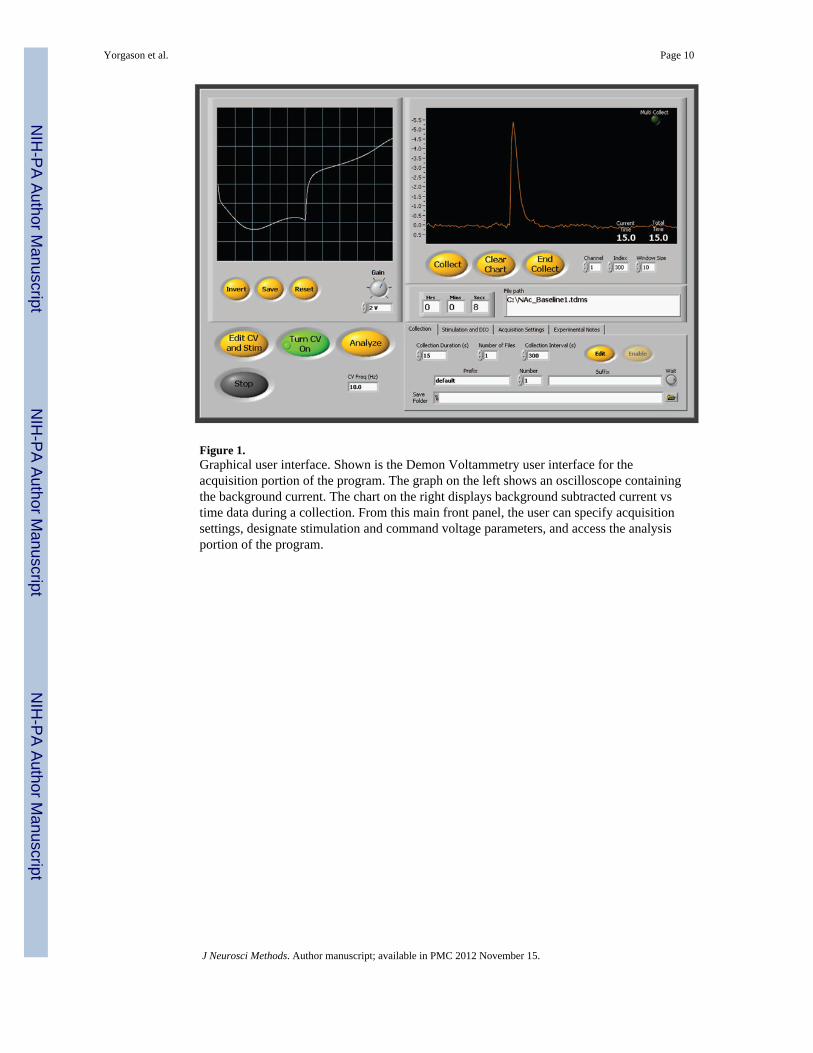
Figure 1.Graphical user interface. Shown is the Demon Voltammetry user interface for theacquisition portion of the program. The graph on the left shows an oscilloscope containingthe background current. The chart on the right displays background subtracted current vstime data during a collection. From this main front panel, the user can specify acquisitionsettings, designate stimulation and command voltage parameters, and access the analysisportion of the program.
Yorgason et al. Page 10
J Neurosci Methods. Author manuscript; available in PMC 2012 November 15.
NIH
-PA Author Manuscript
NIH
-PA Author Manuscript
NIH
-PA Author Manuscript
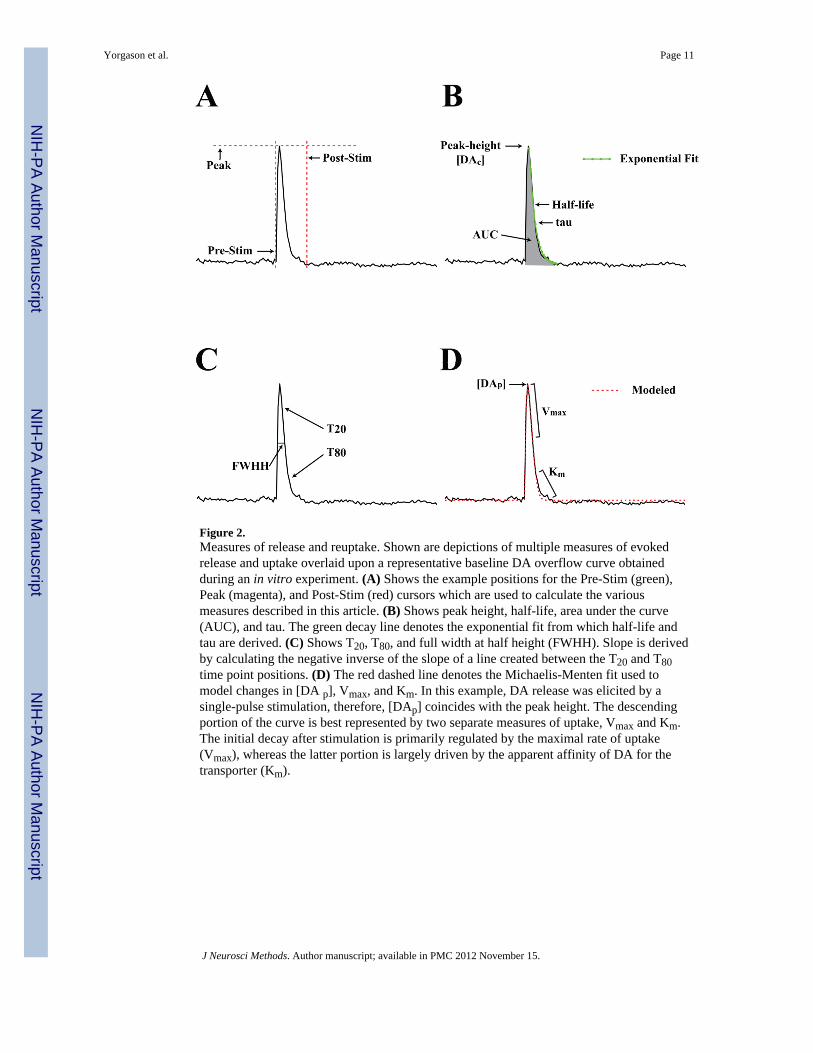
Figure 2.Measures of release and reuptake. Shown are depictions of multiple measures of evokedrelease and uptake overlaid upon a representative baseline DA overflow curve obtainedduring an in vitro experiment. (A) Shows the example positions for the Pre-Stim (green),Peak (magenta), and Post-Stim (red) cursors which are used to calculate the variousmeasures described in this article. (B) Shows peak height, half-life, area under the curve(AUC), and tau. The green decay line denotes the exponential fit from which half-life andtau are derived. (C) Shows T20, T80, and full width at half height (FWHH). Slope is derivedby calculating the negative inverse of the slope of a line created between the T20 and T80time point positions. (D) The red dashed line denotes the Michaelis-Menten fit used tomodel changes in [DA p], Vmax, and Km. In this example, DA release was elicited by asingle-pulse stimulation, therefore, [DAp] coincides with the peak height. The descendingportion of the curve is best represented by two separate measures of uptake, Vmax and Km.The initial decay after stimulation is primarily regulated by the maximal rate of uptake(Vmax), whereas the latter portion is largely driven by the apparent affinity of DA for thetransporter (Km).
Yorgason et al. Page 11
J Neurosci Methods. Author manuscript; available in PMC 2012 November 15.
NIH
-PA Author Manuscript
NIH
-PA Author Manuscript
NIH
-PA Author Manuscript
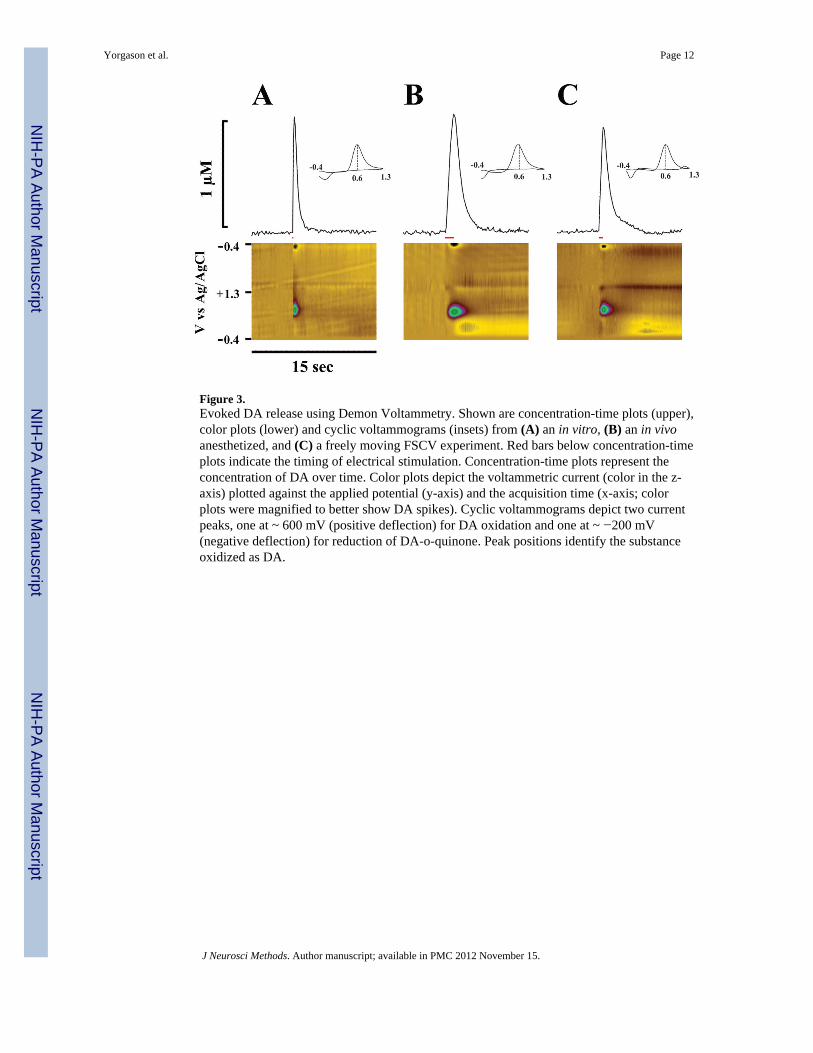
Figure 3.Evoked DA release using Demon Voltammetry. Shown are concentration-time plots (upper),color plots (lower) and cyclic voltammograms (insets) from (A) an in vitro, (B) an in vivoanesthetized, and (C) a freely moving FSCV experiment. Red bars below concentration-timeplots indicate the timing of electrical stimulation. Concentration-time plots represent theconcentration of DA over time. Color plots depict the voltammetric current (color in the z-axis) plotted against the applied potential (y-axis) and the acquisition time (x-axis; colorplots were magnified to better show DA spikes). Cyclic voltammograms depict two currentpeaks, one at ~ 600 mV (positive deflection) for DA oxidation and one at ~ −200 mV(negative deflection) for reduction of DA-o-quinone. Peak positions identify the substanceoxidized as DA.
Yorgason et al. Page 12
J Neurosci Methods. Author manuscript; available in PMC 2012 November 15.
NIH
-PA Author Manuscript
NIH
-PA Author Manuscript
NIH
-PA Author Manuscript
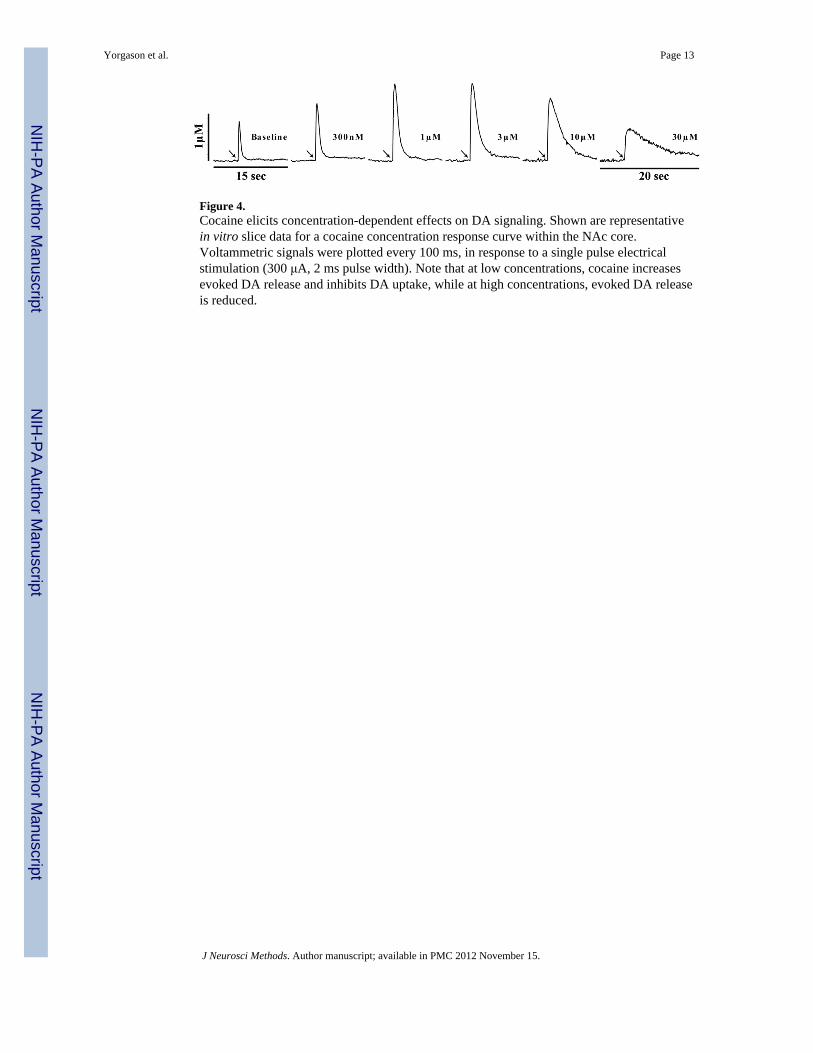
Figure 4.Cocaine elicits concentration-dependent effects on DA signaling. Shown are representativein vitro slice data for a cocaine concentration response curve within the NAc core.Voltammetric signals were plotted every 100 ms, in response to a single pulse electricalstimulation (300 μA, 2 ms pulse width). Note that at low concentrations, cocaine increasesevoked DA release and inhibits DA uptake, while at high concentrations, evoked DA releaseis reduced.
Yorgason et al. Page 13
J Neurosci Methods. Author manuscript; available in PMC 2012 November 15.
NIH
-PA Author Manuscript
NIH
-PA Author Manuscript
NIH
-PA Author Manuscript
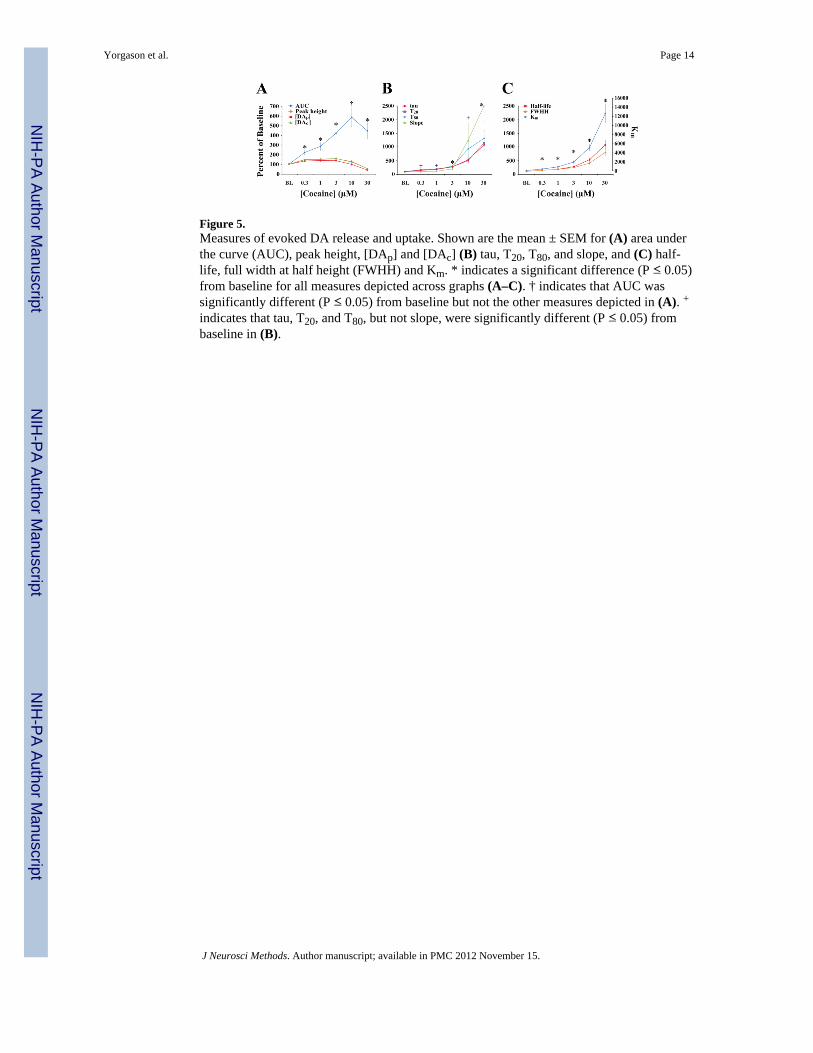
Figure 5.Measures of evoked DA release and uptake. Shown are the mean ± SEM for (A) area underthe curve (AUC), peak height, [DAp] and [DAc] (B) tau, T20, T80, and slope, and (C) half-life, full width at half height (FWHH) and Km. * indicates a significant difference (P ≤ 0.05)from baseline for all measures depicted across graphs (A–C). † indicates that AUC wassignificantly different (P ≤ 0.05) from baseline but not the other measures depicted in (A). +indicates that tau, T20, and T80, but not slope, were significantly different (P ≤ 0.05) frombaseline in (B).
Yorgason et al. Page 14
J Neurosci Methods. Author manuscript; available in PMC 2012 November 15.
NIH
-PA Author Manuscript
NIH
-PA Author Manuscript
NIH
-PA Author Manuscript
NIH
-PA Author Manuscript
NIH
-PA Author Manuscript
NIH
-PA Author Manuscript
Yorgason et al. Page 15
Table I
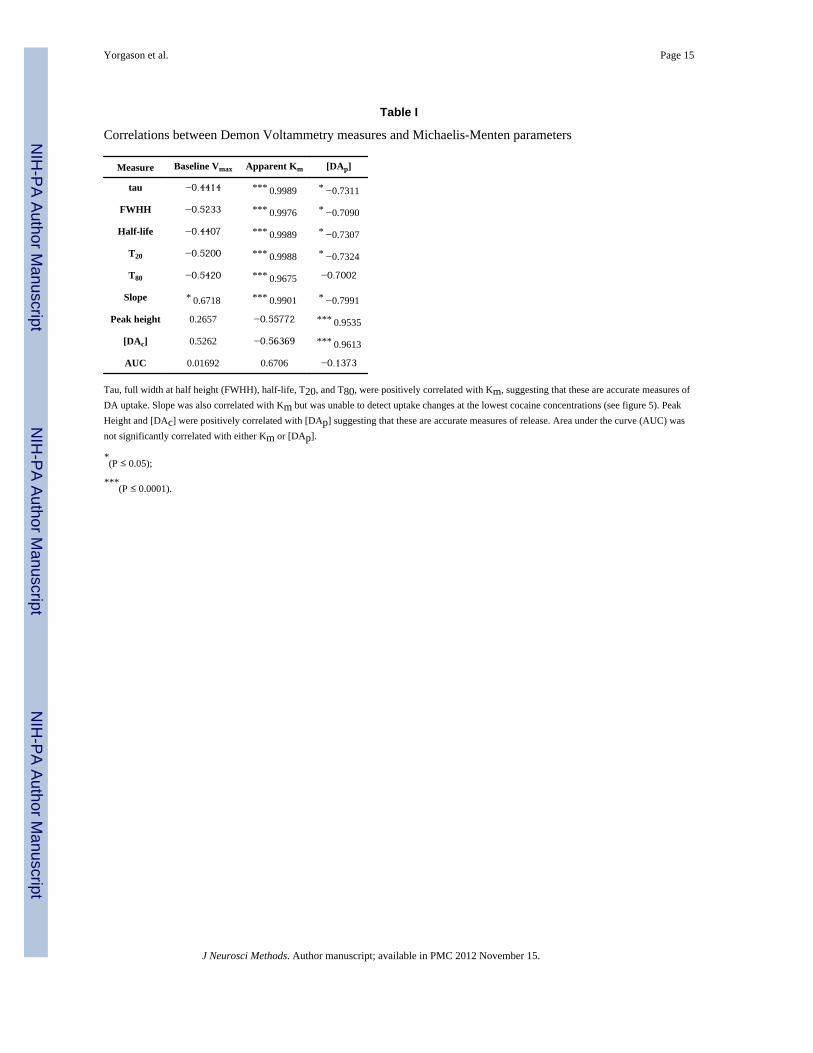
Correlations between Demon Voltammetry measures and Michaelis-Menten parameters
Measure Baseline Vmax Apparent Km [DAp]
tau −0.4414 *** 0.9989 * −0.7311
FWHH −0.5233 *** 0.9976 * −0.7090
Half-life −0.4407 *** 0.9989 * −0.7307
T20 −0.5200 *** 0.9988 * −0.7324
T80 −0.5420 *** 0.9675 −0.7002
Slope * 0.6718 *** 0.9901 * −0.7991
Peak height 0.2657 −0.55772 *** 0.9535
[DAc] 0.5262 −0.56369 *** 0.9613
AUC 0.01692 0.6706 −0.1373
Tau, full width at half height (FWHH), half-life, T20, and T80, were positively correlated with Km, suggesting that these are accurate measures ofDA uptake. Slope was also correlated with Km but was unable to detect uptake changes at the lowest cocaine concentrations (see figure 5). PeakHeight and [DAc] were positively correlated with [DAp] suggesting that these are accurate measures of release. Area under the curve (AUC) wasnot significantly correlated with either Km or [DAp].
*(P ≤ 0.05);
***(P ≤ 0.0001).
J Neurosci Methods. Author manuscript; available in PMC 2012 November 15.