Optimization of electromembrane extraction combined with differential pulse voltammetry using...
7
Electrochimica Acta 96 (2013) 117–123 Contents lists available at SciVerse ScienceDirect Electrochimica Acta jou rn al hom epa ge: www.elsevier.com/locate/electacta Optimization of electromembrane extraction combined with differential pulse voltammetry using modified screen-printed electrode for the determination of sufentanil Hamid Ahmar, Ali Reza Fakhari ∗ , Hadi Tabani, Abolfath Shahsavani Department of Chemistry, Faculty of Sciences, Shahid Beheshti University, G. C., P.O. Box 19839-4716, Tehran, Islamic Republic of Iran a r t i c l e i n f o Article history: Received 22 November 2012 Received in revised form 31 January 2013 Accepted 8 February 2013 Available online 16 February 2013 Keywords: Sufentanil Electromembrane extraction Screen printed electrode Modified electrode Experimental design a b s t r a c t In the present work, for the first time, electromembrane extraction (EME) combined with differential pulse voltammetry by multi-wall carbon nanotubes modified screen-printed carbon electrode has been reported for determining sufentanil. EME of sufentanil was carried out by applying a D.C. electrical poten- tial through a thin supported liquid membrane (SLM). Charged drug molecules were extracted from an aqueous sample, through the SLM, into an acidic aqueous acceptor solution (20 L) which is placed inside the lumen of a hollow fiber. Then, the acceptor solution was analyzed using differential pulse voltam- metry (DPV). A Box–behnken design was used in order to optimize different variables affecting extraction efficiency using following DPV currents as signals. The main parameters which affect the extraction and determination of sufentanil were observed to be: accumulation time, 30 s; organic solvent, 2-nitrophenyl octyl ether; pH of the donor phase, 2.5; pH of the acceptor phase, 1.0; extraction time, 28 min; extraction output potential difference, 190 V and stirring rate, 1000 rpm. Under the optimal conditions, DPV currents were linear with the concentration of sufentanil within the range of 6.4 × 10 −8 –3.62 × 10 −6 mol dm −3 with the detection limit (S/N = 3) of 2.0 × 10 −8 mol dm −3 . Finally, the proposed method has been successfully used for the determination of sufentanil in urine and plasma samples. © 2013 Elsevier Ltd. All rights reserved. 1. Introduction Sufentanil is the most potent drug of the synthetic nar- cotics series that is widely used in relatively large dosages as a potent analgesic, a primary anesthetic agent and a sedative during preoperative, induction, maintenance, and postoperative surgical periods [1–4]. Just like most medications, sufentanil has many possible side effects. The most serious and significant effects of sufentanil overdose are respiratory depression, anxiety, dizzi- ness, drowsiness, constipation, indigestion, nausea, and headaches. Therefore, many chromatographic methods were developed to detect the amount of sufentanil in biological samples [1,2,4–9]. Time-consuming determination step and high instrumental cost are common disadvantages of these methods. Contrary to these methods, electrochemical techniques present many advantages such as fast response time, low cost, high sensitivity and easy operation. However, due to the low concentration of the analyte and the interference of biological species in urine and plasma, sample preconcentration and cleanup must be carried out prior to the determination step. Recently, single-drop microextraction ∗ Corresponding author. Tel.: +98 21 29903260; fax: +98 21 22431683. E-mail address: [email protected] (A.R. Fakhari). (SDME) [4], dispersive liquid–liquid microextraction (DLLME) [5], hollow fiber liquid phase microextraction (HF-LPME) [5,10] and solid-phase microextraction (SPME) [11] have been developed for extracting sufentanil from various matrices. Among these sample preconcentration techniques, liquid-phase microextraction (LPME), especially hollow fiber liquid phase microextraction (HF-LPME) [12,13], and electro-membrane extrac- tion (EME) [14–16] have grown rapidly. In HF-LPME, target analytes are extracted from an aqueous donor phase (DP), through an organic solvent immobilized in the pores of a hollow fiber as a thin supported liquid membrane (SLM), into a microliter volume of an acceptor phase (AP) which is filled inside the lumen of the fiber. The driving force in HF-LPME is passive diffusion of the target analytes based on the distribution constants between the DP and the SLM and also between the SLM and the AP. EME is a new concept of HF- LPME in which an electrical field serves as a driving force. In this system, charged analytes are extracted from an aqueous sample, through the SLM, into an aqueous AP (5–25 L) placed inside the lumen of a hollow fiber by applying an electrical field in the range of 5–300 V. Due to the volume difference between the DP and the AP, analyte preconcentration is obtained. Both HF-LPME and EME provide an excellent sample clean-up and pre-concentration for biological matrixes [17,18]. Smaller volumes of AP lead to higher enrichment factors (EFs) and better detection limits, but the AP 0013-4686/$ – see front matter © 2013 Elsevier Ltd. All rights reserved. http://dx.doi.org/10.1016/j.electacta.2013.02.049
-
Upload
independent -
Category
Documents
-
view
1 -
download
0
Transcript of Optimization of electromembrane extraction combined with differential pulse voltammetry using...

Opf
HD
a
ARRAA
KSESME
1
cadsmonTdTamsoast
0h
Electrochimica Acta 96 (2013) 117– 123
Contents lists available at SciVerse ScienceDirect
Electrochimica Acta
jou rn al hom epa ge: www.elsev ier .com/ locate /e lec tac ta
ptimization of electromembrane extraction combined with differentialulse voltammetry using modified screen-printed electrodeor the determination of sufentanil
amid Ahmar, Ali Reza Fakhari ∗, Hadi Tabani, Abolfath Shahsavaniepartment of Chemistry, Faculty of Sciences, Shahid Beheshti University, G. C., P.O. Box 19839-4716, Tehran, Islamic Republic of Iran
r t i c l e i n f o
rticle history:eceived 22 November 2012eceived in revised form 31 January 2013ccepted 8 February 2013vailable online 16 February 2013
eywords:ufentanillectromembrane extraction
a b s t r a c t
In the present work, for the first time, electromembrane extraction (EME) combined with differentialpulse voltammetry by multi-wall carbon nanotubes modified screen-printed carbon electrode has beenreported for determining sufentanil. EME of sufentanil was carried out by applying a D.C. electrical poten-tial through a thin supported liquid membrane (SLM). Charged drug molecules were extracted from anaqueous sample, through the SLM, into an acidic aqueous acceptor solution (20 �L) which is placed insidethe lumen of a hollow fiber. Then, the acceptor solution was analyzed using differential pulse voltam-metry (DPV). A Box–behnken design was used in order to optimize different variables affecting extractionefficiency using following DPV currents as signals. The main parameters which affect the extraction and
creen printed electrodeodified electrode
xperimental design
determination of sufentanil were observed to be: accumulation time, 30 s; organic solvent, 2-nitrophenyloctyl ether; pH of the donor phase, 2.5; pH of the acceptor phase, 1.0; extraction time, 28 min; extractionoutput potential difference, 190 V and stirring rate, 1000 rpm. Under the optimal conditions, DPV currentswere linear with the concentration of sufentanil within the range of 6.4 × 10⁻⁸–3.62 × 10⁻⁶ mol dm−3 withthe detection limit (S/N = 3) of 2.0 × 10⁻⁸ mol dm−3. Finally, the proposed method has been successfullyused for the determination of sufentanil in urine and plasma samples.
. Introduction
Sufentanil is the most potent drug of the synthetic nar-otics series that is widely used in relatively large dosages as
potent analgesic, a primary anesthetic agent and a sedativeuring preoperative, induction, maintenance, and postoperativeurgical periods [1–4]. Just like most medications, sufentanil hasany possible side effects. The most serious and significant effects
f sufentanil overdose are respiratory depression, anxiety, dizzi-ess, drowsiness, constipation, indigestion, nausea, and headaches.herefore, many chromatographic methods were developed toetect the amount of sufentanil in biological samples [1,2,4–9].ime-consuming determination step and high instrumental costre common disadvantages of these methods. Contrary to theseethods, electrochemical techniques present many advantages
uch as fast response time, low cost, high sensitivity and easyperation. However, due to the low concentration of the analyte
nd the interference of biological species in urine and plasma,ample preconcentration and cleanup must be carried out prioro the determination step. Recently, single-drop microextraction∗ Corresponding author. Tel.: +98 21 29903260; fax: +98 21 22431683.E-mail address: [email protected] (A.R. Fakhari).
013-4686/$ – see front matter © 2013 Elsevier Ltd. All rights reserved.ttp://dx.doi.org/10.1016/j.electacta.2013.02.049
© 2013 Elsevier Ltd. All rights reserved.
(SDME) [4], dispersive liquid–liquid microextraction (DLLME) [5],hollow fiber liquid phase microextraction (HF-LPME) [5,10] andsolid-phase microextraction (SPME) [11] have been developed forextracting sufentanil from various matrices.
Among these sample preconcentration techniques, liquid-phasemicroextraction (LPME), especially hollow fiber liquid phasemicroextraction (HF-LPME) [12,13], and electro-membrane extrac-tion (EME) [14–16] have grown rapidly. In HF-LPME, target analytesare extracted from an aqueous donor phase (DP), through anorganic solvent immobilized in the pores of a hollow fiber as a thinsupported liquid membrane (SLM), into a microliter volume of anacceptor phase (AP) which is filled inside the lumen of the fiber. Thedriving force in HF-LPME is passive diffusion of the target analytesbased on the distribution constants between the DP and the SLMand also between the SLM and the AP. EME is a new concept of HF-LPME in which an electrical field serves as a driving force. In thissystem, charged analytes are extracted from an aqueous sample,through the SLM, into an aqueous AP (5–25 �L) placed inside thelumen of a hollow fiber by applying an electrical field in the rangeof 5–300 V. Due to the volume difference between the DP and the
AP, analyte preconcentration is obtained. Both HF-LPME and EMEprovide an excellent sample clean-up and pre-concentration forbiological matrixes [17,18]. Smaller volumes of AP lead to higherenrichment factors (EFs) and better detection limits, but the AP
1 imica
vc
teaSst
aobomtTt
2
2
1FORwM(Ipsa
2
cwteeoacctwmesfreoahdwtPtb
18 H. Ahmar et al. / Electroch
olumes obtained in EME are quite low for conventional electro-hemical measurements.
Screen-printed electrodes are low-price miniaturized elec-rochemical platforms where working, counter and referencelectrodes are printed in a small area. They are commercially avail-ble and could be applied for solutions with microliter volumes.creen-printed carbon electrodes are widely used in many fieldsuch as pharmaceutical, environmental and food analysis applica-ions [19,20].
To the best of our knowledge, there is no report available aboutpplying EME or electrochemical methods for the determinationf sufentanil in the literature. In this study, a new strategy haseen reported for a fast and sensitive detection of sufentanil basedn EME coupled with differential pulse voltammetry (DPV). DPVeasurements were carried out using multi-wall carbon nano-
ubes modified screen-printed carbon electrode (MWCNT-SPCE).he influence of different experimental conditions has been inves-igated using Box–behnken design (BBD).
. Experimental
.1. Reagents and materials
All organic solvents such as 2-nitrophenyl octyl ether (NPOE),-ethyl-2-nitrobenzene (ENB) and nitrobenzene (NB) were fromluka (Buchs, Switzerland). Multi-wall carbon nanotubes (95%,.D.: 20–40 nm, length: 0.1–10 �m) were purchased from theesearch Institute of Petroleum Industry (Tehran, Iran). HPLC gradeater was obtained through a Milli-Q system (Millipore, Milford,A, USA) and was used to prepare all solutions. Sufentanil citrate
purity > 99.90%) was obtained from Tofigh Daru company (Tehran,ran) and was used without further purification. Drug-free humanlasma was obtained from Taleghani Hospital (Tehran, Iran). Urineamples were collected from volunteers. All solutions were storedt 4 ◦C protected from light.
.2. Apparatus
All electrochemical measurements were performed using aomputer controlled �Autolab potentiostat/galvanostat type IIIith a general-purpose electrochemical software operating sys-
em GPES version 4.7 (Ecochemie, Utrecht, Holland). Voltammetricxperiments were performed on three-electrode screen-printedlectrochemical strips (DropSens, Spain). Each strip was consistedf a 4 mm diameter disk screen-printed carbon electrode (SPCE)s the modified and unmodified working electrode, and a carbonounter electrode, both printed on an alumina substrate using heaturing carbon composite inks, and a silver pseudoreference elec-rode. Ink formulation and characteristics of the commercial SPCEsere regarded as the proprietary information provided by theanufacturers. A specific connector allowed the connection of the
lectrochemical strip to the potentiostat/galvanostat. Field emis-ion scanning electron microscopy (FE-SEM) images were obtainedrom Hitachi FE-SEM model S-4160. In this study, a previouslyeported [21] EME cell design was used in order to keep the inter-lectrode distance constant so reproducible extractions could bebtained. The porous hollow fiber used for immobilizing the SLMnd housing the acceptor solution was a PP Q3/2 polypropyleneollow fiber (Membrana, Wuppertal, Germany) with an internaliameter of 0.60 mm, 200 �m wall thickness and 0.2 �m pores. Itas cut into 8.0 cm segments, cleaned in acetone and dried prior
o use. The DC power supply used was a EPS-600Z model (Payaajohesh Pars, Tehran, Iran) with a programmable output poten-ial difference within the range of 0–600 V, providing currentsetween 0 and 0.5 A. Platinum wires (0.2 mm diameter) were used
Acta 96 (2013) 117– 123
as electrodes with an inter-electrode distance of 5 mm in the sam-ple and the acceptor solution. The electrodes were connected tothe power supply which resulted in an electrical field of 400 V cm−1
(for a typical 200 V D.C.). Stirring the solutions was carried out by aHeidolph MR 3001 K magnetic stirrer (Schwa Bach, Germany).
2.3. Standard and real sample solutions
Stock solution of sufentanil (2.6 × 10⁻³ mol dm−3) was preparedin HPLC grade water. The stock solution container was covered withaluminum foil in order to be protected from light exposure and wasstored for a month at 4 ◦C with no evidence of decomposition. Then,the required standard solutions were freshly prepared by dilutingan appropriate amount of the stock solution to the required con-centrations. The plasma and urine samples were diluted at 1:4 and1:1 ratios respectively using HPLC grade water. pH values of theplasma and urine samples were adjusted to 2.5 with the additionof 4 M HCl solution.
2.4. Extraction procedure
A 4-mL sample solution was filled into a glass vial with aninternal diameter of 0.8 cm and 8.5 cm height. An 8.0 cm piece ofpolypropylene hollow fiber was then inserted in to the glass vialthrough the cap. It was dipped for 15 s in the organic solvent servingas the SLM, and excess of the solvent was removed using a medi-cal wipe. With a micro syringe, 20 �L of the AP (pH 1.0, 0.1 M HCl)was inserted into the lumen of the hollow fiber and the end of itwas sealed using a pair of hot flat-tip pliers. One of the electrodes,the cathode, was introduced into the lumen of the fiber. The fibercontaining the cathode, SLM and the AP was afterward directedinto the sample solution. The other electrode, the anode, was leddirectly into the sample solution. The electrodes were subsequentlyconnected to the power supply and the whole sample compartmentwas placed on a stirrer. The power supply was turned on and extrac-tion was performed for a prescribed time. When the extraction wascompleted, the power supply was turned off and the hollow fiberwas taken out of the DP. The sealed end of the hollow fiber was cutusing scissors, and the AP was collected with a micro syringe. TheAP was mixed with 20 �L of NaOH (0.1 M) and then transferred toan electrochemical cell.
2.5. Preparation of modified electrode
MWCNTs were refluxed in a mixture of concentratedH2SO4:HNO3 (3:1) for 24 h, then the product (MWCNTs-COOH)was washed with double distilled water and dried in vacuumat room temperature [22,23]. The oxidized MWCNTs suspensionwas prepared by dispersing 5 mg of MWCNTs in 10 mL N,N′-dimethylformamide (DMF) using ultrasonic agitation to obtain arelatively stable suspension. Then, SPCE electrode was coated bycasting 5 �L of the black suspension of MWCNTs and was driedusing hair dryer [23].
2.6. Voltammetric measurement
The MWCNT-SPCE was first activated in the blank solution(NaOH 0.1 M (20 �L) + HCl 0.1 M (20 �L)) by cyclic voltammetricsweeps between −0.2 and +1.0 V, until stable cyclic voltam-mograms were obtained. Then, the blank solution was removed
and analyte solution was transferred into the electrochemical celland voltammetric measurement was done. The experimental con-ditions for DPV were: step potential 15 mV and pulse amplitude50 mV.
H. Ahmar et al. / Electrochimica Acta 96 (2013) 117– 123 119
A) SPC
3
3
c(fi
3
Msbiaaoi
3e
3
aeab
FSs
Fig. 1. FE-SEM images of (
. Results and discussion
.1. Surface characterization of MWCNT-SPCE
The surface morphologies of the SPCE and MWCNT-SPCE wereharacterized by FE-SEM (Fig. 1). As compared with bare SPCEFig. 1A), long tube chain structures were observed for the MWCNTslm in MWCNT-SPCE (Fig. 1B).
.2. Voltammetric behavior of sufentanil at MWCNT-SPCE
The cyclic voltammograms of sufentanil, at a bare SPCE and atWCNT-SPCE are shown in Fig. 2. As shown in this figure (curve b),
ufentanil has a weak and broad oxidation peak on the surface of aare SPCE at 600 mV vs. silver pseudo reference electrode, while as
t is seen in curve a, on the surface of MWCNT-SPCE, sufentanil hasn anodic peak at 560 mV vs. silver pseudo reference electrode, with
considerable enhancement in the peak current. The total absencef the cathodic return peaks indicates an irreversible electrochem-cal oxidation.
.3. Optimization of voltammetry conditions of sufentanillectrooxidation
.3.1. Optimization of the amount of MWCNTsThe amount of MWCNTs affects the peak current. This is prob-
bly related to the thickness of the film, high surface area and thelectrocatalytic properties of MWCNTs [23–25]. High surface areand electrocatalytic activity of MWCNTs lead to better responsesut, the thickness of the modifier must be optimized. Because, if
ig. 2. Cyclic voltammograms of 1.3 × 10⁻⁴ mol dm−3 sufentanil on (a) MWCNTs-PCE (b) bare SPCE (c) Blank CV of MWCNTs-SPCE and (d) Blank CV of bare SPCE;can rate: 50 mV s−1; supporting electrolyte solution (NaCl; 0.05 M).
E and (B) MWCNTs-SPCE.
the modifier film is too thick, background current and resistance toelectron and mass transfer processes for sufentanil, both increasewhich leads to broad and undesirable peaks (Fig. 3). Consideringthese points and also according to our previous experience [23],5 �L of the 0.5 mg mL−1 MWCNTs suspension was selected as theoptimum volume for preparing the modified electrode.
3.3.2. Optimization of accumulation time and potentialAccumulation time and potential are two important parame-
ters in the voltammetry step which could affect the peak currentresponse of the CNT modified electrodes [26,27]. These effects werestudied by DPV. It was observed that the peak current increasedwith increasing accumulation time for the first 30 s, which inducedrapid adsorption of sufentanil on the surface of the modified elec-trode. The peak current changed very slowly after this period oftime. Since longer accumulation times might reduce the volumeof the droplet, 30 s was chosen to be the accumulation time forfurther studies. Also, the effect of accumulation potential was stud-ied by applying different potential values from −0.2 to +0.4 V andthe peak current did not change obviously. Hence, accumulation atopen circuit was adopted for further studies.
3.4. Optimization of the electromembrane extraction of sufentanil
The sufentanil was extracted from 4 mL sample solutions. First,the extraction conditions were optimized for water and then theconditions were applied to plasma and urine samples. In all ofthe optimization experiments, the concentration of sufentanil was
−3
0.52 �mol dm . Initially, the influence of the organic solvent type,salt addition (ionic strength) and stirring rate of the sample solutionon extraction efficiency were evaluated separately. Then, the influ-ence of the other factors (extraction output potential difference,Fig. 3. Cyclic voltammograms of 1.3 × 10⁻⁴ mol dm−3 sufentanil using variousamounts of the modifier (a–c: 2.5, 5, 10 �L); other conditions as mentioned in Fig. 2.

120 H. Ahmar et al. / Electrochimica Acta 96 (2013) 117– 123
eamP
3
aecTampptfpNs
3
msiisrtrw
Table 1The experimental variables and levels of the Box–Behnken design (BBD).
Variable Symbol Level
Lower Central Upper
pH of AP A 1 2 3pH of DP B 2 4 6
Fig. 4. EF of sufentanil with different organic solvents as SLM.
xtraction time, acceptor and donor phase pHs), were evaluated byn experimental design method [28,29]. The experimental designatrix and data analysis were carried out by StatGraphics Plus
ackage, version 5.1.
.4.1. Selection of organic solventIt has been indicated that the chemistry of the solvent used
s the SLM is of great importance. Basic analytes are successfullyxtracted with nitro aromatic solvents like NPOE [30], while, acidicompounds are extracted by aliphatic alcohols like 1-octanol [31].hus, in this work three solvents (NB, ENB and NPOE) were useds the SLM solvents. Other factors were constant during the opti-ization (inter-electrode distance 5 mm, stirring rate 800 rpm, 80 V
otential difference, 15 min as the extraction time, acceptor phaseH 2.0 and donor phase pH 3.0). As resulted in Fig. 4, recoveries inhe range of 12–40% (corresponding EFs of 24–80) were obtainedor sufentanil using various solvents. These results showed that NBresented low recovery. High EF for sufentanil was obtained whenPOE was used. Therefore, NPOE was selected as the SLM for further
tudies.
.4.2. Influence of stirring rateStirring rate is also another important factor to promote the
ass transfer process, especially while using large volumes of theample solution, in which the enhanced stirring rate serves tomprove the convection in the sample solution as well as reduc-ng the thickness of the boundary layer between the SLM and theample solution [32,33]. On the other hand, under higher stirring
ates over 1000 rpm, bubbles were observed in the sample solu-ion, affecting the extraction negatively. Additionally, in stirringates above 1000 rpm, the loss of the SLM may potentially occur,hich affects both extraction efficiency and precision. Given theseFig. 5. RSM obtained by plotting pH of AP v
Voltage (V) C 20 110 200Extraction time (min) D 5 17.5 30
observations, an agitation speed of 1000 rpm was deemed to be themost suitable.
3.5. Optimization design
In this step, a BBD was applied for the optimization of theremaining key factors (extraction output potential difference,extraction time, pH of the acceptor and donor phases) and alsoinvestigating the interaction between these variables. The exam-ined levels of these factors are given in Table 1. The number ofexperimental points (N) is defined by the expression [34]:
N = 2k(k − 1) + Cp (1)
where k is the number of variables and Cp is the number of centerpoints. In this study, k and Cp were set at 4 and 8, respectively,which meant 32 experiments had to be done.
The peak current obtained was evaluated by the analysis of vari-ance (ANOVA), and the main effects were visualized by the use ofPareto chart. According to the results, the pH of the AP had thelargest influence on the peak current and a negative effect upon theextraction. The effect of pH of the AP on extraction can be under-stood using the ion balance (�) of the system. The �, defined as thetotal ionic concentration in the donor phase to that of the acceptorphase, impresses the flux over the membrane [35]. According to theNernst–Planck equation, the maximum response can be obtainedin the minimum value of � (decreasing pH of the AP) [35]. In lowpH values of the AP (which caused decreasing of �), the analytewas easily released into the acceptor solution, which leads to anincrease in the extraction efficiency.
Fig. 5 is response surface methodology (RSM) and the contourplot which show the effect of pH of the AP and pH of the DP onthe response at fixed values of extraction output potential dif-ference and time in their center values. Inspection of the BBDresults showed that the response increased when the pH of theAP decreased, but it is not affected while changing the pH of theDP. Earlier results had shown that the pH of the DP is not a criti-
cal parameter in EME [36]. According to the Pareto chart and RSMresults, pHs of the AP and DP were selected as 1 and 2.5, respec-tively.s. pH of DP for sufentanil using BBD.

H. Ahmar et al. / Electrochimica Acta 96 (2013) 117– 123 121
ential difference vs. extraction time for sufentanil using BBD.
tdtotAcdeetiwdioa
3
(wtwo
ct(p
E
wifia
TV
Fig. 6. RSM obtained by plotting extraction output pot
The RSM and the contour plot (Fig. 6) were applied to analyzehe simultaneous effect of extraction time and output potentialifference variables on the response and displayed the interac-ion between these independent variables. Inspecting the resultsf this figure showed that the response increased when the extrac-ion output potential difference and extraction time increased.pplying high electrical potential differences promoted their effi-ient migration through the artificial membrane and reduced theeprotonation opportunity of this drug, which resulted in higherxtraction efficiencies [32,33]. Extraction time was the key param-ter that determined the total amount of the drug transferred fromhe DP to the AP. Fig. 6 shows that response increased with increas-ng the extraction time. According to this figure, 28 min and 190 V
ere obtained as optimum extraction time and output potentialifference, respectively. In this condition, the current was mon-
tored. At the start of the experiment, the short peak current wasbserved; afterward the current was decreased slowly to the 12 �After 5 min [30].
.6. Analytical performance
The linearity, limit of detection (LOD), limit of quantificationLOQ), precision, and accuracy of the method were validated forater samples spiked with the sufentanil at different concentra-
ion levels. The voltammograms and calibration curve for sufentanilhich were obtained by differential pulse voltammetry under the
ptimal experimental conditions were shown in Fig. 7.Also, the results of the analysis together with the analytical
haracteristics were shown in Table 2. As it can be seen, sufen-anil showed a good linearity with a squared correlation coefficientR2) greater than 0.99. The extraction recovery (ER%) of the EMErocedure was calculated according to the following equation:
R = na,final
ns,initial100% =
(Va
Vs
)(Ca,final
Cs,initial
)× 100% (3)
here ns,initial and na,final are the number of the analyte moles orig-nally present in the sample and the number of the analyte molesnally collected in the AP, respectively. Va is the volume of thecceptor solution, Vs is the volume of the sample, Ca,final is the final
able 2alidation results of sufentanil.
Sample LODa Linearitya R2 ERb EFc Repro
Water 0.02 0.064–3.62 0.999 61 122 9.1
a Concentration is based on �mol dm−3.
b Extraction recovery was obtained for 0.52 �mol dm−3 of sufentanil (n = 3).c Enrichment factor was calculated based on extraction of 0.52 �mol dm−3 of sufentanid Reproducibility was obtained by three separated MWCNT-SPCE for 0.18 �mol dm−3 oe Intraday and inter day RSDs% for 0.18 �mol dm−3 of sufentanil (no significant differenf Intraday and inter day RSDs% for 0.52 �mol dm−3 of sufentanil (no significant differen
Fig. 7. DPVs of various concentrations of sufentanil (down to up: 0.064, 0.10, 0.15,0.26, 0.52, 1.03, 1.55, 2.07, 2.60, 3.10 and 3.62 �mol dm−3) in the optimal conditions,inset: calibration curve for the determination of sufentanil in water.
concentration of the analyte in the acceptor solution, and Cs,initial isthe initial analyte concentration in the sample solution.
The EF of the EME procedure was calculated as the ratio of thefinal sufentanil concentration in the AP over its concentration inthe original solution according to the following equation:
EF = Ca,final
Cs,initial(4)
Reproducibility was obtained by extracting and analyzinga standard solution of 0.18 �mol dm−3 using three separatedMWCNT-SPCE. Repeatability or intraday precision was investigatedby analyzing five replicate of the standard solution and inter day
ducibilityd RSD%e RSD%f
Intra day Inter day Intra day Inter day
5.7 7.8 5.2 7.4
l.f sufentanil.ce, t (8) = 2.15, p > 0.05).ce, t (8) = 1.02, p > 0.05).
122 H. Ahmar et al. / Electrochimica Acta 96 (2013) 117– 123
Table 3Determination of sufentanil in plasma and urine samples.
Drug Sample
Plasma Urine
Caddeda Cfound
a RSD%b ER (%) Caddeda Cfound
a RSD%b ER (%)
Sufentanil 0.18 0.07 6.7 39 0.18 0.10 5.6 560.52 0.22 6.2 42 0.52 0.30 6.9 58
a All concentrations are based on �mol dm−3.b RSDs% were calculated for n = 3.
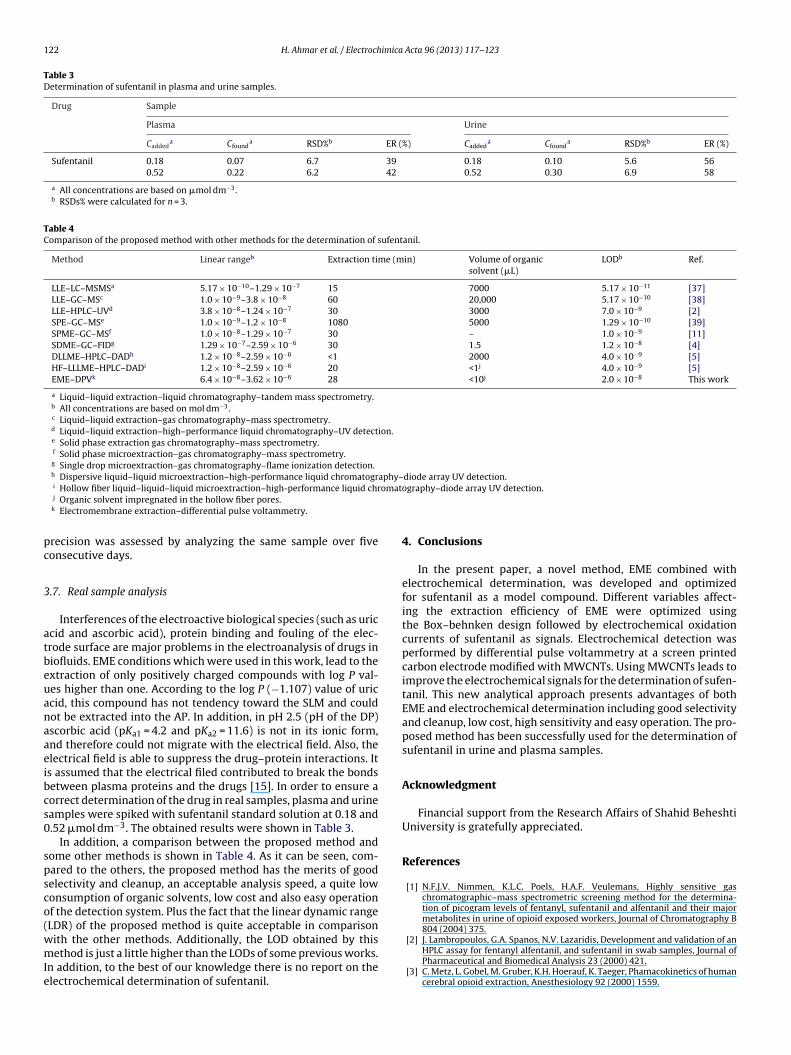
Table 4Comparison of the proposed method with other methods for the determination of sufentanil.
Method Linear rangeb Extraction time (min) Volume of organicsolvent (�L)
LODb Ref.
LLE–LC–MSMSa 5.17 × 10⁻¹⁰–1.29 × 10⁻⁷ 15 7000 5.17 × 10⁻¹¹ [37]LLE–GC–MSc 1.0 × 10⁻⁹–3.8 × 10⁻⁸ 60 20,000 5.17 × 10⁻¹⁰ [38]LLE–HPLC–UVd 3.8 × 10⁻⁸–1.24 × 10⁻⁷ 30 3000 7.0 × 10⁻⁹ [2]SPE–GC–MSe 1.0 × 10⁻⁹–1.2 × 10⁻⁸ 1080 5000 1.29 × 10⁻¹⁰ [39]SPME–GC–MSf 1.0 × 10⁻⁸–1.29 × 10⁻⁷ 30 – 1.0 × 10⁻⁹ [11]SDME–GC–FIDg 1.29 × 10⁻⁷–2.59 × 10⁻⁶ 30 1.5 1.2 × 10⁻⁸ [4]DLLME–HPLC–DADh 1.2 × 10⁻⁸–2.59 × 10⁻⁶ <1 2000 4.0 × 10⁻⁹ [5]HF–LLLME–HPLC–DADi 1.2 × 10⁻⁸–2.59 × 10⁻⁶ 20 <1j 4.0 × 10⁻⁹ [5]EME–DPVk 6.4 × 10⁻⁸–3.62 × 10⁻⁶ 28 <10j 2.0 × 10⁻⁸ This work
a Liquid–liquid extraction–liquid chromatography–tandem mass spectrometry.b All concentrations are based on mol dm−3.c Liquid–liquid extraction–gas chromatography–mass spectrometry.d Liquid–liquid extraction–high–performance liquid chromatography–UV detection.e Solid phase extraction gas chromatography–mass spectrometry.f Solid phase microextraction–gas chromatography–mass spectrometry.g Single drop microextraction–gas chromatography–flame ionization detection.h Dispersive liquid–liquid microextraction–high-performance liquid chromatography–diode array UV detection.
omat
pc
3
atbeuanaaeibcs0
spsco(wmIe
i Hollow fiber liquid–liquid–liquid microextraction–high-performance liquid chrj Organic solvent impregnated in the hollow fiber pores.k Electromembrane extraction–differential pulse voltammetry.
recision was assessed by analyzing the same sample over fiveonsecutive days.
.7. Real sample analysis
Interferences of the electroactive biological species (such as uriccid and ascorbic acid), protein binding and fouling of the elec-rode surface are major problems in the electroanalysis of drugs iniofluids. EME conditions which were used in this work, lead to thextraction of only positively charged compounds with log P val-es higher than one. According to the log P (−1.107) value of uriccid, this compound has not tendency toward the SLM and couldot be extracted into the AP. In addition, in pH 2.5 (pH of the DP)scorbic acid (pKa1 = 4.2 and pKa2 = 11.6) is not in its ionic form,nd therefore could not migrate with the electrical field. Also, thelectrical field is able to suppress the drug–protein interactions. Its assumed that the electrical filed contributed to break the bondsetween plasma proteins and the drugs [15]. In order to ensure aorrect determination of the drug in real samples, plasma and urineamples were spiked with sufentanil standard solution at 0.18 and.52 �mol dm−3. The obtained results were shown in Table 3.
In addition, a comparison between the proposed method andome other methods is shown in Table 4. As it can be seen, com-ared to the others, the proposed method has the merits of goodelectivity and cleanup, an acceptable analysis speed, a quite lowonsumption of organic solvents, low cost and also easy operationf the detection system. Plus the fact that the linear dynamic rangeLDR) of the proposed method is quite acceptable in comparison
ith the other methods. Additionally, the LOD obtained by thisethod is just a little higher than the LODs of some previous works.n addition, to the best of our knowledge there is no report on thelectrochemical determination of sufentanil.
ography–diode array UV detection.
4. Conclusions
In the present paper, a novel method, EME combined withelectrochemical determination, was developed and optimizedfor sufentanil as a model compound. Different variables affect-ing the extraction efficiency of EME were optimized usingthe Box–behnken design followed by electrochemical oxidationcurrents of sufentanil as signals. Electrochemical detection wasperformed by differential pulse voltammetry at a screen printedcarbon electrode modified with MWCNTs. Using MWCNTs leads toimprove the electrochemical signals for the determination of sufen-tanil. This new analytical approach presents advantages of bothEME and electrochemical determination including good selectivityand cleanup, low cost, high sensitivity and easy operation. The pro-posed method has been successfully used for the determination ofsufentanil in urine and plasma samples.
Acknowledgment
Financial support from the Research Affairs of Shahid BeheshtiUniversity is gratefully appreciated.
References
[1] N.F.J.V. Nimmen, K.L.C. Poels, H.A.F. Veulemans, Highly sensitive gaschromatographic–mass spectrometric screening method for the determina-tion of picogram levels of fentanyl, sufentanil and alfentanil and their majormetabolites in urine of opioid exposed workers, Journal of Chromatography B804 (2004) 375.
[2] J. Lambropoulos, G.A. Spanos, N.V. Lazaridis, Development and validation of anHPLC assay for fentanyl alfentanil, and sufentanil in swab samples, Journal ofPharmaceutical and Biomedical Analysis 23 (2000) 421.
[3] C. Metz, L. Gobel, M. Gruber, K.H. Hoerauf, K. Taeger, Phamacokinetics of humancerebral opioid extraction, Anesthesiology 92 (2000) 1559.

imica
[
[
[
[
[
[
[
[
[
[
[
[
[
[
[
[
[
[
[
[
[
[
[
[
[
[
[
[
[
H. Ahmar et al. / Electroch
[4] A.R. Fakhari, H. Tabani, S. Nojavan, Immersed single-drop microextractioncombined with gas chromatography for the determination of sufentanil andalfentanil in urine and wastewater samples, Analytical Methods 3 (2011)951.
[5] M. Saraji, M. Khalili Boroujeni, A.A. Hajialiakbari Bidgoli, Comparison of dis-persive liquid–liquid microextraction and hollow fiber liquid–liquid–liquidmicroextraction for the determination of fentanyl, alfentanil, and sufentanilin water and biological fluids by high-performance liquid chromatography,Analytical and Bioanalytical Chemistry 400 (2011) 2149.
[6] K.L.L. Movig, M.C.J. Langen, A.C.G. Egberts, Analysis of low concentrationsufentanil citrate/bupivacaine hydrochloride admixtures, using solid phaseextraction followed by high-performance liquid chromatography, Journal ofPharmaceutical and Biomedical Analysis 21 (1999) 845.
[7] L. Palleschi, L. Lucentini, E. Ferretti, F. Anastasi, M. Amoroso, G. Draisci,Quantitative determination of sufentanil in human plasma by liquidchromatography–tandem mass spectrometry, Journal of Pharmaceutical andBiomedical Analysis 32 (2003) 329.
[8] L. Liang, S. Wan, J. Xiao, J. Zhang, M. Gu, Rapid UPLC–MS/MS method for thedetermination of sufentanil in human plasma and its application in target-controlled infusion system, Journal of Pharmaceutical and Biomedical Analysis54 (2011) 838.
[9] M. Saraji, M. Khalili Boroujeni, Analysis of narcotic drugs in biological samplesusing hollow fiber liquid–phase microextraction and gas chromatography withnitrogen phosphorus detection, Microchimica Acta 174 (2011) 159.
10] A.R. Fakhari, H. Tabani, S. Nojavan, 2012. Miniaturized hollow fibre assistedliquid-phase microextraction and gas chromatography for determination oftrace concentration of sufentanil and alfentanil in biological samples, DrugTesting and Analysis, http://dx.doi.org/10.1002/dta.1387, in press.
11] C. Paradis, C. Dufresne, M. Bolon, R. Boulieu, Solid-phase microextrac-tion of human plasma samples for determination of sufentanil by gaschromatography–mass spectrometry, Therapeutic Drug Monitoring 24 (2002)768.
12] G. Shen, H.K. Lee, Hollow fiber-protected liquid-phase microextraction of tri-azine herbicides, Analytical Chemistry 74 (2002) 648.
13] K.E. Rasmussen, S. Pedersen-Bjergaard, Developments in hollow fibre based,liquid-phase microextraction, Trends in Analytical Chemistry 23 (2004) 1.
14] L.E.E. Eibak, A. Gjelstad, K.E. Rasmussen, S. Pedersen-Bjergaard, Exhaustive elec-tromembrane extraction of some basic drugs from human plasma followedby liquid chromatography–mass spectrometry, Journal of Pharmaceutical andBiomedical Analysis 57 (2012) 33.
15] I.K. Kiplagat, T.K.O. Doan, P. Kubán, P. Bocek, Trace determination of perchlorateusing electromembrane extraction and capillary electrophoresis with capaci-tively coupled contactless conductivity detection, Electrophoresis 32 (2011)3008.
16] A. Gjelstad, S. Pedersen-Bjergaard, Electromembrane extraction: a new tech-nique for accelerating bioanalytical sample preparation, Bioanalysis 3 (2011)787.
17] A. Gjelstad, H. Jensen, K.E. Rasmussen, S. Pedersen-Bjergaard, Kinetic aspectsof hollow fiber liquid-phase microextraction and electromembrane extraction,Analytica Chimica Acta 742 (2012) 10.
18] L. Fotouhi, Y. Yamini, S. Molaei, S. Seidi, Comparison of conventional hol-low fiber based liquid phase microextraction and electromembrane extractionefficiencies for the extraction of ephedrine from biological fluids, Journal ofChromatography A 1218 (2011) 8581.
19] O.D. Renedo, M.A. Alonso-Lomillo, M.J.A. Martínez, Recent developments inthe field of screen-printed electrodes and their related applications, Talanta 73(2007) 202.
20] M. Li, Y.-T. Li, D.-W. Li, Y.-T. Long, Recent developments and applications ofscreen-printed electrodes in environmental assays-a review, Analytica Chimica
Acta 734 (2012) 31.21] A.R. Fakhari, H. Tabani, S. Nojavan, H. Abedi, Electromembrane extrac-tion combined with cyclodextrin-modified capillary electrophoresis forthe quantification of trimipramine enantiomers, Electrophoresis 33 (2012)506.
[
Acta 96 (2013) 117– 123 123
22] M.R. Nabid, Y. Bide, S.J. Tabatabaei Rezaei, Pd nanoparticles immobilizedon PAMAM-grafted MWCNTs hybrid materials as new recyclable catalystfor Mizoraki–Heck cross-coupling reactions, Applied Catalysis A-General 406(2011) 124.
23] A.R. Fakhari, H. Ahmar, A new method based on headspace adsorptive accumu-lation using a carboxylated multi-walled carbon nanotubes modified electrode:application for trace determination of nitrobenzene and nitrotoluene in waterand wastewater, Analytical Methods 3 (2011) 2593.
24] X. Dai, G.G. Wildgoose, R.G. Compton, Apparent ‘electrocatalytic’ activity ofmultiwalled carbon nanotubes in the detection of the anaesthetic halothane:occluded copper nanoparticles, Analyst 131 (2006) 901.
25] P. Canete-Rosales, V. Ortega, A. Álvarez-Lueje, S. Bollo, M. González, A. Ansón,M.T. Martínez, Influence of size and oxidative treatments of multi-walled car-bon nanotubes on their electrocatalytic properties, Electrochimica Acta 62(2012) 163.
26] M. Ghalkhani, S. Shahrokhian, Application of carbon nanoparticle/chitosanmodified electrode for the square-wave adsorptive anodic striping voltammet-ric determination of Niclosamide, Electrochemistry Communications 12 (2010)66.
27] S. Shahrokhian, M. Khafaji, Application of pyrolytic graphite modified withnano-diamond/graphite film for simultaneous voltammetric determination ofepinephrine and uric acid in the presence of ascorbic acid, Electrochimica Acta55 (2010) 9090.
28] M. Rezazadeh, Y. Yamini, S. Seidi, Electrically assisted liquid-phase microex-traction for determination of �2-receptor agonist drugs in wastewater, Journalof Separation Science 35 (2012) 571.
29] S. Seidi, Y. Yamini, T. Baheri, R. Feizbakhsh, Electrokinetic extraction on arti-ficial liquid membranes of amphetamine-type stimulants from urine samplesfollowed by high performance liquid chromatography analysis, Journal of Chro-matography A 1218 (2011) 3958.
30] A. Gjelstad, K.E. Rasmussen, S. Pedersen-Bjergaard, Electrokinetic migrationacross artificial liquid membranes: tuning the membrane chemistry to differenttypes of drug substances, Journal of Chromatography A 1124 (2006) 29.
31] M. Balchen, A. Gjelstad, K.E. Rasmussen, S. Pedersen-Bjergaard, Electrokineticmigration of acidic drugs across a supported liquid membrane, Journal of Chro-matography A 1152 (2007) 220.
32] S. Pedersen-Bjergaard, K.E. Rasmussen, Electrokinetic migration across artifi-cial liquid membranes: new concept for rapid sample preparation of biologicalfluids, Journal of Chromatography A 1109 (2006) 183.
33] A. Gjelstad, T.M. Andersen, K.E. Rasmussen, S. Pedersen-Bjergaard, Microextrac-tion across supported liquid membranes forced by pH gradients and electricalfields, Journal of Chromatography A 1157 (2007) 38.
34] F. Kamarei, H. Ebrahimzadeh, A.A. Asgharinezhad, Optimization of simulta-neous derivatization and extraction of aliphatic amines in water samples withdispersive liquid–liquid microextraction followed by HPLC, Journal of Separa-tion Science 34 (2011) 2719.
35] T.M. Middelthon-Bruer, A. Gjelstad, K.E. Rasmussen, S. Pedersen-Bjergaard,Parameters affecting electro membrane extraction of basic drugs, Journal ofSeparation Science 31 (2008) 753.
36] L.E.E. Eibak, A. Gjelstad, K.E. Rasmussen, S. Pedersen-Bjergaard, Kinetic electromembrane extraction under stagnant conditions-fast isolation of drugs fromuntreated human plasma, Journal of Chromatography A 1217 (2010) 5050.
37] S. Cooreman, C. Deprez, F. Martens, J.V. Bocxlaer, K. Croes, A comprehensiveLC–MS-based quantitative analysis of fentanyl-like drugs in plasma and urine,Journal of Separation Science 33 (2010) 2654.
38] N.F.J. Van Nimmen, H.A.F. Veulemans, Development and validation of a highlysensitive gas chromatographic–mass spectrometric screening method for thesimultaneous determination of nanogram levels of fentanyl, sufentanil andalfentanil in air and surface contamination wipes, Journal of Chromatography
A 1035 (2004) 249.39] C. Dufresne, P. Favetta, C. Paradis, R. Boulieu, Comparative study of liquid-liquidextraction and solid-phase extraction methods for the separation of sufentanilfrom plasma before gas chromatographic–mass spectrometric analysis, ClinicalChemistry 47 (2001) 600.