Demography of a savanna palm tree in Ivory Coast (Lamto): population persistence and life-history
19
Jomol of Tro/uhl Ecology (2000) 16:637-655. With 4 figures Copyright 0 2000 Cambridge University Press Demography of a savanna palm tree in Ivory Coast (Lamto): population persistence and Iife-history SfiBASTIEN BAROT’, JACQUES GIGNOUX, ROGER VUATTOUX and STI?PHANE LEGENDRE LaOoratoire d’Ecologie, UMR 7G.25, Ecole Normale Sqbh-ieure, 46 Rue d’Ulm, 75230 Paris cedex 05, France (Accepted 19th February 2000) AFKIXACT. Burassus aetlziokurn is a dioecious palm tree. of African S~V~~IXLS. A stage-classified matrix population model has been parametrizcd with field data (Lamto reserve, Ivory Coast). It enabled the study of the persistence of the popula- tion, and analysis ol’ its sensitivity to diff’crcnt vital rates. Age of’ palms in each stage were estimated to complete the description of the palm life-history. The main results arc: (1) The studied populations arc very close to the equilibrium but the stable stage distribution (predicted by the model) and the observed distribu- tion arc significantly different indicating a former change in the vital rates. (2) Reproduction seems to be highly delayed (first reproduction on average at 114 y), while the estimated duration of the reproductive part of the life-cycle is relatively short (22 y). KEY WORDS: age estimation, demography, humid savanna, matrix population model, palm tree, senesccncc, stage classiIied matrix model INTRODUCTION Matrix population models have been widely used to analyse the demography of plant populations (Silvertown el al. 1993). They constitute very good tools to analyse the persistence of populations, to describe the life-histories of the spe- cies concerned, and to compare different populations (Caswell 1989). For animals such as birds or mammals, survival and fecundity are usually said to depend mostly on age, whereas size is more relevant in the study of plant dynamics (Caswell 1986). Indeed, plants are modular organisms, and are gen- erally much more plastic in their growth than animals (Begon et al. 1990, Tre- wavas &Jennings 1986, Watkinson & White 1985). Consequently, the relation 637
-
Upload
independent -
Category
Documents
-
view
0 -
download
0
Transcript of Demography of a savanna palm tree in Ivory Coast (Lamto): population persistence and life-history

Jomol of Tro/uhl Ecology (2000) 16:637-655. With 4 figuresCopyright 0 2000 Cambridge University Press
Demography of a savanna palm tree in IvoryCoast (Lamto): population persistence andIife-history
SfiBASTIEN BAROT’, JACQUES GIGNOUX, ROGER VUATTOUX andSTI?PHANE LEGENDRE
LaOoratoire d’Ecologie, UMR 7G.25, Ecole Normale Sqbh-ieure, 46 Rue d’Ulm, 75230Paris cedex 05, France(Accepted 19th February 2000)
AFKIXACT. Burassus aetlziokurn is a dioecious palm tree. of African S~V~~IXLS. Astage-classified matrix population model has been parametrizcd with field data(Lamto reserve, Ivory Coast). It enabled the study of the persistence of the popula-tion, and analysis ol’ its sensitivity to diff’crcnt vital rates. Age of’ palms in each
stage were estimated to complete the description of the palm life-history. Themain results arc: (1) The studied populations arc very close to the equilibrium butthe stable stage distribution (predicted by the model) and the observed distribu-tion arc significantly different indicating a former change in the vital rates. (2)Reproduction seems to be highly delayed (first reproduction on average at 114 y),while the estimated duration of the reproductive part of the life-cycle is relativelyshort (22 y).
KEY WORDS: age estimation, demography, humid savanna, matrix populationmodel, palm tree, senesccncc, stage classiIied matrix model
INTRODUCTION
Matrix population models have been widely used to analyse the demographyof plant populations (Silvertown el al. 1993). They constitute very good tools toanalyse the persistence of populations, to describe the life-histories of the spe-cies concerned, and to compare different populations (Caswell 1989). Foranimals such as birds or mammals, survival and fecundity are usually said todepend mostly on age, whereas size is more relevant in the study of plantdynamics (Caswell 1986). Indeed, plants are modular organisms, and are gen-erally much more plastic in their growth than animals (Begon et al. 1990, Tre-wavas &Jennings 1986, Watkinson & White 1985). Consequently, the relation
637
638 S. B A R O T , J. GIGNOUX, R . VUATTOUX AND S . LEGENDRE
between age and size (or stage) is obscure in plants. Thus, matrix models areusually age-classified for animal populations, while they are usually stage-classified for plant populations, and particularly for long-lived plant popula-tions. In this context palm trees are good biological models since their architec-ture is relatively simple (Tomlinson &Jeffrey 1990): they are easy to identifyat all stages, and stages are easily determined.
Several matrix population models have already been published for palm treesgrowing in forest (as canopy or understorey trees) (Bullock 1980, Enright &Watson 1992, Olmst ed & Alvarez-Buylla 1995, Pinard 1993, Pifiero et al. 1984).We present here, as far as we know, the first matrix model for a savanna palmtree, Borassus aethiopum. A first description of its life-cycle was obtained usingstatic data (Barot & Gignoux 1999). Other studies have analysed the respectiveroles of different processes in palm demography in Lamto savanna (IvoryCoast): intraspecific competition, seed dispersal, formation of spatial patternsof individuals in each stage (Barot et al. 1999a, b). Yet, no study has beenpublished that could enable a global analysis of the palm’s demography, andparticularly to assess persistence of the studied populations. Consequently, wehad two aims: (1) To build a matrix model and use it to determine the demo-graphic status of the studied palm populations (are the populations growing,remaining stable or declining?), and determine sensitivities to the demographicparameters (fecundity, survival and recruitment rates in each stage), (2) To .,use the model to complete the former description of the palm’s life-cycle andparticularly to test for the senescence pattern that has already been pointedout by Barot & Gignoux (1999). For the first time, age estimates were derivedfor B. aethiopum by the rarely used method of Cochran & Ellner (1992).
STUDY SPECIES
Borassus aethiopum is a common palm in West Africa humid savannas. It is atall, solitary and pleonanthic palm of the Borasseae tribe (Uhl & Dransfield1987). Seed germination is remote-tubular (Tomlinson &Jeffrey 1990, Uhl &Dransfield 1987): the cotyledonary axis extends downwards in the soil and car-ries the seedling down to 40 cm deep (Monnier 1968). The youngest seedlingshave one or two 0.5 - 1.0 m long elongated entire leaves, older seedlings haveone or two 0.5 - 1.0 m long leaves which are slit a few times, Older individualsall bear the same fan-shaped leaves (Vuattoux 1968). In the youngerjuveniles,the terminal bud is below ground, which defines the establishment phase(Tomlinson &Jeffrey 1990). The number of leaves increases during the juvenilestage (up to about 20) and decreases during the adult stage (Barot & Gignoux1999). B. aethiobum is dioecious and no case of sex switching or clonal reproduc-tion is known. Females bear 50-100, l-l.5 kg fresh weight fleshy fruits, with2-3 seeds per fruit (Vuattoux 1968).
Palm age is often assessed using the number of leaf scars (Tomlinson 1963,Tomlinson & Jeffrey 1990). This is not possible for B. aethiofium because leaf

Demograjhy of a saoanna fialm tree 639
SXI’S are particularly inconspicuous due to the annual fire and to termite feed-ing activity along the stem. Moreover, age assessments based on leaf scars areprobably biased, because comprehetisive data on the leaf dynamics are hardlyavailable, and because during the establishment part of palm life-cycles theterminal bud is often underground (Tomlinson & Jeffrey 1990). The corres-
ponding leaf scars cannot be counted to assess the duration of this part of thel i f e c y c l e ,
STUDY SITE
The study was conducted at the Lamto station, Ivory Coast (6”13’ N, 5”OZ’ W)at the edge of the rain forest domain (Menaut & Ctsar 1979). This ‘site hasbeen described thoroughly elsewhere (Menaut & C%sar 1982). Savanna vegeta-tion is composed of grass and small dicotyledonous trees. Adult palms - B.aetlEio#urn - form,.a third stratum above the two others (from now on the term‘palm’ will ,be used for B. ae&obum).
The demographic study was implemented in two different savanna types,corresponding to two different soil types (Menaut & C&ar 1979): tree s?vannaon the ferruginous soils and grass savanna on the hydromorphic soils in poorlydrained areas. Palms have b&n proved to have different spatial patterns inthese two savanna types: adults are clumped’ in grass savanna, whereas theyhave a random pattern in tree savanna (&trot et al. 1999a)..Each year the grus.layer and all standing vegetation up to 2 m high is burnt by a fire in the middleOf the dry season.
Lamto station lies in the middle ,of a 2500-ha reserve founded in 1961 SO
that palms have not been exploited ‘since 38 y, Palm exploitation was alreadyvery low before the creation of the reserve because of the ,formr?r low humanpopulation density in the area at this date. Around the reserve, the palm popu-
lation is nowadays exploited intensively: wine is made out of the sap ((Herzoget al. 1995), which in this area is extracted from adults until their death), fruitsare eaten, trunks and leaves are used for construction.
rv~ETI~ODS
Field dataWe defined five stages based on the palm morphology: seeds, entire-leafed
seedlings bearing only one or two entire leaves (EL-seedling), slit-leafed seed-lings bearing at least one slit leaf (SL-seedlings), juveniles with fan-shapedleaves (stemmed or not stemmed), and adults (reproductive, stemmed andwith the same fan-shaped leaves as juveniles).
Palm individuals were censused in April of 1996, 1997 and 1998 011 two plotsof tree savanna (El: 4.00 ha and TS2: 3.75 ha), ,and two plots of grass savanna(GSl: 3.75 ha and GS2: 6.00 ha). Size and location of the plots were chosen sothat plots could be considered as,representative of their facies regarding sOi1
640 S. BIKoT, J . CIGNOUX, R . V L J A T T O U X A N D S. L E G E N D R E
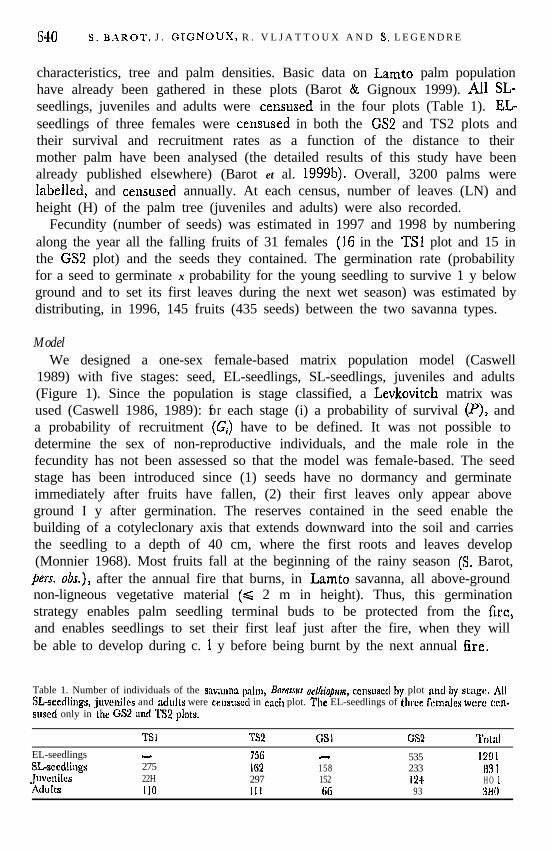
characteristics, tree and palm densities. Basic data on Lamto palm populationhave already been gathered in these plots (Barot & Gignoux 1999). All SL-seedlings, juveniles and adults were censused in the four plots (Table 1). EL-seedlings of three females were censused in both the GS2 and TS2 plots andtheir survival and recruitment rates as a function of the distance to theirmother palm have been analysed (the detailed results of this study have beenalready published elsewhere) (Barot et al. 1999b). Overall, 3200 palms wereIabelled, and censused annually. At each census, number of leaves (LN) andheight (H) of the palm tree (juveniles and adults) were also recorded.
Fecundity (number of seeds) was estimated in 1997 and 1998 by numberingalong the year all the falling fruits of 31 females (16 in the TSl plot and 15 inthe GS2 plot) and the seeds they contained. The germination rate (probabilityfor a seed to germinate x probability for the young seedling to survive 1 y belowground and to set its first leaves during the next wet season) was estimated bydistributing, in 1996, 145 fruits (435 seeds) between the two savanna types.
ModelWe designed a one-sex female-based matrix population model (Caswell
1989) with five stages: seed, EL-seedlings, SL-seedlings, juveniles and adults(Figure 1). Since the population is stage classified, a Levkovitcb matrix wasused (Caswell 1986, 1989): for each stage (i) a probability of survival (P), anda probability of recruitment (GJ have to be defined. It was not possible todetermine the sex of non-reproductive individuals, and the male role in thefecundity has not been assessed so that the model was female-based. The seedstage has been introduced since (1) seeds have no dormancy and germinateimmediately after fruits have fallen, (2) their first leaves only appear aboveground I y after germination. The reserves contained in the seed enable thebuilding of a cotyleclonary axis that extends downward into the soil and carriesthe seedling to a depth of 40 cm, where the first roots and leaves develop(Monnier 1968). Most fruits fall at the beginning of the rainy season (S. Barot,
fiers. ohs.), after the annual fire that burns, in Lamto savanna, all above-groundnon-ligneous vegetative material (< 2 m in height). Thus, this germinationstrategy enables palm seedling terminal buds to be protected from the fire,and enables seedlings to set their first leaf just after the fire, when they willbe able to develop during c. 1 y before being burnt by the next annual fire.
Table 1. Number of individuals of the wvxnn:~ txhn, Borossw nellriopun~, censused by plot rind by alngc:. AllSL-seedlings, jwrnilcs and adults were censt~sed in each plot. The EL-seedlings of three females were cen-suscd only in the GS2 and ‘I’S2 plots.
EL-seedlings%sccdli11gs.JuvenilcsAdultv
TSl TS2 GSl GS2 ‘lktl
- 75G - 535 12I11275 162 158 233 H9 I22H 297 152 124 H O 1110 111 GG 93 3HO

Demog-atl;Clly of a snvnnna palm tree 641
Figure 1. Life cycle diagram corresponding to the five-stage female-based matrix model used for BorflsswO~thiOfJirot population. r;‘,, fecundity in stage i; G,, probability in stage i of swvival anrl recruitment to thCnext stage; P,, probability in stage i of survival in the same stage; R,, probability in stage i of ~~rvivd andretrogression to the precedent stage.
This equation corresponds to a general matrix representation of the equa-tion lr(t+I) =A x n(t), where n is the vector describing numbers of individualsin each stage, and A the transition matrix, containing the fecundity (J), pro-portions of individuals that survive and remain in a stage (I’), proportions ofindividuals that survive and recruit to the next stage (G), and proportions ofindividuals that survive but regress to the precedent stage (I?). In our model(I) PI = 0 since seeds, the first stage, have no dormancy, (2) G.+ was calculatedLS the product of the global recruitment rate k) from the juvenile stage(computed for all juveniles, whether they were males or females) to the adultstage by the percentage of females among ail adult palms (sex ratio, sr).Fecundity was defined, as the number of seeds produced annually by a femaleadult (PJ. Since the model was female-based, recruitment rates of juveniles tothe adult stage were defined as the recruitment probability multiplied by theproportion of females found in each plot (G, = ST x g). We did not find anydifference between adult male and female survival and growth rates.
The transition matrix enables the computation of changes in the numbersof individuals from time t to time 2+1 (y) simply by multiplying the transitionmatrix by the initial population vector (eqn I), and to predict the asymptoticbehaviour of the population: asymptotic growth rate (I), and stable stage distri-bution. We computed the sensitivities (results not detailed) and the elasticitiesof h to the matrix parameters (Caswell 1989, De Croon et al. 1986). Sensitivitiesmeasure the absolute sensitivity of k to absolute changes in vital rates, while
642 S. BAROT, J, GIGNOUX, R. VUATTOUX AND S. LEGENDRE
elasticities assess the proportional effects of proportiorial changes in the vitalrates (Caswell 1989, van Groenendael et al. 1988). We also computed the sensit-ivity of the predicted stable stage distribution to the matrix parameters as wellas the elasticity of the asymptotic growth rate to the sex-ratio (lower levelparameters elasticity) (&swell 1989). Alvarez-Buylla & Slatkin’s (1993) for-mula was used to estimate analytically the standard deviation of asymptoticgrowth rates due to the estimation of vital rates. It was further used to assignconfidence limits to these rates and to test whether they are significantly differ-ent from 1.0, assuming a normal distribution.
A five-stage matrix was built with the average transition probabilities for thefour plots and the two annual transitions-from now on, it will be called theaverage five-stage model. Four five-stage matrices were also constructed in atwo-way design: savanna type (grass savanna + tree savanna) x two annualtransitions (1996-97 + 1997-98). Variations in fecundities according to theyear and the savanna type were analysed through an ANOVA model. The fourmatrices were compared through a two-way log-linear analysis of variancemodel (Caswell 1989) through the SAS CATMOD procedure (SAS 1989b).
We preliminarily analysed matrix models where adult and juvenile stageswere divided in size classes. These models lead to the same conclusions as thefive-stage model presented here, as far as asymptotic growth rates and stablestage distributions are concerned. Thus we only present here the five-stagemodel (the more simple one) based on stages defined objectively by morpholo-gical and reproductive features. These stages have already been shown to berelevant for demographic studies (Barot et al. 1999a, b).
Estimations of palm age in the different stages were computed usingCochran’s method (Cochran & Ellner 1992). The basic idea underlying theseestimations of age is that even if a stage-classified matrix model does not takeage explicitly into account, age is implicitly present in the model since thematrix parameters (survival and recruitment rates, as well as fecundity) areestimated on an annual base. For each stage, we calculated (using the notationof Cochran & Ellner, 1992): the average age in the it” stage Ly,), the mean ageof residence in the it” stage (Si), the conditional remaining life-span of indi-viduals in the itI’ stage (a,), the mean time to reach the it” stage from the seed(first stage) (~~~~d, i), the total conditional life-span (Ai).
& is the mean remaining life span of individuals that have reached the i”’stage, while Ai is the mean total life-span of individuals that have reached theit” stage, SO that Ai is the sum of Z nced, i and sZi..yi and Si seem to be closelyrelated parameters butTi is calculated under the assumption that the stablestage distribution has been reached, as opposed to Si. For each of these meanage-based parameters it was possible to compute a standard deviation, Thesestandard deviations do not denote the uncertainty in the age estimations: they
are estimates of the real standard deviations of the age of the individuals inthe different stages. We also computed the predicted fraction of age a in&-viduals in each stage i,~i,~, at the stable stage distribution, and the fraction ofage a individuals in the whole population !&, i.e. the stable age distribution.

.Llemogra@hy of a savannu palm tree 643
Matrix analyses were realized using the ULM software (Legendre & Clobert1995), and some specially-designed authors SAS/IML (SAS 1989a) routines,particularly for the age estimations. Statistics were also implemented in theSAS statistical package (SAS 1989b).
AverageJive-stage modelThe average transition matrix calculated for the four plots, and the two
annual transitions (Table 2) is characterised by very high survival rates, evenfor the two seedling stages, and low recruitment rates between stages. Theglobal percentage of females in the whole population was not significantly dif-ferent from 50% (although the sex ratio was biased in some plots) (Barot &Gignoux 1999). The mortality pattern is U-shaped: the mortality rate(l-Gi-Pi-&I, cf. eqn 1) decreases during the first stages and increases from the
juvenile stage to the adult stage (respectively Lbr seeds, EL-seedlings, SL-seedlings, juveniles, and adults: 0,774, 0.124, 0.028, 0.008 and 0.044),
The asymptotic growth rate value, 5 was 1,009. The standard deviation ofh, due to the uncertainty on matrix parameter, was estimated as CJ(J.) = 0.010.Assuming a normal distribution for h, that means that the 95% confidence limitintervals were (0.989, 1.029): the asymptotic growth rate of the population wasnot significantly different from 1.0.
The observed stage distribution was different Cram the predicted stable stagedistribution (Figure 2; x’-test, di’ = 3, I? < 0.001). II’ the observed transitionrates were constant in time, the proportion ol’EL-seedlings and adults in thewhole population would have decreased, while the proportions of SLseedlingsand juveniles would have increased, Yet, the sensitivity of the right eigenvector(stable stage distribution) to the recruitment rate from the juvenile stage tothe adult stage (G,+) was much higher than to all other parameters (the sensit-ivities to G4 were respectively 37.1, 15.4, -9,2, -44.0, and 0.6 for seed, EL-seedling, SL-seedling, juvcnilc and adult frequencies, whereas sensitivities toall other demographic paramctcrs were smaller than 2,O in absolute value).This means that very small variations in C;, could have produced the discrep-ancy between the observed and the predicted distributions.
Elasticities of h to the recruitment rates are lower than to survival rates

644 S. B A R O T , J . CIGNOUX, R . V U A T T O U X A N D S . LEGENDRE
go1 I SSD
E L - S S L - S J u v Adu
Figure 2. Obserwd stngc distribution for the four plots pooled together (Obs), ond prcdictcd StidJk stage
distribution @SD) for the average (four plots ;md two .~nnunl transitions) live-stage U. aet/tio&m model.EM, cntirc-le;Ced seedling; SLS, slit-leafed sredling: juv, juvenile; adu, adult.
(Table 3). The highest elasticity was obtained for juvenile survival. The elasti-city for the fecundity is very low. As recruitment rates are much lower thansurvival rates, the pattern of sensitivities of h to vital rates was partly differentfrom the elasticity pattern (results not detailed): (1) sensitivity to the fecunclitywas also very low, but (2) sensitivities to recruitment rates were higher thanto survival rates, (3) the highest sensitivity was for the juvenile recruitmentrate to the adult stage (G.J.
G+ was computed as the product of the global recruitment rate from thejuvenile stage (,c, both male and female individuals) to the adult stage by theproportion of adult females (ST) so that it was possible to compute the elasticityof h to ST and g (elasticity to lower level parameters) (Caswell 1989). Theseelasticities were both small (0.0125, 0.0125) in comparison to the elasticitiesto survival rates.
The recruitment to the adult stage (and thus sexual maturity) occurs rela-tively late in the palm’s life-cycle: average age of adults,yl,~l,,l, = 81.4 y, mean
Tnble 8. Elasticity matrices for the live-stngc ;wer;lgc Borarms acl/riu/un~ matrix model (?hble 2), Existingtr;ulsitions me indicntetl in bold. Stages ils in Tnblr 2.
SfX!tl EL-S SGS Juvcnilc Adult
SCCCI 0.000 0.000 0.000 0.000 0.012EL-S 0.012 0.069 0.000 0.000 u.uooSL-s 0.000 0.013 0.159 0.003 0.000Tiwcnilc 0.000 0.000 0.015 0.481 0.000‘;\dult 0.001~ 0.000 0.000 0.012 0.222
Demography of a savanna palm tme 645
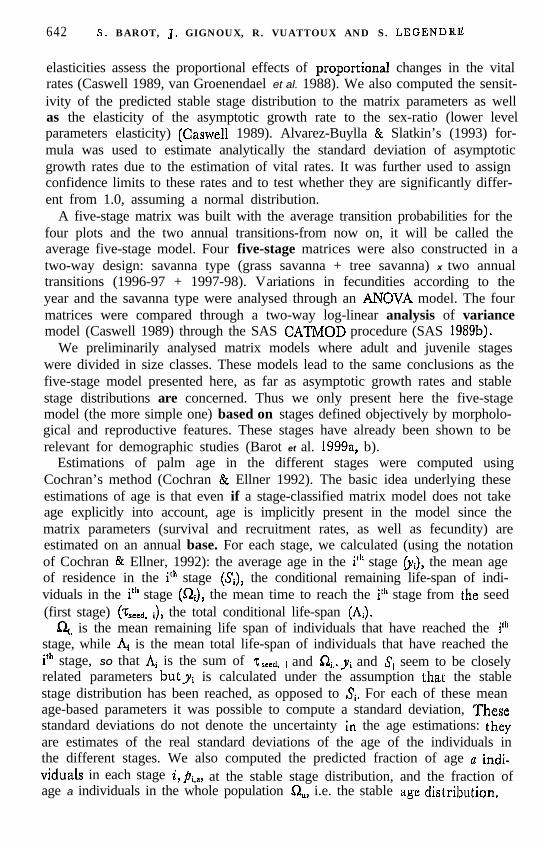
Table 4. Age-based life-history parameters (Cochmn & Ellner 1992) come spoadinq to the five-stage BO~CXWIfi~~~i@ca average matrix model. Standard deviations arc indicated in parcnthesk Average age in the i”’stage,-%@,; mean age of residence in the P stage, &; conditional remaining life spm~ of individuals in the ilbstage, Q; mean time to reach the i”’ stage from the seed stage, T,,,;
that llflve reached the P stage, A,.total conditional life span of individuals
SeedEL-seedlingX-seedlingJuvenileAdult
3 si 4 7 ,.l.Wl. I Ai
l(O) 1 (0) 3.1 (36.0) 1 (01 4.1 (36.0)8.7 (10.7) 10.4 (18.6) 16.4 (97.9) 2.3 (G.1) 18.8 (104.0)
29.6 (31.9) 45.7 (56.7) 57.9 (208.9) 9.9 (I 1.9) 67.7 (220.7)100.9 (262.2)62.3 (45.3) 91.1 (72.3) 79.1 (248.0) 21.8 (14.2)
8.14 (48.9) 113.9 (75.7) 22.7 (103.7) 92. I (72.3) 114.9 (176.0)
age of residence in the adult stage, Sndrllt = 113.9 y, mean time to reach theadult stage, &d, ;,duIt = 92.1 y (Table 4). Tseetl, RcIuIt is consistent with Sadnit, whilerhe low&dult value, is apparently not consistent with the two previous values.It is due to the fact that ~~~~~~~~ is computed for the stable stage distribution.That is linked to the asymptotic growth rate which is slightly higher than 1:many young individuals have been produced in the recent cohort. The popula-tion will rejuvenate if the matrix parameters do not change and when thestable age distribution is reached (Co&ran & Ellner 1992).
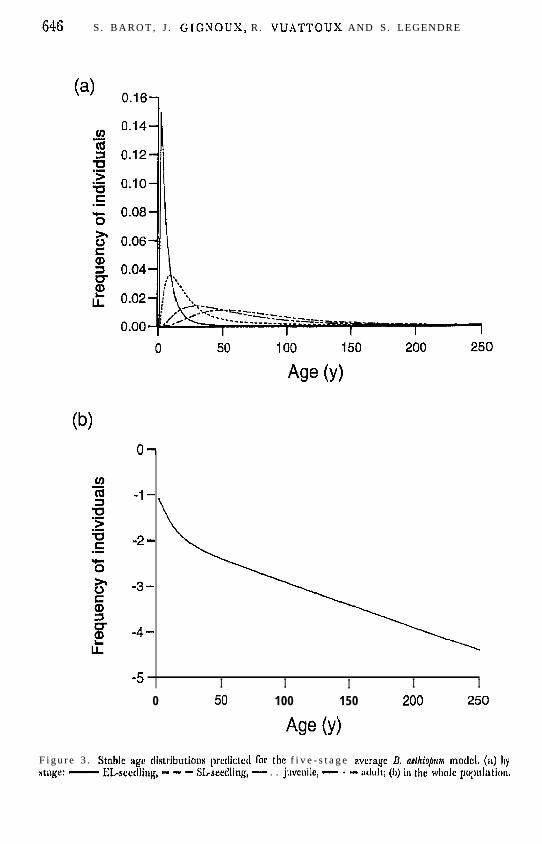
The remaining life-span of individuals (Q) increases until the-juvenile stage,emphasizing the relatively low duration of the reproductive (adult) part of thepalm’s life-cycle. The age distribution by stage displayed in Figure 3a has threecharacteristics: (1) frequencies of individuals strongly decreased from the seed-ling stage to the adult stage; (2) age distributions were increasingly symmetricwith increasing stage order; (3) age distributions were increasingly even withincreasing stage order, allowing for higher differences between ages of indi-viduals that belong to the same stage. This last feature is clearly pointed outin Table 4 where all standard deviations increase from the seed stage to theadult stage, for the average age, the mean age of residence, and the meantime to reach the stage. This is due to the accumulation of uncertainty on theage at which recruitment between stages occurs. The standard deviations ofboth the conditional remaining life-span and the total conditional life-timedecrease from the juvenile to the adult stage because adults do not recruit toanother stage and because their mortality is higher than juvenile mortality.Figure 3b displays, as in most age classified population models (when the stableage distribution has been reached), an age distribution divided in two mainparts: first a steep slope depending mainly on the high mortality rates in thefirst stages, second a milder slope depending on adult survival rate.
The four (two savanna @@es x twoyea+ transitions)jive-stage modelsThere is no obvious difference between the four estimated matrices (Table
5), in spite of differences in estimated sex ratio between the two savanna types(45% of females in grass savanna, ‘and 57% in tree savanna). Fecundity is notsignificantly different between the two savanna types and the two zLlllu.ldf trans-itions (two-way analysis of variance df = 3, 6 1; rz = 0.02; savanna type, I’ = 0.92;
646 S . B A R O T , J . GICNOUX, R. VUATTOUX AND S. LEGENDRE
01
-I-
-2 -
-3-
-4-
-5 I I I I I0 50 100 150 200 250
Age (Y)
F i g u r e 3 . Stddc age clistributions prcdiclctl Tar the f i v e - s t a g e wcragc II. acf/~io/mn moflcl. (it) bystage: - EL-scetlling, - - - SL-sectlling, - . . juvcuile, - * - atlull; (I>) in Ltlc wldc population.

Table 5. Transition matrices for the two types of savanna and the two annuaJ transitions. Stages as in Table 2.
Seed
ELSSL-sJuvenileAdult
bTree savanna 199697 Tree savanna 1997-98
3&
Seed ELS SLS Juvenile Adult Seed EL-S SL-S Juvenile Adult 2
0.000 0.000 0.000 0.000 54.9 0.000 0.000 0.000 0.000 81.6 &
0.126 0.863 0.002 0.000 0.000 0.126 0.850 0.034 0.000 0.0000.000 0.037 0.923 0.005 0.000 0.000 0.030 0.900 0.014 0.000 50.000 0.000 0.063 0.989 0.000 0.000 0.000 0.038 0.978 0.000 20.000 0.000 0.000 0.003 0.959 0.000 0.000 0.000 0.0006 0.926 E--
Grass savanna 1996-7 Grass savanna 1997-98 5Seed 0.000 0.000 0.000 0.000 69.5 0.000 0.000 0.000 0.000 63.0 2EL-S 0.126 0.867 0.031 0.000 0.000 0.126 0.821 0.026 0.000 0.000 ELSL-S 0.000 0.007 0.936 0.018 0.000 0.000 0.017 0.92 1 0.015 0.000 s
Juvenile 0.000 0.000 0.03 1 0.974 0.000 0.000 0.000 0.040 0.960 0.000 %Adult 0.000 0.000 0.000 0.003 0.980 0.000 0.000 0.000 0.005 0.965 c-a
648 S . BAROT, J . GIGNOUX, R . VUATTOUX AND S . LEGENDRE
go-
80--
70-ng 60-u.-$ 50.. -
; 40.Pxs
30.
20.
IO-
O-
DIGS l2%24 GS 1996-97 EZB GS 1997-98-TS TS1996-97 .!BEi TS1997-98
- E L - S - ' +ssL-s- -Juv - + Adu ---I
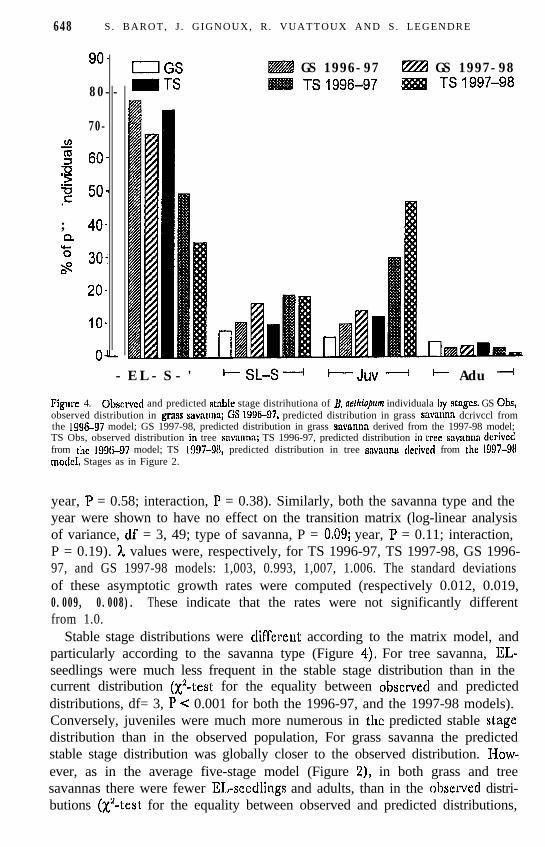
Figure 4. Qbscrvcd and predicted stable stage distrihutiona of B. ne~lrio~wn individuala by stnges. GS Ohs,observed distribution in grass savnnnn; GS 199~97, predicted distribution in grass sav~n~~:~ dcrivccl fromthe 1996-97 model; GS 1997-98, predicted distribution in grass szwnnnn derived from the 1997-98 model;TS Obs, observed distribution in tree snvaunn; TS 1996-97, predicted distribution in tree snvilnna derivedfrom the 1996-97 model; TS 1997-90, predicted distribution in tree swvunntr derivecl from the 1997-98model. Stages as in Figure 2.
year, I? = 0.58; interaction, P = 0.38). Similarly, both the savanna type and theyear were shown to have no effect on the transition matrix (log-linear analysisof variance, df = 3, 49; type of savanna, P = 0,09; year, P = 0.11; interaction,P = 0.19). h values were, respectively, for TS 1996-97, TS 1997-98, GS 1996-97, and GS 1997-98 models: 1,003, 0.993, 1,007, 1.006. The standard deviationsof these asymptotic growth rates were computed (respectively 0.012, 0.019,0.009, 0.008). These indicate that the rates were not significantly differentfrom 1.0.
Stable stage distributions were different according to the matrix model, andparticularly according to the savanna type (Figure 4), For tree savanna, EL-seedlings were much less frequent in the stable stage distribution than in thecurrent distribution (X2-test for the equality between observed and predicteddistributions, df= 3, P < 0.001 for both the 1996-97, and the 1997-98 models).Conversely, juveniles were much more numerous in the predicted stable stagedistribution than in the observed population, For grass savanna the predictedstable stage distribution was globally closer to the observed distribution. I-Iow-ever, as in the average five-stage model (Figure 2), in both grass and treesavannas there were fewer EL-seedlings and adults, than in the observccl distri-butions (X’-test for the equality between observed and predicted distributions,

Demogrnplly of a savanna palm tree 649
df = 3, P < 0.001 for both the 1996-97 and the 1997-98 models). The reverseheld for SL-seedlings and juveniles. As in the average five-stage model, thesensitivity of the stable stage distribution was much more important to therecruitment from the juvenile stage to the adult stage than to all other matrixparameters.
DISCUSSION
B. aethiopum demograply2% aethiapum population seems to be very close to the equilibrium: the asymp-
totic growth rates of the different models are not significantly different from1.0, and the four five-stage matrices for the two savanna types x two annualtransitions are not significantly different. However, B. &hio@m populationsare not at the stable stage distribution. That suggests either that (1) a pastevent such as a storm stronger than usual, or a very intense fire has disturbedthe stage distribution, which has not yet returned to the stable distribution, orthat (2) some vital rates in the transition matrix have changed, for examplebecause of the recent climatic trend, and the new stable stage distribution hasnot yet been reached. These two cases are possible since the species is long-lived, and since the stable stage distribution should be long to recover f?omally kind of disturbance or demographic change (Platt et al. 1988). However,we do not know of any disturbance, at least since the ecology station has beenfounded (1962), and the current rainfall irregularity [the total annual rainfalltends to decrease, and the rainy season arrival is often delayed) could havetriggered a change in the vital rates (Paturei et al. 1995). These rates could
also have changed clue to the extinction (in Lamto Reserve) of B. nethiapumfruit secondary dispersers (elephants and baboons). In fact, it has been S~IOWII
that seedling survival and recruitment rates would probably be higher if clis-1xrsaI distances were longer (Barot et al. 1999b). Moreover, the whole palmpopulation dynamics has been preclictecl to depend strongly on the interactionbetween environmental heterogeneity, and the palm spatial distribution (Barotet al. 1999a). The outcome of this interaction is likely to depend on the primaryspatial distribution, i.e. seed spatial repartition. These two mechanisms mayexplain the observed difference betweell observed and predicted stable distri-butions, since the sensitivity of the stable stage distribution to the recruitmentrate to the adult stage is very high.
The savanna type did not have any significant effect on the transition matrix.It may be due to the fact that all survival rates are very high, while all recruit-ment rates are very low: indeed small differences in proportions would be verydif’ficult to highlight unless a lot of individuals were to have been censused.The predicted stable stage distributions present the same trends (within sav-anna types, and during the two yearly transitions) in comparison to theobserved distributions. It suggests that the discrepancy between grass and treesavanna stable stage distributions may arise from an interaction between somegeneral factor of change al the scale of Lamto savanna, and some intrinsic
650 S. BAROT, J. GIGNOUX, R. VUATTOUX ANI) S. LEGENDRE
factor to the savanna type, The two savanna types are first characterized bydifferent edaphic conditions, soil being much more humid during the rainyseason in grass savannas than in tree savannas. They are also characterized bydifferent adult palm spatial patterns, adults having a random pattern in treesavanna, and a clumped pattern in grass savanna (Barot et al. 1999a). Thatcould denote a less intense competition between juvenile or adult palms ingrass savanna. These two features (spatial pattern and edaphic conditions)could interact with, for example, a climatic change or a modification in theseed dispersal regime, and produce the observed demographic pattern.
Our transition matrices are more complicated than the ones used by DeMatos & Silva Matos (1998) since there is some retrogression. Anyhow, oursensitivity and elasticity results follow the general pattern they found in Lefko-vitch matrices: sensitivities to recruitment are higher than to survival, whereasthe reverse holds for elasticities. The elasticity to fecundity is very small, whichseems to be a common property of a Lefkovitch matrix (elasticities to fecund-ities are bound to be smaller than the greatest elasticity to recruitment rate)(De Matos & Silva Matos 1998). As far as both relative sensitivities(elasticities) and sensitivities are concerned, the most sensitive stage is thejuvenile stage: (1) the vital rate that limits mostly (sensitivity) the growth rateof the palm population is the recruitment rate from the juvenile stage to theadult stage, i.e. juvenile growth rate that is very low; (2) the relative increase(elasticity) in a vital rate that would lead to the strongest increase in h wouldbe an increase in juvenile survival. This pattern may partly be explained byfire that each year burns the palm leaves up to several metres, and forcespalms to invest in new leaves, and probably into defences (thick highly sclerotictissues). Moreover, there seems to be an intense intraspecific competitionbetween juveniles (probably for light) that decreases their growth rates (Barotet al. 1999a). The lack of nutrients in Lamto savanna soils could also be a factorlimiting juvenile growth and their recruitment to the adult stage: nutrientshave a very patchy distribution that has led to a particular root foraging strat-egy that involves the development of a wide root system (Mordelet et al. 1996).Fire, intraspecific competition, and the lack of soil nutrients are probably themain proximate causes of the observed very low recruitm.ent rate to the adultstage. In this way, this recruitment rate constitutes a kind or demographicbottleneck that constrains the whole palm demography.
The elasticity of h to the sex ratio is small. That is due partly to the factthat the sex ratio is used to compute G+., the recruitment to the female adultstage, for which the elasticity is also very smalls. That is also due to the factthat fecundity was supposed not to depend on males (pollination is not takeninto account). A two-sex model (Caswell & Weeks 1986, Meagher & Antonovics1982) would be more relevant, but data on the role of males in the fecundityare difficult to obtain. Data on the mechanism of sex determination(environmental, or purely genetic) (Bierzychudek & Eckhart 1988) and a mean
Demography of a savanna palm tree 651
to determine the sex of non-reproducing individuals would also be very usefulto deal with this issue.
B. aethiopum life-historyAS already suspected, B. aethiopum is very long-lived (Barot & Gignoux 1999).
The most striking feature is that, according to the assessed age-based para-meters, reproduction is highly delayed (first reproduction on average at 114 y),while the reproductive period before death is quite short (about 22 y onaverage), and much shorter than expected (Barot & Gignoux 1999). B. aethi-@Urn, a savanna palm tree, seems to delay its reproduction more than forestpalms for which age at first reproduction has been assessed through growthmodels and counts of leaf scars (Bullock 1980, Enright & Watson 1992,Olmsted & Alvarez-Buylla 1995, Pinard 1993, PiAero et al. 1984). Standarddeviations of age-based parameters are very high. It is due to the fact thatsurvival rates are quite high in all B. aethiopum stages, whereas recruitmentrates are very low, that allows individuals to remain for a very long time in thesame stage, without dying and without recruiting to the next stage. Thatdenotes that the relation between age and stage (or size) is weak in B. aethiopumand that there is a strong growth plasticity in the species. Moreover, retrogres-sion (recruitment of individuals to a precedent stage) increases the standarddeviation of age-based parameters and is another clue of plasticity.
As stated in the method section, adult and juvenile stages were preliminarilydivided into size classes. When the juvenile stage was divided into four heightclasses and the adult stage into two classes according to the number of leaves(height was measured less precisely for adults than for juveniles), it appearedthat mortality decreases in the first three juvenile classes, and increases fromthe third juvenile class to the second adult class. Moreover, fecundity is higherfor the first adult stage than for the second (results not detailed here). Dividingadult and juvenile stages in size classes enabled the building of a nine-stagematrix model that was also used to compute age estimations. As pointed outby Enright et al, (1995) these age estimations depend on the number of stagesused in the model, Yet, the nine-stage model led to age estimations c. 15 yhigher than the five-stage model (for age at first reproduction): that reinforcesthe conclusion that B. aethiopum begins to reproduce very late.
The results showing that fecundity (seed production) decreases in successiveadult stages, and that mortality increases as early in the life-cycle as in thejuvenile stage are consistent with previous results (Barot & Gignoux 1999)pointing out a clear senescence period in B. aethiopum life-cycle: numbers ofleaves are maximum for the younger adults, fecundities assessed by seedlingcounts are higher for the younger females, They support the fact that senes-cence begins as soon as sexual maturity is reached.
The U-shaped mortality pattern that has been found for B, aethiopum is fre-quent among trees (Harcombe 1987) and palms (Enright & Watson 1992,Olmsted & Alvarez-Buylla 1995, Pifiero et al. 1984). Causes of mortality are
652 S. B A R O T , J. GIGNOLJX, R. VUATTOUX AND S. LEGENDRE
hardly known, but juveniles usually seem to die progressively, after spendingseveral years with very few leaves, i.e. they seem to die from resource exhaus-tion. The whole mortality pattern would thus be linked to the resource alloca-tion pattern (into roots, stem and leaves) and to some environmental con-straints, mostly the global lack of nutrients in the savanna soils, and the annualfire (as stated above). Young palms that are too far from nutrient-rich patches,or that are too densely clumped are likely to die slowly just because they donot find enough resources to survive and grow (Barot et al. 1999a). Adults’death is in 80% of cases linked to an obvious senescence, i.e. they die whenonly three or four very small leaves remain without having reproduced for someyears. Twenty per cent of adults’ death are due to uprooting that can be viewedas a kind of frequent accident. However, uprooted palms are usually senescent(S. Barot,@rs. ohs.), and the obvious decrease in their number of leaves is likelyto be concomitant with a decrease in the root system extension, which is ofparamount importance for adult palm mechanical stability.
Thus, all results are consistent and point to an extreme case of the perennialstrategy: reproduction is highly delayed, and its onset coincides with a strongsenescence. Three savanna features are likely to be very important for plantdynamics, and are consequently likely to have shaped their life-histories(Skarpe 1992): fire (that burns Lamto savanna each year), the lack of mineralnutrients in soils (especially nitrogen), the lack of water (at least during thedry season). A fourth factor, herbivoty, plays an important role in savannavegetation dynamics, but is probably not very important for palm trees: noherbivore is known to have a strong influence on B. aethio/wrz survival. For thispalm, fire, the lack of nutrients (Mordelet ef al, 1996), and possibly the lack ofwater during certain periods of the year are likely to weaken seedlings andjuveniles, and to reduce their growth. As far as fire is concerned, a slow growth-high investment into aerial protective structure strategy seems to have beenselected for B. aetl~iopum: protection of the terminal bud, thick sclerotic tissues,probably very rich in silica (Tomlinson &Jeffrey 1990). Moreover, for B. aatlzi-o@un~ it would probably not be advantageous to reproduce before a certainheight has been reached, otherwise flowers (male and female) or young fruitsmay get burnt before becoming mature; flowers usually begin to develop duringthe dry season before the annual fire and fire often climbs up very high alongpalm stems (S. Barot,pers. 06.~).
CONCLUSION
The main result of our study is that the studied palm populations are veryclose to the demographic equilibrium. However, a long-term study woulcl benecessary to verify this conclusion. The asymptotic growth rates being veryclose to 1.0 may be due to the intraspecific competition formerly pointed outbetween juveniles (Barot et al. 1999a). Our model takes globally into accountthe effect of this density dependence on vital rates, and that leads to the

653
observed vital rates, and to the consequent h values: for example, the measuredrecruitment rate from the juvenile stage to the adult stage results partly fromintraspecific competition between juveniles. Density dependence could beexplicitly included in matrix population models (Silva Matos et al. 1999), but itwas not possible here, since all palm populations have roughly the same densityin Lamto savannas.
It must also be emphasized that matrix models do not take into accountdifferences between individuals of the same stage. Such differences are particu-larly important for plants since plant individuals of a given population at leastdiffer from each other in their spatial location, environment being often het-erogeneous, and spatial distribution of individuals being usually uneven(Crawley 1986, Pacala & Silander 1985). Such space-related processes are sus-pected to play a particularly important role in B. nethiopunl demography (Barotat al. 1999a). The matrix models and the computed h values globally resultfrom all these processes, without taking them explicitly into account as fordensity dependence. In fact, juvenile vital rates are probably density depend-ent, but since juveniles are highly clumped the negative interaction betweenthem is strictly local (a few metres in scale) (Barot et al. 1999): it cannot bemodelled easily with a matrix model. To understand how spatial processes-local competition, seed dispersion, favourable patches-interact, and what istheir relative importance for the persistence of B. aethiojwn populations, spa-tially explicit individual-based model should be built (Bolker & Pacala 1997,Euston 1992, Huston el al, 1988).
ACKNOWLEDGEMENTS
We express our gratitude to the Universiti: Nationale de C&e d’Ivoire for thehelp in the field. We thank Lamto technicians (Kouassi Kouassi Etienne,KouanG N’Guessan FranGois, Konan Marcel and Savadogo Sada& Prosper) fortheir practical assistance and sharing their knowledge of the field with us. Wethank two anonymous reviewers for their helpful cotnments. The lieid workwas supported by funding from the CNRS-ORSTOM SALT program (GCTEcore research project).
LITERATURE CITED
~I.,k’ARlZBUYLLA, E. R. & SLATKIN, M. 1993. Finding conlidence limits on ppulatinn ~PO\V~II rates:Monte Carlo test of a simple amnlytical method. Uih G&273-282.
BAROT, S. & GIGNOUX, J. 1999, Population structure and life cycle of Borarrf~s mllri@?fl Mart.:evidence of senesccuce in a palm tree. &iolrol,ica 31z439-448.
BAROT, S., GIGNOUX, J. & MDNAIJT, *J.-C:. 1999a. Demography of a savanua palm Crcc: preclictiollsfrom comprehensive spatial pattern analyses. Ecoolog)~ HO:1987-2005.
BAROT, S., GIGNOUX, J, & MGNAUT, J.-C. 199%. Seed shadows, survival and recruitmcut: IlOw
simple tneclxmisms lead to dynamics of pophtion recruitment curves. Oih Hli:Y20-330.BEGON, M., l+UU~l& J, I,. & TQWNSEND, C. R. 1990. Ec&gv. Blackwell Scientific Publicntinl%
Oxford.BIERZYCHUDEK, 1’. & ECKHART, V. 198&l. Spatial segregation or the scxcs of dioecious plants.
herican Na~t~raiis~ 132:34-43.

654 S . B A R O T , J, GIGNOUX, R . VUATTOUX AND S . LEGENDRE
BOLKBR, B. & PACALA, S. W. 1997. Using moment equations to understand stochastically drivenspatial pattern formation in ecological systems. Tlcorcficul Popalafion Biology 52179-197.
BULLOCK, S. H. 1980. Demography of an undergrowth palm in littoral Cameroon. Eiolropicn 12:247-255.
CASWELL, H. 1986. Life cycle models for plants. Lectures en Muthemutics in the L$ SGiences 18:171-233.CASWELL, H. 1989. Matrix population mudefs. Sinauer, Sunderland, MA. 328 pp.CASWELL, H. & WEEKS, D. E. 1986. Two-sex models: chaos, extinction, and other dynamic
consequences of sex. American Naturalist 128:707-735.COCHRAN, M. E. & ELLNBR, S. 1992. Simple methods for calculating age-based life history parameters
for stage-structured populations. Ecolo,@cal Monogruphs 62:345-364.CRAWLBY, M. j. 1986. Plant ecology. Blackwell Scientific Publications, Oxford, UK 717 pp.DE KROON, H., PWSIBR, A., VAN GROENENDABL, J. & CASWBLL, H. 1986. Elasticity: the relative
contribution of demographic parameters to population growth rate. Ecology 67:1427-1451.DE MATOS. M. B. & SILVA MATOS. D. M. 1998. Mathematical constraints on transition matrix
elasticity .analysis. Journal of Ecolocly S&706-708.ENRIGHT, N. J,, FRANCO, M. & SILVERTOWN, J. 1995. Comparing plant life histories using elasticity
analysis: the importance of life span and the number of life-stages. Dccologia 104:79-84.BNRIGHT, N. J. & WATSON, A. D. 1992. Population dynamics of the nikau palm, Rhopalosryri supida
(Wendl. et Drude), in a temperate forest remnant near Auckland, New Zealand. New Z&and Journalof Botany 30:2943.
HARCOMBE, P. A. 1987. Tree life tables. BioScience 37:557-568.HERZOG, F., FARAH, Z. & AMADO, R. 1995. Chemical composition and nutritional significance of
wines from the palms E&is gtrinccnrir and Borussur nethiopum in the V-BaoulC, C&e d’Ivoire. TropicalScience 35:30-39.
I-IUSTON, M. 1992. Individual-based forest succession models and the theory of plant competition. Pp.408-420 in De Angelis, D. L. & Gross, L. J. (eds). Indiuidual bused models and npprouches in ecology.Chapman & Hall, New York.
HUSTON, M., DBANGBLIS, D. & POST, W. 1988. New computer models unify ecological theory.BioScisnct 38:682-69 1,
LEGENDRE, S. & CLOBERT, J. 1995. ULM, a software for conservation and evolutionary biologists.Journal of Applied Statistics 22~8 17-834.
MEAGHER, T. R. & ANTONOVICS, J. 1982. The population biology of Chamuelirium lufcum, a dioeciousmember of the lily family: life history studies. J?cology 63:1690-1700.
MENAUT, J.-C. & CESAR, J. 1979. Structure and primary productivity of Lamto savannas, Ivory Coast.Ecolo@ 60:1197-1210.
MBNAUT, J.-C. & CESAR, J. 1982. The structure rind dynamics of n West African savanna. Pp. 80-100in Ifuntlcy, B. J. & Walker, B. H. (cds). Ecolog, of tropical r~~sasn~s. Springer-Verlag, Berlin.
MONNIBR, Y. 1968 . Les efits des few d e browse sur u n e savant ,br&vesti&e d e C&c d’luoirc. E t u d e sEburneennes. Minis&e de la Recherche Scientifque de la Republique de CBte-d’Ivoire, Abidjan.190 pp,
MORDELET, P., BAROT, S. & ABBADIE, L. 1996. Root foraging strategies and soil patchiness in ahumid savanna. Plnnr and Soil 182:171-17(X
OLMSTED, I. & ALVAREZ-BUYLLA, E. R, 1995. Sustainable harvesting of tropical trees: demographyand matrix models of two palm species in Mexico. Ecological Applications 5:484-500.
PACAL4, S. W. & SILAh’DER, J. 1985. Neighhorhood models of plant population clynamics. 1.Single-species models of annuals. Amcr+n Naturalist 125:385-411.
PATUREL, J.-E., SERVAT, E., KOIJAME, B., BOYER, J.-F., LUBES, H. & MASSON, J. M, 1995.Manifestations de la sCcheresse en afriquc de 1’Ouest non sahtlienne. Cas de la C&e tl’Ivoire, duTogo et du B&in. Slcharssse 6:95-102.
PINARD, M. 1993. Impacts of stem harvesting on populations of Iriarten deltoidca (Pnlmne) in extractivereserve in Acre, Brazil. Biolropica 25:2-14,.
PII%RO, D., MARTfNBZ-RAMOS, M. & SARUKI-IAN, J. 1984. A population model of Astrecutyummexicanum and a sensitivity analysis of its finite rate of increase. Journal of Etalogy 72:977-991.
PUTT, W. J,, EVANS, G. W. & RATHBUN, S. L. 1988. The population dynamics of a long-lived conifer(Pinur paluslris). American Naturalist I3 1:4.9 1-525.
SAS INSTITUTE 1989a. SASIIML User’s Guide, l&s. 6, 4th cd. SAS Inst., Car-y, NC. 501 pp,SAS INSTITUTE 1989b. SAS/STAT User’s Guide, Vert. 6, 4th cd. SAS Inst., Gary, NC. 1686 pp.SILVA MATOS, D. M. S., FRECKLETON, R. P. C WATKINSON, A. R. 1999. The role of density
clcpcnclcnce in the population dynamics of a tropical palm. Ecology 80:2635-2850.

Demograjhy of a Savanna palm tree 655
SILVERTOWN, J., FRANCO, hf., PEXNTY, I. & MENDOZA, A. 1993. Comparative plant demography -relative importance of life-cycle components to the finite rate of increase in woody and herbaceousperennials. Jw-nal of Ecolo~ 81:465-476.
SKARPE, C. 1992. Dynamics of savanna ecosystems. Journal OJ Vegetation Science 3:293-300.TOMLINSON, P. B. 1963. Measuring growth rates in palms. Principer 7:4OA4.TOMLLNSON, P. B. & JEFFREY, E. C. 1990. Thlc strucfurnl biolso of palms. Clarendon Press, Oxford.
477 pp.TRBWAVAS, A. J. h JENNINGS, D. H. 1986. Introduction. Pp. I-2 in Jennings, D. H. & Trewavas, AJ.
(eds). Pksticip in p1ant.r. Compauy of Biologists Limited, Cambridge.UHL, N. W. & DRANSFIBLD, J. 1987. Geacru puImnmm. Allen Press, Lawrence, Kansas. GlO pp.VAN GROENBNDAEL, J. V., DE ICROON, H. & CASWELL, H. 1988. Projection matrices in population
biology. Trends in Ecoln~ and Evolution 3:264269.WA’ITOUX, R. 1968. Le peuplement du palmier RBnier (Bsraum uethiopusr) d’une savane de C&e
d’hoire. Annales de l’iXversi6c’ d2lbidjan. Sirie B, Tome I. Fascicule l:l-137.WATKINSON, A. R. & WHITE, J, 1985. Some life-history consequences of modular construction in
plants. Philosophical Transactions ofthe Royal Socieb, London, B 313C31-51.